Investigation of Tsunami-Induced Damage and Fragility of Buildings in Thailand after the December...
25
Investigation of Tsunami-Induced Damage and Fragility of Buildings in Thailand after the December 2004 Indian Ocean Tsunami Anat Ruangrassamee, a… Hideaki Yanagisawa, b… Piyawat Foytong, a… Panitan Lukkunaprasit, a… Shunichi Koshimura, b… and Fumihiko Imamura b… The December 2004 Indian Ocean tsunami caused human loss and devastating damage to civil engineering structures along the west coast of southern Thailand. This damage was investigated to evaluate the vulnerability of structures. Criteria for post-tsunami investigation were developed, and a database system was established to manage and present the data. The database of reinforced concrete RC buildings was then analyzed to find the relationship between the damage level and a the distance from the shoreline or b the inundation height. A representative RC column’s capacity to resist lateral forces was measured by a full-scale loading test to gain insight into the relationship between the observed damage and the actual structural performance. DOI: 10.1193/1.2208088 INTRODUCTION The 26 December 2004 Indian Ocean tsunami was generated by the M=9.0+ earth- quake off the shore of northwestern Sumatra. The first wave of the tsunami struck the coast of Thailand, Malaysia, and other countries in the Andaman Sea about two hours after the earthquake. The tsunami caused human loss and devastating damage to civil engineering structures along the west coast of southern Thailand TCLEE 2005. The damage ranged from zero for structures on higher ground to collapse for weak structures near the shoreline. A damage investigation was conducted to evaluate the vulnerability of structures. The criteria, which were based on postearthquake evaluation, were devel- oped to quantitatively evaluate tsunami-induced damage to buildings AIJ 2000. An in- vestigation form was used in the field to record damage data. A web-based database sys- tem was developed to manage and present these damage data and the corresponding photos CEEEV 2005. Damage data for 94 buildings are available on the CEEEV web site. No database for tsunami-induced damage to buildings in terms of damage or failure modes of structural components, design, and materials has previously been available. The database of damaged RC buildings was then analyzed to find the relationship a Department of Civil Engineering, Chulalongkorn University, Phayathai Road, Patumwan, Bangkok, 10330, Thailand b Tsunami Engineering Laboratory, Disaster Control Research Center, Graduate School of Engineering, Tohoku University, Aoba 6-6-11, Aoba-ku, Sendai, 980-8579, Japan S377 Earthquake Spectra, Volume 22, No. S3, pages S377–S401, June 2006; © 2006, Earthquake Engineering Research Institute
-
Upload
independent -
Category
Documents
-
view
0 -
download
0
Transcript of Investigation of Tsunami-Induced Damage and Fragility of Buildings in Thailand after the December...

Investigation of Tsunami-Induced Damageand Fragility of Buildings in Thailandafter the December 2004 Indian OceanTsunami
Anat Ruangrassamee,a… Hideaki Yanagisawa,b… Piyawat Foytong,a…
Panitan Lukkunaprasit,a… Shunichi Koshimura,b… and Fumihiko Imamurab…
The December 2004 Indian Ocean tsunami caused human loss anddevastating damage to civil engineering structures along the west coast ofsouthern Thailand. This damage was investigated to evaluate the vulnerabilityof structures. Criteria for post-tsunami investigation were developed, and adatabase system was established to manage and present the data. The databaseof reinforced concrete �RC� buildings was then analyzed to find therelationship between the damage level and �a� the distance from the shorelineor �b� the inundation height. A representative RC column’s capacity to resistlateral forces was measured by a full-scale loading test to gain insight into therelationship between the observed damage and the actual structuralperformance. �DOI: 10.1193/1.2208088�
INTRODUCTION
The 26 December 2004 Indian Ocean tsunami was generated by the M=9.0+ earth-quake off the shore of northwestern Sumatra. The first wave of the tsunami struck thecoast of Thailand, Malaysia, and other countries in the Andaman Sea about two hoursafter the earthquake. The tsunami caused human loss and devastating damage to civilengineering structures along the west coast of southern Thailand �TCLEE 2005�. Thedamage ranged from zero for structures on higher ground to collapse for weak structuresnear the shoreline. A damage investigation was conducted to evaluate the vulnerabilityof structures. The criteria, which were based on postearthquake evaluation, were devel-oped to quantitatively evaluate tsunami-induced damage to buildings �AIJ 2000�. An in-vestigation form was used in the field to record damage data. A web-based database sys-tem was developed to manage and present these damage data and the correspondingphotos �CEEEV 2005�. Damage data for 94 buildings are available on the CEEEV website. No database for tsunami-induced damage to buildings in terms of damage or failuremodes of structural components, design, and materials has previously been available.
The database of damaged RC buildings was then analyzed to find the relationship
a� Department of Civil Engineering, Chulalongkorn University, Phayathai Road, Patumwan, Bangkok, 10330,Thailand
b� Tsunami Engineering Laboratory, Disaster Control Research Center, Graduate School of Engineering, Tohoku
University, Aoba 6-6-11, Aoba-ku, Sendai, 980-8579, JapanS377Earthquake Spectra, Volume 22, No. S3, pages S377–S401, June 2006; © 2006, Earthquake Engineering Research Institute

S378 A. RUANGRASSAMEE ET AL.
between the damage level and �a� the distance from the shoreline or �b� the inundationheight. For the RC buildings in Thailand, a fragility curve was developed for risk analy-sis or scenario simulation. To understand how a constructed structural component resistslateral forces, a loading test was performed on an RC column that represents local con-struction practice. This test provided insight into the relationship between observed dam-age and actual performance.
THE TSUNAMI AS OBSERVED IN THAILAND
The tsunami generated waves 5–12 m high along the west coast of southern Thailand�Siripong et al. 2005�. Figure 1 shows the runup height versus the distance from theshoreline in Phang-Nga and Phuket, which had relatively high and moderate runupheights, respectively. The runup height was measured by surveying the ground and tsu-nami traces, with reference to official benchmarks, according to the IntergovernmentalOceanographic Commission �IOC� post-tsunami survey field guide �IOC 1998�.
Several video cameras and photographic cameras recorded the tsunami propagatingand striking the coastal area. One of the significant features of the observed tsunami is abore type with a steep wave profile offshore in Khaolak, which generated strong turbu-lence and currents.
A series of tsunami waves struck the coast due to the refraction, reflection, and os-
Figure 1. Runup height vs. distance from the shoreline �note: the x and y axes are not to scale�.�a� Bangniang Village, Khaolak, Phang-Nga. �b� Patong Beach, Phuket.

TSUNAMI-INDUCED DAMAGE AND FRAGILITY OF BUILDINGS IN THAILAND S379
cillation that could be observed at tidal stations. Repeated flooding and receding cur-rents would increase the damage to buildings and would affect beaches through erosionand deposition of sand.
DESIGN PRACTICE IN THAILAND
Southern Thailand has been considered a region that is not prone to seismic activity.The region’s buildings have not been designed for earthquake loading, let alone tsuna-mis. According to Ministerial Regulation No. 6 �B.E. 2527� for overall building resis-tance, a relatively low wind loading of 0.5 kPa is specified for the lower 10 m, and—forlow-rise buildings—0.8 kPa is specified for the next 10 m �MI 1984�. The wind pressurecorresponds approximately to a 3-sec. gust wind speed of 36 m/sec. at 10 m above-ground for open terrain, associated with an annual probability of 0.02. Low-rise resi-dential and commercial RC buildings, which form the bulk of the building stock, aregenerally constructed without supervision by engineers.
RC buildings generally feature small columns. The number of column ties typicallyprovided is small �e.g., 6-mm-diameter ties at 150–200 mm spacing for 150�150 mm2 or 200�200 mm2 columns�. Infilled, unreinforced masonry panels, gener-ally 100 mm thick, are extensively used as nonstructural elements, with a small numberof dowel bars connecting the panels and the boundary RC frames. The ultimate com-pressive strength of concrete in buildings is normally on the order of 18 MPa, or lower.The specified yield strength of reinforcing bars is usually 240 MPa for plain bars and300 MPa for deformed ones. Bricks and mortar are of extremely low quality, since theyare used as nonstructural elements.
TYPICAL TSUNAMI-INDUCED BUILDING DAMAGE
The typical kinds of damage to building foundations, columns, beams, and second-ary members are summarized below.
FOUNDATIONS
Most of the residential buildings along shorelines have spread footings that rest onsand. Typically, after the collapse of a retaining structure whose purpose is to elevate theresidential zone and prevent erosion, the sand under a footing is eroded. This results inan unsupported foundation. The lack of foundation support may not cause the buildingto collapse if the footing is framed to beams and columns that are linked to other foot-ings. It is important to note that the redistribution of internal forces occurs in the frame.If the foundation is not repaired as soon as possible, then the tidal action will cause moreerosion, which will finally cause the building to collapse �Figure 2�. Figure 2a shows abuilding with an unsupported foundation a few days after the tsunami; Figure 2b showsthe collapse of this building one month later.
In addition, erosion occurred around the spread footings of some buildings locatedfurther inland. Loose backfill materials are susceptible to erosion by high-velocity cur-rents; when that occurs around a footing, the sand under the footing is also prone toerosion. Figure 3 shows the collapse of a building that was about 100 m from the shore.

S380 A. RUANGRASSAMEE ET AL.
Figure 2. Damage associated with spread footings. �a� Building with an unsupported founda-
tion, as of 30 December 2004. �b� The same building had collapsed by 30 January 2005.
TSUNAMI-INDUCED DAMAGE AND FRAGILITY OF BUILDINGS IN THAILAND S381
Figure 3. Unsupported foundation that is due to the erosion of loose backfill materials: �a� un-supported footing, and �b� failure of unsupported footing.
S382 A. RUANGRASSAMEE ET AL.
The erosion of sand around and under footings caused total collapse, which suggests thatbackfill materials should be treated to increase bonding. Such treatment may be done bygeosynthetics �Jones and Wilkinson 2005�. More study is required in this area.
COLUMNS
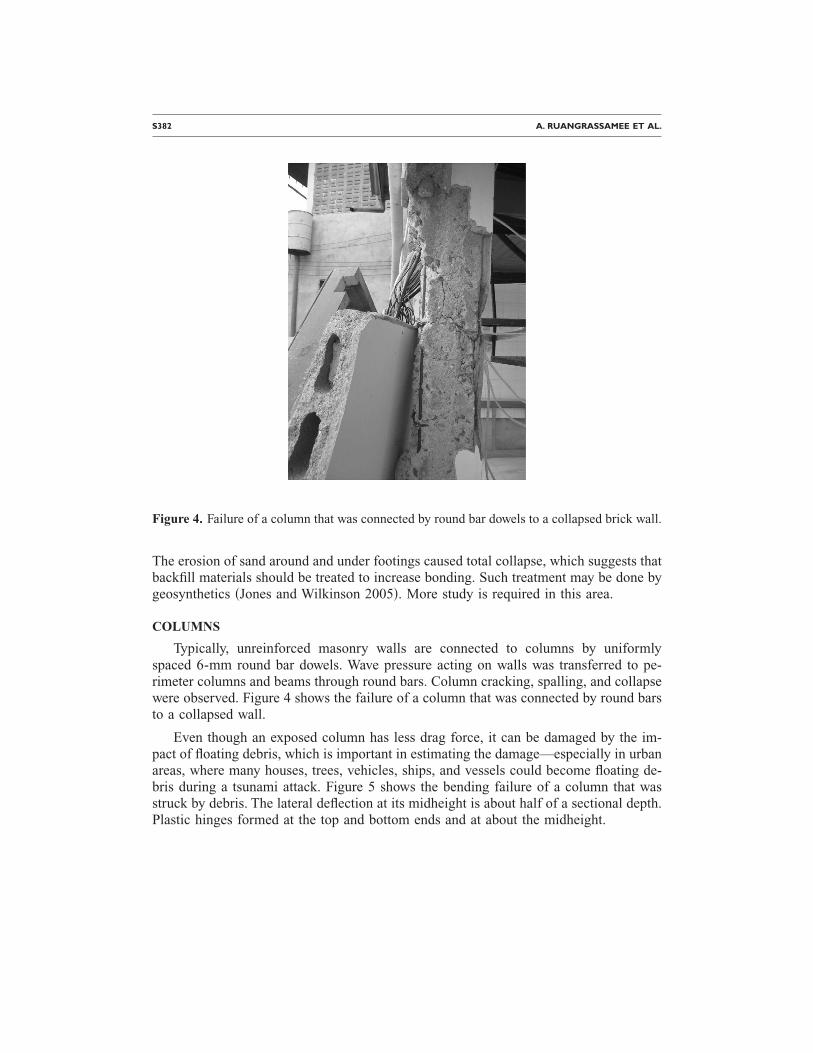
Typically, unreinforced masonry walls are connected to columns by uniformlyspaced 6-mm round bar dowels. Wave pressure acting on walls was transferred to pe-rimeter columns and beams through round bars. Column cracking, spalling, and collapsewere observed. Figure 4 shows the failure of a column that was connected by round barsto a collapsed wall.
Even though an exposed column has less drag force, it can be damaged by the im-pact of floating debris, which is important in estimating the damage—especially in urbanareas, where many houses, trees, vehicles, ships, and vessels could become floating de-bris during a tsunami attack. Figure 5 shows the bending failure of a column that wasstruck by debris. The lateral deflection at its midheight is about half of a sectional depth.Plastic hinges formed at the top and bottom ends and at about the midheight.
Figure 4. Failure of a column that was connected by round bar dowels to a collapsed brick wall.

TSUNAMI-INDUCED DAMAGE AND FRAGILITY OF BUILDINGS IN THAILAND S383
BEAMS
Beams are designed to resist gravity loads, but tsunamis generate lateral force onstructures, including beams. Figure 6 shows the lateral bending failure of a facade beamand a ground beam.
The failure of beams at joints was observed in some buildings, and poor joint de-tailing prevailed in the buildings that were surveyed. The complete failure of the build-ing in Figure 7 was the result of joint failure. Clearly, insufficient anchorage of reinforc-ing bars in the connecting members had resulted in joints with practically no momentresistance. Consequently, the joints could not withstand the large bending moments in-duced by the waves.
SECONDARY MEMBERS
Walls and roofing tiles are considered to be secondary components of buildings. Onetypical kind of damage to walls is the punching failure of brick walls or glass windows,as shown in Figure 8. The investigation found that the opening in walls that was pro-vided by windows could prevent the failure of walls and primary members. Infilled pan-els with openings were observed to remain, with minimum signs of distress. This is dueto the fact that, once the window panels break or the doors give in, the openings serve toreduce the excessive unbalanced pressure �on one side of the panel� that would result if
Figure 5. Bending failure of a column.

S384 A. RUANGRASSAMEE ET AL.
there were no openings. Thus strategic placement of openings should be beneficial andshould be considered in tsunami-resistant design, pending further research.
FIELD DATA COLLECTION
To evaluate how buildings performed during the tsunami, a consistent format �seeAppendix� was used to gather basic structural information and record observed damage.Key aspects of the data collection are described below.
LOCATION OF BUILDINGS
Building locations were measured by a portable global positioning system �GPS� re-ceiver in the WGS84 datum. These locations are important for accessing buildings sothat a detailed investigation can be conducted later. Since it is time-consuming to mea-sure the distance from the shoreline for each building in the field, GPS building loca-tions are also useful for computing the distance from the shoreline by geographic infor-mation system �GIS� software.
INUNDATION HEIGHT
Because a tsunami usually leaves traces on the walls of most buildings, the inunda-tion height for each building can be recorded. In this investigation, the inundation heightwas measured in reference to the ground floor.
Figure 6. Lateral bending failure of beams: �a� facade beam; �b� ground beam.

TSUNAMI-INDUCED DAMAGE AND FRAGILITY OF BUILDINGS IN THAILAND S385
Figure 7. �a� Joint failure in building due to insufficient anchorage of reinforcing bars. �b� De-
tail of lower right front of building.
S386 A. RUANGRASSAMEE ET AL.
STRUCTURAL FORM
Basic information about the structural form was recorded, including the building’sfunction, structural type, foundation type, wall type, and roof type.
COLUMN AND BEAM DAMAGE
Because columns are the primary members of a building, column damage can causethe whole building to collapse. Column damage was classified according to a damageindex �DI� consisting of six categories, as shown in Table 1. The DI is based on the ob-served crack width in a column. Beam damage was classified according to four catego-ries: no damage, cracking, spalling, and collapse.
OVERALL DAMAGE
The overall damage was classified into four damage levels, �D�:• No damage
• Damage to secondary members �i.e., walls and roofs�• Damage to primary members
• Collapse
Figure 8. Punching failure of walls.

TSUNAMI-INDUCED DAMAGE AND FRAGILITY OF BUILDINGS IN THAILAND S387
Damage to primary members means that some columns or beams may crack or suf-fer some damage, but the whole structure does not lose its gravity-resisting capacity andis repairable.
DATABASE SYSTEM
A database system was developed to facilitate management of the collected damagedata. The database is stored in Microsoft Access format and is interfaced with end usersusing Active Server Pages �ASPs�, which are server-side scripts developed by Microsoft.The records can be viewed, added, or deleted by any web browser, but only authorizedusers can add or delete records. Figure 9 shows a record accompanied by a photo �asmentioned above, damage data for 94 buildings are available on the CEEEV web site�.
DISCUSSION OF DAMAGE TO RC BUILDINGS
In the database are 94 records of RC buildings; of these, 77 are in Kamala Beach�Phuket�, and 17 are in Khaolak �Phang-Nga�. Figure 10 shows the inundated area inKamala Beach and the locations of the observed buildings. That area was inundated to adistance of about 600 m from the shoreline, and the locations of observed buildingsrange from the shoreline to the inundation boundary. Collapsed buildings were observedalong the shoreline, whereas the buildings on higher ground suffered minor damage orno damage. Of the observed buildings, the greatest number were houses, most of whichhad one or two stories �Figure 11�. Figure 12 shows the distribution of building damage.Notably, 77 of 94 buildings suffered wall damage that was caused by the impact of thetsunami or debris.
FRAGILITY OF RC BUILDINGS
As the foregoing discussion indicates, damage is related to the locations of buildingsin an inundated area. In this study, the distance from the shoreline and the inundationheight are used as parameters to characterize the tsunami’s influence on buildings. Each
Table 1. Column damage index
DI Description
0 No cracks1 Crack width �0.2 mm; cracks are visible only at close range.2 Crack width 0.2 mm to �1.0 mm; cracks are obvious.3 Crack width 1.0 mm to 2.0 mm; wide cracks with concrete
spalling4 Crack width �2.0 mm; concrete spalling and exposed
reinforcement5 Buckling of reinforcement, crushing of concrete core, or residual
deformation is obvious.
a Source: AIJ �2000�

S388 A. RUANGRASSAMEE ET AL.
damage level D is quantified as shown in Table 2. It is important to note that more studyis required in relating the damage levels to the repair cost or reserved strength for moreprecise risk assessment.
Figure 13 shows how the damage level is related to the inundation height and thedistance from the shoreline for the 94 buildings in the database. Three buildings wereexcluded in deriving Figure 13a because they and the neighboring buildings bore notrace of the inundation height. The relation obviously has a large amount of scatter.
To calculate the average damage level, the individual damage levels are averaged fora certain distance range or inundation height range. Since a typical grid size for the tsu-nami runup simulation is about 30–50 m, the range selected for averaging the distancewas 40 m. The range selected for averaging the inundation height was 0.5 m, which isabout a few times the value of the possible error in measuring the inundation heightfrom tsunami traces. Figure 14 shows the distribution of buildings for equal intervals ofthe inundation height and the distance. It is important to note that there is one data pointin the distance intervals of 360–400 m and 960–1,000 m. The averaged damage level
Figure 9. Sample page of the database record and an accompanying photo.

TSUNAMI-INDUCED DAMAGE AND FRAGILITY OF BUILDINGS IN THAILAND S389
D̄ is computed according to the following equation:
D̄ =0.33n2 + 0.67n3 + 1.00n4
n1 + n2 + n3 + n4�1�
where n1 is the number of buildings with no damage, n2 is the number of buildings withdamage to secondary members, n3 is the number of buildings with damage to primarymembers, and n4 is the number of collapsed buildings. The averaged damage level isweighted according to the values in Table 2. Equation 1 shows the tendency of the dam-age level of buildings in a given range of the inundation height or a given range of thedistance from the shoreline.
Figure 10. Locations of observed buildings in Kamala Beach, Phuket.

S390 A. RUANGRASSAMEE ET AL.
Figure 15a shows the relation between the average damage level and the inundationheight. The averaged damage level increases as the inundation height increases, and lessscatter occurs. The maximum average damage level is about 0.8. Since there is a corre-lation between the average damage level and the inundation height, a nonlinear regres-sion analysis was conducted to obtain the relation as
D̄ =0.61H
1 + H�2�
where H is the inundation height measured with reference to the ground floor. Equation2, which is overlaid on Figure 15a, is useful for estimating the building damage from thetsunami runup simulation.
Figure 15b shows the relation between the average damage level and the distancefrom the shoreline. The average damage level tends to decrease as the distance increases,up to about 350 m. At distances of 365 m and 978 m, the average damage level is 0.67.At those two distances, one building was surveyed in each distance range. The two
Figure 11. Details of the observed buildings: �a� function, and �b� height �in stories�.

TSUNAMI-INDUCED DAMAGE AND FRAGILITY OF BUILDINGS IN THAILAND S391
buildings are in Khaolak, where the inundation distance was more than 1 km, and theinundation height was large. Figure 15b suggests that the average damage level corre-lates with the distance from the shoreline for each particular area. To generalize the re-lation for several regions, other factors representing the severity of tsunamis—such asthe inundation height—in each region must be considered together.
PERFORMANCE OF RC COLUMN UNDER LATERAL LOADING
In one-story and two-story buildings, columns whose section was 150�150 mm2
had DI values ranging from 0 to 5. To determine the lateral force capacity of this type ofcolumn, a full-scale loading test was performed on a 150�150 mm2 RC column. Thelongitudinal reinforcement consisted of four 12-mm-diameter round bars. The lateralconfinement was provided by rectangular ties made of 6-mm-diameter round bars
Figure 12. Distribution of damage to observed buildings: �a� overall damage, and �b� damageto walls.

S392 A. RUANGRASSAMEE ET AL.
equally spaced at 200-mm intervals along the column. The rectangular tie had a 90°hook at a corner, which is typical of local practice. The nominal yielding strength of around bar is 240 MPa, and the strength of concrete on the test day was 17.4 MPa.
The column height in most buildings was about 2.6–2.8 m. The column specimenwas set up by providing a footing at the base and applying a lateral load at 1.4 m abovethe base, resulting in a shear span ratio of 9.3 �Figure 16�. This represents an inflectionpoint at the midheight of the column. Axial force was applied to the column top by ten-sion rods. The lateral load was monotonically applied by a 500-kN actuator under dis-placement control. The drift ratio at which the crack pattern and crack width were re-corded was evenly increased at an interval of 0.1% �for a drift ratio �1.0%� and at aninterval of 0.2% �for a drift ratio �1.0%�. The specimen was tested up to a drift ratio of6.6%.
Table 2. Values assigned to the damage levels
Damage level �D� Value
No damage 0Damage to secondary members 0.33Damage to primary members 0.67Collapse 1.00
Figure 13. Damage level as a function of the inundation height and the distance from theshoreline. �a� Relation with inundation height. �b� Relation with distance from the shoreline.

TSUNAMI-INDUCED DAMAGE AND FRAGILITY OF BUILDINGS IN THAILAND S393
Since the actuator pushed the specimen to the west, horizontal tension cracks devel-oped in the east face, and cracks extended to the north and south faces �Figure 17�. At adrift ratio of 4%, cracks caused by concrete crushing were noticeable. Notably, eventhough the column is lightly confined by rectangular ties, no shear crack developed dur-ing the test. The slenderness of the column causes a moment to reach the moment ca-pacity of the section before the shear capacity is reached. Longitudinal cracks becameobvious at a drift ratio of 4%, indicating an onset of buckling of the longitudinal rein-forcement. In the investigation, the column DI was based on crack widths after unload-ing. The relation between crack widths under loading and crack widths after unloading isnoteworthy. Figure 18 shows crack widths at a drift ratio of 6.6% under loading and afterunloading to zero. For crack widths �2 mm, unloading causes a large percentage ofcrack closure.
Figure 19 shows the relation between the lateral force and the drift ratio. The maxi-mum lateral force capacity is 6.9 kN at a drift ratio of about 3%. The lateral force dropsto 80% of the capacity at a drift ratio of about 4.5%. Figure 20 shows how the maximum
Figure 14. Distribution of observed buildings for a given inundation height interval and a givenshoreline distance interval. �a� Relation with inundation height. �b� Relation with distance fromthe shoreline.

S394 A. RUANGRASSAMEE ET AL.
crack width depends on the drift ratio. The crack width increases exponentially with thedrift ratio. At the maximum load corresponding to a drift ratio of 3%, the maximumcrack width is about 1 mm.
In the post-tsunami investigation phase, crack width is one of the key parameters foridentifying structural damage. Figure 21 shows the relation between the crack width andthe normalized load, which is the pre-peak lateral load normalized by the peak load. Thecrack width increases exponentially with a normalized load. The crack width C �in mm�can be predicted as follows:
C = e−9.78+10L̄ �3�
where L̄ is a normalized load. One can estimate the probable applying load on the basisof the measured crack width. Notably, the crack width observed in the post-tsunami in-vestigation is the crack width after the unloading of tsunami forces. It is important todetermine the relation between the crack width under loading and the crack width afterunloading. Figure 22 shows this relation for a drift ratio of 6.6%. For the crack widthunder loading at less than 2 mm, the crack width decreases to about 0.1–0.2 mm afterunloading. The crack width after unloading CUL �in mm� may be predicted from
CUL = 0.648C �4�
Figure 15. Average damage level as a function of the inundation height and the distance fromthe shoreline. �a� Relation with inundation height. �b� Relation with distance from the shoreline.

TSUNAMI-INDUCED DAMAGE AND FRAGILITY OF BUILDINGS IN THAILAND S395
Figure 16. Setup for the full-scale loading test.
Figure 17. Crack patterns at different drift ratios. �a� Drift ratio of 2%. �b� Drift ratio of 6%.

S396 A. RUANGRASSAMEE ET AL.
Figure 18. Crack widths at the final stage of testing; the drift ratio was 6.6%. �a� Under load-ing. �b� After unloading.
Figure 19. Lateral load vs. drift ratio.

TSUNAMI-INDUCED DAMAGE AND FRAGILITY OF BUILDINGS IN THAILAND S397
Since the relation between the crack width under loading and the crack width afterunloading was obtained at the final stage of the test when the column experienced a driftratio of 6.6%, more study is required for other drift ratios.
SUMMARY AND CONCLUSIONS
The 26 December 2004 Indian Ocean tsunami caused human loss and devastatingdamage to civil engineering structures along the west coast of southern Thailand. Thetsunami was a real test of the tsunami resistance of buildings. Because a systematic andquantitative database is useful for evaluating the performance of buildings in resistingtsunamis, a consistent format was developed and used to gather basic structural infor-mation and record observed damage. The damage to building components was catego-rized on the basis of the general tsunami-induced damage observed. To facilitate dataanalysis and management, a database system was developed and made available on aweb site for further utilization.
Figure 20. Maximum crack width vs. drift ratio.
Figure 21. Maximum crack width vs. normalized pre-peak load.

S398 A. RUANGRASSAMEE ET AL.
On the basis of the survey data, the relations between the damage level and �a� theinundation height or �b� the distance from the shoreline were studied. The damage leveldepends significantly on the inundation height. Its dependence was formulated for thepurpose of risk analysis from the tsunami runup simulation. For each area, the damagelevel tends to decrease as the distance from the shoreline increases. To generalize therelation for all areas, other factors representing severity of tsunamis in each region needto be considered together, such as the inundation height.
The damage to a typical RC column in the observed area was studied by performinga monotonic loading test. Since the crack width is an important parameter in post-tsunami investigation, its relation to the normalized load and the crack width under load-ing was clarified. On the basis of these findings, the observed damage can be quantified.
Figure 22. Crack width after unloading vs. crack width under loading.

TSUNAMI-INDUCED DAMAGE AND FRAGILITY OF BUILDINGS IN THAILAND S399
APPENDIX: INVESTIGATION FORM FOR TSUNAMI-INDUCED BUILDINGDAMAGE
Reference no.DateTimeInspectorOrganizationStructure nameLocationLongitudeLatitudeDistance from a shoreline �m�Inundation height �m�Function � Residence � Hotel � Shop � School � Other � NAStructural type � RC � Wood � Steel � OtherFoundation type � Shallow foundation � Pile foundation � Other � NAWall type � Brick � Glass � Brick and glass � Open space � Wood � OtherRoof type � Tile � RC � OtherNo. of stories �aboveground�No. of stories �underground�Plan width �m�Plan length �m�Remarks on structural detailsColumn width �m�Column depth �m�Column height �m�Column reinforcementTotal no. of columnsNo. of inspected columnsNo. of columns with DI=0No. of columns with DI=1No. of columns with DI=2No. of columns with DI=3No. of columns with DI=4No. of columns with DI=5Remarks on column damageBeam width �m�Beam depth �m�Beam reinforcementBeam damage � No damage � Cracking � Spalling � CollapseRemarks on beam damageFooting width �m�

S400 A. RUANGRASSAMEE ET AL.
Footing length �m�Footing depth �m�No. of footingsFoundation damage � No damage � Eroded � Unsupported
� Displaced � Collapse � NARemarks on foundation damageWall damage � No damage � DamagedRemarks on wall damageRoof damage � No damage � Tiles are obliterated. � Roof beams are damaged.
� CollapseRemarks on roof damageOverall damage� No damage� Damage to secondary members� Damage to some primary members� CollapseDamage keyword
ACKNOWLEDGMENTS
This study could not have succeeded without the support of many people. The au-thors are grateful to the following groups: all the local people who shared the experiencethat they gained from their losses; the Department of Marine and Coastal Resources,Ministry of Natural Resources and Environment; Department of Public Works and Townand Country Planning, Ministry of Interior Affairs; Public Works and Town and CountryPlanning Bureau in Phuket and Phang-Nga; Council of Engineers, Thailand; Chula-longkorn University, Thailand; Technical Lifeline Earthquake Engineering Committee,American Society of Civil Engineers; EERI; and the Institute of Civil Engineers, UK.
REFERENCES
Architectural Institute of Japan �AIJ�, 2000. Report on the Technical Cooperation for TemporaryRestoration of Damaged RC School Buildings Due to the 1999 Chi-Chi Earthquake, Tokyo.
Center of Excellence in Earthquake Engineering and Vibration �CEEEV�, 2005. Department ofCivil Engineering, Chulalongkorn University, Bangkok, Thailand. http://evr.eng.chula.ac.th/earthquake/DamageSurvey/view.asp
Intergovernmental Oceanographic Commission �IOC�, 1998. Post-Tsunami Survey Field Guide,UNESCO.
Jones, C.J.F.P., and Wilkinson, S. M., 2005. The potential application of geosynthetics to reducestructural damage caused by tsunamis, in Proceedings of the International Symposium onTsunami Reconstruction with Geosynthetics—Protection, Mitigation, and Rehabilitation ofCoastal and Waterway Erosion Control, Bangkok, Thailand.
Ministry of Interior �MI�, 1984. Ministerial Regulation No. 6 �B. E. 2527�, Thailand.
TSUNAMI-INDUCED DAMAGE AND FRAGILITY OF BUILDINGS IN THAILAND S401
Siripong, A., Choi, B. H., Vichiencharoen, C., Yumuang, S., and Sawangphol, N., 2005. Thechanging coastline on the Andaman seacoasts of Thailand from the Indian Ocean tsunami, inProceedings of the Special Asia Tsunami Session at APAC 2005, Jeju-do, Korea.
Technical Council on Lifeline Earthquake Engineering �TCLEE�, 2005. Sumatra-Andaman Is-lands Earthquake and Tsunami of December 26, 2004—Lifeline Performance, American So-ciety of Civil Engineers, TCLEE Monograph No. 29.
�Received 7 October 2005; accepted 3 May 2006�