
Estimating ozone risks using forest monitoring networks—results for science, policy, and society
12
1 23 Annals of Forest Science Official journal of the Institut National de la Recherche Agronomique (INRA) ISSN 1286-4560 Annals of Forest Science DOI 10.1007/s13595-014-0440-y Estimating ozone risks using forest monitoring networks—results for science, policy, and society Antonella Cristofori, Giovanni Bacaro, Mauro Confalonieri, Fabiana Cristofolini, Luisa Frati, Francesco Geri, Elena Gottardini, et al.
-
Upload
independent -
Category
Documents
-
view
1 -
download
0
Transcript of Estimating ozone risks using forest monitoring networks—results for science, policy, and society

1 23
Annals of Forest ScienceOfficial journal of the Institut Nationalde la Recherche Agronomique (INRA) ISSN 1286-4560 Annals of Forest ScienceDOI 10.1007/s13595-014-0440-y
Estimating ozone risks using forestmonitoring networks—results for science,policy, and society
Antonella Cristofori, GiovanniBacaro, Mauro Confalonieri, FabianaCristofolini, Luisa Frati, Francesco Geri,Elena Gottardini, et al.
1 23
Your article is protected by copyright and
all rights are held exclusively by INRA and
Springer-Verlag France. This e-offprint is
for personal use only and shall not be self-
archived in electronic repositories. If you wish
to self-archive your article, please use the
accepted manuscript version for posting on
your own website. You may further deposit
the accepted manuscript version in any
repository, provided it is only made publicly
available 12 months after official publication
or later and provided acknowledgement is
given to the original source of publication
and a link is inserted to the published article
on Springer's website. The link must be
accompanied by the following text: "The final
publication is available at link.springer.com”.
ORIGINAL PAPER
Estimating ozone risks using forest monitoring networks—resultsfor science, policy, and society
Antonella Cristofori & Giovanni Bacaro & Mauro Confalonieri & Fabiana Cristofolini &Luisa Frati & Francesco Geri & Elena Gottardini & Gabriele Tonidandel & Fabio Zottele &
Marco Ferretti
Received: 30 May 2014 /Accepted: 10 November 2014# INRA and Springer-Verlag France 2014
Abstract& Key message Few integration steps (adding low-costozone measurements, link to existing conventional moni-tors, joint data processing) transformed the traditionalforest monitoring network into a multifunctional infra-structure producing information relevant for estimatingrisk to vegetation and human health
&Context Traditionally, forest monitoring networks have beendesigned to assess status and trends of forest condition. Weargue that they can help providing answers to a much broaderrange of questions for science, policy, and society. Here, weconcentrate on the example of ground-level ozone pollution.& Aims The aim of this study is to demonstrate the value ofpresent forest monitoring networks as infrastructures that—with few integration steps—can provide important data andinformation to estimate the risk posed by ground-level ozoneto vegetation and human health.& Methods We measured ozone concentration by passivesamplers at the local (Trentino, northern Italy) plots of theICP Forests Level I network over the period 2007–2011.By integrating these data with those from conventionalozone monitors (mostly located in urban areas), we (i)obtained an even distribution of air quality measurementsover the investigated area, (ii) estimated international ex-posure indicators for vegetation and human population,and (iii) obtained data allowing geostatistical modelingand mapping of ozone concentrations, exposure, and asso-ciated potential risk.& Results Mean May–July ozone concentration ranged from58 to 169 μg m−3, depending on forest site and year. Modeling
Handling Editor: Pasi RAUTIO
Contribution of the co-authors Antonella Cristofori contributed todesign the experiment, running field work, and write the paper; GiovanniBacaro contributed to model ozone concentrations and write the paper;Mauro Confalonieri contributed to organize field work and write thepaper; Fabiana Cristofolini contributed to design the experiment, runningfield work, and write the paper; Luisa Frati contributed to model ozoneconcentrations, derive and map ozone risk for population, and write thepaper; Francesco Geri contributed to map ozone concentrations and writethe paper; Elena Gottardini contributed to design the experiment, runningfield work, coordinating the research project, and write the paper;Gabriele Tonidandel contributed to collect ozone concentration data andwrite the paper; Fabio Zottele contributed to spatialize temperature dataand write the paper; Marco Ferretti contributed to design the experiment,supervise the work, and write the paper.
Electronic supplementary material The online version of this article(doi:10.1007/s13595-014-0440-y) contains supplementary material,which is available to authorized users.
A. Cristofori (*) : F. Cristofolini : E. GottardiniSustainable Agro-ecosystems and Bioresources Department,Research and Innovation Centre, Fondazione Edmund Mach, Via E.Mach 1, 38010 San Michele all’Adige, TN, Italye-mail: [email protected]
F. Cristofolinie-mail: [email protected]
E. Gottardinie-mail: [email protected]
G. Bacaro : L. Frati : F. Geri :M. FerrettiTerraData environmetrics, Via L. Bardelloni 19,58025 Monterotondo M.mo, GR, Italy
G. Bacaroe-mail: [email protected]
L. Fratie-mail: [email protected]
F. Gerie-mail: [email protected]
M. Ferrettie-mail: [email protected]
G. BacaroCNR-IRPI, Istituto di Ricerca per la Protezione Idrogeologica, ViaMadonna Alta 126, 06128 Perugia, Italy
Annals of Forest ScienceDOI 10.1007/s13595-014-0440-y
Author's personal copy
and mapping (root-mean-square deviation (RMSD)=12.31 μg m−3) provided evidence that the risk threshold forvegetation in terms of AOT40 was exceeded in large parts(90 %) of the study area, and frequently even by two times,depending on the year. With respect to population, up to 43 %of the dwellers were exposed to medium–high risk ofexceedances of the information threshold.& Conclusion Ozone measurements carried out at the ICPForests Level I forest monitoring network permitted mappingozone levels and the estimation of possible risk for vegetationand human health. Forest monitoring networks can be seen asinfrastructures that can be useful to address a wide range ofenvironmental issues and with a much broader scope thantheir original one.
Keywords Potential risk . Directive 2008/50/EC .
Vegetation . Human health . Modeling .Mapping
1 Introduction
Tropospheric ozone (O3) originates from photochemical reac-tions involving primary air pollutants such as nitrogen oxides(NOx, mostly emitted by human activities) and volatile or-ganic compounds (VOC, from both anthropogenic and bio-genic emission) (The Royal Society 2008). Ozone has beenfrequently reported to cause severe risks to a variety of targets,including forest vegetation (Leisner and Ainsworth 2012) andhuman health (WHO 2000). In Europe, the Directive 2008/50/EC (2008/50/EC 2008) sets acceptable limits for ozone con-centration and exposure to protect human health and vegeta-tion, for which thresholds are also defined by UNECE(CLRTAP 2004). These limits provide the basis under whichnational and regional regulatory agencies operate to identifyareas where limits are exceeded and to undertake countermea-sures or remedial actions. Information about the amount of the
target resource (e.g., population, forests) exposed to potential-ly harmful ozone concentration over a given region is there-fore important to assess the potential risk and “benefit fromthe provision of high resolutionmaps”which “are essential fordefining the communities most at risk” (Coyle et al. 2002).Such information, however, can be obtained only after anestimation process, which is constrained by the availabilityof ozone data and/or the prediction ability and applicability ofmodels. This is particularly true when considering remoteareas. Here, risk assessment is constrained by three maininterrelated aspects: first, measurement of ground-level ozoneis possible and/or affordable on a very limited number of sites.Even when available, measured data may have low spatialand/or temporal resolution. Second, it is known that ozoneconcentration in rural/remote sites is in general higher thanthose of urban areas, due to lack of chemical scavenging andreduced nighttime ozone depletion (the Royal Society 2008).In contrast, most of conventional monitors are located in urbanareas, and—given the above pattern—they generate data thatcannot be readily used to infer ozone risk to forests. Third,measured data at individual sites cannot be readily extrapolat-ed over the target region in order to infer a possible risk. Theseconstrains make modeling an important approach for riskassessment. Modeling ambient air quality has a long history(e.g., Kalenderski and Steyn 2011), and ozone photochemicaldeterministic models have been developed both at large- andlocal-scale. However, up to now, large-scale deterministicmodels are typically available with a too coarse spatial reso-lution (e.g., 50×50-km EMEP), not suited for the local-scalerisk assessment (EEA 2009). On the other hand, even whendeveloped at the local-scale (e.g., TECHNE Consulting s.r.l.2006), photochemical models are data intensive and expen-sive to keep updated. In addition, scientific understanding ofthe physical and chemical processes may be incomplete for agiven region, either in principle or in practice (Kalenderskiand Steyn 2011). As a result, statistical and geostatisticalmodeling can be an option, and several attempts exist in thisrespect (e.g., Loibl et al. 2004).
Permanent networks of forest-condition monitoring plotshave been installed on a systematic basis since the 1980s inEurope (Ferretti and Fischer 2013). They cover remote andforested areas, are georeferenced, and represent a convenientinfrastructure for all those information needs that require aneven spatial coverage, like the assessment of ozone pollution.Here, we present a study based on 5-year integrated datacollection (different sources: passive sampling at forest sitesand conventional monitors in urbanized areas), geostatisticalmodeling and mapping approach to produce “basic” spatialinformation of ozone data for a montane area in northern Italy,province of Trento (Fig. 1). In this area, ozone is originated inpart by precursors from local sources (motorways and urbanareas in the valley bottoms) and partly imported during theafternoon by air movements from the nearby heavily
G. BacaroBIOCONNET, Biodiversity and Conservation Network, Departmentof Life Sciences, University of Siena, Via P.A. Mattioli 4,53100 Siena, Italy
M. ConfalonieriForests and Fauna Service, Autonomous Province of Trento, ViaG.B. Trener 3, 38121 Trento, Italye-mail: [email protected]
G. TonidandelEnvironmental Protection Agency, Autonomous Province of Trento,Piazza Vittoria, 5 - 38122 Trento, Italye-mail: [email protected]
F. ZotteleGeographic Information System, Centre for Technology Transfer,Fondazione Edmund Mach, Via E. Mach 1, 38010 San Micheleall’Adige, TN, Italye-mail: [email protected]
A. Cristofori et al.
Author's personal copy
urbanized Po valley and Lombardy. A possible contribution ofbiogenic emission cannot be excluded, although no data wasavailable to estimate its actual importance in the area. Thelocal systematic ICP Forests Level I monitoring network(Lorenz and Fischer 2013) was equipped with passive sam-plers and integrated with the network of automatic analyzersof the Environmental Protection Agency, AutonomousProvince of Trento (APPA). This approach provides the basis(i) to cope with the constrained condition of ozone dataavailability typical of many montane regions in Europe (e.g.,Sanz et al. 2007) and (ii) to functionally connect the higherspatial resolution of the passive sampling network with thehigher time resolution of the conventional monitors. The aimswere (i) to provide spatially explicit estimates of the risk posedby ozone to vegetation and human health and, by this mean,(ii) to provide a proof of the potential of traditional forestmonitoring networks not only for forest science (risk forpotential impact of ozone on forests) but also for policy andthe society at large extent (risk for seminatural vegetation andhuman health), demonstrating that multifunctionality of forestmonitoring networks can be of great help in reconciling forestmonitoring with environmental and societal needs (Ferrettiet al. 2013).
2 Materials and methods
2.1 Study concept
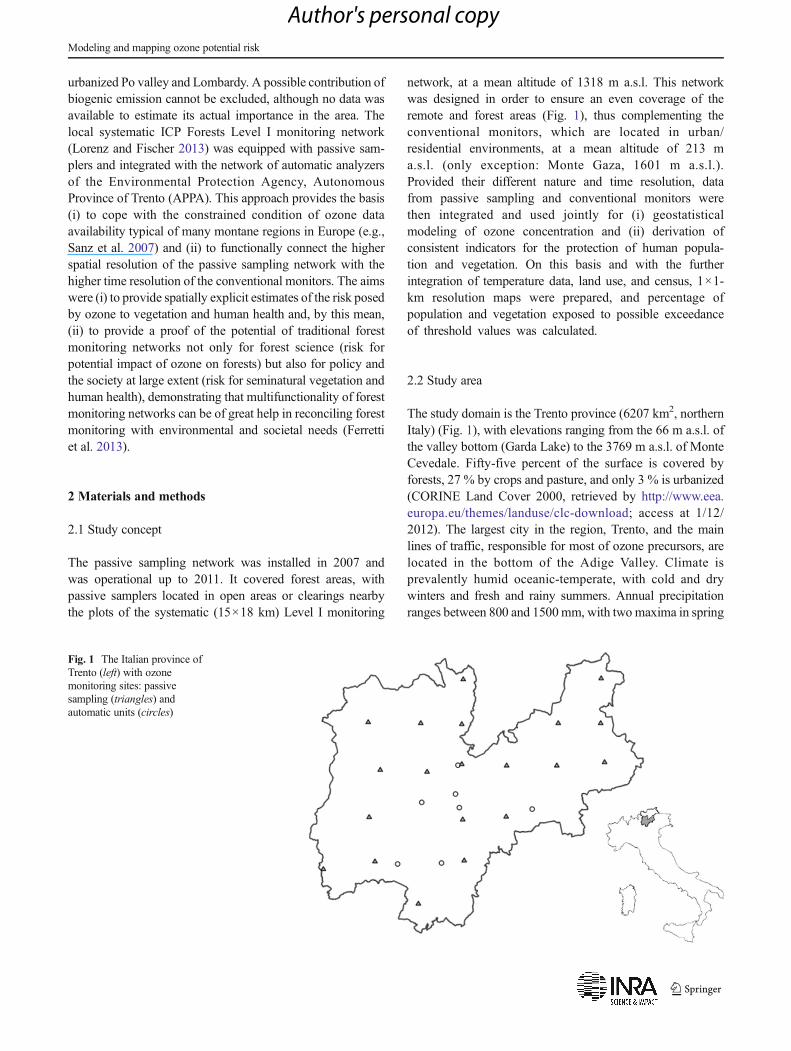
The passive sampling network was installed in 2007 andwas operational up to 2011. It covered forest areas, withpassive samplers located in open areas or clearings nearbythe plots of the systematic (15×18 km) Level I monitoring
network, at a mean altitude of 1318 m a.s.l. This networkwas designed in order to ensure an even coverage of theremote and forest areas (Fig. 1), thus complementing theconventional monitors, which are located in urban/residential environments, at a mean altitude of 213 ma.s.l. (only exception: Monte Gaza, 1601 m a.s.l.).Provided their different nature and time resolution, datafrom passive sampling and conventional monitors werethen integrated and used jointly for (i) geostatisticalmodeling of ozone concentration and (ii) derivation ofconsistent indicators for the protection of human popula-tion and vegetation. On this basis and with the furtherintegration of temperature data, land use, and census, 1×1-km resolution maps were prepared, and percentage ofpopulation and vegetation exposed to possible exceedanceof threshold values was calculated.
2.2 Study area
The study domain is the Trento province (6207 km2, northernItaly) (Fig. 1), with elevations ranging from the 66 m a.s.l. ofthe valley bottom (Garda Lake) to the 3769 m a.s.l. of MonteCevedale. Fifty-five percent of the surface is covered byforests, 27 % by crops and pasture, and only 3 % is urbanized(CORINE Land Cover 2000, retrieved by http://www.eea.europa.eu/themes/landuse/clc-download; access at 1/12/2012). The largest city in the region, Trento, and the mainlines of traffic, responsible for most of ozone precursors, arelocated in the bottom of the Adige Valley. Climate isprevalently humid oceanic-temperate, with cold and drywinters and fresh and rainy summers. Annual precipitationranges between 800 and 1500mm, with two maxima in spring
Fig. 1 The Italian province ofTrento (left) with ozonemonitoring sites: passivesampling (triangles) andautomatic units (circles)
Modeling and mapping ozone potential risk
Author's personal copy
and autumn. Annual mean temperature varies between 8 and12 °C (Eccel and Saibanti 2005).
2.3 Input data for modeling approaches
Input data for modeling included geographical localizationand elevation, land use data, spatially explicit modeled tem-perature data, ozone data from passive sampling and automat-ic units, and demographic data. Ozone concentration datawere collected by eight UV-photometric analyzers with hourlymeasurement (APPA; n=7 urban-suburban automatic, n=1mountain) and 15–20 sites equipped by diffusive samplers,with weekly exposure time (passam ag, Männedorf,Switzerland; n=15 in 2007; n=20 in 2008–2011), exposedin open areas nearby the forest plots for 13 weeks in a periodranging from the end of April to the start of August during theyears 2007–2011 (Fig. 1; Online Resource 1). Cross-calibration of passive samplers and automatic analyzers wasperformed by means of colocated devices (for details seeGottardini et al. 2010).
Weekly mean temperature maps were calculated fromhourly temperature maps at a 250-m spatial resolution andthen upscaled to the 1-km resolution grid selected for themodeling approach (Gottardini et al. 2010), using the meanvalue as a linear operator on the pixel values. Maps weremodeled by regression-kriging (RK) (Hengl et al. 2007) onhourly mean temperature records from 113 meteorologicalstations (property of Fondazione Edmund Mach andMeteotrentino).
Based on the data provided by the Statistics Serviceof the Autonomous Province of Trento, Trentino count-ed 477,010 dwellers in 2001 and 524,826 in 2010, witha spatial distribution almost unchanged between the twosurveys. In particular, the highest population densitywas found at elevation <500 m a.s.l. Population cover-age was estimated for each 1×1-km grid cell (the sameused for modeling ozone concentration and potentialrisk) in proportion of the percentage of the surface ofeach cadastral section falling into the given cell andassuming an homogeneous dis t r ibut ion of thepopulation.
2.4 Geostatistical analysis and modeling
Five annual models were developed, one for each year,2007–2011 (for details see Online Resource 2).Predictive geostatistical linear models were evaluatedto estimate mean ozone concentration in 1×1-km gridcells across the entire study domain. Tests for normalityand, when necessary, Box-Cox transformation (Legendreand Legendre 1998) were preliminarily conducted oneach data series, and subsequently, a generalized linearmodel was built. Starting from a full model, the final
parsimonious, reduced model was identified accordingto a step-wise procedure, with explanatory variables(elevation and temperatures) chosen through the mini-mization of the (log) likelihood and the AkaikeInformation Criterion (AIC) (Cristofori et al. 2012).The low number of included explanatory variables wasdefined considering the low number of ozone samplerscompared to the high number of coefficients to estimate.Cross-validation statistics by leave-one-out procedurewas used to assess the bias, and the accuracy of thefinal spatial model was evaluated by root-mean-squaredeviation (RMSD). Universal kriging (Krige 1976) wasthen applied in order to predict mean ozone concentra-tions in each 1×1-km grid cell across the whole Trentoprovince, for the considered period (2007–2011).
2.5 Estimation of potential exceedances of target thresholdsfor ozone exposure
As for vegetation, ozone accumulated over a threshold of80 μg m−3 (=40 parts per billion, AOT40) was the indicatordefined to evaluate potential risk due to ozone (2008/50/EC2008; CLRTAP 2004). AOT40 was estimated for each 1×1-km cell on the basis of mean concentration data and by asimple linear model (Ferretti et al. 2012a). In order to identifyand quantify the vegetation area potentially at risk, the esti-mated AOT40 was associated to CORINE Land Cover codesfor forests (3.1) and seminatural vegetation (3.2). Evaluationwas referred to three categories of potential relative risk:AOT40<risk threshold (RT), RT<AOT40<2RT, AOT40>2RT. RTs considered in this study were those set by theDirective 2008/50/EC (6000 and 18,000 μg m−3 h−1, long-term objective and target value, respectively) and by UNECE(10,000 μg m−3 h−1, critical level; CLRTAP 2004).
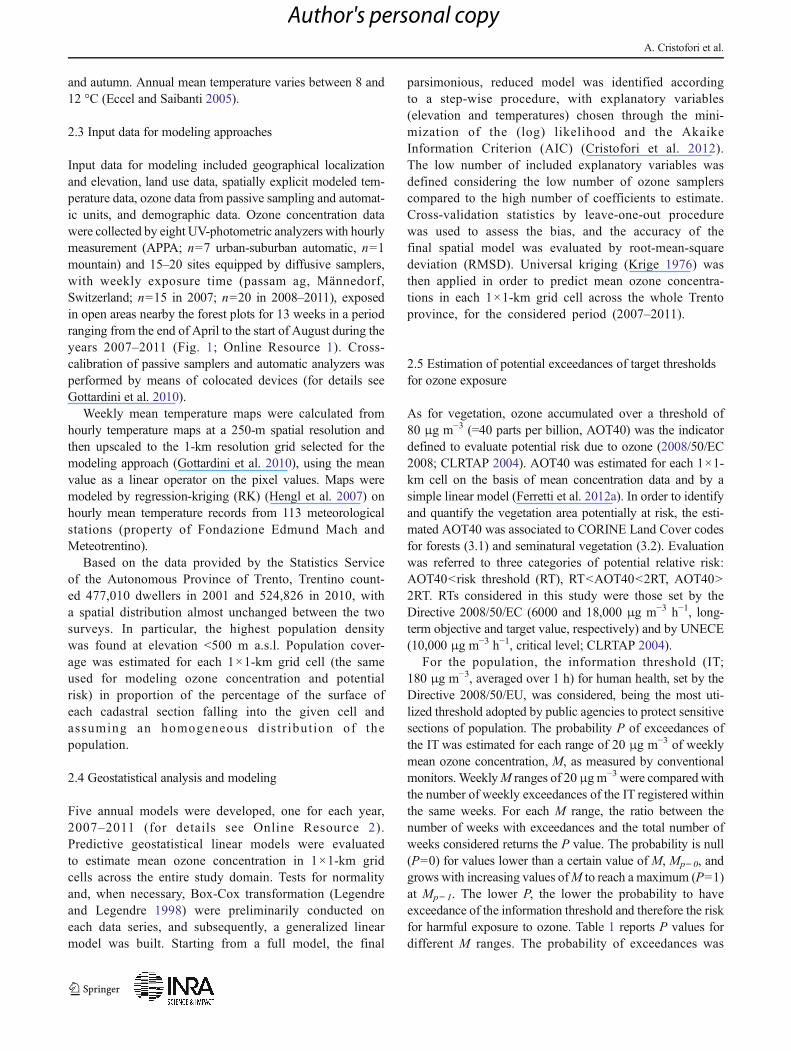
For the population, the information threshold (IT;180 μg m−3, averaged over 1 h) for human health, set by theDirective 2008/50/EU, was considered, being the most uti-lized threshold adopted by public agencies to protect sensitivesections of population. The probability P of exceedances ofthe IT was estimated for each range of 20 μg m−3 of weeklymean ozone concentration, M, as measured by conventionalmonitors. WeeklyM ranges of 20μg m−3 were compared withthe number of weekly exceedances of the IT registered withinthe same weeks. For each M range, the ratio between thenumber of weeks with exceedances and the total number ofweeks considered returns the P value. The probability is null(P=0) for values lower than a certain value of M, Mp=0, andgrows with increasing values ofM to reach a maximum (P=1)at Mp=1. The lower P, the lower the probability to haveexceedance of the information threshold and therefore the riskfor harmful exposure to ozone. Table 1 reports P values fordifferent M ranges. The probability of exceedances was
A. Cristofori et al.
Author's personal copy
calculated only for grid cells with elevations <500 m a.s.l. andnumber of residents >0.
2.6 Quality assurance
Data completeness was verified for each automatic analyzer.Mean completeness was 94.9 % (range 60.5–100 %); dataseries (site/year) with a completeness <90 % were discarded(four out of 31). Reliability of ozone concentration data pro-vided by passive sampling was evaluated by parallel measure-ments in close proximity of the conventional monitors. Rawhourly mean temperatures used for the modeling were vali-dated using standard data quality routines. Reliability ofmodeled temperatures was further tested by comparisonwith data measured by temperature micro-dataloggers(FT-800/System, Econorma s.a.s., Treviso, Italy), posi-tioned in each ozone measurement site.
3 Results
3.1 Ozone concentration
Seasonal and daily time course of mean ozone concen-trations recorded by passive samplers and automaticunits are reported in Fig. 2. Although the time courseis consistent between the two methods, the mean valuesdiffer. Besides differing accuracy, this may depend onthe location and elevation of the monitoring sites(Gottardini et al. 2010). The well-known pattern forwhich urban areas (mostly at the valley bottom) showlower ozone concentration than rural/montane areas(mostly at medium to high elevation) (The RoyalSociety 2008) was proven true also for the TrentoProvince. Moreover, comparing the daily course ofhourly mean ozone concentration for low and highelevation automatic units, a clear reduction of nighttime
Table 1 Probability of weekly exceedances of the information threshold (180 μg m−3) related to each concentration range (M, μg m−3) at sitesequipped with automatic analyzers, mean exceedance probability (±standard deviation) for valley floor only (Monte Gaza excluded) and all sites
Site M<60 60<M<80 80<M<100 100<M<120 120<M<140 140<M<160
Borgo Valsugana 0 0.04 0.44 1.00 – –
Trento Gardolo 0 0.10 – – – –
Monte Gaza 0 0 0 0.08 0.38 0.50
Trento Parco S. Chiara 0 0.05 0.20 0.60 – –
Piana Rotaliana 0 0.15 0.35 1 – –
Riva del Garda 0 0.05 0.58 1 – –
Rovereto Largo Posta 0 0 0.05 0.56 – –
Grumo S. Michele a/A 0 0.13 0.50 – – –
Valley floor 0.0 0.07 (±0.05) 0.35 (±0.20) 0.83 (±0.23) – –
All sites 0.0 0.06 (±0.05) 0.30 (±0.22) 0.71 (±0.37) 0.38 0.50
0
20
40
60
80
100
120
140
160
19 20 21 22 23 24 25 26 27 28 29 30 31
mgµ(
noitart
ne cn
oce
noz
O-3
)
Week number
Mountain unit
Forest passive sampling
Urban units0
20
40
60
80
100
120
140
160
1 3 5 7 9 11 13 15 17 19 21 23
Hour of the day
Mountain unit
Urban units
Fig. 2 Time course of mean ozone concentrations for the consideredweeks (left) and for the daytime (right). Mean concentration over 2007–2011 is represented by week for the mountain automatic unit (1601 ma.s.l.), the forest passive sampling sites (n=15 in 2007, 20 in 2008–2011;
mean elevation 1318 m a.s.l.), and the urban-suburban automatic units(n=7, mean elevation 213 m a.s.l.); bars indicate the standard deviationamong years (left). Daily development of the hourly mean of ozoneconcentration for a mountain and six urban units, referred to 2007 (right)
Modeling and mapping ozone potential risk
Author's personal copy
ozone depletion is demonstrated for the mountain site(Fig. 2).
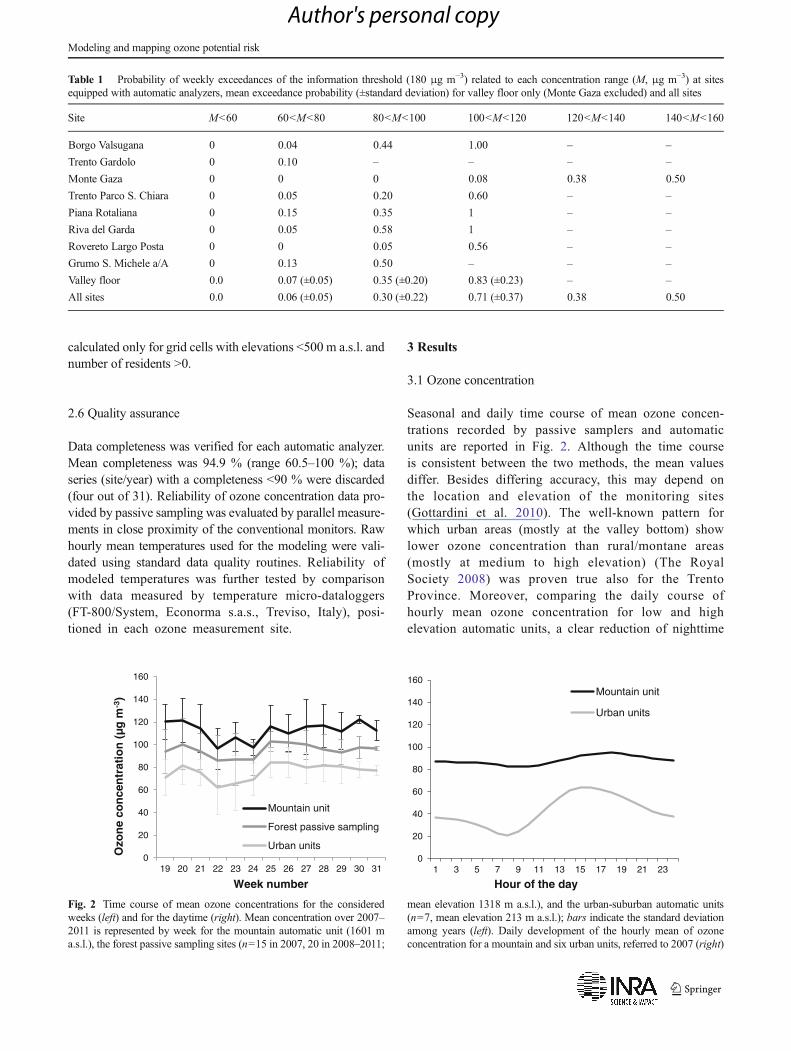
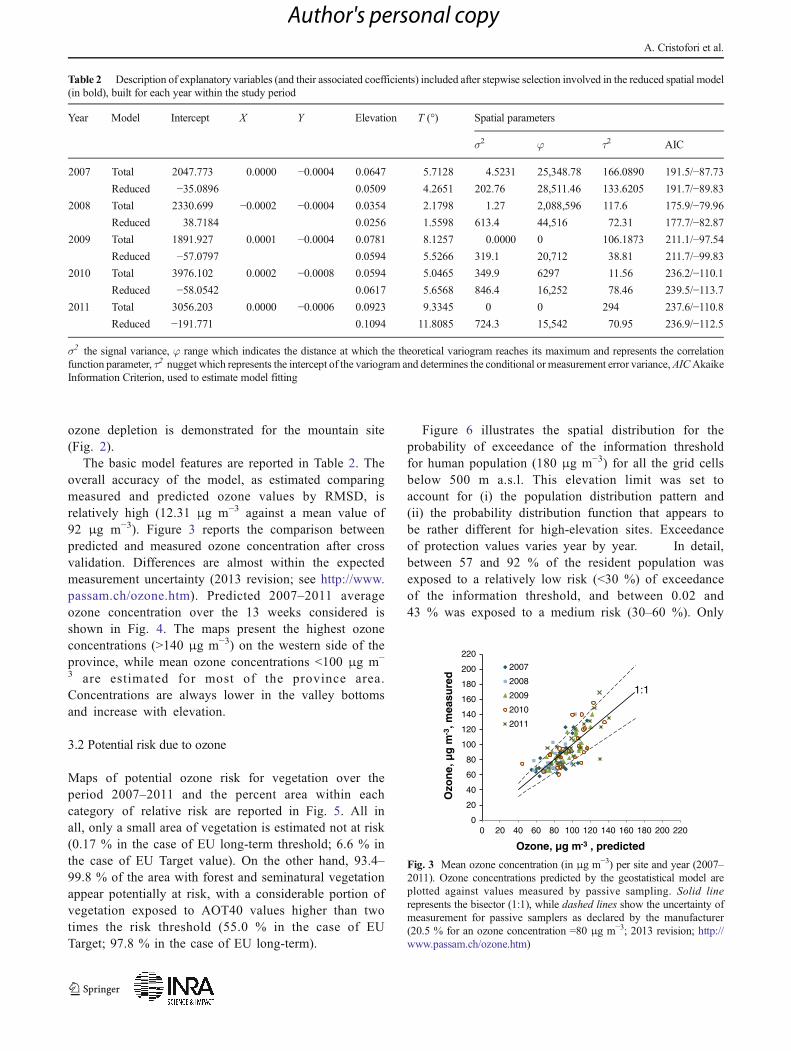
The basic model features are reported in Table 2. Theoverall accuracy of the model, as estimated comparingmeasured and predicted ozone values by RMSD, isrelatively high (12.31 μg m−3 against a mean value of92 μg m−3). Figure 3 reports the comparison betweenpredicted and measured ozone concentration after crossvalidation. Differences are almost within the expectedmeasurement uncertainty (2013 revision; see http://www.passam.ch/ozone.htm). Predicted 2007–2011 averageozone concentration over the 13 weeks considered isshown in Fig. 4. The maps present the highest ozoneconcentrations (>140 μg m−3) on the western side of theprovince, while mean ozone concentrations <100 μg m−
3 are estimated for most of the province area.Concentrations are always lower in the valley bottomsand increase with elevation.
3.2 Potential risk due to ozone
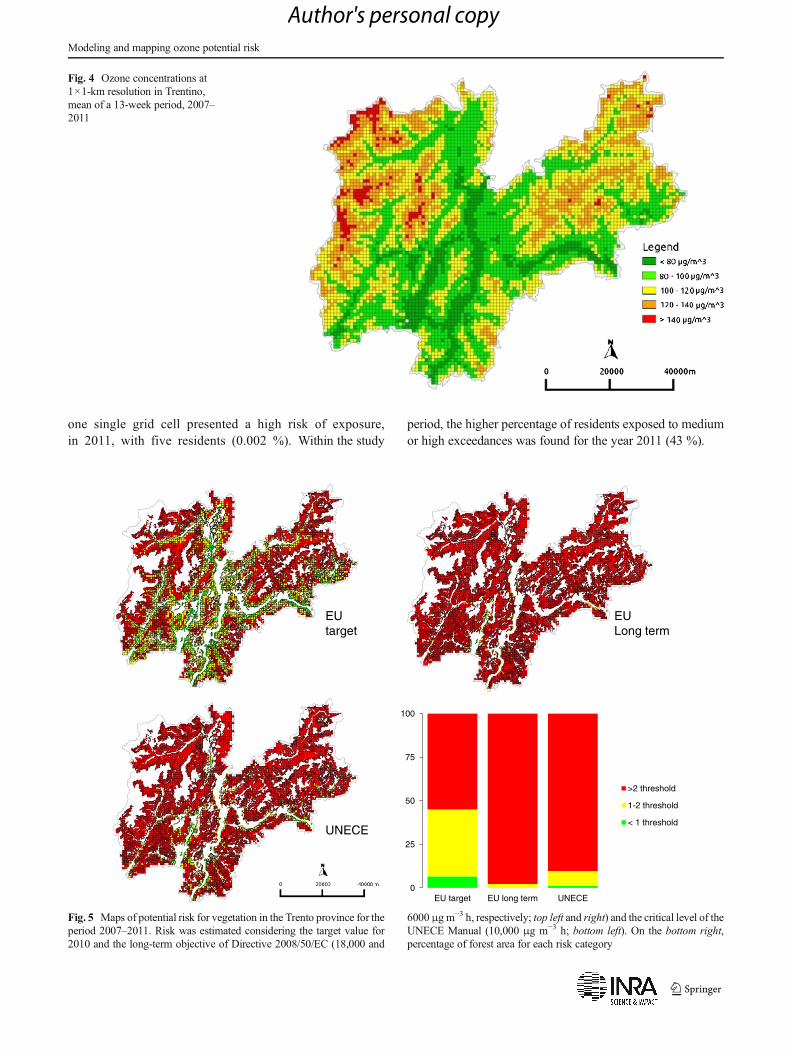
Maps of potential ozone risk for vegetation over theperiod 2007–2011 and the percent area within eachcategory of relative risk are reported in Fig. 5. All inall, only a small area of vegetation is estimated not at risk(0.17 % in the case of EU long-term threshold; 6.6 % inthe case of EU Target value). On the other hand, 93.4–99.8 % of the area with forest and seminatural vegetationappear potentially at risk, with a considerable portion ofvegetation exposed to AOT40 values higher than twotimes the risk threshold (55.0 % in the case of EUTarget; 97.8 % in the case of EU long-term).
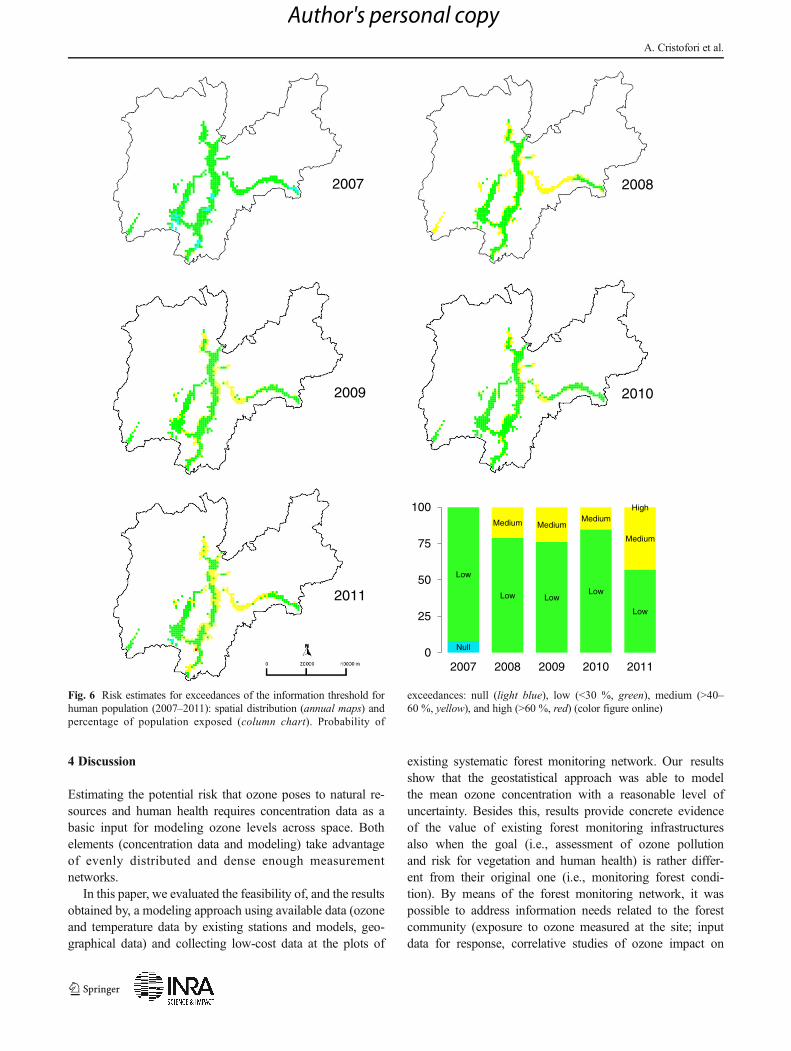
Figure 6 illustrates the spatial distribution for theprobability of exceedance of the information thresholdfor human population (180 μg m−3) for all the grid cellsbelow 500 m a.s.l. This elevation limit was set toaccount for (i) the population distribution pattern and(ii) the probability distribution function that appears tobe rather different for high-elevation sites. Exceedanceof protection values varies year by year. In detail,between 57 and 92 % of the resident population wasexposed to a relatively low risk (<30 %) of exceedanceof the information threshold, and between 0.02 and43 % was exposed to a medium risk (30–60 %). Only
Table 2 Description of explanatory variables (and their associated coefficients) included after stepwise selection involved in the reduced spatial model(in bold), built for each year within the study period
Year Model Intercept X Y Elevation T (°) Spatial parameters
σ2 φ τ2 AIC
2007 Total 2047.773 0.0000 −0.0004 0.0647 5.7128 4.5231 25,348.78 166.0890 191.5/−87.73Reduced −35.0896 0.0509 4.2651 202.76 28,511.46 133.6205 191.7/−89.83
2008 Total 2330.699 −0.0002 −0.0004 0.0354 2.1798 1.27 2,088,596 117.6 175.9/−79.96Reduced 38.7184 0.0256 1.5598 613.4 44,516 72.31 177.7/−82.87
2009 Total 1891.927 0.0001 −0.0004 0.0781 8.1257 0.0000 0 106.1873 211.1/−97.54Reduced −57.0797 0.0594 5.5266 319.1 20,712 38.81 211.7/−99.83
2010 Total 3976.102 0.0002 −0.0008 0.0594 5.0465 349.9 6297 11.56 236.2/−110.1Reduced −58.0542 0.0617 5.6568 846.4 16,252 78.46 239.5/−113.7
2011 Total 3056.203 0.0000 −0.0006 0.0923 9.3345 0 0 294 237.6/−110.8Reduced −191.771 0.1094 11.8085 724.3 15,542 70.95 236.9/−112.5
σ2 the signal variance, φ range which indicates the distance at which the theoretical variogram reaches its maximum and represents the correlationfunction parameter, τ2 nugget which represents the intercept of the variogram and determines the conditional or measurement error variance,AICAkaikeInformation Criterion, used to estimate model fitting
0
20
40
60
80
100
120
140
160
180
200
220
0 20 40 60 80 100 120 140 160 180 200 220
Ozo
ne,
µg
m-3
, mea
sure
d
Ozone, µg m-3 , predicted
2007
2008
2009
2010
2011
1:1
Fig. 3 Mean ozone concentration (in μg m−3) per site and year (2007–2011). Ozone concentrations predicted by the geostatistical model areplotted against values measured by passive sampling. Solid linerepresents the bisector (1:1), while dashed lines show the uncertainty ofmeasurement for passive samplers as declared by the manufacturer(20.5 % for an ozone concentration =80 μg m−3; 2013 revision; http://www.passam.ch/ozone.htm)
A. Cristofori et al.
Author's personal copy
one single grid cell presented a high risk of exposure,in 2011, with five residents (0.002 %). Within the study
period, the higher percentage of residents exposed to mediumor high exceedances was found for the year 2011 (43 %).
Fig. 4 Ozone concentrations at1×1-km resolution in Trentino,mean of a 13-week period, 2007–2011
0
25
50
75
100
EU target EU long term UNECE
>2 threshold
1-2 threshold
< 1 thresholdUNECE
EU target
EU Long term
Fig. 5 Maps of potential risk for vegetation in the Trento province for theperiod 2007–2011. Risk was estimated considering the target value for2010 and the long-term objective of Directive 2008/50/EC (18,000 and
6000μg m−3 h, respectively; top left and right) and the critical level of theUNECE Manual (10,000 μg m−3 h; bottom left). On the bottom right,percentage of forest area for each risk category
Modeling and mapping ozone potential risk
Author's personal copy
4 Discussion
Estimating the potential risk that ozone poses to natural re-sources and human health requires concentration data as abasic input for modeling ozone levels across space. Bothelements (concentration data and modeling) take advantageof evenly distributed and dense enough measurementnetworks.
In this paper, we evaluated the feasibility of, and the resultsobtained by, a modeling approach using available data (ozoneand temperature data by existing stations and models, geo-graphical data) and collecting low-cost data at the plots of
existing systematic forest monitoring network. Our resultsshow that the geostatistical approach was able to modelthe mean ozone concentration with a reasonable level ofuncertainty. Besides this, results provide concrete evidenceof the value of existing forest monitoring infrastructuresalso when the goal (i.e., assessment of ozone pollutionand risk for vegetation and human health) is rather differ-ent from their original one (i.e., monitoring forest condi-tion). By means of the forest monitoring network, it waspossible to address information needs related to the forestcommunity (exposure to ozone measured at the site; inputdata for response, correlative studies of ozone impact on
2007
2011
2008
20102009
Null
Low
Low LowLow
Low
Medium MediumMedium
Medium
High
0
25
50
75
100
2007 2008 2009 2010 2011
Fig. 6 Risk estimates for exceedances of the information threshold forhuman population (2007–2011): spatial distribution (annual maps) andpercentage of population exposed (column chart). Probability of
exceedances: null (light blue), low (<30 %, green), medium (>40–60 %, yellow), and high (>60 %, red) (color figure online)
A. Cristofori et al.
Author's personal copy
growth and health; Ferretti et al. 2012b) and to a largergroup of potential data users (input data for modeling andsubsequent estimates for e.g., potential risk for humanhealth). In the same line, mapped ozone levels can be ofvalue when ozone impacts on ecosystem services (Millset al. 2013) are of concern. In a capsule, supplementingthe existing plots with passive sampling and ensuringproper integration with other data sources (e.g., conven-tional monitors, existing temperature models) providedadditional value to the original forest monitoring network.
There are, however, several elements that need improve-ment. From the technical point of view, the probability distri-bution function of risk threshold exceedance for human healthrequires to be adapted for high elevation areas. From a moregeneral perspective, adequate communication and dissemina-tion are necessary to make resource managers, decisionmakers, environmental protection agencies, local health au-thorities, and monitoring administrators aware of the consid-erable benefit that few integration steps can provide to theinformation potential of monitoring networks.
Another issue is the extent at which potential risk canactually result into real effects. Although addressing such anissue is out of the scope of this paper, it is worth mentioningthat different factors may modify the actual response to ozoneof plants and human beings. This is particularly true forvegetation, for which ozone uptake by foliage (rather thanexposure) is considered more suited to evaluate the actual risk(e.g., Reich 1987). Since ozone uptake is controlled by sto-matal conductance, actual risk for vegetation can differ fromthe potential risk inferred by e.g. AOT40 data (The RoyalSociety 2008). In particular, such a risk can be considerablylower than expected at sites subject to drought condition (e.g.Mediterranean sites). It is worth noting that, due to the localclimate, most forests in Trentino experience fresh and rainysummer, with potentially scarce limitation for ozone uptake.Actually, preliminary data showed that time patterns of ozoneflux and AOT40 are pretty similar (Ferretti et al. 2012b).
5 Conclusion
Ground-level ozone mean concentration was modeled over a6207 km2 from data obtained by conventional monitors (most-ly in urban areas) and passive sampling in remote sites ofalready existing forest condition monitoring networks. Crossvalidation revealed an overall agreement between estimatedand measured values, with an estimated root-mean-squaredeviation (RMSD) of 12.31 μg m−3 against a mean value of92 μg m−3. Our study provides evidence that Level I moni-toring network is an infrastructure that not only can be usefulwithin the forest community but also—with a few integrationsteps—may serve as a suitable framework to address a wide
range of environmental concerns, including human health,even at local level.
We focused on the evaluation of the risks posed by ozone toforest and seminatural vegetation (which are of interest forforest and environmental resource managers) and humanhealth (which is of interest of local health authorities). Basedon the forest monitoring grid, we were able to estimate levelsand extent of the potential risk, and this is indeed an importantstep for the environmental management. Whether this poten-tial risk actually results into real effects is out of the scope ofthis paper and will be subject of further investigation.
The results presented here can be reinforced by moreextensive testing at national and international level. Thismay help in strengthening the concept and improve predictivemodels. In a time when support for ecological monitoring isbecoming increasingly difficult (e.g., Legg and Nagy 2006),demonstrating the multifunctionality of the existing infrastruc-ture may also help in reconciling forest monitoring withenvironmental and societal needs.
Acknowledgments Forests and Fauna Service and Environmental Pro-tection Agency of the Autonomous Province of Trento contributed to therealization of the project, in terms of funding, data sharing, and fieldwork. This is the paper No. 6 originated by the Ozone EFFORT project(Ozone EFFect on FORests in Trentino).
Funding Funding was from Forests and Fauna Service andEnvironmental Protection Agency of the Autonomous Province ofTrento.
References
2008/50/EC (2008) Directive 2008/50/EC of the European parliamentand of the council of 21 May 2008 on ambient air quality andcleaner air for Europe. J Eur Union
CLRTAP (2004)Manual onmethodologies and criteria for modelling andmapping critical loads and levels and air pollution effects, risks andtrends, ECEConvention on Long-range transboundary air pollution;accessed on 13/05/2014 at the websites of the ICP mapping &modelling and at the website of the coordination centre for effects
Coyle M, Smith RI, Stedman JR, Weston KJ, Fowler D (2002)Quantifying the spatial distribution of surface ozone concentrationin the UK. Atmos Environ 36:1013–1024. doi:10.1016/S1352-2310(01)00303-X
Cristofori A, Cristofolini F, Gottardini E, Bacaro G, Geri F, Zottele F,Ferretti M (2012) Modellizzazione e spazializzazione delleconcentrazioni di ozono e stima del rischio potenziale per lavegetazione. In: Gottardini et al. (eds) Ozono e foreste inTrentino—Risultati del progetto Ozone EFFORT 2007–2011.Fondazione Edmund Mach, San Michele all’Adige (TN), Italy. pp45–64. ISBN: 978-88-7843-037-2. doi: 10.13140/2.1.4501.8568
Eccel E, Saibanti S (2005) Climatic setting of the Lavarone-VezzenaPlateau in the general context of Trentino. Studi Trent Sci NatActa Geol 82:111–121
EEA (2009) EMEP/EEA air pollutant emission inventory guidebook2009. Technical guidance to prepare national emission inventories2009. European Environment Agency, Luxembourg
Modeling and mapping ozone potential risk
Author's personal copy
Ferretti M, Fischer R (2013) Forest Monitoring: methods for terrestrialinvestigations in Europe with an overview of North America andAsia. Developments in environmental science, vol 12. Elsevier,Oxford
Ferretti M, Cristofolini F, Cristofori A, Gerosa G, Gottardini E (2012a) Asimple linear model for estimating ozone AOT40 at forest sites fromraw passive sampling data. J Environ Monit 14:2238–2244. doi:10.1039/c2em30137g
Ferretti M, Bacaro G, Brunialti G, Cristofolini F, Cristofori A,Frati L, Maccherini S, Gottardini E (2012b) Defogliazione edaccrescimento degli alberi nei siti di monitoraggio delleforeste in Trentino: relazione con fattori stazionali,nutrizionali, meteorologici ed ozono nel periodo 2005–2011.In: Gottardini et al. (eds) Ozono e foreste in Trentino—Risul ta t i del proget to Ozone EFFORT 2007–2011.Fondazione Edmund Mach, San Michele all’Adige (TN),Italy. pp 107–132. ISBN: 978-88-7843-037-2. doi:10.13140/2.1.4501.8568
Ferretti M, Fischer R, Moffat J (2013) Terrestrial methods in forestmonitoring: toward the next generation? In: Ferretti M, Fisher R(eds) Forest monitoring: methods for terrestrial investigations inEurope with an overview of North America and Asia.Developments in environmental science, vol 12. Elsevier, Oxford,pp 483–496
Gottardini E, Cristofori A, Cristofolini F, Ferretti M (2010) Variability ofozone concentration in a montane environment, northern Italy.Atmos Environ 44:147–152. doi:10.1016/j.atmosenv.2009.10.017
Hengl T, Heuvelink GBM, Rossiter DG (2007) About regression-kriging:from equations to case studies. Comput Geosci 33:1301–1315. doi:10.1016/j.cageo.2007.05.001
Kalenderski S, Steyn DG (2011) Mixed deterministic statistical model-ling of regional ozone air pollution. Environmetrics 22:572–586.doi:10.1002/env.1088
Krige DG (1976) A review of the development of geostatistics in SouthAfrica. In: Guarascio M et al (eds) Advanced geostatistics in themining industry. Reidel, Dordrecht, Holland, pp 279–293
Legendre P, Legendre L (1998) Numerical ecology, 2nd edn. ElsevierScience B.V, Amsterdam
Legg CJ, Nagy L (2006) Why most conservation monitoring is, but neednot be, a waste of time. J Environ Manag 78:194–199. doi:10.1016/j.jenvman.2005.04.016
Leisner CP, Ainsworth EA (2012) Quantifying the effects of ozone onplant reproductive growth and development. Glob Chang Biol 18:606–616. doi:10.1111/j.1365-2486.2011.02535.x
LoiblW, Bolhar-Nordenkampf HR, Herman F, Smidt S (2004)Modellingcritical levels of ozone for the forested area of Austria modificationsof the AOT40 concept. Environ Sci Pollut Res 11:171–180. doi:10.1065/espr2004.03.187
Lorenz M, Fischer R (2013) Pan-European forest monitoring: an over-view. In: Ferretti M, Fischer R (eds) Forest monitoring: methods forterrestrial investigations in Europe with an overview of NorthAmerica and Asia. Elsevier Science Bv, Amsterdam, pp 19–32
Mills G, Wagg S, Harmens H (2013) Ozone pollution: impacts onecosystem services and biodiversity. Centre for ecology and hydrol-ogy. Environment Centre Wales, Bangor
Reich P (1987) Quantifying plant response to ozone: a unifying theory.Tree Physiol 3:63–91. doi:10.1093/treephys/3.1.63
Sanz MJ, Calatayud V, Sanchez-Pena G (2007) Measures of ozone concen-trations using passive sampling in forests of South Western Europe.Environ Pollut 145:620–628. doi:10.1016/j.envpol.2006.02.031
TECHNE Consulting s.r.l (2006) Studio modellistico sulla generazione etrasporto dell’ozono. N.Raccolta 13/05, pp.106. APPA, Trento
The Royal Society (2008) Ground-level ozone in the 21st century: futuretrends, impacts and policy implications. The Royal Society, London
WHO (2000) Air quality guidelines for Europe, vol 91, 2nd edn. WHORegional Publications, European Series, Copenhagen
A. Cristofori et al.
Author's personal copy