Erweiterte Surveillance von HIV-Infektionen - Refubium
100
Aus dem Robert Koch-Institut, Abteilung für Infektionsepidemiologie DISSERTATION Erweiterte Surveillance von HIV-Infektionen - Enhanced HIV Surveillance zur Erlangung des akademischen Grades Doctor rerum medicinalium (Dr. rer. medic.) vorgelegt der Medizinischen Fakultät Charité - Universitätsmedizin Berlin von Alexandra Hofmann, MPH aus Dresden Datum der Promotion: 03.12.2021 1
-
Upload
khangminh22 -
Category
Documents
-
view
0 -
download
0
Transcript of Erweiterte Surveillance von HIV-Infektionen - Refubium

Aus dem Robert Koch-Institut,
Abteilung für Infektionsepidemiologie
DISSERTATION
Erweiterte Surveillance von HIV-Infektionen - Enhanced HIV Surveillance
zur Erlangung des akademischen Grades
Doctor rerum medicinalium (Dr. rer. medic.)
vorgelegt der Medizinischen Fakultät Charité - Universitätsmedizin Berlin
von
Alexandra Hofmann, MPH
aus Dresden
Datum der Promotion: 03.12.2021
1

Inhaltsverzeichnis
Abkürzungsverzeichnis ................................................................................................................ 3
1. Zusammenfassung der Publikationspromotion ....................................................................... 4
1.1. Abstrakt (Deutsch) ............................................................................................................ 4
1.2. Abstract (Englisch) ............................................................................................................ 5
1.3. Einleitung .......................................................................................................................... 6
1.4. Methoden ....................................................................................................................... 12
1.5. Ergebnisse ....................................................................................................................... 15
1.6. Diskussion und Schlussfolgerung .................................................................................... 18
1.7. Literaturverzeichnis ........................................................................................................ 25
2. Eidesstattliche Versicherung .................................................................................................. 31
3. Anteilserklärung an den erfolgten Publikationen .................................................................. 32
4. Originalarbeiten als Promotionsleistung ............................................................................... 34
Publikation 1 .............................................................................................................................. 34
Publikation 2 .............................................................................................................................. 48
Publikation 3 .............................................................................................................................. 57
Publikation 4 .............................................................................................................................. 76
5. Lebenslauf .............................................................................................................................. 86
6. Publikationsliste ..................................................................................................................... 88
6.1. Publikationen in wissenschaftlichen Zeitschriften im Peer-Review Verfahren ............. 88
6.2. Weitere Publikationen .................................................................................................... 90
6.3. Zitierfähige wissenschaftliche Beiträge (Veranstaltungen mit Tagungsband) ............... 91
6.4. Weitere wissenschaftliche Beiträge ............................................................................... 98
7. Danksagung .......................................................................................................................... 100
2

Abkürzungsverzeichnis
AIDS Acquired Immune Deficiency Syndrome ART antiretrovirale Therapie BED-CEIA BED HIV-1 Capture enzyme immunoassay CD4 cluster of differentiation 4 COMET Context-based Modeling for Expeditious Typing CRF Circulating Recombinant Form DFS Filterpapierproben mit Dried fluid spots EBM einheitliche Bewertungsmaßstab ECDC Europäische Zentrum für die Prävention und die Kontrolle von Krankheiten ELISA enzyme linked immunosorbent assay et al. und andere FLTR false longterm rate GOP Gebührenordnungsposition HET Personen mit heterosexuellen Kontakten HIV Humane Immundefizienz-Virus IfSG Infektionsschutzgesetz IgG Immunglobuline G INSTI integrase strand transfer inhibitors InzSurv-HIV Surveillance von rezenten HIV-Infektionen KI Konfidenzintervall MSM Männer, die Sex mit Männern haben NGS next generation sequencing NNRTI Nichtnukleosidische Reverse-Transkriptase-Inhibitoren NRTIs Nukleosidische Reverse-Transkriptase-Inhibitoren Odn normalisierte optische Dichte OR Odds Ratio PCR Polymerase-Kettenreaktion PI Proteaseinhibitoren PrEP HIV-Prä-Expositions-Prophylaxe RKI Robert Koch-Institut RNA Ribonukleinsäure TDR transmitted drug resistance USA Vereinigten Staaten von Amerika WHO Weltgesundheitsorganisation Zi Zentralinstitut für die kassenärztliche Versorgung in der Bundesrepublik Deutschland
3

1. Zusammenfassung der Publikationspromotion
1.1. Abstrakt (Deutsch)
Einleitung: Ende 2018 lebten weltweit 37,9 Millionen Menschen mit einer HIV-Infektion und
etwa 1,7 Millionen Menschen hatten sich geschätzt 2018 mit HIV infiziert. Die Strategie der
Weltgesundheitsorganisation aus dem Jahr 2016 hat das Ziel, AIDS (Acquired Immune Deficiency
Syndrome) bis 2030 zu beenden. Daher ist es wichtig sicherzustellen, dass 90% der HIV-
Infizierten, ihren Status kennen und 90% der diagnostizierten therapiert werden und davon 90%
das Virus unterdrücken können („90-90-90-Strategie“). Um diese Ziele zu überwachen wurden
für die HIV-Surveillance in Deutschland neben der gesetzlichen Meldepflicht von HIV-Diagnosen
weitere Bausteine aufgebaut. Dazu zählt u.a. die Überwachung von rezenten HIV-Infektionen
(InzSurv-HIV) und die molekulare Surveillance von rezenten HIV-Infektionen. Es wurde eine neue
Methode zur Ermittlung von Personen die auf HIV getestet wurden und somit ihren HIV-Status
kennen, geprüft.
Methoden: Für InzSurv-HIV wurden Filterpapierproben mit getrockneten Blutstropfen (DFS) von
neudiagnostizierten HIV-Fällen gesammelt, um diese auf rezente HIV-Infektionen zu
untersuchen. Die Filterpapierproben wurden zusätzlich dazu genutzt um das Virus zu
sequenzieren und den HIV-Subtyp zu bestimmen sowie auf erworbene medikamentöse
Resistenzen (TDR) zu untersuchen. Mithilfe von Abrechnungsdaten des Zentralinstituts der
kassenärztlichen Vereinigungen (Zi) wurde die Anzahl der Personen ermittelt, bei denen ein HIV-
Test im niedergelassenen Bereich durchgeführt wurde und daher ihren HIV-Status kennen.
Ergebnisse: Bei den HIV-Neudiagnosen mit DFS lag der Anteil der rezenten HIV-Infektionen
zwischen 2008 und 2014 bei 30,1% (95% KI 29,2%-31,0%). Der Anteil der rezenten HIV-
Infektionen war am höchsten bei Männern, die Sex mit Männern hatten (35,0%, MSM). Unter
809 2013 und 2014 sequenzierten rezenten HIV-Infektionen lag der Anteil der TDR bei 10,8%.
Der HIV-Subtyp B wurde am häufigsten (77,0%), gefolgt vom HIV-Subtyp A (5,1%), festgestellt.
Im Zeitraum von 2013 - 2016 sank der Anteil rezenter HIV-Infektionen mit dem HIV-Subtyp B,
wohingegen der HIV-Subtyp A anstieg. Der Anteil der TDR lang in diesem Zeitraum bei 11,0%.
Zwischen 864.065 Personen (in 2011) und 999.465 Personen (in 2015) wurden im Zeitraum von
2010 und 2015 jährlich auf HIV im niedergelassenen Bereich getestet.
Diskussion und Schlussfolgerung: Es konnten erfolgreich weitere Bausteine der HIV-Surveillance
in Deutschland eingeführt werden. Durch die Nutzung von Routinedaten des Zi konnte erstmalig
4

die Anzahl der durchgeführten HIV-Tests bei Personen im niedergelassenen Bereich bundesweit
ermittelt werden.
1.2. Abstract (Englisch)
Title: Enhanced HIV Surveillance
Background: About 37.9 million people lived worldwide with an HIV-Infection in 2018, about 1.7
million were newly infected in 2018. The World Health Organisation adopted a new strategy in
2016 with the goal to eliminate AIDS (Acquired Immune Deficiency Syndrome) until 2030. This
goal is achieved if 90% of those living with HIV know their diagnosis, 90% of persons diagnosed
with HIV receive a therapy and from those about 90% are virally suppressed. To reach these goals
the surveillance for HIV in Germany was enhanced with a surveillance of recent HIV-Infections
(InzSurv-HIV), molecular surveillance of HIV and new methods were developed to establish the
number of persons tested, in addition to the regular notification of HIV diagnosed cases.
Methods: For InzSurv-HIV dried filter spots were collected from newly diagnosed HIV cases and
tested for recent HIV infections. The dried filter spots were also used for sequencing to identify
HIV Subtypes and to analyse the transmitted drug resistances (TDR) by recent HIV infections. By
using reimbursement data from statutory health insurances from the central research institute
of ambulatory health care (Zi) the number of persons with HIV tests can be estimated for
ambulatory care.
Results: Between 2008 and 2014 about 30.1% of the newly diagnosed HIV cases with dried filter
spots were recently infected. The highest percentage of recent HIV infections could be found
among men who had sex with men (31.7%). From 809 successfully sequenced recent HIV-
Infections (2013 - 2014) the TDR was 10.8%. HIV-Subtype B (77.0%) was common among recent
HIV-Infections, followed by Subtype A (5.1%). Between 2013 - 2016 the percentage of subtype B
decreased and subtype A increased slightly. During the same time period TDR was 11.0%. About
864,065 to 999,465 persons received annually an HIV test between 2010 and 2015.
Discussion and Conclusion: To enhance the HIV Surveillance different additional modules could
be successfully introduced in Germany. For the first time, the number of persons with HIV tests
in ambulatory care could be established by using routine data provided by Zi.
5

1.3. Einleitung
Weltweit lebten Ende 2018 37,9 Millionen Menschen mit einer HIV-Infektion und es wird
geschätzt, dass etwa 1,7 Millionen Menschen sich in 2018 neu mit HIV infiziert haben (1). Für
Europa schätzt das „Europäisches Zentrum für die Prävention und die Kontrolle von Krankheiten“
(ECDC), dass 2018 etwa 2.165.454 Menschen in Europa mit HIV lebten und davon etwa 1.724.600
(80%) von ihrer Infektion wussten (2). Für Deutschland schätzte das Robert Koch-Institut (RKI),
dass in Deutschland Ende 2018 etwa 87.900 (81.600 - 93.000) Menschen mit HIV lebten und
davon etwa 77.300 (71.300 - 82.800), also 87,9% der Infizierten, von ihrer HIV-Infektion wussten
(3).
Humanes Immundefizienz-Virus (HIV)
HIV-Infektionen sind von Mensch zu Mensch, durch Blut oder andere infektiöse
Körperflüssigkeiten übertragbar. Häufigster Übertragungsweg sind dabei ungeschützte
Sexualkontakte. HIV greift das Immunsystem des Körpers, speziell die weißen Blutkörperchen
(CD4 Zellen), an und zerstört diese Zellen und schwächt damit das Immunsystem. Der Verlauf der
HIV-Infektion wird in 3 verschiedene Stadien eingeteilt, ausgehend von einer akuten Infektion
gefolgt von einem symptomarmen Stadium, welches Monate oder Jahre andauern kann. Bei allen
Infizierten erfolgen allerdings irreversible Störungen der Immunabwehr, die im Endstadium der
HIV-Infektion als AIDS (Acquired Immune Deficiency Syndrome) bezeichnet wird und ohne
Therapie zum Tod führte (4).
Eine HIV-Infektion kann nicht geheilt werden. Durch eine antiretrovirale Kombinationstherapie
kann jedoch die Entstehung eines klinisch relevanten Immundefektes und der daraus folgenden
Komplikationen verhindert werden (4). Für die antiretrovirale Therapie einer HIV-Infektion
werden unterschiedliche Wirkstoffe miteinander kombiniert, die u.a. verschiedenen
Medikamentenklassen zugeordnet werden. Das Virus entwickelt unter dem antiretroviralen
Selektionsdruck Resistenzen gegen die einzelnen Wirkstoffe und diese resistenten Virusvarianten
können bei einer HIV-Infektion übertragen werden. Um eine HIV-Infektion gut zu therapieren, ist
eine regelmäßige Kontrolle der Viruslast sowie des Immunstatus mit einer eventuellen
Anpassung der Therapie erforderlich (4).
Der Nachweis einer HIV-Infektion erfolgt im Rahmen einer Stufendiagnostik durch zwei
unterschiedliche Verfahren: dem Suchtest (meist ein ELISA- enzyme linked immunosorbent
assay) zum Nachweis spezifischer Antikörper, gefolgt von einem Bestätigungstest (Immunoblot
6

oder Nukleinsäure-Amplifikations-Test z.B. durch eine Polymerase-Kettenreaktion - PCR), als
Nachweis von Virusantigen oder viralen Nukleinsäuren (5).
Um die Übertragung von HIV-Infektionen zu verhindern, ist somit eine gute Therapie der HIV-
Infizierten notwendig. Die Weltgesundheitsorganisation (WHO) hat 2016 eine globale HIV-
Strategie veröffentlicht mit dem Ziel, AIDS bis 2030 zu beenden und die Anzahl der HIV-
Neuinfektionen zu reduzieren (6). Sie enthält auch Ziele, die bis 2020 erreicht werden sollen.
Dazu gehört die Sicherstellung, dass 90% aller Personen, die mit HIV infiziert sind, ihren HIV-
Status kennen, somit auf HIV getestet wurden. Sowie das von den HIV diagnostizierten Personen
90% eine Therapie erhalten und davon 90% eine niedrige Viruslast (unter der Nachweisgrenze)
haben (6). Mit einer frühzeitig initiierten und lebenslangen Therapie kann sich das individuelle
Immunsystem der erkrankten Person besser regenerieren und eine Übertragung auf andere
Personen kann damit verhindert werden (6, 7).
Für das Erreichen der in der WHO Strategie beschriebenen Ziele ist es daher wichtig, die HIV-
Infektionen eines Landes zu beschreiben und zu überwachen. Dies kann durch die Surveillance
von HIV-Infektionen gewährleistet werden.
Surveillance von HIV-Infektionen
Surveillance ist die kontinuierliche, systematische Erhebung von Daten in einer definierten
Bevölkerung, sowie deren Analyse und Interpretation mit dem Ziel, Public Health-Maßnahmen
entsprechend planen, implementieren und evaluieren zu können (8). Wörtlich bedeutet dabei
Surveillance Überwachung bzw. Beobachtung. Ziel der Surveillance von Infektionskrankheiten ist
es valide, zeitnahe, regional gegliederte Daten zu erheben und diese über verschiedene Regionen
und die Zeit vergleichen zu können (8). Ein weiteres Ziel der Surveillance von
Infektionskrankheiten ist neben der Evaluation von Präventions- und Interventionsmaßnahmen,
die Ausbruchserkennung und die Identifikation von Risikogruppen (8).
In Deutschland erfolgt die Surveillance von Infektionskrankheiten durch eine passive
Datenerfassung. Sie basiert auf einer gesetzlichen Meldepflicht (Gesetz zur Verhütung und
Bekämpfung von Infektionskrankheiten beim Menschen, Infektionsschutzgesetz - IfSG) (9).
HIV gehört zu den meldepflichtigen Erregern, die nichtnamentlich (anonym) direkt vom Labor
ans RKI gemeldet werden müssen (§7.3 IfSG), dabei ist der direkte oder indirekte Nachweis einer
HIV-Infektion meldepflichtig (9). Die Meldung erfolgt postalisch mit einem vom RKI entworfenen
7

Meldebogen, der eine fortlaufende Nummer enthält. Der HIV-Meldebogen erfasst alle im Gesetz
geforderten Informationen zu einem positiven HIV-Fall (§10 IfSG) (9). Auf dem HIV-Meldebogen
wird beispielsweise nach dem Diagnosedatum, Informationen zum Fall sowie zu
Laboruntersuchungen gefragt. Um zu vermeiden, dass ein Fall mehrmals gezählt wird, erhält
jeder Fall einen HIV-Code, der die Identifikation von mehrfachen Meldungen eines Falls
erleichtern soll (9, 10). Der/die einsendende / behandelnde Arzt/Ärztin ist verpflichtet, das Labor
bei der Meldepflicht zu unterstützen und ergänzende Angaben zu dem HIV positiven Fall zu
übermitteln (z. B. Alter, Geschlecht, vermuteter Transmissionsweg; Herkunft, vermuteter
Infektionsort) (10).
In der Surveillance von HIV-Infektionen wird als wichtige epidemiologische Maßzahl die
(kumulierte) Inzidenz verwendet. Sie gibt die Anzahl der Neuerkrankten in Bezug auf die zu
Grunde liegende Bevölkerung in einem bestimmten Zeitraum an (11). Die Bestimmung der
Inzidenz von HIV-Infektionen ist mit Daten aus dieser passiven Surveillance nicht möglich, denn
die Meldung einer Diagnose (Diagnosedatum) erlaubt keinen direkten Rückschluss auf den
Infektionszeitpunkt (Infektionsdatum), da zwischen Infektion und Diagnose viel Zeit vergehen
kann (12). Somit wird in der Surveillance von HIV-Infektionen üblicherweise die Inzidenz der
neudiagnostizierten HIV-Fälle berichtet (12) und die Anzahl der Neuinfizierten wird mithilfe von
Modellierungen geschätzt (3). Die Schätzung für Deutschland nutzt dafür mehrere Datenquellen
wie die HIV-Meldezahlen, die Todesursachen-Statistik, sowie Daten zu Verschreibungen von
antiretroviralen Medikamenten bei gesetzlich versicherten Patienten (13).
Bei der Ermittlung einer Inzidenz ist auch noch zu definieren, welchen Nenner man verwendet,
also auf welche Personengruppe sich die Inzidenz bezieht. In der Regel wird dabei als Nenner die
Bevölkerung Deutschlands verwendet. Alternativ könnte jedoch auch die Anzahl der Personen
verwendet werden, die auf HIV getestet wurden, als Ausgangspunkt für die Überwachung der
Ziele der WHO-Strategie (6). Damit alle Personen ihren HIV-Statuts kennen, benötigen diese
Zugang zu HIV-Tests und die Möglichkeit sich testen zu lassen. In Deutschland stehen für die
Bevölkerung verschiedene kostenlose Testmöglichkeiten zur Verfügung: niedrigschwellige
anonyme Testangebote der Aidshilfen oder der Gesundheitsämter. Aber auch HIV-Tests im
niedergelassenen Bereich sind möglich im Rahmen der Schwangerschaftsvorsorge oder bei
einem Krankheitsverdacht.
8

Erweiterte HIV-Surveillance
Eine Meldepflicht hat den Vorteil, dass gesetzlich festgelegt ist, welche Informationen zu melden
sind und dass jede in Deutschland bestätigte HIV-Infektion zu melden ist (10). Durch eine
Meldepflicht erhält man allerdings keine Informationen über den Verlauf der HIV-Infektion.
Zwischen der Infektion mit HIV und der Diagnose können viele Jahre vergehen. Deshalb ist es auf
Basis der Meldedaten nicht direkt möglich, die Inzidenz der HIV-Infektionen in einem Jahr zu
bestimmen oder Aussagen über das aktuelle Infektionsgeschehen zu treffen. Daher sollte die
HIV-Surveillance durch weitere Bausteine ergänzt werden. So kann beispielsweise für die
Modellierung der HIV Epidemie verschiede Datenquellen genutzt werden um sowohl die Inzidenz
der HIV-Neuinfektionen als auch die HIV Prävalenz in Deutschland zu schätzen. Um das HIV-
Infektionsgeschehen umfassender abbilden zu können, ist es daher erforderlich die gesetzliche
Meldedaten zu ergänzen. So können beispielsweise Beobachtungsstudien ergänzende
Informationen über den Verlauf der Infektion oder zur Medikation liefern (14). Hinzu kommt
eine, für die Ärzteschaft, freiwillige AIDS Fallmeldung die seit 1982 im AIDS-Fallregister erfasst
und dokumentiert werden (14). Verschiedene Befragungen der Labore zur Anzahl durchgeführter
HIV-Testungen ergänzen die erweiterte Surveillance (15-17).
Seit den 2000er Jahren wurden verschiedene serologische Tests entwickelt, mit Hilfe derer die
Dauer einer bestehenden HIV-Infektion ermittelt werden kann. Also ob sich bei der untersuchten
HIV-Infektion um eine rezente (also kürzlich erworbene) HIV-Infektion handelt, die etwa 6
Monate vor der Diagnose erworben wurde (18). Mit den sogenannten „Tests for recent HIV-
Infection“ kann dabei zwischen einer kürzlich erfolgten HIV-Infektion und einer länger
bestehenden HIV-Infektion unterschieden werden, um auf diese Weise die Inzidenz der HIV-
Neuinfektionen genauer bestimmen zu können. Unter den ersten etablierten Tests Anfang der
2000er war der von Sedia Bioscience „BED HIV-1 Capture enzyme immunoassay“ (BED-CEIA) (19)
entwickelte und kommerziell erhältliche Test. Der BED-CEIA misst den Anteil der HIV-1
spezifischen Immunglobulin G (IgG) Antikörper in Relation zu den gesamten IgG (18). Der Test
wurde in Deutschland im Rahmen einer Pilotstudie 2005 - 2007 evaluiert (20) und anschließend
in einer bundesweiten Studie angewendet (21). Dies führte zur Einführung einer bundesweiten
Surveillance von rezenten HIV-Infektionen in 2011, als weiterer Baustein der bestehenden HIV
Surveillance in Deutschland (18).
9

Im Rahmen der Surveillance von rezenten HIV-Infektionen wurde 2013 zusätzlich eine
molekulare Surveillance von HIV-Infektionen aufgebaut (22). Es erfolgte dabei zunächst eine
Testung auf Rezenz durch die im Rahmen der Surveillance gesammelten Filterpapierproben von
neudiagnostizierten HIV-Fällen und anschließend erfolgte eine Genomsequenzierung der Probe
(22). Anhand der Genomsequenz kann der HIV-Subtyp sowie resistenzassoziierte Mutationen
ermittelt werden. Mit diesen Informationen ist es möglich, einen Überblick über aktuell
zirkulierende HIV-Subtypen sowie Informationen zu Transmissionsnetzwerken oder auch HIV-
Ausbrüchen (z.B. in bestimmten Gruppen) zu erhalten (14, 23).
Übertragene resistente Viren (transmitted drug resistance, TDR) sind von klinischer Bedeutung,
da sie die Wirksamkeit der antiretroviralen Therapie (ART) beeinträchtigen und zu einem Anstieg
der Viruslast im Plasma im Falle eines Therapieversagens führen können (24). Die WHO schrieb
in 2010, dass eine HIV-1 Resistenzsurveillance ein wichtiges weltweites Ziel ist, um die Effektivität
der ART zu gewährleisten (25).
Die Erfassung der zirkulierenden HIV-Subtypen in verschiedenen Ländern ist von
epidemiologischer und klinischer Relevanz. Diese Informationen beeinflussen dabei die
Sicherheit und die Genauigkeit der Diagnostik und sind wichtig für die HIV-Prävention und
Entwicklung von Impfungen (22). Durch die Einführung der HIV-Prä-Expositions-Prophylaxe
(PrEP) in 2019 als gesetzliche Krankenkassenleistung (26), wird regelmäßiges Testen auf HIV und
nach bestätigter HIV-Infektion, ein sofortiger Beginn einer ART umso wichtiger, dennoch kann
eine übertragene HIV-Resistenz den Erfolg einer Therapie mindern. Eine Untersuchung auf
genotypische Resistenzen ist daher vor dem Beginn einer Therapie wichtig.
Um im Rahmen der WHO Strategie zu überprüfen, wie viele Personen ihren HIV-Status kennen,
werden in Deutschland Informationen über die Anzahl der durchgeführten Tests bei Personen
benötigt. Das RKI hat Befragungen bei Laboren durchgeführt (sog. Nennerstudien), um die Anzahl
der durchgeführten HIV-Tests (Such- und Bestätigungstests) zu erfassen sowie die Positivenrate
zu bestimmen (15-17), um so u.a. auch zeitliche Trends bei den HIV-Meldungen besser
interpretieren zu können. Diese Befragungen hatten einige Limitationen: Unter anderem ist die
Anzahl der Labore, die eine HIV-Diagnostik in Deutschland durchführen, unbekannt. Daher ist
unklar, ob die teilnehmenden Labore an einer Befragung repräsentativ für alle HIV
diagnostizierenden Labore sind. Die wichtigste Einschränkung ist jedoch, dass in der HIV-
Diagnostik mehrere Tests je Person durchgeführt werden. Zunächst wird ein Suchtest
durchgeführt, der mit einem anderen Testverfahren bestätigt wird. Fällt der zweite Test positiv
10

aus, wird der Test mit einer weiteren Probe wiederholt, um Verwechselungen oder auch
Probenkontaminationen auszuschließen (5). Somit kann es vorkommen, dass mehrere Tests je
Person durchgeführt werden, die möglicherweis auch in verschiedenen Laboren durchgeführt
werden. Einen Rückschluss auf die Anzahl der getesteten Personen ist bei einer Befragung der
Labore schwierig. Um zu eruieren, wie viele Personen sich auf HIV haben testen lassen und somit
ihren HIV-Status kennen, wird daher eine andere Herangehensweise benötigt.
Ziel
Ziel der hier vorgestellten Arbeiten ist es, die zusätzlichen Bausteine der erweiterten HIV-
Surveillance in Deutschland zu beschreiben und dabei:
1. den Aufbau einer Surveillance von rezenten Infektionen darzustellen (18), mit den
Zielen der
a. Ermittlung des Anteils von rezenten HIV-Infektionen unter den
diagnostizierten HIV-Infektionen und der
b. Beschreibung der Fälle mit einer rezenten HIV-Infektion sowie
2. die aus der Surveillance von rezenten HIV-Infektionen entwickelte molekulare
Surveillance zu beschreiben (22, 23), mit den Zielen der
a. Überwachung der aktuell zirkulierenden Subtypen in Deutschland und der
b. Überwachung der aktuell übertragenen Resistenzen in Deutschland sowie
3. die Nutzbarkeit von Routinedaten für die erweiterte Surveillance von HIV-Infektionen
zu prüfen (27), um
a. die Anzahl der auf HIV getesteten Personen zu ermitteln und einen
b. Nenner für die bessere Ermittlung der HIV-Inzidenz zu erhalten.
Die zusätzlichen Bausteine der erweiterten HIV-Surveillance dienen dazu, Rückschlüsse
hinsichtlich aktueller HIV-Infektionen in bestimmten Risikogruppen zu ziehen sowie
herauszufinden, welche HIV-Subtypen und HIV-Resistenzen übertragen werden. Des Weiteren
kann damit der Nenner der Inzidenz von HIV-Infektionen, sowie die Anzahl der Personen
bestimmt werden, die zu einem bestimmten Zeitpunkt ihren HIV-Status kennen. Die Ergebnisse
sollen dazu beitragen, Präventionsbotschaften oder auch Empfehlungen an das aktuelle HIV-
Infektionsgeschehen anzupassen und somit einen Beitrag zur Überwachung der HIV-Infektionen
in Deutschland zu leisten und damit auch die Erreichung der WHO Ziele zu überwachen.
11
Aus diesen übergeordneten Zielen resultiert u.a. die Beschreibung des Anteils der rezenten HIV-
Infektionen unter den neudiagnostizierten HIV-Infektionen (2008 bis 2014), sowie die
Identifikation von Faktoren, die mit einer rezenten HIV-Infektion einhergehen, um die aktuellen
Transmissionsdynamiken besser zu verstehen (18).
Ein weiteres Ziel ist es, die übertragenen Resistenzen und die Bestimmung der HIV-1 Subtypen
unter den neudiagnostizierten (rezenten) HIV-Infektionen (2013-2014) zu ermitteln (22), um
potenzielle phylogenetische Verwandtschaften und HIV-Transmissionscluster zwischen 2013 und
2016 zu beschreiben (23).
Im Rahmen der erweiterten HIV-Surveillance soll zudem geprüft werden, ob die Nutzung von
Daten, die zu einem anderen Zweck erhoben wurden (sog. Routinedaten bzw. Sekundärdaten),
eine sinnvolle Möglichkeit sind, um die Anzahl der getesteten Personen zu ermitteln, um auf
diese Weise den Nenner für die Berechnung der Inzidenz besser bestimmen zu können (27).
1.4. Methoden
Surveillance von rezenten HIV-Infektionen (InzSurv-HIV)
Basis der InzSurv-HIV sind die nicht-namentlich an das RKI gemeldeten HIV-Neudiagnosen gemäß
IfSG (§7.3) Die Anzahl der HIV-Diagnosen variiert nach meldendem Labor. Für den Aufbau der
Surveillance von rezenten HIV-Infektionen wurden daher zunächst nicht alle Labore in
Deutschland rekrutiert, die HIV-Infektionen diagnostizieren, sondern spezifisch jene rekrutiert,
die häufig eine HIV-Diagnostik durchführen und somit viele Meldungen ans RKI übermitteln.
Weiterhin wurde eine Zufallsstichprobe weiterer Labore mit weniger HIV-Meldungen ausgewählt
(18). Die teilnehmenden InzSurv-HIV Labore meldeten etwa 91% aller HIV-Diagnosen zwischen
2008 - 2014 (18). Diese Labore tropften für InzSurv-HIV Restblut, welches aus der Diagnostik der
HIV-Infektion eines Falles übrigblieb, auf Filterpapier (Whatmann #903), als getrocknete Tropfen
von Serum oder getrocknete Plasmatropfen (zusammen Dried Fluid Spots; DFS) (18). Die DFS
wurden anschließend zusammen mit dem HIV-Meldebogen direkt an das RKI gesendet (18).
Für die erste Beschreibung der Surveillance der rezenten HIV-Infektionen wurden DFS
verwendet, die zwischen 2008 und 2014 in zwei verschiedenen Projektphasen gesammelt
wurden (18). Es wurden dabei ausschließlich Fälle beschrieben, die zwischen 2008 und 2014
erstmalig mit HIV diagnostiziert wurden und für die eine Filterpapierprobe vorhanden war (18).
Für die in dem Artikel beschriebene Analyse wurden Fälle, die jünger als 18 Jahre waren bzw. bei
denen als Transmissionsrisiko „Mutter zu Kind Übertragung“ auf dem HIV-Meldebogen
12

angegeben wurde, ausgeschlossen. Zusätzlich wurden Fälle mit unbekanntem Alter und
unbekanntem Geschlecht ausgeschlossen (18).
Laboruntersuchungen zur Ermittlung der HIV-Rezenz (frische Infektion)
Die Untersuchungen der Filterpapierproben erfolgte am RKI im Fachgebiet 18 (HIV und andere
Retroviren), die für die Ermittlung einer rezenten Infektion den Untersuchungsassay BED-CEIA
nutzten, zunächst von der Firma Calypte® und seit 2014 einen Assay der Firma Sedia® (Sedia
Bioscience Corporation, Portland, Oregon, USA) (18). Der Anteil der IgG Antikörper in Relation
zum gesamt IgG wird beim BED-CEIA anhand der normalisierten optischen Dichte (ODn)
gemessen (18). Fälle werden als rezent bzw. als kürzlich erworbene Infektion klassifiziert, wenn
die ODn <0,8 ist (18). Für den BED-CEIA der Firma Sedia® wurde eine rezente Infektion definiert
als HIV-Fall, bei denen die Infektion vor 197 Tagen (127 - 236 Tage) erfolgte bzw. bei Fällen mit
HIV-Subtyp B von 162 Tagen erfolgte (18). Calypte® ermittelte mit ihrem Test einen Cut-off von
155 Tagen (18). In einer Pilotstudie, die in Berlin durchgeführt wurde, konnte eine rezente HIV-
Infektion bis zu 20 Wochen (140 Tage) nach der Infektion nachgewiesen werden (28). Die
Sensitivität und Spezifität des Tests beträgt laut Parekh et al. 81,7% bzw. 89,1% (19). Für
Deutschland wurde eine Sensitivität 80% und eine Spezifität von 86% für einen cut off von
ODn<0,8 ermittelt (28). Der BED-CEIA ist daher nur für epidemiologische Studien zugelassen und
wird nur bei zuvor diagnostizierten HIV-Infektionen genutzt. Dabei wird geprüft, wieviel Zeit
zwischen Infektionszeitpunkt und Diagnosezeitpunkt vergangen ist (18). Für die Entscheidung ob
eine rezente HIV-Infektion vorliegt, wurde zusätzlich ein Testalgorithmus vom ECDC verwendet,
um vom verwendeten Test falsch klassifizierte Ergebnisse zu korrigieren (29). Für eine
vollständige Nutzung des Algorithmus fehlten allerdings Angaben zu den im Rahmen des
Algorithmus verwendeten Variablen, die teilweise nur unvollständig auf dem HIV-Meldebogen
abgefragt werden (29). So konnten damit nur vom verwendeten Test falsch klassifizierte rezente
HIV-Infektionen korrigiert werden, nicht jedoch falsch klassifizierte länger bestehende
Infektionen (18).
Erweiterung InzSurv-HIV um die Untersuchung auf HIV-Subtypen und Resistenzen
Um unter den rezenten HIV-Neudiagnosen die aktuell zirkulierenden HIV-Subtypen und
erworbenen medikamentösen Resistenzen (TDR) zu ermitteln, wurden die DFS der InzSurv-HIV
genutzt. Die Nutzung von DFS für die Surveillance führte bei der Ermittlung von Subtypen und
Resistenzen zu vergleichbaren Ergebnissen wie Studien, die Plasmaproben nutzten (30, 31). Die
13

HIV-RNA wurde aus den Filterpapierproben extrahiert und mittels einer in-house Polymerase-
Kettenreaktion (PCR) nach einem adaptierten Protokoll von Cleland et al. sequenziert (32). Die
Einteilung in HIV-1 Subtypen erfolgte mithilfe des Rega HIV-1 Subtypen Tools und COMET HIV-1
(22, 33). Die Identifizierung der Resistenzmutationen basierte auf einer WHO-Liste von 2009 (34).
Es wurden dabei die resistenzassoziierten Mutationen den drei verschiedenen
Medikamentenklassen, nukleosidische Reverse Transkriptase Inhibitoren, nicht-nukleosidische
Reverse Transkriptase Inhibitoren sowie Protease Inhibitoren (NRTI, NNRTI und PI) zugeordnet
und unter Verwendung des Stanford Algorithmus als singuläre, doppelte oder multi-Resistenz
eingeordnet und in Kategorien der Resistenz eingeteilt (hoch-resistent, intermediär und sensitiv
(susceptible; empfänglich)) (22). Für die erstmalige Untersuchung wurden DFS von rezenten HIV-
Infektionen aus den Diagnosejahren 2013 und 2014 genutzt (22).
In einer erweiterten zusätzlichen Analyse wurden die DFS von rezenten HIV-Infektionen der
Diagnosejahre 2013 - 2016 verwendet (23). Dabei wurden bei einer rezenten HIV-Infektion die
Genomabschnitte der Protease und der Reversen Transkriptase (2013 - 2016) sowie zusätzlich
die Integrase (2014 - 2016) erzeugt (23). Im Jahr 2015 wurde die am RKI genutzte Sanger
Sequenzierung durch NGS (next generation sequencing) mithilfe der Nutzung einer Illumina
MiSeq Platform, ergänzt (35). Der HIV-1 Subtyp wurde wie auch zuvor mittels des Rega HIV-
Subytyping Tools (36) und dem COMET HIV-1 (33) einer pol-Sequenz zugeordnet. Auch hier
wurde die Prävalenz einer TDR berechnet anhand der Anzahl der Fälle, die mit einer Variante
einer Mutation in der WHO-Liste gelistet wurden (34). Zusätzlich wurden übertragene integrase
strand transfer inhibitors (INSTI) Mutationen definiert als solche, die in der Standford HIV-
Datenbank als resistent gelistet wurden (23).
Mithilfe der Filterpapierproben der InzSurv-HIV und Blut bzw. Plasmaproben der Serokonverter
Studie (37) wurden im Laufe der Zeit weitere Verfahren zur Ermittlung der rezenten HIV-
Infektionen getestet: vor allem ein Aviditätstest und ein „Limiting Antigen Test“ evaluiert bzw.
erprobt (38, 39). Auch wurde im RKI Labor ein neues Verfahren zur Ermittlung von Genotypen
aus DFS für epidemiologische Studien entwickelt, welches durch Filterpapierproben der InzSurv-
HIV und HIV-Referenzstämmen evaluiert wurde (40).
Nutzbarkeit von Routinedaten für die erweiterte Surveillance von HIV-Infektionen
Um zu prüfen, ob Daten, die zu einem anderen Zweck erhoben wurden (sog. Routine bzw.
Sekundärdaten), für Fragestellungen innerhalb der Surveillance von HIV-Infektionen genutzt
14

werden könnten, wurden Daten des Zentralinstituts für die kassenärztliche Versorgung in
Deutschland (Zi) genutzt (27). Diese Daten enthalten bundesweite, pseudonymisierte,
krankenkassenübergreifende Abrechnungsdaten aus dem niedergelassenen Bereich der Jahre
2010 - 215 (27). Mitthilfe dieser Daten sollte zunächst der Anteil gesetzlich versicherter Personen
ermittelt werden, bei denen innerhalb eines Jahres mindestens ein HIV-Suchtest durchgeführt
bzw. abgerechnet wurde. Zusätzlich dazu sollte erfasst werden bei wie vielen Personen davon im
Anschluss ein HIV-Bestätigungstest durchgeführt wurde. Im niedergelassenen Bereich stehen
mehrere Untersuchungsmethoden für den Nachweis einer HIV-Infektion zur Verfügung, die zu
Abrechnungszwecken unterschiedlich kodiert werden und dadurch teilweise auch einen
Rückschluss auf den Untersuchungsgrund zulassen (z.B. GOP 01811 - Untersuchung auf HIV-
Antikörper bei einer Schwangeren im Rahmen der Mutterschaftsvorsorge, siehe auch Tabelle 1
bei Hofmann et al. (27)). HIV-Bestätigungsteste sollen laut Einheitlichem Bewertungsmaßstab
(EBM) durchgeführt werden, wenn zuvor ein HIV-Suchtest reaktiv ausgefallen ist (41). So kann
anhand der Daten der Anteil der reaktiven HIV-Suchtests ermittelt werden. Im Rahmen dieser
Auswertung war es nicht möglich, zusätzlich unter den Personen bei denen ein HIV-Suchtest und
ein HIV-Bestätigungstest abgerechnet wurde, zu ermitteln bei wie vielen davon der HIV-
Bestätigungstest positiv war, also eine entsprechende HIV-Diagnose in den Abrechnungsdaten
enthalten war. Als Surrogat wurde daher die Anzahl der durchgeführten HIV-Bestätigungstests
im niedergelassenen Bereich mit den an das RKI gemeldeten HIV-Neudiagnosen verglichen (27),
um beispielsweise abschätzen zu können, ob durch die im niedergelassenen Bereich getesteten
Personen ein Rückschluss auf die insgesamt in Deutschland getesteten Personen möglich ist.
1.5. Ergebnisse
Surveillance von rezenten HIV-Infektionen (InzSurv-HIV)
Insgesamt haben 227 Labore zwischen 2008 und 2014 HIV-Diagnosen ans RKI übermittelt. Die an
der Surveillance der rezenten Infektionen beteiligten Labore (n=108) übermittelten 91,3%
(35.756 / 39.170) der HIV-Diagnosen. 53% (n=20.896) der übermittelten HIV-Diagnosen waren
neudiagnostizierte HIV-Fälle. 99,1% (n=18.462) der gleichzeitig übermittelten DFS konnten einer
HIV-Diagnose zugeordnet werden (siehe auch Grafik 1 bei Hofmann et al. (18)). Beim Vergleich
aller HIV-Neudiagnosen (2008 - 2014) mit und ohne Filterpapierprobe konnten keine
Unterschiede in Alter, Geschlecht und Transmissionsweg festgestellt werden. Einzig die Anzahl
15

der gesammelten Filterpapierproben unterschied sich im Laufe der Zeit, was auf eine kürzere Zeit
der Sammlung von Filterpapierproben in 2010 zurückzuführen war (18).
Etwa ein Drittel (n=3.221; 31,4%; 95% Konfidenzintervall – KI- 30,5%-32,2%) der HIV-
Neudiagnosen mit DFS wurden als rezente HIV-Infektion klassifiziert, nach Anwendung des ECDC
Algorithmus waren 30,1% (n=3.084; 95% KI 29,2%-31,0%) der HIV-Neudiagnosen rezent. Der
Anteil der rezenten Infektionen war bei Männern höher als bei Frauen, sowie am höchsten in der
Altersgruppe der 18-25-Jährigen. Der Anteil der rezenten HIV-Infektionen war am höchsten bei
Männer die Sex mit Männern haben (MSM), gefolgt von Personen, die sich Drogen injizierten
(18). Der prozentuale Anteil der rezenten HIV-Infektionen bei Personen mit Herkunft
Deutschland lag bei 33% (n=2.121), wohingegen der Anteil bei Personen, die aus Subsahara-
Afrika stammten, nur bei 17% (n=169) lag. Personen, die aus Deutschland stammten, hatten
häufiger eine rezente HIV-Infektion als Personen, die aus dem Ausland stammten. HIV-Fälle mit
einer rezenten HIV-Infektion wurden häufiger in Deutschland infiziert als im Ausland (32,9% vs.
21,5% chi²p<0,001). Bei aus dem Ausland stammenden HIV-Fällen zeigte sich, dass diese sich
möglicherweise eher in Deutschland infiziert hatten als im Ausland (30,1% vs. 18,5% chi² <0,001)
(siehe auch Tabelle 2 und 3 bei Hofmann et. al.) (18).
Der Anteil der neudiagnostizierten Fälle mit DFS stieg im Beobachtungszeitraum leicht an von
1.264 in 2008 zu 2.033 Fällen in 2014. Der jährlich beobachtete Anteil der rezenten HIV-
Infektionen schwankte zwischen 26% in 2010 und 32% in 2012. Ein signifikanter Anstieg von
insgesamt 4% zwischen 2008 zu 2014 konnte mithilfe in einer univariaten logistischen Regression
bestätigt werden (OR 1,023; 95%KI 1,006-1,049 p<0,012) (siehe auch Grafik 3 bei Hofmann et al.
(18)).
Molekulare Surveillance von Subtypen und Resistenzen bei rezenten HIV-Infektionen
In 2013 und 2014 wurden 6.371 Filterpapierproben von HIV-Fällen gesammelt, davon wurden
2.034 (32%) serologisch als rezente HIV-Infektion klassifiziert mithilfe des BED-CEIA. Proben mit
einem CD4 Wert <200 Zellen / µl oder einer Viruslast <400 Kopien /µl oder beidem wurden für
diese Analyse als länger bestehende HIV-Infektion re-klassifiziert und ausgeschlossen. Insgesamt
konnten von 1.797 rezenten HIV-Neudiagnosen 809 Proben erfolgreich amplifiziert und
sequenziert werden (22). Davon wiesen 10,8% (87/809) eine Resistenz auf: 4,3% NRTI; 2,6%
NNRTI; 3,0% PI (22). 77% (n=623/809) der rezenten HIV-Infektionen hatten den Subtyp B. 23,0%
(n=186/809) wurden als HIV-non-B Subtyp klassifiziert (davon am häufigsten mit 5,1% Subtyp A,
16

n=41) (22). Der HIV-Subtyp B hatte eine signifikante Assoziation mit einem hohen Anteil von
Resistenzen (12,0%; n=75/623) im Vergleich zu HIV-non-B Subtypen (vs. 6,4% p=0,04) (22). Bei
Personen mit dem Transmissionsrisiko MSM konnte am häufigsten der HIV-Subtyp B (87,7%,
n=436/497) nachgewiesen werden. Bei Personen mit heterosexuellen Kontakten (HET) wurden
häufig HIV-non-B Subtypen (A, C, G) nachgewiesen (22). Bei Personen, die aus Deutschland
stammten, lag der Anteil der HIV-non-B Subtypen signifikant niedriger als bei Personen, die aus
anderen Ländern stammten (14%; n=68/485 vs. 45,6% n= 72/158 p<0,0001) (22).
Bei einer weiteren Analyse wurden HIV-Fälle mit DFS, die zwischen 2013 und 2016 neu
diagnostiziert wurden, eingeschlossen (23). 10.643 DFS von neudiagnostizierten HIV-Fällen
wurden für diesen Zeitraum an das RKI übermittelt, davon wurden 3.380 (31,8%) als rezente HIV-
Infektion klassifiziert. Davon konnten 1.885 (55,8%) sequenziert werden. Für die Analyse der
HIV-1 Genotypen der Integrase Genom Region waren 820 der 1.885 DFS der neudiagnostizierten
HIV-Fälle vorhanden (23). Auch hier zeigte sich, dass der HIV-Subtyp B am häufigsten (68,6%) zu
finden war. Die Anzahl der Fälle mit HIV-Subtyp B sanken jedoch signifikant zwischen 2013 und
2016 (23). Unter den HIV-non-B Subtypen war der häufigste HIV-Subtyp A (8,2%), gefolgt von
einer zirkulierenden rekombinanten Form (CRF), CRF02_AG (5,7%) und HIV-Subtyp C (5,0%). Der
Anstieg der HIV-non-B Subtypen ist durch einen signifikanten Anstieg der HIV-Subtyp A und HIV-
Subtyp C Fälle zu erklären (23).
Mithilfe der erweiterten Analyse konnte auch die Prävalenz und der Trend von übertragener
Resistenz gegen die antiretroviralen Medikamentenklassen (TDR) ermittelt werden. Der Anteil
der TDR lag laut WHO-Liste bei 11,0% (23). Ein zeitlicher Trend konnte zwischen 2013 und 2016
nicht beobachtet werden. Resistenzen gegen NNRTI konnten am häufigsten (4,7%) festgestellt
werden, gefolgt von NRTI (4,5%) und PI (3,2%) (23). Es wurden signifikant höhere TDR bei MSM
im Vergleich zu HET gefunden (23). Bei den HIV-Subtyp B Infektionen war die Prävalenz von TDR
(12,4%) höher als im Vergleich zu allen HIV-non-B Subtyp Infektionen (8,1% p<0,01). Die höchsten
Anteile von TDR wurden bei Fällen mit HIV-Subtyp A (14,9%) gefunden (siehe auch Tabelle 3 bei
Hauser et. al.) (23). Eine Resistenz gegen INSTI wurde lediglich in einer analysierten Sequenz (von
820) gefunden (23).
Nutzbarkeit von Routinedaten für die erweiterte Surveillance von HIV-Infektionen
Zwischen 2010 und 2015 wurde bei mindestens 5.487.703 Personen ein HIV-Suchtest im
niedergelassenen Bereich abgerechnet, dies entspricht etwa 864.065 - 999.465 Personen
17

jährlich. In den analysierten Jahren wurden bei wesentlich mehr Frauen als Männern ein HIV-
Suchtest abgerechnet (siehe auch Tabelle 2 bei Hofmann et al. (27)). Bei einem Großteil der
Frauen wurde ein HIV-Suchtest im Rahmen der Mutterschaftsvorsorge durchgeführt. Bei etwa
2.410 bis 3.062 Personen wurde jährlich anschließend ein HIV-Bestätigungstest abgerechnet.
HIV-Bestätigungstests wurden etwas häufiger bei Männern als bei Frauen durchgeführt. Die
Reaktivrate schwankte somit in den Jahren 2010 - 2015 zwischen 0,26% und 0,35%, wobei die
Rate im Zeitverlauf leicht sank (27). Im Zeitverlauf ist die Anzahl der Personen, bei denen ein HIV-
Suchtest durchgeführt wurde, angestiegen. Die Anzahl der Personen, die im Anschluss einen HIV-
Bestätigungstest hatten, nahm hingegen etwas ab (27). Vergleicht man die im selben Zeitraum
an das RKI übermittelten HIV-Neudiagnosen mit den abgerechneten HIV-Bestätigungstests im
niedergelassenen Bereich, so ist zu beobachten, dass die Anzahl der gemeldeten HIV-
Neudiagnosen teilweise höher ist als die Anzahl der Personen, bei denen ein HIV-
Bestätigungstest (vor allem bei Männern) durchgeführt wurde (27).
1.6. Diskussion und Schlussfolgerung
Surveillance von rezenten HIV-Infektionen (InzSurv-HIV)
Die erstmalige Beschreibung der rezenten HIV-Infektionen unter den HIV-Neudiagnosen in
Deutschland zeigte, dass in fast einem Drittel der neudiagnostizierten HIV-Fälle eine rezente HIV-
Infektion nachgewiesen werden konnte. Bei diesen Fällen erfolgte die HIV-Infektion innerhalb
der letzten 6 Monate vor der Diagnose. Der beobachtete Anteil der rezenten HIV-Infektionen
stieg sogar leicht, jedoch statistisch signifikant an. Der höchste Anteil von rezenten Infektionen
konnte bei MSM beobachtet werden, was auch in anderen europäischen Ländern beobachtet
wurde, die ebenfalls den BED-CEIA für den Nachweis einer rezenten HIV-Infektion nutzten (18).
Mit dieser Analyse konnte auch gezeigt werden, dass knapp 2/3 der HIV diagnostizierten Fälle
eine länger bestehende HIV-Infektion hatten. Diese Fälle wurden also später im Infektionsverlauf
diagnostiziert und konnten somit möglicherweise ihre HIV-Infektion länger übertragen (18).
MSM haben ein hohes Risiko, eine HIV-Infektion zu erwerben. Jedoch ist in dieser Gruppe sowie
in den anderen Transmissionsgruppen trotz verstärkter Präventionsbemühungen, der Anteil der
länger bestehenden Infektionen zum Zeitpunkt der Veröffentlichung von Hofmann et al. immer
noch hoch (18). Dies könnte bedeuten, dass nicht jeder MSM sich seines Risikos für den Erwerb
eine HIV-Infektion bewusst ist und sich daher auch nicht regelmäßig testen lässt (18).
Empfehlungen sprechen sich dafür aus, dass Personen mit einem Risiko für eine HIV-Infektion,
18

also auch MSM, sich regelmäßig testen lassen sollten, mindestens jedoch ein Mal im Jahr, bzw.
bei MSM alle 3 - 6 Monate (42, 43). Die Analyse der Jahre 2008 - 2014 zeigten, dass diesen
Empfehlungen wahrscheinlich nicht immer nachgekommen wurde. Für MSM bestehen viele
Angebote, sich kostenlos und auch anonym auf HIV testen zu lassen. Bei einer Onlinebefragung
2013 / 2014 unter MSM in Deutschland gaben lediglich 38% der Befragten an, dass sie innerhalb
der letzten 12 Monate auf HIV getestet wurden. 35% der Befragten gaben an noch nie auf HIV
getestet worden zu sein (44). Bei einer europäischen Onlinebefragung gaben 79% aller MSM an,
jemals auf HIV getestet worden zu sein, davon wurden 56% innerhalb der letzten 12 Monate auf
HIV getestet (45).
Auch wenn der Anteil der rezente HIV-Infektionen bei MSM nicht sehr hoch ist, ist er
beispielweise bei HET noch niedriger. Dies ist möglicherweise darauf zurückzuführen, dass eine
HIV-Infektion von heterosexuellen Personen nicht als Risiko wahrgenommen wird, aber auch
dass das Angebot eines HIV-Tests nicht ausreichend von der Ärzteschafft, beispielsweise im
Rahmen einer Anamnese oder Routineuntersuchung, kommuniziert wird. Testangebote sollten
daher auch für Personen mit heterosexuellen Kontakten weiter ausgebaut und die
Risikowahrnehmung in dieser Gruppe erhöht werden. So könnte beispielweise in zukünftigen
Präventionskampagnen deutlicher hervorgehoben werden, dass regelmäßiges Testen für alle
Personen wichtig ist, die ein Risiko (z. B. ungeschützter bzw. kondomloser Geschlechtsverkehr)
eingegangen sind (18, 43). Die Wahrnehmung für mögliche Risikokontakte sollte bei allen
Personen, die Kontakt zum Gesundheitssystem haben (z.B. in der niedergelassenen Ärzteschaft,
Drogenberatungsstellen, Beratungsstellen in Gesundheitsämtern usw.) erhöht werden, damit
eine offene Kommunikation zu diesem Thema stattfinden kann und diesen Personen ggf. ein HIV-
Test angeboten werden kann (18).
Bei Personen, die aus dem Ausland stammen, konnte eher eine länger bestehende Infektion
beobachtet werden als bei Personen die aus Deutschland stammten. Dies könnte darauf
hindeuten, dass diese Personen sich eher in ihrem Heimatland infiziert haben und eventuell auch
schon von ihrer Infektion wussten, da jede neu in Deutschland diagnostizierte HIV-Infektion
meldepflichtig ist. Andererseits kann es auch möglich sein, dass diese Personen nichts von ihrer
HIV-Infektion wussten und aufgrund des möglicherweise besseren Gesundheitssystems erst in
Deutschland erstmalig getestet wurden (18). In der Analyse konnte gezeigt werden, dass der
Anteil der rezenten HIV-Infektionen über die Zeit angestiegen ist. Im selben Zeitraum hat sich die
Anzahl der neu diagnostizierten HIV-Fälle nicht stark verändert, so dass der Anstieg des Anteils
19

der rezenten HIV-Infektionen möglicherweise doch ein verbessertes HIV-Testangebot
widerspiegelt (18). In einer aktuellen Analyse (2011 - 2018) wurde festgestellt, dass der Anteil
der rezenten HIV-Infektion unter den HIV-Neudiagosen weiterhin angestiegen ist und
beispielsweise in 2018 bei 38,8% (bei MSM bei 44,5%) lag (14). Somit ist der Anteil der rezenten
HIV-Infektionen seit der Etablierung der Surveillance immer weiter angestiegen, bei teilweise
sinkenden HIV-Neudiagnosen (14) was für eine bessere Wahrnehmung von Testangeboten
spricht.
Bei der Analyse der rezenten HIV-Infektionen ist limitierend zu beachten, dass die genaue Anzahl
der getesteten Personen in Deutschland unklar ist und dass der Anteil der rezenten HIV-Infektion
immer auch abhängig vom Testverhalten und der Anzahl der neudiagnostizierten HIV-Fälle ist. In
2011 wurden über 1,6 Millionen HIV-(Such-)-Tests durchgeführt (15). Der für InzSurv-HIV
verwendete Test (BED-CEIA) zur Ermittlung einer rezenten HIV-Infektion hat eine geringe
Sensitivität und Spezifität (81,7% und 89,1%) und eine relativ hohe falsch rezente Rate von 7,4%
(19). Da der angewendete Test allerdings mit Proben der Serokonverter Studie evaluiert wurde
(28), ist anzunehmen, dass der Test valide Angaben für Deutschland erzeugt. Der Test wurde im
Rahmen der Surveillance von rezenten HIV-Infektionen mehrmals überprüft und die Verfahren
zur Ermittlung der Rezenz weiterentwickelt (38, 39). Um weiterhin mehr Sicherheit über die
Qualität des Testergebnisses zu erhalten, wurde auch der vom ECDC empfohlene
Testalgorithmus angewendet (29). Allerdings konnte nicht der ganze Algorithmus verwendet
werden, da die zur Verfügung stehenden Informationen nicht ausreichend vollständig vorhanden
waren (18). Als weitere Limitation sollte erwähnt werden, dass keine Korrektur der
Laborergebnisse bezüglich von falsch als länger bestehender HIV-Infektion klassifizierten
rezenter HIV-Infektionen (FLTR) möglich war, was auch an fehlenden Angaben im HIV-
Meldebogen lag. Dies könnte möglicherweise zu einer Überschätzung der länger bestehenden
HIV-Infektionen führen. Im Jahr 2016 wurde allerdings im RKI Labor ein Multi Assay Algorithmus
eingeführt, in dem der BED-CEIA und der BioRad Aviditätstest gemeinsam genutzt wurden, um
u.a. die FLTR niedriger zu halten (38, 39).
Ausbau der HIV-Surveillance um die Untersuchung auf HIV-Subtypen und Resistenzen bei
rezenten HIV-Infektionen
Die Erweiterung der Surveillance von rezenten HIV-Infektionen um Untersuchungen auf HIV-
Subtypen und übertragene Medikamentenresistenzen konnte erfolgreich für Filterpapierproben
20
etabliert werden (22). Da bei dieser Untersuchung länger bestehende HIV-Infektionen
ausgeschlossen wurden, konnten aktuelle Trends im Infektionsgeschehen dargestellt werden
(22). Der Anteil an Resistenzen unter den rezenten HIV-Infektionen lag bei 10,8% und ist
vergleichbar mit Ergebnissen aus der Serokonverter Studie (37). Der am häufigsten
vorkommende Subtyp in West-Europa ist HIV-Subtyp B (46) und war auch in Deutschland der
häufigste Subtyp (22). Der HIV-Subtyp B konnte am häufigsten in der Risikogruppe MSM
gefunden werden, der HIV-Subtyp A wurde häufiger in anderen Risikogruppen gefunden (22).
Viele der Migrant*innen mit einer rezenten HIV-Infektion hatten einen HIV-Subtyp der in ihrem
Heimatland dominierte. Daraus könnte man schließen, dass diese HIV-Fälle sich entweder in
ihrem Heimatland kürzlich infiziert haben oder innerhalb ihrer Gemeinschaft in Deutschland (22).
Bei einer weiteren tiefergehenden Analyse wurden 1.885 rezente HIV-Neudiagnosen zwischen
2013 und 2016 analysiert (23). Hier bestätigte sich, dass der HIV-Subtyp B der häufigste Subtyp
in diesem Zeitraum war. Es konnte jedoch im gleichen Zeitraum ein signifikanter Anstieg von HIV-
Non-B Subtypen beobachtet werden (Subtyp A, C, CRF02_AG). Dieser Anstieg ist möglicherweise
auf Immigrationsprozesse aus Ländern, in denen diese Subtypen häufiger vorkommen (z.B.
Subsahara-Afrika / Zentral- / Ost-Europa), zurückzuführen, als Konsequenz der
Flüchtlingsbewegung mit ihrem Höhepunkt in 2015. Der Anstieg von HIV-Fällen mit Subtyp A und
C zeigt aber auch die Verbreitung dieser Subtypen in der Bevölkerung Deutschlands, was auch in
anderen europäischen Ländern beobachtet werden konnte (47). Der Anteil der übertragenen
Resistenzen lag stabil bei ca. 11%, wie er auch in der Serokonverter Studie für den Zeitraum 1996
bis 2010 beschrieben wurde (37). Allerdings lag der Anteil der übertragenen Resistenzen in ganz
Europa bei 8,3% für den Zeitraum 2008 – 2010, bei Personen die kürzlich infiziert wurden, lag der
Anteil jedoch bei 10,1% (48). Übertragene Resistenzen wurden häufiger bei Subtyp B als bei Non-
B Subtypen gefunden, dies scheint sich aber anzugleichen (22, 23). In der erweiterten Analyse
der rezenten HIV-Infektionen von 2013 - 2016 konnte erstmalig für Deutschland eine Analyse von
vorhandenen INSTI Resistenzen, nach Einführung des Medikaments Raltegravir in 2007,
durchgeführt werden (23). Obwohl lediglich ein Fall einer übertragenen Mutation gefunden
wurde, sollte dies jedoch weiterhin beobachtet werden (23).
Im Jahr 2016 wurde das Medikament Truvada in der EU für die HIV-PrEP (Prä-Expositions-
Prophylaxe) zugelassen (49). Eine Überwachung der übertragenen Resistenzen ist daher
weiterhin wichtig, da möglicherweise resistente Mutationen eingeführt werden könnten. Wie in
21

der Analyse der Daten von 2013 - 2016 gezeigt, waren die Tenofovir-Resistenzen (Wirkstoff in
Truvada) bis zum Jahr 2016 gering (23). Eine regelmäßige Testung auf HIV bei Personen, die HIV-
PrEP nutzen, ist daher notwendig, um eine Überwachung von PrEP bezogenen Mutationen zu
beobachten (23, 43). Die entsprechenden Voraussetzungen wurden zusammen mit der
Kostenübernahme durch die Krankenkassen in 2019 geschaffen (26).
Als eine Limitation der Analyse der Daten von 2013 - 2016 zu HIV-Subtypen und Resistenzen
könnte möglicherweise betrachtet werden, dass zum Zeitpunkt der Analyse nur rezente HIV-
Infektionen untersucht wurden. Dies kann möglicherweise zu einer Überschätzung der Personen
führen, die häufiger getestet wurden aufgrund ihrer persönlichen Risikoeinschätzung bzw.
Wahrnehmung. Die Genotypisierung der Integrase wird erst seit 2014 am RKI durchgeführt und
es konnte anfangs eine schlechte PCR-Erfolgsrate aufgrund der Degeneration der DFS beobachtet
werden. Eine Vorhersage für alle Medikamentenklassen war daher im Rahmen der Analyse für
die Veröffentlichung von Hauser et al. nur für 43% der rezenten HIV-Fälle möglich (23).
Nutzbarkeit von Routinedaten für die erweiterte Surveillance von HIV-Infektionen
Durch die Daten des Zi konnte erstmalig die Anzahl der Personen ermittelt werden, die im
niedergelassenen Bereich auf HIV getestet wurden (27). Anhand der Daten konnte beispielweise
gezeigt werden, dass am häufigsten Frauen und von diesen am häufigsten Frauen im Rahmen der
Mutterschaftsvorsorge, auf HIV getestet wurden und somit diese Gruppe ihren HIV-Status kennt.
Im Vergleich zu den an das RKI gemeldeten HIV-Neudiagnosen fiel jedoch auf, dass die Anzahl
der Männer, bei denen sowohl ein Such- als auch Bestätigungstest durchgeführt wurde niedriger
ist als die an das RKI übermittelten HIV-Neudiagnosen für Männer (27). Diese Diskrepanz liegt
vermutlich daran dass es neben der Testmöglichkeit im niedergelassenen Bereich auch noch
weitere Testangebote gibt und möglicherweise auch HIV-Tests im niedergelassenen Bereich
durchgeführt werden, die nicht abgerechnet, sondern von den Personen selbst bezahlt werden
(27). Etwa 11% der Bevölkerung Deutschlands waren in 2019 privat krankenversichert (50). HIV-
Tests von privat versicherten Personen sind in den Daten des Zi daher nicht enthalten (27). Die
meisten HIV-Neudiagnosen in Deutschland werden bei MSM festgestellt. Bei einer Befragung
unter MSM (2013 / 2014) gab weniger als die Hälfte der Befragten an, dass ihr letzter HIV-Test
im niedergelassenen Bereich durchgeführt wurde (44). Auch eine internationale Studie unter
MSM berichtet davon, dass etwa 33% der HIV-negativen MSM und 37% der HIV-positiven MSM
ihren letzten HIV-Test im niedergelassenen Bereich erhielten (45). So spricht einiges dafür, dass
22
MSM sich eher in anderen Testeinrichtungen testen lassen und somit womöglich dort eher mehr
HIV-Neudiagnosen registriert werden als im niedergelassenen Bereich. Dafür spricht auch eine
Studie (2011-2012) von Marcus et al. in einer niedrigschwelligen Testeinrichtung, wo eine HIV-
Positivrate von 2,9% gefunden wurde (51).
Schlussfolgerung
Mithilfe verschiedener Labortestverfahren konnte eine langfristige Surveillance von rezenten
HIV-Infektionen in Deutschland aufgebaut werden. Die Nutzung von Filterpapierproben für die
Surveillance als Untersuchungsmaterial konnte im Rahmen der vorgestellten Veröffentlichungen
bestätigt werden. Die Verwendung der Filterpapierproben führte dazu, dass bei rezenten HIV-
Infektionen zusätzliche Informationen zum HIV-Subtyp und aktuell übertragene Resistenten
gegen verfügbare Medikamente flächendeckend und repräsentativ für rezente HIV-Infektionen
gesammelt werden konnte. Seit Ende 2018 wird der BED-CEIA nicht mehr in Deutschland
verwendet, daher war es wichtig, auch andere Verfahren zur Ermittlung von rezenten HIV-
Infektionen zu überprüfen. So konnte beispielsweise der BioRad Aviditätstest zeitgleich mit dem
BED-CEIA für einige Jahre verwendet werden, bevor der BED-CEIA nicht mehr produziert wurde.
Es konnte dabei gezeigt werden, dass trotz des Wegfalls des BED-CEIA noch Trendanalysen
möglich sind (39). Mithilfe der Surveillance von rezenten HIV-Infektionen kann somit eine
Wissenslücke geschlossen werden. Es besteht nun die Möglichkeit mit der erweiterten
Surveillance, das aktuelle Infektionsgeschehen zu überwachen und so Einfluss auf die
Resistenzentwicklung und die Entwicklung von Leitlinien zur Therapie zu nehmen.
Die aufgebaute Surveillance von rezenten HIV-Infektionen mit der integrierten molekularen
Surveillance erlaubt dabei die Überwachung der aktuell zirkulierenden HIV-Subtypen sowie der
aktuell zirkulierenden übertragenden Resistenzen. Damit erhält man einen Überblick über
aktuelle Übertragungen von HIV-Infektionen sowie die Identifikation von Subgruppen, in denen
aktuell HIV übertragen wird, so können diese Gruppen durch spezielle Präventionsprogramme
besser angesprochen werden. Detaillierte Informationen zu aufkommenden rekombinanten
Formen oder TDR und ihre Transmissionsrouten könnten dazu beitragen, die therapeutischen
Strategien zu überwachen oder zielgerecht präventive Maßnahmen zu verbessern.
Durch die erstmalige Auswertung der vom Zi zur Verfügung gestellten Daten konnte erfolgreich
der Nutzen von Routinedaten für die Surveillance von HIV-Infektionen gezeigt werden (27). Die
Nutzung von Routinedaten für die Surveillance von HIV-Infektionen ist somit eine gute
23

Möglichkeit, um im Rahmen der WHO-Strategie zur Elimination von AIDS Informationen über
Personen zu erhalten, die auf HIV getestet wurden, und somit ihren HIV-Status kennen. Allerdings
kann man über die Analyse der Daten nur diejenigen ermitteln, die im niedergelassenen Bereich
getestet wurden. In Deutschland stehen der Bevölkerung jedoch noch andere Testmöglichkeiten
zur Verfügung, die in diesen Daten nicht erfasst sind. Mittels Laborbefragungen erhält man die
Anzahl der durchgeführten HIV-Test, die auch außerhalb des niedergelassenen Bereichs
durchgeführt wurden (15-17). Um nun die Routinedaten zukünftig weiter für die HIV-Surveillance
nutzen zu können, sind weitere Analysen notwendig z.B. um zu untersuchen wie viele Tests je
Person im niedergelassenen Bereich pro Jahr durchgeführt wurden. Diese Information könnte
dann eventuell genutzt werden um bei Laborbefragungen die ermittelten Testzahlen besser
interpretieren zu können. Für die Nutzung von Routinedaten für die HIV-Surveillance ist auch
wichtig, die Anzahl der Personen zu ermitteln, bei denen nach einer durchlaufenen
Stufendiagnostik erstmalig eine HIV-relevante Diagnose kodiert wurde. Dies sollte in einer
weiteren Zusammenarbeit mit dem Zi oder Besitzern von Routinedaten erprobt werden.
Routinedaten sollten für die erweiterte Surveillance weiterhin genutzt werden, da damit u.a.
auch weitere Ziele der WHO-Strategie überwacht werden könnten. Um Informationen zu
Personen zu erhalten, die außerhalb des ambulanten Bereichs auf HIV getestet wurden, sind
dennoch regelmäßige weitere Befragungen notwendig, um alle Testmöglichkeiten zu erfassen
und damit die tatsächliche Anzahl der Personen zu bestimmen, die in Deutschland ihren HIV-
Status kennen. Zusätzlich können diese Routinedaten auch für die statistische Modellierung der
Inzidenz und Prävalenz von HIV-Infektionen in Deutschland verwendet werden.
24

1.7. Literaturverzeichnis
1. UNAIDS Joint United Nations Programme on HIV/AIDS. UNAIDS data 2019. Geneva: UNAIDS; 2019. Report No.: UNAIDS/JC2959E. Available from: https://www.unaids.org/sites/default/files/media_asset/2019-UNAIDS-data_en.pdf
2. European Centre for Disease Prevention and Control. Continuum of HIV care. Monitoring implementation of the Dublin Declaration on partnership to fight HIV/AIDS in Europe and Central Asia: 2018 progress report. Stockholm: ECDC; 2019. DOI: https://doi.org/10.2900/89066
3. an der Heiden M, Marcus U, Kollan C, Schmidt D, Gunsenheimer-Bartmeyer B, Bremer V. Schätzung der Zahl der HIV-Neuinfektionen und der Gesamtzahl von Menschen, die mit HIV in Deutschland leben, Stand Ende 2018. Epidemiologisches Bulletin. 2019(46):483-92. DOI: http://dx.doi.org/10.25646/6410
4. Robert Koch-Institut. HIV-Infektion / AIDS - RKI Ratgeber Berlin: Robert Koch-Institut,; 2018 [updated 22.11.2018; cited 2020 16.06.2020]. Available from: https://www.rki.de/DE/Content/Infekt/EpidBull/Merkblaetter/Ratgeber_HIV_AIDS.html.
5. Rabenau HF, Bannert N, Berger A, Donoso Mantke O, Eberle J, Enders M, Fickenscher H, Grunert HP, Gurtler L, Heim A, Huzly D, Kaiser R, Korn K, Nick S, Kucherer C, Nubling M, Obermeier M, Panning M, Zeichhardt H. Nachweis einer Infektion mit Humenem Immundefizienzvirus (HIV): Serologisches Screening mit nachfolgender Bestätigungsdiagnostik durch Antikörper-basierte Testsysteme und / oder durch HIV-Nukleinsäure-Nachweis. Bundesgesundheitsblatt Gesundheitsforschung Gesundheitsschutz. 2015;58(8):877-86. DOI: https://doi.org/10.1007/s00103-015-2174-x
6. World Health Organization. Global health sector strategy on HIV 2016-2021. Towards ending AIDS. Geneva: World Health Organization; 2016 2016. Report No.: WHO/HIV/2016.05. Available from: https://apps.who.int/iris/handle/10665/246178
7. Lundgren JD, Babiker AG, Gordin F, Emery S, Grund B, Sharma S, Avihingsanon A, Cooper DA, Fätkenheuer G, Llibre JM, Molina JM, Munderi P, Schechter M, Wood R, Klingman KL, Collins S, Lane HC, Phillips AN, Neaton JD. Initiation of Antiretroviral Therapy in Early Asymptomatic HIV Infection. N Engl J Med. 2015;373(9):795-807. DOI: https://doi.org/10.1056/NEJMoa1506816
8. Ludwig M-S. Surveillance. In: Schlipköter U, Wildner M, editors. Lehrbuch Infektionsepidemiologie. Bern: Huber; 2006. p. 57-67.
9. Gesetz zur Verhütung und Bekämpfung von Infektionskrankheiten beim Menschen (Infektionsschutzgesetz - IfSG) (Bundesgesetzblatt Jahrgang 2000 Teil I Nr. 33, ausgegeben zu Bonn am 25. Juli 2000, 2000).
10. Robert Koch-Institut. Anmerkungen zur Erfassung von HIV-Infektionen auf der Grundlage des neuen Infektionsschutzgesetzes. Epidemiologisches Bulletin. 2001;Sonderausgabe A:4.
11. Heißenhuber A, Kuhn J. Allgemeine Grundlagen der Epidemiologie. In: Schlipköter U, Wildner M, editors. Lehrbuch Infektionsepidemiologie. Bern: Huber; 2006. p. 31-40.
25

12. Robert Koch-Institut. HIV-Jahresbericht 2016. Epidemiologisches Bulletin. 2017;39/2017:431-56. DOI: https://doi.org/10.17886/EpiBull-2017-051
13. an der Heiden M, Marcus U, Kollan C, Schmidt D, Voß L, Gunsenheimer-Bartmeyer B, Bremer V. Schätzung der Zahl der HIV-Neuinfektionen und der Gesamtzahl von Menschen mit HIV in Deutschland - 7. Anhang: Methoden zur Schätzung der HIV-Neuinfektionen und der Gesamtzahl von Menschen mit HIV in Deutschland. Epidemiologisches Bulletin. 2018(47):520-2. DOI: https://doi.org/10.17886/EpiBull-2018-056.2
14. Koppe U, Hanke K, Fiebig U, Schmidt D, Meixenberger K, Pantke A, Gunsenheimer-Bartmeyer B, Kollan C, Kühne A, Marcus U, Bannert N, Bremer V. HIV-Studien und HIV-Projekte am Robert Koch-Institut. Epidemiologisches Bulletin. 2019(49):527-39. DOI: https://doi.org/10.25646/6423.2
15. Robert Koch-Institut. „HIV-Nennerstudie“: Online Laborbefragung zur Bestandsaufnahme der HIV-Diagnostik in Deutschland 2011. Epidemiologisches Bulletin. 2015;07(15):47-50. DOI: http://dx.doi.org/10.25646/4699
16. Robert Koch-Institut. Webbasierte Erhebung zur HIV-Diagnostik in Deutschland 2009. Epidemiologisches Bulletin. 2010;2010(39):391-5. DOI: http://dx.doi.org/10.25646/4474
17. Robert Koch-Institut. Zu in Deutschland durchgeführten HIV-Such- und -Bestätigungstests im Jahr 2004. Epidemiologisches Bulletin. 2006;2006(1):2-5. DOI: http://dx.doi.org/10.25646/4214
18. Hofmann A, Hauser A, Zimmermann R, Santos-Hovener C, Batzing-Feigenbaum J, Wildner S, Kucherer C, Bannert N, Hamouda O, Bremer V, Bartmeyer B. Surveillance of recent HIV infections among newly diagnosed HIV cases in Germany between 2008 and 2014. BMC Infect Dis. 2017;17(1):484. DOI: https://doi.org/10.1186/s12879-017-2585-4
19. Parekh BS, Kennedy MS, Dobbs T, Pau CP, Byers R, Green T, Hu DJ, Vanichseni S, Young NL, Choopanya K, Mastro TD, McDougal JS. Quantitative detection of increasing HIV type 1 antibodies after seroconversion: a simple assay for detecting recent HIV infection and estimating incidence. AIDS research and human retroviruses. 2002;18(4):295-307. DOI: https://doi.org/10.1089/088922202753472874
20. Bätzing-Feigenbaum J, Loschen S, Gohlke-Micknis S, Hintsche B, Rausch M, Hillenbrand H, Cordes C, Poggensee G, Kucherer C, Hamouda O. Implications of and perspectives on HIV surveillance using a serological method to measure recent HIV infections in newly diagnosed individuals: results from a pilot study in Berlin, Germany, in 2005-2007. HIV Medicine. 2009;10(4):209-18. DOI: https://doi.org/10.1111/j.1468-1293.2008.00672.x
21. Bätzing-Feigenbaum J, Loschen S, Gohlke-Micknis S, Zimmermann R, Herrmann A, Kamga Wambo O, Kucherer C, Hamouda O. Country-wide HIV incidence study complementing HIV surveillance in Germany. Euro Surveill. 2008;13(36). DOI: http://dx.doi.org/10.25646/568
22. Hauser A, Hofmann A, Hanke K, Bremer V, Bartmeyer B, Kuecherer C, Bannert N. National molecular surveillance of recently acquired HIV infections in Germany, 2013 to 2014. Euro Surveill. 2017;22(2). DOI: https://doi.org/10.2807/1560-7917.ES.2017.22.2.30436
26

23. Hauser A, Hofmann A, Meixenberger K, Altmann B, Hanke K, Bremer V, Bartmeyer B, Bannert N. Increasing proportions of HIV-1 non-B subtypes and of NNRTI resistance between 2013 and 2016 in Germany: Results from the national molecular surveillance of new HIV-diagnoses. PLoS One. 2018;13(11):e0206234. DOI: https://doi.org/10.1371/journal.pone.0206234
24. Wittkop L, Gunthard HF, de Wolf F, Dunn D, Cozzi-Lepri A, de Luca A, Kucherer C, Obel N, von Wyl V, Masquelier B, Stephan C, Torti C, Antinori A, Garcia F, Judd A, Porter K, Thiebaut R, Castro H, van Sighem AI, Colin C, Kjaer J, Lundgren JD, Paredes R, Pozniak A, Clotet B, Phillips A, Pillay D, Chene G, EuroCoord Csg. Effect of transmitted drug resistance on virological and immunological response to initial combination antiretroviral therapy for HIV (EuroCoord-CHAIN joint project): a European multicohort study. Lancet Infect Dis. 2011;11(5):363-71. DOI: https://doi.org/10.1016/S1473-3099(11)70032-9
25. World Health Organisation. WHO HIVResNet HIV drug resistance laboratory strategy. 2010. Available from: https://www.who.int/hiv/pub/drugresistance/hiv_reslab_strategy.pdf
26. Bundesministerium für Gesundheit. Gesetzlicher Anspruch für HIV-Präexpositionsprophylaxe (PrEP) kommt 2019 [06.03.2021]. Available from: https://www.bundesgesundheitsministerium.de/terminservice-und-versorgungsgesetz/prep.html.
27. Hofmann A, Batzing J, Marcus U, Bremer V, Bartmeyer B. Wie viele Personen lassen sich in Deutschland im niedergelassenen Bereich auf HIV testen? Bundesgesundheitsblatt Gesundheitsforschung Gesundheitsschutz. 2020;63(10):1262-70. DOI: https://doi.org/10.1007/s00103-020-03210-y
28. Loschen S, Batzing-Feigenbaum J, Poggensee G, Cordes C, Hintsche B, Rausch M, Dupke S, Gohlke-Micknis S, Rodig J, Hamouda O, Kucherer C. Comparison of the human immunodeficiency virus (HIV) type 1-specific immunoglobulin G capture enzyme-linked immunosorbent assay and the avidity index method for identification of recent HIV infections. J Clin Microbiol. 2008;46(1):341-5. DOI: https://doi.org/10.1128/JCM.01055-07
29. European Centre for Disease Prevention and Control. Monitoring recently acquired HIV infections in the European context. Technical Report. Stockholm: European Centre for Disease Prevention and Control; 2013 25.01.2016. Report No.: 978-92-9193479-9. DOI: https://doi.org/10.2900/85544
30. Masciotra S, Garrido C, Youngpairoj AS, McNulty A, Zahonero N, Corral A, Heneine W, de Mendoza C, Garcia-Lerma JG. High concordance between HIV-1 drug resistance genotypes generated from plasma and dried blood spots in antiretroviral-experienced patients. AIDS (London, England). 2007;21(18):2503-11. DOI: https://doi.org/10.1097/QAD.0b013e3281c618db
31. World Health Organisation, WHO HIV ResNet Laboratory Working group. WHO Manual for HIV drug resistance testing using dried blood spot specimens. 2012. Report No.: WHO/HIV/2012.30. Available from: http://apps.who.int/iris/bitstream/10665/75829/1/WHO_HIV_2012.30_eng.pdf
27

32. Cleland A, Davis C, Adams N, Lycett C, Jarvis LM, Holmes H, Simmonds P. Development of multiplexed nucleic acid testing for human immunodeficiency virus type 1 and hepatitis C virus. Vox Sang. 2001;81(2):93-101. DOI: https://doi.org/10.1046/j.1423-0410.2001.00093.x
33. Struck D, Lawyer G, Ternes AM, Schmit JC, Bercoff DP. COMET: adaptive context-based modeling for ultrafast HIV-1 subtype identification. Nucleic Acids Res. 2014;42(18):e144. DOI: https://doi.org/10.1093/nar/gku739
34. Bennett DE, Camacho RJ, Otelea D, Kuritzkes DR, Fleury H, Kiuchi M, Heneine W, Kantor R, Jordan MR, Schapiro JM, Vandamme AM, Sandstrom P, Boucher CA, van de Vijver D, Rhee SY, Liu TF, Pillay D, Shafer RW. Drug resistance mutations for surveillance of transmitted HIV-1 drug-resistance: 2009 update. PLoS One. 2009;4(3):e4724. DOI: https://doi.org/10.1371/journal.pone.0004724
35. Machnowska P, Hauser A, Meixenberger K, Altmann B, Bannert N, Rempis E, Schnack A, Decker S, Braun V, Busingye P, Rubaihayo J, Harms G, Theuring S. Decreased emergence of HIV-1 drug resistance mutations in a cohort of Ugandan women initiating option B+ for PMTCT. PLoS One. 2017;12(5):e0178297. DOI: https://doi.org/10.1371/journal.pone.0178297
36. Pineda-Pena AC, Faria NR, Imbrechts S, Libin P, Abecasis AB, Deforche K, Gomez-Lopez A, Camacho RJ, de Oliveira T, Vandamme AM. Automated subtyping of HIV-1 genetic sequences for clinical and surveillance purposes: performance evaluation of the new REGA version 3 and seven other tools. Infect Genet Evol. 2013;19:337-48. DOI: https://doi.org/10.1016/j.meegid.2013.04.032
37. Zu Knyphausen F, Scheufele R, Kucherer C, Jansen K, Somogyi S, Dupke S, Jessen H, Schurmann D, Hamouda O, Meixenberger K, Bartmeyer B. First line treatment response in patients with transmitted HIV drug resistance and well defined time point of HIV infection: updated results from the German HIV-1 seroconverter study. PLoS One. 2014;9(5):e95956. DOI: https://doi.org/10.1371/journal.pone.0095956
38. Hauser A, Santos-Hoevener C, Meixenberger K, Zimmermann R, Somogyi S, Fiedler S, Hofmann A, Bartmeyer B, Jansen K, Hamouda O, Bannert N, Kuecherer C. Improved testing of recent HIV-1 infections with the BioRad avidity assay compared to the limiting antigen avidity assay and BED Capture enzyme immunoassay: evaluation using reference sample panels from the German Seroconverter Cohort. PLoS One. 2014;9(6):e98038. DOI: https://doi.org/10.1371/journal.pone.0098038
39. Hauser A, Heiden MA, Meixenberger K, Han O, Fiedler S, Hanke K, Koppe U, Hofmann A, Bremer V, Bartmeyer B, Kuecherer C, Bannert N. Evaluation of a BioRad Avidity assay for identification of recent HIV-1 infections using dried serum or plasma spots. J Virol Methods. 2019;266:114-20. DOI: https://doi.org/10.1016/j.jviromet.2019.02.002
40. Hauser A, Meixenberger K, Machnowska P, Fiedler S, Hanke K, Hofmann A, Bartmeyer B, Bremer V, Bannert N, Kuecherer C. Robust and sensitive subtype-generic HIV-1 pol genotyping for use with dried serum spots in epidemiological studies. J Virol Methods. 2018;259:32-8. DOI: https://doi.org/10.1016/j.jviromet.2018.05.013
28

41. Kassenärztliche Bundesvereinigung. Einheitlicher Bewertungsmaßstab (EBM) Stand: 4. Quartal 2015 Berlin 2015 [18.10.2017]. Available from: https://www.kbv.de/media/EBM-2009-Archiv_2.zip.
42. Gokengin D, Geretti AM, Begovac J, Palfreeman A, Stevanovic M, Tarasenko O, Radcliffe K. 2014 European Guideline on HIV testing. Int J STD AIDS. 2014;25(10):695-704. DOI: https://doi.org/10.1177/0956462414531244
43. Deutsche STI-Gesellschaft (DSTIG), Ärztliche Gesellschaft zur Gesundheitsförderung e.V. (AGGF), Bundesverband der Kinder- und Jugendärzte e.V. (BVKJ), Deutsche AIDS-Gesellschaft e.V. (DAIG), Deutsche Arbeitsgemeinschaf niedergelassener Ärzte für die Versorgung HIV-Infizierter (DAGNÄ e.V.), Deutscher Dermatologische Gesellschaft (DDG), Deutsche Gesellschaft für Allgemeinmedizin und Familienmedizin e.V. (DEGAM), Deutsche Gesellschaft für Andrologie (DGA), Deutschle Gesellschaft für Gynäkologie und Geburtshilfe (DGGG), Deutsche Gesellschaft für Infektiologie (DGI), Deutsche Gesellschaft für psychsomatische Frauenheilkunde und Geburtshilfe (DGPFG), Deutsche Gesellschaft für Rechtmedizin (DGRM), Deutsche Gesellschaft für Sexualfroschung (DGfS), Deutsche Gesellschaft für Urologie e.V. (DGU), Gesellschaft für Sexualpädagogik (GSP), Gemeinsame Diagnostikkommission der Deutschen Vereinigung zur Bekämpfung der Viruskrankheiten (DVV) und der Gesellschaft für Virologie (GfV), Kempetenznetz HIV/AIDS, Robert Koch-Institut. Sexuell übertragbare Infektionen (STI) – Beratung, Diagnostik und Therapie - AWMF S2k Leitlinie Registernummer 059 – 006. Berlin: Arbeitsgemeinschaft der Wissenschaftlichen Medizinischen Fachgesellschaften e.V. (AWMF) e.V.; 2018. Available from: https://www.awmf.org/leitlinien/detail/ll/059-006.html
44. Marcus U, Gassowski M, Kruspe M, Drewes J. Recency and frequency of HIV testing among men who have sex with men in Germany and socio-demographic factors associated with testing behaviour. BMC Public Health. 2015;15:727. DOI: https://doi.org/10.1186/s12889-015-1945-5
45. The EMIS Network. EMIS-2017 – The European Men-Who-Have-Sex-With-Men Internet Survey. Key findings from 50 countries. Stockholm: European Centre for Disease Prevention and Control; 2019. DOI: https://doi.org/10.2900/690387
46. Hemelaar J, Gouws E, Ghys PD, Osmanov S. Global and regional distribution of HIV-1 genetic subtypes and recombinants in 2004. AIDS (London, England). 2006;20(16):W13-23. DOI: https://doi.org/10.1097/01.aids.0000247564.73009.bc
47. Beloukas A, Psarris A, Giannelou P, Kostaki E, Hatzakis A, Paraskevis D. Molecular epidemiology of HIV-1 infection in Europe: An overview. Infect Genet Evol. 2016;46:180-9. DOI: https://doi.org/10.1016/j.meegid.2016.06.033
48. Hofstra LM, Sauvageot N, Albert J, Alexiev I, Garcia F, Struck D, Van de Vijver D, Asjo B, Beshkov D, Coughlan S, Descamps D, Griskevicius A, Hamouda O, Horban A, Van Kasteren M, Kolupajeva T, Kostrikis LG, Liitsola K, Linka M, Mor O, Nielsen C, Otelea D, Paraskevis D, Paredes R, Poljak M, Puchhammer-Stockl E, Sonnerborg A, Stanekova D, Stanojevic M, Van Laethem K, Zazzi M, Zidovec Lepej S, Boucher CAB, Schmit JC, Wensing AMJ, for the Spread Program. Transmission of HIV Drug Resistance and the Predicted Effect on Current First-line Regimens in Europe. Clin Infect Dis. 2016;62(5):655-63. DOI: https://doi.org/10.1093/cid/civ963
29

49. Verzeichnis der Beschlüsse der Europäischen Union über die Zulassung von Arzneimitteln vom 1. August 2016 bis 31. August 2016 (Veröffentlichung gemäß Artikel 13 bzw. Artikel 38 der Verordnung (EG) Nr. 726/2004 des Europäischen Parlaments und des Rates) OJ C 362, 30.9.2016, p. 1–9 Sect. 362/1 (2016).
50. Böhm K. Gesundheitszustand der Bevölkerung und Ressourcen der Gesundheitsversorgung. In: Statistisches Bundesamt (Destatis), Wissenschaftszentrum Berlin für Sozialforschung (WZB), Bundesinstitut für Bevölkerungsforschung (BiB), Sozio-oekonomische Panel (SOEP) am Deutschen Institut für Wirtschaftsforschung (DIW Berlin), editors. Datenreport 2021 - Ein Sozialbericht für die Bundesrepublik Deutschland. Bonn: Bundeszentrale für politische Bildung; 2021. p. 325-33.
51. Marcus U, Ort J, Grenz M, Eckstein K, Wirtz K, Wille A. Risk factors for HIV and STI diagnosis in a community-based HIV/STI testing and counselling site for men having sex with men (MSM) in a large German city in 2011-2012. BMC Infect Dis. 2015;15:14. DOI: https://doi.org/10.1186/s12879-014-0738-2
30
31
2. Eidesstattliche Versicherung
„Ich, Alexandra Hofmann, versichere an Eides statt durch meine eigenhändige Unterschrift, dass
ich die vorgelegte Dissertation mit dem Thema: Erweiterte Surveillance von HIV-Infektionen -
Enhanced HIV Surveillance selbstständig und ohne nicht offengelegte Hilfe Dritter verfasst und
keine anderen als die angegebenen Quellen und Hilfsmittel genutzt habe.
Alle Stellen, die wörtlich oder dem Sinne nach auf Publikationen oder Vorträgen anderer
Autoren/innen beruhen, sind als solche in korrekter Zitierung kenntlich gemacht. Die Abschnitte
zu Methodik (insbesondere praktische Arbeiten, Laborbestimmungen, statistische Aufarbeitung)
und Resultaten (insbesondere Abbildungen, Graphiken und Tabellen) werden von mir
verantwortet.
Ich versichere ferner, dass ich die in Zusammenarbeit mit anderen Personen generierten Daten,
Datenauswertungen und Schlussfolgerungen korrekt gekennzeichnet und meinen eigenen
Beitrag sowie die Beiträge anderer Personen korrekt kenntlich gemacht habe (siehe
Anteilserklärung). Texte oder Textteile, die gemeinsam mit anderen erstellt oder verwendet
wurden, habe ich korrekt kenntlich gemacht.
Meine Anteile an etwaigen Publikationen zu dieser Dissertation entsprechen denen, die in der
untenstehenden gemeinsamen Erklärung mit dem/der Erstbetreuer/in, angegeben sind. Für
sämtliche im Rahmen der Dissertation entstandenen Publikationen wurden die Richtlinien des
ICMJE (International Committee of Medical Journal Editors; www.icmje.og) zur Autorenschaft
eingehalten. Ich erkläre ferner, dass ich mich zur Einhaltung der Satzung der Charité -
Universitätsmedizin Berlin zur Sicherung Guter Wissenschaftlicher Praxis verpflichte.
Weiterhin versichere ich, dass ich diese Dissertation weder in gleicher noch in ähnlicher Form
bereits an einer anderen Fakultät eingereicht habe.
Die Bedeutung dieser eidesstattlichen Versicherung und die strafrechtlichen Folgen einer
unwahren eidesstattlichen Versicherung (§§156, 161 des Strafgesetzbuches) sind mir bekannt
und bewusst.“
Datum Unterschrift

3. Anteilserklärung an den erfolgten Publikationen
Alexandra Hofmann hatte folgenden Anteil an den folgenden Publikationen:
Publikation 1: Hofmann A, Hauser A, Zimmermann R, Santos-Hövener C, Bätzing-Feigenbaum J,
Wildner S, Kücherer C, Bannert N, Hamouda O, Bremer V, Bartmeyer B.: Surveillance of recent
HIV infections among newly diagnosed HIV cases in Germany between 2008 and 2014. BMC
Infectious Diseases. 2017;17(1):484. DOI: 10.1186/s12879-017-2585-4. Impact factor: 2,620 für
2017 (Quelle: Journal Citation Reports)
• Verantwortlich für die Durchführung der Studie InzSurv-HIV
• Federführung bei der Konzeption des Artikels
• Durchführung der Literaturrecherche und Auswahl der relevanten Literatur
• Eigenverantwortliche Bereinigung und Analyse der Daten
• Federführung bei der Erstellung der Tabellen und Grafiken
• Federführung beim Verfassen und überarbeiten der Publikation
• Interpretation der Ergebnisse in Zusammenarbeit mit den Koautoren
Publikation 2: Hauser A, Hofmann A, Hanke K, Bremer V, Bartmeyer B, Kuecherer C, Bannert N.:
National molecular surveillance of recently acquired HIV infections in Germany, 2013 to 2014.
Euro Surveill. 2017;22(2). DOI: 10.2807/1560-7917.ES.2017.22.2.30436. Impact factor: 7,127 für
2017 (Quelle: Journal Citation Reports)
• Bereitstellung und Datenbereinigung der epidemiologischen Daten aus der Studie
InzSurv-HIV
• Unterstützung bei der Analyse der Daten
• Prüfung der Tabellen und Grafiken
• Interpretation der Ergebnisse in Zusammenarbeit mit den Koautoren
• Revidieren des Manuskripts
Publikation 3: Hauser A, Hofmann A, Meixenberger K, Altmann B, Hanke K, Bremer V, Bartmeyer
B, Bannert N.: Increasing proportions of HIV-1 non-B subtypes and of NNRTI resistance between
2013 and 2016 in Germany: Results from the national molecular surveillance of new HIV-
diagnoses. PLoS One. 2018;13(11): e0206234. DOI: 10.1371/journal.pone.0206234. Impact
factor: 2,776 für 2018 (Quelle: Journal Citation Reports)
32

• Bereitstellung und Datenbereinigung der epidemiologischen Daten aus der Studie
InzSurv-HIV
• Unterstützung bei der Datenanalyse
• Prüfung der Tabellen und Grafiken
• Interpretation der Ergebnisse in Zusammenarbeit mit den Koautoren
• Revidieren des Manuskripts
Publikation 4: Hofmann, A, Bätzing, J, Marcus, U, Bremer, V, Bartmeyer, B: Wie viele Personen
lassen sich in Deutschland im niedergelassenen Bereich auf HIV testen?. Bundesgesundheitsbl
63, 1262–1270 (2020). DOI: 10.1007/s00103-020-03210-y.
Impact factor: 1,059 für 2019 (Quelle: Journal Citation Reports)
• Verantwortlich für die Konzeption und Durchführung der Studie zur Ermittlung der
getesteten Personen im niedergelassenen Bereich
• Federführung bei der Konzeption des Artikels
• Durchführung der Literaturrecherche und Auswahl der relevanten Literatur
• Analyse der durch das Zi zusammengestellten aggregierten Daten
• Federführung bei der Erstellung der Tabellen und Grafiken
• Federführung beim Verfassen und überarbeiten der Publikation
• Interpretation der Ergebnisse in Zusammenarbeit mit den Koautoren
____________________________
Unterschrift der Doktorandin
33
4. Originalarbeiten als Promotionsleistung
Publikation 1
Hofmann A, Hauser A, Zimmermann R, Santos-Hövener C, Bätzing-Feigenbaum J, Wildner S,
Kücherer C, Bannert N, Hamouda O, Bremer V, Bartmeyer B.: Surveillance of recent HIV infections
among newly diagnosed HIV cases in Germany between 2008 and 2014. BMC Infectious Diseases.
2017;17(1):484. DOI: 10.1186/s12879-017-2585-4. Impact factor: 2,620 für 2017 (Quelle: Journal
Citation Reports)
34

RESEARCH ARTICLE Open Access
Surveillance of recent HIV infections amongnewly diagnosed HIV cases in Germanybetween 2008 and 2014Alexandra Hofmann1,2*, Andrea Hauser3, Ruth Zimmermann1, Claudia Santos-Hövener1, Jörg Bätzing-Feigenbaum4,Stephan Wildner5, Claudia Kücherer3, Norbert Bannert3, Osamah Hamouda6, Viviane Bremer1 and Barbara Bartmeyer1
Abstract
Background: The HIV surveillance system in Germany is based on mandatory, anonymous notification of newlydiagnosed HIV cases by laboratories. Because the time between HIV infection and the diagnosis of HIV varies widelybetween persons, it is difficult to determine the number of cases of recent HIV infection among newly diagnosedcases of HIV. In Germany, the BED-capture-enzyme immunoassay (BED-CEIA) has been used to distinguish betweenrecent and long-standing HIV infection. The aim of this analysis is to report the proportion of cases of recent HIVinfection among newly diagnosed cases in Germany between 2008 and 2014 and to identify factors associatedwith recent infections.
Methods: A sample of voluntary laboratories among all HIV diagnostic laboratories was recruited. Residualblood from HIV diagnostic tests was spotted on filter paper as dried serum or dried plasma spots and wassent along with the notification form of the HIV cases. The BED-CEIA test was performed. A case was definedas recent HIV infection with a BED-CEIA test result of less than 0.8 normalized optical density, with theexclusion of CDC stage C. The proportion of recent newly diagnosed HIV infections among different groups(such as transmission groups, gender or age groups) was calculated. We used logistic regression to identifyfactors associated with recent HIV infection and to identify subpopulations with high proportions of recentHIV infections.
Results: Approximately 10,257 newly diagnosed cases were tested for recency using the BED-CEIA. In total,3084 (30.4%) of those were recently infected with HIV. The highest proportion of recent HIV infections wasfound among men who had sex with men (MSM) (35%) and persons between 18 and 25 years of age (43.0%). Logistic regression revealed that female German intravenous drug users with a recent HIV infection hada higher chance of being detected than German MSM (OR 2.27).
Conclusions: Surveillance of recent HIV infection is a useful additional tool to monitor the HIV epidemic inGermany. We could observe ongoing HIV transmission in Germany in general and in different subgroups, andwe could identify factors associated with recent HIV infection in Germany.
Keywords: Surveillance, HIV, Recent HIV infection, Test for recency of infection, Bed-CEIA, Germany
* Correspondence: [email protected] for Infectious Disease Epidemiology, Unit 34 HIV/AIDS, STI andBlood-Borne Infections, Robert Koch-Institute, Seestr.10, 13353 Berlin,Germany2Charité, Universitätsmedizin, Berlin, GermanyFull list of author information is available at the end of the article
© The Author(s). 2017 Open Access This article is distributed under the terms of the Creative Commons Attribution 4.0International License (http://creativecommons.org/licenses/by/4.0/), which permits unrestricted use, distribution, andreproduction in any medium, provided you give appropriate credit to the original author(s) and the source, provide a link tothe Creative Commons license, and indicate if changes were made. The Creative Commons Public Domain Dedication waiver(http://creativecommons.org/publicdomain/zero/1.0/) applies to the data made available in this article, unless otherwise stated.
Hofmann et al. BMC Infectious Diseases (2017) 17:484 DOI 10.1186/s12879-017-2585-4
35
BackgroundIn 2014, 83,400 (77,000–91,200) people were estimatedto be living with HIV/AIDS in Germany. The majorityof them were men who have sex with men (MSM; ap-proximately 53,800), followed by people who were in-fected heterosexually with HIV (HET; approximately10,500) and approximately 7900 persons who were intra-venous drug users (IDU). The estimated HIV epidemicin Germany peaked in 1985, followed by a decline in the1990s, an increase from 2000 to 2006, and stable infec-tion rates from 2006 to 2014. It was estimated by model-ling that in 2014, approximately 3200 people were newlyinfected with HIV. The highest estimated number ofHIV infections occurred among MSM (2300) [1].In Germany, the HIV surveillance system is based on
mandatory, anonymous notification of newly diagnosedHIV cases by laboratories. Additional epidemiological in-formation regarding the HIV mode of transmission andother clinical data is reported by physicians. AIDS casereporting is voluntary [2]. In addition to HIV notifica-tion data, several long-term observational cohort studiesin different HIV-positive populations, such as the studyon the clinical surveillance of HIV disease [3], theGerman HIV seroconverter study [4] and other biologicaland behavioural studies in the most affected vulnerablegroups have been performed.The time between HIV infection and the diagnosis of
HIV varies widely between individuals. Therefore, it isdifficult to calculate the number of persons newly in-fected with HIV per year to determine the incidence ofHIV infections by exclusively using newly diagnosedHIV cases. As a consequence, all other supportivesources, such as the HIV cohorts and the mortalityregister, are used to model the incidence of new HIV in-fections per year and the number of people who livewith HIV/AIDS in Germany by using the imputationmethod [1, 5].In addition to modelling an estimated incidence and
prevalence of HIV infected persons in Germany, cases ofnewly diagnosed HIV are regularly tested serologicallyfor recent HIV infection (TRI) since 2011 to improvethe method of estimating the HIV epidemic in Germanyand to identify populations with recent transmission ofHIV. Numerous serological assays for TRI were developedand applied within the last decade [6–9]. Most of the testsare based on the measurement of the maturation of HIV-1 specific antibodies, which occur within the first twoyears after seroconversion [10, 11]. Accordingly, based onthe increase of the antibody titres [12–14], the proportionof HIV-specific immunoglobulin G (IgG) antibodies rela-tive to total IgG [15] or the avidity of antibodies [16–20],TRIs can distinguish between recently acquired and long-standing infections. For many years, the BED-capture-enzyme immunoassay (BED-CEIA) [15] was the most
commonly used recency assay [21–23]. The BED-CEIAwas evaluated for Germany in a pilot study (2005–2007)[24] and finally applied in a nationwide cross-sectionalincidence study [25, 26]. The findings in this study wereused to implement a nationwide surveillance system ofrecent HIV infections in 2011.The aim of this analysis is to report the proportions of
recent HIV infections among newly diagnosed HIV casesin Germany between 2008 and 2014 and to identify fac-tors associated with recent infection in order to provideinsight into current HIV transmission dynamics.
MethodsSample collectionNewly diagnosed HIV cases were directly reported bylaboratories to the Robert Koch Institute, RKI, which isthe national public health institute of Germany. As thenumber of HIV notifications varies a lot between thereporting laboratories in Germany, only a subgroup oflaboratories were recruited using convenience samplingfor this analysis (n = 108; Fig. 1). This subgroup oflaboratories notified 90.5% of all newly HIV diagnosedcases between 2008 and 2014. These laboratories col-lected blood residuals from HIV diagnostics, which werespotted on filter paper (Whatman # 903, GE HealthcareBio-Science Corp, Westborough, USA) as dried serumspots (DSS) or dried plasma spots (DPS) for the surveil-lance of recent HIV infections. The DSS/DPS sampleswere sent together with the routine HIV notificationform to the RKI. For this analysis, DSS/DPS sampleswere used from two different studies. They were col-lected between 1st March 2008 and 30th June 2010 for anationwide cross-sectional study and between the 1stJanuary 2011 and 31st December 2014 for the study“surveillance of recent HIV infections”.For this analysis, only persons were included, who
were newly diagnosed with HIV between 2008 and 2014and with one additional DSS/DPS sample available. HIVnotifications and DSS/DPS samples were linked by usingthe number of the HIV notification form. Data on age,gender, mode of transmission, region of origin and as-sumed region of infection were used from the associatedHIV notification form. Exclusion criteria for this analysiswere unknown information on gender or age, age below18 years, being infected with HIV via mother to childtransmission, or DSS/DPS samples from double-notifiedHIV cases (Fig. 2). Ethical approval for the nationwidecross-sectional study was given by the ethics board atthe Charité, University Medicine, Berlin, as well asapproval from the data protection office of Germany ac-cording to the Federal Data Protection Act. The DSS/DPS samples used were residuals from routine HIVdiagnostic processing; therefore, no patient informedconsent was given. Furthermore, the DSS/DPS samples
Hofmann et al. BMC Infectious Diseases (2017) 17:484 Page 2 of 13
36

cannot be linked to an individual person because theHIV notification system is strictly anonymous. Addition-ally, the BED-CEIA is only licensed for epidemiologicalstudies and not for individual diagnosis. Therefore, noextra benefit can be obtained by informing personsabout positive BED-CEIA test results.
Laboratory testingAll DSS/DPS samples were tested for recency of HIVinfection by the RKI study laboratory (HIV and Other Ret-roviruses Unit) using the BED-CEIA from the CalypteBiomedical Corporation, Portland, USA [27], and since2014, the BED-CEIA from Sedia Biosciences Corporation,Portland, USA was used [28]. The BED-CEIA measuresthe proportion of HIV-1-specific immunoglobulin G (IgG)antibodies relative to total IgG at a normalized optical
density (ODn). Cases were classified as recent HIV infec-tion or long-standing infection by the quantitative outputrelative to a defined cut off of ODn <0.8. A recent HIVinfection is determined, according to Sedia BiosciencesCorporation, as an infection that occurred within the last197 (range 127–236) days, or within the last 162 days forHIV subtype B [28]. Calypte reports a duration of 155 days[27], and in Germany, approximately 20 weeks (=140 days)was determined as the duration of a recent HIV infection[29]. The sensitivity and specificity of the BED-CEIA arelow (81.7%; 89.1%) [15], and therefore, the test is rec-ommended for surveillance purposes only using DSS/DPS samples from individuals who have already beendiagnosed with HIV.To minimize false recent classification of the BED-
CEIA, an additional step, the recent test algorithm (RITA),
Fig. 1 Distribution of participating laboratories (n = 108) in Germany, 2008–2014. Map created with RegioGraph Analyse © GfK GeoMarketingGmbH, Bruchsal, Germany
Hofmann et al. BMC Infectious Diseases (2017) 17:484 Page 3 of 13
37

was applied following the European Centre for Disease Pre-vention and Control (ECDC) recommendation [30]. It isrecommended that cases with a recent BED-CEIA test re-sult should be recoded as long-standing infection if the casewas reported with an AIDS defining illness (stage C of theCenters for Disease Control and Prevention (CDC) criteria),CD4 cell counts < 200 cells/mm3
, or a reported plasma viralload below 400 copies/ml. Data on CD4 cell counts andviral load are often missing in the HIV notification formand are therefore scarce. For example, in 2014, only 34% ofthe newly diagnosed HIV cases had information regardingCD4 cell count [31]. Therefore, only the information aboutAIDS defining illnesses reported on the notification formwas used to minimize false BED-CEIA test results.A newly diagnosed case of recent infection with HIV
is therefore defined as a BED-CEIA test result with a cutoff of less than 0.8 ODn and without any documentedAIDS defining illnesses. In contrast, a case with long-standing HIV infection is defined as a case in which theBED-CEIA test result has a cut off equal to or higherthan 0.8 ODn or an AIDS defining illness. By using thismethod, cases with a false recent test result can be iden-tified and corrected; however false long-standing (FLS)test results were not corrected. To correct the FLS test
results, as well, further information about the cases isneeded, such as previously documented HIV RNA+/Ab-or p24Ag+/Ab- within 180 days of the sample date,clinical symptoms of seroconversion, or previously docu-mented HIV-negative test result within 180 days of thesample date [30]. This information is not available onthe HIV notification form.
Statistical analysisAnalyses were performed using STATA 13.0 (Stata Stat-istical Software: Release 13, United States). To guaranteecomparability between newly diagnosed HIV cases withDSS/DPS and all newly diagnosed HIV cases, a weighthas been calculated by dividing the proportion of vari-able specifications among all newly diagnosed cases withthe proportion of variable specifications of those newlydiagnosed cases with DSS/DPS.We analysed the number and the proportion of recent
HIV infections among cases using the chi2 test for bivariatecomparison and logistic regression to assess the odds ratiofor recent infections. Univariate logistic regression was per-formed. Factors with significant odds ratios were includedin the multivariable logistic regression. Time trends wereanalysed by using logistic regression with recent infection
Fig. 2 Flowchart of DSS/DPS samples and HIV diagnoses included in the analyses between 2008 and 2014 in Germany. DSS/DPS: dried serumspots or dried plasma spots. RITA: recent test algorithm. BED-CEIA: BED-capture-enzyme immunoassay
Hofmann et al. BMC Infectious Diseases (2017) 17:484 Page 4 of 13
38

as a dependent variable and diagnosed cases with DSS/DPSper year as an independent variable. Multivariable logisticregression with recent infection as a dependent variablewas also used to identify subgroups according to theirgender and origin within different modes of transmission.Unknown data was included into analysis, such as un-known mode of transmission, origin or assumed region ofinfection for identifying subgroups. For the proportion ofrecent infections, the 95% confidence interval (95% CI) wascalculated. A Mann-Whitney (Wilcoxon) rank sum test ofmedians was used to compare the age of those with recentinfection and those with long-standing infection.
ResultsParticipating laboratories and availability of DSS/DPSamong newly diagnosed HIV casesBetween 2008 and 2014, a total of 39,170 HIV diagnoseswere reported by 227 laboratories nationwide. The par-ticipating laboratories (n = 108/227; 47.6%) reportedapproximately 91.3% (n = 35,756) of all HIV diagnosesbetween 2008 and 2014. Of these 39,170 HIV diagnoses,20,896 (53.3%) were newly diagnosed cases (double orunknown notifications were excluded from analysis).During the same time period, a total of 18,623 DSS/DPSsamples were sent to the RKI by these laboratories and99.1% could be linked to an HIV notification form (Fig. 2).The distribution of the numbers of reported HIV cases bylaboratories within subgroups is similar for newly diag-nosed HIV cases with DSS/DPS (n = 10,257) and all newlydiagnosed cases (n = 20,487 Table 1). The different weightsranged between 0.9 and 1.1 (Median 1), therefore no add-itional weight adjustment was included. Especially, thenumber of collected DSS/DPS samples differed in 2010(n = 4.0), when DSS/DPS samples were collected for ashorter time period than in other years. The number of col-lected DSS/DPS samples increased significantly over time(chi2 p < 0.001).
Characteristics of the overall study population of newlydiagnosed HIV cases with DSS/DPS samples between2008 and 2014The study population consisted mostly of men (83.3%; n=8,541/10,257). The main mode of HIV transmissionwas MSM (58.4%), followed by an unknown mode oftransmission (20.0%), HET (18.6%) and IDU (3.0%). Onethird (33.6%) of the study population was between 25and 34 years old (Table 2). Most patients originatedfrom Germany (62.4%), followed by people from sub-Saharan Africa (9.5% (Table 3). The most frequently re-ported presumed region of infection was Germany(69.5%), followed by sub-Saharan Africa (7.2%) (Table 3).Information about CD4 cell count among newly diag-
nosed HIV cases with DSS/DPS was available from32.1% (n =3297). Of those cases, 51.6% showed CD4 cell
counts below 350 cells (n = 1700). Late presentation(CD4 cell counts <350 cells/mm3 or CDC stadiumAIDS) was identified in 10.1% (n =949/9363) of newlydiagnosed cases with DSS/DPS with available data. Virusload information was available for 36.6% (n =3755/10,257) of newly diagnosed HIV cases with DSS/DPS.
Table 1 Comparison of newly diagnosed HIV cases with andwithout DSS/DPS samples by gender, origin, age, mode oftransmission, region of presumed infection, region of origin andyear of diagnosis, 2008–2014, Germany
Newly diagnosed HIV cases, n %
total with DSS/DPS4 Sample weighting
Total 20,487 100% 10,257 100%
Gender
Men 17,137 83.6% 8,541 83.3% 1.0
Women 3,350 16.4% 1,716 16.7% 1.0
Region of origin
Germany 12,830 62.6% 6,405 62.4% 1.0
Abroad 5,454 26.6% 2,853 27.8% 1.0
Unknown 2,203 10.8% 999 9.7% 1.1
Age group
< 25 years 2,298 11.2% 1,216 11.9% 0.9
25–34 years 6,687 32.6% 3,443 33.6% 1.0
35–44 years 5,999 29.3% 2,986 29.1% 1.0
45–54 years 3,824 18.7% 1,838 17.9% 1.0
> =55 years 1,679 8.2% 774 7.5% 1.1
Mode of transmission
MSM1 11,541 56.3% 5,993 58.4% 1.0
HET2 3,789 18.5% 1,909 18.6% 1.0
IDU3 649 3.2% 307 3.0% 1.1
Unknown 4,508 22.0% 2,048 20.0% 1.1
Region of presumed infection
Germany 14,184 69.2% 7,124 69.5% 1.0
Abroad 3,506 17.1% 1,803 17.6% 1.0
Unknown 2,797 13.7% 1,330 13.0% 1.1
Year of Diagnosis
2008 2,745 13.4% 1,264 12.3% 1.1
2009 2,815 13.7% 1,335 13.0% 1.1
2010a 2,653 12.9% 332 3.2% 4.0
2011 2,644 12.9% 1,624 15.8% 0.8
2012 2,920 14.3% 1,779 17.3% 0.8
2013 3,232 15.8% 1,890 18.4% 0.9
2014 3,478 17.0% 2,033 19.8% 0.91 MSM men who have sex with men2 IDU persons who are intravenous drug users3 HET persons with heterosexual contact4 DSS/DPS Sample Dried Serum Spot/Dried Plasma SpotaDSS/DPS samples were not continuously collected due to the end of the firststudy in June 2010
Hofmann et al. BMC Infectious Diseases (2017) 17:484 Page 5 of 13
39

Proportion of recent HIV infections among newlydiagnosed HIV cases with DSS/DPS samples between2008 and 2014In total, 3221 (31.4%; 95% CI 30.5–32.2%) cases wereclassified as recent infections, of which 137 (4.2%) werereclassified according to the ECDC recommendation(see Fig. 2) [30]. The final study population consisted of30.1% of cases with recent infection (n = 3084; 95% CI29.2–31.0%). The proportion of recent HIV infectionsamong men was 31.7% compared to 22.1% amongwomen (chi2 p < 0.001). The highest proportion of re-cent infections (43.0%) was found among young personsbetween 18 and 25 years of age (Table 2). Within thedifferent modes of transmission, the highest proportionof recent infections was found among MSM (35.0%),followed by IDU (34.9%) (Table 2). Persons with a recent
HIV infection were significantly younger than those witha long-standing HIV infection (median age 34 vs.37 years; p < 0.001 Wilcoxon). MSM with recent HIVinfection were significantly younger than MSM with along-standing HIV infection (median age 33 vs. 36 years;p < 0.001 Wilcoxon). No difference in age regardingrecent HIV infection could be found for HET (medianage 35 vs. 36; p = 0.1215 Wilcoxon) and IDU (medianage 34 vs. 36; p = 0.0990 Wilcoxon).The proportion of recent infection was 33.1% among
Germans and 17.3% among sub-Saharan Africans (Table 3).Newly diagnosed HIV cases from Germany were morelikely to be recent infected than those identified amongnewly diagnosed HIV cases originating from abroad(33.1% vs. 23.6%; chi2 p < 0.001) (Table 2). Persons re-ported to be infected with HIV in the Western Europe
Table 2 Characteristics and factors associated with recent HIV infection among newly diagnosed HIV cases using DSS/DPS samplesin Germany, 2008–2014
Newly diagnosed HIV cases, n % Univariate analysis Multivariable analysis (n = 10,257)
Factor total with DSS/DPS4 with recent infection OR* 95% CI° OR* 95% CI°
Total 10,257 100% 3,084 30.01%
Gender
Men 8,541 83.3% 2,705 31.7% (ref) (ref)
Women 1,716 16.7% 379 22.1% 0.61# 0.54–0.69 0.94 0.79–1.12
Region of origin
Germany 6,405 62.5% 2,121 33.1% (ref) (ref)
Abroad 2,853 27.8% 673 23.6% 0.62# 0.56–0.69 0.74# 0.66–0.84
Unknown 999 9.7% 290 29.0% 0.83## 0.71–0.96 0.94 0.80–1.11
Age group
< 25 years 1,216 11.9% 523 43.0% (ref) (ref)
25–34 years 3,443 33.6% 1,091 31.7% 0.61# 0.54–0.70 0.63# 0.55–0.72
35–44 years 2,986 29.1% 846 28.3% 0.52# 0.46–0.60 0.53# 0.46–0.61
45–54 years 1,838 17.9% 470 25.6% 0.46# 0.39–0.53 0.45# 0.39–0.53
> =55 years 774 7.5% 154 19.9% 0.33# 0.27–0.41 0.35# 0.28–0.43
Mode of transmission
MSM1 5,993 58.4 2,095 35.0% (ref) (ref)
HET2 1,909 18.6 393 20.6% 0.48# 0.43–0.55 0.65# 0.54–0.79
IDU3 307 3.0 107 34.9% 1.00 0.78–1.27 1.18 0.92–1.51
Unknown 2,048 20.0 489 23.9% 0.58# 0.52–0.65 0.68# 0.60–0.77
Region of presumed infection
Germany 7,124 69.4% 2,346 32.9% (ref) (ref)
Abroad 1,803 17.6% 387 21.5% 0.56# 0.49–0.63 0.85## 0.73–0.99
Unknown 1,330 13.0 351 26.4% 0.73# 0.64–0.83 0.98 0.84–1.141MSM: men who have sex with men2IDU: persons who are intravenous drug users3HET: persons with heterosexual contact4 DSS/DPS: Dried Serum Spot/Dried Plasma Spot*OR: odds ratio°95% CI: 95% Confidence interval# p-value: p < =0.001## p-value: p < =0.05
Hofmann et al. BMC Infectious Diseases (2017) 17:484 Page 6 of 13
40

region (excluding Germany) had the highest proportionof recent infections (34.1%), followed by people fromGermany (32.9%) as the presumed region of infection(Table 3). Cases with a recent HIV infection were morelikely infected with HIV in Germany than abroad (32.9%compared to 21.5%; chi2 p < 0.001). Cases from abroadwith a recent infection were more likely reported to haveacquired the infection in Germany (30.8% vs. 18.5%; chi2
p < 0.001). Cases with recent infection and available infor-mation on CD4 cell showed significantly higher CD4 cell
counts than cases with long standing infection (Median485 vs. 252 CD4 cells/mm3; p < 0.001 Wilcoxon). Among2.2% (n =21/949) of cases defined as late presenters byCD4 cell count or CDC stage, a recent infection was iden-tified by using the BED-CEIA.
Proportion of recent infections over time withintransmission groupsThe newly diagnosed HIV cases with available DSS/DPSsamples increased from 1264 in 2008 to 2033 in 2014.
Table 3 Origin and presumed region of infection in cases of recent HIV infection among newly diagnosed HIV cases using DSS/DPSsamples in Germany, 2008–2014
Newly diagnosed HIV cases, n % Univariate analysis
Total with DSS/DPS1 With recent infection OR* 95% CI°
Region of origin
Germany 6,405 62.4% 2,121 33.1% (ref)
Eastern Europe 384 3.7 90 23.4% 0.62# 0.49–0.79
Western Europe 310 3.0 98 31.6% 0.93 0.73–1.19
Central Europe 464 4.5 143 30.8% 0.90 0.73–1.10
Asia / Oceania 274 2.7 65 23.7% 0.63# 0.47–0.83
America / Caribbean 265 2.6 68 25.7% 0.70## 0.53–0.92
North / Northeast Africa 90 0.9 20 22.2% 0.58## 0.35–0.95
sub-Saharan Africa 978 9.5 169 17.3 0.42# 0.35–0.50
Unknown region 88 0.9 20 22.7% 0.59## 0.36–0.98
Unknown 999 9.7 290 29.0% 0.83## 0.71–0.96
Region of origin (combined)
Germany 6,405 62.4 2,121 33.1% (ref)
Abroad 2,853 27.8 673 23.6% 0.62# 0.56–0.69
Unknown 999 9.7 290 29.0% 0.83## 0.71–0.96
Region of presumed infection
Germany 7,124 69.5 2,346 32.9% (ref)
Eastern Europe 215 2.1 41 19.1% 0.48# 0.34–0.68
Western Europe 205 2.0 70 34.1% 1.06 0.79–1.42
Central Europe 145 1.4 36 24.8% 0.67## 0.46–0.98
Asia / Oceania 266 2.6 54 20.3% 0.52# 0.39–0.70
America / Caribbean 128 1.2 30 23.4% 0.62## 0.41–0.94
North / Northeast Africa 43 0.4 13 30.2 0.88 0.46–1.70
sub-Saharan Africa 737 7.2 129 17.5% 0.43# 0.36–0.53
Unknown Region 64 0.6 14 21.9% 0.57 0.31–1.03
Unknown 1,330 13.0 351 26.4% 0.73# 0.63–0.83
Region of presumed infection (combined)
Germany 7,124 69.5 2,346 32.9% (ref)
Abroad 1,803 17.6 387 21.5% 0.56# 0.49–0.63
Unknown 1,330 13.0 351 26.4% 0.73# 0.64–0.83
°95% CI: 95% confidence interval*OR: odds ratio1 DSS/DPS: Dried Serum Spot/Dried Plasma Spot# p-value: p < =0.001## p-value: p < =0.05
Hofmann et al. BMC Infectious Diseases (2017) 17:484 Page 7 of 13
41

The DSS/DPS sample collection decreased in June 2010due to the end of the first study (Table 1). The propor-tion of recent HIV infections per year varied from 26%in 2010 up to 32% in 2012, with an overall increase of4% between 2008 and 2014 (data not shown). Theoverall increase could be confirmed by univariate logisticregression (OR 1.023; 95% CI 1.006–1.049; p < 0.012). Asimilar trend was observed for MSM (OR 1.030; 95% CI1.003–1.058) and for HET (OR 1.079; 95% CI 1.02–1.140). No significant trend over time (OR 0.965; 95% CI0.865–1.076; p < 0.521) was seen in IDU (Fig. 3).
Association between recent infections and other variablesThe univariate logistic regression revealed that severalfactors were associated with recent HIV infection, suchas mode of transmission, age, gender and region of in-fection, which are shown in Table 2. These associationswere confirmed by multivariable logistic regression,which showed that cases with a different mode of trans-mission than MSM were more likely to have a long-standing HIV infection. Including persons younger than25 years, the proportion of persons with long-standingHIV infections increased with age (Table 2).An additional multivariable logistic regression aimed
to identify sub-groups within the main transmissiongroups revealed, that female German intravenous drugusers had a higher chance of being diagnosed with a re-cent HIV infection (OR 2.49; 95% CI 1.40–4.41) thanGerman MSM (Table 4). However, the numbers of fe-male German drug users were small, with 28 (57.1%)cases of recent HIV infection among 49 female Germandrug users in total. Other groups with a lower chance of
being recently infected with HIV compared to GermanMSM were German heterosexual females (OR 0.70; 95%CI 0.55–0.90), heterosexual females with an origin abroad(OR 0.44; 95% CI 0.35–0.54), heterosexual females withan unknown origin (OR 0.34; 95% CI 0.17–0.70) andheterosexual men with an origin abroad (OR 0.39, 95% CI0.29–0.53) (Table 4).
DiscussionThis was the first analysis in Germany on national levelto determine the proportion of recent HIV infectionsamong newly diagnosed HIV cases by using the BED-CEIA according to ECDC corrections. One-third ofnewly diagnosed HIV infections between 2008 and 2014were recent infections within the six months beforediagnosis. Overall, we found a slight but significant in-creasing trend of recent HIV infection between 2008and 2014, particularly among MSM and HET. The high-est proportion of recent HIV infections was found inMSM (35.0%) in contrast to a low proportion in HET(20.6%). Logistic regression identified that only the smallgroup of female German IDU had a higher chance ofbeing newly diagnosed and coincidentally infected re-cently with HIV than MSM.The overall proportion of recent HIV infections in
Germany is similar to that of other European countriesusing the BED-CEIA for TRI. The overall proportion ofrecent HIV infections ranged from 23% among newly di-agnosed cases in Catalonia, Spain (2006–2008) [32] to35% in Sweden (2003–2010) [33]. However, in countriesusing other TRI, such as England, Northern Ireland,Wales or France, the proportion of recent HIV
Fig. 3 Proportion of recent HIV infections among newly diagnosed HIV cases using DSS/DPS samples in different transmission groups by year inGermany, 2008–2014. MSM: men who have sex with men. IDU: persons who are intravenous drug users. HET: persons with heterosexual contact
Hofmann et al. BMC Infectious Diseases (2017) 17:484 Page 8 of 13
42

infections ranged between 15% [34] and 25% [35], whichis lower than in those countries using the BED-CEIA forTRI. The proportion of newly diagnosed and recently in-fected cases is constantly low over the time compared tothe high proportion of long standing and late presentingHIV infections. This is alarming from the perspective ofprevention, because those who are diagnosed late are
often unaware of their HIV infection for a long time andcould therefore potently transmit HIV. As a consequence,early detection and diagnosis of HIV infection is of utmostimportance to prevent new infections. As a strategy foreliminating infections, testing must be brought to scale,followed by immediate sustainable treatment, irrespectiveof the immune status.
Table 4 Characteristics of subpopulations within the different modes of transmission with recent HIV infection among newlydiagnosed HIV cases with DSS/DPS samples in Germany, 2008–2014
Subpopulations Newly diagnosed HIV cases, n % Univariate analysis Multivariable analysis (n = 10,257)
Total With recent infection OR* 95% CI° OR* 95% CI°
MSM1 Men German Origin 4,654 1,652 35.5% (ref) (ref)
non-German Origin 944 316 33.5% 0.91 0.79–1.06 0.87 0.75–1.02
Unknown 395 127 32.2% 0.86 0.69–1.07 0.85 0.68–1.07
IDU2 Men German Origin 92 37 40.2% 1.22 0.80–1.86 1.35 0.88–2.06
non-German Origin 114 26 22.8% 0.54## 0.35–0.83 0.58## 0.37–0.91
Unknown 24 7 29.2% 0.75 0.31–1.81 0.76 0.31–1.85
Women German Origin 49 28 57.1% 2.42## 1.37–4.28 2.49## 1.40–4.41
non-German Origin 17 4 23.5% 0.56 0.18–1.72 0.52 0.17–1.61
Unknown 11 5 45.5% 1.51 0.46–4.97 1.50 0.45–4.99
HET3 Men German Origin 175 49 28.0% 0.71## 0.51–0.99 0.96 0.68–1.36
non-German Origin 414 66 15.9% 0.34# 0.26–0.45 0.39# 0.29–0.53
Unknown 13 6 46.2% 1.56 0.52–0.46 1.92 0.63–5.80
Women German Origin 347 95 27.4% 0.69## 0.54–0.87 0.70## 0.55–0.90
non-German Origin 901 168 18.6% 0.42# 0.35–0.50 0.44# 0.35–0.54
Unknown 59 9 15.3% 0.33## 0.16–0.67 0.34## 0.17–0.70
Unknown Men German Origin 960 236 24.6% 0.59# 0.51–0.69 0.67# 0.57–0.79
non-German Origin 351 67 19.1% 0.43# 0.33–0.56 0.48# 0.36–0.63
Unknown 405 116 28.6% 0.73## 0.58–0.91 0.80 0.62–1.03
Women German Origin 128 24 18.8% 0.42# 0.27–0.66 0.46# 0.30–0.73
non-German Origin 112 26 23.2% 0.58## 0.35–0.86 0.58## 0.37–0.91
Unknown 92 20 21.7% 0.50## 0.31–0.83 0.54## 0.32–0.90
Region of presumed infection
Germany 7,124 2,346 32.9% (ref) (ref)
Abroad 1,803 387 21.5% 0.56# 0.49–0.63 0.87 0.74–1.02
Unknown 1,330 351 26.4% 0.73# 0.64–0.83 0.97 0.83–1.14
Age group
< 25 years 1,216 523 43.0% (ref) (ref)
25–34 years 3,443 1,091 31.7% 0.61# 0.54–0.70 0.63# 0.55–0.72
35–44 years 2,986 846 28.3% 0.52# 0.46–0.60 0.53# 0.46–0.61
45–54 years 1,838 470 25.6% 0.46# 0.39–0.53 0.45# 0.39–0.53
> =55 years 774 154 19.9% 0.33# 0.27–0.41 0.34# 0.28–0.421 MSM men who have sex with men2 IDU persons who are intravenous drug users3 HET persons with heterosexual contact°95% CI: 95% Confidence interval*OR: odds ratio# p-value: p < =0.001## p-value: p < =0.05
Hofmann et al. BMC Infectious Diseases (2017) 17:484 Page 9 of 13
43

Men who have sex with men (MSM) are the groupmost at risk for HIV infection in the European Union(EU)/European Economic Association (EEA), as well asin the United States, despite targeted prevention pro-grammes since the beginning of the HIV epidemic [36].MSM are also the group in Germany with the highestproportion of newly diagnosed cases of recent HIV infec-tion, similar to other European countries which used theBED-CEIA [32, 33] or other serological tests [34, 37].It is recommended that persons at risk for HIV infec-
tion - such as MSM - should be tested at least once ayear or even more often, depending on their risk behav-iour [38, 39]. This may result in a higher proportion ofrecently diagnosed HIV infections. It is known that theawareness, knowledge and perceived level of personalrisk for HIV infection among MSM is high, which mightbe one reason for regular test seeking and the high pro-portion of recent HIV infection we found in this group.Even though they test more regularly than do othergroups with risky behaviour, the proportion of recentHIV infections among MSM should be much higher. Ina recent German MSM online survey, approximately60% of the questioned MSM were tested within the pre-vious 12 months, and approximately 53% said they aregetting tested on a regular basis [40]. However, nearlytwo-thirds (65%) of MSM who were newly diagnosedwith HIV were diagnosed later than 6 months after theinfection occurred. Reasons for late diagnosis may varyamong different groups. The fear of stigmatization, alarge geographical distance to the next anonymous test-ing site, or a lack of risk awareness may be related toHIV testing behaviour, especially among MSM [40].The lack of risk awareness might also be the reason forthe low proportion of recent HIV infections amongHET. To improve testing frequency in groups withrisky behaviour, such as MSM, IDU or HET, preventionprogrammes should include the importance of regularand easy access to HIV testing sites and increase theawareness of risks.Female intravenous drug users also showed a high pro-
portion of newly diagnosed cases with recent HIV infec-tion. We also found that female drug users of Germanorigin had a higher chance than MSM for having a re-cent HIV infection. The high proportion of recent HIVinfections might be related to the fact that women moreoften seek contact with the health care system or arebetter reached by testing offers for HIV or Hepatitis Cduring opioid substitution therapy. However, as thenumbers in this sub-group were small due to the smallgroup size, we believe that the result of the logistic re-gression may be related to statistical chance, and theassociated results must be interpreted carefully and shouldbe further observed in the following years. Nevertheless,this result shows the importance of adapted prevention
programmes. All persons with risky sexual behaviourshould be offered an HIV test regularly, whenever theyhave contact with the health care system. However, anHIV test should not only be offered by contact with thehealth care system, e.g. HIV/STI outreach clinics, it alsoshould be included in harm reduction programmes fordrug users and offered in low threshold drug services.Despite the continuous roll-out of HIV testing campaigns,services still need to improve the offers and the facilitiesfor HIV testing to reduce late presentation.The proportion of recent HIV infections decreased
with age, meaning that long-standing infections werefound more often in older age groups. This trend wasalso observed in other studies [33, 34, 37, 41]. The timebetween infection and diagnosis is usually shorter inyounger persons; nevertheless, the proportion of recentHIV infection in persons older than 55 years is stillnearly 24%, indicating that there is ongoing HIV-transmission in older age groups.Persons who originated from abroad more often had a
long-standing infection than did German natives. Thiscould mean that most of these cases were infected andpotentially diagnosed in their home country, but thecases were also diagnosed in Germany for the first timeand thus reported by the laboratories as newly diagnosedin Germany. Another explanation might be that thesepeople did not know about their infection and that theyhad not been reached appropriately by prevention pro-grammes and testing strategies in Germany. To preventHIV infections among persons from abroad, the preven-tion programmes have to be tailored in a way to reachthose hard-to-reach groups. To improve understandingregarding persons originating from sub-Saharan Africaand living in Germany, a study was established in 2014at the RKI that aimed to identify their specific needs andtheir knowledge about HIV in order to address sustain-able prevention in this sub-group in Germany [42].The proportion of recent infections among newly diag-
nosed cases increased over the time period. This couldsuggest a real increase in HIV infections. However, thisincrease is not reflected by the total number of newlydiagnosed infections, which remained fairly stable overthe past years [31]. Therefore, the increase in recentinfections could reflect more specific testing during thattime period. In Germany, data are only available regard-ing HIV diagnoses but not regrading negative test resultsor the total number of HIV tests performed. It is there-fore impossible to draw firm conclusions on rates solelybased on recency testing among newly diagnosed HIVcases without knowledge of the testing rates.
LimitationsThere are some limitations to our analysis. First, the inter-pretation of the proportion of recent infections among
Hofmann et al. BMC Infectious Diseases (2017) 17:484 Page 10 of 13
44

newly diagnosed HIV cases depends on testing patternsand the number of persons tested for HIV. There is onlylimited information available about the total number ofpersons tested in Germany. A study among HIV diagnos-tic laboratories estimated that approximately 1,6 millionHIV screening tests were performed in 2011 [43]. In thatstudy, the participating laboratories could not distinguishbetween performed tests and persons screened, andthe study only had information about performed testsfor one year. Interpreting time trends for HIV recencyin Germany is therefore difficult. The HIV test-seekingpattern might vary between different populations; forexample, MSM are tested more regularly and more fre-quently than other populations. Therefore, a direct esti-mation of the HIV incidence is not possible, and we canonly report the proportion of recent infections amongnewly diagnosed sub-groups over time.Second, the sensitivity and specificity of the BED-CEIA
(81.7%; 89.1%) [15] are quite low, while the reported falserecent rates (FRR) are high (7.4%) depending on the HIV-subtype distribution in the respective countries [44]. How-ever, the BED-CEIA was evaluated using specimens fromthe German HIV-seroconverter cohort, where the date ofinfection was well-defined based on the laboratory diagno-sis [29]. Therefore, the application of the BED assay to theGerman surveillance system is assumed to be valid to re-port the proportion of recent HIV infections among newlydiagnosed HIV cases in Germany. Recently, we adaptedthe validation panel to an updated distribution of HIV-subtypes in Germany in order to re-calculate the FRRinduced by the BED-CEIA, resulting in an FRR of 10% forGermany [45]. Because of the rather high FRR, a testingalgorithm was applied using the recommendation of theECDC [30]. For the reason that CD4 cell counts and viralload measurements are incomplete in the HIV notificationsystem and are only reported in one-third of the notifiedcases, the recommended algorithm could only be usedwith the information about AIDS status. Therefore, the re-ported recent HIV infections may still be overestimated.Data to correct false long-standing test results are notavailable in the German HIV surveillance system; there-fore, a correction is not possible. This might introduce anerror into the data, because we might overestimate caseswith long-standing infection. In 2016, we implemented amulti-assay algorithm, including the BED-CEIA and anavidity assay, to address this limitation.
ConclusionsIn conclusion, the surveillance of recent HIV infectionsis a useful additional tool to monitor the HIV epidemicin Germany. It allows the observation of ongoing HIVtransmission in Germany, and we identified (sub) popu-lations at risk who can now be addressed more speci-fically in prevention programs, such as offering more
frequent HIV-testing to those populations at risk. Wecould also identify factors associated with recent HIV in-fection, such as age, transmission group and origin. Anearly diagnosis is important for preventing new infec-tions. Furthermore, the information gained through thispart of the HIV surveillance programme can improvethe statistical estimation models of the prevalence andincidence of HIV in Germany.However, there is still the potential to improve the sur-
veillance of recent HIV infections, for example, byimplementing serological tests for recent infections witha higher sensitivity and specificity or to apply two sero-logical tests in a multi-assay algorithm to achieve a moreaccurate proportion of recent HIV infections among thenewly diagnosed HIV cases in Germany. It is also im-portant to have a valid and accurate documentation ofclinical data (such as CD4 count and virus load) to cor-rect falsely identified recent or long-standing infections,as is recommended internationally. Additionally, to cal-culate the HIV incidence in Germany, it is important toinclude the total number of persons tested for HIV inGermany into the surveillance of recent HIV infections.
Abbreviations95% CI: 95% confidence interval; AIDS: acquired immunodeficiencysyndrome; BED-CEIA: BED-capture-enzyme immunoassay; CDC: Centers forDisease Control and Prevention; DPS: dried plasma spots; DSS: dried serumspots; ECDC: European Centre for Disease Prevention and Control;EEA: European Economic Association; EU: European Union; FLS: false long-standing; FRR: false recent rate; HET: persons with heterosexual contacts;HIV: human immunodeficiency virus; IDU: persons who are intravenous drugusers; MSM: men who have sex with men; OR: odds ratio; RITA: recent testalgorithm; RKI: Robert Koch- Institute; TRI: test for recent (HIV) infections
AcknowledgementsWe would like to thank all participating laboratories for sending us driedfilter spots for laboratory analysis and for the continuous exchange of ideasand suggestions. All participating laboratories who agreed to publish theirnames are listed at http://www.rki.de/DE/Content/InfAZ/H/HIVAIDS/Studien/InzSurv_HIV/beteiligte_Labore.html. Without them, the project would nothave led to the present results. We would like to thank all participating staffat the RKI who were involved in the realization of the studies, especially thelaboratory assistants for executing the BED-CEIA and the medicaldocumentation officers for data entry and data quality control.
Availability of data and materialsThe dataset supporting the conclusions of this article is available in theZenodo repository: http://doi.org/10.5281/zenodo.260114.
FundingThe nationwide cross-sectional incidence study (2008–2010) and the“Surveillance of recent HIV infections” (2011–2014) were funded by theGerman Federal Ministry of Health.
Authors’ contributionsAH, RZ, CSH, BB, and AHau analysed and interpreted the data. AH, RZ,CSH, BB, and AHau wrote the paper. RZ, OH, CSH, CK, and BBcontributed to the conception and the design of the studies. JBFdesigned and planned the nationwide cross-sectional incidence study.SW implemented the BED-CEIA in Germany. CK, AHau and SW testedDSS/DPS samples for recency of infection and interpreted the testresults. RZ, CSH, AHau, NB, BB, VB, OH, and CK revised the articlecritically and OH, NB, VB, and BB gave the final approval for publishingthe article. All authors read and approved the final manuscript.
Hofmann et al. BMC Infectious Diseases (2017) 17:484 Page 11 of 13
45

Ethics approval and consent to participateEthical approval for the nationwide cross-sectional study was givenby the ethics board at the Charité, University Medicine, Berlin, andapproval was also granted by the data protection office of Germanyaccording to the Federal Data Protection Act. The DSS/DPS samplesused were residuals from routine HIV diagnostic processes; therefore,no informed consent was obtained from the patients. Furthermore, theDSS/DPS samples cannot be linked to individuals because the HIVnotification system is strictly anonymous. Additionally, the BED-CEIA isonly accredited for epidemiological studies and not for individualdiagnosis. Therefore, no extra benefit can be obtained by informingpersons about positive BED-CEIA test results.
Consent for publicationNot applicable.
Competing interestsThe authors declare that they have no competing interests.
Publisher’s NoteSpringer Nature remains neutral with regard to jurisdictional claims inpublished maps and institutional affiliations.
Author details1Department for Infectious Disease Epidemiology, Unit 34 HIV/AIDS, STI andBlood-Borne Infections, Robert Koch-Institute, Seestr.10, 13353 Berlin,Germany. 2Charité, Universitätsmedizin, Berlin, Germany. 3Department ofInfectious Diseases, Unit 18 HIV and Other Retroviruses, Robert Koch-Institute,Nordufer 20, 13353 Berlin, Germany. 4Central Research Institute ofAmbulatory Health Care in Germany (Zi), Berlin, Germany. 5SGS Belgium NV,Generaal De Wittelaan 19, B-2800 Mechelen, Belgium. 6Department forInfectious Disease Epidemiology, Robert Koch-Institute, Seestr.10, 13353Berlin, Germany.
Received: 26 January 2017 Accepted: 3 July 2017
References1. Robert Koch-Institut. Schätzung der Prävalenz und Inzidenz von HIV-
Infektionen in Deutschland, Stand Ende 2014 Epidemiologisches Bulletin2015;45(2015).
2. Hamouda O. HIV/AIDS surveillance in Germany. J Acquir Immune DeficSyndr. 2003;32(Suppl 1):49–54.
3. Batzing-Feigenbaum J, Kollan C, Kuhne A, Matysiak-Klose D, Gunsenheimer-Bartmeyer B, Hamouda O, et al. Cohort profile: the German ClinSurv HIVproject - a multicentre open clinical cohort study supplementing nationalHIV surveillance. HIV Med. 2010;
4. Zu Knyphausen F, Scheufele R, Kucherer C, Jansen K, Somogyi S, Dupke S,et al. First line treatment response in patients with transmitted HIV drugresistance and well defined time point of HIV infection: updated resultsfrom the German HIV-1 seroconverter study. PLoS One. 2014;9(5):e95956.
5. Robert Koch-Institut. Weiterführende Analysen zur HIV-Inzidenz- und-Prävalenzschätzung 2012. Epidemiologisches Bulletin. 2013;45:457–64.
6. Janssen RS, Satten GA, Stramer SL, Rawal BD, O'Brien TR, Weiblen BJ, et al.New testing strategy to detect early HIV-1 infection for use in incidenceestimates and for clinical and prevention purposes. JAMA. 1998;280(1):42–8.
7. Murphy G, Parry JV. Assays for the detection of recent infections withhuman immunodeficiency virus type 1. Euro Surveill. 2008; 13(36).
8. Guy R, Gold J, Calleja JM, Kim AA, Parekh B, Busch M, et al. Accuracy ofserological assays for detection of recent infection with HIV andestimation of population incidence: a systematic review. Lancet InfectDis. 2009;9(12):747–59.
9. Busch MP, Pilcher CD, Mastro TD, Kaldor J, Vercauteren G, Rodriguez W, etal. Beyond detuning: 10 years of progress and new challenges in thedevelopment and application of assays for HIV incidence estimation. AIDS(London, England). 2010;24(18):2763–71.
10. Curtis KA, Kennedy MS, Charurat M, Nasidi A, Delaney K, Spira TJ, et al.Development and characterization of a bead-based, multiplex assay forestimation of recent HIV type 1 infection. AIDS Res Hum Retrovir. 2012;28(2):188–97.
11. Thomas HI, Wilson S, O'Toole CM, Lister CM, Saeed AM, Watkins RP, et al.Differential maturation of avidity of IgG antibodies to gp41, p24 and p17following infection with HIV-1. Clin Exp Immunol. 1996;103(2):185–91.
12. Kothe D, Byers RH, Caudill SP, Satten GA, Janssen RS, Hannon WH, et al.Performance characteristics of a new less sensitive HIV-1 enzymeimmunoassay for use in estimating HIV seroincidence. J Acquir ImmuneDefic Syndr. 2003;33(5):625–34.
13. Rawal BD, Degula A, Lebedeva L, Janssen RS, Hecht FM, Sheppard HW, et al.Development of a new less-sensitive enzyme immunoassay for detection ofearly HIV-1 infection. J Acquir Immune Defic Syndr. 2003;33(3):349–55.
14. Barin F, Meyer L, Lancar R, Deveau C, Gharib M, Laporte A, et al.Development and validation of an immunoassay for identification of recenthuman immunodeficiency virus type 1 infections and its use on driedserum spots. J Clin Microbiol. 2005;43(9):4441–7.
15. Parekh BS, Kennedy MS, Dobbs T, Pau CP, Byers R, Green T, et al.Quantitative detection of increasing HIV type 1 antibodies afterseroconversion: a simple assay for detecting recent HIV infection andestimating incidence. AIDS Res Hum Retrovir. 2002;18(4):295–307.
16. Suligoi B, Galli C, Massi M, Di Sora F, Sciandra M, Pezzotti P, et al. Precision andaccuracy of a procedure for detecting recent human immunodeficiency virusinfections by calculating the antibody avidity index by an automatedimmunoassay-based method. J Clin Microbiol. 2002;40(11):4015–20.
17. Masciotra S, Dobbs T, Candal D, Hanson D, Delaney K, editors. Antibodyavidity-based assay for identifying recent HIV-1 infections Based on GeneticSystems [TM] 1/2 Plus O EIA2010 16.-19.2.2010 17th Conference onRetroviruses and Opportunistic Infections.
18. Wei X, Liu X, Dobbs T, Kuehl D, Nkengasong JN, Hu DJ, et al. Developmentof two avidity-based assays to detect recent HIV type 1 seroconversionusing a multisubtype gp41 recombinant protein. AIDS Res Hum Retrovir.2010;26(1):61–71.
19. Suligoi B, Rodella A, Raimondo M, Regine V, Terlenghi L, Manca N, et al. Avidityindex for anti-HIV antibodies: comparison between third- and fourth-generation automated immunoassays. J Clin Microbiol. 2011;49(7):2610–3.
20. Chawla A, Murphy G, Donnelly C, Booth CL, Johnson M, Parry JV, et al.Human immunodeficiency virus (HIV) antibody avidity testing to identifyrecent infection in newly diagnosed HIV type 1 (HIV-1)-seropositive personsinfected with diverse HIV-1 subtypes. J Clin Microbiol. 2007;45(2):415–20.
21. Hu DJ, Vanichseni S, Mock PA, Young NL, Dobbs T, Byers RH Jr, et al. HIV type 1incidence estimates by detection of recent infection from a cross-sectionalsampling of injection drug users in Bangkok: use of the IgG capture BEDenzyme immunoassay. AIDS Res Hum Retrovir. 2003;19(9):727–30.
22. Kim AA, McDougal JS, Hargrove J, Rehle T, Pillay-Van Wyk V, Puren A, et al.Evaluating the BED capture enzyme immunoassay to estimate HIVincidence among adults in three countries in sub-Saharan Africa. AIDS ResHum Retrovir. 2010;26(10):1051–61.
23. Scheer S, Nakelsky S, Bingham T, Damesyn M, Sun D, Chin CS, et al.Estimated HIV incidence in California, 2006-2009. PLoS One. 2013;8(2):e55002.
24. Bätzing-Feigenbaum J, Loschen S, Gohlke-Micknis S, Hintsche B, Rausch M,Hillenbrand H, et al. Implications of and perspectives on HIV surveillanceusing a serological method to measure recent HIV infections in newlydiagnosed individuals: results from a pilot study in berlin, Germany, in2005&2007. HIV Medicine. 2009;10(4):209–18.
25. Batzing-Feigenbaum J, Loschen S, Gohlke-Micknis S, Zimmermann R,Herrmann A, Kamga Wambo O, et al. Country-wide HIV incidence studycomplementing HIV surveillance in Germany. Euro Surveill. 2008;13(36).
26. Santos-Hovener C, Zimmermann R, Kucherer C, Batzing-Feigenbaum J, WildnerS, Hamouda O, et al. Conversation about Serostatus decreases risk of acquiringHIV: results from a case control study comparing MSM with recent HIVinfection and HIV negative controls. BMC Public Health. 2014;14:453.
27. Calypte. Aware™ BED™ EIA HIV-1 Incidence Test (IgG-Capture HIV-EIA).Enzyme Immunoassay for Population Esitmates of HIV-1 Incidence. Portland,USA: Calypte Biomedical Corporation; 2008.
28. Sedia Biosciences Corporation. Sedia™ BED HIV-1 Incidence EIA. EnzymeImmunoassay for Population Esitmates of HIV-1 Incidence. Portland, USA:Sedia Biosciences Corporation; 2014.
29. Loschen S, Batzing-Feigenbaum J, Poggensee G, Cordes C, Hintsche B,Rausch M, et al. Comparison of the human immunodeficiency virus (HIV)type 1-specific immunoglobulin G capture enzyme-linked immunosorbentassay and the avidity index method for identification of recent HIVinfections. J Clin Microbiol. 2008;46(1):341–5.
Hofmann et al. BMC Infectious Diseases (2017) 17:484 Page 12 of 13
46

30. European Centre for Disease Prevention and Control. Monitoring recentlyacquired HIV infections in the European context. Stockholm: ECDC; 2013[cited 2016 Jan 25]. Available from: http://www.ecdc.europa.eu/en/publications/Publications/monitoring-recently-acquired-HIV-infections-european-context.pdf.
31. Robert Koch-Institut. HIV-Diagnosen und AIDS-Erkrankungen in Deutschland:Bericht zur Entwicklung im Jahr 2014 aus dem Robert Koch-Institut.Epidemiologisches Bulletin. 2015;27(2015).
32. Romero A, Gonzalez V, Esteve A, Martro E, Matas L, Tural C, et al.Identification of recent HIV-1 infection among newly diagnosed cases inCatalonia, Spain (2006-08). Eur J Pub Health. 2012;22(6):802–8.
33. Widgren K, Skar H, Berglund T, Kling AM, Tegnell A, Albert J. Delayed HIVdiagnosis common in Sweden, 2003-2010. Scand J Infect Dis. 2014;46(12):862–7.
34. Aghaizu A, Murphy G, Tosswill J, DeAngelis D, Charlett A, Gill ON, et al.Recent infection testing algorithm (RITA) applied to new HIV diagnoses inEngland, Wales and Northern Ireland, 2009 to 2011. Euro Surveill. 2014;19(2).
35. Le Vu S, Le Strat Y, Barin F, Pillonel J, Cazein F, Bousquet V, et al. Population-based HIV-1 incidence in France, 2003-08: a modelling analysis. LancetInfect Dis. 2010;10(10):682–7.
36. De Cock KM, Jaffe HW, Curran JW. The evolving epidemiology of HIV/AIDS.AIDS (London, England). 2012;26(10):1205–13.
37. Semaille C, Cazein F, Pillonel J, Lot F, Le Vu S, Pinget R, et al. Four years ofsurveillance of recent HIV infections at country level, France, mid 2003–2006: experience and perspectives. Euro Surveill. 2008;13(36).
38. Gokengin D, Geretti AM, Begovac J, Palfreeman A, Stevanovic M, TarasenkoO, et al. 2014 European guideline on HIV testing. Int J STD AIDS. 2014;25(10):695–704.
39. Arbeitsgemeinschaft der Wissenschaftlichen MedizinischenFachgesellschaften, Deutsche STI-Gesellschaft, Robert Koch-Institut,Bundeszentrale für gesundheitsliche Aufklärung, Landeszentrum GesundheitNordrgein-Westfalen. [S1 Guidline: STI/STD- Counselling, Diagnostic andTherapy] 2015 [cited 2016 Jan 25]. Available from: http://www.awmf.org/uploads/tx_szleitlinien/059-006l_S1_STI_STD-Beratung_2015-07.pdf.
40. Marcus U, Gassowski M, Kruspe M, Drewes J. Recency and frequency of HIVtesting among men who have sex with men in Germany and socio-demographic factors associated with testing behaviour. BMC Public Health.2015;15:727.
41. Romero A, Gonzalez V, Granell M, Matas L, Esteve A, Martro E, et al. Recentlyacquired HIV infection in Spain (2003-2005): introduction of the serologicaltesting algorithm for recent HIV seroconversion. Sex Transm Infect. 2009;85(2):106–10.
42. Robert Koch-Institut. [Knowledge Attitude Behavior Study about HIV and STITesting in Germany for migrants from Sub-Saharan-Africa (MISSA)] Berlin:Robert Koch-Institut; 2015 [cited 2016 Feb 25]. Available from: http://www.rki.de/DE/Content/InfAZ/H/HIVAIDS/Studien/MiSSA/MiSSA_node.html.
43. Robert Koch-Institut. HIV-Nennerstudie: Online Laborbefragung zurBestandsaufnahme der HIV-Diagnostik in Deutschland 2011.Epidemiologisches. Bulletin. 2015;07(15):47–50.
44. Kassanjee R, Pilcher CD, Keating SM, Facente SN, McKinney E, Price MA, etal. Independent assessment of candidate HIV incidence assays onspecimens in the CEPHIA repository. AIDS (London, England). 2014;28(16):2439–49.
45. Hauser A, Hofmann A, Meixenberger K, Somogyi S, Bartmeyer B, Jansen K,et al., editors. Comparing a ‘Multi Assay Algorithm’ with the BED CaptureEnzyme Immunoassay for the testing of recent HIV-1 infections in Germany.15th European AIDS Conference; 2015 21.10–24.10.2015; Barcelona, Spain.
• We accept pre-submission inquiries
• Our selector tool helps you to find the most relevant journal
• We provide round the clock customer support
• Convenient online submission
• Thorough peer review
• Inclusion in PubMed and all major indexing services
• Maximum visibility for your research
Submit your manuscript atwww.biomedcentral.com/submit
Submit your next manuscript to BioMed Central and we will help you at every step:
Hofmann et al. BMC Infectious Diseases (2017) 17:484 Page 13 of 13
47

Publikation 2
Hauser A, Hofmann A, Hanke K, Bremer V, Bartmeyer B, Kuecherer C, Bannert N.: National
molecular surveillance of recently acquired HIV infections in Germany, 2013 to 2014. Euro
Surveill. 2017;22(2). DOI: 10.2807/1560-7917.ES.2017.22.2.30436. Impact factor: 7,127 für 2017
(Quelle: Journal Citation Reports)
48

1www.eurosurveillance.org
Surveillance and outbreak report
National molecular surveillance of recently acquired HIV infections in Germany, 2013 to 2014
A Hauser ¹ , A Hofmann 2 3 , K Hanke ¹ , V Bremer ² , B Bartmeyer ² , C Kuecherer ¹ , N Bannert ¹ 1. Division of HIV and Other Retroviruses, Robert Koch Institute, Berlin, Germany2. Division of HIV/AIDS, STI and Blood-borne Infections, Robert Koch Institute, Berlin, Germany3. Charité – Universitätsmedizin, Berlin, GermanyCorrespondence: Norbert Bannert ([email protected])
Citation style for this article: Hauser A, Hofmann A, Hanke K, Bremer V, Bartmeyer B, Kuecherer C, Bannert N. National molecular surveillance of recently acquired HIV infections in Germany, 2013 to 2014. Euro Surveill. 2017;22(2):pii=30436. DOI: http://dx.doi.org/10.2807/1560-7917.ES.2017.22.2.30436
Article submitted on 01 February 2016 / accepted on 23 August 2016 / published on 12 January 2017
To enable an up-to-date molecular analysis of human immunodeficiency virus (HIV) genotypes circulating in Germany we have established a surveillance system based on recently acquired HIV infections. New HIV infections are reported to the Robert Koch Institute as a statutory duty for anonymous notification. In 2013 and 2014, a dried serum spot (DSS) sample was received from 6,371 newly diagnosed HIV-cases; their analysis suggested that 1,797 samples originated from a recent infection. Of these, 809 were success-fully genotyped in the pol region to identify transmit-ted drug resistance (TDR) mutations and to determine the HIV-1 subtype. Total TDR was 10.8%, comprising 4.3% with mono-resistance to nucleoside reverse tran-scriptase inhibitors (NRTIs), 2.6% to non-NRTIs, 3.0% to protease inhibitors and 0.6% and 0.2%, respec-tively, with dual- and triple-class resistances. HIV-1 subtype B was most prevalent with 77.0%. Non-B infections were identified more often in men and women with heterosexual transmission compared with intravenous drug users or men who have sex with men (79% and 76%, 33%, 12%; all p < 0.05). Non-B subtypes were also more frequently found in patients originat-ing from countries other than Germany (46% vs 14%; p < 0.05) and in patients infected outside of Germany (63% vs 14%; p < 0.05).
IntroductionContinuous molecular HIV surveillance provides valu-able public health information concerning the trans-mission of drug-resistant viruses and the dynamics of currently circulating variants. Transmitted drug resist-ance (TDR) has significant clinical consequences as it is associated with an increase in the failure rate of antiretroviral therapy (ART) [1]. With prevalence of TDR (at least one resistance mutation) ranging between 10% and 15% in several European countries and in North America [2-6], the problem is of substantial con-cern. Genotypic resistance testing is therefore recom-mended before commencing first-line treatment [7].
The prevalence of TDR in a country is determined by the history of clinical therapy regimens and the failures resulting from resistance. TDR can vary depending on transmission route, country of origin of the patient and country of infection [6]. From a virological perspective, TDR is largely determined by the persistence of the associated mutation(s). Persistence of those mutations depends mainly on the fitness costs to the virus and on the viral genetic background (e.g. chance of compensa-tory mutations) [8].
Knowledge of currently circulating HIV subtypes in a country and the dynamics of their spread is of epidemi-ological and clinical relevance. This information affects the safety and accuracy of HIV diagnostics and is valu-able for HIV prevention and vaccine development.
The objective of this study was to determine TDR and HIV-1 subtypes in a substantial subset of new HIV-1 infections diagnosed in 2013 and 2014 in Germany. We intended to examine transmissions from a restricted period of time and therefore, only recently acquired infections among the newly diagnosed cases were included. We aimed to analyse TDR and transmitted HIV-1 subtypes in the main transmission groups: men who have sex with men (MSM), persons with het-erosexual contact (HET) and people who inject drugs (PWID), considering sex and origin of the infected indi-vidual and place of infection.
Methods
Clinical samplesThe data protection officer of the RKI and the German Federal Commissioner for Data Protection and Freedom of Information approved the study protocol (III-401/008#0016).
49

2 www.eurosurveillance.org
RNA isolation and HIV sequencingHIV RNA from 4 x 100 µL DSS was extracted accord-ing to the manufacturer’s instructions with the manual NucliSense Magnetic Extraction method for samples collected in 2013 or the automated Biomerieux EasyMag platform for samples collected in 2014 (both bioMerieux, Capronne, France). Viral RNA was quanti-fied using an in house LTR RT-TaqMan PCR according to a modified protocol [9]. As concentration controls, serial dilutions of the IIIB strain of HIV-1 in human HIV-negative plasma was dropped onto filter cards (DPS standard). Samples were analysed using a newly designed HIV-1 group M generic RT-PCR system (in house pol RT-PCR) covering the genomic region of HIV-1 protease (AS9–99) and reverse transcriptase (AS1–252) including all resistance-associated positions. The in house pol RT-PCR assay consists of two pol RT-PCRs yielding two overlapping amplicons: a fragment 1 of
576 bp (primer_A: CCCTCARATCACTCTTTggCARCgA, position 2,252–2,276; Primer_B: CCTAATTgAACYTCCCARAARTCYTgAgT, position 2,799–2,827) and a second fragment 2 of 718 bp (Primer_C: AAACAATggCCATTRACAgARgA, position 2,613–2,636; primer_D: CTAAYTTYTgTATRTCATTgACAgTCCA, posi-tion 3,303–3,330). All nucleotide positions refer to sequence of the HXB2 genome (accession number K03455). The detection limit of the in house pol RT-PCR was shown to be equivalent to 1,000 copies/mL DPS standard (highest dilution resulting in 100% posi-tive PCR outcome). Population-based sequencing was performed and a consensus sequence from both frag-ments was obtained.
HIV-1 subtypingThe HIV-1 subtype was assigned by applying the REGA HIV-1 subtyping tool (REGA HIV Subtyping Tool Version
Figure 1Prevalence of transmitted drug resistance mutations by drug class (A) and predicted susceptibility to antiretroviral drugs by level of resistance (B) in the study population, Germany, 2013–14 (n = 809)
B. Susceptibility by resistance level
0 2 4 6
ATV/r
DRV/r
FPV/r
IDV/r
LPV/r
NFV
SQV/r
TPV/r
EFV
ETR
NVP
RPV
3TC
ABC
AZT
D4T
DDI
FTC
TDF
Resistance to specific drugs (%)
Low and intermediate resistanceHigh resistance
PI
NRTI
NNRTI
A. Mutations by drug class
0 1 2 3
M46IL
I50LV
F53LY
V82ACFLTMS
I85V
L90M
K101EP
K103NS
Y181CIV
Y188CHL
G190AES
M41L
D67EGN
T69D
V75AMTS
Y115F
M184IV
T215CDEISV
K219ENQR
Frequency of resistance mutation (%)
PI
NRTI
NNRTI
NRTI: nucleoside reverse transcriptase inhibitors; NNRTI: non-nucleoside reverse transcriptase inhibitors; PI: protease inhibitor.
Panel B: Prediction according to Stanford SIR algorithm: intermediate levels of resistance (light colours) and high levels of resistance (dark colours); low and potentially low levels are not indicated.
50

3www.eurosurveillance.org
3.0) and COMET HIV-1 (Version 1.0) [10] to the pol sequence. Only subtype classifications based on boot-strap values of > 70% in the tree topology were taken into account. In cases where a subtype or circulating recombinant form (CRF) was not assigned by either subtyping tool, the strain was classified as unique recombinant form (URF). In addition, a distance-based neighbour-joining method and bootstrap (PHYLIP ver-sion 3.6) was calculated using an extended panel of subtype reference sequences from the Los Alamos HIV sequence database.
HIV drug resistance interpretation and calculation of the prevalence of transmitted drug resistanceThe World Health Organization (WHO)’s surveillance drug resistance mutations (SDRM) list was used to interpret TDR [11]. Levels of expected resistance to each of the three drug classes nucleoside reverse tran-scriptase inhibitors (NRTI), non-nucleoside reverse transcriptase inhibitors (NNRTI) and protease inhibi-tors (PI) as mono, dual or triple class resistance were predicted using the Stanford algorithm (version 7.0). Three levels of resistance were scored: high (R), inter-mediate (I, intermediate and low), sensitive (S, poten-tially resistant and sensitive).
Statistical analysisDescriptive statistics for continuous variables were calculated as medians and interquartile ranges (IQR). Differences in proportions, odds ratios (OR) and 95% confidence intervals (CI) were assessed by two-sided Fisher’s exact test using EPICALC 2000 software (ver-sion 1.02; Gilman and Myatt 1997). A two-sided p value ≤ 0.05 was considered significant.
Results
Characterisation of the study populationIn 2013 and 2014, a total of 6,371 DSS prepared from residual serum of newly HIV-diagnosed cases were submitted to the RKI along with the anonymous report. Of these, 2,034 (32%) were serologically classified as recent HIV infections using the BED-CEIA. The viral load was reported for 700 and a CD4+ T-cell count for 543 of the 2,034 specimens. Specimens with CD4+ T-cell counts < 200 cells/µL (n = 108) or viral loads < 400 cop-ies/mL (n = 50) or both (n=8) were reclassified as ‘long-standing infections’ and, together with repeatedly reported cases (n = 71), excluded, resulting in 1,797 DSS. Sufficient material (four serum spots à 100 µL) was available for 1,387 of those specimens. The pol RT-PCR amplification and sequencing was successful in 809 samples; these represented the final study panel of recent HIV infections. A viral load was reported for 298 of 809 cases, with a median of 184,481 copies/mL (IQR: 45,405–983,158). Among these 298 cases, CD4+ T-cell counts were available for 214, with a median of 357 cells/µL (IQR: 278–487). The proportional dis-tribution of recently infected cases analysed by sex, transmission routes, country of origin and country of
Figure 2Subtype distribution (A) in the main transmission groups and (B) by country of origin, Germany, 2013–14 (n = 809)
B.
0%
10%
20%
30%
40%
50%
60%
70%
80%
90%
100%
Germany Eastern Europe
Western Europe
Central Europe
(excluding Germany)
Africab Americac Asiad Not reported
A.
0%
10%
20%
30%
40%
50%
60%
70%
80%
90%
100%
MSM HET HET_m HET_f PWID Notreported
Reported
497na= 65 19 46 21 220 583
485ne= 27 28 36 31 17 14 166
CRF_URF
CRF02_AG
CRF01_AE
G
F
D
C
B
A
HET: persons with heterosexual contact; HET_f: female persons with heterosexual contact; HET_m: male persons with heterosexual contact; MSM: men who have sex with men; PWID: people who inject drugs.
a Transmission group `other´(n=6, see Table 1) was excluded from the data set.
b Patients from the Middle East, North and sub-Saharan Africa.
c Patients from North and Latin America.
d Patients from South and South-east Asia.
e Two patients from the Caribbean, one patient from Oceania and two patients with unknown non-German origin were excluded.
51

4 www.eurosurveillance.org
infection extracted from sociodemographic data sub-mitted with the notification form are shown in Table 1.
Prevalence of transmitted drug resistanceThe overall prevalence of TDR in patients with recently acquired HIV infection diagnosed in 2013 and 2014 was 10.8% (n = 87/809; 95% CI: 8.8–13.1). This comprised mono-resistance to NRTIs in 4.3% (35/809; 95% CI: 3.1–6.0) of the patients, to NNRTIs in 2.6% (21/809; 95% CI: 1.7–4.0) and to PIs in 3.0% (24/809; 95% CI: 2.0–4.5) of cases. Dual and triple class resistance was identified in 0.6% (n = 4 NRTI/NNRTI; n = 1 NNRTI/PI) and 0.2% (n = 2 NRTI/NNRTI/PI) of the patients, respec-tively (Table 2).
Of all 52 NRTI-associated mutations identified, 46 were thymidine analogue mutations (TAM), namely: the revertants of T215Y (T215CDEISV; 2.3%; 19/809), M41L (2.2%; 15/809), K219ENQR (0.9%; 7/809) and D67EGN (0.6%; 5/809). TAM were selected by the thymidine analogues and conferred intermediate resistance to azidothymidine (AZT) and stavudine (D4T). The most prevalent NNRTI resistance mutations were K103N and K103S (2.5%; 20/809), selected by first generation NNRTIs. The PI-selected resistance mutations M46I and M46L were present at a level of 1.6% (13/809) associ-ated with resistance to a broad spectrum of PIs: ataza-navir/ritonavir (ATV/r), fosamprenavir (FPV/r), indinavir (IDV/r), lopinavir (LPV/r), nelfinapir (NFV) and triprana-vir (TPV/r). The PI-selected resistance mutations L90M (resistance to LPV/r, ATV/r, saquinavir (SQV)/r, IDV/r, NFV) and V82ACFLTMS (resistance to FPV/r, TPV/r, IDV/r, LPV/r, ATV/r) were present at levels of 0.7% (6/809) and 0.9% (7/809), respectively (Figure 1A and B).
Drug resistance mutations observed in transmitted HIV strains mainly induced intermediate levels of resistance to NRTI and PI (mainly resistance-associated singleton mutations). High levels of resistance were frequently observed to the NNRTIs efavirenz (EFV) and nevirap-ine (NVP) and were caused primarily by the prevalent resistance mutation K103N (Figure 1B).
We found no correlation between TDR and sex, trans-mission group, origin of patient or country of infection in general or for any resistance class (all p values > 0.05) (Table 2).
Prevalence of HIV-1 subtypesThe most prevalent HIV-1 subtype in the total study population (n = 809) was subtype B with 77.0% (623/809; 95% CI: 73.9–79.8), while 23.0% of HIV-1 infections (186/809; 95% CI: 20.2–26.1) were caused by non-B subtypes including A (5.1%, 41/809), C (3.6%, 29/809), D (0.7%, 6/809), F (1.6%, 13/809), G (2.7%, 22/809), CRF01_AE (2.0%, 16/809) and CRF02_AG (3.3%, 27/809) as well as 4.0% (32/809) other rare CRFs (06_cpx, 07_BC, 12_BF, 18_cpx, 19_cpx, 34_01B, 35_AD, 44_BF, 49_cpx) and URFs. These rare CRFs
Figure 3Prevalence of HIV-1 subtypes stratified by (A) main transmission groups and (B) origin of patient, Germany 2013–14 (n = 809)
A B C D F G
CRF01_AG
CRF02_AG
CRF_URF
B.
0%
10%
20%
30%
40%
50%
60%
70%
80%
90%
100%
Not reported
Asiab
Americac
Africad
Central Europe (excluding Germany)
Western Europe
Eastern Europe
Germany
41ne= 626 29 6 13 24 16 27 32
A.
0%A B C D F G
CRF01_AG
CRF02_AG
CRF_URF
10%
20%
30%
40%
50%
60%
70%
80%
90%
100%
Not reportedOtheraPWIDHETMSM
41n= 623 29 6 13 22 16 27 32
HET: persons with heterosexual contact; MSM: men who have sex with men; PWID: people who inject drugs.
a Transmission group `other´(n=6), see Table 1.
b Patients from South and South-east Asia.
c Patients from North and Latin America.
d Patients from Middle East, North and sub-Sahara Africa.
e Two patients from the Caribbean, one patient from Oceania and two patients with unknown non-German origin were excluded.
52

5www.eurosurveillance.org
were grouped together with the URFs into the rare CRF/URF subgroup.
The subtype distribution in the subset of recent infec-tions with available CD4+ T-cell counts and viral loads (n = 214) was very similar to the overall study popu-lation, with 77.1% (165/214) subtype B and 22.9% (49/214) non-B infections including A (4.2%, 9/214), C (5.1%, 11/214), D (0.9%, 2/214), F (0.9%, 3/214), G (2.8%, 6/214), CRF01_AE (1.9%, 4/214) and CRF02_AG (1.9%, 4/214) as well as 4.7% (10/214) rare CRF/URFs (all p values of pairwise comparisons > 0.2).
HIV-1 subtype B was associated with a significantly higher proportion of TDR (12.0%, 75/623) than the non-B subtypes (6.4%; 12/186; OR: 0.50; 95% CI: 0.27–0.95; p = 0.04), particularly with regard to the NRTI mutations (5.3% in B, 1.1% in non-B, p = 0.01) (Table 2).
With regard to the main transmission groups, MSM were predominantly infected by subtype B, with 87.7% (436/497) which is significantly higher than in PWID (14/21) or in HET (15/65; male HET: 4/19 and female HET 11/46; all p values MSM-PWID-HET < 0.05). In HET, sub-type diversity was high and particularly non-B subtypes A (8/65), C (12/65) and G (8/65) were frequent. In PWID, subtype A (4/21) was the second most prevalent sub-type (after B with 14/21), while subtypes C, D, CRF01_AE and the group of rare CRF/URF were not identified in PWID. Subtype distribution in the group that did not report transmission type mirrored the group that did report transmission type (MSM + HET + PWID), with a
slightly lower proportion of subtype B (70.5%, 155/220 vs 79.8%, 465/583) (Figure 2A). The proportion of sub-type non-B infections in Germans (14.0%, 68/485) was significantly lower than in individuals from other coun-tries (45.6%, 72/158; p < 0.0001). Subtype B was pre-dominant in Germans and in migrants originating from America and western and central Europe (417/485, 15/17, 19/28 and 29/36, respectively). Subtype A was the most frequently subtype identified in eastern Europeans (12/27), while migrants from Africa and Asia were infected with a greater variety of subtypes (Figure 2B).
For the subtypes A, B, F, CRF01_AE and the rare CRF/URF, the main transmission route was MSM (14/41, 436/623, 7/13, 7/16 and 14/32, respectively) while the subtypes C, D and G were mainly transmitted by het-erosexual contacts (12/29, 3/6 and 8/22, respectively) (Figure 3A).
HIV subtype A was mostly identified in Germans (16/41) and eastern European patients (12/41), subtype C and G in Germans (12/29 and 6/22) and Africans (8/29 and 6/22), while for Subtype D and CRF02_AG, no main ori-gin of patients could be identified. The rare CRF/URFs were mainly identified in Germans (14/31) but also in patients originating from other continents (Europe (4/31), Africa (3/31), America (2/31) and Asia (1/31)) (Figure 3B).
A stratification according to the geographical region of acquisition revealed that in Germany (86.2%; 451/523), America (3/5) and in western (14/21) and central Europe (7/12), subtype B infections were mainly acquired. Non-B subtypes were acquired more frequently abroad (62.6%; 57/91) than in Germany (13.8%; 72/523; p < 0.05).
DiscussionWe have established a molecular HIV-1 surveillance strategy based on samples collected in association with the mandatory notification system of new HIV diagnoses in Germany. Analysis of samples was restricted to recent HIV-transmissions with a defined duration of less than 302 days since HIV infection. This approach permitted us to focus on the viruses circu-lating during any given period of time and to estimate current trends in the HIV epidemic, because late pre-senters who acquired an infection before that period were excluded.
The overall TDR prevalence among the 2013 and 2014 study samples was 10.8%. This is largely comparable to previously published cohort studies from Germany and several other western European countries with a long history of combination ART (cART) [3-5] and indi-cates in many respects that the rate of TDR is essen-tially stable: Patients included in the German HIV-1 seroconverter cohort between 1996 and 2010 revealed TDR in 11.9% [5]. Two recent comprehensive epidemio-logical studies involving 26 European countries carried
Table 1Characteristics of patients with recent infection included in molecular HIV surveillance, Germany, 2013–14 (n = 809)
Study population n %Sex Male 718 88.8Female 86 10.6Not reported 5 0.6Transmission group Men who have sex with men 497 61.4Persons with heterosexual contacts 65 8.0Persons with intravenous drug use 21 2.6Other 6 0.7Not reported 220 27.2Country of origin Germany 485 60.0Other 158 19.5Not reported 166 20.5Country of infection Germany 523 64.6Other 91 11.2Not reported 195 24.1
53

6 www.eurosurveillance.org
out on behalf of the SPREAD-programme reported lev-els of 8.9% (95% CI: 8.1–9.8) and 8.3% (95% CI: 7.7–9.5) for the period from 2002 to 2007 [6] and from 2008 to 2010, respectively [12]. Proportions of patients with mono-NRTI, mono-NNRTI, mono-PI, dual- and multi-class resistance (5.0%, 2.9%, 2.5%, 0.8% and 0.4%, respectively) [6] were very similar to our findings (4.3%, 2.6%, 3.0%, 0.6% and 0.2%). In both the SPREAD stud-ies and in ours, the detected NRTI resistance mutations belonged to the TAM (mainly revertants of T215Y, fol-lowed by M41L) selected by AZT and D4T. The most prevalent NNRTI SDRMs were K103NS, and resistance to PIs was mainly due to the mutations L90M and M46IL [6,12]. TAM are very frequent and long-term persisting resistance mutations [8]. De novo selection by current therapies is unlikely because the use of AZT and D4T is declining [13]. We therefore suggest that these have become circulating strains by onward transmission from untreated, and probably undiagnosed, individu-als. While TAM may not have any particular impact on the success of current first-line treatments, K103N and K103S may still be associated with their failure [7].
Sex was not associated with TDR in our study. However, the prevalence of TDR was slightly but not signifi-cantly higher among MSM, in Germans or in individu-als infected in Germany. In studies carried out in some other European countries, the associations between TDR and MSM or subtype B (exhibiting higher TDR lev-els) were significant [6,12,14].
HIV-1 epidemiology is characterised by compartmental-ised subepidemics of subtypes with a dynamic nature. The most prevalent subtype in western European coun-tries is subtype B, mainly as a consequence of multiple introductions via migration, tourism and trade from dif-ferent geographical areas [15]. The lowest proportion of subtype B was reported for Portugal with 48.3% for patients diagnosed between 2006 and 2012 [16] while the highest proportion was observed in Poland with 96.2% for patients diagnosed between 2002 and 2005 [17].
Determinants of subtype distribution are the transmis-sion group, country of origin and country of infection. Subtype B is highly prevalent in MSM, most probably as a result of a founder effect rather than an increased
Table 2Prevalence of transmitted drug resistance to the major antiretroviral drug classes in the study population stratified by relevant subgroups, Germany, 2013–14 (n = 809)
TDR NRTI NNRTI PI Dual Multin % n % n % n % n % n %
Total 87 10.8 35 4.3 21 2.6 24 3.0 5 0.6 2 0.2Sex Male (n = 718) 78 10.9 32 4.5 18 2.5 21 2.9 5 0.7 2 0.3Female (n = 68) 9 10.5 3 3.5 3 3.5 3 3.5 0 0Not reported (n = 5) 0 0 0 0 0 0Transmission group MSM (n = 497) 59 11.9 22 4.4 14 2.8 17 3.4 4 0.8 2 0.4HET (n = 65) 4 6.2 3 4.6 1 1.5 0 0 0PWID (n = 21) 2 9.5 1 4.8 0 1 4.8 0 0Other (n = 6) 0 0 0 0 0 0Not reported (n = 220) 22 10.0 9 4.1 6 2.7 6 2.7 1 0.5 0Country of origin Germany (n = 485) 56 11.5 24 4.9 12 2.5 16 3.3 3 0.6 1 0.2Other (n = 158) 12 7.6 2 1.3 5 3.2 3 1.9 1 0.6 1 0.6Not reported (n = 166) 19 11.4 9 5.4 4 2.4 5 3.0 1 0.6 0Country of infection Germany (n = 523) 63 12.0 23 4.4 15 2.9 18 3.4 5 1.0 2 0.4Other (n = 91) 5 5.5 3 3.3 1 1.1 1 1.1 0 0Not reported (n = 195) 19 9.7 9 4.6 5 2.6 5 2.6 0 0HIV-1 SubtypesB (n = 623) 75 12.0 33 5.3 16 2.6 19 3.0 5 0.8 2 0.3Non-B (n = 186) 12 6.5 2 1.1 5 2.7 5 2.7 0 0
HET: persons with heterosexual contact; HIV: human immunodeficiency virus; MSM: men who have sex with men; NRTI: nucleotide reverse transcriptase inhibitors; NNRTI: non-nucleotide reverse transcriptase inhibitors; PI: protease inhibitor; PWID: people who inject drugs; TDR: transmitted drug resistance.`Not reported´ data were excluded from the pairwise comparisons. All p values of pairwise comparison were > 0.05.
54

7www.eurosurveillance.org
transmission potential of subtype B [18]. Non-B sub-types were significantly more frequently diagnosed in sub-populations originating from and often acquired in countries other than Germany. Most migrants with recent HIV infections carried subtypes dominating in their country of origin [19], suggesting that they may have acquired the infection during a visit to their home countries or within their community in Germany.
Interestingly, a considerable proportion of rare CRF/URFs are present in patients originating from all conti-nents. However, the high proportion of Germans in the non-B clade group, in particular those with subtype A, F and rare CRF/URFs, indicates that non-B strains have become endemic in the German population. Although the number of PWID analysed was low, HIV-1 subtype A was strikingly more common in PWID than in other transmission groups.
One limitation of our study was that the restriction to recently acquired infections over-estimates patient groups that are tested more frequently due to their awareness of transmission risks. This might explain the slightly higher prevalence of MSM among recent infec-tions in our study (61.4%) compared with the notifica-tion data for all (recent and prevalent) newly diagnosed HIV infections in 2013 and 2014 (57.7%) [20]. A second limitation was the overall genotyping success rate of 58% in samples from recent infections. This was mainly due to a lack of serum spots for RNA extraction or to RNA degradation after inappropriate handling or ship-ment. A technical limitation was the expected misclas-sification of long-standing as recent infections due to a false recent rate (FRR) of ca 4.7% for subtype B or even higher for the non-B subtypes, in particular A and D (FRR 18.9 and 18.2%, respectively), using the BED CEIA assay [21]. This may have led to an over-representation of non-B subtypes in the study. Taking into account CD4+ T-cell counts and viral load data as parameters for recency estimation is expected to diminish this bias [22]. Consideration of these clinical parameters that were available for about one third of the samples only marginally reduced the prevalence for the recent non-B infections from 23.0% to 22.9% but, more sig-nificantly, from 5.1% to 4.2% for subtype A, which is generally the most strongly affected by BED misclas-sification. An ancillary analysis of specimens that were reclassified as long-standing infections based on CD4+ T-cell counts < 200 cells/µL and viral loads < 400 copies/mL (n = 72) revealed 33.3% non-B and 11.1% subtype A (data not shown), confirming the anticipated over-representation introduced by the BED ELISA. Based on these data, the lack of CD4+ T-cell counts and viral loads for two thirds of the sample set is estimated to result in an over-representation of non-B subtypes of less than 2.5%. Being one of two commercially avail-able recency tests, the BED CEIA is used worldwide for epidemiological surveillance studies [23-28], although efforts to evaluate and improve serological recency tests are ongoing [21].
ConclusionThe TDR prevalence in recent HIV infections among notified newly diagnosed HIV patients in Germany was still high (> 10%) in 2013 and 2014 and was within the range of other European countries, including the pro-portions of resistance classes. Although the selec-tion for resistant HIV was dramatically reduced by the introduction of cART and new drugs [29], levels of TDR remain stable in all European countries and are still dominated by resistance to NRTI. This is most likely caused by a continued onward transmission of per-sisting NRTI-resistant strains that emerged as a result of failed treatment regimens during the pre-cART era (1987–96) and not by transmission of resistant viruses from patients failing cART. Therefore, genotypic resist-ance testing of HIV before first-line treatment needs to be continued. Since therapy-naïve and probably also undiagnosed patients are the predominant source of TDR, early detection of HIV infection followed by early treatment, as recommended in the current guidelines [7], could reduce the transmission of resistant virus [13,30]. Our data also demonstrate that subtype B remains the most frequently transmitted subtype in Germany because of its high prevalence in MSM.
AcknowledgementsThe authors thank the laboratories participating in the InzSurv and MASTER HIV/HEP projects. We also thank the sequencing facility of the RKI. Many thanks to Steve Norley for proofreading of the manuscript. The study was funded by the German Federal Ministry of Health.
Conflict of interestNone declared.
Authors’ contributionsAndrea Hauser: designed and performed the experiments, collected data, analysed the data, wrote the manuscript. Alexandra Hofmann: collected and analysed data; contribut-ed to the writing of the manuscript. Kirsten Hanke: analysed the data. Viviane Bremer: analysed the data, contributed to the writing of the manuscript. Barbara Bartmeyer: collected and analysed data, contributed to the writing of the manu-script. Claudia Kuecherer: contributed significantly to the design of the study, contributed reagents/materials/analy-sis tools; analysed the data, contributed to the writing of the manuscript. Norbert Bannert: was mainly responsible for the design and supervision of the study, analysed the data, contributed to the writing of the manuscript.
References1. Wittkop L, Günthard HF, de Wolf F, Dunn D, Cozzi-Lepri A,
de Luca A, et al. Effect of transmitted drug resistance on virological and immunological response to initial combination antiretroviral therapy for HIV (EuroCoord-CHAIN joint project): a European multicohort study. Lancet Infect Dis. 2011;11(5):363-71. DOI: 10.1016/S1473-3099(11)70032-9 PMID: 21354861
2. Wheeler WH, Ziebell RA, Zabina H, Pieniazek D, Prejean J, Bodnar UR, et al. Prevalence of transmitted drug resistance associated mutations and HIV-1 subtypes in new HIV-1 diagnoses, U.S.-2006. AIDS. 2010;24(8):1203-12. DOI: 10.1097/QAD.0b013e3283388742 PMID: 20395786
55

8 www.eurosurveillance.org
3. Colafigli M, Torti C, Trecarichi EM, Albini L, Rosi A, Micheli V, et al. Evolution of transmitted HIV-1 drug resistance in HIV-1-infected patients in Italy from 2000 to 2010. Clin Microbiol Infect. 2012;18(8):E299-304. DOI: 10.1111/j.1469-0691.2012.03847.x PMID: 22536753
4. Baxter JD, Dunn D, White E, Sharma S, Geretti AM, Kozal MJ, et al. Global HIV-1 transmitted drug resistance in the INSIGHT Strategic Timing of AntiRetroviral Treatment (START) trial. HIV Med. 2015;16(Suppl 1):77-87. DOI: 10.1111/hiv.12236 PMID: 25711326
5. Zu Knyphausen F, Scheufele R, Kücherer C, Jansen K, Somogyi S, Dupke S, et al. First line treatment response in patients with transmitted HIV drug resistance and well defined time point of HIV infection: updated results from the German HIV-1 seroconverter study. PLoS One. 2014;9(5):e95956. DOI: 10.1371/journal.pone.0095956 PMID: 24788613
6. Frentz D, Van de Vijver DA, Abecasis AB, Albert J, Hamouda O, Jørgensen LB, et al. Increase in transmitted resistance to non-nucleoside reverse transcriptase inhibitors among newly diagnosed HIV-1 infections in Europe. BMC Infect Dis. 2014;14(1):407. DOI: 10.1186/1471-2334-14-407 PMID: 25047543
7. European AIDS Clinical Society (EACS). Guidelines. Version 8.0. European Guidelines for treatment of HIV-infected adults in Europe2015. Brussels: EACS; October 2015. Available from: http://www.eacsociety.org/guidelines/eacs-guidelines/eacs-guidelines.html
8. Yang WL, Kouyos RD, Böni J, Yerly S, Klimkait T, Aubert V, et al. , Swiss HIV Cohort Study (SHCS). Persistence of transmitted HIV-1 drug resistance mutations associated with fitness costs and viral genetic backgrounds.PLoS Pathog. 2015;11(3):e1004722. DOI: 10.1371/journal.ppat.1004722 PMID: 25798934
9. Cleland A, Davis C, Adams N, Lycett C, Jarvis LM, Holmes H, et al. Development of multiplexed nucleic acid testing for human immunodeficiency virus type 1 and hepatitis C virus. Vox Sang. 2001;81(2):93-101. DOI: 10.1046/j.1423-0410.2001.00093.x PMID: 11555468
10. Struck D, Lawyer G, Ternes AM, Schmit JC, Bercoff DP. COMET: adaptive context-based modeling for ultrafast HIV-1 subtype identification.Nucleic Acids Res. 2014;42(18):e144. DOI: 10.1093/nar/gku739 PMID: 25120265
11. Bennett DE, Camacho RJ, Otelea D, Kuritzkes DR, Fleury H, Kiuchi M, et al. Drug resistance mutations for surveillance of transmitted HIV-1 drug-resistance: 2009 update. PLoS One. 2009;4(3):e4724. DOI: 10.1371/journal.pone.0004724 PMID: 19266092
12. Hofstra LM, Sauvageot N, Albert J, Alexiev I, Garcia F, Struck D, et al. Transmission of HIV drug resistance and the predicted effect on current first-line regimens in Europe. Clin Infect Dis. 2016;62(5):655-63. DOI: 10.1093/cid/civ963 PMID: 26620652
13. Mbisa JL, Fearnhill E, Dunn DT, Pillay D, Asboe D, Cane PA, UK HIV Drug Resistance Database. Evidence of self-sustaining drug resistant HIV-1 lineages among untreated patients in the United Kingdom.Clin Infect Dis. 2015;61(5):829-36. DOI: 10.1093/cid/civ393 PMID: 25991470
14. Karlsson A, Björkman P, Bratt G, Ekvall H, Gisslén M, Sönnerborg A, et al. Low prevalence of transmitted drug resistance in patients newly diagnosed with HIV-1 infection in Sweden 2003-2010. PLoS One. 2012;7(3):e33484. DOI: 10.1371/journal.pone.0033484 PMID: 22448246
15. Magiorkinis G, Angelis K, Mamais I, Katzourakis A, Hatzakis A, Albert J, et al. The global spread of HIV-1 subtype B epidemic. Infect Genet Evol. 2016;46:169-79.
16. Pereira NR, Duro R, Piñero C, Malheiro L, Soares J, Serrão R, et al. Characterization of HIV-1 subtypes in a Portuguese cohort. J Int AIDS Soc. 2014;17(4) Suppl 3;19683.PMID: 25397433
17. Abecasis AB, Wensing AM, Paraskevis D, Vercauteren J, Theys K, Van de Vijver DA, et al. HIV-1 subtype distribution and its demographic determinants in newly diagnosed patients in Europe suggest highly compartmentalized epidemics. Retrovirology. 2013;10(1):7. DOI: 10.1186/1742-4690-10-7 PMID: 23317093
18. Foley B, Pan H, Buchbinder S, Delwart EL. Apparent founder effect during the early years of the San Francisco HIV type 1 epidemic (1978-1979).AIDS Res Hum Retroviruses. 2000;16(15):1463-9. DOI: 10.1089/088922200750005985 PMID: 11054259
19. Hemelaar J, Gouws E, Ghys PD, Osmanov S. Global and regional distribution of HIV-1 genetic subtypes and recombinants in 2004.AIDS. 2006;20(16):W13-23. DOI: 10.1097/01.aids.0000247564.73009.bc PMID: 17053344
20. Robert Koch Institute (RKI). Regional distribution of new HIV diagnoses within Germany. [Regionale Verteilung der HIV-Neudiagnosen innerhalb Deutschlands]. Epidemiologisches Bulletin. 2015;27/2015. German. Available from: http://
www.rki.de/DE/Content/Infekt/EpidBull/Archiv/2015/Ausgaben/27_15.pdf?__blob=publicationFile.
21. Kassanjee R, Pilcher CD, Keating SM, Facente SN, McKinney E, Price MA, et al. Independent assessment of candidate HIV incidence assays on specimens in the CEPHIA repository. AIDS. 2014;28(16):2439-49. DOI: 10.1097/QAD.0000000000000429 PMID: 25144218
22. European Centre for Disease Prevention and Control (ECDC). Monitoring recently acquired HIV infections in the European context. Stockholm: ECDC; 2013. Available from: http://www.ecdc.europa.eu/en/publications/Publications/monitoring-recently-acquired-HIV-infections-european-context.pdf
23. Kim AA, McDougal JS, Hargrove J, Rehle T, Pillay-Van Wyk V, Puren A, et al. Evaluating the BED capture enzyme immunoassay to estimate HIV incidence among adults in three countries in sub-Saharan Africa. AIDS Res Hum Retroviruses. 2010;26(10):1051-61. DOI: 10.1089/aid.2009.0218 PMID: 20849299
24. Scheer S, Nakelsky S, Bingham T, Damesyn M, Sun D, Chin CS, et al. Estimated HIV Incidence in California, 2006-2009. PLoS One. 2013;8(2):e55002. DOI: 10.1371/journal.pone.0055002 PMID: 23405106
25. Grinberg G, Giron LB, Knoll RK, Galinskas J, Camargo M, Arif MS, et al. High prevalence and incidence of HIV-1 in a counseling and testing center in the city of Itajaí, Brazil. Braz J Infect Dis. 2015;19(6):631-5. DOI: 10.1016/j.bjid.2015.08.001 PMID: 26361837
26. Zhang J, Guo Z, Yang J, Pan X, Jiang J, Ding X, et al. Genetic diversity of HIV-1 and transmitted drug resistance among newly diagnosed individuals with HIV infection in Hangzhou, China. J Med Virol. 2015;87(10):1668-76. DOI: 10.1002/jmv.24223 PMID: 25899877
27. Lunar MM, Matković I, Tomažič J, Vovko TD, Pečavar B, Poljak M. Longitudinal trends of recent HIV-1 infections in Slovenia (1986-2012) determined using an incidence algorithm.J Med Virol. 2015;87(9):1510-6. DOI: 10.1002/jmv.24209 PMID: 25970253
28. Santos-Hövener C, Zimmermann R, Kücherer C, Bätzing-Feigenbaum J, Wildner S, Hamouda O, et al. Conversation about Serostatus decreases risk of acquiring HIV: results from a case control study comparing MSM with recent HIV infection and HIV negative controls. BMC Public Health. 2014;14(1):453. DOI: 10.1186/1471-2458-14-453 PMID: 24885694
29. Gill VS, Lima VD, Zhang W, Wynhoven B, Yip B, Hogg RS, et al. Improved virological outcomes in British Columbia concomitant with decreasing incidence of HIV type 1 drug resistance detection. Clin Infect Dis. 2010;50(1):98-105. DOI: 10.1086/648729 PMID: 19951169
30. Drescher SM, von Wyl V, Yang WL, Böni J, Yerly S, Shah C, et al. Treatment-naive individuals are the major source of transmitted HIV-1 drug resistance in men who have sex with men in the Swiss HIV Cohort Study. Clin Infect Dis. 2014;58(2):285-94. DOI: 10.1093/cid/cit694 PMID: 24145874
License and copyrightThis is an open-access article distributed under the terms of the Creative Commons Attribution (CC BY 4.0) Licence. You may share and adapt the material, but must give appropriate credit to the source, provide a link to the licence, and indi-cate if changes were made.
This article is copyright of the authors, 2017.
56
Publikation 3
Hauser A, Hofmann A, Meixenberger K, Altmann B, Hanke K, Bremer V, Bartmeyer B, Bannert N.:
Increasing proportions of HIV-1 non-B subtypes and of NNRTI resistance between 2013 and 2016
in Germany: Results from the national molecular surveillance of new HIV-diagnoses. PLoS One.
2018;13(11): e0206234. DOI: 10.1371/journal.pone.0206234. Impact factor: 2,776 für 2018
(Quelle: Journal Citation Reports)
57

RESEARCH ARTICLE
Increasing proportions of HIV-1 non-B
subtypes and of NNRTI resistance between
2013 and 2016 in Germany: Results from the
national molecular surveillance of new HIV-
diagnoses
Andrea HauserID1,2*, Alexandra HofmannID
3,4, Karolin Meixenberger1, Britta Altmann1,
Kirsten Hanke1, Viviane Bremer3, Barbara Bartmeyer3, Norbert Bannert1,2
1 Division of HIV and Other Retroviruses, Robert Koch Institute, Berlin, Germany, 2 Institute of Medical
Virology, Charite Universitatsmedizin Berlin, Berlin, Germany, 3 Division of HIV/AIDS, STI and Blood-borne
Infections, Robert Koch-Institute, Berlin, Germany, 4 Charite, Universitatsmedizin Berlin, Berlin, Germany
Abstract
Background
Molecular surveillance of newly diagnosed HIV-infections is important for tracking trends in
circulating HIV-variants, including those with transmitted drug resistances (TDR) to sustain
ART efficacy.
Methods
Dried serum spots (DSS) are received together with the statutory notification of a new diag-
nosis. ’Recent infections’ (<155 days) classified by a ’recent infection test algorithm’ (BED-
CEIA and clinical data) are genotyped in HIV-protease (PR), reverse transcriptase (RT) and
integrase (INT) to determine the HIV-1 subtype, to calculate prevalence and trends of TDR,
to predict baseline susceptibility and to identify potential transmission clusters for resistant
variants.
Results
Between January 2013 and December 2016, 1,885 recent infections were analysed regard-
ing the PR/RT genomic region, with 43.5% of these also being subjected to the analysis of
INT. The proportion of HIV-1 non-B viruses (31.3%; 591/1,885) increased from 21.6% to
36.0%, particularly the subtypes A (5.0% to 8.3%) and C (3.2% to 7.7%; all ptrends < 0.01).
The subtype A increment is mainly due to transmissions within men who have sex with men
(MSM) while subtype C transmissions are associated with heterosexuals and people who
inject drugs. The prevalence of TDR was stable at 11.0% (208/1,885) over the study period.
Resistances to nucleotide RT inhibitors (NRTI) and PR inhibitors (PI) were 4.5% and 3.2%,
respectively, without identifiable trends. In contrast, resistances to non-NRTIs (NNRTI,
PLOS ONE | https://doi.org/10.1371/journal.pone.0206234 November 8, 2018 1 / 18
a1111111111
a1111111111
a1111111111
a1111111111
a1111111111
OPEN ACCESS
Citation: Hauser A, Hofmann A, Meixenberger K,
Altmann B, Hanke K, Bremer V, et al. (2018)
Increasing proportions of HIV-1 non-B subtypes
and of NNRTI resistance between 2013 and 2016
in Germany: Results from the national molecular
surveillance of new HIV-diagnoses. PLoS ONE 13
(11): e0206234. https://doi.org/10.1371/journal.
pone.0206234
Editor: Chiyu Zhang, Institut Pasteur of Shanghai
Chinese Academy of Sciences, CHINA
Received: June 1, 2018
Accepted: October 9, 2018
Published: November 8, 2018
Copyright:© 2018 Hauser et al. This is an open
access article distributed under the terms of the
Creative Commons Attribution License, which
permits unrestricted use, distribution, and
reproduction in any medium, provided the original
author and source are credited.
Data Availability Statement: All relevant sequence
data have been deposited in the NCBI database. All
251 accession numbers are provided within the
Supporting Information file, S2 Text.
Funding: The study was funded by the German
Federal Ministry of Health, Grant number: FKZ
2513AUK375. (NB, VB). The funders had no role in
study design, data collection and analysis, decision
to publish, or preparation of the manuscript.
58

4.7%) doubled between 2014 and 2016 from 3.2% to 6.4% (ptrend = 0.02) mainly due to the
K103N mutation (from 1.7% to 4.1%; ptrend = 0.03) predominantly detected in recently
infected German MSM not linked to transmission clusters. Transmitted INSTI mutations
were present in only one case (T66I) and resistance to dolutegravir was not identified at all.
Reduced susceptibility to recommended first-line therapies was low with 1.0% for PIs, 1.3%
for NRTIs and 0.7% for INSTIs, but high for the NNRTIs efavirence (4.9%) and rilpivirine
(6.0%) due to the K103N mutation and the polymorphic mutation E138A. These trends in
therapy-naïve individuals impact current first-line regimens and require awareness and vigi-
lant surveillance.
Introduction
HIV infection is still a major public health concern in EU/EEA countries with approximately
30,000 new cases reported each year [1]. Prevention by pre-exposure prophylaxis (PrEP), fre-
quent (self-) testing of persons at risk with rapid diagnostic assays and immediate initiation of
highly effective combination antiretroviral therapy (cART) following a confirmed infection
are among the most promising new measures introduced in recent years to curb the number
of HIV-transmissions in this region of the world [2]. However, further transmission of drug
resistant viral variants that can limit the success of first-line therapy regimens remains a sub-
stantial issue [3]. Genotypic resistance testing prior to treatment initiation is therefore recom-
mended by national and European guidelines in order to predict clinical resistance and guide
the choice of individual treatments [4, 5]. The prevalence of transmitted drug resistance
(TDR) is primarily linked to the cART prescription pattern in a country, the proportion of
individuals treated with cART, the extend of acquired drug resistance relaying on the common
therapy adherence, resistance barriers of the administered antiretroviral regimes and the fre-
quency of virus load monitoring. As the access to cART is increasing worldwide [6], TDR
requires more attention and its surveillance is gaining momentum at national and interna-
tional levels [7–9].
To predict TDR in cART-naïve patients, the World Health Organization (WHO) defined
relevant resistance mutations selected by protease inhibitors (PIs), nucleoside reverse tran-
scriptase inhibitors (NRTIs) and non-NRTIs (NNRTIs). These are summarized in the WHO
surveillance drug resistance mutations (WHO SDRM) list from 2009 [10]. Based on this list,
the overall prevalence of TDR in Europe is reported to have been largely stable for more than a
decade, affecting approximately one in ten new infections [11, 12]. This is somewhat surpris-
ing since the introduction of new drugs with higher potency and reduced tendency to induce
resistance resulted in a decrease in therapy failures during this period [13]. The explanation
for this apparent paradox is the high prevalence of resistance associated mutations with low
impact on viral fitness that persist in transmission chains for years without selective pressure
by the drug [14–16].
The surveillance of transmitted resistances of integrase strand transfer inhibtors (INSTI) is
of particular interest. Raltegravir was approved in Europe in 2007, followed by elvitegravir
(2012) and dolutegravir (2014). The general tolerance and the low likelihood of resistance
selection due to a high genetic barrier [17] led to their widespread use and recommendation as
first-line option in European guidelines [5, 18]. Since the WHO SDRM list does not include
INSTI selected mutations in the last updated version of 2009, the Stanford HIV drug resistance
database SDRM Worksheet for INSTI may be used instead.
Increase of HIV non-B subtypes and NNRTI resistance in Germany between 2013-2016
PLOS ONE | https://doi.org/10.1371/journal.pone.0206234 November 8, 2018 2 / 18
Competing interests: The authors have declared
that no competing interests exist.
59
In 2013 a molecular surveillance program was initiated in Germany that is based on the
examination of viral sequences from recently infected among newly diagnosed HIV cases [7,
19]. The aim of the present study was to analyse the distribution of HIV-1 subtypes, the preva-
lence of TDR, the potential phylogenetic relationship of TDR and its impact on the baseline
susceptibility in newly diagnosed patients between 2013 and 2016.
Materials and methods
Clinical samples
According to the “Protection Against Infection Act” (IfSG; §7) of 2001, diagnostic laboratories
in Germany are obligated to report newly diagnosed HIV infections anonymously to the Ger-
man public health institute (Robert Koch Institute, RKI). For surveillance programs a network
of approximately eighty diagnostic laboratories (https://www.rki.de/DE/Content/InfAZ/H/
HIVAIDS/Studien/InzSurv_HIV/beteiligte_Labore.html) was established that send along with
the report form, residual serum from newly diagnosed HIV cases spotted onto a filter card
(Whatman 903 filter paper) as dried serum spots (DSS). According to §13 of IfSG the RKI is
authorized to receive blood residuals from diagnostics for surveillance purposes.
By this sampling strategy, specimens from approximately 60% of all reported newly diag-
nosed HIV infections are send to the RKI laboratory. Here, DSS are classified into recently
acquired and long term HIV-infections according to the ECDC recommended ‘recent infec-
tion test algorithm´ (RITA) including results from the BED IgG Capture EIA (Sedia Biosci-
ences Corporation, Portland, OR, USA) and clinical data from the HIV-notification database
(CDC classification, CD4 cell count and viral load) [19]. Only recent infections are subse-
quently processed for HIV-genotyping. Sequence data are finally merged with the provided
anonymous socio-demographic data from the HIV-notification form (gender; transmission
routes: men who have sex with men (MSM), persons with heterosexual contact (HET), people
who inject drugs (PWID); regions of patient origin) for analysis. The data protection officer of
the Robert Koch Institute and the Federal Commissioner for Data Protection and Freedom of
Information approved the study protocol (III-401/008#0016).
HIV-1 subtyping, drug resistance interpretation and phylogenetic analysis
HIV-1 genotypes from the protease (PR) and reverse transcriptase (RT) genomic region
(2013–2016) and the integrase (INT) genomic region (2014–2016) were generated according
to the previously published protocols [20, 21]. Since 2015, Sanger sequencing has been substi-
tuted by next generation sequencing (NGS) using the Illumina MiSeq platform as described
previously [22]. After extensive evaluations, a 20% threshold for defining ambiguities was
applied to the NGS generated sequences to maintain consistency (S1 Text).The HIV-1 subtype
was assigned by applying the REGA HIV Subtyping Tool (3.0) [23] and COMET HIV-1 (1.0)
[24] to the pol-sequence. In cases where a subtype or circulating recombinant form (CRF)
could not be assigned, a maximum-likelihood tree with bootstrap (IQ-TREE 1.5.5) was calcu-
lated using the HIV-1 subtype reference panel from the Los Alamos HIV sequence data base.
Only subtype classifications based on bootstrap values of>70% in the tree topology were
taken into account, otherwise they were classified as unique recombinant form (URF).
The prevalence of TDR was calculated from the number of persons infected with viral vari-
ants carrying at least one mutation included in the WHO SDRM list [10]. Transmitted INSTI
mutations were defined as the detection of mutations listed in the Stanford HIV drug resis-
tance database SDRM Worksheet for INSTI (https://hivdb.stanford.edu/pages/SDRM.
worksheet.INI.html; updated in June 2016). Phenotypic resistance was predicted using the
Stanford HIV Drug Resistance Database 8.4 algorithm (Stanford HIVbd) [25]. Three levels of
Increase of HIV non-B subtypes and NNRTI resistance in Germany between 2013-2016
PLOS ONE | https://doi.org/10.1371/journal.pone.0206234 November 8, 2018 3 / 18
60

resistance were scored: (i) S = susceptible (including susceptible and potential resistant levels)
(ii) I = intermediate (including low and intermediate levels) and (iii) R = resistant (high
level resistance). Predictions of primary resistance to recommended and alternative first-
line therapy options are based on the EACS treatment guidelines 9.0 [5] which include the
NNRTIs efavirenz and rilpivirine, the NRTIs abacavir, lamivudine, tenofovir and emtricita-
bine, the PIs atazanavir, darunavir and lopinavir and the INSTIs raltegravir, elvitegravir and
dolutegravir.
Drug resistance mutations present in a proportion of� 0.5% in the dataset were defined to
be ‘frequent mutations´ and were used for trend analysis. In addition, sequences carrying one
of the ‘frequent mutations´ were applied to phylogenetic analysis to allow the spread of resis-
tance mutations within transmission networks to be mapped. For this purpose sequences were
aligned with 33 reference sequences from the Los Alamos database and trimmed to 1026 base
pairs. To select the optimal tree model, Maximum Likelihood (ML) phylogenies were recon-
structed using the Ultrafast Bootstrap approximation in IQ-TREE with 10,000 replicates with
the integrated model selection algorithm [26, 27]. A group O sequence was used as outgroup
for the ML tree reconstruction. The tool ‘Transmic´ (https://github.com/kavehyousef/code)
[28] was used to identify clusters of closely related sequences, possibly linked by direct trans-
mission or very short transmission chains (putative transmission clusters). Therefore, a 99%
bootstrap cut-off and a 4.5% mean pairwise patristic distance were used as a cluster threshold
as reported by other groups [29, 30]. The tree was visualized in Figtree (version 1.4.0).
Statistics
Statistical analyses were performed using STATA (version 14.2). Continuous variables were
analyzed using median and interquartile range (IQR). The chi2 test was used for bivariate com-
parison and logistic regression to assess the odds ratios (OR) and 95% confidence intervals
(CI). Changes in the prevalence over time were analyzed using the chi2 test for trend of odds.
Results
Characterisation of the study population
Between 2013 and 2016, a total of 10,643 DSS of newly diagnosed HIV-cases were submitted
to the RKI along with the anonymous report and 3,380 (31.8%) were classified as recent infec-
tions. From these we were able to obtain 1,885 (55.8%) HIV-1 genotypes of the PR and RT
genomic regions. The median plasma viral load was 140,500 copies/ml (IQR 32,269–991,106),
the median CD4 cell count was 454 cells/μl (IQR 304–612) and the median age of the newly
diagnosed individuals was 36.3 years. Baseline patient characteristics are shown in Table 1.
During the study period the most remarkable change was an increase in the proportion of
HET (7.6% to 13.1%) and persons with African origin (3.2% to 7.5%) between 2013 and 2015
followed by a slight decline in 2016 (to 11.4% and 6.0%, respectively).
HIV-1 genotypes of the INT genomic region were available for 820 of the 1,885 DSS
(43.5%) from newly diagnosed cases in 2014 (70/466, 16%), 2015 (348/624, 57%) and 2016
(402/517, 79%). The proportional distribution in subgroups was congruent between the total
study population (n = 1,885) and the subset (n = 820) (Table 1).
Prevalence and trends of HIV-1 subtypes
Subtype B infections were predominant in the total study population with 68.6% (CI95% 66.5–
70.7; 1,294/1,885) and primarily affected MSM and persons of German origin (Fig 1, Table 2).
The proportion of subtype B infections was significantly decreasing from 78.4% in 2013 to
Increase of HIV non-B subtypes and NNRTI resistance in Germany between 2013-2016
PLOS ONE | https://doi.org/10.1371/journal.pone.0206234 November 8, 2018 4 / 18
61

Table 1. Baseline characteristics of the study population.
Protease/Reverse Transcriptase Integrase
n 2013–2016 (n = 1,885)
%
2013 (n = 278)
%
2014 (n = 466) % 2015 (n = 624)% 2016 (n = 517)
%
2014–2016 (n = 820)
%
Gender
Male 1,638 86.9 87.8 88.6 87.0 84.7 87.2
Female 228 12.1 11.5 10.7 12.3 13.4 11.8
Not reported 19 1.0 0.7 0.6 0.6 1.9 1.0
Mode of transmission
MSM 1,091 57.9 60.8 62.5 55.6 54.9 55.5
HET 207 11.0 7.6 9.7 13.1 11.4 10.7
PWID 71 3.8 4.0 2.2 4.3 4.5 5.2
Other 7 0.4 0.7 0.4 0.3 0.2 0.4
Not reported 509 27.0 27.0 25.3 26.6 29.0 28.2
Region of origin
Germany 1,147 60.9 59.4 60.7 56.6 66.9 61.3
Eastern Europe 59 3.1 2.5 4.1 3.2 2.5 2.9
Western Europe 60 3.2 4.7 2.6 4.2 1.7 3.3
Central Europe 77 4.1 3.2 4.7 3.7 4.5 4.8
Asia/Oceania 36 1.9 1.4 2.4 2.9 0.6 1.7
America/Caribbean 46 2.4 2.5 2.2 3.2 1.7 2.4
Africa 111 5.9 3.2 5.2 7.5 6.0 6.1
Other 8 0.4 0.4 0.2 0.5 0.6 0.5
Not reported 341 18.1 22.7 18.0 18.3 15.5� 17.0
MSM: men who have sex with men; HET: persons with heterosexual mode of transmission; PWID: people who inject drugs
� p <0.05.
https://doi.org/10.1371/journal.pone.0206234.t001
Fig 1. Analysis of HIV-1 subtypes. (A) Proportion of HIV-1 subtypes in the study population. (B) Trend analysis for
major subtypes that show a significant increase or decrease (p< 0.05) between 2013 and 2016. Trend lines and p-values are indicated for the total proportions of subtypes. MSM: men who have sex with men; HET: persons with
heterosexual mode of transmission, PWID: people who inject drugs, GER: German.
https://doi.org/10.1371/journal.pone.0206234.g001
Increase of HIV non-B subtypes and NNRTI resistance in Germany between 2013-2016
PLOS ONE | https://doi.org/10.1371/journal.pone.0206234 November 8, 2018 5 / 18
62

64.0% in 2016 (ptrend = 0.001). This trend is primarily based on the two above mentioned sub-
groups and can also be observed in non-Germans (all ptrend> 0.05) (Fig 1B).
Among the non-B infections (31.4%, CI95% 29.3–33.5, 591/1,885) the most prevalent were
subtype A (8.2%), CRF02_AG (5.7%) and subtype C (5.0%) (Fig 1A). Almost half of the
infected individuals were of German origin, while the other half was of foreign origin
(Table 2). Subtype A infected persons of foreign origin (n = 60) mostly originated from Cen-
tral/East Europe (n = 31) or Sub-Saharan Africa (n = 13) and subtype C or CRF02_AG infected
persons of foreign origin (nC = 40 and nAG = 48) largely originated from Sub-Saharan Africa
(nC = 26 and nAG = 21) (Table 2). The increment in the proportion of non-B infections is
mostly due to a significant increase of subtype A (ptrend = 0.008) and C (ptrend = 0.002) (Fig
1B). While subtype A peaked in 2015 and declined somewhat in the following year, subtype C
proportions increased steadily and reached a maximum in 2016. These developments are also
evident in most of the analysed subgroups except for subtype C in non-Germans, which
peaked in 2015 (Fig 1B).
Prevalence and trends of TDR
The overall prevalence of TDR according to the WHO SDRM list was 11.0% (CI95% 9.7–12.5)
(Table 3). There was little variation in the four year period between 2013 and 2016 (ptrend = 0.68)
Table 2. Analysis of infections with major HIV-1 subtypes regarding transmission groups and regional origin.
Subtype B
(n = 1,294)
%
Subtype A(n = 154)
%
CRF02_AG(n = 108)
%
Subtype C (n = 95)
%
MSM 68.7 36.4 22.2 26.3
PWID 2.0 8.4 7.4 10.5
HET 3.3 24.7 32.4 36.9
Not reported/ other 26.0 30.5 38.0 26.3
Germany 68.9 43.5 32.4 43.2
Not Germany 13.7 39.0 44.4 42.1
Not reported 17.4 17.5 23.2 14.7
MSM: men who have sex with men; HET: persons with heterosexual mode of transmission, PWID: people who inject drugs
https://doi.org/10.1371/journal.pone.0206234.t002
Table 3. Prevalence of TDR within subgroups between 2013 and 2016.
Over all
% (n)
Mode of transmission Region of Origin Subtypes
MSM
% (n)
HET
% (n)
PWID
% (n)
Not rep.
/other
% (n)
GER
% (n)
EUR
% (n)
AM
% (n)
AFR
% (n)
AS
% (n)
Not rep.
/other
% (n)
A
% (n)
B
% (n)
C
% (n)
CRF
02_AG
% (n)
TDR 11.0
(208)
11.4
(124)
6.8
(14)
5.6 (4) 12.8 (66) 11.2
(128)
5.6
(11)
13.0
(6)
12.6
(14)
5.6
(2)
13.5 (47) 14.9
(23)
12.4
(160)
8.4
(8)
6.5 (7)
NRTI 4.5 (84) 4.4 (48) 3.4 (7) 2.8 (2) 5.2 (27) 4.4 (51) 2.6 (5) 4.3 (2) 6.3 (7) 2.8
(1)
5.2 (18) 1.9 (3) 5.7 (74) 3.2
(3)
1.9 (2)
NNRTI 4.7 (89) 4.9 (53) 4.3 (9) 1.4 (1) 5.0 (26) 4.4 (51) 3.1 (6) 13.0
(6)
5.4 (6) 5.6
(2)
5.2 (18) 5.2 (8) 4.9 (63) 5.3
(5)
5.6 (6)
PI 3.2 (60) 3.7 (40) 0.5 (1) 1.4 (1) 3.5 (18) 3.5 (40) 1.0 (2) 0.0 (0) 2.7 (3) 2.8
(1)
4.0 (14) 9.1 (14) 3.2 (41) 2.1
(2)
0.9 (1)
MSM: men who have sex with men; HET: persons with heterosexual mode of transmission; TM: mode of transmission; rep.: reported; GER: Germany; EUR: Europe;
AM: America; AFR: Africa; AS: Asia
https://doi.org/10.1371/journal.pone.0206234.t003
Increase of HIV non-B subtypes and NNRTI resistance in Germany between 2013-2016
PLOS ONE | https://doi.org/10.1371/journal.pone.0206234 November 8, 2018 6 / 18
63

(Fig 2). Mono resistance was present in 9.9% of the patients (NNRTI: 3.6%, NRTI: 3.4%, PI:
2.8%), dual and triple class resistance in 1.0% and 0.2%, respectively. Taking mono and multiclass
TDR together (cumulative counts), NNRTI resistance was most frequently found with 4.7%
(CI95% 3.9–5.8), followed by NRTI resistance (4.5%, CI95% 3.6–5.5), and PI resistance (3.2%,
CI95% 2.5–4.1) (Table 3). A trend analysis revealed that NRTI resistance decreased to its lowest
levels in 2016 (ptrend = 0.47), while NNRTI resistance increased within the study period (ptrend =
0.06). This increase was significant between 2014 and 2016 (ptrend = 0.02). PI resistance did not
show any tendency to increase or decrease between 2013 and 2016 (ptrend = 0.99) (Fig 2).
Significantly higher proportions of TDR were found in MSM compared to HET (p = 0.03)
and in Germans compared to non-Germans (33/397, 8.3%; p< 0.13). However, the prevalence
was also high in persons with American and African origin, but the total number of cases with
this origin was low (n = 6 and 14, respectively) (Table 3). Moreover, in subtype B the preva-
lence of TDR (160/1,294; 12.4%) was significantly higher than in non-B subtypes (48/591;
8.1%; p< 0.01). However, the highest level of TDR (14.9%) was identified in subtype A
(Table 3).
Prevalence of TDR mutations and their impact on drug susceptibility
according to the Stanford HIVdb
The thymidine analogue mutations (TAMs) M41L, K219Q and T215 revertants as well as the
non-TAM M184V were among the most frequently transmitted NRTI-resistance mutations
(� 0.5%) (Table 4). These TAMs were responsible for the high proportions of resistance to
zidovudine and stavudine (both 4%) (Fig 3A) at low/intermediate level (Fig 3B). Less fre-
quently observed were the mutations D67N (n = 8), K65R (n = 2) and K70R (n = 2). The
M184V, K70R and K65R mutations induce high level resistance to NRTIs in recommended
first-line regimen according to EACS (9.0). However, their abundance was low with 1.3% (aba-
cavir 1.3%, lamivudine 0.7%, tenofovir 0.9% and emtricitabine 0.7%) (Fig 3A).
Fig 2. Trends of transmitted drug resistance among newly diagnosed HIV cases with recent HIV infections in total and according to drug classes. The
confidence interval for NNRTI resistance is indicated.
https://doi.org/10.1371/journal.pone.0206234.g002
Increase of HIV non-B subtypes and NNRTI resistance in Germany between 2013-2016
PLOS ONE | https://doi.org/10.1371/journal.pone.0206234 November 8, 2018 7 / 18
64

The most frequently detected NNRTI-mutation was K103N. Its proportion was increasing
between 2013 and 2016 (ptrend = 0.07) with this increase being significant between 2014 and
2016 (ptrend = 0.03). The steep slope of the ‘total K103N´ between 2014 and 2016 was quite con-
gruent in the subgroups of MSM, persons of German origin and subtype B infections (Fig 4A).
However, slightly increasing tendencies with a peak in 2015 could also be observed for persons
with non-German origin and subtype non-B infections (Fig 4B). Consequently, resistance to
first generation NNRTIs (efavirenz and nevirapine) doubled between 2014 and 2016 (Fig 3A).
The polymorphic NNRTI-mutation E138A not recorded in the SDRM list but associated with
low level resistance to the second generation NNRTI rilpivirine according to Stanford HIVdb
was found even more frequently during the whole study period (Table 4 and Fig 3B). There-
fore, phenotypic resistance to the first-line recommended or alternative NNRTIs (efavirenz
4.9% and rilpivirine 6%) (Fig 3A) was relatively high with 9.1% (172/1,885).
PI-mutations M46I/L and V82L that are responsible for low or intermediate resistance lev-
els to tipranavir, nelfinavir and fosamprenavir (Fig 3B) were also frequently present (Table 4)
but without identifiable tendency during the study period (Fig 3A). However, for the first-line
recommended or alternative PIs predicted phenotypic resistance was very low with 1% (ataza-
navir 0.7% and lopinavir 1.0%).
Transmitted INSTI mutations according to Stanford SDRM Worksheet for INSTI were
identified in a single sequence among 820 analysed cases (0.12%), namely the major primary
mutation T66I resulting in high level resistance to elvitegravir and low level resistance to ralte-
gravir. According to predictions from the Stanford HIVdb, phenotypic INSTI resistance
(excluding potential low level) was identified in 0.7% (6/820) of cases (Fig 3B) due to the pres-
ence of the T66I (n = 1), the G163R or K (n = 4) or the combination of T97A and E157Q
(n = 1) resulting in low level resistance to elvitegravir and raltegravir. These cases were absent
in 2014, but exhibited an increase to 0.3% (1/624) in 2015 and to 1.2% (5/517) in 2016 (Fig
3A). None of the sequences showed evidence for resistance to dolutegravir (Fig 3). Taken
together, primary resistance to recommended drugs for first-line therapy according to EACS
9.0 was 10.9% (205/1,885).
Table 4. Most frequently identified TDR mutations (� 0.5%) within the year of diagnosis and indoors HIV-1 subtypes.
n 2013-2016(n = 1,885)
%
2013(n = 278)
%
2014(n = 466)% 2015(n = 624)% 2016(n = 517)% A(n = 154) % B(n = 1,294)% C
(n = 95)%
CRF02_AG
(n = 108)
%
NRTI
M41L 21 1.1 1.4 1.5 1.0 0.8 0.6 1.5 - -
M184V 9 0.5 0.7 0.2 0.8 0.2 0.6 0.3 2.1 0.9
T215rev 49 2.6 1.4 3.0 2.9 2.5 0.6 3.7 - -
K219Q 12 0.6 0.7 0.6 1.0 0.2 1.3 0.6 1.1 0.9
NNRTI
K103N 57 3.0 3.2 1.7 3.0 4.1 3.2 3.4 3.2 2.8
�V108I 9 0.5 1.4 0.2 0.2 0.6 0.6 0.5 - -
�E138A 75 4.0 4.7 4.3 3.8 3.5 6.5 3.5 3.2 5.6
PI
M46I/L 28 1.5 2.2 1.3 1.0 1.9 7.8 1.1 1.1 0.9
Q58E 10 0.5 1.4 - 0.3 0.8 - 0.8 - -
V82L 15 0.8 0.7 0.6 0.8 1.0 - 1.2 - -
L90M 9 0.5 0.7 0.6 0.5 0.2 - 0.6 - -
� mutations according to Stanford HIVdb, not listed in the SDRM-list
https://doi.org/10.1371/journal.pone.0206234.t004
Increase of HIV non-B subtypes and NNRTI resistance in Germany between 2013-2016
PLOS ONE | https://doi.org/10.1371/journal.pone.0206234 November 8, 2018 8 / 18
65

Fig 3. Prevalence of predicted resistance to approved HIV therapeutics according to the Stanford HIVdb. (A) Resistance (low/intermediate/high
level) stratified according to the year of diagnosis. (B) Resistance level; # calculated from 820 cases;� drugs included in recommended and alternative
first-line treatment option according to EACS 9.0 guidelines; EFV efavirenz, ETR etravirine, NVP nevirapine, RPV rilpivirine, 3TC lamivudine, ABC
abacavir, AZT zidovudine, D4T stavudine, DDI didanosine, FTC emtricitabine, TDF tenofovir, ATV atazanavir, DRV darunavir, FPV fosamprenavir,
IDV indinavir, LPV lopinavir, NFV nelfinavir, SQV saquinavir, TPV tipranavir, EVG elvitegravir, RAL raltegravir, DTG dolutegravir.
https://doi.org/10.1371/journal.pone.0206234.g003
Increase of HIV non-B subtypes and NNRTI resistance in Germany between 2013-2016
PLOS ONE | https://doi.org/10.1371/journal.pone.0206234 November 8, 2018 9 / 18
66

Transmission cluster analysis of TDR mutations
Sequences that had one or more of the most frequent NRTI, NNRTI and PI resistance mutations
or the polymorphic E138A (listed in Table 4) were selected for phylogenetic analysis (n = 251). All
relevant sequence data have been deposited in the NCBI database. All 251 accession numbers are
provided within the Supporting Information file, S2 Text. Among them, half were found in one of
32 clusters identified (49.4%, 124/251). The average was 3.9 (min 2 –max 16) sequences per clus-
ter. Three large clusters consisting exclusively of male individuals and mainly MSM and Germans
were recognized. Cluster 1 consists of 11 subtype A sequences with the M46I mutation. 15 subtype
B sequences with the V82L mutation form cluster 2 and 16 subtype B sequences with the revertant
T215S form the third large cluster (Fig 5). The proportion of these major TDR mutations trans-
mitted in clusters and the respective cluster sizes are given in Table 5.
Special attention was paid to the clustering of the K103N mutation in order to analyse
whether the previously described increase in 2015/2016 was the result of a recent spread within
one or few active transmission networks and/or within a specific transmission group. Around
40% of the sequences carrying the K103N mutation were found within nine different clusters
(all subtype B, cluster size of 2–4 sequences per cluster) (Table 5, Fig 5). Persons in this ‘clus-
ter-linked´ group were all male, MSM and German or their transmission group and/or origin
was not reported. The proportion of individuals within ‘cluster-linked´ subgroups was quite
similar in the years 2013/2014 and 2015/2016 (p = 0.67). Among the ‘not cluster-linked´
sequences carrying the K103N mutation the diversity of HIV-1 subtypes (A, B, C, G,
Fig 4. Trends for the K103N mutation between 2013 and 2016 in total and in subgroups. (A) in MSM, persons with German Origin or subtype B infection
(B) in persons with heterosexual transmission route, with non-German origin and with subtype non-B infection. Trend line and p-value are indicated for
proportions of total K103N. MSM: men who have sex with men.
https://doi.org/10.1371/journal.pone.0206234.g004
Increase of HIV non-B subtypes and NNRTI resistance in Germany between 2013-2016
PLOS ONE | https://doi.org/10.1371/journal.pone.0206234 November 8, 2018 10 / 18
67

CRF02_AG) as well as the origin of infected persons (Germany, East Europe, West Europe,
Latin America, Sub Saharan Africa and not reported) was much higher. The proportion of
individuals not linked to K103N-clusters was generally higher in 2015/2016 than in 2013/2014
(p = 0.01), although the sampling was more dense in 2015/2016 (n = 1,141 compared to 744 in
2013/2014). Especially the group of ‘male persons´ and here particularly those for which the
transmission route was not reported was significantly higher in 2015/2016 (p = 0.008) (Fig 6).
However, insignificantly higher proportions were also present in MSM, Germans, non-Ger-
mans, persons with unknown origin, infected with subtype B as well as non-B infected but
without reaching significance (all p> 0.05) (Fig 6).
Discussion
In this study we analysed 1,885 recent HIV-1 infections newly diagnosed between 2013 and
2016. The proportions of HIV-1 subtypes and primary resistances in the total population and
Fig 5. Phylogenetic analysis of 251 HIV-1 sequences carrying drug resistance mutations. Three large clusters with M46I, V82L or T215S mutations are shown
with blue branches and all sequences carrying the K103N mutation are depicted with dots at the tips.
https://doi.org/10.1371/journal.pone.0206234.g005
Increase of HIV non-B subtypes and NNRTI resistance in Germany between 2013-2016
PLOS ONE | https://doi.org/10.1371/journal.pone.0206234 November 8, 2018 11 / 18
68

Table 5. Prevalence of mutations identified in clusters by phylogenetic analysis of 251 sequences with drug resistance mutations.
Mutation (n) Proportion in clusters (%) Cluster with 2 individuals Cluster with 3–4 individuals Cluster with 5–7 individuals Cluster with >7 individuals
M46I (20) 75.0 2 - - 1 (n = 11)
M46L (8) 37.5 - 1 - -
V82L (15) 100.0 - - - 1 (n = 15)
L90M (9) 33.3 - 1 - -
Q58E (10) 20.0 1 - - -
K103N (57) 40.4 6 3 - -
V108l (9) 0.0 - - - -
E138A (75) 37.3 2 3 2 -
M41L (21) 42.9 - 1 1 -
M184V (9) 0.0 - - - -
T215E (10) 40.0 2 - - -
T215S (31) 80.6 3 1 - 1 (n = 16)
K219Q (12) 58.3 2 1 - -
https://doi.org/10.1371/journal.pone.0206234.t005
Fig 6. Proportion of not-clusters-linked sequences with K103N mutation according to sub-groups of HIV-infected individuals in 2013/2014
compared to 2015/2016. K103N sequences are grouped according to gender, transmission route, origin and HIV-subtype of the infected person. The
proportion is calculated from the total number of sequences of two respective 2-year periods (2013/2014: 744 sequences; 2015/2016: 1140 sequences).
Between the two year periods a significant increase of the K103N mutation in males who are not linked to transmission clusters is evident. MSM: men
who have sex with men; HET: persons with heterosexual mode of transmission, GER: German, not rep. transm.: not reported transmission, � p< 0.05,��p< 0.01.
https://doi.org/10.1371/journal.pone.0206234.g006
Increase of HIV non-B subtypes and NNRTI resistance in Germany between 2013-2016
PLOS ONE | https://doi.org/10.1371/journal.pone.0206234 November 8, 2018 12 / 18
69

within subgroups (mode of transmission, region of origin) were stratified according to the
year of diagnosis to allow analysing changes over time to be.
In Germany, subtype B continues to be the predominant subtype (68.9%), although the pro-
portion of non-B subtypes significantly increased between 2013 and 2016, particularly for sub-
types A and CRF02_AG which peaked in 2015 (11.7% and 7.1%) and subtype C which
doubled from 3.6% in 2013/2014 [7] to 7.7% in 2016. This increase is partly attributed to per-
sons immigrating from countries where these subtypes are highly prevalent [31] (Sub-Saharan
Africa and Central/East Europe) as a result of the flow of refugees into Europe, including Ger-
many with its highest peak in 2015. However, the increase of infections with subtypes A and C
was attributed even more to the spread within the German population: high proportions were
found in German MSM (subtype A) and German HET and PWID (subtype C). A general
increase of non-B subtypes as well as a subtype diversification is a phenomenon that was also
observed for many other European countries [32–34].
TDR in Germany analysed by using the WHO surveillance drug resistance list [10] was sta-
ble at ~11% between 2013 and 2016, which is in agreement with the data from the German
HIV-1 Seroconverter Cohort (11.9% overall TDR in 1996–2010) [35]. TDR at a lower level
(8.3%) has also been calculated across 26 European countries for patients diagnosed between
2008 and 2010. TDR in Germany continues to be more frequent among MSM, as reported for
other European countries [12, 36] and continues to be significantly more frequent in subtype
B than in non-B subtypes. However, the difference appears to be narrowing [37] due to the
increase of TDR in non-B subtypes from 6.4% in a previous study [7] to 8.1% in this study. A
high proportion of TDR was found in subtype A as a result of one German MSM transmission
network spreading the PI resistance mutation M46I. While proportions of NRTI and PI resis-
tance are similar in the present study compared to those reported for Europe [12], the preva-
lence of NNRTI resistance is about two times higher than previously described for Germany
[7] and compared to other countries [12]. This increase was mainly driven by the K103N
mutation selected by the first generation NNRTIs nevirapine and efavirenz. While nevirapine
was removed from the European treatment guidelines several years ago, efavirenz is still listed
as alternative regimen for first-line therapy [5] but is very rarely used in Germany [38]. There-
fore, ’de novo’ selection of K103N mutations in Germany followed by transmission to newly
diagnosed persons seems to be unlikely in times of highly suppressive cART and pre-treatment
resistance testing. In contrast, selection of resistance followed by an alarmingly increasing
trend of TDR—especially for NNRTI resistances—from regions where first generation
NNRTIs are commonly administered due to cost issues (e.g. Sub-Saharan Africa) is reported
[39]. Therefore, we assume that the increase of the K103N mutation in our study population is
the result of two developments: firstly, the import of the K103N mutation with non-B subtypes
from abroad appears to have occurred at quite low levels (Fig 4B). However, the majority of
such imported infections with phylogenetically unrelated viruses, even if reported in Germany
as a “new diagnosis” in the study period, might not have been analysed here because the vast
majority is likely long standing which were excluded from the study.
Secondly, the increasing trend of K103N infections in MSM, individuals of German origin
and with subtype B infection (Fig 4A) might be explained by the fact that German MSM are
known to have the highest rates of recent infections because they test more frequently than
other transmission groups [19]. Although phylogenetic analysis revealed that there was no sig-
nificant spread of K103N within one or more active transmission networks (as shown for the
PI mutations among MSM) we assume that these phylogenetic unrelated K103N carrying
strains are a result of continuous onwards transmission of the persisting K103N mutation
among long term as well as recent infected individuals and therefore, are not appearing as a
coherent transmission network in our phylogenetic analysis. Comprehensive transmission
Increase of HIV non-B subtypes and NNRTI resistance in Germany between 2013-2016
PLOS ONE | https://doi.org/10.1371/journal.pone.0206234 November 8, 2018 13 / 18
70

network analysis that includes recent as well as long standing infections might therefore pro-
vide some clarification for Germany. Along these lines, increasing proportions of NNRTI
resistance and particularly of the K103N mutation were also reported from MSM networks in
Greece and in San Diego [40, 41].
Large transmission networks of German MSM were observed for the most frequently trans-
mitted NRTI mutation T215S (revertant of T215Y/F), and the PI resistance mutations M46I
and V82L. Nevertheless, the proportions of transmitted NRTI and PI resistance remained sta-
ble during the study period. NRTI resistance resulted mainly from the high prevalence of per-
sisting TAMs. Many studies have shown by phylogenetic analysis that onward transmission
among drug-naïve patients is the major reason for the maintenance of stable NRTI resistance
levels [41–45]. However, as the TAM selecting drugs zidovudine and stavudine have been
replaced by tenofovir in current treatment guidelines, TAMs are no longer of direct clinical
relevance. The proportion of transmitted PI resistance was higher in Germany (3.2%) than in
other European countries (2.0%) [12], presumably due to large clusters of the M46I and V82L
mutations. However, their impact on PIs recommended in current first-line therapies remains
low.
Therefore, the predicted resistance to the currently recommended first-line regimens [5]
consisting of two NRTI plus one PI or one INSTI is very low at the population level (<2.3%)
while primary resistance to NNRTI is frequent with 9.1%: 4.9% to efavirence (due to the
K103N mutation) and 6.0% to rilpivirine (due to the frequent E138A polymorphism). Similar
proportions were reported recently from the UK Drug Resistance Database with 8.2% NNRTI
resistance including 6.2% resistance to rilpivirine and 3.4% to efavirenz [36]. Resistance testing
is therefore particularly recommended for patients starting with or switching to an NNRTI-
containing regimen.
In 2017, tenofovir-containing pre-exposure prophylaxis (PrEP, e.g. tenofovir in combina-
tion with emtricitabine) was introduced in Germany. HIV-infection despite PrEP, due to
subclinical drug levels or infection with resistant variants, might occur and fuel the emergence
of TDR. So far, resistance mutations selected by tenofovir and emtricitabine (K65R, K70R
and M184V) have been rare (below 1%). However, as MSM transmission networks have been
identified to be a major source for the spread of HIV resistance by others [46] and by us, fre-
quent HIV-screening for PrEP users and the monitoring of PrEP-selected mutations is
recommended.
For the first time, we analysed, to which extent INSTI resistance was transmitted following
the introduction of the first generation INSTI raltegravir in Germany in 2007. So far, the pro-
portion of transmitted INSTI mutations is low with only one case identified. Phenotypic resis-
tance to raltegravir and elvitegravir according to Stanford HIVdb is predicted to be 0.7% and
resistance to the second generation INSTI dolutegravir was not detected at all. Primary drug
resistance to INSTIs was also described to be rare in studies of European patients diagnosed in
2013 [36] or 2015 [47]. However, since transmission of INSTI resistance in Germany might
occur with a delay the need for follow-up in the future remains.
One limitation of the present study is the relatively short study period. Changes over time
should therefore be interpreted carefully. Furthermore, integrase genotyping only started in
2014, resulting in lower PCR success rates due to RNA degradation on DSS. A combined pre-
diction including all drug classes was only possible for 43.0% of cases therefore, resistance to
integrase was analysed separately in this dataset. Another limitation is that the SDRM list has
not been updated since 2009 and resistance mutations to the newest drugs or drug classes (e.g.
integrase inhibitors) had to be analysed with different mutation lists. Some of the SDRMs are
only relevant to older drugs rarely used in today’s first-line regimens in EU/EEA countries [4,
5]. If the SDRM list is used, the weighting for TAMs is disproportionately high since they no
Increase of HIV non-B subtypes and NNRTI resistance in Germany between 2013-2016
PLOS ONE | https://doi.org/10.1371/journal.pone.0206234 November 8, 2018 14 / 18
71
longer have clinical relevance. On the other hand, NNRTI resistance is underestimated due to
the lack of the E138A mutation. The relevance of TDR for the outcome of first-line therapy in
EU/EEA countries as calculated from the SDMR list should therefore be interpreted by taking
this underestimation into consideration.
Conclusion
Despite effective cART, TDR is present at an overall stable proportion in Germany (11%). In
particular, viruses carrying resistance mutations with low fitness cost are spread continuously
by onwards transmission, and German MSM are generally driving the spread in Germany,
both within transmission networks and outside of networks as shown for the K103N mutation.
Intensified HIV-screening in these groups followed by early treatment with cART including
the pre-treatment resistance testing as recommended in the current guidelines should help
reduce the spread of resistant viruses in the ART naïve population. Due to the increasing use
of INSTIs in first-line regimens and tenofovir/emtricitabin for PrEP, it is important to monitor
TDR for public health efforts and in order to maintain the effectiveness of cART.
Supporting information
S1 Text. Validation of the NGS ambiguity threshold.
(DOCX)
S2 Text. Accession numbers for NCBI database.
(DOCX)
Acknowledgments
The authors would like to thank all participating laboratories for sending us dried filter spots
for the laboratory analysis and the continuous exchange of ideas and suggestions. All partici-
pating laboratories are listed at www.rki.de. (http://www.rki.de/DE/Content/InfAZ/H/
HIVAIDS/Studien/InzSurv_HIV/beteiligte_Labore.html). We also thank our technicians and
the sequencing facility of the RKI. Many thanks to Stephen Norley and Michelle Jaschke for
proofreading the manuscript. The study was funded by the German Federal Ministry of
Health, Grant number: FKZ: 2513AUK375.
Author Contributions
Conceptualization: Viviane Bremer, Barbara Bartmeyer, Norbert Bannert.
Data curation: Andrea Hauser, Alexandra Hofmann, Karolin Meixenberger, Britta Altmann,
Kirsten Hanke, Barbara Bartmeyer, Norbert Bannert.
Formal analysis: Andrea Hauser, Karolin Meixenberger, Britta Altmann, Kirsten Hanke.
Funding acquisition: Viviane Bremer, Barbara Bartmeyer, Norbert Bannert.
Investigation: Andrea Hauser, Alexandra Hofmann, Britta Altmann.
Methodology: Andrea Hauser, Karolin Meixenberger, Britta Altmann, Kirsten Hanke.
Project administration: Andrea Hauser, Barbara Bartmeyer, Norbert Bannert.
Resources: Alexandra Hofmann, Viviane Bremer, Barbara Bartmeyer, Norbert Bannert.
Software: Andrea Hauser, Kirsten Hanke.
Supervision: Viviane Bremer, Barbara Bartmeyer, Norbert Bannert.
Increase of HIV non-B subtypes and NNRTI resistance in Germany between 2013-2016
PLOS ONE | https://doi.org/10.1371/journal.pone.0206234 November 8, 2018 15 / 18
72

Validation: Andrea Hauser.
Visualization: Andrea Hauser.
Writing – original draft: Andrea Hauser.
Writing – review & editing: Alexandra Hofmann, Karolin Meixenberger, Britta Altmann,
Kirsten Hanke, Viviane Bremer, Barbara Bartmeyer, Norbert Bannert.
References1. ECDC ECfDPaC. HIV/AIDS surveillance in Europe 2017–2016 data. Stockholm: ECDC, 2017.
2. Hill A, Pozniak A. HIV treatment cascades: how can all countries reach the UNAIDS 90-90-90 target?
AIDS. 2015; 29(18):2523–5. https://doi.org/10.1097/QAD.0000000000000864 PMID: 26558548.
3. Wittkop L, Gunthard HF, de Wolf F, Dunn D, Cozzi-Lepri A, de Luca A, et al. Effect of transmitted drug
resistance on virological and immunological response to initial combination antiretroviral therapy for HIV
(EuroCoord-CHAIN joint project): a European multicohort study. Lancet Infect Dis. 2011; 11(5):363–71.
https://doi.org/10.1016/S1473-3099(11)70032-9 PMID: 21354861.
4. Deutsche AIDS-Gesellschaft (DAIG), Osterreichische AIDS-Gesellschaft (OAIG), Deutsche Gesell-
schaft fur Innere Medizin (DGIM), Deutsche STI-Gesellschaft (DSTIG), Deutsche Gesellschaft fur
Infektiologie (DGI), Gesellschaft fur Virologie (GfV), et al. Deutsch-Osterreichische Leitlinien zur antire-
troviralen Therapie der HIV-Infektion. 2015. p. 50.
5. European AIDS Clinical Society (EACS). Guidelines Version 9.0 October 2017. European Guidelines
for treatment of HIV-infected adults in Europe2017.
6. WHO. Towards universal access: Scaling up priority HIV/AIDS interventions in the health sector Prog-
ress report 2010. 2010.
7. Hauser A, Hofmann A, Hanke K, Bremer V, Bartmeyer B, Kuecherer C, et al. National molecular surveil-
lance of recently acquired HIV infections in Germany, 2013 to 2014. Euro Surveill. 2017; 22(2). https://
doi.org/10.2807/1560-7917.ES.2017.22.2.30436 PMID: 28105988.
8. Keating P, Pharris A, Leitmeyer K, De Angelis S, Wensing A, Amato-Gauci AJ, et al. Assessment of
HIV molecular surveillance capacity in the European Union, 2016. Euro Surveill. 2017; 22(49). https://
doi.org/10.2807/1560-7917.ES.2017.22.49.17–00269 PMID: 29233253; PubMed Central PMCID:
PMCPMC5727594.
9. WHO. WHO HIV drug resistance laboratory strategy. 2010.
10. Bennett D, Camacho R, Otelea D, Kuritzkes D, Fleury H, Kiuchi M, et al. Drug resistance mutations for
surveillance of transmitted HIV-1 drug-resistance: 2009 update. PLoS One. 2009; 4(3):e4724. Epub
2009/03/07. https://doi.org/10.1371/journal.pone.0004724 PMID: 19266092; PubMed Central PMCID:
PMC2648874.
11. Rhee SY, Blanco JL, Jordan MR, Taylor J, Lemey P, Varghese V, et al. Geographic and temporal trends
in the molecular epidemiology and genetic mechanisms of transmitted HIV-1 drug resistance: an indi-
vidual-patient- and sequence-level meta-analysis. PLoS Med. 2015; 12(4):e1001810. https://doi.org/
10.1371/journal.pmed.1001810 PMID: 25849352; PubMed Central PMCID: PMCPMC4388826.
12. Hofstra LM, Sauvageot N, Albert J, Alexiev I, Garcia F, Struck D, et al. Transmission of HIV Drug Resis-
tance and the Predicted Effect on Current First-line Regimens in Europe. Clin Infect Dis. 2015. https://
doi.org/10.1093/cid/civ963 26620652. PMID: 26620652
13. Pursuing Later Treatment Option IIpt, Observational HIVEREG, Costagliola D, Lodwick R, Ledergerber
B, Torti C, et al. Trends in virological and clinical outcomes in individuals with HIV-1 infection and viro-
logical failure of drugs from three antiretroviral drug classes: a cohort study. Lancet Infect Dis. 2012; 12
(2):119–27. https://doi.org/10.1016/S1473-3099(11)70248-1 PMID: 21988895.
14. Little SJ, Frost SD, Wong JK, Smith DM, Pond SL, Ignacio CC, et al. Persistence of transmitted drug
resistance among subjects with primary human immunodeficiency virus infection. J Virol. 2008; 82
(11):5510–8. https://doi.org/10.1128/JVI.02579-07 PMID: 18353964; PubMed Central PMCID:
PMCPMC2395184.
15. Yang WL, Kouyos RD, Boni J, Yerly S, Klimkait T, Aubert V, et al. Persistence of transmitted HIV-1 drug
resistance mutations associated with fitness costs and viral genetic backgrounds. PLoS Pathog. 2015;
11(3):e1004722. https://doi.org/10.1371/journal.ppat.1004722 PMID: 25798934; PubMed Central
PMCID: PMCPMC4370492.
16. Yerly S, Rakik A, De Loes SK, Hirschel B, Descamps D, Brun-Vezinet F, et al. Switch to unusual amino
acids at codon 215 of the human immunodeficiency virus type 1 reverse transcriptase gene in
Increase of HIV non-B subtypes and NNRTI resistance in Germany between 2013-2016
PLOS ONE | https://doi.org/10.1371/journal.pone.0206234 November 8, 2018 16 / 18
73

seroconvertors infected with zidovudine-resistant variants. J Virol. 1998; 72(5):3520–3. PMID:
9557630; PubMed Central PMCID: PMCPMC109570.
17. Brenner BG, Thomas R, Blanco JL, Ibanescu RI, Oliveira M, Mesplede T, et al. Development of a
G118R mutation in HIV-1 integrase following a switch to dolutegravir monotherapy leading to cross-
resistance to integrase inhibitors. J Antimicrob Chemother. 2016; 71(7):1948–53. https://doi.org/10.
1093/jac/dkw071 PMID: 27029845; PubMed Central PMCID: PMCPMC4896408.
18. Clinical EA, EACS S. EACS Treatment Guidelines updated: Version 7.1—November 2014 2014.
19. Hofmann A, Hauser A, Zimmermann R, Santos-Hovener C, Batzing-Feigenbaum J, Wildner S, et al.
Surveillance of recent HIV infections among newly diagnosed HIV cases in Germany between 2008
and 2014. BMC Infect Dis. 2017; 17(1):484. https://doi.org/10.1186/s12879-017-2585-4 PMID:
28693564.
20. Meixenberger K, Yousef KP, Smith MR, Somogyi S, Fiedler S, Bartmeyer B, et al. Molecular evolution
of HIV-1 integrase during the 20 years prior to the first approval of integrase inhibitors. Virol J. 2017; 14
(1):223. https://doi.org/10.1186/s12985-017-0887-1 PMID: 29137637; PubMed Central PMCID:
PMCPMC5686839.
21. Hauser A, Meixenberger K, Machnowska P, Fiedler S, Hanke K, Hofmann A, et al. Robust and sensitive
subtype-generic HIV-1 pol genotyping for use with dried serum spots in epidemiological studies. J Virol
Methods. 2018; 259:32–8. https://doi.org/10.1016/j.jviromet.2018.05.013 PMID: 29859195.
22. Machnowska P, Hauser A, Meixenberger K, Altmann B, Bannert N, Rempis E, et al. Decreased emer-
gence of HIV-1 drug resistance mutations in a cohort of Ugandan women initiating option B+ for
PMTCT. PLoS One. 2017; 12(5):e0178297. https://doi.org/10.1371/journal.pone.0178297 PMID:
28562612; PubMed Central PMCID: PMCPMC5451067.
23. Pineda-Pena AC, Faria NR, Imbrechts S, Libin P, Abecasis AB, Deforche K, et al. Automated subtyping
of HIV-1 genetic sequences for clinical and surveillance purposes: performance evaluation of the new
REGA version 3 and seven other tools. Infect Genet Evol. 2013; 19:337–48. https://doi.org/10.1016/j.
meegid.2013.04.032 PMID: 23660484.
24. Struck D, Lawyer G, Ternes AM, Schmit JC, Bercoff DP. COMET: adaptive context-based modeling for
ultrafast HIV-1 subtype identification. Nucleic Acids Res. 2014; 42(18):e144. https://doi.org/10.1093/
nar/gku739 PMID: 25120265; PubMed Central PMCID: PMCPMC4191385.
25. Liu TF, Shafer RW. Web resources for HIV type 1 genotypic-resistance test interpretation. Clin Infect
Dis. 2006; 42(11):1608–18. https://doi.org/10.1086/503914 PMID: 16652319; PubMed Central PMCID:
PMCPMC2547473.
26. Nguyen LT, Schmidt HA, von Haeseler A, Minh BQ. IQ-TREE: a fast and effective stochastic algorithm
for estimating maximum-likelihood phylogenies. Mol Biol Evol. 2015; 32(1):268–74. https://doi.org/10.
1093/molbev/msu300 PMID: 25371430; PubMed Central PMCID: PMCPMC4271533.
27. Minh BQ, Nguyen MA, von Haeseler A. Ultrafast approximation for phylogenetic bootstrap. Mol Biol
Evol. 2013; 30(5):1188–95. https://doi.org/10.1093/molbev/mst024 PMID: 23418397; PubMed Central
PMCID: PMCPMC3670741.
28. Pouran Yousef K, Meixenberger K, Smith MR, Somogyi S, Gromoller S, Schmidt D, et al. Inferring HIV-
1 Transmission Dynamics in Germany From Recently Transmitted Viruses. J Acquir Immune Defic
Syndr. 2016; 73(3):356–63. https://doi.org/10.1097/QAI.0000000000001122 PMID: 27400403.
29. Ragonnet-Cronin M, Lycett SJ, Hodcroft EB, Hue S, Fearnhill E, Brown AE, et al. Transmission of Non-
B HIV Subtypes in the United Kingdom Is Increasingly Driven by Large Non-Heterosexual Transmission
Clusters. J Infect Dis. 2016; 213(9):1410–8. https://doi.org/10.1093/infdis/jiv758 PMID: 26704616;
PubMed Central PMCID: PMCPMC4813743.
30. Ragonnet-Cronin M, Hodcroft E, Hue S, Fearnhill E, Delpech V, Brown AJ, et al. Automated analysis of
phylogenetic clusters. BMC Bioinformatics. 2013; 14:317. https://doi.org/10.1186/1471-2105-14-317
PMID: 24191891; PubMed Central PMCID: PMCPMC4228337.
31. Hemelaar J, Gouws E, Ghys PD, Osmanov S. Global and regional distribution of HIV-1 genetic sub-
types and recombinants in 2004. AIDS. 2006; 20(16):W13–23. https://doi.org/10.1097/01.aids.
0000247564.73009.bc PMID: 17053344.
32. Esbjornsson J, Mild M, Audelin A, Fonager J, Skar H, Bruun Jorgensen L, et al. HIV-1 transmission
between MSM and heterosexuals, and increasing proportions of circulating recombinant forms in the
Nordic Countries. Virus Evol. 2016; 2(1):vew010. https://doi.org/10.1093/ve/vew010 PMID: 27774303;
PubMed Central PMCID: PMCPMC4989887.
33. Beloukas A, Psarris A, Giannelou P, Kostaki E, Hatzakis A, Paraskevis D. Molecular epidemiology of
HIV-1 infection in Europe: An overview. Infect Genet Evol. 2016; 46:180–9. https://doi.org/10.1016/j.
meegid.2016.06.033 PMID: 27321440.
34. Neogi U, Haggblom A, Santacatterina M, Bratt G, Gisslen M, Albert J, et al. Temporal trends in the
Swedish HIV-1 epidemic: increase in non-B subtypes and recombinant forms over three decades.
Increase of HIV non-B subtypes and NNRTI resistance in Germany between 2013-2016
PLOS ONE | https://doi.org/10.1371/journal.pone.0206234 November 8, 2018 17 / 18
74

PLoS One. 2014; 9(6):e99390. https://doi.org/10.1371/journal.pone.0099390 PMID: 24922326;
PubMed Central PMCID: PMCPMC4055746.
35. Zu Knyphausen F, Scheufele R, Kucherer C, Jansen K, Somogyi S, Dupke S, et al. First line treatment
response in patients with transmitted HIV drug resistance and well defined time point of HIV infection:
updated results from the German HIV-1 seroconverter study. PLoS One. 2014; 9(5):e95956. https://doi.
org/10.1371/journal.pone.0095956 PMID: 24788613; PubMed Central PMCID: PMC4006817.
36. Tostevin A, White E, Dunn D, Croxford S, Delpech V, Williams I, et al. Recent trends and patterns in
HIV-1 transmitted drug resistance in the United Kingdom. HIV Med. 2017; 18(3):204–13. https://doi.org/
10.1111/hiv.12414 PMID: 27476929; PubMed Central PMCID: PMCPMC5297994.
37. Fabeni L, Alteri C, Di Carlo D, Orchi N, Carioti L, Bertoli A, et al. Dynamics and phylogenetic relation-
ships of HIV-1 transmitted drug resistance according to subtype in Italy over the years 2000–14. J Anti-
microb Chemother. 2017; 72(10):2837–45. https://doi.org/10.1093/jac/dkx231 PMID: 29091206.
38. Institute RK. Klinische Aspekte der HIV-Versorgung Die ClinSurv-HIV-Kohorte Epidemiologisches Bul-
letin. 2016; 28. https://doi.org/10.17886/EpiBull-2016-045
39. Gupta RK, Gregson J, Parkin N, Haile-Selassie H, Tanuri A, Andrade Forero L, et al. HIV-1 drug resis-
tance before initiation or re-initiation of first-line antiretroviral therapy in low-income and middle-income
countries: a systematic review and meta-regression analysis. Lancet Infect Dis. 2017. https://doi.org/
10.1016/S1473-3099(17)30702-8 PMID: 29198909.
40. Paraskevis D, Kostaki E, Magiorkinis G, Gargalianos P, Xylomenos G, Magiorkinis E, et al. Prevalence
of drug resistance among HIV-1 treatment-naive patients in Greece during 2003–2015: Transmitted
drug resistance is due to onward transmissions. Infect Genet Evol. 2017; 54:183–91. https://doi.org/10.
1016/j.meegid.2017.07.003 PMID: 28688977.
41. Panichsillapakit T, Smith DM, Wertheim JO, Richman DD, Little SJ, Mehta SR. Prevalence of Transmit-
ted HIV Drug Resistance Among Recently Infected Persons in San Diego, CA 1996–2013. J Acquir
Immune Defic Syndr. 2016; 71(2):228–36. https://doi.org/10.1097/QAI.0000000000000831 PMID:
26413846; PubMed Central PMCID: PMCPMC4712087.
42. Drescher SM, von Wyl V, Yang WL, Boni J, Yerly S, Shah C, et al. Treatment-naive individuals are the
major source of transmitted HIV-1 drug resistance in men who have sex with men in the Swiss HIV
Cohort Study. Clin Infect Dis. 2014; 58(2):285–94. https://doi.org/10.1093/cid/cit694 PMID: 24145874.
43. Mbisa JL, Fearnhill E, Dunn DT, Pillay D, Asboe D, Cane PA, et al. Evidence of Self-Sustaining Drug
Resistant HIV-1 Lineages Among Untreated Patients in the United Kingdom. Clin Infect Dis. 2015; 61
(5):829–36. https://doi.org/10.1093/cid/civ393 PMID: 25991470.
44. Paraskevis D, Kostaki E, Gargalianos P, Xylomenos G, Lazanas M, Chini M, et al. Transmission
Dynamics of HIV-1 Drug Resistance among Treatment-Naive Individuals in Greece: The Added Value
of Molecular Epidemiology to Public Health. Genes (Basel). 2017; 8(11). https://doi.org/10.3390/
genes8110322 PMID: 29137167; PubMed Central PMCID: PMCPMC5704235.
45. Parczewski M, Leszczyszyn-Pynka M, Witak-Jedra M, Szetela B, Gasiorowski J, Knysz B, et al.
Expanding HIV-1 subtype B transmission networks among men who have sex with men in Poland.
PLoS One. 2017; 12(2):e0172473. https://doi.org/10.1371/journal.pone.0172473 PMID: 28234955;
PubMed Central PMCID: PMCPMC5325290.
46. Frange P, Assoumou L, Descamps D, Cheret A, Goujard C, Tran L, et al. HIV-1 subtype B-infected
MSM may have driven the spread of transmitted resistant strains in France in 2007–12: impact on sus-
ceptibility to first-line strategies. J Antimicrob Chemother. 2015; 70(7):2084–9. https://doi.org/10.1093/
jac/dkv049 PMID: 25885327.
47. Sayan M, Gunduz A, Ersoz G, Inan A, Deveci A, Ozgur G, et al. Integrase Strand Transfer Inhibitors
(INSTIs) Resistance Mutations in HIV-1 Infected Turkish Patients. HIV Clin Trials. 2016; 17(3):109–13.
https://doi.org/10.1080/15284336.2016.1153303 PMID: 27125365.
Increase of HIV non-B subtypes and NNRTI resistance in Germany between 2013-2016
PLOS ONE | https://doi.org/10.1371/journal.pone.0206234 November 8, 2018 18 / 18
75

Publikation 4
Hofmann, A, Bätzing, J, Marcus, U, Bremer, V, Bartmeyer, B: Wie viele Personen lassen sich in
Deutschland im niedergelassenen Bereich auf HIV testen?. Bundesgesundheitsbl 63, 1262–1270 (2020).
DOI: 10.1007/s00103-020-03210-y. Impact factor: 1,059 für 2019 (Quelle: Journal Citation Reports)
76

Originalien und Übersichten
Bundesgesundheitsblhttps://doi.org/10.1007/s00103-020-03210-y
© Der/die Autor(en) 2020
Alexandra Hofmann1,2 · Jörg Bätzing3 · Ulrich Marcus1 · Viviane Bremer1 ·Barbara Bartmeyer11 Abteilung für Infektionsepidemiologie, Fachgebiet HIV/AIDS und andere sexuell oder durch Blutübertragbare Infektionen, Robert Koch-Institut, Berlin, Deutschland
2 Charité Universitätsmedizin, Berlin, Deutschland3 Zentralinstitut für die kassenärztliche Versorgung in Deutschland (Zi), Berlin, Deutschland
Wie viele Personen lassen sichin Deutschland imniedergelassenen Bereichauf HIV testen?
Hintergrund
Ziele des gemeinsamen Programms derVereinten Nationen für HIV/AIDS (UN-AIDS) sind bis zum Jahr 2020, dass 90%der HIV-Infizierten von ihrer Infektionwissen, 90% davon eine antiretrovira-le Therapie (ART) erhalten und 90%unter Therapie eine Viruslast unter derNachweisgrenze aufweisen [1]. Im Jahr2015 ging man in Deutschland von et-wa 84.700 (78.300–91.100) Menschenmit einer HIV-Infektion aus. Etwa 15%(12.600; 11.300–14.100) war ihre In-fektion nicht bekannt. Diese Menschenmüssen mit Testangeboten erreicht wer-den [2].
Das Ziel, dass möglichst allen HIV-Infizierten ihr Status so früh wie möglichbekannt wird, kann durch intensiviertesTesten von Personen mit HIV-Infek-tionsrisiko erreicht werden. Zu denunterschiedlichen Testmöglichkeiten inDeutschland zählen z.B. niedrigschwel-lige anonyme Angebote der Aidshilfenoder der Gesundheitsämter. Im Be-reich der ambulanten vertragsärztlichenVersorgung kann z.B. bei Erkrankungs-verdacht oder im Rahmen des Schwan-gerschaftsscreenings auf HIV getestetwerden. Aber auch die Testung aufeigene Kosten ist möglich. Diese unter-schiedlichen Testmöglichkeiten machenes nahezu unmöglich zu ermitteln, wieviele Personen bundesweit insgesamt aufHIV getestet wurden und somit ihren
HIV-Status kennen. Dieser Indikator istjedoch unverzichtbar zur Evaluierungvon Präventionsmaßnahmen oder auchzur Überprüfung, ob zunehmende HIV-Neudiagnosen auf mehr durchgeführteHIV-Tests zurückzuführen sind.
Das Robert Koch-Institut (RKI) hatmehrfach Befragungen bei Laborendurchgeführt, um zu ermitteln, wie vieleHIV-Tests durchgeführt wurden [3–5].In diesen Befragungen wurde die An-zahl durchgeführter Tests und nicht dergetesteten Personen ermittelt. Hinzukommt, dass aufgrund einer Stufen-diagnostik oft mehrere Labore an derDiagnose einer HIV-Infektion beteiligtsind [6, 7]. Zudem soll ein positiverHIV-Bestätigungstest anhand einer wei-teren Probe derselben Person bestätigtwerden. Bei Laborerhebungen könnendaherPersonenmitHIV-Testsmehrmalsgezählt werden, wodurch die Anzahl derGetesteten überschätzt wird.
Seit 2015 werden in einem Projektder Deutschen Aidshilfe und des RKIdie inniedrigschwelligenTesteinrichtun-gen durchgeführten HIV-Tests ermittelt.Auch Gesundheitsämter wurden in derVergangenheit zu diesemThema befragt[8].DieHIV-Testhäufigkeit im ambulan-ten, vertragsärztlichen Bereich ist bishernicht bekannt. Für die Abschätzung derAnzahl der auf HIV getesteten Perso-nenstehenhiervertragsärztlicheAbrech-nungsdaten als Routinedaten der ambu-lanten Versorgung zur Verfügung. An-
hand dieser Datenquelle soll mit dieserAnalyse ermittelt werden, wie viele Ver-sicherte sich im Rahmen des ambulan-ten Leistungsangebots der gesetzlichenKrankenversicherung (GKV) innerhalbeines Jahres auf HIV haben testen las-sen. Ziel ist es, damit die HIV-Testhäu-figkeit in Deutschland besser beschrei-ben zu können und einen Indikator fürdie Umsetzung der UNAIDS-90–90–90-Strategie zu erhalten.
Methoden
Datenquelle und Daten-bereitstellung
Datengrundlage sind bundesweite,pseudonymisierte, krankenkassenüber-greifende, vertragsärztliche Abrech-nungsdaten gemäß § 295 SGB V derJahre 2010 bis 2015 (VDX-Daten; [9]).Die Generierung des Datenaggregatserfolgte schrittweise durch das Zentral-institut für die kassenärztlichen Vereini-gungen in Deutschland (Zi). Zunächstwurden GKV-Versicherte im Altersbe-reich 15–74 Jahre mit mindestens ei-nem Arztkontakt im vertragsärztlichenVersorgungssektor zwischen 2010 und2015 ermittelt, bei denen HIV-Such-tests (Nachweis von HIV-1- und HIV-2-spezifischen Antikörpern) durchgeführtwordenwaren.AnschließendwurdendieFälle mit HIV-Bestätigungstests (HIV-
Bundesgesundheitsblatt - Gesundheitsforschung - Gesundheitsschutz77

Originalien und Übersichten
Tab. 1 Gebührenordnungspositionen (GOP) nach einheitlichemBewertungsmaßstab (EBM) für denNachweis einer HIV-Infektion, Stand 4. Quartal2015 [10]
GOP Leistungsname Beschreibung Zusammen-gefasst als
01811 HIV-Immunoassay Untersuchung auf HIV-Antikörper bei einer Schwangeren mittels Immunoassay im Rahmen derMutterschaftsvorsorge
HIV-Suchtest
32575 HIV-1- oder HIV-1/2-Antikörper-Immuno-assay
HIV-1- und/oder HIV-1/2-Antikörper-Nachweismittels Immunoassay, ggf. einschl. HIV-Antigen-NachweismittelsHIV-Antigen-Antikörper-Kombinationstest
HIV-Suchtest
32576 HIV-2-Antikörper-Immunoassay
HIV-2-Antikörper-Nachweismittels Immunoassay, ggf. einschl. HIV-Antigen-NachweismittelsHIV-Antigen-Antikörper-Kombinationstest
HIV-Suchtest
32783 Nachweis von HIV Nachweis von Virus-Antigenen aus einem Körpermaterial (Direktnachweis)mittels Immunfluo-reszenz und/oder mittels Immunoassaymit photometrischer oder gleichwertigerMessung
HIV-Suchtest
32660 HIV-1-, HIV-2-Antikörper-Western-blot
Untersuchungen auf Antikörper gegen Krankheitserreger mittels Immunreaktionmit elektro-phoretisch aufgetrennten und/oder diagnostisch gleichwertigen rekombinantenmikrobiellen/viralen Antigenen (Immunoblot) als Bestätigungs- oder Abklärungstest nach positivem oderfraglich positivem Antikörpernachweis
HIV-Bestäti-gungstest
1-, HIV-2-Antikörper-Westernblot) er-mittelt.
Vertragsärztliche Leistungen wer-den über Gebührenordnungspositionen(GOP) aufBasis des einheitlichenBewer-tungsmaßstabes (EBM) quartalsweiseabgerechnet [10]. Die im EBM enthalte-nen GOP für die Labordiagnostik (HIV-Suchtests und HIV-Bestätigungstests)sind in . Tab. 1 zusammengefasst.
Die HIV-Diagnostik erfolgt in Stufen[6], sodass auch Personen mit einem aufden Suchtest zeitnah im selben Quartalbzw. im Folgequartal folgenden HIV-Bestätigungstest (im Folgenden Such-und Bestätigungstest) ermittelt werdenkonnten. Die aggregierten Datentabellenumfassten 5-Jahres-Altersgruppen, Ge-schlecht und Quartal der abgerechnetenLeistung. Zellenbesetzungen mit Wertenunter 30 konnten aus Datenschutzgrün-den nicht ausgegeben werden, sodassteilweise Aggregationsebenen mit grö-ßeren Altersgruppen gewählt wurden.Abgerechnete Leistungen mit wider-sprüchlichenoder fehlenden Informatio-nen zum Alter oder Geschlecht wurdenausgeschlossen. HIV-Tests im Rahmender Mutterschaftsvorsorge (GOP 01811)wurdennur für denAltersbereichder 15-bis 49-jährigen Frauen eingeschlossen.Um die Anzahl der schwangeren Frauenunter den weiblichen Versicherten zuermitteln, wurden Daten des Statisti-schen Bundesamtes genutzt. Die Anzahlder Lebendgeborenen, Totgeborenenund der durchgeführten Schwanger-schaftsabbrüche eines Jahres bei Frauen
im Alter von 15–49 Jahren wurden alsGesamtanzahl von Schwangerschaftenzusammengefasst [11, 12].1 Anschlie-ßend wurde der Anteil der GKV-versi-cherten Frauen [13] des Altersbereichs15–49 Jahre unter allen EinwohnerinnenDeutschlands [14] bestimmt und bei denSchwangerschaften berücksichtigt.
Vergleich mit HIV-Neudiagnosengem. Infektionsschutzgesetz (§7.3IfSG)
ImRahmendes Infektionsschutzgesetzeserfolgt eine nichtnamentliche Meldung(IfSG §7, Absatz 3) aller labordiagno-stisch bestätigten HIV-Infektionen inDeutschland direkt an das Robert Koch-Institut; daraus ergibt sich die Anzahlder jährlichen HIV-Neudiagnosen. Umdie Übereinstimmung der Verteilungder getesteten Personen nach Alter undGeschlecht mit den neudiagnostiziertenHIV-Infektionen abzuschätzen, wur-den die Personen mit HIV-Such- undBestätigungstest mit den gemäß In-fektionsschutzgesetz gemeldeten HIV-Neudiagnosen (IfSG §7.3) verglichen[15].
1 Quelle: Statistisches Bundesamt (Destatis);Tabelle zur Anzahl der Totgeborenen nach demAlter der Mutter und Familienstand der Eltern2010–2015,persönlicheKommunikation.
Statistische Auswertung
Die Analyse der Daten erfolgte am RKI.Die Ergebnisse wurden deskriptiv dar-gestellt. HIV-Bestätigungstests sind nurdann abrechnungsfähig, wenn diese zurAbklärung positiver oder fraglich posi-tiver Antikörpernachweise durchgeführtwerden [10]. Indirekt ergibt sich somitderAnteil reaktiver Suchtests (Reaktivra-te). Um zeitliche Trends zu erkennen,wurden lineare Regressionen durchge-führt, wobei das Jahr des Tests die un-abhängige Variable und Alter oder Ge-schlecht jeweils die abhängige Variabledarstellten. Bei einem p-Wert ≤0,05 wur-de ein signifikant steigender bzw. sinken-der linearerTrendangenommen.DieAn-zahl der getesteten Personen je 100.000GKV-Versicherte wurde nach Alter undGeschlecht stratifiziert ermittelt [13].DieAuswertung erfolgte mit Excel und StataVersion 14.2.
Ergebnisse
Personen mit abgerechnetenHIV-Suchtests
Für insgesamt 5.487.703 Personen mitabgerechneten HIV-Suchtests zwischen2010 und 2015 konnten weitere Analy-sen durchgeführt werden (. Abb. 1). In. Abb. 1 und in . Tab. 2 ist die Anzahlder jährlich getesteten Personen zu fin-den, diese schwankte zwischen 864.065und 999.465 jährlich getesteten Personen
Bundesgesundheitsblatt - Gesundheitsforschung - Gesundheitsschutz 78

(getestete Männer: 150.073–176.215; ge-testete Frauen: 713.992–823.250).
Für die Analyse der HIV-Suchtests,die im Rahmen der Mutterschaftsvor-sorge (GOP 01811) durchgeführt wur-den, wurden insgesamt 3134 abgerech-nete Leistungenmit fehlenden, unplausi-blenoderwidersprüchlichenInformatio-nen (Frauen über 50 Jahren n= 1161, un-bekanntesGeschlechtundAltern=1291,Männer n= 682) von den weiteren Ana-lysen ausgeschlossen. Weitere 12.211 ab-gerechnete Leistungen von Personen, beidenen eine Angabe zumGeschlecht oderzum Alter fehlte, wurden ebenfalls aus-geschlossen.
Jährlich wurden im Durchschnitt1,7% der GKV-Versicherten (2,7%Frauen und 0,6% Männer) auf HIVgetestet (. Abb. 1). Die Anzahl der ge-testeten Personen stieg im Zeitverlaufum 15% (p= 0,003) an, für Frauen um15,2% (p= 0,002) und für Männer um16,6% (p= 0,003; . Tab. 2). Im Durch-schnitt entfielen 82,5% der jährlichenHIV-Suchtests auf Frauen und davon81,2% auf HIV-Suchtests im Rahmender Mutterschaftsvorsorge (. Tab. 2).Vergleicht man die Anzahl der Schwan-gerschaften mit der Anzahl der durch-geführten HIV-Tests im Rahmen derMutterschaftsvorsorge, ist zu erkennen,dass sowohl die Anzahl der Schwan-gerschaften bei gesetzlich versichertenFrauen als auch der Anteil der schwan-geren Frauen mit einem HIV-Suchtestim Rahmen der Mutterschaftsvorsorge(Anstieg um 7,2% bzw. 15,5%; p= 0,017bzw. p= 0,004) angestiegen ist (. Tab. 3).
Die Anzahl der HIV-Suchtests je100.000 gesetzlich Versicherte stieg beiMännern und Frauen in denmeisten Al-tersgruppen an. Ausnahmen bildeten beiMännern die Altersgruppen 15–24 Jahre(p= 0,077) und 25–29 Jahre (p= 0,363)und bei Frauen die Altersgruppe der 15-bis 24-Jährigen, in der die Anzahl derSuchtests imZeitverlauf sogar signifikantabnahm (. Abb. 2a,b).
HIV-Bestätigungstests
Zwischen 2010 und 2015 wurde bei17.405 Personen mindestens ein HIV-Bestätigungstest abgerechnet. Davonhatten 7,9% (n= 1371 Personen) einen
Zusammenfassung · Abstract
Bundesgesundheitsbl https://doi.org/10.1007/s00103-020-03210-y© Der/die Autor(en) 2020
A. Hofmann · J. Bätzing · U. Marcus · V. Bremer · B. Bartmeyer
Wie viele Personen lassen sich in Deutschland imniedergelassenen Bereich auf HIV testen?
ZusammenfassungHintergrund. Die Anzahl der in Deutschlandauf HIV getesteten Personen ist schwerzu ermitteln. Unter bestimmten Voraus-setzungen sind HIV-Tests Leistung dergesetzlichen Krankenversicherung (GKV).Ziel dieser Analyse war die Untersuchungdes Testumfangs in der vertragsärztlichenVersorgung.Methoden. Vertragsärztliche Abrech-nungsdaten des Zentralinstituts für diekassenärztliche Versorgung (Zi) wurdenhinsichtlich HIV-Such- und -Bestätigungstestsder Jahre 2010–2015 analysiert. Die Aus-wertung erfolgte deskriptiv; zeitliche Trendswurden mit linearen Regressionen überprüft.Die Anzahl der Bestätigungstests wurdemit den an das Robert Koch-Institut (RKI)gemeldeten HIV-Neudiagnosen verglichen.Ergebnisse. Im Jahresdurchschnitt wurden1,7% der GKV-Versicherten auf HIV getestet.Der Suchtestumfang stieg im Zeitverlauf an.Durchschnittlich 82,5% der Untersuchtenwaren Frauen, von denen 81,2% währendder Schwangerschaft getestet wurden.
Bestätigungstests wurden im Gesamtzeit-raum bei 16.034 Versicherten durchgeführt(durchschnittlich 0,3% der VersichertenmitSuchtest), darunter im Durchschnitt 51,2%Männer. Im selben Zeitraumwurden 18.446HIV-Neudiagnosen (davon 82,8% Männer)ans RKI gemeldet.Schlussfolgerung. Erstmalig wurde diePersonenzahl mit HIV-Test im Bereich derGKV bestimmt. Die hohe Suchtestzahl beiFrauen ist auf Tests in der Schwangerschaftzurückzuführen. Aus der im Vergleich zu dengemeldeten HIV-Neudiagnosen geringerenZahl von abgerechneten Bestätigungstestskann geschlossen werden, dass in unbekann-tem Umfang in anderen Testeinrichtungenund nicht über die GKV auf HIV getestet unddiagnostiziert wurde.
SchlüsselwörterSekundärdatenanalyse · Versorgungs-forschung · HIV-Tests · AmbulanteAbrechnungsleistungen · Vertragsärzte
Howmany people have been tested for HIV in the outpatientsector in Germany?
AbstractBackground. Estimating the numberof persons tested for HIV in Germany ischallenging. HIV testing can be reimbursedby statutory health insurance (SHI) undercertain circumstances. This study aimed to useSHI physician claims data to determine thenumber of persons tested in the outpatientsector.Methods. The Central Research Institutefor Ambulatory Health Care in Germany(Zi) aggregated a dataset of persons testedfor HIV among all SHI insurees. Descriptiveanalysis differentiated between screeningand confirmatory HIV tests. Time trends wereexplored using linear regression. Insureeswith confirmatory tests were compared tonewly diagnosed HIV (ndHIV) cases.Results. Between 2010 and 2015, 1.7%of insurees were annually screened bySHI physicians. Screening tests increased
significantly between 2010 and 2015. Amongpersons screened, 82.5% were womenand of those 81.2% had a screening testduring pregnancy. Confirmatory tests wereperformed on 16,034 insurees (0.3% withscreening test; 51.2%men). A total of 18,446(82.8% men) ndHIV cases were notifiedbetween 2010 and 2015.Conclusions. For the first time, the numberof persons with HIV tests in the SHI sectorwas estimated. The high number of screenedwomen is due to tests during pregnancy. Thehigher number of ndHIV cases indicates anunknown number of persons tested at othertesting sites.
KeywordsSecondary data analysis · Health servicesresearch · HIV tests · Ambulatory medicalcare · SHI physicians
Bundesgesundheitsblatt - Gesundheitsforschung - Gesundheitsschutz79
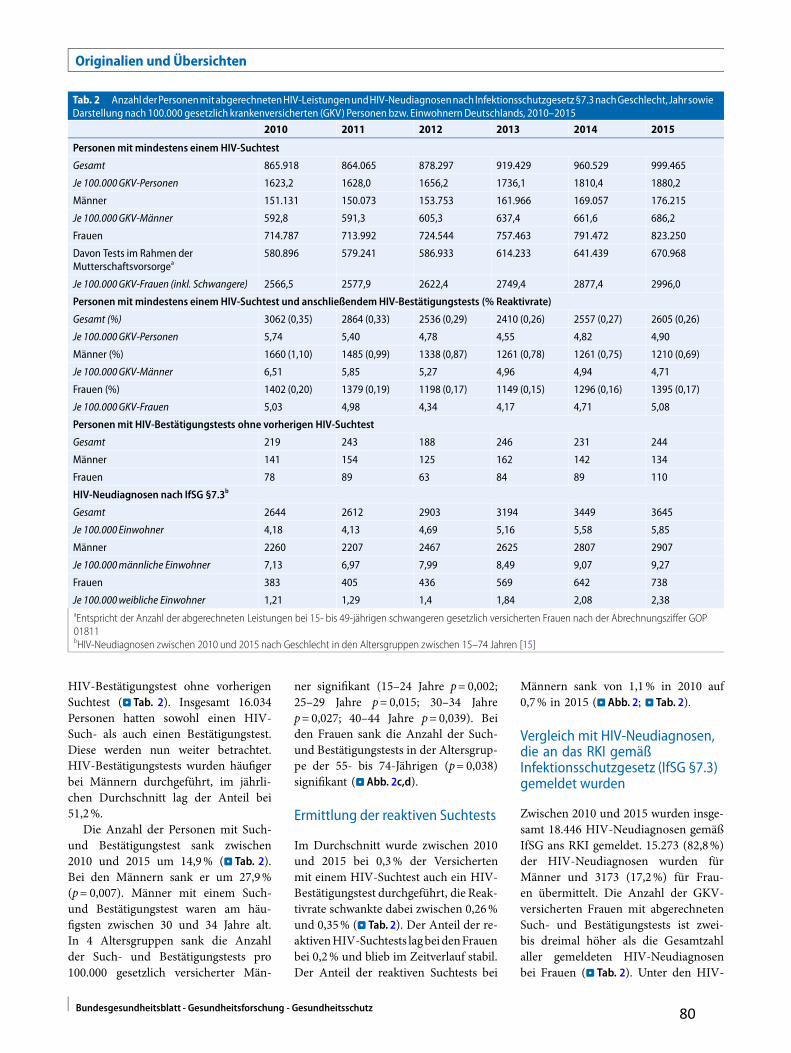
Originalien und Übersichten
Tab. 2 AnzahlderPersonenmitabgerechnetenHIV-LeistungenundHIV-NeudiagnosennachInfektionsschutzgesetz§7.3nachGeschlecht,JahrsowieDarstellung nach 100.000 gesetzlich krankenversicherten (GKV) Personen bzw. EinwohnernDeutschlands, 2010–2015
2010 2011 2012 2013 2014 2015
Personenmit mindestens einemHIV-Suchtest
Gesamt 865.918 864.065 878.297 919.429 960.529 999.465
Je 100.000GKV-Personen 1623,2 1628,0 1656,2 1736,1 1810,4 1880,2
Männer 151.131 150.073 153.753 161.966 169.057 176.215
Je 100.000GKV-Männer 592,8 591,3 605,3 637,4 661,6 686,2
Frauen 714.787 713.992 724.544 757.463 791.472 823.250
Davon Tests im Rahmen derMutterschaftsvorsorgea
580.896 579.241 586.933 614.233 641.439 670.968
Je 100.000GKV-Frauen (inkl. Schwangere) 2566,5 2577,9 2622,4 2749,4 2877,4 2996,0
Personenmit mindestens einemHIV-Suchtest und anschließendemHIV-Bestätigungstests (% Reaktivrate)
Gesamt (%) 3062 (0,35) 2864 (0,33) 2536 (0,29) 2410 (0,26) 2557 (0,27) 2605 (0,26)
Je 100.000GKV-Personen 5,74 5,40 4,78 4,55 4,82 4,90
Männer (%) 1660 (1,10) 1485 (0,99) 1338 (0,87) 1261 (0,78) 1261 (0,75) 1210 (0,69)
Je 100.000GKV-Männer 6,51 5,85 5,27 4,96 4,94 4,71
Frauen (%) 1402 (0,20) 1379 (0,19) 1198 (0,17) 1149 (0,15) 1296 (0,16) 1395 (0,17)
Je 100.000GKV-Frauen 5,03 4,98 4,34 4,17 4,71 5,08
Personenmit HIV-Bestätigungstests ohne vorherigen HIV-Suchtest
Gesamt 219 243 188 246 231 244
Männer 141 154 125 162 142 134
Frauen 78 89 63 84 89 110
HIV-Neudiagnosen nach IfSG §7.3b
Gesamt 2644 2612 2903 3194 3449 3645
Je 100.000 Einwohner 4,18 4,13 4,69 5,16 5,58 5,85
Männer 2260 2207 2467 2625 2807 2907
Je 100.000männliche Einwohner 7,13 6,97 7,99 8,49 9,07 9,27
Frauen 383 405 436 569 642 738
Je 100.000weibliche Einwohner 1,21 1,29 1,4 1,84 2,08 2,38aEntspricht der Anzahl der abgerechneten Leistungen bei 15- bis 49-jährigen schwangeren gesetzlich versicherten Frauen nach der Abrechnungsziffer GOP01811bHIV-Neudiagnosen zwischen 2010 und 2015 nach Geschlecht in den Altersgruppen zwischen 15–74 Jahren [15]
HIV-Bestätigungstest ohne vorherigenSuchtest (. Tab. 2). Insgesamt 16.034Personen hatten sowohl einen HIV-Such- als auch einen Bestätigungstest.Diese werden nun weiter betrachtet.HIV-Bestätigungstests wurden häufigerbei Männern durchgeführt, im jährli-chen Durchschnitt lag der Anteil bei51,2%.
Die Anzahl der Personen mit Such-und Bestätigungstest sank zwischen2010 und 2015 um 14,9% (. Tab. 2).Bei den Männern sank er um 27,9%(p= 0,007). Männer mit einem Such-und Bestätigungstest waren am häu-figsten zwischen 30 und 34 Jahre alt.In 4 Altersgruppen sank die Anzahlder Such- und Bestätigungstests pro100.000 gesetzlich versicherter Män-
ner signifikant (15–24 Jahre p= 0,002;25–29 Jahre p= 0,015; 30–34 Jahrep= 0,027; 40–44 Jahre p= 0,039). Beiden Frauen sank die Anzahl der Such-und Bestätigungstests in der Altersgrup-pe der 55- bis 74-Jährigen (p= 0,038)signifikant (. Abb. 2c,d).
Ermittlung der reaktiven Suchtests
Im Durchschnitt wurde zwischen 2010und 2015 bei 0,3% der Versichertenmit einem HIV-Suchtest auch ein HIV-Bestätigungstest durchgeführt, die Reak-tivrate schwankte dabei zwischen 0,26%und 0,35% (. Tab. 2). Der Anteil der re-aktivenHIV-Suchtests lagbeidenFrauenbei 0,2% und blieb im Zeitverlauf stabil.Der Anteil der reaktiven Suchtests bei
Männern sank von 1,1% in 2010 auf0,7% in 2015 (. Abb. 2; . Tab. 2).
Vergleich mit HIV-Neudiagnosen,die an das RKI gemäßInfektionsschutzgesetz (IfSG §7.3)gemeldet wurden
Zwischen 2010 und 2015 wurden insge-samt 18.446 HIV-Neudiagnosen gemäßIfSG ans RKI gemeldet. 15.273 (82,8%)der HIV-Neudiagnosen wurden fürMänner und 3173 (17,2%) für Frau-en übermittelt. Die Anzahl der GKV-versicherten Frauen mit abgerechnetenSuch- und Bestätigungstests ist zwei-bis dreimal höher als die Gesamtzahlaller gemeldeten HIV-Neudiagnosenbei Frauen (. Tab. 2). Unter den HIV-
Bundesgesundheitsblatt - Gesundheitsforschung - Gesundheitsschutz 80

Abb. 18DarstellungderStudienpopulationvongesetzlichkrankenversicherten (GKV)Personenzwischen15und74 JahrenmitmindestenseinemabgerechnetenHIV-Test zwischen2010und2015. (Quellen:VDX-Daten,2010–2015[9];KM-6-Statistik,2010–2015 [13])
Neudiagnosen lag 2010 der Anteil derFrauen bei 14,5% und 2015 bei 20,2%.Bei den Such- und Bestätigungstests lagder Anteil der Frauen bei 45,8% in 2010und bei 53,6% in 2015.
Die Anzahl der abgerechneten Such-und Bestätigungstests bei GKV-versi-cherten Männern ist niedriger als dieAnzahl der an das RKI übermittel-ten HIV-Neudiagnosen bei Männern(. Tab. 2). Im zeitlichen Verlauf sank dieAnzahl der abgerechneten Such- und Be-stätigungstests bei Männern (p= 0,007),im selben Zeitraum stieg die Anzahl derHIV-Neudiagnosen (p= 0,001; . Tab. 2).
Diskussion
Mit der vorliegenden Untersuchungkonnte erstmalig im Bereich der GKVder ambulant auf HIV getestete Ver-sichertenanteil im Zeitverlauf ermitteltwerden. Am häufigsten wurden Frauenim Rahmen der Mutterschaftsvorsorgegetestet. Im Vergleich zu den an dasRKI gemeldeten HIV-Neudiagnosen beiMännern fiel auf, dass die Anzahl derMänner mit einem Such- und Bestäti-
gungstests niedriger ist als die Anzahlder ans RKI übermittelten HIV-Neudia-gnosen.
HIV-Suchtests
Von 2010 bis 2015 wurden im Durch-schnitt 1,7% Versicherte (2,7% Frau-en und 0,6% Männer), also zwischen864.065 und 960.529 Personen jährlichambulant auf HIV getestet. Es wurdenmehrFrauenalsMänneraufHIVgetestet,was wahrscheinlich auf das Angebot derHIV-Testung im Rahmen der Schwan-gerschaftsvorsorge zurückzuführen ist.Das RKI schätzte, dass 2015 etwa 69.500(64.500–74.600)Männer in Deutschlandmit einer HIV-Infektion leben, davonwissen 58.800 (54.800–63.500) Männervon ihrer HIV-Infektion und etwa 15%(10.500; 9400–11.900) der Männer sindinfiziert, aber nicht diagnostiziert [2].Vor diesemHintergrund sind die Anzahlund der Anteil der gesetzlich versicher-ten Männer, bei denen sowohl ein HIV-Suchtest als auch ein Bestätigungstestdurchgeführt wurde, sehr gering, da we-niger als 1% der gesetzlich versicherten
Männer im ambulanten Bereich auf HIVgetestet wurde.
DersignifikanteAnstiegderabgerech-neten Suchtests bei Frauen ist auf die Tes-tungen im Rahmen der Mutterschafts-vorsorge zurückzuführen, da gleichzeitigein Anstieg der Schwangerschaften undder Inanspruchnahme desHIV-Schwan-gerenscreenings beobachtet wurde. DerAnteil schwangerer Frauen in der GKVmit einem HIV-Suchtest ist von 84,0%im Jahr 2010 auf 90,5% in 2015 ange-stiegen, erscheint im Vergleich zu ande-ren Ländern aber noch immer zu nied-rig. So lag der Anteil der schwangerenFrauenmit HIV-Tests in London im Jahr2007 bei 95,1% [16], in den Niederlan-den 2006–2008 bei 99,8% [17] und inOntario (Kanada) 2010 bei 96% [18].
SeitSeptember2007soll jederschwan-geren Frau vom niedergelassenen Arztein HIV-Test angeboten und im Mutter-pass als „Beratung der Schwangeren zumHIV-Antikörpertest“ dokumentiertwer-den [19]. Ob tatsächlich jeder schwange-ren Frau ein HIV-Test angeboten wur-de, ist jedoch unklar. Eine 10-prozenti-ge Ablehnungsrate erscheint angesichts
Bundesgesundheitsblatt - Gesundheitsforschung - Gesundheitsschutz81

Originalien und Übersichten
Tab. 3 Ermittlungder schwangeren Frauenunter dengesetzlich versicherten (GKV) Frauen sowieAnteil der Schwangerenmit einemHIV-Suchtest imRahmenderMutterschaftsvorsorge bei Frauen zwischen15und 49 Jahren, 2010–2015
2010 2011 2012 2013 2014 2015
Anzahl lebendgeborene Kinder von Müttern in der Alters-gruppe 15–49 Jahrea
677.801 662.526 673.399 681.906 714.743 737.371
Anzahl Schwangerschaftsabbrüche in der Altersgruppe15–49 Jahrea
109.984 108.471 106.425 102.465 99.332 98.876
Anzahl Totgeburten von Frauen in der Altersgruppe der 15-bis 49-Jährigena
2465 2383 2398 2556 2595 2787
Gesamtanzahl (entspricht der Anzahl von Schwangerschaf-ten in der Altersgruppe 15–49 Jahre)
790.250 773.380 782.222 786.927 816.670 839.034
Weibliche Einwohner Deutschlands im Alter zwischen15–49 Jahrena
18.458.137 17.934.712 17.780.227 17.612.453 17.463.924 17.436.464
Gesetzlich krankenversicherte (GKV) Frauen zwischen15–49 Jahrenb
16.150.789 15.922.458 15.763.147 15.601.346 15.491.477 15.402.456
Schwangere GKV-Frauen zwischen 15–49 Jahrenc 691.465 686.608 693.483 697.070 724.432 741.159
GKV-Frauen mit HIV-Test im Rahmen der Mutterschaftsvor-sorge
580.896 579.241 586.933 614.233 641.439 670.968
Anteil GKV-schwangere Frauen mit HIV-Suchtest 84,0% 84,4% 84,6% 88,1% 88,5% 90,5%aQuelle: Statistisches Bundesamt [11, 12]; Statistisches Bundesamt (Destatis); Tabelle zur Anzahl der Totgeborenen nach dem Alter der Mutter und Familien-stand der Eltern 2010–2015, persönliche KommunikationbQuelle: KM-6-Statistik der GKV-Personen [13]cQuelle: eigene Berechnung der Anzahl der GKV-Frauen unter der weiblichen Bevölkerung Deutschlands multipliziert mit der Anzahl der Schwangeren einesJahres
der hochwirksamen Interventionsmög-lichkeiten zur Verhinderung einer HIV-Übertragung auf das Kind schwer vor-stellbar. Es ist jedoch somit nicht auszu-schließen, dass schwangere Frauen ande-re HIV-Testangebote außerhalb der Ver-sorgung im GKV-Sektor wahrnehmen.2015 wurde vomGemeinsamen Bundes-ausschuss (G-BA) beschlossen, dass dieDurchführung des HIV-AntikörpertestsimMutterpassdokumentiertwerdensoll.Es bleibt abzuwarten, ob sich der An-teil der getesteten Schwangeren dadurchweiter erhöht [20].
HIV-Bestätigungstest
Nicht hinter jedem abgerechneten Such-und Bestätigungstest steht eine positi-ve Diagnose, die an das RKI gemeldetwird. Insbesondere bei der Testung vonSchwangeren, einer Bevölkerungsgrup-pemit sehr niedriger HIV-Prävalenz, ge-langtmanmit den zurVerfügung stehen-den HIV-Suchtests selbst bei einer sehrhohen Spezifität in einenBereich, in demder positive Vorhersagewert eines reak-tivenSuchtestergebnisseswahrscheinlichkleiner als 50% ist.
BeiMännern ist dieHIV-Prävalenz inDeutschland deutlich höher als bei Frau-
en. Daher ist auch der positive Vorhersa-gewert eines reaktiven Suchtestergebnis-ses deutlich besser. Dabei ist zu berück-sichtigen, dass es bei Männern kein Rou-tinescreening wie bei Schwangeren gibt,sodass sich überwiegend Männer testenlassen, die für sich auch ein Infektions-risiko vermuten. Auch dies erhöht denpositivenVorhersagewert eines reaktivenSuchtestergebnisses. Trotzdem bleibt dieZahl der reaktiven Suchtests bei gesetz-lich Versicherten deutlich unter der Zahlder gemeldeten HIV-Neudiagnosen vonMännern.
Dem RKI werden alle bestätigtenHIV-Neudiagnosen gemeldet, auchwenn diese in anderen Testsettings(z.B. öffentlicher Gesundheitsdienst,Krankenhäuser) diagnostiziert wurden,sodass HIV-Neudiagnosen aus dem nie-dergelassenen Bereich nur einen Teilaller Neudiagnosen darstellen.
Zudem sind etwa 15% der Bevölke-rungnicht inderGKV,sonderninderpri-vaten Krankenversicherung (PKV) ver-sichert. HIV-Neudiagnosen aus diesemPersonenkreis tauchen somitnicht indenAbrechnungsdatendesGKV-Sektors auf.So hat das Wissenschaftliche Institut derPKV 2013 festgestellt, dass unter pri-vat versicherten Personen der Anteil der
HIV-Infizierten höher ist als in der Ge-samtbevölkerung [21].
Am häufigsten wurden schwange-re Frauen im niedergelassenen Bereichgetestet, wohingegen sich die meistenHIV-Neudiagnosen bei Männern, vorallem beiMännern, die SexmitMännernhaben (MSM), finden [22]. Der AnteilvonHIV-Infektionenunter schwangerenFrauen ist sehr niedrig [17, 18], daherentspricht die geringe Anzahl reaktiverSuchtests den Erwartungen.
Im Jahr 2015 befanden sich unterden HIV-Neudiagnosen 79,6% Männerund davon waren 63,3% MSM [22].Bei einer Befragung von MSM gaben44% der Befragten an, dass sie ihrenletzten HIV-Test bei einem niederge-lassenen Arzt hatten [23]. Dies ist mitden Ergebnissen dieser Studie durchausvereinbar und würde bedeuten, dass eingroßer Teil derHIV-Tests beiMSM, aberauch bei Männern mit anderen Trans-missionsrisiken andernorts erfolgt, z.B.in Krankenhäusern, Gesundheitsämternund HIV-Testeinrichtungen, die sichspeziell an MSM richten. Die abneh-mende Reaktivrate bei Männern könntedaraufhindeuten, dassHIV-Tests zuneh-mend in solchen Einrichtungen erfolgen.Dafür spricht auch, dass beispielsweise
Bundesgesundheitsblatt - Gesundheitsforschung - Gesundheitsschutz 82

Abb. 29 Zeittrends der abgerechnetenHIV-Suchtest undHIV-Such- undBestätigungstestsbei gesetzlich krankenversichertenMännernund Frauen zwischen 2010 und 2015. aMännermit HIV-Suchtests,b Frauenmit HIV-Suchtests,cMännermit HIV-Such- undBestätigungstests,d Frauenmit HIV-Such- undBestätigungstests
in einer niedrigschwelligen Testeinrich-tung für MSM eine HIV-Positivrate von2,9% gefunden wurde [24], und dasLandeszentrum Gesundheit Nordrhein-Westfalen (NRW) berichtet von einerHIV-Positivrate von 1,0% in 2011 und1,2% in 2014 für Gesundheitsämter inNRW [25].
Limitationen
Die Daten beinhalten nur ambulantabgerechnete Leistungen aus dem Be-reich der GKV. HIV-Tests für privatversicherte Personen oder die HIV-Tests, die von Personen in Arztpraxenselbst bezahlt oder in anderen Test-settings durchgeführt wurden, sind indieser Analyse nicht enthalten. Um dieGesamtanzahl der getesteten Personenin Deutschland zu erhalten, muss zuden vertragsärztlich veranlassten HIV-Tests noch eine unbekannte Anzahl vonHIV-Tests aus anderen Sektoren hin-zugerechnet werden. Daten zu HIV-Diagnosen im Anschluss an die HIV-Stufendiagnostik konnten aufgrund desam Zi verfügbaren Datenbestands nichtmit ausreichender Sicherheit zugeord-net werden, sodass ein abschließenderVergleich von Personen mit Such- undBestätigungstests und anschließenderHIV-Diagnose im niedergelassenen Be-reich mit den HIV-Neudiagnosen nichtmöglich war. Weiterhin liegen am Ziausschließlich pseudonymisierte Daten(nach Vorname, Nachname, Geburtsda-tum) vor, sodass beispielsweise bei derÄnderung des Nachnamens ein neuesPseudonym entstehen kann und Perso-nen mehrmals gezählt werden können.DerHIV-Test inderSchwangerschaftsollzu einem möglichst frühen Zeitpunktin der Schwangerschaft durchgeführtwerden [26]. Daher sind HIV-Testsbei Schwangeren auch im Jahr vor derGeburt möglich, was in dieser Unter-suchung über einen 6-Jahres-Zeitraum
Bundesgesundheitsblatt - Gesundheitsforschung - Gesundheitsschutz83

Originalien und Übersichten
jedoch mit großer Wahrscheinlichkeitausgeglichen wird.
Schlussfolgerung undEmpfehlung
Auch wenn die Anzahl durchgeführterSuch- und Bestätigungstests in Arztpra-xen niedrig erscheint, spielt die Arzt-praxis dennoch eine zentrale Rolle beider Identifikation und Versorgung vonHIV-infiziertenPersonen, denn fast 90%der erwachsenen Bevölkerung Deutsch-lands besuchen mindestens einmal imJahreinenniedergelassenenArzt [27].Daetwa 50% der HIV-Neudiagnosen späterfolgen [28, 29], könnte die intensive-re Propagierung von HIV-Tests im am-bulanten vertragsärztlichenBereichdazubeitragen, Infektionen frühzeitig zu er-kennen, zu behandeln und Übertragun-gen zu verhindern [30].
Korrespondenzadresse
Alexandra HofmannAbteilung für Infektionsepidemiologie,Fachgebiet HIV/AIDS und andere sexuell oderdurch Blut übertragbare Infektionen, RobertKoch-InstitutSeestr. 10, 13353 Berlin, [email protected]
Funding. Open Access funding provided by ProjektDEAL.
Einhaltung ethischer Richtlinien
Interessenkonflikt. A. Hofmann, J. Bätzing, U.Mar-cus undB. Bartmeyer geben an, dass kein Interes-senkonflikt besteht. V. BremerwurdenReise- undÜbernachtungskosten sowie TeilnehmergebührenvonderDeutschen STI-Gesellschaft erstattet und sieerhielt ein Vortragshonorar vonder ÄrztekammerWestfalen-Lippe. Sie erhielt außerdemDrittmittel desBundesministeriums für Gesundheit.
Für diesenBeitragwurden vondenAutoren keineStudien anMenschenoder Tierendurchgeführt.Für die aufgeführten Studiengelten die jeweils dortangegebenen ethischenRichtlinien.
Open Access.Dieser Artikelwird unter der CreativeCommonsNamensnennung4.0 International Lizenzveröffentlicht, welche dieNutzung, Vervielfältigung,Bearbeitung, VerbreitungundWiedergabe in jegli-chemMediumundFormat erlaubt, sofern Sie den/dieursprünglichenAutor(en)unddieQuelle ordnungsge-mäßnennen, einen Link zur Creative Commons Lizenzbeifügenundangeben, obÄnderungen vorgenom-menwurden.
Die in diesemArtikel enthaltenenBilder und sonstigesDrittmaterial unterliegen ebenfalls der genanntenCreative Commons Lizenz, sofern sich aus der Abbil-dungslegendenichts anderes ergibt. Sofern das be-treffendeMaterial nicht unter der genanntenCreativeCommons Lizenz steht unddie betreffendeHandlungnicht nachgesetzlichenVorschriften erlaubt ist, ist fürdie oben aufgeführtenWeiterverwendungendesMa-terials die Einwilligungdes jeweiligen Rechteinhaberseinzuholen.
WeitereDetails zur Lizenz entnehmenSie bitte derLizenzinformation auf http://creativecommons.org/licenses/by/4.0/deed.de.
Literatur
1. UNAIDS (2014)90–90–90Anambitious treatmenttarget to help end the AIDS epidemic. http://www.unaids.org/sites/default/files/media_asset/90-90-90_en_0.pdf.Zugegriffen:16.Mai2019
2. Robert Koch-Institut (2016) Schätzung derPrävalenz und Inzidenz von HIV-Infektionen inDeutschland, Stand Ende 2015. Epidemiol Bull45:497–509
3. Robert Koch-Institut (2006) Zu in DeutschlanddurchgeführtenHIV-Such-und-BestätigungstestsimJahr2004.EpidemiolBull2006:2–5
4. Robert Koch-Institut (2010) Webbasierte Erhe-bung zur HIV-Diagnostik in Deutschland 2009.EpidemiolBull2010:391–395
5. Robert Koch-Institut (2015) „HIV-Nennerstudie“:Online Laborbefragung zur Bestandsaufnah-me der HIV-Diagnostik in Deutschland 2011.EpidemiolBull07:47–50
6. Rabenau HF, Bannert N, Berger A et al (2015)Nachweis einer Infektion mit Humenem Im-mundefizienzvirus (HIV): Serologisches Screeningmit nachfolgender Bestätigungsdiagnostik durchAntikörper-basierte Testsysteme und/oder durchHIV-Nukleinsäure-Nachweis. Bundesgesundheits-blatt Gesundheitsforschung Gesundheitsschutz58:877–886
7. Robert Koch-Institut (2001) Anmerkungen zurErfassung vonHIV-Infektionen auf der Grundlagedes neuen Infektionsschutzgesetzes. EpidemiolBullA:1
8. AltmannM,NielsenS,HamoudaO,BremerV(2013)Angebote der Beratungsstellen zu sexuell über-tragbarenInfektionenundHIVunddiesbezüglicheDatenerhebung indeutschenGesundheitsämternim Jahr 2012. Bundesgesundheitsblatt Gesund-heitsforschungGesundheitsschutz56:922–929
9. NimptschU, BestmannA, ErhartMet al (2015) Zu-gang zu Routinedaten. In: Swart E, Ihle P, Gothe H,Matusiewicz D (Hrsg) Routinedaten im Gesund-heitswesen. Handbuch Sekundärdatenanalyse:Grundlagen, Methoden und Perspektiven. Huber,Bern, S270–290
10. Kassenärztliche Bundesvereinigung (2015) Ein-heitlicher Bewertungsmaßstab (EBM) Stand: 4.Quartal 2015. https://www.kbv.de/media/EBM-2009-Archiv_2.zip.Zugegriffen:18.Okt. 2017
11. Statistisches Bundesamt (Destatis) (2017) Statistikder Geburten nach Alter der Mutter, Geschlechtder Lebendgeborenen und Familienstand derEltern 2010–2015 – TabelleNr: 12612-0007.https://www-genesis.destatis.de/genesis/online.Zugegriffen:2. Febr. 2017
12. Statistisches Bundesamt (Destatis) (2017) Statistikder Schwangerschaftsabbrüche 2010–2015 –TabelleNr: 23311-0001. https://www-genesis.
destatis.de/genesis/online. Zugegriffen: 12. Juli2017
13. Bundesministerium für Gesundheit (2016) Mit-glieder und Versicherte der Gesetzlichen Kran-kenversicherung (GKV): Statistik über Versi-cherte, gegliedert nach Status, Alter, Wohnortund Kassenart (KM6) – Stichtag: 1. Juli 2015.https://www.bundesgesundheitsministerium.de/themen/krankenversicherung/zahlen-und-fakten-zur-krankenversicherung/mitglieder-und-versicherte.html.Zugegriffen:24.Nov.2016
14. Statistisches Bundesamt (Destatis) (2017) Statistikder Bevölkerung nach Alter und Geschlecht,2010–2015 – TabelleNr: 12411-0006. https://www-genesis.destatis.de/genesis/online. Zuge-griffen:25.Okt. 2017
15. Robert Koch-Institut (2017) SurvStat@RKI: HIVNeudiagnosen nach Altersgruppen und Ge-schlecht zwischen 2010 und 2015 in DeutschlandDatenstand: Epidemiologisches Jahrbuch 2016(1.3.2017). https://survstat.rki.de/. Zugegriffen: 1.Apr. 2017
16. Giraudon I, Forde J, Maguire H, Arnold J,Permalloo N (2009) Antenatal screening andprevalence of infection: surveillance in London,2000–2007.EuroSurveill 14:8–12
17. Op de Coul EL, Hahne S, vanWeert YWet al (2011)AntenatalscreeningforHIV,hepatitisBandsyphilisin the Netherlands is effective. BMC Infect Dis11:185
18. Remis RS, Merid MF, Palmer RW et al (2012) Highuptake of HIV testing in pregnant women inOntario,Canada.PLoSOne7:e48077
19. Gemeinsame Bundesausschuss (G-BA) (2007)Bekanntmachung eines Beschlusses des Gemein-samen Bundesausschusses über eine Änderungder Mutterschafts-Richtlinien: Merkblatt HIV-Screening vom 13.09.2007. :Bundesanzeiger, Bd.1301A239
20. Gemeinsame Bundesausschuss (G-BA) (2015)Beschluss des Gemeinsamen Bundesausschussesüber eine Änderung der Richtlinien über dieärztliche Betreuung während der Schwanger-schaft und nach der Entbindung („Mutterschafts-Richtlinien“). Bundesanzeiger, Bd. AT9.11.2015 B1(Anpassung der Anlage 3 (Mutterpass) – EintragzurDurchführungeinesHIVTestsvom20.08.2015)
21. Wissentschaftliches Institut der PKV (WIP),FinkenstädtV,WildF(2013)WIP-Diskussionspapier2/13: HIV-Infektionen in der PKV – Prävalenz,Inzidenz und Arzneimitttelversorgung. http://www.wip-pkv.de/forschungsbereiche/detail/hiv-infektion-in-der-pkv-praevalenz-inzidenz-und-arzneimittelversorgung.html. Zugegriffen: 23.Mai2019
22. Robert Koch-Institut (2016) HIV-Jahresbericht2015.EpidemiolBull38/2016:407–430
23. MarcusU, GassowskiM, KruspeM,Drewes J (2015)Recency and frequency of HIV testing amongmen who have sex with men in Germany andsocio-demographic factorsassociatedwith testingbehaviour.BMCPublicHealth15:727
24. Marcus U, Ort J, Grenz M, Eckstein K, Wirtz K,Wille A (2015) Risk factors for HIV and STIdiagnosis in a community-based HIV/STI testingand counselling site formen having sexwithmen(MSM) in a large German city in 2011–2012. BMCInfectDis15:14
25. Kuttner-May S, Krönke S,MünstermannD, LuchtA(2015) Anonymes, kostenloses HIV- und Syphilis-Beratungs- und Untersuchungsprogramm imöffentlichen Gesundheitsdienst in Nordrhein-Westfaen (NRW). In: Deutsch-Österreichischer
Bundesgesundheitsblatt - Gesundheitsforschung - Gesundheitsschutz 84

AIDS Kongress (DÖAK). K.I.T. Group, Düsseldorf, S65–66
26. Gemeinsame Bundesausschuss (G-BA) (2016)Richtlinien des Gemeinsamen Bundesausschus-ses über die ärztliche Betreuung während derSchwangerschaftundnachderEntbindung(„Mut-terschafts-Richtlinien“). Version vom 21.04.2016.Bundesanzeiger,Bd.AT19.07.2016
27. Prütz F, Rommel A (2017) Inanspruchnahmeambulanter ärztlicherVersorgung inDeutschland.J Health Monit. https://doi.org/10.17886/RKI-GBE-2017-116
28. European Centre for Disease Prevention andControl (2017)HIV testing.Monitoring implemen-tation of the Dublin Declaration on partnership tofight HIV/AIDS in Europe and Central Asia: 2017progress reporthttps://doi.org/10.2900/964345
29. Zoufaly A, an der HeidenM, Marcus U et al (2012)Late presentation for HIV diagnosis and care inGermany.HIVMed13:172–181
30. Bundesministerium für Gesundheit, Bundesmi-nisterium für wirtschaftliche Zusammenarbeitund Entwicklung (2016) BIS 2030 – Strategiezur Eindämmung von HIV, Hepatitis B und Cund anderen sexuell übertragbaren Infektionen.http://www.bundesgesundheitsministerium.de/fileadmin/Dateien/Publikationen/Praevention/Broschueren/Strategie_BIS_2030_HIV_HEP_STI.pdf.Zugegriffen:9.Mai2019
Bundesgesundheitsblatt - Gesundheitsforschung - Gesundheitsschutz85

5. Lebenslauf
Mein Lebenslauf wird aus datenschutzrechtlichen Gründen in der elektronischen Version
meiner Arbeit nicht veröffentlicht.
86

Mein Lebenslauf wird aus datenschutzrechtlichen Gründen in der elektronischen Version meiner Arbeit nicht veröffentlicht.
87

6. Publikationsliste
6.1. Publikationen in wissenschaftlichen Zeitschriften im Peer-Review Verfahren
2021
Halm, A., Grote, U., an der Heiden, M., Hamouda O., Schaade L., Rexroth U., & RKI-
Lagezentrums-Gruppe (… Hofmann, A. …). Das Lagemanagement des Robert Koch-Instituts
während der COVID-19-Pandemie und der Austausch zwischen Bund und Ländern.
Bundesgesundheitsbl (2021). DOI: 10.1007/s00103-021-03294-0. Impact factor: 1,059 für 2019
(Quelle: Journal Citation Reports)
Zimmermann, R., Külper-Schiek, W., Steffen, G., Gillesberg Lassen, S., Bremer, V., Dudareva, S.
& die Hepatitis-Monitoring-Arbeitsgruppe (… Hofmann, A. …). Wie lässt sich die Eliminierung
von Hepatitis B, C und D in Deutschland messen? Ergebnisse eines interdisziplinären
Arbeitstreffens. Bundesgesundheitsbl 64, 77–90 (2021). DOI: 10.1007/s00103-020-03260-2.
Impact factor: 1,059 für 2019 (Quelle: Journal Citation Reports)
2020
Hofmann, A., Bätzing, J., Marcus, U., Bremer V., Bartmeyer B. Wie viele Personen lassen sich in
Deutschland im niedergelassenen Bereich auf HIV testen?. Bundesgesundheitsbl 63, 1262–1270
(2020). DOI: 10.1007/s00103-020-03210-y. Impact factor: 1,059 für 2019 (Quelle: Journal
Citation Reports)
2019
Hanke K, Rodrigues Faria N, Kühnert D, Yousef KP, Hauser A, Meixenberger K, Hofmann A,
Bremer V, Bartmeyer B, Pybus O, Kücherer C, von Kleist M, Bannert N: Reconstruction of the
genetic history and the current spread of HIV-1 subtype A in Germany. J Virol. 2019 May
29;93(12). pii: e02238-18. DOI: 10.1128/JVI.02238-18. Print 2019 Jun 15. Impact factor: 4,501
für 2019 (Quelle: Journal Citation Reports)
Hauser A, Heiden MA, Meixenberger K, Han O, Fiedler S, Hanke K, Koppe U, Hofmann A,
Bremer V, Bartmeyer B, Kuecherer C, Bannert N: Evaluation of a BioRad Avidity assay for
identification of recent HIV-1 infections using dried serum or plasma spots. J Virol Methods.
2019 Apr; 266:114-120. DOI: 10.1016/j.jviromet.2019.02.002. Impact factor: 1,786 für 2019
(Quelle: Journal Citation Reports)
88

2018
Hauser A, Hofmann A, Meixenberger K, Altmann B, Hanke K, Bremer V, Bartmeyer B, Bannert
N: Increasing proportions of HIV-1 non-B subtypes and of NNRTI resistance between 2013 and
2016 in Germany: Results from the national molecular surveillance of new HIV-diagnoses. PLoS
One. 2018 Nov 8;13(11):e0206234. DOI: 10.1371/journal.pone.0206234. Impact factor: 2,776
für 2018 (Quelle: Journal Citation Reports)
Hauser A, Meixenberger K, Machnowska P, Fiedler S, Hanke K, Hofmann A, Bartmeyer B,
Bremer V, Bannert N, Kuecherer C.: Robust and sensitive subtype-generic HIV-1 pol genotyping
for use with dried serum spots in epidemiological studies. J Virol Methods. 2018 Sep; 259:32-
38. DOI: 10.1016/j.jviromet.2018.05.013. Impact factor: 1,746 für 2018 (Quelle: Journal Citation
Reports)
2017
Hofmann A, Hauser A, Zimmermann R, Santos-Hövener C, Bätzing-Feigenbaum J, Wildner S,
Kücherer C, Bannert N, Hamouda O, Bremer V, Bartmeyer B.: Surveillance of recent HIV
infections among newly diagnosed HIV cases in Germany between 2008 and 2014. BMC Infect
Dis. 2017 Jul 11;17(1):484. DOI: 10.1186/s12879-017-2585-4. Impact factor: 2,620 für 2017
(Quelle: Journal Citation Reports)
Hauser A, Hofmann A, Hanke K, Bremer V, Bartmeyer B, Kuecherer C, Bannert N (2017):
National molecular surveillance of recently acquired HIV infections in Germany, 2013 to 2014.
Euro Surveill. 2017 Jan 12;22(2). pii: 30436. DOI: 10.2807/1560-7917.ES.2017.22.2.30436.
Impact factor: 7,127 für 2017 (Quelle: Journal Citation Reports)
2014
Hauser A, Santos-Hoevener C, Meixenberger K, Zimmermann R, Somogyi S, Fiedler S, Hofmann
A, Bartmeyer B, Jansen K, Hamouda O, Bannert N, Kuecherer C (2014): Improved testing of
recent HIV-1 infections with the BioRad Avidity Assay compared to the Limiting Antigen Avidity
Assay and BED Capture Enzyme Immunoassay: Evaluation using reference sample panels from
the German Seroconverter Cohort. PLoS ONE June 3. DOI: 10.1371/journal.pone.0098038.
Impact factor: 3,234 für 2014 (Quelle: Journal Citation Reports)
89

2010
Gilsdorf A, Hofmann A, Hamouda O, Bremer V: Highly variable use of diagnostic methods for
sexually transmitted infections - results of a nationwide survey, Germany 2005. BMC Infect Dis.
2010 Apr 19;10(1):98. DOI: 10.1186/1471-2334-10-98. Impact factor: 2,825 für 2010 (Quelle:
Journal Citation Reports)
Süss T, Buchholz U, Dupke S, Grunow R, an der Heiden M, Heider A, Biere B, Schweiger B, Haas
W, Krause G; Robert Koch Institut Shedding Investigation Group (… Hofmann, A. …). Shedding
and transmission of novel influenza virus A/H1N1 infection in households - Germany, 2009. Am
J Epidemiol. 2010 Jun; 171(11):1157-64. DOI: 10.1093/aje/kwq071. Impact factor: 5,745 für
2010 (Quelle: Journal Citation Reports)
2007
Bremer V, Hofmann A, Hamouda O: Epidemiologie der Chlamydia-trachomatis-Infektionen.
Hautarzt 2007 58:18-23. DOI: 10.1007/s00105-006-1267-8. Impact factor: 0,333 für 2007
(Quelle: Journal Citation Reports)
2005
Bremer V, Marcus U, Hofmann A, Hamouda O (2005): Building a sentinel surveillance system
for sexually transmitted infections in Germany, 2003. Sex Transm Inf 81:173-179. Impact factor:
2,668 für 2005 (Quelle: Journal Citation Reports)
6.2. Weitere Publikationen
2015
Schink SB, Hofmann A: HIV-Nennerstudie - eine Befragung von Laboren zur aktuellen HIV-
Diagnostik in Deutschland. Epidemiologisches Bulletin S. 47-50 7/2015
2014
Hofmann A, Dudareva-Vizule S, Sailer A, Hamouda O, Bremer V (2014): Chlamydia trachomatis
in Deutschland - Ergebnisse des Laborsentinels. HIV+More. September, 3/2014: 32-35
90

2011
Hofmann A, Dreesman J, Wagner D: Umfrage zur Durchführung von Tuberkulose-
Umgebungsuntersuchungen in Niedersachsen. Deutsches Zentralkomitee zur Bekämpfung der
Tuberkulose. 34. Informationsbericht, S.38-48, 2011. Berlin
6.3. Zitierfähige wissenschaftliche Beiträge (Veranstaltungen mit Tagungsband)
2018
Hofmann A, J. Bätzing, K. Jansen, B. Bartmeyer, V. Bremer (2018): Wie viele HIV- / STI-Tests
werden in deutschen Arztpraxen durchgeführt?. 63. Deutscher STI-Kongress. 06.-09. Juni 2018.
Bochum, Deutschland Erschienen in JDDG: Journal of the German Society of Dermatology:
Volume16, IssueS3:S. 8-9: Abstracts zum 63. Deutschen STI‐Kongress 2018 mit Leopoldina‐
Symposium und Interdisziplinärem Networking für die Millennials, 06.‐09. Juni 2018, Bochum,
im Stadtpark; June 2018; Pages 6-35. DOI: 10.1111/ddg.13552 - Vortrag
Hauser A, Hanke A, Hofmann A, Markus U, Zimmermann R, Bremer V, Bannert N (2018):
Nachweis und Analyse eines HIV-1 Ausbruchs unter Drogengebrauchenden im Raum München
mit Hilfe der molekularen Surveillance. 17. Münchner AIDS- und Hepatitis-Tage - zu Gast in
Berlin 23.-25.3.2018 - HIV/AIDS Hepatitis Infektiologie 2018 (Hoffmann / Jäger (Hrgs.)) ISBN:
978-3-9817252-2-3 S.27 - Vortrag
Hauser A, Hanke A, Hofmann A, Meixenberger K, Altmann B, Bremer V, Bartmeyer B, Bannert N
(2018): Trends bei übertragenen Resistenzen und zirkulierenden HIV-1 Subtypen - Ergebnisse
der nationalen molekularen Surveillance in Deutschland 2013-2016. Gemeinsame Jahrestagung
der Deutschen Gesellschaft für Infektiologie (DGI) und des Deutschen Zentrums für
Infektionsforschung (DZIF), 28.-30. September 2017, Hamburg - Tagungsband S. 17 - ISBN 978-
3-00-057615-7 - Vortrag
2017
Hanke K, Hauser A, Hofmann A, Bartmeyer B, Bremer V, Bannert N (2017): Molecular
surveillance reveals a recent outbreak of HIV-1 subtype C infections among people who inject
drugs (PWID) in Munich, Germany 16th European AIDS Conference, 25.-27.10.2017. Milan,
Italy: http://www.abstractserver.com/eacsabstractarchive/absabstract.php?abid=6017 -
BPD3/1 Poster/ Best Poster Discussion
91

Hauser A, Hofmann A, Hanke K, Meixenberger K, Bremer V, Bartmeyer B, Bannert N (2017):
Trends for transmitted drug resistance and prevalence of non-B subtypes in recent HIV
infections? results from the national molecular surveillance, Germany 2013-2016 16th
European AIDS Conference, 25.-27.10.2017. Milan, Italy PE6/20
http://www.abstractserver.com/eacsabstractarchive/absabstract.php?abid=6020 - Poster
Hofmann A, Bätzing J, Bremer V, Bartmeyer B (2017): The problem of the denominator - or how
many people have been tested for HIV in Germany between 2010 and 2015: 16th European
AIDS Conference, 25.-27.10.2017. Milan, Italy PE23/41
http://www.abstractserver.com/eacsabstractarchive/absabstract.php?abid=6046 - Poster
Hofmann A, Hauser A, Bannert N, Hamouda O, Bremer V, Bartmeyer B (2017): Factors
associated with recent HIV infections in Germany (2011-2016): 16th European AIDS
Conference, 25.-27.10.2017. Milan, Italy PE23/41
http://www.abstractserver.com/eacsabstractarchive/absabstract.php?abid=6036 - Poster
Hofmann A, Hauser A, Bannert N, Bartmeyer B, Bremer V (2017): Kürzlich erworbene HIV-
Infektionen bei MSM in Deutschland (2011-2016) 8. Deutsch-Österreichischer Aids-Kongress
14.07.-17.07.2017, Salzburg Tagungsband S. 45 - Vortrag
Hofmann A, Bätzing-Feigenbaum J, Bremer V, Bartmeyer B (2017): Auf der Suche nach dem
Nenner oder wie viele Personen lassen sich bei niedergelassenen Ärzten auf HIV testen? 8.
Deutsch-Österreichischer Aids-Kongress 14.07.-17.07.2017, Salzburg –Tagungsband S. 29 -
Vortrag
2016
Hofmann A, Hauser A, Bannert N, Bartmeyer B, Bremer V (2016): Kürzlich erworbene HIV-
Infektionen bei MSM in Deutschland (2011-2015): Was wissen wir? STI-Kongress 2016 der
Deutschen STI-Gesellschaft 07.07.-09.07.2016, Berlin. Tagungsband S. 34-35 - Poster und
Vortrag
Hauser A, Hofmann A, Hanke K, Bremer V, Bartmeyer B, Kücher C, Bannert N (2016):
Prevalence and impact of transmitted drug resistance in recent HIV-1 infections, Germany 2013
to 2015 International Congress of Drug Therapy in HIV Infection 23-26 October 2016, Glasgow,
UK Abstract erschienen im Journal of the International AIDS Society 19 (Suppl 8S7). DOI:
92

10.7448/IAS.19.8.21487 - P353 - Poster; Impact factor: 6,296 für 2016 (Quelle: Journal Citation
Reports)
2015
Hofmann A, Hauser A, Santos-Hövener C, Zimmermann R, Bannert N, Bartmeyer B, Kücherer C,
Bremer V (2015): Kürzlich erworbene HIV-Infektionen in Deutschland (2011-2014): Was wissen
wir? 10. Jahrestagung der Deutschen Gesellschaft für Epidemiologie 30.09.-02.10.2015,
Potsdam Tagungsband S. 30-31 - Vortrag
Hofmann A, Hauser A, Bannert N, Hamouda O, Bremer V, Kücherer C, Bartmeyer B (2015):
Recent HIV-infections in Germany 2008-2014: What do we know? 15th European AIDS
Conference, October 21 - 24, 2015 PE21/22
https://www.abstractserver.com/eacsabstractarchive/absabstract.php?abid=5316 - Poster
Hofmann A, Hauser A, Santos-Hövener C, Zimmermann R, Bannert N, Bartmeyer B, Kücherer C,
Hamouda O (2015): Kürzlich erworbene HIV-infektionen in Deutschland (2011-2014): Was
wissen wir? Deutsch- Österreichischer Aids-Kongress, 24.-27.06.2015, Düsseldorf, PW 23
Tagungsband S. 64 - Poster
Hofmann A, Hauser A, Santos-Hövener C, Zimmermann R, Bannert N , Bartmeyer B, Kücherer C,
Hamouda O (2015): Recent HIV infections in Germany (2011-2014): Which groups among the
newly diagnosed HIV cases are infected recently?. 25th Annual Meeting of the Society for
Virology; 2015; 18–21 March 2015; Bochum/Germany - Poster ID: 114 Tagungsband S. 158 -
Poster
Hofmann A, Hauser A, Schönerstedt-Zastrau K, Santos-Hövener C, Zimmermann R, Bannert N,
Bremer V, Kücherer C, Bartmeyer B (2015): Comparison of two approaches for recent infections
among newely diagnosed MSM using a recency test and the date of the reported last negative
test in German (2011-2014). 29th European Conference on sexually transmitted Infections; 24.-
26. September 2015; Sitges, Spain Tagungsband S. 56 - Poster
Bartmeyer B, Schönerstedt-Zastrau K, Hofmann A, Kollan C, Voss L, Hamouda O, Bremer V
(2015): High proportion of newly diagnosed HV-positive MSM had previous HIV-test in
Germany - Is testing used as prevention strategy?. 29th European Conference on Sexually
Transmitted Infections; 24.-26. September 2015; Sitges, Spain - Tagungsband S. 56 - Poster
93

Dudareva-Vizule S, Alt K, Hofmann A, Jansen K, Sailer A, Haar K, Bremer V (2015): Chlamydia
trachomatis infection in men in Germany, 2008-2014. 29th European Conference on Sexually
Transmitted Infections; 24.-26. September 2015; Sitges, Spain - Tagungsband S. 57 - Poster
Hauser A, Hofmann A, Meixenberger K, Somogyi S, Bartmeyer B, Jansen K, Bremer V, Bannert
N, Kuecherer C (2015): Comparing a `Multi Assay Algorithm´ with the BED Capture Enzyme
Immunoassay for the testing of recent HIV-1 infections in Germany; PosterID: PE21/16: 15th
European AIDS Conference, October 21–24, 2015, Barcelona, Spain:
http://www.abstractserver.com/eacsabstractarchive/absabstract.php?abid=5210 - Poster
Hauser A, Hanke K, Hofmann A, Santos-Hövener C, Bartmeyer B, Hamouda O, Kuecherer C,
Bannert N (2015): Molecular surveillance of recently acquired HIV infections in Germany using
dried serum spots reveals an increase in HIV-1 subtype non-B infections and a decrease in
transmission of drug resistance: 25th Annual Meeting of the Society for Virology, 18–21 March
2015 Bochum, Germany- Tagungsband S.145 - Vortrag
2014
Alt K, Dudareva-Vizule S, Sailer A, Haar K, Hofmann A, Bremer V (2014): Chlamydia trachomatis-
Laborsentinel - Ergebnisse zu Untersuchungen bei Männern. STI-Kongress der DSTIG - Sexuelle
Gesundheit Gemeinsam gestalten - 19.-21. Juni 2014, Berlin, Germany. - Tagungsband S.73 -
Poster
Hofmann A, Dudareva-Vizule S, Sailer A, Hamouda O, Bremer V (2014): Ergebnisse aus dem
Chlamydia trachomatis Laborsentinel in Deutschland (2008-2013). STI-Kongress der DSTIG -
Sexuelle Gesundheit Gemeinsam gestalten - 19.-21. Juni 2014, Berlin, Germany P06 -
Tagungsband S. 76-77 - Poster
Kücherer C, Hauser A, Santos-Hövener, Hofmann A, Zimmermann R, Hamouda O, BannerN
(2014): Molecular surveillance of recently acquired HIV infections in Germany using dried
serum spots: 24th Annual Meeting of the Society for Virology March 26th - 29th 2014, Alpbach,
Tyrol, Austria Tagungsband S. 159 - Vortrag
Hauser A, Meixenberger K; Hofmann A, Bannert N, Orjin H, Zimmermann R, Bartmeyer B,
Santos-Hoevener C, Somogyi S, Jansen K, Kuecherer C (2014): Performance of a Multi-Assay
Algorithm in Comparison with Two Serological Tests for Recent HIV-Infections: 24th Annual
94

Meeting of the Society for Virology March 26th - 29th 2014, Alpbach, Tyrol, Austria.
Tagungsband S. 162 - Poster
Hauser A, Hofmann A, Hanke K, Santos-Hoevener C, Zimmermann R, Hamouda O, Bannert N,
Kuecherer C (2014): Analysis of transmitted drug resistance and HIV-1 subtypes using dried
serum spots of recently HIV-infected individuals in 2013 in Germany: International Congress of
Drug Therapy in HIV Infection 2-6 November 2014, Glasgow, UK Abstract erschienen im Journal
of the International AIDS Society 17(Suppl 3):1. DOI: 10.7448/IAS.17.4.19670 - Poster. Impact
factor: 5,090 für 2014 (Quelle: Journal Citation Reports)
Hauser A, Han O, Hofmann A, Meixenberger K, Zimmermann R, Somogyi S (2014): Anwendung
eines Algorithmus mit multiplen Analyten zur Ermittlung der Anzahl neuer HIV-Infektionen in
Deutschland 2014. 15. Münchner AIDS- und Hepatitis-Tage 21-23. März 2014. - Tagungsband S.
17 - Vortrag
2013
Hauser A, Santos-Hoevener C, Hofmann A, Zimmermann R, Hamouda O, Bannert N, Kuecherer
C (2013): Analysis of Transmitted Drug Resistance and HIV-Subtypes from Dried Serum Spots of
Newly Diagnosed Patients in Germany: Results from the Study "Surveillance of Incident HIV
Infections" in 2012: 14th European AIDS Conference - EACS 16-19.10.2013 Brussels, Belgium
http://www.abstractserver.com/eacsabstractarchive/absabstract.php?abid=4610 - Poster
Hofmann A, Gallowitz C, Tenckhoff B (2013): Regionalisierte Analyse ambulant durchgeführter
Polypektomien im Rahmen von Koloskopien in 2011, Agens Workshop 7./8. März 2013, Berlin
https://www.zi.de/veranstaltungen/workshops/agens-methodenworkshop/;
https://www.zi.de/fileadmin/images/content/PDFs_alle/P5_AGENS_Hofmann_Poster.pdf -
Poster
2010
Hofmann A, Dreesman J, Alpers K, Hauer B, Wagner D (2010): Tuberculosis contact tracing
varies among local public health departments in Lower Saxony, Germany European Scientific
Conference on Applied Infectious Disease Epidemiology (ESCAIDE) 11.-13. November 2010,
Stockholm. Tagungsband S. 29 - Vortrag
Hofmann A, Dreesman J (2010): Das räumliche Scan-Verfahren mit SaTScan®, ein nützliches
Tool um Salmonellose-Ausbrüche in Niedersachsen zu erkennen? Gemeinsamer Kongress der
95

Deutschen Gesellschaft für Sozialmedizin und Prävention, der Deutschen Gesellschaft für
Epidemiologie und der European Union of Medicine in Assurance and Social Security (EUMASS)
21.-25.September 2010, Berlin. Abstract erschienen in: Das Gesundheitswesen, Ausgabe 8/9
2010 S. 552 Impact factor: 0,660 für 2010 (Quelle: Journal Citation Reports) - Vortrag
Hofmann A, Dreesman J (2010): Spatial cluster detection - a useful tool to detect Salmonella
Outbreaks in Lower Saxony, Germany: Conference on Applied Infectious Disease Epidemiology
(ESCAIDE) 11.-13. November 2010, Stockholm. Tagungsband S. 126 - Poster
2009
Hofmann A, Ruebsamen C, Wagner D. Dreesman J (2009): A high attack rate of tuberculosis
infections in a school outbreak, Wilhelmshaven, Germany, 2008 European Scientific Conference
on Applied Infectious Disease Epidemiology (ESCAIDE) 26.-28. October 2009, Stockholm.
Tagungsband S. 45 - Vortrag
2008
Hofmann A, Bremer V, Marcus U, Hamouda O (2008): Results of STI Sentinel Surveillance in
Germany: Comparison of Data from local health offices and private practitioners European
Scientific Conference on Applied Infectious Disease Epidemiology (ESCAIDE) 19.-21. November
2008, Berlin - Tagungsband S. 53 - Vortrag
Hofmann A, Bremer V, Marcus U, Hamouda O (2008): Fünf Jahre STD-Sentinel Surveillance in
Deutschland 3. Jahrestagung DGEpi (Deutsche Gesellschaft für Epidemiologie) 24.-
27.September 2008, Bielefeld - Tagungsband S.76 - Vortrag
Hofmann A, Bremer V, Marcus U, Hamouda O (2008): Anogenitale Warzen und Genitalherpes
in deutschland - Erkentnisse aus dem STD-Sentinel Netzwerk des RKI 3. Jahrestagung DGEpi
(Deutsche Gesellschaft für Epidemiologie) 24.-27.September 2008, Bielefeld- Tagungsband
S.176 - Poster
2006
Hofmann A, Bremer V, Marcus U, Hamouda O (2006): Kann die Veränderung von Fragebögen
im Verlauf einer epidemiologischen Studie die Datenqualität verbessern? 9. DVMD-Fachtagung
30. - 31.3.2006, Erlangen. Reichenbach: Alius Verlag, 2006, ISBN: 3-938792-99-X S.189-191 -
Poster
96

Bremer V, Marcus U, Hofmann A, Hamouda O (2006): Sexually Transmitted Infections in Female
Sex Workers in Germany - Results of the STI Sentinel Surveillance. 22nd IUSTI Europe,
Conference on sexually transmitted infections, Versailles 19.-21.10.2006. Erschienen in: Int J
STD AIDS 2006;17 Suppl 1:1-81. Impact factor: 1,274 für 2006 (Quelle: Journal Citation Reports)
- Poster
Bremer V, Marcus U, Hofmann A, Hamouda O (2006): Three years of STI sentinel surveillance in
Germany: What is the outcome? 22nd IUSTI Europe, Conference on sexually transmitted
infections, Versailles 19.-21.10.2006. Erschienen in: Int J STD AIDS 2006;17 Suppl 1:1-81. Impact
factor: 1,274 für 2006 (Quelle: Journal Citation Reports) - Poster
2005
Hofmann A, Bremer V, Marcus U, Hamouda O (2005): Datenqualität im Sentinel-Netwerk für
Sexuell übertragbare Erkrankungen: Gemeinsame Jahrestagung der Deutschen Gesellschaft für
Medizinische Informatik, Biometrie und Epidemiologie (gmds) und der Deutschen
Arbeitsgemeinschaft für Epidemiologie (dae) 11. - 15.September 2005, Freiburg.
http://www.egms.de/static/en/meetings/gmds2005/05gmds308.shtml - Poster
Bremer V, Marcus U, Hofmann A, Hamouda O (2005): HIV and STI co-infections in Germany:
results of the sentinel surveillance system, 2004. 10. Deutscher und 16. Österreichischer AIDS-
Kongress, Wien, 01.- 04.06.2005. Erschienen im European Journal of Medical Research (Eur J
Med Res) 10 (Suppl II) June 2005 S.39-40. Impact factor: 0,944 für 2005 (Quelle: Journal Citation
Reports: https://jcr.clarivate.com) - Vortrag
Bremer V, Marcus U, Hofmann A, Hamouda O (2005): HIV and STI Co-Infections in Germany:
Results of the Sentinel Surveillance System, 2004. 16th Biannual Meeting of the International
Society of STD Research (ISSTDR), Amsterdam, 10.-13.7.2005, Poster TP-134; Tagungsband
S.242 - Poster
Bremer V, Marcus U, Hofmann A, Hamouda O (2005): Two years of STI sentinel surveillance in
Germany: What is the outcome? 16th Biannual Meeting of the International Society of STD
Research (ISSTDR), Amsterdam, 10.-13.07.2005, Poster TP-135; Tagungsband S. 243 - Poster
Bremer V, Marcus U, Hofmann A, Hamouda O (2005): Genital warts and genital herpes in
Germany - what do we know? 16th Biannual Meeting of the International Society of STD
Research (ISSTDR), Amsterdam, 10.-13.07.2005, Poster TP-137, Tagungsband S. 243 - Poster
97

2004
Bremer V, Marcus U, Hofmann A, Hamouda O (2004): Sentinel Surveillance System for sexually
transmitted infections in Germany: first results Abstract erschienen im Biometrical Journal
46(Suppl S1) March 2004 p. 137 Abstracts of the Joint Meeting of the IBS-DR and the DAE,
Heidelberg, 16–19 March 2004. DOI: 10.1002/bimj.200490197. Impact factor: 0,599 für 2004
(Quelle: Journal Citation Reports)- P2.32- Poster
6.4. Weitere wissenschaftliche Beiträge
Hofmann, A (2019): Statuary (Infectious Disease) Surveillance: Workshop Surveillance and
Outbreak des Helmholtz-Zentrum für Infektionsforschung (HZI) in Kooperation mit dem
Deutschen Zentrum für Infektionsforschung (DZIF), 24. - 28.06.2019, Braunschweig
Hofmann, A (2019): Software tools for outbreak investigations: RKI Linelist-Tool: Workshop
Surveillance and Outbreak des Helmholtz-Zentrum für Infektionsforschung (HZI) in Kooperation
mit dem Deutschen Zentrum für Infektionsforschung (DZIF), 24. - 28.06.2019, Braunschweig
Hofmann, A (2018): HIV- & STI-Tests in Arztpraxen 2010-2015: Deutsche STI-Gesellschaft:
Sitzung der Arbeitsgruppe Sexuelle Gesundheit 26.1.2018, Berlin - Vortrag
Hofmann, A (2017): HIV- & STI-Tests in Arztpraxen 2010-2015: 21. Dresdner AIDS-
Symposium,18.11.2017, Dresden - eingeladener Vortrag
Hofmann, A (2017): Wie viele Personen lassen sich bei niedergelassenen Ärzten auf HIV testen?
- Ergebnisse einer Sekundärdatenanalyse. Abteilung 3 Kolloquium 6.11.2017, Berlin - Vortrag
Hofmann, A (2017): Surveillance von rezenten HIV Infektionen in Deutschland (2011-2016): HIV
& Hepatitis: Neues aus der molekularen und epidemiologischen Forschung: 12-13.10.2017
Berlin - Vortrag
Hofmann A (2017): HIV und andere sexuell übertragbare Infektionen (STI) - Auszubildenden Tag
der Berliner Tierpfleger im RKI am 07.04.2017 - Vortrag
Hofmann, A (2015): Surveillance der rezenten HIV-Infektionen - Projekttreffen der Studien
Serokonverter und InzSurv-HIV: HIV Surveillance in Deutschland - Wo stehen wir und wo gehen
wir hin? 27.11.2015, Berlin:
98

https://www.rki.de/DE/Content/InfAZ/H/HIVAIDS/Studien/InzSurv_HIV/Berichte/Projekttreffen
_HIV-Surveillance_in_Deutschland.pdf?__blob=publicationFile - Vortrag
Hofmann A, Hauser A, Santos-Hövener C, Zimmermann R, Bannert N, Bremer V, Kücherer C
(2014): Inzidente HIV Infektionen (InzSurv-HIV) in Deutschland (2011-2014): Sex, Blut und
Infektionen - aktuelle Forschung zu HIV, STI und Hepatitis am RKI, 11. -12. Dezember 2014
Berlin, Germany - Poster
Hofmann A, Dudareva-Vizule S, Sailer A, Hamouda O, Bremer V (2014) : Results of Chlamydia
trachomatis Laboratory sentinel in Germany. 12. Chlamydien Workshop 2.-4. April 2014, Berlin-
Vortrag
Hofmann A (2013): Serologische Inzidenztestung bei HIV-Neudiagnosen - Ergebnisse der
InzSurvHIV-Studie von 2011-2013, Epidemiologische und molekularbiologische Surveillance von
HIV in Deutschland - Aktuelle Studienergebnisse des RKI - 5.12.2013, Berlin - Vortrag
Hofmann A (2013): Die HIV-Nennerstudien - Studienstruktur und Ergebnisse von vorherigen
Befragungen, Epidemiologische und molekularbiologische Surveillance von HIV in Deutschland -
Aktuelle Studienergebnisse des RKI - 5.12.2013, Berlin - Vortrag
Hofmann A, Dreesman J, Wagner D (2010): Durchführung von Tuberkulose-
Umgebungsuntersuchungen in Niedersachsen - Ergebnisse einer Erhebung im
niedersächsischen ÖGD, Fortbildungsveranstaltung für Gesundheitsaufseher,
Gesundheitsassistenten und Gesundheitsingenieure 26.10.2010, Hannover - Vortrag
Bremer V, Marcus U, Hofmann A, Hamouda O (2004): Sentinel surveillance system in Germany:
The first year. IUSTI Conference on sexually transmitted infections, Mykonos, 07.-09.10.2004. -
Vortrag
99

7. Danksagung
An dieser Stelle möchte ich mich bei all den Menschen bedanken, die mich bei der Durchführung
dieser Arbeit unterstützt haben.
Zunächst gilt mein Dank PD Dr. Dirk Werber, Dr. Barbara Gunsenheimer-Bartmeyer sowie Dr.
Viviane Bremer für die Betreuung meiner Dissertation, die kritische Diskussion und die
Unterstützung bei der Erstellung der Arbeit.
Weiterhin gilt mein Dank all meinen Koautoren für die gute, konstruktive Zusammenarbeit in den
Projekten und beim Erstellen der Publikationen. Ferner gilt mein Dank den teilnehmenden
Laboren der Studie InzSurv-HIV, ohne deren Unterstützung die Studie und der Aufbau der
molekularen Surveillance nicht erfolgreich gewesen wäre.
Des Weiteren möchte ich mich bei der Leitung des Zentralinstitut für die Kassenärztliche
Versorgung in Deutschland (Zi) für die Genehmigung der Studie zur Ermittlung der auf HIV
getesteten Personen im niedergelassenen Bereich bedanken. Mein besonderer Dank gilt dabei
auch Dr. Jörg Bätzing der die Abfrage der Daten im Zi durchgeführt hat.
100