ERL - June 7-12, 2015Stony Brook U - JACoW.org
138
ERL2015 ERL2015 June 7-12, 2015 Stony Brook University, Stony Brook, New York, USA Topics Operational Experience and Commissioning Results New Applications and Projects Electron Sources Machine Optics and Beam Dynamics Superconducting RF Beam Instrumentation and Control For more information please contact: [email protected] http://www.bnl.gov/erl2015/ e 56 th ICFA Advanced Beam Dynamics Workshop on Energy Recovery Linacs International Organizing Committee S. Belomestnykh, BNL/SBU (Chairman) S. Benson, JLab I. Ben-Zvi, BNL/SBU W. Fischer, BNL R. Hajima, JAEA G. Hoffstaetter, Cornell U. E. Jensen, CERN H. Kawata, KEK K.-J. Kim, ANL and U. of Chicago J. Knobloch, HZB G. N. Kulipanov, BINP S. Smith, STFC/DL/ASTeC Local Organizing Committee V. Ptitsyn, BNL/SBU (Chairman) D. Kayran, BNL (IPC Chair) P. Manning, BNL A. Petway, BNL C. Hoffman, BNL
-
Upload
khangminh22 -
Category
Documents
-
view
1 -
download
0
Transcript of ERL - June 7-12, 2015Stony Brook U - JACoW.org

ERL2015 ERL2015
June 7-12, 2015
Stony Brook University, Stony Brook, New York, USA TopicsO
perational Experience and Comm
issioning ResultsNew Applications and ProjectsElectron SourcesM
achine Optics and Beam
Dynam
icsSuperconducting RFBeam
Instrumentation and Control
For more inform
ation please contact: [email protected]
http://www.bnl.gov/erl2015/
The 56
th ICFA Advanced Beam
Dynam
ics Workshop
on Energy Recovery Linacs
International Organizing Com
mittee
S. Belomestnykh, BNL/SBU (Chairm
an)
S. Benson, JLab
I. Ben-Zvi, BNL/SBU
W. Fischer, BNL
R. Hajima, JAEA
G. Hoffstaetter, Cornell U.
E. Jensen, CERN
H. Kawata, KEK
K.-J. Kim, ANL and U. of Chicago
J. Knobloch, HZB
G. N. Kulipanov, BINP
S. Smith, STFC/DL/ASTeC
Local Organizing Com
mittee
V. Ptitsyn, BNL/SBU (Chairman)
D. Kayran, BNL (IPC Chair)
P. Manning, BNL
A. Petway, BNL
C. Hoffman, BNL

ERL2015 – Stony Brook, NY, USA
ContentsPreface i
Poster . . . . . . . . . . . . . . . . . . . . . . . . . . . . . . . . . . . . . . . . . . . . . . . . . . . . . . . iGroup Photo . . . . . . . . . . . . . . . . . . . . . . . . . . . . . . . . . . . . . . . . . . . . . . . . . . . . iiContents . . . . . . . . . . . . . . . . . . . . . . . . . . . . . . . . . . . . . . . . . . . . . . . . . . . . . . iiiCommittees . . . . . . . . . . . . . . . . . . . . . . . . . . . . . . . . . . . . . . . . . . . . . . . . . . . . iv
Papers 1MOPBTH003 – The Femto-Science Factory: A Multi-turn ERL Based Light Source . . . . . . . . . . . . . . . 1MOPCTH010 – Design Work of the ERL-FEL as the High Intense EUV Light Source . . . . . . . . . . . . . . 4MOPDTH014 – Status and Commissioning Results of the R&D ERL at BNL . . . . . . . . . . . . . . . . . . . 10TUIBLH2026 – LHeC ERL Design and Beam-Dynamics Issues . . . . . . . . . . . . . . . . . . . . . . . . . 15TUIBLH2027 – Tracking Studies in eRHIC Energy-Recovery Recirculator . . . . . . . . . . . . . . . . . . . . 20TUICLH1030 – Improving the Smoothness of Multialkali Antimonide Photocathodes: An In-Situ X-Ray Reflectivity
Study . . . . . . . . . . . . . . . . . . . . . . . . . . . . . . . . . . . . . . . . . . . . . . . . . 27TUICLH2032 – Investigations on Transverse Beam Break Up Using a Recirculated Electron Beam* . . . . . . 30TUICLH2034 – Linear Microbunching Gain Estimation Including CSR and LSC Impedances in Recirculation Ma-
chines . . . . . . . . . . . . . . . . . . . . . . . . . . . . . . . . . . . . . . . . . . . . . . . . . 34TUIDLH1038 – First Beam Characterization of SRF Gun II with a Copper Photocathode . . . . . . . . . . . . 42TUIDLH2040 – Transverse-emittance Preserving Arc Compressor: Sensitivity to Beam Optics, Charge and Energy 48WEIALH2048 – Current Measurement and Associated Machine Protection in the ERL at BNL . . . . . . . . . 52WEIBLH1049 – Current Status of the MESA Project . . . . . . . . . . . . . . . . . . . . . . . . . . . . . . . 58WEIBLH2054 – Operational Experience of CW SRF Injector and Main Linac Cryomodules at the Compact ERL 63WEICLH1058 – ERL for Low Energy Electron Cooling at RHIC (LEReC) . . . . . . . . . . . . . . . . . . . . . 67WEICLH2062 – Development for Mass Production of Superconducting Cavity By MHI . . . . . . . . . . . . . 72WEICLH2063 – Ultra-Fast Harmonic Resonant Kicker Design for the MEIC Electron Circular Cooler Ring . . . 75WEIDLH1002 – The Optics of the Low Energy FFAG Cell of the eRHIC Collider Using Realistic Fields . . . . . 80WEIDLH2066 – Performance of the Digital LLRF Systems at KEK cERL . . . . . . . . . . . . . . . . . . . . . 84WEIDLH2068 – Using a 1.3 GHz 20 kW Solid State Amplifier as RF Power Supply for DC-SRF Photo-injector . 88THIALH2069 – Diagnostic Test-Beam-Line for the MESA Injector . . . . . . . . . . . . . . . . . . . . . . . . 91THPTHL072 – CsK2Sb Photocathode Development for BERLinPro . . . . . . . . . . . . . . . . . . . . . . . 97THPTHL073 – Development of a Multialkali Photocathode Preparation System . . . . . . . . . . . . . . . . . 100THPCTH075 – Summary of WG1 on Injectors - ERL 2015 . . . . . . . . . . . . . . . . . . . . . . . . . . . . 103THPCTH076 – ERL Beam Dynamics and Optics: A Summary of Working Group 2 at the ERL Workshop 2015 . 107THPCTH077 – Summary of WG3 on Instrumentation, Controls, and Beam Losses - ERL 2015 . . . . . . . . . 111THPDTH078 – ERL 2015 Summary of Workging Group 4 RF and Superconductiong RF . . . . . . . . . . . . 115THPDTH079 – Summary of WG5 on ERL Applications - ERL 2015 . . . . . . . . . . . . . . . . . . . . . . . 121
Appendices 127List of Authors . . . . . . . . . . . . . . . . . . . . . . . . . . . . . . . . . . . . . . . . . . . . . . . . . . . 127Institutes List . . . . . . . . . . . . . . . . . . . . . . . . . . . . . . . . . . . . . . . . . . . . . . . . . . . 131
Contents iii

ERL2015 – Stony Brook, NY, USA
Chair of ConferenceSergey Belomestnykh BNL/SBU
Local Organizing Committee (LOC)Sergey Belomestnykh ERL2015 ChairmanVadim Ptitsyn LOC ChairPamela Manning AdministrationAnna Petway CoordinatorCaitlin Hoffman EditorDmitry Kayran IPC Chair
International Organizing Committee (IOC)Sergey Belomestnykh (ERL Chair) BNL/SBUSteve Benson JLabIlan Ben-Zvi BNL/SBUWolfram Fischer BNLRyoichi Hajima JAEAGeorg Hoffstaetter CornellErk Jensen CERNHiroshi Kawata KEKKwang-Je Kim ANL & U. of ChicagoJens Knobloch HZBGennady N. Kulipanov BINPSusan Smith STFC/DL/ASTeC
International Program Committee (IPC)Dmitry Kayran (IPC Chair) BNLMichael Abo-Bakr HZBDeepa Angal-Kalinin ASTeCAndre Arnold HZDRKurt Aulenbacher Mainz U.Ivan Bazarov CornellOliver Bruning CERNAndrew Burrill HZBDave Douglas JLabBruce Dunham CornellPavel Evtushenko JLabCarlos Hernandez-Garcia JLabThorsten Kamps HZBVladimir Litvinenko SBU/BNLKexin Liu Peking U.Chris Mayes CornellNobuyuki Nishimori JAEATakashi Obina KEKVadim Ptitsyn BNL/SBUHiroshi Sakai KEKNikolay Vinokurov BINPJiuqing Wang IHEP
iv PrefaceCommittees

THE FEMTO-SCIENCE FACTORY: A MULTI-TURN ERL BASED LIGHT
SOURCE∗
T. Atkinson†, A. V. Bondarenko, A. N. Matveenko, Y. Petenev,
Helmholtz-Zentrum Berlin für Materialien und Energie GmbH (HZB), Germany.
Abstract
A conceptual design study for a future multi-turn ERL
based light source at HZB is completed and presently under
internal review. The Femto-Science-Factory (FSF) is a can-
didate for a 4th generation diffraction limited synchrotron
light source. It will provide its users with ultra-bright pho-
tons of angstrom wavelength at 6 GeV. The FSF is intended
to be a multi-user facility and offer a wide variety of oper-
ation modes. Presented in this paper is an overview of the
conceptual design with respect to the facility layout, oper-
ation modes and the expectations of the beam parameters
from the start-to-end simulations.
INTRODUCTION
This paper continues on from a recent feasibility study [1]
for multi-turn ERL based light sources. The most recent
additions to the optic are the numerous matching sections
needed to geometrically optimize the machine layout into
a single tunnel and the final deceleration recovery stage to
dump the beam at 10 MeV.
Figure 1: Schematic of the FSF. Green lines - acceleration,
red - deceleration and black - 6 GeV final beam
Figure 1 shows the layout of the light source and Table 1
summarizes the main parameters.
The difference in the two modes with regards to the lattice
design occurs in the low energy section of the machine. For
the High Brilliance Mode (HBM) a beam of higher charge is
accelerated on crest in all of the linacs and circulates round
isochronous arcs. The Short Pulse Mode (SPM) however
relies on achromatic arcs for the telescopic compression
technique removing the correlated energy spread due to
the off-crest acceleration. The modes share common high
energy arcs where radiation effects play an important role
in emittance growth.
The vertical spreaders geometry has been designed so
that the total length of the structure is restricted to 25 m.
∗ Work supported by German Bundesministerium für Bildung und
Forschung, Land Berlin, and grants of Helmholtz Association VH NG
636 and HRJRG-214.† [email protected]
Table 1: Main arameters of the FSF ulti-turn ERL
Parameter HBM SPM
Energy (GeV) 6 6
〈I〉 (mA) 20 5
Q (pC) 15 4
εn (mm mrad) 0.1 0.5
σt (fs) 2000 10
〈B〉 (ph/(s mm2 mrad2 0.1%) 8·1022 4·1021
Bpeak (ph/(s mm2 mrad2 0.1%) 1026 1026
The optic is isochronous, contains sextupoles to correct the
second order for high energy spread beams, and the beta
functions are minimized throughout. Due to these heavy
demands, the 4 and 6 GeV spreaders bend in both transversal
planes.
TWO STAGE INJECTION
The beam parameters achieved in the injector is essen-
tial for ultimate brilliance in both modes of the FSF. The
0.1 mm mrad goal of the transverse emittance is challenging
and compensation techniques up to 50 MeV where space
charge still dominates are required to preserve emittance. A
Space Charge Optimizer (SCO) [2] program was used to nu-
merically solve the Kapchinsky-Vladimirsky equations repet-
itively and to find the optimal setting for the quadrupoles for
minimum emittance growth (2D emittance compensation).
Modeling of the injector is comprehensively described in [3].
ASTRA was used to produce a realistic bunch starting simu-
lations from the cathode, as shown in Fig. 2 which could be
converted to Elegant and tracked onwards.
Figure 2: Typical beam distribution on injector exit.
The 230 MeV linac and the respective arc in the injection
scheme are used to further accelerate the beam and provide
intermediate bunch compression to 2 ps in both modes. In
addition, energy staging considerations, transversal beam
Proceedings of ERL2015, Stony Brook, NY, USA MOPBTH003
WG6 ERLs
ISBN 978-3-95450-183-0
1 Cop
yrig
ht©
2015
CC
-BY-
3.0
and
byth
ere
spec
tive
auth
ors

break-up and micro-bunching instability studies have all
contributed to the inclusion and layout of this two stage
injection process.
HIGH BRILLIANCE MODE
The transverse emittance growth is kept to a minimum
throughout the whole 8 km machine, to utilize the undulator
radiation in all acceleration and deceleration sections in order
to maximize user potential. Shown in Fig. 3 is the spectral
brightness expectations of the FSF using the start-to-end
beam parameters.
Figure 3: Comparison of the spectral brightness for the FSF
and present 3rd generation light sources.
The average brilliance expectations of the FSF from 1 to
6 GeV plotted in blue, cover a broad wavelength and are a
magnitude larger than present 3rd generation light sources.
The comparison is made using realistic undulator parameters
and common operational modes.
For the high brilliance mode, with all the suppression tech-
niques described in place, the transversal emittance mainly
grows due to incoherent radiation effects and can be analyti-
cally estimated in the 6 GeV arc as 0.04 mm mrad.
Table 2 summarizes the main beam dynamic parameters
at various stages across the machine. The bunch is of great
quality regarding minimal emittance from the 1st to the final
user station on recovery.
Table 2: Start-to-end eam arameters for the 15 pC HBM
Pos. εnx εny σt σE Energy
(mm
mrad)
(mm
mrad)
(ps) (10−3) (MeV)
Input 0.13 0.09 3.09 2.93 50
1st user 0.14 0.08 2.13 0.21 1000
Undulator 0.20 0.08 2.13 0.18 6000
Final user 0.28 0.09 2.13 0.66 1000
Dumpline 1.24 0.11 3.60 72.56 10
The 7.3 % output energy spread is foreseen as unproblem-
atic for the future beam dump design.
SHORT PULSE MODE
Each off-crest acceleration followed by achromatic arcs
constitute the telescopic compression scheme in the lower
energy acceleration sections. The first two arcs up to a beam
energy of 2 GeV have φ1 = +10 , φ2 = −20 and positive
R561 = 20 cm and R562 = 8 cm values. On recovery the
linac phase is shifted φ1,2 → φ1,2+180 (ERL process) and
the arcs have the corresponding symmetric negative R56
values. This telescopic scheme not only has the potential to
produce ultra short bunch lengths but also helps remove the
correlated energy spread from RF on acceleration. Figure
shows the SPM to have a larger relative energy spread com-
pared with the HBM (Low Emittance Mode LEM).
Figure 4: Log plot of the evolution of the energy spread
throughout the FSF for both modes.
Sextupoles are required to combat the transverse emit-
tance growth due to chromatic aberrations due to the high
energy spread on recovery s > 6 km. As an alternative to
computationally expensive particle tracking, key 2nd order
terms were analytically found to reduce the transverse emit-
tance growth.
ε21 = 〈x1
2〉〈x ′21〉 − 〈x1x
′1〉
2 (1)
ε21 = (T161T262 − T162T261)2 (
〈δ20 x20〉〈δ
20 x′20〉 − 〈δ
20 x0x
′0〉
2)
Suitable optic can be found where T161T262 = T162T261 in a
few seconds rather than the usual time scales associated with
dedicated particle tracking codes. Without these additional
corrections the beam degradation on recovery is too large
and results in energy spreads far above the specification at
the dump.
To complement this analytic 2nd order technique, a lon-
gitudinal emittance compensation scheme uses the higher
order magnetic terms created in the arc Eq. 3 and the linac
off-crest acceleration Eq. 2 to recover the longitudinal emit-
tance of the injector Eq. 4.
LINAC: cΔt1 = cΔt0
δ1 = δ0 + R65cΔt0 + T655(cΔt0)2 (2)
ARC: cΔt2 = cΔt1 + R56δ1 + T566δ21 (3)
δ2 = δ1
4
MOPBTH003 Proceedings of ERL2015, Stony Brook, NY, USA
ISBN 978-3-95450-183-0
2Cop
yrig
ht©
2015
CC
-BY-
3.0
and
byth
ere
spec
tive
auth
ors
WG6 ERLs

ε22 =
(T566R
365 − T655
)2〈(cΔt0)4〉〈(cΔt0)2〉 (4)
Figure 5 shows the positive implications of this method
adapted for the two stage telescopic bunch compression,
the vertical scale is logarithmic (log 10−14 → 10 fs). The
longitudinal emittance, black line, is recovered after the first
arc at 1 km. This allows the full potential for further com-
pression in the following arc resulting in a 10 fs long bunch
length shown in red. The longitudinal emittance then grows
due to CSR effects producing unwanted energy spread. The
bunch length at 2 GeV also increases to 25 fs at the entrance
to the long undulator section at 6 GeV. On recovery the bunch
is actively decompressed in preparation for the dump.
Figure 5: Normalized longitudinal emittance and bunch
length in the FSF.
If one assumes that the compression scheme represents a
limit for any given bunch charge, then the zero-charge bunch
length can be deduced from the rectangular bunch model
and the data (red crosses) from start-to-end simulations to be
5.6 fs. As the SPM is heavily dependent on CSR, this notion
is extrapolated in Fig. 6 to form a boundary for feasible
operation in the FSF. Bunch lengths below the boundary
will induce distortions due to CSR that will be too large to
recover the beam at 10 MeV.
Figure 6: Boundary of minimum bunch length due to CSR
effects in the FSF.
Above the boundary all machine settings are possible. The
upper charge boundary of 15 pC is the limit from the injector
studies for low emittance. The 1 ps long bunch extremity on
the top of the figure is seen as a value that will not produce
excessive longitudinal emittance growth during acceleration.
Notably the LEM results would exist in the top right hand
corner of the figure suggesting that the operation mode is
well above the CSR limit and further bunch compression is
possible, but will reduce the average brilliance.
Bunches of 1, 3 and 5 pC were used in the SPM start-to-
end simulations. Table 3 summarizes the results for the 3 pC
case. The bunch length remains below 50 fs throughout the
user stages Low and High Energy Arcs (LEA and HEA)
and the corresponding expectations of the peak brilliance is
shown in Fig. 7.
Figure 7: Comparison of the peak brilliance for the FSF and
present 3rd generation light sources.
As the energy increases and the beam distortions grow de-
pending on the bunch charge and length, the beam properties
rise beyond the diffraction limit. This is apparent in Fig. 7
as the ultimate peak brilliance favors lower bunch charges
at the final beam energy of 6 GeV.
Table 3: Start-to-end eam arameters for the 3 pC SPM
Pos. εnx εny σt σE Energy
(mm
mrad)
(mm
mrad)
(fs) (10−3) (MeV)
Input 0.11 0.06 1990.09 0.46 50
LEA 0.18 0.06 7.39 0.71 2000
HEA 0.30 0.08 22.59 0.62 4000
Undulator 0.49 0.10 24.73 0.52 6000
HEA 1.00 0.23 48.70 0.92 4000
LEA 2.52 0.49 452.22 1.77 2000
Dumpline 32.88 0.64 4430.29 14.66 % 10
REFERENCES
[1] T. Atkinson et al., "Start-to-end Optic of the FSF Multi-turn
ERL Project", IPAC2014, Germany.
[2] A. V. Bondarenko et al, "Implementation of 2D-emittance
compensation scheme in the bERLinpro injector", FEL2011,
China.
[3] A. Matveenko et al., "Multi-turn ERL-based Synchrotron
Light Facility: Injector Design", IPAC2014, Germany.
Proceedings of ERL2015, Stony Brook, NY, USA MOPBTH003
WG6 ERLs
ISBN 978-3-95450-183-0
3 Cop
yrig
ht©
2015
CC
-BY-
3.0
and
byth
ere
spec
tive
auth
ors
DESIGN WORK OF THE ERL-FEL AS THE HIGH INTENSE EUV LIGHT
SOURCE *
N. Nakamura, S. Chen, T. Furuya, K. Haga, I. Hanyu, K. Harada, T. Honda, Y. Honda,
E. Kako, Y. Kamiya, R. Kato, H. Kawata, Y. Kobayashi, T. Konomi, T. Kubo,
S. Michizono, T. Miyajima, H. Nakai, T. Obina, K. Oide, H. Sakai, S. Sakanaka,
M. Shimada, K. Tsuchiya, K. Umemori, M. Yamamoto,
KEK, Oho, Tsukuba, Ibaraki 305-0801, Japan
R. Hajima, N. Nishimori, JAEA, Tokai, Naka, Ibaraki 319-1195, Japan
Abstract
Energy recovery linac(ERL) based free electron
lasers(FELs) are promising candidates of high-power
EUV sources for lithography. We have designed a 10-kW
class ERL-FEL operated at 13.5 nm and demonstrated the
FEL power of more than 10 kW at the average current of
less than 10 mA by using simulations. In this paper, we
will present the design work of the ERL-FEL as the high-
power EUV source.
INTRODUCTION
High-power EUV sources are required in the future for
lithography. EUV FELs are becoming candidates of the
EUV sources because the order of EUV-FEL size and
cost can be acceptable. ERL-based FELs have merits of
energy recovery, low dumped beam power and activation
compared with those based on ordinary linear accelerators.
We recently started the design study on the ERL-based
FEL as a high intense EUV source for lithography
applications. In this design work, the first target is 10-kW
FEL power at 13.5 nm and the beam energy is fixed to
800 MeV. For the design, we use available technology
without too much development and make the most of
resources of the Compact ERL(cERL) at KEK[1].
INJECTOR DESIGN
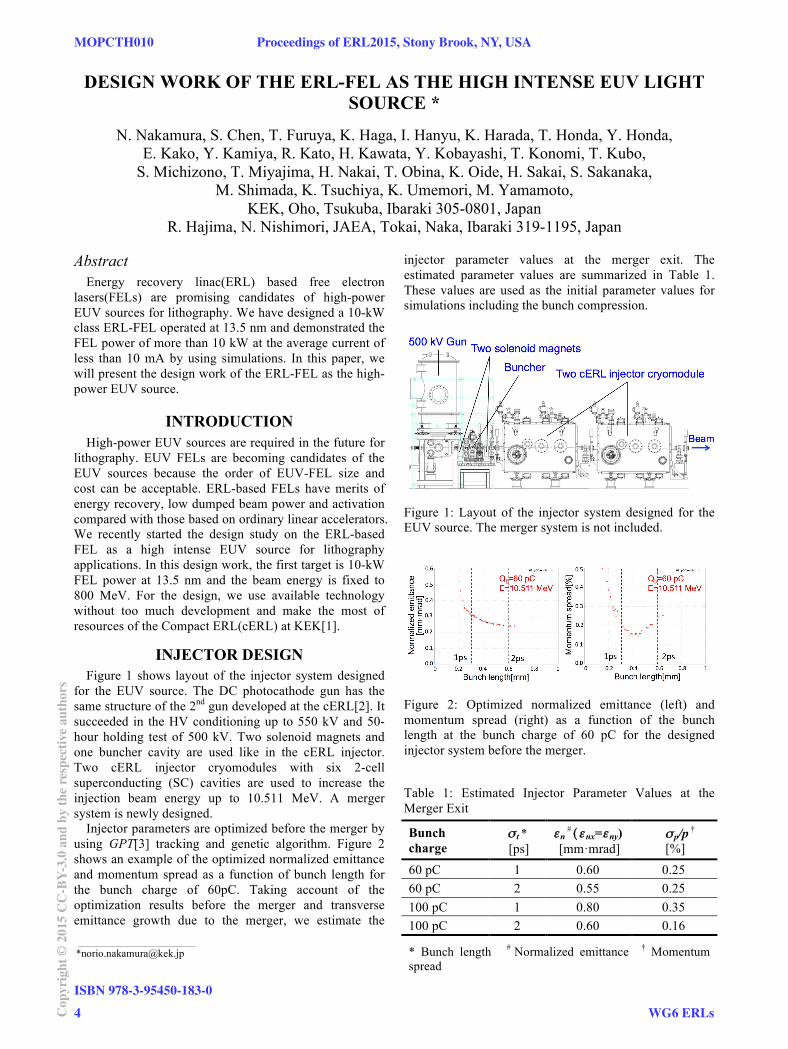
Figure 1 shows layout of the injector system designed
for the EUV source. The DC photocathode gun has the
same structure of the 2nd
gun developed at the cERL[2]. It
succeeded in the HV conditioning up to 550 kV and 50-
hour holding test of 500 kV. Two solenoid magnets and
one buncher cavity are used like in the cERL injector.
Two cERL injector cryomodules with six 2-cell
superconducting (SC) cavities are used to increase the
injection beam energy up to 10.511 MeV. A merger
system is newly designed.
Injector parameters are optimized before the merger by
using GPT[3] tracking and genetic algorithm. Figure 2
shows an example of the optimized normalized emittance
and momentum spread as a function of bunch length for
the bunch charge of 60pC. Taking account of the
optimization results before the merger and transverse
emittance growth due to the merger, we estimate the
injector parameter values at the merger exit. The
estimated parameter values are summarized in Table 1.
These values are used as the initial parameter values for
simulations including the bunch compression.
Figure 1: Layout of the injector system designed for the
EUV source. The merger system is not included.
Figure 2: Optimized normalized emittance (left) and
momentum spread (right) as a function of the bunch
length at the bunch charge of 60 pC for the designed
injector system before the merger.
Table 1: Estimated Injector Parameter Values at the
Merger Exit
Bunch
charge
σ t *
[ps]
εn # (εnx=εny)
[mm·mrad]
σp/p †
[%]
60 pC 1 0.60 0.25
60 pC 2 0.55 0.25
100 pC 1 0.80 0.35
100 pC 2 0.60 0.16
* Bunch length
# Normalized emittance
† Momentum
spread
____________________________________________
MOPCTH010 Proceedings of ERL2015, Stony Brook, NY, USA
ISBN 978-3-95450-183-0
4Cop
yrig
ht©
2015
CC
-BY-
3.0
and
byth
ere
spec
tive
auth
ors
WG6 ERLs
MAIN LINAC DESIGN
Cavity Design
The cERL main-linac cavities, called Model 2, are
stably operated at about 8.5MV/m[4]. However the field
emission of the cavities becomes significant above about
10 MV/m. Therefore we will use a different design called
Model 1 for the EUV source. The Model-1 cavity[5]
illustrated in Fig. 3 is a Tesla-type 9-cell cavity with a
large-aperture HOM-damped beam pipe. This cavity has a
smaller ratio of the peak to acceleration electric field as
compared to Model 2. Therefore stable operation at 12.5
MV/m seems achievable. The detailed structure of the
Model-1 cavity is under design and the large-aperture
HOM-damped beam pipe may be applied to the other side.
Figure 3: Illustration of the Model-1 cavity.
Table 2: Comparison of Model 1 and Model 2
Model 1 Model 2
Frequency 1.3 GHz 1.3 GHz
Rsh/Q 1007 Ω 897 Ω
Ep/Eacc 2.0 3.0
Iris diameter 70 mm 80 mm
Main Linac Optics
The main linac has 64 cavities in 16 cryomodules to
accelerate the beam up to 800 MeV. The acceleration
electric field is about 12.5 MV/m. Figure 4 shows the
main-linac optics for acceleration and deceleration.
Quadrupole triplets are placed at every two cryomodules
for the beam focusing. The horizontal and vertical
betatron functions are optimized against transverse beam
break-up (BBU) due to the cavity HOMs.
Figure 4: Horizontal and vertical betatron functions
(βx, βy) of the main superconducting linac for the
acceleration and deceleration phases.
HOM BBU and Heating
The BBU threshold current is calculated for the
designed main-linac optics by using the simulation code
bi[6]. The transverse HOM parameters of the Model-1
cavity are listed in Table 3. By scanning over the betatron
phase and the return loop length, the minimum threshold
current is calculated to be 195 mA without the HOM
frequency randomization. It is well above the expected
average current of the EUV source.
Table 3: HOM Parameters of the Model-1 Cavity
Frequency
[GHz]
Qe R/Q
[Ω/cm2]
(R/Q) Qe/f
[Ω/cm2/GHz]
1.866 7732 6.43 26659
1.874 11655 8.77 54526
1.879 18360 1.95 19089
2.575 4899 21.32 40557
3.082 33608 0.98 10676
The HOM heating of the main-linac cavity should be
considered. The parasitic loss of the beam is given by the
following equation:
Ploss = klossQb
2f . (1)
where the loss factor kloss strongly depends on the bunch
length. The parasitic loss is finally absorbed at the HOM
damper. Therefore the maximum absorption power of the
HOM damper restricts the bunch charge, length and
frequency. Table 4 shows examples of estimated parasitic
loss power for the Model-1 cavity. Our short-term target
of the absorption power of the HOM damper is 30 W and
the final goal is 100 W. In addition, the bunch frequency
should be carefully selected so as to avoid heating
resonant to monopole HOMs. Bunch frequencies of 130,
162.5, 260, 325 and 650 MHz are possible at least for the
Model-1 cavity.
Table 4: Estimated Parasitic Loss of the Model-1 Cavity
Bunch length
@cavity
9.75mA x 2
60pC
162.5MHz
8mA x 2
100pC
81.25MHz
1 ps 23.4 W 32 W
2 ps 17.6 W 24 W
FEL PARAMETERS
Here FEL parameters are briefly described. The FEL
power PFEL is roughly expressed by the product of the
electron beam power Pelectron and Pierce parameter ρFEL as
follows:
PFEL
= ρFELPelectron
. (2)
The electron beam power is the product of the beam
energy E and the average beam current Iav. The Pierce
parameter is given by
Proceedings of ERL2015, Stony Brook, NY, USA MOPCTH010
WG6 ERLs
ISBN 978-3-95450-183-0
5 Cop
yrig
ht©
2015
CC
-BY-
3.0
and
byth
ere
spec
tive
auth
ors

ρFEL =1
16
I p
IA
K2[JJ ]
2λu2
γ 3σ xσ y (2π )2
!
"##
$
%&&
1/3
, (3)
where Ip, IA, γ, σx, σy, K and λu are the peak current,
Alfven current(17kA), horizontal and vertical beam sizes,
the K-vaue and magnetic period of the undulators. [JJ] is
J0[ξ]-J1[ξ] with ξ=K2/(4+2K
2) for planar undulators and
unity for helical undulators. The horizontal and vertical
beam sizes are proportional to the square root of the
horizontal and vertical emittances, respectively. High
peak current and low emittance are important for the FEL
power.
BUNCH COMPRESSION AND
DECOMPRESSION SCHEME
Bunch compression is essential for achieving high peak
current and decompression for efficient energy recovery
without significant beam loss.
Figure 5: Bunch compression and decompression
schemes: (a) The bunch compressor is the 1st arc. (b) The
bunch compressor is only the chicane or combination of
the 1st arc and chicane. For all the cases, the bunch
decompressor is the 2nd
arc.
The simplest scheme is that the bunch compressor is
the 1st arc and the bunch decompressor the 2
nd arc and
illustrated in Fig. 5a. The 1st and 2
nd arcs have the R56 and
T566 values with different signs. The electron bunch from
the injector is accelerated off crest in the main linac and
compressed in the 1st arc with non-zero R56 optics. The
sextupole magnets in the 1st arc optimize T566 in order to
minimize the bunch length or maximize the Pierce
parameter. The compressed bunch is used for the FEL in
the long undulator section and then decompressed before
the beam dump by using the optics of the 2nd
arc and off-
crest deceleration in the main linac.
Figure 5b shows two other bunch compression and
decompression schemes using a chicane. One is that the
bunch compressor is only the chicane and the other
combination of the 1st arc and chicane. We try three
different bunch compression schemes in our design study.
DESIGN OF ARCS AND CHICANE
Arc Sections
A 2-cell TBA lattice is used for design of the arc
sections. Figure 6 shows the 2-cell TBA lattice and an
example of the isochronous optics (R56=0 m). The
structure of the TBA cell is very similar to that of the
cERL arcs. The bending radius and angle are 3 m and π/8
for each of the eight sector bending magnets. The lengths
of the quadrupole and sextupole magnets are two times
longer than that of the cERL because the beam energy is
high. Optics matching of the two cells is done by four
quadrupole magnets at the arc center. Eight sextupole
magnets can be inserted in the arc to optimize T566.
The R56 of the 2-cell TBA lattice is expressed with the
bending radius ρ, the bending angle θ and the dispersion
function ηc at the TBA-cell center as follows:
R56= 4ρ(θ − sinθ )+ 2η
csinθ . (4)
The 2-cell TBA optics with different R56 values of ±0.3 m
and ±0.6 m can be designed in a similarly way to the
isochronous optics. The 2-cell TBA lattice has a wide
dynamic range of R56. The momentum acceptance is
estimated from the maximum dispersion function to be
more than 4% for a possible horizontal half-aperture of
about 5 cm and expected to tolerate a large momentum
spread caused by the FEL.
Figure 6: 2-cell TBA lattice and optics for the arcs. The
betatron and dispersion functions of an isochronous optics
(R56=0 m) are shown in the upper and lower graphs.
MOPCTH010 Proceedings of ERL2015, Stony Brook, NY, USA
ISBN 978-3-95450-183-0
6Cop
yrig
ht©
2015
CC
-BY-
3.0
and
byth
ere
spec
tive
auth
ors
WG6 ERLs
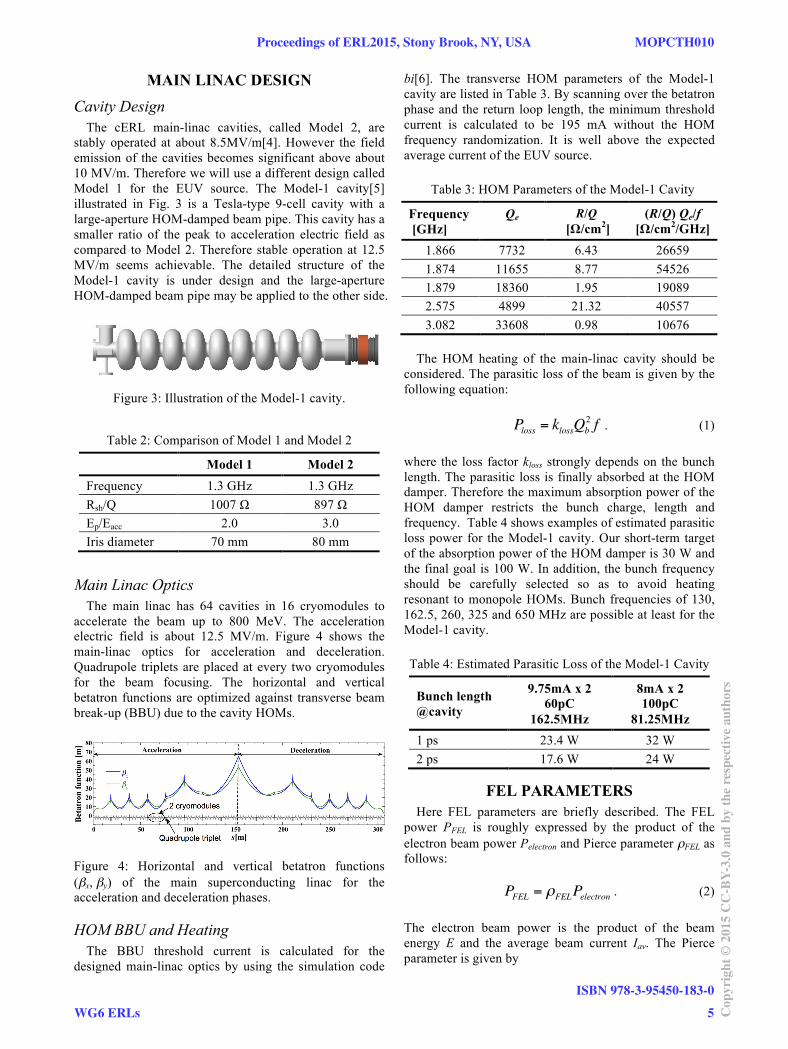
Chicane
A chicane is designed with four rectangular bending
magnets for the bunch compression. The R56 of this
chicane is expressed by
R56= −
4LB
cosθ−4L
B
2LD
ρ2 cos3θ+ 4ρθ , (5)
where ρ, θ, LB, and LD are the bending radius, the bending
angle and the magnet length and interval. In the design,
the magnet length of 1 m and the magnet interval of 0.51
m are used. Figure 7a is chicane optics with R56 of -0.3 m
for the bunch compression by only the chicane and Figure
7b chicane optics with R56 of -0.15 m for the bunch
compression by combination of the 1st arc and chicane.
They are used for the bunch compression simulations.
Figure 7: Dispersion function ηx and betatron functions
(βx, βy) of the chicane for bunch compression (a) by only
the chicane (R56=-0.3 m) and (b) by the combination of
the 1st arc and chicane (R56=-0.15 m).
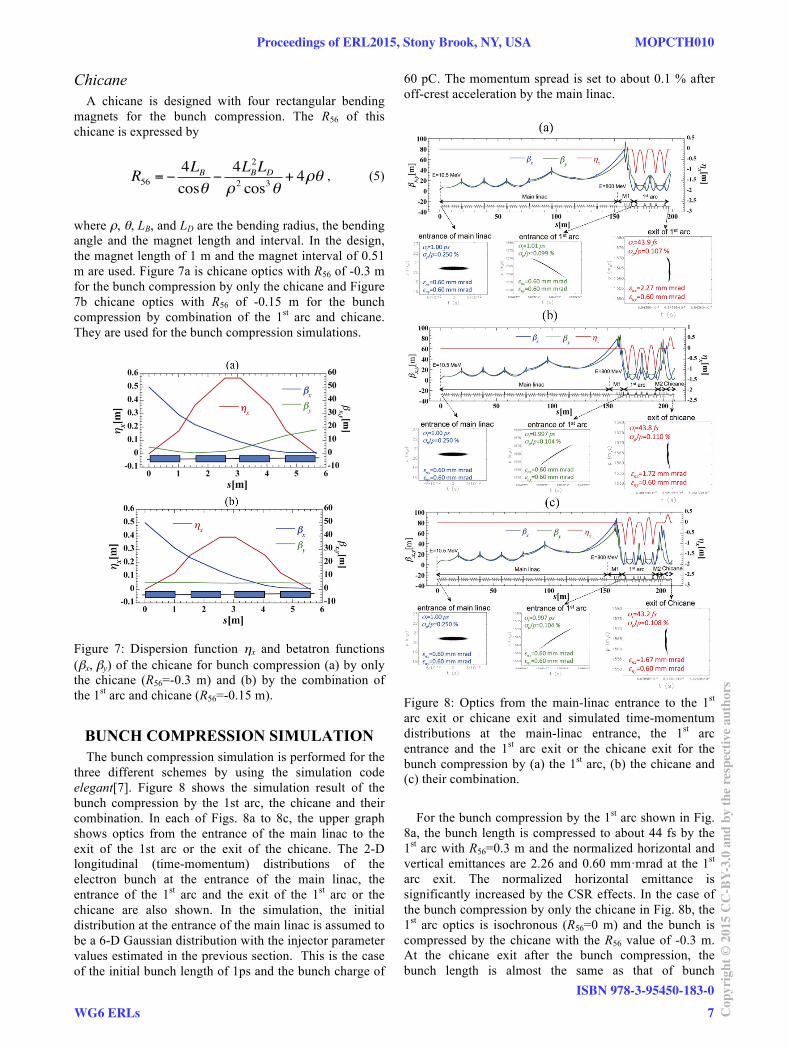
BUNCH COMPRESSION SIMULATION
The bunch compression simulation is performed for the
three different schemes by using the simulation code
elegant[7]. Figure 8 shows the simulation result of the
bunch compression by the 1st arc, the chicane and their
combination. In each of Figs. 8a to 8c, the upper graph
shows optics from the entrance of the main linac to the
exit of the 1st arc or the exit of the chicane. The 2-D
longitudinal (time-momentum) distributions of the
electron bunch at the entrance of the main linac, the
entrance of the 1st arc and the exit of the 1
st arc or the
chicane are also shown. In the simulation, the initial
distribution at the entrance of the main linac is assumed to
be a 6-D Gaussian distribution with the injector parameter
values estimated in the previous section. This is the case
of the initial bunch length of 1ps and the bunch charge of
60 pC. The momentum spread is set to about 0.1 % after
off-crest acceleration by the main linac.
Figure 8: Optics from the main-linac entrance to the 1st
arc exit or chicane exit and simulated time-momentum
distributions at the main-linac entrance, the 1st arc
entrance and the 1st arc exit or the chicane exit for the
bunch compression by (a) the 1st arc, (b) the chicane and
(c) their combination.
For the bunch compression by the 1st arc shown in Fig.
8a, the bunch length is compressed to about 44 fs by the
1st arc with R56=0.3 m and the normalized horizontal and
vertical emittances are 2.26 and 0.60 mm·mrad at the 1st
arc exit. The normalized horizontal emittance is
significantly increased by the CSR effects. In the case of
the bunch compression by only the chicane in Fig. 8b, the
1st arc optics is isochronous (R56=0 m) and the bunch is
compressed by the chicane with the R56 value of -0.3 m.
At the chicane exit after the bunch compression, the
bunch length is almost the same as that of bunch
Proceedings of ERL2015, Stony Brook, NY, USA MOPCTH010
WG6 ERLs
ISBN 978-3-95450-183-0
7 Cop
yrig
ht©
2015
CC
-BY-
3.0
and
byth
ere
spec
tive
auth
ors
compression by the 1st arc. On the other hand, the
normalized horizontal emittance is reduced to 1.72
mm·mrad because the CSR effects are reduced by optics
adjustment described later. Figure 8c shows the
simulation result of the bunch compression by
combination of the 1st arc and chicane. Both the 1
st arc
and chicane have the same R56 value of -0.15 m. At the
chicane exit, the bunch has almost the same parameter
values as that of the bunch compression by only the
chicane. The parameter values after the bunch
compression are summarized in Table 5.
For the two bunch compression schemes using the
chicane, the CSR-induced emittance growth is reduced by
matching the phase ellipse angle to the CSR kick angle at
the chicane exit, as shown in Fig. 9. The Pierce parameter
becomes almost maximum at this matching condition.
Such adjustment of the phase ellipse angle is found to be
difficult for the bunch compression by the 1st arc having
achromatic TBA optics with a fixed R56 value. Therefore
the normalized horizontal emittance is large compared to
those of the other two schemes using the chicane.
Table 5: Beam Parameters after Bunch Compression
Bunch
Compressor
σ t *
[fs]
σp/p #
[%]
εnx , εny †
[mm·mrad]
1st arc 43.9 0.107 2.27, 0.60
Chicane 43.8 0.110 1.72, 0.60
1st arc + Chicane 43.2 0.108 1.67, 0.60
* Bunch length # Momentum spread
† Normalized
horizontal and vertical emittances
Figure 9: Maximization of the Pierce parameter by
matching the phase ellipse angle φphase to the CSR kick
angle φCSR=63.4 degrees. This is the case for the bunch
compression by only the chicane at the bunch charge of
60 pC.
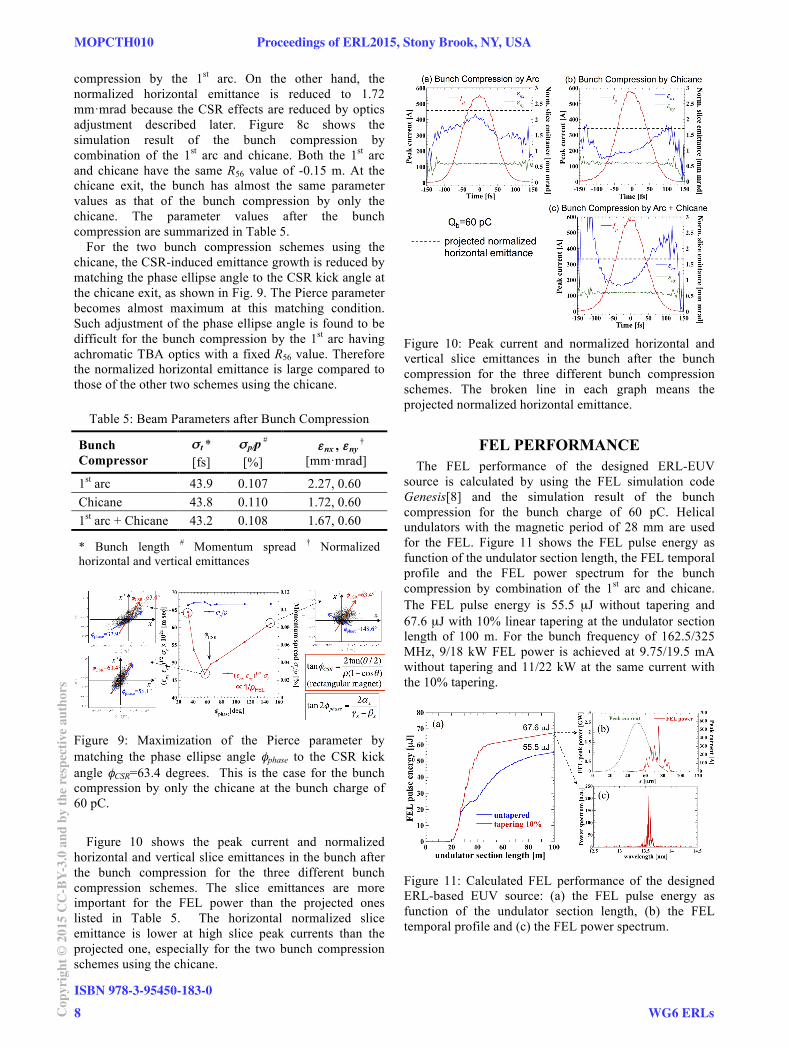
Figure 10 shows the peak current and normalized
horizontal and vertical slice emittances in the bunch after
the bunch compression for the three different bunch
compression schemes. The slice emittances are more
important for the FEL power than the projected ones
listed in Table 5. The horizontal normalized slice
emittance is lower at high slice peak currents than the
projected one, especially for the two bunch compression
schemes using the chicane.
Figure 10: Peak current and normalized horizontal and
vertical slice emittances in the bunch after the bunch
compression for the three different bunch compression
schemes. The broken line in each graph means the
projected normalized horizontal emittance.
FEL PERFORMANCE
The FEL performance of the designed ERL-EUV
source is calculated by using the FEL simulation code
Genesis[8] and the simulation result of the bunch
compression for the bunch charge of 60 pC. Helical
undulators with the magnetic period of 28 mm are used
for the FEL. Figure 11 shows the FEL pulse energy as
function of the undulator section length, the FEL temporal
profile and the FEL power spectrum for the bunch
compression by combination of the 1st arc and chicane.
The FEL pulse energy is 55.5 µJ without tapering and
67.6 µJ with 10% linear tapering at the undulator section
length of 100 m. For the bunch frequency of 162.5/325
MHz, 9/18 kW FEL power is achieved at 9.75/19.5 mA
without tapering and 11/22 kW at the same current with
the 10% tapering.
Figure 11: Calculated FEL performance of the designed
ERL-based EUV source: (a) the FEL pulse energy as
function of the undulator section length, (b) the FEL
temporal profile and (c) the FEL power spectrum.
MOPCTH010 Proceedings of ERL2015, Stony Brook, NY, USA
ISBN 978-3-95450-183-0
8Cop
yrig
ht©
2015
CC
-BY-
3.0
and
byth
ere
spec
tive
auth
ors
WG6 ERLs

SUMMARY AND OUTLOOK
The design work on the ERL-based EUV source was
recently started. The injector, main linac, arc sections and
chicane have been designed. The bunch compression
simulation has also been done. As a result, more than
10/20 kW FEL power is demonstrated at the average
current of less than 10/20 mA. The present image of the
designed EUV source is shown in Fig. 12. Further design
work and optimization for the tapering, optics, beam and
undulator parameters are expected to improve the FEL
power. In addition, the bunch decompression simulation
and finally S2E simulation from the gun to the beam
dump should be performed.
Figure 12: Present image of the designed ERL-based
EUV source.
REFERENCES
[1] S. Sakanaka et al., MOPCTH07, ERL2015, Stony
Brook, NY, USA.
[2] M. Yamamoto et al., TUIBLH1020, ERL2015, Stony
Brook, NY, USA.
[3] GPT, http://www.pulsar.nl/gpt/index.html
[4] H. Sakai et al., WEIBLH2054, ERL2015, Stony
Brook, NY, USA.
[5] H. Sakai et al., Proc. of ERL2007, Daresbury, UK,
p.34 (2007).
[6] bi, http://www.lepp.cornell.edu/~ib38/bbu/
[7] elegant, http://www.aps.anl.gov/Accelerator_Systems
_Division/Accelerator_Operations_Physics/manuals/
elegant_latest/elegant.pdf
[8] Genesis, http://genesis.web.psi.ch
Proceedings of ERL2015, Stony Brook, NY, USA MOPCTH010
WG6 ERLs
ISBN 978-3-95450-183-0
9 Cop
yrig
ht©
2015
CC
-BY-
3.0
and
byth
ere
spec
tive
auth
ors
STATUS AND COMMISSIONING RESULTS OF THE R&D ERL AT BNL*D. Kayran#,1,2, Z. Altinbas1, D. Beavis1, S. Belomestnykh1,2, I. Ben-Zvi1,2, S. Deonarine1,D. M. Gassner1, R. C. Gupta1, H. Hahn1,L. R. Hammons1,2, Chung Ho1, J. Jamilkowski1,
P. Kankiya1, N. Laloudakis1, R. Lambiase1, V.N. Litvinenko1,2, G. Mahler1, L. Masi1, G. McIntyre1,T. A. Miller1, J. Morris1, D. Phillips1, V. Ptitsyn1,2, T. Seda1, B. Sheehy1, L. Smart1, K. Smith1,
T. Srinivasan-Rao1, A.N.Steszyn1, T. R. Than1, E. Wang1, D. Weiss1, Huamu Xie1, Wencan Xu1,A.Zaltsman1
1) Collider-Accelerator Department, Brookhaven National Laboratory, Upton, NY 11973, USA
2) Physics & Astronomy Department, Stony Brook University, Stony Brook, NY 11794, USA
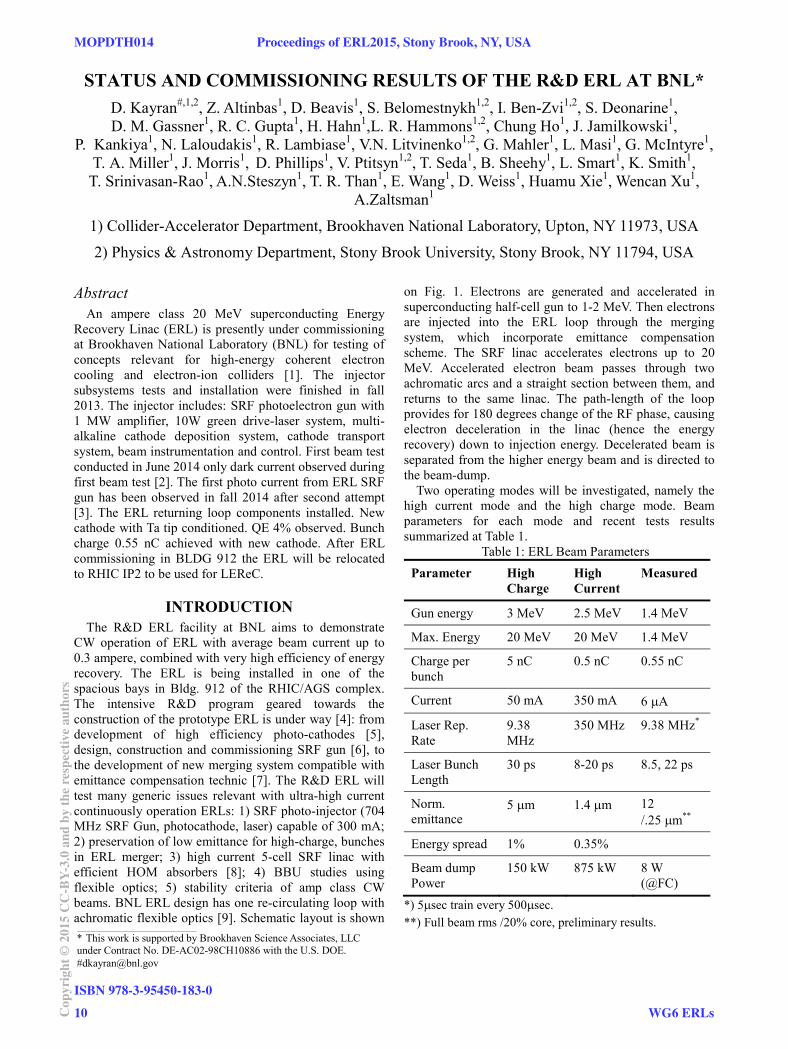
AbstractAn ampere class 20 MeV superconducting Energy
Recovery Linac (ERL) is presently under commissioning at Brookhaven National Laboratory (BNL) for testing of concepts relevant for high-energy coherent electron cooling and electron-ion colliders [1]. The injector subsystems tests and installation were finished in fall 2013. The injector includes: SRF photoelectron gun with 1 MW amplifier, 10W green drive-laser system, multi-alkaline cathode deposition system, cathode transport system, beam instrumentation and control. First beam test conducted in June 2014 only dark current observed during first beam test [2]. The first photo current from ERL SRF gun has been observed in fall 2014 after second attempt [3]. The ERL returning loop components installed. New cathode with Ta tip conditioned. QE 4% observed. Bunch charge 0.55 nC achieved with new cathode. After ERL commissioning in BLDG 912 the ERL will be relocated to RHIC IP2 to be used for LEReC.
INTRODUCTIONThe R&D ERL facility at BNL aims to demonstrate
CW operation of ERL with average beam current up to 0.3 ampere, combined with very high efficiency of energy recovery. The ERL is being installed in one of the spacious bays in Bldg. 912 of the RHIC/AGS complex. The intensive R&D program geared towards the construction of the prototype ERL is under way [4]: from development of high efficiency photo-cathodes [5], design, construction and commissioning SRF gun [6], to the development of new merging system compatible with emittance compensation technic [7]. The R&D ERL will test many generic issues relevant with ultra-high current continuously operation ERLs: 1) SRF photo-injector (704 MHz SRF Gun, photocathode, laser) capable of 300 mA; 2) preservation of low emittance for high-charge, bunches in ERL merger; 3) high current 5-cell SRF linac with efficient HOM absorbers [8]; 4) BBU studies using flexible optics; 5) stability criteria of amp class CW beams. BNL ERL design has one re-circulating loop with achromatic flexible optics [9]. Schematic layout is shown
on Fig. 1. Electrons are generated and accelerated in superconducting half-cell gun to 1-2 MeV. Then electrons are injected into the ERL loop through the merging system, which incorporate emittance compensation scheme. The SRF linac accelerates electrons up to 20 MeV. Accelerated electron beam passes through two achromatic arcs and a straight section between them, and returns to the same linac. The path-length of the loop provides for 180 degrees change of the RF phase, causing electron deceleration in the linac (hence the energy recovery) down to injection energy. Decelerated beam is separated from the higher energy beam and is directed to the beam-dump.
Two operating modes will be investigated, namely the high current mode and the high charge mode. Beam parameters for each mode and recent tests results summarized at Table 1.
Table 1: ERL Beam ParametersParameter High
ChargeHigh Current
Measured
Gun energy 3 MeV 2.5 MeV 1.4 MeV
Max. Energy 20 MeV 20 MeV 1.4 MeV
Charge per bunch
5 nC 0.5 nC 0.55 nC
Current 50 mA 350 mA 6 A
Laser Rep. Rate
9.38 MHz
350 MHz 9.38 MHz*
Laser Bunch Length
30 ps 8-20 ps 8.5, 22 ps
Norm. emittance
5 m 1.4 m 12/.25 m**
Energy spread 1% 0.35%
Beam dump Power
150 kW 875 kW 8 W (@FC)
*) 5 sec train every 500 sec.**) Full beam rms /20% core, preliminary results.
____________________________________________
* This work is supported by Brookhaven Science Associates, LLC under Contract No. DE-AC02-98CH10886 with the U.S. DOE.#[email protected]
MOPDTH014 Proceedings of ERL2015, Stony Brook, NY, USA
ISBN 978-3-95450-183-0
10Cop
yrig
ht©
2015
CC
-BY-
3.0
and
byth
ere
spec
tive
auth
ors
WG6 ERLs

Figure 1: Schematic layout of the R&D ERL at BNL.
In the high current (0.3 A) mode ERL will accelerate electron 0.5 nC per bunch with 703 MHz rep-rate. In this case the energy gain of electrons at gun exit is limited to 2.0 MeV by the available RF CW klystron power of 1 MW. In the high charge mode, ERL will have electron beam with 5 nC per bunch and 10 MHz repetition rate, i.e. it will produce 50 mA average current. In this mode, the electrons energy at the gun exit could be pushed higher. The maximum voltage at the gun is 2.5 MV limited by power coupling design and available RF power.
SRF COMPONENTSThe most important element of BNL ERL is SRF
photo-injector. BNL 704 MHz SRF gun has been designed with a short 8.5 cm cell. The short length was chosen to provide high electric field at the cathode at low accelerating voltage. In order to provide effective damping of high order mode (HOM) this gun has rather large iris radius of 5 cm. Ferrate dumpers are installed around ceramic break at the exit of the gun. Gun has been installed at ERL in 2012. SRF gun now routinely operates CW without the cathode at 2 MV accelerating voltage.
With new cathode stalk installed the gun operated at 1.25 MV [10] with good vacuum and no radiation. (See Fig. 2)
Figure 2: ERL 704MHz SRF gun performance during conditioning and CW operation with new cathode stalk. From top to bottom: radiation, beam-line vacuum, klystron power and gun voltage signals.
The heart of the ERL facility is 5-cell 704MHz SRF linac, which is designed for operating with ampere-class CW beam current [8]. The cavity was designed as a “single-mode” cavity, in which all Higher Order Modes (HOMs) propagate to HOM ferrite absorbers through the large beam pipe. This design provides for very low Q’s for HOMs and hence very high ERL stability.
Proceedings of ERL2015, Stony Brook, NY, USA MOPDTH014
WG6 ERLs
ISBN 978-3-95450-183-0
11 Cop
yrig
ht©
2015
CC
-BY-
3.0
and
byth
ere
spec
tive
auth
ors

Measurements of the damped Q and R/Q of the HOMs and simulations show that in nominal operation regime the cavity is stable to over 20 amperes in a one pass ERL and over 2 amperes for two passes ERL. The 5cell cavity has been commissioned in 2010. In cold emission tests high gradients are achieved for short period of time (as shown in Fig. 3).
A thermal problem has been discovered during commissioning SRF 5-cell cavity, which prevents CW operation at gradients above 12 MV/m. However, the prototype program can still be pursued if the cavity can be operated in a pulsed “quasi-cw’ mode up to 20 MV/m, in which the cavity is on, with stable gradient, for a time long compared with the transit time through the ERL loop (10 nsec).
Figure 3: Five cell cavity performances during horizontal test. Pulses are 2 seconds long with a 30 second interval
SRF PHOTOINJECTOR BEAM TEST SETUP
The beam commissioning has been started on June 2014. The first beam test schematic setup shown in Fig. 4. The ERL injection dipole is off during first beam test. The current coming from the gun goes straight to the faraday cup where current can be measured. Steering magnet is installed next to the laser cross. The beam profile monitor (YAG crystal) can be inserted before the faraday cup to measure beam size [11] (see Fig. 4).
For the first beam test, a Cs3Sb cathode was fabricated using copper substrate and QE has been measured at value of 2E-3 in deposition chamber. During cathode stalk transfer to the gun QE significantly degraded. Additional QE reduction has been observed when cathode has been used at liquid nitrogen temperature. Final QE measured was very low of 2.7e-5.
With maximum available laser power 4W we were able to extract only 7.7 pC charge per bunch. This first photocurrent was measured during the first ERL gun beam test [3] (see Fig. 5).
Figure 4: Schematic layout of the SRF injector at BNL R&D ERL.
Figure 5: Faraday cup (1MOhm termination) signal during first beam test of ERL 704 MHz SRF Gun. Top: laser shutter open 1.09V; bottom: laser shutter closed 38mV. It corresponds to dark current 38nA, photocurrent 1.09 mA.
RESULTS WITH NEW CATHODE STALK New cathode stalk with Ta tip has been fabricated. We
tested 3.8% QE K2CsSb cathode in the 704MHz SRF gun. The cathode survives well during the gun and stalk RF conditioning. The maximum cathode QE inside the gun (cold) measured 1%. We didn’t see any QE degradation after two days of high bunch charge operation. The vacuum at the gun exit is at 10-9 scale during gun operation. After extracting the measured QE at room temperature is still 3.8% [12] (see Fig. 6).
During the beam tests bunch charge was measured by FC and ICT (Fig. 7). Both measurements agreed.
.
MOPDTH014 Proceedings of ERL2015, Stony Brook, NY, USA
ISBN 978-3-95450-183-0
12Cop
yrig
ht©
2015
CC
-BY-
3.0
and
byth
ere
spec
tive
auth
ors
WG6 ERLs
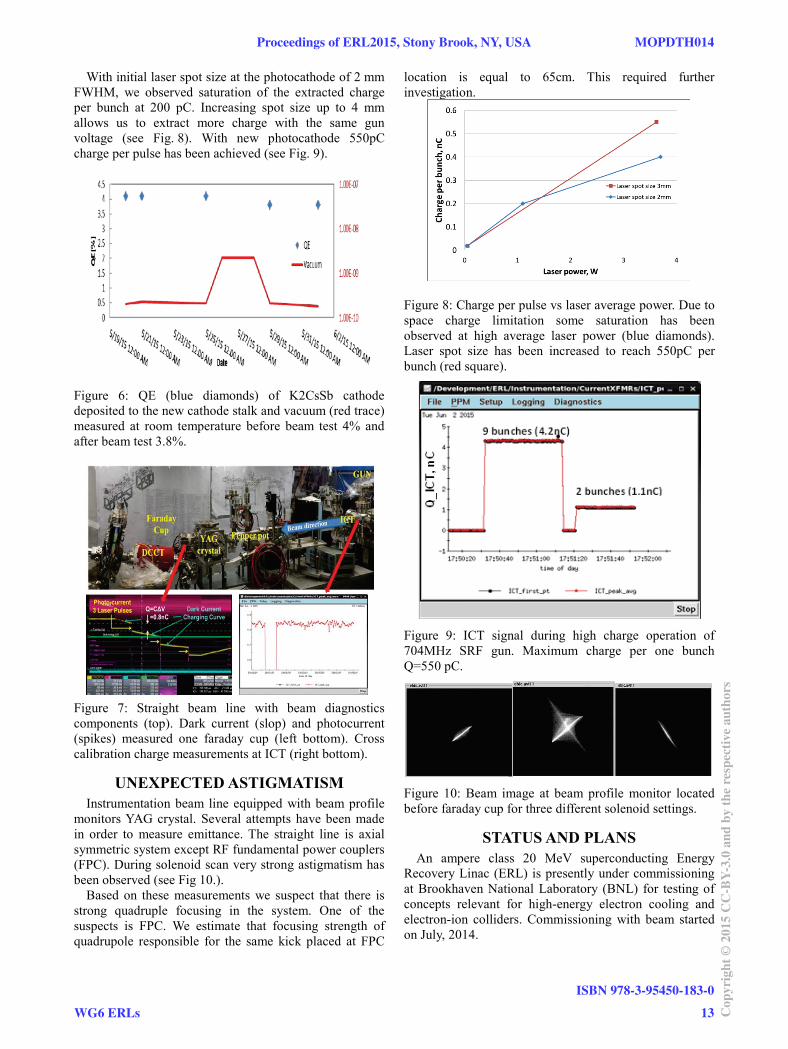
With initial laser spot size at the photocathode of 2 mm FWHM, we observed saturation of the extracted charge per bunch at 200 pC. Increasing spot size up to 4 mm allows us to extract more charge with the same gun voltage (see Fig. 8). With new photocathode 550pC charge per pulse has been achieved (see Fig. 9).
Figure 6: QE (blue diamonds) of K2CsSb cathode deposited to the new cathode stalk and vacuum (red trace) measured at room temperature before beam test 4% and after beam test 3.8%.
Figure 7: Straight beam line with beam diagnostics components (top). Dark current (slop) and photocurrent (spikes) measured one faraday cup (left bottom). Cross calibration charge measurements at ICT (right bottom).
UNEXPECTED ASTIGMATISMInstrumentation beam line equipped with beam profile
monitors YAG crystal. Several attempts have been made in order to measure emittance. The straight line is axial symmetric system except RF fundamental power couplers (FPC). During solenoid scan very strong astigmatism has been observed (see Fig 10.).
Based on these measurements we suspect that there is strong quadruple focusing in the system. One of the suspects is FPC. We estimate that focusing strength of quadrupole responsible for the same kick placed at FPC
location is equal to 65cm. This required further investigation.
Figure 8: Charge per pulse vs laser average power. Due to space charge limitation some saturation has been observed at high average laser power (blue diamonds). Laser spot size has been increased to reach 550pC per bunch (red square).
Figure 9: ICT signal during high charge operation of 704MHz SRF gun. Maximum charge per one bunch Q=550 pC.
Figure 10: Beam image at beam profile monitor located before faraday cup for three different solenoid settings.
STATUS AND PLANSAn ampere class 20 MeV superconducting Energy
Recovery Linac (ERL) is presently under commissioning at Brookhaven National Laboratory (BNL) for testing of concepts relevant for high-energy electron cooling and electron-ion colliders. Commissioning with beam started on July, 2014.
Proceedings of ERL2015, Stony Brook, NY, USA MOPDTH014
WG6 ERLs
ISBN 978-3-95450-183-0
13 Cop
yrig
ht©
2015
CC
-BY-
3.0
and
byth
ere
spec
tive
auth
ors
Gun to dump commissioning has been approved. Full ERL loop commissioning approval is under its way.The first photo current from ERL SRF gun has been observed in November 2014 (1 mA per 500msec RF pulse). New “mulipactor free” Ta tip cathode stalks conditioned for CW operation in March, 2015. ERL returning loop components installation is completed in May, 2015. QE with Ta cathode tip: room temperature measured 4%, cold in gun 1%. May, 2015. Beam commissioning with new cathode started in June 2015. Some beam parameters measured: energy, emittance. The highest charge per bunch from SRF gun .55 nC has been demonstrated, max average current per 3 msec RF pulse 3.5uA. We startedcommissioning beam instrumentation with beam. After ERL commissioning in BLDG912 the ERL components will be relocated to RHIC IP2 to be used as low energy RHIC electron cooler [13].
REFERENCES[1] I. Ben-Zvi et al., “Extremely High Current, High
Brightness Energy Recovery Linac,” In Proc. of PAC2005, pp. 2741-2743 (2005).
[2] D. Kayran et al., “First Test Results from SRF Photoinjector for the R&D ERL at BNL,” In Proc. of IPAC’14, pp. 748-750 (2014).
[3] Wencan Xu et al., “First beam Commissioning at BNL ERL SRF gun,” In Proc. of IPAC’2015, pp1941-1943 (2015).
[4] D. Kayran et al., “Status of High Current R&D Energy Recovery Linac at BNL,” In Proc. ofPAC’11, pp. 2148-2150 (2011).
[5] E. Wang et al., “Fabrication of alkali antimonite photocathode for SRF gun,” In Proc. of IPAC’14, pp. 742-744 (2014).
[6] Wencan Xu et al., Commissioning SRF gun for the R&D ERL at BNL, In Proc. of IPAC2013, pp. 2492-2494 (2013).
[7] V.N. Litvinenko, R. Hajima, D. Kayran, NIMA 557,165 (2006).
[8] B. Sheehy et al., “BNL 703 MHz Superconducting RF cavity testing”, In Proc. of PAC’11, pp. 913-915(2011).
[9] D. Kayran et al., “Optics for High Brightness and High Current ERL Project at BNL”, In Proc. of PAC2005, pp. 1775- 1777 (2005).
[10] Wencan Xu et al., “Multipacting-free quarter-wavelength choke joint design for BNL SRF gun”, In Proc. of IPAC’2015, pp 1935-1937 (2015).
[11] T.A. Miller et al., “Current Measurement and Associated Machine Protection in the ERL at BNL”.WEIALH248, these proceedings ERL2015.
[12] E. Wang et al., “Characterization of Multi-alkali Antimonide Cathode at Cryogenic Temperatures and its Performance in SRF Gun”. TUICLH1027, these proceedings, ERL2015.
[13] J. Kewisch et al., “ERL for Low Energy Electron Cooling at RHIC (LEReC)”, WEICLH1058, these proceedings, ERL2015.
MOPDTH014 Proceedings of ERL2015, Stony Brook, NY, USA
ISBN 978-3-95450-183-0
14Cop
yrig
ht©
2015
CC
-BY-
3.0
and
byth
ere
spec
tive
auth
ors
WG6 ERLs
LHeC ERL DESIGN AND BEAM-DYNAMICS ISSUES
A. Bogacz, JLab, Newport News, VA 23606, USAA. Latina, D. Schulte, CERN, Geneva, Switzerland
D. Pellegrini, EPFL, Lausanne, Switzerland and CERN, Geneva, Switzerland
AbstractThe LHeC study is a possible upgrade of the LHC that
aims at delivering an electron beam for collision with the
existing hadronic beam. The current baseline design for the
electron facility consists of a multi-pass superconductive
energy-recovery linac operating in a continuous wave mode.
Here, we describe the overall layout of such ERL complex
located on the LHC site. We present an optimized multi-pass
linac optics enabling operation of the proposed 3-pass RLA
in the Energy Recovery mode. We also describe emittance
preserving return arc optics architecture; including layout
and optics of the arc switch-yard. High current (∼100 mA)
beam operation in the linacs excites long range wake-fields
between bunches of different turns, which induce instabilities
and might cause beam losses. The impact of long-range
wake-fields, synchrotron radiation, and beam-beam effects
has been assessed in this paper.
INTRODUCTION
Two of the initially purposed options for the LHeC: the
Linac-Ring and the Ring-Ring, both offered comparable
performances. However, the Linac-Ring has recently been
selected as the baseline; the choice mainly based on minimiz-
ing interference with the LHC operation. New sections of
the lattice have been recently designed and a PLACET2 [1]
simulation has been setup to validate the ERL operation.
The ERL based design for the LHeC electron facility is
sketched in Fig. 1. Each of the two 1 km long supercon-
ducting linacs provide a total acceleration of 10 GeV. The
injection energy is 500 MeV. In order to reach the collision
energy of 60 GeV, the electrons are recirculated three times.
Beams of different energies are directed into separate recir-
culation arcs via beam spreaders and recombiners placed
at each end of the linacs. They allow to vertically separate
the beams at the different energies routing them to the corre-
sponding arcs. Arc2 and Arc4 are equipped with bypasses
to avoid the interference with the detector.
Recombiner 38m+ Matching 20m
Linac2 1008m IP Line 196m
Bypass
Linac1 1008m RF Compensation+ Doglegs+ Matching 120m
RF Compensation + Doglegs+ Matching 96m
Spreader 38m
Spreader 38m Recombiner 38m
Arc1,3,5 3142m Arc2,4,6 3142m
Dump
Injector
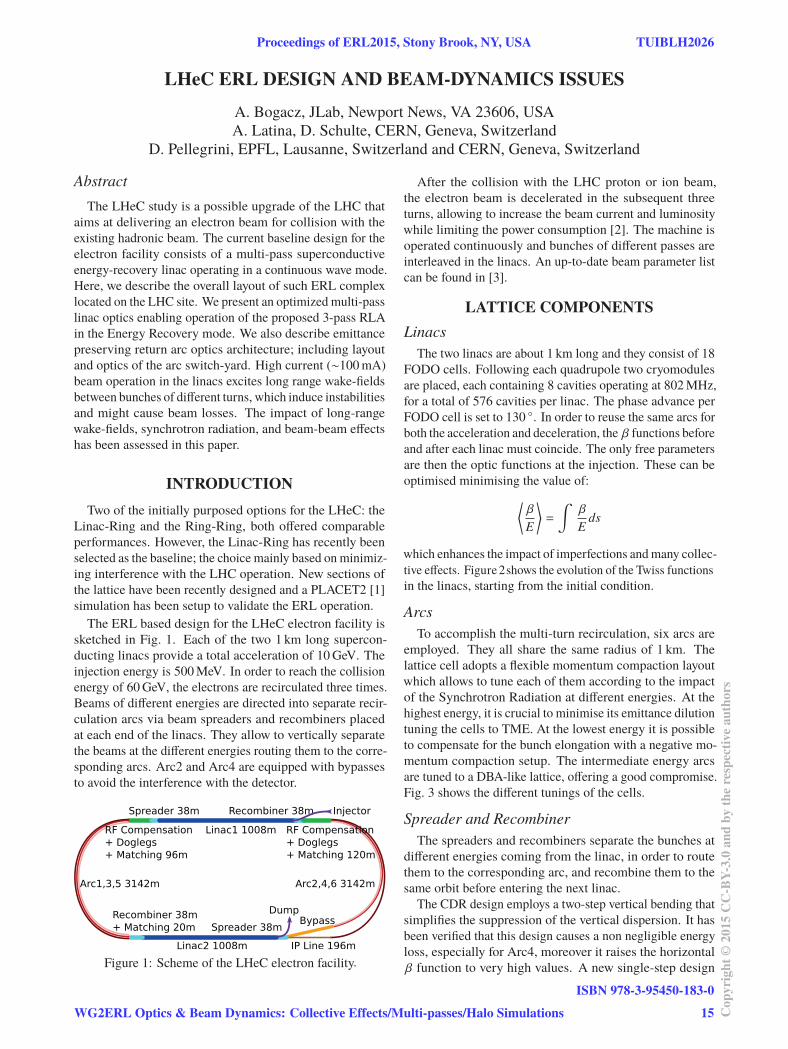
Figure 1: Scheme of the LHeC electron facility
After the collision with the LHC proton or ion beam,
the electron beam is decelerated in the subsequent three
turns, allowing to increase the beam current and luminosity
while limiting the power consumption [2]. The machine is
operated continuously and bunches of different passes are
interleaved in the linacs. An up-to-date beam parameter list
can be found in [3].
LATTICE COMPONENTS
LinacsThe two linacs are about 1 km long and they consist of 18
FODO cells. Following each quadrupole two cryomodules
are placed, each containing 8 cavities operating at 802 MHz,
for a total of 576 cavities per linac. The phase advance per
FODO cell is set to 130 . In order to reuse the same arcs for
both the acceleration and deceleration, the β functions before
and after each linac must coincide. The only free parameters
are then the optic functions at the injection. These can be
optimised minimising the value of:
⟨β
E
⟩
=
∫β
Eds
which enhances the impact of imperfections and many collec-
tive effects. Figure 2shows the evolution of the Twiss functions
in the linacs, starting from the initial condition.
ArcsTo accomplish the multi-turn recirculation, six arcs are
employed. They all share the same radius of 1 km. The
lattice cell adopts a flexible momentum compaction layout
which allows to tune each of them according to the impact
of the Synchrotron Radiation at different energies. At the
highest energy, it is crucial to minimise its emittance dilution
tuning the cells to TME. At the lowest energy it is possible
to compensate for the bunch elongation with a negative mo-
mentum compaction setup. The intermediate energy arcs
are tuned to a DBA-like lattice, offering a good compromise.
Fig. 3 shows the different tunings of the cells.
Spreader and RecombinerThe spreaders and recombiners separate the bunches at
different energies coming from the linac, in order to route
them to the corresponding arc, and recombine them to the
same orbit before entering the next linac.
The CDR design employs a two-step vertical bending that
simplifies the suppression of the vertical dispersion. It has
been verified that this design causes a non negligible energy
loss, especially for Arc4, moreover it raises the horizontal
β function to very high values. A new single-step design.
Proceedings of ERL2015, Stony Brook, NY, USA TUIBLH2026
WG2ERL Optics & Beam Dynamics: Collective Effects/Multi-passes/Halo Simulations
ISBN 978-3-95450-183-0
15 Cop
yrig
ht©
2015
CC
-BY-
3.0
and
byth
ere
spec
tive
auth
ors
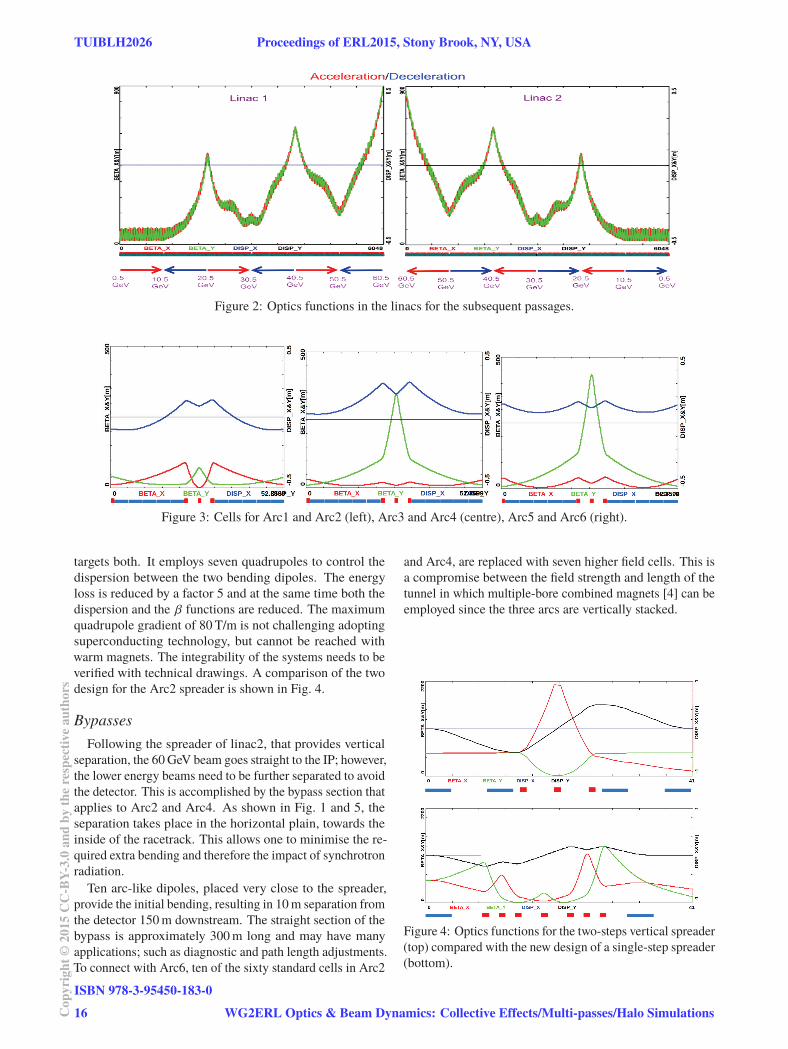
Figure 2: Optics functions in the linacs for the subsequent passages.
Figure 3: Cells for Arc1 and Arc2 (left), Arc3 and Arc4 (centre), Arc5 and Arc6 (right).
targets both. It employs seven quadrupoles to control the
dispersion between the two bending dipoles. The energy
loss is reduced by a factor 5 and at the same time both the
dispersion and the β functions are reduced. The maximum
quadrupole gradient of 80 T/m is not challenging adopting
superconducting technology, but cannot be reached with
warm magnets. The integrability of the systems needs to be
verified with technical drawings. A comparison of the two
design for the Arc2 spreader is shown in Fig. 4.
BypassesFollowing the spreader of linac2, that provides vertical
separation, the 60 GeV beam goes straight to the IP; however,
the lower energy beams need to be further separated to avoid
the detector. This is accomplished by the bypass section that
applies to Arc2 and Arc4. As shown in Fig. 1 and 5, the
separation takes place in the horizontal plain, towards the
inside of the racetrack. This allows one to minimise the re-
quired extra bending and therefore the impact of synchrotron
radiation.
Ten arc-like dipoles, placed very close to the spreader,
provide the initial bending, resulting in 10 m separation from
the detector 150 m downstream. The straight section of the
bypass is approximately 300 m long and may have many
applications; such as diagnostic and path length adjustments.
To connect with Arc6, ten of the sixty standard cells in Arc2
and Arc4, are replaced with seven higher field cells. This is
a compromise between the field strength and length of the
tunnel in which multiple-bore combined magnets [4] can be
employed since the three arcs are vertically stacked.
Figure 4: Optics functions for the two-steps vertical spreader
(top) compared with the new design of a single-step spreader
(bottom).
TUIBLH2026 Proceedings of ERL2015, Stony Brook, NY, USA
ISBN 978-3-95450-183-0
16Cop
yrig
ht©
2015
CC
-BY-
3.0
and
byth
ere
spec
tive
auth
ors
WG2ERL Optics & Beam Dynamics: Collective Effects/Multi-passes/Halo Simulations

Figure 6 shows the Twiss functions at the beginning of Arc4.
We chose to keep the same quadrupolar strengths in the
junction and in the arc cells, this creates a little mismatch in
the junction cells that is removed in the dispersion suppressor.
In Arc2 the mismatch is more evident and it has been cured
by adjusting the quadrupoles in the last junction cell and in
the first regular cell.
−0.2 0.2 0.4 0.6 0.8 1. 1.2 1.4 1.6 1.8 2.−0.2
0.2
0.4
0.6
0.8
1.
1.2
1.4
0
O
BA
R
B′
O′
r
θ
θ1
θ2
Figure 5: Scheme of the bypass geometry. The IP line, AB,
has been purposely stretched, being actually ∼ 1/5 of the
arc radius.
0
200
400
600
800
0 200 400 600 800 1000-0.4
-0.2
0
0.2
0.4
beta
[m]
disp
ersi
on [m
]
s [m]
betaxbetaydispxdispy
Figure 6: Beta functions and dispersion at the beginning
of Arc4 with the detector bypass included. It features the
vertical spreader, the initial horizontal bending, the straight
section, the modified dispersion suppressor, seven junction
cells, and four regular cells.
Compensating RFThe energy lost due to the synchrotron radiation has to
be replenished into the beam so that at the entrance of each
arc the accelerating and deceletating beams have the same
energy. Compensating cavities are placed before the bending
section of Arc1, Arc3 and Arc5 and after the bending section
of Arc2, Arc4 and Arc6. As shown in Fig. 7, they employ
the second harmonic RF frequency, so that each section can
replenish the energy lost in the corresponding arc for both
the accelerating and the decelerating beams.
Figure 7: The second harmonic RF restores the energy loss
both in the accelerating and decelerating passages.
TRACKING SIMULATIONS
The two linacs and the six arcs, properly connected to-
gether, have been imported in PLACET2 [5]. This code im-
plements the recirculation in a realistic way. Each element is
defined only once and its phase is computed accordingly to
the beam time of flight. The beam-beam effect is computed
by GUINEA-PIG [6]. It has been found that the synchrotron
radiation has a big impact in the spreader and recombiner
sections and in the doglegs for path length adjustments. For
the time being, in order to proceed with this study, the above
effects have been ignored. The second harmonic RF, re-
quired to re-integrate the synchrotron radiation energy loss,
is currently modelled as a thin element.
Single-Bunch Tracking
0
400
800
1200
1600
2000
2400
2800
0 10 20 30 40 50 0
10
20
30
40
50
60
70
Beta
[m]
Ener
gy [G
eV]
s [km]
betaybetax
energy
Figure 8: Beta functions and energy profile obtained follow-
ing a bunch in the whole LHeC lattice.
The single bunch tracking allows to verify the beam trans-
port. Figure 8 shows the Twiss parameters obtained following
a bunch along its path along the whole machine. The linacs
are easily identifiable by looking at the energy profile. In
the arcs the energy stays almost constant, the only variation
being caused by the synchrotron radiation. A small beta
beating can be barely noted in the arcs: it is caused by the
different model of the RF-focussing in the linacs between
PLACET2 and OptiM, the program used for the matchings.
It is possible to note the different average values of the β
functions in different arcs, deriving from their different tun-
ings of the momentum compaction, as previously described.
The longitudinal phase space is shown in Fig. 9. It can be
noted that while none of the arc is isochronous, their com-
bined effects preserve the bunch length reducing the impact
Proceedings of ERL2015, Stony Brook, NY, USA TUIBLH2026
WG2ERL Optics & Beam Dynamics: Collective Effects/Multi-passes/Halo Simulations
ISBN 978-3-95450-183-0
17 Cop
yrig
ht©
2015
CC
-BY-
3.0
and
byth
ere
spec
tive
auth
ors
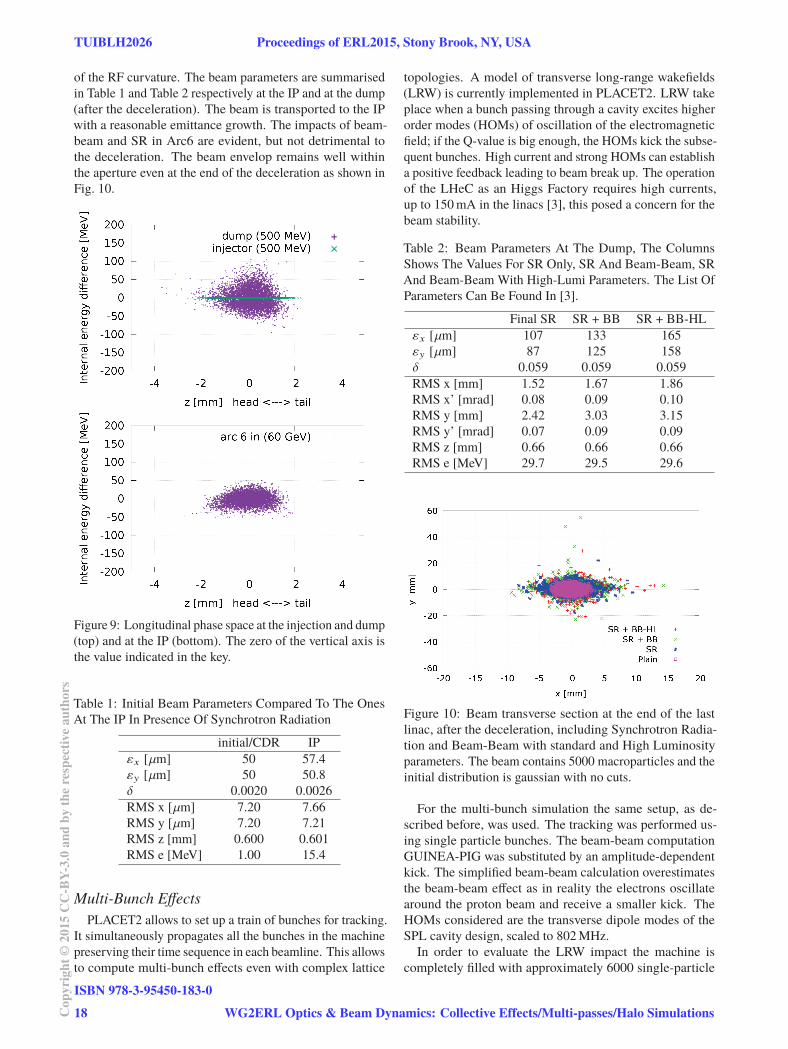
of the RF curvature. The beam parameters are summarised
in Table 1 and Table 2 respectively at the IP and at the dump
(after the deceleration). The beam is transported to the IP
with a reasonable emittance growth. The impacts of beam-
beam and SR in Arc6 are evident, but not detrimental to
the deceleration. The beam envelop remains well within
the aperture even at the end of the deceleration as shown in
Fig. 10.
Figure 9: Longitudinal phase space at the injection and dump
(top) and at the IP (bottom). The zero of the vertical axis is
the value indicated in the key.
Table 1: Initial Beam Parameters Compared To The Ones
At The IP In Presence Of Synchrotron Radiation
initial/CDR IP
εx [μm] 50 57.4
εy [μm] 50 50.8
δ 0.0020 0.0026
RMS x [μm] 7.20 7.66
RMS y [μm] 7.20 7.21
RMS z [mm] 0.600 0.601
RMS e [MeV] 1.00 15.4
Multi-Bunch EffectsPLACET2 allows to set up a train of bunches for tracking.
It simultaneously propagates all the bunches in the machine
preserving their time sequence in each beamline. This allows
to compute multi-bunch effects even with complex lattice
topologies. A model of transverse long-range wakefields
(LRW) is currently implemented in PLACET2. LRW take
place when a bunch passing through a cavity excites higher
order modes (HOMs) of oscillation of the electromagnetic
field; if the Q-value is big enough, the HOMs kick the subse-
quent bunches. High current and strong HOMs can establish
a positive feedback leading to beam break up. The operation
of the LHeC as an Higgs Factory requires high currents,
up to 150 mA in the linacs [3], this posed a concern for the
beam stability.
Table 2: Beam Parameters At The Dump, The Columns
Shows The Values For SR Only, SR And Beam-Beam, SR
And Beam-Beam With High-Lumi Parameters. The List Of
Parameters Can Be Found In [3].
Final SR SR + BB SR + BB-HL
εx [μm] 107 133 165
εy [μm] 87 125 158
δ 0.059 0.059 0.059
RMS x [mm] 1.52 1.67 1.86
RMS x’ [mrad] 0.08 0.09 0.10
RMS y [mm] 2.42 3.03 3.15
RMS y’ [mrad] 0.07 0.09 0.09
RMS z [mm] 0.66 0.66 0.66
RMS e [MeV] 29.7 29.5 29.6
Figure 10: Beam transverse section at the end of the last
linac, after the deceleration, including Synchrotron Radia-
tion and Beam-Beam with standard and High Luminosity
parameters. The beam contains 5000 macroparticles and the
initial distribution is gaussian with no cuts.
For the multi-bunch simulation the same setup, as de-
scribed before, was used. The tracking was performed us-
ing single particle bunches. The beam-beam computation
GUINEA-PIG was substituted by an amplitude-dependent
kick. The simplified beam-beam calculation overestimates
the beam-beam effect as in reality the electrons oscillate
around the proton beam and receive a smaller kick. The
HOMs considered are the transverse dipole modes of the
SPL cavity design, scaled to 802 MHz.
In order to evaluate the LRW impact the machine is
completely filled with approximately 6000 single-particle
TUIBLH2026 Proceedings of ERL2015, Stony Brook, NY, USA
ISBN 978-3-95450-183-0
18Cop
yrig
ht©
2015
CC
-BY-
3.0
and
byth
ere
spec
tive
auth
ors
WG2ERL Optics & Beam Dynamics: Collective Effects/Multi-passes/Halo Simulations

bunches perfectly aligned. One misaligned bunch is then
injected followed by many bunches again perfectly aligned.
The perturbation introduced by the misaligned bunch is prop-
agated to the others, as can be seen in Fig. 11. There are
two important parameters: the slope of the tail, which deter-
mines if and how fast the perturbation is damped; and the Fparameter that represents the total amplification of the beam
action, defined as the squared sum of all the amplitudes [7].
This sum is convergent and mostly driven by the bunches
that are close to the exciting one.
Figure 11: Normalised actions of the bunches at the IP. Only
the bunch with action 1 carries an initial misalignment. All
the other bunches are excited by LRW. Each bunch contains
4 × 10⁹ electrons.
BUNCH RECOMBINATION PATTERN
The LHeC operation foresees continuous injection and
multi-turn recirculation. In this scenario more bunches at
different energies are interleaved in the linacs, appearing in
periodic sequences. The spreader and recombiner design,
employing fixed-field dipoles, do not pose timing constraints.
This give us full control of the recombination pattern that
can be selected adjusting the length of the return arcs to the
required integer number of λ.
A good choice for the recombination pattern consists of al-
most equal spacing (compatibly with the RF) of the bunches
in the RF buckets. In order to minimise the bunch cross
talk is advantageous to maximise the separation between the
bunches at the lowest energy: the ones at first and sixth turn.
This is depicted in Fig. 12.
It has been verified that a pattern where bunches at first
and sixth turn closely follow each other, reduces the BBU
threshold current.
CONCLUSIONS AND OUTLOOK
The LHeC study is vigorously progressing both on the
lattice design and on the beam dynamics simulations. In
this paper we have reviewed the fundamental components
of the LHeC lattice together with their optimisations. The
machine layout, the linacs and the return arcs design have
been summarised and new sections such as the detector
bypass and the single-step spreader have been introduced.
t
1 27 λ
36 λ
17 λ
45 6
Figure 12: When the recirculation is in place, the linacs are
populated with bunches at different turns (the turn number
is indicated).
A comprehensive simulation has been setup using the
newly developed tracking code: PLACET2. The impacts
of synchrotron radiation, long-range wakefields and beam-
beam effect have been evaluated and they are not detrimental
for the deceleration. Investigation of cavity misalignment
impact on beam trajectories has also been initiated.
The next major steps should target the full integration of
the lattice with the interaction region. Realistic simulation of
the ion cloud effect should also be performed. Furthermore
detailed estimate of tolerances in terms of field quality and
phase stability are required and may come with the exper-
imental support of the CERN ERLF [8], currently in the
design phase.
ACKNOWLEDGMENT
The authors would like to thank Edward Niessen for his
help with the GUINEA-PIG computations of the beam-beam
effect.
REFERENCES
[1] D. Pellegrini et al., “PLACET2: a Novel Code for Beam Dy-
namics in Recirculating Machines”, MOPJE068, Proceedings
of IPAC’15, Richmond VA, USA (2015).
[2] J.L. Abelleira Fernandez et al., “LHeC Conceptual Design
Report”, J. Phys. G: Nucl. Part. Phys. 39 075001 (2012).
[3] F. Zimmerman, O. Brüening, M. Klein, “The LHeC as a
Higgs Boson Factory”, MOPWO054, IPAC’13, Shangai,China (2013).
[4] A. Milanese, “Warm magnets for LHeC / Test Facility arcs”,
Talk at the LHeC workshop 2014, https://indico.cern. ch/event/278903/session/6/contribution/41
[5] D. Pellegrini et al., “Single and Multi-bunch End-to-end Track-
ing in the LHeC”, MOPJE066, Proceedings of IPAC’15, Rich-
mond VA, USA (2015).
[6] D. Schulte, “Beam-Beam Simulations with GUINEA-PIG“,
ICAP’98, Monterey CA, USA (1998).
[7] D. Schulte, “Multi-Bunch Calculations in the CLIC Main
Linac”, FR5RFP055, Proceedings of PAC09, Vancouver,BC, Canada.
[8] E. Jensen et al., “Design Study of an ERL Test Facility at
CERN” TUOBA02, Proceedings of IPAC’14, Dresden,
Ger-many (2014).
Proceedings of ERL2015, Stony Brook, NY, USA TUIBLH2026
WG2ERL Optics & Beam Dynamics: Collective Effects/Multi-passes/Halo Simulations
ISBN 978-3-95450-183-0
19 Cop
yrig
ht©
2015
CC
-BY-
3.0
and
byth
ere
spec
tive
auth
ors
TRACKING STUDIES IN eRHIC ENERGY-RECOVERY RECIRCULATORF. Meot, S. Brooks, V. Ptitsyn, D. Trbojevic, N. Tsoupas
Collider-Accelerator Department, BNL, Upton, NY 11973
AbstractThis paper gives a brief overview of various beam and
spin dynamics investigations undertaken in the frameworkof the design studies regarding the FFAG lattice basedelectron energy recovery re-circulator ring of the eRHICelectron-ion collider project.
INTRODUCTIONA Fixed Field Alternating Gradient (FFAG) doublet-cell
version of the energy recovery recirculator of the eRHICelectron-ion collider [1] is being investigated [2, 3]. A pairof such FFAG rings placed along RHIC recirculate the elec-tron beam through a 1.322 GeV linac (ERL), from respec-tively 1.3 to 6.6 GeV (5 beams) and 7.9 to 21.2 GeV (11beams), and back down to injection energy. A spreader anda combiner are placed at the linac ends for proper orbit and6-D matching, including time-of-flight adjustment.
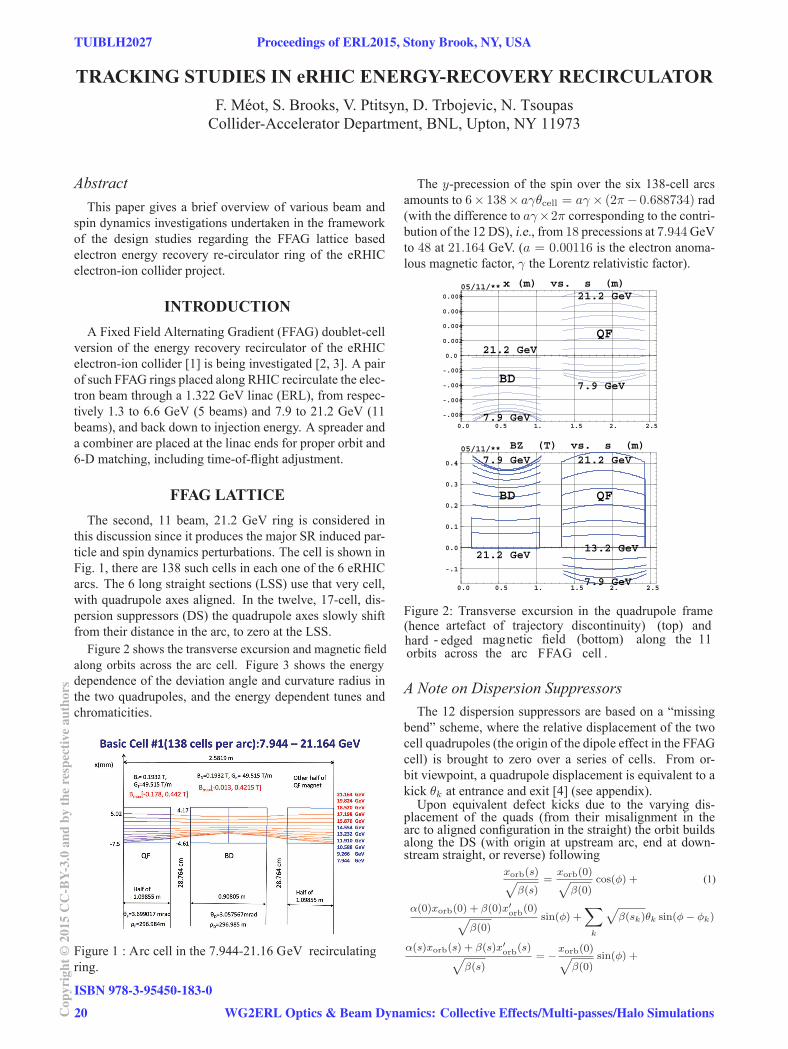
FFAG LATTICEThe second, 11 beam, 21.2 GeV ring is considered in
this discussion since it produces the major SR induced par-ticle and spin dynamics perturbations. The cell is shown inFig. 1, there are 138 such cells in each one of the 6 eRHICarcs. The 6 long straight sections (LSS) use that very cell,with quadrupole axes aligned. In the twelve, 17-cell, dis-persion suppressors (DS) the quadrupole axes slowly shiftfrom their distance in the arc, to zero at the LSS.
Figure 2 shows the transverse excursion and magnetic fieldalong orbits across the arc cell. Figure 3 shows the energydependence of the deviation angle and curvature radius inthe two quadrupoles, and the energy dependent tunes andchromaticities.
Figure 1 : Arc cell in the 7.944-21.16 GeV recirculating ring.
The y-precession of the spin over the six 138-cell arcsamounts to 6× 138× aγθcell = aγ× (2π− 0.688734) rad(with the difference to aγ×2π corresponding to the contri-bution of the 12 DS), i.e., from 18 precessions at 7.944 GeVto 48 at 21.164 GeV. (a = 0.00116 is the electron anoma-lous magnetic factor, γ the Lorentz relativistic factor).
0.0 0.5 1. 1.5 2. 2.5
-.008
-.006
-.004
-.002
0.0
0.002
0.004
0.006
0.008
05/11/** x (m) vs. s (m)
7.9 GeV
7.9 GeV
21.2 GeV
21.2 GeV
QF
BD
0.0 0.5 1. 1.5 2. 2.5
-.1
0.0
0.1
0.2
0.3
0.4
05/11/** BZ (T) vs. s (m)
7.9 GeV
13.2 GeV 21.2 GeV
7.9 GeV
21.2 GeV
BD QF
Figure 2: Transverse excursion in the quadrupole frame(hence artefact of trajectory discontinuity) (top) andhard - edged magnetic field (bottom), along the 11orbits across the arc FFAG cell .
A Note on Dispersion SuppressorsThe 12 dispersion suppressors are based on a “missing
bend” scheme, where the relative displacement of the twocell quadrupoles (the origin of the dipole effect in the FFAGcell) is brought to zero over a series of cells. From or-bit viewpoint, a quadrupole displacement is equivalent to akick θk at entrance and exit [4] (see appendix).
Upon equivalent defect kicks due to the varying dis-placement of the quads (from their misalignment in thearc to aligned configuration in the straight) the orbit buildsalong the DS (with origin at upstream arc, end at down-stream straight, or reverse) following
xorb(s)√β(s)
=xorb(0)√
β(0)cos(φ) + (1)
α(0)xorb(0) + β(0)x′
orb(0)√
β(0)sin(φ) +
∑k
√β(sk)θk sin(φ− φk)
α(s)xorb(s) + β(s)x′
orb(s)√
β(s)= −
xorb(0)√β(0)
sin(φ) +
TUIBLH2027 Proceedings of ERL2015, Stony Brook, NY, USA
ISBN 978-3-95450-183-0
20Cop
yrig
ht©
2015
CC
-BY-
3.0
and
byth
ere
spec
tive
auth
ors
WG2ERL Optics & Beam Dynamics: Collective Effects/Multi-passes/Halo Simulations

α(0)xorb(0) + β(0)x′
orb(0)√
β(0)cos(φ) +
∑k
√β(sk)θk cos(φ− φk)
with xorb(0) and xorb(0) the FFAG orbit coordinates in thearc→LSS case, while xorb(0) = 0, x′
orb(0) = 0 in theLSS→arc case. Figure 4-top shows the orbit build-up fromLLS to arc, ending up at the arc with (x,x’) coordinateswhich do not fully coincide with the periodic orbit of thearc FFAG cell. The orbit build-up depends on the phaseadvance φ =
∫ s
0dsβ(s)
, as a consequence it depends on celltune, and thus on energy. Figure 4-middle shows the resultingorbit build-up in the arcs over 6 consecutive arcs at 5 differ-ent energies, 7.9, 9.3, 10.6, 11.9GeV and 13.2 GeV. In eachcase the starting coordinates (at s = 0 in the figure, i.e., inthe first LSS) are taken (x, x ′) = (0, 0). Figure 4-bottom il-lustrates the tune dependence of the orbit amplification inthe case of pass #4 - for simplicity energy is changed in-stead of tunes, with the correlation given in Fig. 3.
Figure 3: Top : energy dependence of deviation and curvature radius in arc cell quads. Bottom : cell tunes and chromaticities versus energy ; the vertical bars materialize the 11 design energies.
SYNCHROTRON RADIATIONThe SR induced energy loss relative to the the bunch cen-
troid and the energy spread write, respectively
ΔE
Eref= 1.9× 10⁻¹⁵ γ3Δθ
ρ,σE
Eref= 3.8× 10⁻¹⁴ γ
52
√Δθ
ρ(2)
with Δθ the arc length and 1/ρ the curvature, assumedconstant. Taking for average radius, in the QF (focus-ing quad) and BD (defocusing quad) magnets respectively,ρBD ≈ sBD
ΔθBD, ρQF ≈ sQF
ΔθQF(with sBD and sQF the arc
lengths) and considering in addition, with lBD, lQF the
Figure 4: Top : Case of the 11.9GeV pass. The orbit isshown from end of first LSS to upstream region of first arc.Middle : Case of the 11.9GeV pass. The orbit is shownfrom end of first LSS (from where it starts with zero co-ordinates) to upstream region of first arc (140-200 m re-gion). Bottom : The orbit is computed for 7 different ener-gies E + dE in the vicinity of E = 11.9GeV, namely fordE/E = 0, ±1, 2, 3%. The orbit build-up appears verysmall for dE/E = 1%.
magnet lengths, sBD ≈ lBD, sQF ≈ lQF, and taking inaddition < (1/ρ)2 >≈ 1/ < ρ2 >, then one gets, per cell
ΔE[MeV ] ≈ 0.96× 10⁻¹⁵γ4
(lBD
ρ2BD
+lQF
ρ2QF
)(3)
σE ≈ 1.94× 10⁻¹⁴γ7/2
√lBD
|ρ3BD|+
lQF
|ρ3QF|
Proceedings of ERL2015, Stony Brook, NY, USA TUIBLH2027
WG2ERL Optics & Beam Dynamics: Collective Effects/Multi-passes/Halo Simulations
ISBN 978-3-95450-183-0
21 Cop
yrig
ht©
2015
CC
-BY-
3.0
and
byth
ere
spec
tive
auth
ors

This is illustrated for a complete eRHIC turn (includingLSS and DS sections) in Fig. 5, where it is also comparedwith Monte Carlo tracking, the agreement is at % level. Theenergy loss shows a local minimum in the aγ = 30−35 re-gion, a different behavior from the classical γ4 dependencein an isomagnetic lattice.
0
20
40
60
80
100
20 25 30 35 40 45 0
1
2
3
4
5
6 8 10 12 14 16 18 20 22
ΔE [MeV]
σ E [MeV]
E [GeV]
ΔE, theor.Ray-tracing
σE, theor.Ray-tracing
aγFigure 5: Energy loss and energy spread. Solid lines : theory (Eqs. 3) for a 6-arc ring. Markers : Monte Carlo, for a complete eRHIC ring (see sample tracking outcomes in Fig. 6).
The bunch lengthening over a [s, sf ] distance, resultingfrom the stochastic energy loss, can be written [5],
σl =(σE
E
) [1
Lbend
∫ sf
s
(Dx(s)T51(sf ← s)+ (4)
D′
x(s)T52(sf ← s)− T56)2ds]1/2
with the integral being taken over the bends, Dx and D′
x
the dispersion function and its derivative, T5i the trajec-tory lengthening coefficient of the first order mapping (i =1, 5, 6 stand for respectively x, δl, δp/p coordinates).
The energy loss causes a drift of the bunch centroid,as well as an horizontal emittance increase, both can becomputed from the lattice parameters in the linear approx-imation [5, 6, 7]. Figure 7 illustrates these effects over a21.164 GeV recirculation (with bunch re-centering on thereference optical axis at each of the six LSS).
Cumulative effect of SR, over a complete7.94→21.2→7.94 GeV cycle, is illustrated in Fig. 8 :(i) energy spread, σE/E = 2.6 × 10⁻⁴ at 21.1 GeV andσE/E = 8.4 × 10⁻⁴ back at 7.944 GeV ; (ii) bunchlengthening, σl = 2 mm at 21.1 GeV and σl = 2.5 mmback down to 7.944 GeV ; (iii) normalized horizontalemittance (from zero starting value), namely, εx = 20 μmat 21.1 GeV (with strong contribution from uncompensatedchromatic effects), and εx = 8 μm back at 7.944 GeV.
AcceptanceThe naturally large dynamical acceptance of the linear
lattice shrinks with magnet alignment and field defects, thisis illustrated in Fig. 9. SR is off in these DA computations,SR causes emittance growth thus reducing the space avail-able for the beam at injection into a recirculation.
0 200 400 600 800 1000 1200 1400 1600 180021110
21120
21130
21140
21150
21160
KinEnr (MeV) vs. s (m) LSS 1
ARC 1
LSS 2
ARC 2
LSS 3
2.1055E+4
2.106E+4
2.1065E+4
2.107E+4
2.1075E+4
0
20
40
60
80
100
120
140
Zgoubi|Zpop 11-01-2015 COUNT vs. KinEnr (MeV)
3649. 3649. 3649. 3650. 3650. 3650. 3650.0
20
40
60
80
100
120
140
Zgoubi|Zpop 11-01-2015 COUNT vs. s (m)
Figure 6: Top : stochastic energy decrease of a few particles over the first 3 arcs atEref = 21.164 GeV. Middle : final spread a 5000 particle bunch after the 21.164 GeV pass, σE
Eref= 1.9 × 10
−4 around ΔEEref
= −4.7 × 10⁻³
average energy loss (Eq. 2). Bottom : longitudinal bunchdistribution (Eq. 4).
0 500 1000 1500 2000 2500 3000 35000.00348
0.0035
0.00352
0.00354
0.00356
0.00358
0.0036
0.00362
0.00364Zgoubi|Zpop 11-01-2015 x (m) vs. s (m)
-0.25E-4
-0.2E-4
-0.15E-4
-0.1E-4
-0.5E-5
-0.6E-5
-0.4E-5
-0.2E-5
0.0
0.2E-5
0.4E-5
0.6E-5
Zgoubi|Zpop 11-01-2015 x_f’ (rd) vs. x_f (m)
Figure 7: Left : SR loss induced x-drift along the 6 arcs, com-plete ring, E = 21.164 GeV, (shown are a few particles in a bunch launched on the LSS axis with zero initial 6-D emittance). Right : a 5000 particle bunch, horizontal phase space after that complete turn, featuring xf = −15 μm,
σxf = 4.3 μm, x′
f = −1.1. μrad,f
σx′ = 1.8 μrad.
Multipole DefectsFigure 10 illustrates a different way of looking at tol-
erances, e.g. here in the presence of a dodecapole de-fect in all quadrupoles of the ring (i.e., same workinghypotheses as for the bottom Fig. 9) : a 5000-particlebunch is launched with εx ≈ εy ≈ 50πμm and 10−4
rms energy spread, for 21 circulations in a complete ring(6 × [
12LSS − DS − ARC − DS − 1
2LSS]
+ Linac).
TUIBLH2027 Proceedings of ERL2015, Stony Brook, NY, USA
ISBN 978-3-95450-183-0
22Cop
yrig
ht©
2015
CC
-BY-
3.0
and
byth
ere
spec
tive
auth
ors
WG2ERL Optics & Beam Dynamics: Collective Effects/Multi-passes/Halo Simulations
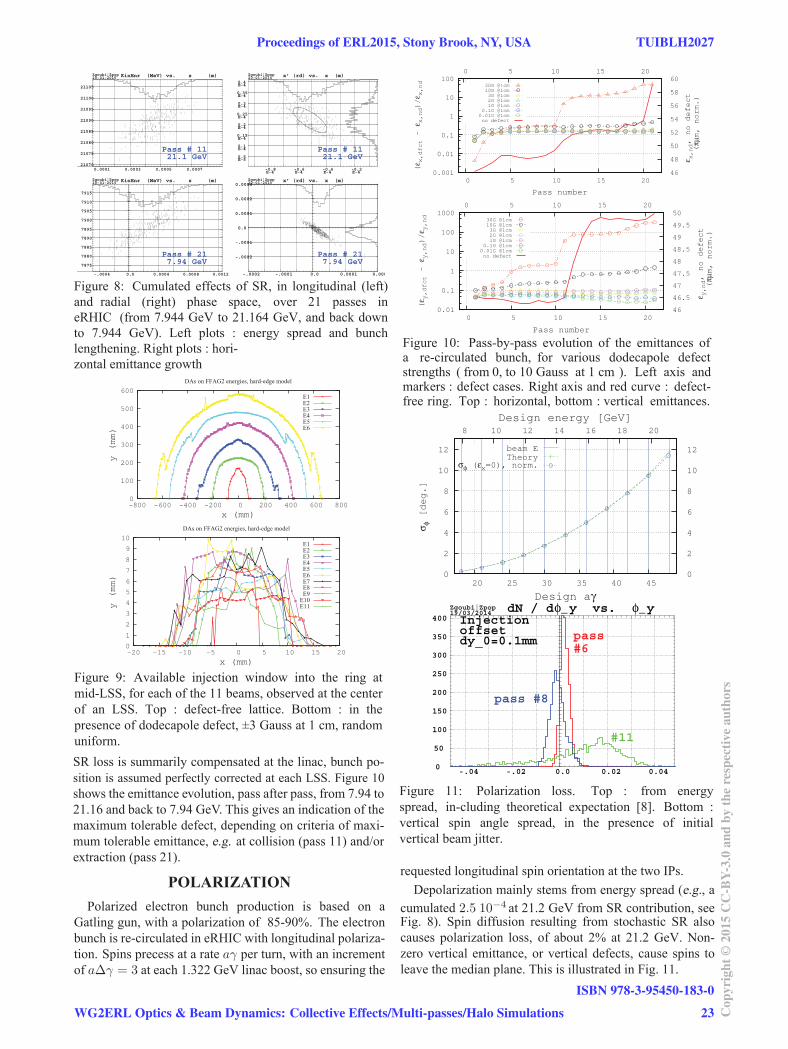
0.0001 0.0003 0.0005 0.000721070
21075
21080
21085
21090
21095
21100
21105
Zgoubi|Zpop 20-01-2015 KinEnr (MeV) vs. s (m)
Pass # 1121.1 GeV
-0.8E-4
-0.6E-4
-0.4E-4
-0.2E-4
0.5E-5
0.1E-4
0.15E-4
0.2E-4
0.25E-4
0.3E-4
0.35E-4
0.4E-4
Zgoubi|Zpop20-01-2015 x’ (rd) vs. x (m)
Pass # 1121.1 GeV
-.0004 0.0 0.0004 0.0008 0.0012
7875
7880
7885
7890
7895
7900
7905
7910
7915
Zgoubi|Zpop 20-01-2015 KinEnr (MeV) vs. s (m)
Pass # 217.94 GeV
-.0002 -.0001 0.0 0.0001 0.000
-.0002
-.0001
0.0
0.0001
0.0002
0.0003Zgoubi|Zpop20-01-2015 x’ (rd) vs. x (m)
Pass # 217.94 GeV
Figure 8: Cumulated effects of SR, in longitudinal (left) and radial (right) phase space, over 21 passes in eRHIC (from 7.944 GeV to 21.164 GeV, and back down to 7.944 GeV). Left plots : energy spread and bunch lengthening. Right plots : hori-zontal emittance growth
0
100
200
300
400
500
600
-800 -600 -400 -200 0 200 400 600 800
y (mm)
x (mm)
DAs on FFAG2 energies, hard-edge model
E1E2E3E4E5E6
0
1
2
3
4
5
6
7
8
9
10
-20 -15 -10 -5 0 5 10 15 20
y (mm)
x (mm)
DAs on FFAG2 energies, hard-edge model
E1E2E3E4E5E6E7E8E9
E10E11
Figure 9: Available injection window into the ring at mid-LSS, for each of the 11 beams, observed at the center of an LSS. Top : defect-free lattice. Bottom : in the presence of dodecapole defect, ±3 Gauss at 1 cm, random uniform.SR loss is summarily compensated at the linac, bunch po-sition is assumed perfectly corrected at each LSS. Figure 10shows the emittance evolution, pass after pass, from 7.94 to21.16 and back to 7.94 GeV. This gives an indication of themaximum tolerable defect, depending on criteria of maxi-mum tolerable emittance, e.g. at collision (pass 11) and/orextraction (pass 21).
POLARIZATIONPolarized electron bunch production is based on a
Gatling gun, with a polarization of 85-90%. The electronbunch is re-circulated in eRHIC with longitudinal polariza-tion. Spins precess at a rate aγ per turn, with an incrementof aΔγ = 3 at each 1.322 GeV linac boost, so ensuring the
0.001
0.01
0.1
1
10
100
0 5 10 15 20
46
48
50
52
54
56
58
60
0 5 10 15 20
(ε x,dfct -
ε x,nd)/
ε x,nd
ε x,nd, no defect
(πμm, norm.)
Pass number
no defect0.01G @1cm0.1G @1cm1G @1cm2G @1cm3G @1cm10G @1cm30G @1cm
0.01
0.1
1
10
100
1000
0 5 10 15 20
46
46.5
47
47.5
48
48.5
49
49.5
50
0 5 10 15 20
(ε y,dfct -
ε y,nd)/
ε y,nd
ε y,nd, no defect
(πμm, norm.)
Pass number
no defect0.01G @1cm0.1G @1cm1G @1cm2G @1cm3G @1cm10G @1cm30G @1cm
Figure 10: Pass-by-pass evolution of the emittances of a re-circulated bunch, for various dodecapole defect strengths ( from 0, to 10 Gauss at 1 cm ). Left axis and markers : defect cases. Right axis and red curve : defect-free ring. Top : horizontal, bottom : vertical emittances.
0
2
4
6
8
10
12
20 25 30 35 40 45 0
2
4
6
8
10
12
8 10 12 14 16 18 20σ φ [deg.]
Design aγ
Design energy [GeV]
beam ETheory
σφ (εx=0), norm.
-.04 -.02 0.0 0.02 0.040
50
100
150
200
250
300
350
400Zgoubi|Zpop19/03/2014 φ_ φ_ dN / d y vs. yInjection
offset dy_0=0.1mm pass
#6
pass #8
#11
Figure 11: Polarization loss. Top : from energyspread, in-cluding theoretical expectation [8]. Bottom :vertical spin angle spread, in the presence of initialvertical beam jitter.
requested longitudinal spin orientation at the two IPs.Depolarization mainly stems from energy spread (e.g., a
cumulated 2.5 10−4 at 21.2 GeV from SR contribution, see Fig. 8). Spin diffusion resulting from stochastic SR also causes polarization loss, of about 2% at 21.2 GeV. Non-zero vertical emittance, or vertical defects, cause spins to leave the median plane. This is illustrated in Fig. 11.
Proceedings of ERL2015, Stony Brook, NY, USA TUIBLH2027
WG2ERL Optics & Beam Dynamics: Collective Effects/Multi-passes/Halo Simulations
ISBN 978-3-95450-183-0
23 Cop
yrig
ht©
2015
CC
-BY-
3.0
and
byth
ere
spec
tive
auth
ors
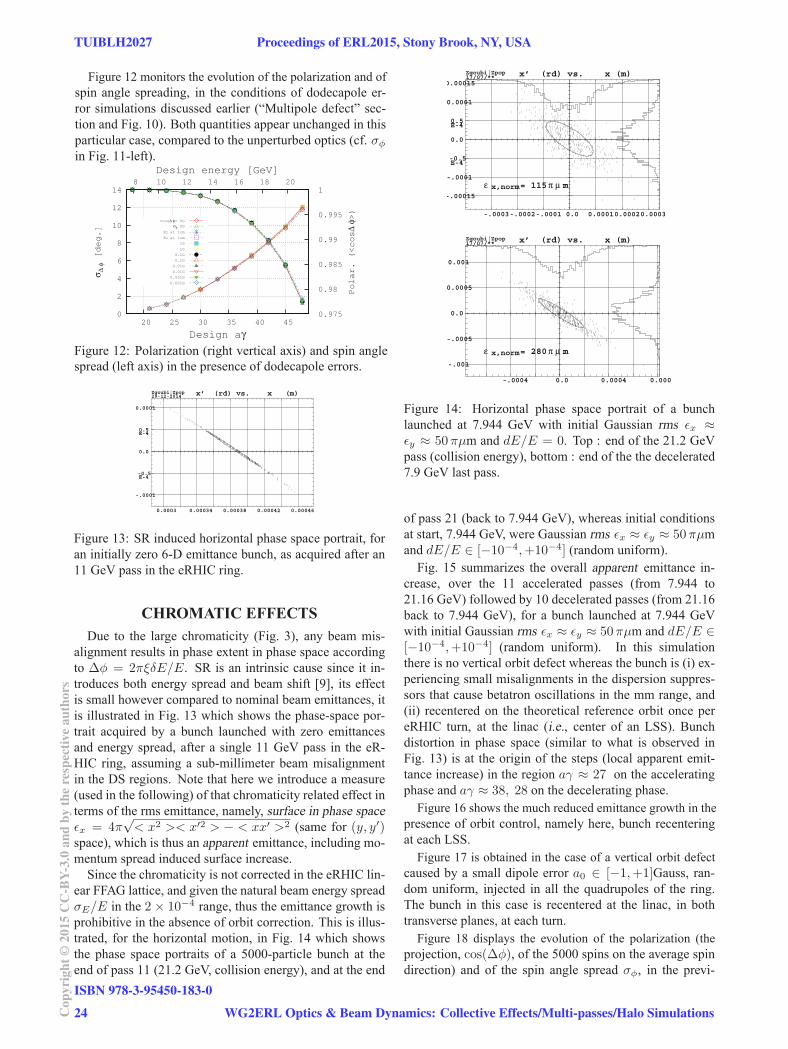
Figure 12 monitors the evolution of the polarization and ofspin angle spreading, in the conditions of dodecapole er-ror simulations discussed earlier (“Multipole defect” sec-tion and Fig. 10). Both quantities appear unchanged in thisparticular case, compared to the unperturbed optics (cf. σφ
in Fig. 11-left).
0
2
4
6
8
10
12
14
20 25 30 35 40 45 0.975
0.98
0.985
0.99
0.995
1 8 10 12 14 16 18 20
σ Δ φ [deg.]
Polar. (<cos
Δ φ>)
Design aγ
Design energy [GeV]
<cosΔ φ> 0Gσφ 0G
3G at 1cm
3G at 1cm
1G
1G
0.1G
0.1G
0.01G
0.01G
0.001G
0.001G
Figure 12: Polarization (right vertical axis) and spin angle spread (left axis) in the presence of dodecapole errors.
0.0003 0.00034 0.00038 0.00042 0.00046
-.0001
-0.5E-4
0.0
0.5E-4
0.0001
Zgoubi|Zpop29-12-2014 x’ (rd) vs. x (m)
Figure 13: SR induced horizontal phase space portrait, foran initially zero 6-D emittance bunch, as acquired after an11 GeV pass in the eRHIC ring.
CHROMATIC EFFECTSDue to the large chromaticity (Fig. 3), any beam mis-
alignment results in phase extent in phase space accordingto Δφ = 2πξδE/E. SR is an intrinsic cause since it in-troduces both energy spread and beam shift [9], its effectis small however compared to nominal beam emittances, itis illustrated in Fig. 13 which shows the phase-space por-trait acquired by a bunch launched with zero emittancesand energy spread, after a single 11 GeV pass in the eR-HIC ring, assuming a sub-millimeter beam misalignmentin the DS regions. Note that here we introduce a measure(used in the following) of that chromaticity related effect interms of the rms emittance, namely, surface in phase spaceεx = 4π
√< x2 >< x′2 > − < xx′ >2 (same for (y, y′)
space), which is thus an apparent emittance, including mo-mentum spread induced surface increase.
Since the chromaticity is not corrected in the eRHIC lin-ear FFAG lattice, and given the natural beam energy spreadσE/E in the 2 × 10⁻⁴ range, thus the emittance growth isprohibitive in the absence of orbit correction. This is illus-trated, for the horizontal motion, in Fig. 14 which showsthe phase space portraits of a 5000-particle bunch at theend of pass 11 (21.2 GeV, collision energy), and at the end
-.0003-.0002-.0001 0.0 0.00010.00020.0003
-.00015
-.0001
-0.5E-4
0.0
0.5E-4
0.0001
0.00015
Zgoubi|Zpop 17/07/** x’ (rd) vs. x (m)
ε π μ x,norm = 115 m
-.0004 0.0 0.0004 0.000
-.001
-.0005
0.0
0.0005
0.001
Zgoubi|Zpop 17/07/** x’ (rd) vs. x (m)
ε π μ x,norm = 280 m
Figure 14: Horizontal phase space portrait of a bunchlaunched at 7.944 GeV with initial Gaussian rms εx ≈εy ≈ 50πμm and dE/E = 0. Top : end of the 21.2 GeVpass (collision energy), bottom : end of the the decelerated7.9 GeV last pass.
of pass 21 (back to 7.944 GeV), whereas initial conditionsat start, 7.944 GeV, were Gaussian rms εx ≈ εy ≈ 50πμmand dE/E ∈ [−10−4,+10−4] (random uniform).
Fig. 15 summarizes the overall apparent emittance in-crease, over the 11 accelerated passes (from 7.944 to21.16 GeV) followed by 10 decelerated passes (from 21.16back to 7.944 GeV), for a bunch launched at 7.944 GeVwith initial Gaussian rms εx ≈ εy ≈ 50πμm and dE/E ∈[−10−4,+10−4] (random uniform). In this simulationthere is no vertical orbit defect whereas the bunch is (i) ex-periencing small misalignments in the dispersion suppres-sors that cause betatron oscillations in the mm range, and(ii) recentered on the theoretical reference orbit once pereRHIC turn, at the linac (i.e., center of an LSS). Bunchdistortion in phase space (similar to what is observed inFig. 13) is at the origin of the steps (local apparent emit-tance increase) in the region aγ ≈ 27 on the acceleratingphase and aγ ≈ 38, 28 on the decelerating phase.
Figure 16 shows the much reduced emittance growth in thepresence of orbit control, namely here, bunch recenteringat each LSS.
Figure 17 is obtained in the case of a vertical orbit defectcaused by a small dipole error a0 ∈ [−1,+1]Gauss, ran-dom uniform, injected in all the quadrupoles of the ring.The bunch in this case is recentered at the linac, in bothtransverse planes, at each turn.
Figure 18 displays the evolution of the polarization (theprojection, cos(Δφ), of the 5000 spins on the average spindirection) and of the spin angle spread σφ, in the previ-
TUIBLH2027 Proceedings of ERL2015, Stony Brook, NY, USA
ISBN 978-3-95450-183-0
24Cop
yrig
ht©
2015
CC
-BY-
3.0
and
byth
ere
spec
tive
auth
ors
WG2ERL Optics & Beam Dynamics: Collective Effects/Multi-passes/Halo Simulations
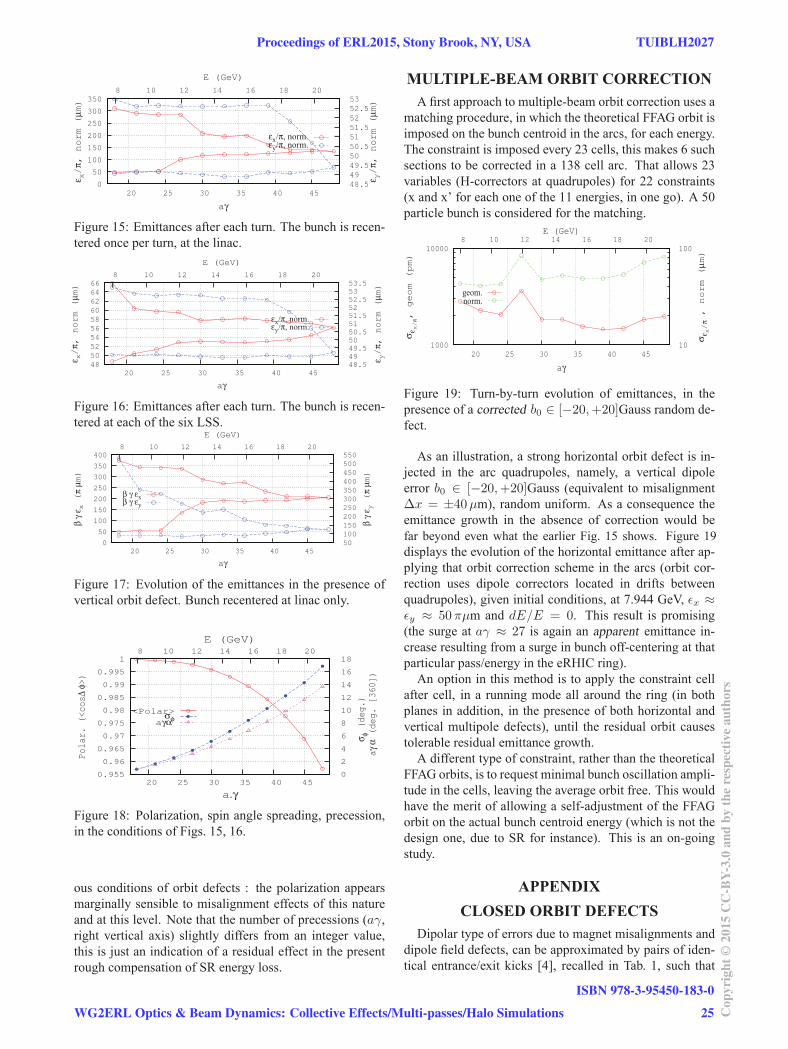
0
50
100
150
200
250
300
350
20 25 30 35 40 45
48.5
49
49.5
50
50.5
51
51.5
52
52.5
53
8 10 12 14 16 18 20
ε x/
π, norm (
μm)
ε y/
π, norm (
μm)
aγ
E (GeV)
εx/π, norm.εy/π, norm.
Figure 15: Emittances after each turn. The bunch is recen-tered once per turn, at the linac.
48
50
52
54
56
58
60
62
64
66
20 25 30 35 40 45
48.5 49 49.5 50 50.5 51 51.5 52 52.5 53 53.5
8 10 12 14 16 18 20
ε x/
π, norm (
μm)
ε y/
π, norm (
μm)
aγ
E (GeV)
εx/π, norm.εy/π, norm.
Figure 16: Emittances after each turn. The bunch is recen-tered at each of the six LSS.
0
50
100
150
200
250
300
350
400
20 25 30 35 40 45
50
100
150
200
250
300
350
400
450
500
550
8 10 12 14 16 18 20
β γ
ε x (
π μm)
β γ
ε y (
π μm)
aγ
E (GeV)
β γ εxβ γ εy
Figure 17: Evolution of the emittances in the presence ofvertical orbit defect. Bunch recentered at linac only.
0.955
0.96
0.965
0.97
0.975
0.98
0.985
0.99
0.995
1
20 25 30 35 40 45 0
2
4
6
8
10
12
14
16
18 8 10 12 14 16 18 20
Polar. (<cos
Δ φ>)
σ φ (deg.)
a
γ α (deg. [360])
a.γ
E (GeV)
<Polar>σφaγα
Figure 18: Polarization, spin angle spreading, precession,in the conditions of Figs. 15, 16.
ous conditions of orbit defects : the polarization appearsmarginally sensible to misalignment effects of this natureand at this level. Note that the number of precessions (aγ,right vertical axis) slightly differs from an integer value,this is just an indication of a residual effect in the presentrough compensation of SR energy loss.
MULTIPLE-BEAM ORBIT CORRECTIONA first approach to multiple-beam orbit correction uses a
matching procedure, in which the theoretical FFAG orbit isimposed on the bunch centroid in the arcs, for each energy.The constraint is imposed every 23 cells, this makes 6 suchsections to be corrected in a 138 cell arc. That allows 23variables (H-correctors at quadrupoles) for 22 constraints(x and x’ for each one of the 11 energies, in one go). A 50particle bunch is considered for the matching.
1000
10000
20 25 30 35 40 45
10
100
8 10 12 14 16 18 20
σε x/
π, geom (pm)
σε x/
π , norm (
μm)
aγ
E (GeV)
geom.norm.
Figure 19: Turn-by-turn evolution of emittances, in thepresence of a corrected b0 ∈ [−20,+20]Gauss random de-fect.
As an illustration, a strong horizontal orbit defect is in-jected in the arc quadrupoles, namely, a vertical dipoleerror b0 ∈ [−20,+20]Gauss (equivalent to misalignmentΔx = ±40μm), random uniform. As a consequence theemittance growth in the absence of correction would befar beyond even what the earlier Fig. 15 shows. Figure 19displays the evolution of the horizontal emittance after ap-plying that orbit correction scheme in the arcs (orbit cor-rection uses dipole correctors located in drifts betweenquadrupoles), given initial conditions, at 7.944 GeV, εx ≈εy ≈ 50πμm and dE/E = 0. This result is promising(the surge at aγ ≈ 27 is again an apparent emittance in-crease resulting from a surge in bunch off-centering at thatparticular pass/energy in the eRHIC ring).
An option in this method is to apply the constraint cellafter cell, in a running mode all around the ring (in bothplanes in addition, in the presence of both horizontal andvertical multipole defects), until the residual orbit causestolerable residual emittance growth.
A different type of constraint, rather than the theoreticalFFAG orbits, is to request minimal bunch oscillation ampli-tude in the cells, leaving the average orbit free. This wouldhave the merit of allowing a self-adjustment of the FFAGorbit on the actual bunch centroid energy (which is not thedesign one, due to SR for instance). This is an on-goingstudy.
APPENDIXCLOSED ORBIT DEFECTS
Dipolar type of errors due to magnet misalignments anddipole field defects, can be approximated by pairs of iden-tical entrance/exit kicks [4], recalled in Tab. 1, such that
Proceedings of ERL2015, Stony Brook, NY, USA TUIBLH2027
WG2ERL Optics & Beam Dynamics: Collective Effects/Multi-passes/Halo Simulations
ISBN 978-3-95450-183-0
25 Cop
yrig
ht©
2015
CC
-BY-
3.0
and
byth
ere
spec
tive
auth
ors
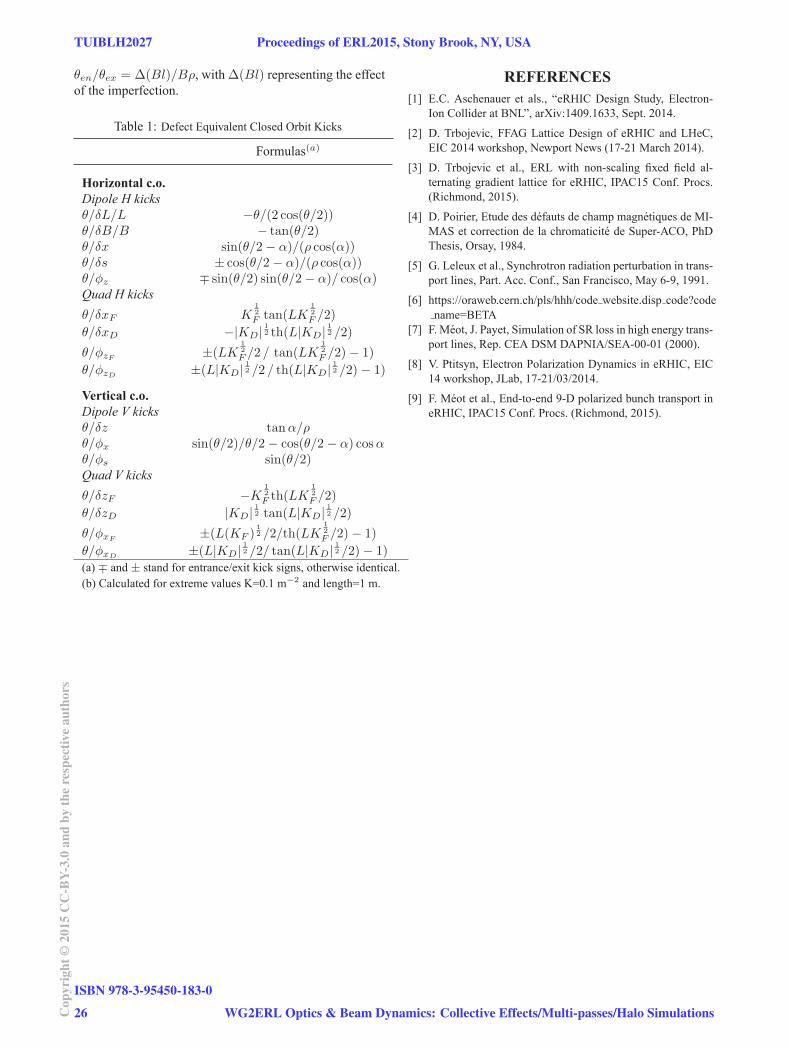
θen/θex = Δ(Bl)/Bρ, with Δ(Bl) representing the effectof the imperfection.
Table 1: Defect Equivalent Closed Orbit Kicks
Formulas(a)
Horizontal c.o.Dipole H kicksθ/δL/L −θ/(2 cos(θ/2))θ/δB/B − tan(θ/2)θ/δx sin(θ/2− α)/(ρ cos(α))θ/δs ± cos(θ/2− α)/(ρ cos(α))θ/φz ∓ sin(θ/2) sin(θ/2− α)/ cos(α)Quad H kicksθ/δxF K
12
F tan(LK12
F /2)
θ/δxD −|KD| 12 th(L|KD| 12 /2)θ/φzF ±(LK 1
2
F /2 / tan(LK12
F /2)− 1)
θ/φzD ±(L|KD| 12 /2 / th(L|KD| 12 /2)− 1)
Vertical c.o.Dipole V kicksθ/δz tanα/ρθ/φx sin(θ/2)/θ/2− cos(θ/2− α) cosαθ/φs sin(θ/2)Quad V kicksθ/δzF −K 1
2
F th(LK12
F /2)
θ/δzD |KD| 12 tan(L|KD| 12 /2)θ/φxF
±(L(KF )12 /2/th(LK
12
F /2)− 1)
θ/φxD±(L|KD| 12 /2/ tan(L|KD| 12 /2)− 1)
(a) ∓ and ± stand for entrance/exit kick signs, otherwise identical.(b) Calculated for extreme values K=0.1 m−2 and length=1 m.
REFERENCES[1] E.C. Aschenauer et als., “eRHIC Design Study, Electron-
Ion Collider at BNL”, arXiv:1409.1633, Sept. 2014.
[2] D. Trbojevic, FFAG Lattice Design of eRHIC and LHeC,EIC 2014 workshop, Newport News (17-21 March 2014).
[3] D. Trbojevic et al., ERL with non-scaling fixed field al-ternating gradient lattice for eRHIC, IPAC15 Conf. Procs.(Richmond, 2015).
[4] D. Poirier, Etude des defauts de champ magnetiques de MI-MAS et correction de la chromaticite de Super-ACO, PhDThesis, Orsay, 1984.
[5] G. Leleux et al., Synchrotron radiation perturbation in trans-port lines, Part. Acc. Conf., San Francisco, May 6-9, 1991.
[6] https://oraweb.cern.ch/pls/hhh/code website.disp code?codename=BETA
[7] F. Meot, J. Payet, Simulation of SR loss in high energy trans-port lines, Rep. CEA DSM DAPNIA/SEA-00-01 (2000).
[8] V. Ptitsyn, Electron Polarization Dynamics in eRHIC, EIC14 workshop, JLab, 17-21/03/2014.
[9] F. Meot et al., End-to-end 9-D polarized bunch transport ineRHIC, IPAC15 Conf. Procs. (Richmond, 2015).
TUIBLH2027 Proceedings of ERL2015, Stony Brook, NY, USA
ISBN 978-3-95450-183-0
26Cop
yrig
ht©
2015
CC
-BY-
3.0
and
byth
ere
spec
tive
auth
ors
WG2ERL Optics & Beam Dynamics: Collective Effects/Multi-passes/Halo Simulations
IMPROVING THE SMOOTHNESS OF MULTIALKALI ANTIMONIDE PHOTOCATHODES: AN IN-SITU X-RAY REFLECTIVITY STUDY
Z. Ding, E. Muller, Stony Brook University, Stony Brook, NY, 11794, USA J. Xie, ANL, Lemont, IL 60439, USA
K. Attenkofer, M. Gaowei, J. Sinsheimer, J. Smedley, J. Walsh, BNL, Upton, NY, 11973, USA J. Kuhn, Helmholtz-Zentrum Berlin, Berlin, 12489, Germany
S. Schubert, J. Wong, H. Padmore, LBNL, Berkeley, CA, 94720, USAH. Frisch, University of Chicago, Chicago, IL, 60637, USA
Abstract Multialkali antimonide photocathodes have been shownto be excellent electron sources for a wide range of applications because of high quantum efficiency, low emittance, good lifetime, and fast response. In recent years, synchrotron X-ray methods have been used to study the growth mechanism of K2CsSb photocathodes. The traditional sequential growth of K2CsSb has been shown to result in rough surface, which will have an adverse impact on the emittance of the electron beam. However, co-evaporation of alkali metals on the evaporated Sb layer and sputter deposition may offer a route to solving the roughness problem. Recent studies on K2CsSb grown by these methods are presented and surface roughness is determined by X-ray reflectivity (XRR) and results are compared.
INTRODUCTION During recent years, numerous studies have been carried out on the K2CsSb photocathode as a promising candidate for high quality electron sources [1, 2]. The traditional growth method is to sequentially evaporate Sb, K and Cs onto the substrate. In-situ X-ray analysis on photocathodes grown by this traditional recipe indicates that the surface roughness to be ~ 25 nm rms for a 50 nm thick cathode [2],however a photocathode with this roughness would impactthe intrinsic emittance in the high gradient fields used in most applications [3]. Studies have shown that for an emission field of 20 MV/m a roughness of less than 1 nm is required [4]. Previous studies have revealed the growth mechanism of the traditionally grown K2CsSb photocathode [5, 6]. The evolution of crystalline Sb layer to a K-Sb compound and then to a crystalline K3Sb significantly increases the roughness from the sub nm scale to more than 10 nm. In order to improve this process, we have developed a method in which multiple thin layers of the antimonide are grown. Sb is deposited in thickness that prevents the formation of crystalline antimony, followed by sequential evaporation of K and Cs [6].
In this work, X-ray reflectivity analysis on photocathodesgrown by this method as well as two new approaches, co-evaporation of K and Cs and sputter deposition, will be discussed in details.
EXPERIMENTAL In-situ synchrotron X-ray growth studies of K2CsSbphotocathodes were carried out at beam line G3, on the Cornell High Energy Synchrotron Source (CHESS), using a photon energy of 11.26 keV. Two Pilatus 100K pixel detectors were installed on the growth system and a Vortex detector was placed about 18 cm away from the sample, so that X-ray reflectivity (XRR), wide angle X-ray diffraction (WAXD), X-ray diffraction (XRD) and X-ray fluorescence(XRF) can be measured during the growth. The base pressure of the chamber during cathode growth was kept in the low 10-10 Torr range and partial pressure of water and oxygen were in the low 10-11 Torr range. A quartz crystal microbalance (QCM) was positioned alongside the sample holder, and the growth rate of all materials set controlled to be 0.2 Å/s. The temperature of the sample was kept at approximately The XRR data is fitted by the refinement program GenX[7], which uses Parratt’s recursion and adopts the Nevot-Croce model for the calculation of roughness [8].
Sequential Evaporation For sequential evaporation experiments, a first layer of 3nm Sb was deposited on a Si substrate, followed by K deposition until the photocurrent maximized. Cs was deposited finally to maximize the photocurrent. A second layer of 5nm Sb was deposited afterwards and the deposition of K and Cs was repeated. X-ray reflectivity analysis was done on the substrate and after each evaporation. Further details can be found in [6].
Proceedings of ERL2015, Stony Brook, NY, USA TUICLH1030
WG1 ERL Injectors (Gun/Cathode/Laser)
ISBN 978-3-95450-183-0
27 Cop
yrig
ht©
2015
CC
-BY-
3.0
and
byth
ere
spec
tive
auth
ors

Co-evaporation For co-evaporation experiments, a first layer of 1.5nm Sb, according to QCM, was deposited on the MgO substrate, K and Cs were then co-evaporated onto the Sb layer until the photocurrent reached a maximum. A second layer of Sb followed by co-evaporation of K and Cs was repeated. A final photocathode of 6 layers in total was grown.
Sputter Deposition A radio-frequency (RF) sputter system was installed in the growth chamber. The K2CsSb target was synthesized at Radiation Monitoring Devices (RMD), Inc. The detailed description of the sputter experiment can be found in [4].Sputter deposition was carried out on MgO substrates,grown in 3 layers for a total thickness of 30 nm (sample F009) and on a Si substrate, where the film was grown in one layer of 30 nm thick (sample F010), with final Cs deposition on both samples.
RESULTSSequential Evaporation XRR simulation result for the sample grown by sequential evaporation is shown in Fig. 1 (left). The Si substrate has a roughness determined by fitting the simulation model of 3.1 Å. The first evaporation of Sb has a thickness of 35 Å and a roughness of 2.9 Å. The next step of K evaporation results in a 141 Å thick layer which has 10.5 Å roughness due to the recrystallization process. The cesiation process produces a photocathode that is 5 times as thick as the Sb layer. The fitted roughness for the first layer of cathode is 13.2 Å.XRR analysis on the final photocathode reveals that the thickness is 469 Å and the roughness is 32 Å, which is approximately an order of magnitude lower than that of the traditionally grown sequential photocathodes. The quantum efficiency at the 532 nm wavelength is measured to be 4.9%.
Figure 1: XRR fitting results, simulations are fitted to experimental data. Open circles stand for measured data; Colored curves stand for simulation. Left: Sequential evaporation; Middle: Co-evaporation; Right: Sputter deposition (F009).
Figure 2: Calculated stoichiometry of each layer of the photocathodes. Left: Co-evaporation sample; Right: Sputtered sample.
TUICLH1030 Proceedings of ERL2015, Stony Brook, NY, USA
ISBN 978-3-95450-183-0
28Cop
yrig
ht©
2015
CC
-BY-
3.0
and
byth
ere
spec
tive
auth
ors
WG1 ERL Injectors (Gun/Cathode/Laser)
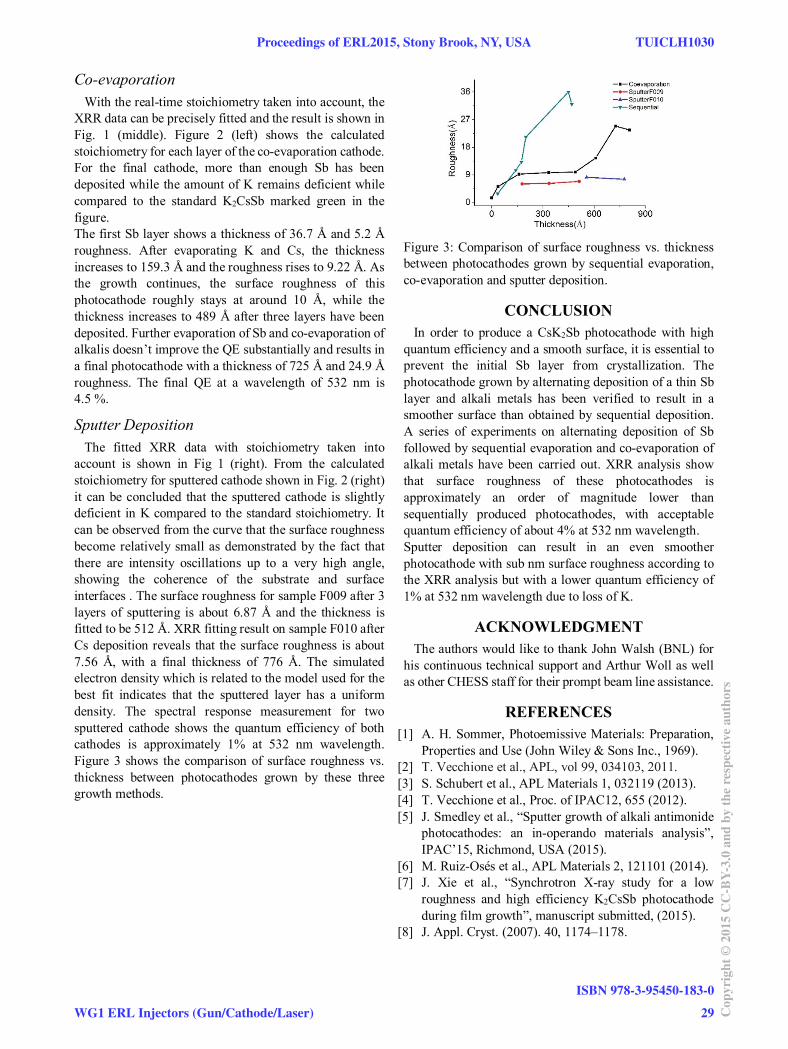
Co-evaporation With the real-time stoichiometry taken into account, the XRR data can be precisely fitted and the result is shown in Fig. 1 (middle). Figure 2 (left) shows the calculated stoichiometry for each layer of the co-evaporation cathode. For the final cathode, more than enough Sb has been deposited while the amount of K remains deficient while compared to the standard K2CsSb marked green in the figure. The first Sb layer shows a thickness of 36.7 Å and 5.2 Å roughness. After evaporating K and Cs, the thickness increases to 159.3 Å and the roughness rises to 9.22 Å. As the growth continues, the surface roughness of this photocathode roughly stays at around 10 Å, while the thickness increases to 489 Å after three layers have been deposited. Further evaporation of Sb and co-evaporation of alkalis doesn’t improve the QE substantially and results in a final photocathode with a thickness of 725 Å and 24.9 Å roughness. The final QE at a wavelength of 532 nm is 4.5 %.
Sputter Deposition The fitted XRR data with stoichiometry taken into account is shown in Fig 1 (right). From the calculated stoichiometry for sputtered cathode shown in Fig. 2 (right) it can be concluded that the sputtered cathode is slightly deficient in K compared to the standard stoichiometry. It can be observed from the curve that the surface roughness become relatively small as demonstrated by the fact that there are intensity oscillations up to a very high angle, showing the coherence of the substrate and surface interfaces . The surface roughness for sample F009 after 3 layers of sputtering is about 6.87 Å and the thickness is fitted to be 512 Å. XRR fitting result on sample F010 after Cs deposition reveals that the surface roughness is about 7.56 Å, with a final thickness of 776 Å. The simulated electron density which is related to the model used for the best fit indicates that the sputtered layer has a uniform density. The spectral response measurement for two sputtered cathode shows the quantum efficiency of both cathodes is approximately 1% at 532 nm wavelength. Figure 3 shows the comparison of surface roughness vs. thickness between photocathodes grown by these three growth methods.
Figure 3: Comparison of surface roughness vs. thickness between photocathodes grown by sequential evaporation, co-evaporation and sputter deposition.
CONCLUSION In order to produce a CsK2Sb photocathode with high quantum efficiency and a smooth surface, it is essential to prevent the initial Sb layer from crystallization. The photocathode grown by alternating deposition of a thin Sb layer and alkali metals has been verified to result in a smoother surface than obtained by sequential deposition. A series of experiments on alternating deposition of Sb followed by sequential evaporation and co-evaporation of alkali metals have been carried out. XRR analysis show that surface roughness of these photocathodes is approximately an order of magnitude lower than sequentially produced photocathodes, with acceptable quantum efficiency of about 4% at 532 nm wavelength. Sputter deposition can result in an even smoother photocathode with sub nm surface roughness according to the XRR analysis but with a lower quantum efficiency of 1% at 532 nm wavelength due to loss of K.
ACKNOWLEDGMENT The authors would like to thank John Walsh (BNL) for his continuous technical support and Arthur Woll as well as other CHESS staff for their prompt beam line assistance.
REFERENCES [1] A. H. Sommer, Photoemissive Materials: Preparation,
Properties and Use (John Wiley & Sons Inc., 1969). [2] T. Vecchione et al., APL, vol 99, 034103, 2011. [3] S. Schubert et al., APL Materials 1, 032119 (2013). [4] T. Vecchione et al., Proc. of IPAC12, 655 (2012). [5] J. Smedley et al., “Sputter growth of alkali antimonide
photocathodes: an in-operando materials analysis”, IPAC’15, Richmond, USA (2015).
[6] M. Ruiz-Osés et al., APL Materials 2, 121101 (2014). [7] J. Xie et al., “Synchrotron X-ray study for a low
roughness and high efficiency K2CsSb photocathode during film growth”, manuscript submitted, (2015).
[8] J. Appl. Cryst. (2007). 40, 1174–1178.
Proceedings of ERL2015, Stony Brook, NY, USA TUICLH1030
WG1 ERL Injectors (Gun/Cathode/Laser)
ISBN 978-3-95450-183-0
29 Cop
yrig
ht©
2015
CC
-BY-
3.0
and
byth
ere
spec
tive
auth
ors

INVESTIGATIONS ON TRANSVERSE BEAM BREAK UP USING A
RECIRCULATED ELECTRON BEAM*
T. Kürzeder#, M. Arnold, M. Gros, F. Hug, L. Jürgensen, J. Pforr, N. PietrallaTU Darmstadt, Darmstadt, Germany
AbstractThe recirculating superconducting accelerator
S-DALINAC provides electron beams of up to 130 MeV
for nuclear physics experiments at the University of
Darmstadt since 1991. It consists of a 10 MeV injector
and a 40 MeV main linac and reaches its final design
energy using up to two recirculation paths. The
superconducting main linac houses eight 20-cell SRF
cavities operated at 3 GHz and 2 K. The very low
threshold current of only a few µA for the occurrence of
beam break up in addition with the recirculating linac
design gives a unique opportunity to the ERL community
for testing different strategies of avoiding beam break up
experimentally at this accelerator and to benchmark beam
dynamics simulations concerning this topic. To minimize
the impact of HOMs on the recirculating electron bunches
we will place skew quadrupole and sextupole magnets in
our accelerator and test their effect on the threshold
current. We will report on the status of beam dynamics
simulations concerning their use in the accelerator and
present actual calculations for the positioning of the skew
quadrupoles. An outlook on the future activities at the
S-DALINAC will be given.
INTRODUCTIONTransverse beam break up (BBU) is one of the main
problems of modern superconducting energy recovery linacs. A theory of BBU instability in ERLs was shown in [1]. It occurs when an electron bunch travelling through an accelerating cavity excites higher order dipole modes (HOM) in it. These HOMs can have a large quality factor and thus a long lifetime in superconducting cavities. The bunch will be deflected by the electro-magnetic field of the mode. In a recirculating design this gets even worse as the same bunch can be deflected by the same HOM in the same direction. Thereby the maximum beam current which can be transported and accelerated is limited in every recirculating linac. This limit is called the BBU threshold current. For ERLs worldwide which are planned or already under constructions this is a crucial parameter as they yield for beam currents of 10-100 mA and above.
On the contrary in early SRF linacs only a few µA of beam current were possible because of BBU [2,3]. Also the S-DALINAC [4] is limited in its beam current when operated in recirculating mode. The highest stable current achieved so far in a long term experiment accounts for 5 µA [5], which was well below the design value of 20 µA but convenient for the experiments carried out. The low threshold currents at the S-DALINAC allow to carry
out experiments on transverse beam break up without the risk of damaging the accelerator.
S-DALINACThe Superconducting Darmstadt LINear Accelerator
(S-DALINAC) provides electron beams for nuclear- and astrophysical experiments at the University of Darmstadt. It consists of a superconducting 10 MeV injector and a 40 MeV linac. With two recirculation beam lines the main linac can be used up to 3 times. As electron sources a thermionic and a photo gun, which can also produce polarized electrons [6], can be chosen. This layout was originally designed to provide beam energies of up to 130 MeV and beam currents of either 60 µA in single pass mode or 20 µA when recirculated twice. But as mentioned above, the design beam current in recirculating operation could not be achieved so far.
For acceleration of the beam twelve 20-cell SRF cavities are used on an operation frequency of 3 GHz. These cavities have been produced in the 1990s and have never been optimized with regard to HOM suppression. Furthermore no HOM couplers can be used as most HOMs are trapped within the middle cells of these long 20-cell cavities.
In August 2015 the installation of an additional
recirculation beam line will begin and is scheduled to be
finished in January 2016 [7]. A floor plan of the
S-DALINAC is shown in Fig. 1. In the current setup with
only two recirculations the power dissipated by the
cavities to the helium bath was too high when used at
maximum gradient as the quality factor of the cavities is
smaller than originally planned [8]. The upgrade is done
in order to reach the design energy of 130 MeV in
c.w.-operation with a smaller accelerating gradient per
cavity
BBU SUPPRESSIONMany efforts have been made and are still going on to
raise the BBU threshold currents. There are two strategies to address the problem. As a basis, cavities of ERLs are designed to damp the higher order modes. Also HOM couplers will be used. The second approach is matching the optics of the beam transport system. We are planning to increase the low threshold current of the S-DALINAC by manipulating the beam optics in the recirculation loops.
Variation of the Transverse Phase AdvanceIn [9] it is proposed to match the transverse phase
advance in an ERL in a way that a negative feedback of
the HOM excitation is provided which can increase the
___________________________________________
*Work supported by BMBF through 05K13RDA #[email protected]
TUICLH2032 Proceedings of ERL2015, Stony Brook, NY, USA
ISBN 978-3-95450-183-0
30Cop
yrig
ht©
2015
CC
-BY-
3.0
and
byth
ere
spec
tive
auth
ors
WG2ERL Optics & Beam Dynamics: Collective Effects/Multi-passes/Halo Simulations

threshold current. In addition simulations in [9] show
that a coupling of the x and y planes of transverse motion
could increase the threshold current even further.
We will test these approaches and try to reach for
higher currents when running the S-DALINAC as a single
or three times recirculating linac in 2016. The exchange
of the complete phase space will be done in the second
recirculation path. Therefore three skew quadrupole
magnets need to be implemented in our FODO lattice. In
order to achieve the exchange of vertical and horizontal
phase spaces a 4x4 rotation matrix is needed.
Such a matrix can be calculated analytically like
in [10]. For our case we chose a lattice, which fits best
into our regular lattice. The three skew quadrupoles are
distributed in a way that between half of their distance to
each other respectively one conventional quadrupole (first
focussing, second defocussing) will be positioned
(SFSDS).
The positions of the skew quadrupoles are marked
green in Fig.1. The analytical solution (thin lens
approximation) for such a system [10] provides the
refractive power for the skew quadrupoles of s = 1/s√2and for the conventional quadrupoles of F/D = ±√2/s.
With a beam energy of 68.85 MeV and a drift of
s = 1.981 m between each magnet’s focal plane the gradients easily can be calculated to Gs = 0.4184 T/m and
GF/D = ±1.4206 T/m then. Finally a numerical
optimization using the elegant code [11] has been carried
out in order to find the exact values for the 5 magnets of
the rotation system (see Table 1).
Table 1: Optimized Quadrupole Gradients for the Phase Space Rotation System
Focussing/Defocussing Quadrupoles ±1.082 T/m
Skew Quadrupole 1&3 0.4408 T/mSkew Quadrupole 2 0.4347 T/m
The skew magnets have been manufactured already and
are currently undergoing tests in the first recirculation of
the S-DALINAC (see Fig. 2). They will be used for first
experiments on BBU in summer 2015 and then be
relocated to their optimized positions during installation
of the new recirculation beamline.
Variation of ChromaticityIn [12] it is shown that a recirculation beam line with
high enough chromaticity ξ let electrons “forget” the kick obtained by any dipole mode. The condition which has to be fulfilled for that behaviour is also given in [12]:
|ΔE/E·ξ|>>1 (1)
With its typical energy spread ΔE/E of about 10-3 to
10-4
the natural chromaticity of <100 in the recirculation
beam lines is not big enough to test this theory with the
S-DALINAC. Therefore two sextupole magnets will be
installed in each arc of a recirculation at positions of high
dispersion in order to increase ξ. In total there will be 12 sextupoles (four per recirculation beam line).
Figure 1: Floor plan of the S-DALINAC with planned upgrade. Skew quadrupole magnets are shown in green in the strait section of the new (Second) recirculation. Sextupoles will be positioned in the arcs (shown in orange).
Figure 2: Three skew quadrupole magnets in the first recirculation of the S-DALINAC. They will be relocated in the second loop in the described SFSDS lattice above.
Proceedings of ERL2015, Stony Brook, NY, USA TUICLH2032
WG2ERL Optics & Beam Dynamics: Collective Effects/Multi-passes/Halo Simulations
ISBN 978-3-95450-183-0
31 Cop
yrig
ht©
2015
CC
-BY-
3.0
and
byth
ere
spec
tive
auth
ors

The magnets were constructed from 1 mm sheets of mu-metal (see Fig. 3). The magnets with 35 windings per coil were tested in continuous operation showing no significant heating operated with 7 A. At that current the field gradient was determined to be 109 T/m2 (see also Fig. 3). While the geometric length of the yoke amounts 7.5 cm the magnetic length was found to be 9 cm.
So far simulations of the beam dynamics with the elegant-code [11] showed, that the sextupole magnets can increase the chromaticity per turn to values of 1000 and higher, when one uses a larger energy spread of 2.5·10
-3.
Fulfilling the condition in [12] is thereby possible but nevertheless one has to watch carefully the emittance growth caused by such a setting [13,14]. In Figure 4 the envelope of the first recirculation beam line is shown with and without using the sextupole magnets in it.
The quadrupole magnets were set in a way, that they compensate already for negative effects caused by the sextupoles, while we tried to reach the needed chromaticities. In the shown example we got ξx and ξy of about 1000 but the emittance increased by a factor of 20 for εx and a factor 12 for εy. A proper beam transport gets challenging with an emittance growth like that. So far we think of testing the effect of chromaticity to the BBU threshold current by only recirculating once and then dump the beam or recirculate many times but only activate the sexupoles in a specific turn finding a setting which also provides a proper beam transport.
FUTURE ACTIVITIESAfter testing the strategies for BBU suppression with
the 3 times recirculated electron beam, we plan to commission the S-DALINAC as a single and double turn ERL. The major preparations for this are already done. Within the arcs of the new beamline, dipole magnets can be moved by stepper motors on their table in order to allow a change of the pathlength by about 10 cm. This represents a complete rf-wavelength and will allow to change the mode of operation from an accelerating multi-turn linac to an ERL. The separation magnet together with its vacuum chamber were designed and built to allow the extraction of a decelerated beam at injection energy (see Fig. 5). In future it will be possible to either steer the beam directly after the first linac pass into the second recirculation beamline and decelerate it afterwards or to use the main linac twice by bringing the beam first in the F-recirculation before performing the 180° phase shift in
Figure 4: Beam envelope in x and y direction of the first recirculation beam line with sexupoles switched off and on (E = 38 MeV and ΔE/E = 2.5·10
-3).
Figure 3: Photo of a sextupole magnet and results of a field gradient measurement on it.
Figure 5: Separation magnet for the S-DALINAC upgrade providing possibility to extract the electron beam at injection energy for ERL mode. A picture taken from CST [15] simulation and a photo of the recently delivered magnet with vacuum chamber are shown.
TUICLH2032 Proceedings of ERL2015, Stony Brook, NY, USA
ISBN 978-3-95450-183-0
32Cop
yrig
ht©
2015
CC
-BY-
3.0
and
byth
ere
spec
tive
auth
ors
WG2ERL Optics & Beam Dynamics: Collective Effects/Multi-passes/Halo Simulations
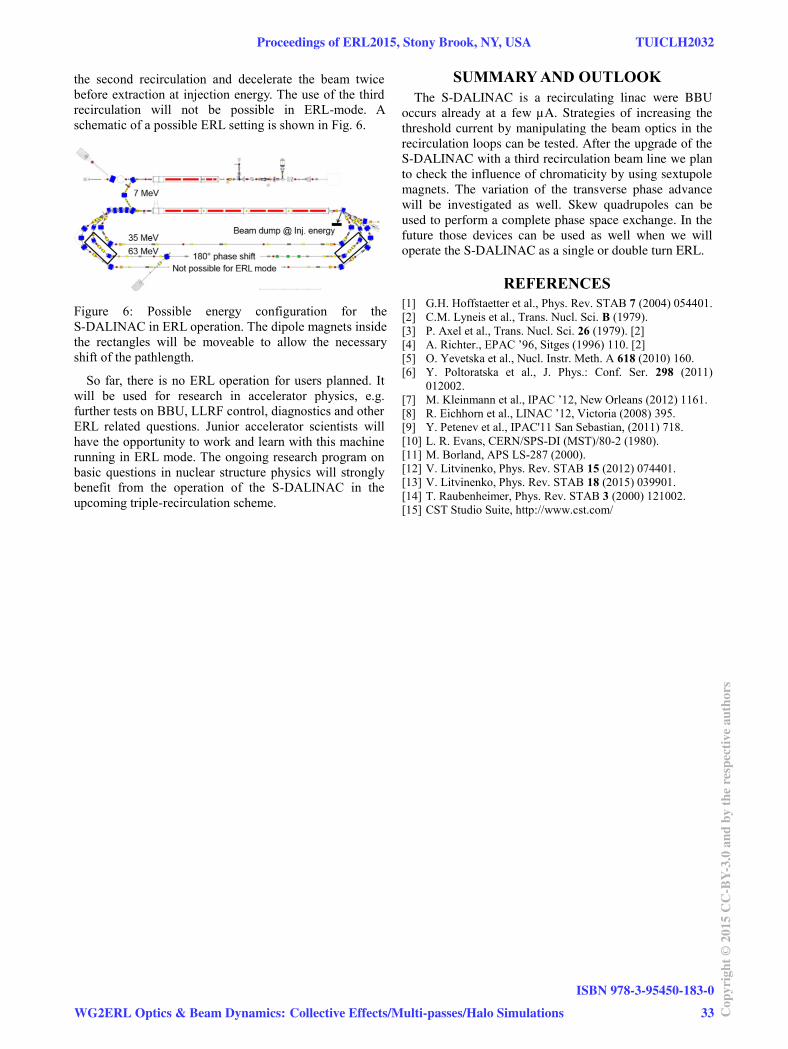
the second recirculation and decelerate the beam twice before extraction at injection energy. The use of the third recirculation will not be possible in ERL-mode. A schematic of a possible ERL setting is shown in Fig. 6.
So far, there is no ERL operation for users planned. It will be used for research in accelerator physics, e.g. further tests on BBU, LLRF control, diagnostics and other ERL related questions. Junior accelerator scientists will have the opportunity to work and learn with this machine running in ERL mode. The ongoing research program on basic questions in nuclear structure physics will strongly benefit from the operation of the S-DALINAC in the upcoming triple-recirculation scheme.
SUMMARY AND OUTLOOK
The S-DALINAC is a recirculating linac were BBU
occurs already at a few µA. Strategies of increasing the
threshold current by manipulating the beam optics in the
recirculation loops can be tested. After the upgrade of the
S-DALINAC with a third recirculation beam line we plan
to check the influence of chromaticity by using sextupole
magnets. The variation of the transverse phase advance
will be investigated as well. Skew quadrupoles can be
used to perform a complete phase space exchange. In the
future those devices can be used as well when we will
operate the S-DALINAC as a single or double turn ERL.
REFERENCES
[1] G.H. Hoffstaetter et al., Phys. Rev. STAB 7 (2004) 054401.
[2] C.M. Lyneis et al., Trans. Nucl. Sci. B (1979).
[3] P. Axel et al., Trans. Nucl. Sci. 26 (1979). [2]
[4] A. Richter., EPAC ’96, Sitges (1996) 110. [2]
[5] O. Yevetska et al., Nucl. Instr. Meth. A 618 (2010) 160.
[6] Y. Poltoratska et al., J. Phys.: Conf. Ser. 298 (2011)
012002.
[7] M. Kleinmann et al., IPAC ’12, New Orleans (2012) 1161.
[8] R. Eichhorn et al., LINAC ’12, Victoria (2008) 395.
[9] Y. Petenev et al., IPAC'11 San Sebastian, (2011) 718.
[10] L. R. Evans, CERN/SPS-DI (MST)/80-2 (1980).
[11] M. Borland, APS LS-287 (2000).
[12] V. Litvinenko, Phys. Rev. STAB 15 (2012) 074401.
[13] V. Litvinenko, Phys. Rev. STAB 18 (2015) 039901.
[14] T. Raubenheimer, Phys. Rev. STAB 3 (2000) 121002.
[15] CST Studio Suite, http://www.cst.com/
Figure 6: Possible energy configuration for the S-DALINAC in ERL operation. The dipole magnets inside the rectangles will be moveable to allow the necessary shift of the pathlength.
Proceedings of ERL2015, Stony Brook, NY, USA TUICLH2032
WG2ERL Optics & Beam Dynamics: Collective Effects/Multi-passes/Halo Simulations
ISBN 978-3-95450-183-0
33 Cop
yrig
ht©
2015
CC
-BY-
3.0
and
byth
ere
spec
tive
auth
ors
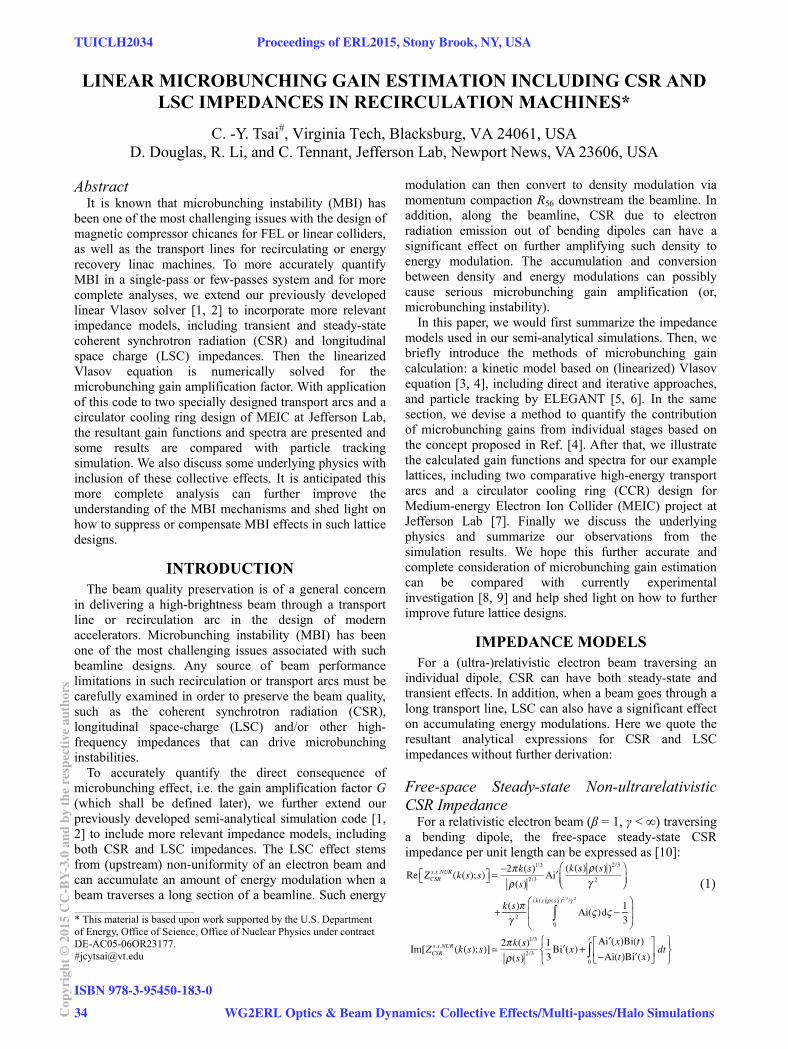
LINEAR MICROBUNCHING GAIN ESTIMATION INCLUDING CSR AND LSC IMPEDANCES IN RECIRCULATION MACHINES*
C. -Y. Tsai#, Virginia Tech, Blacksburg, VA 24061, USA D. Douglas, R. Li, and C. Tennant, Jefferson Lab, Newport News, VA 23606, USA
Abstract It is known that microbunching instability (MBI) has
been one of the most challenging issues with the design of magnetic compressor chicanes for FEL or linear colliders, as well as the transport lines for recirculating or energy recovery linac machines. To more accurately quantify MBI in a single-pass or few-passes system and for more complete analyses, we extend our previously developed linear Vlasov solver [1, 2] to incorporate more relevant impedance models, including transient and steady-state coherent synchrotron radiation (CSR) and longitudinal space charge (LSC) impedances. Then the linearized Vlasov equation is numerically solved for the microbunching gain amplification factor. With application of this code to two specially designed transport arcs and a circulator cooling ring design of MEIC at Jefferson Lab, the resultant gain functions and spectra are presented and some results are compared with particle tracking simulation. We also discuss some underlying physics with inclusion of these collective effects. It is anticipated this more complete analysis can further improve the understanding of the MBI mechanisms and shed light on how to suppress or compensate MBI effects in such lattice designs.
INTRODUCTION The beam quality preservation is of a general concern
in delivering a high-brightness beam through a transport line or recirculation arc in the design of modern accelerators. Microbunching instability (MBI) has been one of the most challenging issues associated with such beamline designs. Any source of beam performance limitations in such recirculation or transport arcs must be carefully examined in order to preserve the beam quality, such as the coherent synchrotron radiation (CSR), longitudinal space-charge (LSC) and/or other high-frequency impedances that can drive microbunching instabilities.
To accurately quantify the direct consequence of microbunching effect, i.e. the gain amplification factor G (which shall be defined later), we further extend our previously developed semi-analytical simulation code [1, 2] to include more relevant impedance models, including both CSR and LSC impedances. The LSC effect stems from (upstream) non-uniformity of an electron beam and can accumulate an amount of energy modulation when a beam traverses a long section of a beamline. Such energy
modulation can then convert to density modulation via momentum compaction R56 downstream the beamline. In addition, along the beamline, CSR due to electron radiation emission out of bending dipoles can have a significant effect on further amplifying such density to energy modulation. The accumulation and conversion between density and energy modulations can possibly cause serious microbunching gain amplification (or, microbunching instability).
In this paper, we would first summarize the impedance models used in our semi-analytical simulations. Then, we briefly introduce the methods of microbunching gain calculation: a kinetic model based on (linearized) Vlasov equation [3, 4], including direct and iterative approaches, and particle tracking by ELEGANT [5, 6]. In the same section, we devise a method to quantify the contribution of microbunching gains from individual stages based on the concept proposed in Ref. [4]. After that, we illustrate the calculated gain functions and spectra for our example lattices, including two comparative high-energy transport arcs and a circulator cooling ring (CCR) design for Medium-energy Electron Ion Collider (MEIC) project at Jefferson Lab [7]. Finally we discuss the underlying physics and summarize our observations from the simulation results. We hope this further accurate and complete consideration of microbunching gain estimation can be compared with currently experimental investigation [8, 9] and help shed light on how to further improve future lattice designs.
IMPEDANCE MODELS For a (ultra-)relativistic electron beam traversing an
individual dipole, CSR can have both steady-state and transient effects. In addition, when a beam goes through a long transport line, LSC can also have a significant effect on accumulating energy modulations. Here we quote the resultant analytical expressions for CSR and LSC impedances without further derivation:
Free-space Steady-state Non-ultrarelativistic CSR Impedance
For a relativistic electron beam (β = 1, γ < ∞) traversing a bending dipole, the free-space steady-state CSR impedance per unit length can be expressed as [10]:
(1)
____________________________________________
* This material is based upon work supported by the U.S. Department of Energy, Office of Science, Office of Nuclear Physics under contract DE-AC05-06OR23177. #[email protected]
TUICLH2034 Proceedings of ERL2015, Stony Brook, NY, USA
ISBN 978-3-95450-183-0
34Cop
yrig
ht©
2015
CC
-BY-
3.0
and
byth
ere
spec
tive
auth
ors
WG2ERL Optics & Beam Dynamics: Collective Effects/Multi-passes/Halo Simulations
where x k(s) (s) 2/3 2 , k = 2π/λ is the modulation
wave number, ρ(s) is the bending radius, and Ai and Bi are Airy functions. Under ultrarelativistic approximation ( ), Eq. (1) is reduced to the well-known expression
[11, 12]:
ZCSRs.s.UR k(s);s ik(s)1/3 A
(s)2/3
(2)
where the constant A 2 Bi'(0) 3 iAi'(0) . Entrance Transient CSR Impedance
Prior to reaching steady-state interaction, the beam entering a bend from a straight section would experience the so-called entrance transient state, where the impedance per unit length can be obtained by Laplace transformation of the corresponding wakefield [13, 14, 15]:
ZCSRent k(s);s 4
s* e4 i (s ) 4
3s* i(s) 1/31
3,i(s)
(3)
where (s ) k (s )zL
(s ), s* is the longitudinal coordinate
measured from dipole entrance, zL s* 324 2 , and Γ is
the upper incomplete Gamma function. Exit Transient CSR Impedance
There are also exit CSR transient effects as a beam exits from a dipole. For the case with fields generated from an upstream electron (at retarded time) propagating across the dipole to downstream straight section, i.e. Case C of Ref. [15], the corresponding impedance per unit length can be similarly obtained by Laplace transformation:
ZCSRexit k(s);s 4
Lb 2s* e ik (s )Lb
2
6 (s)2 Lb3s* (4)
where s* is the longitudinal coordinate measured from dipole exit and Lb is the dipole length.
For the impedance expression with the case of fields generated from an electron (at retarded time) within a dipole propagating downstream the straight section, we use the following expression for the exit transient impedance [16]:
ZCSRdrif (k(s);s)
2s* , if 2/31/3 s* 2 22k (s )
2 , if s* 2 2
0, if s* 2/31/3
(5)
where s* is the longitudinal coordinate measured from dipole exit. This expression assumes the exit impedance comes primarily from coherent edge radiation in the near-field region (i.e. z < λγ2), and in our simulation we only include transient effects [Eq. (4) and (5)] right after a nearby upstream bend. Here we note that these CSR models are valid only when the wall shielding effect is negligible. The wall shielding effect becomes important when the distance from the beam orbit to the walls h is to satisfy h 2 1/3.
Longitudinal Space Charge Impedances [17] Below we present two slightly different LSC
impedance expressions implemented in our code. The first one is on-axis model, which assumes a transversely uniform density with circular cross section of radius rb,
ZLSConaxis (k(s);s)
4i
rb (s)
1K1( )
(6)
where k (s)rb (s ) and the transverse beam sizes can be
obtained by the fitted result rb (s) 1.7472 x (s) y(s) [18].
The second LSC model is the average model, which integrates the radial dependence [17,19],
ZLSCave (k(s);s)
4i
rb (s)
1 2I1( )K1( )
(7)
where ξ is defined above the same way.
NUMERICAL METHODS To quantify the MBI in a transport or recirculation arc,
we estimate the microbunching amplification factor G (or, bunching factor) by two distinct methods. The first one, based on a kinetic model, is to solve a (linearized) Vlasov equation [3,4] using given impedance models [e.g. Eqs. (1-7)]. This method is of our primary focus in this paper. The second one, served as a benchmarking of the first method, is based on particle tracking (here we use ELEGANT [5,6]). For the former, after mathematical simplification of the linearized Vlsaov equation, we actually solve a general form of Volterra integral equation [3,4] in terms of the bunching factor. In our semi-analytical code, to facilitate us in simulating ERL-based lattices which usually contain spreaders/recombiners, we extend the existing formulation [3,4] to include both transverse horizontal and vertical bends. Below summarizes the governing equation for bunching factor gk,
gk (s) gk(0)(s) K(s, s ')gk (s ')ds '
0
s
(8)
where the kernel function can be particularly expressed as
K(s, s ') ik
I (s)
IA
C(s ')R56 (s ' s)Z kC(s '), s ' [Landau damping] (9)
for the [Landau damping] term
[Landau damping] expk2
2
x0 x0R512 (s, s ')
R522 (s,s ')
x0
y0 y0R532 (s,s ')
R542 (s,s ')
y0
2R562 (s,s ')
(10)
with R56 (s ' s) R56 (s) R56 (s ') R51(s ')R52 (s) R51(s)R52 (s ')
R53(s ')R54 (s) R53(s)R54 (s ') (11)
and R5i (s, s ') C(s)R5 i (s)C(s ')R5i (s ') for i = 1, 2, 3, 4, 6.
Here the kernel function K(s,s’) describes relevant
collective effects, gk(s) the resultant bunching factor as a function of the longitudinal position given a wavenumber k, and gk
(0)(s) is the bunching factor in the absence of collective effect (i.e. from pure optics effect). We particularly note that the above formulation can be applicable to the case with focusing in combined-function dipoles.
Proceedings of ERL2015, Stony Brook, NY, USA TUICLH2034
WG2ERL Optics & Beam Dynamics: Collective Effects/Multi-passes/Halo Simulations
ISBN 978-3-95450-183-0
35 Cop
yrig
ht©
2015
CC
-BY-
3.0
and
byth
ere
spec
tive
auth
ors

In the above formulation, we have made the coasting beam approximation, i.e. the modulation wavelength is assumed much shorter compared with the whole bunch duration. The transport functions R5i(s) (i = 1, 2, 3, 4, 6) are adopted from ELEGANT with slight modification to account for “non-ultrarelativistic” contributionR56 (s) R56 (s) s
2 where s is the longitudinal
coordinate along the beamline. Here we define the microbunching gain function at k = 2π/λ as G(s) gk (s) gk
(0)(0) and the gain spectral function at the
exit of a lattice as Gf () G(s s f ) (12)
We note that the impedance term in Eq. (9) is of our primary interest. With given impedance models [Eqs. (1-7)], we can estimate the microbunching gain through a beamline. Since the calculation is fast (compared with tracking simulation), it can be used to make quick estimation or optimize the microbunching gain development in a lattice design.
For Eq. (8), we solve it by two approaches: one is the direct solution, and the other resorts to the iterative solution. For the latter approach, at the first step, we express Eq. (8) in vector forms for gk (s) and gk
(0)(s), and
in a matrix form for K(s, s '). Then we arrive at the
following equation
gk IK 1gk
(0) (13)
provided the inverse matrix of IK exists.
At the second step, to introduce the stage gain concept, motivated by Ref. [4], we try to define the first-order iterative solution by expanding Eq. (13) as:gk
(1) IK gk(0) and the second-order iteration to be
gk(2) IK K2 gk
(0) . In general, to nth order iterative
solution, we have
gk(n) Km
m0
n
gk(0) (14)
It can be seen that, in Eq. (14), the sum to infinite order should give an equivalent result of Eq. (13) [or, Eq. (8)], provided the sum converges. Therefore, these two approaches, Eq. (8) and Eq. (14), can be proven equivalent. Here we note that the convergence of Eq. (14) is held in a single-pass (or, finite-pass) system, e.g. the transport or recirculation arcs, for CSR effects. For a storage ring or for LSC effects which are ubiquitous along the beamline, the convergence would not be held, which is however beyond the scope of this paper [20]. For CSR-induced microbunching gain, the advantage of using numerical iterative approach, Eq. (14), is that it can give us a further insight to see how different orders of iterative solutions contribute to the different physical amplification stages. Also, Eq. (14) facilitates us exploring up to which stage the overall CSR-induced microbunching development can be described, by comparing with the direct solution [1]. Hereafter we dub the solutions of Eq. (13) as direct solutions, and those of Eq. (14) as iterative
solutions. Note that the definition of gain function with respect to Eq. (8) [i.e. Eq. (12)] can now be generalized to define the staged gain function, with respect to Eq. (14), as with and,
similar to Eq. (12), the stage gain spectral function, Gf
(n) G (n)(s s f ) (15)
To further compare the CSR microbunching gains contributed from individual stages, we devise in this subsection a method to quantitatively characterize the microbunching amplification in terms of stage orders. We note that Eq. (15) can in general be expanded in a series of polynomial of the beam current as [see also Eq. (14) and (9)]
(16)
up to a certain order M.
In order to extract the net effects caused by the lattice optics and beam phase space spreads for Landau damping, the above expression Eq. (16), together with knowledge of Eq. (9), can be further formulated as
(17)
where A is defined in Eq. (2), γ is the relativistic factor and dm
( ) is the dimensionless coefficient (given a certain
modulation wavelength) which now reflects the properties from lattice optics at mth stage (m = 0, 1, 2,…), as well as Landau damping through finite beam emittances and energy spread [see Eqs. (10)]. For our interest in the following discussion, λ is chosen to correspond to the maximal CSR gain, denoted as opt
. Here we point out
that Eq. (38) of Ref. [4] can be a special case of Eq. (17) for M = 2 in a typical bunch compressor chicane.
Obtaining the coefficients dm( ) of Eq. (17) can be
straightforward. Here we remark the close connection between Eq. (9) and Eqs. (14, 15). For now, we can define the individual stage gain, which shall be convenient for our further discussion,
(18)
Note the difference between Eq. (17) and (18). As our second model to calculate the microbunching
gains, we use ELEGANT [5,6], based on the particle tracking, as our benchmarking against the results by our semi-analytical Vlasov solver for the following example lattices.
SIMULATION RESULTS
High-energy Transport Arcs (Example 1 and 2) In this section we take two 1.3 GeV high-energy
transport arcs as our comparative examples (hereafter dubbed Example 1 and Example 2 lattice). The detailed description of the two example lattices can be found in Ref. [21, 22]. Table 1 summarizes some initial beam
TUICLH2034 Proceedings of ERL2015, Stony Brook, NY, USA
ISBN 978-3-95450-183-0
36Cop
yrig
ht©
2015
CC
-BY-
3.0
and
byth
ere
spec
tive
auth
ors
WG2ERL Optics & Beam Dynamics: Collective Effects/Multi-passes/Halo Simulations
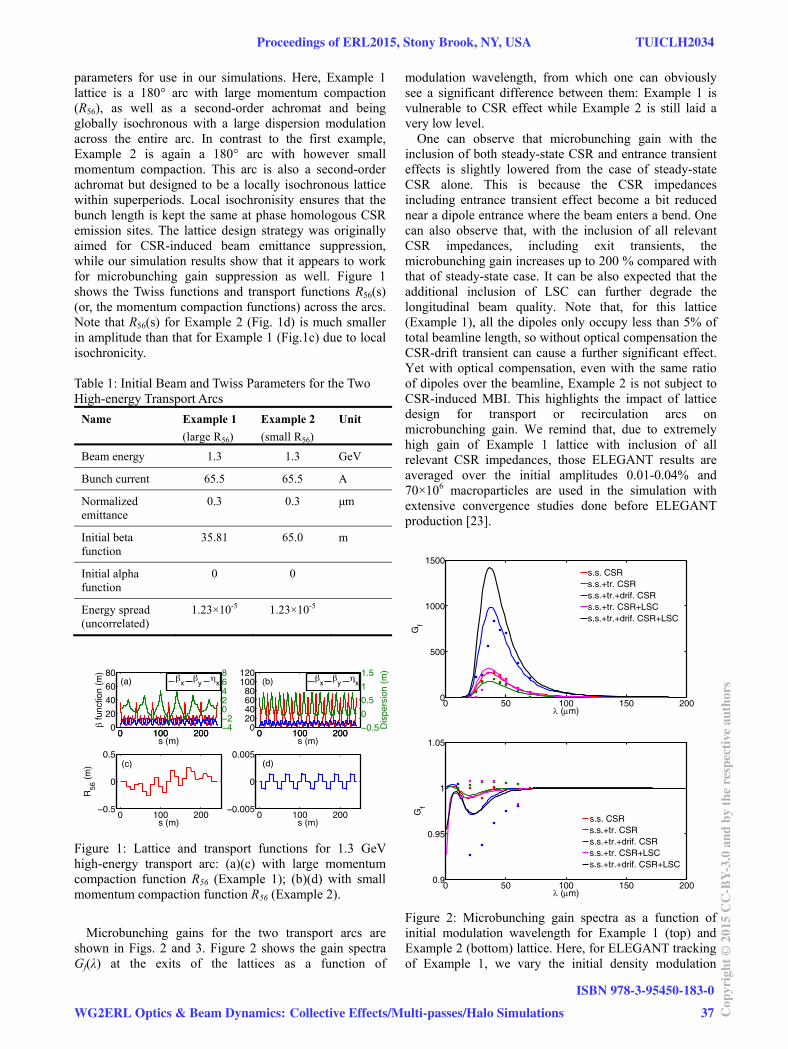
parameters for use in our simulations. Here, Example 1 lattice is a 180° arc with large momentum compaction (R56), as well as a second-order achromat and being globally isochronous with a large dispersion modulation across the entire arc. In contrast to the first example, Example 2 is again a 180° arc with however small momentum compaction. This arc is also a second-order achromat but designed to be a locally isochronous lattice within superperiods. Local isochronisity ensures that the bunch length is kept the same at phase homologous CSR emission sites. The lattice design strategy was originally aimed for CSR-induced beam emittance suppression, while our simulation results show that it appears to work for microbunching gain suppression as well. Figure 1 shows the Twiss functions and transport functions R56(s) (or, the momentum compaction functions) across the arcs. Note that R56(s) for Example 2 (Fig. 1d) is much smaller in amplitude than that for Example 1 (Fig.1c) due to local isochronicity.
Table 1: Initial Beam and Twiss Parameters for the Two High-energy Transport Arcs
Name Example 1
(large R56)
Example 2
(small R56)
Unit
Beam energy 1.3 1.3 GeV
Bunch current 65.5 65.5 A
Normalized emittance
0.3 0.3 μm
Initial beta function
35.81 65.0 m
Initial alpha function
0 0
Energy spread (uncorrelated)
1.23×10⁻⁵ 1.23×10⁻⁵
Figure 1: Lattice and transport functions for 1.3 GeV high-energy transport arc: (a)(c) with large momentum compaction function R56 (Example 1); (b)(d) with small momentum compaction function R56 (Example 2).
Microbunching gains for the two transport arcs are
shown in Figs. 2 and 3. Figure 2 shows the gain spectra Gf(λ) at the exits of the lattices as a function of
modulation wavelength, from which one can obviously see a significant difference between them: Example 1 is vulnerable to CSR effect while Example 2 is still laid a very low level.
One can observe that microbunching gain with the inclusion of both steady-state CSR and entrance transient effects is slightly lowered from the case of steady-state CSR alone. This is because the CSR impedances including entrance transient effect become a bit reduced near a dipole entrance where the beam enters a bend. One can also observe that, with the inclusion of all relevant CSR impedances, including exit transients, the microbunching gain increases up to 200 % compared with that of steady-state case. It can be also expected that the additional inclusion of LSC can further degrade the longitudinal beam quality. Note that, for this lattice (Example 1), all the dipoles only occupy less than 5% of total beamline length, so without optical compensation the CSR-drift transient can cause a further significant effect. Yet with optical compensation, even with the same ratio of dipoles over the beamline, Example 2 is not subject to CSR-induced MBI. This highlights the impact of lattice design for transport or recirculation arcs on microbunching gain. We remind that, due to extremely high gain of Example 1 lattice with inclusion of all relevant CSR impedances, those ELEGANT results are averaged over the initial amplitudes 0.01-0.04% and 70×106 macroparticles are used in the simulation with extensive convergence studies done before ELEGANT production [23].
Figure 2: Microbunching gain spectra as a function of initial modulation wavelength for Example 1 (top) and Example 2 (bottom) lattice. Here, for ELEGANT tracking of Example 1, we vary the initial density modulation
0 50 100 150 2000
500
1000
1500
(m)
Gf
s.s. CSRs.s.+tr. CSRs.s.+tr.+drif. CSRs.s.+tr. CSR+LSCs.s.+tr.+drif. CSR+LSC
0 50 100 150 2000.9
0.95
1
1.05
(m)
Gf
s.s. CSRs.s.+tr. CSRs.s.+tr.+drif. CSRs.s.+tr. CSR+LSCs.s.+tr.+drif. CSR+LSC
Proceedings of ERL2015, Stony Brook, NY, USA TUICLH2034
WG2ERL Optics & Beam Dynamics: Collective Effects/Multi-passes/Halo Simulations
ISBN 978-3-95450-183-0
37 Cop
yrig
ht©
2015
CC
-BY-
3.0
and
byth
ere
spec
tive
auth
ors
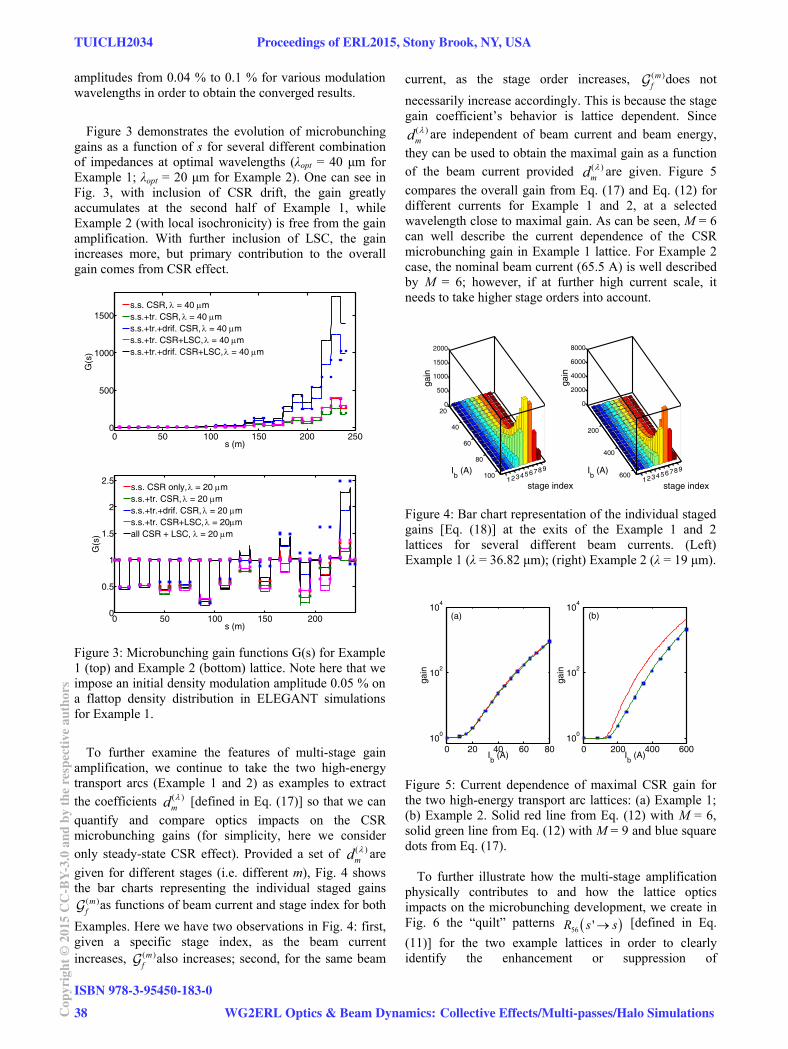
amplitudes from 0.04 % to 0.1 % for various modulation wavelengths in order to obtain the converged results.
Figure 3 demonstrates the evolution of microbunching
gains as a function of s for several different combination of impedances at optimal wavelengths (λopt = 40 μm for Example 1; λopt = 20 μm for Example 2). One can see in Fig. 3, with inclusion of CSR drift, the gain greatly accumulates at the second half of Example 1, while Example 2 (with local isochronicity) is free from the gain amplification. With further inclusion of LSC, the gain increases more, but primary contribution to the overall gain comes from CSR effect.
Figure 3: Microbunching gain functions G(s) for Example 1 (top) and Example 2 (bottom) lattice. Note here that we impose an initial density modulation amplitude 0.05 % on a flattop density distribution in ELEGANT simulations for Example 1.
To further examine the features of multi-stage gain
amplification, we continue to take the two high-energy transport arcs (Example 1 and 2) as examples to extract the coefficients dm
( ) [defined in Eq. (17)] so that we can
quantify and compare optics impacts on the CSR microbunching gains (for simplicity, here we consider only steady-state CSR effect). Provided a set of dm
( ) are
given for different stages (i.e. different m), Fig. 4 shows the bar charts representing the individual staged gains
as functions of beam current and stage index for both
Examples. Here we have two observations in Fig. 4: first, given a specific stage index, as the beam current increases, also increases; second, for the same beam
current, as the stage order increases, does not
necessarily increase accordingly. This is because the stage gain coefficient’s behavior is lattice dependent. Since
dm( ) are independent of beam current and beam energy,
they can be used to obtain the maximal gain as a function of the beam current provided dm
( ) are given. Figure 5
compares the overall gain from Eq. (17) and Eq. (12) for different currents for Example 1 and 2, at a selected wavelength close to maximal gain. As can be seen, M = 6 can well describe the current dependence of the CSR microbunching gain in Example 1 lattice. For Example 2 case, the nominal beam current (65.5 A) is well described by M = 6; however, if at further high current scale, it needs to take higher stage orders into account.
Figure 4: Bar chart representation of the individual staged gains [Eq. (18)] at the exits of the Example 1 and 2 lattices for several different beam currents. (Left) Example 1 (λ = 36.82 μm); (right) Example 2 (λ = 19 μm).
Figure 5: Current dependence of maximal CSR gain for the two high-energy transport arc lattices: (a) Example 1; (b) Example 2. Solid red line from Eq. (12) with M = 6, solid green line from Eq. (12) with M = 9 and blue square dots from Eq. (17).
To further illustrate how the multi-stage amplification physically contributes to and how the lattice optics impacts on the microbunching development, we create in Fig. 6 the “quilt” patterns R56 s ' s [defined in Eq.
(11)] for the two example lattices in order to clearly identify the enhancement or suppression of
0 50 100 150 200 2500
500
1000
1500
s (m)
G(s
)
s.s. CSR, = 40 ms.s.+tr. CSR, = 40 ms.s.+tr.+drif. CSR, = 40 ms.s.+tr. CSR+LSC, = 40 ms.s.+tr.+drif. CSR+LSC, = 40 m
0 50 100 150 2000
0.5
1
1.5
2
2.5
s (m)
G(s
)
s.s. CSR only, = 20 ms.s.+tr. CSR, = 20 ms.s.+tr.+drif. CSR, = 20 ms.s.+tr. CSR+LSC, = 20mall CSR + LSC, = 20 m
123456789
20
40
60
80
100
0
500
1000
1500
2000
stage index
Ib (A)
gain
123456789
200
400
600
0
2000
4000
6000
8000
stage index
Ib (A)
gain
0 20 40 60 8010
0
102
104
Ib (A)
gain
0 200 400 60010
0
102
104
Ib (A)
gain
(a) (b)
TUICLH2034 Proceedings of ERL2015, Stony Brook, NY, USA
ISBN 978-3-95450-183-0
38Cop
yrig
ht©
2015
CC
-BY-
3.0
and
byth
ere
spec
tive
auth
ors
WG2ERL Optics & Beam Dynamics: Collective Effects/Multi-passes/Halo Simulations
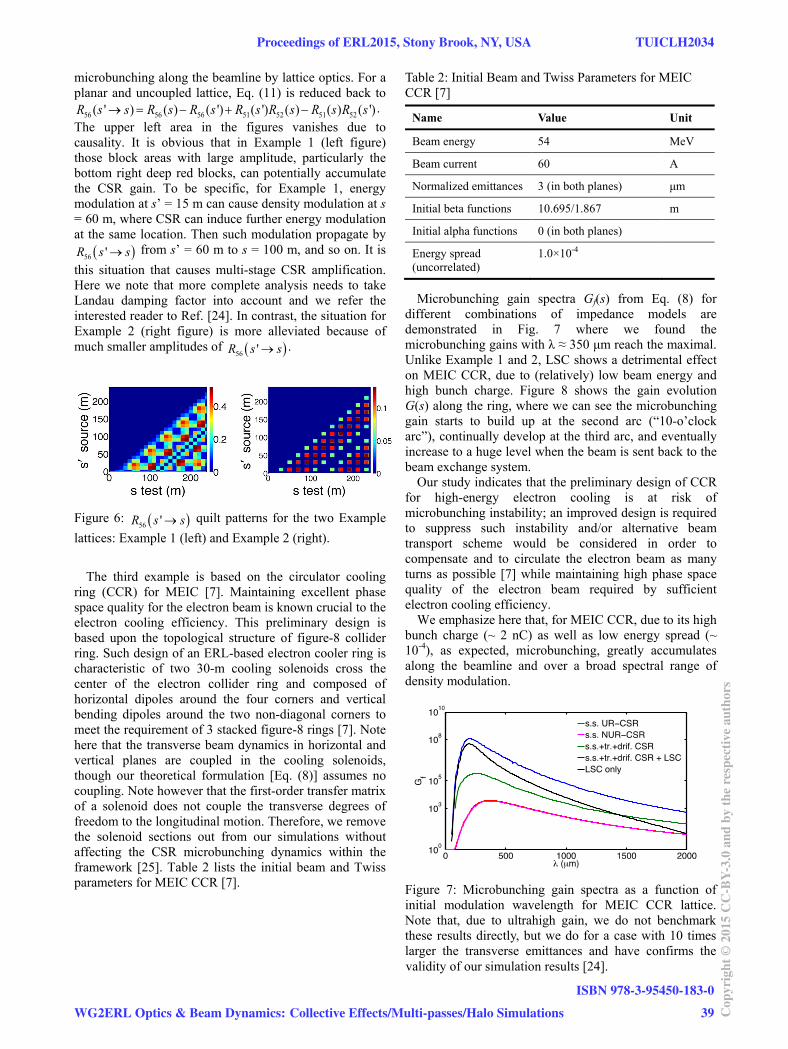
microbunching along the beamline by lattice optics. For a planar and uncoupled lattice, Eq. (11) is reduced back to R56 (s ' s) R56 (s) R56 (s ') R51(s ')R52 (s) R51(s)R52 (s ') .
The upper left area in the figures vanishes due to causality. It is obvious that in Example 1 (left figure) those block areas with large amplitude, particularly the bottom right deep red blocks, can potentially accumulate the CSR gain. To be specific, for Example 1, energy modulation at s’ = 15 m can cause density modulation at s = 60 m, where CSR can induce further energy modulation at the same location. Then such modulation propagate byR56 s ' s from s’ = 60 m to s = 100 m, and so on. It is
this situation that causes multi-stage CSR amplification. Here we note that more complete analysis needs to take Landau damping factor into account and we refer the interested reader to Ref. [24]. In contrast, the situation for Example 2 (right figure) is more alleviated because of much smaller amplitudes of R56 s ' s .
Figure 6: R56 s ' s quilt patterns for the two Example
lattices: Example 1 (left) and Example 2 (right).
The third example is based on the circulator cooling
ring (CCR) for MEIC [7]. Maintaining excellent phase space quality for the electron beam is known crucial to the electron cooling efficiency. This preliminary design is based upon the topological structure of figure-8 collider ring. Such design of an ERL-based electron cooler ring is characteristic of two 30-m cooling solenoids cross the center of the electron collider ring and composed of horizontal dipoles around the four corners and vertical bending dipoles around the two non-diagonal corners to meet the requirement of 3 stacked figure-8 rings [7]. Note here that the transverse beam dynamics in horizontal and vertical planes are coupled in the cooling solenoids, though our theoretical formulation [Eq. (8)] assumes no coupling. Note however that the first-order transfer matrix of a solenoid does not couple the transverse degrees of freedom to the longitudinal motion. Therefore, we remove the solenoid sections out from our simulations without affecting the CSR microbunching dynamics within the framework [25]. Table 2 lists the initial beam and Twiss parameters for MEIC CCR [7].
Table 2: Initial Beam and Twiss Parameters for MEIC CCR [7]
Name Value Unit
Beam energy 54 MeV
Beam current 60 A
Normalized emittances 3 (in both planes) μm
Initial beta functions 10.695/1.867 m
Initial alpha functions 0 (in both planes)
Energy spread (uncorrelated)
1.0×10⁻⁴
Microbunching gain spectra Gf(s) from Eq. (8) for
different combinations of impedance models are demonstrated in Fig. 7 where we found the microbunching gains with λ ≈ 350 μm reach the maximal. Unlike Example 1 and 2, LSC shows a detrimental effect on MEIC CCR, due to (relatively) low beam energy and high bunch charge. Figure 8 shows the gain evolution G(s) along the ring, where we can see the microbunching gain starts to build up at the second arc (“10-o’clock arc”), continually develop at the third arc, and eventually increase to a huge level when the beam is sent back to the beam exchange system.
Our study indicates that the preliminary design of CCR for high-energy electron cooling is at risk of microbunching instability; an improved design is required to suppress such instability and/or alternative beam transport scheme would be considered in order to compensate and to circulate the electron beam as many turns as possible [7] while maintaining high phase space quality of the electron beam required by sufficient electron cooling efficiency.
We emphasize here that, for MEIC CCR, due to its high bunch charge (~ 2 nC) as well as low energy spread (~ 10-4), as expected, microbunching, greatly accumulates along the beamline and over a broad spectral range of density modulation.
Figure 7: Microbunching gain spectra as a function of initial modulation wavelength for MEIC CCR lattice. Note that, due to ultrahigh gain, we do not benchmark these results directly, but we do for a case with 10 times larger the transverse emittances and have confirms the validity of our simulation results [24].
Proceedings of ERL2015, Stony Brook, NY, USA TUICLH2034
WG2ERL Optics & Beam Dynamics: Collective Effects/Multi-passes/Halo Simulations
ISBN 978-3-95450-183-0
39 Cop
yrig
ht©
2015
CC
-BY-
3.0
and
byth
ere
spec
tive
auth
ors
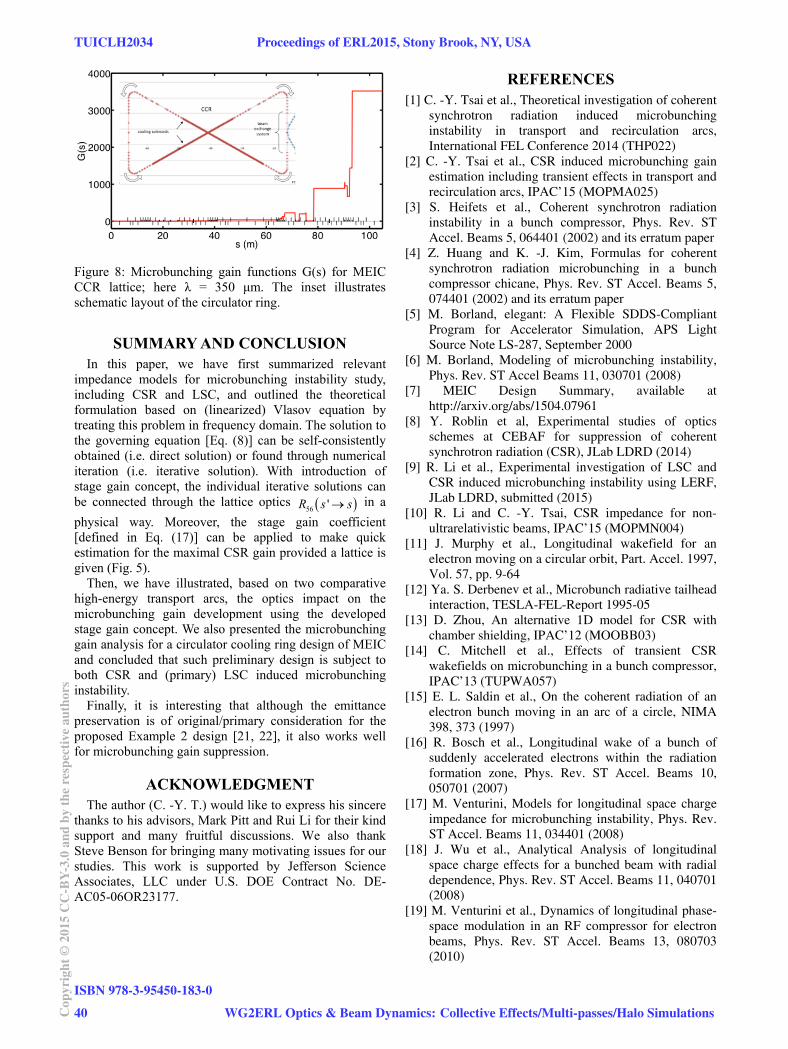
Figure 8: Microbunching gain functions G(s) for MEIC CCR lattice; here λ = 350 μm. The inset illustrates schematic layout of the circulator ring.
SUMMARY AND CONCLUSION In this paper, we have first summarized relevant
impedance models for microbunching instability study, including CSR and LSC, and outlined the theoretical formulation based on (linearized) Vlasov equation by treating this problem in frequency domain. The solution to the governing equation [Eq. (8)] can be self-consistently obtained (i.e. direct solution) or found through numerical iteration (i.e. iterative solution). With introduction of stage gain concept, the individual iterative solutions can be connected through the lattice optics R56 s ' s in a
physical way. Moreover, the stage gain coefficient [defined in Eq. (17)] can be applied to make quick estimation for the maximal CSR gain provided a lattice is given (Fig. 5).
Then, we have illustrated, based on two comparative high-energy transport arcs, the optics impact on the microbunching gain development using the developed stage gain concept. We also presented the microbunching gain analysis for a circulator cooling ring design of MEIC and concluded that such preliminary design is subject to both CSR and (primary) LSC induced microbunching instability.
Finally, it is interesting that although the emittance preservation is of original/primary consideration for the proposed Example 2 design [21, 22], it also works well for microbunching gain suppression.
ACKNOWLEDGMENT The author (C. -Y. T.) would like to express his sincere
thanks to his advisors, Mark Pitt and Rui Li for their kind support and many fruitful discussions. We also thank Steve Benson for bringing many motivating issues for our studies. This work is supported by Jefferson Science Associates, LLC under U.S. DOE Contract No. DE-AC05-06OR23177.
REFERENCES [1] C. -Y. Tsai et al., Theoretical investigation of coherent
synchrotron radiation induced microbunching instability in transport and recirculation arcs, International FEL Conference 2014 (THP022)
[2] C. -Y. Tsai et al., CSR induced microbunching gain estimation including transient effects in transport and recirculation arcs, IPAC’15 (MOPMA025)
[3] S. Heifets et al., Coherent synchrotron radiation instability in a bunch compressor, Phys. Rev. ST Accel. Beams 5, 064401 (2002) and its erratum paper
[4] Z. Huang and K. -J. Kim, Formulas for coherent synchrotron radiation microbunching in a bunch compressor chicane, Phys. Rev. ST Accel. Beams 5, 074401 (2002) and its erratum paper
[5] M. Borland, elegant: A Flexible SDDS-Compliant Program for Accelerator Simulation, APS Light Source Note LS-287, September 2000
[6] M. Borland, Modeling of microbunching instability, Phys. Rev. ST Accel Beams 11, 030701 (2008)
[7] MEIC Design Summary, available at http://arxiv.org/abs/1504.07961
[8] Y. Roblin et al, Experimental studies of optics schemes at CEBAF for suppression of coherent synchrotron radiation (CSR), JLab LDRD (2014)
[9] R. Li et al., Experimental investigation of LSC and CSR induced microbunching instability using LERF, JLab LDRD, submitted (2015)
[10] R. Li and C. -Y. Tsai, CSR impedance for non-ultrarelativistic beams, IPAC’15 (MOPMN004)
[11] J. Murphy et al., Longitudinal wakefield for an electron moving on a circular orbit, Part. Accel. 1997, Vol. 57, pp. 9-64
[12] Ya. S. Derbenev et al., Microbunch radiative tailhead interaction, TESLA-FEL-Report 1995-05
[13] D. Zhou, An alternative 1D model for CSR with chamber shielding, IPAC’12 (MOOBB03)
[14] C. Mitchell et al., Effects of transient CSR wakefields on microbunching in a bunch compressor, IPAC’13 (TUPWA057)
[15] E. L. Saldin et al., On the coherent radiation of an electron bunch moving in an arc of a circle, NIMA 398, 373 (1997)
[16] R. Bosch et al., Longitudinal wake of a bunch of suddenly accelerated electrons within the radiation formation zone, Phys. Rev. ST Accel. Beams 10, 050701 (2007)
[17] M. Venturini, Models for longitudinal space charge impedance for microbunching instability, Phys. Rev. ST Accel. Beams 11, 034401 (2008)
[18] J. Wu et al., Analytical Analysis of longitudinal space charge effects for a bunched beam with radial dependence, Phys. Rev. ST Accel. Beams 11, 040701 (2008)
[19] M. Venturini et al., Dynamics of longitudinal phase-space modulation in an RF compressor for electron beams, Phys. Rev. ST Accel. Beams 13, 080703 (2010)
TUICLH2034 Proceedings of ERL2015, Stony Brook, NY, USA
ISBN 978-3-95450-183-0
40Cop
yrig
ht©
2015
CC
-BY-
3.0
and
byth
ere
spec
tive
auth
ors
WG2ERL Optics & Beam Dynamics: Collective Effects/Multi-passes/Halo Simulations
[20] R. Warnock, private communication (2014) [21] D. R. Douglas et al., Control of coherent synchrotron
radiation and microbunching effects during transport of high brightness electron beams, arXiv: 1403.2318v1 [physics.acc-ph]
[22] D. R. Douglas et al., Control of synchrotron radiation effects during recirculation, IPAC’15 (TUPMA038)
[23] C.-Y. Tsai and R. Li, Simulation of coherent synchrotron radiation induced microbunching gain using ELEGANT, JLAB-TN-14-016
[24] C. -Y. Tsai et al., (to be published) [25] Numerical tracking simulation confirms that such
artificial removal of solenoid sections does not affect CSR-induced microbunching gains; however, we believe LSC can have an additional effect due to such long cooling sections.
Proceedings of ERL2015, Stony Brook, NY, USA TUICLH2034
WG2ERL Optics & Beam Dynamics: Collective Effects/Multi-passes/Halo Simulations
ISBN 978-3-95450-183-0
41 Cop
yrig
ht©
2015
CC
-BY-
3.0
and
byth
ere
spec
tive
auth
ors

FIRST BEAM CHARACTERIZATION OF SRF GUN II WITH A COPPER PHOTOCATHODE
J. Teichert#, A. Arnold, P. Michel, P. Murcek, R. Xiang, HZDR, Dresden, GermanyP. Lu, H. Vennekate, TU Dresden & HZDR, Dresden, Germany
Abstract An improved SRF gun (ELBE SRF Gun II) has been
installed and commissioned at HZDR. This new gun replaces the first SRF gun at the superconducting linear accelerator ELBE which had been in operation since 2007. The new SRF gun II has an improved 3.5-cell niobium cavity and a superconducting solenoid is integrated into the gun cryostat. The first beam test has been carried out with a Cu photocathode. Using the standard high repetition rate laser system, this delivers low bunch charges of a few pC only. The beam parameters for this low charge beam have been measured, and the first beam has been guided into the ELBE accelerator.
INTRODUCTION A high-brightness electron source is one of the key
elements of an energy recovery linac (ERL) as it has been proposed for future light sources, or other application in high energy particle physics. Since ERLs are usually designed for high current and continuous wave (CW) operation, their electron sources require both properties: low emittance and high average current. At present, there are three electron source types in operation at ERLs or their application is planned: electron sources with a static high voltage (DC guns), normal conducting radio frequency (RF) electron sources, and superconducting RF electron sources (SRF guns). All three types are photoelectron injectors utilizing powerful lasers and photo cathodes for electron beam generation. DC guns present the most developed technology and have demonstrated high repetition rate and high average current operation at several CW accelerators. The DC gun of the Cornell injector holds the world record in CW current and in transverse emittance [1, 2], and recently the specifications for CLRS could be successfully demonstrated [3]. SRF guns are still in the development phase but they offer the potential of significant higher acceleration fields and should therefore be able to deliver smaller emittances for high bunch charges [4].
THE ELBE SRF GUN II In May 2014 the second SRF gun (ELBE SRF Gun II)
was installed at the ELBE superconducting linear accelerator facility. The basic design of this new gun is similar to that of the former SRF Gun I [5], but it has a new 3.5-cell cavity made of fine grain niobium. Beside several smaller modifications, the new cavity has a different acceleration field distribution, i.e. a peak field ratio of 80% to 100% between half-cell and TESLA cells.
Figure 1: CAD view of the SRF Gun II cryomodule.
Benefit from a higher gradient, beam dynamic simulation showed reduced emittance and bunch length.
The design of the new cryomodule for SRF gun II is shown in Fig. 1. The 1.3 GHz Nb cavity consists of three TESLA cells and a specially designed half-cell. Another superconducting cell, called choke filter, prevents the leakage of the RF field towards the cathode support system. A normal conducting (NC) photocathode is installed in this system, which is isolated from the cavity by a vacuum gap and cooled with liquid nitrogen.
A new feature is the integration of a superconducting
(SC) solenoid in the cryomodule for emittance
preservation purposes. Compared to the NC solenoid of SRF gun I which was placed downstream of the gun, the new design is much more compact and the distance to the cathode is smaller. The SC solenoid is placed on a remote-controlled x-y table to align its center to the electron beam axis. The cryogenic design of the assembly is sophisticated: The solenoid is cooled with 2 K He by means of a bypass from the cavity. The in-vacuum step motors and translation tables are on 77 K to reduce the heat load to the liquid He bath. Additional μ-metal shields keep the solenoid remanence field and the step motors fields on a 1 μT level near the cavity. Details of the SC solenoid design and testing are published in ref. [6].
Compared to the primary setup of SRF Gun I described in [5] there are several modification in the RF system of the gun. Now the RF main power with a frequency of 1.3 GHz is delivered by a solid state amplifier with a CW power of 10 kW [7]. The previous plastics (Rexolite) warm window is replaced by a fused silica window with higher thermal stability. A three stub tuner in the wave guide allows a variation of the band width. The analog low-level RF control system und the coaxial ELBE main power coupler with fixed coupling are still in use. ___________________________________________
TUIDLH1038 Proceedings of ERL2015, Stony Brook, NY, USA
ISBN 978-3-95450-183-0
42Cop
yrig
ht©
2015
CC
-BY-
3.0
and
byth
ere
spec
tive
auth
ors
WG1 ERL Injectors (Gun/Cathode/Laser)
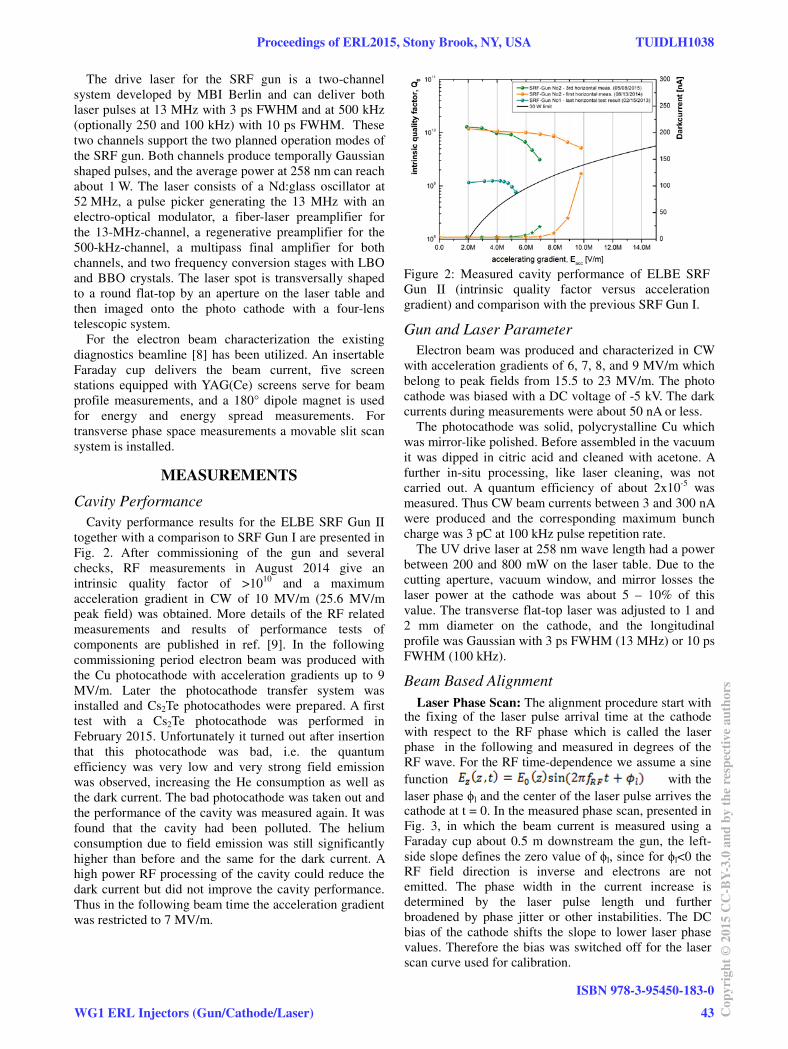
The drive laser for the SRF gun is a two-channel system developed by MBI Berlin and can deliver both laser pulses at 13 MHz with 3 ps FWHM and at 500 kHz (optionally 250 and 100 kHz) with 10 ps FWHM. These two channels support the two planned operation modes of the SRF gun. Both channels produce temporally Gaussian shaped pulses, and the average power at 258 nm can reach about 1 W. The laser consists of a Nd:glass oscillator at 52 MHz, a pulse picker generating the 13 MHz with an electro-optical modulator, a fiber-laser preamplifier for the 13-MHz-channel, a regenerative preamplifier for the 500-kHz-channel, a multipass final amplifier for both channels, and two frequency conversion stages with LBO and BBO crystals. The laser spot is transversally shaped to a round flat-top by an aperture on the laser table and then imaged onto the photo cathode with a four-lens telescopic system.
For the electron beam characterization the existing diagnostics beamline [8] has been utilized. An insertable Faraday cup delivers the beam current, five screen stations equipped with YAG(Ce) screens serve for beam profile measurements, and a 180° dipole magnet is used for energy and energy spread measurements. For transverse phase space measurements a movable slit scan system is installed.
MEASUREMENTS
Cavity Performance Cavity performance results for the ELBE SRF Gun II
together with a comparison to SRF Gun I are presented in Fig. 2. After commissioning of the gun and several checks, RF measurements in August 2014 give an intrinsic quality factor of >1010 and a maximum acceleration gradient in CW of 10 MV/m (25.6 MV/m peak field) was obtained. More details of the RF related measurements and results of performance tests of components are published in ref. [9]. In the following commissioning period electron beam was produced with the Cu photocathode with acceleration gradients up to 9 MV/m. Later the photocathode transfer system was installed and Cs2Te photocathodes were prepared. A first test with a Cs2Te photocathode was performed in February 2015. Unfortunately it turned out after insertion that this photocathode was bad, i.e. the quantum efficiency was very low and very strong field emission was observed, increasing the He consumption as well as the dark current. The bad photocathode was taken out and the performance of the cavity was measured again. It was found that the cavity had been polluted. The helium consumption due to field emission was still significantly higher than before and the same for the dark current. A high power RF processing of the cavity could reduce the dark current but did not improve the cavity performance. Thus in the following beam time the acceleration gradient was restricted to 7 MV/m.
Figure 2: Measured cavity performance of ELBE SRF Gun II (intrinsic quality factor versus acceleration gradient) and comparison with the previous SRF Gun I.
Gun and Laser Parameter Electron beam was produced and characterized in CW
with acceleration gradients of 6, 7, 8, and 9 MV/m which belong to peak fields from 15.5 to 23 MV/m. The photo cathode was biased with a DC voltage of -5 kV. The dark currents during measurements were about 50 nA or less.
The photocathode was solid, polycrystalline Cu which was mirror-like polished. Before assembled in the vacuum it was dipped in citric acid and cleaned with acetone. A further in-situ processing, like laser cleaning, was not carried out. A quantum efficiency of about 2x10⁻⁵ was measured. Thus CW beam currents between 3 and 300 nA were produced and the corresponding maximum bunch charge was 3 pC at 100 kHz pulse repetition rate.
The UV drive laser at 258 nm wave length had a power between 200 and 800 mW on the laser table. Due to the cutting aperture, vacuum window, and mirror losses the laser power at the cathode was about 5 – 10% of this value. The transverse flat-top laser was adjusted to 1 and 2 mm diameter on the cathode, and the longitudinal profile was Gaussian with 3 ps FWHM (13 MHz) or 10 ps FWHM (100 kHz).
Beam Based Alignment Laser hase can: The alignment procedure start with
the fixing of the laser pulse arrival time at the cathode with respect to the RF phase which is called the laser phase in the following and measured in degrees of the RF wave. For the RF time-dependence we assume a sine function with the
l and the center of the laser pulse arrives thecathode at t = 0. In the measured phase scan, presented in Fig. 3, in which the beam current is measured using a Faraday cup about 0.5 m downstream the gun, the left-
l l<0 theRF field direction is inverse and electrons are not emitted. The phase width in the current increase is determined by the laser pulse length und further broadened by phase jitter or other instabilities. The DC bias of the cathode shifts the slope to lower laser phase values. Therefore the bias was switched off for the laser scan curve used for calibration.
Proceedings of ERL2015, Stony Brook, NY, USA TUIDLH1038
WG1 ERL Injectors (Gun/Cathode/Laser)
ISBN 978-3-95450-183-0
43 Cop
yrig
ht©
2015
CC
-BY-
3.0
and
byth
ere
spec
tive
auth
ors
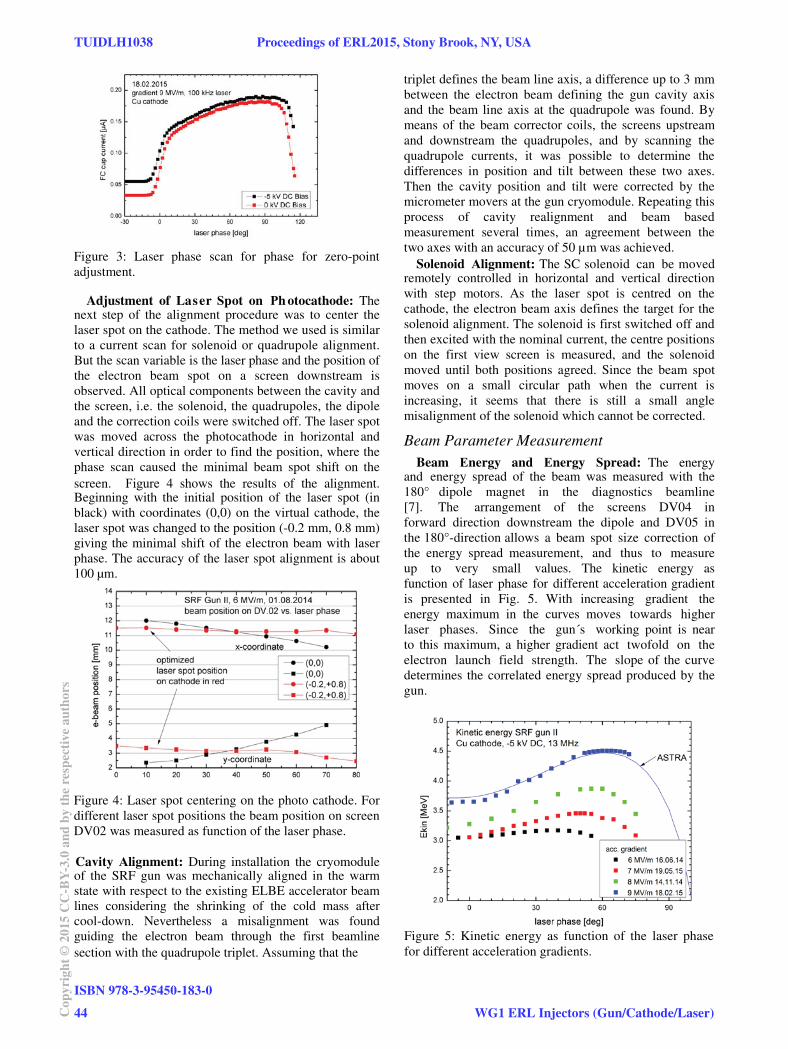
Figure 3: Laser phase scan for phase for zero-point adjustment.
Adjustment of a ser p ot on h otocathode: The next step of the alignment procedure was to center the laser spot on the cathode. The method we used is similar to a current scan for solenoid or quadrupole alignment. But the scan variable is the laser phase and the position of the electron beam spot on a screen downstream is observed. All optical components between the cavity and the screen, i.e. the solenoid, the quadrupoles, the dipole and the correction coils were switched off. The laser spot was moved across the photocathode in horizontal and vertical direction in order to find the position, where the phase scan caused the minimal beam spot shift on the screen. Figure 4 shows the results of the alignment. Beginning with the initial position of the laser spot (in black) with coordinates (0,0) on the virtual cathode, the laser spot was changed to the position (-0.2 mm, 0.8 mm) giving the minimal shift of the electron beam with laser phase. The accuracy of the laser spot alignment is about 100 μm.
Figure 4: Laser spot centering on the photo cathode. For different laser spot positions the beam position on screen DV02 was measured as function of the laser phase.
Cavity lignment: During installation the cryomodule of the SRF gun was mechanically aligned in the warm state with respect to the existing ELBE accelerator beam lines considering the shrinking of the cold mass after cool-down. Nevertheless a misalignment was found guiding the electron beam through the first beamline section with the quadrupole triplet. Assuming that the
triplet defines the beam line axis, a difference up to 3 mm between the electron beam defining the gun cavity axis and the beam line axis at the quadrupole was found. By means of the beam corrector coils, the screens upstream and downstream the quadrupoles, and by scanning the quadrupole currents, it was possible to determine the differences in position and tilt between these two axes. Then the cavity position and tilt were corrected by the micrometer movers at the gun cryomodule. Repeating this process of cavity realignment and beam based measurement several times, an agreement between the two axes with an accuracy of 50 μm was achieved.
Solenoid lignment: The SC solenoid can be movedremotely controlled in horizontal and vertical direction with step motors. As the laser spot is centred on the cathode, the electron beam axis defines the target for the solenoid alignment. The solenoid is first switched off and then excited with the nominal current, the centre positions on the first view screen is measured, and the solenoid moved until both positions agreed. Since the beam spot moves on a small circular path when the current is increasing, it seems that there is still a small angle misalignment of the solenoid which cannot be corrected.
Beam Parameter Measurement Beam nergy and nergy pread: The energy
and energy spread of the beam was measured with the 180° dipole magnet in the diagnostics beamline [7]. The arrangement of the screens DV04 in forward direction downstream the dipole and DV05 in the 180°-direction allows a beam spot size correction of the energy spread measurement, and thus to measure up to very small values. The kinetic energy as function of laser phase for different acceleration gradient is presented in Fig. 5. With increasing gradient the energy maximum in the curves moves towards higher laser phases. Since the gun´s working point is near to this maximum, a higher gradient act twofold on the electron launch field strength. The slope of the curve determines the correlated energy spread produced by the gun.
Figure 5: Kinetic energy as function of the laser phase for different acceleration gradients.
TUIDLH1038 Proceedings of ERL2015, Stony Brook, NY, USA
ISBN 978-3-95450-183-0
44Cop
yrig
ht©
2015
CC
-BY-
3.0
and
byth
ere
spec
tive
auth
ors
WG1 ERL Injectors (Gun/Cathode/Laser)
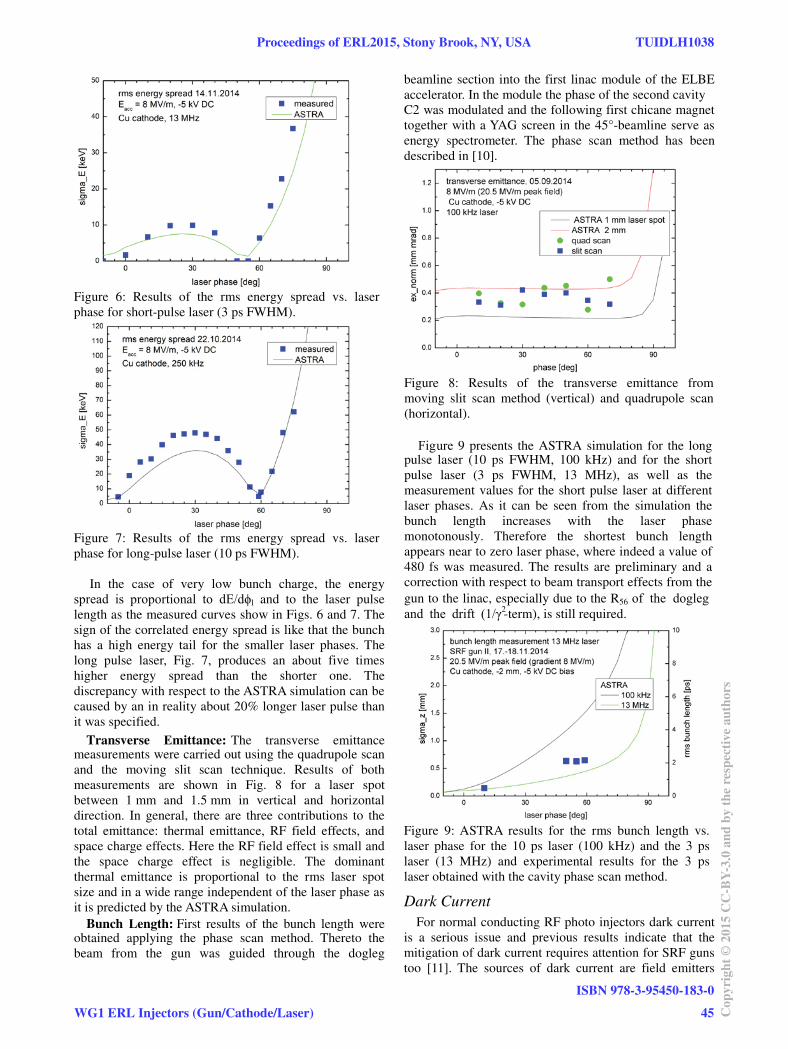
Figure 6: Results of the rms energy spread vs. laser phase for short-pulse laser (3 ps FWHM).
Figure 7: Results of the rms energy spread vs. laser phase for long-pulse laser (10 ps FWHM).
In the case of very low bunch charge, the energy l and to the laser pulse
length as the measured curves show in Figs. 6 and 7. The sign of the correlated energy spread is like that the bunch has a high energy tail for the smaller laser phases. The long pulse laser, Fig. 7, produces an about five times higher energy spread than the shorter one. The discrepancy with respect to the ASTRA simulation can be caused by an in reality about 20% longer laser pulse than it was specified.
Transverse mittance: The transverse emittancemeasurements were carried out using the quadrupole scan and the moving slit scan technique. Results of both measurements are shown in Fig. 8 for a laser spot between 1 mm and 1.5 mm in vertical and horizontal direction. In general, there are three contributions to the total emittance: thermal emittance, RF field effects, and space charge effects. Here the RF field effect is small and the space charge effect is negligible. The dominant thermal emittance is proportional to the rms laser spot size and in a wide range independent of the laser phase as it is predicted by the ASTRA simulation.
Bunch ength: First results of the bunch length wereobtained applying the phase scan method. Thereto the beam from the gun was guided through the dogleg
beamline section into the first linac module of the ELBE accelerator. In the module the phase of the second cavity C2 was modulated and the following first chicane magnet together with a YAG screen in the 45°-beamline serve as energy spectrometer. The phase scan method has been described in [10].
Figure 8: Results of the transverse emittance from moving slit scan method (vertical) and quadrupole scan (horizontal).
Figure 9 presents the ASTRA simulation for the long pulse laser (10 ps FWHM, 100 kHz) and for the short pulse laser (3 ps FWHM, 13 MHz), as well as the measurement values for the short pulse laser at different laser phases. As it can be seen from the simulation the bunch length increases with the laser phase monotonously. Therefore the shortest bunch length appears near to zero laser phase, where indeed a value of 480 fs was measured. The results are preliminary and a correction with respect to beam transport effects from the gun to the linac, especially due to the R56
2-term), is still required.
Figure 9: ASTRA results for the rms bunch length vs. laser phase for the 10 ps laser (100 kHz) and the 3 ps laser (13 MHz) and experimental results for the 3 ps laser obtained with the cavity phase scan method.
Dark Current For normal conducting RF photo injectors dark current
is a serious issue and previous results indicate that the mitigation of dark current requires attention for SRF guns too [11]. The sources of dark current are field emitters
Proceedings of ERL2015, Stony Brook, NY, USA TUIDLH1038
WG1 ERL Injectors (Gun/Cathode/Laser)
ISBN 978-3-95450-183-0
45 Cop
yrig
ht©
2015
CC
-BY-
3.0
and
byth
ere
spec
tive
auth
ors
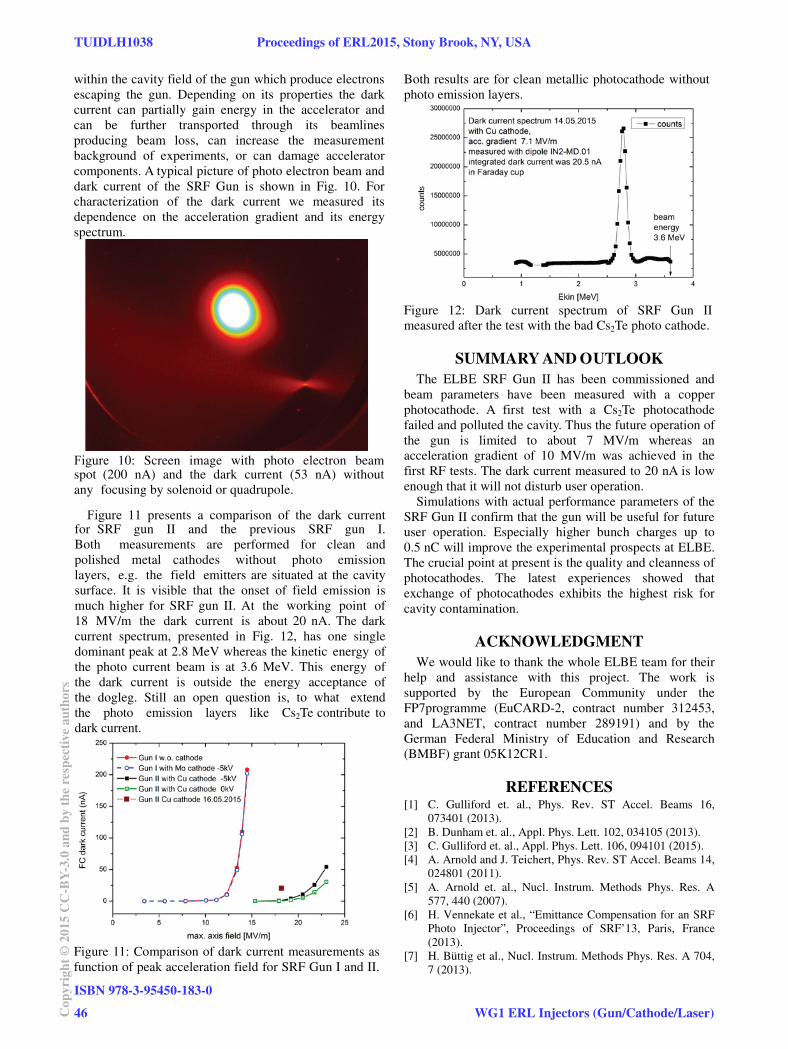
within the cavity field of the gun which produce electrons escaping the gun. Depending on its properties the dark current can partially gain energy in the accelerator and can be further transported through its beamlines producing beam loss, can increase the measurement background of experiments, or can damage accelerator components. A typical picture of photo electron beam and dark current of the SRF Gun is shown in Fig. 10. For characterization of the dark current we measured its dependence on the acceleration gradient and its energy spectrum.
Figure 10: Screen image with photo electron beam spot (200 nA) and the dark current (53 nA) without any focusing by solenoid or quadrupole.
Figure 11 presents a comparison of the dark current for SRF gun II and the previous SRF gun I. Both measurements are performed for clean and polished metal cathodes without photo emission layers, e.g. the field emitters are situated at the cavity surface. It is visible that the onset of field emission is much higher for SRF gun II. At the working point of 18 MV/m the dark current is about 20 nA. The dark current spectrum, presented in Fig. 12, has one single dominant peak at 2.8 MeV whereas the kinetic energy of the photo current beam is at 3.6 MeV. This energy of the dark current is outside the energy acceptance of the dogleg. Still an open question is, to what extend the photo emission layers like Cs2Te contribute to dark current.
Figure 11: Comparison of dark current measurements as function of peak acceleration field for SRF Gun I and II.
Both results are for clean metallic photocathode without photo emission layers.
Figure 12: Dark current spectrum of SRF Gun II measured after the test with the bad Cs2Te photo cathode.
SUMMARY AND OUTLOOK The ELBE SRF Gun II has been commissioned and
beam parameters have been measured with a copper photocathode. A first test with a Cs2Te photocathode failed and polluted the cavity. Thus the future operation of the gun is limited to about 7 MV/m whereas an acceleration gradient of 10 MV/m was achieved in the first RF tests. The dark current measured to 20 nA is low enough that it will not disturb user operation.
Simulations with actual performance parameters of the SRF Gun II confirm that the gun will be useful for future user operation. Especially higher bunch charges up to 0.5 nC will improve the experimental prospects at ELBE. The crucial point at present is the quality and cleanness of photocathodes. The latest experiences showed that exchange of photocathodes exhibits the highest risk for cavity contamination.
ACKNOWLEDGMENT We would like to thank the whole ELBE team for their
help and assistance with this project. The work is supported by the European Community under the FP7programme (EuCARD-2, contract number 312453, and LA3NET, contract number 289191) and by the German Federal Ministry of Education and Research (BMBF) grant 05K12CR1.
REFERENCES [1] C. Gulliford et. al., Phys. Rev. ST Accel. Beams 16,
073401 (2013). [2] B. Dunham et. al., Appl. Phys. Lett. 102, 034105 (2013). [3] C. Gulliford et. al., Appl. Phys. Lett. 106, 094101 (2015). [4] A. Arnold and J. Teichert, Phys. Rev. ST Accel. Beams 14,
024801 (2011). [5] A. Arnold et. al., Nucl. Instrum. Methods Phys. Res. A
577, 440 (2007). [6] H. Vennekate et al., “Emittance Compensation for an SRF
Photo Injector”, Proceedings of SRF’13, Paris, France (2013).
[7] H. Büttig et al., Nucl. Instrum. Methods Phys. Res. A 704, 7 (2013).
TUIDLH1038 Proceedings of ERL2015, Stony Brook, NY, USA
ISBN 978-3-95450-183-0
46Cop
yrig
ht©
2015
CC
-BY-
3.0
and
byth
ere
spec
tive
auth
ors
WG1 ERL Injectors (Gun/Cathode/Laser)
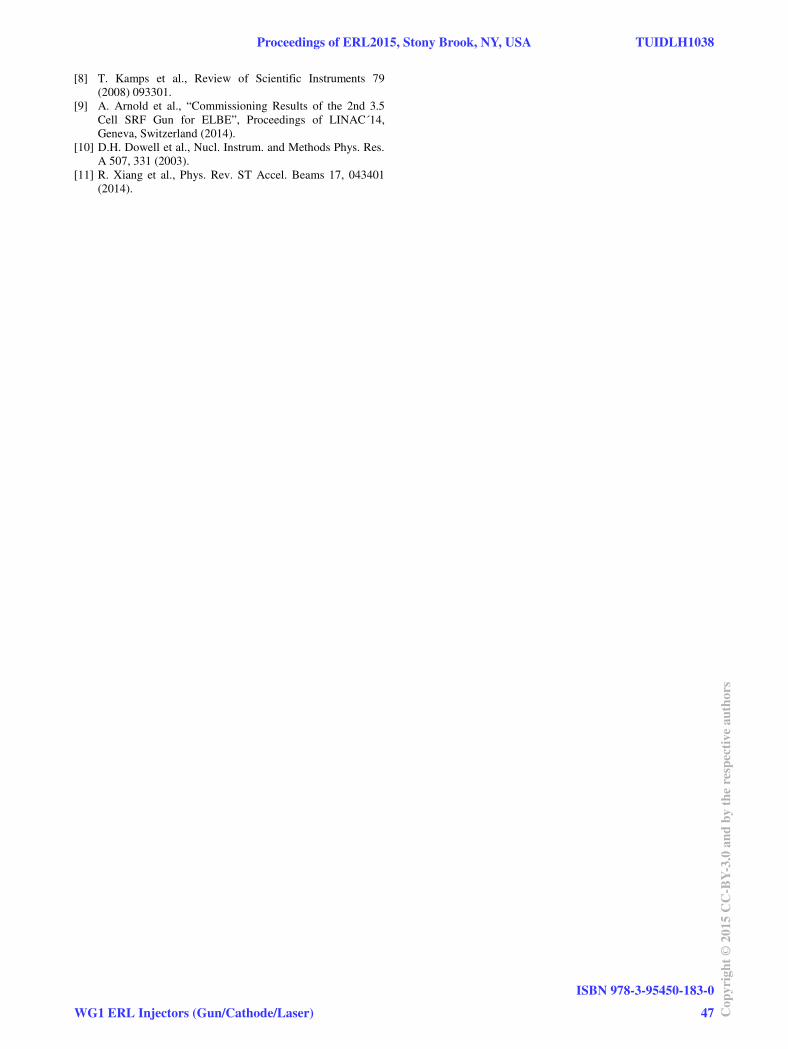
[8] T. Kamps et al., Review of Scientific Instruments 79 (2008) 093301.
[9] A. Arnold et al., “Commissioning Results of the 2nd 3.5 Cell SRF Gun for ELBE”, Proceedings of LINAC´14, Geneva, Switzerland (2014).
[10] D.H. Dowell et al., Nucl. Instrum. and Methods Phys. Res. A 507, 331 (2003).
[11] R. Xiang et al., Phys. Rev. ST Accel. Beams 17, 043401 (2014).
Proceedings of ERL2015, Stony Brook, NY, USA TUIDLH1038
WG1 ERL Injectors (Gun/Cathode/Laser)
ISBN 978-3-95450-183-0
47 Cop
yrig
ht©
2015
CC
-BY-
3.0
and
byth
ere
spec
tive
auth
ors
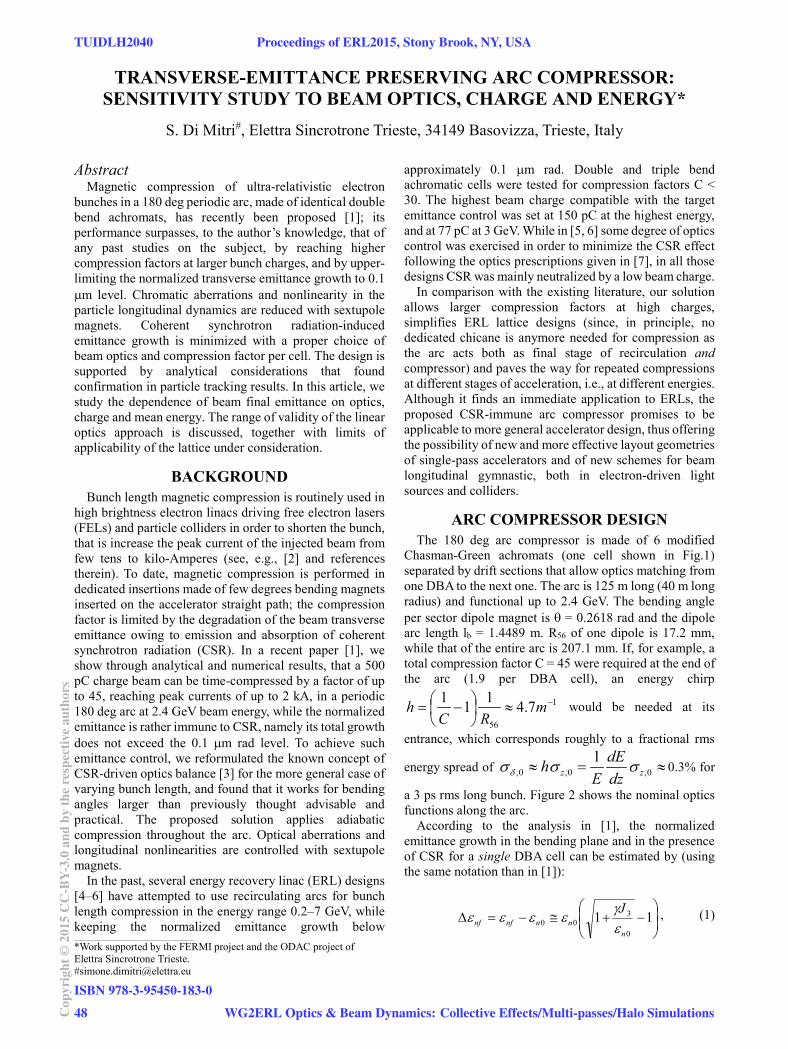
TRANSVERSE-EMITTANCE PRESERVING ARC COMPRESSOR: SENSITIVITY STUDY TO BEAM OPTICS, CHARGE AND ENERGY*
S. Di Mitri#, Elettra Sincrotrone Trieste, 34149 Basovizza, Trieste, Italy
Abstract Magnetic compression of ultra-relativistic electron
bunches in a 180 deg periodic arc, made of identical double bend achromats, has recently been proposed [1]; its performance surpasses, to the author’s knowledge, that of any past studies on the subject, by reaching higher compression factors at larger bunch charges, and by upper-limiting the normalized transverse emittance growth to 0.1
m level. Chromatic aberrations and nonlinearity in the particle longitudinal dynamics are reduced with sextupole magnets. Coherent synchrotron radiation-induced emittance growth is minimized with a proper choice of beam optics and compression factor per cell. The design is supported by analytical considerations that found confirmation in particle tracking results. In this article, we study the dependence of beam final emittance on optics, charge and mean energy. The range of validity of the linear optics approach is discussed, together with limits of applicability of the lattice under consideration.
BACKGROUND Bunch length magnetic compression is routinely used in
high brightness electron linacs driving free electron lasers (FELs) and particle colliders in order to shorten the bunch, that is increase the peak current of the injected beam from few tens to kilo-Amperes (see, e.g., [2] and references therein). To date, magnetic compression is performed in dedicated insertions made of few degrees bending magnets inserted on the accelerator straight path; the compression factor is limited by the degradation of the beam transverse emittance owing to emission and absorption of coherent synchrotron radiation (CSR). In a recent paper [1], we show through analytical and numerical results, that a 500 pC charge beam can be time-compressed by a factor of up to 45, reaching peak currents of up to 2 kA, in a periodic 180 deg arc at 2.4 GeV beam energy, while the normalized emittance is rather immune to CSR, namely its total growth does not exceed the 0.1 m rad level. To achieve such emittance control, we reformulated the known concept of CSR-driven optics balance [3] for the more general case of varying bunch length, and found that it works for bending angles larger than previously thought advisable and practical. The proposed solution applies adiabatic compression throughout the arc. Optical aberrations and longitudinal nonlinearities are controlled with sextupole magnets.
In the past, several energy recovery linac (ERL) designs [4–6] have attempted to use recirculating arcs for bunch length compression in the energy range 0.2–7 GeV, while keeping the normalized emittance growth below
approximately 0.1 m rad. Double and triple bend achromatic cells were tested for compression factors C < 30. The highest beam charge compatible with the target emittance control was set at 150 pC at the highest energy, and at 77 pC at 3 GeV. While in [5, 6] some degree of optics control was exercised in order to minimize the CSR effect following the optics prescriptions given in [7], in all those designs CSR was mainly neutralized by a low beam charge.
In comparison with the existing literature, our solution allows larger compression factors at high charges, simplifies ERL lattice designs (since, in principle, no dedicated chicane is anymore needed for compression as the arc acts both as final stage of recirculation and compressor) and paves the way for repeated compressions at different stages of acceleration, i.e., at different energies. Although it finds an immediate application to ERLs, the proposed CSR-immune arc compressor promises to be applicable to more general accelerator design, thus offering the possibility of new and more effective layout geometries of single-pass accelerators and of new schemes for beam longitudinal gymnastic, both in electron-driven light sources and colliders.
ARC COMPRESSOR DESIGN The 180 deg arc compressor is made of 6 modified
Chasman-Green achromats (one cell shown in Fig.1) separated by drift sections that allow optics matching from one DBA to the next one. The arc is 125 m long (40 m long radius) and functional up to 2.4 GeV. The bending angle per sector dipole magnet is = 0.2618 rad and the dipole arc length lb = 1.4489 m. R56 of one dipole is 17.2 mm, while that of the entire arc is 207.1 mm. If, for example, a total compression factor C = 45 were required at the end of the arc (1.9 per DBA cell), an energy chirp
1
56
7.4111 mRC
h would be needed at its
entrance, which corresponds roughly to a fractional rms
energy spread of 0,0,0,1
zz dzdE
Eh 0.3% for
a 3 ps rms long bunch. Figure 2 shows the nominal optics functions along the arc.
According to the analysis in [1], the normalized emittance growth in the bending plane and in the presence of CSR for a single DBA cell can be estimated by (using the same notation than in [1]):
110
300
nnnnfnf
J , (1)
____________________________________________
*Work supported by the FERMI project and the ODAC project of Elettra Sincrotrone Trieste. #[email protected]
TUIDLH2040 Proceedings of ERL2015, Stony Brook, NY, USA
ISBN 978-3-95450-183-0
48Cop
yrig
ht©
2015
CC
-BY-
3.0
and
byth
ere
spec
tive
auth
ors
WG2ERL Optics & Beam Dynamics: Collective Effects/Multi-passes/Halo Simulations
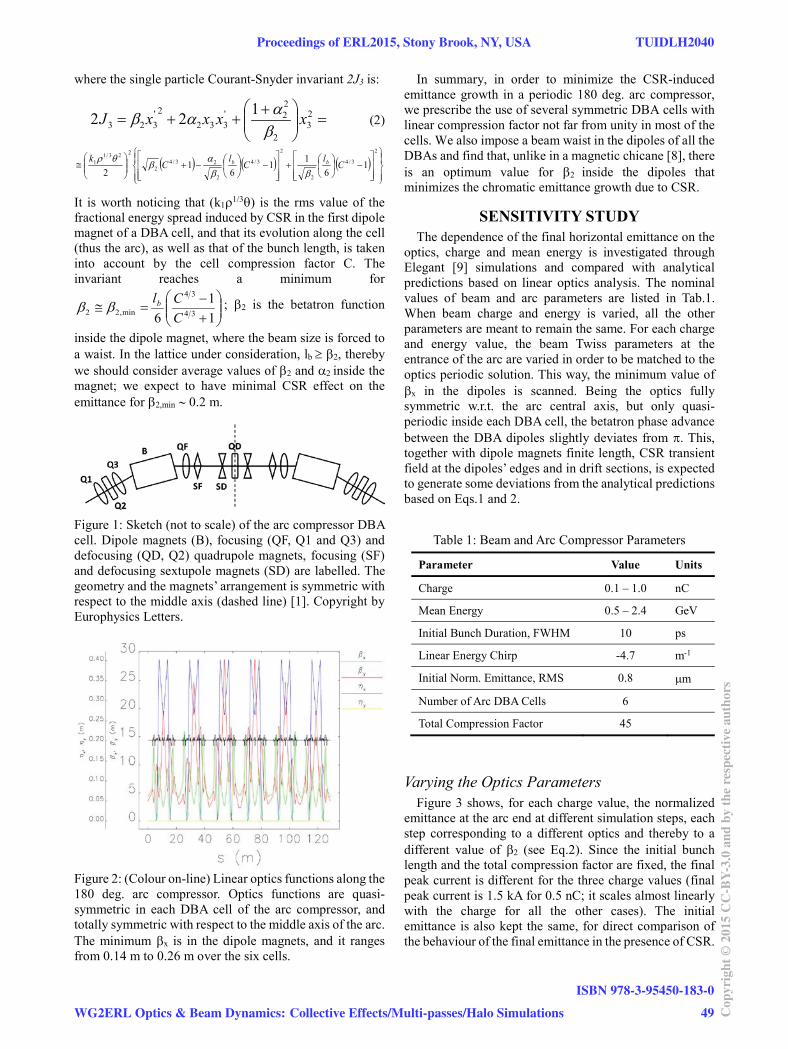
where the single particle Courant-Snyder invariant 2J3 is:
23
2
22'
3322'
323122 xxxxJ (2)
2
3/4
2
2
3/4
2
23/42
223/11 1
611
61
2ClClCk bb
It is worth noticing that (k11/3 ) is the rms value of the
fractional energy spread induced by CSR in the first dipole magnet of a DBA cell, and that its evolution along the cell (thus the arc), as well as that of the bunch length, is taken into account by the cell compression factor C. The invariant reaches a minimum for
11
6 34
34
min,22 CClb ; 2 is the betatron function
inside the dipole magnet, where the beam size is forced to a waist. In the lattice under consideration, lb 2, thereby we should consider average values of 2 and 2 inside the magnet; we expect to have minimal CSR effect on the emittance for 2,min 0.2 m.
Figure 1: Sketch (not to scale) of the arc compressor DBA cell. Dipole magnets (B), focusing (QF, Q1 and Q3) and defocusing (QD, Q2) quadrupole magnets, focusing (SF) and defocusing sextupole magnets (SD) are labelled. The geometry and the magnets’ arrangement is symmetric with respect to the middle axis (dashed line) [1]. Copyright by Europhysics Letters.
Figure 2: (Colour on-line) Linear optics functions along the 180 deg. arc compressor. Optics functions are quasi-symmetric in each DBA cell of the arc compressor, and totally symmetric with respect to the middle axis of the arc. The minimum x is in the dipole magnets, and it ranges from 0.14 m to 0.26 m over the six cells.
In summary, in order to minimize the CSR-induced emittance growth in a periodic 180 deg. arc compressor, we prescribe the use of several symmetric DBA cells with linear compression factor not far from unity in most of the cells. We also impose a beam waist in the dipoles of all the DBAs and find that, unlike in a magnetic chicane [8], there is an optimum value for 2 inside the dipoles that minimizes the chromatic emittance growth due to CSR.
SENSITIVITY STUDY The dependence of the final horizontal emittance on the
optics, charge and mean energy is investigated through Elegant [9] simulations and compared with analytical predictions based on linear optics analysis. The nominal values of beam and arc parameters are listed in Tab.1. When beam charge and energy is varied, all the other parameters are meant to remain the same. For each charge and energy value, the beam Twiss parameters at the entrance of the arc are varied in order to be matched to the optics periodic solution. This way, the minimum value of
x in the dipoles is scanned. Being the optics fully symmetric w.r.t. the arc central axis, but only quasi-periodic inside each DBA cell, the betatron phase advance between the DBA dipoles slightly deviates from . This, together with dipole magnets finite length, CSR transient field at the dipoles’ edges and in drift sections, is expected to generate some deviations from the analytical predictions based on Eqs.1 and 2.
Table 1: Beam and Arc Compressor Parameters
Parameter Value Units
Charge 0.1 – 1.0 nC
Mean Energy 0.5 – 2.4 GeV
Initial Bunch Duration, FWHM 10 ps
Linear Energy Chirp -4.7 m-1
Initial Norm. Emittance, RMS 0.8 m
Number of Arc DBA Cells 6
Total Compression Factor 45
Varying the Optics Parameters Figure 3 shows, for each charge value, the normalized
emittance at the arc end at different simulation steps, each step corresponding to a different optics and thereby to a different value of 2 (see Eq.2). Since the initial bunch length and the total compression factor are fixed, the final peak current is different for the three charge values (final peak current is 1.5 kA for 0.5 nC; it scales almost linearly with the charge for all the other cases). The initial emittance is also kept the same, for direct comparison of the behaviour of the final emittance in the presence of CSR.
Proceedings of ERL2015, Stony Brook, NY, USA TUIDLH2040
WG2ERL Optics & Beam Dynamics: Collective Effects/Multi-passes/Halo Simulations
ISBN 978-3-95450-183-0
49 Cop
yrig
ht©
2015
CC
-BY-
3.0
and
byth
ere
spec
tive
auth
ors
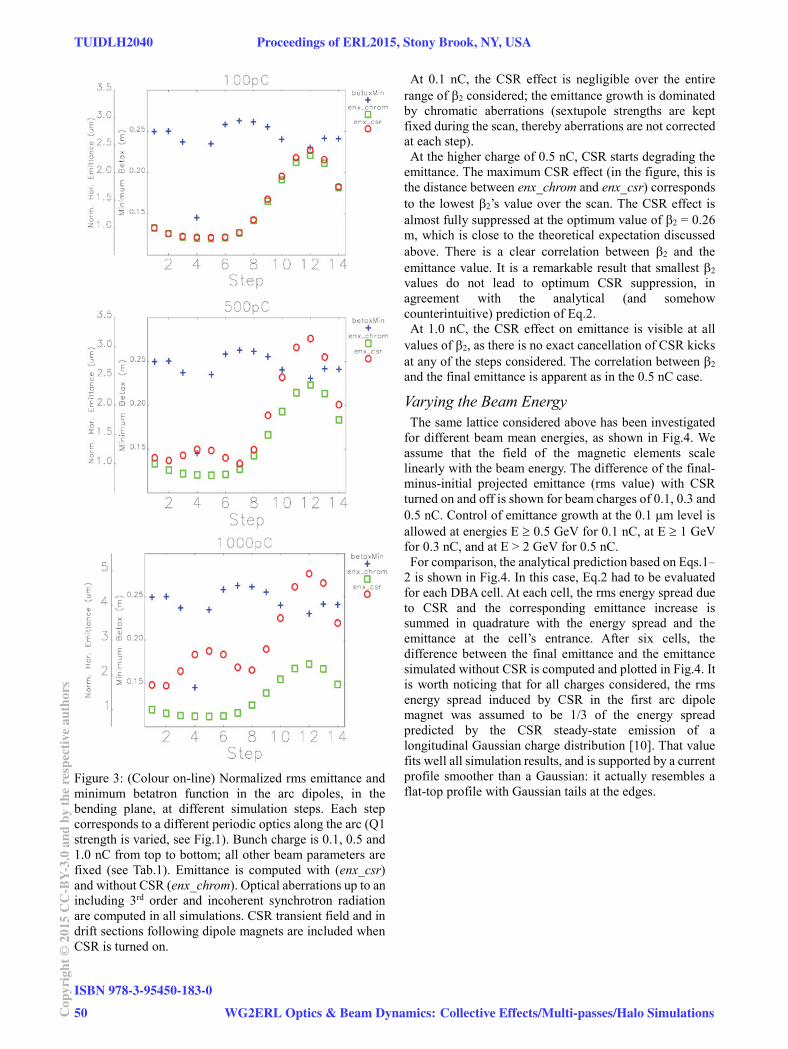
Figure 3: (Colour on-line) Normalized rms emittance andminimum betatron function in the arc dipoles, in thebending plane, at different simulation steps. Each stepcorresponds to a different periodic optics along the arc (Q1strength is varied, see Fig.1). Bunch charge is 0.1, 0.5 and1.0 nC from top to bottom; all other beam parameters arefixed (see Tab.1). Emittance is computed with (enx_csr)and without CSR (enx_chrom). Optical aberrations up to anincluding 3rd order and incoherent synchrotron radiationare computed in all simulations. CSR transient field and indrift sections following dipole magnets are included whenCSR is turned on.
At 0.1 nC, the CSR effect is negligible over the entirerange of 2 considered; the emittance growth is dominatedby chromatic aberrations (sextupole strengths are keptfixed during the scan, thereby aberrations are not correctedat each step).At the higher charge of 0.5 nC, CSR starts degrading the
emittance. The maximum CSR effect (in the figure, this isthe distance between enx_chrom and enx_csr) correspondsto the lowest 2’s value over the scan. The CSR effect isalmost fully suppressed at the optimum value of 2 = 0.26m, which is close to the theoretical expectation discussedabove. There is a clear correlation between 2 and theemittance value. It is a remarkable result that smallest 2values do not lead to optimum CSR suppression, inagreement with the analytical (and somehowcounterintuitive) prediction of Eq.2.At 1.0 nC, the CSR effect on emittance is visible at all
values of 2, as there is no exact cancellation of CSR kicksat any of the steps considered. The correlation between 2and the final emittance is apparent as in the 0.5 nC case.
Varying the Beam EnergyThe same lattice considered above has been investigated
for different beam mean energies, as shown in Fig.4. Weassume that the field of the magnetic elements scalelinearly with the beam energy. The difference of the final-minus-initial projected emittance (rms value) with CSRturned on and off is shown for beam charges of 0.1, 0.3 and0.5 nC. Control of emittance growth at the 0.1 m level isallowed at energies E 0.5 GeV for 0.1 nC, at E 1 GeVfor 0.3 nC, and at E > 2 GeV for 0.5 nC.For comparison, the analytical prediction based on Eqs.1–
2 is shown in Fig.4. In this case, Eq.2 had to be evaluatedfor each DBA cell. At each cell, the rms energy spread dueto CSR and the corresponding emittance increase issummed in quadrature with the energy spread and theemittance at the cell’s entrance. After six cells, thedifference between the final emittance and the emittancesimulated without CSR is computed and plotted in Fig.4. Itis worth noticing that for all charges considered, the rmsenergy spread induced by CSR in the first arc dipolemagnet was assumed to be 1/3 of the energy spreadpredicted by the CSR steady-state emission of alongitudinal Gaussian charge distribution [10]. That valuefits well all simulation results, and is supported by a currentprofile smoother than a Gaussian: it actually resembles aflat-top profile with Gaussian tails at the edges.
TUIDLH2040 Proceedings of ERL2015, Stony Brook, NY, USA
ISBN 978-3-95450-183-0
50Cop
yrig
ht©
2015
CC
-BY-
3.0
and
byth
ere
spec
tive
auth
ors
WG2ERL Optics & Beam Dynamics: Collective Effects/Multi-passes/Halo Simulations
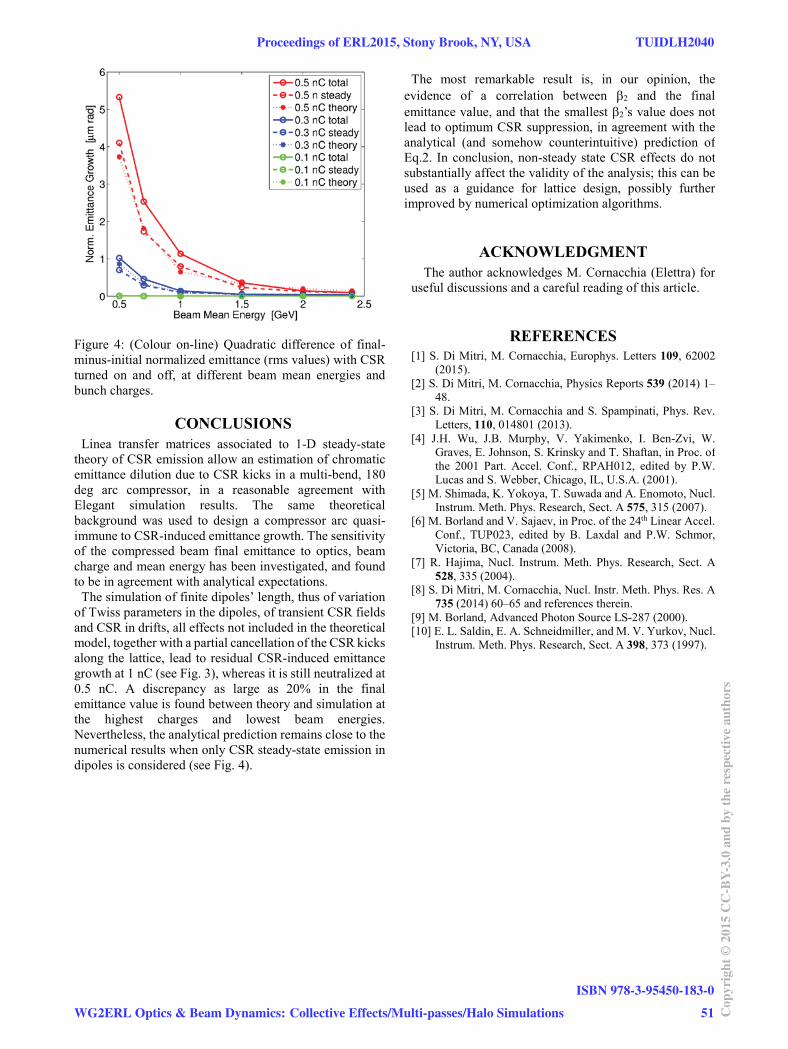
Figure 4: (Colour on-line) Quadratic difference of final-minus-initial normalized emittance (rms values) with CSRturned on and off, at different beam mean energies andbunch charges.
CONCLUSIONS Linea transfer matrices associated to 1-D steady-state
theory of CSR emission allow an estimation of chromaticemittance dilution due to CSR kicks in a multi-bend, 180deg arc compressor, in a reasonable agreement withElegant simulation results. The same theoreticalbackground was used to design a compressor arc quasi-immune to CSR-induced emittance growth. The sensitivityof the compressed beam final emittance to optics, beamcharge and mean energy has been investigated, and foundto be in agreement with analytical expectations.
The simulation of finite dipoles’ length, thus of variationof Twiss parameters in the dipoles, of transient CSR fieldsand CSR in drifts, all effects not included in the theoreticalmodel, together with a partial cancellation of the CSR kicksalong the lattice, lead to residual CSR-induced emittancegrowth at 1 nC (see Fig. 3), whereas it is still neutralized at0.5 nC. A discrepancy as large as 20% in the finalemittance value is found between theory and simulation atthe highest charges and lowest beam energies.Nevertheless, the analytical prediction remains close to thenumerical results when only CSR steady-state emission indipoles is considered (see Fig. 4).
The most remarkable result is, in our opinion, theevidence of a correlation between 2 and the finalemittance value, and that the smallest 2’s value does notlead to optimum CSR suppression, in agreement with theanalytical (and somehow counterintuitive) prediction ofEq.2. In conclusion, non-steady state CSR effects do notsubstantially affect the validity of the analysis; this can beused as a guidance for lattice design, possibly furtherimproved by numerical optimization algorithms.
ACKNOWLEDGMENT The author acknowledges M. Cornacchia (Elettra) for
useful discussions and a careful reading of this article.
REFERENCES [1] S. Di Mitri, M. Cornacchia, Europhys. Letters 109, 62002
(2015). [2] S. Di Mitri, M. Cornacchia, Physics Reports 539 (2014) 1–
48. [3] S. Di Mitri, M. Cornacchia and S. Spampinati, Phys. Rev.
Letters, 110, 014801 (2013). [4] J.H. Wu, J.B. Murphy, V. Yakimenko, I. Ben-Zvi, W.
Graves, E. Johnson, S. Krinsky and T. Shaftan, in Proc. ofthe 2001 Part. Accel. Conf., RPAH012, edited by P.W.Lucas and S. Webber, Chicago, IL, U.S.A. (2001).
[5] M. Shimada, K. Yokoya, T. Suwada and A. Enomoto, Nucl.Instrum. Meth. Phys. Research, Sect. A 575, 315 (2007).
[6] M. Borland and V. Sajaev, in Proc. of the 24th Linear Accel.Conf., TUP023, edited by B. Laxdal and P.W. Schmor,Victoria, BC, Canada (2008).
[7] R. Hajima, Nucl. Instrum. Meth. Phys. Research, Sect. A528, 335 (2004).
[8] S. Di Mitri, M. Cornacchia, Nucl. Instr. Meth. Phys. Res. A735 (2014) 60–65 and references therein.
[9] M. Borland, Advanced Photon Source LS-287 (2000). [10] E. L. Saldin, E. A. Schneidmiller, and M. V. Yurkov, Nucl.
Instrum. Meth. Phys. Research, Sect. A 398, 373 (1997).
Proceedings of ERL2015, Stony Brook, NY, USA TUIDLH2040
WG2ERL Optics & Beam Dynamics: Collective Effects/Multi-passes/Halo Simulations
ISBN 978-3-95450-183-0
51 Cop
yrig
ht©
2015
CC
-BY-
3.0
and
byth
ere
spec
tive
auth
ors
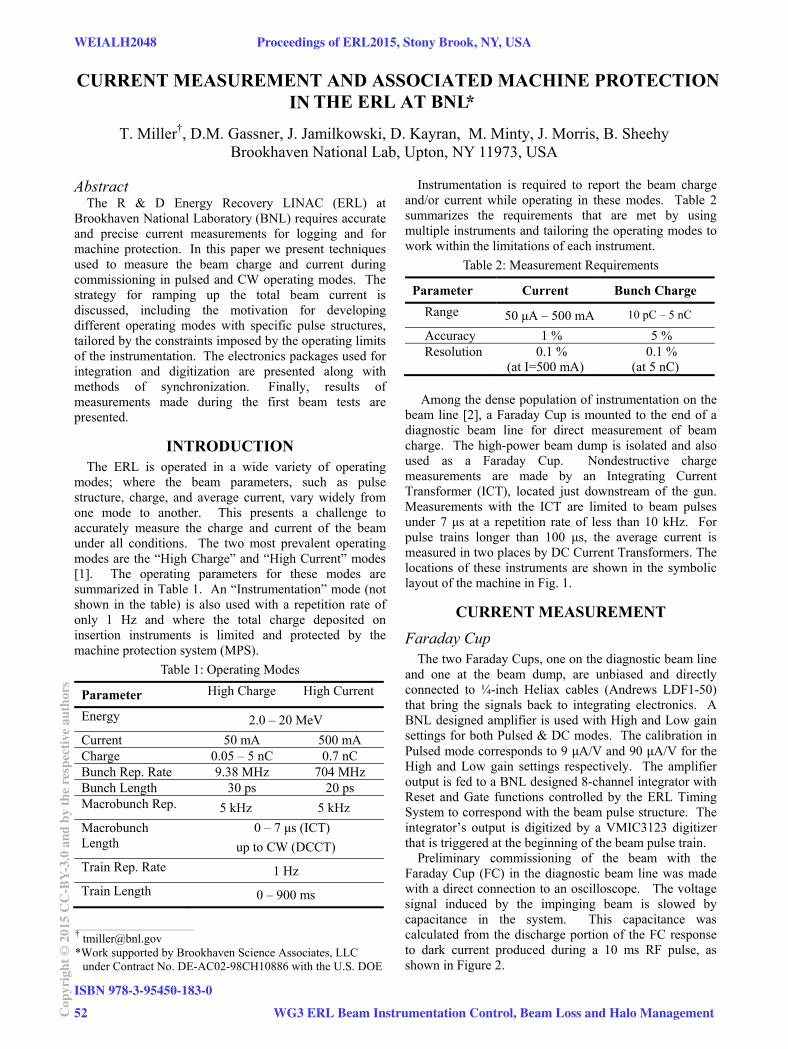
CURRENT MEASUREMENT AND ASSOCIATED MACHINE PROTECTION IN
THE ERL AT BNL *
T. Miller†, D.M. Gassner, J. Jamilkowski, D. Kayran, M. Minty, J. Morris, B. Sheehy Brookhaven National Lab, Upton, NY 11973, USA
Abstract The R & D Energy Recovery LINAC (ERL) at
Brookhaven National Laboratory (BNL) requires accurate and precise current measurements for logging and for machine protection. In this paper we present techniques used to measure the beam charge and current during commissioning in pulsed and CW operating modes. The strategy for ramping up the total beam current is discussed, including the motivation for developing different operating modes with specific pulse structures, tailored by the constraints imposed by the operating limits of the instrumentation. The electronics packages used for integration and digitization are presented along with methods of synchronization. Finally, results of measurements made during the first beam tests are presented.
INTRODUCTION The ERL is operated in a wide variety of operating
modes; where the beam parameters, such as pulse structure, charge, and average current, vary widely from one mode to another. This presents a challenge to accurately measure the charge and current of the beam under all conditions. The two most prevalent operating modes are the “High Charge” and “High Current” modes [1]. The operating parameters for these modes are summarized in Table 1. An “Instrumentation” mode (not shown in the table) is also used with a repetition rate of only 1 Hz and where the total charge deposited on insertion instruments is limited and protected by the machine protection system (MPS).
Table 1: Operating Modes
Parameter High Charge High Current
Energy 2.0 – 20 MeV
Current 50 mA 500 mA Charge 0.05 – 5 nC 0.7 nC Bunch Rep. Rate 9.38 MHz 704 MHz Bunch Length 30 ps 20 ps Macrobunch Rep. 5 kHz 5 kHz
Macrobunch Length
0 – 7 μs (ICT)
up to CW (DCCT)
Train Rep. Rate 1 Hz
Train Length 0 – 900 ms
Instrumentation is required to report the beam charge and/or current while operating in these modes. Table 2 summarizes the requirements that are met by using multiple instruments and tailoring the operating modes to work within the limitations of each instrument.
Table 2: Measurement Requirements
Parameter Current Bunch Charge
Range 50 μA – 500 mA 10 pC – 5 nC
Accuracy 1 % 5 % Resolution 0.1 %
(at I=500 mA) 0.1 %
(at 5 nC) Among the dense population of instrumentation on the
beam line [2], a Faraday Cup is mounted to the end of a diagnostic beam line for direct measurement of beam charge. The high-power beam dump is isolated and also used as a Faraday Cup. Nondestructive charge measurements are made by an Integrating Current Transformer (ICT), located just downstream of the gun. Measurements with the ICT are limited to beam pulses under 7 μs at a repetition rate of less than 10 kHz. For pulse trains longer than 100 μs, the average current is measured in two places by DC Current Transformers. The locations of these instruments are shown in the symbolic layout of the machine in Fig. 1.
CURRENT MEASUREMENT
Faraday Cup The two Faraday Cups, one on the diagnostic beam line
and one at the beam dump, are unbiased and directly connected to ¼-inch Heliax cables (Andrews LDF1-50) that bring the signals back to integrating electronics. A BNL designed amplifier is used with High and Low gain settings for both Pulsed & DC modes. The calibration in Pulsed mode corresponds to 9 μA/V and 90 μA/V for the High and Low gain settings respectively. The amplifier output is fed to a BNL designed 8-channel integrator with Reset and Gate functions controlled by the ERL Timing System to correspond with the beam pulse structure. The integrator’s output is digitized by a VMIC3123 digitizer that is triggered at the beginning of the beam pulse train.
Preliminary commissioning of the beam with the Faraday Cup (FC) in the diagnostic beam line was made with a direct connection to an oscilloscope. The voltage signal induced by the impinging beam is slowed by capacitance in the system. This capacitance was calculated from the discharge portion of the FC response to dark current produced during a 10 ms RF pulse, as shown in Figure 2.
____________________________________________
† [email protected] *Work supported by Brookhaven Science Associates, LLC
under Contract No. DE-AC02-98CH10886 with the U.S. DOE
WEIALH2048 Proceedings of ERL2015, Stony Brook, NY, USA
ISBN 978-3-95450-183-0
52Cop
yrig
ht©
2015
CC
-BY-
3.0
and
byth
ere
spec
tive
auth
ors
WG3 ERL Beam Instrumentation Control, Beam Loss and Halo Management

Figure 1: Symbolic layout of ERL with instrumentation.
Figure 2: Faraday cup signal with pulsed beam – dark current.
The FC signal dropped by 63 % (one time constant) in
5ms as the capacitance discharged. Using equation 1 below with 1 MΩ from the scope input impedance and the measured 5 ms time constant;
(1)
the system capacitance was found to be 5nF. Equation 2 below gives the total charge deposited by the dark current during the 10 ms pulse.
Q I(t)dt 1
RV (t)dt . (2)
Using equation 3 with equation 2 for Q, R=1 MΩ from the scope input impedance, T=10ms duration of the beam
during the RF pulse, and the integrated voltage of 21.7 mV-s from the scope function;
I Q
T 1
RTV (t)dt (3)
the average dark current during the RF pulse was found to be 2 μA, similar to measurements presented earlier [3]. Using the system capacitance, the charge from the photocurrent was found from Q=CΔV; where ΔV is the peak-to-peak change in voltage during the photocurrent pulse and C is the system capacitance of 5nF. This was measured in Fig. 3 to be 158 mV; giving a charge of 0.8 nC per pulse, considerably higher than measurements presented earlier [4]. Figure 3 shows three consecutive photocurrent pulses superimposed on the slow curve from
Figure 3: Faraday cup signal with photo current.
5ms
63%
Discharge Into R
scope
(1MΩ)
charged by e-beam
RF Pulse
Faraday Cup
BLM Log Signal
Calculated Integral
Time Constant
Proceedings of ERL2015, Stony Brook, NY, USA WEIALH2048
WG3 ERL Beam Instrumentation Control, Beam Loss and Halo Management
ISBN 978-3-95450-183-0
53 Cop
yrig
ht©
2015
CC
-BY-
3.0
and
byth
ere
spec
tive
auth
ors
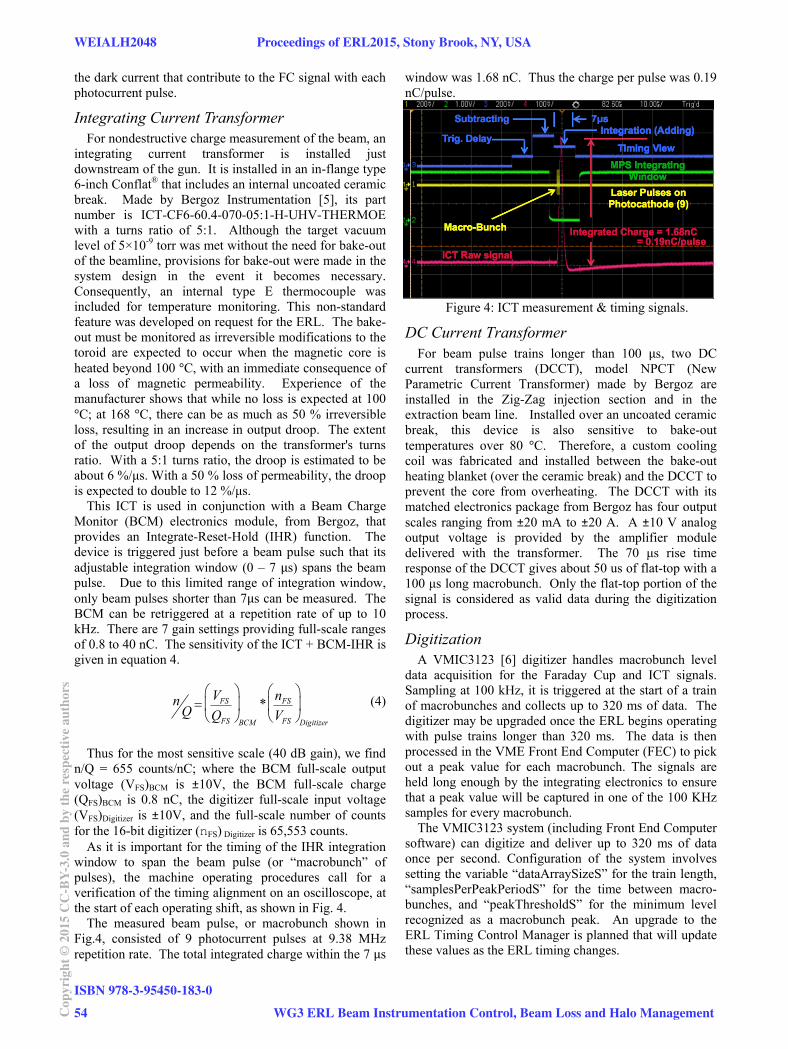
the dark current that contribute to the FC signal with each photocurrent pulse.
Integrating Current Transformer For nondestructive charge measurement of the beam, an
integrating current transformer is installed just downstream of the gun. It is installed in an in-flange type 6-inch Conflat® that includes an internal uncoated ceramic break. Made by Bergoz Instrumentation [5], its part number is ICT-CF6-60.4-070-05:1-H-UHV-THERMOE with a turns ratio of 5:1. Although the target vacuum level of 5×10⁻⁹ torr was met without the need for bake-out of the beamline, provisions for bake-out were made in the system design in the event it becomes necessary. Consequently, an internal type E thermocouple was included for temperature monitoring. This non-standard feature was developed on request for the ERL. The bake-out must be monitored as irreversible modifications to the toroid are expected to occur when the magnetic core is heated beyond 100 °C, with an immediate consequence of a loss of magnetic permeability. Experience of the manufacturer shows that while no loss is expected at 100 °C; at 168 °C, there can be as much as 50 % irreversible loss, resulting in an increase in output droop. The extent of the output droop depends on the transformer's turns ratio. With a 5:1 turns ratio, the droop is estimated to be about 6 %/μs. With a 50 % loss of permeability, the droop is expected to double to 12 %/μs.
This ICT is used in conjunction with a Beam Charge Monitor (BCM) electronics module, from Bergoz, that provides an Integrate-Reset-Hold (IHR) function. The device is triggered just before a beam pulse such that its adjustable integration window (0 – 7 μs) spans the beam pulse. Due to this limited range of integration window, only beam pulses shorter than 7μs can be measured. The BCM can be retriggered at a repetition rate of up to 10 kHz. There are 7 gain settings providing full-scale ranges of 0.8 to 40 nC. The sensitivity of the ICT + BCM-IHR is given in equation 4.
nQ VFS
QFS
BCM
*nFS
VFS
Digitizer
(4)
Thus for the most sensitive scale (40 dB gain), we find n/Q = 655 counts/nC; where the BCM full-scale output voltage (VFS)BCM is ±10V, the BCM full-scale charge (QFS)BCM is 0.8 nC, the digitizer full-scale input voltage (VFS)Digitizer is ±10V, and the full-scale number of counts for the 16-bit digitizer (nFS) Digitizer is 65,553 counts.
As it is important for the timing of the IHR integration window to span the beam pulse (or “macrobunch” of pulses), the machine operating procedures call for a verification of the timing alignment on an oscilloscope, at the start of each operating shift, as shown in Fig. 4.
The measured beam pulse, or macrobunch shown in Fig.4, consisted of 9 photocurrent pulses at 9.38 MHz repetition rate. The total integrated charge within the 7 μs
window was 1.68 nC. Thus the charge per pulse was 0.19 nC/pulse.
Figure 4: ICT measurement & timing signals.
DC Current Transformer For beam pulse trains longer than 100 μs, two DC
current transformers (DCCT), model NPCT (New Parametric Current Transformer) made by Bergoz are installed in the Zig-Zag injection section and in the extraction beam line. Installed over an uncoated ceramic break, this device is also sensitive to bake-out temperatures over 80 °C. Therefore, a custom cooling coil was fabricated and installed between the bake-out heating blanket (over the ceramic break) and the DCCT to prevent the core from overheating. The DCCT with its matched electronics package from Bergoz has four output scales ranging from ±20 mA to ±20 A. A ±10 V analog output voltage is provided by the amplifier module delivered with the transformer. The 70 μs rise time response of the DCCT gives about 50 us of flat-top with a 100 μs long macrobunch. Only the flat-top portion of the signal is considered as valid data during the digitization process.
Digitization A VMIC3123 [6] digitizer handles macrobunch level
data acquisition for the Faraday Cup and ICT signals. Sampling at 100 kHz, it is triggered at the start of a train of macrobunches and collects up to 320 ms of data. The digitizer may be upgraded once the ERL begins operating with pulse trains longer than 320 ms. The data is then processed in the VME Front End Computer (FEC) to pick out a peak value for each macrobunch. The signals are held long enough by the integrating electronics to ensure that a peak value will be captured in one of the 100 KHz samples for every macrobunch.
The VMIC3123 system (including Front End Computer software) can digitize and deliver up to 320 ms of data once per second. Configuration of the system involves setting the variable “dataArraySizeS” for the train length, “samplesPerPeakPeriodS” for the time between macro-bunches, and “peakThresholdS” for the minimum level recognized as a macrobunch peak. An upgrade to the ERL Timing Control Manager is planned that will update these values as the ERL timing changes.
WEIALH2048 Proceedings of ERL2015, Stony Brook, NY, USA
ISBN 978-3-95450-183-0
54Cop
yrig
ht©
2015
CC
-BY-
3.0
and
byth
ere
spec
tive
auth
ors
WG3 ERL Beam Instrumentation Control, Beam Loss and Halo Management
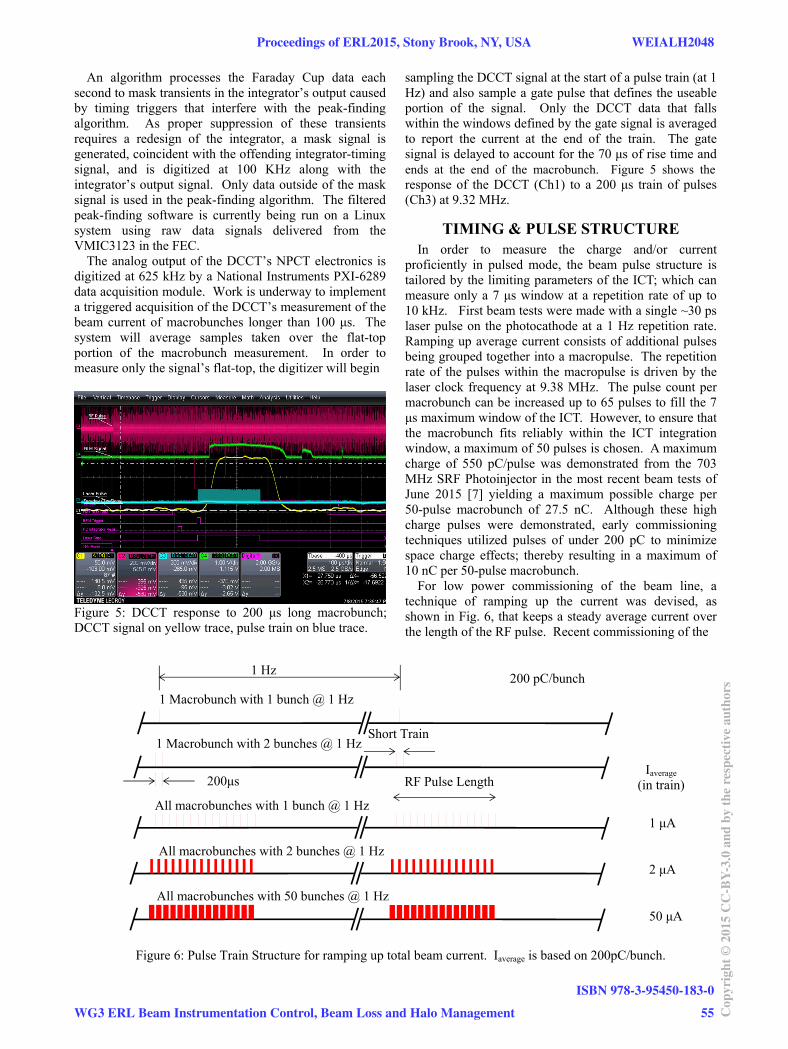
An algorithm processes the Faraday Cup data each second to mask transients in the integrator’s output caused by timing triggers that interfere with the peak-finding algorithm. As proper suppression of these transients requires a redesign of the integrator, a mask signal is generated, coincident with the offending integrator-timing signal, and is digitized at 100 KHz along with the integrator’s output signal. Only data outside of the mask signal is used in the peak-finding algorithm. The filtered peak-finding software is currently being run on a Linux system using raw data signals delivered from the VMIC3123 in the FEC.
The analog output of the DCCT’s NPCT electronics is digitized at 625 kHz by a National Instruments PXI-6289 data acquisition module. Work is underway to implement a triggered acquisition of the DCCT’s measurement of the beam current of macrobunches longer than 100 μs. The system will average samples taken over the flat-top portion of the macrobunch measurement. In order to measure only the signal’s flat-top, the digitizer will begin
Figure 5: DCCT response to 200 μs long macrobunch; DCCT signal on yellow trace, pulse train on blue trace.
sampling the DCCT signal at the start of a pulse train (at 1 Hz) and also sample a gate pulse that defines the useable portion of the signal. Only the DCCT data that falls within the windows defined by the gate signal is averaged to report the current at the end of the train. The gate signal is delayed to account for the 70 μs of rise time and ends at the end of the macrobunch. Figure 5 shows the response of the DCCT (Ch1) to a 200 μs train of pulses (Ch3) at 9.32 MHz.
TIMING & PULSE STRUCTURE In order to measure the charge and/or current
proficiently in pulsed mode, the beam pulse structure is tailored by the limiting parameters of the ICT; which can measure only a 7 μs window at a repetition rate of up to 10 kHz. First beam tests were made with a single ~30 ps laser pulse on the photocathode at a 1 Hz repetition rate. Ramping up average current consists of additional pulses being grouped together into a macropulse. The repetition rate of the pulses within the macropulse is driven by the laser clock frequency at 9.38 MHz. The pulse count per macrobunch can be increased up to 65 pulses to fill the 7 μs maximum window of the ICT. However, to ensure that the macrobunch fits reliably within the ICT integration window, a maximum of 50 pulses is chosen. A maximum charge of 550 pC/pulse was demonstrated from the 703 MHz SRF Photoinjector in the most recent beam tests of June 2015 [7] yielding a maximum possible charge per 50-pulse macrobunch of 27.5 nC. Although these high charge pulses were demonstrated, early commissioning techniques utilized pulses of under 200 pC to minimize space charge effects; thereby resulting in a maximum of 10 nC per 50-pulse macrobunch.
For low power commissioning of the beam line, a technique of ramping up the current was devised, as shown in Fig. 6, that keeps a steady average current over the length of the RF pulse. Recent commissioning of the
Figure 6: Pulse Train Structure for ramping up total beam current. Iaverage is based on 200pC/bunch.
1 Macrobunch with 1 bunch @ 1 Hz
1 Macrobunch with 2 bunches @ 1 Hz Short Train
200μs
All macrobunches with 1 bunch @ 1 Hz
All macrobunches with 2 bunches @ 1 Hz
All macrobunches with 50 bunches @ 1 Hz
1 μA
2 μA
50 μA
Iaverage (in train)
200 pC/bunch 1 Hz
RF Pulse Length
Proceedings of ERL2015, Stony Brook, NY, USA WEIALH2048
WG3 ERL Beam Instrumentation Control, Beam Loss and Halo Management
ISBN 978-3-95450-183-0
55 Cop
yrig
ht©
2015
CC
-BY-
3.0
and
byth
ere
spec
tive
auth
ors
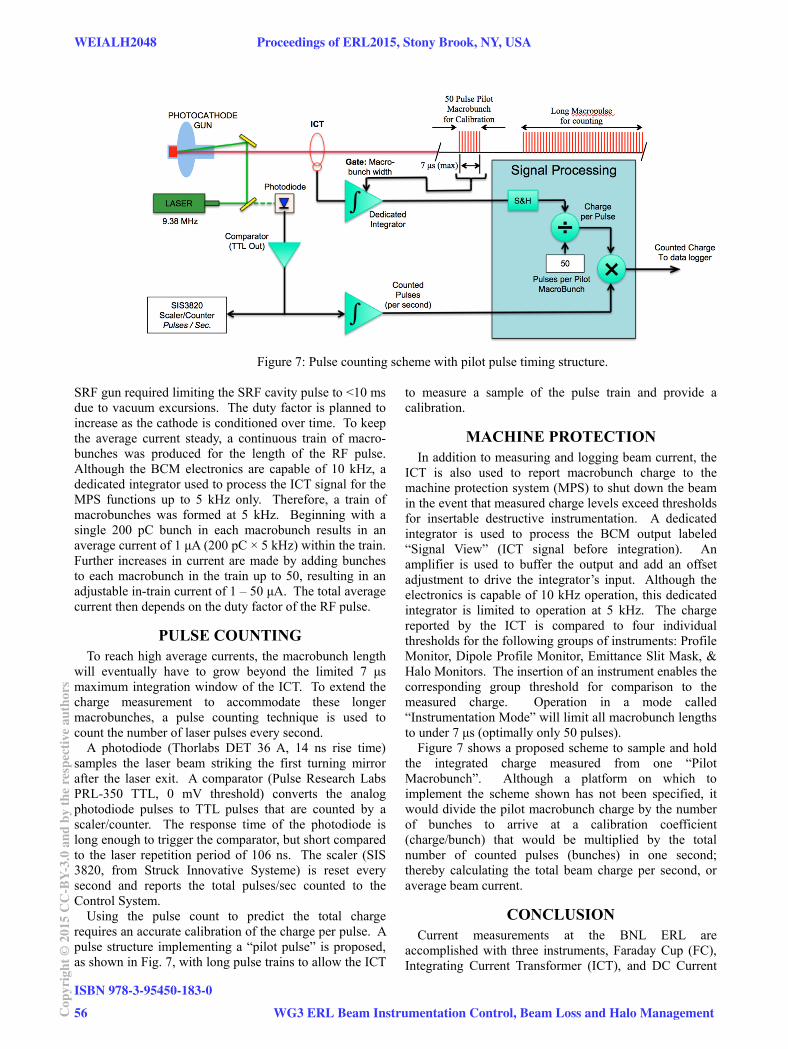
Figure 7: Pulse counting scheme with pilot pulse timing structure.
SRF gun required limiting the SRF cavity pulse to <10 ms due to vacuum excursions. The duty factor is planned to increase as the cathode is conditioned over time. To keep the average current steady, a continuous train of macro-bunches was produced for the length of the RF pulse. Although the BCM electronics are capable of 10 kHz, a dedicated integrator used to process the ICT signal for the MPS functions up to 5 kHz only. Therefore, a train of macrobunches was formed at 5 kHz. Beginning with a single 200 pC bunch in each macrobunch results in an average current of 1 μA (200 pC × 5 kHz) within the train. Further increases in current are made by adding bunches to each macrobunch in the train up to 50, resulting in an adjustable in-train current of 1 – 50 μA. The total average current then depends on the duty factor of the RF pulse.
PULSE COUNTING To reach high average currents, the macrobunch length
will eventually have to grow beyond the limited 7 μs maximum integration window of the ICT. To extend the charge measurement to accommodate these longer macrobunches, a pulse counting technique is used to count the number of laser pulses every second.
A photodiode (Thorlabs DET 36 A, 14 ns rise time) samples the laser beam striking the first turning mirror after the laser exit. A comparator (Pulse Research Labs PRL-350 TTL, 0 mV threshold) converts the analog photodiode pulses to TTL pulses that are counted by a scaler/counter. The response time of the photodiode is long enough to trigger the comparator, but short compared to the laser repetition period of 106 ns. The scaler (SIS 3820, from Struck Innovative Systeme) is reset every second and reports the total pulses/sec counted to the Control System.
Using the pulse count to predict the total charge requires an accurate calibration of the charge per pulse. A pulse structure implementing a “pilot pulse” is proposed, as shown in Fig. 7, with long pulse trains to allow the ICT
to measure a sample of the pulse train and provide a calibration.
MACHINE PROTECTION In addition to measuring and logging beam current, the
ICT is also used to report macrobunch charge to the machine protection system (MPS) to shut down the beam in the event that measured charge levels exceed thresholds for insertable destructive instrumentation. A dedicated integrator is used to process the BCM output labeled “Signal View” (ICT signal before integration). An amplifier is used to buffer the output and add an offset adjustment to drive the integrator’s input. Although the electronics is capable of 10 kHz operation, this dedicated integrator is limited to operation at 5 kHz. The charge reported by the ICT is compared to four individual thresholds for the following groups of instruments: Profile Monitor, Dipole Profile Monitor, Emittance Slit Mask, & Halo Monitors. The insertion of an instrument enables the corresponding group threshold for comparison to the measured charge. Operation in a mode called “Instrumentation Mode” will limit all macrobunch lengths to under 7 μs (optimally only 50 pulses).
Figure 7 shows a proposed scheme to sample and hold the integrated charge measured from one “Pilot Macrobunch”. Although a platform on which to implement the scheme shown has not been specified, it would divide the pilot macrobunch charge by the number of bunches to arrive at a calibration coefficient (charge/bunch) that would be multiplied by the total number of counted pulses (bunches) in one second; thereby calculating the total beam charge per second, or average beam current.
CONCLUSION Current measurements at the BNL ERL are
accomplished with three instruments, Faraday Cup (FC), Integrating Current Transformer (ICT), and DC Current
WEIALH2048 Proceedings of ERL2015, Stony Brook, NY, USA
ISBN 978-3-95450-183-0
56Cop
yrig
ht©
2015
CC
-BY-
3.0
and
byth
ere
spec
tive
auth
ors
WG3 ERL Beam Instrumentation Control, Beam Loss and Halo Management
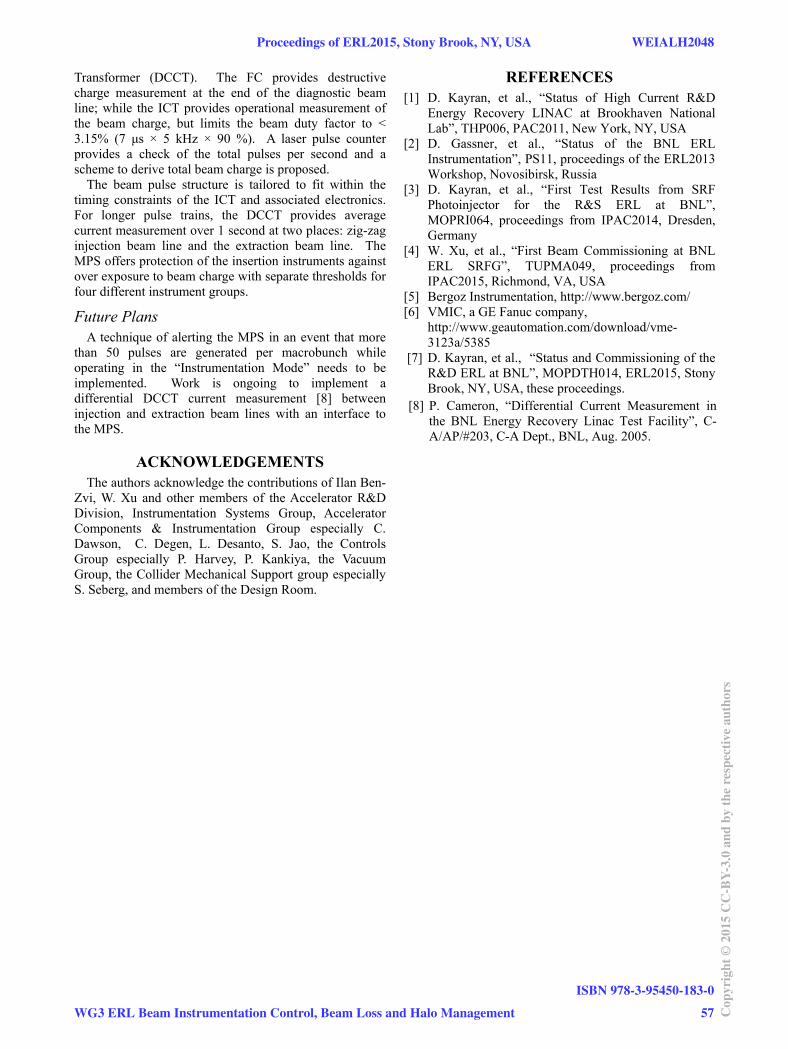
Transformer (DCCT). The FC provides destructive charge measurement at the end of the diagnostic beam line; while the ICT provides operational measurement of the beam charge, but limits the beam duty factor to < 3.15% (7 μs × 5 kHz × 90 %). A laser pulse counter provides a check of the total pulses per second and a scheme to derive total beam charge is proposed.
The beam pulse structure is tailored to fit within the timing constraints of the ICT and associated electronics. For longer pulse trains, the DCCT provides average current measurement over 1 second at two places: zig-zag injection beam line and the extraction beam line. The MPS offers protection of the insertion instruments against over exposure to beam charge with separate thresholds for four different instrument groups.
Future Plans A technique of alerting the MPS in an event that more
than 50 pulses are generated per macrobunch while operating in the “Instrumentation Mode” needs to be implemented. Work is ongoing to implement a differential DCCT current measurement [8] between injection and extraction beam lines with an interface to the MPS.
ACKNOWLEDGEMENTS The authors acknowledge the contributions of Ilan Ben-
Zvi, W. Xu and other members of the Accelerator R&D Division, Instrumentation Systems Group, Accelerator Components & Instrumentation Group especially C. Dawson, C. Degen, L. Desanto, S. Jao, the Controls Group especially P. Harvey, P. Kankiya, the Vacuum Group, the Collider Mechanical Support group especially S. Seberg, and members of the Design Room.
REFERENCES [1] D. Kayran, et al., “Status of High Current R&D
Energy Recovery LINAC at Brookhaven National Lab”, THP006, PAC2011, New York, NY, USA
[2] D. Gassner, et al., “Status of the BNL ERL Instrumentation”, PS11, proceedings of the ERL2013 Workshop, Novosibirsk, Russia
[3] D. Kayran, et al., “First Test Results from SRF Photoinjector for the R&S ERL at BNL”, MOPRI064, proceedings from IPAC2014, Dresden, Germany
[4] W. Xu, et al., “First Beam Commissioning at BNL ERL SRFG”, TUPMA049, proceedings from IPAC2015, Richmond, VA, USA
[5] Bergoz Instrumentation, http://www.bergoz.com/ [6] VMIC, a GE Fanuc company,
http://www.geautomation.com/download/vme-3123a/5385
[7] D. Kayran, et al., “Status and Commissioning of the R&D ERL at BNL”, MOPDTH014, ERL2015, Stony Brook, NY, USA, these proceedings.
[8] P. Cameron, “Differential Current Measurement in the BNL Energy Recovery Linac Test Facility”, C-A/AP/#203, C-A Dept., BNL, Aug. 2005.
Proceedings of ERL2015, Stony Brook, NY, USA WEIALH2048
WG3 ERL Beam Instrumentation Control, Beam Loss and Halo Management
ISBN 978-3-95450-183-0
57 Cop
yrig
ht©
2015
CC
-BY-
3.0
and
byth
ere
spec
tive
auth
ors
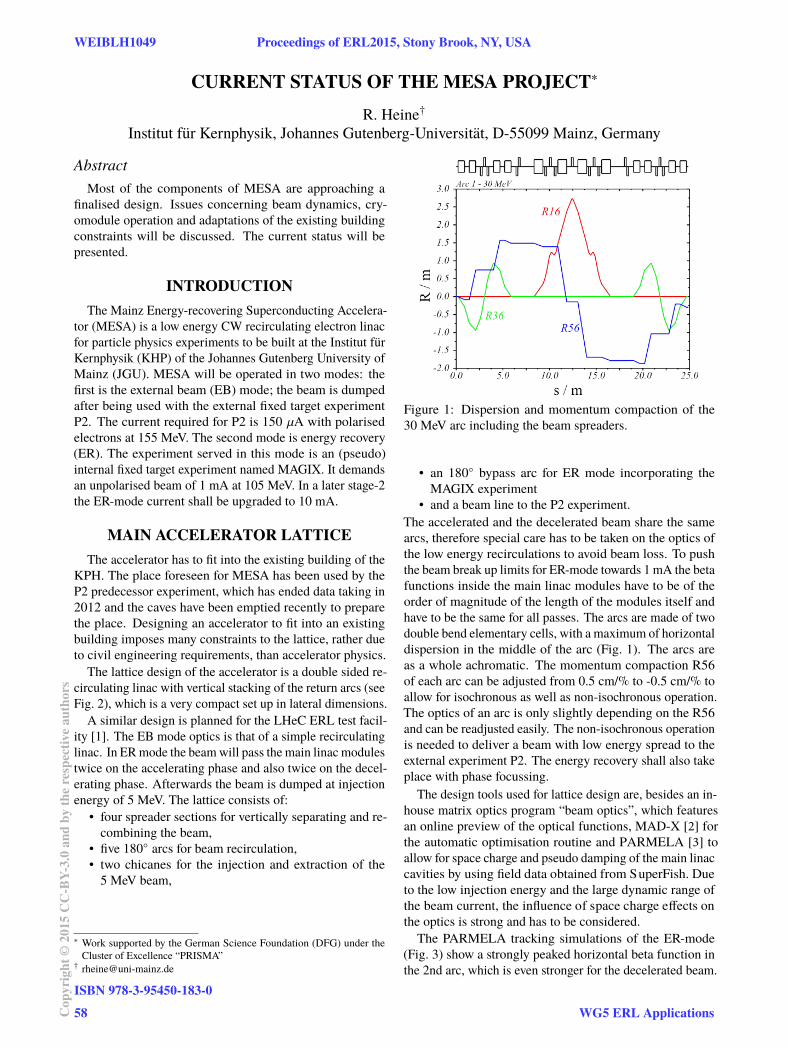
CURRENT STATUS OF THE MESA PROJECT∗
R. Heine†
Institut für Kernphysik, Johannes Gutenberg-Universität, D-55099 Mainz, Germany
Abstract
Most of the components of MESA are approaching a
finalised design. Issues concerning beam dynamics, cry-
omodule operation and adaptations of the existing building
constraints will be discussed. The current status will be
presented.
INTRODUCTION
The Mainz Energy-recovering Superconducting Accelera-
tor (MESA) is a low energy CW recirculating electron linac
for particle physics experiments to be built at the Institut für
Kernphysik (KHP) of the Johannes Gutenberg University of
Mainz (JGU). MESA will be operated in two modes: the
first is the external beam (EB) mode; the beam is dumped
after being used with the external fixed target experiment
P2. The current required for P2 is 150 µA with polarised
electrons at 155 MeV. The second mode is energy recovery
(ER). The experiment served in this mode is an (pseudo)
internal fixed target experiment named MAGIX. It demands
an unpolarised beam of 1 mA at 105 MeV. In a later stage-2
the ER-mode current shall be upgraded to 10 mA.
MAIN ACCELERATOR LATTICE
The accelerator has to fit into the existing building of the
KPH. The place foreseen for MESA has been used by the
P2 predecessor experiment, which has ended data taking in
2012 and the caves have been emptied recently to prepare
the place. Designing an accelerator to fit into an existing
building imposes many constraints to the lattice, rather due
to civil engineering requirements, than accelerator physics.
The lattice design of the accelerator is a double sided re-
circulating linac with vertical stacking of the return arcs (see
Fig. 2), which is a very compact set up in lateral dimensions.
A similar design is planned for the LHeC ERL test facil-
ity [1]. The EB mode optics is that of a simple recirculating
linac. In ER mode the beam will pass the main linac modules
twice on the accelerating phase and also twice on the decel-
erating phase. Afterwards the beam is dumped at injection
energy of 5 MeV. The lattice consists of:
• four spreader sections for vertically separating and re-
combining the beam,
• five 180 arcs for beam recirculation,
• two chicanes for the injection and extraction of the
5 MeV beam,
∗ Work supported by the German Science Foundation (DFG) under the
Cluster of Excellence “PRISMA”† [email protected]
Figure 1: Dispersion and momentum compaction of the
30 MeV arc including the beam spreaders.
• an 180 bypass arc for ER mode incorporating the
MAGIX experiment
• and a beam line to the P2 experiment.
The accelerated and the decelerated beam share the same
arcs, therefore special care has to be taken on the optics of
the low energy recirculations to avoid beam loss. To push
the beam break up limits for ER-mode towards 1 mA the beta
functions inside the main linac modules have to be of the
order of magnitude of the length of the modules itself and
have to be the same for all passes. The arcs are made of two
double bend elementary cells, with a maximum of horizontal
dispersion in the middle of the arc (Fig. 1). The arcs are
as a whole achromatic. The momentum compaction R56
of each arc can be adjusted from 0.5 cm/% to -0.5 cm/% to
allow for isochronous as well as non-isochronous operation.
The optics of an arc is only slightly depending on the R56
and can be readjusted easily. The non-isochronous operation
is needed to deliver a beam with low energy spread to the
external experiment P2. The energy recovery shall also take
place with phase focussing.
The design tools used for lattice design are, besides an in-
house matrix optics program “beam optics”, which features an online preview of the optical functions, MAD-X [2] for the automatic optimisation routine and PARMELA [3] to allow for space charge and pseudo damping of the main linac cavities by using field data obtained from SuperFish. Due to the low injection energy and the large dynamic range of the beam current, the influence of space charge effects on the optics is strong and has to be considered.
The PARMELA tracking simulations of the ER-mode
(Fig. 3) show a strongly peaked horizontal beta function in
the 2nd arc, which is even stronger for the decelerated beam.
WEIBLH1049 Proceedings of ERL2015, Stony Brook, NY, USA
ISBN 978-3-95450-183-0
58Cop
yrig
ht©
2015
CC
-BY-
3.0
and
byth
ere
spec
tive
auth
ors
WG5 ERL Applications
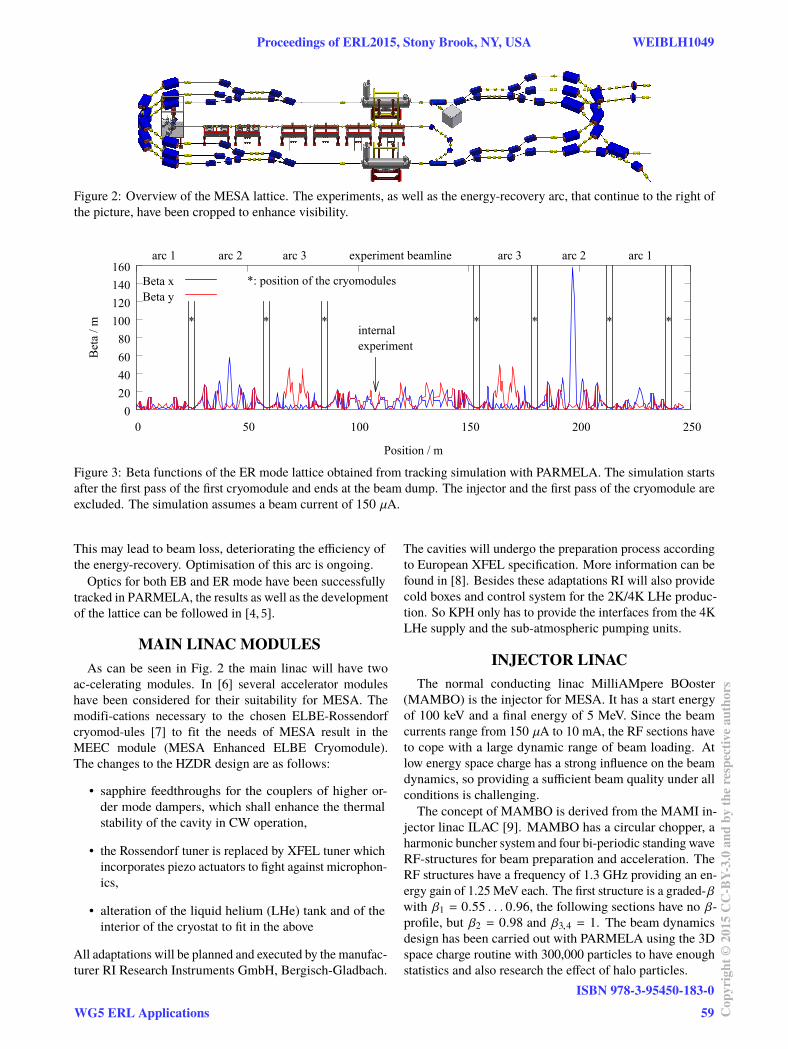
Figure 2: Overview of the MESA lattice. The experiments, as well as the energy-recovery arc, that continue to the right of
the picture, have been cropped to enhance visibility.
020406080
100120140160
0 50 100 150 200 250
Bet
a / m
Position / m
arc 1 arc 2 arc 3 experiment beamline
internalexperiment
* * * * * * *
*: position of the cryomodules
arc 3 arc 2 arc 1
Beta xBeta y
Figure 3: Beta functions of the ER mode lattice obtained from tracking simulation with PARMELA. The simulation starts
after the first pass of the first cryomodule and ends at the beam dump. The injector and the first pass of the cryomodule are
excluded. The simulation assumes a beam current of 150 µA.
This may lead to beam loss, deteriorating the efficiency of
the energy-recovery. Optimisation of this arc is ongoing.
Optics for both EB and ER mode have been successfully
tracked in PARMELA, the results as well as the development
of the lattice can be followed in [4, 5].
MAIN LINAC MODULES
As can be seen in Fig. 2 the main linac will have two ac-celerating modules. In [6] several accelerator modules have been considered for their suitability for MESA. The modifi-cations necessary to the chosen ELBE-Rossendorf cryomod-ules [7] to fit the needs of MESA result in the MEEC module (MESA Enhanced ELBE Cryomodule). The changes to the HZDR design are as follows:
• sapphire feedthroughs for the couplers of higher or-
der mode dampers, which shall enhance the thermal
stability of the cavity in CW operation,
• the Rossendorf tuner is replaced by XFEL tuner which
incorporates piezo actuators to fight against microphon-
ics,
• alteration of the liquid helium (LHe) tank and of the
interior of the cryostat to fit in the above
All adaptations will be planned and executed by the manufac-
turer RI Research Instruments GmbH, Bergisch-Gladbach.
The cavities will undergo the preparation process according
to European XFEL specification. More information can be
found in [8]. Besides these adaptations RI will also provide
cold boxes and control system for the 2K/4K LHe produc-
tion. So KPH only has to provide the interfaces from the 4K
LHe supply and the sub-atmospheric pumping units.
INJECTOR LINAC
The normal conducting linac MilliAMpere BOoster
(MAMBO) is the injector for MESA. It has a start energy
of 100 keV and a final energy of 5 MeV. Since the beam
currents range from 150 µA to 10 mA, the RF sections have
to cope with a large dynamic range of beam loading. At
low energy space charge has a strong influence on the beam
dynamics, so providing a sufficient beam quality under all
conditions is challenging.
The concept of MAMBO is derived from the MAMI in-
jector linac ILAC [9]. MAMBO has a circular chopper, a
harmonic buncher system and four bi-periodic standing wave
RF-structures for beam preparation and acceleration. The
RF structures have a frequency of 1.3 GHz providing an en-
ergy gain of 1.25 MeV each. The first structure is a graded-β
with β1 = 0.55 . . . 0.96, the following sections have no β-
profile, but β2 = 0.98 and β3,4 = 1. The beam dynamics
design has been carried out with PARMELA using the 3D
space charge routine with 300,000 particles to have enough
statistics and also research the effect of halo particles.
Proceedings of ERL2015, Stony Brook, NY, USA WEIBLH1049
WG5 ERL Applications
ISBN 978-3-95450-183-0
59 Cop
yrig
ht©
2015
CC
-BY-
3.0
and
byth
ere
spec
tive
auth
ors
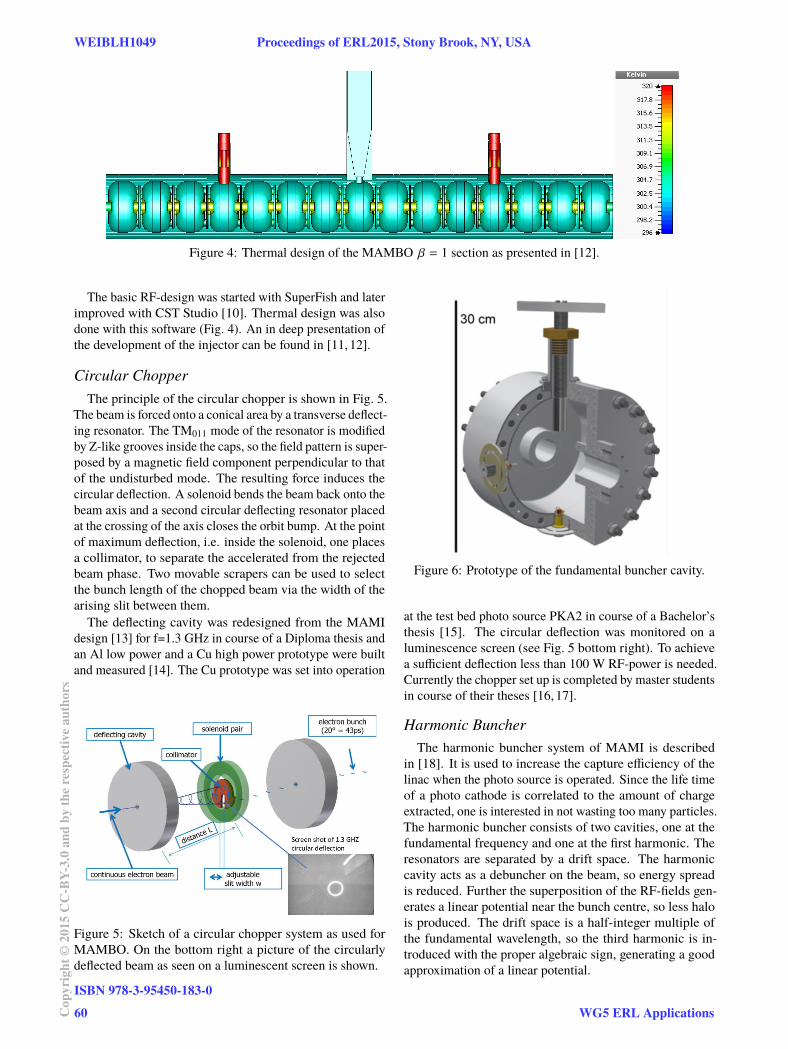
Figure 4: Thermal design of the MAMBO β = 1 section as presented in [12].
The basic RF-design was started with SuperFish and later
improved with CST Studio [10]. Thermal design was also
done with this software (Fig. 4). An in deep presentation of
the development of the injector can be found in [11, 12].
Circular Chopper
The principle of the circular chopper is shown in Fig. 5.
The beam is forced onto a conical area by a transverse deflect-
ing resonator. The TM011 mode of the resonator is modified
by Z-like grooves inside the caps, so the field pattern is super-
posed by a magnetic field component perpendicular to that
of the undisturbed mode. The resulting force induces the
circular deflection. A solenoid bends the beam back onto the
beam axis and a second circular deflecting resonator placed
at the crossing of the axis closes the orbit bump. At the point
of maximum deflection, i.e. inside the solenoid, one places
a collimator, to separate the accelerated from the rejected
beam phase. Two movable scrapers can be used to select
the bunch length of the chopped beam via the width of the
arising slit between them.
The deflecting cavity was redesigned from the MAMI
design [13] for f=1.3 GHz in course of a Diploma thesis and
an Al low power and a Cu high power prototype were built
and measured [14]. The Cu prototype was set into operation
Figure 5: Sketch of a circular chopper system as used for
MAMBO. On the bottom right a picture of the circularly
deflected beam as seen on a luminescent screen is shown.
Figure 6: Prototype of the fundamental buncher cavity.
at the test bed photo source PKA2 in course of a Bachelor’s
thesis [15]. The circular deflection was monitored on a
luminescence screen (see Fig. 5 bottom right). To achieve
a sufficient deflection less than 100 W RF-power is needed.
Currently the chopper set up is completed by master students
in course of their theses [16, 17].
Harmonic Buncher
The harmonic buncher system of MAMI is described
in [18]. It is used to increase the capture efficiency of the
linac when the photo source is operated. Since the life time
of a photo cathode is correlated to the amount of charge
extracted, one is interested in not wasting too many particles.
The harmonic buncher consists of two cavities, one at the
fundamental frequency and one at the first harmonic. The
resonators are separated by a drift space. The harmonic
cavity acts as a debuncher on the beam, so energy spread
is reduced. Further the superposition of the RF-fields gen-
erates a linear potential near the bunch centre, so less halo
is produced. The drift space is a half-integer multiple of
the fundamental wavelength, so the third harmonic is in-
troduced with the proper algebraic sign, generating a good
approximation of a linear potential.
WEIBLH1049 Proceedings of ERL2015, Stony Brook, NY, USA
ISBN 978-3-95450-183-0
60Cop
yrig
ht©
2015
CC
-BY-
3.0
and
byth
ere
spec
tive
auth
ors
WG5 ERL Applications

The design of the buncher is currently adapted to the
MESA frequency [19]. The RF-design of the fundamental
and the harmonic cavity is finished. A low power prototype
of the fundamental cavity (Fig. 6) has been produced and
measured on a bead pull system. The high power prototype
is currently in production, as well as the low power prototype
of the harmonic resonator.
RF POWER SYSTEMS
At HZDR solid state amplifiers (SSA) have been proven to
be a reliable choice for generating RF-power [20]. Therefore
all RF-power transmitters of the MESA facility will be based
on solid state technology. Scalability and redundancy are
the main arguments for SSA, besides the ceasing availability
of tube based power sources and a lack of tubes in the right
power range for MAMBO. For MESA power sources of
some 100 W (Chopper/Buncher), 10-15 kW (MEEC) and
45-75 kW (MAMBO) are needed.
In the low power range an in house solution is available
for 1.3 GHz and 2.45 GHz. Both frequencies are actually
used at the test photo sources PKA2 and PKAT at KPH [21]. In the kilowatt regime a commercial solution is favoured.
PARTICLE SOURCES
MESA will have a 100 keV GaAs photo source for po-
larised and non-polarised electrons. The gun to be used for
MESA is PKA2 (Fig. 7), a copy of the well proven MAMI
design [22] currently used as test bed. Although the restric-
tion to 100 keV beam imposes strong space charge forces
during the high current non-polarised beam operation, itis of high benefit for the control of the spin at low current
polarised operation and e.g. the insertion length of the spin
diagnostic and manipulation devices, such as Wien-filters,
scales with the beam energy.
At MAMI the gun is used with a DC beam, the PKA2
has been equipped with an RF-synchronised pulse laser [21]. So a short bunch can be generated already at the gun, the
chopper is only needed to cut away tails generated from e.g.
stray light, dark currents or delayed emission. The amount of
charge wasted is decreased significantly, improving cathode
life time and radiation levels.
As an upgrade during stage-2 a new photo source the
“Small Thermalised Electron source Mainz” (STEAM) is
designed [23] based on the JLAB inverted gun [24]. The
technical design of STEAM is finished (Fig. 8) and produc-
tion of the parts has started. It is constructed for 200 keV
beam energy, but also operation at 100 keV is possible. As
the accelerating field of STEAM at 100 keV is still higher
than compared to PKA2, the energy spread of the emitted
electrons is smaller, leading to a better acceleration of a
high current beam in MAMBO. Alternatively the low en-
ergy section of MAMBO including the graded-β could be
redesigned for stage-2.
Figure 7: Technical drawing of the 100 keV photo source
PKA2, which is currently used as test bed for MAMBO
components.
Figure 8: Technical drawing of the 200 keV photo source
STEAM.
SUMMARY
The MESA project is well on the way. The core compo-
nents are designed or their design is close to completion.
First subcomponents are either in stage of production or test-
ing. Assembly and commissioning of the low energy beam
transport line of MAMBO is planned for 2016.
ACKNOWLEDGEMENT
The author would like to thank all members of the MESA
accelerator working group for giving input on the current
results of their work.
Proceedings of ERL2015, Stony Brook, NY, USA WEIBLH1049
WG5 ERL Applications
ISBN 978-3-95450-183-0
61 Cop
yrig
ht©
2015
CC
-BY-
3.0
and
byth
ere
spec
tive
auth
ors

REFERENCES
[1] A. Valloni, et al., "Strawman Optics Design For the LHeC
ERL Test Facility", IPAC2013, Shanghai, China, TUPME055,
p. 1694-1696, (2013).
[2]
R. Heine, D. Simon, et al., “Lattice and Start to End Sim-
ulation of the Mainz Energy Recovering Superconducting
Accelerator MESA”, IPAC’14, Dresden, Germany, p. 346
(2014), MOPRO108.
[3]
D. Simon, R. Heine, et al., “Lattice and Beam Dynamics of
the Energy Recovery Mode of the Mainz Energy-recovering
Superconducting Accelerator MESA”, IPAC’15, Richmond,
USA (2015), MOPWA046.
[4]
W. Herr, F. Schmidt, "A MAD-X Primer", Geneva,
Switzer-land, CERN-AB-2004-027-ABP, (2004).
[5]
L.M. Young, "PARMELA", Los Alamos, USA, LA-
UR-96- 1835, (2005).
[6] F. Schlander, et al., “Investigation of Cryomodules for
the Mainz Energy-recovering Superconducting Accelera-
tor MESA”, IPAC’14, Dresden, Germany, p 2505 (2014),
WEPRI013.
[7] J. Teichert, et al., Nucl. Inst. and Meth. A 557 (2006) 239.
[8] F. Schlander, et al.,“1.3 GHz SRF Cryomodules for the Mainz
Energy-recovering Superconducting Accelerator MESA” ,IPAC’15, Richmond, USA (2015), WEPMA041.
[9] H. Euteneuer et al., “The Injector Linac for the Mainz Mi-
crotron”, EPAC88, Rome, Italy, p. 550 (1988).
[10] CST - Computer Simulation Technology, Darmstadt, Ger-
many.
[11] R. Heine et al., “Injector Linac for the MESA Facility”,
IPAC’13, Shanghai, China, p. 2150 (2013), WEPWA011.
[12] R. Heine et al.,“Further Investigations on the MESA injector”,
IPAC’15, Richmond, USA, (2015), TUPWA045.
[13] H. Braun et al., “The Gun/Chopper System for the MAINZ
Microtron”, EPAC88, Rome, Italy, p. 997 (1988).
[14]V. Bechtold, “Eine Deflektor-Kavität für den MESA Beschle-
uniger”, Diploma thesis, JGU Mainz, Germany (2013).
[15] B. Ledroit, “Hochfrequenzmessungen am Chopperresonator
für MESA”, Bachleor’s thesis, JGU Mainz, Germany (2014).
[16] B. Ledroit, “Aufbau und Test des MAMBO-Chopper”, Mas-
ter’s thesis, JGU Mainz, Germany, in preparation.
[17] C. Stoll, “Bau und Test von Solenoiden für MAMBO”, Mas-
ter’s thesis, JGU Mainz, Germany, in preparation.
[18] V.I. Shvedunov et al., “Design of a Prebuncher for Increased
Longitudinal Capture Efficiency of MAMI”, EPAC96, Sitges,
Spain, p.1502 (1996).
[19] P. Heil, “Design und Test eines harmonischen Buncher für
MAMBO”, Master’s thesis, JGU Mainz, Germany, in prepa-
ration.
[20] H. Büttig, et al., “Two Years Experience with the Upgraded
ELBE RF-System Driven by 20 kW Solid State Ampli-
fier Blocks (SSPA)”, IPAC’15, Dresden, Germany, p 2257,
WEPME003.
[21]
K. Aulenbacher, et al., AIP Conf. Proc. 675 (2002) 1088[22]
I. Alexander, “Diagnostic Test-Beam-Line For The MESA In-
jector”, ERL2015, Stony Brook, USA, (2015), THIALH2069.
[23] S. Friederich, K. Aulenbacher, “Test electron source for in-
creased brightness emission by near band gap photoemission”,
IPAC’15, Richmond, USA, (2015), TUPWA044.
[24] P.A. Adderley, et al., Phys. Rev. ST-AB 13 (2010) 010101.
WEIBLH1049 Proceedings of ERL2015, Stony Brook, NY, USA
ISBN 978-3-95450-183-0
62Cop
yrig
ht©
2015
CC
-BY-
3.0
and
byth
ere
spec
tive
auth
ors
WG5 ERL Applications
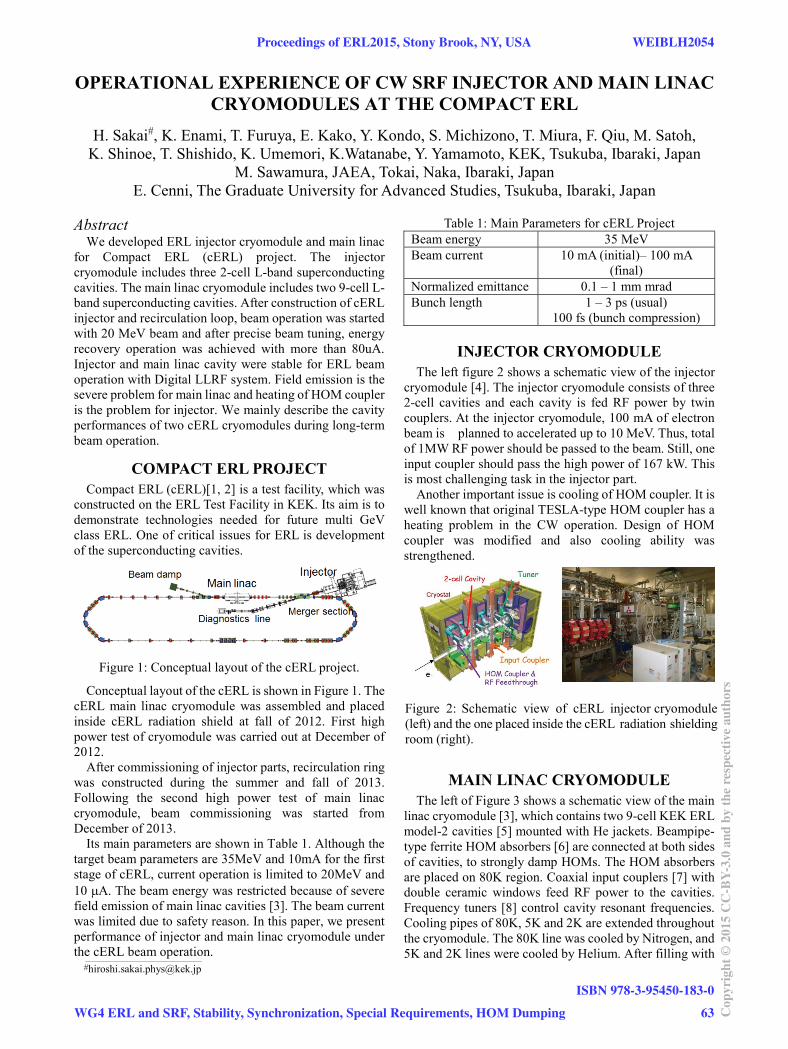
OPERATIONAL EXPERIENCE OF CW SRF INJECTOR AND MAIN LINAC CRYOMODULES AT THE COMPACT ERL
H. Sakai#, K. Enami, T. Furuya, E. Kako, Y. Kondo, S. Michizono, T. Miura, F. Qiu, M. Satoh, K. Shinoe, T. Shishido, K. Umemori, K.Watanabe, Y. Yamamoto, KEK, Tsukuba, Ibaraki, Japan
M. Sawamura, JAEA, Tokai, Naka, Ibaraki, Japan E. Cenni, The Graduate University for Advanced Studies, Tsukuba, Ibaraki, Japan
Abstract We developed ERL injector cryomodule and main linac
for Compact ERL (cERL) project. The injector cryomodule includes three 2-cell L-band superconducting cavities. The main linac cryomodule includes two 9-cell L-band superconducting cavities. After construction of cERL injector and recirculation loop, beam operation was started with 20 MeV beam and after precise beam tuning, energy recovery operation was achieved with more than 80uA. Injector and main linac cavity were stable for ERL beam operation with Digital LLRF system. Field emission is the severe problem for main linac and heating of HOM coupler is the problem for injector. We mainly describe the cavity performances of two cERL cryomodules during long-term beam operation.
COMPACT ERL PROJECT Compact ERL (cERL)[1, 2] is a test facility, which was
constructed on the ERL Test Facility in KEK. Its aim is to demonstrate technologies needed for future multi GeV class ERL. One of critical issues for ERL is development of the superconducting cavities.
Figure 1: Conceptual layout of the cERL project.
Conceptual layout of the cERL is shown in Figure 1. The cERL main linac cryomodule was assembled and placed inside cERL radiation shield at fall of 2012. First high power test of cryomodule was carried out at December of 2012.
After commissioning of injector parts, recirculation ring was constructed during the summer and fall of 2013. Following the second high power test of main linac cryomodule, beam commissioning was started from December of 2013.
Its main parameters are shown in Table 1. Although the target beam parameters are 35MeV and 10mA for the first stage of cERL, current operation is limited to 20MeV and 10 A. The beam energy was restricted because of severe field emission of main linac cavities [3]. The beam current was limited due to safety reason. In this paper, we present performance of injector and main linac cryomodule under the cERL beam operation.
Table 1: Main Parameters for cERL Project Beam energy 35 MeV Beam current 10 mA (initial)– 100 mA
(final) Normalized emittance 0.1 – 1 mm mrad Bunch length 1 – 3 ps (usual)
100 fs (bunch compression)
INJECTOR CRYOMODULE The left figure 2 shows a schematic view of the injector
cryomodule [4]. The injector cryomodule consists of three 2-cell cavities and each cavity is fed RF power by twin couplers. At the injector cryomodule, 100 mA of electron beam is planned to accelerated up to 10 MeV. Thus, total of 1MW RF power should be passed to the beam. Still, one input coupler should pass the high power of 167 kW. This is most challenging task in the injector part.
Another important issue is cooling of HOM coupler. It is well known that original TESLA-type HOM coupler has a heating problem in the CW operation. Design of HOM coupler was modified and also cooling ability was strengthened.
Figure 2: Schematic view of cERL injector cryomodule (left) and the one placed inside the cERL radiation shielding room (right).
MAIN LINAC CRYOMODULE The left of Figure 3 shows a schematic view of the main
linac cryomodule [3], which contains two 9-cell KEK ERL model-2 cavities [5] mounted with He jackets. Beampipe-type ferrite HOM absorbers [6] are connected at both sides of cavities, to strongly damp HOMs. The HOM absorbers are placed on 80K region. Coaxial input couplers [7] with double ceramic windows feed RF power to the cavities. Frequency tuners [8] control cavity resonant frequencies. Cooling pipes of 80K, 5K and 2K are extended throughout the cryomodule. The 80K line was cooled by Nitrogen, and 5K and 2K lines were cooled by Helium. After filling with ___________________________________________
Proceedings of ERL2015, Stony Brook, NY, USA WEIBLH2054
WG4 ERL and SRF, Stability, Synchronization, Special Requirements, HOM Dumping
ISBN 978-3-95450-183-0
63 Cop
yrig
ht©
2015
CC
-BY-
3.0
and
byth
ere
spec
tive
auth
ors
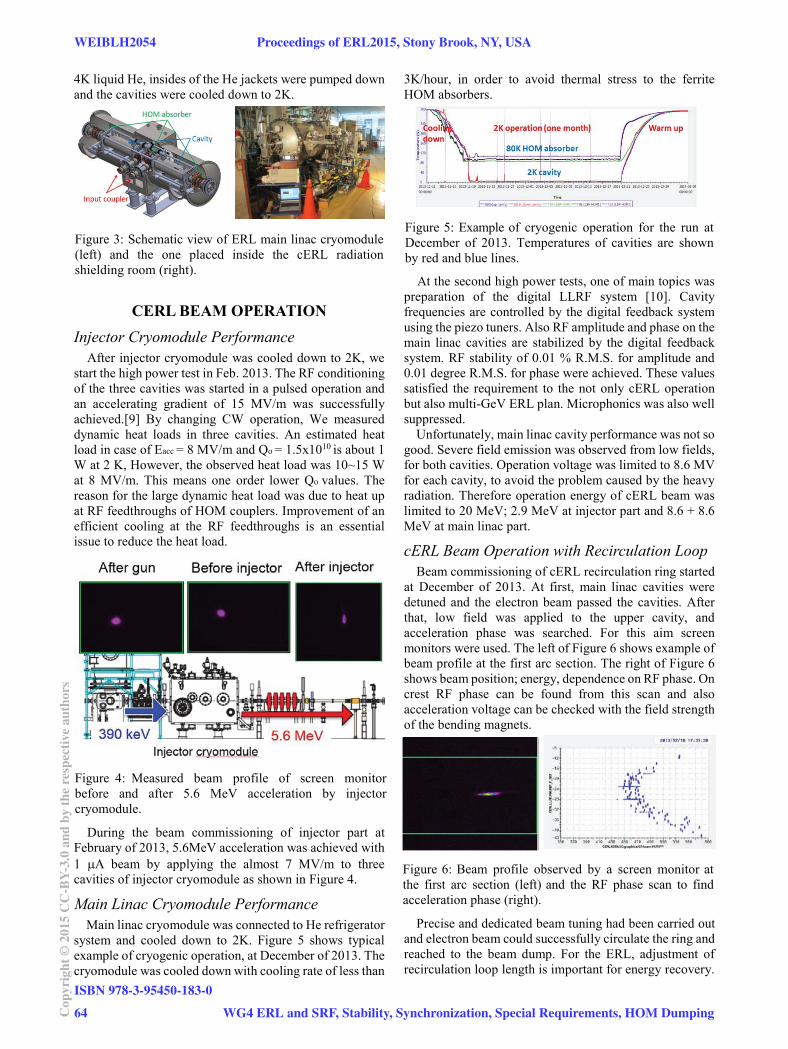
4K liquid He, insides of the He jackets were pumped down and the cavities were cooled down to 2K.
Figure 3: Schematic view of ERL main linac cryomodule (left) and the one placed inside the cERL radiationshielding room (right).
CERL BEAM OPERATIONInjector Cryomodule Performance
After injector cryomodule was cooled down to 2K, we start the high power test in Feb. 2013. The RF conditioning of the three cavities was started in a pulsed operation and an accelerating gradient of 15 MV/m was successfullyachieved.[9] By changing CW operation, We measured dynamic heat loads in three cavities. An estimated heat load in case of Eacc = 8 MV/m and Qo = 1.5x10¹⁰ is about 1 W at 2 K, However, the observed heat load was 10~15 W at 8 MV/m. This means one order lower Qo values. The reason for the large dynamic heat load was due to heat up at RF feedthroughs of HOM couplers. Improvement of an efficient cooling at the RF feedthroughs is an essential issue to reduce the heat load.
Figure 4: Measured beam profile of screen monitor before and after 5.6 MeV acceleration by injector cryomodule.
During the beam commissioning of injector part at February of 2013, 5.6MeV acceleration was achieved with 1 A beam by applying the almost 7 MV/m to three cavities of injector cryomodule as shown in Figure 4.
Main Linac Cryomodule Performance Main linac cryomodule was connected to He refrigerator
system and cooled down to 2K. Figure 5 shows typical example of cryogenic operation, at December of 2013. The cryomodule was cooled down with cooling rate of less than
3K/hour, in order to avoid thermal stress to the ferrite HOM absorbers.
Figure 5: Example of cryogenic operation for the run at December of 2013. Temperatures of cavities are shown by red and blue lines.
At the second high power tests, one of main topics was preparation of the digital LLRF system [10]. Cavity frequencies are controlled by the digital feedback system using the piezo tuners. Also RF amplitude and phase on the main linac cavities are stabilized by the digital feedback system. RF stability of 0.01 % R.M.S. for amplitude and 0.01 degree R.M.S. for phase were achieved. These values satisfied the requirement to the not only cERL operationbut also multi-GeV ERL plan. Microphonics was also well suppressed.
Unfortunately, main linac cavity performance was not so good. Severe field emission was observed from low fields, for both cavities. Operation voltage was limited to 8.6 MV for each cavity, to avoid the problem caused by the heavy radiation. Therefore operation energy of cERL beam was limited to 20 MeV; 2.9 MeV at injector part and 8.6 + 8.6MeV at main linac part.
cERL Beam Operation with Recirculation LoopBeam commissioning of cERL recirculation ring started
at December of 2013. At first, main linac cavities were detuned and the electron beam passed the cavities. After that, low field was applied to the upper cavity, and acceleration phase was searched. For this aim screen monitors were used. The left of Figure 6 shows example of beam profile at the first arc section. The right of Figure 6 shows beam position; energy, dependence on RF phase. On crest RF phase can be found from this scan and also acceleration voltage can be checked with the field strength of the bending magnets.
Figure 6: Beam profile observed by a screen monitor atthe first arc section (left) and the RF phase scan to find acceleration phase (right).
Precise and dedicated beam tuning had been carried out and electron beam could successfully circulate the ring and reached to the beam dump. For the ERL, adjustment of recirculation loop length is important for energy recovery.
WEIBLH2054 Proceedings of ERL2015, Stony Brook, NY, USA
ISBN 978-3-95450-183-0
64Cop
yrig
ht©
2015
CC
-BY-
3.0
and
byth
ere
spec
tive
auth
ors
WG4 ERL and SRF, Stability, Synchronization, Special Requirements, HOM Dumping
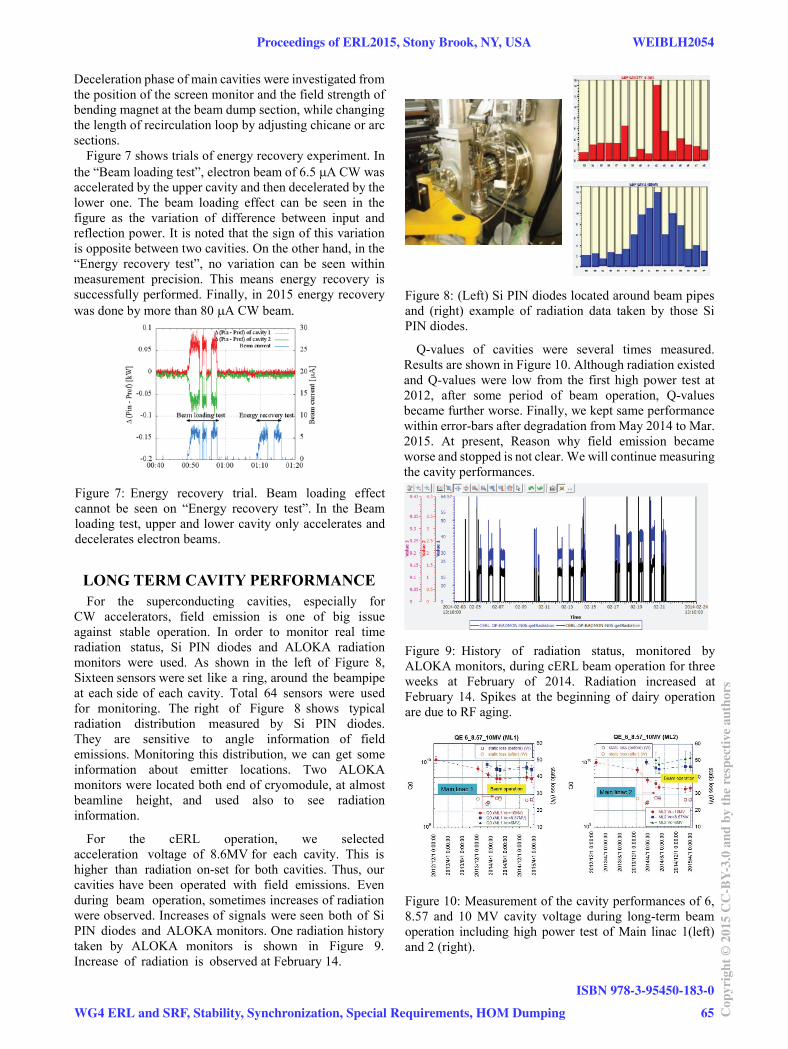
Deceleration phase of main cavities were investigated from the position of the screen monitor and the field strength of bending magnet at the beam dump section, while changing the length of recirculation loop by adjusting chicane or arc sections.
Figure 7 shows trials of energy recovery experiment. Inthe “Beam loading test”, electron beam of 6.5 A CW was accelerated by the upper cavity and then decelerated by the lower one. The beam loading effect can be seen in the figure as the variation of difference between input and reflection power. It is noted that the sign of this variation is opposite between two cavities. On the other hand, in the “Energy recovery test”, no variation can be seen within measurement precision. This means energy recovery is successfully performed. Finally, in 2015 energy recovery was done by more than 80 A CW beam.
Figure 7: Energy recovery trial. Beam loading effect cannot be seen on “Energy recovery test”. In the Beam loading test, upper and lower cavity only accelerates anddecelerates electron beams.
LONG TERM CAVITY PERFORMANCEFor the superconducting cavities, especially for
CW accelerators, field emission is one of big issue against stable operation. In order to monitor real time radiation status, Si PIN diodes and ALOKA radiation monitors were used. As shown in the left of Figure 8,Sixteen sensors were set like a ring, around the beampipe at each side of each cavity. Total 64 sensors were used for monitoring. The right of Figure 8 shows typical radiation distribution measured by Si PIN diodes. They are sensitive to angle information of field emissions. Monitoring this distribution, we can get some information about emitter locations. Two ALOKAmonitors were located both end of cryomodule, at almostbeamline height, and used also to see radiation information.
For the cERL operation, we selectedacceleration voltage of 8.6MV for each cavity. This is higher than radiation on-set for both cavities. Thus, our cavities have been operated with field emissions. Even during beam operation, sometimes increases of radiation were observed. Increases of signals were seen both of Si PIN diodes and ALOKA monitors. One radiation history taken by ALOKA monitors is shown in Figure 9.Increase of radiation is observed at February 14.
Figure 8: (Left) Si PIN diodes located around beam pipesand (right) example of radiation data taken by those Si PIN diodes.
Q-values of cavities were several times measured. Results are shown in Figure 10. Although radiation existed and Q-values were low from the first high power test at 2012, after some period of beam operation, Q-values became further worse. Finally, we kept same performance within error-bars after degradation from May 2014 to Mar. 2015. At present, Reason why field emission became worse and stopped is not clear. We will continue measuring the cavity performances.
Figure 9: History of radiation status, monitored by ALOKA monitors, during cERL beam operation for three weeks at February of 2014. Radiation increased at February 14. Spikes at the beginning of dairy operation are due to RF aging.
Figure 10: Measurement of the cavity performances of 6, 8.57 and 10 MV cavity voltage during long-term beam operation including high power test of Main linac 1(left)and 2 (right).
Proceedings of ERL2015, Stony Brook, NY, USA WEIBLH2054
WG4 ERL and SRF, Stability, Synchronization, Special Requirements, HOM Dumping
ISBN 978-3-95450-183-0
65 Cop
yrig
ht©
2015
CC
-BY-
3.0
and
byth
ere
spec
tive
auth
ors

As one trial to suppress field emissions, pulse processing method was applied. Several milliseconds of additional few MV pulses were added to nominal 8.6MV CW RF field. Figure 11 shows the trial of pulse processing to the upper cavity. Figure 11 (a) shows RF field applied on the cavity and (b) shows its pulse structure. Figure 11 (c) shows variations of radiation signals monitored by Si diodes during processing. Time period of Figure (a) and (c) are same. It can be seen that several radiation signals became smaller during processing. Radiation becomes about half. Thus, Pulse processing method is considered to be effective to suppress field emissions.
At moment, field emission limits main linac cavity performance. To recover the design acceleration field of 15MV, it is essential to eliminate it. Our ideas of countermeasure against field emission are as following; (a) apply more sophisticated pulse processing, (b) apply He processing, (c) disassemble the cryomodule, apply HPR to the cavities and reassemble it.
It is noted that suppression of field emission is of course essential for CW operation of superconducting cavities, but also recovery method from heavy field emission is important. If an effective recovery method is realized, possibly without disassembling the cryomodule, it is desirable.
Figure 11: (a) RF field during pulse processing and (b) its magnification. (c) Decrease of radiation signal, observed by Si PIN diodes, during pulse processing.
SUMMARY AND FUTURE PLANThe compact ERL in KEK was constructed and beam
commissioning has been carried out for recirculation loop.Operation voltage of main linac cavities was restricted to 8.6 MV per cavity. So beam energy was limited up to 20 MeV. After beam tuning, energy recovery operation was successfully performed. RF stability of cavities were enough good for cERL beam operation. Field emission of main linac cavity is one of big issues for CW operation of
ERL cavities. During beam operation, increases of radiation were sometimes observed. Pulse processing method was efficient to suppress field emissions.
We continue to see the cavity performance during the CW beam operation up to more than 10 mA. And we plan to make the new cryomodule with for 9c-cell cavities toovercome field emission problem with higher gradient and prepare the mass production.
REFERENCES[1] R. Hajima et al. (ed.), KEK Report 2007-7/ JAEA-Research
2008-032 (2008) [in Japanese][2] N. Nakamura et al., “Present status of the Compact ERL at
KEK”, IPAC’14, Dresden, Germany, June 2014, p.2450 (2014).
[3] K. Umemori et al., “Construction of main linac cryomodule for Compact ERL project”, IPAC’13, Shanghai, China, May 2013, p.2349 (2013)
[4] K. Watanabe et al., “Development of the superconducting rf 2-cell cavity for cERL injector at KEK”, Nuclear Instruments and Methods In Physics Research A, Vol. 714 p.67 (2013).
[5] K. Umemori et al., “Design of L-band superconducting cavity for the energy recovery linacs”, APAC’07, Indore, India, Feb 2007, p.570 (2007)
[6] M. Sawamura et al., “Cooling properties of HOM absorber model for cERL in Japan”, SRF’2011, Chicago, July, 2011,p.350(2011)
[7] H. Sakai et al., “High power tests of KEK-ERL input coupler for main linac under liquid nitrogen condition”, SRF’2011, Chicago, July, 2011, p.356(2011)
[8] S. Noguchi et al., “New tuners for ILC cavity application”,SRF’07 Beijing, Oct, 2007, WE303.
[9] E. Kako et al., “High Power Tests of Injector Cryomodule for Compact-ERL”, IPAC’13, Shanghai, China, May 2013, p.2340 (2013).
[10] T. Miura et al., “Performance of RF system for Compact-ERL Main Linac at KEK”, IPAC’14, Dresden, Germany, June 2014, p.2450 (2014).
WEIBLH2054 Proceedings of ERL2015, Stony Brook, NY, USA
ISBN 978-3-95450-183-0
66Cop
yrig
ht©
2015
CC
-BY-
3.0
and
byth
ere
spec
tive
auth
ors
WG4 ERL and SRF, Stability, Synchronization, Special Requirements, HOM Dumping
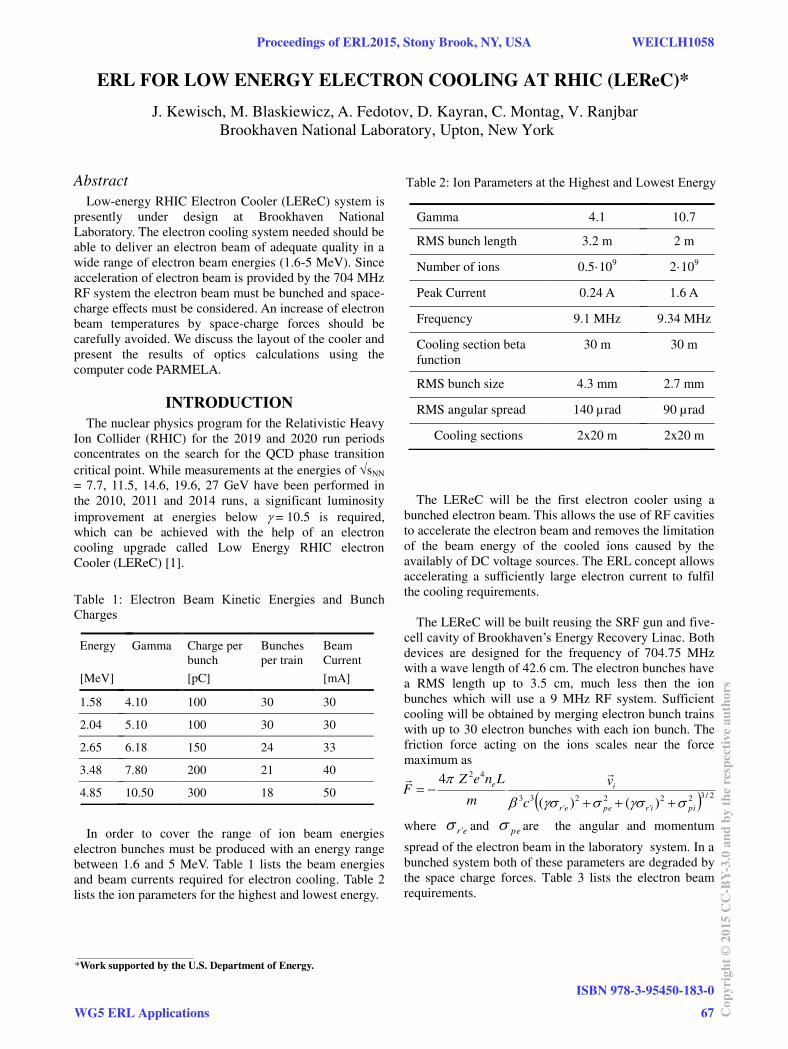
ERL FOR LOW ENERGY ELECTRON COOLING AT RHIC (LER C)*
J. Kewisch, M. Blaskiewicz, A. Fedotov, D. Kayran, C. Montag, V. Ranjbar
Brookhaven National Laboratory, Upton, New York
Abstract
Low-energy RHIC Electron Cooler (LEReC) system is
presently under design at Brookhaven National
Laboratory. The electron cooling system needed should be
able to deliver an electron beam of adequate quality in a
wide range of electron beam energies (1.6-5 MeV). Since
acceleration of electron beam is provided by the 704 MHz
RF system the electron beam must be bunched and space-
charge effects must be considered. An increase of electron
beam temperatures by space-charge forces should be
carefully avoided. We discuss the layout of the cooler and
present the results of optics calculations using the
computer code PARMELA.
INTRODUCTION
The nuclear physics program for the Relativistic Heavy
Ion Collider (RHIC) for the 2019 and 2020 run periods
concentrates on the search for the QCD phase transition
critical point. While measurements at the energies of sNN
= 7.7, 11.5, 14.6, 19.6, 27 GeV have been performed in
the 2010, 2011 and 2014 runs, a significant luminosity
improvement at energies below = 10.5 is required,
which can be achieved with the help of an electron
cooling upgrade called Low Energy RHIC electron
Cooler (LEReC) [1].
Table 1: Electron Beam Kinetic Energies and Bunch
Charges
In order to cover the range of ion beam energies
electron bunches must be produced with an energy range
between 1.6 and 5 MeV. Table 1 lists the beam energies
and beam currents required for electron cooling. Table 2
lists the ion parameters for the highest and lowest energy.
Table 2: Ion Parameters at the Highest and Lowest Energy
The LEReC will be the first electron cooler using a
bunched electron beam. This allows the use of RF cavities
to accelerate the electron beam and removes the limitation
of the beam energy of the cooled ions caused by the
availably of DC voltage sources. The ERL concept allows
accelerating a sufficiently large electron current to fulfil
the cooling requirements.
The LEReC will be built reusing the SRF gun and five-
cell cavity of Brookhaven’s Energy Recovery Linac. Both devices are designed for the frequency of 704.75 MHz
with a wave length of 42.6 cm. The electron bunches have
a RMS length up to 3.5 cm, much less then the ion
bunches which will use a 9 MHz RF system. Sufficient
cooling will be obtained by merging electron bunch trains
with up to 30 electron bunches with each ion bunch. The
friction force acting on the ions scales near the force
maximum as
where er ' and pe are the angular and momentum
spread of the electron beam in the laboratory system. In a
bunched system both of these parameters are degraded by
the space charge forces. Table 3 lists the electron beam
requirements.
Gamma 4.1 10.7
RMS bunch length 3.2 m 2 m
Number of ions 0.5·109 2·10
9
Peak Current 0.24 A 1.6 A
Frequency 9.1 MHz 9.34 MHz
Cooling section beta
function
30 m 30 m
RMS bunch size 4.3 mm 2.7 mm
RMS angular spread 140 µrad 90 µrad
Cooling sections 2x20 m 2x20 m
Energy
[MeV]
Gamma Charge per
bunch
[pC]
Bunches
per train
Beam
Current
[mA]
1.58 4.10 100 30 30
2.04 5.10 100 30 30
2.65 6.18 150 24 33
3.48 7.80 200 21 40
4.85 10.50 300 18 50 2/322
'
22
'
33
42
)()(
4
piirpeer
ie
c
v
m
LneZF
___________________________________________
*Work supported by the U.S. Department of Energy.
e
Proceedings of ERL2015, Stony Brook, NY, USA WEICLH1058
WG5 ERL Applications
ISBN 978-3-95450-183-0
67 Cop
yrig
ht©
2015
CC
-BY-
3.0
and
byth
ere
spec
tive
auth
ors
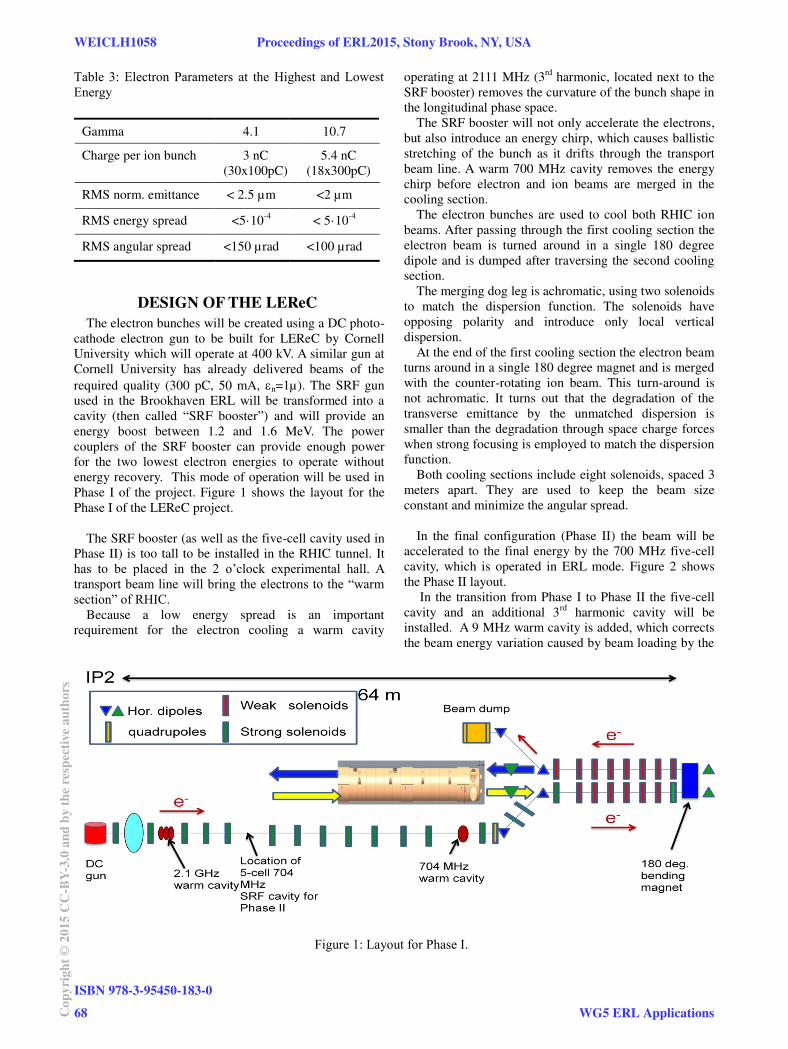
Table 3: Electron Parameters at the Highest and Lowest
Energy
DESIGN OF THE LER C The electron bunches will be created using a DC photo-
cathode electron gun to be built for LEReC by Cornell
University which will operate at 400 kV. A similar gun at
Cornell University has already delivered beams of the
required quality (300 pC, 50 mA, n=1µ). The SRF gun
used in the Brookhaven ERL will be transformed into a
cavity (then called “SRF booster”) and will provide an
energy boost between 1.2 and 1.6 MeV. The power
couplers of the SRF booster can provide enough power
for the two lowest electron energies to operate without
energy recovery. This mode of operation will be used in
Phase I of the project. Figure 1 shows the layout for the
Phase I of the LEReC project.
The SRF booster (as well as the five-cell cavity used in
Phase II) is too tall to be installed in the RHIC tunnel. It
has to be placed in the 2 o’clock experimental hall. A transport beam line will bring the electrons to the “warm section” of RHIC.
Because a low energy spread is an important
requirement for the electron cooling a warm cavity
operating at 2111 MHz (3rd
harmonic, located next to the
SRF booster) removes the curvature of the bunch shape in
the longitudinal phase space.
The SRF booster will not only accelerate the electrons,
but also introduce an energy chirp, which causes ballistic
stretching of the bunch as it drifts through the transport
beam line. A warm 700 MHz cavity removes the energy
chirp before electron and ion beams are merged in the
cooling section.
The electron bunches are used to cool both RHIC ion
beams. After passing through the first cooling section the
electron beam is turned around in a single 180 degree
dipole and is dumped after traversing the second cooling
section.
The merging dog leg is achromatic, using two solenoids
to match the dispersion function. The solenoids have
opposing polarity and introduce only local vertical
dispersion.
At the end of the first cooling section the electron beam
turns around in a single 180 degree magnet and is merged
with the counter-rotating ion beam. This turn-around is
not achromatic. It turns out that the degradation of the
transverse emittance by the unmatched dispersion is
smaller than the degradation through space charge forces
when strong focusing is employed to match the dispersion
function.
Both cooling sections include eight solenoids, spaced 3
meters apart. They are used to keep the beam size
constant and minimize the angular spread.
In the final configuration (Phase II) the beam will be
accelerated to the final energy by the 700 MHz five-cell
cavity, which is operated in ERL mode. Figure 2 shows
the Phase II layout.
In the transition from Phase I to Phase II the five-cell
cavity and an additional 3rd
harmonic cavity will be
installed. A 9 MHz warm cavity is added, which corrects
the beam energy variation caused by beam loading by the
Gamma 4.1 10.7
Charge per ion bunch 3 nC
(30x100pC)
5.4 nC
(18x300pC)
RMS norm. emittance < 2.5 µm <2 µm
RMS energy spread <5·10-4
< 5·10-4
RMS angular spread <150 µrad <100 µrad
Figure 1: Layout for Phase I.
e
WEICLH1058 Proceedings of ERL2015, Stony Brook, NY, USA
ISBN 978-3-95450-183-0
68Cop
yrig
ht©
2015
CC
-BY-
3.0
and
byth
ere
spec
tive
auth
ors
WG5 ERL Applications
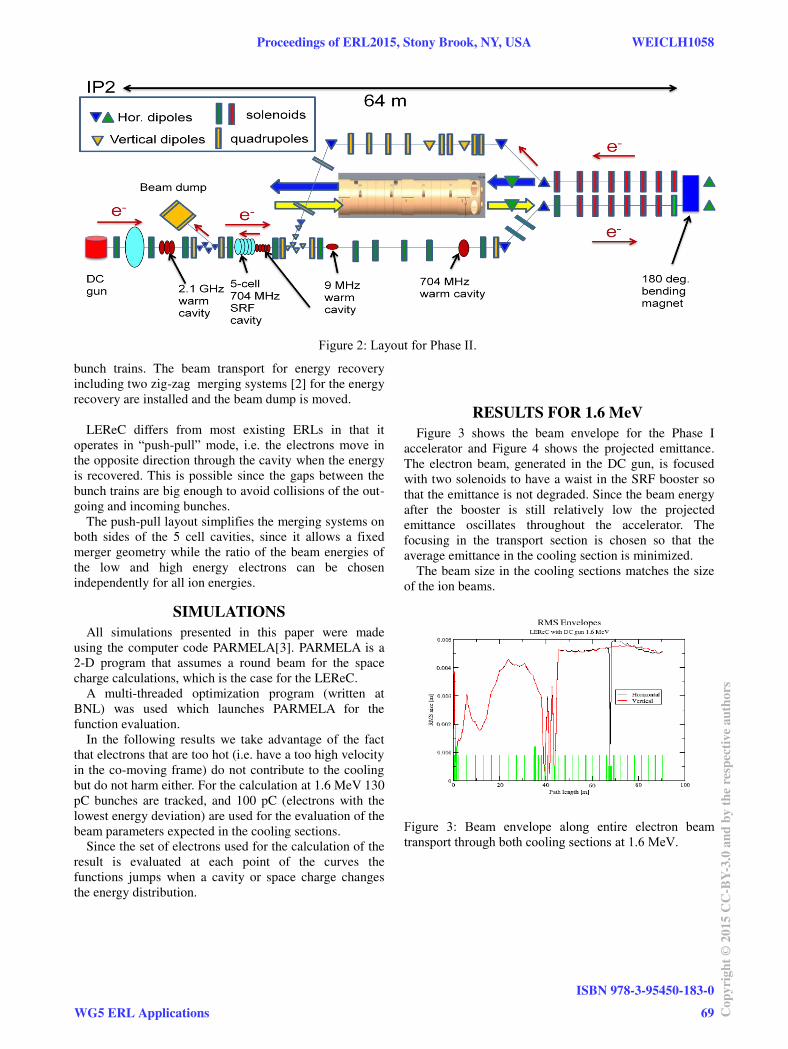
bunch trains. The beam transport for energy recovery
including two zig-zag merging systems [2] for the energy
recovery are installed and the beam dump is moved.
LEReC differs from most existing ERLs in that it
operates in “push-pull” mode, i.e. the electrons move in the opposite direction through the cavity when the energy
is recovered. This is possible since the gaps between the
bunch trains are big enough to avoid collisions of the out-
going and incoming bunches.
The push-pull layout simplifies the merging systems on
both sides of the 5 cell cavities, since it allows a fixed
merger geometry while the ratio of the beam energies of
the low and high energy electrons can be chosen
independently for all ion energies.
SIMULATIONS
All simulations presented in this paper were made
using the computer code PARMELA[3]. PARMELA is a
2-D program that assumes a round beam for the space
charge calculations, which is the case for the LEReC.
A multi-threaded optimization program (written at
BNL) was used which launches PARMELA for the
function evaluation.
In the following results we take advantage of the fact
that electrons that are too hot (i.e. have a too high velocity
in the co-moving frame) do not contribute to the cooling
but do not harm either. For the calculation at 1.6 MeV 130
pC bunches are tracked, and 100 pC (electrons with the
lowest energy deviation) are used for the evaluation of the
beam parameters expected in the cooling sections.
Since the set of electrons used for the calculation of the
result is evaluated at each point of the curves the
functions jumps when a cavity or space charge changes
the energy distribution.
RESULTS FOR 1.6 M V Figure 3 shows the beam envelope for the Phase I
accelerator and Figure 4 shows the projected emittance.
The electron beam, generated in the DC gun, is focused
with two solenoids to have a waist in the SRF booster so
that the emittance is not degraded. Since the beam energy
after the booster is still relatively low the projected
emittance oscillates throughout the accelerator. The
focusing in the transport section is chosen so that the
average emittance in the cooling section is minimized.
The beam size in the cooling sections matches the size
of the ion beams.
Figure 3: Beam envelope along entire electron beam
transport through both cooling sections at 1.6 MeV.
Figure 2: Layout for Phase II.
e
Proceedings of ERL2015, Stony Brook, NY, USA WEICLH1058
WG5 ERL Applications
ISBN 978-3-95450-183-0
69 Cop
yrig
ht©
2015
CC
-BY-
3.0
and
byth
ere
spec
tive
auth
ors
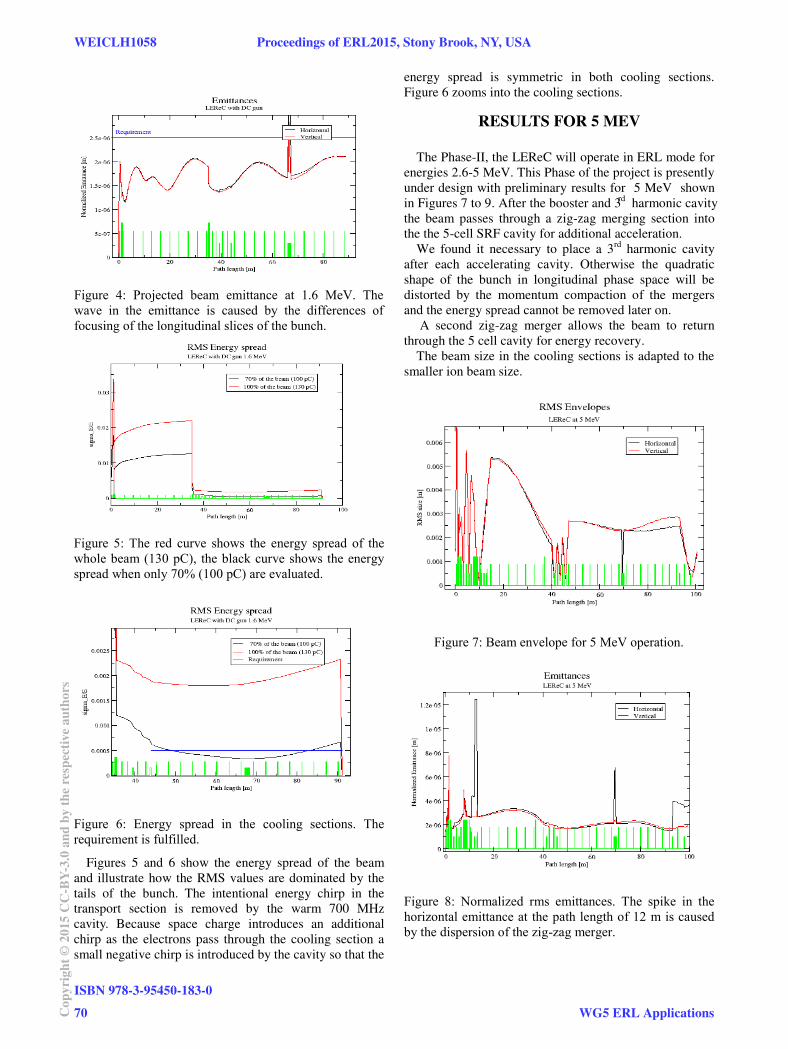
Figure 4: Projected beam emittance at 1.6 MeV. The
wave in the emittance is caused by the differences of
focusing of the longitudinal slices of the bunch.
Figure 5: The red curve shows the energy spread of the
whole beam (130 pC), the black curve shows the energy
spread when only 70% (100 pC) are evaluated.
Figure 6: Energy spread in the cooling sections. The
requirement is fulfilled.
Figures 5 and 6 show the energy spread of the beam
and illustrate how the RMS values are dominated by the
tails of the bunch. The intentional energy chirp in the
transport section is removed by the warm 700 MHz
cavity. Because space charge introduces an additional
chirp as the electrons pass through the cooling section a
small negative chirp is introduced by the cavity so that the
energy spread is symmetric in both cooling sections.
Figure 6 zooms into the cooling sections.
RESULTS FOR 5 MEV
The Phase-II, the LEReC will operate in ERL mode for
energies 2.6-5 MeV. This Phase of the project is presently
under design with preliminary results for 5 MeV shown
in Figures 7 to 9. After the booster and 3 harmonic cavity rd
the beam passes through a zig-zag merging section into
the the 5-cell SRF cavity for additional acceleration.
We found it necessary to place a 3rd
harmonic cavity
after each accelerating cavity. Otherwise the quadratic
shape of the bunch in longitudinal phase space will be
distorted by the momentum compaction of the mergers
and the energy spread cannot be removed later on.
A second zig-zag merger allows the beam to return
through the 5 cell cavity for energy recovery.
The beam size in the cooling sections is adapted to the
smaller ion beam size.
Figure 7: Beam envelope for 5 MeV operation.
Figure 8: Normalized rms emittances. The spike in the
horizontal emittance at the path length of 12 m is caused
by the dispersion of the zig-zag merger.
WEICLH1058 Proceedings of ERL2015, Stony Brook, NY, USA
ISBN 978-3-95450-183-0
70Cop
yrig
ht©
2015
CC
-BY-
3.0
and
byth
ere
spec
tive
auth
ors
WG5 ERL Applications
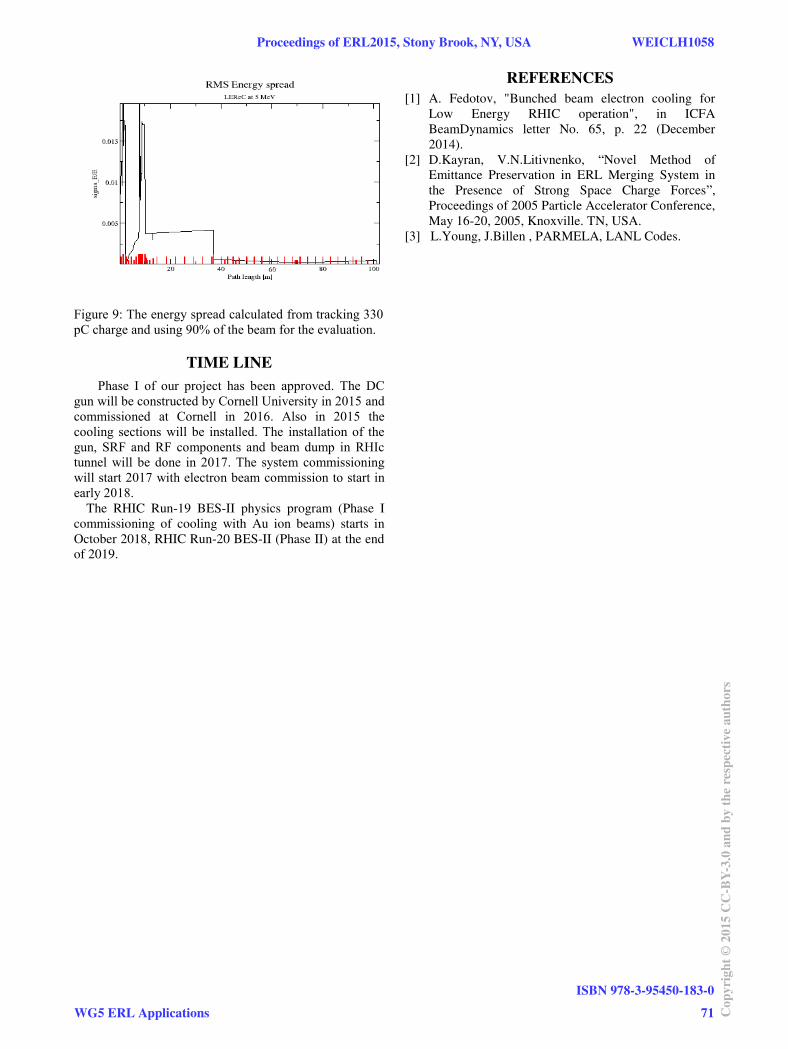
Figure 9: The energy spread calculated from tracking 330
pC charge and using 90% of the beam for the evaluation.
TIME LINE
Phase I of our project has been approved. The DC
gun will be constructed by Cornell University in 2015 and
commissioned at Cornell in 2016. Also in 2015 the
cooling sections will be installed. The installation of the
gun, SRF and RF components and beam dump in RHIc
tunnel will be done in 2017. The system commissioning
will start 2017 with electron beam commission to start in
early 2018.
The RHIC Run-19 BES-II physics program (Phase I
commissioning of cooling with Au ion beams) starts in
October 2018, RHIC Run-20 BES-II (Phase II) at the end
of 2019.
REFERENCES
[1] A. Fedotov, "Bunched beam electron cooling for
Low Energy RHIC operation", in ICFA
BeamDynamics letter No. 65, p. 22 (December
2014).
[2] D.Kayran, V.N.Litivnenko, “Novel Method of
Emittance Preservation in ERL Merging System in
the Presence of Strong Space Charge Forces”,
Proceedings of 2005 Particle Accelerator Conference,
May 16-20, 2005, Knoxville. TN, USA.
[3] L.Young, J.Billen , PARMELA, LANL Codes.
Proceedings of ERL2015, Stony Brook, NY, USA WEICLH1058
WG5 ERL Applications
ISBN 978-3-95450-183-0
71 Cop
yrig
ht©
2015
CC
-BY-
3.0
and
byth
ere
spec
tive
auth
ors

DEVELOPMENT FOR MASS PRODUCTION OF SUPERCONDUCTING CAVITY BY MHI
K. Kanaoka, H. Hara, K. Okihira, K. Sennyu, T. Yanagisawa, Mitsubishi Heavy Industries, Ltd., Mihara, Hiroshima, Japan
R. Matsuda, Mitsubishi Heavy Industries, Ltd., Takasago, Hyogo, Japan
Abstract Mitsubishi Heavy Industries (MHI) has developed the
manufacturing process of superconducting cavities for along time. In this paper, recent progress of our work will be reported.
INTRODUCTIONMHI has improved our superconducting technology to
take part in the production design and manufacturing of the cryomodules including the superconducting cavities. Figure 1 shows the schematic view of cERL in KEK. MHI produced the injector module of cERL shown in figure 2 which contains three 9-cell cavities. We performed the production design and fabrication of the parts and assembly of the cryomodule at KEK. We also fabricated the main accelerator module for cERL shown in figure 3. The assembly of the cryomodule was also performed by MHI at KEK except the assembly in the clean room. These cryomodules conform to Japanese high pressure gas safety law [1][2][3].
Figure 1: Schematic view of cERL in KEK.
Figure 2: Injector module of cERL in KEK.
Figure 3: Main accelerator module of cERL in KEK.
The high intensity electron gun will be requested for the next generation ERL. As a plan for the future, we have developed SRF electron gun in collaboration with KEK [3].We designed the 1.3GHz 1.5-cell elliptical cavity for the superconducting RF electron gun. The spec and the electric field distribution of the gun are shown in figure 4. As the first step, we designed the shape of the cavity and analysed the electric field distribution by SUPERFISH.
Figure 4: Spec(left) and electric field distribution (right) ofsuperconducting RF electron gun.
Figure 5 shows the simplified schematic and the photos of the parts before assembly.
Figure 5: Manufacturing procedure of the half-cells.
We fabricated the Prototype#1 shown in figure 6. This cavity is under the preparation of the vertical test in KEK. The result will be reported soon. Now, we are studying the
WEICLH2062 Proceedings of ERL2015, Stony Brook, NY, USA
ISBN 978-3-95450-183-0
72Cop
yrig
ht©
2015
CC
-BY-
3.0
and
byth
ere
spec
tive
auth
ors
WG4 ERL and SRF, Stability, Synchronization, Special Requirements, HOM Dumping

choke structure and the coupling calculation of the input coupler and so on.
Figure 6: Prototype#1.
Cu plating for the input coupler requires high intensity electric conductivity to suppress RF resistance and low thermal conductivity to supress the heat transfer. Thin copper plating film on the stainless steel plate and high RRR are required.
We are developing the manufacturing method of high power input coupler for the purpose of low RF loss for high power and low heat penetration in collaboration with KEK.We fabricated the Cu plating sample by periodic reverse copper electroplating. And, we measured RRR of the Cu plating on the stainless steel bars. 3 samples (t=10,20,30m Cu plating on t=1mm stainless steel plate) were prepared and measured RRR of each sample. However, it is difficult to measure directly the resistivity of the Cu plating. So we measured both Cu plated/unplated samples and calculated RRR. Heat treatment also has an influence on the resistivity. Therefore, we measured both with/without heat-treated(800 ) samples.
Figure 7 shows the cross section of the samples. We measured the thickness of the sample by the laser microscope.
Figure 8 shows the results of the measurement. We found RRR of Cu plating without heat treatment satisfied the requirement. On the other hand, the heat treatment decreases RRR of Cu plating on stainless steel. We are preparing the measurement of the chemical composition of the Cu layer.
Figure 7: Sample (left), Cross section of the samples(right).
Figure 8: Result of the measurement.
DEVELOPMENT OF FABRICATION METHOD FOR MASS-PRODUCTION
In future, the mass production of the superconducting cavities will be required for the main linac of ERL. MHI has planned to have the factory to manufacture 200 cavities in 3 years. From now on, the activities of mass production performed by MHI will be introduced.
MHI’s Development Histories of the Cavity Fabrication Methods
Table 1 shows our development histories of the cavity fabrication methods. Our technical developments are shown as below: [3][4][5]
Welding process for stiffener from EBW to LBW.Welding process for baseplate EBW and LBW.Number of the cavity for final welding per 1 chamberfrom 1 cavity to 4 cavities.Seamless dumbbell applied to 2-cell cavity.Unification monitor port and flange
Table 1: Development Histories for Mass-production
Phase CavityNo.
Welding process for stiffener
Welding process for baseplate
Number of the cavity for final welding per 1 chamber
New process
R&D MHI-A9-cell
LBW EBW 1
MHI-B2-cell
- - 1 Seamless dumbbell
MHI-C 9-cell
LBW LBW 1 9seam/1batch
MHI-D 9-cell
LBW EBW 1 +3 dummy
Unification of
monitor port and flange
STF2-a
#23-26 LBW EBW 2 Using retainer ring for monitor
port
STF2-b
#27-30 LBW EBW 2
Cu plating
Proceedings of ERL2015, Stony Brook, NY, USA WEICLH2062
WG4 ERL and SRF, Stability, Synchronization, Special Requirements, HOM Dumping
ISBN 978-3-95450-183-0
73 Cop
yrig
ht©
2015
CC
-BY-
3.0
and
byth
ere
spec
tive
auth
ors

LBW for the Welding Process for StiffenerFigure 9 shows the laser welding machine which is
applied to the welding of the stiffener rings. Lasergenerated by the oscillator is switched by the beam switch and directed to the welding station through the fiber. This laser welding machine can be used for the welding in this station and also other stations continuously [3][4][5].
Figure 9: Composition of LBW machine.
Seamless Dumbbell Figure 10 shows the process of the manufacture of the
seamless dumbbell. The seamless pipe is made by deep drawing from a Niobium sheet and cut both end. We use spinning for the forming but not use hydroforming. We can process from “Set of the pipe” to “Turning for stiffener” without grip-changing. We fabricated the 2-call superconducting cavity called MHI-B by using the seamless dumbbell, and performed the vertical test in JLab in collaboration with JLab and KEK. This cavity reached 32.4[MV/m] [3][4][5].
Figure 10: Process of the manufacture of the seamlessdumbbell.
Unification of Monitor Port and Flange Figure 11 shows the superconducting cavity called MHI-
D. We succeeded to reduce 3 parts and 3 welding line by the combination of pick up port and flange. We changed the materials for pick up port from Niobium Titanium alloy and pure Niobium to ASTM Gr-2 Niobium. We performed the leak test for it at 2K and confirmed there was no leak[4][5].
Figure 11: Result of the measurement.
Batch ProcessMHI has the EBW machine which can contain four 9-cell
cavities by vertical position and weld them in one batch. We succeeded in welding all seams of equator of four cavities in one batch (see Fig. 12). One of these cavities reached 34.9[MV/m] by the vertical test in KEK [4][5].
Figure 12: Batch process.
SUMMARYMHI fabricated “Injector module”, “Main acceleratormodule” for KEK cERLMHI has improved mass-production method shown asbelow.- Laser beam welding- Seamless dumbbell- Changing the material of HOM couplerMHI is currently developing “SRF electron gun”,“Coupler” now.
REFERENCES[1] F. Inoue, et al., “The Development of Cryomodule for c-
ERL at MHI”, ERL2013, Novosibirsk, Russia, 2013, PS15[2] T. Yanagisawa, et al., “Development for Mass Production of
Superconducting Cavity by MHI” IPAC2015, Richmond,VA, USA, July 2015, WEPMA048.
[3] H. Hitomi, et al., “Fabrication of Superconducting RF cavity at MHI”, ERL2011, Tsukuba, Japan, 2011, WG3002.
[4] H. Hara, et al., “SRF activities at MHI,” TTC Meeting,Tsukuba, Japan, December 2014, WD4 Id86.
[5] K. Sennyu, et al., “Industrialization of ILC from a view point of industry”, 4th IPAC13, Shanghai, China, 2013, WEIB203.
WEICLH2062 Proceedings of ERL2015, Stony Brook, NY, USA
ISBN 978-3-95450-183-0
74Cop
yrig
ht©
2015
CC
-BY-
3.0
and
byth
ere
spec
tive
auth
ors
WG4 ERL and SRF, Stability, Synchronization, Special Requirements, HOM Dumping
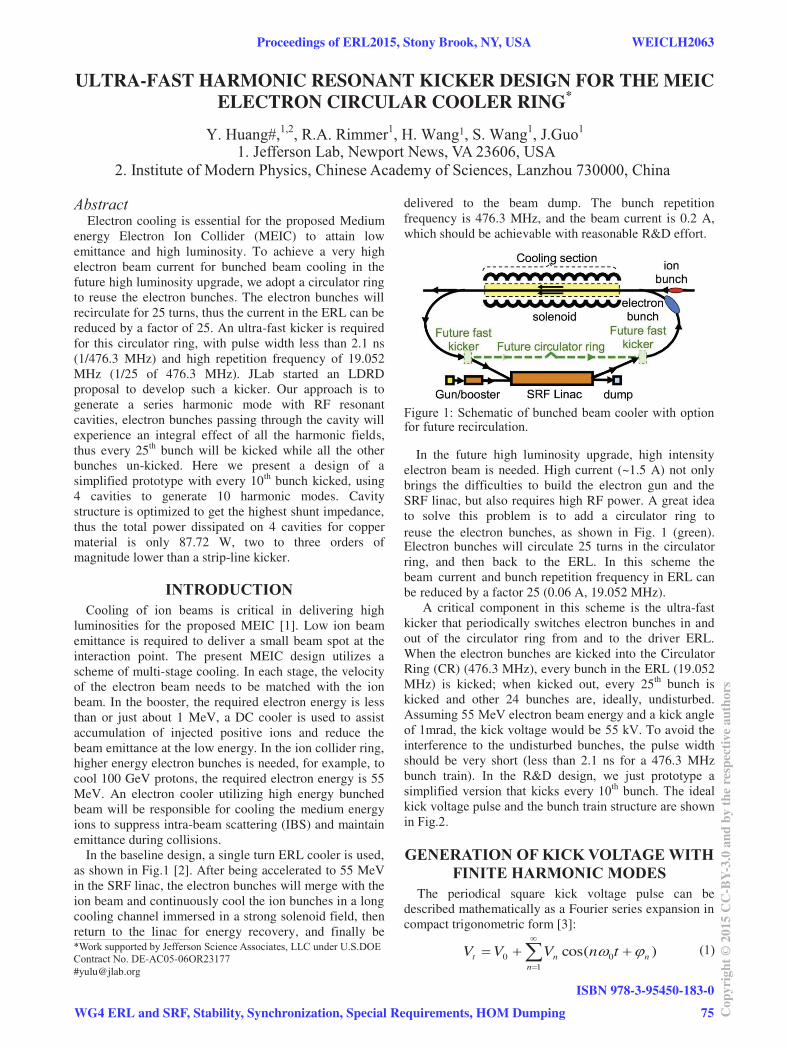
ULTRA-FAST HARMONIC RESONANT KICKER DESIGN FOR THE MEIC ELECTRON CIRCULAR COOLER RING*
H. Wang1,
Electron cooling is essential for the proposed Medium energy Electron Ion Collider (MEIC) to attain low emittance and high luminosity. To achieve a very high electron beam current for bunched beam cooling in the future high luminosity upgrade, we adopt a circulator ring to reuse the electron bunches. The electron bunches will recirculate for 25 turns, thus the current in the ERL can be reduced by a factor of 25. An ultra-fast kicker is required for this circulator ring, with pulse width less than 2.1 ns (1/476.3 MHz) and high repetition frequency of 19.052 MHz (1/25 of 476.3 MHz). JLab started an LDRD proposal to develop such a kicker. Our approach is to generate a series harmonic mode with RF resonant cavities, electron bunches passing through the cavity will experience an integral effect of all the harmonic fields, thus every 25th bunch will be kicked while all the other bunches un-kicked. Here we present a design of a simplified prototype with every 10th bunch kicked, using 4 cavities to generate 10 harmonic modes. Cavity structure is optimized to get the highest shunt impedance, thus the total power dissipated on 4 cavities for copper material is only 87.72 W, two to three orders of magnitude lower than a strip-line kicker.
MEIC [1]. Low ion beamemittance is required to deliver a small beam spot at the interaction point. The present MEIC design utilizes a scheme of multi-stage cooling. In each stage, the velocity of the electron beam needs to be matched with the ion beam. In the booster, the required electron energy is less than or just about 1 MeV, a DC cooler is used to assist accumulation of injected positive ions and reduce the beam emittance at the low energy. In the ion collider ring, higher energy electron bunches is needed, for example, to cool 100 GeV protons, the required electron energy is 55 MeV. An electron cooler utilizing high energy bunched beam will be responsible for cooling the medium energy ions to suppress intra-beam scattering (IBS) and maintain emittance during collisions.
In the baseline design, a single turn ERL cooler is used, as shown in Fig.1 [2]. After being accelerated to 55 MeV in the SRF linac, the electron bunches will merge with the ion beam and continuously cool the ion bunches in a long cooling channel immersed in a strong solenoid field, then return to the linac for energy recovery, and finally be
delivered to the beam dump. The bunch repetition frequency is 476.3 MHz, and the beam current is 0.2 A, which should be achievable with reasonable R&D effort.
Figure 1: Schematic of bunched beam cooler with option for future recirculation.
In the future high luminosity upgrade, high intensity electron beam is needed. High current (~1.5 A) not only brings the difficulties to build the electron gun and the SRF linac, but also requires high RF power. A great idea to solve this problem is to add a circulator ring to reuse the electron bunches, as shown in Fig. 1 (green). Electron bunches will circulate 25 turns in the circulator ring, and then back to the ERL. In this scheme the beam current and bunch repetition frequency in ERL can be reduced by a factor 25 (0.06 A, 19.052 MHz).
A critical component in this scheme is the ultra-fast kicker that periodically switches electron bunches in and out of the circulator ring from and to the driver ERL. When the electron bunches are kicked into the Circulator Ring (CR) (476.3 MHz), every bunch in the ERL (19.052 MHz) is kicked; when kicked out, every 25th bunch is kicked and other 24 bunches are, ideally, undisturbed.
. To avoid theinterference to the undisturbed bunches, the pulse width should be very short (less than 2.1 ns for a 476.3 MHz bunch train).
The periodical square kick voltage pulse can be described mathematically as a Fourier series expansion in compact trigonometric form [3]:
100 )cos(
n
nnt tnVVV
___________________________________________
- - #[email protected]
Proceedings of ERL2015, Stony Brook, NY, USA WEICLH2063
WG4 ERL and SRF, Stability, Synchronization, Special Requirements, HOM Dumping
ISBN 978-3-95450-183-0
75 Cop
yrig
ht©
2015
CC
-BY-
3.0
and
byth
ere
spec
tive
auth
ors

Vt is the total kick voltage, the constant term V0 represents a DC offset, 0 is bunch repetition frequency in ERL, Vn
and n are amplitude and phase terms of these harmonics. Reconstructing the voltage pulse with the first 10 harmonics, and adjusting the DC offset and amplitudes to satisfy the design kick voltage, the reconstructed kick voltage pulse can be seen in Fig. 2 (black). The kicked bunches experience a kick voltage of 55 kV, while the centers of each un-kicked bunch will experience zero kick voltage. The waveform fluctuates between adjacent bunches, generating a head-tail difference in the kick each bunch sees. For the kicked bunches, a flat top kick can be obtained by adjusting the pulse width before FFT; and for the un-kicked bunches, the head and tail difference can be cancelled by an 1800 betatron phase advance between two kickers.
Consider a normalized periodical pulse voltage of width b, amplitude 1, in one period (-b/2, 2 -b/2), thesquare pulse can be expanded as the following form:
)cos()2
sin(12
2),,(
1
xnb
nn
bxbsF
s
n
s is the harmonic number x is variable. If we consider +/- 3 of ( =2cm) electron bunches, for 10 harmonics, wecan solve the following equation to optimize the width b.
)06.0,,10()0,,10( bFbF
A series b is get from this equation, as can be shown in Fig. 3.We define the flatness as:
)0,,(),,(min),,(max
),,(bsF
xbsFxbsFxbsflatF
510504.9)06.0,859324.0,10(flatF5104308.3)06.0,474168.1,10(flatF
5106348.1)06.0,079633.2,10(flatF
Larger b gives better flatness, but also requires larger amplitude and power for each mode, and a wider pulse also has effect on the un-kicked bunch. Thus in this case, minimum b is enough.
-
In Figure 2, we construct the kick voltage with 10 harmonic modes, and every 10th bunch is kicked. If we want to construct a waveform that kicks every 25th bunch
Kic
k V
olta
ge P
ulse
(kV
)
Bunch Distance (m)s0 1 2 3 4 5 6
0
10
20
30
40
50
60
3.5 3 2.5 2 1.5 1 0.5 0 0.5 1 1.5 2 2.5 3 3.50.2
0
0.2
0.4
0.6
0.8
1
1.2
F 10 0.859324 x( )
F 10 1.474168 x( )
F 10 2.079633 x( )
Bunch Distance (m)s
WEICLH2063 Proceedings of ERL2015, Stony Brook, NY, USA
ISBN 978-3-95450-183-0
76Cop
yrig
ht©
2015
CC
-BY-
3.0
and
byth
ere
spec
tive
auth
ors
WG4 ERL and SRF, Stability, Synchronization, Special Requirements, HOM Dumping

using this method, the required harmonic number will be 25, which may impose difficulties for the cavity design. However, with n modes, the number of variables in equation (1) is 2n+1 (1 DC offset, n amplitudes, n phases). If the waveform has 2n+1 constraints in a period, i.e. zero at the 2n un-kicked bunches and Vt at the kicked bunch, in most cases we should be able to find a set of solution constructed with about n modes, reducing the number of modes by half. We have found such a solution with all the phase set to 0, if
021 2... VVVV n (8)
0121 22 ... VVVVV nn (9)
Figure 5 compares the waveforms generated by the constraint method with the FFT method. Both waveforms can kick every 25th bunch. The main difference is the flatness for the kicked bunch. To improve the flatness in the constraint method, one or two more harmonic modes can be added.
The cavity model used to generate harmonic modes is quarter wave transmission line shorted at one end and capacitive loaded at the other end, as shown in Fig. 6. Here b and a are the radius of outer and inner conductor, and g is the end gap. Beam passes through the gap and is deflected primarily by a transverse electric field.
m
Because of the boundary conditions of this type cavity, the higher order modes in one cavity can be only odd-harmonics of the fundamental mode of the cavity. Thus to generate the first 10 harmonics of the beam frequency, 4 cavities are needed, as shown in Fig. 7. The relationship between cavity number M and maximum harmonic number N can be supported as
NM 12
The maximum harmonic modes N distributed in M cavities can be demonstrated in Tab.1 as an example for M=4, N=15, f0=476.3MHz, calculated by the base frequencies of f0/N 2f0/N, 4f0/N, 8f0/N.
Table 1: Harmonic Modes in Each Cavity Cavity #1 Cavity #2 Cavity #3 Cavity #4
N
fn 0
1 )12(
n1=0~7 N
fn 0
2
2)12(
N
fn 0
3
4)12(
n3=0~1 N
fn 0
4
8)12(
n4=0
N
n
n
N
n
nn
total
tt
P
tnVV
P
VR
1
100 )cos(
It is crucial to make sure every mode is on its target frequency. From the numerical simulations above, we can calculate the bandwidth of each mode for the room temperature copper wall material. As shown in Table 3, Q0 for each mode is calculated for 300 K copper. Fundamental mode in each cavity is critically coupled; higher modes in the 5 modes and 3 modes cavities are slightly over coupled. Then the bandwidth for one coupler system:
Kic
k V
olta
ge P
ulse
(kV
)
Bunch Distance (m)0 1 2 3 4 5 6 7 8 9 10 11 12 13 14 155
0
5
10
15
20
25
30
35
40
45
50
55
60
Proceedings of ERL2015, Stony Brook, NY, USA WEICLH2063
WG4 ERL and SRF, Stability, Synchronization, Special Requirements, HOM Dumping
ISBN 978-3-95450-183-0
77 Cop
yrig
ht©
2015
CC
-BY-
3.0
and
byth
ere
spec
tive
auth
ors

)1(0
n
n
nn
Q
ff
Here fn, Q0n, n and fn is the frequency, quality factor,coupling strength and bandwidth of nth mode.
Table 2: Kick Voltage, Shunt Impedance and Dissipate Power for Each Mode Mode (MHz)
FFT Kick Voltage
(kV)
CST Trans. Shunt
Dissipated Power for 300K
Copper (W) 47.63 13.711 7.13E6 26.37 95.26 12.462 1.14E7 13.62
142.89 10.532 4.09E6 27.12 190.52 8.1290 1.35E7 4.89 238.15 5.5030 3.14E6 9.64 285.78 2.9170 6.09E6 1.40 333.41 0.6300 2.65E6 0.15 381.04 -1.2090 1.65E7 0.09 428.67 -2.4320 2.40E6 2.46 476.3 -3.0110 4.57E6 1.98 DC 8.2760
Total 55.508 3.56E7 87.72
It is also shown in Tab.3, when we design the cavity, with an optimized tapering shape design on the cavity inner conductor, harmonic frequencies without tunings can be controlled within the bandwidths of operation modes. However, geometry change due to fabrication error or thermal/mechanical deformation may cause the cavity harmonic frequency deviations more than the natural bandwidths.
An ultra-fast (2.1 ns pulse width), high repetition rate kicker was conceptual developed, with great power efficiency (87.72 W for 55kV kick voltage) and cost-effective (just copper or copper plated stainless steel cavities in room temperature). The conceptual design of the RF cavity, stub tuner and input loop coupler has been done for simple cavity case. Further optimization to reduce the number of harmonic modes, strategy to get more efficient tuning scheme is under study. Beam dynamics tracking, mechanical design, HOM damping will be studied further. A prototype cavity will be made; RF bench measurement and the possible vacuum device development for the beam experiment will be done in the future.
Table 3: Bandwidth of Each Mode for 300K Copper
WEICLH2063 Proceedings of ERL2015, Stony Brook, NY, USA
ISBN 978-3-95450-183-0
78Cop
yrig
ht©
2015
CC
-BY-
3.0
and
byth
ere
spec
tive
auth
ors
WG4 ERL and SRF, Stability, Synchronization, Special Requirements, HOM Dumping
Proceedings of ERL2015, Stony Brook, NY, USA WEICLH2063
WG4 ERL and SRF, Stability, Synchronization, Special Requirements, HOM Dumping
ISBN 978-3-95450-183-0
79 Cop
yrig
ht©
2015
CC
-BY-
3.0
and
byth
ere
spec
tive
auth
ors
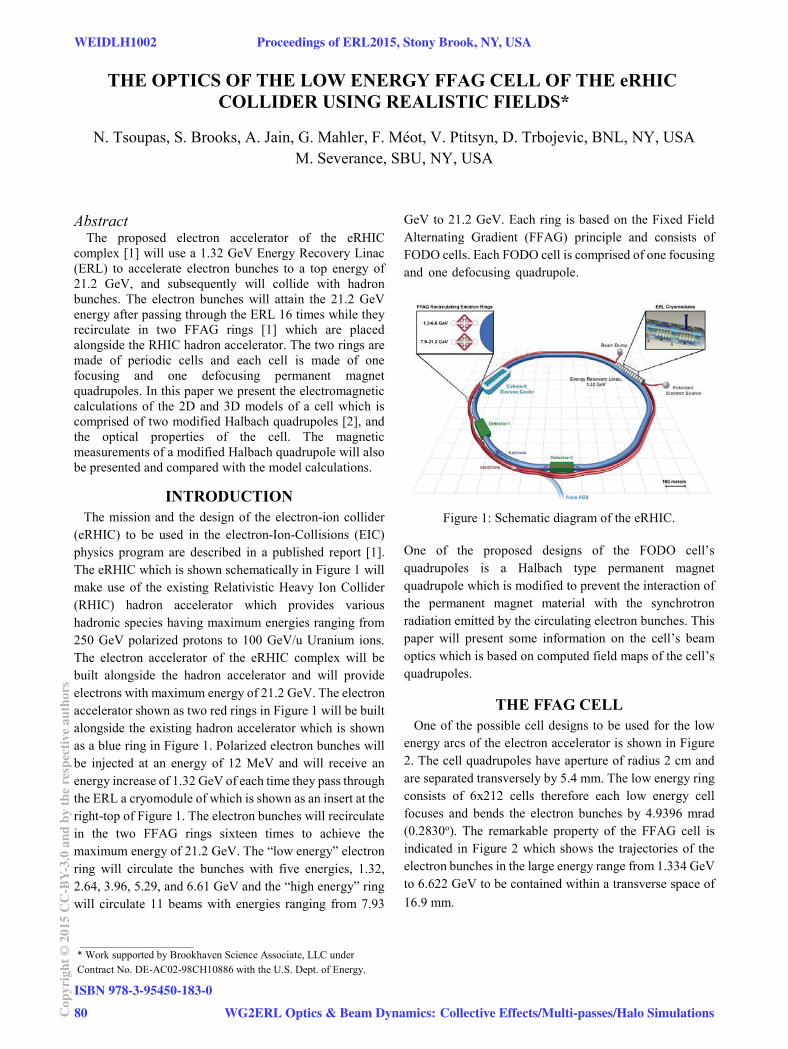
THE OPTICS OF THE LOW ENERGY FFAG CELL OF THE eRHIC COLLIDER USING REALISTIC FIELDS*
N. Tsoupas, S. Brooks, A. Jain, G. Mahler, F. Méot, V. Ptitsyn, D. Trbojevic, BNL, NY, USA M. Severance, SBU, NY, USA
AbstractThe proposed electron accelerator of the eRHIC
complex [1] will use a 1.32 GeV Energy Recovery Linac (ERL) to accelerate electron bunches to a top energy of 21.2 GeV, and subsequently will collide with hadron bunches. The electron bunches will attain the 21.2 GeV energy after passing through the ERL 16 times while they recirculate in two FFAG rings [1] which are placed alongside the RHIC hadron accelerator. The two rings are made of periodic cells and each cell is made of one focusing and one defocusing permanent magnet quadrupoles. In this paper we present the electromagnetic calculations of the 2D and 3D models of a cell which is comprised of two modified Halbach quadrupoles [2], and the optical properties of the cell. The magnetic measurements of a modified Halbach quadrupole will also be presented and compared with the model calculations.
INTRODUCTIONThe mission and the design of the electron-ion collider
(eRHIC) to be used in the electron-Ion-Collisions (EIC) physics program are described in a published report [1]. The eRHIC which is shown schematically in Figure 1 will make use of the existing Relativistic Heavy Ion Collider (RHIC) hadron accelerator which provides various hadronic species having maximum energies ranging from 250 GeV polarized protons to 100 GeV/u Uranium ions. The electron accelerator of the eRHIC complex will be built alongside the hadron accelerator and will provide electrons with maximum energy of 21.2 GeV. The electron accelerator shown as two red rings in Figure 1 will be built alongside the existing hadron accelerator which is shown as a blue ring in Figure 1. Polarized electron bunches will be injected at an energy of 12 MeV and will receive an energy increase of 1.32 GeV of each time they pass through the ERL a cryomodule of which is shown as an insert at the right-top of Figure 1. The electron bunches will recirculatein the two FFAG rings sixteen times to achieve the maximum energy of 21.2 GeV. The “low energy” electron ring will circulate the bunches with five energies, 1.32, 2.64, 3.96, 5.29, and 6.61 GeV and the “high energy” ringwill circulate 11 beams with energies ranging from 7.93
GeV to 21.2 GeV. Each ring is based on the Fixed Field Alternating Gradient (FFAG) principle and consists of FODO cells. Each FODO cell is comprised of one focusing and one defocusing-.quadrupole.
Figure 1: Schematic diagram of the eRHIC.
One of the proposed designs of the FODO cell’s quadrupoles is a Halbach type permanent magnet quadrupole which is modified to prevent the interaction of the permanent magnet material with the synchrotron radiation emitted by the circulating electron bunches. This paper will present some information on the cell’s beam optics which is based on computed field maps of the cell’s quadrupoles.
THE FFAG CELLOne of the possible cell designs to be used for the low
energy arcs of the electron accelerator is shown in Figure 2. The cell quadrupoles have aperture of radius 2 cm andare separated transversely by 5.4 mm. The low energy ring consists of 6x212 cells therefore each low energy cell focuses and bends the electron bunches by 4.9396 mrad (0.2830o). The remarkable property of the FFAG cell is indicated in Figure 2 which shows the trajectories of the electron bunches in the large energy range from 1.334 GeV to 6.622 GeV to be contained within a transverse space of 16.9 mm..
_____________________* Work supported by Brookhaven Science Associate, LLC underContract No. DE-AC02-98CH10886 with the U.S. Dept. of Energy.
WEIDLH1002 Proceedings of ERL2015, Stony Brook, NY, USA
ISBN 978-3-95450-183-0
80Cop
yrig
ht©
2015
CC
-BY-
3.0
and
byth
ere
spec
tive
auth
ors
WG2ERL Optics & Beam Dynamics: Collective Effects/Multi-passes/Halo Simulations
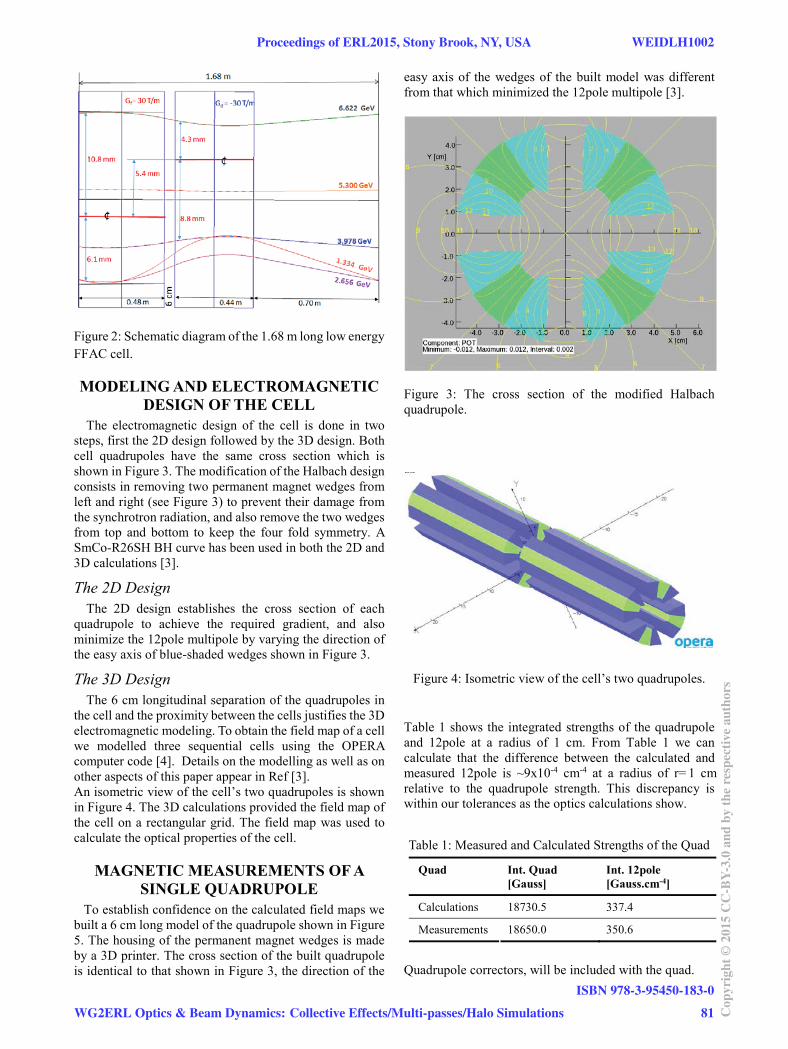
Figure 2: Schematic diagram of the 1.68 m long low energy FFAC cell.
MODELING AND ELECTROMAGNETIC DESIGN OF THE CELL
The electromagnetic design of the cell is done in two steps, first the 2D design followed by the 3D design. Both cell quadrupoles have the same cross section which is shown in Figure 3. The modification of the Halbach design consists in removing two permanent magnet wedges from left and right (see Figure 3) to prevent their damage from the synchrotron radiation, and also remove the two wedges from top and bottom to keep the four fold symmetry. ASmCo-R26SH BH curve has been used in both the 2D and 3D calculations [3].
The 2D DesignThe 2D design establishes the cross section of each
quadrupole to achieve the required gradient, and also minimize the 12pole multipole by varying the direction of the easy axis of blue-shaded wedges shown in Figure 3.
The 3D DesignThe 6 cm longitudinal separation of the quadrupoles in
the cell and the proximity between the cells justifies the 3D electromagnetic modeling. To obtain the field map of a cell we modelled three sequential cells using the OPERA computer code [4]. Details on the modelling as well as on other aspects of this paper appear in Ref [3].An isometric view of the cell’s two quadrupoles is shown in Figure 4. The 3D calculations provided the field map of the cell on a rectangular grid. The field map was used to calculate the optical properties of the cell.
MAGNETIC MEASUREMENTS OF A SINGLE QUADRUPOLE
To establish confidence on the calculated field maps we built a 6 cm long model of the quadrupole shown in Figure 5. The housing of the permanent magnet wedges is made by a 3D printer. The cross section of the built quadrupole is identical to that shown in Figure 3, the direction of the
easy axis of the wedges of the built model was different from that which minimized the 12pole multipole [3].
Figure 3: The cross section of the modified Halbach quadrupole.
Figure 4: Isometric view of the cell’s two quadrupoles.
Table 1 shows the integrated strengths of the quadrupole and 12pole at a radius of 1 cm. From Table 1 we can calculate that the difference between the calculated and measured 12pole is ~9x10⁻⁴ cm-4 at a radius of r=1 cm relative to the quadrupole strength. This discrepancy is within our tolerances as the optics calculations show.
Table 1: Measured and Calculated Strengths of the Quad
Quad Int. Quad [Gauss]
Int. 12pole[Gauss.cm-4]
Calculations 18730.5 337.4
Measurements 18650.0 350.6
Quadrupole correctors, will be included with the quad.
Proceedings of ERL2015, Stony Brook, NY, USA WEIDLH1002
WG2ERL Optics & Beam Dynamics: Collective Effects/Multi-passes/Halo Simulations
ISBN 978-3-95450-183-0
81 Cop
yrig
ht©
2015
CC
-BY-
3.0
and
byth
ere
spec
tive
auth
ors

Figure 5: A picture of the modified Halbach quadrupole. The housing of the permanent magnet wedges is made by a 3D printer.
OPTICAL PROPERTIES OF THE CELLThe beam optics of the cell consists in studying the
following properties of the low energy ring:The closed orbits of the ring for the electron buncheswithin the energy range 1.3 to 6.6 GeV. This studyproves that the magnetic field map of a single cellallows the formation of closed orbits in the ring.The horizontal and vertical tunes Qx and Qy and thechromaticities x, y, which correspond to the closedorbits. This study provides information on the stability of the closed orbits.The acceptance of the ring, which is the maximumbeam emittances x, and y, of each beam bunch thatcorresponds to a closed orbit of a given energy.The dynamic aperture for each close orbit.The beta functions in the cell.
The zgoubi computer code [ ] has been used to calculatethe optical properties.
The Closed OrbitsFigure 6 shows 42 closed orbits of electron bunches in a
cell in the energy range of 1.3 GeV to 6.6 GeV. In the zgoubi code x-axis is along the beam direction and y is radial.
Tunes and Chromaticities Figure 7 is a plot of the tunes Qx, a n d Q y, and the
chromaticities x, y . The betatron tunes in combination with the chromaticities as plotted in Figure 7 indicate that the electron bunches are away from beam resonances.
Figure 6: Closed orbits in the low energy cell of eRHIC.
Figure 7: Plot of tunes and the chromaticities in a cell as a function of electron’s kinetic energy (top scale). The symbol =g/2-1=1.16x10-3 in the label of the horizontal scale and g is the g-factor of the electron.
The Acceptance of the Ring Figures 8 and 9 show the horizontal and vertical rms
acceptances of the low energy ring for five of the electron bunches.
Figure 8: The horizontal rms beam acceptance for each of the five energy-bunches being transported in the ring.
WEIDLH1002 Proceedings of ERL2015, Stony Brook, NY, USA
ISBN 978-3-95450-183-0
82Cop
yrig
ht©
2015
CC
-BY-
3.0
and
byth
ere
spec
tive
auth
ors
WG2ERL Optics & Beam Dynamics: Collective Effects/Multi-passes/Halo Simulations
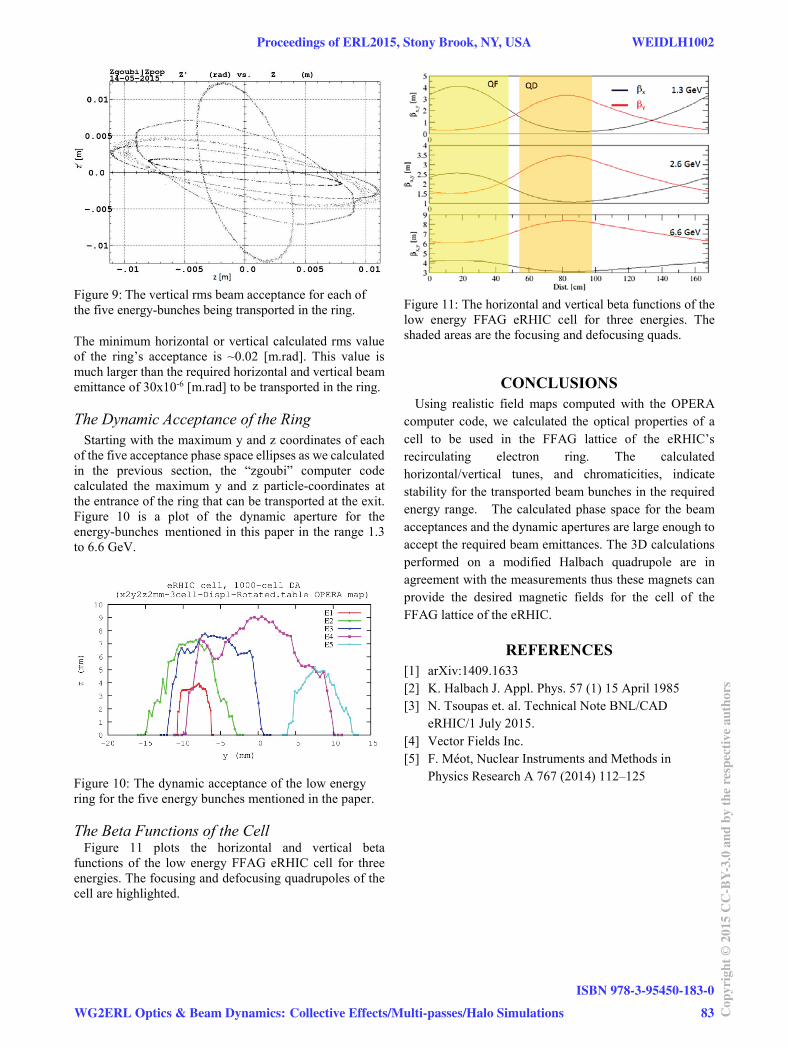
Figure 9: The vertical rms beam acceptance for each of the five energy-bunches being transported in the ring.
The minimum horizontal or vertical calculated rms value of the ring’s acceptance is ~0.02 [m.rad]. This value is much larger than the required horizontal and vertical beam emittance of 30x10-6 [m.rad] to be transported in the ring.
The Dynamic Acceptance of the RingStarting with the maximum y and z coordinates of each
of the five acceptance phase space ellipses as we calculated in the previous section, the “zgoubi” computer code calculated the maximum y and z particle-coordinates at the entrance of the ring that can be transported at the exit. Figure 10 is a plot of the dynamic aperture for the energy-bunches mentioned in this paper in the range 1.3 to 6.6 GeV.
Figure 10: The dynamic acceptance of the low energy ring for the five energy bunches mentioned in the paper.
The Beta Functions of the CellFigure 11 plots the horizontal and vertical beta
functions of the low energy FFAG eRHIC cell for three energies. The focusing and defocusing quadrupoles of the cell are highlighted.
Figure 11: The horizontal and vertical beta functions of the low energy FFAG eRHIC cell for three energies. The shaded areas are the focusing and defocusing quads.
CONCLUSIONSUsing realistic field maps computed with the OPERA
computer code, we calculated the optical properties of a cell to be used in the FFAG lattice of the eRHIC’srecirculating electron ring. The calculatedhorizontal/vertical tunes, and chromaticities, indicate stability for the transported beam bunches in the required energy range. The calculated phase space for the beam acceptances and the dynamic apertures are large enough to accept the required beam emittances. The 3D calculations performed on a modified Halbach quadrupole are in agreement with the measurements thus these magnets can provide the desired magnetic fields for the cell of the FFAG lattice of the eRHIC.
REFERENCES[1] arXiv:1409.1633[2] K. Halbach J. Appl. Phys. 57 (1) 15 April 1985[3] N. Tsoupas et. al. Technical Note BNL/CAD
eRHIC/1 July 2015.[4] Vector Fields Inc.[5] F. Méot, Nuclear Instruments and Methods in
Physics Research A 767 (2014) 112–125
Proceedings of ERL2015, Stony Brook, NY, USA WEIDLH1002
WG2ERL Optics & Beam Dynamics: Collective Effects/Multi-passes/Halo Simulations
ISBN 978-3-95450-183-0
83 Cop
yrig
ht©
2015
CC
-BY-
3.0
and
byth
ere
spec
tive
auth
ors
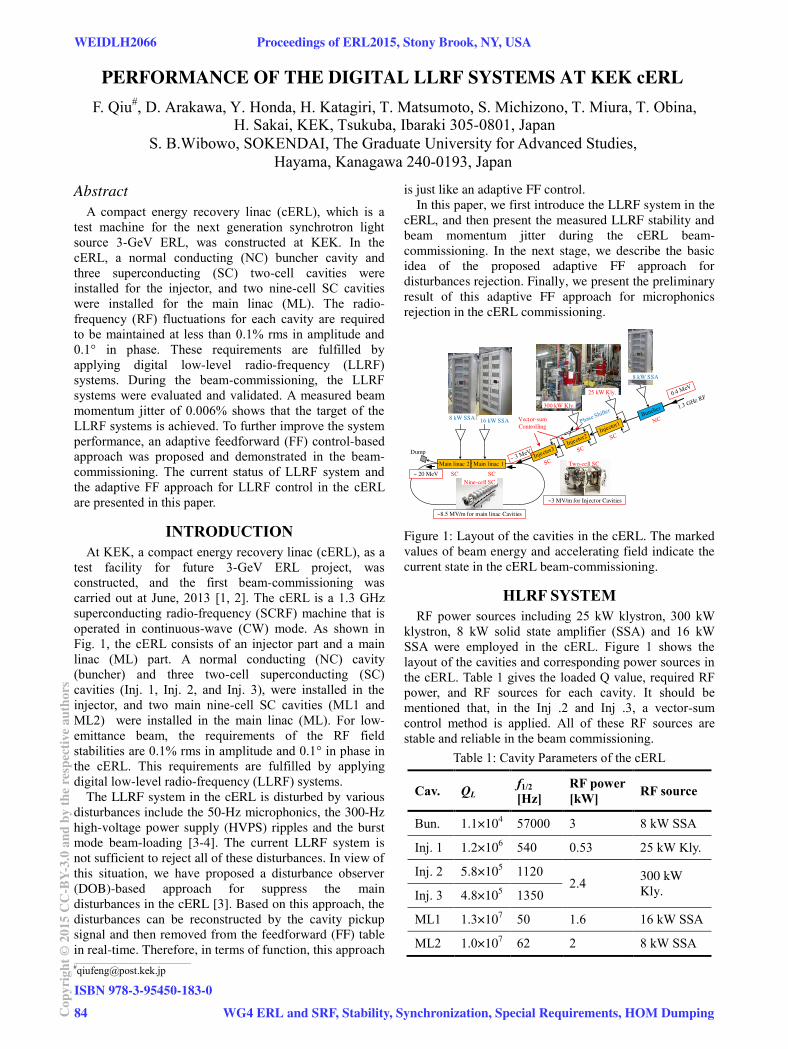
___________________________________________
PERFORMANCE OF THE DIGITAL LLRF SYSTEMS AT KEK cERL
F. Qiu#, D. Arakawa, Y. Honda, H. Katagiri, T. Matsumoto, S. Michizono, T. Miura, T. Obina,H. Sakai, KEK, Tsukuba, Ibaraki 305-0801, Japan
S. B.Wibowo, SOKENDAI, The Graduate University for Advanced Studies, Hayama, Kanagawa 240-0193, Japan
Abstract
A compact energy recovery linac (cERL), which is a test machine for the next generation synchrotron light source 3-GeV ERL, was constructed at KEK. In the cERL, a normal conducting (NC) buncher cavity and three superconducting (SC) two-cell cavities were installed for the injector, and two nine-cell SC cavities were installed for the main linac (ML). The radio-
frequency (RF) fluctuations for each cavity are required to be maintained at less than 0.1% rms in amplitude and 0.1° in phase. These requirements are fulfilled by applying digital low-level radio-frequency (LLRF) systems. During the beam-commissioning, the LLRF systems were evaluated and validated. A measured beam momentum jitter of 0.006% shows that the target of the LLRF systems is achieved. To further improve the system performance, an adaptive feedforward (FF) control-based approach was proposed and demonstrated in the beam-
commissioning. The current status of LLRF system and the adaptive FF approach for LLRF control in the cERL are presented in this paper.
INTRODUCTIONAt KEK, a compact energy recovery linac (cERL), as a
test facility for future 3-GeV ERL project, was constructed, and the first beam-commissioning was carried out at June, 2013 [1, 2]. The cERL is a 1.3 GHz superconducting radio-frequency (SCRF) machine that is operated in continuous-wave (CW) mode. As shown in Fig. 1, the cERL consists of an injector part and a main linac (ML) part. A normal conducting (NC) cavity (buncher) and three two-cell superconducting (SC) cavities (Inj. 1, Inj. 2, and Inj. 3), were installed in the injector, and two main nine-cell SC cavities (ML1 and ML2) were installed in the main linac (ML). For low-
emittance beam, the requirements of the RF field stabilities are 0.1% rms in amplitude and 0.1° in phase in the cERL. This requirements are fulfilled by applying digital low-level radio-frequency (LLRF) systems.
The LLRF system in the cERL is disturbed by various
disturbances include the 50-Hz microphonics, the 300-Hz
high-voltage power supply (HVPS) ripples and the burst
mode beam-loading [3-4]. The current LLRF system is
not sufficient to reject all of these disturbances. In view of
this situation, we have proposed a disturbance observer
(DOB)-based approach for suppress the main
disturbances in the cERL [3]. Based on this approach, the
disturbances can be reconstructed by the cavity pickup
signal and then removed from the feedforward (FF) table
in real-time. Therefore, in terms of function, this approach
is just like an adaptive FF control.
In this paper, we first introduce the LLRF system in the
cERL, and then present the measured LLRF stability and
beam momentum jitter during the cERL beam-
commissioning. In the next stage, we describe the basic
idea of the proposed adaptive FF approach for
disturbances rejection. Finally, we present the preliminary
result of this adaptive FF approach for microphonics
rejection in the cERL commissioning.
Main linac 2
8 kW SSA
Nine-cell SC
8 kW SSA
Main linac 1 Two-cell SC
SC SC
300 kW Kly.
25 kW Kly.
8 kW SSA
Vector-sum
Controlling
~8.5 MV/m for main linac Cavities
~3 MV/m for Injector Cavities
~ 20 MeV
Dump
16 kW SSA
Figure 1: Layout of the cavities in the cERL. The marked
values of beam energy and accelerating field indicate the
current state in the cERL beam-commissioning.
HLRF SYSTEMRF power sources including 25 kW klystron, 300 kW
klystron, 8 kW solid state amplifier (SSA) and 16 kW SSA were employed in the cERL. Figure 1 shows the layout of the cavities and corresponding power sources in the cERL. Table 1 gives the loaded Q value, required RF power, and RF sources for each cavity. It should be mentioned that, in the Inj .2 and Inj .3, a vector-sum control method is applied. All of these RF sources are stable and reliable in the beam commissioning.
Table 1: Cavity Parameters of the cERL
Cav. QLf1/2 [Hz]
RF power [kW] RF source
Bun. 1.1×10⁴ 57000 3 8 kW SSA
Inj. 1 1.2×10⁶ 540 0.53 25 kW Kly.
Inj. 2 5.8×10⁵ 1120
2.4 300 kW
Kly. Inj. 3 4.8×10⁵ 1350
ML1 1.3×10⁷ 50 1.6 16 kW SSA
ML2 1.0×10⁷ 62 2 8 kW SSA
WEIDLH2066 Proceedings of ERL2015, Stony Brook, NY, USA
ISBN 978-3-95450-183-0
84Cop
yrig
ht©
2015
CC
-BY-
3.0
and
byth
ere
spec
tive
auth
ors
WG4 ERL and SRF, Stability, Synchronization, Special Requirements, HOM Dumping

LLRF SYSTEM
A simplified schematic of the cERL LLRF system is shown in Fig. 1. The 1.3-GHz cavity pick up signal is down-converted to a 10-MHz intermediate frequency (IF) signal at first. The 10-MHz IF signal is sampled at 80-
MHz by a 16-bit analog to digital converter (ADC) and then fed into a field-programmable gate array (FPGA) board. The baseband in-phase and quadrature (I/Q) components are detected from the IF signal with a non-
IQ-based IQ detection method. After being filtered by infinite impulse response (IIR) filters, the detected I/Q signals are compared with their set values, and the I/Q error signals are calculated. The I/Q error signals are controlled by proportional and integrational (PI) feedback (FB) controllers and then added together with their corresponding FF tables. Finally, the combined I/Q signals are fed into an I/Q modulator via 16-bit digital to analog convertors (DACs) to regenerate the 1.3-GHz RF signal. This regulated RF signal will be used to drive the high-power RF source (e.g. klystron and SSA), which drives the cavities. It should be mentioned that, to evaluate the stability of the cavity pick-up signal, we have installed a pick-up monitor inside FPGA (see Fig. 2). An adjustable-bandwidth digital filter, aims to remove the ADC noises, is placed in front of the monitor.
A µTCA system is employed as the digital control platform. Experimental physics and industrial control system (EPICS) is selected to be the data communication system. The detailed information about that digital platform can be found in [4].
Calib.ADC
Vector sum
I
Q
I_Set
ADC
DAC
DAC
cos sin
sin cos
FPGA
Power PC
EPICS IOC
IQ M
od
.
Waveform Command
Linux
IF ≈ 10 MHz
I
AMC Card
AD9783
Do
wn
Co
nver
tor
IIR
RF = 1300 MHz
LO ≈ 1310 MHzAnalog filter
PI
IIR
Fil.
Q_Set
I_FF
Calib.
Q
1300 MHz
Kly. / SSA
Pre. Amp.
Clk ≈ 80 MHz
LTC2208
ADC
ADC
ADC
PI
Q_FF
cos sin
sin cos
DIO (RF SW)SW1
Fil
Fil
bandwidth
Monitor
(pick up)
Figure 2: Schematic of the LLRF system in the cERL.
STABILITY
The typical LLRF system performance in the cERL beam-commissioning are listed in Table 2. Generally speaking, all of our LLRF systems satisfy the requirements of the cERL beam-commissioning. Disturbances in the LLRF system are suppressed well by applying high FB gains. However, some high intensity disturbances still exist in the LLRF systems. Figure 3 shows the RF performance of Inj. 2&3 and ML2. It is very clearly to see that, there is a 300-Hz fluctuation in the vector-sum RF filed of Inj. 2&3 cavities, especially in the phase. Investigations reveal that this 300-Hz ripples come from the high voltage power supply [3]. On the other hand, an approximately 50-Hz component can be
observed in the phase of the ML2, this component is mainly caused by the microphonics [5].
The beam energy stability is measured by the screen monitor which is installed downstream of the bending magnet with a 2.2 m dispersion and 62.6 µm/pixel resolution. The beam momentum jitter is calculated based on the peak point of the beam projection in the screen monitor. The calibrated beam momentum jitter is about 0.006% rms as shown in Fig. 4. This value is in consistence with the measured RF stability in the LLRF system (see Table 2).
Table 2: Status of RF Systems in the Commissioning
Cavity φb Vc RF stability (rms) δA/A δθ
Buncher -90° 0.07% 0.04°
Inj. 1 0° 0.7 MV 0.006% 0.009 °
Inj. 2 0° 0.65 MV 0.007% 0.025°
Inj. 3 0° 0.65 MV
ML1 0° 8.56 MV 0.003% 0.010°
ML2 0° 8.56 MV 0.003% 0.007°
Figure 3: RF stability of the Inj. 2&3 (top) and ML2 (bottom). The 300-Hz fluctuation in the Inj. 2&3 is caused by the high voltage power supply ripples.
Figure 4: Beam momentum jitter measurement. The measured beam momentum jitter was 0.0065% rms, which is in agreement well with RF stability.
Proceedings of ERL2015, Stony Brook, NY, USA WEIDLH2066
WG4 ERL and SRF, Stability, Synchronization, Special Requirements, HOM Dumping
ISBN 978-3-95450-183-0
85 Cop
yrig
ht©
2015
CC
-BY-
3.0
and
byth
ere
spec
tive
auth
ors
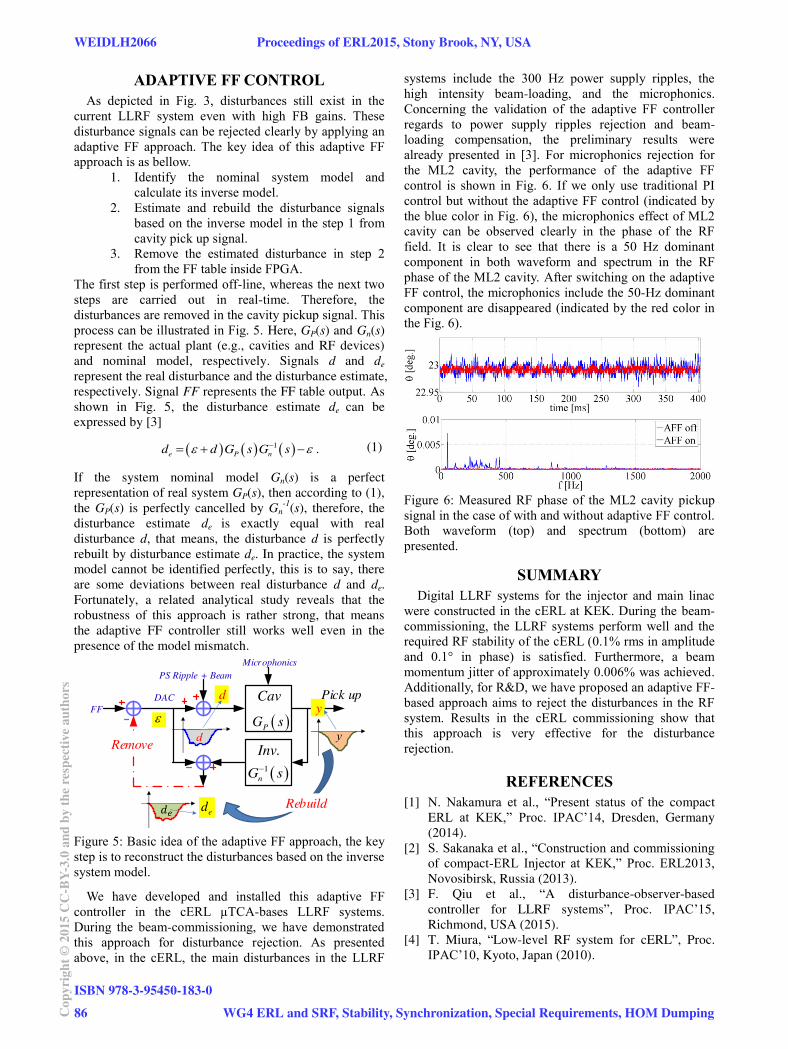
ADAPTIVE FF CONTROL
As depicted in Fig . 3, disturbances still exist in the current LLRF system even with high FB gains. These disturbance signals can be rejected clearly by applying an adaptive FF approach. The key idea of this adaptive FF approach is as bellow.
1. Identify the nominal system model and calculate its inverse model.
2. Estimate and rebuild the disturbance signals based on the inverse model in the step 1 from cavity pick up signal.
3. Remove the estimated disturbance in step 2 from the FF table inside FPGA.
The first step is performed off-line, whereas the next two steps are carried out in real-time. Therefore, the disturbances are removed in the cavity pickup signal. This process can be illustrated in Fig. 5. Here, GP(s) and Gn(s)
represent the actual plant (e.g., cavities and RF devices)
and nominal model, respectively. Signals d and de
represent the real disturbance and the disturbance estimate,
respectively. Signal FF represents the FF table output. As
shown in Fig. 5, the disturbance estimate de can be
expressed by [3]
1 .e P n
d d G s G s (1)
If the system nominal model Gn(s) is a perfect
representation of real system GP(s), then according to (1),
the GP(s) is perfectly cancelled by Gn-1
(s), therefore, the
disturbance estimate de is exactly equal with real
disturbance d, that means, the disturbance d is perfectly
rebuilt by disturbance estimate de. In practice, the system
model cannot be identified perfectly, this is to say, there
are some deviations between real disturbance d and de.
Fortunately, a related analytical study reveals that the
robustness of this approach is rather strong, that means
the adaptive FF controller still works well even in the
presence of the model mismatch.
Cav
PG s
Inv.
1
nG s
FF
DAC
PS Ripple + Beam
d
ed
Microphonics
Removed
y
y
Pick up
Rebuild
Figure 5: Basic idea of the adaptive FF approach, the key step is to reconstruct the disturbances based on the inverse system model.
We have developed and installed this adaptive FF controller in the cERL µTCA-bases LLRF systems. During the beam-commissioning, we have demonstrated this approach for disturbance rejection. As presented above, in the cERL, the main disturbances in the LLRF
systems include the 300 Hz power supply ripples, the high intensity beam-loading, and the microphonics. Concerning the validation of the adaptive FF controller regards to power supply ripples rejection and beam-
loading compensation, the preliminary results were already presented in [3]. For microphonics rejection for the ML2 cavity, the performance of the adaptive FF control is shown in Fig. 6. If we only use traditional PI control but without the adaptive FF control (indicated by the blue color in Fig. 6), the microphonics effect of ML2 cavity can be observed clearly in the phase of the RF field. It is clear to see that there is a 50 Hz dominant component in both waveform and spectrum in the RF phase of the ML2 cavity. After switching on the adaptive FF control, the microphonics include the 50-Hz dominant component are disappeared (indicated by the red color in the Fig. 6).
Figure 6: Measured RF phase of the ML2 cavity pickup signal in the case of with and without adaptive FF control. Both waveform (top) and spectrum (bottom) are presented.
SUMMARY
Digital LLRF systems for the injector and main linac were constructed in the cERL at KEK. During the beam-
commissioning, the LLRF systems perform well and the required RF stability of the cERL (0.1% rms in amplitude and 0.1° in phase) is satisfied. Furthermore, a beam momentum jitter of approximately 0.006% was achieved. Additionally, for R&D, we have proposed an adaptive FF-
based approach aims to reject the disturbances in the RF system. Results in the cERL commissioning show that this approach is very effective for the disturbance rejection.
REFERENCES
[1] N. Nakamura et al., “Present status of the compact
ERL at KEK,” Proc. IPAC’14, Dresden, Germany
(2014).
[2] S. Sakanaka et al., “Construction and commissioning of compact-ERL Injector at KEK,” Proc. ERL2013, Novosibirsk, Russia (2013).
[3] F. Qiu et al., “A disturbance-observer-based
controller for LLRF systems”, Proc. IPAC’15,
Richmond, USA (2015).
[4] T. Miura, “Low-level RF system for cERL”, Proc.
IPAC’10, Kyoto, Japan (2010).
WEIDLH2066 Proceedings of ERL2015, Stony Brook, NY, USA
ISBN 978-3-95450-183-0
86Cop
yrig
ht©
2015
CC
-BY-
3.0
and
byth
ere
spec
tive
auth
ors
WG4 ERL and SRF, Stability, Synchronization, Special Requirements, HOM Dumping
[5] M. Satoh et al., “Mechanical vibration search of
compact ERL main linac superconducting cavities in
crymodule”, Proc. IPAC’14, Dresden, Germany
(2014).
Proceedings of ERL2015, Stony Brook, NY, USA WEIDLH2066
WG4 ERL and SRF, Stability, Synchronization, Special Requirements, HOM Dumping
ISBN 978-3-95450-183-0
87 Cop
yrig
ht©
2015
CC
-BY-
3.0
and
byth
ere
spec
tive
auth
ors

USING A 1.3 GH 20 W SOLID STATE AMPLIFIER AS RF POWER SUPPLY FOR DC-SRF PHOTO-INJECTOR*
F. Wang#, L. Lin, B.C. Zhang, Institute of Heavy Ion Physics & State Key Laboratory of Nuclear Physics and Technology,
University, Beijing 100871, China
Abstract R&D of a 1.3 GHz 20 kW CW solid state amplifier
which consists of 88 elementary modules with individual power supplies, has been carried out under the cooperation between BBEF (Beijing) and Peking University for the DC-SRF photo-injector. It has been installed and applied to the experiments of the DC-SRF photo-injector at Peking University since 2012. The structure, test with full power and full reflection, improvements and performance for long-term operation of this 20 kW solid state RF amplifier will be described in this presentation.
INTRODUCTION The DC-SRF photo-injector which combines a DC
Pierce structure and a superconducting cavity was firstly proposed by Peking University in 2001 [1]. The prototype of the DC-SRF photo-injector with a 1.3 GHz 1.5-cell superconducting cavity was constructed and preliminary experiments at 4.2 K demonstrated its feasibility in 2004 with the electron beam energy gain of about 1 MeV [2]. In the beam experiments of the prototype injector, a 4.5 kW solid state amplifier (SSA) was used. It was combined by eight unit modules and a dummy load cooled by water. Each module was supposed to deliver up to 600 W, which included four 150 W transistors. The designed output power was 4.5 kW but only 3.5 kW had been achieved finally.
After demonstrating the feasibility of prototype, we designed and constructed an upgraded DC-SRF injector with a 3.5-cell cavity. The designed beam power is 13 kW with beam current of 2.6 mA and energy gain of 5 MeV [3]. Taking into account the regulation reserve of 20% for phase and amplitude control and 6% for losses in the waveguide distribution, an amplifier with the output up to 18 kW is required. So a 20 kW CW amplifier at 1.3 GHz is needed. Table 1 shows the technical specification of the power amplifier.
There are three kinds of possible RF amplifiers, which are klystrons, IOTs and SSAs, can provide CW 20 kW RF power at 1.3GHz. The ELBE CW-LINAC employs four pairs of 10 kW SSAs to replace the 10 kW klystrons for the four superconducting 9-cell TESLA cavities in January 2012 [4]. The Cornell Energy-Recovery Linac (ERL) injector has two high power 1300 MHz RF systems, the first system is based on a 16 kW IOT transmitter to drive a normal conducting buncher cavity, and the second system employs five 120 kW klystron to
feed 2-cell superconducting cavities [5]. ALICE at Daresbury Laboratory uses 5 IOTs from three different commercial suppliers [6].
Table 1: Technical pecification of the ower mplifier
Parameter Required
Frequency Range 1300±0.05MHz
CW & Pulsed Output Power
(1dB Compression) 20 kW
Linear Gain 73dB
Output Harmonics 2nd Order -30 dBc
Output Harmonics 3rd Order -30 dBc
RF Phase Shift vs. Output 10
Gain Change vs. Output 2.0 dB
Efficiency at 20kW output 40%
From the experience gained from our 1.3 GHz 3.5 kW SSA, we realized the advantages of SSA for small facilities such as high modularity with the associated redundancy and flexibility, elimination of high voltage and high power circulator, and simple start-up procedures and low maintenance cost. Especially at that time transistors with CW output power more than 200 W at 1.3 GHz were available from industry and the amplifier could be made in China. So we decided to manufacture a SSA under the collaboration with BBEF by the end of 2009.
STRUCTURE OF THE 1.3 GH 20 W SSA Benefitted from the transistors with output power more
than 200 W, the unit module which contains two transistors, a circulator and a terminal can deliver output power up to CW 350 W after its construction. The transistors (MRF6V13250H) are from freescale, and it is claimed each one can deliver up to CW 230 W at 1.3 GHz, and a little bit higher to 250 W in pulsed mode with length of 200 s and duty factor of 10%. The custommade circulator (VBM1387) is from VALVO in Germany, its isolation is more than 25 dB, and full reflection with the CW power of 400 W is allowed. The terminal (Series 32-1209) is from Florida RF Labs and its power capability is up to 500 W. Each unit module is powered by its own power supply with the output voltage of 50 V and the current up to 14 A. The designed efficiency of AC to DC convertor is 92%.
___________________________________________
*Work supported by National Basic Research Project (973) (No. 2011CB808304 and No. 2011CB808302) #[email protected]
z k
z k
WEIDLH2068 Proceedings of ERL2015, Stony Brook, NY, USA
ISBN 978-3-95450-183-0
88Cop
yrig
ht©
2015
CC
-BY-
3.0
and
byth
ere
spec
tive
auth
ors
WG4 ERL and SRF, Stability, Synchronization, Special Requirements, HOM Dumping

Figure 1 shows the overall structure of the SSA. It consists of 8 transistor banks. Each bank generates 3 kW and is decoupled by a coaxial-waveguide transition from 1 5/8 inch rigid line to WR650 waveguide, and in which, there are 11 elementary modules with individual power supplies and one module is used as a preamplifier to drive the other ten. Figure 2 is the photograph of the SSA, the big plates cooled by water with flow rate of 4.9 m3/h at 4 bar are the transistor banks, the 350 W unit modules are mounted on the upper side and the 700 W AC to DC convertors are on the reverse side.
10×350W3kW
Combiner10-WaySplitter
350W
Pre- Amplifier
3kW
2 WaySplitter
4WaySplitter
3kW
4WaySplitter
Wave-guide
Combiner
Wave-guide
Combiner Wave-guide
CombinerInput Output
Figure 1 Structure of 20kW SSA
50 V DC convertor
Figure 2: 1.3 GHz 20 kW SSA
TEST AND RESULTS After the accomplishment of the manufactory and
factory test in BBEF, the SSA had been delivered to Peking University in the January of 2012. After installation, the tests of the amplifier including whether the basic parameters reach the designed values, long term performance with dummy load, full CW reflection, and the performance in pulse mode.
The results in detail are brought out in the following. The gain and output of the power amplifier is illustrated in Fig. 3, it can be seen the gain is larger than 85 dB and changes 1.6 dB from 1kW to 20kW. The phase shift changes 9.5° when the output power increased as shown in Fig. 4. The 3 dB bandwidth of the amplifier is more than 30 MHz, and it is much larger than typical 3 dB
bandwidth of klystron and IOT. The drain efficiency of the SSA is 38% at 20 kW output and 25% at half power output. The efficiency of RF power, which is 34% at 20 kW output and 20% at half output, is a little lower. The second and third harmonics of the output RF signal are suppressed which are -68.9 dBc and -57.1 dBc respectively, while those of the input RF signal are -41.7 dBc and -49.7 dBc respectively. The long term stability of the amplifier was measured with the low level control system and the results of 5kW output and 17kW output are illustrated in Fig. 5 and Fig. 6 respectively. The temperature gradient of the power is ±0.8%/ °C, and we did not get the temperature gradient of the phase as the temperature of the coolant and the output power are both fluctuating during the measurements. We also measured the parameters of the amplifier in pulsed mode. The rising time of the input RF signal is about 54 ns, and the output is 64 ns. In delay measurement, the output signal is 386 ns later than the input signal, which includes the propagation time of 230 ns through coaxial cable with length of 45 m, the propagation time of 81 ns through the waveguide with the length of 17.5 m, so the delay of the amplifier is about 75 ns. The power consumed by the amplifier in pulsed mode was measured and there is a wall-plug power consuming of about 9 kW when the amplifier is only turned on but without RF output. This 9 kW is the quiescent power drain and it varies when the transistor works at different quiescent points. In our case, in order to maintain small gain fluctuation, the quiescent power drain is quite large and then limits the efficiency.
Figure 3 Output power and gain of the 20kW SSA
Figure 4: Phase shift of the 20kW SSA
350 W unit module
700 W, 220 V AC to
Proceedings of ERL2015, Stony Brook, NY, USA WEIDLH2068
WG4 ERL and SRF, Stability, Synchronization, Special Requirements, HOM Dumping
ISBN 978-3-95450-183-0
89 Cop
yrig
ht©
2015
CC
-BY-
3.0
and
byth
ere
spec
tive
auth
ors
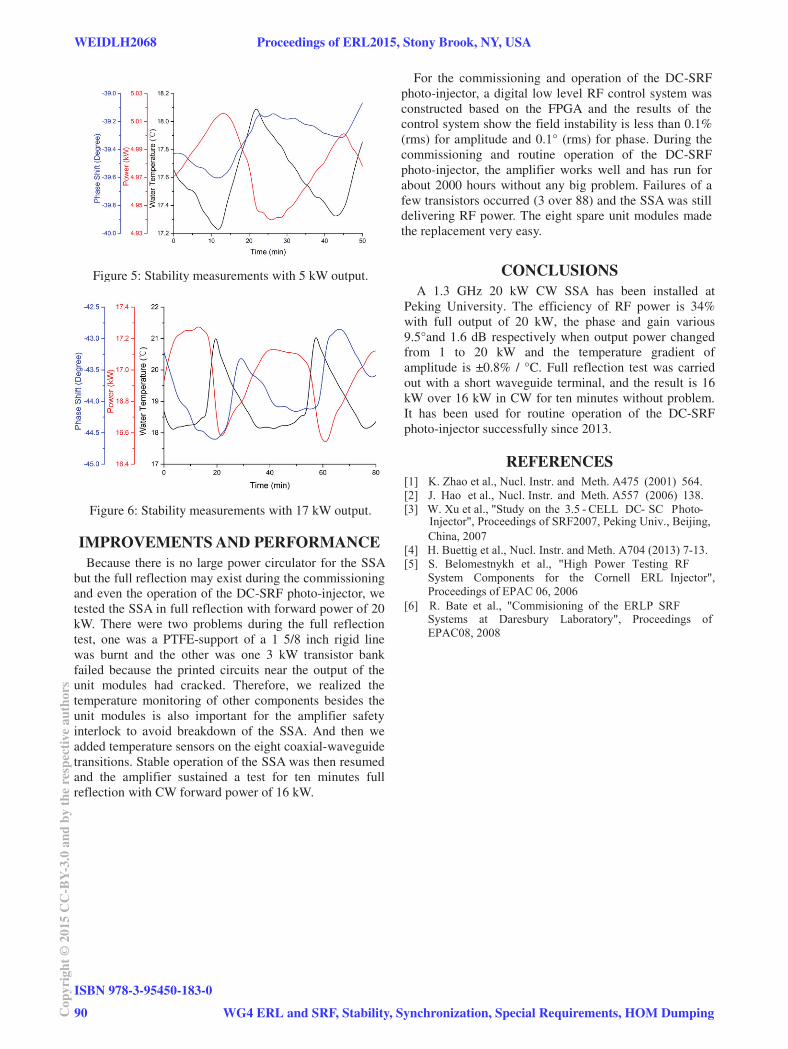
Figure 5: Stability measurements with 5 kW output
Figure 6: Stability measurements with 17 kW output
IMPROVEMENTS AND PERFORMANCE Because there is no large power circulator for the SSA
but the full reflection may exist during the commissioning and even the operation of the DC-SRF photo-injector, we tested the SSA in full reflection with forward power of 20 kW. There were two problems during the full reflection test, one was a PTFE-support of a 1 5/8 inch rigid line was burnt and the other was one 3 kW transistor bank failed because the printed circuits near the output of the unit modules had cracked. Therefore, we realized the temperature monitoring of other components besides the unit modules is also important for the amplifier safety interlock to avoid breakdown of the SSA. And then we added temperature sensors on the eight coaxial-waveguide transitions. Stable operation of the SSA was then resumed and the amplifier sustained a test for ten minutes full reflection with CW forward power of 16 kW.
For the commissioning and operation of the DC-SRF photo-injector, a digital low level RF control system was constructed based on the FPGA and the results of the control system show the field instability is less than 0.1% (rms) for amplitude and 0.1° (rms) for phase. During the commissioning and routine operation of the DC-SRF photo-injector, the amplifier works well and has run for about 2000 hours without any big problem. Failures of a few transistors occurred (3 over 88) and the SSA was still delivering RF power. The eight spare unit modules made the replacement very easy.
CONCLUSIONS A 1.3 GHz 20 kW CW SSA has been installed at
Peking University. The efficiency of RF power is 34% with full output of 20 kW, the phase and gain various 9.5°and 1.6 dB respectively when output power changed from 1 to 20 kW and the temperature gradient of amplitude is ±0.8% / °C. Full reflection test was carried out with a short waveguide terminal, and the result is 16 kW over 16 kW in CW for ten minutes without problem. It has been used for routine operation of the DC-SRF photo-injector successfully since 2013.
REFERENCES
WEIDLH2068 Proceedings of ERL2015, Stony Brook, NY, USA
ISBN 978-3-95450-183-0
90Cop
yrig
ht©
2015
CC
-BY-
3.0
and
byth
ere
spec
tive
auth
ors
WG4 ERL and SRF, Stability, Synchronization, Special Requirements, HOM Dumping
DIAGNOSTIC TEST-BEAM-LINE FOR THE MESA INJECTOR∗
I. Alexander† , K. Aulenbacher, V. Bechthold, B. Ledroit, C. Matejcek
Institut für Kernphysik, Johannes Gutenberg-Universität, D-55099 Mainz, Germany
Abstract
With the test-beam-line it is possible to measure the two
transverse phase-spaces and the temporal distribution of the
electron bunches. It is also possible to investigate the emit-
tance close to the source and further down stream to check
the emittance evolution along the beam-line. Further more
the beam halo can be studied. The beam-line components
will be introduced and some preliminary results will be pre-
sented.
INTRODUCTION
MESA will be a multi-turn Energy Recovery Linac
(ERL) which can be operated in two different modes. An
ERL Mode (105MeV) or an External Beam (EB) Mode
(155MeV) [1, 2]. The source will be a 100 keV dc photo
gun which delivers polarized electrons with a current of
150 μA and an unpolarized electron beam with a beam cur-
rent of 1mA in stage 1 and 10 mA in stage 2. Close to the
source there will be a spin manipulation section with two
Wien-Filters and a solenoid followed by a chopper-buncher
section consisting of four normal conducting cavities. The
injector will be normal conducting with an output energy
of 5MeV. After the injector follow two superconducting
linac modules which produce an energy gain of 25 MeV
each.
The task of the diagnostic test-beam-line is to determine
if the source can deliver a smaller emittance than the ac-
ceptance of the accelerator - for all bunch charges - which
requires that the normalized emittance is εn ≤ 1 μm. For
the operation of MESA the source should be reliable and
deliver a high extractable charge with a long lifetime.
Semiconductor photo cathodes have some properties that
should be taken into account. Close to the band gap energy
it is possible to create spin polarized electrons with circular
polarized photons. However when operating in this mode
one suffers from low quantum efficiency (QE) and reduced
cathode lifetime. If high currents, but no spin-polarization,
are desired it is advantageous to use higher photon energies,
since the QE is almost an order of magnitude larger and the
lifetime is longer. At around 400 nm the photo cathodes
can have a QE of 10% 32mA/W. For higher photon en-
ergies not only the QE increases but also the thermal emit-
tance does. This is because of the fact, that the stimulated
∗Work supported by the German Science Foundation (DPG) under the
Cluster of Exelence PRISMA†[email protected]
electrons have not enough time to thermalize while they
are traveling through the semiconductor and end up with
a wider energy distribution. This additional energy spread
gets transferred into more transverse momenta which leads
to a higher thermal emittance [3].
The source in the diagnostic test-beam-line has deliv-
ered 700C within one charge-lifetime at average currents
exceeding 1mA (MESA stage-1). The experiment needs
average current of 1(10)mA corresponding to an extracted
charge of 3.6(36)C/h if a transmission of 100% is assumed.
To achieve a complete transmission a RF-synchronized
laser must excite photo-emission. We will capture the so-
produced bunches by a harmonic buncher system which
can accept bunches with an extension of about 120°. This
leads to the requirement that the emitted intensity - which
is the convolution of the temporal laser intensity profile and
the response of the photo cathode - must fit into this inter-
val. Tiny fractions outside the interval may be suppressed
by a chopper system to provide very clean operating con-
ditions for MESA. In the set-up described here one of the
circular deflecting cavities which were developed for the
chopper system of MESA is used as temporal diagnostic
instrument - see below.
We estimate the space charge caused current limit of the
source by Isc,lim = p0Ad2U
3/2. Here p0 = 2.33·10−6A/V3/2
is the so-called perveance, Ad2 = 44.4 · 10−6 is a geometric
factor with the emitting area A = 1mm2 and the cathode-
anode distance d = 150mm. The accelerating voltage
U = 100 kV. With all these parameters the emittance is
still < 1 μm and the current limit would be Isc,lim 3mA.
This leads to the expectation, that the source can fulfill the
requirements of MESA stage 1. This is also supported by
CST-computersimulations [4]. Nevertheless a new 200 keV
source is in production to increase the current limit to the
requirements of MESA stage 2 [4].
COMPONENTSeam ine
Proceedings of ERL2015, Stony Brook, NY, USA THIALH2069
WG1 ERL Injectors (Gun/Cathode/Laser)
ISBN 978-3-95450-183-0
91 Cop
yrig
ht©
2015
CC
-BY-
3.0
and
byth
ere
spec
tive
auth
ors

source
spin mani-pulation section
chopper-bunchersection
n.c. injector
s.c. linacmodules
beam dump
experiments
10 m
Figure 1: Floor plan of the MESA accelerator facility. In the left mid side sits the 100 keV dc photo gun, followed by some spin manipulation elements and the normal conducting injector. The main linac consists of two superconductinglinac modules with two or three recirculations, depending on the operation mode. The experiments will be located further on the side and are not shown here to enhance visibility.
scanner 1
scanner 3scann
er 2
source 100 keV
doublescattering Mott
polarimeter
horizontal
vertical
horiz
onta
l
faraday-cup ( SiC )
alpha-magnet
alpha-magnet
laser wavelength405 nm and 520 nm
laserwavelength
~780 nm
quadrupoltriplet
solenoiddoublet
resonator
quadrupoldoublet
Wien-Filter
quadrupoldoublet
quadrupoldoublet
quadrupoldoublet
beam-line forpolarimetry andhalo-diagnosis
UHV suitable
pulse length measurement
Figure 2: Schematic overview of the beam-line setup.
Here the evolution of the emittance with respect to the po-
sition of scanner 1 can be studied. If the second α-magnet
is switched off investigations of the temporal distribution
of the electron beam can be done with a deflecting cavity
[5, 6, 7] and a Ce:YAG screen. If the second α-magnet is
switched on the electrons pass by the third analyzing stage
(scanner 3) where it is possible to take a closer look to the
beam halo. Behind scanner 3 there is a Wien-Filter for
spin manipulation and a double scattering Mott polarime-
ter. This device promises to yield very precise polarization
measurements for the experiments foreseen at MESA. It is,
however, not relevant for the contents discussed here, and
we will therefore not discuss more details. All components
between the source and the second α-magnet/scanner 3 are
UHV compatible and bakeable. There are focusing ele-
ments like quadrupoles (blue) and solenoids (green) as well
as several steering magnets which are not shown in
The UV-VIS laser system (405&520 nm) is installed on
the “first floor” (2m above ground) close to the source
chamber to create a minimized beam spot on the photo
cathode and due to the lack of space. For spin polarized
electrons it is necessary to illuminate the photo cathode per-
pendicular to the surface with circular polarized laser light
and because of that the IR laser system (780 nm) sits under
the first α-magnet.
aser ystem
The laser system consists of three laser diodes with
dif-ferent wavelengths. The 405 nm and 520 nm laser
diodes are mounted close to the source and illuminate the
cathode through a view-port on the bottom of the source
chamber. A schematic sketch is shown in gure 3. At
short distance after the two laser diodes there is an
anamorphic prism pair
gure
THIALH2069 Proceedings of ERL2015, Stony Brook, NY, USA
ISBN 978-3-95450-183-0
92Cop
yrig
ht©
2015
CC
-BY-
3.0
and
byth
ere
spec
tive
auth
ors
WG1 ERL Injectors (Gun/Cathode/Laser)
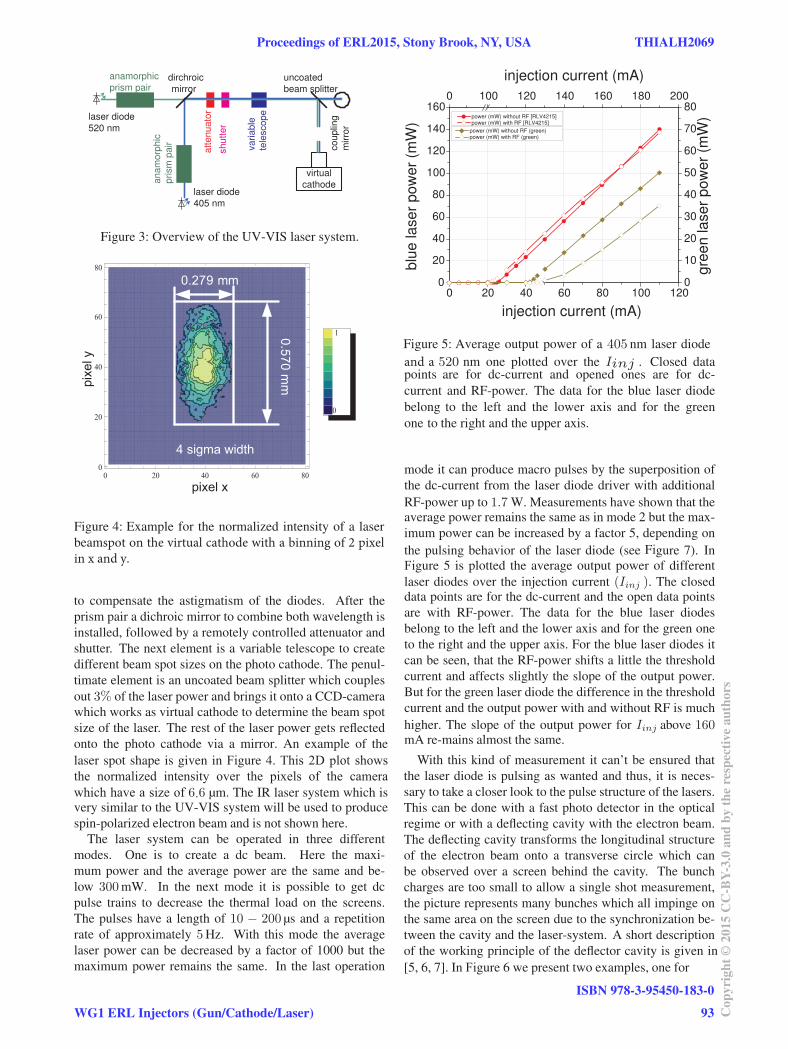
anamorphicprism pair
anam
orph
icpr
ism
pai
r
shut
ter
atte
nuat
or
varia
ble
tele
scop
e
virtualcathode
dirchroicmirror
laser diode520 nm
laser diode405 nm
uncoatedbeam splitter
coup
ling
mirr
or
Figure 3: Overview of the UV-VIS laser system.
Figure 4: Example for the normalized intensity of a laser
beam
to compensate the astigmatism of the diodes. After the
prism pair a dichroic mirror to combine both wavelength is
installed, followed by a remotely controlled attenuator and
shutter. The next element is a variable telescope to create
different beam spot sizes on the photo cathode. The penul-
timate element is an uncoated beam splitter which couples
out 3% of the laser power and brings it onto a CCD-camera
which works as virtual cathode to determine the beam spot
size of the laser. The rest of the laser power gets reflected
onto the photo cathode via a mirror. An example of the
laser spot shape is given in gure 4.
6.6 μm. The IR laser system which isvery similar to the UV-VIS system will be used to produce
spin-polarized electron beam and is not shown here.
The laser system can be operated in three different
modes. One is to create a dc beam. Here the maxi-
mum power and the average power are the same and be-
low 300mW. In the next mode it is possible to get dc
pulse trains to decrease the thermal load on the screens.
The pulses have a length of 10 − 200 μs and a repetition
rate of approximately 5Hz. With this mode the average
laser power can be decreased by a factor of 1000 but the
maximum power remains the same. In the last operation
0 20 40 60 80 100 1200
20
40
60
80
100
120
140
1600 100 120 140 160 180 200
0
10
20
30
40
50
60
70
80
blue
lase
r po
wer
(m
W)
injection current (mA)
power (mW) without RF [RLV4215]power (mW) with RF [RLV4215]
gree
n la
ser
pow
er (
mW
)
injection current (mA)
power (mW) without RF (green)power (mW) with RF (green)
Figure 5: Average output power of a 405 nm laser diode
520 nm one plotted over the Iinj . Closed datapoints are for dc-current and opened ones are for dc-
current and RF-power. The data for the blue laser diode
belong to the left and the lower axis and for the green
one to the right and the upper axis.
mode it can produce macro pulses by the superposition of
the dc-current from the laser diode driver with additional
RF-power up to 1.7 W. Measurements have shown that theaverage power remains the same as in mode 2 but the max-
imum power can be increased by a factor 5, depending on
the pulsing behavior of the laser diode (see F gure 7). In
gure 5 is plotted the average output power of different
laser diodes over the injection current (Iinj ). The closeddata points are for the dc-current and the open data points
are with RF-power. The data for the blue laser diodes
belong to the left and the lower axis and for the green one
to the right and the upper axis. For the blue laser diodes it
can be seen, that the RF-power shifts a little the threshold
current and affects slightly the slope of the output power.
But for the green laser diode the difference in the threshold
current and the output power with and without RF is much
higher. The slope of the output power for Iinj above 160mA re-mains almost the same.
With this kind of measurement it can’t be ensured that
the laser diode is pulsing as wanted and thus, it is neces-
sary to take a closer look to the pulse structure of the lasers.
This can be done with a fast photo detector in the optical
regime or with a deflecting cavity with the electron beam.
The deflecting cavity transforms the longitudinal structure
of the electron beam onto a transverse circle which can
be observed over a screen behind the cavity. The bunch
charges are too small to allow a single shot measurement,
the picture represents many bunches which all impinge on
the same area on the screen due to the synchronization be-
tween the cavity and the laser-system. A short description
of the working principle of the deflector cavity is given in
[5, 6, 7]. In gure 6 we present two examples, one for
Proceedings of ERL2015, Stony Brook, NY, USA THIALH2069
WG1 ERL Injectors (Gun/Cathode/Laser)
ISBN 978-3-95450-183-0
93 Cop
yrig
ht©
2015
CC
-BY-
3.0
and
byth
ere
spec
tive
auth
ors

Iinj = 170 mAdc beam
Figure 6: Example of pulse profiles behind the deflection
cavity
Iinj
dc beam and the other one for RF-synchronized beam of
the green laser diode. For this experiment a RF-power of
120 W was injected into the cavity to get a diameter of ≈30 mm. In gure 7 the normalized intensity is plot-ted
over the RF-phase of the cavity for three different Iinj(170, 180, 190 mA) of the laser diode. The peak power ismore than five times larger than the the power measured at
the same drive current in dc operation. All three Iinj de-liver a transmission of 95% within a phase acceptance of
120°.
The green laser diode is mounted in the laser system to
check how big the influence of the wavelength depending
emittance is and if they show a better pulsing behavior than
the blue ones.
canner evices
All three scanners have a Ce:YAG screen with a diame-
ter of 25mm to optimize the beam trajectory and to make
emittance measurements by quadrupole scans. Scanner 1
and 2 also contain tungsten wires with a diameter of 40 μm
for emittance measurements and to investigate the halo dis-
tribution because of the higher dynamic range in compar-
ison to the CCD-camera. Furthermore scanner 1 has two
slit arrays which are oriented perpendicular to each other.
They have a slit width of 25 μm and a spacing of 250 μm
to make emittance measurements complementary to quad
scan results. In scanner 2 the slits are replaced by a hole
mask (pepper pot) with 21 x 21 holes with a diameter of
25 μm and a spacing of 250 μm in both directions. The pur-
pose of scanner 3 is halo investigations and for that there
are mounted two additional Ce:YAG screens. One with a
2mm hole and the other one with a 3mm hole.
RESULTS
uad can
For the quadrupole scan the inverse focal length of one
quadrupole is varied from −5m−1 ≤ f−1 ≤ 5m−1 and
the beam profile is obtained from a Ce:YAG screen with
a CCD-camera. The squared beam diameter can be plot-
ted over the k values of the quadrupole and on this data
it is possible to fit a quadratic function which contains the
TWISS parameters (α, β, γ). With this TWISS parame-
ters the normalized emittance can be calculated as followed
εn = βeγe√
βγ − α2 [8]. Here βe & γe are the relativis-
tic velocity and the Lorentz-factor of the electrons respec-
tively.
This has been done for different beam alignment settings
and the preliminary results are presented in 8. In the
upper right corner of the plot the dimensions of the used
laser spot are shown and the beam profile is shown in
4. With this dimensions of the emitting area A = 0.5mm2
the geometric ratio Ad2 = 22.2 · 10−6. The presented pre-
liminary results are made with pulsed dc beam and without
RF-synchronized pulses.
The results show large variations which may be caused
by varying conditions, since they have been obtained over
a long period of time. The increase in emittance can be ex-
pected because of the small perveance. However, further
investigations are necessary before definitive statements
can be made. In particular we will try to investigate the
reason for differing values of the slit mask technique , pre-
sented below.
lit ask
In the slit mask emittance measurement method small
slices of the beam are cut-out. More details of the slit mask
method can be seen in [9]. This is presented on the left
side of gure 9 where the raw data of the measurement
with 0.5 mA beam current are shown. Here the bit-value isplot-ted over the pixel position on the camera. From this
data the width and the displacement of each peak are
extracted and with this parameters it is possible to
reconstruct the phase space distribution which can be seen
on the right side of gure 9. Here the color code and the
point size indicates the normalized intensity of the slits.
Furthermore with this parameters the normalized
emittance can be calculated. In gure 10 preliminary
results for three different solenoid currents and a beam
current of 0.1 mA to 0.5 mA are pre-sented. This data alsorepresents the 1σ−emittance. The variation of the solenoidcurrent has been done to check
gure
gure
THIALH2069 Proceedings of ERL2015, Stony Brook, NY, USA
ISBN 978-3-95450-183-0
94Cop
yrig
ht©
2015
CC
-BY-
3.0
and
byth
ere
spec
tive
auth
ors
WG1 ERL Injectors (Gun/Cathode/Laser)
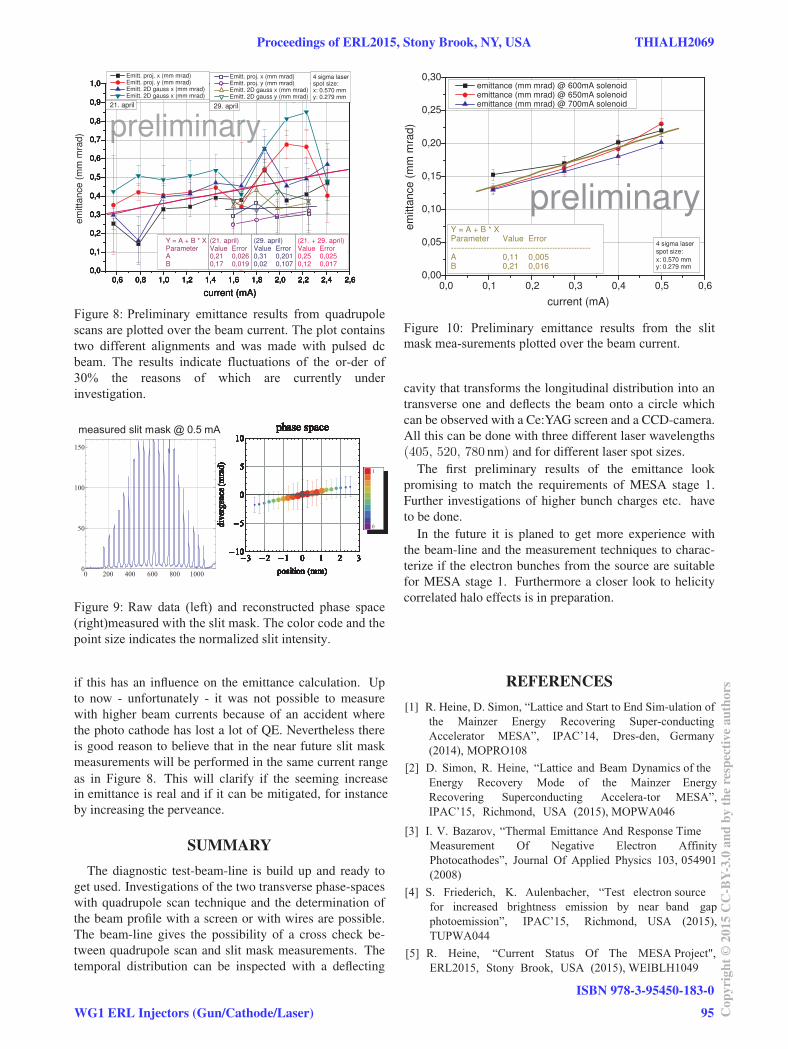
preliminary
0,6 0,8 1,0 1,2 1,4 1,6 1,8 2,0 2,2 2,4 2,60,0
0,1
0,2
0,3
0,4
0,5
0,6
0,7
0,8
0,9
1,0
0,6 0,8 1,0 1,2 1,4 1,6 1,8 2,0 2,2 2,4 2,60,0
0,1
0,2
0,3
0,4
0,5
0,6
0,7
0,8
0,9
1,0
0,6 0,8 1,0 1,2 1,4 1,6 1,8 2,0 2,2 2,4 2,60,0
0,1
0,2
0,3
0,4
0,5
0,6
0,7
0,8
0,9
1,0
0,6 0,8 1,0 1,2 1,4 1,6 1,8 2,0 2,2 2,4 2,60,0
0,1
0,2
0,3
0,4
0,5
0,6
0,7
0,8
0,9
1,0
0,6 0,8 1,0 1,2 1,4 1,6 1,8 2,0 2,2 2,4 2,60,0
0,1
0,2
0,3
0,4
0,5
0,6
0,7
0,8
0,9
1,04 sigma laserspot size:x: 0.570 mmy: 0.279 mm
Emitt. proj. x (mm mrad)Emitt. proj. y (mm mrad)Emitt. 2D gauss x (mm mrad)Emitt. 2D gauss x (mm mrad)
emitt
ance
(m
m m
rad)
current (mA)
29. april
Emitt. proj. x (mm mrad)Emitt. proj. y (mm mrad)Emitt. 2D gauss x (mm mrad)Emitt. 2D gauss y (mm mrad)
21. april
Y = A + B * X (21. april) (29. april) (21. + 29. april)Parameter Value Error Value Error Value ErrorA 0,21 0,026 0,31 0,201 0,25 0,025B 0,17 0,019 0,02 0,107 0,12 0,017
current (mA)current (mA)current (mA)
if this has an influence on the emittance calculation. Up
to now - unfortunately - it was not possible to measure
with higher beam currents because of an accident where
the photo cathode has lost a lot of QE. Nevertheless there
is good reason to believe that in the near future slit mask
measurements will be performed in the same current range
as in gure 8. This will clarify if the seeming increase
in emittance is real and if it can be mitigated, for instance
by increasing the perveance.
SUMMARY
The diagnostic test-beam-line is build up and ready to
get used. Investigations of the two transverse phase-spaces
with quadrupole scan technique and the determination of
the beam profile with a screen or with wires are possible.
The beam-line gives the possibility of a cross check be-
tween quadrupole scan and slit mask measurements. The
temporal distribution can be inspected with a deflecting
preliminary
0,0 0,1 0,2 0,3 0,4 0,5 0,60,00
0,05
0,10
0,15
0,20
0,25
0,30
emitt
ance
(m
m m
rad)
current (mA)
emittance (mm mrad) @ 600mA solenoidemittance (mm mrad) @ 650mA solenoidemittance (mm mrad) @ 700mA solenoid
Y = A + B * XParameter Value Error---------------------------------------------------A 0,11 0,005B 0,21 0,016
4 sigma laserspot size:x: 0.570 mmy: 0.279 mm
cavity that transforms the longitudinal distribution into an
transverse one and deflects the beam onto a circle which
can be observed with a Ce:YAG screen and a CCD-camera.
All this can be done with three different laser wavelengths
(405, 520, 780 nm) and for different laser spot sizes.
The first preliminary results of the emittance look
promising to match the requirements of MESA stage 1.
Further investigations of higher bunch charges etc. have
to be done.
In the future it is planed to get more experience with
the beam-line and the measurement techniques to charac-
terize if the electron bunches from the source are suitable
for MESA stage 1. Furthermore a closer look to helicity
correlated halo effects is in preparation.
REFERENCES
[1] R. Heine, D. Simon, “Lattice and Start to End Sim-
Proceedings of ERL2015, Stony Brook, NY, USA THIALH2069
WG1 ERL Injectors (Gun/Cathode/Laser)
ISBN 978-3-95450-183-0
95 Cop
yrig
ht©
2015
CC
-BY-
3.0
and
byth
ere
spec
tive
auth
ors
THIALH2069 Proceedings of ERL2015, Stony Brook, NY, USA
ISBN 978-3-95450-183-0
96Cop
yrig
ht©
2015
CC
-BY-
3.0
and
byth
ere
spec
tive
auth
ors
WG1 ERL Injectors (Gun/Cathode/Laser)
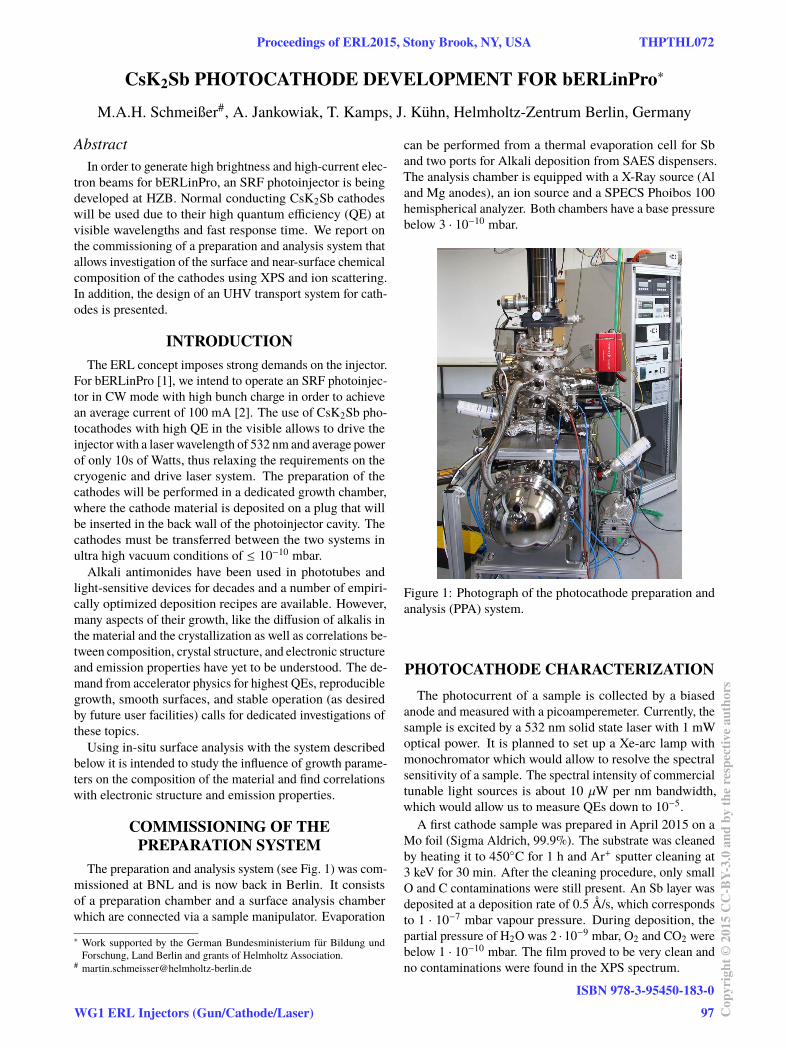
CsK2Sb PHOTOCATHODE DEVELOPMENT FOR bERLinPro∗
M.A.H. Schmeißer#, A. Jankowiak, T. Kamps, J. Kühn, Helmholtz-Zentrum Berlin, Germany
AbstractIn order to generate high brightness and high-current elec-
tron beams for bERLinPro, an SRF photoinjector is being
developed at HZB. Normal conducting CsK2Sb cathodes
will be used due to their high quantum efficiency (QE) at
visible wavelengths and fast response time. We report on
the commissioning of a preparation and analysis system that
allows investigation of the surface and near-surface chemical
composition of the cathodes using XPS and ion scattering.
In addition, the design of an UHV transport system for cath-
odes is presented.
INTRODUCTION
The ERL concept imposes strong demands on the injector.
For bERLinPro [1], we intend to operate an SRF photoinjec-
tor in CW mode with high bunch charge in order to achieve
an average current of 100 mA [2]. The use of CsK2Sb pho-
tocathodes with high QE in the visible allows to drive the
injector with a laser wavelength of 532 nm and average power
of only 10s of Watts, thus relaxing the requirements on the
cryogenic and drive laser system. The preparation of the
cathodes will be performed in a dedicated growth chamber,
where the cathode material is deposited on a plug that will
be inserted in the back wall of the photoinjector cavity. The
cathodes must be transferred between the two systems in
ultra high vacuum conditions of ≤ 10−10 mbar.
Alkali antimonides have been used in phototubes and
light-sensitive devices for decades and a number of empiri-
cally optimized deposition recipes are available. However,
many aspects of their growth, like the diffusion of alkalis in
the material and the crystallization as well as correlations be-
tween composition, crystal structure, and electronic structure
and emission properties have yet to be understood. The de-
mand from accelerator physics for highest QEs, reproducible
growth, smooth surfaces, and stable operation (as desired
by future user facilities) calls for dedicated investigations of
these topics.
Using in-situ surface analysis with the system described
below it is intended to study the influence of growth parame-
ters on the composition of the material and find correlations
with electronic structure and emission properties.
COMMISSIONING OF THE
PREPARATION SYSTEM
The preparation and analysis system (see Fig. 1) was com-
missioned at BNL and is now back in Berlin. It consists
of a preparation chamber and a surface analysis chamber
which are connected via a sample manipulator. Evaporation
∗ Work supported by the German Bundesministerium für Bildung und
Forschung, Land Berlin and grants of Helmholtz Association.# [email protected]
can be performed from a thermal evaporation cell for Sb
and two ports for Alkali deposition from SAES dispensers.
The analysis chamber is equipped with a X-Ray source (Al
and Mg anodes), an ion source and a SPECS Phoibos 100
hemispherical analyzer. Both chambers have a base pressure
below 3 · 10−10 mbar.
Figure 1: Photograph of the photocathode preparation and
analysis (PPA) system.
PHOTOCATHODE CHARACTERIZATION
The photocurrent of a sample is collected by a biased
anode and measured with a picoamperemeter. Currently, the
sample is excited by a 532 nm solid state laser with 1 mW
optical power. It is planned to set up a Xe-arc lamp with
monochromator which would allow to resolve the spectral
sensitivity of a sample. The spectral intensity of commercial
tunable light sources is about 10 μW per nm bandwidth,
which would allow us to measure QEs down to 10−5.
A first cathode sample was prepared in April 2015 on a
Mo foil (Sigma Aldrich, 99.9%). The substrate was cleaned
by heating it to 450C for 1 h and Ar+ sputter cleaning at
3 keV for 30 min. After the cleaning procedure, only small
O and C contaminations were still present. An Sb layer was
deposited at a deposition rate of 0.5 Å/s, which corresponds
to 1 · 10−7 mbar vapour pressure. During deposition, the
partial pressure of H2O was 2 · 10−9 mbar, O2 and CO2 were
below 1 · 10−10 mbar. The film proved to be very clean and
no contaminations were found in the XPS spectrum.
Proceedings of ERL2015, Stony Brook, NY, USA THPTHL072
WG1 ERL Injectors (Gun/Cathode/Laser)
ISBN 978-3-95450-183-0
97 Cop
yrig
ht©
2015
CC
-BY-
3.0
and
byth
ere
spec
tive
auth
ors

Following a sequential growth procedure, K and Cs were
subsequently deposited. For both alkalis, the vapour pressure
was very low and could hardly be resolved in the mass spec-
trometer (<10−13 mbar). During the K deposition the partial
pressure of H2O was 2 · 10−9 mbar, O2 and CO2 were below
1 · 10−10 mbar. The Cs dispenser had to be heated above its
specified current to obtain a reading on the quartz microbal-
ance. A too high temperature of the dispenser led to high
background pressure of atomic O and N in the 10−9 mbar
range. An XPS spectrum was taken after the deposition of
both Alkalis where traces of Cr and O are discernible. All
three spectra can be compared in Fig. 2.
1000 800 600 400 200 0
Cs 4dCs 4p
K 2p
K 2s
Sb 3d
Sb 3p1/2
Inte
nsity
(arb
. u.)
Binding energy (eV)
Mo Sb Cs-K-Sb
Mg Kα
O KLL
O 1s
Mo 3s
Mo 3p
Mo 3d
C 1sMo 4s
Mo 4p
Sb 3d
Sb 4d
Sb MNN
Sb 3p3/2
K LMM Cs 3d
Figure 2: XPS survey spectra of three steps of a cathode
preparation. The Mo substrate after cleaning (see text), after
Sb deposition and after K and Cs deposition is shown.
SUBSTRATE PREPARATION AND
CATHODE TRANSFER
The preparation system is located in a laboratory room
apart from the injector, thus the cathodes must be transported
in a movable vacuum vessel and transferred into the injector
cryomodule using a load-lock. The transfer system is based
on a setup that is in use at HZDR.
Figure 3: Drawing of the pug holder that will fit into the back
wall of the gun cavity. The small CuBe spring that holds the
plug is locked tightly and can be opened by a mechanism
inside the holder rod.
The cathode puck (red cap in Fig. 3) can be made of
copper or molybdenum. Copper plugs will be used for the
commissioning of the injector with low bunch charge and
molybdenum plugs will be used as substrates for the CsK2Sb
cathodes. In order to maintain the low surface resistivity of
copper, but exploit the better substrate behavior of refractory
metals, the use of a Cu plug with Ta or Mo evaporated on
the surface as a barrier substrate layer will be investigated.
Here, field emission properties need to be considered [3].
Figure 4: Drawing of the transfer system at the PPA system,
as-planned.
In the preparation system and during transport the plugs
will be mounted on omicron style sample holders. The trans-
fer system (Fig. 4) at the injector allows to take the plugs
off their sample holders and mount them on a cathode stalk
shown in Fig. 3. Both transfer systems can handle a tray of
four sample holders which can be inserted to the vacuum
suitcase (Fig. 5) through a load-lock. Ongoing work will be
Figure 5: Photograph of the vacuum suitcase with 4 cathode
positions, as recently commissioned. Base pressures in the
low 10−11 mbar range can be maintained.
focused on studying the QE dependence on the composition,
optimization of growth procedures, photocathode life time
studies and the development of a reproducible growth pro-
cedure of CsK2Sb photocathodes with a smooth surface and
high QE. A prototype of the photoinjector and a diagnostics
beamline will be available in spring 2016 [4], where in-gun
experiments and post-operation analysis will be performed.
ACKNOWLEDGMENT
The authors gratefully acknowledge the engineering work
of K. Martin, D. Böhlick and A. Frahm and P. Murzcek
(HZDR).
THPTHL072 Proceedings of ERL2015, Stony Brook, NY, USA
ISBN 978-3-95450-183-0
98Cop
yrig
ht©
2015
CC
-BY-
3.0
and
byth
ere
spec
tive
auth
ors
WG1 ERL Injectors (Gun/Cathode/Laser)

REFERENCES
[1] M. Abo-Bakr et al. “Status of the HZB ERL Project
bERLinPro.” In: Proceedings of IPAC 2014. MO-PRO106. Dresden, 2014, pp. 2014–2016.
[2] A. Neumann et al. “Towards a 100mA Superconduct-
ing RF Photoinjector for bERLinPro.” In: Proceedingsof SRF 2013. MOIOB02. Paris, pp. 42–49.
[3] S. Lagotzky et al. “Prevention of electron field emis-
sion from molybdenum substrates for photocathodes
by the native oxide layer.” In: The European PhysicalJournal Applied Physics 70.2 (2015), p. 21301. doi:10.1051/epjap/2015150167.
[4] J. Völker et al. “Introducing GunLab- A Compact Test
Facility for SRF Photoinjectors.” In: Proceedings ofIPAC 2014. MOPRI020. Dresden, 2014, pp. 630–632.
Proceedings of ERL2015, Stony Brook, NY, USA THPTHL072
WG1 ERL Injectors (Gun/Cathode/Laser)
ISBN 978-3-95450-183-0
99 Cop
yrig
ht©
2015
CC
-BY-
3.0
and
byth
ere
spec
tive
auth
ors
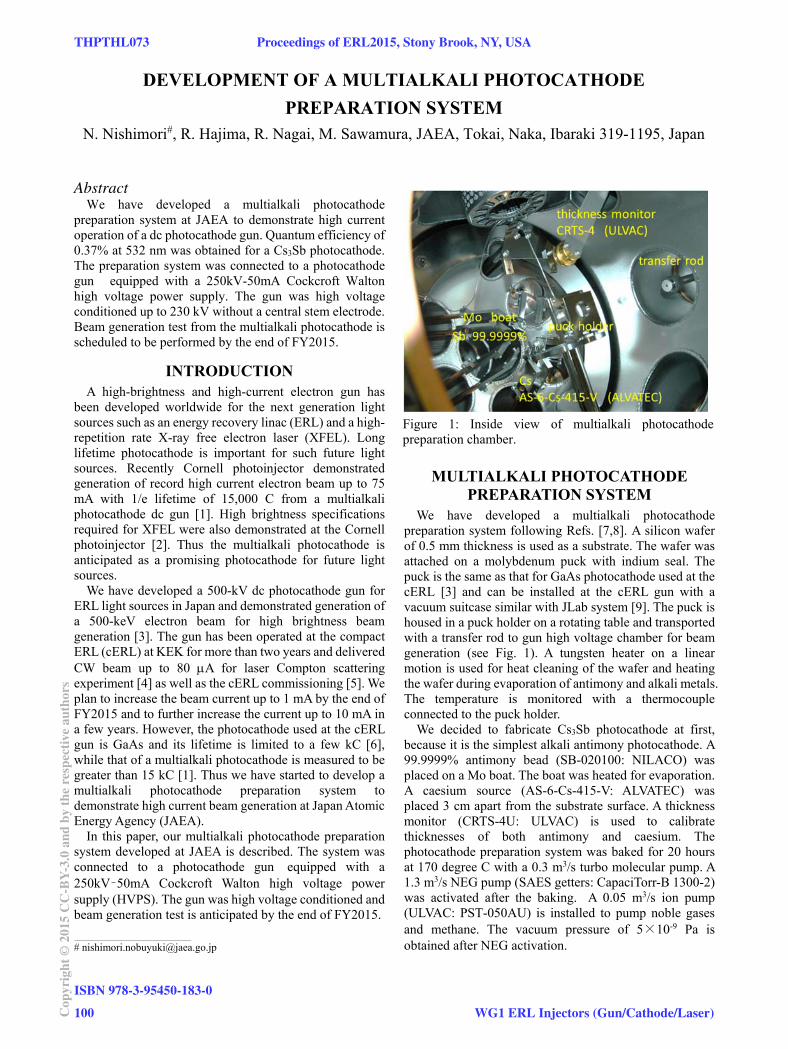
DEVELOPMENT OF A MULTIALKALI PHOTOCATHODE PREPARATION SYSTEM
N. Nishimori#, R. Hajima, R. Nagai, M. Sawamura, JAEA, Tokai, Naka, Ibaraki 319-1195, Japan
Abstract
We have developed a multialkali photocathode preparation system at JAEA to demonstrate high current operation of a dc photocathode gun. Quantum efficiency of 0.37% at 532 nm was obtained for a Cs3Sb photocathode. The preparation system was connected to a photocathode gun equipped with a 250kV-50mA Cockcroft Walton high voltage power supply. The gun was high voltage conditioned up to 230 kV without a central stem electrode. Beam generation test from the multialkali photocathode is scheduled to be performed by the end of FY2015.
INTRODUCTION A high-brightness and high-current electron gun has
been developed worldwide for the next generation light sources such as an energy recovery linac (ERL) and a high-repetition rate X-ray free electron laser (XFEL). Long lifetime photocathode is important for such future light sources. Recently Cornell photoinjector demonstrated generation of record high current electron beam up to 75 mA with 1/e lifetime of 15,000 C from a multialkali photocathode dc gun [1]. High brightness specifications required for XFEL were also demonstrated at the Cornell photoinjector [2]. Thus the multialkali photocathode is anticipated as a promising photocathode for future light sources.
We have developed a 500-kV dc photocathode gun for ERL light sources in Japan and demonstrated generation of a 500-keV electron beam for high brightness beam generation [3]. The gun has been operated at the compact ERL (cERL) at KEK for more than two years and delivered CW beam up to 80 A for laser Compton scattering experiment [4] as well as the cERL commissioning [5]. We plan to increase the beam current up to 1 mA by the end of FY2015 and to further increase the current up to 10 mA in a few years. However, the photocathode used at the cERL gun is GaAs and its lifetime is limited to a few kC [6], while that of a multialkali photocathode is measured to be greater than 15 kC [1]. Thus we have started to develop a multialkali photocathode preparation system to demonstrate high current beam generation at Japan Atomic Energy Agency (JAEA).
In this paper, our multialkali photocathode preparation system developed at JAEA is described. The system was connected to a photocathode gun equipped with a 250kV–50mA Cockcroft Walton high voltage power supply (HVPS). The gun was high voltage conditioned and beam generation test is anticipated by the end of FY2015.
MULTIALKALI PHOTOCATHODE PREPARATION SYSTEM
We have developed a multialkali photocathode preparation system following Refs. [7,8]. A silicon wafer of 0.5 mm thickness is used as a substrate. The wafer was attached on a molybdenum puck with indium seal. The puck is the same as that for GaAs photocathode used at the cERL [3] and can be installed at the cERL gun with a vacuum suitcase similar with JLab system [9]. The puck is housed in a puck holder on a rotating table and transported with a transfer rod to gun high voltage chamber for beam generation (see Fig. 1). A tungsten heater on a linear motion is used for heat cleaning of the wafer and heating the wafer during evaporation of antimony and alkali metals. The temperature is monitored with a thermocouple connected to the puck holder.
We decided to fabricate Cs3Sb photocathode at first, because it is the simplest alkali antimony photocathode. A 99.9999% antimony bead (SB-020100: NILACO) was placed on a Mo boat. The boat was heated for evaporation. A caesium source (AS-6-Cs-415-V: ALVATEC) was placed 3 cm apart from the substrate surface. A thickness monitor (CRTS-4U: ULVAC) is used to calibrate thicknesses of both antimony and caesium. The photocathode preparation system was baked for 20 hours at 170 degree C with a 0.3 m3/s turbo molecular pump. A 1.3 m3/s NEG pump (SAES getters: CapaciTorr-B 1300-2) was activated after the baking. A 0.05 m3/s ion pump (ULVAC: PST-050AU) is installed to pump noble gases and methane. The vacuum pressure of 5×10⁻⁹ Pa is obtained after NEG activation.
Figure 1: Inside view of multialkali photocathode preparation chamber.
___________________________________________
THPTHL073 Proceedings of ERL2015, Stony Brook, NY, USA
ISBN 978-3-95450-183-0
100Cop
yrig
ht©
2015
CC
-BY-
3.0
and
byth
ere
spec
tive
auth
ors
WG1 ERL Injectors (Gun/Cathode/Laser)
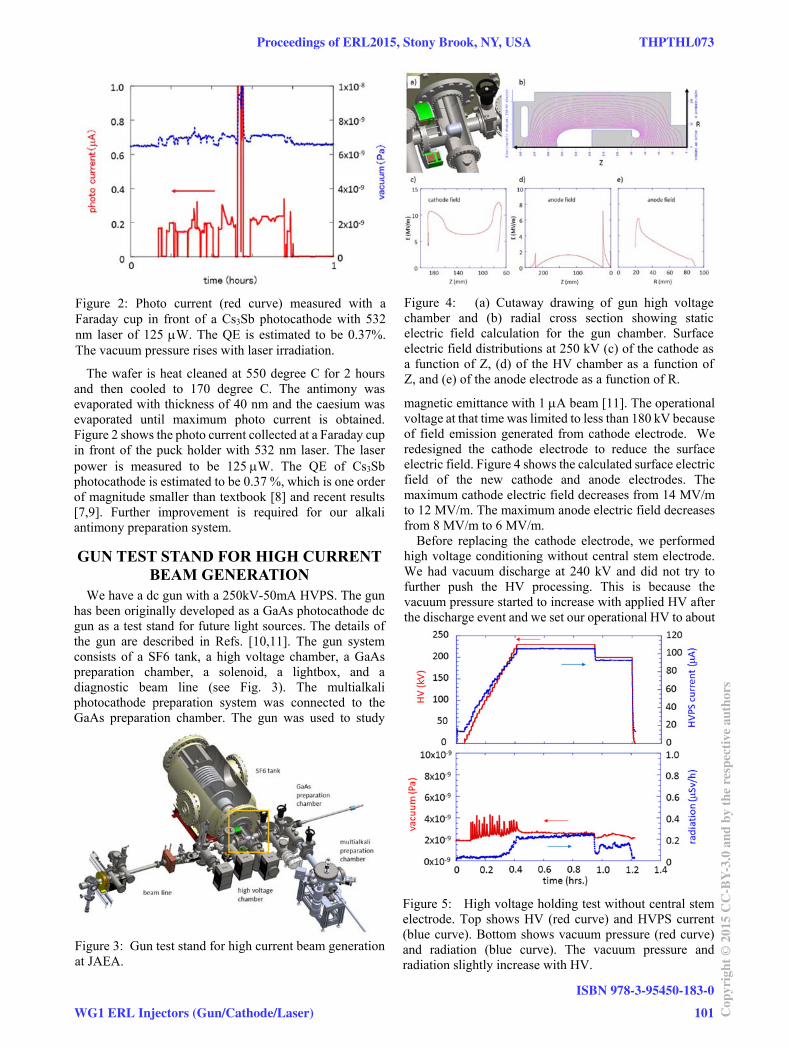
The wafer is heat cleaned at 550 degree C for 2 hours and then cooled to 170 degree C. The antimony was evaporated with thickness of 40 nm and the caesium was evaporated until maximum photo current is obtained. Figure 2 shows the photo current collected at a Faraday cup in front of the puck holder with 532 nm laser. The laser power is measured to be 125W. The QE of Cs3Sb photocathode is estimated to be 0.37 %, which is one order of magnitude smaller than textbook [8] and recent results [7,9]. Further improvement is required for our alkali antimony preparation system.
GUN TEST STAND FOR HIGH CURRENT BEAM GENERATION
We have a dc gun with a 250kV-50mA HVPS. The gun has been originally developed as a GaAs photocathode dc gun as a test stand for future light sources. The details of the gun are described in Refs. [10,11]. The gun system consists of a SF6 tank, a high voltage chamber, a GaAs preparation chamber, a solenoid, a lightbox, and a diagnostic beam line (see Fig. 3). The multialkali photocathode preparation system was connected to the GaAs preparation chamber. The gun was used to study
magnetic emittance with 1 A beam [11]. The operational voltage at that time was limited to less than 180 kV because of field emission generated from cathode electrode. We redesigned the cathode electrode to reduce the surface electric field. Figure 4 shows the calculated surface electric field of the new cathode and anode electrodes. The maximum cathode electric field decreases from 14 MV/m to 12 MV/m. The maximum anode electric field decreases from 8 MV/m to 6 MV/m.
Before replacing the cathode electrode, we performed high voltage conditioning without central stem electrode. We had vacuum discharge at 240 kV and did not try to further push the HV processing. This is because the vacuum pressure started to increase with applied HV after the discharge event and we set our operational HV to about
Figure 2: Photo current (red curve) measured with a Faraday cup in front of a Cs3Sb photocathode with 532 nm laser of 125 µW. The QE is estimated to be 0.37%. The vacuum pressure rises with laser irradiation.
Figure 4: (a) Cutaway drawing of gun high voltage chamber and (b) radial cross section showing static electric field calculation for the gun chamber. Surface electric field distributions at 250 kV (c) of the cathode as a function of Z, (d) of the HV chamber as a function of Z, and (e) of the anode electrode as a function of R.
Figure 3: Gun test stand for high current beam generation at JAEA.
Figure 5: High voltage holding test without central stem electrode. Top shows HV (red curve) and HVPS current (blue curve). Bottom shows vacuum pressure (red curve) and radiation (blue curve). The vacuum pressure and radiation slightly increase with HV.
Proceedings of ERL2015, Stony Brook, NY, USA THPTHL073
WG1 ERL Injectors (Gun/Cathode/Laser)
ISBN 978-3-95450-183-0
101 Cop
yrig
ht©
2015
CC
-BY-
3.0
and
byth
ere
spec
tive
auth
ors
200 kV. The vacuum pressure recovered from 8×10⁻⁹ Pa to 4×10⁻⁹ Pa after holding HV at 230 kV for four hours. Figure 5 shows the HV holding test at 230 kV after the vacuum recovery. The top shows the gun HV (red curve) and the HVPS current (blue curve). The bottom shows the vacuum (red curve) and radiation (blue curve). The application of 200 kV on the ceramic tube leads to slight increases of vacuum and radiation. These data can be used to obtain increases of vacuum and radiation caused by central stem and cathode electrodes in the future experiment.
SUMMARY We have developed a multialkali photocathode
preparation system and obtained QE of 0.37% at 532 nm for a Cs3Sb photocathode. The QE is one order of magnitude smaller than the textbook [8]. The system thus needs to be further improved. The system was connected to the existing dc gun equipped with a 250kV-50mA HVPS at JAEA for beam generation. The gun was high voltage conditioned up to 230 kV without a central stem electrode. Beam generation test from the multialkali photocathode is planned to be performed by the end of FY2015.
ACKNOWLEDGMENTS This work is supported by Photon and Quantum Basic
Research Coordinated Development Program from the Ministry of Education, Culture, Sports, Science and
Technology, Japan and is partially supported by JSPS Grants-in-Aid for Scientific Research in Japan (15K13412).
REFERENCES [1] L. Cultera et al., Appl. Phys. Lett. 103 (2013) 103504. [2] C. Gulliford et al., Appl. Phys. Lett. 106 (2015)
094101. [3] N. Nishimori et al., Appl. Phys. Lett. 102 (2013)
234103. [4] R. Nagai et al., “Demonstration of High-flux Photon
Generation from an ERL-based Laser Compton Photon Source”, in Proc. of IPAC2015, Richmond, VA, 2015.
[5] S. Sakanaka et al., “Recent Progress and Operational Status of the compact ERL at KEK”, in Proc. of IPAC2015, Richmond, VA, 2015.
[6] J. Grames et al., Phys. Rev. STAB 14 (2011) 043501. [7] Luca Cultera, “Fabrication, characterization, and use
of alkali antimonides in a dc gun”, Photocathode Physics for Photoinjectors 2012, Ithaka, NY, 2012.
[8] A. H. Sommer, “Photoemissive Materials”, John Wiley & Sons, Inc. New York (1968).
[9] R. R. Mammei et al., Phys. Rev. STAB 16 (2013) 033401.
[10] R. Nagai et al., “Development of a 250-kV Photo-cathode Electron Gun for the ERL Light Sources at JAEA”, in Proc. of PAC2009, p. 545-547, Vancouver, BC, Canada, 2009.
[11] R. Nagai et al., Rev. Sci. Instrum. 83 (2012) 123303.
THPTHL073 Proceedings of ERL2015, Stony Brook, NY, USA
ISBN 978-3-95450-183-0
102Cop
yrig
ht©
2015
CC
-BY-
3.0
and
byth
ere
spec
tive
auth
ors
WG1 ERL Injectors (Gun/Cathode/Laser)
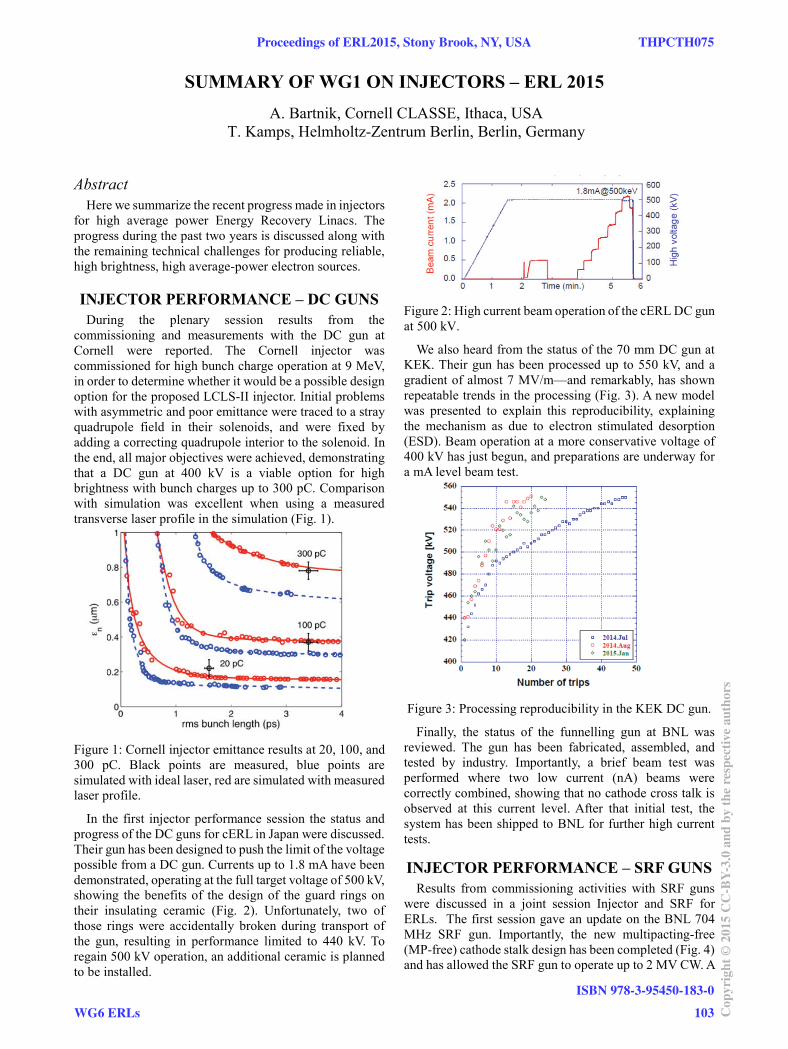
SUMMARY OF WG1 ON INJECTORS – ERL 2015A. Bartnik, Cornell CLASSE, Ithaca, USA
T. Kamps, Helmholtz-Zentrum Berlin, Berlin, Germany
AbstractHere we summarize the recent progress made in injectors
for high average power Energy Recovery Linacs. The progress during the past two years is discussed along with the remaining technical challenges for producing reliable, high brightness, high average-power electron sources.
INJECTOR PERFORMANCE – DC GUNSDuring the plenary session results from the
commissioning and measurements with the DC gun at Cornell were reported. The Cornell injector was commissioned for high bunch charge operation at 9 MeV, in order to determine whether it would be a possible design option for the proposed LCLS-II injector. Initial problems with asymmetric and poor emittance were traced to a stray quadrupole field in their solenoids, and were fixed by adding a correcting quadrupole interior to the solenoid. In the end, all major objectives were achieved, demonstrating that a DC gun at 400 kV is a viable option for high brightness with bunch charges up to 300 pC. Comparison with simulation was excellent when using a measured transverse laser profile in the simulation (Fig. 1).
Figure 1: Cornell injector emittance results at 20, 100, and 300 pC. Black points are measured, blue points are simulated with ideal laser, red are simulated with measured laser profile.
In the first injector performance session the status and progress of the DC guns for cERL in Japan were discussed.Their gun has been designed to push the limit of the voltage possible from a DC gun. Currents up to 1.8 mA have been demonstrated, operating at the full target voltage of 500 kV, showing the benefits of the design of the guard rings on their insulating ceramic (Fig. 2). Unfortunately, two of those rings were accidentally broken during transport of the gun, resulting in performance limited to 440 kV. To regain 500 kV operation, an additional ceramic is planned to be installed.
Figure 2: High current beam operation of the cERL DC gun at 500 kV.
We also heard from the status of the 70 mm DC gun at KEK. Their gun has been processed up to 550 kV, and a gradient of almost 7 MV/m—and remarkably, has shown repeatable trends in the processing (Fig. 3). A new model was presented to explain this reproducibility, explaining the mechanism as due to electron stimulated desorption (ESD). Beam operation at a more conservative voltage of400 kV has just begun, and preparations are underway for a mA level beam test.
Figure 3: Processing reproducibility in the KEK DC gun.
Finally, the status of the funnelling gun at BNL was reviewed. The gun has been fabricated, assembled, and tested by industry. Importantly, a brief beam test was performed where two low current (nA) beams were correctly combined, showing that no cathode cross talk is observed at this current level. After that initial test, the system has been shipped to BNL for further high current tests.
INJECTOR PERFORMANCE – SRF GUNSResults from commissioning activities with SRF guns
were discussed in a joint session Injector and SRF for ERLs. The first session gave an update on the BNL 704 MHz SRF gun. Importantly, the new multipacting-free (MP-free) cathode stalk design has been completed (Fig. 4) and has allowed the SRF gun to operate up to 2 MV CW. A
Proceedings of ERL2015, Stony Brook, NY, USA THPCTH075
WG6 ERLs
ISBN 978-3-95450-183-0
103 Cop
yrig
ht©
2015
CC
-BY-
3.0
and
byth
ere
spec
tive
auth
ors

beam test was performed with a K2CsSb cathode, which successfully demonstrated that the QE of the cathode is preserved after cryogenic cooling—no cathode degradation was observed. In addition, up to 0.55 nC per bunch was extracted from the gun, in a low-rep rate beam test at 0.85 MeV.
Figure 4: New multipacting-free cathode stalk with Ta tip, used in the BNL 704 MHz SRF gun.
Results from the recent beam measurements with the new SRF gun II at ELBE were presented. Though operating at a smaller gradient than expected due a cavity breakdown event, 7 MV/m, it should still potentially allow up to 500 pC, improving user operation. The cathode-cavity interface is the primary challenge at the moment, due to the need for high quality cleanliness. In addition, transverse emittance and longitudinal phase spacemeasurements were performed, and agreed well with expectations from Astra simulations (Fig. 5).
Figure 5: Transverse normalized emittance versus launch phase measurements using two methods with the SRF gun at ELBE.
CATHODES AND LASERSTwo talks were given on laser systems. First, during the
plenary session, we heard a summary talk on the state of lasers for use in ERLs. Due to the existence of high quantum efficiency cathodes, drive lasers are now
powerful enough for 100s of mA of beam current, and this is not a limiting factor any more. But, more work is still needed on long term stability, both in position and phase. More flexibility is also needed in the repetition rate and pulse structure, in order to have a method to raise beam current without affecting the e-beam optics.
We also saw a presentation on a new method to shape laser profiles using a spatial light modulator (SLM). Instead of making a phase grating, and exploiting diffraction to tune the shape of the laser beam, the SLM was used to manipulate the polarization of the light, on a pixel-to-pixel scale. A subsequent polarizer was then used to carve out the desired shape from the initial beam. Though inherently lossy, this method benefits from being both fast, simple, and potentially very accurate (Fig. 6).
Figure 6: Example shaped laser and electron beam profile.
We heard two talks, related to an effort to understand and control the surface roughness on Alkali photocathodes. K2CsSb photocathodes have been regarded as a strong candidate for excellent electron sources. The traditional sequential growth method for this type of photocathode could result in a rough surface which will have an adverse influence on the beam emittance in the high gradient field used in most applications. Previous studies have revealed the evolution from crystalline Sb layer, to a K-Sb compound, and then to the crystalline K3Sb significantly increase the surface roughness. X-ray reflectivity (XRR) is a powerful non-destructive thin film characterization method and has been applied to the growth study of K2CsSb photocathode. In order to suppress the roughening phenomenon, they developed an alternating deposition method of Sb layer and followed by K-Cs sequential deposition, together with co-deposition of K and Cs, and sputtering. XRR analysis shows that co-evaporated K2CsSb may end up in a smoother surface with almost the same quantum efficiency compared to sequentially-evaporated photocathode (Fig. 7). Sputter deposition could result in a smooth photocathode with sub nm roughness and acceptable 1% quantum efficiency at the wavelength of green light.
THPCTH075 Proceedings of ERL2015, Stony Brook, NY, USA
ISBN 978-3-95450-183-0
104Cop
yrig
ht©
2015
CC
-BY-
3.0
and
byth
ere
spec
tive
auth
ors
WG6 ERLs
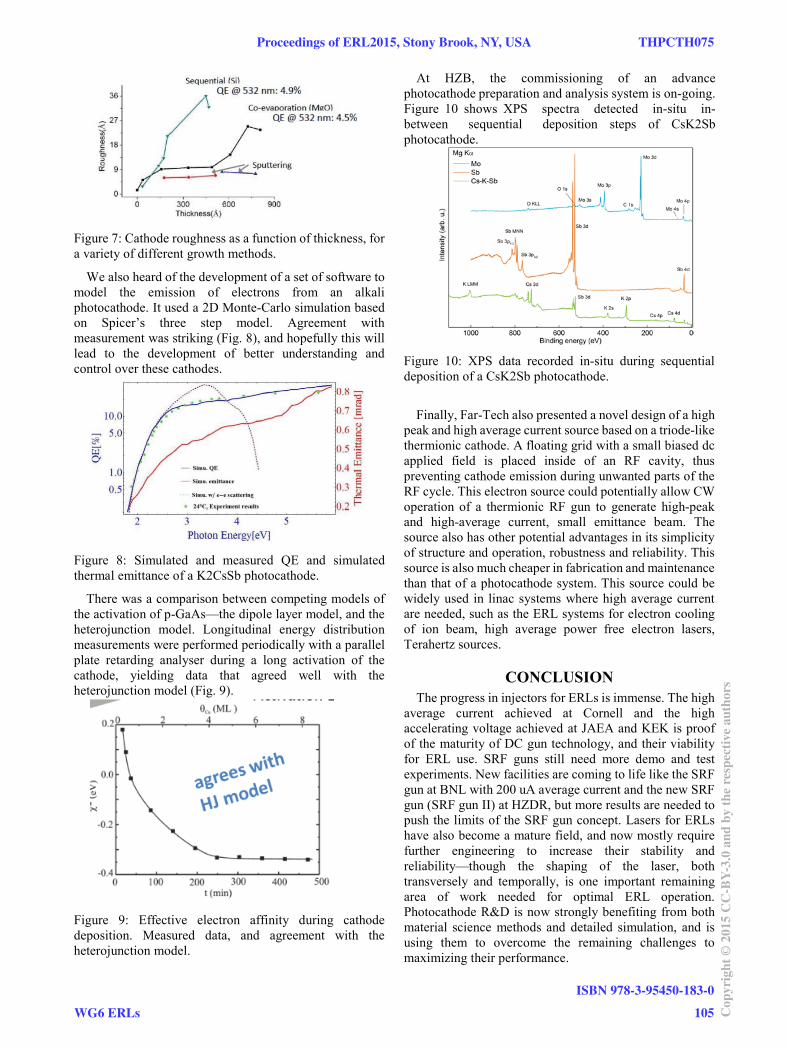
Figure 7: Cathode roughness as a function of thickness, for a variety of different growth methods.
We also heard of the development of a set of software to model the emission of electrons from an alkali photocathode. It used a 2D Monte-Carlo simulation based on Spicer’s three step model. Agreement with measurement was striking (Fig. 8), and hopefully this will lead to the development of better understanding and control over these cathodes.
Figure 8: Simulated and measured QE and simulated thermal emittance of a K2CsSb photocathode.
There was a comparison between competing models of the activation of p-GaAs—the dipole layer model, and the heterojunction model. Longitudinal energy distribution measurements were performed periodically with a parallel plate retarding analyser during a long activation of the cathode, yielding data that agreed well with the heterojunction model (Fig. 9).
Figure 9: Effective electron affinity during cathode deposition. Measured data, and agreement with the heterojunction model.
At HZB, the commissioning of an advance photocathode preparation and analysis system is on-going. Figure 10 shows XPS spectra detected in-situ in-between sequential deposition steps of CsK2Sb photocathode.
Figure 10: XPS data recorded in-situ during sequential deposition of a CsK2Sb photocathode.
Finally, Far-Tech also presented a novel design of a high peak and high average current source based on a triode-like thermionic cathode. A floating grid with a small biased dc applied field is placed inside of an RF cavity, thus preventing cathode emission during unwanted parts of the RF cycle. This electron source could potentially allow CW operation of a thermionic RF gun to generate high-peak and high-average current, small emittance beam. The source also has other potential advantages in its simplicity of structure and operation, robustness and reliability. This source is also much cheaper in fabrication and maintenance than that of a photocathode system. This source could be widely used in linac systems where high average current are needed, such as the ERL systems for electron cooling of ion beam, high average power free electron lasers, Terahertz sources.
CONCLUSIONThe progress in injectors for ERLs is immense. The high
average current achieved at Cornell and the high accelerating voltage achieved at JAEA and KEK is proofof the maturity of DC gun technology, and their viability for ERL use. SRF guns still need more demo and test experiments. New facilities are coming to life like the SRF gun at BNL with 200 uA average current and the new SRF gun (SRF gun II) at HZDR, but more results are needed to push the limits of the SRF gun concept. Lasers for ERLs have also become a mature field, and now mostly require further engineering to increase their stability and reliability—though the shaping of the laser, both transversely and temporally, is one important remaining area of work needed for optimal ERL operation. Photocathode R&D is now strongly benefiting from both material science methods and detailed simulation, and is using them to overcome the remaining challenges to maximizing their performance.
Proceedings of ERL2015, Stony Brook, NY, USA THPCTH075
WG6 ERLs
ISBN 978-3-95450-183-0
105 Cop
yrig
ht©
2015
CC
-BY-
3.0
and
byth
ere
spec
tive
auth
ors

ACKNOWLEDGMENTSThe authors would like to thank the workshop organizers
and participants of the working group for the excellent presentations and lively discussions during and in-between the sessions.
THPCTH075 Proceedings of ERL2015, Stony Brook, NY, USA
ISBN 978-3-95450-183-0
106Cop
yrig
ht©
2015
CC
-BY-
3.0
and
byth
ere
spec
tive
auth
ors
WG6 ERLs
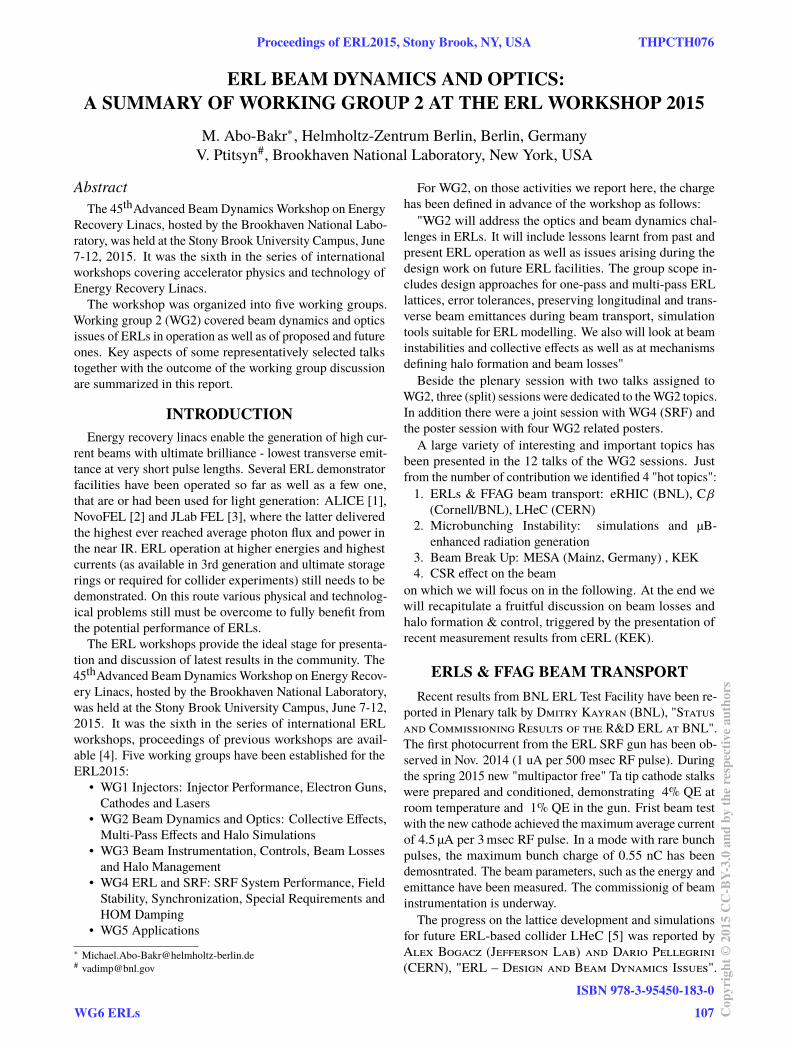
ERL BEAM DYNAMICS AND OPTICS:A SUMMARY OF WORKING GROUP 2 AT THE ERL WORKSHOP 2015
M. Abo-Bakr∗, Helmholtz-Zentrum Berlin, Berlin, GermanyV. Ptitsyn#, Brookhaven National Laboratory, New York, USA
AbstractThe 45thAdvanced Beam Dynamics Workshop on Energy
Recovery Linacs, hosted by the Brookhaven National Labo-ratory, was held at the Stony Brook University Campus, June7-12, 2015. It was the sixth in the series of internationalworkshops covering accelerator physics and technology ofEnergy Recovery Linacs.The workshop was organized into five working groups.
Working group 2 (WG2) covered beam dynamics and opticsissues of ERLs in operation as well as of proposed and futureones. Key aspects of some representatively selected talkstogether with the outcome of the working group discussionare summarized in this report.
INTRODUCTIONEnergy recovery linacs enable the generation of high cur-
rent beams with ultimate brilliance - lowest transverse emit-tance at very short pulse lengths. Several ERL demonstratorfacilities have been operated so far as well as a few one,that are or had been used for light generation: ALICE [1],NovoFEL [2] and JLab FEL [3], where the latter deliveredthe highest ever reached average photon flux and power inthe near IR. ERL operation at higher energies and highestcurrents (as available in 3rd generation and ultimate storagerings or required for collider experiments) still needs to bedemonstrated. On this route various physical and technolog-ical problems still must be overcome to fully benefit fromthe potential performance of ERLs.
The ERL workshops provide the ideal stage for presenta-tion and discussion of latest results in the community. The45thAdvanced Beam Dynamics Workshop on Energy Recov-ery Linacs, hosted by the Brookhaven National Laboratory,was held at the Stony Brook University Campus, June 7-12,2015. It was the sixth in the series of international ERLworkshops, proceedings of previous workshops are avail-able [4]. Five working groups have been established for theERL2015:
• WG1 Injectors: Injector Performance, Electron Guns,Cathodes and Lasers
• WG2 Beam Dynamics and Optics: Collective Effects,Multi-Pass Effects and Halo Simulations
• WG3 Beam Instrumentation, Controls, Beam Lossesand Halo Management
• WG4 ERL and SRF: SRF System Performance, FieldStability, Synchronization, Special Requirements andHOM Damping
• WG5 Applications∗ [email protected]# [email protected]
For WG2, on those activities we report here, the chargehas been defined in advance of the workshop as follows:"WG2 will address the optics and beam dynamics chal-
lenges in ERLs. It will include lessons learnt from past andpresent ERL operation as well as issues arising during thedesign work on future ERL facilities. The group scope in-cludes design approaches for one-pass and multi-pass ERLlattices, error tolerances, preserving longitudinal and trans-verse beam emittances during beam transport, simulationtools suitable for ERL modelling. We also will look at beaminstabilities and collective effects as well as at mechanismsdefining halo formation and beam losses"Beside the plenary session with two talks assigned to
WG2, three (split) sessions were dedicated to theWG2 topics.In addition there were a joint session with WG4 (SRF) andthe poster session with four WG2 related posters.A large variety of interesting and important topics has
been presented in the 12 talks of the WG2 sessions. Justfrom the number of contribution we identified 4 "hot topics":1. ERLs & FFAG beam transport: eRHIC (BNL), Cβ
(Cornell/BNL), LHeC (CERN)2. Microbunching Instability: simulations and µB-
enhanced radiation generation3. Beam Break Up: MESA (Mainz, Germany) , KEK4. CSR effect on the beam
on which we will focus on in the following. At the end wewill recapitulate a fruitful discussion on beam losses andhalo formation & control, triggered by the presentation ofrecent measurement results from cERL (KEK).
ERLS & FFAG BEAM TRANSPORTRecent results from BNL ERL Test Facility have been re-
ported in Plenary talk by Dmitry Kayran (BNL), "Statusand Commissioning Results of the R&D ERL at BNL".The first photocurrent from the ERL SRF gun has been ob-served in Nov. 2014 (1 uA per 500 msec RF pulse). Duringthe spring 2015 new "multipactor free" Ta tip cathode stalkswere prepared and conditioned, demonstrating 4% QE atroom temperature and 1% QE in the gun. Frist beam testwith the new cathode achieved the maximum average currentof 4.5 µA per 3msec RF pulse. In a mode with rare bunchpulses, the maximum bunch charge of 0.55 nC has beendemosntrated. The beam parameters, such as the energy andemittance have been measured. The commissionig of beaminstrumentation is underway.
The progress on the lattice development and simulationsfor future ERL-based collider LHeC [5] was reported byAlex Bogacz (Jefferson Lab) and Dario Pellegrini(CERN), "ERL – Design and Beam Dynamics Issues".
Proceedings of ERL2015, Stony Brook, NY, USA THPCTH076
WG6 ERLs
ISBN 978-3-95450-183-0
107 Cop
yrig
ht©
2015
CC
-BY-
3.0
and
byth
ere
spec
tive
auth
ors
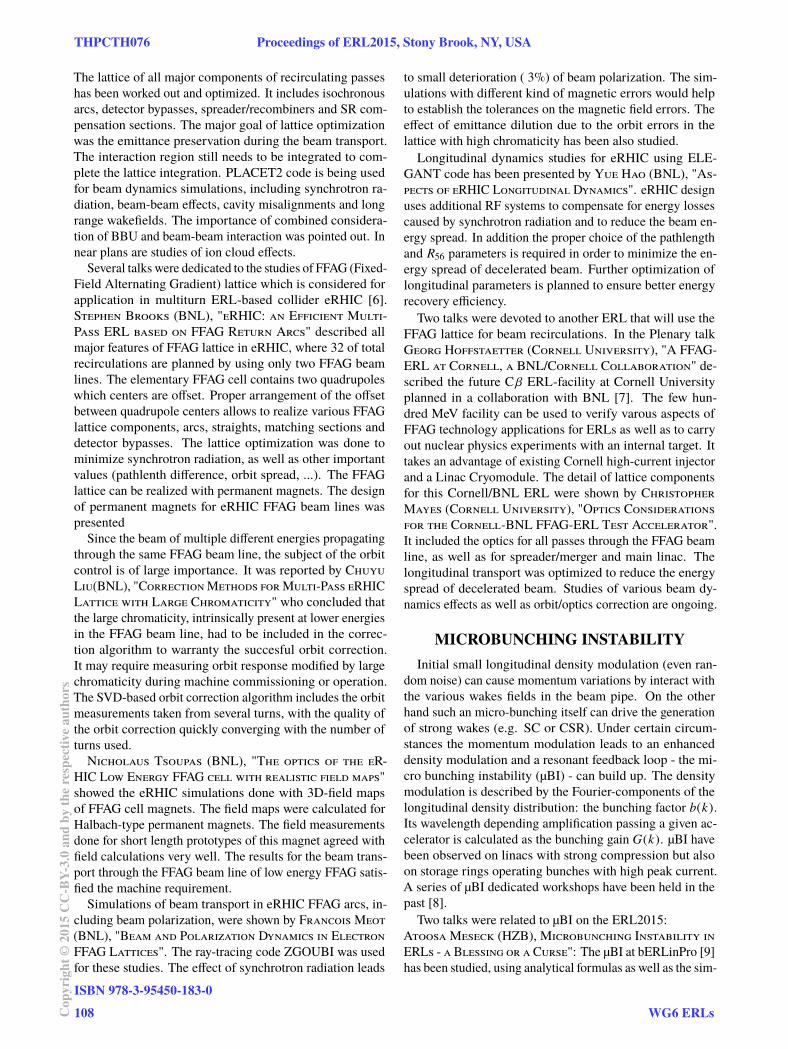
The lattice of all major components of recirculating passeshas been worked out and optimized. It includes isochronousarcs, detector bypasses, spreader/recombiners and SR com-pensation sections. The major goal of lattice optimizationwas the emittance preservation during the beam transport.The interaction region still needs to be integrated to com-plete the lattice integration. PLACET2 code is being usedfor beam dynamics simulations, including synchrotron ra-diation, beam-beam effects, cavity misalignments and longrange wakefields. The importance of combined considera-tion of BBU and beam-beam interaction was pointed out. Innear plans are studies of ion cloud effects.
Several talks were dedicated to the studies of FFAG (Fixed-Field Alternating Gradient) lattice which is considered forapplication in multiturn ERL-based collider eRHIC [6].Stephen Brooks (BNL), "eRHIC: an Efficient Multi-Pass ERL based on FFAG Return Arcs" described allmajor features of FFAG lattice in eRHIC, where 32 of totalrecirculations are planned by using only two FFAG beamlines. The elementary FFAG cell contains two quadrupoleswhich centers are offset. Proper arrangement of the offsetbetween quadrupole centers allows to realize various FFAGlattice components, arcs, straights, matching sections anddetector bypasses. The lattice optimization was done tominimize synchrotron radiation, as well as other importantvalues (pathlenth difference, orbit spread, ...). The FFAGlattice can be realized with permanent magnets. The designof permanent magnets for eRHIC FFAG beam lines waspresented
Since the beam of multiple different energies propagatingthrough the same FFAG beam line, the subject of the orbitcontrol is of large importance. It was reported by ChuyuLiu(BNL), "CorrectionMethods forMulti-Pass eRHICLattice with Large Chromaticity" who concluded thatthe large chromaticity, intrinsically present at lower energiesin the FFAG beam line, had to be included in the correc-tion algorithm to warranty the succesful orbit correction.It may require measuring orbit response modified by largechromaticity during machine commissioning or operation.The SVD-based orbit correction algorithm includes the orbitmeasurements taken from several turns, with the quality ofthe orbit correction quickly converging with the number ofturns used.Nicholaus Tsoupas (BNL), "The optics of the eR-
HIC Low Energy FFAG cell with realistic field maps"showed the eRHIC simulations done with 3D-field mapsof FFAG cell magnets. The field maps were calculated forHalbach-type permanent magnets. The field measurementsdone for short length prototypes of this magnet agreed withfield calculations very well. The results for the beam trans-port through the FFAG beam line of low energy FFAG satis-fied the machine requirement.Simulations of beam transport in eRHIC FFAG arcs, in-
cluding beam polarization, were shown by Francois Meot(BNL), "Beam and Polarization Dynamics in ElectronFFAG Lattices". The ray-tracing code ZGOUBI was usedfor these studies. The effect of synchrotron radiation leads
to small deterioration ( 3%) of beam polarization. The sim-ulations with different kind of magnetic errors would helpto establish the tolerances on the magnetic field errors. Theeffect of emittance dilution due to the orbit errors in thelattice with high chromaticity has been also studied.Longitudinal dynamics studies for eRHIC using ELE-
GANT code has been presented by Yue Hao (BNL), "As-pects of eRHIC Longitudinal Dynamics". eRHIC designuses additional RF systems to compensate for energy lossescaused by synchrotron radiation and to reduce the beam en-ergy spread. In addition the proper choice of the pathlengthand R56 parameters is required in order to minimize the en-ergy spread of decelerated beam. Further optimization oflongitudinal parameters is planned to ensure better energyrecovery efficiency.Two talks were devoted to another ERL that will use the
FFAG lattice for beam recirculations. In the Plenary talkGeorg Hoffstaetter (Cornell University), "A FFAG-ERL at Cornell, a BNL/Cornell Collaboration" de-scribed the future Cβ ERL-facility at Cornell Universityplanned in a collaboration with BNL [7]. The few hun-dred MeV facility can be used to verify varous aspects ofFFAG technology applications for ERLs as well as to carryout nuclear physics experiments with an internal target. Ittakes an advantage of existing Cornell high-current injectorand a Linac Cryomodule. The detail of lattice componentsfor this Cornell/BNL ERL were shown by ChristopherMayes (Cornell University), "Optics Considerationsfor the Cornell-BNL FFAG-ERL Test Accelerator".It included the optics for all passes through the FFAG beamline, as well as for spreader/merger and main linac. Thelongitudinal transport was optimized to reduce the energyspread of decelerated beam. Studies of various beam dy-namics effects as well as orbit/optics correction are ongoing.
MICROBUNCHING INSTABILITYInitial small longitudinal density modulation (even ran-
dom noise) can cause momentum variations by interact withthe various wakes fields in the beam pipe. On the otherhand such an micro-bunching itself can drive the generationof strong wakes (e.g. SC or CSR). Under certain circum-stances the momentum modulation leads to an enhanceddensity modulation and a resonant feedback loop - the mi-cro bunching instability (µBI) - can build up. The densitymodulation is described by the Fourier-components of thelongitudinal density distribution: the bunching factor b(k).Its wavelength depending amplification passing a given ac-celerator is calculated as the bunching gain G(k). µBI havebeen observed on linacs with strong compression but alsoon storage rings operating bunches with high peak current.A series of µBI dedicated workshops have been held in thepast [8].
Two talks were related to µBI on the ERL2015:Atoosa Meseck (HZB), Microbunching Instability inERLs - a Blessing or a Curse": The µBI at bERLinPro [9]has been studied, using analytical formulas as well as the sim-
THPCTH076 Proceedings of ERL2015, Stony Brook, NY, USA
ISBN 978-3-95450-183-0
108Cop
yrig
ht©
2015
CC
-BY-
3.0
and
byth
ere
spec
tive
auth
ors
WG6 ERLs
ulation code ASTRA. Amplification of initial shot noise dueto LSC has been simulated, showing the most pronouncedimpact in the wavelength range from 1 µm to 1mm, as ex-pected from the applied impedance spectrum for analyticalcalculations. However, the longitudinal machine dispersion(R56), leads to damping (instead of amplification) of the shotnoise for almost the entire wavelength range. As result ofthe simulations no significant gain and thus µBI is expectedfor bERLinPro’s standard mode of operation. Additionalanalytical 1D estimations including CSR impedance give noindication for µBI too.As an example a test beam line including a Compact
FODO Channel (CFC) has been optimized to drive the µBI:significant gains can be reached, potentially allowing thegeneration of at least partly coherent radiation in the EUV.Next studies will consider µBI in bERLinPro’s short pulsemode and further investigations on µBI supported radiationgeneration.Cheng-Ying Tsai (Virginia Polytechnic Institute
and State University), "Linear Microbunching GainEstimation Including CSR And LSC Impedances in Re-circulation Machines": to investigate µBI on the CCR(Circular Cooler Ring) of JLab’s proposed Medium EnergyElectron Ion Collider MEIC [10], a new program, based onan extended Vlasov solver, has been written. Main programfeatures are the implementation of horizontal & verticalbending magnets (need for spreaders and recombiners inERLs), non ultra-relativistic, transient and steady state CSRas well as 1D LSC. The semi-analytical program uses elegantgenerated input and calculates gain curves for a given lattice.Calculation times for the whole gain curve correspond tothose of a single elegant run. Application to a high energyarc for code testing showed very good agreement to elegant,both for a lattice developing a strong µBI as well as for onetuned to minimize the overall gain. Gain curves for MEICCCR have been presented, indicating high gains with peakvalues in the order of 108 at 350 µm wavelength, where LSCcaused even higher gains compared to CSR. Implementationof further impedance models, energy changes in the beamline and benchmarking with experiments are planned.
BEAM BREAK UP
A bunch passing a cavity off-axis excites higher orderdipole modes (HOMs), where the amount of transfered en-ergy depends on the off-axis amplitude. At the same timean already existing cavity HOM field kicks the bunch, thuschanging its downstream trajectory. If the bunch’s totalenergy transfer into the cavity HOM from all turns is notdamped until the next bunch passes, a resonant loop can beformed. Especially in super conducting cavities with highquality factors, HOM amplitudes can get high enough tocause beam loss. The so called Beam Break Up (BBU) oc-curs in various forms - transverse and longitudinal, singleand multi pass - and can severely limit the maximum ma-chine current. The instability has been observed on many
machines since the 1960ies and needs to be carefully con-sidered in the design of high current accelerators.
In WG2 two BBU dedicated talks were given:Thorsten Kuerzeder (TU Darmstadt), "Investigationson Transverse Beam Break Up Using a RecirculatedElectron Beam": observation of current limitations at theS-DALINAC facility [11]were introduces and related to thetransverse BBU instability. While planning for a maximumof 20 µA no currents higher than 8 µA have been reached sofar. A BBU instability, caused by the eight 3 GHz cavities,is supposed. In the design of these 1 m long, 20 cell cavi-ties neither minimized HOMs nor HOM absorber had beenconsidered. Several proposes to increase the BBU thresh-old are considered: beside the optimization of transversetunes, 3 skew quadrupoles have been inserted into the new,second recirculation line, enabling a complete transversephase space exchange. First test will be start in July 2015.Another approach is a massive increase of chromaticity: forlarge values with |ξ ∆E/E | 1 a significantly increasedBBU threshold current is expected. With ∆E/E 10−3 thenatural chromaticity is one order of magnitude too low. 12sextupole magnets with an integrated sextupole strength of10 T/m have been fabricated and will be placed at highestdispersion positions inside the arcs. Detailed BBU studiesare planned for 2015/16.
Si Chen (KEK), "HOM-BBU Simulation for KEK ERLLight Source": The ERL driven photon factory [12], pro-posed at KEK, is planned to operate with up to 100 mAbeam current. Results of latest BBU simulations, using a new3.4 GeV lattice design together with the newHOMoptimized"Model II" cavities, have been presented and compared to for-mer calculation with the 3.0 GeV lattice and TESLA like res-onators. Recirculation phase scans yields threshold currentsbetween 220 and 300mA, where BBU simulations for singlecavities indicate lower thresholds when placed in low energysections. Based on an FFT analysis of the simulated trans-verse beam motion the dominant mode at f = 4.011 GHzcould been identified and excellently agrees with the inputHOM parameter set. As expected, HOM frequency random-ization studies for the 224 cavities yield higher thresholds:the average value for 1000 sets of Gaussian distributed HOMfrequency shifts is 640 mA (σ f = 1 MHz). Variation of thefrequency shift showed an almost linear threshold increasefrom the shift-free case (σ f = 0 MHz, 220 mA) to 940 mAat σ f = 2 MHz. Further lattice and cavity optimizationwork is planned for the next time.
CSR EFFECT ON THE BEAMTwo talks were devoted to studies related with Coherent
Synchrotron Radiation. Christopher Hall (ColoradoState University), "Study of CSR Impact on ElectronBeam in the JLab ERL", presented results of measurementswhich used controllable bunch compression in two locationsof the JLab ERL. The resulting beam energy distribution,impacted by CSR-induced energy loss, was measured in thedownstream arc. The fragmentation of the energy spectrum,
Proceedings of ERL2015, Stony Brook, NY, USA THPCTH076
WG6 ERLs
ISBN 978-3-95450-183-0
109 Cop
yrig
ht©
2015
CC
-BY-
3.0
and
byth
ere
spec
tive
auth
ors

enhanced by longitudinal space charge, was observed. Allmeasured results show good qualitative agreement to 1-DCSR simulations. It was also concluded that CSR in driftsafter a bunch compressor can have a large impact on theenergy distribution.Simone Di Mitri (Elettra - Sincrotrone Trieste),
"Transverse Emittance Preserving Arc Compressor:Sensitivity to Beam Optics, Charge and Energy" ex-tended the theory of CSR kick-optics balance to the caseof varying bunch length. The optimal optics is based on aprinciple of canceling successive CSR-induced kicks to min-imize CSR-induced emittance growth. The theoretical andsimulation studies were presented for the arc compressor,based on DBA cells that has properly balanced optics.
BEAM LOSSES & HALOMuch of the discussion timewas devoted to the topic of the
beam halo and related slow beam loss. Pavel Evtushenko(Jefferson Lab) listed the major halo sources in JLab FELinjector. They include a limited extinction ratio of drivelaser, stray laser light and its reflections hitting the cathodeand elsewhere, and space charge dominated beam transport.There is no intentional collimation implemented in JLabERL, but minor collimation of bunch tails is done naturallyby the vacuum chamber.
cERL, which is under commissioning in KEK (Japan), car-ried out initial collimation studies, mentioned in the Plenarytalk by Shogo Sakanaka (KEK), "Successful Result ofthe Commissioning on cERL in KEK". The collimatedportion of beam was up to 0.1% of total beam current, butthe efficiency of the collimation with respect to the radiationlevels seen in recirculating arc was not very clear. It waspointed out that the collimation system has not yet been op-timized, since it is not necessary at the present beam currentlevels (<100 µA). Thus, much of interest will be the furtherexperience with the collimation system at cERL, as the beamcurrent increases. For simulation of collimation the GPTcode was used with 105 − 106 particles. It was noted that2012 an "Unwanted Beam" workshop took place in Berlin,devoted to the topic of the beam halo, dark current and beamloss control.
REFERENCES[1] N. Thompson et al., "First lasing of the ALICE infra-red
Free-Electron Laser", NIM A 680, 2012.[2] O.A.Shevchenko et al., "Commissioning Status and further
Development of the Novosibirsk Multiturn ERL", ERL2013,Novosibirsk, Russia.
[3] S. Benson et al., "The 4th Generation Light Source atJefferson Lab”, NIM A 582, 2007.
[4] Previous ERL Workshops on JaCoW (www.jacow.org):ERL2007, Daresbury, UKhttp://accelconf.web.cern.ch/AccelConf/erl07
ERL2009, Cornell, USAhttp://accelconf.web.cern.ch/AccelConf/ERL2009
ERL2011, Tsukuba, Japanhttp://accelconf.web.cern.ch/AccelConf/ERL2011
ERL2013, Novosibirsk, Russiahttp://accelconf.web.cern.ch/AccelConf/ERL2013
[5] LHeC Study Group, "A Large Hadron Electron Colliderat CERN",Journal of Physics G, V.39, Number 7, Article075001, 2012.
[6] E. Aschenauer, et al., "eRHIC Design Study",arXiv:1409.1633, 2014.
[7] I. Bazarov et al., "The Cornell-BNL FFAG-ERL Test Accel-erator: White Paper", arXiv:1504.00588, 2015.
[8] Workshop Series on Micro-Bunch Instabilities:1st µBI workshop, Trieste, 2007
XYZ/FERMI/index.php?n=Main.MicrobunchingWS2nd µBI workshop, Berkeley, 2008XYZ/FERMI/index.php?n=Main.MicrobunchingWS-US
3rd µBI workshop, Frascati, 2010http://www.lnf.infn.it/conference/uBI10/
4th µBI workshop, Washington (UMER), 2012http://www.umer.umd.edu/events_folder/uBi12/
5th µBI workshop, Pohang, 2013http://pal.postech.ac.kr/ubi2013/
6th µBI workshop, Trieste, 2014XYZ/Conferences/2014/MBIW6/
XYZ = https://www.elettra.trieste.it
[9] M. Abo-Bakr et al., "Progress Report of the Berlin EnergyRecovery Project BERLinPro", IPAC2015, Richmond, USA.
[10] Y. Zhang et al., "Status of MEIC Design Studies”, IPAC2013,Shanghai, China.
[11] Y Poltoratska et al., "Status and recent developments at thepolarized-electron injector of the superconducting Darmstadtelectron linear accelerator S-DALINAC", J. Phys.: Conf. Ser.298, 2011.
[12] KEK ERL CDR:pfwww.kek.jp/ERLoffice/detabase/ERL_CDR_full_text.pdf
THPCTH076 Proceedings of ERL2015, Stony Brook, NY, USA
ISBN 978-3-95450-183-0
110Cop
yrig
ht©
2015
CC
-BY-
3.0
and
byth
ere
spec
tive
auth
ors
WG6 ERLs
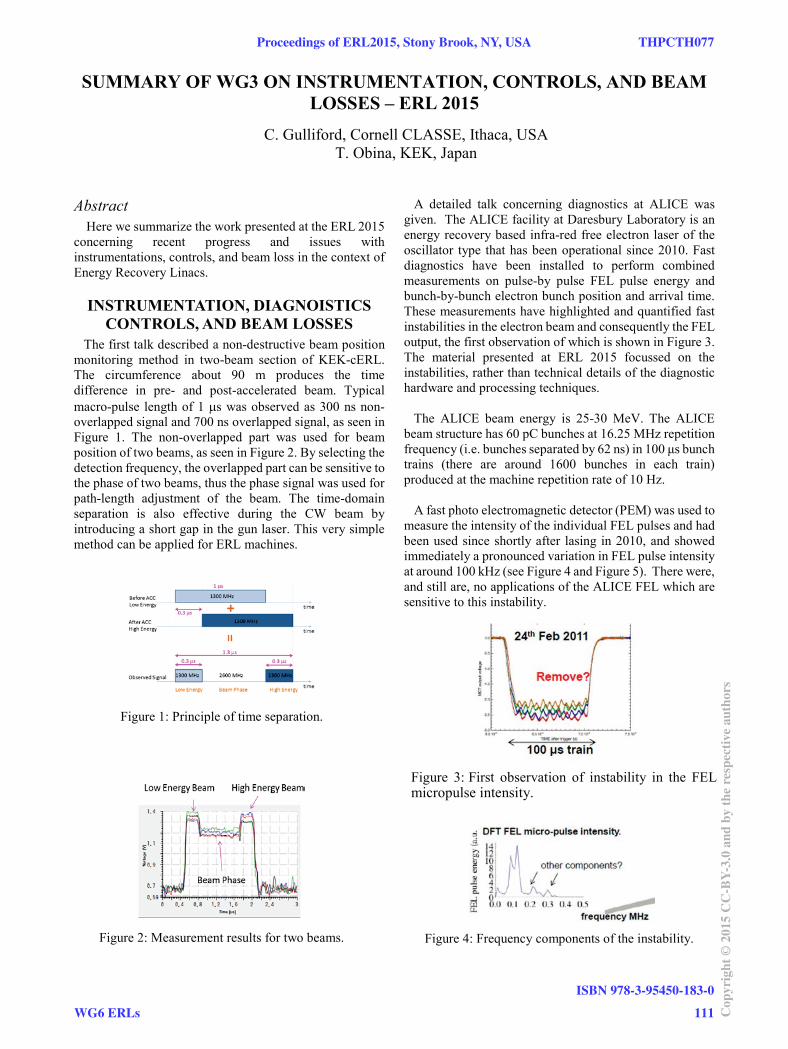
SUMMARY OF WG3 ON INSTRUMENTATION, CONTROLS, AND BEAM LOSSES – ERL 2015
C. Gulliford, Cornell CLASSE, Ithaca, USA T. Obina, KEK, Japan
Abstract Here we summarize the work presented at the ERL 2015
concerning recent progress and issues with instrumentations, controls, and beam loss in the context of Energy Recovery Linacs.
INSTRUMENTATION, DIAGNOISTICS CONTROLS, AND BEAM LOSSES
The first talk described a non-destructive beam position monitoring method in two-beam section of KEK-cERL. The circumference about 90 m produces the time difference in pre- and post-accelerated beam. Typical macro-pulse length of 1 s was observed as 300 ns non-overlapped signal and 700 ns overlapped signal, as seen in Figure 1. The non-overlapped part was used for beam position of two beams, as seen in Figure 2. By selecting the detection frequency, the overlapped part can be sensitive to the phase of two beams, thus the phase signal was used for path-length adjustment of the beam. The time-domain separation is also effective during the CW beam by introducing a short gap in the gun laser. This very simple method can be applied for ERL machines.
Figure 1: Principle of time separation.
Figure 2: Measurement results for two beams.
A detailed talk concerning diagnostics at ALICE was given. The ALICE facility at Daresbury Laboratory is an energy recovery based infra-red free electron laser of the oscillator type that has been operational since 2010. Fast diagnostics have been installed to perform combined measurements on pulse-by pulse FEL pulse energy and bunch-by-bunch electron bunch position and arrival time. These measurements have highlighted and quantified fast instabilities in the electron beam and consequently the FEL output, the first observation of which is shown in Figure 3. The material presented at ERL 2015 focussed on the instabilities, rather than technical details of the diagnostic hardware and processing techniques. The ALICE beam energy is 25-30 MeV. The ALICE beam structure has 60 pC bunches at 16.25 MHz repetition
trains (there are around 1600 bunches in each train) produced at the machine repetition rate of 10 Hz. A fast photo electromagnetic detector (PEM) was used to measure the intensity of the individual FEL pulses and had been used since shortly after lasing in 2010, and showed immediately a pronounced variation in FEL pulse intensity at around 100 kHz (see Figure 4 and Figure 5). There were, and still are, no applications of the ALICE FEL which are sensitive to this instability.
Figure 3: First observation of instability in the FEL micropulse intensity.
Figure 4: Frequency components of the instability.
Proceedings of ERL2015, Stony Brook, NY, USA THPCTH077
WG6 ERLs
ISBN 978-3-95450-183-0
111 Cop
yrig
ht©
2015
CC
-BY-
3.0
and
byth
ere
spec
tive
auth
ors

Figure 5: FEL micropulse intensity showing instability.
To investigate the source of this instability, fast BPM electronics (which had been originally developed for use on the EMMA non-scaling FFAG at Daresbury) were implemented at various locations in ALICE. They showed a pronounced instability at roughly 100 kHz in the bunch position, most clearly in the post-booster and post-linac lattice (see Figure 6). Pre-booster, the evidence for this instability was less clear. In addition, a ~300 kHz instability in the bunch charge was observed clearly at all locations; this sometimes appears in the FEL intensity at a much smaller amplitude than the 100 kHz signal. To further investigate the root cause of the instabilities, the photoinjector laser was examined. A fast photodiode reveals a 300 kHz instability in the laser intensity, while the evidence for a ~100 kHz position instability of the laser beam is less convincing. It had in fact already been established in measurements in 2007 that the SSB spectra of the PI laser phase with respect to the RF reference showed an instability at 300 kHz.
Figure 6: Position instability on fast BPMs.
In addition to the measurements described above, some measurements were performed synchronising fast PEM, BPM, and bunch time-of-arrival (TOA) measurements (using optical sampling of BPM signals) for individual machine shots. The motivation for this was as test bed for optical TOA diagnostics and as a potential source of extra information on the instabilities. The 100 kHz instability was also present in the TOA data and highly correlated with the other observables. After presenting this material, several suggestions were made as to the root cause of the 100 kHZ instability. These included the DC gun power supply stability, stability of the
PI laser power supplies, and instabilities resulting from feedback loop from the low level RF. It was noted that the bunch position stability seemed to be more pronounced as the beam moved further downstream through the machine from the gun. These suggestions will be investigated further with the relevant technical groups at Daresbury. Similarly, diagnostic work being done on the MESA project was discussed. The diagnostic test-beam-line for MESA shown in Figure 7 is built and ready for use. Investigations of the two transverse phase-spaces with quadrupole scan technique and the determination of the beam profile with a screen or with wires are possible. The beam-line gives the possibility of a cross check between quadrupole scan and slit mask measurements. The temporal distribution can be inspected with a deflecting cavity that transforms the longitudinal distribution into an transverse one and deflects the beam onto a circle which can be observed with a Ce:YAG screen and a CCD-camera, as shown in Figure 8. All this can be done with three different laser wavelengths (405, 520, 780nm) and for different laser spot sizes.
Figure 7: MESA diagnostic components.
Figure 8: MESA Deflecting Cavity and Collimator Set-up
The first preliminary results of the emittance look promising to match the requirements of MESA stage 1. Further investigations of higher bunch charges etc. have to be done.
.
THPCTH077 Proceedings of ERL2015, Stony Brook, NY, USA
ISBN 978-3-95450-183-0
112Cop
yrig
ht©
2015
CC
-BY-
3.0
and
byth
ere
spec
tive
auth
ors
WG6 ERLs
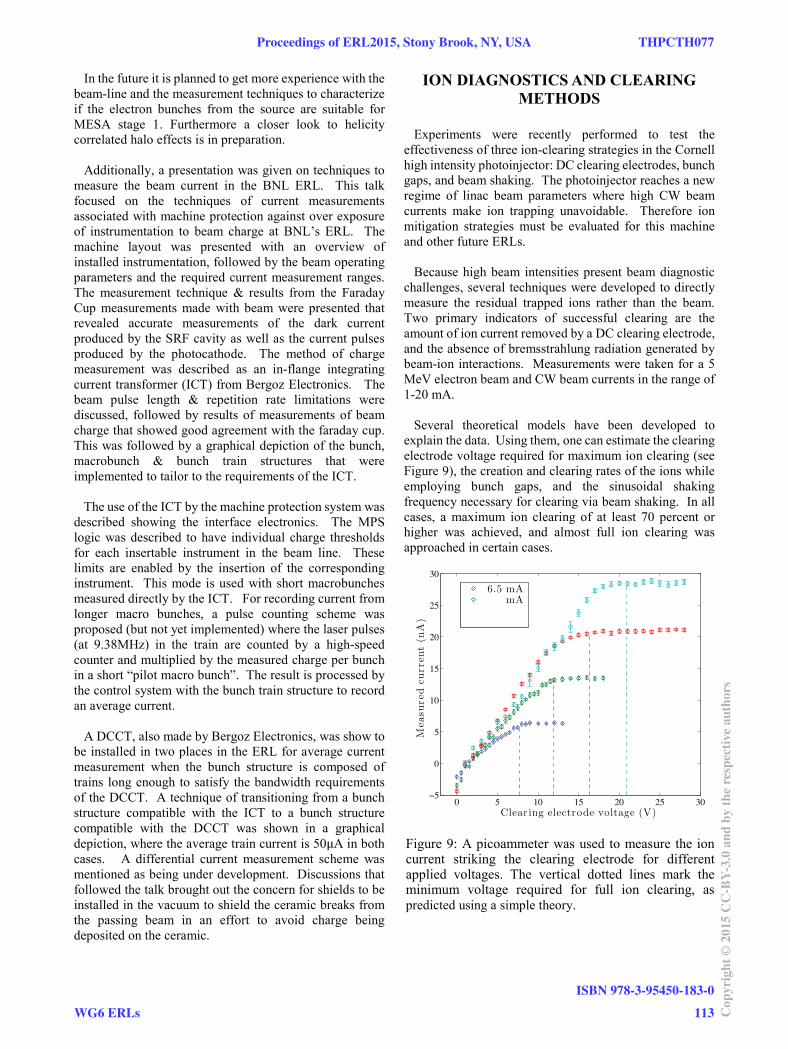
In the future it is planned to get more experience with the beam-line and the measurement techniques to characterize if the electron bunches from the source are suitable for MESA stage 1. Furthermore a closer look to helicity correlated halo effects is in preparation. Additionally, a presentation was given on techniques to measure the beam current in the BNL ERL. This talk focused on the techniques of current measurements associated with machine protection against over exposure of instrumentation to beam charge at BNL’s ERL. The machine layout was presented with an overview of installed instrumentation, followed by the beam operating parameters and the required current measurement ranges. The measurement technique & results from the Faraday Cup measurements made with beam were presented that revealed accurate measurements of the dark current produced by the SRF cavity as well as the current pulses produced by the photocathode. The method of charge measurement was described as an in-flange integrating current transformer (ICT) from Bergoz Electronics. The beam pulse length & repetition rate limitations were discussed, followed by results of measurements of beam charge that showed good agreement with the faraday cup. This was followed by a graphical depiction of the bunch, macrobunch & bunch train structures that were implemented to tailor to the requirements of the ICT. The use of the ICT by the machine protection system was described showing the interface electronics. The MPS logic was described to have individual charge thresholds for each insertable instrument in the beam line. These limits are enabled by the insertion of the corresponding instrument. This mode is used with short macrobunches measured directly by the ICT. For recording current from longer macro bunches, a pulse counting scheme was proposed (but not yet implemented) where the laser pulses (at 9.38MHz) in the train are counted by a high-speed counter and multiplied by the measured charge per bunch in a short “pilot macro bunch”. The result is processed by the control system with the bunch train structure to record an average current. A DCCT, also made by Bergoz Electronics, was show to be installed in two places in the ERL for average current measurement when the bunch structure is composed of trains long enough to satisfy the bandwidth requirements of the DCCT. A technique of transitioning from a bunch structure compatible with the ICT to a bunch structure compatible with the DCCT was shown in a graphical depiction, where the average train current is 50 A in both cases. A differential current measurement scheme was mentioned as being under development. Discussions that followed the talk brought out the concern for shields to be installed in the vacuum to shield the ceramic breaks from the passing beam in an effort to avoid charge being deposited on the ceramic.
ION DIAGNOSTICS AND CLEARING METHODS
Experiments were recently performed to test the effectiveness of three ion-clearing strategies in the Cornell high intensity photoinjector: DC clearing electrodes, bunch gaps, and beam shaking. The photoinjector reaches a new regime of linac beam parameters where high CW beam currents make ion trapping unavoidable. Therefore ion mitigation strategies must be evaluated for this machine and other future ERLs. Because high beam intensities present beam diagnostic challenges, several techniques were developed to directly measure the residual trapped ions rather than the beam. Two primary indicators of successful clearing are the amount of ion current removed by a DC clearing electrode, and the absence of bremsstrahlung radiation generated by beam-ion interactions. Measurements were taken for a 5 MeV electron beam and CW beam currents in the range of 1-20 mA. Several theoretical models have been developed to explain the data. Using them, one can estimate the clearing electrode voltage required for maximum ion clearing (see Figure 9), the creation and clearing rates of the ions while employing bunch gaps, and the sinusoidal shaking frequency necessary for clearing via beam shaking. In all cases, a maximum ion clearing of at least 70 percent or higher was achieved, and almost full ion clearing was approached in certain cases.
Figure 9: A picoammeter was used to measure the ion current striking the clearing electrode for different applied voltages. The vertical dotted lines mark the minimum voltage required for full ion clearing, as predicted using a simple theory.
Proceedings of ERL2015, Stony Brook, NY, USA THPCTH077
WG6 ERLs
ISBN 978-3-95450-183-0
113 Cop
yrig
ht©
2015
CC
-BY-
3.0
and
byth
ere
spec
tive
auth
ors

Figure 10: Increasing the frequency and duration of bunch gaps reduces the trapped ion density as shown by the residual ion current hitting a clearing electrode.
Of particular note is the finding that the total amount of clearing while employing bunch gaps does not depend strictly on the bunch gap duration and frequency. Instead, it depends only on the total time the beam is turned off, as is seen in Figure 10. This flexibility may allow it to be deployed in ERLs – a prospect previously thought too difficult to consider due to problems with beam loading.
A new diagnostic capable of surviving high intensity electron beams was discussed. It consists of a thin rotating wire that passes through the beam, and a downstream radiation detector. Together, they allow for a high current beam profile. The design was optimized to reduce the footprint of the device, while still allowing it to reach the large velocities needed to prevent it from absorbing too much heat load from the beam. It was installed in the Cornell injector, and tested at moderately high beam currents up to 20 mA, though at the relatively low energy and correspondingly large beam width inherent in injectors. Depending on the gain in the PMT radiation monitor, it could also be used at a much lower average current, and at these currents it was compared to a measurement on a viewscreen. Above a certain speed, which supressed the error from wire vibration, the two measurements were found to agree well, as in Figure 11.
Figure 11: Comparison of the beam profile using thewire-scanner vs. viewscreen.
CONCLUSIONProgress continues to be made in the development of
diagnostics suitable for the high intensity beams produced in Energy Recovery Linear accelerators. Instabilities were investigated at ALICE using various diagnostics including fast BPMs. The diagnostic beamline for MESA was discussed. The applicable range and performance benefits of competing designs for measuring beam current were covered, including ICTs and DCCTs. Finally, a report on effective methods of ion clearing as well as a new diagnostic for transverse beam profiles was given.
ACKNOWLEDGMENTThe authors would like to thank the workshop organizers
and participants of the working group for the excellent presentations and discussions during and in-between the sessions.
THPCTH077 Proceedings of ERL2015, Stony Brook, NY, USA
ISBN 978-3-95450-183-0
114Cop
yrig
ht©
2015
CC
-BY-
3.0
and
byth
ere
spec
tive
auth
ors
WG6 ERLs
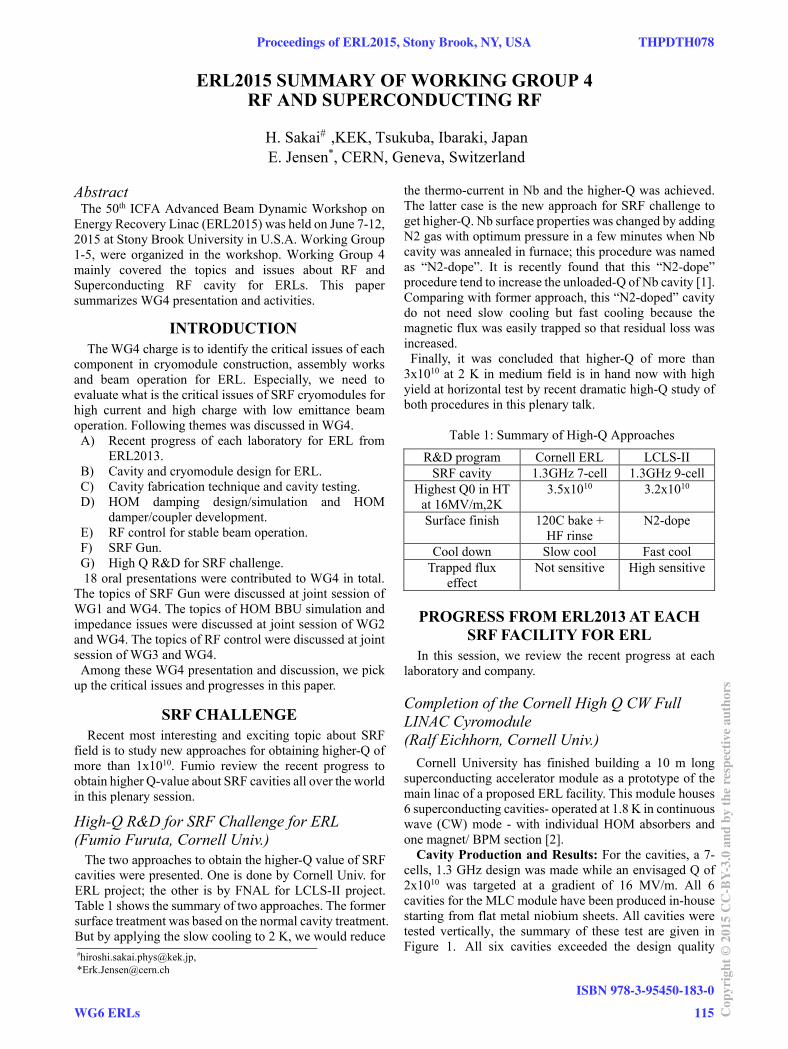
ERL2015 SUMMARY OF WORKING GROUP 4 RF AND SUPERCONDUCTING RF
H. Sakai# ,KEK, Tsukuba, Ibaraki, Japan E. Jensen*, CERN, Geneva, Switzerland
Abstract The 50th ICFA Advanced Beam Dynamic Workshop on Energy Recovery Linac (ERL2015) was held on June 7-12, 2015 at Stony Brook University in U.S.A. Working Group 1-5, were organized in the workshop. Working Group 4 mainly covered the topics and issues about RF and Superconducting RF cavity for ERLs. This paper summarizes WG4 presentation and activities.
INTRODUCTION The WG4 charge is to identify the critical issues of each
component in cryomodule construction, assembly works and beam operation for ERL. Especially, we need to evaluate what is the critical issues of SRF cryomodules for high current and high charge with low emittance beam operation. Following themes was discussed in WG4. A) Recent progress of each laboratory for ERL from
ERL2013.B) Cavity and cryomodule design for ERL.C) Cavity fabrication technique and cavity testing.D) HOM damping design/simulation and HOM
damper/coupler development.E) RF control for stable beam operation.F) SRF Gun.G) High Q R&D for SRF challenge.
18 oral presentations were contributed to WG4 in total. The topics of SRF Gun were discussed at joint session of WG1 and WG4. The topics of HOM BBU simulation and impedance issues were discussed at joint session of WG2 and WG4. The topics of RF control were discussed at joint session of WG3 and WG4. Among these WG4 presentation and discussion, we pick up the critical issues and progresses in this paper.
SRF CHALLENGE Recent most interesting and exciting topic about SRF
field is to study new approaches for obtaining higher-Q of more than 1x10¹⁰. Fumio review the recent progress to obtain higher Q-value about SRF cavities all over the world in this plenary session.
High-Q R&D for SRF Challenge for ERL
(Fumio Furuta, Cornell Univ.)
The two approaches to obtain the higher-Q value of SRF cavities were presented. One is done by Cornell Univ. for ERL project; the other is by FNAL for LCLS-II project. Table 1 shows the summary of two approaches. The former surface treatment was based on the normal cavity treatment. But by applying the slow cooling to 2 K, we would reduce
the thermo-current in Nb and the higher-Q was achieved. The latter case is the new approach for SRF challenge to get higher-Q. Nb surface properties was changed by adding N2 gas with optimum pressure in a few minutes when Nb cavity was annealed in furnace; this procedure was named as “N2-dope”. It is recently found that this “N2-dope” procedure tend to increase the unloaded-Q of Nb cavity [1]. Comparing with former approach, this “N2-doped” cavity do not need slow cooling but fast cooling because the magnetic flux was easily trapped so that residual loss was increased. Finally, it was concluded that higher-Q of more than 3x10¹⁰ at 2 K in medium field is in hand now with high yield at horizontal test by recent dramatic high-Q study of both procedures in this plenary talk.
Table 1: Summary of High-Q Approaches R&D program Cornell ERL LCLS-II
SRF cavity 1.3GHz 7-cell 1.3GHz 9-cellHighest Q0 in HT
at 16MV/m,2K 3.5x10¹⁰ 3.2x10¹⁰
Surface finish 120C bake + HF rinse
N2-dope
Cool down Slow cool Fast cool Trapped flux
effect Not sensitive High sensitive
PROGRESS FROM ERL2013 AT EACH SRF FACILITY FOR ERL
In this session, we review the recent progress at each laboratory and company.
Completion of the Cornell High Q CW Full
LINAC Cyromodule
(Ralf Eichhorn, Cornell Univ.)
Cornell University has finished building a 10 m long superconducting accelerator module as a prototype of the main linac of a proposed ERL facility. This module houses 6 superconducting cavities- operated at 1.8 K in continuous wave (CW) mode - with individual HOM absorbers and one magnet/ BPM section [2].
Cavity Production and Results: For the cavities, a 7-cells, 1.3 GHz design was made while an envisaged Q of 2x10¹⁰ was targeted at a gradient of 16 MV/m. All 6 cavities for the MLC module have been produced in-house starting from flat metal niobium sheets. All cavities were tested vertically, the summary of these test are given in Figure 1. All six cavities exceeded the design quality
#[email protected], *[email protected]
Proceedings of ERL2015, Stony Brook, NY, USA THPDTH078
WG6 ERLs
ISBN 978-3-95450-183-0
115 Cop
yrig
ht©
2015
CC
-BY-
3.0
and
byth
ere
spec
tive
auth
ors
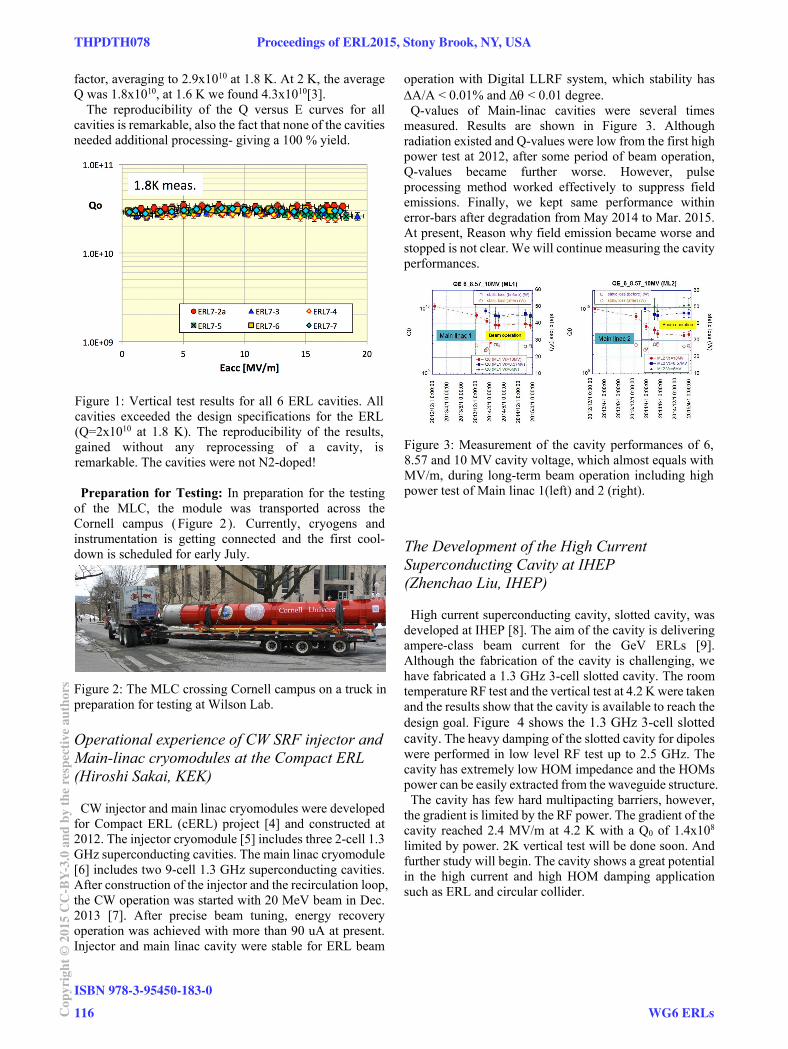
factor, averaging to 2.9x10¹⁰ at 1.8 K. At 2 K, the average Q was 1.8x10¹⁰, at 1.6 K we found 4.3x10¹⁰[3].
The reproducibility of the Q versus E curves for all cavities is remarkable, also the fact that none of the cavities needed additional processing- giving a 100 % yield.
Figure 1: Vertical test results for all 6 ERL cavities. All cavities exceeded the design specifications for the ERL (Q=2x10¹⁰ at 1.8 K). The reproducibility of the results, gained without any reprocessing of a cavity, is remarkable. The cavities were not N2-doped!
Preparation for Testing: In preparation for the testing of the MLC, the module was transported across the Cornell campus (Figure 2 ). Currently, cryogens and instrumentation is getting connected and the first cool-down is scheduled for early July.
Figure 2: The MLC crossing Cornell campus on a truck in preparation for testing at Wilson Lab.
Operational experience of CW SRF injector and
Main-linac cryomodules at the Compact ERL
(Hiroshi Sakai, KEK)
CW injector and main linac cryomodules were developed for Compact ERL (cERL) project [4] and constructed at 2012. The injector cryomodule [5] includes three 2-cell 1.3 GHz superconducting cavities. The main linac cryomodule [6] includes two 9-cell 1.3 GHz superconducting cavities. After construction of the injector and the recirculation loop, the CW operation was started with 20 MeV beam in Dec. 2013 [7]. After precise beam tuning, energy recovery operation was achieved with more than 90 uA at present. Injector and main linac cavity were stable for ERL beam
operation with Digital LLRF system, which stability has A/A < 0.01% and < 0.01 degree. Q-values of Main-linac cavities were several times
measured. Results are shown in Figure 3. Although radiation existed and Q-values were low from the first high power test at 2012, after some period of beam operation, Q-values became further worse. However, pulse processing method worked effectively to suppress field emissions. Finally, we kept same performance within error-bars after degradation from May 2014 to Mar. 2015. At present, Reason why field emission became worse and stopped is not clear. We will continue measuring the cavity performances.
Figure 3: Measurement of the cavity performances of 6, 8.57 and 10 MV cavity voltage, which almost equals with MV/m, during long-term beam operation including high power test of Main linac 1(left) and 2 (right).
The Development of the High Current
Superconducting Cavity at IHEP
(Zhenchao Liu, IHEP)
High current superconducting cavity, slotted cavity, was developed at IHEP [8]. The aim of the cavity is delivering ampere-class beam current for the GeV ERLs [9]. Although the fabrication of the cavity is challenging, we have fabricated a 1.3 GHz 3-cell slotted cavity. The room temperature RF test and the vertical test at 4.2 K were taken and the results show that the cavity is available to reach the design goal. Figure 4 shows the 1.3 GHz 3-cell slotted cavity. The heavy damping of the slotted cavity for dipoles were performed in low level RF test up to 2.5 GHz. The cavity has extremely low HOM impedance and the HOMs power can be easily extracted from the waveguide structure. The cavity has few hard multipacting barriers, however,
the gradient is limited by the RF power. The gradient of the cavity reached 2.4 MV/m at 4.2 K with a Q0 of 1.4x10⁸ limited by power. 2K vertical test will be done soon. And further study will begin. The cavity shows a great potential in the high current and high HOM damping application such as ERL and circular collider.
THPDTH078 Proceedings of ERL2015, Stony Brook, NY, USA
ISBN 978-3-95450-183-0
116Cop
yrig
ht©
2015
CC
-BY-
3.0
and
byth
ere
spec
tive
auth
ors
WG6 ERLs
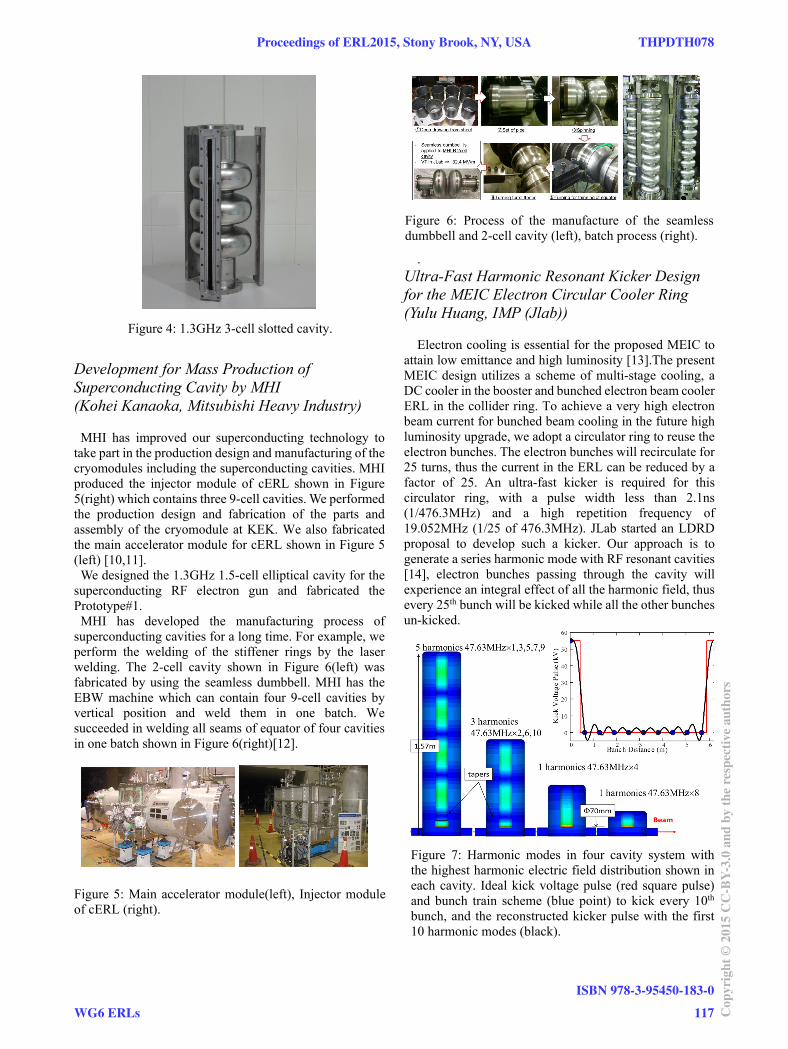
Figure 4: 1.3GHz 3-cell slotted cavity.
Development for Mass Production of
Superconducting Cavity by MHI
(Kohei Kanaoka, Mitsubishi Heavy Industry)
MHI has improved our superconducting technology to take part in the production design and manufacturing of the cryomodules including the superconducting cavities. MHI produced the injector module of cERL shown in Figure 5(right) which contains three 9-cell cavities. We performed the production design and fabrication of the parts and assembly of the cryomodule at KEK. We also fabricated the main accelerator module for cERL shown in Figure 5 (left) [10,11]. We designed the 1.3GHz 1.5-cell elliptical cavity for the
superconducting RF electron gun and fabricated the Prototype#1. MHI has developed the manufacturing process of
superconducting cavities for a long time. For example, we perform the welding of the stiffener rings by the laser welding. The 2-cell cavity shown in Figure 6(left) was fabricated by using the seamless dumbbell. MHI has the EBW machine which can contain four 9-cell cavities by vertical position and weld them in one batch. We succeeded in welding all seams of equator of four cavities in one batch shown in Figure 6(right)[12].
Figure 5: Main accelerator module(left), Injector module of cERL (right).
Figure 6: Process of the manufacture of the seamless dumbbell and 2-cell cavity (left), batch process (right).
. Ultra-Fast Harmonic Resonant Kicker Design
for the MEIC Electron Circular Cooler Ring
(Yulu Huang, IMP (Jlab))
Electron cooling is essential for the proposed MEIC to attain low emittance and high luminosity [13].The present MEIC design utilizes a scheme of multi-stage cooling, a DC cooler in the booster and bunched electron beam cooler ERL in the collider ring. To achieve a very high electron beam current for bunched beam cooling in the future high luminosity upgrade, we adopt a circulator ring to reuse the electron bunches. The electron bunches will recirculate for 25 turns, thus the current in the ERL can be reduced by a factor of 25. An ultra-fast kicker is required for this circulator ring, with a pulse width less than 2.1ns (1/476.3MHz) and a high repetition frequency of 19.052MHz (1/25 of 476.3MHz). JLab started an LDRD proposal to develop such a kicker. Our approach is to generate a series harmonic mode with RF resonant cavities [14], electron bunches passing through the cavity will experience an integral effect of all the harmonic field, thus every 25th bunch will be kicked while all the other bunches un-kicked.
Figure 7: Harmonic modes in four cavity system with the highest harmonic electric field distribution shown in each cavity. Ideal kick voltage pulse (red square pulse) and bunch train scheme (blue point) to kick every 10th bunch, and the reconstructed kicker pulse with the first 10 harmonic modes (black).
Proceedings of ERL2015, Stony Brook, NY, USA THPDTH078
WG6 ERLs
ISBN 978-3-95450-183-0
117 Cop
yrig
ht©
2015
CC
-BY-
3.0
and
byth
ere
spec
tive
auth
ors
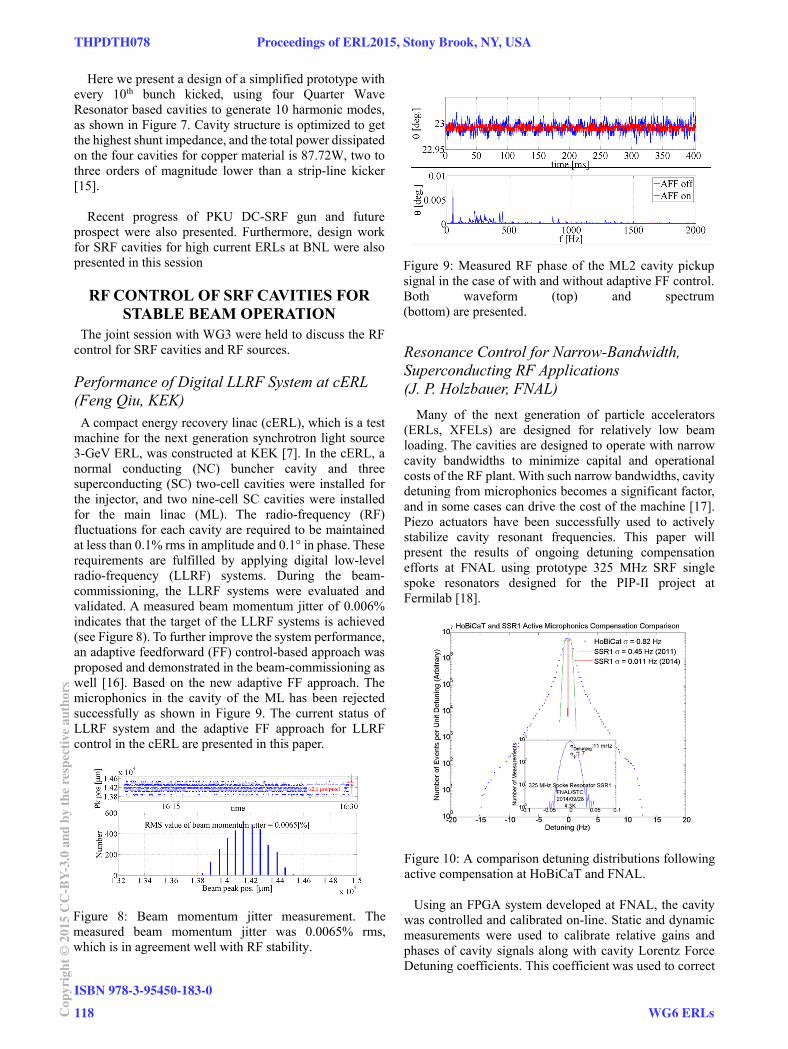
Here we present a design of a simplified prototype with every 10th bunch kicked, using four Quarter Wave Resonator based cavities to generate 10 harmonic modes, as shown in Figure 7. Cavity structure is optimized to get the highest shunt impedance, and the total power dissipated on the four cavities for copper material is 87.72W, two to three orders of magnitude lower than a strip-line kicker [15].
Recent progress of PKU DC-SRF gun and future prospect were also presented. Furthermore, design work for SRF cavities for high current ERLs at BNL were also presented in this session
RF CONTROL OF SRF CAVITIES FOR STABLE BEAM OPERATION
The joint session with WG3 were held to discuss the RF control for SRF cavities and RF sources.
Performance of Digital LLRF System at cERL
(Feng Qiu, KEK) A compact energy recovery linac (cERL), which is a test
machine for the next generation synchrotron light source 3-GeV ERL, was constructed at KEK [7]. In the cERL, a normal conducting (NC) buncher cavity and three superconducting (SC) two-cell cavities were installed for the injector, and two nine-cell SC cavities were installed for the main linac (ML). The radio-frequency (RF) fluctuations for each cavity are required to be maintained at less than 0.1% rms in amplitude and 0.1° in phase. These requirements are fulfilled by applying digital low-level radio-frequency (LLRF) systems. During the beam-commissioning, the LLRF systems were evaluated and validated. A measured beam momentum jitter of 0.006% indicates that the target of the LLRF systems is achieved (see Figure 8). To further improve the system performance, an adaptive feedforward (FF) control-based approach was proposed and demonstrated in the beam-commissioning as well [16]. Based on the new adaptive FF approach. The microphonics in the cavity of the ML has been rejected successfully as shown in Figure 9. The current status of LLRF system and the adaptive FF approach for LLRF control in the cERL are presented in this paper.
Figure 8: Beam momentum jitter measurement. The measured beam momentum jitter was 0.0065% rms, which is in agreement well with RF stability.
Figure 9: Measured RF phase of the ML2 cavity pickup signal in the case of with and without adaptive FF control. Both waveform (top) and spectrum (bottom) are presented.
Resonance Control for Narrow-Bandwidth,
Superconducting RF Applications
(J. P. Holzbauer, FNAL)
Many of the next generation of particle accelerators (ERLs, XFELs) are designed for relatively low beam loading. The cavities are designed to operate with narrow cavity bandwidths to minimize capital and operational costs of the RF plant. With such narrow bandwidths, cavity detuning from microphonics becomes a significant factor, and in some cases can drive the cost of the machine [17]. Piezo actuators have been successfully used to actively stabilize cavity resonant frequencies. This paper will present the results of ongoing detuning compensation efforts at FNAL using prototype 325 MHz SRF single spoke resonators designed for the PIP-II project at Fermilab [18].
Figure 10: A comparison detuning distributions following active compensation at HoBiCaT and FNAL.
Using an FPGA system developed at FNAL, the cavity was controlled and calibrated on-line. Static and dynamic measurements were used to calibrate relative gains and phases of cavity signals along with cavity Lorentz Force Detuning coefficients. This coefficient was used to correct
THPDTH078 Proceedings of ERL2015, Stony Brook, NY, USA
ISBN 978-3-95450-183-0
118Cop
yrig
ht©
2015
CC
-BY-
3.0
and
byth
ere
spec
tive
auth
ors
WG6 ERLs

this detuning in a feedforward configuration on the piezo. Careful calculation of cavity detuning was calculated online and feed into the piezo for active compensation of fast cavity detuning. Over a two hour run, the cavity resonance was stabilized to an RMS detuning of 11 mHz with a peak to RMS ratio of 6 as shown in Figure 10. Active efforts to improve this and include amplitude and phase stability are ongoing.
Using a 1.3 GHz 20 kW Solid State Amplifier as
RF Power Supply for DC-SRF Photo-Injector
(Fang Wang, Peking Univ.)
An upgraded DC-SRF injector with a 3.5-cell cavity was designed and constructed at Peking University [19]. Taking into account the regulation reserve for phase and amplitude control and losses in the waveguide distribution, a 20 kW CW amplifier at 1.3 GHz is needed and we manufactured a solid state amplifier (SSA) under the collaboration with BBEF.
10×350W3kW
Combiner10-WaySplitter
350W
Pre- Amplifier
3kW
2 WaySplitter
4WaySplitter
3kW
4WaySplitter
Wave-guide
Combiner
Wave-guide
Combiner Wave-guide
CombinerInput Outp
Figure 11:Structure of 20kW SSA.
Table 2: Technical Specification of the Power Amplifier Parameter Required Results
Frequency Range /MHz 1300±0.05 1300±0.05CW & Pulsed Output Power (1dB Compression) /kW
≥ 20 20
Linear Gain /dB ≥73 ~85
Output Harmonics 2nd/3rd Order /dBc
≤-30 ≤-30
-70 -57
RF Phase Shift vs. Output/° ≤10 9.5
Gain Change vs. Output/ dB ≤2.0 1.6
Efficiency at 20kW output ≥40% 34%
The overall structure of the SSA is illustrated in Figure 11. It consists of 8 transistor banks. Each bank generates 3 kW and in which, there are 11 elementary modules with
individual power supplies and one module is used as a preamplifier to drive the other ten. It has been tested after the installation. The technical
specification is shown in Table 2. Full reflection test was carried out with a short waveguide terminal, and we got 16 kW over 16 kW in CW for ten minutes without problem. It has been used for routine operation of the DC-SRF photo-injector successfully since 2012.
DISCUSSION To clarify the present status and future prospect for
establishing the high current and high charge with low emittance ERL beam operation. We discuss the following subjects. A) How is the present status for high current ERL of
each component ?i. Cavity design and test results are OK to meet
the more than 100mA operation. However, weneed to care not to contaminate the fieldemission source in string assembly especiallyfor mass production phase.
ii. HOM damper/coupler development for highcurrent beam operation were continuouslyproceeded at each labs. Recently, HOMdamper works well with CW 40 mA of 2.7 psbunch length at Cornell injector beam line.
iii. Fundamental power coupler (FPC) gives thetransmitted more than CW 40kW of 1.3 GHz atCornell Univ and KEK. BNL FPC give the CW500 kW of 700 MHz. These results enable CWbeam operation 100mA at injector.
B) How to obtain and keep the optimum and stable CWoperation field with High-Q for a long time for beamoperation ?
i. Recent high-Q R&D including “N2 doped”cavity gives the Q0 > 3x10¹⁰ at 16 MV/m. Weneed to push high-Q R&D more.
ii. Degradation during beam operation is one ofthe problem for stable beam operation. KEKcERL main linac cavities met the degradationcome from field emission (FE) during beamoperation at 8.3MV/m field. Furthermore,CEBAF and SNS also meet the degradationduring beam operation. We need to keepmeasuring the cavity performance and collectthe experience of degradation of cavities withlong-term beam operation.
iii. We discuss about how to stop the FE (Dark)current from cavity in operation. By usingcollimator and Q-magnet between cryomodule,we can separate the dark current and mainbeam. However, we conclude that we need thecareful simulation and discuss with beamdynamics group (WG2) more.
C) RF and beam control issues. (WG3/4 joint session)i. By using Digital LLRF system, stability hasA/A < 0.01% and < 0.01 degree at KEK
cERL. And tuner control with 0.011Hz was
Proceedings of ERL2015, Stony Brook, NY, USA THPDTH078
WG6 ERLs
ISBN 978-3-95450-183-0
119 Cop
yrig
ht©
2015
CC
-BY-
3.0
and
byth
ere
spec
tive
auth
ors
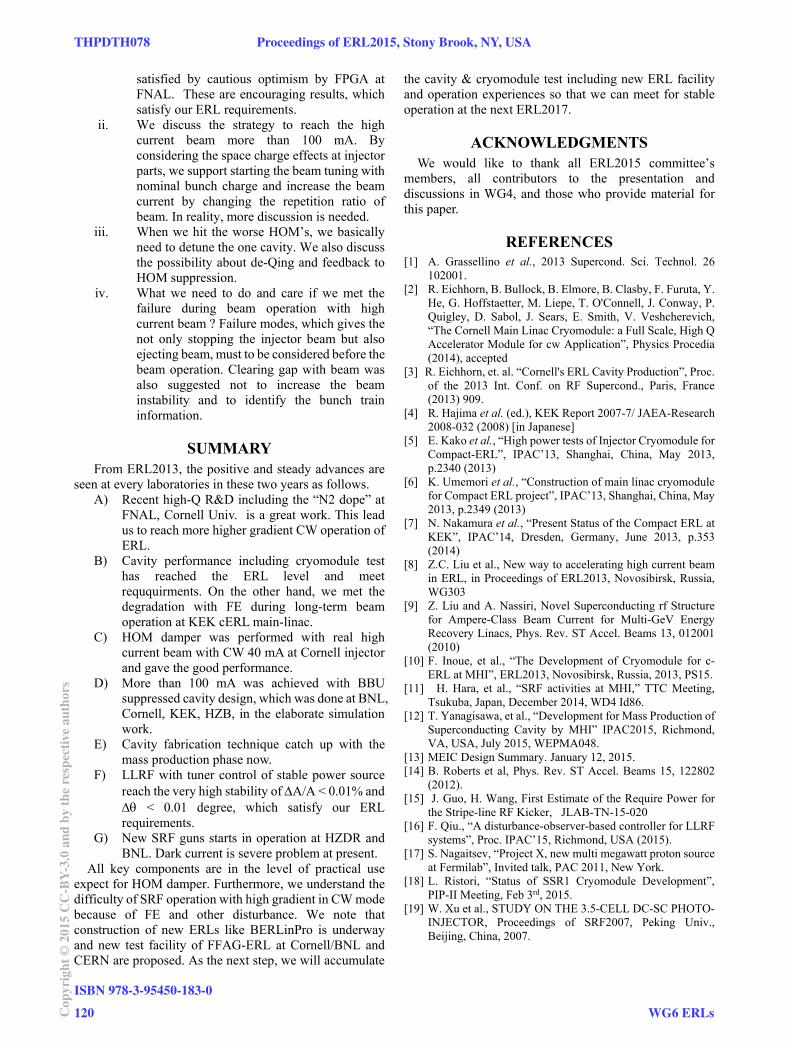
satisfied by cautious optimism by FPGA at FNAL. These are encouraging results, which satisfy our ERL requirements.
ii. We discuss the strategy to reach the high current beam more than 100 mA. By considering the space charge effects at injector parts, we support starting the beam tuning with nominal bunch charge and increase the beam current by changing the repetition ratio of beam. In reality, more discussion is needed.
iii. When we hit the worse HOM’s, we basically need to detune the one cavity. We also discuss the possibility about de-Qing and feedback to HOM suppression.
iv. What we need to do and care if we met the failure during beam operation with high current beam ? Failure modes, which gives the not only stopping the injector beam but also ejecting beam, must to be considered before the beam operation. Clearing gap with beam was also suggested not to increase the beam instability and to identify the bunch train information.
SUMMARY From ERL2013, the positive and steady advances are
seen at every laboratories in these two years as follows. A) Recent high-Q R&D including the “N2 dope” at
FNAL, Cornell Univ. is a great work. This lead us to reach more higher gradient CW operation of ERL.
B) Cavity performance including cryomodule test has reached the ERL level and meet reququirments. On the other hand, we met the degradation with FE during long-term beam operation at KEK cERL main-linac.
C) HOM damper was performed with real high current beam with CW 40 mA at Cornell injector and gave the good performance.
D) More than 100 mA was achieved with BBU suppressed cavity design, which was done at BNL, Cornell, KEK, HZB, in the elaborate simulation work.
E) Cavity fabrication technique catch up with the mass production phase now.
F) LLRF with tuner control of stable power source reach the very high stability of A/A < 0.01% and < 0.01 degree, which satisfy our ERL requirements.
G) New SRF guns starts in operation at HZDR and BNL. Dark current is severe problem at present.
All key components are in the level of practical use expect for HOM damper. Furthermore, we understand the difficulty of SRF operation with high gradient in CW mode because of FE and other disturbance. We note that construction of new ERLs like BERLinPro is underway and new test facility of FFAG-ERL at Cornell/BNL and CERN are proposed. As the next step, we will accumulate
the cavity & cryomodule test including new ERL facility and operation experiences so that we can meet for stable operation at the next ERL2017.
ACKNOWLEDGMENTS We would like to thank all ERL2015 committee’s
members, all contributors to the presentation and discussions in WG4, and those who provide material for this paper.
REFERENCES [1] A. Grassellino et al., 2013 Supercond. Sci. Technol. 26
102001. [2] R. Eichhorn, B. Bullock, B. Elmore, B. Clasby, F. Furuta, Y.
He, G. Hoffstaetter, M. Liepe, T. O'Connell, J. Conway, P. Quigley, D. Sabol, J. Sears, E. Smith, V. Veshcherevich, “The Cornell Main Linac Cryomodule: a Full Scale, High Q Accelerator Module for cw Application”, Physics Procedia (2014), accepted
[3] R. Eichhorn, et. al. “Cornell's ERL Cavity Production”, Proc. of the 2013 Int. Conf. on RF Supercond., Paris, France (2013) 909.
[4] R. Hajima et al. (ed.), KEK Report 2007-7/ JAEA-Research 2008-032 (2008) [in Japanese]
[5] E. Kako et al., “High power tests of Injector Cryomodule for Compact-ERL”, IPAC’13, Shanghai, China, May 2013, p.2340 (2013)
[6] K. Umemori et al., “Construction of main linac cryomodule for Compact ERL project”, IPAC’13, Shanghai, China, May 2013, p.2349 (2013)
[7] N. Nakamura et al., “Present Status of the Compact ERL at KEK”, IPAC’14, Dresden, Germany, June 2013, p.353 (2014)
[8] Z.C. Liu et al., New way to accelerating high current beam in ERL, in Proceedings of ERL2013, Novosibirsk, Russia, WG303
[9] Z. Liu and A. Nassiri, Novel Superconducting rf Structure for Ampere-Class Beam Current for Multi-GeV Energy Recovery Linacs, Phys. Rev. ST Accel. Beams 13, 012001 (2010)
[10] F. Inoue, et al., “The Development of Cryomodule for c-ERL at MHI”, ERL2013, Novosibirsk, Russia, 2013, PS15.
[11] H. Hara, et al., “SRF activities at MHI,” TTC Meeting, Tsukuba, Japan, December 2014, WD4 Id86.
[12] T. Yanagisawa, et al., “Development for Mass Production of Superconducting Cavity by MHI” IPAC2015, Richmond, VA, USA, July 2015, WEPMA048.
[13] MEIC Design Summary. January 12, 2015. [14] B. Roberts et al, Phys. Rev. ST Accel. Beams 15, 122802
(2012). [15] J. Guo, H. Wang, First Estimate of the Require Power for
the Stripe-line RF Kicker, JLAB-TN-15-020 [16] F. Qiu., “A disturbance-observer-based controller for LLRF
systems”, Proc. IPAC’15, Richmond, USA (2015). [17] S. Nagaitsev, “Project X, new multi megawatt proton source
at Fermilab”, Invited talk, PAC 2011, New York. [18] L. Ristori, “Status of SSR1 Cryomodule Development”,
PIP-II Meeting, Feb 3rd, 2015. [19] W. Xu et al., STUDY ON THE 3.5-CELL DC-SC PHOTO-
INJECTOR, Proceedings of SRF2007, Peking Univ., Beijing, China, 2007.
THPDTH078 Proceedings of ERL2015, Stony Brook, NY, USA
ISBN 978-3-95450-183-0
120Cop
yrig
ht©
2015
CC
-BY-
3.0
and
byth
ere
spec
tive
auth
ors
WG6 ERLs
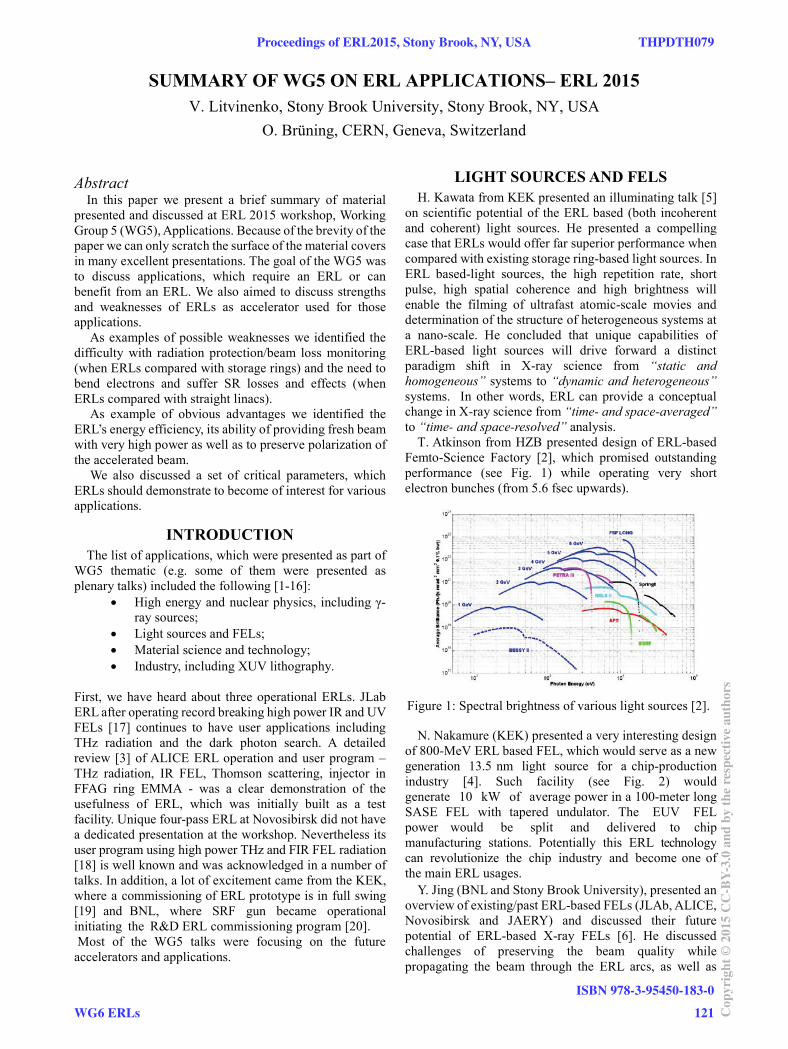
SUMMARY OF WG5 ON ERL APPLICATIONS– ERL 2015V Litvinenko, Stony Brook University, Stony Brook, NY, USA
O Brüning, CERN, Geneva, Switzerland
Abstract In this paper we present a brief summary of material
presented and discussed at ERL 2015 workshop, Working Group 5 (WG5), Applications. Because of the brevity of the paper we can only scratch the surface of the material covers in many excellent presentations. The goal of the WG5 was to discuss applications, which require an ERL or can benefit from an ERL. We also aimed to discuss strengths and weaknesses of ERLs as accelerator used for those applications.
As examples of possible weaknesses we identified the difficulty with radiation protection/beam loss monitoring (when ERLs compared with storage rings) and the need to bend electrons and suffer SR losses and effects (when ERLs compared with straight linacs).
As example of obvious advantages we identified the ERL’s energy efficiency, its ability of providing fresh beam with very high power as well as to preserve polarization of the accelerated beam.
We also discussed a set of critical parameters, which ERLs should demonstrate to become of interest for various applications.
INTRODUCTIONThe list of applications, which were presented as part of
WG5 thematic (e.g. some of them were presented as plenary talks) included the following [1-16]:
High energy and nuclear physics, including -ray sources;Light sources and FELs;Material science and technology;Industry, including XUV lithography.
First, we have heard about three operational ERLs. JLab ERL after operating record breaking high power IR and UV FELs [17] continues to have user applications including THz radiation and the dark photon search. A detailed review [3] of ALICE ERL operation and user program – THz radiation, IR FEL, Thomson scattering, injector in FFAG ring EMMA - was a clear demonstration of the usefulness of ERL, which was initially built as a test facility. Unique four-pass ERL at Novosibirsk did not havea dedicated presentation at the workshop. Nevertheless its user program using high power THz and FIR FEL radiation
is well known and was acknowledged in a number of talks. In addition, a lot of excitement came from the KEK,where a commissioning of ERL prototype is in full swing[19] and BNL, where SRF gun became operational initiating the R&D ERL commissioning program [20].Most of the WG5 talks were focusing on the future
accelerators and applications.
LIGHT SOURCES AND FELSH. Kawata from KEK presented an illuminating talk [5]
on scientific potential of the ERL based (both incoherent and coherent) light sources. He presented a compelling case that ERLs would offer far superior performance when compared with existing storage ring-based light sources. In ERL based-light sources, the high repetition rate, short pulse, high spatial coherence and high brightness will enable the filming of ultrafast atomic-scale movies and determination of the structure of heterogeneous systems at a nano-scale. He concluded that unique capabilities of ERL-based light sources will drive forward a distinct paradigm shift in X-ray science from “static and homogeneous” systems to “dynamic and heterogeneous” systems. In other words, ERL can provide a conceptual change in X-ray science from “time- and space-averaged”to “time- and space-resolved” analysis.
T. Atkinson from HZB presented design of ERL-based Femto-Science Factory [2], which promised outstanding performance (see Fig. 1) while operating very short electron bunches (from 5.6 fsec upwards).
Figure 1: Spectral brightness of various light sources [2].
N. Nakamure (KEK) presented a very interesting design of 800-MeV ERL based FEL, which would serve as a new generation 13.5 nm light source for a chip-productionindustry [4]. Such facility would generate 10 kW of average power in a 100-meter long SASE FEL with tapered undulator. The EUV FEL power would be split and delivered to chipmanufacturing stations. Potentially this ERL technologycan revolutionize the chip industry and become one of the main ERL usages.
Y. Jing (BNL and Stony Brook University), presented anoverview of existing/past ERL-based FELs (JLAb, ALICE, Novosibirsk and JAERY) and discussed their future potential of ERL-based X-ray FELs [6]. He discussed challenges of preserving the beam quality while propagating the beam through the ERL arcs, as well as
Proceedings of ERL2015, Stony Brook, NY, USA THPDTH079
WG6 ERLs
ISBN 978-3-95450-183-0
121 Cop
yrig
ht©
2015
CC
-BY-
3.0
and
byth
ere
spec
tive
auth
ors

design of bunch of compressors which minimize damage to the beam from coherent synchrotron radiation (CSR).
Figure 2: 3D-rendering of EUV source design [4] for industrial applications.
Using an example of an ERL designed for the eRHIC electron-ion collider, he showed that the electron bunch can be accelerated, compressed and used in a single path SASE FEL [6,21 (see Fig. 3). Furthermore, he illustrated how ERL driven FEL can be used for X-ray FEL oscillators [22,23].
Figure 3: Power evolution in ERL driven SASE FEL operating at 1 Å. Such FEL saturates after 100 m of the FEL wiggler.
I. Konoplev (JAI) presented a concept of a compact ultra-high flux X-ray and THz source [13], based on unique two-cavity SRF system strongly coupled at fundamental frequency (Fig. 4). One of the cavities is used for accelerating the beam and the other is for decelerating. A unique feature of this design is that HOMs of two cavities are intentionally detuned to suppress TBBU instability. The X-ray radiation in such ERL system will be generated using Compton scattering of a laser light, while THz radiation will use a Smith-Purcell type.
Figure 4: Conceptual layout of uh-flux system [13].
HIGH ENERGY AND NUCLEAR PHYSICS, INCLUDING -RAY SOURCESV. Ptitsyn presented two compelling designs of high
energy ERL-based electron-hadron colliders [1]: eRHIC [21] and LHeC [22]. In eRHIC (Fig. 5), 21.2 GeV 16-pass ERL would be used to collide polarized electrons with 250 GeV polarized proton or 100 GeV heavy ion circulating in one of RHIC super-conducting rings. This next generation QCD-facility promises a range of discoveries ranging fromobserving gluon saturation to solving proton spin puzzle. [21]
Figure 5: Layout of eRHIC collider.
LHeC would use a 3-pass 60 GeV ERL (see Fig. 6) to accelerate and to collide polarized electrons with one of he7 TeV proton beams circulating the LHC. This collider program aims at the energy frontier of high-precision physics and beyond-the-standard-model physics [22]. It also would allow high precision studies of Higgs properties.
THPDTH079 Proceedings of ERL2015, Stony Brook, NY, USA
ISBN 978-3-95450-183-0
122Cop
yrig
ht©
2015
CC
-BY-
3.0
and
byth
ere
spec
tive
auth
ors
WG6 ERLs

Figure 6: Layout of LHeC ERL.
One of the co-authors from this summary presented a concept of lepton ERL scalable to TeV energies using proton beam for transporting the energy from decelerating linac to an accelerating one [8] (see Fig. 7). Such scheme allows to practically eliminating losses for synchrotron radiation, which limit traditional lepton ERL schemes to few tens of GeV.
Figure 7: Schematic of TeV-scale lepton ERL.
E. Jensen (CERN) presented plans for 900 MeV three-path ERL facility at CERN (Fig. 8), which would be used for a number of applications beyond serving as a test bed for LHeC [7]: quench test of the superconducting magnets, testing beam instrumentation for future accelerator
-ray beams.
Figure 8: Schematic of CERN ERL facility.
There were two talks on how ERL can be used for cooling hadron beams. I. Pinayev (BNL) presented talk on using an ERL for coherent electron cooling (CeC) on hadron beam in eRHIC, which had to increase the RHIC hadron beams’ brightness by about three orders of magnitude [11]. He also presented the Proof-of-Principle CeC experiment system (see Fig. 9), which is under commissioning at RHIC IP2 straight section [23].
J. Kewisch presented a concept of low energy (2.7 to 5 MeV) ERL for cooling RHIC ion beams when operating at low energies below 10 GeV/u [14] (see Fig. 10).
R.Heine described a 155 MeV MESA ERL/RL, which is under construction at Mainz, Germany [9] under the nuclear physics research program. This facility will operate
both in ERL and RL (recirculating linac) modes accelerating polarized electron beam (see Fig. 11).
Figure 9: CeC Proof-of-Principle system at IP2 of RHIC.
Figure 10: CeC Proof-of-Principle system at IP2 of RHIC.
Figure 11: Layout of MESA ERL.
Generating Compton back- -ray beams using ERLs was a prominent theme in many presentations. ERL-
-ray sources [24] have significant advantage when compared with that based on storage rings [25] or linacs [26]. R. Hajima (JAEA) presented a detailed design as well as a first experiment on ERL- -ray source at KEK [10] (see Fig. 12). He presented an example of how such sources can be used for detection of illicit radioactive materials using existing HI S facility at Duke University [24].
Figure 12: ERL based Compton -ray source.
Proceedings of ERL2015, Stony Brook, NY, USA THPDTH079
WG6 ERLs
ISBN 978-3-95450-183-0
123 Cop
yrig
ht©
2015
CC
-BY-
3.0
and
byth
ere
spec
tive
auth
ors
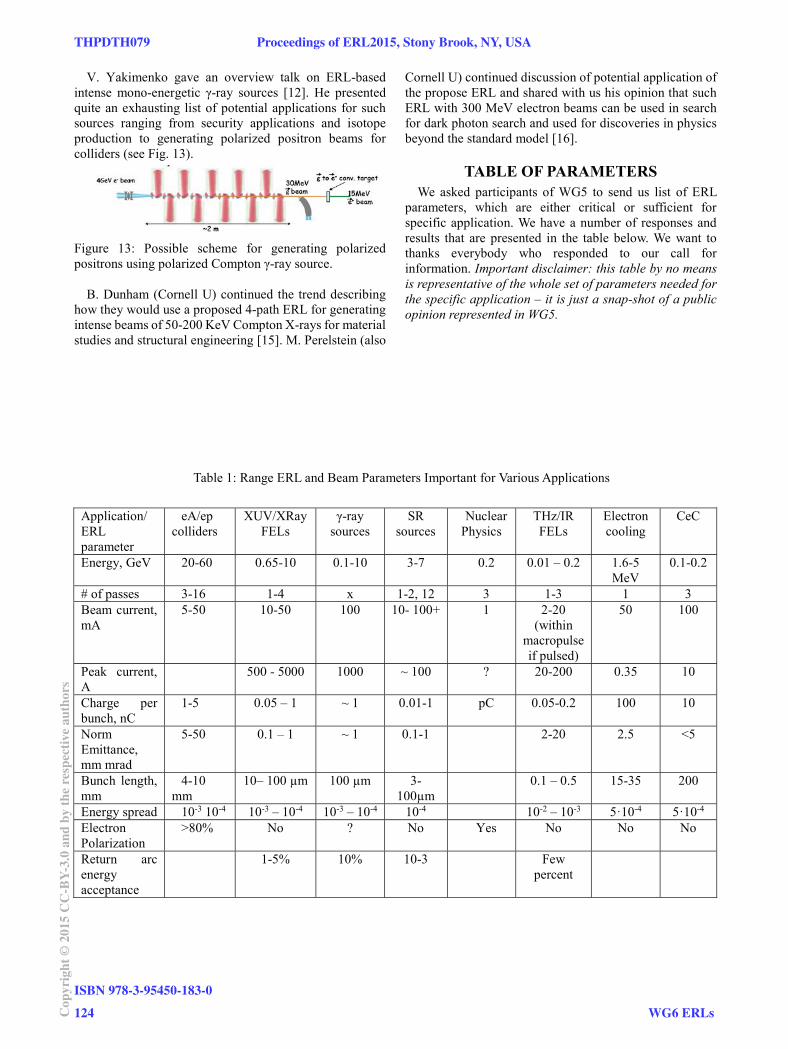
V. Yakimenko gave an overview talk on ERL-based intense mono- -ray sources [12]. He presented quite an exhausting list of potential applications for such sources ranging from security applications and isotope production to generating polarized positron beams for colliders (see Fig. 13).
Figure 13: Possible scheme for generating polarized positrons using polarized Compton -ray source.
B. Dunham (Cornell U) continued the trend describing how they would use a proposed 4-path ERL for generating intense beams of 50-200 KeV Compton X-rays for material studies and structural engineering [15]. M. Perelstein (also
Cornell U) continued discussion of potential application of the propose ERL and shared with us his opinion that such ERL with 300 MeV electron beams can be used in search for dark photon search and used for discoveries in physics beyond the standard model [16].
TABLE OF PARAMETERSWe asked participants of WG5 to send us list of ERL
parameters, which are either critical or sufficient for specific application. We have a number of responses and results that are presented in the table below. We want to thanks everybody who responded to our call for information. Important disclaimer: this table by no means is representative of the whole set of parameters needed for the specific application – it is just a snap-shot of a public opinion represented in WG5.
Table 1: Range ERL and Beam Parameters Important for Various Applications
Application/ERL parameter
eA/ep colliders
XUV/XRayFELs
-raysources
SR sources
Nuclear Physics
THz/IR FELs
Electroncooling
CeC
Energy, GeV 20-60 0.65-10 0.1-10 3-7 0.2 0.01 – 0.2 1.6-5MeV
0.1-0.2
# of passes 3-16 1-4 x 1-2, 12 3 1-3 1 3Beam current, mA
5-50 10-50 100 10- 100+ 1 2-20(within
macropulse if pulsed)
50 100
Peak current, A
500 - 5000 1000 ~ 100 ? 20-200 0.35 10
Charge per bunch, nC
1-5 0.05 – 1 ~ 1 0.01-1 pC 0.05-0.2 100 10
Norm Emittance, mm mrad
5-50 0.1 – 1 ~ 1 0.1-1 2-20 2.5 <5
Bunch length, mm
4-10mm
10– 100 μm 100 μm 3-100μm
0.1 – 0.5 15-35 200
Energy spread 10-3 10-4 10-3 – 10-4 10-3 – 10-4 10-4 10-2 – 10-3 5·10-4 5·10-4
Electron Polarization
>80% No ? No Yes No No No
Return arc energy acceptance
1-5% 10% 10-3 Few percent
THPDTH079 Proceedings of ERL2015, Stony Brook, NY, USA
ISBN 978-3-95450-183-0
124Cop
yrig
ht©
2015
CC
-BY-
3.0
and
byth
ere
spec
tive
auth
ors
WG6 ERLs

CONCLUSIONSPresentations and discussions at WG5 clearly
demonstrated that ERL brings new and unique capabilities in many application areas: from fundamental science to industry and national security. With ERL technology maturing, we expect more and more application area to pop-up in near future. The fact that a number of ERL are either under construction, commissioning or in other advanced development phases, makes this period very exciting but also very raveling of real challenges posed by ERL technology.
ACKNOWLEDGMENTSThe authors would like to thank the workshop organizers
and participants of the working group for the excellent presentations and lively discussions during and in-between the sessions.
REFERENCES[1] ERL-based Electron-Ion Colliders, V. Ptitsyn, these
proceedings[2] The Femto-Science Factory: A Multi-turn ERL-based
Light Source, T. Atkinson, these proceedings[3] 10 Years of ALICE: From Concept to Operational
User Facility, P. Williams, these proceedings[4] Design work of the ERL-FEL as the high intense EUV
light source, N. Nakamura, these proceedings[5] Science cases on ERL as a synchrotron light source,
H. Kawata, these proceedings[6] ERL as FEL driver, Y.Jing, these proceedings[7] ERL facility at CERN for applications, E. Jensen,
these proceedings[8] A Lepton Energy Recovery Linac Scalable to TeV, V.
N. Litvinenko, these proceedings[9] Current Status of the MESA Project, R.Heine, , these
proceedings[10] Laser Compton Sources Based On Energy Recovery
Linacs, R. Hajima, , these proceedings[11] Using ERLs for Coherent electron Cooling, I.Pinayev,
these proceedings[12] ERL as high intensity mono- -ray sources,
V. Yakimenko, these proceedings[13] Ultra-High Flux of X-ray/THz Source based on
Asymmetric Dual Axis Energy Recovery Configuration, I. Konoplev, these proceedings
[14] ERL for low energy electron cooling at RHIC (LEReC), J.Kewisch, these proceedings
[15] An Inverse Compton Scattering Beamline for High-Energy, Time-Resolved X-ray Scattering Studies of Materials, B. Dunham, these proceedings
[16] Nuclear and High-Energy Physics Experiments with Cornell's FFAG ERL, M. Perelstein, these proceedings
[17] G. R. Neil et al., Phys. Rev. Lett. 84, 662, 2000[18] O.A. Shevchenko et al.,” The Novosibirsk terahertz
FEL facility – current status and future prospects”, Proc. of FEL 2012, Nara, Japan (2012)
[19] Successful Result of the Commissioning on cERL in KEK, S. Sakanaka, these proceedings
[20] Status and Commissioning Results of the R&D ERL at BNL, D. Kayran, these proceedings
[21] eRHIC Design Study: An Electron-Ion Collider at BNL, E.C.Aschenauer et al., arxiv.org/abs/1409.1633,2014
[22] A Large Hadron Electron Collider at CERN, J. L. A. Fernandez et al., Journ. Of Physics G: Nuclear and Particle Physics, 39, 2012, p. 75001
[23] First 1.6 MeV electron beam with 3 nC per bunch was generated from its 112 MHz SRF gun in June 2015.
[24] Potential uses of ERL-based -ray sources, V.N. Litvinenko et al., IEEE Trans. Plasma Science 36,2008, p. 1799
[25] Recent Results with the High Intensity -ray Facility, V.N. Litvinenko, NIM A507 (2003) 527
[26] Electron Linac design to drive bright Compton back-scattering gamma-ray, A. Bacci et al., J. Appl. Phys. 113, 194508 (2013)
Proceedings of ERL2015, Stony Brook, NY, USA THPDTH079
WG6 ERLs
ISBN 978-3-95450-183-0
125 Cop
yrig
ht©
2015
CC
-BY-
3.0
and
byth
ere
spec
tive
auth
ors

126

Proceedings of ERL2015, Stony Brook, NY, USA
List of AuthorsBold papercodes indicate primary authors
— A —Abo-Bakr, M. TUPATH020, THPCTH076Ackeret, M.A. TUIBLH1023Agladze, N.I. THIALH2070Ainsworth, R. WEICLH1057Alexander, I. THIALH2069Altinbas, Z. MOPDTH014Arakawa, D.A. WEIDLH2066Arnold, A. TUIDLH1037, TUIDLH1038Arnold, M. TUICLH2032Atkinson, T. MOPBTH003Attenkofer, K. TUICLH1030Aulenbacher, K. THIALH2069
— B —Bakin, V.V. THIALH2072Bartnik, A.C. MOPCTH008, TUPATH019,
TUICLH1024, THIALH2070,THIALH2071, THPCTH075
Bazarov, I.V. MOPBTH005, MOPCTH008,TUICLH1024, THIALH2070,THIALH2071
Beavis, D.R. MOPDTH014Bechthold, V. THIALH2069Belomestnykh, S.A. MOPDTH014, TUICLH1027,
TUIDLH1036, WEICLH2061Ben-Zvi, I. MOPBTH005, MOPDTH014,
TUIBLH1023, TUICLH1027,TUIDLH1036, WEICLH2061
Berg, J.S. MOPBTH005, TUIBLH2024Bhandari, H. TUICLH1030Blaskiewicz, M. MOPBTH005, WEICLH1058Bogacz, S.A. MOPBTH004, TUIBLH2026,
WEIALH1043Bondarenko, A.V. MOPBTH003Brock, J.D. WEICLH1059Brooks, S.J. MOPBTH005, TUIBLH2024,
TUIBLH2027, WEIDLH1002Brown, K.A. MOPBTH005Brüning, O.S. MOPBTH004, TUPATH023,
WEIALH1043, THPDTH079Bullock, B. WEIBLH2053Burt, G. WEICLH1057
— C —Calaga, R. WEIALH1043Cenni, E. WEIBLH2054Chang, X. TUIBLH1022Chen, J.E. WEIBLH2056Chen, S. MOPCTH010, TUICLH2033Ciovati, G. TUIDLH1037Clasby, B. WEIBLH2053
Conway, J.V. WEIBLH2053Cultrera, L. MOPCTH008
— D —Dai, J. WEIBLH2055Deonarine, S. MOPDTH014Di Mitri, S. TUIDLH2040Ding, Z. TUICLH1030Dobbins, J. MOPBTH005, THIALH2070,
THIALH2071Dobrin, E. TUIBLH1023Douglas, D. TUICLH2034Dunham, B.M. MOPBTH005, MOPCTH008,
WEICLH1059, THIALH2070,THIALH2071
— E —Eichhorn, R.G. WEIBLH2053Elmore, B. WEIBLH2053Enami, K. WEIBLH2054
— F —Fan, P.L. WEIBLH2056Fedotov, A.V. WEICLH1058Feng, L.W. WEIBLH2056, WEIDLH2068Fischer, W. MOPBTH005Freitag, M. TUIDLH1037Frisch, H.J. TUICLH1030Full, S.J. THIALH2070, THIALH2071Furuta, F. MOPDTH012, WEIBLH2053Furuya, T. MOPCTH010, WEIBLH2054
— G —Gao, J. WEIBLH2055Gaowei, M. TUICLH1030Gassner, D.M. MOPDTH014, TUIBLH1023,
WEIALH2048Gros, M. TUICLH2032Gulliford, C.M. MOPCTH008, TUPATH021,
THPCTH077Guo, J. WEICLH2063Gupta, R.C. MOPDTH014
— H —Haga, K. MOPCTH010Hahn, H. MOPDTH014, WEICLH2061Hajima, R. MOPCTH010, TUIBLH1020,
TUIBLH1021, WEIBLH1050,THPTHL073
Hall, C.C. TUICLH2035Hammons, L.R. MOPDTH014
List of Authors
ISBN 978-3-95450-183-0
127 Cop
yrig
ht©
2015
CC
-BY-
3.0
and
byth
ere
spec
tive
auth
ors
Proceedings of ERL2015, Stony Brook, NY, USA
Hanyu, I. MOPCTH010Hao, J.K. WEIBLH2056, WEIDLH2068Hao, Y. MOPBTH005, TUIBLH2024,
TUIBLH2025, TUIDLH2041Hara, H. WEICLH2062Harada, K. MOPCTH010He, F.S. WEIBLH2055He, Y. WEIBLH2053Heine, R.G. WEIBLH1049Ho, C. MOPDTH014Hoffstaetter, G.H. MOPBTH005, WEIBLH2053,
WEICLH1059, WEICLH1060,THIALH2071
Holzbauer, J.P. WEIDLH2067Honda, T. MOPCTH010Honda, Y. MOPCTH010, TUIBLH1020,
TUIBLH1021, WEIDLH2066Huang, S. WEIBLH2056Huang, Y.L. WEICLH2063Hug, F. TUICLH2032Hulsart, R.L. WEIALH2046
— J —Jackson, F. WEIALH2047Jain, A.K. WEIDLH1002Jamilkowski, J.P. MOPDTH014, WEIALH2048Jankowiak, A. THPTHL072Jensen, E. MOPBTH004, TUPATH022,
WEIALH1043, THPDTH078Jin, S. WEIBLH2055Jin, X.J. TUIBLH1020, TUIBLH1021Jing, Y.C. WEIALH1042Jones, L.B. THIALH2072Jürgensen, L.E. TUICLH2032
— K —Kako, E. MOPCTH010, WEIBLH2054Kamiya, Y. MOPCTH010Kamps, T. TUPATH019, THPTHL072,
THPCTH075Kanaoka, K. WEICLH2062Kankiya, P. K. MOPDTH014Katagiri, H. WEIDLH2066Kato, R. MOPCTH010Kawata, H. MOPCTH010, WEIALH1041Kayran, D. MOPDTH014, TUICLH1027,
TUIDLH1036, WEIALH2048,WEICLH1058
Kewisch, J. WEICLH1058Klein, M. MOPBTH004, WEIALH1043Kneisel, P. TUIDLH1037Knobloch, J. MOPBTH006Kobayashi, M. TUIBLH1021Kobayashi, Y. MOPCTH010Kondo, Y. WEIBLH2054Konomi, T. MOPCTH010
Konoplev, I.V. WEICLH1057Kostroun, V.O. WEICLH1059Kubo, T. MOPCTH010Kühn, J. TUICLH1030, THPTHL072Kürzeder, T. TUICLH2032Kuriki, M. TUIBLH1021, TUIBLH1020Kurisu, H. TUIBLH1021
— L —Laloudakis, N. MOPDTH014Lambiase, R.F. MOPDTH014, TUIBLH1023Latina, A. TUIBLH2026Ledroit, B. THIALH2069Li, R. TUICLH2034Li, Y. THIALH2070Liepe, M. WEIBLH2053Lin, L. WEIBLH2056, WEIDLH2068Litvinenko, V. MOPDTH014, TUPATH023,
TUIBLH2024, TUIBLH2025,TUIDLH2041, WEIALH1044,THPDTH079
Liu, C. TUIBLH2024, TUIBLH2025Liu, K.X. WEIBLH2056, WEIDLH2068Liu, X. THIALH2070Liu, Z.C. WEIBLH2055Lu, P.N. TUIDLH1038
— M —Mahler, G.J. MOPDTH014, WEIDLH1002Masi, L. MOPDTH014Matejcek, C. THIALH2069Matsuda, R. WEICLH2062Matsumoto, T. WEIDLH2066Matveenko, A.N. MOPBTH003Maxson, J.M. MOPCTH008, TUICLH1024Mayes, C.E. MOPBTH005, WEIDLH1001McIntyre, G.T. MOPDTH014, TUICLH1027Meng, W. MOPBTH005, TUIBLH1023Méot, F. MOPBTH005, TUIBLH1019,
TUIBLH2024, TUIBLH2027,WEIDLH1002
Mi, Z.H. WEIBLH2055Michel, P. TUIDLH1038Michizono, S. MOPCTH010, WEIBLH2054,
WEIDLH2066Michnoff, R.J. WEIALH2046Militsyn, B.L. THIALH2072Miller, R.C. TUIBLH1023Miller, T.A. MOPDTH014, WEIALH2048Minty, M.G. MOPBTH005, TUIBLH2024,
TUIBLH2025, WEIALH2048Miura, T. WEIBLH2054, WEIDLH2066Miyajima, T. MOPCTH010, TUIBLH1020,
TUIBLH1021Montag, C. WEICLH1058Moore, T.P. THIALH2070
ISBN 978-3-95450-183-0
128Cop
yrig
ht©
2015
CC
-BY-
3.0
and
byth
ere
spec
tive
auth
ors
List of Authors
Proceedings of ERL2015, Stony Brook, NY, USA
Morris, J. MOPDTH014, WEIALH2048Muller, E.M. TUICLH1030Murcek, P. TUIDLH1037, TUIDLH1038
— N —Nagai, R. TUIBLH1020, TUIBLH1021,
THPTHL073Nakai, H. MOPCTH010Nakamura, N. MOPCTH010, TUICLH2033Nishimori, N. MOPCTH010, TUIBLH1021,
THPTHL073, TUIBLH1020Noakes, T.C.Q. THIALH2072
— O —O’Connell, T.I. WEIBLH2053Obina, T. MOPCTH010, TUPATH021,
TUIBLH1020, WEIALH2045,WEIDLH2066, THPCTH077
Oide, K. MOPCTH010Okihira, K. WEICLH2062
— P —Padmore, H.A. TUICLH1030Patterson, J.R. MOPBTH005, WEICLH1060Peggs, S. MOPBTH005Pellegrini, D. MOPBTH004, TUIBLH2026Perlstein, M. WEICLH1060Petenev, Y. MOPBTH003Pforr, J. TUICLH2032Phillips, D. MOPDTH014Pietralla, N. TUICLH2032Pietz, J.R. TUIBLH1023Pinayev, I. WEIALH2046, WEIBLH1051Pischalnikov, Y.M. WEIDLH2067Ptitsyn, V. MOPATH001, MOPBTH005,
MOPDTH014, TUPATH020,TUIBLH2024, TUIBLH2025,TUIBLH2027, TUIDLH2041,WEIDLH1002, THPCTH076
— Q —Qiu, F. WEIBLH2054, WEIDLH2066Quan, S.W. WEIBLH2056, WEIDLH2068Quigley, P. WEIBLH2053
— R —Rahman, O.H. TUIBLH1023Ranjbar, V.H. WEICLH1058Rao, T. MOPDTH014, TUIBLH1023Rimmer, R.A. WEICLH2063Roser, T. MOPBTH005, TUIBLH2024
— S —Sabol, D.M. WEIBLH2053
Sagan, D. MOPBTH005Sakai, H. MOPCTH010, WEIBLH2054,
THPDTH078Sakai, H. TUPATH022, WEIDLH2066Sakanaka, S. MOPCTH007, MOPCTH010Sato, M. WEIBLH2054Savino, J.J. THIALH2070Sawamura, M. WEIBLH2054, THPTHL073Schappert, W. WEIDLH2067Scheibler, H.E. THIALH2072Schirm, K.M. WEIALH1043Schmeißer, M. THPTHL072Schubert, S.G. TUICLH1030Schulte, D. TUIBLH2026Sears, J. WEIBLH2053Seda, T. MOPDTH014Sennyu, K. WEICLH2062Seryi, A. WEICLH1057Severance, M. WEIDLH1002Sheehy, B. MOPDTH014, TUIBLH1023,
TUICLH1027, WEIALH2048Shimada, M. MOPCTH010, TUICLH2033Shinoe, K. WEIBLH2054Shishido, T. WEIBLH2054Sinsheimer, J. TUICLH1030Skaritka, J. TUIBLH1023Smart, L. MOPDTH014Smedley, J. TUICLH1030Smith, E.N. WEIBLH2053Smith, K.S. MOPDTH014Smolenski, K.W. THIALH2070Srinivasan-Rao, T. MOPDTH014Steszyn, A.N. MOPDTH014
— T —Takai, R. WEIALH2045Teichert, J. TUIDLH1037, TUIDLH1038Tennant, C. TUICLH2034Terekhov, A.S. THIALH2072Than, R. MOPDTH014, TUICLH1027Thieberger, P. MOPBTH005, TUIBLH2024Thompson, K.A. TUIBLH1023Tigner, M. MOPATH002Torres-Sanchez, R. WEIALH1043Trbojevic, D. MOPBTH005, TUIBLH2024,
TUIBLH2025, TUIBLH2027,WEIDLH1002
Tsai, C.-Y. TUICLH2034Tsoupas, N. MOPBTH005, TUIBLH2024,
TUIBLH2027, WEIDLH1002Tsuchiya, K. MOPCTH010Turlington, L. TUIDLH1037
— U —Uchiyama, T. TUIBLH1020, TUIBLH1021Umemori, K. MOPCTH010, WEIBLH2054
List of Authors
ISBN 978-3-95450-183-0
129 Cop
yrig
ht©
2015
CC
-BY-
3.0
and
byth
ere
spec
tive
auth
ors
Proceedings of ERL2015, Stony Brook, NY, USA
— V —Valloni, A. MOPBTH004, WEIALH1043Vennekate, H. TUIDLH1037, TUIDLH1038Veshcherevich, V. WEIBLH2053
— W —Walsh, J. TUICLH1030Wang, E. MOPDTH014, TUIBLH1023,
TUICLH1027Wang, F. WEIBLH2055, WEIBLH2056,
WEIDLH2068Wang, G.W. WEIBLH2055Wang, H. WEICLH2063Wang, Q.Y. WEIBLH2055Wang, S. WEICLH2063Wang, Zh.W. WEIBLH2056Watanabe, K. WEIBLH2054Weiss, D. MOPDTH014, TUICLH1027Wen, X.D. WEIBLH2056Wibowo, S.B. WEIDLH2066Williams, P.H. MOPCTH009Wong, J.J. TUICLH1030
— X —Xiang, R. TUIDLH1037, TUIDLH1038Xie, H. MOPDTH014Xie, H.M. TUICLH1027, WEIBLH2056Xie, J. TUICLH1030Xu, W. MOPDTH014, TUICLH1027,
TUIDLH1036, WEICLH2061
— Y —Yakimenko, V. WEIBLH1052Yamamoto, M. MOPCTH010, TUIBLH1020,
TUIBLH1021Yamamoto, Y. WEIBLH2054Yanagisawa, T. WEICLH2062Yeckel, C. TUIBLH1023
— Z —Zaltsman, A. MOPDTH014Zhai, J.Y. WEIBLH2055Zhang, B.C. WEIDLH2068Zhao, K. WEIBLH2056Zhao, T.X. WEIBLH2055Zheng, H.J. WEIBLH2055Zhu, F. WEIBLH2056Zimmermann, F. MOPBTH004
ISBN 978-3-95450-183-0
130Cop
yrig
ht©
2015
CC
-BY-
3.0
and
byth
ere
spec
tive
auth
ors
List of Authors
Proceedings of ERL2015, Stony Brook, NY, USA
Institutes List
ANLArgonne, Illinois, USA
• Xie, J.
BNLUpton, Long Island, New York, USA
• Altinbas, Z.• Attenkofer, K.• Beavis, D.R.• Belomestnykh, S.A.• Ben-Zvi, I.• Berg, J.S.• Blaskiewicz, M.• Brooks, S.J.• Brown, K.A.• Calaga, R.• Deonarine, S.• Fedotov, A.V.• Fischer, W.• Gaowei, M.• Gassner, D.M.• Gupta, R.C.• Hahn, H.• Hammons, L.R.• Hao, Y.• Ho, C.• Hulsart, R.L.• Jain, A.K.• Jamilkowski, J.P.• Jing, Y.C.• Kankiya, P. K.• Kayran, D.• Kewisch, J.• Laloudakis, N.• Lambiase, R.F.• Litvinenko, V.• Liu, C.• Mahler, G.J.• Masi, L.• McIntyre, G.T.• Meng, W.• Méot, F.• Michnoff, R.J.• Miller, T.A.• Minty, M.G.• Montag, C.• Morris, J.• Peggs, S.• Phillips, D.• Pinayev, I.• Ptitsyn, V.• Ranjbar, V.H.• Rao, T.• Roser, T.• Seda, T.• Sheehy, B.• Sinsheimer, J.• Skaritka, J.
• Smart, L.• Smedley, J.• Smith, K.S.• Srinivasan-Rao, T.• Steszyn, A.N.• Than, R.• Thieberger, P.• Trbojevic, D.• Tsoupas, N.• Walsh, J.• Wang, E.• Weiss, D.• Xie, H.• Xu, W.• Zaltsman, A.
CERNGeneva, Switzerland
• Brüning, O.S.• Jensen, E.• Klein, M.• Latina, A.• Pellegrini, D.• Schirm, K.M.• Schulte, D.• Torres-Sanchez, R.• Valloni, A.• Zimmermann, F.
Cockcroft Institute, Lancaster UniversityLancaster, United Kingdom
• Burt, G.
Cornell University (CLASSE), Cornell Laboratory forAccelerator-Based Sciences and EducationIthaca, New York, USA
• Agladze, N.I.• Bartnik, A.C.• Bazarov, I.V.• Brock, J.D.• Bullock, B.• Clasby, B.• Conway, J.V.• Cultrera, L.• Dobbins, J.• Dunham, B.M.• Eichhorn, R.G.• Elmore, B.• Full, S.J.• Furuta, F.• Gulliford, C.M.• He, Y.• Hoffstaetter, G.H.• Kostroun, V.O.• Li, Y.• Liepe, M.• Liu, X.
Institutes List
ISBN 978-3-95450-183-0
131 Cop
yrig
ht©
2015
CC
-BY-
3.0
and
byth
ere
spec
tive
auth
ors
Proceedings of ERL2015, Stony Brook, NY, USA
• Maxson, J.M.• Mayes, C.E.• Moore, T.P.• O’Connell, T.I.• Patterson, J.R.• Quigley, P.• Sabol, D.M.• Sagan, D.• Savino, J.J.• Sears, J.• Smith, E.N.• Smolenski, K.W.• Tigner, M.• Veshcherevich, V.
Cornell UniversityIthaca, New York, USA
• Furuta, F.• Perlstein, M.
CSUFort Collins, Colorado, USA
• Hall, C.C.
Elettra-Sincrotrone Trieste S.C.p.A.Basovizza, Italy
• Di Mitri, S.
Enrico Fermi Institute, University of ChicagoChicago, Illinois, USA
• Frisch, H.J.
EPFLLausanne, Switzerland
• Pellegrini, D.
Far-Tech, Inc.San Diego, California, USA
• Chang, X.
FermilabBatavia, Illinois, USA
• Holzbauer, J.P.• Pischalnikov, Y.M.• Schappert, W.
Hiroshima University, Graduate School of ScienceHigashi-Hiroshima, Japan
• Kuriki, M.
HU/AdSMHigashi-Hiroshima, Japan
• Kuriki, M.
HZBBerlin, Germany
• Abo-Bakr, M.• Atkinson, T.• Bondarenko, A.V.• Jankowiak, A.• Kamps, T.• Knobloch, J.• Kühn, J.• Matveenko, A.N.• Petenev, Y.• Schmeißer, M.
HZDRDresden, Germany
• Arnold, A.• Freitag, M.• Lu, P.N.• Michel, P.• Murcek, P.• Teichert, J.• Vennekate, H.• Xiang, R.
IHEPBeijing, People’s Republic of China
• Dai, J.• Gao, J.• He, F.S.• Jin, S.• Liu, Z.C.• Mi, Z.H.• Wang, G.W.• Wang, Q.Y.• Zhai, J.Y.• Zhao, T.X.• Zheng, H.J.
IKPMainz, Germany
• Alexander, I.• Aulenbacher, K.• Bechthold, V.• Heine, R.G.• Ledroit, B.• Matejcek, C.
IMP/CASLanzhou, People’s Republic of China
• Huang, Y.L.
ISPNovosibirsk, Russia
• Bakin, V.V.• Scheibler, H.E.• Terekhov, A.S.
ISBN 978-3-95450-183-0
132Cop
yrig
ht©
2015
CC
-BY-
3.0
and
byth
ere
spec
tive
auth
ors
Institutes List
Proceedings of ERL2015, Stony Brook, NY, USA
JAEA/FELIbaraki-ken, Japan
• Nishimori, N.
JAEAIbaraki-ken, Japan
• Hajima, R.• Nagai, R.• Nishimori, N.• Sawamura, M.
JAIEgham, Surrey, United Kingdom
• Ainsworth, R.• Konoplev, I.V.• Seryi, A.
JLabNewport News, Virgina, USA
• Bogacz, S.A.• Ciovati, G.• Douglas, D.• Guo, J.• Kneisel, P.• Li, R.• Rimmer, R.A.• Tennant, C.• Turlington, L.• Wang, H.• Wang, S.
KEKIbaraki, Japan
• Arakawa, D.A.• Chen, S.• Enami, K.• Furuya, T.• Haga, K.• Hanyu, I.• Harada, K.• Honda, T.• Honda, Y.• Jin, X.J.• Kako, E.• Kamiya, Y.• Katagiri, H.• Kato, R.• Kawata, H.• Kobayashi, M.• Kobayashi, Y.• Kondo, Y.• Konomi, T.• Kubo, T.• Matsumoto, T.• Michizono, S.• Miura, T.• Miyajima, T.• Nakai, H.
• Nakamura, N.• Obina, T.• Oide, K.• Qiu, F.• Sakai, H.• Sakanaka, S.• Sato, M.• Shimada, M.• Shinoe, K.• Shishido, T.• Takai, R.• Tsuchiya, K.• Uchiyama, T.• Umemori, K.• Watanabe, K.• Yamamoto, M.• Yamamoto, Y.
LBNLBerkeley, California, USA
• Padmore, H.A.• Schubert, S.G.• Wong, J.J.
MHIHiroshima, Japan
• Hara, H.• Kanaoka, K.• Okihira, K.• Sennyu, K.• Yanagisawa, T.
Mitsubishi Heavy Industries Ltd. (MHI)Takasago, Japan
• Matsuda, R.
PKUBeijing, People’s Republic of China
• Chen, J.E.• Fan, P.L.• Feng, L.W.• Hao, J.K.• Huang, S.• Lin, L.• Liu, K.X.• Quan, S.W.• Wang, F.• Wang, Zh.W.• Wen, X.D.• Xie, H.M.• Zhang, B.C.• Zhao, K.• Zhu, F.
Radiation Monitoring DevicesWatertown, USA
• Bhandari, H.
Institutes List
ISBN 978-3-95450-183-0
133 Cop
yrig
ht©
2015
CC
-BY-
3.0
and
byth
ere
spec
tive
auth
ors
Proceedings of ERL2015, Stony Brook, NY, USA
SBUStony Brook, New York, USA
• Ding, Z.• Muller, E.M.
SLACMenlo Park, California, USA
• Yakimenko, V.
SokendaiIbaraki, Japan
• Cenni, E.• Wibowo, S.B.
Stangenes IndustriesPalo Alto, California, USA
• Dobrin, E.• Miller, R.C.• Thompson, K.A.• Yeckel, C.
STFC/DL/ASTeCDaresbury, Warrington, Cheshire, United Kingdom
• Jackson, F.• Jones, L.B.• Militsyn, B.L.• Noakes, T.C.Q.• Williams, P.H.
Stony Brook UniversityStony Brook, USA
• Belomestnykh, S.A.• Ben-Zvi, I.• Hammons, L.R.• Kayran, D.• Litvinenko, V.• Ptitsyn, V.• Rahman, O.H.• Severance, M.
Transfer Engineering and Manufacturing, IncFremont, California, USA
• Ackeret, M.A.• Pietz, J.R.
TU DarmstadtDarmstadt, Germany
• Arnold, M.• Gros, M.• Hug, F.• Jürgensen, L.E.• Kürzeder, T.• Pforr, J.• Pietralla, N.
Virginia Polytechnic Institute and State UniversityBlacksburg, Virginia, USA
• Tsai, C.-Y.
Yamaguchi UniversityUbe-Shi, Japan
• Kurisu, H.
ISBN 978-3-95450-183-0
134Cop
yrig
ht©
2015
CC
-BY-
3.0
and
byth
ere
spec
tive
auth
ors
Institutes List