EstherPolaquinhaTransgressão.pdf - Repositório Institucional
Upload
khangminh22Category
view
2download
0
Equity Valuation of ALMIRALL SA
João Ferreira
Advisor: Professor José Carlos Tudela Martins
Dissertation submitted in partial fulfilment of requirements for the MSc in Management, at the Universidade Católica Portuguesa, 3rd of
June 2016
2
Abstract
This dissertation aims at determining the fair value of Almirall SA equity. The pharmaceutical
industries, as well as Almirall SA were researched in detail. Different theoretical approaches
were discussed in a literature review that represents the “state of the art” in equity valuation.
Based on the literature review, Almirall SA was valued with a sum of the part valuation,
including a discounted cash flow valuation for the mature business, a discounted multiple
valuation for the company research and development activity and a net present value
valuation for income incurring from the recent transaction with AztraZeneca in 2014. The fair
value of 16.2 Euros per share determined the target price of this valuation, based on
comparing said price with the current share price of 18.4 Euros, I made a recommendation for
investors to sell the stock. Finally, this dissertation’s recommendation and valuation was
compared with another from an equity research report from Credit Suisse and I proceeded to
explain the differences in the recommendation and valuation, which might arise from
different assumptions, valuation methods and recommendation method used.
Esta dissertação tem como objectivo determinar o valor justo da acção da Almirall SA. A
indústria farmacêutica, bem como a Almirall SA foram analisados em detalhe. Abordagens
teóricas diferentes foram discutidas numa revisão de literatura que discute os métodos mais
sofisticados e actualizados de avaliação de empresas. Com base na revisão da literatura, a
Almirall SA foi avaliada como uma soma das partes, incluindo uma avaliação fluxos de caixa
descontados para o negócio maduro da empresa, uma avaliação de múltiplos descontada para
a actividade da empresa em investigação e desenvolvimento e uma avaliação do valor
presente líquido para a renda proveniente da transacção recente com a AztraZeneca em 2014.
O valor justo de 16.2 Euros por acção determinou o preço-alvo desta avaliação, com base na
comparação do referido preço com a preço actual de 18.4 Euros, fiz uma recomendação aos
investidores para vender a acção. Finalmente, a recomendação e avaliação desta dissertação
foram comparadas com outras de um relatório de análise do Credit Suisse e as diferenças que
surgiram na recomendação e avaliação foram discutidas, tendo em conta os pressupostos, os
métodos de avaliação utilizados e a o método de recomendação.

3
Acknowledgements
This dissertation involved a lot of hard work, studying and analysis of concepts that are hard
to grasp. Furthermore, I had the opportunity of doing a part-time internship, during thesis, in
the Haitong Bank Equity Research Department, which consolidated my academic knowledge
and gave me insights needed to complete this dissertation.
Regarding the dissertation, Professor José Carlos Tudela Martins and the HAITONG BANK
equity research department staff proved to be an invaluable help, whom promptly helped me
and addressed my questions and doubts whenever I needed.
On a more personal note, this dissertation is the last step in my master’s degree and education,
therefore I want to thank all that have been with me so far, my family and friends, whom have
helped me to overcome yet another challenge.

4
CONTENT LIST
1 - Introduction ................................................................................................................... 12
2 - Review of Relevant Literature ..................................................................................... 13
2.1 - Cost of Capital ............................................................................................................ 14
2.1.1 - Weighted Average Cost of Capital ............................................................................ 14
2.1.2 - Cost of Equity............................................................................................................ 14
2.1.3 - Cost of Debt .............................................................................................................. 15
2.1.4 - Tax Rate .................................................................................................................... 15
2.1.5 - Risk Free Rate ........................................................................................................... 16
2.1.6 - Market Risk Premium ............................................................................................... 16
2.1.7 - Country Specific Risk ............................................................................................... 17
2.1.8 - Βeta............................................................................................................................ 17
2.2 - Economic Value Added .............................................................................................. 19
2.3 - Discounted Cash Flow ................................................................................................ 20
2.3.1 - Free Cash Flow to the Firm ....................................................................................... 20
2.4.2 - Adjusted Present Value ............................................................................................. 21
2.4.3 - Terminal Value .......................................................................................................... 22
2.5 - Equity Cash-Flow Methods ....................................................................................... 23
2.5.1 - Dividend Discount model.......................................................................................... 23
2.5.2 - Free Cash-Flow to Equity ......................................................................................... 24
2.6 - Valuation of Pharmaceutical Companies ................................................................. 24
2.6.1 - The NPV of the R&D Pipeline .................................................................................. 25
2.6.2 - Option Valuation ....................................................................................................... 27
3 - Relative Valuation ......................................................................................................... 28
4 - Company and Industry Overview ............................................................................... 30
4.1 - Almirall’s History ........................................................................................................ 30
5
4.2 - SWOT Analysis Operating Metrics, Business and Geographic Presence ................... 31
4.3 - Strategic Goals ............................................................................................................. 34
4.4 - Industry Overview ........................................................................................................ 38
4.5 - Macroeconomic Overview ........................................................................................... 41
5 - Almirall’s Valuation ...................................................................................................... 43
5.1 - Valuation Method ......................................................................................................... 43
5.2 - Mature Business DCF Valuation .............................................................................. 43
5.2.1 - Risk-Free Rate and Market Risk Premium ............................................................... 44
5.2.2 - Equity Beta and Return on Equity ............................................................................. 45
5.2.3 - Cost of Debt .............................................................................................................. 46
5.2.4 - WACC ....................................................................................................................... 47
5.2.5 - Net Working Capital ................................................................................................. 47
5.2.6 - CAPEX and Amortization & Depreciation ............................................................... 48
5.2.7 - Dividends, Reserves and Retained Earnings ............................................................. 48
5.2.8 - Revenue Forecast ...................................................................................................... 49
5.2.9 - Other Income ............................................................................................................. 51
5.2.10 - Financial Results and Taxes .................................................................................... 52
5.2.11 - General and Administrative Cost and R&D ............................................................ 53
5.2.12 - Adjustment to EBIT ................................................................................................ 54
5.2.13 - Explicit Period Value and Terminal Value ............................................................. 54
5.3 - R&D Pipeline Valuation .............................................................................................. 56
5.4 - Net Cash ....................................................................................................................... 58
5.5 - AztraZeneca Deal Valuation ........................................................................................ 58
5.6 - Target price and Recommendation .............................................................................. 60
5.7 - Sensitivity Analysis ...................................................................................................... 60
5.8 - Relative Valuation ........................................................................................................ 61
6 - Investment Bank Report Comparison......................................................................... 62
6
Bibliography References .................................................................................................... 65
Appendix.............................................................................................................................. 68
LIST OF FIGURES
Figure 1: Share Price Evolution ............................................................................................ 12
Figure 2: Advantages and Disadvantages of Relative Valuation ......................................... 30
Figure 3: SWOT Analysis .................................................................................................... 31
Figure 4:Sales by Therapeutic Area in 2015 ........................................................................ 32
Figure 5: Sales by Geography in 2015 ................................................................................. 32
Figure 6: Ratios and Key Metrics ......................................................................................... 33
Figure 7: Revenue Breakdown by Therapeutic Area ........................................................... 33
Figure 8: Cost Structure (% Sales) ...................................................................................... 34
Figure 9: Dermatology and Respiratory Revenues 2012-2015 ............................................ 36
Figure 10: Top Products by Revenue in 2015 ...................................................................... 37
Figure 11: R&D Pipeline ...................................................................................................... 38
Figure 12: Pharmaceutical Industry Annual Turnover ......................................................... 39
Figure 13: Dermatology Industry Annual Turnover............................................................. 40
Figure 14: Annual Inflation Rate .......................................................................................... 41
Figure 15: Real GDP Annual Growth Rate .......................................................................... 42
Figure 16: Average Euro/USD Exchange Rate .................................................................... 42
Figure 17: Country Default Spread ...................................................................................... 44
Figure 18: Weighted Average Country Default Spread ....................................................... 44
Figure 19: Bottom up Beta Peer Group ............................................................................... 45
Figure 20: Levered Beta ....................................................................................................... 45
Figure 21: Different Approaches and Respective Cost of Equity ........................................ 46
Figure 22: Cost of Equity ..................................................................................................... 46

7
Figure 23: Working Capital Ratios ....................................................................................... 47
Figure 24: Changes in Working Capital ............................................................................... 47
Figure 25: Amortization & Depreciation Projections ........................................................... 48
Figure 26: Capex Projections ............................................................................................... 48
Figure 27: Equity ratios Projections ..................................................................................... 48
Figure 28: Dividend Pyament Estimates .............................................................................. 49
Figure 29: Revenue Projections ............................................................................................ 49
Figure 30: Top Sellers’ Projections ...................................................................................... 50
Figure 31: Revenue Breakdown Projections ........................................................................ 51
Figure 32: Tax Credits and Deferred Taxes Projections ...................................................... 52
Figure 33: Weighted Average Corporate Tax Rate .............................................................. 52
Figure 34: Effective Tax Rate .............................................................................................. 53
Figure 35: Cost by Business Units ....................................................................................... 53
Figure 36: General & Administrative Costs, R&D and COGS ............................................ 53
Figure 37: EBIT and EBITDA Margins (Normal and Adjusted) ......................................... 54
Figure 38: Adjusted EBIT .................................................................................................... 54
Figure 39: Explicit Period Valuation .................................................................................... 55
Figure 40: Nominal and Real Growth rates in 2020 ............................................................. 55
Figure 41: Terminal growth Rate in 2020 ............................................................................ 56
Figure 42: Terminal Value ................................................................................................... 56
Figure 43: R&D Valuation ................................................................................................... 57
Figure 44: AztraZeneca Cost of Capital ............................................................................... 59
Figure 45: AztraZeneca Deal Income Valuation ................................................................. 59
Figure 46: Peer Group Multiples .......................................................................................... 61
Figure 47: Forward and Trailing Multiples Valuation ......................................................... 62
8
LIST OF FORMULAS
Formula I: WACC ................................................................................................................ 14
Formula II: Cost of Equity.................................................................................................... 14
Formula III: Pre Tax Cost of Debt ........................................................................................ 15
Formula IV: After Tax Cost of Debt .................................................................................... 15
Formula V: Cost of Equity Country Premium ...................................................................... 17
Formula VI: CAPM Regression ........................................................................................... 17
Formula VII: CAPM BETA ................................................................................................. 18
Formula VIII: Levered BETA .............................................................................................. 18
Formula IX: Levered BETA ................................................................................................. 18
Formula X: Levered BETA .................................................................................................. 18
Formula XI: Adjusted BETA ............................................................................................... 18
Formula XII: Economic Value Added .................................................................................. 19
Formula XIII: Return on Invested Capital ............................................................................ 19
Formula XIV: Economic Value Added Discounted Value .................................................. 20
Formula XV: Free Cash Flow to the Firm ............................................................................ 20
Formula XVI: Fair Enterprise Value ................................................................................... 21
Formula XVII: Market Entreprise Value.............................................................................. 21
Formula XVIII: Adjusted Present Value .............................................................................. 22
Formula XIX: Adjusted Present Value Discounted Cash Flows .......................................... 22
Formula XX:Value of Tax Shields ....................................................................................... 22
Formula XXI:Terminal Value .............................................................................................. 22
Formula XXII:Dividend Discount Model ............................................................................ 23
Formula XXIII:Dividend Discount Model ........................................................................... 23
Formula XXIV: Free Cash Flow to Equity .......................................................................... 24
Formula XXV:NPV of R&D Developing Medical Compound .......................................... 26

9
Formula XXVI: Market Model ............................................................................................. 26
GLOSSARY
ALM ALMIRALL
APV Adjusted Present Value
AZN AZTRAZENECA
B Beta
𝐵𝑑 Debt Beta
𝐵𝑖𝑚 Raw Beta
𝐵𝑙 Levered Beta
𝐵𝑢 Unlevered Beta
CAPEX Capital Expenditures
CDS Country Default Spread
CF Cash Flow
COGS Cost of Goods Sold
COPD Chronic Obstructive Pulmonary Disease
Cov Covariance
D Debt
DCF Discounted Cash Flow
DDM Dividend Discount Model
Dep & Amort Depreciation and Amortization
Derma Dermatology
Div Dividend
DPS Dividend Per Share
EBIT Earnings Before Interest and Tax
EBITDA Earnings Before Interest, Depreciation and Amortization
EPS Earnings Per Share
EV Enterprise Value
EVA Economic Value Added
FCFF Free Cash Flow to the Firm
FCFE Free Cash Flow to Equity
FV Fair Value
10
g Growth Rate
GDP Gross Domestic Product
Gen & Admin Costs General and Administrative Costs
GSK GlaxoSmithKline
I Invested Capital
IBEX Spanish Exchange Index
K Cost of Capital
𝐾𝑑 Cost of Debt
𝐾𝑒 Cost of Equity
𝐾𝑢 Cost of Equity Unlevered
Mk Market
Mk Cap Market Capitalization
M&A Mergers and Acquisitions
n Asset life
NOPLAT Net Operating Profit Less Adjusted Taxes
NPV Net Present Value
NWC Net Working Capital
P/E Price to Earnings
PBV Price to Book Value
PPE Property, Plant and Equipment
PV Present Value
R&D Research and Development
𝑅𝑖 Firm Stock Return
𝑅𝑓 Risk Free Rate
𝑅𝑚 Market Return
ROA Return on Assets
ROE Return on Equity
S&P Standard & Poor’s
T Tax Rate
TV Terminal Value
t Number of Time Periods
USD United States dollars
𝑉𝑢 Present Value of Unlevered Firm

11
𝑉𝑇𝑆 Present Value of Interest Tax Shield
WACC Weighted Average Cost of Capital
σ Standard Deviation

12
1 - INTRODUCTION
This dissertation intends to determine a realistic approximation to the fair value of ALM SA
and compare it with the current market price of 4 of January and make a recommendation to
either buy sell or hold the stock.
FIGURE 1: SHARE PRICE EVOLUTION
ALM Stock price has increased substantially over the last years, due to the company
strategy’s redirection and M&A activity. The purpose of this dissertation is to analyse if
ALM’s current price of 18.4 correctly accesses its’ fair value. I based my analysis on
fundamental research and perspectives for the short and long run for the pharmaceutical sector
and the company. Furthermore, this dissertation establishes a market value to the R&D
activity that ALM is undergoing.
The key question this dissertation aims to answer is the following:
Is the current market price correctly valuing ALM’s current business, R&D activities and the
potential of the recent transactions?
To answer this question, I started by reviewing the relevant academic literature.

13
2 - REVIEW OF RELEVANT LITERATURE
This section purpose is to present an overview of the state-of-the-art methods, which are
usually used when performing a company firm valuation.
Firm valuation is widely used in the finance realm, it is used to test market efficiency, to
determine corporate strategy decisions and as a tool in investment and capital budgeting
decisions. (Damodaran, 2002)
In this literature review, I explained in detail different methods and the advantages and
disadvantages associated with each of them, I focused on methods which may be used for
ALM’s Valuation.
As stated in All Roads Lead to Rome “we are fast approaching the point of valuation
overload” (Holt, et al., 1999), in line with this citation, there is a need to clarify and explain
the methodologies that are considered the most up to date and correct approaches of valuation
available. The key theoretical assumption of firm valuation is that even though different
methods are complex and use different data, the valuation result should be equivalent (Holt, et
al., 1999).
Damodaran argues there are four broad approaches to valuation (Damodaran, 2006). The first
and most commonly accepted is the discounted cash-flow approach, it determines the fair
value of an asset by considering the cash that it will generate throughout its life-time
discounted to the present. A second method, the liquidation or accounting valuation, assesses
the value of firms taken into account the book value of its assets. A third approach, relative
valuation, which is a fairly popular method, relies on multiples and uses benchmarking based
on an adequate group of peers. The fourth approach, contingent claim valuation, is performed
when assets display option like characteristics and therefore are valued with option pricing
(Damodaran, 2006).
While Damodaran considers there are four broad approaches to valuation (Fernández, 2015),
Fernández argues there are six. The two additional methods purposed by Fernández are the
goodwill base method and value creation method. Goodwill accounts for the company’s
intangible assets which usually are not reflected in the book value but can be an essential
advantage in many industries, those hard to measure intangibles assets can be brands,
strategic alliances, costumer portfolio, etc.

14
2.1 - COST OF CAPITAL
2.1.1 - WEIGHTED AVERAGE COST OF CAPITAL
The WACC method is suitable to value simple and stable capital structures and it is used to
discount cash-flows that an asset will generate. The method consists in calculating a discount
rate that accounts for the value created, or not, by the financing structure of the company. Due
to this fact, the WACC commonly needs to be adjusted to include tax shields, subsidies,
hedges, different types of debt securities, issue costs and changing capital structures
(Luehrman, 1997).
FORMULA I:
𝑊𝐴𝐶𝐶 =𝐷
𝐷 + 𝐸× 𝐾𝑑 × (1 − 𝑇) +
𝐸
𝐷 + 𝐸× 𝐾𝑒
The WACC is expected to reflect the business risk adjusted to the capital structure, normally
it is calculated by multiplying the after tax cost of debt and cost of equity by the respective
weights in the capital structure. Other inputs may be included if applicable and different
adjustments should be applied in case we are dealing with complex capital structures
(Luehrman, 1997). To determine debt weight in the capital structure, generally it is assumed
the company has a target capital structure (Damodaran, 2002). On other occasions when the
debt level is expected to change, readjustments to the WACC are needed (Fernandéz, 1997).
2.1.2 - COST OF EQUITY
The cost of equity is the expected return on equity demanded by investors and it is calculated
by adding a premium, which is the market risk premium adjusted for the company
sensitiveness to the market risk, to the riskless rate (Damodaran, 2002).
FORMULA II:
𝐾𝑒 = 𝑅𝑓 + 𝛽 × 𝑀𝑘𝑝𝑟𝑒𝑚𝑖𝑢𝑚
The Βeta is a measure of company risk, it includes systematic risk and risk deriving from the
firm’s capital structure (Damodaran, 2002).

15
The cost of equity can be levered or unlevered, representing the overall risk of the firm or just
the assets risk without the effect of leverage, respectively (Damodaran, 2002).
2.1.3 - COST OF DEBT
The cost of debt is the return expected by the firm’s debtholders and it is calculated by adding
a spread on the risk-free rate based on the default risk (Damodaran, 2002).
Rating agencies often rate public companies and determine a spread based on that rating that
rating. Alternatively, the cost of debt can be calculated by the available yield to maturity if the
company has publicly traded bonds or by a synthetic rating based on the interest coverage
ratio of the company (Damodaran, 2002).
FORMULA III:
𝐾𝑑 = 𝑅𝑓 + 𝑠𝑝𝑟𝑒𝑎𝑑
After we determine the pre-tax cost of debt we adjust for the tax benefits of debt.
FORMULA IV:
𝐴𝑓𝑡𝑒𝑟 − 𝑡𝑎𝑥 𝑐𝑜𝑠𝑡 𝑜𝑓 𝑑𝑒𝑏𝑡 = 𝐾𝑑 × (1 − 𝑇)
The underlying assumption on the after-tax cost of debt is that interest is tax deductible, Thus
increasing leverage will lower the amount paid in taxes and maximize the firm’s value up
until a certain point, when bankruptcy costs and other adverse effects start to outweigh debt’s
benefits (Damodaran, 2002).
2.1.4 - TAX RATE
When determining which tax rate to use in valuation, there are arguments in favour of using
either the effective or the corporate marginal tax rate (Damodaran, 2002). Both figures usually
show some discrepancies, mainly due to deferring taxes, use of different accounting standards
for reporting and tax purposes and tax credits (Damodaran, 2002). Damodaran argues that
because none of the reasons that explain the difference between effective and marginal tax
rates are usually sustainable in the long run, effective tax rate should converge to corporate
16
marginal tax rate, and in the long run, marginal tax rate is the most robust assumption. Still,
Damodaran suggests that when estimating cash flows, one can use the effective tax rate in the
first years and use the marginal tax rate in subsequent years and terminal value (Damodaran,
2002).
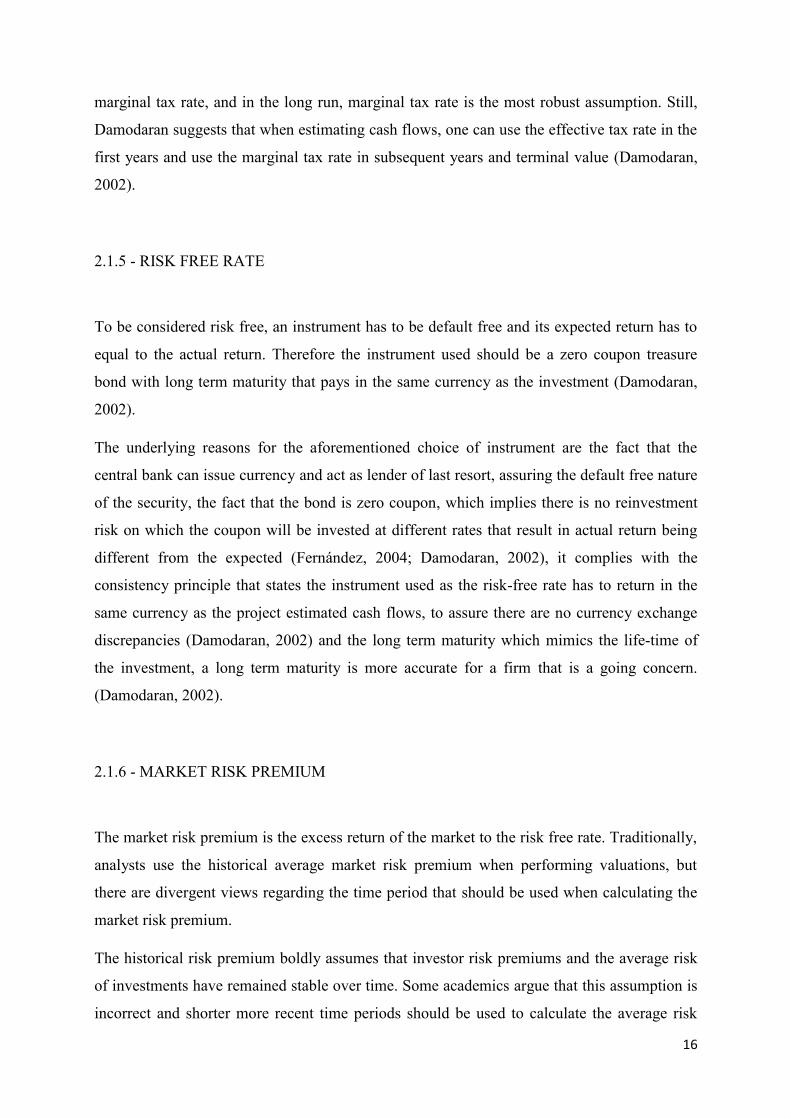
2.1.5 - RISK FREE RATE
To be considered risk free, an instrument has to be default free and its expected return has to
equal to the actual return. Therefore the instrument used should be a zero coupon treasure
bond with long term maturity that pays in the same currency as the investment (Damodaran,
2002).
The underlying reasons for the aforementioned choice of instrument are the fact that the
central bank can issue currency and act as lender of last resort, assuring the default free nature
of the security, the fact that the bond is zero coupon, which implies there is no reinvestment
risk on which the coupon will be invested at different rates that result in actual return being
different from the expected (Fernández, 2004; Damodaran, 2002), it complies with the
consistency principle that states the instrument used as the risk-free rate has to return in the
same currency as the project estimated cash flows, to assure there are no currency exchange
discrepancies (Damodaran, 2002) and the long term maturity which mimics the life-time of
the investment, a long term maturity is more accurate for a firm that is a going concern.
(Damodaran, 2002).
2.1.6 - MARKET RISK PREMIUM
The market risk premium is the excess return of the market to the risk free rate. Traditionally,
analysts use the historical average market risk premium when performing valuations, but
there are divergent views regarding the time period that should be used when calculating the
market risk premium.
The historical risk premium boldly assumes that investor risk premiums and the average risk
of investments have remained stable over time. Some academics argue that this assumption is
incorrect and shorter more recent time periods should be used to calculate the average risk
17
premium. Although recent time periods seem more appropriate to measure market risk,
academics argue that shorter periods of time exhibit higher errors (Damodaran, 2002;
Damodaran, 2011; Fernández, 2004). Concluding, there is no consensus on which risk
premium to use, the historical average or the average of a recent period.
2.1.7 - COUNTRY SPECIFIC RISK
When considering valuation of non-US companies, one has to take into account the country
specific risk. Some consider country risk as diversifiable, that developed and emerging
markets share similar risks (Goedhart & Haden, 2003) and historical Beta already includes
country risk premium.
Fernández lists those aforementioned arguments in the list of 80 common errors in company
valuation (Fernández, 2004) and argues along with other academics that country risk is non-
diversifiable (Damodaran, 2002), implying that investors tend to be biased against different
markets, therefore there is a country specific risk.
A simply way to measure this country risk premium is to use the rating provided by agencies
such as Moody’s and S&P and their respective default spread (James & Koller, 2000), this
spread is added to the cost of equity (Damodaran, 2002; Damodaran, 2011).
FORMULA V:
𝐾𝑒 = 𝑅𝑓 + 𝛽 × 𝑀𝑘𝑅𝑖𝑠𝑘 𝑝𝑟𝑒𝑚𝑖𝑢𝑚 + 𝐶𝐷𝑆
2.1.8 - ΒETA
According to the CAPM, to determine the Beta of the company one must regress its stock
return against the market return. The Beta will be the slope of the regression and it will
represent the sensitiveness of the stock price to market variations (Fama & French, 2004).
FORMULA VI:
𝐸(𝑅𝑖) = 𝐸(𝑅𝑓) + [𝐸(𝑅𝑀) − 𝐸(𝑅𝑓)] × 𝛽𝑖𝑀

18
FORMULA VII:
𝛽𝑖𝑚 =𝑐𝑜𝑣(𝑅𝑖, 𝑅𝑚)
𝜎2(𝑅𝑚)
Formula VI regression allows us to obtain the raw βeta of a company.
The Raw Beta tends to be an accurate risk measure when valuing a widely traded firm, but for
private firms, public firms that have low trading volume, companies that have undergone
leverage changes or acquired new business recently using the bottom-up Beta is a better
approach (Damodaran, 2002).
To determine the bottom-up Beta to use in valuation, we should gather an adequate peer
group, composed of similar companies in terms of market capitalization, industry, size and
geography (Damodaran, 2002).
We should calculate for each of those peers, the unlevered Beta.
FORMULA VIII:
𝛽𝑙 = 𝛽𝑢 + (𝛽𝑢 − 𝛽𝑑) × (1 − 𝑇) ×𝐷
𝐸
Generally there is the assumption that 𝛽𝑑 = 0 and the formula is simplified as in formula IX.
FORMULA IX:
𝛽𝑙 = 𝛽𝑢 × (1 + (1 − 𝑇) ×𝐷
𝐸)
Fernández list the use of the formula IX in every cases as one of 80 common mistakes in
valuation, suggesting the framework in formula if leverage is expected to increase.
FORMULA X:
𝛽𝑙 = 𝛽𝑢 + (𝛽𝑢 − 𝛽𝑑) ×(𝐷 − 𝑉𝑡𝑠)
𝐸
The Beta of the company tends to approximate the market average of 1 in the long run.
Damodaran suggest adjusting the Beta as in formula XI (Damodaran, 2002).
FORMULA XI:
𝐴𝑑𝑗𝑢𝑠𝑡𝑒𝑑 𝐵𝑒𝑡𝑎 = 𝑅𝑎𝑤 𝐵𝑒𝑡𝑎 × (0.67) + 1.00 × (0.33)
19
The unlevered Beta measures the business risk of the company. The unlevered Beta differs
from the levered Beta due to only taking into account the systematic risk relative to the
market, excluding the risk of financial leverage (Damodaran, 2002). Once the unlevered Beta
of each peer is obtained, a simple or Mk Cap weighted average is calculated and that average
will correspond to the unlevered beta of the company we aim to value (Damodaran, 2002).
The unlevered Beta is then levered considering the capital structure of the company
(Damodaran, 2002).
2.2 - ECONOMIC VALUE ADDED
EVA is the surplus value generated by an investment, in essence the excess return to the cost
of capital deployed on an investment.
FORMULA XII:
𝐸𝑉𝐴 = (𝑅𝑂𝐼𝐶 − 𝐾) × 𝐼
To calculate the EVA, there are three basic inputs, the capital invested, the return on invested
capital and the cost of capital.
The best estimate for invested capital should be the assets book value (Damodaran, 2002).
While to estimate the ROIC we use the net operating profit less adjusted taxes (NOPLAT)
over the invested capital, the cost of capital should be the average cost of capital according to
the capital structure, the WACC.
FORMULA XIII:
𝑅𝑂𝐼𝐶 =𝑁𝑂𝑃𝐿𝐴𝑇
𝐼
According to Damodaran, to estimate the NOPLAT, tax adjustments should be subtracted to
the operating profit or EBIT (Damodaran, 2002), additionally, the operating profit should be
adjusted for operating leases, R&D expenses and non-recurrent events.
To determine the EV using the EVA approach one has to sum the value added each year
during the life-time of the project.

20
FORMULA XIV:
𝐸𝑉 = ∑𝐸𝑉𝐴
(1 + 𝑘)𝑡
𝑡=𝑛
𝑡=1
2.3 - DISCOUNTED CASH FLOW
The DCF approaches are widely used and considered the most theoretically sound. The
underlying logic behind DCF is that the fair value of a firm is the cash that the firm is able to
generate throughout its life-time discounted to the present at an adequate rate that reflects the
risk of the firm’s cash-flows. (Damodaran, 2006).
The DCF approach uses the financial statements as its base and forecasts the income and
cash-flow statement in order to calculate the future cash-flows of the firm (Luehrman, 1997).
When performing valuation in some R&D intensive industries, like the pharmaceutical
industry, immediately expensing R&D might have a distortionary effect on earnings and cash-
flows, which can be adjusted by capitalizing R&D expenses. The amortizable life of the R&D
investment is the number of years it takes for the research subject to become a product
(Damodaran, 2002; Keegan, 2008). If the EBIT is adjusted in this fashion, the distortion that
heavy R&D effects create on operating income in a given year is mitigated between the years
of the investment amortizable life.
2.3.1 - FREE CASH FLOW TO THE FIRM
The free-cash-flow to the firm or FCFF values the EV as whole. FCFF excludes cash-flow
deriving from financing activities of the company such as interest or dividends (Damodaran,
2002) and focus only on cash generated by operations. The capital structure is then reflected
in the discount rate, the WACC.
FORMULA XV:
𝐹𝐶𝐹𝐹 = 𝑁𝑂𝑃𝐿𝐴𝑇 − 𝛥𝑁𝑊𝐶 − 𝐶𝐴𝑃𝐸𝑋 + 𝐷𝑒𝑝 & 𝐴𝑚𝑜𝑟𝑡

21
To obtain the FCF, one should adjust the operating income for taxes obtaining the NOPLAT,
additionally, depreciation and amortization is added because it is non-cash expense, net
working capital increases which account for cash tied up in working capital are subtracted
along with capital expenses (Damodaran, 2002).
The EV is the sum of free cash-flows generated from the operating and investing activities for
the firm’s lifespan discounted at the WACC.
FORMULA XVI:
𝐸𝑉 = ∑𝐹𝐶𝐹𝐹𝑡
(1 + 𝑊𝐴𝐶𝐶)𝑡
𝑁
𝑡=1
After determining the EV, one should make further adjustments to obtain the market value of
equity. Minority interest and net debt should be subtracted to the EV (Damodaran, 2002).
FORMULA XVII:
𝐸𝑛𝑡𝑒𝑟𝑝𝑟𝑖𝑠𝑒 𝑉𝑎𝑙𝑢𝑒 = 𝑀𝑘 𝐶𝑎𝑝 + 𝐷𝑒𝑏𝑡 − 𝐸𝑥 𝑐𝑎𝑠ℎ + 𝑀𝑖𝑛 𝐼𝑛𝑡𝑒𝑟𝑒𝑠𝑡 + 𝑃𝑟𝑒𝑓 𝑆ℎ𝑎𝑟𝑒𝑠
Once the market value of equity is calculated, it should be divided by the number of shares
outstanding to obtain the fair value per share, the theoretical share price.
2.4.2 - ADJUSTED PRESENT VALUE
Although the FCFF method is a theoretical sound approach, some academics consider the
APV a better method (Luehrman, 1997). Luehrman argues that analysts should use APV
instead of the FCFF due to the fact that APV is always applicable when the FCFF is, it
requires less strict assumptions, it is subject to less errors and is more complete as a valuation
tool as it shows where the value of the company is created, either from the firms operations or
from financial engineering.
Unlike the FCFF method that forecasts cash-flows and discounts them at the WACC, APV
values the financial structure advantages or disadvantages separately and then adds them to
the value that results from operations (Luehrman, 1997; Fernández, 2004).

22
FORMULA XVIII:
𝐴𝑃𝑉 = 𝑉𝑢 + 𝑉𝑇𝑆 − 𝐵𝑢𝑛𝑘𝑟𝑢𝑝𝑐𝑦 𝑐𝑜𝑠𝑡𝑠 + ℎ𝑒𝑑𝑔𝑒𝑠 + 𝑠𝑢𝑏𝑠𝑖𝑑𝑖𝑒𝑠 − 𝑖𝑠𝑠𝑢𝑒 𝑐𝑜𝑠𝑡𝑠 − 𝑜𝑡ℎ𝑒𝑟 𝑐𝑜𝑠𝑡𝑠
The APV uses the unlevered cost of equity as the discount rate and it is especially useful
when the firm´s financial leverage is expected to change over time because the discount rate
doesn’t need readjustments, changing instead the value of the tax shields (Damodaran, 2002).
FORMULA XIX:
𝐸𝑉 = ∑𝐹𝐶𝐹𝐹𝑡
(1 + 𝐾𝑢)𝑡+ ∑
𝐼𝑇𝑆
(1 + 𝐾𝑢)𝑡
𝑁
𝑡=1
𝑁
𝑡=1
According to Fernández, to determine the terminal value for companies that maintain a
constant book value leverage ratio, the terminal value of tax Shields should be calculated
using formula XX (Fernández, 2007)
FORMULA XX:
𝑉𝑇𝑆 =𝐷 × 𝐾𝑢 × 𝑇
𝐾𝑢 − 𝑔
For alternative financing strategies such as keeping a constant market value of debt ratio, on
which the company’s debt grows with the market value of equity, one should use the Miles-
Ezzel formulation present in formula XXI, which assumes that the appropriate discount rate
for the increase in debt is the risk free rate (Fernández, 2007)
FORMULA XXI:
𝑉𝑇𝑆 =𝐷 × 𝑅𝑓 × 𝑇
𝐾𝑢 − 𝑔×
(1 + 𝐾𝑢)
(1 + 𝑅𝑓)
2.4.3 - TERMINAL VALUE
When the firm is a going concern, one has to determine the terminal value of the company
after an explicit period of cash-flow estimation. There are three ways of calculating the TV,

23
assuming that the TV is the book value of the company’s assets if liquidated at the end of the
explicit period, applying a multiple in the terminal year or assuming that cash flows grow at a
constant rate from the terminal year onwards (Damodaran, 2002).
FORMULA XXII:
𝑇𝑉𝑡 =𝐶𝐹𝑡+1
𝐾 − 𝑔𝑠𝑡𝑎𝑏𝑙𝑒
In the terminal year at a stable growth rate, capital expenditures should offset depreciations,
essentially the company reinvests to replace existing assets. Furthermore, the estimated
terminal growth rate has to be a reasonable figure relative to the nominal growth rate of the
economy where the firm operates, as a rule of thumb, it shouldn’t exceed the GDP growth rate
by more than 2% (Damodaran, 2002). Additionally firms with excess returns can´t maintain
them forever, therefore in the long run excess returns should equal the cost of capital.
2.5 - EQUITY CASH-FLOW METHODS
2.5.1 - DIVIDEND DISCOUNT MODEL
The DDM is an equity valuation model that is based on valuing the firm’s equity as the
dividend per share paid to shareholders during the firm’s lifespan (Farrell, Jr., 2010). Farrell
Jr. argues that analogous to the price of a bond, the price of a stock should be the stream of
dividend payments entitled to the shareholders during the life-time of the company. The DDM
model assumes the company is a going concern and dividends are discounted at a cost of
equity, the required rate of return for equity investors (Damodaran, 2002), additionally there
is a dividend growth rate, which is expected to keep constant and grow at the same rate as the
other key performance metrics. Formula XIII is generally referred to as Gordon’s growth
model.
FORMULA XXIII:
𝐸𝑞𝑢𝑖𝑡𝑦 𝑉𝑎𝑙𝑢𝑒 = 𝐷𝑃𝑆
𝐾𝑒 − 𝑔
There are two basic inputs in the model, the expected dividend per share and the ke. To obtain
the expected dividend per share, one must make projections and assumptions on the company

24
earnings and pay-out-ratio (Damodaran, 2002). The cost of equity is the required rate of
return required by shareholders, which is essentially the compensation that investors require
for forgoing saving or consuming, it is composed by the risk free rate and a market risk
premium that includes interest rate risk, purchasing power risk, business risk and financial
risk (Farrell, Jr., 2010).
2.5.2 - FREE CASH-FLOW TO EQUITY
The FCFE is an equity valuation model and a derivation of the DDM, it assumes the cash-
flow left after the firm faces its financial obligations is paid as dividends and the expected
growth rate includes only the increase in income from operating assets and not income
streaming from marketable securities and other financial results (Damodaran, 2006).
Compared to FCFF, FCFE uses the net income as its base instead of NOPLAT. Interest
related expenses are relevant because debt holders have seniority claims compared to
shareholders (Damodaran, 2002). FCFE accounts for the cash-flows that are left after
investing into net working capital needs, CAPEX, facing all financial obligations and
borrowing and re-paying principal payments on debt. (Damodaran, 2002).
FORMULA XXIV:
𝐹𝐶𝐹𝐸 = 𝑁𝑒𝑡 𝐼𝑛𝑐𝑜𝑚𝑒 − 𝐶𝑎𝑝𝑒𝑥 + 𝐷𝑒𝑝 & 𝐴𝑚𝑜𝑟𝑡 − 𝛥𝑁𝑊𝐶 + 𝑁𝑒𝑡 𝐵𝑜𝑟𝑟𝑜𝑤𝑖𝑛𝑔
FCFE models value the equity stake of the business as the perpetual cash flows entitled to the
shareholders discounted at the levered cost of equity (Damodaran, 2006).
2.6 - VALUATION OF PHARMACEUTICAL COMPANIES
Due to the nature of pharmaceutical companies’ business models, which imply an initial cash
burn for a promise of future revenue streams from successfully developed drugs, performing
firm valuation can prove a challenging task where traditional DCF approaches might not be
the best approach (Keegan, 2008).

25
2.6.1 - THE NPV OF R&D PIPELINE
To value a portfolio of R&D projects currently under development and that are subject to
approval by legal entities, analysts and experts tend to adjust the NPV by attributing
cumulative probabilities of success according to the phase of R&D development that the drug
is in (Keegan, 2008).
Keegan argues that in order to estimate probabilities of a developing drug making it
successfully to market, one has to know the R&D process in drug development, (Keegan,
2008). A process that encompasses two broader phases, drug discover and research and the
regulatory process.
Drug discovery and research starts with the pre-clinical stage where the drug is tested in
animals. The pre-clinical stage is considerably cheaper than latter stages and the chances of a
developing drug reaching the market at this stage is less than 10% (Keegan, 2008). After the
pre-clinical phase, there are four stages of clinical trials. Stage I accesses drug safety, the
probability of successfully progressing to the next stage is 70%, it may last several months
and it accounts for approximately 10% of R&D spending (Keegan, 2008). Stage II tests the
dose range and efficiency of the drug and it is considered the proof of concept stage, it may
last up two years, around 50% of drug candidates in this phase pass to stage III and it
averages 25% of total R&D spending. Stage III is the last stage before the drug is launched to
market and therefore tests the efficacy relative to other treatments or placebos in large scale
trials, it accounts for 35% of R&D expenses, the probability of successfully passing stage III
is 60% and it may last from 2 to 5 years. Phase IV occurs after the product is already in the
market and it acts as a surveillance test (Keegan, 2008).
After the first three research trials are complete, the drug is subjected to regulatory approval,
the regulators will weigh the benefits and risks of the drug candidate. Around 90% of
proposed drugs are approved by regulators.
As mentioned previously, conventional valuation methods are not the most reliable when
dealing with pharmaceutical companies, especially in what concerns the value of its
intangible assets, the drugs under development which are generally called the R&D pipeline.

26
The best estimation possible to compute the NPV of a pipeline is to do a sum of the parts
valuation by adding the different projects NPV’s to obtain the R&D pipeline value (Keegan,
2008).
To calculate the probability weighted NPV of an R&D project, aside from a probability,
Keegan suggests we must estimate peak sales some years after the drug is launched in the
market and an associated profitability rate to estimate peak earnings, revenue increments
could either be by direct sales or royalty payments (Keegan, 2008). Once peak earnings are
estimated, a multiple should be applied to the success probability weighted estimated peak
earnings and that value should be discounted to the current year. Adding the NPVs of the
different development assets results in the probability weighted NPV of the total R&D
portfolio.
FORMULA XXV:
𝑁𝑃𝑉 = −𝐼0 + ∑𝐶𝐹𝑡
(1 + 𝑖)𝑡× 𝑆𝑢𝑐𝑒𝑠𝑠 𝑃𝑟𝑜𝑏𝑎𝑏𝑖𝑙𝑖𝑡𝑦
𝑛
𝑡
The success probability is a cumulative success probability, based on the probability of
successfully passing the successive stages. If we can successfully identify the cost in each
stage, it is possible to build a decision tree a decision tree based model with the NPV at each
decision node (Keegan, 2008).
In order to estimate the market size for a potential drug, we should build a market model
based on the incidence of the disease treated, treatable population, market penetration and
annual cost per patient (Keegan, 2008).
FORMULA XXVI:
𝐴𝑑𝑟𝑒𝑠𝑠 𝑀𝑘 𝑆𝑖𝑧𝑒 = 𝑇𝑟𝑒𝑎𝑡 𝑃𝑜𝑝 × 𝐸𝑠𝑡𝑖𝑚 𝑀𝑘 𝑃𝑒𝑛𝑒𝑡𝑟𝑎𝑡𝑖𝑜𝑛 × 𝐶𝑜𝑠𝑡 𝑝𝑒𝑟 𝑃𝑎𝑡𝑖𝑒𝑛𝑡
There are some aspects to have in mind when valuing a product pipeline, for instance, when
calculating the incidence or prevalence of a disease one should rely on scientific
epidemiological data, additionally to accurately estimate the cost of drug per patient one
should compare with similar drug prices on the market.
Official entities provide estimate for US and European drug prices, drugs in Europe tend to
sell at a discount compared to the US. Once a price is established, one must know the

27
theoretical number of doses per treatment or treatment period, thereafter it is possible to
estimate the annual cost per patient.
Once we obtain a Market size figure we should analyse global sales forecasts by research
entities to reality check our own estimates (Keegan, 2008).
2.6.2 - OPTION VALUATION
In investment analysis, the decision to undertake a project depends on the project having a
positive NPV. This traditional approach to finance is somewhat limited when its valuing
projects that have an option like nature, mainly the option to delay the project (Damodaran,
2002).
The underlying reason for delaying a project is the CF’s volatility, an investment with a
current negative NPV might have a positive NPV in the future. Real option valuation assumes
a time premium that can exceed the value of cash-flows of the following periods even after
the NPV is positive, thus making it viable to delay the project to obtain higher valuations
(Damodaran, 2002). Existence of exclusive rights to the project is a key assumption real
option valuation.
According to Damodaran, there are three general cases where a real option valuation method
is applicable, which are natural resources firms that have undeveloped reserves and can chose
to explore them at any time, normally when the natural resource price is higher, real estate
firms that own undeveloped land and may choose to develop it when appropriate and
companies that own patented products with exclusivity legal rights (Damodaran, 2002).
A call option on an underlying asset is the possibility of buying a certain asset at a strike price
for a certain period of time. To value a call option, the methods used are the binomial model
and Black-Scholes model. The binomial model values American options which feature an
early exercise possibility, at each node of the binomial tree the option can be exercised.
The Black-Scholes model has stricter assumptions regarding options exercise, it considers all
options are European and can only be exercised at maturity (Hull, 2012). Real Options are
mostly American options as the projects can be initiated at any given time until the exclusive
rights expires.

28
The Inputs used while performing an option valuation are the underlying asset, the strike
price, the maturity, the variance and the riskless rate.
The underlying asset in a security call option is the security itself, while in real option, it is the
PV of the CFs streaming from the project (Hull, 2012; Damodaran, 2002).
The strike price in the case of a call option is the pre-agreed contractual price on which we
can buy the security (Hull, 2012), in the case of real option valuation, it will be the initial
investment to start the project (Damodaran, 2002).
The variance on a call option represents the expected movements in the price of the security
(Hull, 2012), in real options the variance in the value of the project relates to the uncertainty
involved in present value of the cash-flows that the project generates, it generally can be
computed in one of three ways: one may use the variance of past similar projects that the
company invested in, estimate probability for various market scenarios and compute the
present value under each of the scenarios calculating the variance across those present values
or use the variance in the value of firms in the sector as the estimate of variance in value of
the project (Damodaran, 2002). The variance is the input, which has the most influence in the
option’s value (Hull, 2012).
The lifetime of call option is the time until the option expires, in real options that is the
number of years the company has until the exclusive rights expire (Damodaran, 2002).
The 𝑅𝑓 should be the zero-coupon Treasury bond rate with a maturity corresponding to the
expiration date of the option (Damodaran, 2002).
Although real option valuation is a theoretical sound approach, it is hard to apply in most
practical cases. Among some of the limitations, keegan mentions that corporate investments
are complex, lognormal distributed project values are hard to apply, hard to understand option
valuation models and the difficulty of measuring the volatility of the market (Keegan, 2008).
3 - RELATIVE VALUATION
Relative valuation is usually achieved by benchmarking through the use of multiples, which
are widely used and relied upon by analysts and financial institutions alike (Henschke &

29
Homburg, 2009). Multiples can be of various sorts, earnings, revenue, book value and even
industry-specific multiples.
According to Damodaran, there are three basic steps in relative valuation (Damodaran, 2002).
The first is to find comparable assets priced by the market, analysts tend to choose companies
in the same sector as comparable. The second step is to scale the market prices to a common
variable to standardize prices and make them comparable, in firm valuation this is done by
calculating the market value of equity or EV by multiples of earnings, book value or revenue.
The last step is to adjust for the differences across the assets, their intrinsic characteristics,
this requires understanding of how fundamentals influence the multiples values (Damodaran,
2006). The standardization of the values of similar firms is done by making them relative to a
common variable, such variables are earnings, EBITDA or sales, thus common multiples used
in valuation are P/E or EV/EBITDA.
Academic literature focus on the importance of using forward looking multiples instead of
trailing multiples, using forecasts rather than historical data is a more accurate estimate and
value predictor (Damodaran, 2006; Goedhart & Haden, 2003; Henschke & Homburg, 2009).
Some multiples can be more adequate than others, for instance, while book value multiples
such as PBV differ greatly across industries, EV/EBITDA multiples are more widely
applicable. The EV/EBITDA multiple has a critical advantage; it excludes the distorting
effect of financing structure in the analyses (Damodaran, 2002; Goedhart & Haden, 2003).
Sector-specific multiples are useful for sectors that are hard to value by conventional
multiples but they carry some disadvantages, those multiples tend to undervalue or overvalue
companies and are harder to relate to fundamental analysis. (Damodaran, 2006). In some
sectors such as biotechnology and pharmaceuticals, heavy R&D expenditure only generate
increments in revenues and earnings in future years, thus a company can incur losses early on,
on these cases, appropriate metrics to use as multiples inputs are the amount spent in R&D
and number of employees working for the company (Keegan, 2008)
When performing relative valuation on a company, the multiple used is an average of a group
of adequate peers, operating in the same industries, with similar size, similar ROIC and
growth rates (Goedhart, Koller and wessels, 2005). High growth and higher ROIC companies
tend to have higher earning and price to book value multiples (Damodaran, 2006; Schreiner &
Spremann, 2007).

30
Relative Valuation alongside DCF are the mainstream approaches to valuation nowadays
(Henschke & Homburg, 2009; Damodaran, 2006), although both have significant different
implications. DCF establish the fair value as the cash the assets will generate throughout its’
lifetime, while when using multiples one free-rides on market information assuming that the
value of the company is what the market is willing to pay at the time, which can over or
undervalue a company according to market momentum, figure 2 presents advantages and
disadvantages of relative valuation.
FIGURE 2: ADVANTAGES AND DISADVANTAGES OF RELATIVE VALUATION
Advantadges Disadvantadges
Simple to use. Comparability is subjective.
Useful when there are large
numbers of comparable firms.
Mirrors market errors such as
under or overvaluation.
Easy to understand. Lack of fundamental analyisis.
Useful to reality check other
valuation methods. Lack of firm specific factors.
Widely used Hard to find suitable peers.
Susceptibility to analyst bias.
An important aspect of relative valuation is the existence of outliers, firms that trade at
exceptional high or low values due to many possible reasons. Outliers in a group of peers can
distort the value of the multiple if calculated by an average, In these cases, the peer group
median is a more appropriate measure of the multiple to use in valuation (Damodaran, 2002).
4 - COMPANY AND INDUSTRY OVERVIEW
4.1 - ALMIRALL’S HISTORY
ALM is a specialty pharmaceutical company located in Barcelona, Spain. The company was
founded in 1943 and has been a pioneer in Spain’s pharmaceutical industry ever since, ALM
has started its own research and development process in the 60’s and by 1987 it reached the
status of market leader in Spain. The company has expanded its physical presence to other
countries gradually, through acquisitions or creation of affiliates. Throughout its history ALM

31
has made substantial investment in chemical plants and research and development centers. In
2007, ALM becomes listed in the IBEX and the company has launched blockbuster products
such as Eklira®, an inhaler for COPD.
Since 2013, the firm has become an active player in acquisitions mainly dermatology related
and has disposed the respiratory franchise in a transaction with AZN.
Currently ALM’s products are available in more than 70 countries and the company has a
physical presence in 14. Most of its sales are in European markets mainly in Spain, its
domestic market, even tough, recently ALM has focused its efforts in establishing a stronger
presence in the US.
4.2 - SWOT ANALYSIS OPERATING METRICS, BUSINESS AND GEOGRAPHIC
PRESENCE
Figure 3 presents a SWOT analysis, identifying the main strengths, weakness, opportunities
and threats ALM is facing. The SWOT is mainly related with the focus on dermatology, the
acquisition based strategy, the transaction with AZN and the strong financial position of the
company.
FIGURE 3: SWOT ANALYSIS
As seen in figure 5, Europe and Spain account for roughly than 67% of total revenues, while
North America represents roughly 25%, a figure that has increased recently driven by ALM’s
strategic goal of becoming a key dermatology player in the US. For values table see Appendix
XIX.
Strengths WeaknessFocus on Dermatology Mature products decliningFinancial situation Limited opportunities in R&D pipelineStrong R&D track record Recent Acquistions risk
Opportunities ThreatsUpcoming M&A activity Price pressure in the USSynergies from concluded deals Dependence of AstraZeneca in common projectsGeographical expansion Patent Cliff and regulation changes

32
FIGURE 4:SALES BY THERAPEUTIC AREA IN 2015
ALM’s product Portfolio is focused on dermatology, which accounts for 43% of Sales in
2015, in line with the company overall strategy of becoming a dermatology player.
Respiratory agents once the main therapeutic area, now accounts for only 15% of the
company sales, declining 50% from previous years due to recent divestment. Gastro and
metabolism accounts for around 16% of sales in 2015, although its weight has been declining
steadily it is still an important therapeutic area for the company strategy. For values table see
Appendix XIII.
FIGURE 5: SALES BY GEOGRAPHY IN 2015
Figure 6 displays some key rations and metrics. The years 2013 and 2014 have been affected
by the recent transactions.

33
FIGURE 6: RATIOS AND KEY METRICS
The EBIT margin and net margin were exceptionally high due to other income relative to the
transaction with AZN. Alternatively, net margins were negative in 2013 due to the acquisition
of Aqua pharmaceuticals, which resulted in high restructuring costs.
Gross margin is calculated over sales, while operating and net margin over total revenue
which includes other income from royalties, joint development and marketing agreements and
from previous transactions.
FIGURE 7: REVENUE BREAKDOWN BY THERAPEUTIC AREA
The change in focus to dermatology is visible in figure 7, ALM has increased its dermatology
sales gaining a foothold in the US market, the US dermatology accounted for 22% of the
company sales in 2015, and alternatively Europe Dermatology has experienced a slower
growth and represents 21% of total sales. Gastro and Metabolism and respiratory sales have
similar weights in the company sales in 2015 and both have been decreasing its weight in total
sales in the previous years, respiratory products decreased more abruptly in 2015, roughly
Year 2011 2012 2013 2014 2015Gross margin 62% 62% 66% 70% 69%EBITDA margin 21% 18% 12% 87% 30%EBIT margin 13% 8% 2% 77% 19%Pre-tax margin 9% 7% -13% 61% 25%Net margin 11% 11% -5% 57% 19%Gen. & admin cost/Sales 36% 52% 55% 48% 41%R&D/Sales 19% 23% 18% 13% 10%Capex/(PPE+Intangibles) 8% 16% 41% 16% 13%Net Debt/EBITDA 40% 28% 287% -54% -235%Net Debt/Total Assets 4% 3% 14% -14% -19%ROIC 11% 8% 0% 26% 4%ROE 9% -4% 40% 9%

34
50%, due to the transaction with AZN, which involved the sale of ALM’s once top seller
Eklira® franchise.
Other less important therapeutic areas include cardiology, which in 2011 accounted for more
than 100 million Euros in sales, central nervous system including Sativex® franchise,
musculoskeletal and urology. The weight of these other sales has been declining at an average
of 15% per year and the trend is expected to continue. For values table see Appendix XIII.
FIGURE 8: COST STRUCTURE (% SALES)
According to figure 8, the total cost structure over total sales, excluding other revenue from
transactions and royalties, has been decreasing in the latter years, which implies the company
has improved its operating efficiency. R&D, general and administrative costs and COGS have
been decreasing steadily since 2012, thus margins have improved. This trend is expected to
continue supported by the growth in dermatology, mainly in the US, which has better margins
that the rest of the business.
R&D and SGA’s over sales were 10% and 41%, respectively, in 2015. COGS have decreased
as well from 38% in 2012 to 31% in 2015. For values table see Appendix XIV.
4.3 - STRATEGIC GOALS
ALM is recently turning around its focus within the pharmaceutical realm. Once, respiratory
products accounted for most of firm’s sales, but recently the company strategy changed

35
completely with the acquisition of Aqua Pharmaceutical, a dermatology company in the US.
With this deal ALM is on track to become a major player in dermatology in the US and aims
at reinforcing its’ position on the European market as well. Additionaly, the company has
made recent investments in aesthetics and management believes it will represent a significant
part of the company sales in the near future. In Short ALM is optimizing its’ portfolio while
making selective divestments.
ALM’s key objetives include business and organization realignment through focus on
dermatology and aesthetics fuelled by inovation and geographic expansion, acquisitions and
R&D pipeline expansion are expected to be the catalyst for the near future,
The company’s strategic goals started to be designed in 2014, when ALM announced the sale
of part of its respiratory portfolio to AZN including the Eklira® franchise, the company top
seller. The deal can ascend to roughly 2.1 Billion USD, 875 on completion of the deal and
1.22 billion on milestones to be achieved.
With the income generated from the sale ALM is determined to focus on dermatology
acquisitions in order expand its product and R&D pipeline. Further disposals of non-core
business units are expected as well and the company intends to spend anywhere between 500
and 700 million Euros in acquisitions in the near future and the divestment in constella one of
ALM’s former franchises proves the firm’s commitement to realigned its product portfolio.

36
FIGURE 9: DERMATOLOGY AND RESPIRATORY REVENUES, 2012-2015
In line with figure 9, In 2015, ALM increased its sales in dermatology, fueled by its’ US
subsidiary.
Recent catalysts for dermatology growth are the acquisition of Poli Group in November 2015,
the product Swap in GSK and the acquisition of ThermiGen in February 2016.
Poli Group is a Italian niche pharmaceutical company that generated 85 million in revenue in
2015, 60% of the group sales are on dermatology, 20% are respiratory and 20% on
gynecology, Poli Group was purchased for 400 Million Euros, 365 up front and 35 related to
milestones.
The GSK deal involved the acquisition of two products, Altabax® and Veltin®, in exchange
for the rights for Toctino® and an undisclosed cash payment. Altabax® and Veltin® target
impetigo and acne, further reinforcing Almiral’s Dermatology portfolio.
ThermiGen LLC is an US based company, that develops temperature controlled radio
frequency products that allows physicians to treat a variety of nerve and soft tissue conditions,
the company generated 30 million in revenue in 2015.
37
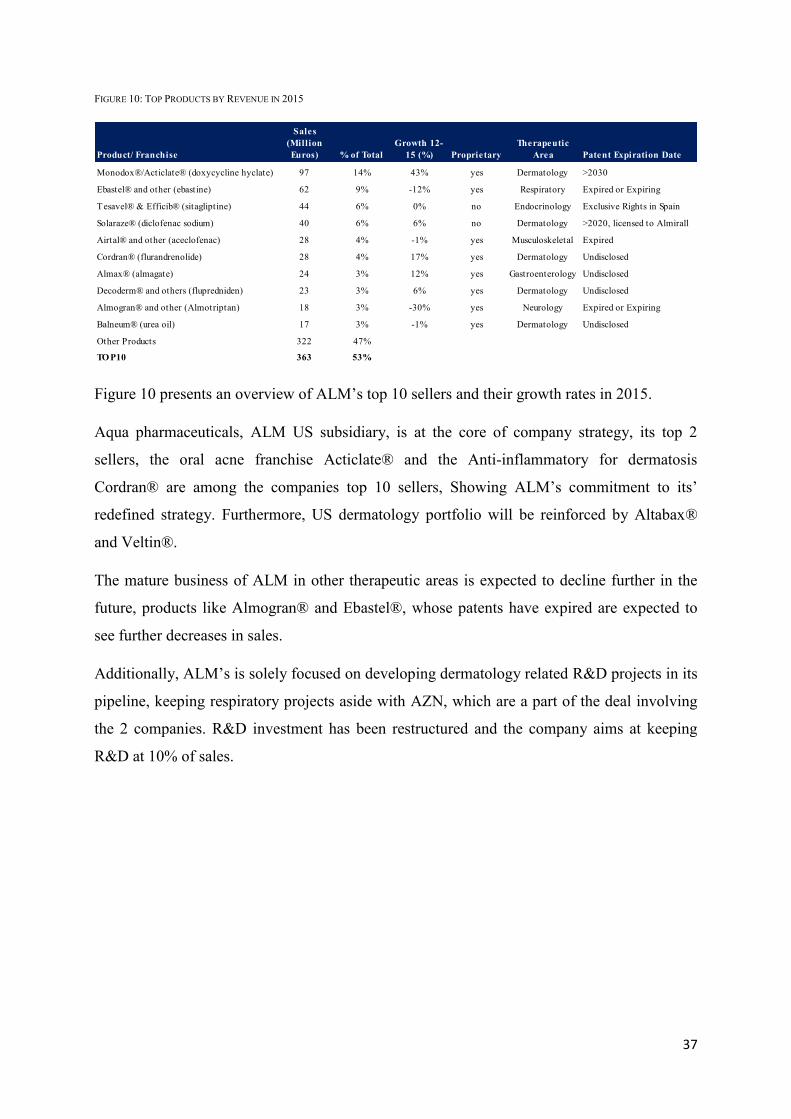
FIGURE 10: TOP PRODUCTS BY REVENUE IN 2015
Figure 10 presents an overview of ALM’s top 10 sellers and their growth rates in 2015.
Aqua pharmaceuticals, ALM US subsidiary, is at the core of company strategy, its top 2
sellers, the oral acne franchise Acticlate® and the Anti-inflammatory for dermatosis
Cordran® are among the companies top 10 sellers, Showing ALM’s commitment to its’
redefined strategy. Furthermore, US dermatology portfolio will be reinforced by Altabax®
and Veltin®.
The mature business of ALM in other therapeutic areas is expected to decline further in the
future, products like Almogran® and Ebastel®, whose patents have expired are expected to
see further decreases in sales.
Additionally, ALM’s is solely focused on developing dermatology related R&D projects in its
pipeline, keeping respiratory projects aside with AZN, which are a part of the deal involving
the 2 companies. R&D investment has been restructured and the company aims at keeping
R&D at 10% of sales.
Product/ Franchise
Sales (Million Euros) % of Total
Growth 12-15 (%) Proprietary
Therapeutic Area Patent Expiration Date
Monodox®/Acticlate® (doxycycline hyclate) 97 14% 43% yes Dermatology >2030
Ebastel® and other (ebastine) 62 9% -12% yes Respiratory Expired or Expiring
Tesavel® & Efficib® (sitagliptine) 44 6% 0% no Endocrinology Exclusive Rights in Spain
Solaraze® (diclofenac sodium) 40 6% 6% no Dermatology >2020, licensed to Almirall
Airtal® and other (aceclofenac) 28 4% -1% yes Musculoskeletal Expired
Cordran® (flurandrenolide) 28 4% 17% yes Dermatology Undisclosed
Almax® (almagate) 24 3% 12% yes Gastroenterology Undisclosed
Decoderm® and others (flupredniden) 23 3% 6% yes Dermatology Undisclosed
Almogran® and other (Almotriptan) 18 3% -30% yes Neurology Expired or Expiring
Balneum® (urea oil) 17 3% -1% yes Dermatology Undisclosed
Other Products 322 47%
TO P10 363 53%

38
FIGURE 11: R&D PIPELINE
4.4 - INDUSTRY OVERVIEW
The pharmaceutical industry is one of major industry in the world, it is worth approximately a
trillion USD and it is on verge of major changes.
Technology progress will make way for the development of better treatments and new
therapies for diseases previously untreated, population ageing and increase in age related
disease incidence in advanced economies will be a major catalyst as well on the other side
there are challenges facing pharmaceutical companies, the control of drug prices and the
patent cliffs which a lot of firms are facing.
The pharmaceutical industry, as whole, is expected to be driven by the economic recovery
underway in developed markets along with the high growth in emerging markets,
“pharmerging markets”. The higher innovation combined with the ageing of the population
will foster the development of new therapies and treatments that improve the prognostics of
numerous health condition. Diseases with once poor prognosis are turning chronic and
specialty pharmaceutical are expected to be a driver behind future growth in the sector.
In developed markets the trend of price cuts is expected to continue and especially in the US,
where price restrictions on drugs may be applied after the outcome of the current 2016
elections which might result in diminishing earnings for pharmaceuticals in the future.
Project Goal Pre-clinical Phase I II III Expected LaunchActikerall Actinic keratosis 2018LAS41008 Plaque Psoriasis 2017ADP31415 Pemphigus vulgaris >2021LAS41006 Nail psoriasis 2021AQ401 Acne >2021LAS41010 Atopic Dermatitis 2017Abediterol ICS Asthma & COPD 2021LAS190792 COPD >2021ADP31417 Asthma & COPD >2021ADP71296 Asthma & COPD >2021P-3058 Nail psoriasis 2020P-3073 Onychomycosis 2020P-3074 Male androgenic alopecia 2020Projects directed by AstraZenecaProjects w ith AstraZenecaAcquired from Poli Group
39
While the US market is expect to recoup and be the driver behind the pharmaceutical growth
in the future, some European countries are undergoing budgetary constraints like Spain,
Portugal or Greece, in those countries healthcare spending is expected to decrease in the near
future.
Additionally, the pharmaceutical industry was recently affected the by a large patent cliff,
peaking in 2012, pharmaceutical companies saw their revenues plunge as their blockbuster
compounds lose their exclusive rights and similar generic drugs flood the market at low
prices, this trend seems to have waned in the latter years.
The increase in generics and specialty pharma has contributed to a less consolidated market.
The major companies have seen their combined market share decrease steadily making room
for smaller companies focused on more specific target markets.
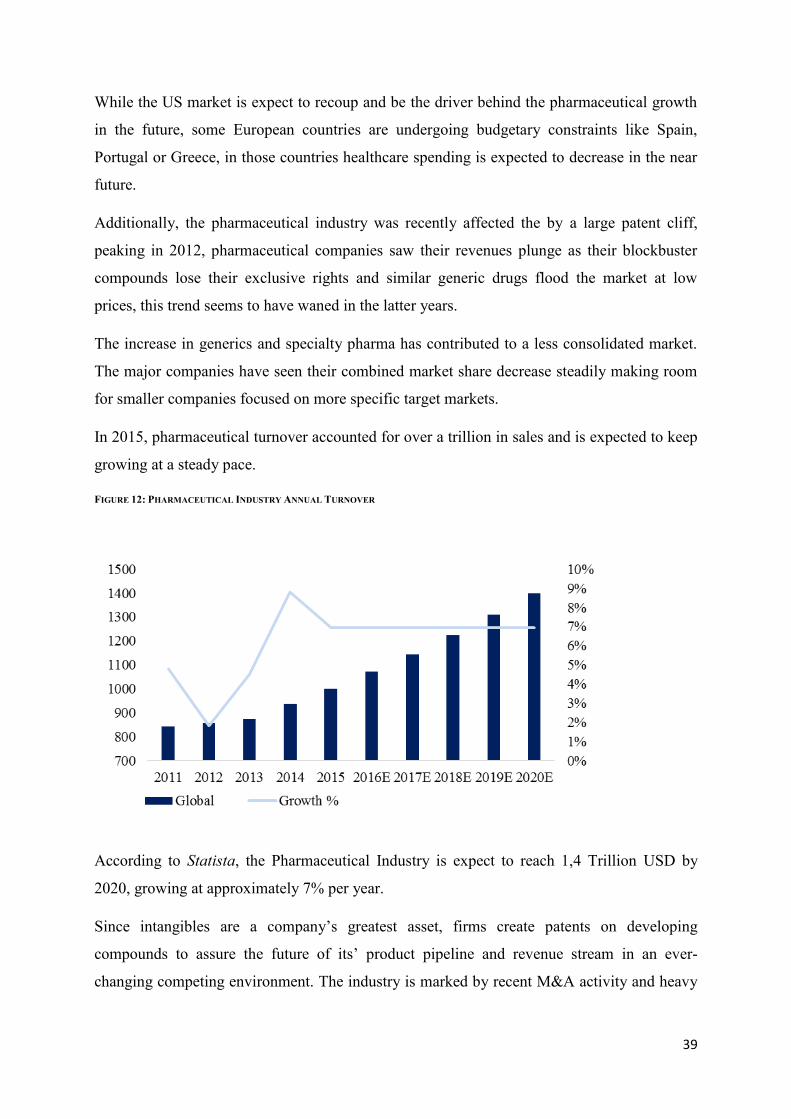
In 2015, pharmaceutical turnover accounted for over a trillion in sales and is expected to keep
growing at a steady pace.
FIGURE 12: PHARMACEUTICAL INDUSTRY ANNUAL TURNOVER
According to Statista, the Pharmaceutical Industry is expect to reach 1,4 Trillion USD by
2020, growing at approximately 7% per year.
Since intangibles are a company’s greatest asset, firms create patents on developing
compounds to assure the future of its’ product pipeline and revenue stream in an ever-
changing competing environment. The industry is marked by recent M&A activity and heavy

40
R&D expenses as companies either acquire new business to avoid expending in drug
development by acquiring new R&D pipeline or spend large amounts on R&D development.
FIGURE 13: DERMATOLOGY INDUSTRY ANNUAL TURNOVER
According to GBI Research, The global dermatology market was worth around 20 Billion
USD in 2015.
Global sales are expected to reach $33.7 billion in 2022, revealing an extraordinary potential
in entering this therapeutic area with an implied estimated CAGR of 8%.
Traditionally a therapeutic area with slow growth within the pharmaceutical realm,
dermatology faces renewed growth fueled by innovative treatments for skin diseases, greater
aesthetic awareness and increasing incidence of skin conditions. At the core of this growth is
the dermatology devices market growing at 11% CAGR (Markets and Markets).
The dermatology industry seems to be changing, as companies are extending indications of
existing products in other therapeutic areas into dermatology. According to Skin Disease
Treatment Technologies and Global Markets, the dermatology market divides into dermatitis
(allergies and contact diseases), cancers (melanomas and other), immune disorders (psoriasis)
and infections (bacterial, fungal and viral). The dermatology landscape has been marked by
acquisitions, small and medium sized companies are being acquired by larger ones. According
to Markets and Markets medical aesthetic market will be worth $12,5 billion in 2020,
growing at 10,8% CAGR.
41
With the current shift in focus on dermatology and entering in the aesthetics market, ALM is
facing stiff competition by the likes of Allergan, Valeant Pharmaceuticals, Zeltiq and
Cynosure. valeant’s brand Solodyn® his expected to cause a flattening of Acticlate®, ALM’s
top seller, sales in 2016. Furthermore, Valeant is also competing with ALM as an acquirer of
dermatology focused businesses.
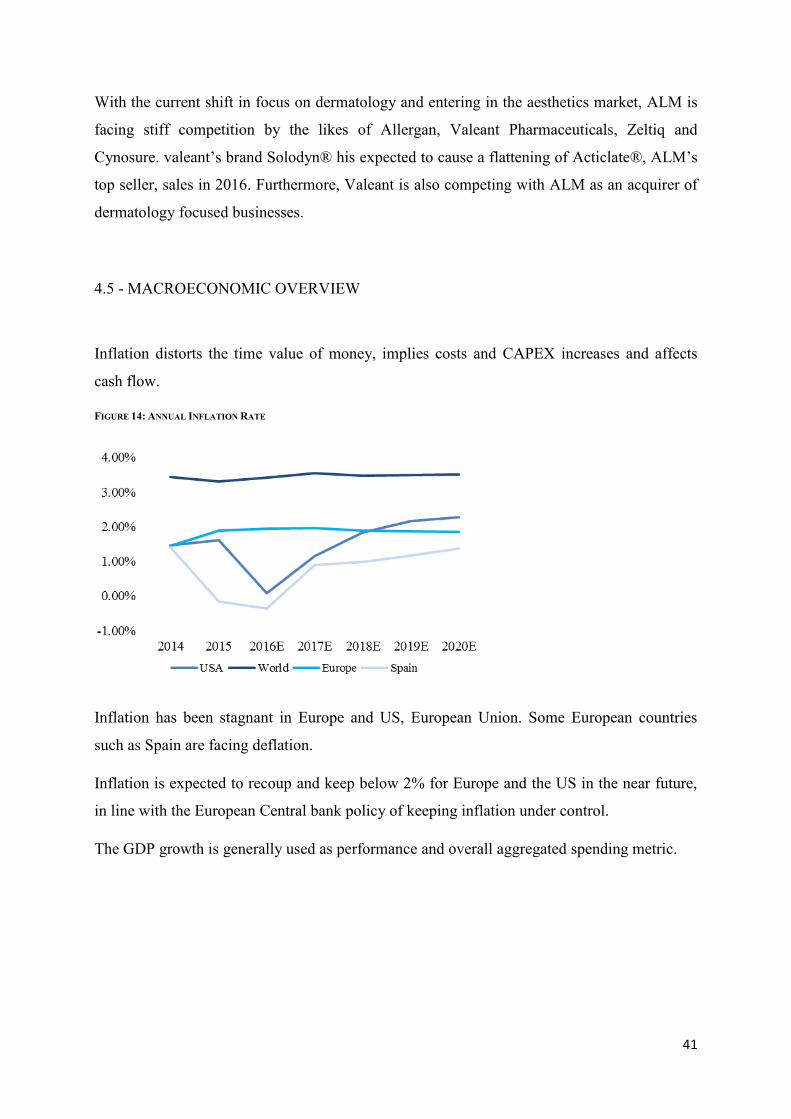
4.5 - MACROECONOMIC OVERVIEW
Inflation distorts the time value of money, implies costs and CAPEX increases and affects
cash flow.
FIGURE 14: ANNUAL INFLATION RATE
Inflation has been stagnant in Europe and US, European Union. Some European countries
such as Spain are facing deflation.
Inflation is expected to recoup and keep below 2% for Europe and the US in the near future,
in line with the European Central bank policy of keeping inflation under control.
The GDP growth is generally used as performance and overall aggregated spending metric.

42
FIGURE 15: REAL GDP ANNUAL GROWTH RATE
The real GDP growth, adjusted for inflation, was low in 2014 and 2015 for Europe between
1% and 2%, and estimates to 2020, predict this trend will continue. Emerging markets are
expected to keep growing at high rates and the US GDP growth is expected to reach 3% in
2016 and slow down afterwards.
Regarding exchange rates, it is important to highlight the effect that it can have on
Multinational company’s revenue which are present in geographies with different currencies.
FIGURE 16: AVERAGE EURO/USD EXCHANGE RATE
Appreciation and depreciation of exchange rates can result in translation losses and artificially
increase or decrease sales depending on which currency the company reports in. Aditionally
for companies that export heavily, appreciations or depreciations of its country’s currency can
hurt or increase sales volumes.
The USD has been appreciating against the euro, the average Euro/USD exchange rate for
2015 1,1. The movement of the Euro/USD is especially important to ALM as the US
43
represents a considerable part of the firm’s revenue, if the firm doesn’t hedge exchange risk,
exchange rate movements might greatly affect ALM’s income statement.
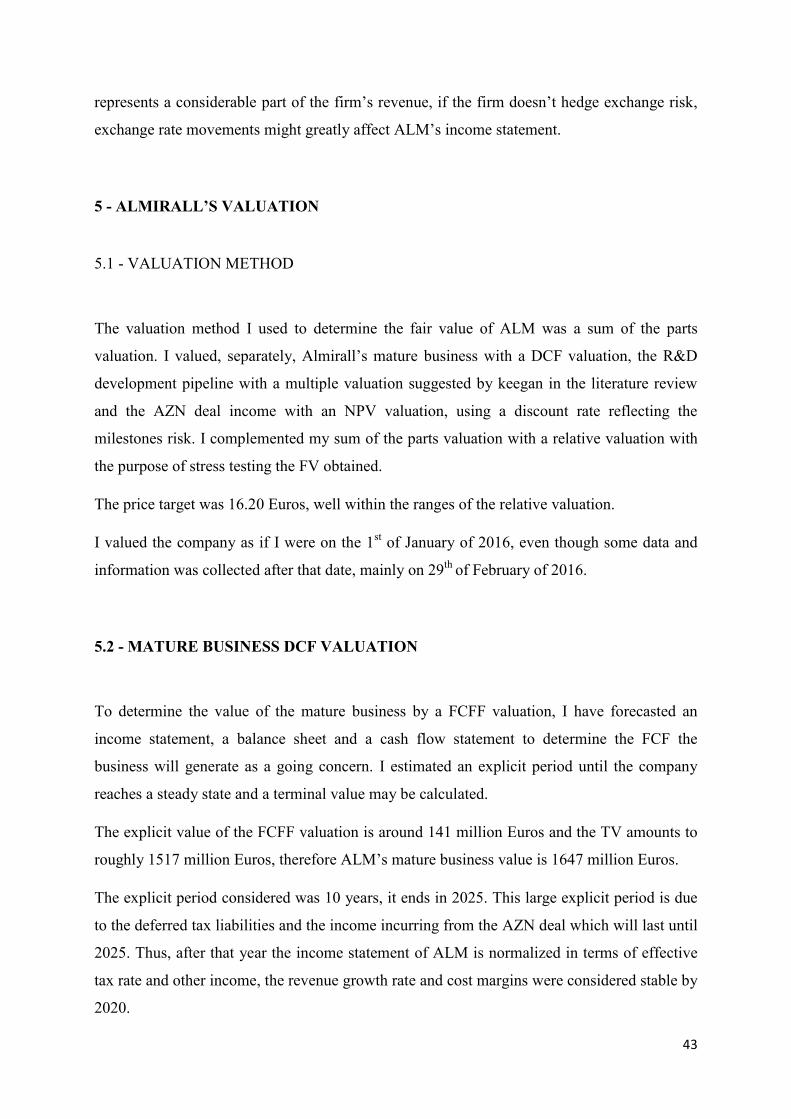
5 - ALMIRALL’S VALUATION
5.1 - VALUATION METHOD
The valuation method I used to determine the fair value of ALM was a sum of the parts
valuation. I valued, separately, Almirall’s mature business with a DCF valuation, the R&D
development pipeline with a multiple valuation suggested by keegan in the literature review
and the AZN deal income with an NPV valuation, using a discount rate reflecting the
milestones risk. I complemented my sum of the parts valuation with a relative valuation with
the purpose of stress testing the FV obtained.
The price target was 16.20 Euros, well within the ranges of the relative valuation.
I valued the company as if I were on the 1st of January of 2016, even though some data and
information was collected after that date, mainly on 29th of February of 2016.
5.2 - MATURE BUSINESS DCF VALUATION
To determine the value of the mature business by a FCFF valuation, I have forecasted an
income statement, a balance sheet and a cash flow statement to determine the FCF the
business will generate as a going concern. I estimated an explicit period until the company
reaches a steady state and a terminal value may be calculated.
The explicit value of the FCFF valuation is around 141 million Euros and the TV amounts to
roughly 1517 million Euros, therefore ALM’s mature business value is 1647 million Euros.
The explicit period considered was 10 years, it ends in 2025. This large explicit period is due
to the deferred tax liabilities and the income incurring from the AZN deal which will last until
2025. Thus, after that year the income statement of ALM is normalized in terms of effective
tax rate and other income, the revenue growth rate and cost margins were considered stable by
2020.
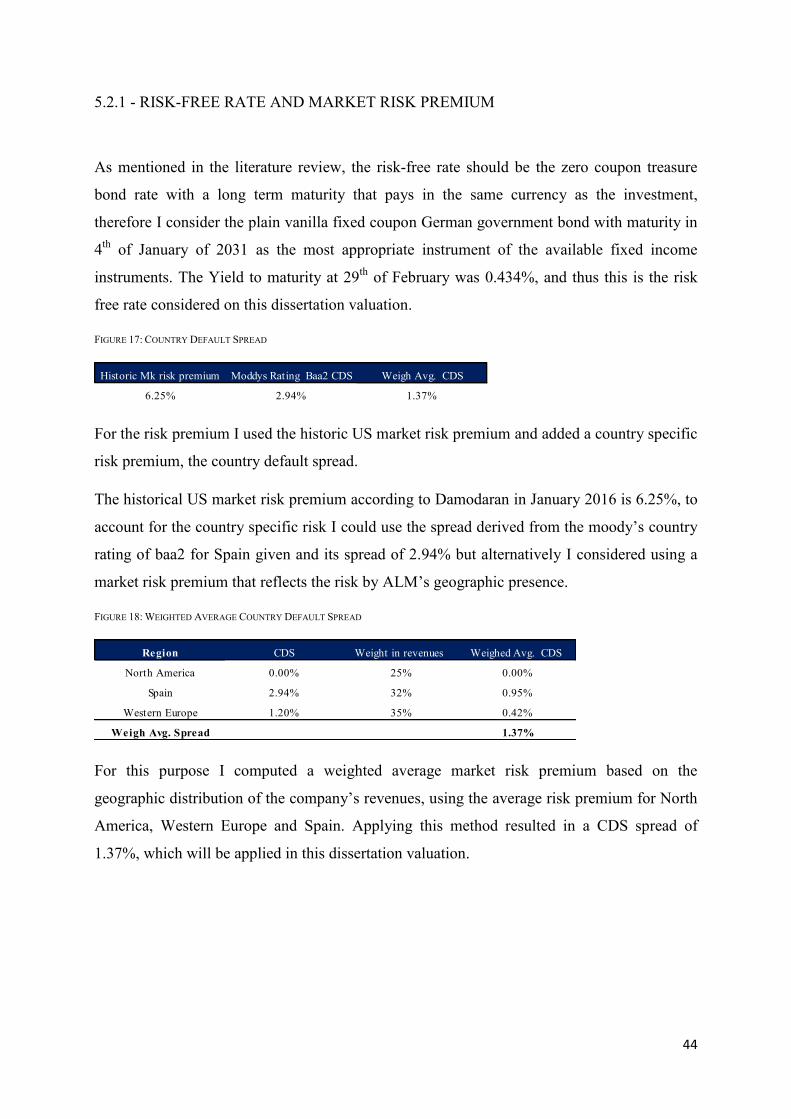
44
5.2.1 - RISK-FREE RATE AND MARKET RISK PREMIUM
As mentioned in the literature review, the risk-free rate should be the zero coupon treasure
bond rate with a long term maturity that pays in the same currency as the investment,
therefore I consider the plain vanilla fixed coupon German government bond with maturity in
4th of January of 2031 as the most appropriate instrument of the available fixed income
instruments. The Yield to maturity at 29th of February was 0.434%, and thus this is the risk
free rate considered on this dissertation valuation.
FIGURE 17: COUNTRY DEFAULT SPREAD
For the risk premium I used the historic US market risk premium and added a country specific
risk premium, the country default spread.
The historical US market risk premium according to Damodaran in January 2016 is 6.25%, to
account for the country specific risk I could use the spread derived from the moody’s country
rating of baa2 for Spain given and its spread of 2.94% but alternatively I considered using a
market risk premium that reflects the risk by ALM’s geographic presence.
FIGURE 18: WEIGHTED AVERAGE COUNTRY DEFAULT SPREAD
For this purpose I computed a weighted average market risk premium based on the
geographic distribution of the company’s revenues, using the average risk premium for North
America, Western Europe and Spain. Applying this method resulted in a CDS spread of
1.37%, which will be applied in this dissertation valuation.
Historic Mk risk premium Moddys Rating Baa2 CDS Weigh Avg. CDS
6.25% 2.94% 1.37%
Region CDS Weight in revenues Weighed Avg. CDS
North America 0.00% 25% 0.00%
Spain 2.94% 32% 0.95%
Western Europe 1.20% 35% 0.42%
Weigh Avg. Spread 1.37%

45
5.2.2 - EQUITY BETA AND RETURN ON EQUITY
In line with the literature review, I applied the CAPM regression to compute the raw Beta of
ALM. The raw beta of the regression of the daily return of ALM against the daily return of
IBEX over a 5 year period until 29 of February of 2016 was 0,51, once adjusted for the
market average, the Beta was 0,67.
The value for the raw Beta is fairly low, due to ALM’s low free-float and trading volume,
which results in lower volatility compared to the index, therefore I decided that the bottom-up
beta approach based on peer average would be a better estimate for the sensibility to market
risk.
The peer group chosen is composed of mainly European specialty pharmaceuticals and firms
active in dermatology or aesthetics. All of the aforementioned companies have a free-float
greater than 60%.
FIGURE 19: BOTTOM UP BETA PEER GROUP
For each of the peer companies I computed the raw Beta and unlevered it. Once I calculated
the unlevered beta for each peer I computed the weighted average by market Capitalization
and adjusted it to the market Beta.
FIGURE 20: LEVERED BETA
The unlevered Beta of 0.85 reflects the risk of ALM’s business activities. In line with the
literature review, I leveraged on the Beta according to ALM’s debt structure to calculate
ALM’s levered beta.
Company Free-Float MK Debt/Equity Levered Beta Tax rate Unlevered BetaAnacor 94.00% 0.00% 0.73 40.00% 0.73Cynosure 99.60% 0.00% 0.58 40.00% 0.58Lonza 100.00% 20.57% 1.17 17.92% 1.01Shire 98.60% 4.63% 0.89 12.50% 0.86UCB 63.60% 5.84% 0.74 33.99% 0.71Valeant Pharmaceuticals 94.00% 63.11% 1.26 26.50% 0.86Faes Farma 98.00% 0.00% 0.73 28.00% 0.73Grifols 69.00% 29.99% 0.53 28.00% 0.44Weighted Average 0.85
Unlevered Beta T MK Debt/Equity Levered Beta
0.85 21% 0% 0.85

46
Because the company has negative net debt, the levered Beta should be, in theory, lower than
the unlevered Beta, but since the company announced it will use the excess cash in future
acquisitions, I considered that in the long-run the net debt will increase. Thus, I considered the
levered beta is equal to the unlevered beta.
FIGURE 21: DIFFERENT APPROACHES AND RESPECTIVE COST OF EQUITY
Figure 21 summarizes different Beta methodologies and respective cost of equity. Still I
considered the most accurate method that reflects ALM’s risk is the bottom-up approach.
FIGURE 22: COST OF EQUITY
In line with the literature review, I calculated the cost of equity by adding the market risk
premium for US multiplied by the bottom-up Beta to the risk free rate, then I added the
weighted average CDS as well. The 𝐾𝑒 obtained was 7.14%.
5.2.3 - COST OF DEBT
Since I assumed that the weight of debt in the capital structure is nonexistent, this implies that
the cost of debt is irrelevant for valuation proposes. Still using S&P’s rating for the company
BB- and the respective 3.99% spread and applying it to the already assumed risk free rate of
0.434%, I reached a value of 4.42%
Alternatively the company’s debt amounts to 325 million Euros of bonds outstanding traded
on the EuroBond and US markets, on 29th of February the yield of those bonds was 3.52%.
The cost of debt could be the yield to maturity on those traded bonds, but for a consistency
purpose, I calculated the 𝐾𝑑 by adding the S&P spread to the risk free rate, thus the 𝐾𝑑 is
4.42%.
Beta Approach Beta Ke
Raw Beta 0.51 5.02%
Peer average 0.79 6.75%
Peer average Adjusted Beta 0.85 7.14%
Reuters Beta 0.76 6.45%
Rf Levered Beta Mk Risk Premium Weigh Avg CDS Ke
0.43% 0.85 6.25% 1.37% 7.14%

47
5.2.4 - WACC
Since the market value of net debt value is negative and the company intends to spend the net
cash on acquisitions and might even increase its’ leverage in the future, for this reason I will
assume an unlevered capital structure, I assumed that the WACC equals 𝐾𝑒 , therefore the
WACC is 7.16%.
The reason I didn’t include debt increase for the forecasting period is the fact that the
company didn’t announce the targets it plans to acquire in the future and the revenue
increments and synergies that said targets could generate.
5.2.5 - NET WORKING CAPITAL
FIGURE 23: WORKING CAPITAL RATIOS
The current 2015 average payable and collection periods and the inventory to sales ratio were
used as the drivers of payables, receivables and inventory for the explicit period.
FIGURE 24: CHANGES IN WORKING CAPITAL
Other current assets accounts for unimportant liquid items, therefore I assumed, for valuation
purposes, these items remain stable. Other current liabilities accounts mostly for wages and
salary payable and research related loans, thus I have forecasted other current liabilities using
salaries payable as a driver by using the average of wages and salaries payable in one year
over total wages and salaries.
Average Payble Period (days) Average Collection Period (days) Inventory to Sales (%)
383 64 13%
Year 2015 2016E 2017E 2018E 2019E 2020EChanges in working capital -59 13 5 5 3 3Changes in inventory 7 6 5 6 5 4Changes in receivables -107 8 7 8 7 6Changes in payables -8 -5 -8 -9 -10 -7Changes in other current assets -4 0 0 0 0 0Changes in other current liabilities 54 4 0 0 0 0

48
5.2.6 - CAPEX AND AMORTIZATION & DEPRECIATION
The CAPEX of pharmaceutical companies include substantial investment in intangibles
assets. I forecasted the CAPEX to equal amortization and depreciation from 2018 onwards.
FIGURE 25: AMORTIZATION & DEPRECIATION PROJECTIONS
FIGURE 26: CAPEX PROJECTIONS
The higher CAPEX for 2016 is due to the acquisition of ThermiGen in February 2016 and
Poli Group in November 2015, which will be paid for in 2016, both were recognized in
business acquisitions. The sale of ALM Mexico subsidiary for 50 Million Euros to Grünenthal
Group was recognized on disposals on 2016 and 2017.
The company plans to spend between 500 and 700 million Euros in acquisitions in the near
future, but because no deal information was made public so far, the forecast figures imply that
the company invests to replace existing capacity, thus CAPEX offsets Depreciation after
2017.
Depreciation is set as fixed percentage of depreciable and amortizable Assets (PPE and
intangibles) at around 12.9%.
5.2.7 - DIVIDENDS, RESERVES AND RETAINED EARNINGS
FIGURE 27: EQUITY RATIOS PROJECTIONS
Year 2015 2016E 2017E 2018E 2019E 2020EAmortization & Depreciation 74 70 120 124 124 124
Year 2015 2016E 2017E 2018E 2019E 2020ECapex 70 509 155 124 124 124intangible assets 14 52 89 92 92 92PPE 13 18 31 32 32 32Financial Assets 30 0 0 0 0 0Business acquisitions 14 439 35 0 0 0Disposals -62 -46 -4 0 0 0Intangible assets and PPE -64 -46 -4 0 0 0Financial Assets 0 0 0 0 0 0Exclusion from consolidation 2 0 0 0 0 0
Year 2015 2016E 2017E 2018E 2019E 2020ELegal reserve 20% 20% 20% 20% 20% 20%Retained earnings 73% 80% 77% 77% 77% 77%Div Payout ratio 27% 20% 23% 23% 23% 23%

49
The company announced a dividend payment of 33 million, which accounts for payout ratio
of 23%, a ratio that I assumed will keep stable in future years. The legal reserve corresponds
to 20% of issued capital.
FIGURE 28: DIVIDEND PAYMENT ESTIMATES
5.2.8 - REVENUE FORECAST
In order to forecast revenues, I used both market research information and company
information for the main products, therapeutic areas and acquired firms products’ revenue
potential. Figure 29 displays revenue projection for the whole business and for some
therapeutic areas and acquired businesses.
FIGURE 29: REVENUE PROJECTIONS
The main therapeutic areas are dermatology, gastrointestinal and respiratory. For dermatology
and aesthetics I forecasted growth based on the products expected growth, and therapeutic
market growth projections, for therapeutic areas where the company plans to divest and
anticipates a further decline in sales, I estimate that sales decrease in line with the average of
the last 5 years.
Year 2015 2016E 2017E 2018E 2019E 2020EDiv Paid 35 33 33 34 36 38
Year 2015 2016E 2017E 2018E 2019E 2020ETotal Revenues 769 859 897 940 978 1007Total Sales 685 744 786 832 875 909YoY -13% 9% 6% 6% 5% 4%Derma Europe 145 152 159 168 176 186YoY 1% 5% 5% 5% 5% 5%Derma US 150 162 182 203 216 231YoY 35% 8% 12% 11% 7% 7%ThermiGen 30 53 77 100 111YoY 100% 78% 44% 30% 11%Poli Group 85 93 100 108 116YoY 100% 9% 8% 8% 8%Respiratory 105 67 62 57 53 49YoY -50% -36% -7% -7% -7% -7%GastroIntestinal 123 103 100 98 96 95YoY -6% -16% -3% -2% -2% -2%Other Sales 162 145 137 130 125 121YoY -15% -10% -6% -5% -4% -3%O ther income 84 115 111 107 103 98
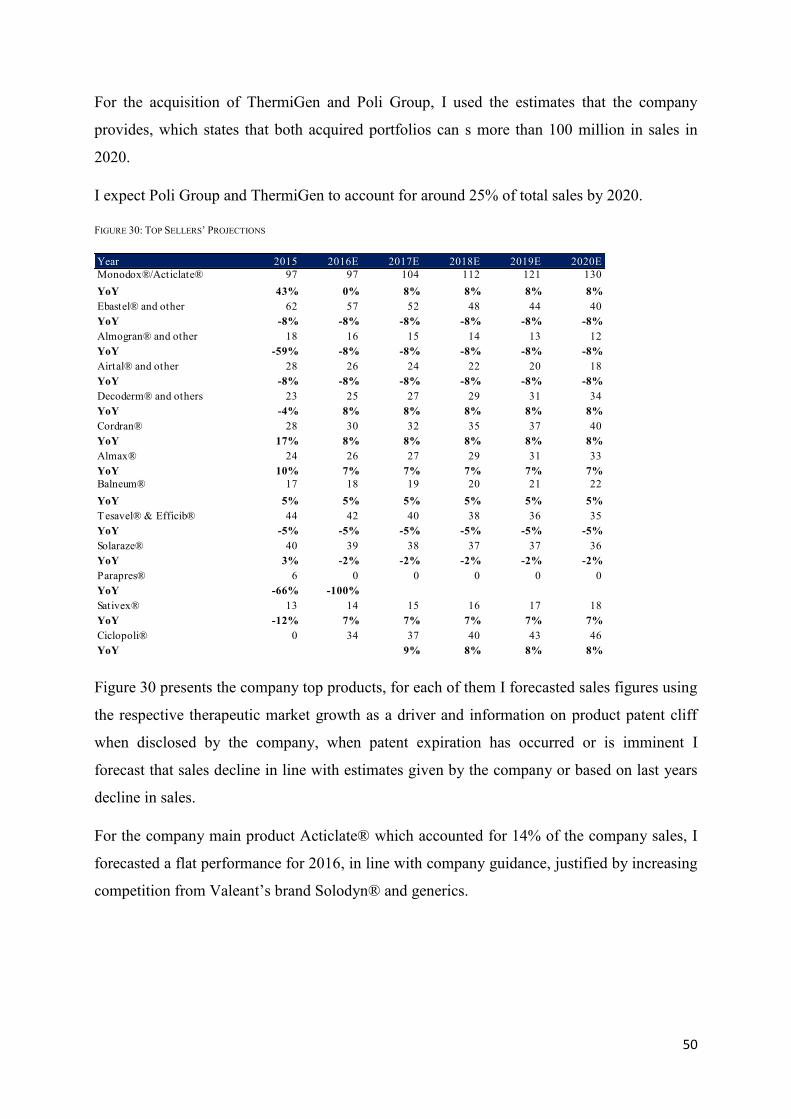
50
For the acquisition of ThermiGen and Poli Group, I used the estimates that the company
provides, which states that both acquired portfolios can s more than 100 million in sales in
2020.
I expect Poli Group and ThermiGen to account for around 25% of total sales by 2020.
FIGURE 30: TOP SELLERS’ PROJECTIONS
Figure 30 presents the company top products, for each of them I forecasted sales figures using
the respective therapeutic market growth as a driver and information on product patent cliff
when disclosed by the company, when patent expiration has occurred or is imminent I
forecast that sales decline in line with estimates given by the company or based on last years
decline in sales.
For the company main product Acticlate® which accounted for 14% of the company sales, I
forecasted a flat performance for 2016, in line with company guidance, justified by increasing
competition from Valeant’s brand Solodyn® and generics.
Year 2015 2016E 2017E 2018E 2019E 2020EMonodox®/Acticlate® 97 97 104 112 121 130YoY 43% 0% 8% 8% 8% 8%Ebastel® and other 62 57 52 48 44 40YoY -8% -8% -8% -8% -8% -8%Almogran® and other 18 16 15 14 13 12YoY -59% -8% -8% -8% -8% -8%Airtal® and other 28 26 24 22 20 18YoY -8% -8% -8% -8% -8% -8%Decoderm® and others 23 25 27 29 31 34YoY -4% 8% 8% 8% 8% 8%Cordran® 28 30 32 35 37 40YoY 17% 8% 8% 8% 8% 8%Almax® 24 26 27 29 31 33YoY 10% 7% 7% 7% 7% 7%Balneum® 17 18 19 20 21 22YoY 5% 5% 5% 5% 5% 5%Tesavel® & Efficib® 44 42 40 38 36 35YoY -5% -5% -5% -5% -5% -5%Solaraze® 40 39 38 37 37 36YoY 3% -2% -2% -2% -2% -2%Parapres® 6 0 0 0 0 0YoY -66% -100%Sativex® 13 14 15 16 17 18YoY -12% 7% 7% 7% 7% 7%Ciclopoli® 0 34 37 40 43 46YoY 9% 8% 8% 8%

51
FIGURE 31: REVENUE BREAKDOWN PROJECTIONS
High growth in dermatology sales is due to the company’s strategic direction, particularly in
the US. The US and European dermatology business is expected to increase its share to 26%
and 28% of total sales, respectively, in 2020, including the increments in dermatology sales
Poli Group will generate, 60% of the group’s revenue is on dermatology.
The abrupt sales breakdown in the respiratory portfolio in 2016 is due to the disposal of
Plusvent®.
Aesthetics, a therapeutic that ALM entered recently with the acquisition of ThermiGen will
account for 12% of sales in 2020. Respiratory and gastro and metabolism will keep
decreasing their weight in the company’s portfolio, by 2020 they will represent 8% and 10%,
respectively. For values table see Appendix XIII.
5.2.9 - OTHER INCOME
Other income includes deferred income recognition from AZN transaction and milestone
related payments. I recognized the deferred income in equal amounts for 10 years up until
2025 of the 201.721 million Euros to be recognized. The amounts equal 20 million Euros
each year. The AZN linked milestones payments are recognized as equal amounts, as well, for
10 years until 2025, the amount recognized is the expected value linked to the probability of

52
reaching the milestones, 95 million Euros multiplied by the probability of receiving the full
amount, the probability decreases as the years advance.
5.2.10 - FINANCIAL RESULTS AND TAXES
Financial results are set as a fixed percentage of net Debt for 2015. This percentage is applied
to the net debt of the previous year to determine the current years’ financial results.
I estimated the tax rate for the forecasted period by taking into account the deferred tax
liabilities and assets, ALM has tax credits resulting from R&D activities and has considerable
tax liabilities as well, according to the notes in the balance sheet, the company expects to
offset them in 10 years, thus I will calculate the effective tax rate by deducing to the estimated
corporate tax rate the recognized tax credits per year and the deferred tax liability recognized
per year.
FIGURE 32: TAX CREDITS AND DEFERRED TAXES PROJECTIONS
Tax credits are a recurrent event in ALM’s activity and I estimated that the tax credit per year
will be the average of the last 5 years, 27 million Euros.
FIGURE 33: WEIGHTED AVERAGE CORPORATE TAX RATE
To the 29.89% estimated corporate tax rate applied on taxable income, I subtracted the net
effect from offsetting tax assets and liabilities, to the income tax due. The corporate tax rate
was calculated by doing the weighted average of ALM’s taxable income by geography,
Year 2015 2016 2017 2018 2019 2020 2021 2022 2023 2024 2025 2026
Deferred Tax Assets 317 312 307 302 297 292 287 282 277 272 266 261
Tax Credit Recognized 34 32 32 32 32 32 32 32 32 32 32 32
Tax Credit (R&D) 12 27 27 27 27 27 27 27 27 27 27 27
Deferred Tax Liabilities 125 113 100 88 75 63 50 38 25 13 0 0
Deffered Tax Liabilities Recognized1 13 13 13 13 13 13 13 13 13 13 0
Net Effect on Tax 33 19 19 19 19 19 19 19 19 19 19 32
Geography T Weight % Net Income Weigh Avg T
Corporate Tax US 40% 31% 12.59%
Corporate Tax EU 22.50% 34% 7.71%
Corporate Tax Spain 28% 34% 9.59%
Average Tax rate 29.89%
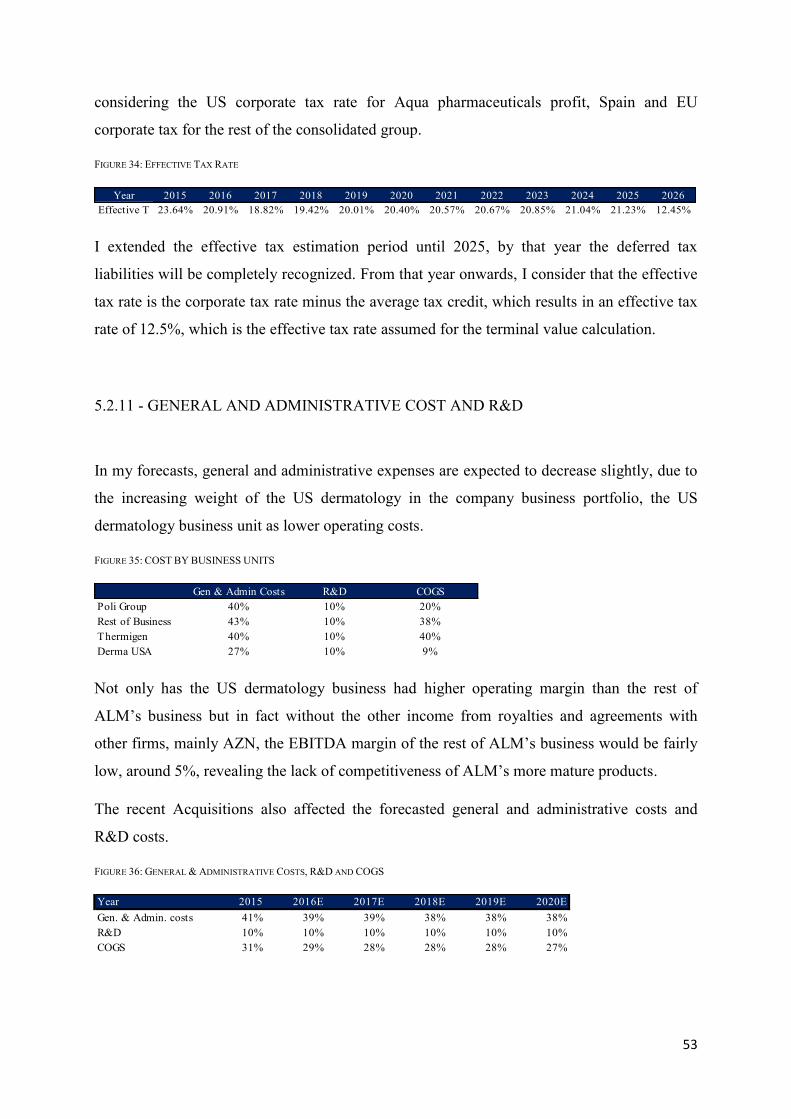
53
considering the US corporate tax rate for Aqua pharmaceuticals profit, Spain and EU
corporate tax for the rest of the consolidated group.
FIGURE 34: EFFECTIVE TAX RATE
I extended the effective tax estimation period until 2025, by that year the deferred tax
liabilities will be completely recognized. From that year onwards, I consider that the effective
tax rate is the corporate tax rate minus the average tax credit, which results in an effective tax
rate of 12.5%, which is the effective tax rate assumed for the terminal value calculation.
5.2.11 - GENERAL AND ADMINISTRATIVE COST AND R&D
In my forecasts, general and administrative expenses are expected to decrease slightly, due to
the increasing weight of the US dermatology in the company business portfolio, the US
dermatology business unit as lower operating costs.
FIGURE 35: COST BY BUSINESS UNITS
Not only has the US dermatology business had higher operating margin than the rest of
ALM’s business but in fact without the other income from royalties and agreements with
other firms, mainly AZN, the EBITDA margin of the rest of ALM’s business would be fairly
low, around 5%, revealing the lack of competitiveness of ALM’s more mature products.
The recent Acquisitions also affected the forecasted general and administrative costs and
R&D costs.
FIGURE 36: GENERAL & ADMINISTRATIVE COSTS, R&D AND COGS
Year 2015 2016 2017 2018 2019 2020 2021 2022 2023 2024 2025 2026Effective T 23.64% 20.91% 18.82% 19.42% 20.01% 20.40% 20.57% 20.67% 20.85% 21.04% 21.23% 12.45%
Gen & Admin Costs R&D COGSPoli Group 40% 10% 20%Rest of Business 43% 10% 38%Thermigen 40% 10% 40%Derma USA 27% 10% 9%
Year 2015 2016E 2017E 2018E 2019E 2020EGen. & Admin. costs 41% 39% 39% 38% 38% 38%R&D 10% 10% 10% 10% 10% 10%COGS 31% 29% 28% 28% 28% 27%

54
COGS and General and admnistritive costs are expected to improve slightly in 2016 and in
the following years, supported by the growth of dermatology. I estimated R&D to be kept
constant at 10% according to the company guidance.
ALM’s margins have an important contribution of other income from the recent AZN deal, if
this is excluded the margins are substantially lower.
FIGURE 37: EBIT AND EBITDA MARGINS (NORMAL AND ADJUSTED)
5.2.12 - ADJUSTMENT TO EBIT
Due to the effect of the AZN transaction, I have adjusted the EBIT by excluding both the
income streaming from reaching the milestones of the AZN deal and the differed income
recognized from the transaction in 2014. The adjusted EBIT will be used to calculate the
NOPLAT.
FIGURE 38: ADJUSTED EBIT
5.2.13 - EXPLICIT PERIOD VALUE AND TERMINAL VALUE
The explicit period value reached was around 140 Million Euros. The FCFF in the first year is
low due to the CAPEX in acquisitions of Poli Group and ThermiGen in 2016.
Year 2015 2016E 2017E 2018E 2019E 2020EEBITDA margin 30% 37% 37% 37% 36% 35%EBITDA margin (Ex. other income from deals) 19% 22% 23% 24% 24% 25%EBIT margin 19% 28% 22% 22% 22% 22%EBIT margin (Ex. other income from deals) 8% 13% 8% 9% 10% 11%
Year 2015 2016E 2017E 2018E 2019E 2020E 2021E 2022E 2023E 2024E 2025E 2026EEBIT 131 208 171 181 191 198 201 202 205 208 212 143EBIT (Excluding Transaction effects) 52 94 60 73 87 100 107 113 120 128 135 143

55
FIGURE 39: EXPLICIT PERIOD VALUATION
The explicit period ends in 2025, the period where I concluded the company will enter in
steady state, the effects from the acquisitions and ALM’s strategy revamping will be
complete. From 2025 onwards I used a perpetuity valuation of the company.
FIGURE 40: NOMINAL AND REAL GROWTH RATES IN 2020
To calculate the terminal value, I used a terminal growth of 2.98%, the median between the
weighted averages of nominal and real GDP growth projections of Europe, USA and Spain in
2020 according to each geography weight in revenues, the nominal and real GDP g are 3.93%
and 2.93%, respectively. The pharmaceutical sector is predicted to grow at around 7% to
2020, and has regularly outperformed GDP growth globally on average but in the long run I
expect it to converge to the GDP growth.
Some analysts argue that the pharmaceutical sector in the future will suffer with price limits
and unfavorable regulation, but the ageing of the population will increase volume sales, and
Year 2015 2016E 2017E 2018E 2019E 2020E 2021E 2022E 2023E 2024E 2025E
Total Revenues 769 859 897 940 978 1007 1030 1052 1077 1103 1130Total Sales 685 744 786 832 875 909 936 964 993 1022 1053YoY -13% 9% 6% 6% 5% 4% 3% 3% 3% 3% 3%Other income 84 115 111 107 103 98 94 88 85 81 77Cost of Sales -215 -217 -224 -233 -242 -248 -256 -263 -271 -279 -288R&D -66 -72 -76 -81 -85 -88 -91 -93 -96 -99 -102General and Administrative costs -280 -290 -304 -320 -335 -347 -357 -368 -379 -390 -402Other op. expenses -3 -2 -2 -2 -2 -2 -2 -2 -2 -2 -2EBITDA 206 278 291 304 314 321 324 325 329 332 336Amort & Dep -74 -70 -120 -124 -124 -124 -124 -124 -124 -124 -124EBIT 131 208 171 181 191 198 201 202 205 208 212
EBIT (Excluding Transaction effects) 52 94 60 73 87 100 107 113 120 128 135
YoY 0 1 0 0 0 0 0 0 0 0 0Taxes -16 -20 -11 -14 -17 -20 -22 -23 -25 -27 -29NO PLAT 37 74 49 59 70 80 85 90 95 101 107Amortization&Depreciation 74 70 120 124 124 124 126 129 131 134 137Changes in NWC 59 -13 -5 -5 -3 -3 -3 -3 -3 -4 -4Net CAPEX -8 -458 -149 -121 -121 -120 -122 -125 -127 -130 -132FCFF 162 -327 15 57 70 80 85 91 96 102 107Discount factor 93% 87% 81% 76% 71% 66% 62% 58% 54% 50%Wacc 7.14%DCF Explicit 141
Nominal GDP Growth rate 2020 g WeightEurope 3.64% 35%USA 4.24% 25%Spain 3.16% 32%RoW 7.48% 8%Total 3.93%
Real GDP Growth rate 2020 g WeightEurope 1.88% 35%USA 1.96% 25%Spain 1.78% 32%RoW 3.97% 8%Total 2.03%

56
the innovation in the sector will provide substantially growth opportunities that might offset
the control on prices.
Inflation may only partially affect ALM’s future sales, implying that the terminal growth rate
should be between the nominal and real GDP growth rates, therefore I concluded the median
between the real and nominal growth rate for 2020 to be the most accurate.
FIGURE 41: TERMINAL GROWTH RATE IN 2020
I considered that from 2020 onwards, the company will be in a steady state of growth, but due
to the increments of AZN deal and the deferred tax liabilities ending in 2025, I computed the
TV on 2025. The FCFF for the terminal year is higher due to the effective tax rate being
lower on the long term due to tax credits.
FIGURE 42: TERMINAL VALUE
The terminal value calculated was around 1517 million Euros, accounting for most of ALM
mature business’ value.
5.3 - R&D PIPELINE VALUATION
To value the products under development, I have focused on the projects, on which I have
visibility on peak sales and are expected to launch before 2021.
Nominal Median Real3.93% 2.98% 2.03%GDP g (2020)
Year 2025E TV
EBIT (Excluding Transaction effects) 135 143YoY 0 0Taxes -29 -18NOPLAT 107 125Amortization&Depreciation 137 139Changes in NWC -4 -4Net CAPEX -132 -135FCFF 107 126
Discount factor 50%Wacc 7.14%TV 1517
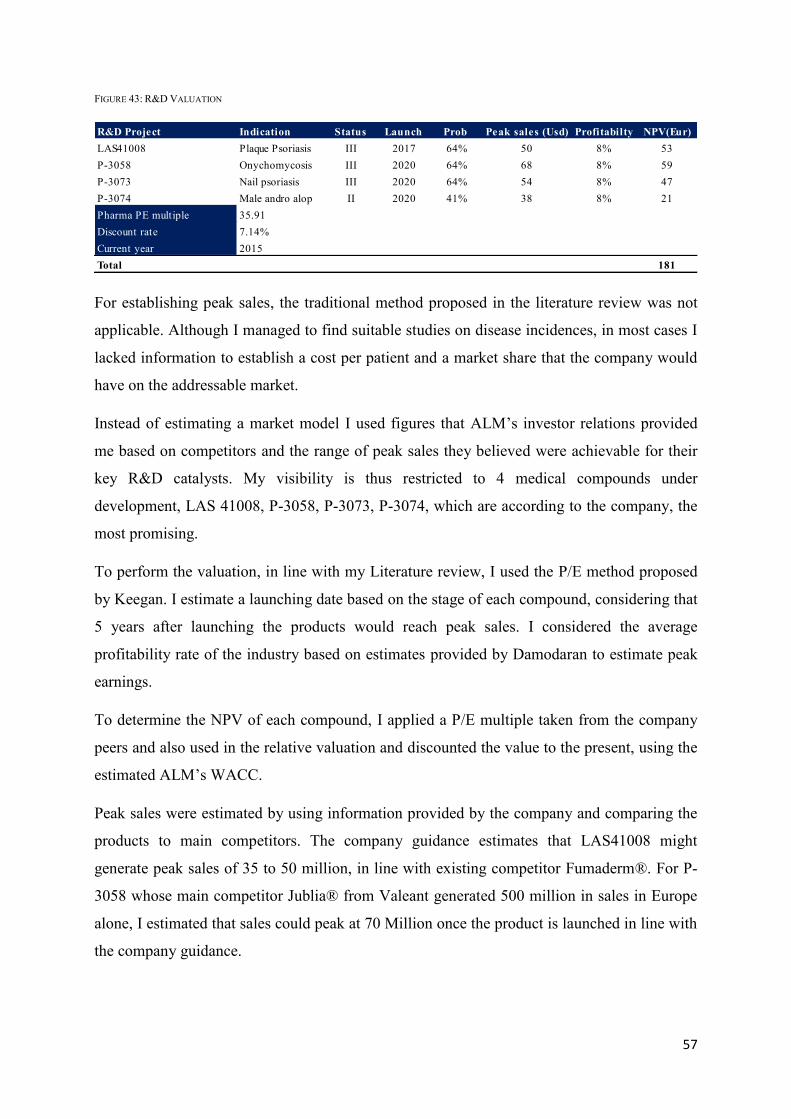
57
FIGURE 43: R&D VALUATION
For establishing peak sales, the traditional method proposed in the literature review was not
applicable. Although I managed to find suitable studies on disease incidences, in most cases I
lacked information to establish a cost per patient and a market share that the company would
have on the addressable market.
Instead of estimating a market model I used figures that ALM’s investor relations provided
me based on competitors and the range of peak sales they believed were achievable for their
key R&D catalysts. My visibility is thus restricted to 4 medical compounds under
development, LAS 41008, P-3058, P-3073, P-3074, which are according to the company, the
most promising.
To perform the valuation, in line with my Literature review, I used the P/E method proposed
by Keegan. I estimate a launching date based on the stage of each compound, considering that
5 years after launching the products would reach peak sales. I considered the average
profitability rate of the industry based on estimates provided by Damodaran to estimate peak
earnings.
To determine the NPV of each compound, I applied a P/E multiple taken from the company
peers and also used in the relative valuation and discounted the value to the present, using the
estimated ALM’s WACC.
Peak sales were estimated by using information provided by the company and comparing the
products to main competitors. The company guidance estimates that LAS41008 might
generate peak sales of 35 to 50 million, in line with existing competitor Fumaderm®. For P-
3058 whose main competitor Jublia® from Valeant generated 500 million in sales in Europe
alone, I estimated that sales could peak at 70 Million once the product is launched in line with
the company guidance.
R&D Project Indication Status Launch Prob Peak sales (Usd) Profitabilty NPV(Eur)LAS41008 Plaque Psoriasis III 2017 64% 50 8% 53P-3058 Onychomycosis III 2020 64% 68 8% 59P-3073 Nail psoriasis III 2020 64% 54 8% 47P-3074 Male andro alop II 2020 41% 38 8% 21Pharma PE multiple 35.91Discount rate 7.14%Current year 2015Total 181

58
P-3058, alongside the other pipeline projects acquired from Poli Group benefits from the
HPCH formulation, which gives it significant advantage against existing products, are also
expected to perform well in the market.
I considered using real option valuation but with the information I had available, an option
valuation was not applicable. I lacked visibility on R&D costs attributable to each project,
thus I couldn’t estimate a strike price. Furthermore, although I had peak sales estimation, I
lacked information to realistically estimate an NPV of the cash-flow the patent will generate
in the future, the underlying asset in real option valuation.
Concluding, the value that I attributed to ALM’s R&D through the model is 181 million
Euros.
5.4 - NET CASH
On 29th of February the net cash position was around 87 million Euros. I subtracted the value
of cash and cash equivalents to the value of debt, additionally I included the cash outflows of
Poli Group and ThermiGen acquisitions and the cash inflows from the sale of the Mexico unit
to Grünenthal, thus the initial Net cash position at the end of 2015 of 484 million Euros
decreased to 87 million Euros.
For valuation purposes, considering the 1st of January as the present date, ALM has a net cash
position of 484.5 million Euros.
5.5 - AZTRAZENECA DEAL VALUATION
Of the 1.22 Billion USD related to milestones of the AZN deal, 170 million were already
received. The remaining 1050 Million USD are expected to be paid in the next 10 years. The
payment is dependent on certain development, sales and launch milestones being met. In line
with the company guidance, LAS190792 progress is the critical factor in the milestones. The
amounts of sales related to milestones were not disclosed by the company.
According with ALM’s Investor relations, the probability of receiving the 1.05 Billion USD
outstanding is between 80% and 85%.

59
To value the AZN deal milestone payment I assumed, in line with company estimates, that the
amount outstanding would be paid in equal amounts of 105 million USD or 95 million Euros
at the average exchange rate for 2016, until 2025. Furthermore I adjusted the value for the
effective tax rate, which resulted in an average payment after tax of 75 million Euros per year.
I assumed that 80% of the total 1050 million USD would be paid as base scenario but the
probability would decrease further as the years progressed.
FIGURE 44: AZTRAZENECA COST OF CAPITAL
To discount the development milestone-related payments, I used AZN’s WACC, implying
that the risk of these cash flows is tied to AZN ability to fulfil the sales and R&D
development milestones in the joint projects.
FIGURE 45: AZTRAZENECA DEAL INCOME VALUATION
Once discounted the total after tax payments and adjusted for the probability, amounted to
603 Million Euros, which I assumed was the fair value for this part of the valuation.
The Euro/USD exchange rate fluctuations may affect the value of the Astra Zeneca deal, this
issue was addressed in the sensitivity analysis.
Rf D/EV Spread Kd Beta Mk risk premium CDS Ke Wacc0.6% 14.4% 1.3% 1.9% 0.67 6.3% 0.6% 5.4% 4.9%
AstraZeneca Milestones payments
yearly Aumounts
USDyearly Amounts (Euros) Pre-Tax
Amounts After Tax Probability
Prob Weigh Income (Euros)
Discount Factor
Value (Eur)
2016 105 95 75 100% 75 95% 712017 105 95 77 96% 74 91% 672018 105 95 76 92% 70 87% 612019 105 95 76 88% 67 83% 552020 105 95 75 82% 62 79% 492021 105 95 75 78% 59 75% 442022 105 95 75 72% 54 72% 392023 105 95 75 68% 51 68% 352024 105 95 75 64% 48 65% 312025 105 95 75 60% 45 62% 28Total 1050 946 753 80% 603 480

60
5.6 - TARGET PRICE AND RECOMMENDATION
The target price is the fair value that results from the sum of the parts valuation.
The criteria that I used to make the recommendation is based on the coefficient of variation of
the daily closing prices of the last year 2 years 2015 and 2014, which reflects the dispersion of
share prices in relation to the average of the last two years, the interval was chosen due to the
fact that those years incorporate the beginning of the change in the company strategy, thus a
similar period to the near future, in how the market values the company. The coefficient of
variation for the last 2 years was 18.5% and target price is 16.20 Euros, the current price is
18.4, above the range the of the coefficient of variation, 14.70 to 17.70 , thus the
recommendation is to SELL if the current price was within or below that range, the
recommendation would be to HOLD or BUY, respectively.
5.7 - SENSITIVITY ANALYSIS
I performed the sensitivity analysis based on growth of sales, terminal growth rate, expenses
as percentage of sales such as cost of sales, R&D and general and administrative costs,
probability of receiving the milestone payments related to the AZN deal, on future peak sales
of company’s current R&D projects and the Euro/USD exchange rate variations and its
impact on US dermatology subsidiary sales.
Even though the company states in its annual accounts that it hedges currency risk, it doesn’t
explain how it does it in detail, as a matter of prudence, I decided to include a sensitivity
analysis on the impact of movements of the Euro/USD on the US dermatology business unit
revenues. I projected two alternative scenarios where the USD appreciates 3% and depreciates
3% per year until 2020.
Additionally the Sensitivity analysis includes movements of the risk free rate, which is
currently historically low, of +1% and +2%.
The general and administrative costs, R&D and cost of sales were also considered, with
changes of 1% relative to base scenario in the range from -2% to 2% of sales from the base
assumed percentage of sales.
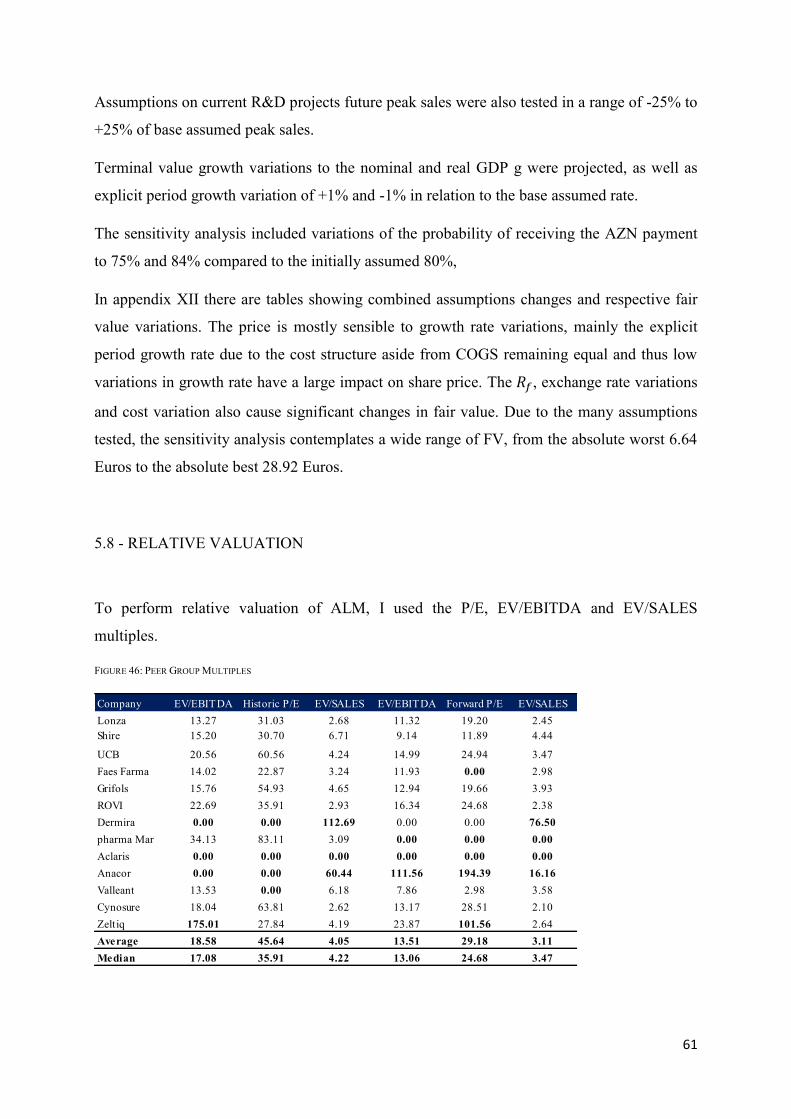
61
Assumptions on current R&D projects future peak sales were also tested in a range of -25% to
+25% of base assumed peak sales.
Terminal value growth variations to the nominal and real GDP g were projected, as well as
explicit period growth variation of +1% and -1% in relation to the base assumed rate.
The sensitivity analysis included variations of the probability of receiving the AZN payment
to 75% and 84% compared to the initially assumed 80%,
In appendix XII there are tables showing combined assumptions changes and respective fair
value variations. The price is mostly sensible to growth rate variations, mainly the explicit
period growth rate due to the cost structure aside from COGS remaining equal and thus low
variations in growth rate have a large impact on share price. The 𝑅𝑓, exchange rate variations
and cost variation also cause significant changes in fair value. Due to the many assumptions
tested, the sensitivity analysis contemplates a wide range of FV, from the absolute worst 6.64
Euros to the absolute best 28.92 Euros.
5.8 - RELATIVE VALUATION
To perform relative valuation of ALM, I used the P/E, EV/EBITDA and EV/SALES
multiples.
FIGURE 46: PEER GROUP MULTIPLES
CompanyHistoric
EV/EBITDA Historic P/E EV/SALESForward
EV/EBITDA Forward P/E Forward
EV/SALESLonza 13.27 31.03 2.68 11.32 19.20 2.45Shire 15.20 30.70 6.71 9.14 11.89 4.44
UCB 20.56 60.56 4.24 14.99 24.94 3.47Faes Farma 14.02 22.87 3.24 11.93 0.00 2.98Grifols 15.76 54.93 4.65 12.94 19.66 3.93ROVI 22.69 35.91 2.93 16.34 24.68 2.38Dermira 0.00 0.00 112.69 0.00 0.00 76.50pharma Mar 34.13 83.11 3.09 0.00 0.00 0.00Aclaris 0.00 0.00 0.00 0.00 0.00 0.00Anacor 0.00 0.00 60.44 111.56 194.39 16.16Valleant 13.53 0.00 6.18 7.86 2.98 3.58Cynosure 18.04 63.81 2.62 13.17 28.51 2.10Zeltiq 175.01 27.84 4.19 23.87 101.56 2.64Average 18.58 45.64 4.05 13.51 29.18 3.11Median 17.08 35.91 4.22 13.06 24.68 3.47

62
To have an adequate benchmark, I have gathered a peer group composed of medium sized,
specialty pharmaceutical companies and firms focused on dermatology and aesthetics. Figure
46 presents the multiples for each of those companies taken from Thomson Reuters. For each
multiple I computed the average excluding outliers (in bold) and the Median.
As discussed in the literature review, I used both forward and trailing multiples. The results
were adjusted in order to don’t reflect the other income from the AZN deal, as such income is
non-recurrent and it will end in 2025, still I added the AZN income value already obtained
separately to reach the fair value. I adjusted the net income by subtracting the AZN income
from EBIT and apply the effective tax rate to that adjusted EBIT.
In line with the literature review, I used the median instead of the simple average of the
company’s peer as the multiple to better exclude the effect of the outliers.
FIGURE 47: FORWARD AND TRAILING MULTIPLES VALUATION
Using the forward multiple approach, the fair value should be between 13.89 and 20.51. The
fair value obtained through the sum of the parts valuation is well within this range but higher
than the Forward P/E, which is explained by the growth potential that the company has in the
long run, with the acquisitions made, not being fully reflected in 2016 earnings.
6 - INVESTMENT BANK REPORT COMPARISON
I choose to compare my report with Credit Suisse equity research report published on the 23th
of February, 2016.
The target price on Credit Suisse report is 14 Euros considering a 12 month period, it implies
a downside of 16.5%, still Credit Suisse maintains a NEUTRAL rating stating: “Our Neutral
Trailing Almirall EV/EBITDA EV/Sales P/E EV Equity FV per share
EBITDA 122 17.08 0 0 2558 3043 17.59
Revenue 685 0 4.215 0 3367 3851 22.27
Earnings 68 0 0 35.91 3124 3568 20.63
AstraZeneca Value 480
Forward Almirall EV/EBITDA EV/Sales P/E EV Equity FV per share
EBITDA 163 13.06 0 0 2611 3095 17.89
Revenue 744 0 3.47 0 3063 3547 20.51
Earnings 78 0 0 24.68 1917 2402 13.89
AstraZeneca Value 480

63
rating reflects the lack of visibility on bolt-on and M&A deals to achieve its strategy and
clarify the mid-term outlook”. Credit Suisse uses an NPV based Methodology called
PharmaValue NPV methodology, based on sales probability, on which it states that the
company is traded on 30% premium to equity NPV. The 9.6 NPV per share implies that
Credit Suisse ALM NPV is 1661 million Euros afterwards the cash was added to obtain the
equity NPV per share to which a premium of 30% is applied.
Credit Suisse stock rating are to OUTPERFORM (BUY), NEUTRAL (HOLD) and
UNDERPERFORM (SELL) and are based on comparison with the relevant benchmark,
which are generally companies of the same sector.
Additionally, Credit Suisse recommends to Overweight, Market Weight or Underweight,
which are related to the analyst’s expectations for the sector’s fundamentals, if it is favorable,
neutral or cautious over the next 12 months, respectively.
The differences between this dissertation and Credit Suisse equity research report includes the
revenues forecast. In this dissertation, revenue growth is higher compared with Credit Suisse
estimated, the CAGR for 2015-2020 is around 6% compared with 4% from the Credit Suisse
report.
Credit Suisse EBIT margin forecast are lower than what I considered, mainly due to higher
increments in other income that I am considering from the AZN deal. SG&A/SALES are
similar for 2016, but from that point onwards this dissertation forecast higher SG&A/SALES,
this is due to an increase in depreciation & amortization resulting from the inclusion of
ThermiGen and Poli Group assets in intangibles and PPE.
Credit Suisse does not disclose the discount rate used on its NPV valuation, thus I can’t
compare with the WACC used in this dissertation.
This dissertation valuation includes R&D components valued at 181 million Euros, which are
not contemplated by the Credit Suisse valuation.
Other income is also a key differentiator of both analyses, in this dissertation, I assumed that
both the differed income and the income received from milestones is going to be recognized
and received in probability weighted equal amounts until 2025, while Credit Suisse reports
makes different assumptions on other income with higher values in 2017 and 2018.
Another noticeable difference refers to the fact that credit Suisse Report doesn’t include
retirement benefit obligations in net debt.
64
Concluding, Credit Suisse values the company as a whole based on a peer based premium on
the equity NPV. It does not value the proceedings of AZN transaction and R&D components
separately. The recommendation method is also different, which results in Credit Suisse
making a neutral recommendation, with a lower target price and higher downside than this
dissertation considered.

65
BIBLIOGRAPHY REFERENCES
2012. From Vision to Decision pharma 2020, s.l.: PWC.
2013. Dermatology Market Overview, Harris Williams & Co..
2015. 5th International Conference on Clinical & Experimental Dermatology, OMICS
International.
2015. Dermatology Devices Market by Diagnostic Devices (Dermatoscope, Microscope,
Imaging Techniques), Treatment Devices (Liposuction, Microdermabrasion, Lasers) & by
Application (Cancer Diagnosis, Acne, Psoriasis, Hair Removal) - Global Forecast to 2019,
Markets and Markets.
2015. IMS Health Forecasts Global Drug Spending to Increase 30 Percent by 2020, to $1.4
Trillion, As Medicine Use Gap Narrows. IMS Health press release , 18 November.
2015. Market profile of U.S. Dermatologists , OneKey Market insights.
2015. Medical Aesthetics Market worth $12,581.9 Million by 2020., Markets and Markets.
2015. The pharmaceutical Industry in Figures key Data, European Federation of
pharmaceutical Industries and Associations.
2016. Almirall looks for new M&A to continue expanding in the dermatology market. The
Pharma letter, 23 february.
2016. Almirall Prodesfarma SA Cortellis company detailed pipeline Report, Thomson Reuters
Cortellis.
2016. Corporate tax rates table, KPMG.
2016. Face of Dermatology Industry Changing; Companies in Global Skin Disease Market
Extending Products, Reports BCC Research. Market Wired, 5 January.
2016. Global Dermatology Market Set to Reach $33.7 Billion by 2022 Despite Patent
Expiries. Pharmaceutical Executive Editors, 4 May.
2016. Global dermatology market set to reach US$33.7bn by 2022, despite patent expiries.
Manufacturing Chemist Pharma, 6 May.

66
2016. Global Dermatology Market to 2022 – Innovative Pipeline and Increasing Uptake of
Biologics to Diversify Treatment Options and Drive Strong Growth, GBI Research .
2016. Global pharmaceutical industry sales in 2014, by region (in billion U.S. dollars),
Statista.
2016. Global Respiratory Drugs Market 2016-2020, Technavio.
2016. Information and company research, Almirall's Investor Relations.
2016. Size of the global skin care market from 2012 to 2021 (in billion U.S. dollars), Statista.
2016. World Economic Outlook Database, IMF.
2016. Yearly Average Euro/UsDollar Exchange Rate, USForex.
Statistics and facts about the pharmaceutical industry worldwide, Statista.
Bhojraj, S. & Lee, C. M. C., 2001. Who is My Peer? A Valuation-based Approach to the
Selection of Comparable Firms. Journal of Accounting Research, pp. 407-439.
Bloomberg, 2016. Company Information for ALMIRALL SA.
Chan, l. K. C., Lakonishok, J. & Sougiannis, T., 2001. The Stock Market Valuation of
Research and Development Expenditures. The Journal of Finance, pp. 2431-2456.
Damodaran, A., 2002. Investment Valuation: Tools and Techniques for Determining the
Value on Any Asset Second Edition. John Wiley and Sons, Ltd..
Damodaran, A., 2006. Valuation Approaches and Metrics: A Survey of the theory and
Evidences. Stern School of Business Working Paper.
Damodaran, A., 2011. Equity Risk Premium (ERP): Determinants, Estimation and
Implication - the 2011 Edition. Stern School of Business Working Paper.
Damodaran, A., 2016. Margins by Sector, Aswath Damodaran.
Fama, E. F. & French, K. R., 2004. The Capital Asset Princing Model: Theory and Evidence.
The journal of Economic Perspectives, 18(3), pp. 25-46.
Farrell, Jr., J. L., 2010. The Dividend Discount Model: A Primer. Financial Analyst Journal,
41(6), pp. 16-19;22-25.

67
Fernández, P., 2004. 80 common errors in company valuation. IESE Business School.
University of Navarra.
Fernández, P., 2004. The value of tax shields is NOT equal to the present value of tax shields.
Journal OF Financial Economics, Volume 73, pp. 145-165.
Fernández, P., 2007. A More Realistic Valuation: APV AND WACC WITH CONSTANT
BOOK LEVERAGE RATIO. IESE Business School Working Paper.
Fernández, P., 2015. Company valuation methods. IESE Business School Working Paper.
Goedhart, M. H. & Haden, P., 2003. Emerging markets aren't as risky as you think. The
Mckinsey Quarterly, pp. 3-9.
Henschke, S. & Homburg, C., 2009. Equity Valuation using multiples: Controlling for
Differences Between Firms. University of Cologne Working Paper.
Holt, W., Nokhasteh, A., Sullivan, P. & Young, M., 1999. All Roads Lead to Rome An
integrated Approach to Valuation Models. Goldman Sachs Investment Research.
Hull, J., 2012. Options, futures and other derivatives. 8th ed. s.l.:Pearson Prentice Hall.
James, M. & Koller, T., 2000. Valuation in emerging markets. The mckinsey quarterly, Issue
4.
Keegan, K. D., 2008. Biotechnology Valuation An Introductory Guide. John Wiley and Sons,
Ltd..
Luehrman, T. A., 1997. Using APV: A better tool for Valuing Operations. Harvard Business
Review, pp. 145-154.
Luehrman, T. A., 1997. What's It Worth? A General Manager's Guide to Valuation. Harvard
Business Review, pp. 132-142.
Thomson Reuters, 2016. Company Information for Almirall SA.
Schreiner, A. & Spremann, K., 2007. Multiples and Their Valuation Accuracy in European
Equity Markets.

68
APPENDIX
I: Peer List for Multiples and Beta calculations
- LONZA GROUP AG - Swiss biopharmaceutical and chemical multinational
company, leader in supplying biopharmaceuticals to the pharmaceutical industry.
- SHIRE PHARMACEUTICALS PLC - Irish-headquartered specialty
Biopharmaceutical Company, it focus on behavioral health, rare conditions,
gastrointestinal and regenerative medicine.
- UCB SA - Belgian multinational bio pharmaceutical, it focus on R&D mainly on
specialty pharmaceuticals, neurology and oncology are the company’s main concerns.
- FAES FARMA SA - Spanish pharmaceutical and chemical company, it
commercializes pharmaceutical products and raw materials, it exports to more than 60
countries.
- GRIFOLS SA – Spanish specialty pharmaceutical company, specialized in blood
plasma based products, on which it is the world leader, it also markets diagnostic
products.
- LABORATORIOS FARMACEUTICOS ROVI SA- Spanish pharmaceutical
company, which markets both proprietary and licensed products.
- DERMIRA Inc. - US based dermatology focused pharmaceutical company.
- PHARMA MAR SA - Spanish pharmaceutical company focused on oncology.
- ACLARIS THERAPEUTICS Inc. - US based dermatology focused pharmaceutical
company.
- VALEANT PHARMACEUTICAL INTERNATIONAL INC. - Canadian based
multinational company, specialized in dermatology among other therapeutic areas.
- ANACOR Pharmaceutical Inc. - US based aesthetic company.
- CYNOSURE INC. - US based aesthetic company.
- ZELTIQ AESTHTICS INC. - US based aesthetic company.

69
II: Amirall’s Consolidated Income Statement
Consolidated Incom
e Statement
20112012
20132014
20152016E
2017E2018E
2019E2020E
2021E2022E
2023E2024E
2025E2026E
Total Revenues
873900
8251407
769859
897940
9781007
10301052
10771103
11301084
Total Sales768
683693
786685
744786
832875
909936
964993
10221053
1084
Cost of Sales-291
-262-233
-235-215
-217-224
-233-242
-248-256
-263-271
-279-288
-296
Gross Profit
477421
460551
471528
562600
633661
680701
722743
765788
Other Incom
e105
217133
62184
115111
107103
9894
8885
8177
0R&
D-145
-160-127
-101-66
-72-76
-81-85
-88-91
-93-96
-99-102
-105
General and Adm
nistrative Costs-277
-353-379
-375-280
-290-304
-320-335
-347-357
-368-379
-390-402
-414
Other O
perating Expenses0
-2-2
-10-3
-2-2
-2-2
-2-2
-2-2
-2-2
-3
EBITD
A160
12485
686206
278291
304314
321324
325329
332336
267
Am
ort & D
ep-63
-68-69
-85-74
-70-120
-124-124
-124-124
-124-124
-124-124
-124
EBIT
9756
16602
131.42208
171181
191198
201202
205208
212143
Finan. Results-5
-5-5
-284
52
23
45
67
89
10
Impairm
ent Reversals/(Losses)-7
-2-5
-690
00
00
00
00
00
0
Restructuring Costs-10
0-80
0-8
00
00
00
00
00
0
Other Costs
00
-9-37
10
00
00
00
00
00
Gains on Sale of Assets
-3-1
-614
440
00
00
00
00
00
IBT
7249
-90482
173213
173183
194202
205208
212216
221153
Taxes
1228
56-34
-41-45
-33-36
-39-41
-42-43
-44-46
-47-19
Net Incom
e84
76-34
448132
169140
147155
160163
165168
171174
134

70
III: ALM’s Consolidated Balance Sheet
Consolidated B
alance Sheet2011
20122013
20142015
2016E2017E
2018E2019E
2020E2021E
2022E2023E
2024E2025E
Total Non-C
urrent Assets
9981046
14381433
13851768
17941789
17841779
17741769
17641759
1754
Goodwill271
270336
339347
347347
347347
347347
347347
347347
Intangible Assets
353358
595444
413701
724724
724724
724724
724724
724
PPE152
157161
132128
228236
236236
236236
236236
236236
Financial Assets
99
23179
181181
181181
181181
181181
181181
181
Deferred T
ax Assets
213251
322339
317312
307302
297292
287282
277272
266
Total Current A
ssets459
310335
11071147
871924
10191121
12231013
11201229
13411456
Inventories93
9298
8187
9399
104110
114118
121125
128132
Accounts Receivable
10699
99207
121128
136144
151157
162166
171176
182
Current Tax A
ssets23
5838
5868
7378
8286
9092
9598
101104
Current Investments
19017
8457
270270
270270
270270
270270
270270
270
Other Current A
ssets7
810
63
33
33
33
33
33
Cash and Cash Equivalents39
3681
298598
302339
415500
589368
464562
662765
Total Assets
14571356
17732540
25322639
27182808
29053003
27872889
29943101
3211
Shareholders Equity855
924888
13401463
15981706
18191938
20612186
23122440
25712704
Issued Capital20
2021
2121
2121
2121
2121
2121
2121
Share Premium
167194
220220
220220
220220
220220
220220
220220
220
Legal Reserve4
44
44
44
44
44
44
44
Other Reserves
584639
688655
10681167
13031409
15201637
17601884
20102138
2268
Valuation Adjustm
ents0
-7-6
-15-14
-14-14
-14-14
-14-14
-14-14
-14-14
Translation D
ifferences-4
-3-5
732
3232
3232
3232
3232
3232
Profit(Loss) for Year
8476
-34448
132169
140147
155160
163165
168171
174
Non-C
urrent Liabilities188
183486
840768
735703
670637
289256
223191
158125
Deferred Incom
e36.4
25.01.0
235202
182161
141121
10181
6140
200
Financial Liabilities76.0
71.8253.9
316316
316316
316316
00
00
00
Deferred T
ax Liabilities41.3
52.2135.2
127125
113100
8875
6350
3825
130
Retirement Benefit O
bligations15.4
15.752.4
6764
6464
6464
6464
6464
6464
Provisions19.2
18.314.8
2619
1919
1919
1919
1919
1919
Other N
on-Current Liabilities29.0
6943
4343
4343
4343
4343
4343
Current Liabilities
414249
398361
302305
310320
330653
346354
363372
381
Financial Liabilities202
027
44
40
00
3160
00
00
Trade Payables
149184
198218
225231
238248
257264
272280
289297
306
Current Tax Liabilities
2224
1833
1012
1314
1414
1515
1616
16
Other Current Liabilities
4042
154106
6358
5858
5858
5858
5858
58
Total Liabilities602
432884
12011070
10411013
990967
942602
577553
530506
Total Equity and Liabilities1457
13561773
25402532
26392718
28082905
30032787
28892994
31013211

71
IV: ALMIRALL’s Cash Flow Statement
V: Main Medical Products Information
Cash Flow Statements 2016E 2017E 2018E 2019E 2020E 2021E 2022E 2023E 2024E 2025EOperating Income 208 171 181 191 198 201 202 205 208 212Depreciation & Amortization -70 -120 -124 -124 -124 -124 -124 -124 -124 -124Changes in NWC -13 -5 -5 -3 -3 0 0 0 0 0Investment Other Operating Assets 75 178 181 179 178 179 180 179 179 178O perating Cash Flow 201 224 233 243 249 256 258 260 263 266CAPEX -509 -155 -124 -124 -124 -124 -124 -124 -124 -124Disposals 46 4 0 0 0 0 0 0 0 0Cash Flows from Investing Activities -463 -151 -124 -124 -124 -124 -124 -124 -124 -124Equity Instruments -35 -33 -33 -34 -36 -38 -38 -38 -39 -40Liability Instruments 0 -4 0 0 0 -316 0 0 0 0Net Cash Flows from Financing Activities -35 -37 -33 -34 -36 -353 -38 -38 -39 -40Cash Change -296 37 77 85 89 -221 96 98 100 103
Products Name Medical Condition Therapeutic Area Proprietary/Licensed
Eklira® and other (aclidinium bromide) COPD Pulmonary/Respiratory Diseases Proprietary
Ebastel® and other (ebastine) Allergy Pulmonary/Respiratory Diseases Proprietary
Oral Acne franchise (Monodox / Acticlate) Acne Dermatology Proprietary
Tesavel® & Efficib® (sitagliptine) Diabetis Type II Endocrinology Licensed
Almogran® and Other (Almotriptan) Migraine Neurology Proprietary
Solaraze® (diclofenac sodium) Actinic keratosis Dermatology, Oncology Licensed
Plusvent® (salmeterol & fluticasone) COPD and Asthma Pulmonary/Respiratory Diseases Licensed
Airtal® and Other (aceclofenac) Pain Musculoskeletal Proprietary
Decoderm® and others (flupredniden) Mycotic Dermatitis Dermatology Proprietary
Cordran® (flurandrenolide) Steroid responsive dermatoses Dermatology Proprietary
Almax® (almagate) Heartburn Gastroenterology Proprietary
Parapres® (candesartan cilexetile) Hearth Failure, Hypertension Cardiology/Vascular Licensed
Balneum® (urea oil) Dry and Itchy skin Dermatology Proprietary
Sativex® (delta-9-tetrahy drocannabinol) Multiple Sclerosis Neurology, Musculoskeletal Licensed
Ciclopoli® Onychomycosis Dermatology Proprietary
Veltin® Acne Dermatology Proprietary
Altabax® Impetigo Dermatology Proprietary

72
VI: R&D Valuation with Different Scenarios
Base scenarioProject
IndicationStatus
Estimated Launch
Years to Launch
Years to Peak Sales
Prob of SuccessPeak Sales (USD)
Prob weigh peak sales
Royalty RateProfitabilty
Prob Weigh Peak Profit
Discount Factor NPV
(euros)LA
S41008Plaque Psoriasis
III2017
27
64%50
32100%
8%2.68
1.653
P-3058O
nychomycosis
III2020
510
64%68
43100%
8%3.63
2.059
P-3073Nail psoriasis
III2020
510
64%54
35100%
8%2.90
2.047
P-3074M
ale andro alopII
20205
1041%
3816
100%8%
1.312.0
21Total
181
-25% peak sales
ProjectIndication
StatusEstim
ated LaunchY
ears to Launch Y
ears to Peak SalesProb of Success
Peak Sales (USD)Prob w
eigh peak salesRoyalty Rate
ProfitabiltyProb W
eigh Peak ProfitDiscount Factor
NPV(euros)
LAS41008
Plaque PsoriasisIII
20172
764%
3824
100%8%
2.011.6
40P-3058
Onychom
ycosisIII
20205
1064%
5132
100%8%
2.722.0
44P-3073
Nail psoriasisIII
20205
1064%
4126
100%8%
2.182.0
35P-3074
Male andro alop
II2020
510
41%29
12100%
8%0.98
2.016
Total135
+25% peak sales
ProjectIndication
StatusEstim
ated LaunchY
ears to Launch Y
ears to Peak SalesProb of Success
Peak Sales (USD)Prob w
eigh peak salesRoyalty Rate
ProfitabiltyProb W
eigh Peak ProfitDiscount Factor
NPV(euros)
LAS41008
Plaque PsoriasisIII
20172
764%
6340
100%8%
3.351.6
67P-3058
Onychom
ycosisIII
20205
1064%
8554
100%8%
4.532.0
74P-3073
Nail psoriasisIII
20205
1064%
6843
100%8%
3.632.0
59P-3074
Male andro alop
II2020
510
41%48
20100%
8%1.64
2.027
Total226

73
VII: Exchange rate risk
Exchange rate is present in ALM’s activity, mainly in cash inflows from US sales, the
payments related to AZN deal, clinical trials paid for in different currency, raw material
purchases, royalty payments in yens and payments made in local currency by the ALM’s
subsidiaries in Mexico, the UK, Poland, Canada, Denmark and the US.
Exchange risk affects 34.87% of revenues and 31.14% of cost of goods sold and other
operating costs. The company foresees collections and payments in foreign currency on a
quarterly basis. In 2015,
ALM reduced its exposure on foreign exchange risk on higher volume commercial
transactions by arranging hedge contracts related to yen purchases of raw materials and cash
inflows from US revenues, additionally any cash surplus in foreign currency are sold to avoid
exchange rate volatility that might affect the income statement.
VIII: Market Capitalization
In 29 of February, the Market capitalization was 2931,15 million Euros. ALM has 172951120
shares outstanding, the free float is 33,10% and the price close in 4 of January of 2016 was
18.4 Euros.
66.64% of shares are owned by WALTON, S.L. a private real estate family based in Madrid.
IX: Financial Debt
In March 2014, ALM issued 325 million Euros in bonds with maturity in 2021.
The book value of non-current financial liabilities is 316 Million. The bonds are traded in the
United States and in the Euro Bond Market.
In the beginning of 2016 the total book value of financial debt, current and non-current was
383,5 Million Euros.
X: Current Investments, Cash and Cash Equivalents
Liquid assets in the balance sheet include current investments, cash and cash equivalents. It
mainly includes shares and debt securities in other companies, deposits with short maturities,
investments in fixed income and equity funds, future payments related to the AZN deal and
available for sale financial assets.
The total amount of current investments cash and cash equivalents was 868 million Euros.
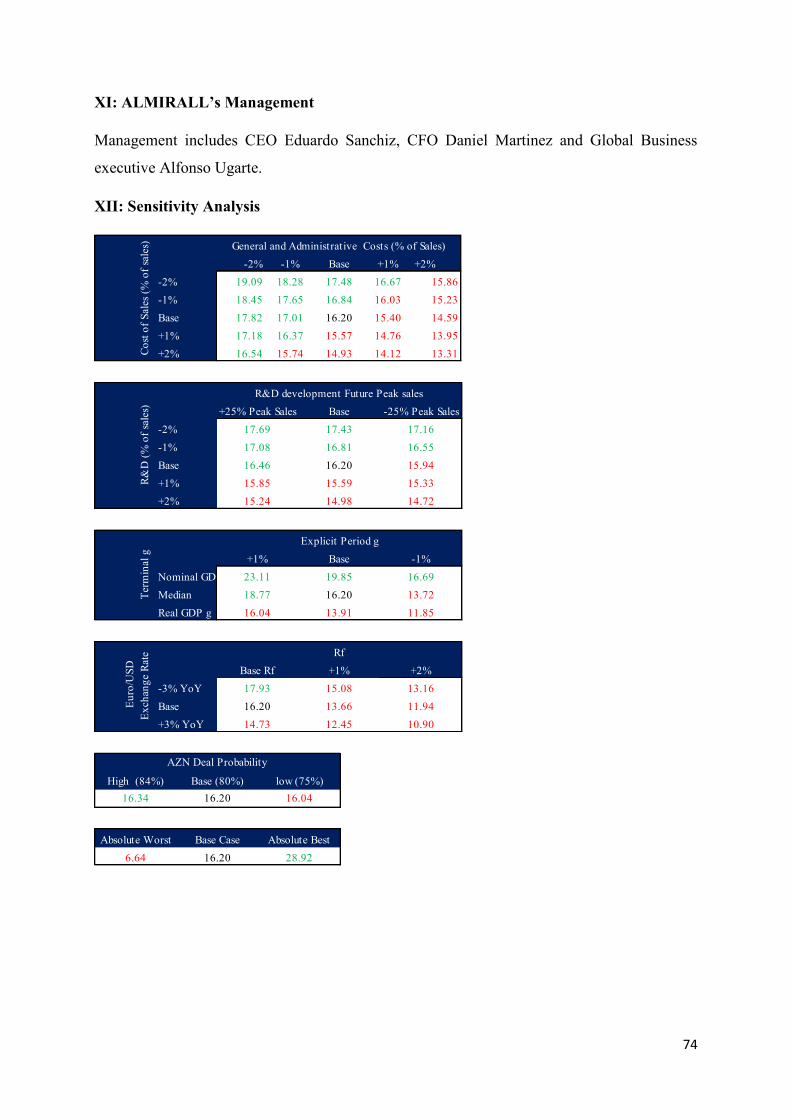
74
XI: ALMIRALL’s Management
Management includes CEO Eduardo Sanchiz, CFO Daniel Martinez and Global Business
executive Alfonso Ugarte.
XII: Sensitivity Analysis
-2% -1% Base +1% +2%-2% 19.09 18.28 17.48 16.67 15.86-1% 18.45 17.65 16.84 16.03 15.23Base 17.82 17.01 16.20 15.40 14.59+1% 17.18 16.37 15.57 14.76 13.95+2% 16.54 15.74 14.93 14.12 13.31Co
st of
Sal
es (%
of s
ales
) General and Administrative Costs (% of Sales)
+25% Peak Sales Base -25% Peak Sales-2% 17.69 17.43 17.16-1% 17.08 16.81 16.55Base 16.46 16.20 15.94+1% 15.85 15.59 15.33+2% 15.24 14.98 14.72
R&D
(% o
f sal
es)
R&D development Future Peak sales
+1% Base -1%Nominal GDP g 23.11 19.85 16.69Median 18.77 16.20 13.72Real GDP g 16.04 13.91 11.85
Term
inal
g
Explicit Period g
Base Rf +1% +2%-3% YoY 17.93 15.08 13.16Base 16.20 13.66 11.94+3% YoY 14.73 12.45 10.90
Euro
/USD
Ex
chan
ge R
ate Rf
High (84%) Base (80%) low (75%)16.34 16.20 16.04
AZN Deal Probability
Absolute Worst Base Case Absolute Best6.64 16.20 28.92

75
XIII: Therapeutic Area as Percentage of Sales.
XIV: Cost Structure as a Percentage of Sales
XV: ALMIRALL’s US Dermatology Unit EBITDA Margin
XVI: ALMIRALL’s EBITDA Margin, excluding US Dermatology
Year 2011 2012 2013 2014 2015 2016E 2017E 2018E 2019E 2020EDermatology Europe 15% 19% 19% 18% 21% 27% 27% 27% 27% 28%Dermatology USA 0% 0% 0% 14% 22% 22% 23% 24% 25% 26%Aesthetics 0% 0% 0% 0% 0% 4% 7% 9% 11% 12%Respiratory 24% 25% 30% 27% 15% 11% 10% 9% 9% 8%Gastro & Metabolism 20% 22% 21% 17% 18% 14% 13% 12% 11% 10%Other 41% 34% 29% 24% 24% 22% 20% 18% 17% 16%
Year 2011 2012 2013 2014 2015 E 2016E 2017E 2018E 2019E 2020ECost of Sales 37.88% 38.40% 33.64% 29.93% 31.31% 29.09% 28.47% 27.94% 27.64% 27.31%R&D 18.81% 23.36% 18.29% 12.79% 9.68% 9.68% 9.68% 9.68% 9.68% 9.68%General and Admin Costs 36.07% 51.62% 54.65% 47.71% 40.88% 39.01% 38.71% 38.45% 38.32% 38.18%Other op. Expenses 0.03% 0.29% 0.27% 1.26% 0.36% 0.29% 0.27% 0.25% 0.24% 0.23%Amort & Dep 8.22% 9.96% 10.02% 10.77% 10.85% 9.36% 15.22% 14.86% 14.14% 13.61%
Year 2015 2016E 2017E 2018E 2019E 2020ESales 150 162 182 203 216 231YoY 35% 8% 12% 11% 7% 7%Cost of Sales -14 -15 -16 -18 -20 -21Gross Profit 136 147 165 184 197 210General and Admnistrative Costs -47 -44 -50 -55 -59 -63R&D -15 -16 -18 -20 -21 -22EBITDA 75 87 98 109 117 124EBITDA Margin 50% 54% 54% 54% 54% 54%
Year 2015 2016E 2017E 2018E 2019E 2020Esales 535 467 459 453 451 451YoY -21% -13% -2% -1% -1% 0%Other income 84 115 111 107 103 98Cost of sales -201 -175 -172 -170 -169 -169Gross profit 334 292 286 283 281 282
General and Admnistrative costs -234 -200 -196 -194 -193 -193R&D -50 -45 -44 -44 -44 -44Other op exp -3 -2 -2 -2 -2 -2EBITDA 131 159 155 150 146 141EBITDA margin 24% 34% 34% 33% 32% 31%

76
XVII: THERMIGEN EBITDA Margin
XVIII: POLI GROUP EBITDA Margin
XIX: Revenue by Geographic area
Year 2016E 2017E 2018E 2019E 2020ESales 30 53 77 100 111YoY 0% 78% 44% 30% 11%Cost of Sales -9 -17 -24 -31 -35Gross Profit 21 37 53 69 76General and Admnistrative Costs -12 -21 -31 -40 -44R&D -3 -5 -7 -10 -11EBITDA 6 10 15 19 21EBITDA Margin 19% 19% 19% 19% 19%
Year 2016E 2017E 2018E 2019E 2020ESales 85 93 100 108 116YoY 9% 8% 8% 8%Cost of Sales -17 -19 -20 -22 -23Gross Profit 68 74 80 86 93General and Admnistrative Costs -34 -37 -40 -43 -46R&D -8 -9 -10 -10 -11EBITDA 26 28 30 33 35EBITDA Margin 30% 30% 30% 30% 30%
Geographic area 2011 2012 2013 2014 2015Spain 50% 41% 38% 30% 32%Europe excluding Spain 37% 42% 44% 35% 35%North America 10% 14% 16% 17% 25%Other 2% 3% 3% 6% 8%
Copyright © 2022 FDOKUMEN