Epidemiology of Renibacterium salmoninarum in wild Arctic charr and brown trout in Iceland
18
Journal of Fish Biology (1998) 53, 322–339 Article No. jb980706 Epidemiology of Renibacterium salmoninarum in wild Arctic charr and brown trout in Iceland H. J ´ ´ *, H. J. M², S. S. S‡, G. G§ S. G ´ * *Institute for Experimental Pathology, University of Iceland, Keldur, IS–112, Reykjavı ´k, Iceland ²Natural History Museum of Ko ´pavogur, Digranesvegur 12, 200 Ko ´pavogur, Iceland ‡Institute of Biology, University of Iceland, Grensa ´svegur 11, IS–108 Reykjavı ´k, Iceland and §Institute of Freshwater Fisheries, Vagnho ¨fda 7, IS–112 Reykjavı ´k, Iceland (Received 18 August 1997, Accepted 31 March 1998) Renibacterium salmoninarum (Rs) is common in wild Arctic charr Salvelinus alpinus and brown trout Salmo trutta in Iceland. Of 22 charr and nine trout populations none were free of Rs antigens. In two charr populations only one fish exceeded the Rs antigen detection limit and in one of these cases the ELISA value was within uncertainty limits of the infection criterion. Mean prevalence of infection was 46% for Arctic charr (range: 3–100%) and 35% for brown trout (range: 6–81%). No infected fish showed gross pathological signs of bacterial kidney disease (BKD). The ubiquity and high prevalences of infection indicated that the bacterium has been endemic for a long time, and is probably a normal, low density resident in the fish. A lack of correlation in mean intensity of Rs antigen and prevalence of infection between sympatric populations of Arctic charr and brown trout suggests that the dynamics of infection and internal proliferation of bacteria can be quite independent in the two species even if they live in the same lake. Rs intensity and its coefficient of variation decreased with age in older fish, suggesting a connection between Rs intensity and host mortality. However, this can be caused by other ecological factors that decrease survival, especially low food availability, which simultaneously increase the susceptibility to Rs infection and internal proliferation. ? 1998 The Fisheries Society of the British Isles Key words: bacterial kidney disease; epidemiology; Salmonidae; life history; ecology. INTRODUCTION Research on bacterial and viral diseases has been confined mainly to aquaculture environment, and less has been done to assess their epidemiology in natural environment (Austin & Austin, 1993). Bacteria and viruses are integral com- ponents of the natural environment and may be expected to be influenced by ecological processes within lake ecosystems in a similar way as larger parasites are (Curtis, 1982; Frandsen et al., 1989; Dorucu et al., 1995). Systematic studies of the epidemiology of infective micro-organisms in nature have a bearing on policy making in aquaculture, and in stocking and conservation of freshwater fish. Bacterial kidney disease (BKD), caused by the Gram-positive bacterium Renibacterium salmoninarum (Sanders & Fryer, 1980), Rs, is one of the most serious diseases in salmonid farming in the Atlantic and Pacific region (Margolis & Evelyn, 1987; Fryer & Lannan, 1993; Olea et al., 1993). It can be acute to chronic and infections can occur over a wide range of temperature (Sanders 322 0022–1112/98/080322+18 $30.00/0 ? 1998 The Fisheries Society of the British Isles
Transcript of Epidemiology of Renibacterium salmoninarum in wild Arctic charr and brown trout in Iceland

Journal of Fish Biology (1998) 53, 322–339Article No. jb980706
Epidemiology of Renibacterium salmoninarum in wild Arcticcharr and brown trout in Iceland
H. J*, H. J. M†, S. S. S‡, G. G§ S. G*
*Institute for Experimental Pathology, University of Iceland, Keldur, IS–112, Reykjavık,Iceland
†Natural History Museum of Kopavogur, Digranesvegur 12, 200 Kopavogur, Iceland‡Institute of Biology, University of Iceland, Grensasvegur 11, IS–108 Reykjavık, Iceland
and §Institute of Freshwater Fisheries, Vagnhofda 7, IS–112 Reykjavık, Iceland
(Received 18 August 1997, Accepted 31 March 1998)
Renibacterium salmoninarum (Rs) is common in wild Arctic charr Salvelinus alpinus and browntrout Salmo trutta in Iceland. Of 22 charr and nine trout populations none were free of Rsantigens. In two charr populations only one fish exceeded the Rs antigen detection limit and inone of these cases the ELISA value was within uncertainty limits of the infection criterion.Mean prevalence of infection was 46% for Arctic charr (range: 3–100%) and 35% for browntrout (range: 6–81%). No infected fish showed gross pathological signs of bacterial kidneydisease (BKD). The ubiquity and high prevalences of infection indicated that the bacterium hasbeen endemic for a long time, and is probably a normal, low density resident in the fish. A lackof correlation in mean intensity of Rs antigen and prevalence of infection between sympatricpopulations of Arctic charr and brown trout suggests that the dynamics of infection andinternal proliferation of bacteria can be quite independent in the two species even if they live inthe same lake. Rs intensity and its coefficient of variation decreased with age in older fish,suggesting a connection between Rs intensity and host mortality. However, this can be causedby other ecological factors that decrease survival, especially low food availability, whichsimultaneously increase the susceptibility to Rs infection and internal proliferation.
? 1998 The Fisheries Society of the British Isles
Key words: bacterial kidney disease; epidemiology; Salmonidae; life history; ecology.
INTRODUCTION
Research on bacterial and viral diseases has been confined mainly to aquacultureenvironment, and less has been done to assess their epidemiology in naturalenvironment (Austin & Austin, 1993). Bacteria and viruses are integral com-ponents of the natural environment and may be expected to be influenced byecological processes within lake ecosystems in a similar way as larger parasitesare (Curtis, 1982; Frandsen et al., 1989; Dorucu et al., 1995). Systematic studiesof the epidemiology of infective micro-organisms in nature have a bearing onpolicy making in aquaculture, and in stocking and conservation of freshwaterfish.
Bacterial kidney disease (BKD), caused by the Gram-positive bacteriumRenibacterium salmoninarum (Sanders & Fryer, 1980), Rs, is one of the mostserious diseases in salmonid farming in the Atlantic and Pacific region (Margolis& Evelyn, 1987; Fryer & Lannan, 1993; Olea et al., 1993). It can be acute tochronic and infections can occur over a wide range of temperature (Sanders
322
0022–1112/98/080322+18 $30.00/0 ? 1998 The Fisheries Society of the British Isles

. 323
et al., 1978; Mitchum et al., 1979). Rs survives intracellularly and is transmittedboth horizontally and vertically (Wood & Wallis, 1955; Bullock et al., 1978;Evelyn et al., 1986).
Infections by Rs have been recorded in wild fish populations (Smith, 1964;Pippy, 1969; Evelyn et al., 1973; Wood, 1974; Ellis et al., 1978; Mitchum et al.,1979; Paterson et al., 1981; Banner et al., 1986; Souter et al., 1987; Sanders et al.,1992; Meyers et al., 1993), and in some cases clinical signs of BKD have beenobserved (Smith, 1964; Pippy, 1969; Evelyn et al., 1973; Mitchum et al., 1979;Banner et al., 1986; Souter et al., 1987). The transmission of BKD between wildand farmed fish has been demonstrated (Mitchum & Sherman, 1981).
In Iceland there are three native species of salmonids, Arctic charr Salvelinusalpinus (L.), brown trout Salmo trutta L. and Atlantic salmon S. salar L., andone imported species, rainbow trout Oncorhynchus mykiss (Walbaum). Rs hasbeen detected sporadically in wild salmonids, but outbreaks of BKD have beendocumented only in intensive salmonid culture. That Rs has been detected inwild fish in Iceland is taken into account in salmonid stocking schemes andaquaculture (Gudmundsdottir et al., 1993; Jonsdottir et al., unpubl.). Thepresent study examined the association of prevalence of infection and intensitiesof Rs antigens with age, length, condition factor, sex and maturity stage of fishin wild populations of Arctic charr and brown trout from 23 lakes. Infectionpatterns of Rs in the fish populations were also analysed in relation to ecological,limnological and geological features of the lakes.
MATERIALS AND METHODS
SAMPLING OF MATERIALArctic charr (691 from 22 populations), brown trout (261 from nine populations),
benthic invertebrates and zooplankton were collected and 12 abiotic variables weremeasured in 23 lakes across the country in August 1993, 1994 and 1995 (Fig. 1, Table I).Sampling procedures were as described for the Ecological Survey of Icelandic Lakes(Malmquist et al., unpublished).
To screen for Rs, sterile kidney samples were excised from individual charr and troutand kept on ice for up to 6 h, and frozen at "20) C until processed for an enzyme linkedimmunoabsorbant assay (ELISA) test.
ELISAThe sample process and the ELISA test included a built in correction for non-specific
binding to the catching antibody (Gudmundsdottir et al., 1993).To establish a negative/positive threshold, ELISA values (E values) from Rs negative
charr stocks from eight fish farms where Rs has never been detected were used as areference. The threshold was defined at the upper 99% confidence limit (CL) of thefrequency distributions of E values from the negative fish (n=349). A fish was thereforejudged infected if it had an E value >0·050 (Fig. 2).
In the preparation of negative controls for the ELISA test, pools of samples fromArctic charr, brown trout and salmon were used. Repeated measurements of the negativetest pool in 1994 were used to assess the accuracy of the ELISA. The mean of 33measurements repeated in 11 different tests had a 95% CL of &0·0024, and the 95% CLof measurements were &0·0139.
In preparation of the positive control, bacterial growth was collected from an agarplate and suspended in 10 ml of phosphate buffered saline (PBS), then 250 ìl of HemoDe(terpene and butylated hydroxyanisole, Fisher Scientific, Pittsburg, PA, U.S.A.) were

324 . .
added, and the suspension heated at 100) C for 15 min. After centrifugation, thesupernatant was collected and tested in an ELISA in twofold dilution steps between 1 : 32and 1 : 1024. Each sample was tested twice. The relationship between E values and thetwofold dilution steps of the bacterial sample test was examined by regression analysis. Ahighly significant, positive linear correlation was observed (r2=0·983, P<0·001), hence themore bacteria present in a sample, the higher the E value.
F. 1. Map of Iceland showing major geological zones and sites of lakes analysed (numbers in circlesrefer to names of lakes, see Table I). A, Areas dominated by post-Glacial (<0·01 million years)basalt lavas; B, areas dominated by Pleistocene (0·01–3·1 M years) basalt formations; C, areasdominated by Upper Tertiary (>3·1 million years) basalt formations (modified from Johannessonand Sæmundsson, 1989).
DATA HANDLING AND EXAMINATIONPrevalence of infection (%, of fish with E value >0·050) and intensity of Rs antigens (E
values) were analysed with respect to the following variables of fish: species; age (year);fork length (cm); wet weight (g); Fulton’s condition factor; sex and maturity stage (fishwith maturity stage >2 are prospective spawners). Fulton’s condition factor wascalculated from: K=100 WLF
"3, where W is wet weight (g) and LF is fork length (cm).For ecological variables, prevalence and E values of fish were analysed with respect to:density of benthic macroinvertebrates (animals retained in a 250-ìm sieve) in the rockysurf zone (0·2–0·5 m depth); density of benthic macroinvertebrates in the soft sedimentzone (>0·5 m depth); density (no. ind 10 l"1) of zooplankton in the pelagic zone; acidity(pH); electrolytic conductivity (indicator of the amount of dissolved nutrient salts);temperature; height above sea level; mean depth; volume; catch of fish per unit effort(indicator of fish density); number of sympatric salmonids; access from sea; stocking offish (a possible way of transmission of Rs between populations); geographical location;and type of bedrock in catchment area.
In statistical analyses of E values, all comparions were performed on ln- or arcsine-transformed data, which conformed to normality.

T
I.L
akes
anal
ysed
(no.
inpa
rent
hese
sre
fer
tosi
teof
lake
,cf
.F
ig.
1)an
dbi
otic
and
abio
tic
vari
able
sof
the
lake
s
Lak
eY
ear
Loc
Hei
ght
Sea
Bdr
cC
ond
pHT
Md
Vol
cpue
SdSt
ock
Hıt
arv.
(1)
1994
114
71
156
6·4
12·4
8·8
671·
12
3(3
)O
ddas
tada
v.(2
)19
941
650
171
7·1
14·2
5·4
161·
62
1B
aula
rval
lav.
(3)
1994
119
30
253
7·0
12·8
17·7
280·
61
1V
atns
holt
sv.
(4)
1994
110
11
109
7·1
15·2
1·0
0,3
1·2
33
(3)
Hau
kada
lsv.
(5)
1994
137
11
567·
314
·823
·478
0·9
23
(3)
Oune
fnt
v.(6
)19
952
470
01
407·
68·
52·
51
0·1
11
Hog
nav.
(7)
1995
241
00
140
7·9
7·4
2·0
10·
71
1T
hidr
iksv
alla
v.(8
)19
952
730
184
8·0
9·3
30·0
450·
72
1Sv
ınav
.(9
)19
932
123
11
997·
610
·712
·514
72·
63
2(3
)M
yv.
(10)
1993
327
70
318
69·
311
·52·
490
23
(1,2
)K
otlu
v.(1
1)19
933
00
249
507·
68·
43·
04
0·9
11
Sigu
rdar
stad
av.
(12)
1993
30
02
313
8·4
8·0
1·3
20·
41
1H
raun
hafn
arv.
(13)
1993
30
02
112
7·3
9·2
2·0
91·
52
1Y
.-D
eild
arv.
(14)
1993
338
12
927·
910
·61·
51
1·2
32
(3)
St.-
Vid
arv.
(15)
1993
315
10
285
8·1
7·9
15·0
61·
41
1Sæ
naut
av.
(16)
1994
352
40
286
9·4
9·8
7·8
180·
91
0Au
nav.
(17)
1994
352
10
262
11·1
11·2
6·0
290·
61
0E
idav
.(1
8)19
943
320
164
6·7
13·8
4·4
51·
62
0U
rrid
av.
(19)
1994
338
01
989·
814
·64·
45
0·1
10
Apa
v.(2
0)19
934
591
283
11·2
1·5
200·
62
3(1
)T
hing
valla
v.(2
1)19
944
101
03
798·
89·
031
·128
552
3(2
)Uu
lfljo
tsv.
(22)
1993
479
03
808·
89·
04·
717
3·6
23
(2)
Elli
dav.
(23)
1993
173
03
918·
810
·91·
02
2·0
33
(2,3
)
Yea
r,Y
ear
ofsa
mpl
ing;
Loc
,geo
grap
hica
lloc
atio
nof
lake
(1,w
est
Icel
and;
2,W
estf
jord
san
dno
rth-
wes
tIc
elan
d;3,
nort
han
dno
rth-
east
Icel
and;
4,so
uth
Icel
and)
;H
eigh
t,he
ight
(m)
ofla
keab
ove
sea
leve
l;Se
a(0
,no
acce
ssfr
omse
a;1,
acce
ssfr
omse
a:B
drck
,B
edro
ckty
pe[1
,U
pper
Ter
tiar
yba
salt
rock
s(>
3·1
mill
ion
year
s);
2,P
leis
toce
neba
salt
form
atio
ns(0
·01–
3·1
mill
ion
year
s);3
,pos
t-gl
acia
llav
as(<
0·01
mill
ion
year
s)];
Con
d,el
ectr
olyt
icco
nduc
tivi
tyof
lake
(ìS
cm"
1);
T,l
ake
tem
pera
ture
()C
);M
d,m
ean
dept
h(m
)of
lake
;V
ol,
volu
me
(Gl)
ofla
ke;
cpue
,ca
tch
per
unit
effor
t;Sd
,sa
lmon
dive
rsit
y(n
o.of
sym
patr
icsa
lmon
idsp
ecie
s:1,
sing
lesp
ecie
s;2,
two
spec
ies;
3,th
ree
spec
ies)
;St
ock,
stoc
king
offis
hin
tola
ke(0
,no
stoc
king
;1,
unlik
ely;
2,lik
ely;
3,Y
es.
Num
bers
inpa
rent
hese
sre
fer
tost
ocke
dsp
ecie
s;1,
Arc
tic
char
r;2,
brow
ntr
out;
3,A
tlan
tic
salm
on).
Hei
ght,
Md,
and
Vol
base
don
Ada
lste
inss
on(1
990)
and
own
mea
sure
men
ts.
Bdr
cis
mod
ified
from
Joha
nnes
son
and
Sæm
unds
son
(198
9).

326 . .
F. 2. Frequency distributions of E values (intensity of Rs antigens) in (a) all lakes pooled and [(b)–(f)]selected lakes with different infection profiles (-, Arctic charr; +, brown trout). Infected fish haveE values >0·050. A reference sample of farmed Arctic charr stocks free of Rs antigens (.) is alsodisplayed with the pooled data (a). Note the change in scale in E values above 0·25.
RESULTS
Antigens of Rs were detected in kidneys of Arctic charr and brown trout fromall 23 lakes sampled (Fig. 2, Table II). No gross pathological changes of BKDwere observed.
Prevalence of infected charr (E value >0·05) ranged between 3% and 100%,and between 6% and 81% for brown trout, and mean E values ranged between0·013 and 0·228, and between 0·018 and 0·082 for charr and brown trout,respectively (Table II, Fig. 2). There was a significant difference among lakes inE values for both Arctic charr (overall analysis of variance, ANOVA,F21,669=16·055, P<0·001) and brown trout (overall ANOVA, F9,251=5·476,

T
II.
Pre
vale
nce
(P,
%)
ofin
fect
edfis
h(E
valu
e>
0·05
)an
dm
ean
ofE
valu
es(M
E)
ofal
lfis
h
Lak
eA
rcti
cch
arr
Bro
wn
trou
t
PM
EL
1L
2M
axn
PM
EL
1L
2M
axn
Auna
v.3
0·01
30·
009
0·01
90·
551
29A
pav.
30·
014
0·01
10·
018
0·06
033
Myv
.*4
0·01
90·
014
0·02
50·
098
26Y
.-D
eild
arv.
140·
021
0·01
40·
032
0·15
629
270·
030
0·02
40·
038
0·10
230
Elli
dav.
160·
025
0·01
80·
035
0·07
032
130·
029
0·02
30·
037
0·24
530
Hra
unha
fnar
v.10
0·02
80·
022
0·03
60·
091
30St
.-V
idar
v.17
0·03
30·
026
0·04
20·
086
29Uu
lfljo
tsv.
300·
034
0·02
00·
056
0·48
020
Thi
drik
sval
lav.
†49
0·04
20·
027
0·06
60·
340
33E
idav
.40
0·04
30·
033
0·05
60·
086
2017
0·02
60·
018
0·03
70·
409
30U
rrid
av.
530·
046
0·03
20·
065
0·34
030
Hau
kada
lsv.
560·
046
0·02
70·
075
0·35
132
Sigu
rdar
stad
av.
520·
050
0·03
80·
066
0·17
625
Sæna
utav
.58
0·05
80·
047
0·07
20·
155
26O
ddas
tada
v.57
0·05
90·
046
0·07
50·
373
3781
0·08
20·
056
0·11
92·
603
30T
hing
valla
v.53
0·06
20·
049
0·07
83·
044
9758
0·04
70·
023
0·09
40·
256
12H
ıtar
v.65
0·06
90·
053
0·09
10·
664
3748
0·04
40·
029
0·06
70·
265
31K
otlu
v.76
0·08
80·
070
0·11
10·
233
21Sv
ınav
.94
0·10
40·
082
0·13
20·
302
1833
0·03
80·
027
0·05
30·
492
27H
ogna
v.90
0·10
60·
083
0·13
51·
091
39V
atns
holt
sv.
770·
110
0·07
90·
155
1·74
730
60·
018
0·01
40·
023
0·07
333
Oune
fnt
v.10
00·
228
0·13
90·
374
2·35
315
Bau
larv
alla
v.28
0·03
00·
018
0·04
91·
901
35M
ean
460·
047
0·04
30·
082
2235
0·03
60·
026
0·05
79
The
lake
sar
era
nked
inas
cend
ing
orde
rof
ME
ofA
rcti
cch
arr.
L1
and
L2
are
low
eran
dup
per
95%
CL
ofM
E.
Max
,m
axim
umE
valu
ein
fish.
nis
num
ber
offis
han
alys
ed.
*Bro
wn
trou
tis
also
pres
ent
inL
ake
Myv
atn
but
was
not
sam
pled
.†O
neun
infe
cted
brow
ntr
out
from
lake
Thi
drik
sval
lava
tn,
the
only
brow
ntr
out
caug
htth
ere,
isno
tin
clud
edin
the
tabl
e.

328 . .
P<0·001). For Arctic charr, maximum E values in individual fish within lakesranged between 0·060 and 3·044, and between 0·073 and 2·603 for brown trout(Table II).
E values and prevalence were correlated positively for infected charr[Pearsons’s r=0·725, d.f.=19, P<0·01, one outlier (fish) from Aunavatn excluded]but not for trout, (r=0·250, d.f.=6, P>0·05).
Overall Arctic charr had higher E values (t=3·975, d.f.=950, P<0·001) andprevalence of infection (G=13·551, d.f.=1, P<0·001) than did trout (see TableII). In the eight lakes pooled where the species co-occur (Myvatn charr notincluded because trout was not sampled there), the difference was even moremarked (mean E value: charr=0·055, trout=0·035, t=5·134, d.f.=525, P<0·001,prevalence: charr=53%, trout=33%, G=21·976, d.f.=1, P<0·001). However, wefound no significant association in prevalence of infection or mean E valuesbetween charr and trout in these eight lakes (prevalence: r=0·225, d.f.=6,P>0·05; mean E value: r=0·044, d.f.=6, P>0·05), but such association would beexpected if interspecific infections were frequent.
INFECTION AND LIFE HISTORY OF FISHA second-order regression accounted significantly for variation of log-
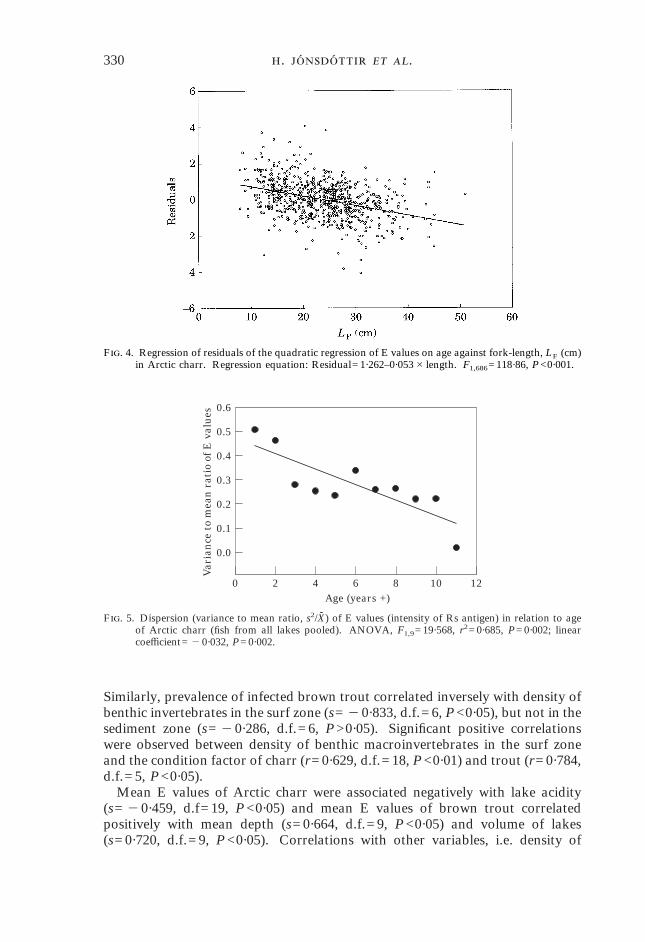
transformed E values with age in charr (F2,685=18·713, P<0·001), but not introut (F2,208=2·881, P=0·058) (Fig. 3). Negative, linear relationships were foundbetween E values and length in both charr (regression coefficient= "0·051,t= "10·078, P<0·001) and trout (regression coefficient= "0·042, t= "5·606,P<0·001). The strength and independence of the relationship between E valuesand length in Arctic charr was investigated further by regressing residuals of thequadratic regression of E values on age against length. The effect of fish lengthwas still highly significant after removing the effect of age (F1,686=118·860,P<0·001) (Fig. 4).
Highly significant differences were found in age, length and condition factorof charr among lakes (ANOVAs, age: F21,666=26·304, P<0·001; length:F21,669=15·486, P<0·001; condition: F21,669=9·960, P<0·001). A closer inspec-tion on a lake basis (Table III) showed that E values were correlated significantlywith age in nine lakes (41%), length in 13 lakes (59%) and condition factor inthree lakes (14%). However, the sign of the correlation coefficients differedamong lakes (Table III). In general, in lakes where the fish population wascomposed of relatively young individuals, E values and age of fish increasedtogether, but in lakes with a relatively high mean age, E values decreased withincreasing age of fish. Furthermore, dispersion of Rs antigen levels, measured asvariance to mean ratio of Rs antigen intensity (E value), declined with increasingage of charr (Fig. 5).
Infected charr were significantly shorter than uninfected fish in five lakes;significantly younger than uninfected fish in two lakes, but significantly older intwo lakes (Table IV). No difference was found in mean age, length or conditionfactor between infected and uninfected brown trout.
With respect to sex neither charr nor trout differed in prevalence of infection(all G-statistics with P>0·05) or in E values (all lakes combined) (charr: t=1·858,d.f.=680, P=0·064; trout: t=1·541, d.f.=218, P=0·125). There was a significantdifference in E values, between prospective spawners (maturity stage >2, mean E

. 329
value=0·063) and non-spawners (mean E value=0·034) among charr (t=7·547,d.f.=647, P<0·001), but not among trout (mean E value of prospective spawn-ers=0·029, for non-spawners=0·036, t=1·274, d.f.=196, P=0·204). Similarly,prevalence of infection was higher in prospective spawners among charr(G=30·326, P<0·001) but not among trout (G=1·177, P>0·05).
INFECTION AND LAKE ECOLOGYFor charr, mean E values were associated with density of macroinvertebrates
in the surf and sediment zones of lakes (Fig. 6). Prevalence of infected charr alsocorrelated inversely with density of macroinvertebrates in the surf zone(s= "0·617, d.f.=18, P<0·01) and the deeper sediment zone (s= "0·667,d.f.=18, P<0·01). For trout, mean E values correlated negatively with density ofbenthic invertebrates in the surf zone, but not in the sediment zone (Fig. 6).
F. 3. A plot of ln-transformed E values (the intensity of Rs antigens) v. the age of the host. The curvesgive the least squares second-order fit to the data. (a) Pooled data for Arctic charr in 22 lakes(quadratic coefficient of regression= "0·029, P<0·001). (b) Pooled data for brown trout in sevenlakes (quadratic coefficient of regression= "0·041, P<0·001). For brown trout, age was notavailable from Lake Baularvallavatn.
330 . .
F. 4. Regression of residuals of the quadratic regression of E values on age against fork-length, LF (cm)in Arctic charr. Regression equation: Residual=1·262–0·053#length. F1,686=118·86, P<0·001.
12
0.6
0.0
0Age (years +)
Var
ian
ce t
o m
ean
rat
io o
f E
val
ues
10
0.4
0.5
0.3
0.2
0.1
2 4 6 8
F. 5. Dispersion (variance to mean ratio, s2/Xz ) of E values (intensity of Rs antigen) in relation to ageof Arctic charr (fish from all lakes pooled). ANOVA, F1,9=19·568, r2=0·685, P=0·002; linearcoefficient= "0·032, P=0·002.
Similarly, prevalence of infected brown trout correlated inversely with density ofbenthic invertebrates in the surf zone (s= "0·833, d.f.=6, P<0·05), but not in thesediment zone (s= "0·286, d.f.=6, P>0·05). Significant positive correlationswere observed between density of benthic macroinvertebrates in the surf zoneand the condition factor of charr (r=0·629, d.f.=18, P<0·01) and trout (r=0·784,d.f.=5, P<0·05).
Mean E values of Arctic charr were associated negatively with lake acidity(s= "0·459, d.f=19, P<0·05) and mean E values of brown trout correlatedpositively with mean depth (s=0·664, d.f.=9, P<0·05) and volume of lakes(s=0·720, d.f.=9, P<0·05). Correlations with other variables, i.e. density of

. 331
T III. Correlation (Pearson’s r) between intensity of E values and age, length andcondition factor of Arctic charr; the lakes are ranked in ascending order of mean age
Lake P MeanE value
Meanage
Pearson’s r
Age Length Condition n
Apav. 3 0·014 2·7 0·565 ** 0·649 ** 0·343 * 33Myv. 4 0·019 3·0 0·181 0·224 0·073 26Vatnsholtsv. 77 0·110 3·1 "0·372 * "0·449 * "0·171 30Kotluv. 76 0·088 3·2 0·224 0·369 0·255 21Ellidav. 16 0·025 3·5 0·588 ** 0·618 ** 0·393 * 32Urridav. 53 0·046 3·8 "0·017 "0·113 "0·177 30Hraunhafnarv. 10 0·028 3·9 0·517 ** 0·544 ** "0·055 30Y.-Deildarv. 14 0·021 4·1 "0·183 "0·380 * "0·205 29Oddastadav. 57 0·059 4·5 "0·100 "0·212 0·165 37Haukadalsv. 56 0·046 4·6 0·508 ** "0·813 ** "0·421 * 32Svınav. 94 0·104 4·8 0·395 "0·195 "0·223 18Sigurdarstadav. 52 0·050 4·9 "0·564 ** "0·689 ** "0·361 25Aunav. 3 0·013 5·4 "0·383 * "0·427 * "0·250 29St.-Vidarv. 17 0·033 5·9 0·025 "0·496 ** "0·068 29Thingvallav. 53 0·062 6·3 "0·091 "0·315 ** "0·098 97Hıtarv. 65 0·069 6·5 0·372 * 0·245 0·073 37Ounefnt v. 100 0·228 6·5 "0·101 0·115 "0·241 15Hognav. 90 0·106 6·6 "0·101 "0·550 ** "0·072 39Eidav. 40 0·043 6·8 "0·162 "0·233 "0·298 20Sænautavy. 58 0·058 7·3 "0·168 "0·144 0·336 26Uu lfljotsv. 30 0·034 7·4 "0·128 "0·467 * 0·063 20Thidriksvallav. 0 7·8 "0·505 ** "0·697 ** "0·178 33
P, prevalence (%) of infection. n, Sample size. *P<0·05; **P<0·01.
T IV. Mean age, mean length and mean condition factor of infected and uninfectedArctic charr
LakeAge (+ years) Length (cm) Condition
nUninf. Infect. P Uninf. Infect. P Uninf. Infect. P
Stora-Vidarv. 6·1 5·2 NS 24 16 ** 1·007 0·984 NS 27Uu lfljotsv. 7·5 7·2 NS 29 20 ** 1·142 1·118 NS 18Thidriksvallav. 8·9 6·6 * 29 16 *** 1·114 1·026 * 30Haukadalsv. 3·8 5·2 * 28 18 *** 1·085 0·986 * 30Sigurdarstadav. 5·7 4·2 ** 41 28 *** 1·106 1·026 NS 23Hıtarv. 5·8 6·9 * 25 28 * 1·048 1·055 NS 35
Only lakes with significant differences in intensities of E values between infection classes are shown.Based upon Kruskall–Wallis test (not tested if n<5).
n, Sample size; NS, not significant. P>0·05; *P<0·05; **P<0·01; ***P<0·001.
zooplankton in the pelagic zone, electrolytic conductivity, lake temperature,height above sea level, or catch of fish per unit effort, were not significant(P>0·05) for either charr or trout.

332 . .
150 000
6
20
Mean no. macroinvertebr m–2 in sediment zone
Mea
n o
f ln
(E
val
ue
× 10
3 + 1
)
5
4
3
50 000 100 000
(b)
40 000
6
20
5
4
3
10 000 20 000 30 000
(a)
Mean no. macroinvertebr m–2 in surf zone
F. 6. A plot of mean ln-transformed E values (intensity of Rs antigens) in Arctic charr (-), (n=20) andbrown trout (,), (n=8) v. (a) density of benthic macroinvertebrates in the surf zone of lakes and(b) density of benthic macroinvertebrates in the sediment zone of lakes. For Arctic charr,Spearman’s s= "0·639 (P<0·01) in the surf zone, and "0·659 (P<0·01) in the sediment zone. Forbrown trout, Spearman’s s= "0·714 (P<0·05) in the surf zone, and "0·286 (P>0·05) in thesediment zone. Data on invertebrates was not available for Lake Myvatn and LakeThingvallavatn.
Mean prevalences (mean of mean prevalences) and mean E value (mean ofmean E values) for charr in lakes situated on basic bedrocks from Upper Tertiarywas significantly higher than in lakes of areas dominated by Pleistocene basaltformations (probabilities from Tukey’s multiple comparisons, prevalence:P=0·019; mean E values: P=0·021) and in areas dominated by postglacial lavas(prevalence: P=0·048; mean E values: P=0·041) (Table V). Furthermore, inlakes on Upper Tertiary bedrock, the density of benthic macroinvertebrates inthe surf zone (mean=5·268 animals m"2) was significantly lower than in surfzones of lakes on Pleistocene bedrock (mean=9·861 animals m"2) or onPost-Glacial lavas (mean=21·344 animals m"2) (F2,18=3·980, P=0·037).Similar differences were observed for densities of benthic invertebrates in thesediment zone.
Infection in charr also differed geographically (Table V). Prevalence wassignificantly higher in north-west Iceland than in north and north-east

T
V.
Mea
npr
eval
ence
(MP
,%
)of
infe
cted
fish
(Eva
lue
>0·
05)
and
mea
nof
Eva
lues
(ME
,m
ean
ofm
eans
)of
all
fish
amon
gla
kes,
grou
ped
byec
olog
cial
vari
able
s
Eco
logi
cal
vari
able
Arc
tic
char
rB
row
ntr
out
MP
ME
nM
PM
En
Bed
rock
type
Upp
erT
erti
ary
basa
lt66
0·07
410
370·
037
5P
leis
toce
neba
salt
290·
034
828
0·03
12
Pos
t-gl
acia
lla
vas
260·
033
436
0·03
82
F5·
739*
*5·
369*
*22
0·01
9N
S0·
121
NS
9G
eogr
aphi
cal
loca
tion
Wes
tIc
elan
d54
0·05
75
350·
037
5W
estf
jord
san
dno
rth-
wes
tIc
elan
d83
0·10
34
330·
038
1N
orth
and
nort
h-ea
stIc
elan
d30
0·03
610
220·
029
2So
uth
Icel
and
290·
032
358
0·04
71
F5·
565*
*3·
579*
220·
520
NS
0·24
6N
S9
Acc
ess
from
sea
No
acce
ss43
0·04
716
390·
040
5A
cces
s52
0·04
96
290·
032
4t
0·42
4N
S0·
101
NS
22"
0·39
4N
S0·
749
NS
9N
o.of
sym
patr
icsa
lmon
ids
One
560·
059
828
0·03
11
Tw
o34
0·03
910
410·
047
4T
hree
500·
051
420
0·02
94
F1·
252
NS
0·85
3N
S22
1·03
8N
S1·
547
NS
9St
ocki
ngof
fish
Non
ean
dor
unlik
ely
480·
053
1232
0·04
13
Yes
and
orlik
ely
410·
041
1031
0·03
46
t"
0·61
0N
S"
0·81
1N
S22
"0·
286
NS
"0·
606
NS
9
n,N
umbe
rof
lake
san
alys
ed.
Fan
dt
refe
r,re
spec
tive
ly,
toA
NO
VA
and
t-te
sts.
NS,
not
sign
ifica
nt.
P>
0·05
;*P
<0·
05;
**P
<0·
025.
MP
are
test
edon
arcs
ine-
tran
sfor
med
data
.
334 . .
Iceland (P=0·007) and south Iceland (P=0·032), and average E value was alsosignificantly higher (P=0·035).
Access from sea, number of sympatric salmonids, or stocking history did notinfluence infection pattern (Table V).
DISCUSSION
A high proportion of the wild fish were infected but have low levels of Rsantigens in the kidney (E values in the range 0·050–0·100). A few fish had highE values. Comparable results have been observed for wild salmonids carrying Rsantigens by Paterson et al. (1979) using IFAT and Meyers et al. (1993) usingELISA.
The low (but frequent) occurrence of Rs antigens could be explained by at leastthree mechanisms, possibly acting concurrently. First, some fish may just havebecome infected. Second, fish recovering from an infection might harbour Rsantigens in immune complexes deposited in the kidney (Kaattari et al., 1989;Sami et al., 1992). In that case, the bacterium might be present or absent and itmight reside in some other organ. Third, the bacterium might be a low densityresident in wild fish forming ‘ a synergetic or controlled parasitic relationshipwith the host ’ (Austin & Austin, 1993). Rs has co-evolved with the salmonidsfor a long time and its survival strategies, e.g. its intracellular location(Gutenberger et al., 1997) appear to be highly successful. Occasionalhomeostatic disturbances within infected fish may induce its occasional prolifer-ation and high levels of Rs antigens. Our findings are in accordance with this.
The absence of external and internal clinical signs of BKD in the present study,even in fish that had high E values, conforms to findings by Paterson et al. (1979)and Meyers et al. (1993) for heavily infected wild salmonids. Clinical signs indiseased fish result from complex host–pathogen interactions (Bruno, 1986). Solack of clinical signs, despite a heavy infection, may be connected with weak orabsent host responses. Brown et al. (1996) studied the development of immunityin salmon hatched from eggs exposed at an early stage to p57, the mainextracellular antigen and putative virulence factor of the bacterium. p57 had apartially immunosuppressive effect on the development of the specific immunesystem. Fish derived from eggs containing the protein showed an increasedsusceptibility to active challenge from Rs, production of antibodies against p57decreased and respiratory burst activity of phagocytic cells as well. Theseauthors postulated that ‘ the intra-ovum presence of Rs and its soluble antigensmay contribute to the inability of many salmon to mount an effective immuneresponse to Rs ’. Turaga et al. (1987) showed that soluble antigens produced byRs are capable of suppressing antibody response in vitro. Information onimmune reactions towards specific antigens of Rs are limited but Wood &Kaattari (1996) demonstrated that the removal of p57 enhanced immunogenicityof the bacterium. These findings suggest that symptom free, although heavilyinfected fish, might arise from eggs exposed to p57.
Although E values pooled over lakes and overall prevalence were higher incharr than in trout we found no significant association in these factors betweenthe two species in lakes where they co-occur. This suggests that the dynamics ofinfection and internal proliferation of bacteria can be quite independent in the

. 335
two species even if they live in the same lake. Both species congregate atspawning sites and this may be the the time and place where intraspecific,horizontal infections are most likely. Since the species very rarely show temporaland spatial overlap in spawning activities horizontal infections might be far lesslikely between the species than between conspecifics.
INFECTION AND FISH LIFE HISTORYHigher E values (intensity of Rs antigens) and prevalence of infection among
prospective charr spawners (fish were sampled c. 1·5 months prior to spawning)suggests increased probability of activation of Rs during maturation. This alongwith the results of Lee & Evelyn (1989) that only low levels of the bacterium areneeded for vertical transmission of Rs and the result of Brown et al. (1996) thatexposure to p57 during the egg stage can cause immunosuppression in subse-quent fry, shows that the bacterium is well adapted for vertical transmission.
The second-order relationship of intensity of Rs antigens with age of fish withmaximum intensities in intermediary ages suggests that Rs infection may be asignificant cause of host mortality. The data fit well with outcomes of Monte-Carlo simulation experiments by Anderson & Gordon (1982) of a singleparasite–host model, assuming a constant mean infection rate through time anda linear probability function of host mortality resulting from parasite burdens.According to Anderson and Gordon (1982) such a convex age–intensity rela-tionship, concomitant with a decline in the degree of dispersion (variance tomean ratio) of intensity in older age classes, may be evidence of the induction ofhost mortality by parasite infection. However, as stressed by Anderson &Gordon (1982), peaked, or curved age–intensity curves may also result from agerelated changes in the average rate of infection, with infection of older hostsceasing, e.g. due to changes in foraging behaviour or to acquisition of acquiredimmunity. These factors, will not normally create a concomitant decline in thedegree of dispersion in older hosts. The dispersion of Rs antigens levels in thecharr decline with increasing age of the fish (Fig. 5) thus suggesting a connectionwith host mortality. However, since most fish harboured relatively few bacteriawhile a few fish harboured the major proportion of the bacterial population, it isunlikely that Rs was a frequent and direct cause of death. The negativerelationship between age and intensity of Rs antigens in older fish more likelystems from other age-dependent mortality factors that, through differentialmortality, result in both lowered intensity and dispersion of Rs antigens in theolder part of the population. Factors likely to work in this manner are foodshortage, sexual maturation and other growth limiting factors. Starved fish inpoor condition are more likely, to harbour flourishing Rs colonies and to die.Older fish are those that have been more successful in acquiring food andmaintaining good condition which concurrently makes them less likely toexperience infection and proliferation of Rs. After the effect of age had beenremoved, there was still a highly significant, negative effect of fish length on Rsintensity. Factors such as food shortage, that are likely to have an adverse effecton survival, also have a negative effect on length at age. The above scenario doesnot imply adverse effects of Rs proliferation. Such effects, whether actingdirectly or via interaction with other mortality inducing factors, may beimportant in natural population.

336 . .
Anderson & Gordon’s (1982) model applied primarily to parasites that have along life span relative to that of the host, e.g. larval helminth parasites. Given afairly constant infection probability, and making assumptions as to howecological factors may increase the risk of death and probability of Rs prolifer-ation simultaneously, it may be argued that the Rs antigens–age relationshipmimics the helminth parasite system.
The intensity–age relationship discussed above is a composite picture, basedon data drawn from separate lake populations that differ considerably in age andlength distribution of fish. A comprehensive, long-term study of a single fishpopulation within a lake might provide valuable information on the infectionrate of Rs.
INFECTION AND LAKE ECOLOGYThe density of benthic macroinvertebrates correlated negatively with Rs
infection, notably in charr, and infection patterns differed according to bedrockand geographical location of lakes. These results conform with the expectationthat ecological features of lakes can influence the dynamics of host–parasiteinteraction (e.g. Curtis, 1982; Frandsen et al., 1989; Dorucu et al., 1995).
The density of macroinvertebrates in the surf zone correlated positively withcondition factor of both charr and trout in Icelandic lakes. If density indicatesaccessibility to fish, then the lower the food availability the more fish sufferinfection and proliferation of Rs. More specifically, higher prevalence ofinfection and E values in fish of nutrient-poorer lakes may be the result ofinsufficient energy acquisition, a stress that upsets the balance in the synergetichost–parasite relationship.
Differences in infection patterns in relation to the type of bedrock incatchment areas of lakes probably result from ecological differences inducedby specific hydrogeological features of each bedrock type. According toGardarsson (1979), lakes in areas of permeable post-Glacial lavas, which receivewater primarily through underground springs, may be biologically richer thanlakes situated in areas of the older, less permeable Pleistocene and especiallyUpper Tertiary bedrocks, where water enters lakes primarily as direct run-offfrom the surface. The patterns of macroinvertebrate density in lakes, withrespect to the different bedrock types, are in good agreement with ecologicalexpectations according to Gardarsson (1979). The geographical difference ininfection pattern also appears to be better explained in terms of ecologicaldifference, induced by hydrogeological features, rather than by location per se,since geographical location is an integrated part of bedrock type, hence ofhydrogeological features.
The few studies that have addressed ecological associations with patterns of Rsin wild salmonids seem to point in the same direction. Mitchum et al. (1979)identified a combination of instability in water flow and water temperature andsmall water volume, as important causes of BKD in three salmonid species.Moreover, Paterson et al. (1981), who studied fish under controlled circum-stances, identified inadequate food as important in determining BKD infectionpatterns.
The high prevalence of Rs antigens in fish from a number of lakes implies thatRs has been endemic for a long time. This is substantiated by the observation

. 337
that among charr populations with the highest levels of Rs antigen and highestprevalances of infection are those in Ounefnt vatn (no. 6, Fig. 1) and Hognavatn(no. 7, Fig. 1), which most likely have never been exposed to stocked fish. Bothlakes are small, shallow, and situated in high altitudes quite far from humansettlement, and with impassable waterways.
In summary, the frequent but low levels of Rs antigens in fish indicate that thebacterium is a normal, low density resident in wild charr and trout. It is unlikelythat stocking has affected the infection pattern of wild charr or trout. We inferthat the epidemiology of Rs infection in wild, Icelandic lake populations ofArctic charr is influenced primarily by ecological features of the lake ecosystem,in particular, favourable food conditions result in a decreased susceptibility toRs. A causal framework of this kind also conforms with the relationshipobserved between the intensity of Rs antigens and the age and size of the host.On a geographical scale the important ecological features of lakes that influencethe epidemiology of to Rs are clearly linked to hydrogeological features ofcatchment areas which in turn reflect the age of geological formation.
The authors thank S. Helgason for his help. Grants to H. Jonsdottir and S.Gudmundsdottir for the study of Rs and grants to GG, HJM and SSS for the lake projectEcological Survey of Icelandic Lakes (ESIL) were provided by The Icelandic ResearchCouncil, The Ministry of Environment, The Ministry of Agriculture, and the FreshwaterFisheries Fund of Iceland (Fiskræktarsjodur Iuslands), which are all acknowledged.
References
Anderson, R. M. & Gordon, D. M. (1982). Processes influencing the distribution ofparasite numbers within host populations with special emphasis on parasite-induced host mortalities. Parasitology 85, 373–398.
Adalsteinsson, H. (1990). Flokkun stoduvatna a Iuslandi (Classification of lakes inIceland). In Vatnid og Landid (Sigbjarnarson, G., ed.), pp. 145–160. NationalEnergy Authority, Reykjavık, Iceland.
Austin, B. & Austin, D. A. (1993). Bacterial Fish Pathogens, Disease in Farmed and WildFish. New York: John-Wiley.
Banner, C. R., Long, J. J., Fryer, J. L. & Rohovec, J. S. (1986). Occurrence of salmonidfish infected with Renibacterium salmoninarum in the Pacific Ocean. Journal ofFish Diseases 9, 273–275.
Brown, L. L., Iwama, G. K. & Evelyn, T. P. T. (1996). The effect of early exposure ofCoho salmon (Oncorhynchus kisutch) eggs to the p57 protein of Renibacteriumsalmoninarum on the development of immunity to the pathogen. Fish & ShellfishImmunology 6, 149–165.
Bruno, D. W. (1986). Histopathology of bacterial kidney disease in laboratory infectedrainbow trout, Salmo gairdneri Richardson, and Atlantic salmon, Salmo salar L.,with reference to naturally infected fish. Journal of Fish Diseases 9, 523–537.
Bullock, G. L., Stuckey, H. M. & Mulcahy, D. (1978). Corynebacterial kidney disease:egg transmission following iodophore disinfection. Fish Health News 7, 51–52.
Curtis, M. A. (1982). Host-parasite interactions in Arctic and subarctic lakes. InParasitology (Meerovitch, E., ed.), pp. 41–57. Montreal, Quebec: McGill Univer-sity Publications.
Dorucu, M., Adams, C. E., Huntingford, F. A. & Crompton, D. W. T. (1995). Howfish–helminth associations arise; an example from Arctic charr in Loch Rannoch.Journal of Fish Biology 47, 1038–1043.
Ellis, R. W., Novotny, A. J. & Harrell, L. W. (1978). Case report of kidney disease in awild chinook salmon, Oncorhynchus tshawytscha, in the sea. Journal of WildlifeDiseases 14, 120–123.
338 . .
Evelyn, T. P. T., Hoskins, G. E. & Bell, G. R. (1973). First record of bacterial kidneydisease in apparently wild salmonid in British Columbia. Journal of the FisheriesResearch Board of Canada 30, 1578–1580.
Evelyn, T. P. T., Prosperi-Porta, L. & Ketcheson, J. E. (1986). Persistence of the kidneydisease bacterium, Renibacterium salmoninarum, in coho salmon, Oncorhynchuskisutch (Walbaum), eggs treated during and after water-hardening with povidone-iodine. Journal of Fish Diseases 9, 461–464.
Frandsen, F., Malmquist, H. J. & Snorrason, S. S. (1989). Ecological parasitology ofpolymorphic Arctic charr Salvelinus alpinus (L.), in Thingvallavatn, Iceland.Journal of Fish Biology 34, 281–297.
Fryer, J. L. & Lannan, C. N. (1993). The history and current status of Renibacteriumsalmoninarum, the causative agent of bacterial kidney disease in Pacific salmon.Fisheries Research 17, 15–33.
Gardarsson, A. (1979). Vistfrædileg flokkun ıslenskra vatna (A classification of Icelandicfreshwaters). Tyli 9, 1–10.
Gudmundsdottir, S., Benediktsdottir, E. & Helgason, S. (1993). Detection ofRenibacterium salmoninarum in salmonid kidney samples: a comparison of resultsusing double-sandwich ELISA and isolation on selective medium. Journal of FishDiseases 16, 185–197.
Gutenberger, S. K., Duimstra, J. R., Rohovec, J. S. & Fryer, J. L. (1997). Intracellularsurvival of Renibacterium salmoninarum in trout mononuclear phagocytes.Diseases of Aquatic Organisms 28, 93–106.
Johannesson, H., Kristjansson, S. & Sæmundsson K. (1989). Geological Map of Iceland.1:500.000. Bedrock Geology. Reykjavik: Icelandic Museum of Natural Historyand Icelandic Geodetic Survey.
Kaattari, S., Turaga, P. & Wiens, G. (1989). Development of a Vaccine for BacterialKidney Disease in Salmon. Bonneville Power Administration, Project 84–46, FinalReport 1989.
Lee, E. G. H. & Evelyn, T. P. T. (1989). Effect of Renibacterium salmoninarum levels inthe ovarian fluid of spawning chinook salmon on the prevalence of the pathogenin their eggs and progeny. Diseases of Aquatic Organisms 7, 179–184.
Margolis, L. & Evelyn, T. P. T. (1987). Aspects of diseases and parasite problems incultured salmonids in Canada, with emphasis on the Pacific region, and regulatorymeasures for their control. In Parasites and Diseases in Natural Waters andAquaculture in Nordic Countries (Stenmark, A. & Malmberg, G., eds), pp. 2–19.Stockholm: Swedish Museum of Natural History.
Meyers, T. R., Short, S., Farrington, C., Lipson, K., Geiger, H. J. & Gates, R. (1993).Comparison of the enzyme-linked immunosorbent assay (ELISA) and the fluor-escent antibody test (FAT) for measuring the prevalences and levels ofRenibacterium salmoninarum in wild and hatchery stocks of salmonid fishes inAlaska, USA. Diseases of Aquatic Organisms 16, 181–189.
Mitchum, D. L. & Sherman, L. E. (1981). Transmission of bacterial kidney disease fromwild to stocked hatchery trout. Canadian Journal of Fisheries and Aquatic Sciences38, 547–551.
Mitchum, D. L., Sherman, L. E. & Baxter, G. T. (1979). Bacterial kidney disease in feralpopulations of brook trout (Salvelinus fontinalis), brown trout (Salmo trutta), andrainbow trout (Salmo gairdneri). Journal of the Fisheries Research Board ofCanada 36, 1370–1376.
Olea, I., Bruno, D. W. & Hastings, T. S. (1993). Detection of Renibacteriumsalmoninarum in naturally infected Atlantic salmon, Salmo salar L., and rainbowtrout, Oncorhynchus mykiss (Walbaum) using an enzyme-linked immunosorbentassay. Aquaculture 116, 99–110.
Paterson, W. D., Gallant, C., Desautels, D. & Marshall, L. (1979). Detection of bacterialkidney disease in wild salmonids in the Margaree river system and adjacent watersusing an indirect fluorescent antibody technique. Journal of the Fisheries ResearchBoard of Canada 36, 1464–1468.

. 339
Paterson, W. D., Lall, S. P. & Desautels, D. (1981). Studies on bacterial kidney diseasein Atlantic salmon (Salmo salar) in Canada. Fish Pathology 15, 283–292.
Pippy, J. H. C. (1969). Kidney disease in juvenile Atlantic salmon (Salmo salar) in theMargaree River. Journal of the Fisheries Research Board of Canada 26, 2535–2537.
Sami, S., Fischer–Scherl, T., Hoffmann, R. W. & Pfeil–Putzien, C. (1992). Immunecomplex mediated glomerulo nephrites associated with bacterial kidney disease inthe rainbow trout (Oncorhynchus mykiss). Veterinary Pathology 29, 169–174.
Sanders, J. E. & Fryer, J. L. (1980). Renibacterium salmoninarum gen. nov., sp. nov., thecausative agent of bacterial kidney disease in salmonid fishes. InternationalJournal of Systematic Bacteriology 30, 496–502.
Sanders, J. E., Pilcher, K. S. & Fryer, J. L. (1978). Relation of water temperature tobacterial kidney disease in coho salmon (Oncorhynchus kisutch), sockeye salmon(O. nerka), and steelhead trout (Salmo gairdneri). Journal of the Fisheries ResearchBoard of Canada 35, 8–11.
Sanders, J. E., Long, J. J., Arakawa, C. K., Bartholomew, J. L. & Rohovec, J. S. (1992).Prevalence of Renibacterium salmoninarum among downstream migratingsalmonids in the Columbia river. Journal of Aquatic Animal Health 4, 72–75.
Smith, I. W. (1964). The occurrence and pathology of Dee disease. Department ofAgriculture and Fisheries for Scotland. Freshwater and Salmon Fisheries Research34, 1–12.
Souter, B. W., Dwilow, A. G. & Knight, K. (1987). Renibacterium salmoninarum in wildArctic charr Salvelinus alpinus and lake trout S. namaycush from the NorthwestTerritories, Canada. Diseases of Aquatic Organisms 3, 151–154.
Turaga, P., Wiens, G. & Kaattari, S. (1987). Bacterial kidney disease: the potential roleof soluble protein antigen(s). Journal of Fish Biology 31 (Suppl. A), 191–194.
Wood, J. W. (1974). Diseases of Pacific Salmon, Their Prevention and Treatment.Olympia, WA: Department of Fisheries. 82 pp.
Wood, J. W. & Wallis, J. (1955). Kidney disease in adult chinook salmon and itstransmission by feeding to young chinook salmon. Fisheries Commission ofOregon, Research Briefs 6, 32–40.
Wood, P. A. & Kaattari, S. L. (1996). Enhanced immunogenicity of Renibacteriumsalmoninarum in chinook salmon after removal of the bacterial cell surface-associated 57 kDa protein. Diseases of Aquatic Organisms 25, 71–79.