Environmental effects of agricultural conservation: A framework for research in two watersheds in...
10
Land owners, water managers, conser- vationists, and policy makers all need better understanding and quantitative measures of the impacts of agricultural conservation within the landscape. Ilie Conservation Et}icts Assssincnt Project (C EAP) is a multifaceted project that was developed to help provide such under- standing and quantitative measurements (Richardson et al. 2008). As part of the crop- lands CEA a watershed study was estab- lislicd in tIme basin of the Washita River, which tlO\VS into Lake Texoma just above the Red River. The Upper Washita River hydrologic win (referred to as the Upper Washita River Basin in this paper) is a 8,3 19-km 2 (3,212- nii 2 ) area located in west central Oklahoma, with agricultural systems and environmental isSues that are typical in the southern Great Plains (fIgure ]).The region is sparsely popu- lated with predominantly mixed cropland and grazing land. Irrigation water is drawn froni reservoirs or groundwater for localized irrigation, but agriculture is largely rainfed. Persistent, multi-year periods of above- and below-average annual precipitation (figure 2) cause significant variation in hydrologic and other environmental processes (Garbrecht and Rossel 2002; Garbrecht et al. 2006). The USDA Agricultural Research Service (ARS) has conducted watershed research in the Upper Washita River Basin since 1961 (Garbrecht et al. 2007), particularly in the Little Washita River Experimental Watershed (LWREW). In 2004. the research facility was expanded to include the Fort Cobb Reservoir Experimental Watershed (ECREW) as part of the CEAP watershed assessment studies (figure 1). The FCREW was selected for in-depth stud y because it has been identified by the Oklahoma Water Resources Board, Oklahoma Departnient of Environmental Quality, and Oklahoma Conservation Commission as a focal point to apply land conservation practices in order to improve water quality (Oklahoma Water Resources Board 2003; Storm et al. 2003; Steiner et al.2004).The Fort Cobb Reservoir and its watershed had been the focus of mon- itoring and assessments for several years, thus providing baseline data against which future environmental conditions could be assessed (e.g., Becker 2001; Fairchild et al. 2004). Fort Cobb Reservoir is on the Oklahoma 303(d) list (list of water bodies that do not meet the water quality standards as given in the Clean Water Act) due to excessive sedi- mentation and trophic state of the lake. A draft management plan has been developed to reduce phosphorus (P) loads, priniar- dv from agricultural sources. Nitrogen (N) is also of concern in some stream segments in some seasons. Earlier assessments indi- cated that agricultural pesticide residues are of inniinial concern it) alluvium (Smith et al. 1986) or groundwater (Becker 2001) in this region. Badger et al. (2003) reported a large and growing economic impact for two Likes in ()klahoma, indicating that impair- merit of the lake for municipal water supply, recreation, and fish and wildlife may be an important factor m local economies in and near the watershed. The overall research objective is to quan- tify interactive effects of variable climate, dynamic land use, and land management, particularly conservation practices, on sur- face and subsurface water resources for the Little Washita River and Fort Cobb Reservoir watersheds. The specific objec- tives of this paper are to (1) describe the hydrologic, climatic, and agricultural frame- work for watershed assessment, (2) provide results froni hydrologic, water quality and soil investigations, and (3) elucidate factors that impact hydrologic and water quality responses to conservation practices. doi:1O.2489/JSWC.63.6.443 Environmental effects of agricultural conservation: A framework for research in two watersheds in Oklahoma's Upper Washita River Basin J.L. Steiner, RI. Starks, l.A. Daniel, J.D. Garbrecht, D. Moriasi, S. McIntyre, and 1.-S. Chen Abstract: Agriculture in the Upper 'sX,bshita River Basin represents nixed crop-livestock s y stems of the Southern Plains. Research in the Little Washita River Experimental Watershed and the Fort Cobb Reservoir Experimental Watershed addresses interactive efh.cts of variable cliniate, land use, and management on environmental quality. The Little Washita River watershed provides opportunities to explore impacts of flood retarding impound- menu within a watershed. The Fort Cobb Reservoir watershed provides opportuni- ties to study effects of agricultural conservation on a large eutrophic reservoir. Analysis of 1940 to 2005 data from the Fort Cobb Reservoir watershed showed that precipita- tion increased 33%, corresponding runoff increased 101%, and sediment yield increased 183% when comparing multi-year wet periods to multi-year dry periods. Depth to groundwater exhibited seasonal and interannual variation. A rapid geomorphic assess- ment indicated that unstable stream channels donnnate the stream networks. Phosphorus concentration in streams was correlated to multiple attributes of the contributing areas, including contributing area, slope, stream density, and channel stabilit y. Anticipated out- conies are improved understanding of environmental effects of conservation, new approaches to nntiganon of water quality problems, and tools to support strategic placement of conserva- tion practices on the landscape to achieve environmental goals. Key words: climate variabilit y—Conservation Effects Assessment Project (CEAP)- groundwater—soil quality—water quality JOURNAL OF SOIL AND WATER CONSERVATION NOV/DEC 2008—VOL. 63, NO.6 443
-
Upload
independent -
Category
Documents
-
view
0 -
download
0
Transcript of Environmental effects of agricultural conservation: A framework for research in two watersheds in...

Land owners, water managers, conser-vationists, and policy makers all needbetter understanding and quantitativemeasures of the impacts of agriculturalconservation within the landscape. IlieConservation Et}icts Assssincnt Project(C EAP) is a multifaceted project that wasdeveloped to help provide such under-standing and quantitative measurements(Richardson et al. 2008). As part of the crop-lands CEA a watershed study was estab-lislicd in tIme basin of the Washita River, whichtlO\VS into Lake Texoma just above the RedRiver. The Upper Washita River hydrologicwin (referred to as the Upper Washita RiverBasin in this paper) is a 8,3 19-km 2 (3,212-nii 2) area located in west central Oklahoma,with agricultural systems and environmentalisSues that are typical in the southern GreatPlains (fIgure ]).The region is sparsely popu-
lated with predominantly mixed croplandand grazing land. Irrigation water is drawnfroni reservoirs or groundwater for localizedirrigation, but agriculture is largely rainfed.Persistent, multi-year periods of above- andbelow-average annual precipitation (figure 2)cause significant variation in hydrologic andother environmental processes (Garbrechtand Rossel 2002; Garbrecht et al. 2006).
The USDA Agricultural Research Service(ARS) has conducted watershed researchin the Upper Washita River Basin since1961 (Garbrecht et al. 2007), particularlyin the Little Washita River ExperimentalWatershed (LWREW). In 2004. the researchfacility was expanded to include the FortCobb Reservoir Experimental Watershed(ECREW) as part of the CEAP watershedassessment studies (figure 1). The FCREWwas selected for in-depth study because it
has been identified by the Oklahoma WaterResources Board, Oklahoma Departnientof Environmental Quality, and OklahomaConservation Commission as a focal pointto apply land conservation practices in orderto improve water quality (Oklahoma WaterResources Board 2003; Storm et al. 2003;Steiner et al.2004).The Fort Cobb Reservoirand its watershed had been the focus of mon-itoring and assessments for several years, thusproviding baseline data against which futureenvironmental conditions could be assessed(e.g., Becker 2001; Fairchild et al. 2004).Fort Cobb Reservoir is on the Oklahoma303(d) list (list of water bodies that do notmeet the water quality standards as given inthe Clean Water Act) due to excessive sedi-mentation and trophic state of the lake. Adraft management plan has been developedto reduce phosphorus (P) loads, priniar-dv from agricultural sources. Nitrogen (N)is also of concern in some stream segmentsin some seasons. Earlier assessments indi-cated that agricultural pesticide residues areof inniinial concern it) alluvium (Smith etal. 1986) or groundwater (Becker 2001) inthis region. Badger et al. (2003) reported alarge and growing economic impact for twoLikes in ()klahoma, indicating that impair-merit of the lake for municipal water supply,recreation, and fish and wildlife may be animportant factor m local economies in andnear the watershed.
The overall research objective is to quan-tify interactive effects of variable climate,dynamic land use, and land management,particularly conservation practices, on sur-face and subsurface water resources forthe Little Washita River and Fort CobbReservoir watersheds. The specific objec-tives of this paper are to (1) describe thehydrologic, climatic, and agricultural frame-work for watershed assessment, (2) provideresults froni hydrologic, water quality andsoil investigations, and (3) elucidate factorsthat impact hydrologic and water qualityresponses to conservation practices.
doi:1O.2489/JSWC.63.6.443
Environmental effects of agriculturalconservation: A framework for researchin two watersheds in Oklahoma's UpperWashita River BasinJ.L. Steiner, RI. Starks, l.A. Daniel, J.D. Garbrecht, D. Moriasi, S. McIntyre, and 1.-S. Chen
Abstract: Agriculture in the Upper 'sX,bshita River Basin represents nixed crop-livestocksystems of the Southern Plains. Research in the Little Washita River Experimental Watershedand the Fort Cobb Reservoir Experimental Watershed addresses interactive efh.cts ofvariable cliniate, land use, and management on environmental quality. The Little WashitaRiver watershed provides opportunities to explore impacts of flood retarding impound-menu within a watershed. The Fort Cobb Reservoir watershed provides opportuni-ties to study effects of agricultural conservation on a large eutrophic reservoir. Analysisof 1940 to 2005 data from the Fort Cobb Reservoir watershed showed that precipita-tion increased 33%, corresponding runoff increased 101%, and sediment yield increased183% when comparing multi-year wet periods to multi-year dry periods. Depth togroundwater exhibited seasonal and interannual variation. A rapid geomorphic assess-ment indicated that unstable stream channels donnnate the stream networks. Phosphorusconcentration in streams was correlated to multiple attributes of the contributing areas,including contributing area, slope, stream density, and channel stabilit y. Anticipated out-conies are improved understanding of environmental effects of conservation, new approachesto nntiganon of water quality problems, and tools to support strategic placement of conserva-tion practices on the landscape to achieve environmental goals.
Key words: climate variability—Conservation Effects Assessment Project (CEAP)-groundwater—soil quality—water quality
JOURNAL OF SOIL AND WATER CONSERVATION NOV/DEC 2008—VOL. 63, NO.6443

0
Figure iResearch subwatersheds within the Washita River Basin showing data collection sites forstream flow, wells, and climate stations from the USDA Agricultural Research Service Micro net,Oklahoma Mesonet, and National Weather Service Cooperative Observer Program (COOP)networks.
Fort CobbU MicronetExperimental Mesonet
Watershed COOPU USGS stream gauge
Wells'• Elevation (m). Logged only
:::
•Private/monitoredIL
Materials and MethodsResearch Watershed Description. The610-kin' (236_un 2) (above stream gauge)LWREW has mixed agricultural land useincluding pasture and rangeland (68%),cropland (20%, mostly rainfed), forest (8%),and miscellaneous uses (4%). The topog-raphy is rolling with a maximum relief of180 in (590 ft) and sandy to loamy soils thatare highly heterogeneous, with 64 soil seriesand 162 phases identified in the watershed(Allen and Nancy 1991). The 786 km'(304 mi2) (above the dam) FCREW also
niixed agricultural land use, includingpland (56%, about one-third is irrigated),
p uure and rangeland (33%), forests anduI, land (5%, mostly along the streams),icr (2%), and roads and miscellaneousi. Soils in the FCREW are also highly
Rrogeneous, with the moderately erosivesandy barns dominating in the eastern
mon of the watershed, highly erosive finelv loaiiis and loamy soils prevalent in the
Hi central and south central areas of the:ershed, and moderately erosive silt barns
Little Washita RiverExperimental
Watershed-- - -
in the western portion of the watershed.Cattle graze the range and pasture lands, andsix swine and two cattle confined feedingoperations are located in the FCR.EW (figure3). In the Upper Washita River Basin, theRush Springs aquifer is an important watersource for domestic, irrigation, and publicsupplies. The aquifer underlies 46% of theLWREW and about 80% of the FCREW(Becker and Runkle 1998).
In the research area, the climate is subhu-mid, receiving about 800 innn (31.4 in) ofannual precipitation (1971 to 2000 normalfor Caddo County) (Oklahoma ClimatologySurvey 2005) with the largest monthlymeans coming in May, June, September, andOctober. Summers are typically long, hot, andrelatively dry with normal daily mean tem-peratures in July of 28.6°C (83.5'F). Wintersare typically short. temperate. and dry withnormal daily mean temperatures in Januaryof 3.0'C (37.4°F) with a average annual tcni-perature gradient of about 1.7'C (3°F) fromsoutheast to northwest and an average annualprecipitation gradient of about 75 mm (3 in)
from east to west across the research area thatspans roughly 100 kin (56 nn).
Meteorological Measurements.Fromn1961 to 1985, a dense network (5 km 13niil spacing) of precipitation gauges wasmaintained in the Upper Washita RiverBasin (Garbrecht et al. 2007) From 1985 toFebruary 2005. 45 weather stations (42 ARSMicronet and 3 Oklahoma Mesonet) werelocated in the LWREW. In February 2005,22 ARS Mieronet stations were removedfrom the LWREW, and 15 were establishedin the ECREW (figure 1). Each Micronetstation provides 5-minute measurements ofair temperature, relative hurindity, rainCiU,solar radiation, and soil temperature at threedepths using methods of the OklahoniaMesonet as described by McPherson et al.(2007).Volunietric soil water content is nlea-sured at each Micronet station at 30-minuteintervals and at 5—, 25—, and 45-cm (2—, 10—,and 18-in) depths using the Stevens HydroProbe. Data are reported by radio telemetryto the Oklahoma Climate Survey for qualityassurance, processing, and dissemination onthe Internet (USDA Agricultural ResearchService 2008). Four Oklahoma Mesonetstations are located in or near the LWREW(Chickasha, Ninnekah, Acme, and Apache),and three are near FCREW (Fort Cobb,Hinton, and Weatherford). The US NationalWeather Service has several CooperativeObserver Program stations in the area.
Strearnjlow Measurements. Steamiifiowis monitored by the US Geological Surveyin collaboration with the Oklahoma WaterResources Board and the USDA ARS at sitesshown in figure I. The streaniflow data anddetails of methodology are available on theInternet (US Geological Surve y 2008). Inboth watersheds, strearnflow record periodsare long, but at most sites the records havegaps, a reflection of changing research pri-orities and limited resources to operate thegauges. In 1963, a streani gauge (drainagearea 538 km2 1208 mi'I) was established onthe LWREW to measure streamfiow andsuspended sediment until 1985. In 1979,another gauge (drainage area 160 km2[62 rni]) was established to measure stream-flow and sediment also until 1985. In 1992,both gauges were reactivated, one at the 160km2 Site and the other slightly downstreamfrom the old site at a 610 kiis' (236 mis 2) drain-age area site. Eight additional gauges wereestablished on Little Washita River tributariesin the nud-1990s to provide a baseline data
1 NOV/DEC 2008—VOL. 63, NO.6 JOURNAL OF SOIL AND WATER CONSERVATION
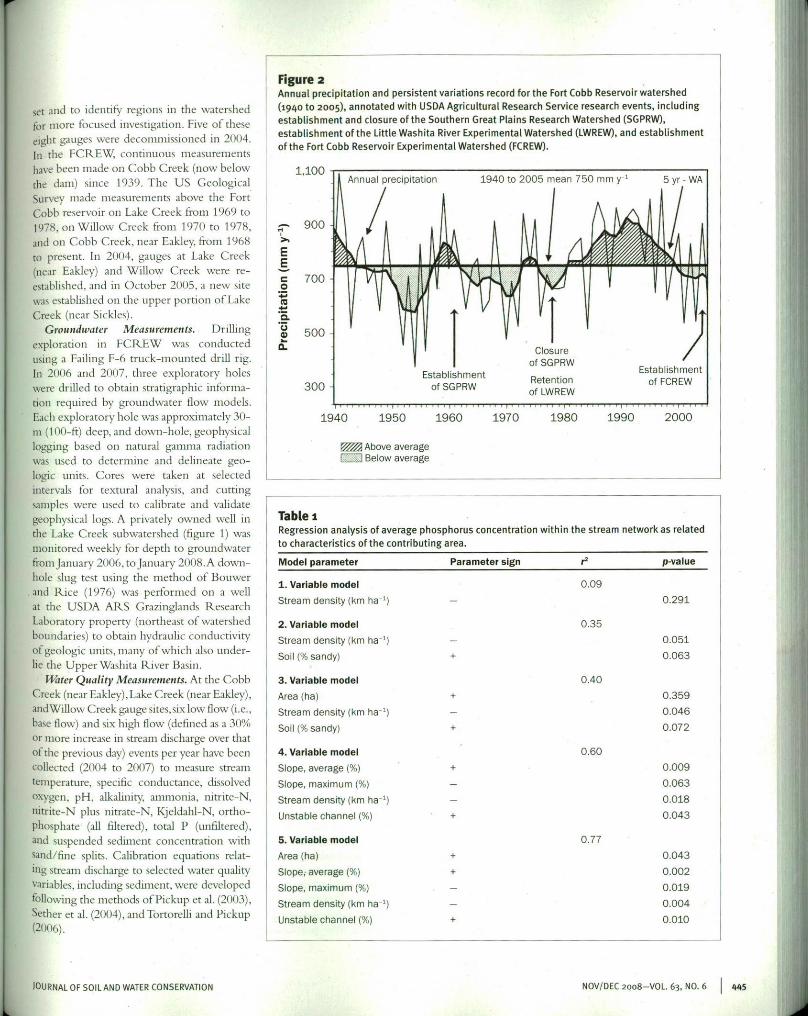
Figure 2Annual precipitation and persistent variations record for the Fort Cobb Reservoir watershed(1940 to 2005), annotated with USDA Agricultural Research Service research events, includingestablishment and closure of the Southern Great Plains Research Watershed (SGPRW),establishment of the Little Washita River Experimental Watershed (LWREW), and establishmentof the Fort Cobb Reservoir Experimental Watershed (FCREW).
1,100
a 700
CL
500
300
1940195019601970198019902000
Above averageEJ Below average
TabteiRegression analysis of average phosphorus concentration within the stream network as relatedto characteristics of the contributing area.
Model parameter Parameter sign r2 p.value
1. Variable model 0.09Stream density (km ha (- 0.291
2. Variable model 0.35
Stream density (km ha) 0.051
Soil (% sandy) + 0.063
3. Variable model 0.40
Area (ha) + 0.359
Strea m density (km ha 0.046Soil (% sandy) + 0.072
4. Variable model 0.60
Slope, average (%) + 0.009Slope, maximum (%) 0.063
Stream density (km ha-1) 0.018
Unstable channel (%) + 0.043
5. Variable model 0.77
Area (ha) + 0.043Slope, average (%( + 0.002Slope, maximum (%) 0.019
Stream density (km ha( 0.004
Unstable channel (%) + 0.010
set ,oid to identity regions in the \y.itelslledfor more focused Investigation. Five of theseeight gauges were decoinnussioned in 2004.In the FCREW, continuous llleasureiiientshave been made oil Creek (now belowthe dam) since 1939. The US GeologicalSurvey made nieasurements above the FortCobb reservoir oil Creek from 1969 101978, oil Creek from 1970 to 1978,and on Cobb Creek, near Eaklev, froni 1968to present. In 2004, gauges at lake Creek(near Eakley) and Willow Creek were re-established. and in October 2005. a new sitewas established on the upper portion of LakeCreek (near Si(-kics).
Groundwater Measurements. l)rilhngexploration in FCIa..EW was conductednsiiic a Failing F-6 truck-mounted drill rig.In 2006 and 2007, three exploratory holeswere drilled to obtain stratigraphic infornia-tion required by groundwater flow models.Each exploratory hole was approximately 30-
Ill -ft) deep, and down-hole, geophysicallogging based oil -amnia radiationwas used to deternnne and delineate geo-logic units. Cores were taken at selectedintervals for textural anal ysis, and cuttingsaniples were used to calibrate and validategeophysical logs. A privately owned well inthe Lake Creek suhwatcrshed (figure 1) wasmonitored weekly for depth to groundwaterfron i January 2006, to January 2008. A down-hole slug test using the method of Bouwerand Rice (1976) was performed oil wellat the USDA ARS Grazinglands ResearchLaboratory property (northeast of watershedboundaries) to obtain hydraulic conductivityof geologic units, nianv of which also under-lie the Upper Washita River Basin.
Water Quality Measurements. At the CobbCreek (near Eaklev), Lake Creek (near Eaklev),and Willow Creek gauge sites, six low flow (i.e.,base flow) and six high flow (defined as a 30%or more increase in stream discharge over thatof the previous day) events per year have beencollected (2004 to 2007) to measure streamtemperature, specific conductance, dissolvedoxygen, pH, alkalinity, animonia, nitrite-N,nitrite_N plus nitrate-N, Kjeldahl-N. ortho-phosphate (all filtered), total P (unfiltered),and suspended sednnent concentration withsand/fine splits. Calibration equations relat-ing stream discharge to selected water qualityvariables, including sediment, were developedfollowing the iiiethods of Pickup et al. (2003),Sether et il. (2004), and lhrtorelli and Pickup(2oo),
JOURNAL OF SOIL AND WATER CONS[RVATION NOVO[C 7OORVOL. 6. NO 645

Figure 3Land use map in the Fort Cobb Reservoir watershed with center pivot sites (as delineated byStorm et at. 2003), confined animal feeding unit sites, and research measurement sites.
Confined animalfeeding operation
Cattle
Land useWinter wheatPeanut /cottonOther summer cropCrass/pastureForest
In addition, froiii l)eceniber 2004.throughDecember 20)17, hi-weekly1 -L (0.95-qt) grab samples of stream waterwere collected from just below the surfaceand away from the bank at 15 sites distrib-uted throughout the stream network in theFCKEW (figure 3). The samples were aim-lyzed for water soluble P. bioavailable P. totalP. sediment, total Kjeldahl N, total N, nitratenitrogen, carbon, and ammonia concen-trations using methods conforming to USEnvironmental Protection Agency (1983)procedures. Additionally,a Horiha W23X1)water quality probe was used hi-weekly ateach of the sites to irteasure pH, conductiv-ity, turbidity, dissolved oxygen, temperature,oxidation reduction potential, and computetotal dissolved solids. The average P Con-ccii trations froni 1 )ccei ii her 2(1)4 throughugh
Stream sample• Micronet
USGS stream gauge10 Center pivot
December 21)1)7 were regressed against sub-watershed characteristics: contributing area,stream density, average slope, maximumslope, percent sandy soil, percent cropland,percent of unstable streamil channels, andpercent gypsum bed outeroppings using theSELECTION! MAXR nmodel of the regres-sion procedure for one variable, two variables.etc. (SAS Institute 2003).
Unit Source Watersheds and Data fromUt/icr Studies: In 1980, a msnniber of unitsource areas, defmsed as self-contained hill-slope drainage areas with single land useand illanagenlent, were established iii theLWR EW, representing cropland, rangeland,and highly erosive sites (Garbreclit et al.2007). Runoff N, P. and sediment sampleswere collected at these sites on a per-stormh,ni, until 1985. I lvdrolonic data are available
for model calibration from various subsva-tersheds within the Upper Washita Basin,starting in 1961. Measurements of N and Pcompounds were niade on the main steinand tributaries of the Little Washita Riverduring the earl y 1980s.
Soil Measurements. Soils were saimipledAt each Micronet site to provide particlesize fractions and soil texture information atthe 5—, 25—, and 45-ens (2—, 1))—, and 18-in)depths to calibrate the soil water content sen-sors. In addition, soil samples were collectedfrom 41 fields in the ECREW from fourcontrasting nlanagenient systems: (1) conven-tionally tilled suinnier annual crop; (2) no-tillurnnier annual crop: (3) cropland converted
to perennial forage (e.g.. peanut [AracliishypciUaca L] fields converted to herniudag_rass Cymuidoii dart ylon (L.) Pers.] pasture orhay); and (4) native grass land (dominated bysuninier perennial prairie grasses). Farm sur-veys were conducted to collect managementhistory from each sampled field. Soils werecollected from two erosive soil types for eachof the four management schemes. with 10replications (fields) for each management/soilconibniation. Twenty soil cores representingthe 0— to 5-cni and 5— to 10-cm (2— to 4-in) layers were collected fl-urn each held andcomnposited. Sainples froni these sites weresent to the Oklahoma State University Soiland Forage Testing Laboratory for analysis ofsoil test P and N, and additional samples weretaken to the USDA ARS National Soil TilthLaboratory for a multi-site analysis.
Land Use/Land Cover Measurements.Historical cropping patterns were compiledat the county level from USDA NationalAgricultural Statistics Service data forCaddo County. Oklahoma, and extendedbackward into the 1940s rising the USCensus Bureau's five-year report for CaddoCounty located at the CAUDILL Library,Washington, DC. A renmote sensing-basedstudy was initiated in 21)1)5 to determineland use and seasonal patterns of land cover.Remotely sensed images (Landsat TM,30-ill 198.5-ft] resolution) of the LWREWand I-CREW were acquired for March 9.June 13 and 29,Julv 31, September I and 17.and November 4, 2005, for the purpose ofdeveloping a landuse map. Ground truth datawere collected on March 24, June 3, 16. 29.and 30, August I. and November 3 by goingto as many as 32 sites in the LWREW Lind36 sites in the FCREW At each site (geiscr-mliv road iiircrseCtions eiiii team recorded
446NOV/DEC 2008—VOL. 63, NO. 6 JOURNAL OF SOIL AND WATER CONSERVATION

Lake Creek subwatershed
Figure 4Depth to water and precipitation (weekly) in Lake Creek subwatershed, 2006 to 2007.
Oil paper .1113 ph (el igrip h eli the 1.111 d coverconditions ill the northeast, southeast, south-west, and northwest directions. Additionally,the latitude and longitude of each site wereobtained via global positioning system.The groundtruth data were returned tothe laboratory and compiled for later use.All ground-truth data and remotel y sensedimages were delivered to the Department Of(;eography at Oklahoma State Universitywhere a supervised classification of themonthly images was performed b y first fixingwater, roads, and forest and then classifyingother uses for each image based on groundtruth data. The monthly landeover imageswere assembled, filtered using a niorpho-metric function, and reviewed to produce afinal map representing the land uses for 2005.Because of the difficulty in differentiatingOne sunmier crop frl)ni another, peanuts andcotton (Gossypiiimu Iiirsiiri,oi L.) were classi-fied together and a generalized categor y wasused for other summer crops.
Land Management and Conseri'atiouPractices. Agronomic management practiceswere compiled by Storm et a]. (2006) forpredominant cropping systems in the water-sheds. In addition, fariii surveys associatedwith soil quality, studies (above) have beencompiled. Conservation practices receivingtechnical or financial assistance from 2001 topresent have been identified at a flirni level bthe Fort Cobb Water Quahtv Project and theOklahoma state office of the USI )A NaturalResources Conservation Service.
Geomorphology and Sediment SourceTrack jnc A rapid geomorphic assessment(Simon 19K Smion and P.. usald i 20)1)Simon et al. 20(4) of the LWREW andFCI&FW was conducted in February 2006,to determine the overall geomorphic evo-lution of each watershed and to identifyreaches along streams that are unstable orhave potential for bank failure. Preliminaryresults of the rapid geomorphic assess-nieiit were used to identify reaches of theLake Creek suhwatershed subject to streamhank instabilities. At these unstable reaches.sednnent source tracking studies were initi-ated ni the suiiinier of 2(1(16 (Wilson et al21s 3 20)5) to identify the source (uplandVs. stream hank) of clays and silts withinthe stream during storm runoff. AdditionalMethodological detail and results of the rapidgeiinmorphic assessment are given in Sinionand Klimetz (2008) and of sediment sourcetracking are given in Wilson et al. (2008).
1501 in:0
—-20
>-22
--24a-
-26
-28
Results and Discussionlfcc;iuse of the croplands focus of the ini-tial CEAP research, results described in thispaper are predominately f}oni the FCRE'W.Research in the LWREW has contributedprimarily to model evaluation and cali-bration for CEA! (Van Liew et al. 2007a,2007b; Moriasi et al. 2007). Van Liew etal. (2003) also reported that flood retard-ing structures reduced peak flows b y 39%for a 5-year return storm and by 483% fora I 0-year storm in a 100 km 2 (62 nd2) areaof the LWREW where 65% of the area wascontrolled by 13 flood retarding structures.Purim, major storms Ili mid-May 2007.the 2.105 upland flood control structuresin Oklahoma, of which 42 are located inthe LWREW. were credited with avoid-ing 33 million of flood damage, indicatingtheir importance as a Conservation mea-
sure (Oklahoma Conservation Commission2008). Future analyses will be balancedacross both watersheds and across croplandsand grazing lands conservation practices.
Climate, Hydrology, and Sediment Yield.The long-term climate record for Oklahomashows that persistent multi-year precipitationvariations recur at irregular intervals (figure2). A relatively long and strong "wet period"prevailedill the 1980s and 1990s. In recentyears, precipitation trends gradually changedtowards drier conditions. In 2)1)14. at the onsetof CEAI', the region was in this drier pre-cipitation pattern. Multi- year precipitationvariations were found to lead to correspond-ing observed multi-year variations in streamflow in the Fort Cobb watershed (Garbreehtet al 2006).
The 2004 and 2005 instantaneous dis-charge and sediment yield measurements
()CO O0p2.00p2.002.0012001
5-,'\S.'5.'5.,511çs.eci55 0'cs.
J O URNAL OF SOIL AND WATER CONSERVATION 5(V DEC 2008—VOL. 63, NO. 6 I 41*7
.4
6
5
'-I
:12
4.U)
1
611162126310
Day of month
60
50
40
30
20
10
[öl
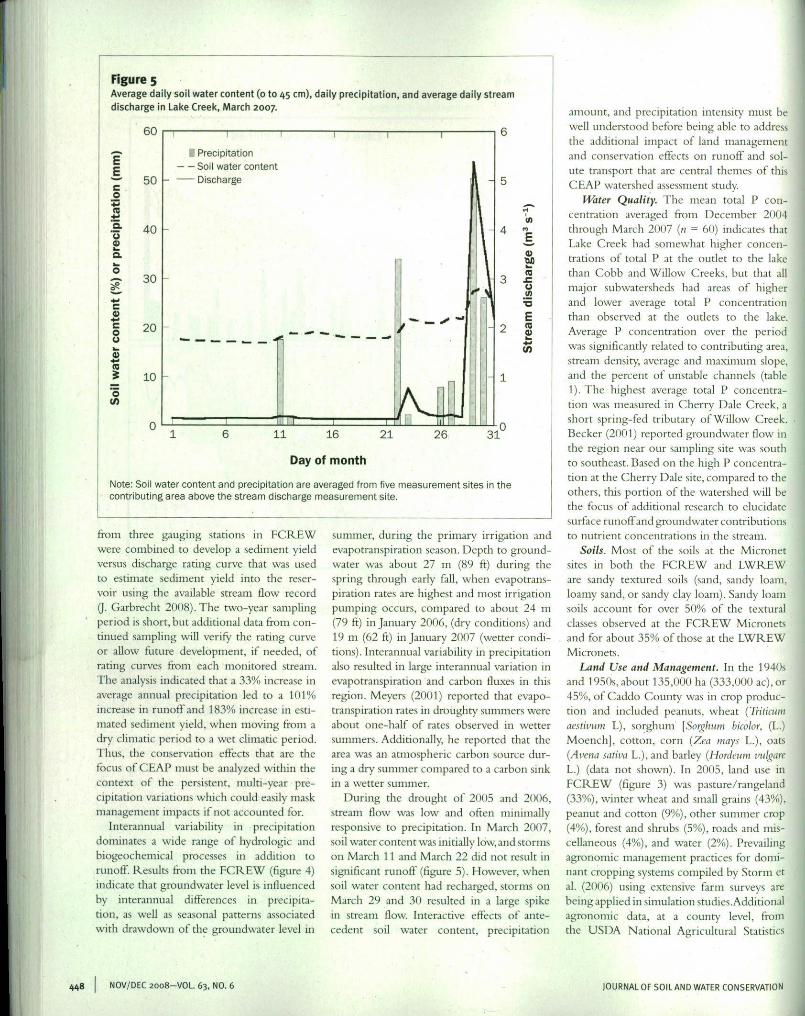
Figure 5Average daily soil water content (o to 45 cm), daily precipitation, and average daily streamdischarge in Lake Creek, March 2007.
E
C0
U0C.0
4.CC,4.
0C.,a-C)4.
JOU)
froin three gauging stations in FCREWwere combined to develop a sediment yieldversus discharge rating curve that was usedto estimate sediment yield into the reser-voir using the available stream flow recordU . Garhrecht 21)08). The two-year samplingperiod is short, but additional data from con-tinued sanipliiig will verify the rating curveor allow future development, if needed, ofriling curves from each monitored stream.The analysis indicated that a 33% increase in.iverage annual precipitation led to a 101%increase in runoff and 183% increase in esti-nated sediment yield, when moving from airy climatic period to a wet climatic period.Ihus, the conservation effects that are theIcus of GEM' must he analyzed within thecontext of the persistent, multi-year pre-cipitation variations which could easily maskmanagement impacts if not accounted for.
Iriteraimnual variability in precipitationloimnaces a wide range of hydrologic andhiogeochemical processes in addition toI unoff. Results from the FCREW (figure 4)indicate that groundwater level is influencedby interammual differences in
liii, .15 \VCll P. seasonal ftter11 .cFJJiIL.-i\ j cYcS-i III
summer, during the prmniary irrigation andevapotranspiration season. Depth to ground-water was about 27 in (89 ft) during thespring through early fall, when evapotrans-piration races are highest and most irrigationpumping occurs, compared to about 24 in(79 ft) in January 2006, (dry conditions) and19 in (62 ft) in January 2007 (wetter condi-tions). Interannual variability in precipitationalso resulted in large interannual variation inevapotranspiration and carbon fluxes in thisregion. Meyers (2001) reported that evapo-transpiration races in droughty summers wereabout one-half of rates observed in wettersummers. Additionally, he reported that thearea was all carbon source dur-ing a dry summer conipared to a carbon sinkin a wetter suninler.
During the drought of 2)1)15 and 2006,streani flow was low and often minunallyresponsive to precipitation. In March 2007,soil water content was initially low, and stormsoil 11 and March 22 did not result insignificant runoff (figure 5). However, whensoil water content had recharged. stornis onMarch 29 and 3)) resulted in a large spikein srrca iii flow. Iii tcr:1c live cffects of iii IC-
cr51 ItIH: I!1 1.11 ii. -
amount, and precipitation intensity must bewell understood before being able to addressthe additional impact of land managementand conservation effects oil and sol-ute transport that are central themes of thisCEAP watershed assessment study.
Water Quality. The mean total P con-centration averaged from December 2004through March 2(1(17 ()1 60) indicates thatLake Creek had somewhat higher concen-trations of total P at the outlet to the lakethan Cobb and Willow Greeks, but that allniajor suhwatersheds had areas of higherand lower average total P concentrationthan observed at the outlets to the lake.Average P concentration over the periodwas significantly related to contributing area,stream density,average and maximuni slope,and the percent of unstable channels (table1). The highest average total P concentra-tion was measured in Cherry Dale Creek, ashort sprmg-fed tributary ofWillow Creek.Becker (2)1(11) reported groundwater flow inthe region near our sampling site was southto southeast. Based oil high P concentra-tion at the Cherry I )ale site, compared to theothers, this portion of the watershed will hethe focus of additional research to elucidatesurface runoffand groundwater contributionsto nutrient concentrations in the stream.
Soils. Most of the soils at the Micronetsites in both the FGREW and I,WR_EWare sandy textured soils (sand, sandy loans,loamy sand, or sandy clay loam). Sandy loanssoils account for over 50% of the texturalclasses observed at the FCREW Micronetsand for about 35% of those at the LWREWMicronets.
Laud Use and Management. In the 1940sand 1950s, about 1 .35,( 0)1 ha (333,000 ac), or45%, of Caddo County s'as in crop produc-tion and included peanuts. wheat ('ftitinunac.stiv,mml, L). sorghum [Soo,thmirn bicolor, (L.)Moench], cotton, corn (Zea mays L.), oats(Anna saliva L.), and barley (Hordemun i'iilc?areL.) (data not shown). In 2005, land use inFCREW (figure 3) Was pasture/rangeland(33%), winter wheat and small grains (43%),peanut and cotton (9%), other sunnner crop(4%), forest and shrubs (5%), roads and mis-cellaneous (4%), and water (2%). Prevailingagrononuc inanagenienc practices for doini-nailt cropping systems conipiled by Storm etal. (2006) using extensive farm surveys arebeing applied in simulation studmes.Additional.lgiOi101flic dua..1t a-oimiirv ]evcl, 611111
- - I - H I \H:: I I IlL - I ii',I II N: --
Note: Soil water content and precipitation are averaged from five measurement sites in thecontributing area above the stream discharge measurement site.
548Nov/DEC 2008-.VOL. 63, NO. 6 JOURNAL OF SOIL AND WATER CONSERVATION

Table 2Conservation practices supported with public funds in the Fort Cobb Reservoir watershed.
USDA NRCS*
Conservation practiceContracts Area (ha) Length (km) Structures
Reduced tillage, no-tillageNA437
Land conversionConservation Reserve Program3NANAAnnual to hay/pastureNA2,216
Stream corridor NA400
Fencing, use exclusion
Oklahoma Conservation Commissiont
ContractsArea (ha)Length (km) Structures
296,880
NA2,646
NA 113
Structural 11NANAWaterway NA
2.7
Terrace NA
2.1
Pipe drops NA
37
Creek jacks NA
30
Septic rehabilitation 5
5
Water management 171,117
Total 404,170 1229,6394.872
Note: NA = data not available.* Data from 2002 to 2006 provided by Phil Perryman, district conservationist, Caddo County, Anadarko, Oklahoma.t Data from 2001 to 2006; M. Ramming; Fort Cobb project coordinator, West Caddo Conservation District, Fort Cobb, Oklahoma.
Service and the historical Agricultural Censusdata will be used to compile historical trendsin cropping patterns, fertilization rates, andaverage yields for future environmental andeCoiionnC analyses.
From Oklahoma Water Resources Boardrecords, we estimated that about 3,500 ha(9.1)1)1) ac) were irrigated in 1958. A few ofthe older solid-set or side-role irrigation sys-tems are still used in the watershed, but mostirrigation in the watershed now is by center-pivot systems. If all pivot sites shown ill3 (from Storm et al. 2003) made a completerotation irrigating 52 ha (132 ac), it wouldconstitute about 10 ,000 ha (26,000 ac) irri-gated by center-pivot systems. Many of thesepivots only supply water to a portion of theland, so further quantification of the irriga-tion component of the water balance overtime is required. Using a timeline of increas-mug irrigation acreage over time improvedSoil and Water Assessment Tool (SWA F)model performance compared to validationruns that assumed a static (current) irrigatedarea (Garbrecht Ct al. 21)07).
Conservation Practices. A nuniher of con-servation practices have been implementedoil FCREW in recent years includingadoption of no-tillage management, con-Version of cropland to grassiaod, installation
of fencing to exclude cattle from streams,various structural practices, and water man-agenient practices (table 2). In a sunulationstudy. Geza et al. (2004) estimated that thewater quality in the watershed would hehighly responsive to conversion froni peanutto perennial crops, and that conversion toswitchgrass as a hioenergy crop, rather thanconversion under Conservation ReserveProgram contracts, would allow for lowerincentive payments. In their study, conversionto ininimuni-tillage wheat was simulated toallow for even lower incentive payments thanfor conversion to perennial biofuels crop-ping, but miniminii-tillage wheat providedless reduction in environmental risks thanconversion to perennial systems.
Sharpley et al. (1996) analyzed paired unitsource watersheds in the LWREW from11980 to 1992 and found that treatment ofgullies (smoothing, vegetation establislnnent,and retention structure) on one of two erod-ing watersheds resulted in a 82% reduction insediment loss, a 61% reduction in total P. anda 56% reduction in total N, compared to theuntreated gully. Simon and Klimetz (201$)also identified gully and channel erosion asa donnnarit potential source of sednncnt inthese two watersheds, indicating the needFor conservation practices that ,iddrcss con-
centrated flow and associated environmentalrisks. Wilson et al. (20118) found that onlyabout 50% of suspended sediment sampledin the upper reach of Lake Creek duringrunoff from one storm in August 2006, wasFroin upland eroded surface soils. Clearly,solutions to water quality problems in thiswatershed must include conservation prac-tices that address concentrated flow andchannel Processes.
Analysis of soils flour farmers' fields ill rotation, conventionally tilled wheat,
cropland converted to perennial grasses, andnative grasses, showed that P and N levelswere higher iii no tillage fields wheii com-pared to conventional fields, and that soilnutrient levels ill cropland convertedto perennial grasses or pastures were lowerstill (figure 7). Since the proposed totalniaxnum daily load plan for this watershedis based on P. future research is needed onseasonal and nianagemerit impacts on soilnutrient concentrations as svell as delivery ofnutrients in solution from fields with con-trasting management practices.
Key Driving Forces and ConservationChallenges. Results indicate that improvedunderstanding of the complex interactiveeffects of climate, land use, and land mnianage-I ncnt is required to improve our quantitative
JOURNAL OF SOIl AND WATER CONSERVATION NOV, DEC 2008 VOL. 63, NO. 6449

understanding of environmental iSSUCS inagricultural watersheds of the Upper WishitaRiver Basin. in the FCREW, with improve-nient of water quality ill the nutrient-limitedreservoir as an endpoint, nutrient inovenientits solution and attached to sediment is andmust remain a key focus. However, reduc-tion of the nutrient load front watershedwill not resolve, in itself, the large nutrientload that is already in reservoir and lakesediments. Because of uncertaint y about therole of base flow in nutrient transport, fourexploratory wells and five additional ground-water monitoring wells are planned for 2008where groundwater elevations call inca-sured using pressure transducers equippedwith data recording equipment. These siteswill allow access for groundwater sampling(fisure 1) in which water samples will beanal yzed for N species and forms of water-soluble P. Performance of hydraulic con-ductivity nicasuremnents of geologic unitsare scheduled oil monitoring wellsin sulnnser 2008 usin g the down-hole slug
test method described by Bouwer and Rice(1976).
Results indicate that delineating rill, gully,and channel sources of sediment and quan-tifying the storage and rate of movementof scdnnents and nutrients within water-sheds must remain a high research priorityConservation practices niust address stabi-lization of the stream corridor and riparianbufk'rs, as well as reducing vulnerability toupland nil erosion. There are visible signs ofwind erosion that deposits soil in ditches, nearfence rows, and in other portions of the land-scape, where the poorl y aggregated particlesare subject to subsequent water transport. Itwill be a great challenge to develop modelsand practices that address interactive cfflctsof wind and water transport of sediment andassociated nutrients.
There are numerous nonagricultural sedi-nient and nutrient sources in the watershedthat must be accounted for and includedin the search for solution to water qualitydeterioration, including road niaintenance
practices, residential and recreational septicsystems, and wildlife. Fairchild et al. (2004)indicated that the highest observed level ofE. otfi near the municipal water intake sitefor the city of Anadarko was associated witha period with large mini nhers of over-winter-ill-' present at the reservoir.
Conservation Opportunitmes. Conversionto mcduced tillage and more intense croprotations has increased in the FCREW inthe past few years, partially driven by increas-ing fuel costs. The Okiahonia ConservationConnnission has focused on increasing no-tmllage in the watershed. No-till workshopsattracted about 150 producers in August2006. and about 300 in February 21)07, mdi-carnig a high and increasing imiterest. Waterquality unproveinents in lake Creek withinthe FCRF.W were recently identified asa nonpomt source prograni success story(Butler 2007), where educational efforts andbest nianageinent practice installation wereidentified as contributuig fcrors in improve-nient of the lndcx of Biological Integrityscores betweeii 1990 and 1998, resulting inremoval of tile Lake Creek from the 303(d)list.
Another practice being adopted in thewatershed is fencing or exclusion of cattlefrom streams. En niany of these areas, veg-etation has very quickly re-established ontile stream banks and fenced ripanian area(M . Ranning, Oklahonia ConservationConnuission. persoi ial coilitnunication 2004).Given findings of Sinion and Khimetz (2008)of the large amount of unstable channels inthe watershed and of Wilson et ml. (200$)of the large fraction of suspended sedimentduriig storm runofi that is from concen-trated flow or channel areas, the importanceof niparian vegetation to enhance streambank stability is very signiticant.
Next Steps. A great deal of research focus-ing oii cropl.oid conservation, establishedsince 211)4 as part of CEA is ongoingand will continue to provide more derailedresnits. It is important to continue to ana-lvze the multitude of results emergingus order to address complex interactiveprocesses that impact effectiveness of con-servation practices. The study initiated toevaluate the Soil Managensent AssessmentFramework (SMAF) (Andrews et al. 2004)will provide the basis for future studies onthe hydrologic nnphications of soil qualityiniprovenient. Field study results will be usedto paraniererize field-scale simulation sites
Figure 6Total phosphorus (mg P L - ) within the stream network, averaged from December 2004 throughMarch 2007.
•0.360.52
• 0.35• 0.35
0 oi , • 0.31
ci\o7 •q.0.44-•°.
()0o c
•0.410041 (
450NOV/DEC 2008—VOL. 63, NO. 6 JOURNAL OF SOIL AND WATER CONSERVATION

4
LIIItIIIJ
0
r--L-
C IN
I -
Figure 7Effects of agricultural management system on (a) phosphorus (Mehlich 3), and (b) nitrate-nitrogen concentrations (from 42 on-farm soil quality study sites, sampled in November 2006).for key inaiiageiiieii t regimes. A niodcli rig
rirdv will be conducted to quaiitif' poteri-ti,il impacts of contrasting land managementand conservation practices, including subse-quent impact of changed soil properties onsurface and subsurface hydrology. The sintu-lated effects of land nianageinent on surfacerwiofL infiltration, soil moisture distributionand the movement of N from the soil surfaceto below the root zone will be quantified.As this research matures, spatial and temporalscaling studies will help build understand-ing of scaling from edge of field to deliveryto the reservoir. Temporal anal ysis will alsofocus on definition of a "design storm" forparticular practices to achieve particularlevek of environmental protection. Basedoil these findings, in-field experimentation,simulation, and promotion of conservation,channel processes and gully erosion must heid Iicc,ed.
Summary and ConclusionsI lie goals of the CEAP watershed assess-merits studies are broad and long term(Richardson et al. 2608). Since 2004, researchin the Upper Washita River Basin in south-western Oklahoma has been expanded fromthe Little Washita River suhwatershed, whereARS research was established in 1961, to asecond suhvatershed above the Fort CobbReservoir. The research configuration pro-vides the franicwork to address conservationConcerns of rainted and irrigated cropping as\\elI as pasture arid native rangelands. Recentacceleration in conversion from intensivelytilled systems to conservation tillage sys-tenis (as fuel prices have increased) oticrsthe opportunity to quantify changes in soilbiological chemical, and physical propertiesor the soils under changing managementrc1I1es. Data analysis within the watershedshould provide insight into fate and transportof contaminants that originate at the fieldscale. In addition, gully erosion, stream bankfailure, and channel processes are all conser-vation concerns in this watershed that musthe addressed through conservation prac-tices. Research and assessments on scalingFro in field to watershed and fate and trans-port analyses must include a Suite of modelsappropriate to the complex array of con-servation concerns. Results clearl y indicatethat 1111ilti-ycar precipitation variations area key factor impacting hydrologic and otherenvironmental processes. If climate issues areiiOi included in the CL Al' assessin ci its, these
(a) 200
1::
(b) 70
60
50
C4000I-C30nfl04.
20
10C-
mipaets could easily mask the conservationarid managenient effects that are the tar-getof the research -
DisclaimerI<CIelCiitt' [Ii .11)5 p1 III)) 'iii hut j),Ipti It ill_tiC fulllike Ill_i -
nonal purposes only and does not constitute in euidorseitientk. I :si )A or due ,iluihu,rs.
Max,Upper quartile
Median -
Lower quartileMitt.-
Outlier 0
C
ReferencesAllen. I'.0. ui,1 .0,'. Nancy. iNS I. Hydrology of the Little
W,isliit.i River 'Aershed, Oklahoma: l)ara and An,ilvsis.ARS-1M. USDA Agricultural Kewarch Service.
Andrews, SS.. 01. K,urlen, and C.A. C.unt'ardella. 2004.Thesoil iti.m.igcntent assessment iratncsvork: A quantitativesoil qualirs evaluation method. Soil Science Society ofAmerica journal 68(6): 1945-1962.
0 1 I
No-tillConventionalConversionNative
4
JOURNAL OF SOIL AND WATER CONSERVATION NOV.:DEC 2008—VOL. 63, NO. 61 451

Badger, DL)., I).F. Schreiner, and R.W. Presley. 2003.Regional impacts of recreational expenditures at twoOk.lahonu lakes. Proceedings of the Oklahonsa Academyof Sciences 59:139-142.
Becker, C.J. 2001. Ground-water Quality. Levels, and FlowDirection Near Fort Cobb Reservoir, Caddo County,Oklahoma, 1998-2000. US Geological Survey, Water-Resources Investigations Report 01 -4076.
Becker. M.F. and 1)1.. Runkle. 1998. 1-lydrogeology, WaterQuality, and Geochemistr y of the Rush Springs Aquifer,Western Oklahoma. US Geological Survey, Water-Resources liivcstig.itioiis Report 98-4081.
Bouwer, II., and P.C. Rice. 1976 A slug test for deter-lowing hydraulic conductivity of unconfined aquiferswith completely or partially penetrating wells. WaterResources Research 12(2):423-428.
Fairchild,J.,B. Lakish, K. Echols, I). Cli.ipitman,T.Johnson.aimdS. Jones. 2004. Air Assessment of the liophicStatus of Fort Cobb Reservoir, Oklahoma. Fin.il report.Columbia, MO: Columbia Environmental Researchr,;enier. US Geological Survey.
Garbrecht, J.D. 2008. Multi-year precipitation variationsand watershed sediment y ield in .i CEAP benchmarkwatershed. journal of Soil and Water Conservation.63:(2)70-76.
G.irhrechr.J.L).,and F. Rossel. 2002. Decade-scale precipita-tion increase in the Great Plains at the end of the 20thcentiirv.Jinmrnal of Hydrologic Engineering 7(l):64-75.
Garbreclmm, j.l).. R.I. Starks. and J.L. Steiner. 2007. Historyof the USDA-A P.S Experimental Watersheds onthe Washsmt.i Riser, Oklahoma. In Contributionsto Environnient,il and Water Histor y. ed. J . Roger.94-106. Reston. Virginia: American Society for CivilEngineers. 1801 Alexander Bell Drive, 211191.
Garhrecht,J.l)., P.J. St.irks, and j.L. Steiner. 2006.The under-appreciated climate factor in GEAR journal of Soil andWater Conservation (ml (4):l1( (A-Il 2A.
Geza, M., B.J. Barfield. and R.L. I lulmmike. 2004. Modelingecononmmc and environmental impacts of land use changein the Fort Cobb Basin. Riper No. 04200 .1, St. Joseph,Ml: Anic'rmc.ims Society of Agricultural and BiologicalEngineers.
McPherson, R.A., C.A. Fiebrich, K.C. Crawford, R.L. Elliot,J.R. Kilby, D.L. Grinisley, J.E. Martinez, J.B. llasara,B.G. Illston, D.A. Morris, K.A. Kloesel, S.J. Stadlet, Al.).Mclviii, A.I. Sutherland. F-I. Slirivastava, J.D. Carlson,J.M. Wolfinbarger, 3.1'. Bostic. and I).B. Deniko. 2)1)17.Statewide imsointoruig of the nicsoscale environment: Atechnical update on the Oklahoma Mesonet. Journal ofAtmospheric and Oceanic Technology 24(3):301-321.
Mevers,T.P. 2001. A comparison of suitmniertimstc water and(:02 fluxes over rangeland for well watered and droughtconditions. Agricultural md Forest Meteorology106(3):205-214.
Moriasi, l).N., J.G. Arnold, M.W. Vats Liew, R. L. Bingner,R.D. I I,mrmiiel. and TL. 'v'emth. 2007. Model evaluationguidelines for systematic quantification of accuracyin watershed simmitmlations. Transactions of the ASABE50(3):885-900.
Oklahoma Climatology Survey. 2005. Caddo CountyClnnate Summary. lmttp://clinsate.niesonet.org/county_chniate/Prcsducts/QuickFacis/caddo.pdf.
Oklahoma Conservation Coinnussion. 2008. Dams SaveOklahoma 533 Million in Flood Damages. hitp://www.ok.gos'/okcc/Nesvs/l )am.image_Preventioim_f'roiii_Flmsod_Cotitrol_Danis.lmitmml
Oklahoma Water Resources Board. 2003. Beisetici.ml UseMonitoring Program (BUMP) Report. - littp://www.osvrb.ok .gos'/studies/reports/bunsp/2003 / humup2(H03.php.
Pickup, BE., W.J. Andrews, B.E. Haggard, and W.R. Green.2003. Phosphorus Concentrations. Loads. and Yields inthe Illinois River Basin, Arkansas arid Oklahoma, 1997-2(11(1. United States Geological Survey Water ResourcesInvestigation Report 03-4168.
Richardson, C.W, I ),A Bucks, and E.j. Sadler. 2008. TheConservation RIles is Assessment Project hencliniarkwatersheds: Synthesis of preliminary Iindings.Journai ofSoil and Water Conservation 63)6):590-604.
SAS Institute. 2002. SAS User's Guide: Statistics.Version 9.1.Cary, NC:: SAS Institute Inc.
Sether, B- WK- llerkas. and A.V. Vecehia. 2004. ConstituentLoads and Flow-weighted Average Concentrationsfor Major Subbasins of tire Upper Red River of theNorth Basin, 1997-1999. USGS Scientific InvestigationsReport 2)11(4-32)))).
Sharples'. A., S.J. Snuths, J.A. Zollss'eg, and G.A. Coleman.1996. Gull y treatisment and water quality in theSouthern Plains.journal of Soil and Water Conservation5] (6):498-503.
Sutton, A. 1989. A model of channel response in disturbedalluvial channels. Earth Surface Processes and L,indformsms14(l):11-26.
Smion. A.- W. Dickerson, and A. I-kiits. 2004. Snspended-sed-timient transport rates it the IS-year recurrence intervalfor ecoregions of the United States:Traosport conditionsat the bankfull and effective discharge. Geomorphology58(1-4):243-262.
Simon, A., and L. Klimeiz. 2008. Relative magnitudes andsources of sediment iii heniclunark svaterslmeds of theC:onsersioon Effects Assessment Prcmject.Jcmurnal of Soiland Water Conservation 6)(6):504_522.
Snnoim. A., and M. Rinaldi. 2000. Ch.mtmmicl nisiabilitvnm time iocss areas of the Midwestern United States.
journal of the American Water Resources Association36(l):133-I511.
South, S.j., JR. Mclleiirv, R.G. Menzel. and N.H. Welch.1986. Agricultural chemicals and heavy metals inupland soils and valley alluviuums of the Little WashsitaRiver Ifasmts. journal (if Soil and Water Conservation
- 41)5):333-336.Steiner, j.L., Ej. Sadler, j.-S. Chen. C. Wilson, I). James,
B. Vandenberg, J . Ross, T. Oster, and K. Cole. 20118.Sustaining the Earth's Warersheds-Agrmcmihtural ResearchData System: Overview of developiimemit and challenges.Journal 01 Soil Water Conservation 6)(6):369-576.
Steiner, J.I.., P.3. Starks, M.W. Vain Limo J.A. I),mimmel, M.Ramming, S. Phillips, K. Matlock. R. Freeland. illid
J . Adams. 2904. The USDA Conservation EffectsAssessment
project. Research its the Fort Cobb
Reservoir Watershed. Jim Proceedings of the C)kI.ihornaWater 2004 (:ommfireumce, Stil]svater. OK, November 18-19.2004 ((:1) ROM).
Stimrnm, D.E., P. It,.. Busteed. and M.j. White. 2006. Fort CobbBasins - Mmmdehmmig and Land Cover Classification. DraftReport to time Oklahoma Dep.mrtmmient of EmnvironmiimenmtalQuality. Imttp://svsvsv.deq.stane.ok.us/ W(3Dmiew/tnmdl/fort,cohh/osuCrtcobhumiodeling,,,jamm200(m.pdf.
Storm, D.E., M.J. Whiny', amid S. Stoodlev. 2003.8 Fort CobbBasin-Modeling and Land Cover Classification. FinalReport. Subuuttgd to the Oklahoma ConservationCommission. http://stormmu.oksrate.edti/reports/Fort'X>2n(C:olsh'n2oreport'R2n(Fuial%211Report%202_26_2003.pdf.
Tortimrehli, R.L.. and B.E. Pickup. 2006. PhosphorusConceiiteatnoiss. Loads, and Yields in the Illinois RiverBasin. Arkansas and Oklahoma, 2(881-20(14. USGSScieittmt'mc Investigations Report 21)(10-5175.
US Eiivironniieiinal Protection Agenc y. 1983. Methodsfor Chemical Analysis of Water and WastesEPA600479020.
USDA Agricultural Research Service. 2008. ARS Micrimniethmtp://ars.misesoumet.org/puhlic.
US Geological Survey. 2008. USGS Real-Time Water Datafor Oklahoma. Isttp://waterdata.mism'.s.gov/ok/muwis/rt.
V,mmm Liesv, M.W. J.D. G,mrlmreclmt, and J.G. Arnold. 2(11(3,Simulation imf the mmnip.wts of'floosf retarding structtmues onstm eaniblosv for it in southwestern Oklahomaunder ilry, as'er.mge. and wet climatic conditions. Journalof Soil and Water Conservation 58(6):340_348.
Van Liew, M.W., C.H. Green, aumml P3. Starks. 2007a. Unitsource area data: Cimmi it ni,mke ;I ins calibratingtime hydrologic response for watershed-scale niodelimqz?Journal of Soil md Water Cummsservationi 62(3):162-171).
Vami Ltew,M,W, T.L. Veinlm. D.D. lfoscls. and J.C. Arimmmld.20071,. Simmtmmlumlit y of SWAF for the comnscry.itiunet5..'cis ,mssessmnm'mmt project: A comparison on USDA-ARS experimmienital watersheds. journal of l-ldrmslogicEngineering 12(2):173-189.
Wilsomm.C.G., CA. Kulitile. l).D. Bosch. J.L.Steuier, PJ. Snarks,M.I ).Tmmmumer, ,muimf CV. Wilsoni. 2008. Quantifying relativecomiirnl,mmtiouis front sediment sources litEffects Assessment Project watersheds. Jmsmmrumal of Soilmud Water Conservation 63(6)523-532.
Wilson, c:.c .. C. Mat msis(R and I'.,). Whining. 2003. Short-term emosmimmi rates frommu a 71Ie inventory balance. EarthStmm'Cmce Processes arid [.ammd(hrmi(s 2$(9):967-977.
Wmlsismm. C c;.. G. ManmsofL 03. Whiting. annh D.M. Kl.mrer.2003. Transport of fine sediment nhmmimmmgh .m svetlaumdtmsmmig radionuclide tracers: Old Woman Creek, OH.Journal ofC;rear Lakes lt,ese,mrclm 31(l):56-57.
452 1 NOV/DEC 2008-VOL. 63, NO.6 JOURNAL OF SOILAND WATER CONSERVATION