
Environmental and Social Impact Assessment (Final)
367
Environmental and Social Impact Assessment (Final) Part 5 of 18 October 2019 THA: Eastern Economic Corridor Independent Power Project Anticipated Environmental Impacts and Mitigations Prepared by Gulf PD Company Limited for the Asian Development Bank. The environmental and social impact assessment report is a document of the borrower. The views expressed herein do not necessarily represent those of ADB's Board of Directors, Management, or staff, and may be preliminary in nature. Your attention is directed to the Term of Use section of this website. In preparing any country program or strategy, financing any project, or by making any designation of or reference to a particular territory or geographic area in this document, the Asian Development Bank does not intend to make any judgments as to the legal or other status of any territory or area.
-
Upload
khangminh22 -
Category
Documents
-
view
0 -
download
0
Transcript of Environmental and Social Impact Assessment (Final)

Environmental and Social Impact Assessment (Final)
Part 5 of 18
October 2019
THA: Eastern Economic Corridor Independent Power Project
Anticipated Environmental Impacts and Mitigations Prepared by Gulf PD Company Limited for the Asian Development Bank. The environmental and social impact assessment report is a document of the borrower. The views expressed herein do not necessarily represent those of ADB's Board of Directors, Management, or staff, and may be preliminary in nature. Your attention is directed to the Term of Use section of this website. In preparing any country program or strategy, financing any project, or by making any designation of or reference to a particular territory or geographic area in this document, the Asian Development Bank does not intend to make any judgments as to the legal or other status of any territory or area.

CHAPTER 5
ANTICIPATED ENVIRONMENTAL
IMPACTS AND MITIGATIONS

Environmental Report for submissionl to ADB Chapter 5
Pluak Daeng Power Plant Anticipated Environmental Impacts and Mitigations
RNP/ENV/P05028/FR (ADB)/RE62049-chap 5 Page 5-1
CHAPTER 5 ANTICIPATED ENVIRONMENTAL IMPACTS AND MITIGATIONS
5.1 PHYSICAL RESOURCES 5.1.1 Air Quality, Climate Change and Greenhouse Gas (GHGs) 5.1.1.1 Air Quality (1) Construction phase The meteorological condition in the project area will not be affected or changed by the construction activities during the construction phase, but the air quality may be affected by construction activities. The main activities attributing to the dispersal of dust particles are foundation building and strengthening as well as pond excavation, as these involve digging, ploughing, and compacting the ground. These activities exclude land levelling which is responsible by Pluak Daeng Industrial Park beforehand over the land to GPD. The number of dust particles dispersed into the ambience depends on the duration of the construction phase, wind speed, wind direction, soil moisture, and the construction sites in the project. Besides, there are pollutants released from the construction tools and machines employed. It is thus necessary to assess the air quality impact in the Construction Phase. The AERMOD mathematical model, version 9.1, which is the latest model (according to the information retrieved in July 2016), is used for the assessment, the details of which are as follows: (1.1) Selection of the model As the sources of air pollutants incurred from the execution of the project are point sources and area sources, in the selection of the model to be used, the concentration of pollutants from multiple sources must be able to be calculated and the location of the receptors and the pollutant sources must be able to be freely selected. Consequently, the consultant team select the AERMOD mathematical model, which is widely recognised and used. With this model, concentration of air pollutants is calculated based on the theory of the planetary boundary layer, the range of which is about 100 meters during nighttime and possibly 1-2 kilometers during daytime; and can be classified into the Convective Boundary Layer (CBL) - the part of the atmosphere caused by the

Environmental Report for submissionl to ADB Chapter 5
Pluak Daeng Power Plant Anticipated Environmental Impacts and Mitigations
RNP/ENV/P05028/FR (ADB)/RE62049-chap 5 Page 5-2
movement of air masses because of sensible heat flux, and the Stable Boundary Layer (SBL) - the part of the atmosphere affected by surface drag, but not influenced by sensible heat flux. AERMOD is a steady- state plume model. In the stable boundary layer (SBL) , it assumes the concentration distribution to be Gaussian in both the vertical and horizontal distribution. In the convective boundary layer (CBL) , the horizontal distribution is also assumed to be Gaussian, but the vertical distribution is described with a bi- Gaussian probability density function. (1.2) Input data used in the model (a) Meteorological data Meteorological data are important input used in the mathematical model in the investigation and assessment of air pollutant concentration, especially data on the wind speed and wind direction as they influence the dispersion of pollutants released into the ambience. In the investigation, the consultant team use the AERMET program to collect the meteorological data during 2016-2018 and refer to the Guideline Manual on the Use of Models to Assess Air Pollutant Dispersion prepared by the Office of Natural Resources and Environmental Policy and Planning (ONEP) dated 24th September 2013 in calculating the factors of the atmospheric boundary layer that is in contact with the planetary surface, which are to be used as input data in the AERMOD mathematical model. The meteorological data used in the assessment are retrieved from the Air Quality Monitoring stations situated the nearest to the project location. The surface data are derived from two sources, which are 1) Pluak Daeng District Public Health Office’ s Air Quality Monitoring Station, Rayong Province, which is under the charge of the Pollution Control Department and 2) Huay Pong Air Quality Monitoring Station, Mueang Rayong District, Rayong Province, which is under the charge of the Meteorological Department; the details of which are shown in Table 5 . 1 . 1 - 1. For the upper air data, the source is the Bangna Air Quality Monitoring Station. The details are as follows:
The surface data; which include wind speed and direction per hour, as shown in Figure 5.1.1-1, dry bulb temperature and relative humidity, as well as the surface features of the area under study; are derived from Pluak Daeng District Public Health Office’ s Air Quality Monitoring Station, Rayong Province, under the charge of the Pollution Control Department, between 2016 and 2018. For the cloud cover and ceiling height per every three hours, the data are from the monitoring of Huay Pong Air Quality Monitoring Station, under the administration of the Meteorological Department, between 2016 and 2018. The details are shown in Table 5.1.1-2.

Environmental Report for submissionl to ADB Chapter 5
Pluak Daeng Power Plant Anticipated Environmental Impacts and Mitigations
RNP/ENV/P05028/FR (ADB)/RE62049-chap 5 Page 5-3
TABLE 5.1.1-1 DETAILS OF THE AIR QUALITY MONITORING STATIONS WHICH ARE THE DATA
SOURCES IN PLUAK DAENG POWER PLANT PROJECT’S AIR QUALITY ASSESSMENT
Air Quality Monitoring station Distance from Pluak
Daeng Power Plant Project (kilometer)
Compass point direction
Pluak Daeng District Public Health Office’s Air Quality Monitoring Station, Rayong Province, under the charge of the Pollution Control Department
6.6 East-Southeast (ESE)
Huay Pong Air Quality Monitoring Station, Mueang Rayong District, Rayong Province, under the charge of the Meteorological Department
24.6 Southwest (SW)
TABLE 5.1.1-2
DETAILS ABOUT THE USE OF SURFACE METEOROLOGICAL DATA IN PLUAK DAENG POWER PLANT PROJECT
Details Pluak Daeng District Public Health Office’s Air Quality Monitoring Station
Huay Pong Air Quality Monitoring Station
2016 2017 2018 2016 2017 2018 Wind speed and direction √ √ √ - - - Dry bulb temperature √ √ √ - - - Relative humidity √ √ √ - - - Cloud cover - - - √ √ √ Ceiling height - - - √ √ √

Environmental Report for submissionl to ADB Chapter 5
Pluak Daeng Power Plant Anticipated Environmental Impacts and Mitigations
RNP/ENV/P05028/FR (ADB)/RE62049-chap 5 Page 5-4
2016 2017
2018 2016-2018
FIGURE 5.1.1-1: WIND SPEED AND WIND DIRECTION FROM PLUAK DAENG DISTRICT
PUBLIC HEALTH OFFICE’S AIR QUALITY MONITORING STATION, 2016-2018

Environmental Report for submissionl to ADB Chapter 5
Pluak Daeng Power Plant Anticipated Environmental Impacts and Mitigations
RNP/ENV/P05028/FR (ADB)/RE62049-chap 5 Page 5-5
For the surface meteorological data derived from Huay Pong Air Quality Monitoring Station, the monitoring is conducted every 3 hours, which is different from at Pluak Daeng District Public Health Office’s Air Quality Monitoring Station where the monitoring is conducted on an hourly basis. In this way, the data derived from Huay Pong Air Quality Monitoring Station must be first converted to per hour basis before they can be fed into the AERMET program. Preparation of the data is as follows:
For ceiling height, if there are data covering all the time period required, step-wise linear interpolation is to be employed. If there are data missing, data from the previous year will be used. If there are no data from the previous year, the hourly average in the monitoring in each month will be used.
For cloud cover, the data are derived from the monitoring which is conducted every 3 hours and there is no data missing. Step- wise linear interpolation is employed so as to convert the data to per hour basis.
The upper data; which are derived from the monitoring conducted at different standard pressure levels starting from the level of about 100 meters above the surface up to the level of about 20 kilometers (up to the level of about 3,000 meters for the data required for the AERMET program); include wind speed and direction, temperature, and dynamic height. Upper air for this study was derived from Weather Research and Forecasting (WRF) (Lakes Environmental Software, 2019) comprising data of pressure, height, temperature, as well as wind speed and wind direction during the Year 2016-2018. Meteorological data of the area with respect to land utilization, which include surface roughness length, Bowen ratio, and albedo; are examined based on the land utilization around Pluak Daeng District Public Health Office’s Air Quality Monitoring Station through the use of the Land Development Department’ s most recent land utilization map covering Rayong Province (2016) . With the site of Pluak Daeng District Public Health Office’ s Air Quality Monitoring Station being specified, the values of the three variables are calculated for two periods, which are May – October ( wet season) and November – April ( dry season) . The QGIS program is applied to convert the Land Development Department’s data on land cover classification in Rayong Province to those applicable to USGS NLCD92 (National Land Cover Dataset 1992), which is a 21-class land cover classification scheme ( the details of which are shown in Appendix 5 A- 1) . Then the

Environmental Report for submissionl to ADB Chapter 5
Pluak Daeng Power Plant Anticipated Environmental Impacts and Mitigations
RNP/ENV/P05028/FR (ADB)/RE62049-chap 5 Page 5-6
converted data are fed into the AERSURFACE program to calculate the values of surface roughness length, Bowen ratio, and albedo ( the details of which are shown in Appendix 5A-2) according to the direction prescribed in U.S.EPA AERSURFACE User’s Guide (as revised on 01/16/2013). In calculating the surface roughness length value, the weighted geometric mean is used, the inverse distance is within 3 km radius and is applied for eight different land use categories. In calculating the Bowen ratio, the unweighted geometric mean is used. In calculating the albedo value, the unweighted geometric mean is used within the area of 10x10 kilometers. Details of land utilization within a three- kilometer radius of Pluak Daeng District Public Health Office’s Air Quality Monitoring Station and in the area of 10x10 kilometers around it as investigated by the AERSURFACE program are shown in Figure 5.1.1-2.
Data on topography and ground height level of the study area to be applied to the AERMAP model are retrieved from the Seamless Shuttle Radar Topography Mission (SRTM) - N12E101 and N13E101, at a resolution of 90x90 meters. (b) Data on potentially affected receptors The consultant team prescribe that the investigation of impacts of air pollutants released from the project covers the area within a fifteen- kilometer radius of the project’s fence line. (“Fenceline” means the project’s boundary inaccessible to the public unless authorized.) The grid receptors are defined as follows:
From the project site to the distance of 1. 5 km away from the fence line, at a resolution of 100 meters.
From the distance of 1. 5–3. 0 km away from the fence line, at a resolution of 250 meters.
From the distance of 3. 0–15. 0 km away from the fence line, at a resolution of 500 meters. In addition, data on ground height level from SRTM3/ SRTM1 are used to assess the air quality in the project area. The study area is classified as elevated terrain and further investigation is conducted on sensitive receptors affected by air pollutants released from the project, which include hospitals, temples and schools in the study area; with a view to assessing the likelihood of the direct impact of the said air pollutants to the health of the people living in the area under study. The sensitive receptor sample groups, 31 in total, are shown in Table 5.1.1-3.

Environmental Report for submissionl to ADB Chapter 5
Pluak Daeng Power Plant Anticipated Environmental Impacts and Mitigations
RNP/ENV/P05028/FR (ADB)/RE62049-chap 5 Page 5-7
5.2.2-2 : 3 10x10
: AERSURFACE . . 2559
FIGURE 5.1.1-2 : DETAILS OF LAND UTILIZATION WITHIN A THREE-KILOMETER RADIUS OF PLUAK DAENG DISTRICT
PUBLIC HEALTH OFFICE’S AIR QUALITY MONITORING STATION AND IN THE AREA OF 10 X10 KILOMETERS AROUND IT
Source: Modified Land use of Rayong and Chon Buri Provine from Land Development Department (2016) by Aesruface Function in AERMOD

Environmental Report for submissionl to ADB Chapter 5
Pluak Daeng Power Plant Anticipated Environmental Impacts and Mitigations
RNP/ENV/P05028/FR (ADB)/RE62049-chap 5 Page 5-8
TABLE 5.1.1-3 GRID REFERENCE AND DISTANCE OF THE SENSITIVE RECEPTORS
FROM THE PROJECT LOCATION
No. Sensitive receptor Grid reference Distance from the project E N location (km) / direction
1 Map Yang Phon Sub-district Administrative Organization
735565 1433613 1.29/east
2 Ban Map Toei School 735503 1433533 1.21/ east 3 Map Toei Temple 735430 1433415 1.12/ east 4 Nikhom Sang Ton Eng 9 School 731947 1430451 2.64/ southwest 5 Prasitharam Temple 732002 1430278 2.75/ southwest 6 Map Yang Phon Sub-district Health
Promoting Hospital 731401 1437012 3.80/ north-northwest
7 Ban Map Yang Phon School 731692 1436797 3.45/ north-northwest 8 Map Yang Phon Temple 732279 1436548 2.90/north-northwest 9 Pluak Daeng Sub-district
Administrative Organization 739055 1434753 4.96/ east
10 Orawin Witthaya School 739058 1434108 4.81/ east 11 Pluak Daeng High Voltage
Electricity Station 737778 1436539 4.54/ northeast
12 Wang Pradu Temple 736636 1430603 3.33/ southeast 13 Wang Pradu School (closed down) 736715 1430692 3.33/ southeast 14 Village No.5, Ban Khlong Plu 733193 1429939 2.58/ south-southwest 15 Village No.7, Ban Wang Pla 732270 1430365 2.78/ southwest 16 Village No. 8, Ban Soi 13 731436 1430734 2.60/ south-southwest 17 Village No.7, Ban Wang Pradu 736569 1430927 3.10/ southeast 18 Village No.4, Ban Khao Mapud 730854 1431065 3.17/ southwest 19 Village No. 5, Ban Wang Tan Mon 732762 1431786 1.26/ southwest 20 Village No.1, Ban Map Toei 735578 1432703 1.46/ east 21 Village No.7, Ban Chak Oi 737267 1433299 3.08/ east 22 Village No.6, Ban Map Yang Mai 731490 1434612 2.25/ northwest 23 Village No 6, Ban Thab Tong 736907 1434627 2.89/ northeast 24 Village No.2, Ban Noen Sawan 733690 1434855 0.81/ north 25 Village No.4, Ban Wang Ta Phin 736444 1435467 2.94/northeast 26 Village No.3, Ban Map Yang Phon 733404 1436506 2.49/ north 27 Village No.6, Ban Nong Rakam 734378 1428021 4.52/south 28 Village No.5, Ban Khlong Phlu 732735 1428558 4.04/ south-southwest 29 Village No.7, Ban Wang Pla 731629 1429178 2.52/ southwest 30 Village No.8 , Ban Soi 13 730774 1429714 3.97/ southwest 31 Village No.4, Ban Chak Manthed 738538 1430469 5.02/ southeast

Environmental Report for submissionl to ADB Chapter 5
Pluak Daeng Power Plant Anticipated Environmental Impacts and Mitigations
RNP/ENV/P05028/FR (ADB)/RE62049-chap 5 Page 5-9
(c) Selection of existing data on ambient air quality monitoring Existing data on ambient air quality monitoring are used in assessing the air quality impact in this study. The highest values in the monitoring by the station or the monitoring point at the receptor as designated by the project are to be used in the assessment. If there is no monitoring result from the designated monitoring point, the project will consider using existing data on ambient air quality monitoring from the station or the monitoring point near the receptor. The details are as follows: ( c. 1) The highest values in the monitoring in the project area at five monitoring points, during 25th January – 1st February 2019. The five monitoring points are situated at (1) Pluak Daeng Power Plant Project site ( 2 ) Village No. 2, Ban Noen Sawan (3 ) Prasitharam Temple (4 ) Ban Map Toei School (5 ) the community in the west of the project site in Village No. 5, Map Yang Phon Sub-district. The highest values registered in the monitoring are shown in Table 5.1.1-4. ( c. 2) The highest values registered by the air quality monitoring system (AQMS) of the stations situated near the project area, three stations in total, which are (1) Pluak Daeng District Public Health Office’ s Air Quality Monitoring Station, under the charge of the Pollution Control Department (2) Eastern Seaboard Industrial Estate’ s Air Quality Monitoring Station (Rayong Province) , and (3) Amata City Industrial Estate’ s Air Quality Monitoring Station (Rayong Province) . Among the data collected by Pluak Daeng District Public Health Office’s Air Quality Monitoring Station, under the charge of the Pollution Control Department; and the report on the results of the implementation in compliance with measures for environmental impact prevention and reduction and measures for environmental quality follow- up ( operation phase) of Eastern Seaboard Industrial Estate Project (Rayong Province) and Amata City Industrial Estate Project (Rayong Province), (extension) Phase 5 (1st implementation), the air quality monitoring system data collected by Pluak Daeng District Public Health Office’ s Air Quality Monitoring Station are considered most complete and up-to-date, the details of which are shown in Table 5.1.1-5. Therefore, the consultant team choose the data collected by Pluak Daeng District Public Health Office’s Air Quality Monitoring Station in assessing the project’s air quality impact.

Environmental Report for submissionl to ADB Chapter 5
Pluak Daeng Power Plant Anticipated Environmental Impacts and Mitigations
RNP/ENV/P05028/FR (ADB)/RE62049-chap 5 Page 5-10
Table 5.1.1-4 HIGHEST VALUES IN THE EXISTING DATA ON THE AMBIENT AIR QUALITY MONITORING IN THE PROJECT’S VICINITY
Station Ambient Concentration of the Air Pollutant (g/m3)1/
NO2 Avg. 1 hr.
NO2 Avg. 1 year2/
SO2 Avg. 1 hr.
SO2 Avg. 24 hr.
SO2 Avg. 1 year 2/
TSP Avg. 8 hr.
TSP Avg. 24 hr.
TSP Avg. 1 year 2/
PM-10 Avg. 24 hr.
PM-10 Avg. 1 year 2/
CO Avg. 1 hr.
CO Avg. 8 hr.2/
1. Pluak Daeng Power Plant Project Area
45.73 7.44 6.03 4.45 0.98 190.60 153.00 47.01 88.00 27.04 1,145.19 916.16
2. Ban Noen Sawan Community Village No.2, Ban Map Yang Phon
55.14 8.97 4.45 3.41 0.72 220.49 177.00 54.39 112.00 34.42 1,145.19 916.16
3. Prasitharam Temple Area 43.47 7.07 3.93 3.14 0.64 184.37 148.00 45.48 87.00 26.73 916.16 916.16 4. Ban Map Toei School 73.95 12.03 7.86 5.24 1.28 367.49 295.00 90.65 109.00 33.49 1,374.23 916.16 5. Western Community of Project
Village No.5, Ban Map Yang Phon 66.99 10.90 5.24 3.67 0.85 321.40 258.00 79.28 116.00 35.65 1,030.67 801.64
6. AQMS Public Health Pluak Daeng District
88.44 16.94 1/ 44.28 10.49 1.88 1/ - - - 99.21 45.00 1/ - -
Maximum 88.44 16.94 44.28 10.49 1.88 367.49 295.00 90.65 116.00 45.00 1,374.23 916.16 National Standard3/ 320 57 780 300 100 15,0004/ 330 100 120 50 34,200 10,260
WHO5/ 200 40 - 20 - - - - 50 20 - - Remark: 1/ The highest values in the monitoring used in assessing the project’s air quality impact are as follows:
- The highest values registered by the project’s monitoring points; which are Pluak Daeng Power Plant Project site, Village No. 2, Ban Noen Sawan, Prasitharam Temple, Ban Map Toei School, and the community in the west of the project site in Village No.5 in Map Yang Phon Sub-district: Using the highest values from data monitoring during 25th January – 1 February 2019
- The highest values registered by Pluak Daeng District Public Health Office’s AQMS during 2016-2018. In the case of unusually high values, the second-highest applicable values are to be used instead. 2/ The equation applied in the calculation is C1/C2 = (t2/t1)n (reference - Air Pollution: Original and Control, 2nd Edition, Harper Collins Publisher, 1981) where C1 and C2 = concentration value at t1 and t2 N = constant, which is 0.17-0.20 (n =0.2)
t1 and t2 = a particular period (minute) the 1-year average value of NO2 is calculated from the 1-hour average value of NO2 the 1-year average value of SO2 is calculated from the 1-hour average value of SO2 the 8-hour average value of TSP is calculated from the 24-hour average value of TSP the 1-year average value of TSP is calculated from the 24-hour average value of TSP the 1-year average value of PM-10 is calculated from the 24-hour average value of PM-10 the 8-hour average value of CO is calculated from the 1-hour average value of CO
3/ National Standards referred to : Announcement of the National Environment Board No. 10 (1995) on ambient air quality standard specification Announcement of the National Environment Board No. 33 (2009) on nitrogen dioxide ambient concentration standard specification Announcement of the National Environment Board No. 21 (2001) on sulfur dioxide ambient concentration standard specification
4/ OSHA Standard, Part title: Safety and health regulations for construction, Subpart title: Occupational health and environmental controls, Standard number 1926.55 App A 5/ WHO Ambient Air Quality Guidelines in Environmental, Health, and Safety (EHS) Guidelines for International Finance Corporation (2007)

Environmental Report for subm
ission to ADB Chapter 5
Pluak Daeng Power Plant Anticipated Environm
ental Impacts and M
itigations
RNP/ENV/P05028/FR (ADB)/RE62049-chap 5 Page 5-11
TABLE 5.1.1-5 DETAILS ABOUT THE STATIONS WITH AIR QUALITY MONITORING SYSTEM (AQMS) SITUATED NEAR THE PROJECT AREA
Station Direction and distance from the project
location (kilometer)
Data acquisition details
Month/year Jan.-Jun. Jul.-Dec. Jan.-Jun. Jul.-Dec. Jan.-Jun. Jul.-Dec.
2016 2016 2017 2017 2018 2018
Pluak Daeng District Public Health Office’s Air Quality Monitoring Station 1/
ENE / 6.6 kilometer
data generated by AQMS on an hourly
basis
Eastern Seaboard Industrial Estate’s Air Quality Monitoring Station (Rayong Province) 2/
N / 5.0 kilometer
data generated by AQMS on an hourly
basis
-
Amata City Industrial Estate’s Air Quality Monitoring Station (Rayong Province)2/
NW / 3.5 kilometer
data generated by AQMS on an hourly
basis
-
Source: 1/ Pollution Control Department, 2019 2/ Bureau of Environmental Impact Evaluation, Office of Natural Resources and Environmental Policy and Planning, 2019

Environmental Report for submissionl to ADB Chapter 5
Pluak Daeng Power Plant Anticipated Environmental Impacts and Mitigations
RNP/ENV/P05028/FR (ADB)/RE62049-chap 5 Page 5-12
With reference to the highest values in the monitoring of ambient air quality by Pluak Daeng District Public Health Office’s Air Quality Monitoring Station, under the charge of the Pollution Control Department, which is about 6.6 kilometers away from the project location to the east-northeast (ENE) , the levels of NO2, SO2, and PM-10 as measured during 2016-2018 showed that there are some values higher than others which may occur due to abnormally condition during measurement. Thus, the abnormal value will be cut off, and the next highest value is used as a representative of air quality at present. The details are shown in Figure 5.1.1-3 to Figure 5.1.1-6 and Table 5.1.1-5. To conclude, the highest values in existing data on ambient air quality monitoring by the station or the monitoring point at the receptor as designated by the project are to be used. For a sensitive receptor where no monitoring result is available, the project will consider using existing data on ambient air quality monitoring from the station or the monitoring point near that receptor, as shown in Table 5. 1. 1-6 and the summary of the monitoring results is shown in Table 5.1.1-7. (d) Pollutant sources during the construction phase Pollutants released into the air during the construction phase are caused by topsoil excavation in the construction areas and vehicles and engines employed in the construction activities. The air quality assessment in the construction phase is thus based on the impacts incurred by each activity. The details of the air pollutant emission rate of each activity are as follows:

Environmental Report for subm
ission to ADB Chapter 5
Pluak Daeng Power Plant Anticipated Environm
ental Impacts and M
itigations
RNP/ENV/P05028/FR (ADB)/RE62049-chap 5 Page 5-13
FIGURE 5.1.1-3: 1-HOUR AVERAGE CONCENTRATION OF NITROGEN DIOXIDE (NO2) FROM AIR QUALITY MONITORING STATION AT
PLUAK DAENG DISTRICT PUBLIC HEALTH OFFICE DURING 2016-2018
320 780
320 780
320 780
320 780
320 780
320 780
320 780 36 67.74
320 780
320 780
320 780
320 780
320 780
320 780
320 780
320 780
320 780
320 780
320 780
320 780
320 780
114.79
94.09
95.9786.56
90.33
101.62
129.84
97.8590.33
88.44
92.21101.62
103.599.74
88.44
320
020406080100120140160180200220240260280300320
NO2
1-HOUR AVERAGE CONCENTRATION OF NO2
micr
ogra
ms/
cubi
c m
eter
88.44 Selected
value
standard

Environmental Report for subm
ission to ADB Chapter 5
Pluak Daeng Power Plant Anticipated Environm
ental Impacts and M
itigations
RNP/ENV/P05028/FR (ADB)/RE62049-chap 5 Page 5-14
FIGUR 5.1.1-4: 1-HOUR AVERAGE CONCENTRATION OF SULFUR DIOXIDE (SO2) FROM AIR QUALITY MONITORING STATION AT
PLUAK DAENG DISTRICT PUBLIC HEALTH OFFICE DURING 2016-2018
320 780
320 780
320 780
52.0 320 780
320 780
320 780
320 780
320 780
320 780
320 780
320 780
320 780
320 780
320 780
320 780
320 780
320 780
320 780
320 780
320 780
320 780
320 780
320 780
43.23
57.38
53.45 50.04
65.2457.64 52.4
780
050100150200250300350400450500550600650700750800
SO2
1-HOUR AVERAGE CONCENTRATION OF SO2
micr
ogra
ms/
cubi
c m
eter
44.28 Selected
value
standard

Environmental Report for subm
ission to ADB Chapter 5
Pluak Daeng Power Plant Anticipated Environm
ental Impacts and M
itigations
RNP/ENV/P05028/FR (ADB)/RE62049-chap 5 Page 5-15
FIGURE 5.1.1-5: 24-HOUR AVERAGE CONCENTRATION OF SULFUR DIOXIDE (SO2) FROM AIR QUALITY MONITORING STATION AT
PLUAK DAENG DISTRICT PUBLIC HEALTH OFFICE DURING 2016-2018
300
0
50
100
150
200
250
300
SO2
24-HOUR AVERAGE CONCENTRATION OF SO2
micr
ogra
ms/
cubi
c m
eter
standard

Environmental Report for subm
ission to ADB Chapter 5
Pluak Daeng Power Plant Anticipated Environm
ental Impacts and M
itigations
RNP/ENV/P05028/FR (ADB)/RE62049-chap 5 Page 5-16
FIGURE 5.1.1-6: 24-HOUR AVERAGE CONCENTRATION OF PARTICULATE MATTER (PM-10) FROM AIR QUALITY MONITORING STATION
AT PLUAK DAENG DISTRICT PUBLIC HEALTH OFFICE DURING 2016-2018
109.42
122.83
110.42117.21
105.21
123.42128.17
108.88 115.08 93.86
106.21120
0
20
40
60
80
100
120
140
PM 10
24-HOUR AVERAGE CONCENTRATION OF PM-10
micr
ogra
ms/
cubi
c m
eter
99.21 Selected
value
standard

Environmental Report for subm
ission to ADB Chapter 5
Pluak Daeng Power Plant Anticipated Environm
ental Impacts and M
itigations
RNP/ENV/P05028/FR (ADB)/RE62049-chap 5 Page 5-17
TABLE 5.1.1-6 DISTANCE FROM THE SENSITIVE RECEPTOR TO THE AIR QUALITY MONITORING POINT/STATION
Sensitive receptor
Distance from the receptor to the air quality monitoring point/station (kilometer)
Pluak Daeng Power Plant Project site
Village No.2, Ban Noen
Sawan
Prasitharam Temple
Ban Map Toei
School
community in the west
of the project site
Pluak Daeng District Public Health Office
Air quality monitoring point/ station situated closest to the receptor
1. Map Yang Phon Sub- district Administrative Organization
1.29 2.82 4.90 0.09 3.63 4.79 Ban Map Toei School
2. Ban Map Toei School 1.21 2.84 4.80 0 3.55 4.88 Ban Map Toei School
3. Map Toei Temple 1.12 2.88 4.67 0.15 3.46 4.99 Ban Map Toei School
4. Nikhom Sang Ton Eng 9 School 2.64 5.42 0.10 4.72 2.45 9.43 Prasitharam Temple
5. Prasitharam Temple 2.75 5.57 0 4.79 2.62 9.47 Prasitharam Temple
6. Map Yang Phon Sub-district Health Promoting Hospital
3.80 2.59 6.67 5.37 4.15 8.85
Village No.2, Ban Noen Sawan
7. Ban Map Yang Phon School 3.45 2.22 6.44 5.01 3.91 8.52 Village No.2, Ban Noen Sawan
8. Map Yang Phon Temple 2.90 1.60 6.20 4.41 3.66 7.90 Village No.2, Ban Noen Sawan
9. Pluak Daeng Sub- district Administrative Organization
4.96 5.54 8.39 3.75 7.29 1.13 Pluak Daeng District Public Health Office
10. Orawin Witthaya School 4.81 5.68 8.08 3.59 7.16 1.52 Pluak Daeng District Public
Health Office
11. Pluak Daeng High Voltage Electricity Station 4.54 4.30 8.53 3.75 6.82 2.63 Pluak Daeng District Public
Health Office
12. Wang Pradu Temple 3.33 5.87 4.74 3.15 5.17 5.77 Ban Map Toei School

Environmental Report for subm
ission to ADB Chapter 5
Pluak Daeng Power Plant Anticipated Environm
ental Impacts and M
itigations
RNP/ENV/P05028/FR (ADB)/RE62049-chap 5 Page 5-18
TABLE 5.1.1-6 DISTANCE FROM THE SENSITIVE RECEPTOR TO THE AIR QUALITY MONITORING POINT/STATION (CONT’D)
Sensitive receptor
Distance from the receptor to the air quality monitoring point/station (kilometer)
Pluak Daeng Power Plant Project site
Village No.2, Ban Noen
Sawan
Prasitharam Temple
Ban Map Toei
School
community in the west
of the project site
Pluak Daeng District Public Health Office
Air quality monitoring point/ station situated closest to the receptor
13. Wang Pradu School (closed down) 3.33 5.84 4.82 3.10 5.20 5.65 Ban Map Toei School
14. Village No. 5, Ban Khlong Plu 2.58 5.69 1.35 4.29 3.19 8.68 Prasitharam Temple
15. Village No. 7, Ban Wang Pla 2.78 5.41 0.36 4.54 2.55 9.20 Prasitharam Temple
16. Village No. 8, Ban Soi 13 2.60 5.33 0.60 4.95 2.24 9.74 Prasitharam Temple
17. Village No. 7, Ban Wang Pradu 3.10 5.56 4.70 2.83 4.97 5.56 Ban Map Toei School
18. Village No. 4, Ban Khao Mapud 3.17 5.31 1.27 5.28 2.17 10.12 Prasitharam Temple
19. Village No. 5, Ban Wang Tan Mon 1.26 3.92 1.66 3.26 1.35 8.08 Pluak Daeng Power Plant Project site
20. Village No. 1, Ban Map Toei 1.46 3.54 4.36 0.85 3.58 5.16 Ban Map Toei School
21. Village No. 7, Ban Chak Oi 3.08 4.36 6.11 1.78 5.28 3.41 Ban Map Toei School
22. Village No. 6, Ban Map Yang Mai 2.25 2.32 4.27 4.16 1.79 8.60 community in the west of the project site
23. Village No. 6, Ban Thab Tong 2.89 3.47 6.58 1.77 5.20 3.22 Ban Map Toei School
24. Village No. 2, Ban Noen Sawan 0.81 0 4.84 2.24 2.58 6.39 Village No. 2, Ban Noen Sawan
25. Village No. 4, Ban Wang Ta Phin 2.94 2.87 6.83 2.13 5.13 3.63 Ban Map Toei School
26. Village No. 3, Ban Map Yang Phon 2.49 0.90 6.33 3.63 3.87 6.79 Village No. 2, Ban Noen Sawan

Environmental Report for subm
ission to ADB Chapter 5
Pluak Daeng Power Plant Anticipated Environm
ental Impacts and M
itigations
RNP/ENV/P05028/FR (ADB)/RE62049-chap 5 Page 5-19
TABLE 5.1.1-6 DISTANCE FROM THE SENSITIVE RECEPTOR TO THE AIR QUALITY MONITORING POINT/STATION (CONT’D)
Sensitive receptor
Distance from the receptor to the air quality monitoring point/station (kilometer)
Pluak Daeng Power Plant Project site
Village No.2, Ban Noen
Sawan
Prasitharam Temple
Ban Map Toei
School
community in the west
of the project site
Pluak Daeng District Public Health Office
Air quality monitoring point/ station situated closest to the receptor
27. Village No. 6, Ban Nong Rakam 4.52 7.64 3.40 5.64 5.43 9.19 Pluak Daeng Power Plant Project site
28. Village No. 5, Ban Khlong Phlu 4.04 7.11 1.98 5.71 4.40 9.92 Pluak Daeng Power Plant Project site
29. Village No. 7, Ban Wang Pla 2.52 6.73 1.21 5.84 3.74 10.39 Prasitharam Temple
30. Village No. 8, Ban Soi 13 3.97 6.54 1.30 6.09 3.42 10.81 Prasitharam Temple
31. Village No. 4, Ban Chak Manthed 5.02 7.15 6.63 4.32 6.97 5.01 Ban Map Toei School
Remark: The underlined figure is the closest distance from the sensitive receptor to the air quality monitoring station.

Environmental Report for subm
ission to ADB Chapter 5
Pluak Daeng Power Plant Anticipated Environm
ental Impacts and M
itigations
RNP/ENV/P05028/FR (ADB)/RE62049-chap 5 Page 5-20
TABLE 5.1.1-7 HIGHEST VALUES IN THE EXISTING DATA ON AIR QUALITY MONITORING WHICH ARE USED TO REPRESENT EACH RECEPTOR’S
AIR POLLUTANT CONCENTRATION LEVEL
Sensitive receptor
Monitoring
point/ station
Ambient concentration of the air pollutant (g/m3) 1-hour average
NO2
1-year average NO2
7/
1-hour average
SO2
24-hour average
SO2
1-year average
SO27/
8-hour average
TSP7/
24-hour average
TSP
1-year average TSP7/
24-hour average PM-10
1-year average PM-107/
1-hour average
CO
8-hour average
CO7/ 1. Map Yang Phon Sub-
district Administrative Organization
4/ 73.95 12.03 7.86 5.24 1.28 367.49 295.00 90.65 109.00 33.49 1,374.23 916.16
2. Ban Map Toei School 4/ 73.95 12.03 7.86 5.24 1.28 367.49 295.00 90.65 109.00 33.49 1,374.23 916.16 3. Map Toei Temple 4/ 73.95 12.03 7.86 5.24 1.28 367.49 295.00 90.65 109.00 33.49 1,374.23 916.16 4. Nikhom Sang Ton
Eng 9 School 3/ 43.47 7.07 3.93 3.14 0.64 184.37 148.00 45.48 87.00 26.73 916.16 916.16
5. Prasitharam Temple 3/ 43.47 7.07 3.93 3.14 0.64 184.37 148.00 45.48 87.00 26.73 916.16 916.16 6. Map Yang Phon Sub-
district Health Promoting Hospital
2/ 55.14 8.97 4.45 3.41 0.72 220.49 177.00 54.39 112.00 34.42 1,145.19 916.16
7. Ban Map Yang Phon School
2/ 55.14 8.97 4.45 3.41 0.72 220.49 177.00 54.39 112.00 34.42 1,145.19 916.16
8. Map Yang Phon Temple 2/ 55.14 8.97 4.45 3.41 0.72 220.49 177.00 54.39 112.00 34.42 1,145.19 916.16 9. Pluak Daeng Sub-
district Administrative Organization*
6/ 88.44 16.94 44.28 10.49 1.88 367.49 295.00 90.65 99.21 45.00 1,374.23 916.16

Environmental Report for subm
ission to ADB Chapter 5
Pluak Daeng Power Plant Anticipated Environm
ental Impacts and M
itigations
RNP/ENV/P05028/FR (ADB)/RE62049-chap 5 Page 5-21
TABLE 5.1.1-7 HIGHEST VALUES IN THE EXISTING DATA ON AIR QUALITY MONITORING WHICH ARE USED TO REPRESENT EACH RECEPTOR’S
AIR POLLUTANT CONCENTRATION LEVEL (CONT’D)
Sensitive receptor
Monitoring
point/ station
Ambient concentration of the air pollutant (g/m3)
1-hour average
NO2
1-year average NO2
7/
1-hour average
SO2
24-hour average
SO2
1-year average
SO27/
8-hour average TSP7/
24-hour average
TSP
1-year average
TSP7/
24-hour average PM-10
1-year average PM-107/
1-hour average
CO
8-hour average
CO7/ 10. Orawin Witthaya
School* 6/ 88.44 16.94 44.28 10.49 1.88 367.49 295.00 90.65 99.21 45.00 1,374.23 916.16
11. Pluak Daeng High Voltage Electricity Station*
6/ 88.44 16.94 44.28 10.49 1.88 367.49 295.00 90.65 99.21 45.00 1,374.23 916.16
12. Wang Pradu Temple 4/ 73.95 12.03 7.86 5.24 1.28 367.49 295.00 90.65 109.00 33.49 1,374.23 916.16 13. Wang Pradu School
(closed down) 4/ 73.95 12.03 7.86 5.24 1.28 367.49 295.00 90.65 109.00 33.49 1,374.23 916.16
14. Village No.5, Ban Khlong Plu
3/ 43.47 7.07 3.93 3.14 0.64 184.37 148.00 45.48 87.00 26.73 916.16 916.16
15. Village No.7, Ban Wang Pla
3/ 43.47 7.07 3.93 3.14 0.64 184.37 148.00 45.48 87.00 26.73 916.16 916.16
16. Village No.8, Ban Soi 13 3/ 43.47 7.07 3.93 3.14 0.64 184.37 148.00 45.48 87.00 26.73 916.16 916.16 17. Village No.7, Ban
Wang Pradu 4/ 73.95 12.03 7.86 5.24 1.28 367.49 295.00 90.65 109.00 33.49 1,374.23 916.16
18. Village No.4, Ban Khao Mapud
3/ 43.47 7.07 3.93 3.14 0.64 184.37 148.00 45.48 87.00 26.73 916.16 916.16

Environmental Report for subm
ission to ADB Chapter 5
Pluak Daeng Power Plant Anticipated Environm
ental Impacts and M
itigations
RNP/ENV/P05028/FR (ADB)/RE62049-chap 5 Page 5-22
TABLE 5.1.1-7 HIGHEST VALUES IN THE EXISTING DATA ON AIR QUALITY MONITORING WHICH ARE USED TO REPRESENT EACH RECEPTOR’S
AIR POLLUTANT CONCENTRATION LEVEL (CONT’D)
Sensitive receptor
Monitoring
point/ station
Ambient concentration of the air pollutant (g/m3)
1-hour average
NO2
1-year average NO2
7/
1-hour average
SO2
24-hour average
SO2
1-year average
SO27/
8-hour average TSP7/
24-hour average
TSP
1-year average
TSP7/
24-hour average PM-10
1-year average PM-107/
1-hour average
CO
8-hour average
CO7/ 19. Village No.5,
Ban Wang Tan Mon 1/ 45.73 7.44 6.03 4.45 0.98 190.60 153.00 47.01 88.00 27.04 1,145.19 916.16
20. Village No.1, Ban Map Toei
4/ 73.95 12.03 7.86 5.24 1.28 367.49 295.00 90.65 109.00 33.49 1,374.23 916.16
21. Village No.7, Ban Chak Oi 4/ 73.95 12.03 7.86 5.24 1.28 367.49 295.00 90.65 109.00 33.49 1,374.23 916.16 22. Village No.6, Ban Map
Yang Mai 5/ 66.99 10.90 5.24 3.67 0.85 321.40 258.00 79.28 116.00 35.65
1,030.67 801.64
23. Village No.6, Ban Thab Tong
4/ 73.95 12.03 7.86 5.24 1.28 367.49 295.00 90.65 109.00 33.49 1,374.23 916.16
24. Village No.2, Ban Noen Sawan
2/ 55.14 8.97 4.45 3.41 0.72 220.49 177.00 54.39 112.00 34.42 1,145.19 916.16
25. Village No.4, Ban Wang Ta Phin
4/ 73.95 12.03 7.86 5.24 1.28 367.49 295.00 90.65 109.00 33.49 1,374.23 916.16
26. Village No.3, Ban Map Yang Phon
2/ 55.14 8.97 4.45 3.41 0.72 220.49 177.00 54.39 112.00 34.42 1,145.19 916.16
27. Village No.6, Ban Nong Rakam
1/ 45.73 7.44 6.03 4.45 0.98 190.60 153.00 47.01 88.00 27.04 1,145.19 916.16
28. Village No.5, Ban Khlong Phlu
1/ 45.73 7.44 6.03 4.45 0.98 190.60 153.00 47.01 88.00 27.04 1,145.19 916.16

Environmental Report for subm
ission to ADB Chapter 5
Pluak Daeng Power Plant Anticipated Environm
ental Impacts and M
itigations
RNP/ENV/P05028/FR (ADB)/RE62049-chap 5 Page 5-23
TABLE 5.1.1-7 HIGHEST VALUES IN THE EXISTING DATA ON AIR QUALITY MONITORING WHICH ARE USED TO REPRESENT EACH RECEPTOR’S
AIR POLLUTANT CONCENTRATION LEVEL (CONT’D)
Sensitive receptor
Monitoring
point/ station
Ambient concentration of the air pollutant (g/m3)
1-hour average
NO2
1-year average NO2
7/
1-hour average
SO2
24-hour average
SO2
1-year average
SO27/
8-hour average TSP7/
24-hour average
TSP
1-year average
TSP7/
24-hour average PM-10
1-year average PM-107/
1-hour average
CO
8-hour average
CO7/ 29. Village No.7, Ban Wang
Pla 3/ 43.47 7.07 3.93 3.14 0.64 184.37 148.00 45.48 87.00 26.73 916.16 916.16
30. Village No. 8, Ban Soi 13 3/ 43.47 7.07 3.93 3.14 0.64 184.37 148.00 45.48 87.00 26.73 916.16 916.16 31. Village No.4, Ban Chak
Manthed 4/ 73.95 12.03 7.86 5.24 1.28 367.49 295.00 90.65 109.00 33.49 1,374.23 916.16
Standard values 8/ 320 780 300 - - 330 100 120 50 Remark: 1/ Pluak Daeng Power Plant Project site 2/ Village No. 2, Ban Noen Sawan 3/ Prasitharam Temple 4/ Ban Map Toei School 5/ the community in the west of the project site in Village No. 5, Map Yang Phon Sub-district 6/ Air Quality Monitoring Station at Pluak Daeng District Public Health Office 7/ Calculation of 1- year average value of NO2, 1- year average value of SO2, 8- hour average value of TSP, 1- year average value of TSP, 1- year average value of PM- 10, and
8-hour average value of CO is based on the details shown in Table 5.1.1-4. 8/ Standard:
- Announcement of the National Environment Board No. 33 (2009) on nitrogen dioxide ambient concentration standard specification - Announcement of the National Environment Board No. 21 (2001) on sulfur dioxide ambient concentration standard specification - Announcement of the National Environment Board No. 10 (1995) and No. 24 (2004) on ambient air quality standard specification - OSHA Standard, Part title: Safety and health regulations for construction, Subpart title: Occupational health and environmental controls, Standard number 1926.55 App A
* In the case of the highest values in the monitoring by Air Quality Monitoring Station at Pluak Daeng District Public Health Office there are no data on the values of total suspended particulate (TSP) and carbon monoxide (CO) , therefore the highest values in the monitoring by the monitoring point second closest to the receptor, which is the air quality monitoring station at Ban Map Toei School, are used instead.

Environmental Report for submission to ADB Chapter 5
Pluak Daeng Power Plant Anticipated Environmental Impacts and Mitigations
RNP/ENV/P05028/FR (ADB)/RE62049-chap 5 Page 5-24
Particulate Matter The expected impact during Construction Phase is only dust dispersion from excavation and open-cut activities. The value of dust dispersion used in impact assessment during the construction of the project derived from the US. EPA, Subject: Compilation of Emission Factor, AP- 42, 1995, is 1. 2 ton/ acre of construction area/month of construction activity. The project area covers approximately 492 rai or 787,200 square meters in Pluak Daeng Industrial Park, under the administration of Rojana Industrial Park Rayong 2 Co. , Ltd. ; is approved in the environmental impact assessment report on the Pluak Daeng Industrial Park Extension, Phase 1. According to the land sale and purchase agreement that the project enters into with Rojana Industrial Park Public Company Limited (the parent company of Rojana Industrial Park Rayong 2 Co., Ltd.), land levelling is the responsibility of Pluak Daeng Industrial Park in order that the execution of the project can be readily accommodated. In other words, Pluak Daeng Industrial Park is accountable for land levelling in the project by the said land sale and purchase agreement and is also obliged to comply with the measures for environmental impact prevention and reduction approved by the Office of Natural Resources and Environmental Policy and Planning. Consequently, the only construction activities potentially causing dust particle dispersion are excavation work for underpinning and construction ponds which will involve topsoil excavation covering the area of about 742,682 square meters, as shown in Table 5. 1. 1-8. The topsoil excavation is expected to take about 18 months (540 days) , during which pipe rack foundations are laid, then steel sheets are assembled into pipe racks. Welding of each part can be carried out alongside the construction of the power plant. In this way, during the construction phase of the project, topsoil excavation is expected to be at the rate of about 1,375.3 square meters per day and is to be executed only during daytime for 8 hours (8.00-17.00 hours) . Therefore, impacts from dust particle dispersion potentially caused by topsoil excavation during the construction of pipe racks are incorporated into those incurred in the power plant’s foundation and piling activities.

Environmental Report for submission to ADB Chapter 5
Pluak Daeng Power Plant Anticipated Environmental Impacts and Mitigations
RNP/ENV/P05028/FR (ADB)/RE62049-chap 5 Page 5-25
TABLE 5.1.1-8 DETAILS OF THE AREAS IN PLUAK DAENG POWER PLANT PROJECT WHERE TOPSOIL
EXCAVATION WORK IS TO BE EXECUTED
Different areas in the project Approximate size (square meter.)
(1) Power Block Area 112,878 (2) Balance of Plant Area 67,005 (3) Pond Area 122,523 (4) Area of Buildings 3,000 (5) Green Area 45,000 (6) Other areas such as for road, ditch, drainage pipeline, right of way
in the power transmission line, etc. 437,276
Grand Total 742,682 Source: Gulf PD Co., Ltd., 2019.
Amounts of pollutants released from the vehicles and
machines used in the construction activities In the consulting team’s assessment of the amounts of pollutants released from the vehicles and engines used in the construction activities, as such construction activities do not happen simultaneously, the assessment is carried out on the basis of each activity, namely piling, ground levelling, building, and transporting activities with reference to On-Road - EMFAC 2007 (v2.3) Emission Factors pursuant to California Environmental Quality Act (CEQA). The main pollutants, which are nitrogen dioxide (NO2), carbon monoxide (CO), particulate matter 10 micrometers or less in diameter (PM-10), are investigated during the working period of eight hours (08. 00-17. 00 hours) . The emission rates of pollutants from vehicles and engines used in the construction activities are shown in Table 5.1.1-9, and the specifications are shown in Table 5.1.1-10.

Environmental Report for submission to ADB Chapter 5
Pluak Daeng Power Plant Anticipated Environmental Impacts and Mitigations
RNP/ENV/P05028/FR (ADB)/RE62049-chap 5 Page 5-26
TABLE 5.1.1-9 EMISSION RATES OF POLLUTANTS FROM THE VEHICLES AND ENGINES USED IN THE
CONSTRUCTION ACTIVITIES Pollutant source2/ Quantity Emission factor (lb-hr)1/ Emission rate (gram/second)
NOX CO PM-10 NOX CO PM-10 1. Piling activities
Pile driver 5 0.2666 0.3455 0.0334 1.333 1.728 0.167 Water tanker truck 2 0.1443 0.0741 0.0095 0.289 0.148 0.019
Total 7 1.622 1.876 0.186 2. Building activities
Backhoe 10 0.1443 0.0741 0.0095 1.443 0.741 0.095 Crane 15 0.2666 0.3455 0.0334 3.999 5.183 0.501 Water tanker truck 2 0.1443 0.0741 0.0095 0.289 0.148 0.019
Total 27 5.731 6.072 0.615 3. Transporting activities
Machinery transportation truck
10 0.1443 0.0741 0.0095 1.443 0.741 0.095
Equipment transportation truck
30 0.1443 0.0741 0.0095 4.329 2.223 0.285
Total 40 5.772 2.964 0.380 Source: 1/ Off-Road - OFFROAD Model Mobile Source Emission Factors, http://www.aqmd.gov –
retrieved on 22nd January 2016 (the horsepower rating of the engine is as proposed in the California Environmental Quality Act (CEQA))
2/ Generator Specifications, http://www.baifapower.com/products/10KVA-200KVA.html (retrieved on 21st July 2016)
In estimating the concentration of nitrogen dioxide released from the engines during the construction phase, the consulting team choose the Plume Volume Molar Ratio Method (PVMRM) in determining the conversion factor of NO2/NOx, because the ozone concentration monitoring results of Pluak Daeng District Public Health Office’ s Air Quality Monitoring Station, Rayong Province, under the charge of the Pollution Control Department, are on an hourly basis. The data used are collected in 2015. The equilibrium NO2/NOx r ratio is 0. 90. The in- stack NO2/NOx ratio is 0. 11 for trucks and heavy engines powered by diesel fuel ( reference - Truck/Cars, Diesel Heavy Duty: Modeling Compliance of The Federal 1-Hour NO2 NAAQS, the California Air Pollution Control Officers Association (CAPCOA), 2011).

Environmental Report for submission to ADB Chapter 5
Pluak Daeng Power Plant Anticipated Environmental Impacts and Mitigations
RNP/ENV/P05028/FR (ADB)/RE62049-chap 5 Page 5-27
TABLE 5.1.1-10 SPECIFICATIONS OF THE VEHICLES AND ENGINES USED IN THE CONSTRUCTION
ACTIVITIES
Engine Stack
Temperature2/
(C)
Airflow rate 2/
(m3/s) Height1/
(m) Diameter1/
(m) pile driver 3.56 0.15 482 0.297 backhoe 2.79 0.11 538 0.105 crane 3.56 0.15 482 0.297 water tanker truck 2.00 0.15 538 0.105 machinery transportation truck 2.00 0.15 538 0.105 equipment transportation truck 2.00 0.15 538 0.105
Source: 1/ Generator Specifications, http://www.baifapower.com/products/10KVA-200KVA.html (retrieved on 21st July 2016)
2/ Engine Horsepower, http://www.donaldsonexhaust.com (retrieved on 21st July 2016)
( 1. 3) A case study in the assessment of air quality impact during the construction phase The case study in the assessment of air quality impact during the construction phase can be summarized as follows: (a) Assessment of dust particle dispersion caused by topsoil excavation in the construction sites
The case before the dust particle suppression measure is established The case when there is a measure to suppress dust particle
dispersion with water spray (b) Amounts of pollutants released from the vehicles and machines used in the construction activities
the case where the assessment is on the impact incurred by the piling activities
the case where the assessment is on the impact incurred by the building activities
the case where the assessment is on the impact incurred by the transporting activities

Environmental Report for submission to ADB Chapter 5
Pluak Daeng Power Plant Anticipated Environmental Impacts and Mitigations
RNP/ENV/P05028/FR (ADB)/RE62049-chap 5 Page 5-28
(1.4) Findings from the assessment in the construction phase Findings from the assessment in the construction phase can be classified into two main cases, as mentioned in (1.3). For the assessment of dust particle dispersion caused by topsoil excavation in the construction sites, there are two cases - the case before the dust particle suppression measure is established and the case when there is a measure to suppress dust particle dispersion with water spray twice a day. The parameters used in the assessment of the impact are the average total suspended particulate (TSP) for 8 hours, 24 hours and 1 year. For the assessment of the impact caused by the vehicles and engines used in the construction activities, the parameters used are the average amount of nitrogen dioxide (NO2 ) for 1 hour, and 1 year; the average amount of carbon monoxide (CO) for 1 hour, and 8 hours; and the average amount of particulate matter 10 micrometers or less in diameter (PM-10) for 24 hours, and 1 year. The findings reveal that the air pollutant values in the study area and sensitive receptors are lower than the values stipulated in general ambient air quality standards. The details are as follows: (a) Assessment of dust particle dispersion resulting from topsoil excavation in the construction sites
Average total suspended particulate (TSP) for 8 hours The case before the dust particle suppression measure is established The execution of the project causes the highest concentration level of the total suspended particulate (TSP) in the ambience for 8 hours on average in the project site, the grid reference for which is 733628 E 1433214 N. The concentration level is 480.31 g/m3, accounting for 3.20% of that stipulated in the Occupational Safety and Health Administration (OSHA) standards, according to which the average TSP in the ambience for 8 hours must not exceed 15,000 g/m3, as shown in Table 5.1.1-11. When considered together with the existing monitoring results (the highest value in the existing monitoring of the average TSP for 8 hours in the project area during 25th January – 1st February 2019, which is 190.60 g/m3), the highest concentration level of the average TSP in the ambience for 8 hours on average is 670. 91 micrograms/ cubic meter or 4. 47% of that stipulated in the OSHA standards, as shown in Table 5.1.1-11.

Environmental Report for submission to ADB Chapter 5
Pluak Daeng Power Plant Anticipated Environmental Impacts and Mitigations
RNP/ENV/P05028/FR (ADB)/RE62049-chap 5 Page 5-29
TABLE 5.1.1-11 ESTIMATED VALUES OF 8-HOUR AVERAGE TOTAL SUSPENDED PARTICULATE (TSP)
CAUSED BY THE PROJECT’S CONSTRUCTION ACTIVITIES
Details
Concentration levels of 8-hour average total suspended particulate (TSP) (g/m3)
Results of the assessment by using the AERMOD model
Concentration level
according to existing
monitoring data 2/
Results of the assessment by using the AERMOD model and
existing monitoring data
Before the mitigation measure is established
When there is dust
suppression measure by using water
spray twice a day1/
Before the mitigation measure is established
When there is dust
suppression measure by using water
spray twice a day1/
Highest concentration value
480.31 240.16 190.60 670.91 430.76
Grid reference 733628E, 1433214N Location project site Direction and distance from the project site
-
Type of land industrial park Standard value3/ 15,000
Remark: 1/ Application of water spray to the construction sites twice a day can suppress dust particle dispersion by 50%.(Source: National Pollution Inventory (NPI), Emission Estimation Technique Manual for Mining, Version 3.1, National Pollutant Inventory, Canberra, Australia, January 2012: Table 4)
2/ The calculation is based on the highest value in the current monitoring of the average TSP for 24 hours in the project area during 25th January – 1st February 2019, and the equation applied in the calculation is C1/C2 = ( t2/t1)n ( reference - Air Pollution: Original and Control, 2nd Edition, Harper Collins Publisher, 1981)
where C1 and C2 = concentration value at t1 and t2 n = constant, which is 0.17-0.20 (n =0.2) t1 and t2 = a particular period (minute) 3/ OSHA Standard, Part title: Safety and health regulations for construction, Subpart title: Occupational
health and environmental controls, Standard number 1926.55 App A Source : Team Consulting Engineering and Management Co., Ltd., 2019

Environmental Report for submission to ADB Chapter 5
Pluak Daeng Power Plant Anticipated Environmental Impacts and Mitigations
RNP/ENV/P05028/FR (ADB)/RE62049-chap 5 Page 5-30
The case when there is a measure to suppress dust particle dispersion with water spray twice a day In the case when there is measure to suppress dust particle dispersion with water spray twice a day, the highest concentration level of 8-hour average TSP in the ambience caused by the project’ s construction activities is registered in the project site, the grid reference for which is 733628 E 1433214 N, and is 240.16 g/m3 or 1.60% of that stipulated in the OSHA standards, as shown in Table 5. 1. 1-11. When considered together with the existing monitoring results ( the highest value in the current monitoring of the average TSP for 8 hours in the project precinct during during 25th January – 1st February 2019, which is 190.60 g/m3), the highest concentration level of the average TSP in the ambience for 8 hours is 430 . 7 6 g/m3 or 2. 8 7% of that stipulated in the OSHA standards, as shown in Table 5.1.1-11.
Average total suspended particulate (TSP) for 24 hours The case before the dust particle suppression measure is established The execution of the project causes the highest concentration level of the average TSP in the ambience for 24 hours in the project site, the grid reference for which is 733628 E 1433214 N. The concentration level is 185.54 g/m3, accounting for 56. 22% of national ambient air quality standards, according to which the average TSP in the ambience for 24 hours must not exceed 330 g/m3. For the 31 sensitive receptors, the highest concentration levels of the average TSP in the ambience for 24 hours range between 0.59-8.99 g/m3 or 0.18-2.72% of that stipulated in general ambient air quality standards, as shown in Table 5.1.1-12. When considered together with the existing monitoring results (the highest value in the current monitoring of the average TSP for 24 hours in the project precinct during during 25th January – 1st February 2019, which is 153.00 g/m3), the highest concentration level of the average TSP in the ambience for 24 hours is 338. 54 g/m3, accounting for 102. 59% of that stipulated in general ambient air quality standards, according to which the average TSP in the ambience for 24 hours must not exceed 33 0 g/m3. For the 31 sensitive receptors, the concentration levels of the average TSP in the ambience for 24 hours range between 149.53-303.37 g/m3 or 45.31-91.93% of that stipulated in general ambient air quality standards, as shown in Table 5.1.1-12.

Environmental Report for subm
ission to ADB Chapter 5
Pluak Daeng Power Plant Anticipated Environm
ental Impacts and M
itigations
RNP/ENV/P05028/FR (ADB)/RE62049-chap 5 Page 5-31
TABLE 5.1.1-12 ESTIMATED VALUES OF 24-HOUR AVERAGE TOTAL SUSPENDED PARTICULATE (TSP) CAUSED BY THE PROJECT’S CONSTRUCTION ACTIVITIES
Details
Concentration levels of 24-hour average total suspended particulate (TSP) (g/m3) Results of the assessment by using the AERMOD
model Concentration level according to existing monitoring data 3/
Results of the assessment by using the AERMOD model and existing monitoring data
Before the mitigation measure is established
When there is dust suppression measure by using water spray twice a
day1/
Before the mitigation measure is established
When there is dust suppression measure by using water spray
twice a day1/ Highest concentration value 185.54 92.77 153.002/ 338.54 245.77 Grid reference 733628E, 1433214N Location project site Direction and distance from the project site - Type of land industrial park Sensitive receptor 1. Map Yang Phon Sub-district Administrative
Organization 5.57 2.78 295.00 300.57 297.78
2. Ban Map Toei School 6.49 3.25 295.00 301.49 298.25 3. Map Toei Temple 8.37 4.19 295.00 303.37 299.19 4. Nikhom Sang Ton Eng 9 School 2.82 1.41 148.00 150.82 149.41 5. Prasitharam Temple 3.07 1.53 148.00 151.07 149.53 6. Map Yang Phon Sub-district Health Promoting
Hospital 1.71 0.85 177.00 178.71 177.85
7. Ban Map Yang Phon School 0.59 0.29 177.00 177.59 177.29 8. Map Yang Phon Temple 2.10 1.05 177.00 179.1 178.05

Environmental Report for subm
ission to ADB Chapter 5
Pluak Daeng Power Plant Anticipated Environm
ental Impacts and M
itigations
RNP/ENV/P05028/FR (ADB)/RE62049-chap 5 Page 5-32
TABLE 5.1.1-12 ESTIMATED VALUES OF 24-HOUR AVERAGE TOTAL SUSPENDED PARTICULATE (TSP) CAUSED BY THE PROJECT’S CONSTRUCTION ACTIVITIES
(CONT’D)
Details
Concentration levels of 24-hour average total suspended particulate (TSP) (g/m3) Results of the assessment by using the AERMOD
model Concentration level according to existing monitoring data 3/
Results of the assessment by using the AERMOD model and existing monitoring data
Before the mitigation measure is established
When there is dust suppression measure by using water spray twice a
day1/
Before the mitigation measure
is established
When there is dust suppression measure by using water spray
twice a day1/ 9. Pluak Daeng Sub-district Administrative
Organization 0.82 0.41 295.00
295.82 295.41
10. Orawin Witthaya School 1.22 0.61 295.00 296.22 295.61 11. Pluak Daeng High Voltage Electricity Station 1.21 0.60 295.00 296.21 295.6 12. Wang Pradu Temple 2.02 1.01 295.00 297.02 296.01 13. Wang Pradu School (closed down) 2.02 1.01 295.00 297.02 296.01 14. Village no.5, Ban Khlong Plu 2.05 1.02 148.00 150.05 149.02 15. Village no.7, Ban Wang Pla 4.67 2.33 148.00 152.67 150.33 16. Village no.8, Ban Soi 13 2.79 1.39 148.00 150.79 149.39 17. Village no.7, Ban Wang Pradu 1.68 0.84 295.00 296.68 295.84 18. Village no.4, Ban Khao Mapud 3.27 1.64 148.00 151.27 149.64 19. Village no.5, Ban Wang Tan Mon 8.99 4.50 153.00 161.99 157.5 20. Village no.1, Ban Map Toei 3.53 1.76 295.00 298.53 296.76 21. Village no.7, Ban Chak Oi 1.99 0.99 295.00 296.99 295.99 22. Village no.6, Ban Map Yang Mai 1.89 0.94 258.00 259.89 258.94 23. Village no.6, Ban Thab Tong 1.24 0.62 295.00 296.24 295.62 24. Village no.2, Ban Noen Sawan 5.01 2.50 177.00 182.01 179.5

Environmental Report for subm
ission to ADB Chapter 5
Pluak Daeng Power Plant Anticipated Environm
ental Impacts and M
itigations
RNP/ENV/P05028/FR (ADB)/RE62049-chap 5 Page 5-33
TABLE 5.1.1-12 ESTIMATED VALUES OF 24-HOUR AVERAGE TOTAL SUSPENDED PARTICULATE (TSP) CAUSED BY THE PROJECT’S CONSTRUCTION ACTIVITIES
(CONT’D)
Details
Concentration levels of 24-hour average total suspended particulate (TSP) (g/m3) Results of the assessment by using the AERMOD
model Concentration level according to existing monitoring data 3/
Results of the assessment by using the AERMOD model and existing monitoring data
Before the mitigation measure is established
When there is dust suppression measure by using water spray twice a
day1/
Before the mitigation measure
is established
When there is dust suppression measure by using water spray
twice a day1/ 25. Village no.4, Ban Wang Ta Phin 1.64 0.82 295.00 296.64 295.82 26. Village no.3, Ban Map Yang Phon 3.32 1.66 177.00 180.32 178.66 27. Village no.6, Ban Nong Rakam 0.72 0.36 153.00 153.72 153.36 28. Village no.5, Ban Khlong Phlu 1.30 0.65 153.00 154.3 153.65 29. Village no.7, Ban Wang Pla 2.84 1.42 148.00 150.84 149.42
30. Village no.8, Ban Soi 13 1.53 0.77 148.00 149.53 148.77
31. Village no.4, Ban Chak Manthed 0.67 0.34 295.00 295.67 295.34
Standard value4/ 330 Remark: 1/ Application of water spray to the construction sites twice a day can suppress dust particle dispersion by 50%.
(Source: National Pollution Inventory (NPI), Emission Estimation Technique Manual for Mining, Version 3.1, National Pollutant Inventory, Canberra, Australia, January 2012: Table 4)
2/ Concerning Table 5.1.1-4: Highest values in the existing data on the ambient air quality monitoring in the project’s vicinity 3/ Concerning Table 5.1.1-7: Highest values in the existing data on air quality monitoring which are used to represent each receptor’s air pollutant concentration level 4/ Announcement of the National Environment Board No. 24 (2004) on ambient air quality standard specification Source: Team Consulting Engineering and Management Co., Ltd., 2019

Environmental Report for submission to ADB Chapter 5
Pluak Daeng Power Plant Anticipated Environmental Impacts and Mitigations
RNP/ENV/P05028/FR (ADB)/RE62049-chap 5 Page 5-34
The case when there is a measure to suppress dust particle dispersion with water spray twice a day In the case when there is measure to suppress dust particle dispersion with water spray twice a day, the highest concentration level of 24-hour average TSP in the ambience caused by the project’ s construction activities is registered in the project site, the grid reference for which is 733628 E 1433214 N, and is 92.77 g/m3, accounting for 28.11% of that stipulated in general ambient air quality standards, according to which the average TSP in the ambience for 24 hours must not exceed 330 g/m3. For the 31 sensitive receptors, the average concentration levels of the TSP in the ambience for 24 hours range between 0.29-4.50 g/m3 or 0.09-1.368% of that stipulated in general ambient air quality standards, as shown in Table 5.1.1-12. When considered together with the existing monitoring results, the highest concentration level of 24-hour average TSP in the ambience is 245.77 g/m3 or 74.48% of that stipulated in general ambient air quality standards. For the 31 sensitive receptors, the concentration levels of the average TSP in the ambience for 24 hours range between 148. 77-299. 19 g/m3 or 45. 08-90. 66% of that stipulated in general ambient air quality standards, as shown in Table 5.1.1-12.
Average total suspended particulate (TSP) for one year The case before the dust particle suppression measure is established The execution of the project causes the highest concentration level of the total suspended particulate (TSP) in the ambience for one year on average in the project site, the grid reference for which is 733728 E 1433214 N. The concentration level is 0 . 0 07 g/m3, accounting for 0. 007% of that stipulated in general ambient air quality standards, according to which the average TSP in the ambience for 1 year must not exceed 100 g/m3. For the 31 sensitive receptors, the average concentration levels of the TSP in the ambience for one year range between 0.000001-0.000036 g/m3 or 0.000001-0.000036% of that stipulated in general ambient air quality standards, as shown in Table 5.1.1-13.

Environmental Report for subm
ission to ADB Chapter 5
Pluak Daeng Power Plant Anticipated Environm
ental Impacts and M
itigations
RNP/ENV/P05028/FR (ADB)/RE62049-chap 5 Page 5-35
TABLE 5.1.1-13 ESTIMATED VALUES OF 1-YEAR AVERAGE TOTAL SUSPENDED PARTICULATE (TSP) CAUSED BY THE PROJECT’S CONSTRUCTION ACTIVITIES
Details
Concentration levels of 1-year average total suspended particulate (TSP) (g/m3) Results of the assessment by using the
AERMOD model Concentration
level according to existing
monitoring data3/
Results of the assessment by using the AERMOD model and existing monitoring data
Before the mitigation measure is established
When there is dust suppression measure by
using water spray twice a day1/
Before the mitigation measure is established
When there is dust suppression measure by
using water spray twice a day1/
Highest concentration value 0.007 0.004 47.012/ 47.017 47.014 Grid reference 733728E, 1433214N Location project site Direction and distance from the project site - Type of land industrial park Sensitive receptor 1. Map Yang Phon Sub-district Administrative Organization 0.000018 0.000009 90.65 90.650018 90.650009 2. Ban Map Toei School 0.000018 0.000009 90.65 90.650018 90.650009 3. Map Toei Temple 0.000018 0.000009 90.65 90.650018 90.650009 4. Nikhom Sang Ton Eng 9 School 0.000013 0.000007 45.48 45.480013 45.480007 5. Prasitharam Temple 0.000013 0.000007 45.48 45.480013 45.480007 6. Map Yang Phon Sub-district Health Promoting Hospital 0.000004 0.000002 54.39 54.390004 54.390002 7. Ban Map Yang Phon School 0.000002 0.000001 54.39 54.390002 54.390001 8. Map Yang Phon Temple 0.000008 0.000004 54.39 54.390008 54.390004 9. Pluak Daeng Sub-district Administrative Organization 0.000003 0.000001 90.65 90.650003 90.650001 10. Orawin Witthaya School 0.000003 0.000001 90.65 90.650003 90.650001 11. Pluak Daeng High Voltage Electricity Station 0.000003 0.000002 90.65 90.650003 90.650002

Environmental Report for subm
ission to ADB Chapter 5
Pluak Daeng Power Plant Anticipated Environm
ental Impacts and M
itigations
RNP/ENV/P05028/FR (ADB)/RE62049-chap 5 Page 5-36
TABLE 5.1.1-13
ESTIMATED VALUES OF 1-YEAR AVERAGE TOTAL SUSPENDED PARTICULATE (TSP) CAUSED BY THE PROJECT’S CONSTRUCTION ACTIVITIES (CONT’D)
Details
Concentration levels of 1-year average total suspended particulate (TSP) (g/m3) Results of the assessment by using the
AERMOD model Concentration
level according to existing
monitoring data3/
Results of the assessment by using the AERMOD model and existing monitoring data
Before the mitigation measure is established
When there is dust suppression measure by
using water spray twice a day1/
Before the mitigation measure is established
When there is dust suppression measure by
using water spray twice a day1/
12. Wang Pradu Temple 0.000003 0.000002 90.65 90.650003 90.650002 13. Wang Pradu School (closed down) 0.000003 0.000002 90.65 90.650003 90.650002 14. Village no.5, Ban Khlong Plu 0.000007 0.000004 45.48 45.480007 45.480004 15. Village no.7, Ban Wang Pla 0.000015 0.000008 45.48 45.480015 45.480008 16. Village no.8, Ban Soi 13 0.000011 0.000005 45.48 45.480011 45.480005 17. Village no.7, Ban Wang Pradu 0.000004 0.000002 90.65 90.650004 90.650002 18. Village no.4, Ban Khao Mapud 0.000013 0.000007 45.48 45.480013 45.480007 19. Village no.5, Ban Wang Tan Mon 0.000036 0.000018 47.01 47.010036 47.010018 20. Village no.1, Ban Map Toei 0.000015 0.000007 90.65 90.650015 90.650007 21. Village no.7, Ban Chak Oi 0.000006 0.000003 90.65 90.650006 90.650003 22. Village no.6, Ban Map Yang Mai 0.000009 0.000004 79.28 79.280009 79.280004 23. Village no.6, Ban Thab Tong 0.000006 0.000003 90.65 90.650006 90.650003 24. Village no.2, Ban Noen Sawan 0.000026 0.000013 54.39 54.390026 54.390013 25. Village no.4, Ban Wang Ta Phin 0.000006 0.000003 90.65 90.650006 90.650003 26. Village no.3, Ban Map Yang Phon 0.000014 0.000007 54.39 54.390014 54.390007 27. Village no.6, Ban Nong Rakam 0.000002 0.000001 47.01 47.010002 47.010001 28. Village no.5, Ban Khlong Phlu 0.000004 0.000002 47.01 47.010004 47.010002 29. Village no.7, Ban Wang Pla 0.000009 0.000004 45.48 45.480009 45.480004

Environmental Report for subm
ission to ADB Chapter 5
Pluak Daeng Power Plant Anticipated Environm
ental Impacts and M
itigations
RNP/ENV/P05028/FR (ADB)/RE62049-chap 5 Page 5-37
TABLE 5.1.1-13
ESTIMATED VALUES OF 1-YEAR AVERAGE TOTAL SUSPENDED PARTICULATE (TSP) CAUSED BY THE PROJECT’S CONSTRUCTION ACTIVITIES (CONT’D)
Details
Concentration levels of 1-year average total suspended particulate (TSP) (g/m3) Results of the assessment by using the
AERMOD model Concentration
level according to existing
monitoring data3/
Results of the assessment by using the AERMOD model and existing monitoring data
Before the mitigation measure is established
When there is dust suppression measure by
using water spray twice a day1/
Before the mitigation measure is established
When there is dust suppression measure by
using water spray twice a day1/
30. Village no.8, Ban Soi 13 0.000006 0.000003 45.48 45.480006 45.480003 31. Village no.4, Ban Chak Manthed 0.000001 0.000001 90.65 90.650001 90.650001
Standard value4/ 100 Remark: 1/ Application of water spray to the construction sites twice a day can suppress dust particle dispersion by 50%.
(Source: National Pollution Inventory (NPI), Emission Estimation Technique Manual for Mining, Version 3.1, National Pollutant Inventory, Canberra, Australia, January 2012: Table 4)
2/ Concerning Table 5.1.1-4: Highest values in the existing data on the ambient air quality monitoring in the project’s vicinity 3/ Concerning Table 5.1.1-7: Highest values in the existing data on air quality monitoring which are used to represent each receptor’s air pollutant concentration level 4/ Announcement of the National Environment Board No. 24 (2004) on ambient air quality standard specification Source: Team Consulting Engineering and Management Co., Ltd., 2019

Environmental Report for submission to ADB Chapter 5
Pluak Daeng Power Plant Anticipated Environmental Impacts and Mitigations
RNP/ENV/P05028/FR (ADB)/RE62049-chap 5 Page 5-38
When considered together with the existing monitoring results, the highest concentration level of 1-year average TSP in the ambience is 47.017 g/m3 or 47.017% of that stipulated in general ambient air quality standards. For the 31 sensitive receptors, the concentration levels of the average TSP in the ambience for one year range between 45.48001-90.65002 g/m3 or 45.48001-90.65002% of that stipulated in general ambient air quality standards, as shown in Table 5.1.1-13. The case when there is a measure to suppress dust particle dispersion with water spray twice a day In the case when there is measure to suppress dust particle dispersion with water spray twice a day, the highest concentration level of 1-year average TSP in the ambience caused by the project’ s construction activities is registered in the project site, the grid reference for which is 733728 E 1433214 N, and is 0.004 g/m3, accounting for 0.004% of that stipulated in general ambient air quality standards, according to which the average TSP in the ambience for one year must not exceed 100 g/m3. For the 31 sensitive receptors, the average concentration levels of the TSP in the ambience for one year range between 0.000001-0.000018 g/m3 or 0.000001-0.000018% of that stipulated in general ambient air quality standards, as shown in Table 5.1.1-13. When considered together with the existing monitoring results, the highest concentration level of 1-year average TSP in the ambience is 47.014 g/m3 or 47.014% of that stipulated in general ambient air quality standards. For the 31 sensitive receptors, the concentration levels of the average TSP in the ambience for one year range between 45.48000-90.65001 g/m3 or 45.48000-90.65001% of that stipulated in general ambient air quality standards, as shown in Table 5.1.1-13. (b) Amounts of pollutants released from the vehicles and engines used in the construction activities The investigation of the pollutants released from the vehicles and engines used in the construction activities reveals that the activity that emits air pollutants most is building. Coming second and third are transporting and piling. Most of the effects of the pollutants caused by the said activities can be felt only in the project site, and the air pollutant values in the study area and sensitive receptors are lower than the values stipulated in general ambient air quality standards, as shown in Table 5.1.1-14 to Table 5.1.1-16, and Appendix 5A-3.

Environmental Report for submission to ADB Chapter 5 Pluak Daeng Power Plant Anticipated Environmental Impacts and Mitigations
RNP/ENV/P05028/FR (ADB)/RE62049-chap 5 Page 5-39
TABLE 5.1.1-14 RESULTS OF THE PREDICTION OF AIR QUALITY BY USING THE AERMOD MODEL AND THE HIGHEST VALUES IN THE EXISTING MONITORING DATA IN THE CASE OF IMPACT FROM PILING ACTIVITIES
Details
Estimated highest concentration levels of air pollutants in the case of impact from piling activities (g/m3) 1-hour average NO2 1-year average NO2 1-hour average CO 8-hour average CO 24-hour average PM-10 1-year average PM-10
Using the
model
Using existing
monitoring data 2/
Total Using the
model
Using existing
monitoring data 2/
Total Using the
model
Using existing
monitoring data 2/
Total Using the
model
Using existing monitoring
data 2/ Total
Using the
model
Using existing
monitoring data 2/
Total Using the
model
Using existing
monitoring data 2/
Total
Highest concentration value 34.61 45.731/ 80.34 1.49 7.441/ 8.93 50.00 1,145.191/ 1,195.19 34.77 916.161/ 950.93 1.37 88.001/ 89.37 0.17 27.041/ 27.21 Grid reference 733828E, 1433114N 733828E, 1433114N 733828E,1433114N 733628E, 1433114N 733628E, 1433114N 733828E, 1433114N Location project site project site project site project site project site project site Direction and distance from the project site - - - - - - Type of land industrial park industrial park industrial park industrial park industrial park industrial park Sensitive receptor 1. Map Yang Phon Sub-district Administrative Organization 11.13 73.95 85.08 0.10 12.03 12.13 14.49 1,374.23 1,388.72 4.84 916.16 921 0.19 109.00 109.19 0.013 33.49 33.503 2. Ban Map Toei School 10.99 73.95 84.94 0.11 12.03 12.14 14.70 1,374.23 1,388.93 4.71 916.16 920.87 0.20 109.00 109.2 0.013 33.49 33.503 3. Map Toei Temple 11.08 73.95 85.03 0.11 12.03 12.14 14.74 1,374.23 1,388.97 5.05 916.16 921.21 0.18 109.00 109.18 0.014 33.49 33.504 4. Nikhom Sang Ton Eng 9 School 6.44 43.47 49.91 0.05 7.07 7.12 8.13 916.16 924.29 2.88 916.16 919.04 0.11 87.00 87.11 0.006 26.73 26.736 5. Prasitharam Temple 6.36 43.47 49.83 0.05 7.07 7.12 8.09 916.16 924.25 2.97 916.16 919.13 0.11 87.00 87.11 0.006 26.73 26.736 6. Map Yang Phon Sub-district Health Promoting Hospital 6.75 55.14 61.89 0.04 8.97 9.01 8.66 1,145.19 1,153.85 1.90 916.16 918.06 0.09 112.00 112.09 0.005 34.42 34.425 7. Ban Map Yang Phon School 7.55 55.14 62.69 0.05 8.97 9.02 10.86 1,145.19 1,156.05 3.13 916.16 919.29 0.14 112.00 112.14 0.006 34.42 34.426 8. Map Yang Phon Temple 6.48 55.14 61.62 0.05 8.97 9.02 8.66 1,145.19 1,153.85 2.17 916.16 918.33 0.08 112.00 112.08 0.006 34.42 34.426 9. Pluak Daeng Sub-district Administrative Organization 3.42 88.44 91.86 0.02 16.94 16.96 4.45 1,374.23 1,378.68 1.51 916.16 917.67 0.05 99.21 99.26 0.003 45.00 45.003 10. Orawin Witthaya School 3.64 88.44 92.08 0.03 16.94 16.97 4.83 1,374.23 1,379.06 2.15 916.16 918.31 0.07 99.21 99.28 0.003 45.00 45.003 11. Pluak Daeng High Voltage Electricity Station 3.61 88.44 92.05 0.02 16.94 16.96 4.86 1,374.23 1,379.09 1.28 916.16 917.44 0.04 99.21 99.25 0.003 45.00 45.003 12. Wang Pradu Temple 5.60 73.95 79.55 0.01 12.03 12.04 7.18 1,374.23 1,381.41 1.19 916.16 917.35 0.06 109.00 109.06 0.002 33.49 33.492 13. Wang Pradu School (closed down) 5.46 73.95 79.41 0.01 12.03 12.04 7.67 1,374.23 1,381.90 1.29 916.16 917.45 0.05 109.00 109.05 0.002 33.49 33.492 14. Village no.5, Ban Khlong Plu 4.78 43.47 48.25 0.02 7.07 7.09 6.23 916.16 922.39 3.17 916.16 919.33 0.11 87.00 87.11 0.003 26.73 26.733 15. Village no.7, Ban Wang Pla 6.39 43.47 49.86 0.05 7.07 7.12 8.09 916.16 924.25 3.46 916.16 919.62 0.11 87.00 87.11 0.006 26.73 26.736 16. Village no.8, Ban Soi 13 5.59 43.47 49.06 0.04 7.07 7.11 7.25 916.16 923.41 2.88 916.16 919.04 0.10 87.00 87.1 0.005 26.73 26.735 17. Village no.7, Ban Wang Pradu 4.59 73.95 78.54 0.01 12.03 12.04 5.92 1,374.23 1,380.15 1.01 916.16 917.17 0.04 109.00 109.04 0.002 33.49 33.492 18. Village no.4, Ban Khao Mapud 5.49 43.47 48.96 0.04 7.07 7.11 7.27 916.16 923.43 1.53 916.16 917.69 0.05 87.00 87.05 0.004 26.73 26.734
19. Village no.5, Ban Wang Tan Mon 10.34 45.73 56.07 0.09 7.44 7.53 13.10 1,145.19 1,158.29 5.21 916.16 921.37 0.17 88.00 88.17 0.011 27.04 27.051
20. Village no.1, Ban Map Toei 9.45 73.95 83.4 0.07 12.03 12.1 12.39 1,374.23 1,386.62 2.57 916.16 918.73 0.13 109.00 109.13 0.008 33.49 33.498 21. Village no.7, Ban Chak Oi 6.08 73.95 80.03 0.04 12.03 12.07 7.90 1,374.23 1,382.13 2.26 916.16 918.42 0.07 109.00 109.07 0.005 33.49 33.495 22. Village no.6, Ban Map Yang Mai 6.02 66.99 73.01 0.02 10.90 10.92 7.97 1,030.67 1,038.64 2.13 801.64 803.77 0.07 116.00 116.07 0.003 35.65 35.653 23. Village no.6, Ban Thab Tong 4.75 73.95 78.7 0.03 12.03 12.06 6.38 1,374.23 1,380.61 1.63 916.16 917.79 0.06 109.00 109.06 0.004 33.49 33.494 24. Village no.2, Ban Noen Sawan 10.56 55.14 65.7 0.10 8.97 9.07 13.01 1,145.19 1,158.20 4.04 916.16 920.2 0.14 112.00 112.14 0.012 34.42 34.432 25. Village no.4, Ban Wang Ta Phin 4.53 73.95 78.48 0.03 12.03 12.06 5.84 1,374.23 1,380.07 1.65 916.16 917.81 0.05 109.00 109.05 0.004 33.49 33.494

Environmental Report for submission to ADB Chapter 5 Pluak Daeng Power Plant Anticipated Environmental Impacts and Mitigations
RNP/ENV/P05028/FR (ADB)/RE62049-chap 5 Page 5-40
TABLE 5.1.1-14 RESULTS OF THE PREDICTION OF AIR QUALITY BY USING THE AERMOD MODEL AND THE HIGHEST VALUES IN THE EXISTING MONITORING DATA IN THE CASE OF IMPACT FROM PILING ACTIVITIES (CONT’D)
Details
Estimated highest concentration levels of air pollutants in the case of impact from piling activities (g/m3) 1-hour average NO2 1-year average NO2 1-hour average CO 8-hour average CO 24-hour average PM-10 1-year average PM-10
Using the
model
Using existing
monitoring data 2/
Total Using the
model
Using existing
monitoring data 2/
Total Using the
model
Using existing
monitoring data 2/
Total Using the
model
Using existing monitoring
data 2/ Total
Using the
model
Using existing
monitoring data 2/
Total Using the
model
Using existing
monitoring data 2/
Total
26. Village no.3, Ban Map Yang Phon 6.51 55.14 61.65 0.04 8.97 9.01 8.37 1,145.19 1,153.56 2.43 916.16 918.59 0.08 112.00 112.08 0.005 34.42 34.425 27. Village no.6, Ban Nong Rakam 2.04 45.73 47.77 0.00 7.44 7.44 3.63 1,145.19 1,148.82 0.61 916.16 916.77 0.02 88.00 88.02 0.001 27.04 27.041 28. Village no.5, Ban Khlong Phlu 3.93 45.73 49.66 0.02 7.44 7.46 5.46 1,145.19 1,150.65 2.49 916.16 918.65 0.08 88.00 88.08 0.002 27.04 27.042 29. Village no.7, Ban Wang Pla 4.05 43.47 47.52 0.03 7.07 7.1 5.49 916.16 921.65 2.23 916.16 918.39 0.07 87.00 87.07 0.004 26.73 26.734 30. Village no.8, Ban Soi 13 5.17 43.47 48.64 0.03 7.07 7.1 6.84 916.16 923.00 2.20 916.16 918.36 0.07 87.00 87.07 0.004 26.73 26.734 31. Village no.4, Ban Chak Manthed 2.70 73.95 76.65 0.01 12.03 12.04 3.73 1,374.23 1,377.96 0.70 916.16 916.86 0.02 109.00 109.02 0.001 33.49 33.491
Standard value 3/ 320 57 34,200 10,260 120 50 WHO 4/ 200 40 - - 50 20
Remark: 1/ Concerning Table 5.1.1-5: Highest values in the existing data on the ambient air quality monitoring in the project’s vicinity 2/ Concerning Table 5.1.1-8: Highest values in the existing data on air quality monitoring which are used to represent each receptor’s air pollutant concentration level 3/ Concerning the standards in :
Announcement of the National Environment Board No. 10 (1995) and No. 24 (2004) on ambient air quality standard specification
Announcement of the National Environment Board No. 33 (2009) on nitrogen dioxide ambient concentration standard specification 4/ Referenced from WHO Ambient Air Quality Guidelines in Environmental, Health, and Safety (EHS) Guidelines for International Finance Corporation (2007) Source: Team Consulting Engineering and Management Co., Ltd., 2016

Environmental Report for submission to ADB Chapter 5 Pluak Daeng Power Plant Anticipated Environmental Impacts and Mitigations
RNP/ENV/P05028/FR (ADB)/RE62049-chap 5 Page 5-41
TABLE 5.1.1-15 RESULTS OF THE PREDICTION OF AIR QUALITY BY USING THE AERMOD MODEL AND THE HIGHEST VALUES IN THE EXISTING MONITORING DATA IN THE CASE OF IMPACT FROM BUILDING ACTIVITIES
Details
Estimated highest concentration levels of air pollutants in the case of impact from building activities (g/m3) 1-hour average NO2 1-year average NO2 1-hour average CO 8-hour average CO 24-hour average PM-10 1-year average PM-10
Using the model
Using existing
monitoring data 2/
Total Using the model
Using existing
monitoring data 2/
Total Using the model
Using existing monitoring
data 2/ Total
Using the model
Using existing monitoring
data 2/ Total
Using the model
Using existing
monitoring data 2/
Total Using the model
Using existing
monitoring data 2/
Total
Highest concentration value 115.19 45.731/ 160.92 6.58 7.441/ 14.02 133.27 1,145.191/ 1,278.46 80.89 916.161/ 997.05 3.11 88.001/ 91.11 0.70 27.041/ 27.74 Grid reference 734028E, 1433014N 733928E, 1433114N 734028E, 1433114N 733728E, 1433014N 733728E, 1433014N 733928E, 1433114N Location project site project site project site project site project site project site Direction and distance from the project site - - - - - - Type of land industrial park industrial park industrial park industrial park industrial park industrial park Sensitive receptor 1. Map Yang Phon Sub-district Administrative Organization 43.87 73.95 117.82 0.40 12.03 12.43 49.50 1,374.23 1,423.73 16.00 916.16 932.16 0.60 109.00 109.6 0.045 33.49 33.535 2. Ban Map Toei School 45.43 73.95 119.38 0.42 12.03 12.45 50.57 1,374.23 1,424.80 18.53 916.16 934.69 0.68 109.00 109.68 0.048 33.49 33.538 3. Map Toei Temple 47.02 73.95 120.97 0.45 12.03 12.48 52.32 1,374.23 1,426.55 19.68 916.16 935.84 0.72 109.00 109.72 0.050 33.49 33.54 4. Nikhom Sang Ton Eng 9 School 25.72 43.47 69.19 0.18 7.07 7.25 28.52 916.16 944.68 9.77 916.16 925.93 0.38 87.00 87.38 0.021 26.73 26.751 5. Prasitharam Temple 24.79 43.47 68.26 0.18 7.07 7.25 27.41 916.16 943.57 9.68 916.16 925.84 0.41 87.00 87.41 0.020 26.73 26.75 6. Map Yang Phon Sub-district Health Promoting Hospital 26.10 55.14 81.24 0.15 8.97 9.12 29.49 1,145.19 1,174.68 7.07 916.16 923.23 0.36 112.00 112.36 0.018 34.42 34.438 7. Ban Map Yang Phon School 26.00 55.14 81.14 0.17 8.97 9.14 34.82 1,145.19 1,180.01 10.33 916.16 926.49 0.46 112.00 112.46 0.021 34.42 34.441 8. Map Yang Phon Temple 27.52 55.14 82.66 0.19 8.97 9.16 30.01 1,145.19 1,175.2 8.38 916.16 924.54 0.30 112.00 112.3 0.022 34.42 34.442 9. Pluak Daeng Sub-district Administrative Organization 12.12 88.44 100.56 0.09 16.94 17.03 14.30 1,374.23 1,388.53 4.47 916.16 920.63 0.16 99.21 99.37 0.010 45.00 45.01 10. Orawin Witthaya School 13.19 88.44 101.63 0.10 16.94 17.04 15.62 1,374.23 1,389.85 7.14 916.16 923.3 0.25 99.21 99.46 0.011 45.00 45.011 11. Pluak Daeng High Voltage Electricity Station 13.16 88.44 101.6 0.09 16.94 17.03 15.78 1,374.23 1,390.01 3.84 916.16 920 0.13 99.21 99.34 0.010 45.00 45.01 12. Wang Pradu Temple 21.52 73.95 95.47 0.05 12.03 12.08 25.13 1,374.23 1,399.36 4.24 916.16 920.4 0.19 109.00 109.19 0.006 33.49 33.496 13. Wang Pradu School (closed down) 20.65 73.95 94.6 0.06 12.03 12.09 26.07 1,374.23 1,400.3 4.39 916.16 920.55 0.17 109.00 109.17 0.006 33.49 33.496 14. Village no.5, Ban Khlong Plu 18.55 43.47 62.02 0.10 7.07 7.17 22.17 916.16 938.33 11.01 916.16 927.17 0.38 87.00 87.38 0.011 26.73 26.741 15. Village no.7, Ban Wang Pla 24.03 43.47 67.5 0.20 7.07 7.27 27.80 916.16 943.96 11.70 916.16 927.86 0.40 87.00 87.4 0.022 26.73 26.752 16. Village no.8, Ban Soi 13 20.90 43.47 64.37 0.16 7.07 7.23 24.60 916.16 940.76 9.90 916.16 926.06 0.34 87.00 87.34 0.018 26.73 26.748 17. Village no.7, Ban Wang Pradu 17.51 73.95 91.46 0.05 12.03 12.08 20.52 1,374.23 1,394.75 3.54 916.16 919.7 0.12 109.00 109.12 0.006 33.49 33.496 18. Village no.4, Ban Khao Mapud 20.51 43.47 63.98 0.14 7.07 7.21 23.90 916.16 940.06 5.20 916.16 921.36 0.18 87.00 87.18 0.015 26.73 26.745 19. Village no.5, Ban Wang Tan Mon 41.81 45.73 87.54 0.38 7.44 7.82 47.58 1,145.19 1,192.77 19.87 916.16 936.03 0.69 88.00 88.69 0.042 27.04 27.082 20. Village no.1, Ban Map Toei 38.04 73.95 111.99 0.28 12.03 12.31 43.06 1,374.23 1,417.29 8.20 916.16 924.36 0.46 109.00 109.46 0.031 33.49 33.521 21. Village no.7, Ban Chak Oi 23.21 73.95 97.16 0.16 12.03 12.19 26.61 1,374.23 1,400.84 7.87 916.16 924.03 0.27 109.00 109.27 0.019 33.49 33.509 22. Village no.6, Ban Map Yang Mai 21.51 66.99 88.5 0.10 10.90 11 26.27 1,030.67 1,056.94 5.90 801.64 807.54 0.20 116.00 116.2 0.011 35.65 35.661 23. Village no.6, Ban Thab Tong 18.25 73.95 92.2 0.12 12.03 12.15 20.81 1,374.23 1,395.04 5.64 916.16 921.8 0.23 109.00 109.23 0.014 33.49 33.504 24. Village no.2, Ban Noen Sawan 42.61 55.14 97.75 0.39 8.97 9.36 48.24 1,145.19 1,193.43 14.62 916.16 930.78 0.50 112.00 112.5 0.043 34.42 34.463 25. Village no.4, Ban Wang Ta Phin 17.35 73.95 91.3 0.13 12.03 12.16 19.90 1,374.23 1,394.13 5.67 916.16 921.83 0.19 109.00 109.19 0.014 33.49 33.504

Environmental Report for submission to ADB Chapter 5 Pluak Daeng Power Plant Anticipated Environmental Impacts and Mitigations
RNP/ENV/P05028/FR (ADB)/RE62049-chap 5 Page 5-42
TABLE 5.1.1-15 RESULTS OF THE PREDICTION OF AIR QUALITY BY USING THE AERMOD MODEL AND THE HIGHEST VALUES IN THE EXISTING MONITORING DATA IN THE CASE OF IMPACT FROM BUILDING ACTIVITIES
Details
Estimated highest concentration levels of air pollutants in the case of impact from building activities (g/m3) 1-hour average NO2 1-year average NO2 1-hour average CO 8-hour average CO 24-hour average PM-10 1-year average PM-10
Using the model
Using existing
monitoring data 2/
Total Using the model
Using existing
monitoring data 2/
Total Using the model
Using existing monitoring
data 2/ Total
Using the model
Using existing monitoring
data 2/ Total
Using the model
Using existing
monitoring data 2/
Total Using the model
Using existing monitoring
data 2/ Total
26. Village no.3, Ban Map Yang Phon 25.02 55.14 80.16 0.17 8.97 9.14 29.07 1,145.19 1174.26 8.14 916.16 924.3 0.28 112.00 112.28 0.019 34.42 34.439 27. Village no.6, Ban Nong Rakam 7.54 45.73 53.27 0.02 7.44 7.46 12.04 1,145.19 1157.23 2.03 916.16 918.19 0.07 88.00 88.07 0.002 27.04 27.042 28. Village no.5, Ban Khlong Phlu 14.88 45.73 60.61 0.08 7.44 7.52 18.61 1,145.19 1163.8 8.34 916.16 924.5 0.28 88.00 88.28 0.009 27.04 27.049 29. Village no.7, Ban Wang Pla 14.82 43.47 58.29 0.12 7.07 7.19 18.27 916.16 934.43 7.14 916.16 923.3 0.24 87.00 87.24 0.013 26.73 26.743 30. Village no.8, Ban Soi 13 19.22 43.47 62.69 0.12 7.07 7.19 22.87 916.16 939.03 7.11 916.16 923.27 0.24 87.00 87.24 0.014 26.73 26.744 31. Village no.4, Ban Chak Manthed 10.61 73.95 84.56 0.04 12.03 12.07 12.81 1,374.23 1387.04 2.27 916.16 918.43 0.08 109.00 109.08 0.004 33.49 33.494
Standard value 3/ 320 57 34,200 10,260 120 50 WHO 4/ 200 40 - - 50 20
Remark: 1/ Concerning Table 5.1.1-5: Highest values in the existing data on the ambient air quality monitoring in the project’s vicinity 2/ Concerning Table 5.1.1-8: Highest values in the existing data on air quality monitoring which are used to represent each receptor’s air pollutant concentration level 3/ Concerning the standards in :
Announcement of the National Environment Board No. 10 (1995) and No. 24 (2004) on ambient air quality standard specification
Announcement of the National Environment Board No. 33 (2009) on nitrogen dioxide ambient concentration standard specification 4/ Referenced from WHO Ambient Air Quality Guidelines in Environmental, Health, and Safety (EHS) Guidelines for International Finance Corporation (2007) Source: Team Consulting Engineering and Management Co., Ltd., 2016

Environmental Report for submission to ADB Chapter 5 Pluak Daeng Power Plant Anticipated Environmental Impacts and Mitigations
RNP/ENV/P05028/FR (ADB)/RE62049-chap 5 Page 5-43
TABLE 5.1.1-16 RESULTS OF THE PREDICTION OF AIR QUALITY BY USING THE AERMOD MODEL AND THE HIGHEST VALUES IN THE EXISTING MONITORING DATA IN THE CASE OF IMPACT FROM TRANSPORTING ACTIVITIES
Details
Estimated highest concentration levels of air pollutants in the case of impact from transporting activities (g/m3) 1-hour average NO2 1-year average NO2 1-hour average CO 8-hour average CO 24-hour average PM-10 1-year average PM-10
Using the model
Using existing
monitoring data 2/
Total using the model
using existing monitoring data
2
total using the
model
using existing
monitoring data 2
total using the
model
using existing
monitoring data 2
total using the
model
using existing
monitoring data 2
total using the
model
using existing
monitoring data 2
total
Highest concentration value 87.33 45.731/ 133.06 6.82 7.441/ 14.26 50.15 1,145.191/ 1,195.34 36.94 916.161/ 953.10 1.92 88.001/ 89.92 0.50 27.041/ 27.54 Grid reference 734128E, 1433114N 734028E, 1433214N 734128E, 1433114N 734028E,1433114N 734028E, 1433114N 734028E, 1433214N Location project site project site project site project site project site project site Direction and distance from the project site - - - - - - Type of land industrial park industrial park industrial park industrial park industrial park industrial park Sensitive receptor 1. Map Yang Phon Sub-district Administrative Organization 44.59 73.95 118.54 0.46 12.03 12.49 25.36 1,374.23 1,399.59 10.52 916.16 926.68 0.46 109.00 109.46 0.034 33.49 33.524 2. Ban Map Toei School 44.15 73.95 118.1 0.48 12.03 12.51 25.58 1,374.23 1,399.81 10.35 916.16 926.51 0.47 109.00 109.47 0.035 33.49 33.525 3. Map Toei Temple 44.23 73.95 118.18 0.50 12.03 12.53 25.26 1,374.23 1,399.49 10.34 916.16 926.5 0.49 109.00 109.49 0.036 33.49 33.526 4. Nikhom Sang Ton Eng 9 School 27.50 43.47 70.97 0.19 7.07 7.26 15.99 916.16 932.15 4.94 916.16 921.1 0.24 87.00 87.24 0.014 26.73 26.744 5. Prasitharam Temple 26.88 43.47 70.35 0.20 7.07 7.27 15.55 916.16 931.71 5.05 916.16 921.21 0.25 87.00 87.25 0.014 26.73 26.744 6. Map Yang Phon Sub-district Health Promoting Hospital 28.89 55.14 84.03 0.17 8.97 9.14 17.37 1,145.19 1,162.56 3.77 916.16 919.93 0.25 112.00 112.25 0.013 34.42 34.433 7. Ban Map Yang Phon School 25.02 55.14 80.16 0.18 8.97 9.15 16.35 1,145.19 1,161.54 5.32 916.16 921.48 0.32 112.00 112.32 0.014 34.42 34.434 8. Map Yang Phon Temple 27.97 55.14 83.11 0.21 8.97 9.18 18.41 1,145.19 1,163.60 4.78 916.16 920.94 0.21 112.00 112.21 0.016 34.42 34.436 9. Pluak Daeng Sub-district Administrative Organization 13.63 88.44 102.07 0.10 16.94 17.04 7.82 1,374.23 1,382.05 2.64 916.16 918.8 0.12 99.21 99.33 0.007 45.00 45.007 10. Orawin Witthaya School 14.88 88.44 103.32 0.10 16.94 17.04 8.73 1,374.23 1,382.96 3.77 916.16 919.93 0.17 99.21 99.38 0.008 45.00 45.008 11. Pluak Daeng High Voltage Electricity Station 14.17 88.44 102.61 0.09 16.94 17.03 8.72 1,374.23 1,382.95 2.20 916.16 918.36 0.09 99.21 99.3 0.007 45.00 45.007 12. Wang Pradu Temple 22.24 73.95 96.19 0.06 12.03 12.09 12.82 1,374.23 1,387.05 2.34 916.16 918.5 0.12 109.00 109.12 0.004 33.49 33.494 13. Wang Pradu School (closed down) 22.59 73.95 96.54 0.06 12.03 12.09 14.17 1,374.23 1,388.40 2.39 916.16 918.55 0.12 109.00 109.12 0.004 33.49 33.494 14. Village no.5, Ban Khlong Plu 19.26 43.47 62.73 0.11 7.07 7.18 12.61 916.16 928.77 5.93 916.16 922.09 0.26 87.00 87.26 0.008 26.73 26.738 15. Village no.7, Ban Wang Pla 25.91 43.47 69.38 0.20 7.07 7.27 14.97 916.16 931.13 6.01 916.16 922.17 0.26 87.00 87.26 0.015 26.73 26.745 16. Village no. 8, Ban Soi 13 22.19 43.47 65.66 0.17 7.07 7.24 13.05 916.16 929.21 5.33 916.16 921.49 0.23 87.00 87.23 0.013 26.73 26.743 17. Village no.7, Ban Wang Pradu 18.54 73.95 92.49 0.06 12.03 12.09 11.89 1,374.23 1,386.12 2.01 916.16 918.17 0.10 109.00 109.1 0.004 33.49 33.494 18. Village no.4, Ban Khao Mapud 22.63 43.47 66.1 0.15 7.07 7.22 13.95 916.16 930.11 2.43 916.16 918.59 0.10 87.00 87.1 0.011 26.73 26.741 19. Village no.5, Ban Wang Tan Mon 38.58 45.73 84.31 0.39 7.44 7.83 22.17 1,145.19 1,167.36 10.38 916.16 926.54 0.45 88.00 88.45 0.029 27.04 27.069 20. Village no.1, Ban Map Toei 36.96 73.95 110.91 0.28 12.03 12.31 21.10 1,374.23 1,395.33 6.00 916.16 922.16 0.26 109.00 109.26 0.021 33.49 33.511 21. Village no.7, Ban Chak Oi 23.91 73.95 97.86 0.17 12.03 12.2 15.45 1,374.23 1,389.68 3.61 916.16 919.77 0.16 109.00 109.16 0.012 33.49 33.502 22. Village no.6, Ban Map Yang Mai 23.88 66.99 90.87 0.10 10.90 11 14.54 1,030.67 1,045.21 4.18 801.64 805.82 0.18 116.00 116.18 0.008 35.65 35.658 23. Village no.6, Ban Thab Tong 19.80 73.95 93.75 0.14 12.03 12.17 11.99 1,374.23 1,386.22 2.80 916.16 918.96 0.14 109.00 109.14 0.010 33.49 33.5 24. Village no.2, Ban Noen Sawan 40.81 55.14 95.95 0.43 8.97 9.4 23.34 1,145.19 1,168.53 7.65 916.16 923.81 0.35 112.00 112.35 0.031 34.42 34.451

Environmental Report for submission to ADB Chapter 5 Pluak Daeng Power Plant Anticipated Environmental Impacts and Mitigations
RNP/ENV/P05028/FR (ADB)/RE62049-chap 5 Page 5-44
TABLE 5.1.1-16 RESULTS OF THE PREDICTION OF AIR QUALITY BY USING THE AERMOD MODEL AND THE HIGHEST VALUES IN THE EXISTING MONITORING DATA IN THE CASE OF IMPACT FROM TRANSPORTING ACTIVITIES (CONT’D)
Details
Estimated highest concentration levels of air pollutants in the case of impact from transporting activities (g/m3) 1-hour average NO2 1-year average NO2 1-hour average CO 8-hour average CO 24-hour average PM-10 1-year average PM-10
Using the model
Using existing
monitoring data 2/
Total using the
model
using existing
monitoring data 2
total using the
model
using existing
monitoring data 2
total using the
model
using existing
monitoring data 2
total using the
model
using existing
monitoring data 2
total using the
model
using existing
monitoring data 2
total
25. Village no.4, Ban Wang Ta Phin 18.97 73.95 92.92 0.14 12.03 12.17 11.49 1,374.23 1,385.72 2.94 916.16 919.1 0.13 109.00 109.13 0.010 33.49 33.50 26. Village no.3, Ban Map Yang Phon 25.19 55.14 80.33 0.20 8.97 9.17 14.73 1,145.19 1,159.92 3.89 916.16 920.05 0.17 112.00 112.17 0.014 34.42 34.434 27. Village no.6, Ban Nong Rakam 7.89 45.73 53.62 0.03 7.44 7.47 5.51 1,145.19 1,150.70 0.92 916.16 917.08 0.04 88.00 88.04 0.002 27.04 27.042 28. Village no.5, Ban Khlong Phlu 15.40 45.73 61.13 0.09 7.44 7.53 9.83 1,145.19 1,155.02 4.16 916.16 920.32 0.18 88.00 88.18 0.006 27.04 27.046 29. Village no.7, Ban Wang Pla 15.71 43.47 59.18 0.12 7.07 7.19 9.70 916.16 925.86 3.66 916.16 919.82 0.16 87.00 87.16 0.009 26.73 26.739 30. Village no.8, Ban Soi 13 20.54 43.47 64.01 0.13 7.07 7.2 12.31 916.16 928.47 3.73 916.16 919.89 0.16 87.00 87.16 0.010 26.73 26.74 31. Village no.4, Ban Chak Manthed 9.46 73.95 83.41 0.04 12.03 12.07 5.62 1,374.23 1,379.85 1.10 916.16 917.26 0.05 109.00 109.05 0.003 33.49 33.493
Standard value 3/ 320 57 34,200 10,260 120 50 WHO 4/ 200 40 - - 50 20
Remark: 1/ Concerning Table 5.1.1-5: Highest values in the existing data on the ambient air quality monitoring in the project’s vicinity 2/ Concerning Table 5.1.1-8: Highest values in the existing data on air quality monitoring which are used to represent each receptor’s air pollutant concentration level 3/ Concerning the standards in :
Announcement of the National Environment Board No. 10 (1995) and No. 24 (2004) on ambient air quality standard specification
Announcement of the National Environment Board No. 33 (2009) on nitrogen dioxide ambient concentration standard specification 4/ Referenced from WHO Ambient Air Quality Guidelines in Environmental, Health, and Safety (EHS) Guidelines for International Finance Corporation (2007) Source: Team Consulting Engineering and Management Co., Ltd., 2016

Environmental Report for submission to ADB Chapter 5
Pluak Daeng Power Plant Anticipated Environmental Impacts and Mitigations
RNP/ENV/P05028/FR (ADB)/RE62049-chap 5 Page 5-45
(2) Operation phase During the operation phase, the main impact is caused by pollutants emitted from the stacks in the fuel-burning process. The main pollutants released from the stacks of the heat recovery steam generator (HRSG) are Total Suspended Particulate (TSP) , Nitrogen Dioxide (NO2) , and Sulfur Dioxide (SO2) . The details of the assessment of impacts resulting from the emission of pollutants in different cases are as follows: (2.1) Selection of the model The AERMOD mathematical model, version 9. 6. 5, which is the latest model, is used in assessing the air quality impact during the operation phase. The preparation of the input data to be used in the model are as already discussed in the part of the assessment of air quality impact during the construction phase. (2.2) Emission source data The main fuel to be used in generating electricity in Pluak Daeng Power Plant Project is natural gas, with diesel as reserved fuel. The pollutants from electricity generation process are to be released from the stacks of the heat recovery steam generator (HRSG), 4 in total, 60 meters high from the ground level and 8 meters in diameter. The main pollutant from the electricity generation process is the oxide of nitrogen (NOx) , the level of which must be regulated by the project in order to ensure that it will not exceed the established standard level. For this, Dry Low NOx ( DLN) System is to be employed in the case that natural gas is used as fuel and Water Injection System in the case of diesel. The consulting team also take into consideration the emission of sulfur dioxide (SO2) and total suspended particulate (TSP) , which may spread to and negatively impact nearby communities. Emission source input data to be used in the model are as follows:
Stack location Height of the stack (meter) The diameter of the stack (meter) Exit temperature (Kelvin temperature scale -°K) Exit velocity (meter/second) Emission rate (gram/second)
The application of the said mathematical model is to be used in conjunction with the highest values in existing data on ambient air quality monitoring by the station or the monitoring point at the receptor as prescribed by the project. For a sensitive receptor where no monitoring result is available, the project will consider using

Environmental Report for submission to ADB Chapter 5
Pluak Daeng Power Plant Anticipated Environmental Impacts and Mitigations
RNP/ENV/P05028/FR (ADB)/RE62049-chap 5 Page 5-46
existing data on ambient air quality monitoring from the station or the monitoring point near that receptor (as shown in Table 5.1.1-8). There are 6 cases based on the 100% load operation and minimum load operation fired by the two fuels in question. Plant operation will be between minimum generation and 100% load ( full load) . Plant load will be dependable on EGAT’ s dispatch instruction which in any case will be between minimum generation and full load. From experience of IPP, the plant will be operated near full load approximately for half of the time, and near-minimum generation load approximately for half of the time. However, the future EGAT’ s dispatch can be either similar or different from experience. Therefore, the assessment was based on the highest capacity at 100 % load and the minimum operation. Details are as follows: Plant operation will be between 375 MW/unit or 4x375 MWnet = 1,500 MWnet/ 4 units (minimum generation) and 100% load ( full load) . Plant load will be dependable on EGAT’ s dispatch instruction which in any case will be between minimum generation and full load. From experience of IPP, the plant will be operated near full load approximately for half of the time, and near-minimum generation load approximately for half of the time. However, the future EGAT’ s dispatch can be either similar or different from experience. Therefore, the assessment was based on the highest capacity at 100 % load and the minimum operation. Details are as follows:
Case 1: Impacts caused by Pluak Daeng Power Plant Project in the event of natural gas-fired operation at 100% load are assessed in conjunction with results of ambient air quality monitoring.
Case 2: Impacts caused by Pluak Daeng Power Plant Project in the event of natural gas- fired operation at minimum load are assessed in conjunction with results of ambient air quality monitoring.
Case 3: Impacts caused by Pluak Daeng Power Plant Project in the event of natural gas- fired operation at 100% load; plus the existing impacts caused by other industrial plants as specified in the environmental impact assessment report though there is not yet air pollutant emission within the radius of 15 kilometers from the project location; are assessed in conjunction with results of ambient air quality monitoring.
Case 4: Impacts caused by Pluak Daeng Power Plant Project in the event of diesel- fired operation at 100% load are assessed in conjunction with results of ambient air quality monitoring.

Environmental Report for submission to ADB Chapter 5
Pluak Daeng Power Plant Anticipated Environmental Impacts and Mitigations
RNP/ENV/P05028/FR (ADB)/RE62049-chap 5 Page 5-47
Case 5: Impacts caused by Pluak Daeng Power Plant Project in the event of diesel- fired operation at minimum load are assessed in conjunction with results of ambient air quality monitoring.
Case 6: Impacts caused by Pluak Daeng Power Plant Project in the event of diesel- fired operation at 100% load; plus the existing impacts caused by other industrial plants as specified in the environmental impact assessment report though there is not yet air pollutant emission within the radius of 15 kilometers from the project location; are assessed in conjunction with results of ambient air quality monitoring.
All the three sources of air pollutants emitted from other industrial plants in the study area to be used in the assessment of the potential air quality impact after the development of the project as specified in the environmental impact assessment report are power plant projects. One is Gulf Group’s power plant projects, and other 2 are Glow Group’ s power plant project, and the natural gas power plant projects of Amata B.Grimm Power (Rayong) 4 Co., Ltd.. The details about the stacks, installed capacity, fuel used, as well as the air quality status of each project are shown in Table 5.1.1-17.
According to Glow Hemaraj Power Co. , Ltd. data on air pollutant emission, which refers to the data in the document certifying the air pollutant emission rates of Glow Hemaraj Power Co. , Ltd. cogeneration plant project in Hemaraj Eastern Seaboard Industrial Estate ( Rayong) , dated 5 November 2014, and the environmental impact assessment report ( the complete edition) of Glow Hemaraj Power Co. , Ltd. cogeneration plant project in Eastern Seaboard Industrial Estate (Rayong) , in Pluak Daeng District, Rayong Province, 2007; in the event of natural gas being used as fuel, only the details about nitrogen dioxide emission is provided. For the case of diesel being used as fuel, the details about the emission of nitrogen dioxide, sulfur dioxide, and total suspended particulates are shown in Appendix 5A-4.

Environmental Report for subm
ission to ADB Chapter 5
Pluak Daeng Power Plant Anticipated Environm
ental Impacts and M
itigations
RNP/ENV/P05028/FR (ADB)/RE62049-chap 5 Page 5-48
TABLE 5.1.1-17 DETAILS ABOUT THE STACKS AND THE AIR QUALITY STATUS OF THE INDUSTRIAL PLANTS SPECIFIED IN
THE ENVIRONMENTAL IMPACT ASSESSMENT REPORT THOUGH THERE IS NOT YET AIR POLLUTANT EMISSION WITHIN THE RADIUS OF 15 KILOMETERS FROM THE PROJECT LOCATION
Industrial plant Installed capacity
(MW) Fuel used Location
Stack Exit temperature
(K)
Exit velocity (m/s)
Emission rate Height
(m) Diameter
(m) NO2 (g/s)
SO2 (g/s)
TSP (g/s)
PM-10 (g/s)
1. Sri Racha Power Plant1/
2,650 natural gas HRSG 1 HRSG 2 HRSG 3 HRSG 4
60 60 60 60
7.01 7.01 7.01 7.01
355.55 355.55 355.55 355.55
23.5 23.5 23.5 23.5
20 20 20 20
6.17 6.17 6.17 6.17
7.86 7.86 7.86 7.86
7.86 7.86 7.86 7.86
diesel HRSG 1 HRSG 2 HRSG 3 HRSG 4
60 60 60 60
7.01 7.01 7.01 7.01
421.15 421.15 421.15 421.15
27.5 27.5 27.5 27.5
20 20 20 20
18.95 18.95 18.95 18.95
11.6 11.6 11.6 11.6
9.51 9.51 9.51 9.51
2. Glow Hemaraj Power Co., Ltd. 1,126 natural gas 2/,3/ HRSG 1 HRSG 2 HRSG 3
50 50 50
6.5 6.5 6.5
373 373 373
22.61 22.61 22.61
74.4 74.4 74.4
- - -
- - -
- - -
diesel 3/ HRSG 1 HRSG 2 HRSG 3
50 50 50
6.5 6.5 6.5
413 413 413
15.56 15.56 15.56
113.5 113.5 113.5
365.7 365.7 365.7
60.4 60.4 60.4
- - -
3. Amata B.Grimm Power (Rayong) 4 Co., Ltd.4/
142.1 natural gas HRSG 1 HRSG 2
45 45
3.03 3.03
376.15 376.15
19.40 19.40
7.33 7.33
1.70 1.70
1.30 1.30
1.30 1.30
Remark : No data available in the environmental impact assessment report Source : 1/ Environmental Impact Assessment Report of Sri Racha Power Plant, Gulf SRC Co., Ltd., 2016 2/ Document certifying the air pollutant emission rates of Glow Hemaraj Power Co., Ltd. cogeneration plant project in Hemaraj Eastern Seaboard Industrial Estate (Rayong),
dated 5th November 2014 3/ Environmental Impact Assessment Report (Complete Edition) of Eastern Seaboard Industrial Estate’s Cogeneration Plant Project (Rayong), Pluak Daeng District, Rayong
Province (2007) 4/ Environmental Impact Assessment Report (Complete Edition) of Amata B.Grimm Power (Rayong) 4 Co., Ltd. Power Plant Project (2014)

Environmental Report for submission to ADB Chapter 5
Pluak Daeng Power Plant Anticipated Environmental Impacts and Mitigations
RNP/ENV/P05028/FR (ADB)/RE62049-chap 5 Page 5-49
Having considered the assessment of the impact caused by particulate matter 10 micrometers or less in diameter (PM-10) during the operation phase of the project, both in the case when natural gas and the case when diesel is used as fuel in conjunction with the existing impacts caused by other industrial plants as specified in the environmental impact assessment report though there is not yet air pollutant emission within the radius of 15 kilometers from the project location, which are 3 natural gas- fired power plant projects in total; the consulting team formulate the hypothesis to be used with the model consisting of two parts as follows:
For the emission of dust particles from the natural gas-fired power plant, the hypothesized ratio of PM-10/TSP is 1.00.
For the emission of dust particles from the diesel- fired power plant, the hypothesized ratio of PM-10/TSP is 0.82 (reference - AP-42: Chapter 3.4, Large Stationary Diesel and All Stationary Dual-fuel Engines) The details about the stacks and the emission rates in each case are shown in Table 5.1.1-17 to Table 5.1.1-18 and Figure 5.1.1-13. Also, the presence of buildings can affect plume rise and the initial dispersion of pollutants within the atmosphere. Turbulent wake zones can be created around buildings that force pollutants to the ground instead of allowing them to rise freely within the atmosphere. Building downwash occurs as the wind flows over and around buildings and impacts the dispersion of pollution from nearby stacks, refer to Figure 5.1.1-14, entitled “Simplified Building Downwash Depiction.” According to Section 123 of the Clean Air Act, GEP is defined as “ the height necessary to ensure that emissions from a stack do not result in excessive concentrations of any air pollutant in the immediate vicinity of the source as a result of atmospheric downwash, eddies or wakes which may be created by the source itself, nearby structures or nearby terrain obstacles.”

Environmental Report for submission to ADB Chapter 5
Pluak Daeng Power Plant Anticipated Environmental Impacts and Mitigations
RNP/ENV/P05028/FR (ADB)/RE62049-chap 5 Page 5-50
TABLE 5.1.1-18 PLUAK DAENG POWER PLANT’S POLLUTANT EMISSION RATES
Details Unit Natural gas Diesel Standard values(1),(2) Stipulated limit (3)
100% load
Minimum load
100% load
Minimum load
Natural gas
Diesel Natural gas
Diesel
Installed capacity MW 700 375 500 375 Number of stacks Stack 4 4 4 4 Stack height m 60 60 60 60 Stack diameter (internal) m 8 8 8 8
Exit temperature C 83 76 96 82
Exit velocity m/s 23.1 15.8 20.8 17.2 Excess O2 (on a dry basis)
Vol % 7 7 7 7
The flow rate of the air at the exit (on a dry basis)
Nm3/s 786 554 693 640
Pollutant concentration
NOx as NO2 @ 7%O2 ppmvd 59 (25) 59 (25) 99 (42) 99 (42) 120 (51) 180 (76) 80 (34) 110 (47) SOx as SO2 @ 7%O2 ppmvd 10 (4) 10 (4) 20 (8) 20 (8) 20 (8) 260 (110) 14 (6) 28 (12) TSP @ 7%O2 mg/m3 20 (8) 20 (8) 35 (15) 35 (15) 60 (25) 120 (51) 32 (14) 44 (19)
Emission rate/stack NO2 g/s 58.6 35.4 74.0 61.2 66.36 75.00 SO2 g/s 13.9 8.4 21.0 17.6 15.79 25.79 TSP g/s 9.7 5.9 12.9 10.6 12.35 14.22
Air pollutant control system Dry Low NOx Combustion
Water Injection System
Remark : (1) The numbers in brackets are the value at 15% O2. (2) IFC’s Emission guidelines for combustion turbine are as follows.
Pollutants Natural Gas Diesel Oil NOx 25 74 SO2 N/A Use of 1% of less S fuel
Particulate Matter N/A 50 (3) Standard values of air pollutant emission concerning the Ministry of Natural Resources and
Environment’s Announcement on Regulatory Standards Established to Control Air Pollutant Emission from New Power Plants, issued on 20th December 2009
(4) Standard values of air pollutant emission concerning the Ministry of Industry’s Regulations on the Establishment of Limits on the Level of Air Impurities Emitted from Electricity Producers or Distributors, issued on 20th December 2009
(5) Regulations on air pollutant emission from independent power producers, as stipulated in the environmental impact assessment report on the Pluak Daeng Industrial Park, Expansion Phase 1, 2016 ( as shown in Appendix 3S)
Source: Gulf PD Co., Ltd., 2019

Environmental Report for submission to ADB Chapter 5
Pluak Daeng Power Plant Anticipated Environmental Impacts and Mitigations
RNP RNP/ENV/P05028/FR (ADB)/RE62049-chap 5 Page 5-51
FIGUR
E 5.
1.1-1
3 : L
OCAT
IONS
OF
THE
STAC
KS O
F TH
E PO
WER
PLA
NTS
IN T
HE S
TUDY
ARE
A
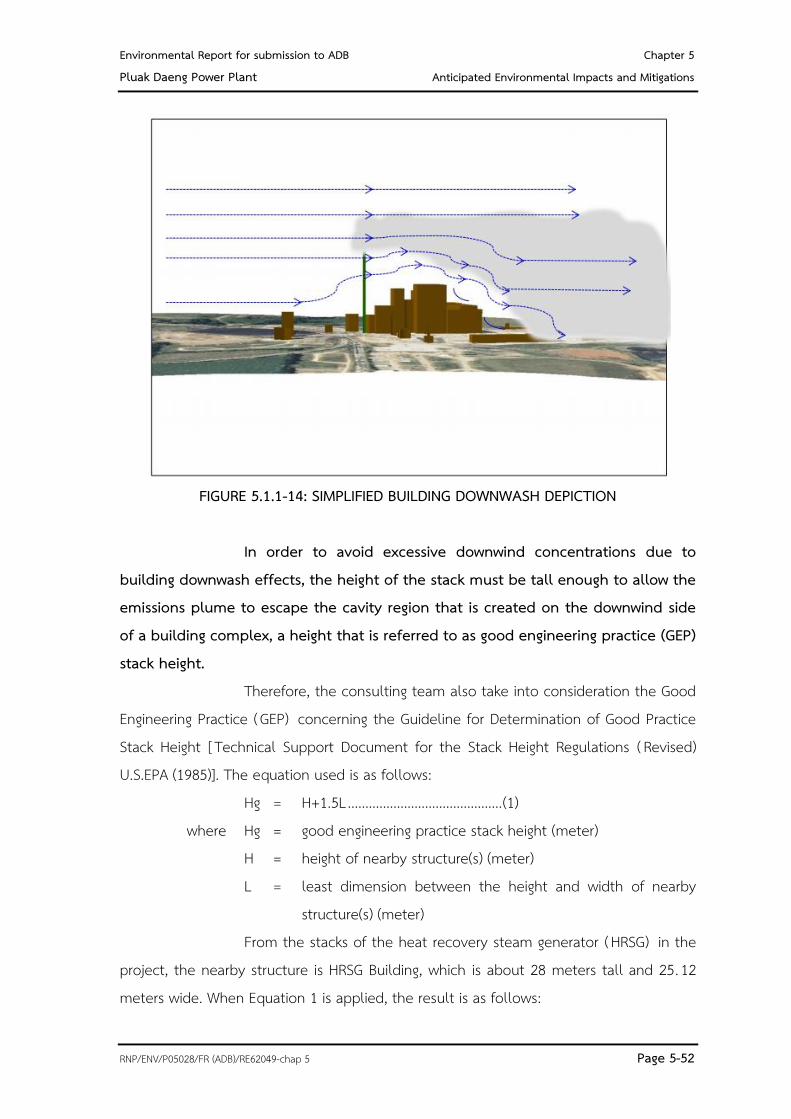
Environmental Report for submission to ADB Chapter 5
Pluak Daeng Power Plant Anticipated Environmental Impacts and Mitigations
RNP/ENV/P05028/FR (ADB)/RE62049-chap 5 Page 5-52
FIGURE 5.1.1-14: SIMPLIFIED BUILDING DOWNWASH DEPICTION
In order to avoid excessive downwind concentrations due to building downwash effects, the height of the stack must be tall enough to allow the emissions plume to escape the cavity region that is created on the downwind side of a building complex, a height that is referred to as good engineering practice (GEP) stack height. Therefore, the consulting team also take into consideration the Good Engineering Practice (GEP) concerning the Guideline for Determination of Good Practice Stack Height [ Technical Support Document for the Stack Height Regulations ( Revised) U.S.EPA (1985)]. The equation used is as follows: Hg = H+1.5L ............................................ (1) where Hg = good engineering practice stack height (meter) H = height of nearby structure(s) (meter) L = least dimension between the height and width of nearby
structure(s) (meter) From the stacks of the heat recovery steam generator (HRSG) in the project, the nearby structure is HRSG Building, which is about 28 meters tall and 25. 12 meters wide. When Equation 1 is applied, the result is as follows:

Environmental Report for submission to ADB Chapter 5
Pluak Daeng Power Plant Anticipated Environmental Impacts and Mitigations
RNP/ENV/P05028/FR (ADB)/RE62049-chap 5 Page 5-53
Hg = 28 m + (1.525.12 m) = 65.68 m The calculation of stack height according to the Good Engineering Practice (GEP) and Guidelines for Determination of Good Practice Stack Height (Technical Support Document for the Stack Height Regulations) (Revised) U.S.EPA (1985) showed that the suggested stack height should be 65.68 m., whereas the designed stack height of the project was 60 m. Therefore, the project has predicted emission concentration of both stack heights to compare the difference between their emissions. The predicted showed that the maximum concentration of pollutants in ambient air from the 60-meter stack is slightly higher than that from the 65.68-meter stack, as shown in Table 5.1.1-19 and Table 5.1.1-20. It can be concluded that a stack of 60 meters high is applicable. Besides, the downwash effect of 60-meter height stack was considered, and it was found that there will be no downwash effect. (2.3) Air Quality Assessment Results In estimating the concentration of nitrogen dioxide in the ambient air caused by the development of the project and the operation of other plants in the study area, the consulting team choose the Plume Volume Molar Ratio Method (PVMRM) in determining the conversion factor of NO2/NOx. For this, the ozone concentration data on an hourly basis collected in 2016-2018 by of Pluak Daeng District Public Health Office’s Air Quality Monitoring Station, Rayong Province, under the charge of the Pollution Control Department, are used. The equilibrium NO2/NOx ratio is 0. 90. The in- stack NO2/NOx ratio is 0. 0 91 for the natural gas- fired power plant projects ( reference - Gas Turbine: Modeling Compliance of The Federal 1-Hour NO2 NAAQS, the California Air Pollution Control Officers Association (CAPCOA), 2011)1. For the diesel-fired power plant projects, the NO2/NOx ratio is 0. 50 ( the default value is according to the Guideline Manual on the Use of Models to Assess Air Pollutant Dispersion).
1 Petrochemical Section, the Office of Natural Resources and Environmental Policy and Planning, 2014, “Data on the In-stack NO2/ NOx Ratio for Emission from Industrial Plants in Map Ta Phut Area, Mueang Rayong District, Rayong Province, for Air Modeling”

Environmental Report for subm
ission to ADB Chapter 5
Pluak Daeng Power Plant Anticipated Environm
ental Impacts and M
itigations
RNP/ENV/P05028/FR (ADB)/RE62049-chap 5 Page 5-54
TABLE 5.1.1-19
CASE 1: IMPACTS CAUSED BY PLUAK DAENG POWER PLANT PROJECT IN THE EVENT OF NATURAL GAS-FIRED OPERATION AT 100% LOAD Highest concentration value from the results of the assessment
Case 1 The height of the Project’s emission stack is 60 m. The height of the Project’s emission stack is 65.68 m NO2 average 1 hr NO2 average 1 yr NO2 average 1 hr NO2 average 1 yr
Highest concentration 209.53 2.54 242.66 4.79 Coordinates 720828E, 1437614N 729328E, 1419614N 728828E, 1419114N 729328E, 1419614N
Area Song Phi Nong Jom Hae Mountain Khao Chomhae Khao Chomhae Direction and distance NW SSW SSW SSW
13.6 km 14.2 km 14.8 km 14.2 km Land utilization Mountain Mountain Mountain Mountain Sensitive Area model monitor total model monitor total model monitor total model monitor total
1 Map Yang Phon Sub-district Administrative Organization
33.04 73.95 106.99 0.91 12.03 12.94 32.77 73.95 106.72 0.91 12.03 12.94
2 Ban Map Toei School 33.76 73.95 107.71 0.92 12.03 12.95 33.49 73.95 107.44 0.91 12.03 12.94 3 Map Toei Temple 34.61 73.95 108.56 0.92 12.03 12.95 34.32 73.95 108.27 0.91 12.03 12.94 4 Nikhom Sang Ton Eng 9 School 64.62 43.47 108.09 1.06 7.07 8.13 63.16 43.47 106.63 1.06 7.07 8.13 5 Prasitharam Temple 66.64 43.47 110.11 1.08 7.07 8.15 65.24 43.47 108.71 1.07 7.07 8.14 6 Map Yang Phon Sub- district Health
Promoting Hospital 59.25 55.14 114.39 0.91 8.97 9.88 58.73 55.14 113.87 0.90 8.97 9.87
7 Ban Map Yang Phon School 63.44 55.14 118.58 0.96 8.97 9.93 62.81 55.14 117.95 0.96 8.97 9.93 8 Map Yang Phon Temple 67.44 55.14 122.58 1.11 8.97 10.08 66.37 55.14 121.51 1.10 8.97 10.07 9 Pluak Daeng Sub- district Administrative
Organization 24.46 88.44 112.90 0.48 16.94 17.42 24.25 88.44 112.69 0.48 16.94 17.42
10 Orawin Witthaya School 31.47 88.44 119.91 0.49 16.94 17.43 31.16 88.44 119.60 0.49 16.94 17.43 11 Pluak Daeng High Voltage Electricity Station 34.04 88.44 122.48 0.52 16.94 17.46 33.89 88.44 122.33 0.52 16.94 17.46 12 Wang Pradu Temple 35.58 73.95 109.53 0.48 12.03 12.51 35.41 73.95 109.36 0.47 12.03 12.50 13 Wang Pradu School (closed down) 35.52 73.95 109.47 0.48 12.03 12.51 35.35 73.95 109.30 0.48 12.03 12.51 14 Village no.5, Ban Khlong Plu 45.78 43.47 89.25 0.92 7.07 7.99 45.54 43.47 89.01 0.91 7.07 7.98 15 Village no.7, Ban Wang Pla 67.07 43.47 110.54 1.11 7.07 8.18 65.60 43.47 109.07 1.11 7.07 8.18 16 Village no.8 , Ban Soi 13 48.65 43.47 92.12 0.92 7.07 7.99 48.22 43.47 91.69 0.91 7.07 7.98 17 Village no.7, Ban Wang Pradu 34.75 73.95 108.70 0.49 12.03 12.52 34.58 73.95 108.53 0.49 12.03 12.52 18 Village no.4, Ban Khao Mapud 41.32 43.47 84.79 0.77 7.07 7.84 41.11 43.47 84.58 0.76 7.07 7.83 19 Village no.5, Ban Wang Tan Mon 56.14 45.73 101.87 1.25 7.44 8.69 55.40 45.73 101.13 1.24 7.44 8.68 20 Village no.1, Ban Map Toei 38.23 73.95 112.18 0.76 12.03 12.79 37.87 73.95 111.82 0.75 12.03 12.78 21 Village no.7, Ban Chak Oi 38.73 73.95 112.68 0.69 12.03 12.72 38.13 73.95 112.08 0.69 12.03 12.72 22 Village no.6, Ban Map Yang Mai 45.45 66.99 112.44 0.77 10.90 11.67 45.14 66.99 112.13 0.76 10.90 11.66 23 Village no.6, Ban Thab Tong 29.55 73.95 103.50 0.65 12.03 12.68 29.44 73.95 103.39 0.65 12.03 12.68 24 Village no.2, Ban Noen Sawan 44.32 55.14 99.46 1.74 8.97 10.71 42.76 55.14 97.90 1.72 8.97 10.69 25 Village no.4, Ban Wang Ta Phin 40.05 73.95 114.00 0.69 12.03 12.72 39.94 73.95 113.89 0.69 12.03 12.72 26 Village no.3, Ban Map Yang Phon 53.30 55.14 108.44 1.34 8.97 10.31 50.15 55.14 105.29 1.33 8.97 10.30 27 Village no.6, Ban Nong Rakam 27.08 45.73 72.81 0.48 7.44 7.92 26.44 45.73 72.17 0.48 7.44 7.92 28 Village no.5, Ban Khlong Phlu 43.04 45.73 88.77 0.86 7.44 8.30 41.99 45.73 87.72 0.85 7.44 8.29 29 Village no.7, Ban Wang Pla 60.76 43.47 104.23 1.00 7.07 8.07 59.60 43.47 103.07 0.99 7.07 8.06 30 Village no.8 , Ban Soi 13 48.15 43.47 91.62 0.87 7.07 7.94 47.05 43.47 90.52 0.86 7.07 7.93 31 Village no.4, Ban Chak Manthed 31.82 73.95 105.77 0.42 12.03 12.45 30.84 73.95 104.79 0.42 12.03 12.45

Environmental Report for subm
ission to ADB Chapter 5
Pluak Daeng Power Plant Anticipated Environm
ental Impacts and M
itigations
RNP/ENV/P05028/FR (ADB)/RE62049-chap 5 Page 5-55
TABLE 5.1.1-20 CASE 4: IMPACTS CAUSED BY PLUAK DAENG POWER PLANT PROJECT IN THE EVENT OF DIESEL-FIRED OPERATION AT 100% LOAD
Highest concentration value from the results of the assessment Case 4 The height of the Project’s emission stack is 60 m. The height of the Project’s emission stack is 65.68 m
NO2 average 1 hr NO2 average 1 yr NO2 average 1 hr NO2 average 1 yr
Highest concentration 263 70 3 20 258 37 3 16
Coordinates 720828E, 1437614N 729328E, 1419614N 720828E, 1437614N 729328E, 1419614N
Area Khao Song Phi Nong Khao Chomhae Khao Song Phi Nong Khao Chomhae
Direction and distance NW SSW NW SSW
13 6 km 14 2 km 13 6 km 14 2 km
Land utilization Mountain Mountain Mountain Mountain
Sensitive Area model monitor total model model monitor total model model monitor total model 1 Map Yang Phon Sub-district Administrative
Organization 41 59 73 95 115 54 1 15 12 03 13 18 41 24 73 95 115 19 1 14 12 03 13 17
2 Ban Map Toei School 42 48 73 95 116 43 1 15 12 03 13 18 42 14 73 95 116 09 1 14 12 03 13 17
3 Map Toei Temple 43 54 73 95 117 49 1 15 12 03 13 18 43 18 73 95 117 13 1 14 12 03 13 17
4 Nikhom Sang Ton Eng 9 School 81 58 43 47 125 05 1 34 7 07 8 41 79 74 43 47 123 21 1 33 7 07 8 40
5 Prasitharam Temple 84 13 43 47 127 60 1 35 7 07 8 42 82 36 43 47 125 83 1 34 7 07 8 41
6 Map Yang Phon Sub- district Health Promoting Hospital
74 66 55 14 129 80 1 14 8 97 10 11 74 01 55 14 129 15 1 13 8 97 10 10
7 Ban Map Yang Phon School 79 93 55 14 135 07 1 21 8 97 10 18 79 14 55 14 134 28 1 21 8 97 10 18
8 Map Yang Phon Temple 84 88 55 14 140 02 1 40 8 97 10 37 83 60 55 14 138 74 1 39 8 97 10 36
9 Pluak Daeng Sub- district Administrative Organization
30 80 88 44 119 24 0 61 16 94 17 55 30 54 88 44 118 98 0 60 16 94 17 54
10 Orawin Witthaya School 39 61 88 44 128 05 0 62 16 94 17 56 39 23 88 44 127 67 0 61 16 94 17 55
11 Pluak Daeng High Voltage Electricity Station 42 90 88 44 131 34 0 66 16 94 17 60 42 71 88 44 131 15 0 66 16 94 17 60
12 Wang Pradu Temple 44 70 73 95 118 65 0 60 12 03 12 63 44 49 73 95 118 44 0 60 12 03 12 63
13 Wang Pradu School (closed down) 44 63 73 95 118 58 0 61 12 03 12 64 44 42 73 95 118 37 0 60 12 03 12 63
14 Village no.5, Ban Khlong Plu 57 65 43 47 101 12 1 16 7 07 8 23 57 35 43 47 100 82 1 15 7 07 8 22
15 Village no.7, Ban Wang Pla 84 67 43 47 128 14 1 40 7 07 8 47 82 82 43 47 126 29 1 39 7 07 8 46
16 Village no.8 , Ban Soi 13 61 36 43 47 104 83 1 15 7 07 8 22 60 82 43 47 104 29 1 14 7 07 8 21
17 Village no.7, Ban Wang Pradu 43 63 73 95 117 58 0 62 12 03 12 65 43 43 73 95 117 38 0 62 12 03 12 65
18 Village no.4, Ban Khao Mapud 52 09 43 47 95 56 0 96 7 07 8 03 51 83 43 47 95 30 0 96 7 07 8 03
19 Village no.5, Ban Wang Tan Mon 70 80 45 73 116 53 1 58 7 44 9 02 69 88 45 73 115 61 1 56 7 44 9 00
20 Village no.1, Ban Map Toei 48 13 73 95 122 08 0 95 12 03 12 98 47 68 73 95 121 63 0 94 12 03 12 97
21 Village no.7, Ban Chak Oi 48 71 73 95 122 66 0 87 12 03 12 90 47 95 73 95 121 90 0 87 12 03 12 90
22 Village no.6, Ban Map Yang Mai 57 21 66 99 124 20 0 97 10 90 11 87 56 83 66 99 123 82 0 96 10 90 11 86
23 Village no.6, Ban Thab Tong 37 21 73 95 111 16 0 82 12 03 12 85 37 07 73 95 111 02 0 82 12 03 12 85
24 Village no.2, Ban Noen Sawan 55 77 55 14 110 91 2 18 8 97 11 15 53 72 55 14 108 86 2 16 8 97 11 13
25 Village no.4, Ban Wang Ta Phin 50 44 73 95 124 39 0 87 12 03 12 90 50 30 73 95 124 25 0 87 12 03 12 90
26 Village no.3, Ban Map Yang Phon 66 92 55 14 122 06 1 68 8 97 10 65 62 94 55 14 118 08 1 67 8 97 10 64
27 Village no.6, Ban Nong Rakam 34 08 45 73 79 81 0 61 7 44 8 05 33 30 45 73 79 03 0 61 7 44 8 05
28 Village no.5, Ban Khlong Phlu 54 17 45 73 99 90 1 08 7 44 8 52 52 85 45 73 98 58 1 07 7 44 8 51
29 Village no.7, Ban Wang Pla 76 68 43 47 120 15 1 26 7 07 8 33 75 22 43 47 118 69 1 25 7 07 8 32
30 Village no.8 , Ban Soi 13 60 71 43 47 104 18 1 09 7 07 8 16 59 33 43 47 102 80 1 09 7 07 8 16
31 Village no.4, Ban Chak Manthed 40 02 73 95 113 97 0 53 12 03 12 56 38 78 73 95 112 73 0 53 12 03 12 56

Environmental Report for submission to ADB Chapter 5
Pluak Daeng Power Plant Anticipated Environmental Impacts and Mitigations
RNP/ENV/P05028/FR (ADB)/RE62049-chap 5 Page 5-56
To be in line with the ambient air quality standards, the parameters used in the assessment of air quality impact with the AERMOD mathematical model are the average concentration of nitrogen dioxide (NO2 ) for 1 hour, and 1 year; the average concentration of sulfur dioxide (SO2) for 24 hours, and 1 year; the average concentration of total suspended particulate ( TSP) for 24 hours, and 1 year; and the average concentration of particulate matter 10 micrometers or less in diameter (PM-10) for 24 hours, and 1 year. The findings reveal that the air pollutant values in the study area and sensitive receptors are lower than the values stipulated in general ambient air quality standards. The details are as follows:
Case 1: Impacts caused by Pluak Daeng Power Plant Project in the event of natural gas-fired operation at 100% load are assessed in conjunction with results of ambient air quality monitoring. The air quality assessment results of the operational period are shown in Table 5.1.1-21 and Appendix 5A-5.
Case 2: Impacts caused by Pluak Daeng Power Plant Project in the event of natural gas- fired operation at minimum load are assessed in conjunction with results of ambient air quality monitoring. The air quality assessment results of the operational period are shown in Table 5.1.1-22 and Appendix 5A-5.
Case 3: Impacts caused by Pluak Daeng Power Plant Project in the event of natural gas- fired operation at 100% load; plus the existing impacts caused by other industrial plants as specified in the environmental impact assessment report though there is not yet air pollutant emission within the radius of 15 kilometers from the project location; are assessed in conjunction with results of ambient air quality monitoring. The air quality assessment results of the operational period are shown in Table 5.1.1-23 and Figure 5.1.1-15 to Figure 5.1.1-23.

Environmental Report for submission to ADB Chapter 5
Pluak Daeng Power Plant Anticipated Environmental Impacts and Mitigations
RNP/ENV/P05028/FR (ADB)/RE62049-chap 5 Page 5-57
TABLE 5.1.1-21 RESULTS OF THE PREDICTION OF AIR QUALITY BY USING THE AERMOD MODEL IN NORMAL CONDITION (WITH DOWNWASH EFFECT),
CASE 1: IMPACTS CAUSED BY PLUAK DAENG POWER PLANT PROJECT IN THE EVENT OF NATURAL GAS-FIRED OPERATION AT 100% LOAD ARE ASSESSED IN CONJUNCTION WITH RESULTS OF AMBIENT AIR QUALITY MONITORING
Study Area Estimated highest concentration levels of air pollutants in the case of impact from transporting activities (g/m3) 1-hour average NO2 1-year average NO2 1-hour average SO2 24-hour average SO2 1-year average SO2 24-hour average TSP 1-year average TSP 24-hour average PM-10 1-year average PM-10
Maximum concentration by model 209.53* 2.54 73.48 17.28 1.40 12.06 0.97 12.06 0.97 Grid reference 720828E, 1437614N 729328E, 1419614N 721328E, 1437614N 729328E, 1418614N 729328E, 1419614N 729328E, 1418614N 729328E, 1419614N 729328E, 1418614N 729328E, 1419614N Location Song Pe Nong Mountain Jom Hae Mountain Song Pe Nong Mountain Jom Hae Mountain Jom Hae Mountain Jom Hae Mountain Jom Hae Mountain Jom Hae Mountain Jom Hae Mountain Direction and distance from the project site
NW SSW NW SSW SSW SSW SSW SSW SSW 13.6 km 14.2 km 13.1 km 15.1 km 14.2 km 15.1 km 14.2 km 15.1 km 14.2 km
Land Use mountain mountain mountain mountain mountain mountain mountain mountain mountain
Sensitive Area Using the
model
Using existing
monitoring data 1/
Total Using the
model
Using existing
monitoring data 1/
Total Using the
model
Using existing
monitoring data 1/
Total Using the
model
Using existing
monitoring data 1/
Total Using the
model
Using existing
monitoring data 1/
Total Using the
model
Using existing
monitoring data 1/
Total Using the
model
Using existing
monitoring data 1/
Total Using the
model
Using existing
monitoring data 1/
Total Using the
model
Using existing
monitoring data 1/
Total
1. Map Yang Phon Sub-district Administrative Organization
33.04 73.95 106.99 0.91 12.03 12.94 16.68 7.86 24.54 2.50 5.24 7.74 0.51 1.28 1.79 1.75 295.00 296.75 0.36 90.65 91.01 1.75 109.00 110.75 0.36 33.49 33.85
2. Ban Map Toei School 33.76 73.95 107.71 0.92 12.03 12.95 16.66 7.86 24.52 2.57 5.24 7.81 0.51 1.28 1.79 1.79 295.00 296.79 0.36 90.65 91.01 1.79 109.00 110.79 0.36 33.49 33.85 3. Map Toei Temple 34.61 73.95 108.56 0.92 12.03 12.95 16.30 7.86 24.16 2.66 5.24 7.90 0.52 1.28 1.80 1.86 295.00 296.86 0.36 90.65 91.01 1.86 109.00 110.86 0.36 33.49 33.85 4. Nikhom Sang Ton Eng 9 School 64.62 43.47 108.09 1.06 7.07 8.13 23.66 3.93 27.59 2.48 3.14 5.62 0.55 0.64 1.19 1.73 148.00 149.73 0.38 45.48 45.86 1.73 87.00 88.73 0.38 26.73 27.11 5. Prasitharam Temple 66.64 43.47 110.11 1.08 7.07 8.15 23.49 3.93 27.42 2.43 3.14 5.57 0.55 0.64 1.19 1.70 148.00 149.70 0.38 45.48 45.86 1.70 87.00 88.70 0.38 26.73 27.11
6. Map Yang Phon Sub-district Health Promoting Hospital
59.25 55.14 114.39 0.91 8.97 9.88 23.77 4.45 28.22 2.01 3.41 5.42 0.42 0.72 1.14 1.40 177.00 178.40 0.29 54.39 54.68 1.40 112.00 113.40 0.29 34.42 34.71
7. Ban Map Yang Phon School 63.44 55.14 118.58 0.96 8.97 9.93 24.52 4.45 28.97 2.12 3.41 5.53 0.45 0.72 1.17 1.48 177.00 178.48 0.31 54.39 54.70 1.48 112.00 113.48 0.31 34.42 34.73 8. Map Yang Phon Temple 67.44 55.14 122.58 1.11 8.97 10.08 25.20 4.45 29.65 2.39 3.41 5.80 0.51 0.72 1.23 1.67 177.00 178.67 0.36 54.39 54.75 1.67 112.00 113.67 0.36 34.42 34.78 9. Pluak Daeng Sub-district
Administrative Organization 24.46 88.44 112.90 0.48 16.94 17.42 15.79 44.28 60.07 1.86 10.49 12.35 0.30 1.88 2.18 1.30 295.00 296.30 0.21 90.65 90.86 1.30 99.21 100.51 0.21 45.00 45.21
10. Orawin Witthaya School 31.47 88.44 119.91 0.49 16.94 17.43 15.05 44.28 59.33 2.28 10.49 12.77 0.30 1.88 2.18 1.59 295.00 296.59 0.21 90.65 90.86 1.59 99.21 100.80 0.21 45.00 45.21 11. Pluak Daeng High Voltage
Electricity Station 34.04 88.44 122.48 0.52 16.94 17.46 14.78 44.28 59.06 1.54 10.49 12.03 0.33 1.88 2.21 1.08 295.00 296.08 0.23 90.65 90.88 1.08 99.21 100.29 0.23 45.00 45.23
12. Wang Pradu Temple 35.58 73.95 109.53 0.48 12.03 12.51 17.96 7.86 25.82 2.49 5.24 7.73 0.27 1.28 1.55 1.74 295.00 296.74 0.19 90.65 90.84 1.74 109.00 110.74 0.19 33.49 33.68 13. Wang Pradu School (closed down) 35.52 73.95 109.47 0.48 12.03 12.51 17.44 7.86 25.30 2.49 5.24 7.73 0.27 1.28 1.55 1.73 295.00 296.73 0.19 90.65 90.84 1.73 109.00 110.73 0.19 33.49 33.68 14. Village no.5, Ban Khlong Plu 45.78 43.47 89.25 0.92 7.07 7.99 17.45 3.93 21.38 2.80 3.14 5.94 0.46 0.64 1.10 1.95 148.00 149.95 0.32 45.48 45.80 1.95 87.00 88.95 0.32 26.73 27.05 15. Village no.7, Ban Wang Pla 67.07 43.47 110.54 1.11 7.07 8.18 24.21 3.93 28.14 2.45 3.14 5.59 0.57 0.64 1.21 1.71 148.00 149.71 0.40 45.48 45.88 1.71 87.00 88.71 0.40 26.73 27.13
16. Village no.8 , Ban Soi 13 48.65 43.47 92.12 0.92 7.07 7.99 19.53 3.93 23.46 2.20 3.14 5.34 0.48 0.64 1.12 1.54 148.00 149.54 0.33 45.48 45.81 1.54 87.00 88.54 0.33 26.73 27.06 17. Village no.7, Ban Wang Pradu 34.75 73.95 108.70 0.49 12.03 12.52 16.60 7.86 24.46 2.40 5.24 7.64 0.28 1.28 1.56 1.67 295.00 296.67 0.19 90.65 90.84 1.67 109.00 110.67 0.19 33.49 33.68 18. Village no.4, Ban Khao Mapud 41.32 43.47 84.79 0.77 7.07 7.84 23.33 3.93 27.26 1.77 3.14 4.91 0.40 0.64 1.04 1.23 148.00 149.23 0.28 45.48 45.76 1.23 87.00 88.23 0.28 26.73 27.01 19. Village no.5, Ban Wang Tan Mon 56.14 45.73 101.87 1.25 7.44 8.69 22.73 6.03 28.76 3.44 4.45 7.89 0.69 0.98 1.67 2.40 153.00 155.40 0.48 47.01 47.49 2.40 88.00 90.40 0.48 27.04 27.52 20. Village no.1, Ban Map Toei 38.23 73.95 112.18 0.76 12.03 12.79 13.50 7.86 21.36 2.84 5.24 8.08 0.43 1.28 1.71 1.98 295.00 296.98 0.30 90.65 90.95 1.98 109.00 110.98 0.30 33.49 33.79 21. Village no.7, Ban Chak Oi 38.73 73.95 112.68 0.69 12.03 12.72 18.18 7.86 26.04 2.77 5.24 8.01 0.37 1.28 1.65 1.93 295.00 296.93 0.26 90.65 90.91 1.93 109.00 110.93 0.26 33.49 33.75 22. Village no.6, Ban Map Yang Mai 45.45 66.99 112.44 0.77 10.90 11.67 17.38 5.24 22.62 1.74 3.67 5.41 0.40 0.85 1.25 1.21 258.00 259.21 0.28 79.28 79.56 1.21 116.00 117.21 0.28 35.65 35.93 23. Village no.6, Ban Thab Tong 29.55 73.95 103.50 0.65 12.03 12.68 13.98 7.86 21.84 1.70 5.24 6.94 0.40 1.28 1.68 1.19 295.00 296.19 0.28 90.65 90.93 1.19 109.00 110.19 0.28 33.49 33.77 24. Village no.2, Ban Noen Sawan 44.32 55.14 99.46 1.74 8.97 10.71 18.91 4.45 23.36 3.54 3.41 6.95 0.88 0.72 1.60 2.47 177.00 179.47 0.62 54.39 55.01 2.47 112.00 114.47 0.62 34.42 35.04

Environmental Report for submission to ADB Chapter 5
Pluak Daeng Power Plant Anticipated Environmental Impacts and Mitigations
RNP/ENV/P05028/FR (ADB)/RE62049-chap 5 Page 5-58
TABLE 5.1.1-21 RESULTS OF THE PREDICTION OF AIR QUALITY BY USING THE AERMOD MODEL IN NORMAL CONDITION (WITH DOWNWASH EFFECT),
CASE 1: IMPACTS CAUSED BY PLUAK DAENG POWER PLANT PROJECT IN THE EVENT OF NATURAL GAS-FIRED OPERATION AT 100% LOAD ARE ASSESSED IN CONJUNCTION WITH RESULTS OF AMBIENT AIR QUALITY MONITORING (CONT’D)
Study Area
Estimated highest concentration levels of air pollutants in the case of impact from transporting activities (g/m3) 1-hour average NO2 1-year average NO2 1-hour average SO2 24-hour average SO2 1-year average SO2 24-hour average TSP 1-year average TSP 24-hour average PM-10 1-year average PM-10
Using the
model
Using existing
monitoring data 1/
Total Using the
model
Using existing
monitoring data 1/
Total Using the
model
Using existing
monitoring data 1/
Total Using the
model
Using existing
monitoring data 1/
Total Using the
model
Using existing
monitoring data 1/
Total Using the
model
Using existing
monitoring data 1/
Total Using the
model
Using existing
monitoring data 1/
Total Using the
model
Using existing
monitoring data 1/
Total Using the
model
Using existing
monitoring data 1/
Total
25. Village no.4, Ban Wang Ta Phin
40.05 73.95 114.00 0.69 12.03 12.72 15.14 7.86 23.00 1.75 5.24 6.99 0.40 1.28 1.68 1.22 295.00 296.22 0.28 90.65 90.93 1.22 109.00 110.22 0.28 33.49 33.77
26. Village no.3, Ban Map Yang Phon
53.30 55.14 108.44 1.34 8.97 10.31 20.88 4.45 25.33 2.69 3.41 6.10 0.61 0.72 1.33 1.88 177.00 178.88 0.42 54.39 54.81 1.88 112.00 113.88 0.42 34.42 34.84
27. Village no.6, Ban Nong Rakam
27.08 45.73 72.81 0.48 7.44 7.92 13.18 6.03 19.21 1.79 4.45 6.24 0.25 0.98 1.23 1.25 153.00 154.25 0.18 47.01 47.19 1.25 88.00 89.25 0.18 27.04 27.22
28. Village no.5, Ban Khlong Phlu
43.04 45.73 88.77 0.86 7.44 8.30 15.33 6.03 21.36 2.73 4.45 7.18 0.41 0.98 1.39 1.91 153.00 154.91 0.29 47.01 47.30 1.91 88.00 89.91 0.29 27.04 27.33
29. Village no.7, Ban Wang Pla 60.76 43.47 104.23 1.00 7.07 8.07 21.70 3.93 25.63 2.26 3.14 5.40 0.48 0.64 1.12 1.58 148.00 149.58 0.34 45.48 45.82 1.58 87.00 88.58 0.34 26.73 27.07 30. Village no.8 , Ban Soi 13 48.15 43.47 91.62 0.87 7.07 7.94 20.02 3.93 23.95 2.28 3.14 5.42 0.43 0.64 1.07 1.59 148.00 149.59 0.30 45.48 45.78 1.59 87.00 88.59 0.30 26.73 27.03 31. Village no.4, Ban Chak
Manthed 31.82 73.95 105.77 0.42 12.03 12.45 19.80 7.86 27.66 2.02 5.24 7.26 0.23 1.28 1.51 1.41 295.00 296.41 0.16 90.65 90.81 1.41 109.00 110.41 0.16 33.49 33.65
Standard value 2/ 320 57 780 300 100 330 100 120 50 WHO 3/ 200 40 - 20 - - - 50 20
Remark: 1/ Concerning Table 5.1.1-8: Highest values in the existing data on air quality monitoring which are used to represent each receptor’s air pollutant concentration level 2/ Concerning the standards in :
Announcement of the National Environment Board No.10 (1995) and No.24 (2004) on ambient air quality standard specification
Announcement of the National Environment Board No.21 (2001) on sulfur dioxide ambient concentration standard specification Announcement of the National Environment Board No.33 (2009) on nitrogen dioxide ambient concentration standard specification
3/ Referenced from WHO Ambient Air Quality Guidelines in Environmental, Health, and Safety (EHS) Guidelines for International Finance Corporation (2007) * Frequency of occurrence of NO2 concentration higher than 25 percent of a national standard is less than 1 percent of the study period (3 years). Source: Team Consulting Engineering and Management Co., Ltd., 2018

Environmental Report for submission to ADB Chapter 5
Pluak Daeng Power Plant Anticipated Environmental Impacts and Mitigations
RNP/ENV/P05028/FR (ADB)/RE62049-chap 5 Page 5-59
TABLE 5.1.1-22 RESULTS OF THE PREDICTION OF AIR QUALITY BY USING THE AERMOD MODEL IN NORMAL CONDITION (WITH DOWNWASH EFFECT),
CASE 2: IMPACTS CAUSED BY PLUAK DAENG POWER PLANT PROJECT IN THE EVENT OF NATURAL GAS-FIRED OPERATION AT MINIMUM LOAD ARE ASSESSED IN CONJUNCTION WITH RESULTS OF AMBIENT AIR QUALITY MONITORING
Study Area
Estimated highest concentration levels of air pollutants in the case of impact from transporting activities (g/m3) 1-hour average NO2 1-year average NO2 1-hour average SO2 24-hour average SO2 1-year average SO2 24-hour average TSP 1-year average TSP 24-hour average PM-10 1-year average PM-10
Using the
model
Using existing
monitoring data 1/
Total Using the
model
Using existing
monitoring data 1/
Total Using the
model
Using existing
monitoring data 1/
Total Using the
model
Using existing
monitoring data 1/
Total Using the
model
Using existing
monitoring data 1/
Total Using the
model
Using existing
monitoring data 1/
Total Using the
model
Using existing
monitoring data 1/
Total Using the
model
Using existing
monitoring data 1/
Total Using the
model
Using existing
monitoring data 1/
Total
Maximum concentration by model 163.15* 1.95 7.44 9.39 69.85 12.82 1.09 0.98 2.07 9.00 0.77 47.01 47.78 9.00 0.77 27.04 27.81 Grid reference 722328E, 1439114N 733728E, 1433914N 721328E, 1437614N 729328E, 1419114N 733828E, 1433714N 729328E, 1419114N 733828E, 1433714N 729328E, 1419114N 733828E, 1433714N Location Song Phi Nong Mountain Agricultural area nearby Pluak Daeng
Industrial Park Song Phi Nong Mountain Jom Hae Mountain Pluak Daeng Industrial Park area Jom Hae Mountain Pluak Daeng Industrial Park area Jom Hae Mountain Pluak Daeng Industrial Park area
Direction and distance from the project site
NW N NW SSW N SSW N SSW N 12.8 km 800 m 13.1 km 14.6 km 600 m 14.6 km 600 m 14.6 km 600 m
Land Use mountain Agricultural area mountain mountain Industrial area mountain Industrial area mountain Industrial area
Sensitive Area Using the
model
Using existing
monitoring data 1/
Total Using the
model
Using existing
monitoring data 1/
Total Using the
model
Using existing
monitoring data 1/
Total Using the
model
Using existing
monitoring data 1/
Total Using the
model
Using existing
monitoring data 1/
Total Using the
model
Using existing
monitoring data 1/
Total Using the
model
Using existing
monitoring data 1/
Total Using the
model
Using existing
monitoring data 1/
Total Using the
model
Using existing
monitoring data 1/
Total
1. Map Yang Phon Sub-district Administrative Organization
25.43 73.95 99.38 0.74 12.03 12.77 14.58 7.86 22.44 2.08 5.24 7.32 0.42 1.28 1.70 1.46 295.00 296.46 0.29 90.65 90.94 1.46 109.00 110.46 0.29 33.49 33.78
2. Ban Map Toei School 26.82 73.95 100.77 0.74 12.03 12.77 14.78 7.86 22.64 2.16 5.24 7.40 0.42 1.28 1.70 1.52 295.00 296.52 0.30 90.65 90.95 1.52 109.00 110.52 0.30 33.49 33.79 3. Map Toei Temple 29.00 73.95 102.95 0.75 12.03 12.78 14.75 7.86 22.61 2.23 5.24 7.47 0.43 1.28 1.71 1.56 295.00 296.56 0.30 90.65 90.95 1.56 109.00 110.56 0.30 33.49 33.79 4. Nikhom Sang Ton Eng 9 School 53.11 43.47 96.58 0.77 7.07 7.84 16.98 3.93 20.91 1.85 3.14 4.99 0.41 0.64 1.05 1.30 148.00 149.30 0.29 45.48 45.77 1.30 87.00 88.30 0.29 26.73 27.02 5. Prasitharam Temple 54.02 43.47 97.49 0.77 7.07 7.84 16.51 3.93 20.44 1.81 3.14 4.95 0.41 0.64 1.05 1.27 148.00 149.27 0.29 45.48 45.77 1.27 87.00 88.27 0.29 26.73 27.02 6. Map Yang Phon Sub-district
Health Promoting Hospital 43.50 55.14 98.64 0.61 8.97 9.58 17.50 4.45 21.95 1.50 3.41 4.91 0.30 0.72 1.02 1.05 177.00 178.05 0.21 54.39 54.60 1.05 112.00 113.05 0.21 34.42 34.63
7. Ban Map Yang Phon School 47.19 55.14 102.33 0.66 8.97 9.63 18.28 4.45 22.73 1.58 3.41 4.99 0.32 0.72 1.04 1.11 177.00 178.11 0.22 54.39 54.61 1.11 112.00 113.11 0.22 34.42 34.64 8. Map Yang Phon Temple 52.97 55.14 108.11 0.77 8.97 9.74 19.34 4.45 23.79 1.76 3.41 5.17 0.37 0.72 1.09 1.24 177.00 178.24 0.26 54.39 54.65 1.24 112.00 113.24 0.26 34.42 34.68 9. Pluak Daeng Sub-district
Administrative Organization 17.15 88.44 105.59 0.33 16.94 17.27 12.26 44.28 56.54 1.46 10.49 11.95 0.21 1.88 2.09 1.02 295.00 296.02 0.15 90.65 90.80 1.02 99.21 100.23 0.15 45.00 45.15
10. Orawin Witthaya School 25.46 88.44 113.90 0.33 16.94 17.27 11.84 44.28 56.12 1.67 10.49 12.16 0.21 1.88 2.09 1.17 295.00 296.17 0.15 90.65 90.80 1.17 99.21 100.38 0.15 45.00 45.15 11. Pluak Daeng High Voltage
Electricity Station 23.22 88.44 111.66 0.36 16.94 17.30 14.16 44.28 58.44 1.14 10.49 11.63 0.23 1.88 2.11 0.80 295.00 295.80 0.16 90.65 90.81 0.80 99.21 100.01 0.16 45.00 45.16
12. Wang Pradu Temple 25.10 73.95 99.05 0.33 12.03 12.36 14.17 7.86 22.03 1.90 5.24 7.14 0.19 1.28 1.47 1.34 295.00 296.34 0.13 90.65 90.78 1.34 109.00 110.34 0.13 33.49 33.62 13. Wang Pradu School (closed
down) 25.05 73.95 99.00 0.33 12.03 12.36 13.56 7.86 21.42 1.88 5.24 7.12 0.19 1.28 1.47 1.32 295.00 296.32 0.14 90.65 90.79 1.32 109.00 110.32 0.14 33.49 33.63
14. Village no.5, Ban Khlong Plu 38.03 43.47 81.50 0.67 7.07 7.74 13.94 3.93 17.87 2.28 3.14 5.42 0.34 0.64 0.98 1.60 148.00 149.60 0.24 45.48 45.72 1.60 87.00 88.60 0.24 26.73 26.97 15. Village no.7, Ban Wang Pla 54.09 43.47 97.56 0.81 7.07 7.88 17.16 3.93 21.09 1.78 3.14 4.92 0.43 0.64 1.07 1.25 148.00 149.25 0.30 45.48 45.78 1.25 87.00 88.25 0.30 26.73 27.03 16. Village no.8 , Ban Soi 13 38.94 43.47 82.41 0.65 7.07 7.72 17.18 3.93 21.11 1.70 3.14 4.84 0.35 0.64 0.99 1.20 148.00 149.20 0.25 45.48 45.73 1.20 87.00 88.20 0.25 26.73 26.98 17. Village no.7, Ban Wang Pradu 24.77 73.95 98.72 0.34 12.03 12.37 13.36 7.86 21.22 1.84 5.24 7.08 0.20 1.28 1.48 1.29 295.00 296.29 0.14 90.65 90.79 1.29 109.00 110.29 0.14 33.49 33.63 18. Village no.4, Ban Khao Mapud 30.55 43.47 74.02 0.54 7.07 7.61 17.25 3.93 21.18 1.55 3.14 4.69 0.29 0.64 0.93 1.09 148.00 149.09 0.20 45.48 45.68 1.09 87.00 88.09 0.20 26.73 26.93 19. Village no.5, Ban Wang Tan Mon 45.35 45.73 91.08 1.02 7.44 8.46 18.70 6.03 24.73 2.74 4.45 7.19 0.57 0.98 1.55 1.92 153.00 154.92 0.40 47.01 47.41 1.92 88.00 89.92 0.40 27.04 27.44 20. Village no.1, Ban Map Toei 30.53 73.95 104.48 0.60 12.03 12.63 10.86 7.86 18.72 2.34 5.24 7.58 0.35 1.28 1.63 1.65 295.00 296.65 0.24 90.65 90.89 1.65 109.00 110.65 0.24 33.49 33.73 21. Village no.7, Ban Chak Oi 29.75 73.95 103.70 0.49 12.03 12.52 14.17 7.86 22.03 2.09 5.24 7.33 0.27 1.28 1.55 1.47 295.00 296.47 0.19 90.65 90.84 1.47 109.00 110.47 0.19 33.49 33.68

Environmental Report for submission to ADB Chapter 5
Pluak Daeng Power Plant Anticipated Environmental Impacts and Mitigations
RNP/ENV/P05028/FR (ADB)/RE62049-chap 5 Page 5-60
TABLE 5.1.1-22 RESULTS OF THE PREDICTION OF AIR QUALITY BY USING THE AERMOD MODEL IN NORMAL CONDITION (WITH DOWNWASH EFFECT),
CASE 2: IMPACTS CAUSED BY PLUAK DAENG POWER PLANT PROJECT IN THE EVENT OF NATURAL GAS-FIRED OPERATION AT MINIMUM LOAD ARE ASSESSED IN CONJUNCTION WITH RESULTS OF AMBIENT AIR QUALITY MONITORING (CONT’D)
Study Area
Estimated highest concentration levels of air pollutants in the case of impact from transporting activities (g/m3) 1-hour average NO2 1-year average NO2 1-hour average SO2 24-hour average SO2 1-year average SO2 24-hour average TSP 1-year average TSP 24-hour average PM-10 1-year average PM-10
Using the
model
Using existing monitoring data
1/
Total Using the
model
Using existing monitoring data
1/
Total Using the
model
Using existing
monitoring data 1/
Total Using the
model
Using existing
monitoring data 1/
Total Using the
model
Using existing
monitoring data 1/
Total Using the model
Using existing
monitoring data 1/
Total Using the
model
Using existing
monitoring data 1/
Total Using the
model
Using existing
monitoring data 1/
Total Using the
model
Using existing
monitoring data 1/
Total
22. Village no.6, Ban Map Yang Mai
32.31 66.99 99.30 0.55 10.90 11.45 18.77 5.24 24.01 1.44 3.67 5.11 0.30 0.85 1.15 1.01 258.00 259.01 0.21 79.28 79.49 1.01 116.00 117.01 0.21 35.65 35.86
23. Village no.6, Ban Thab Tong
20.44 73.95 94.39 0.47 12.03 12.50 12.74 7.86 20.60 1.28 5.24 6.52 0.29 1.28 1.57 0.90 295.00 295.90 0.20 90.65 90.85 0.90 109.00 109.90 0.20 33.49 33.69
24. Village no.2, Ban Noen Sawan
41.69 55.14 96.83 1.41 8.97 10.38 17.26 4.45 21.71 2.93 3.41 6.34 0.73 0.72 1.45 2.06 177.00 179.06 0.51 54.39 54.90 2.06 112.00 114.06 0.51 34.42 34.93
25. Village no.4, Ban Wang Ta Phin
27.70 73.95 101.65 0.49 12.03 12.52 13.61 7.86 21.47 1.33 5.24 6.57 0.29 1.28 1.57 0.93 295.00 295.93 0.21 90.65 90.86 0.93 109.00 109.93 0.21 33.49 33.70
26. Village no.3, Ban Map Yang Phon
55.33 55.14 110.47 0.96 8.97 9.93 18.01 4.45 22.46 2.23 3.41 5.64 0.45 0.72 1.17 1.57 177.00 178.57 0.31 54.39 54.70 1.57 112.00 113.57 0.31 34.42 34.73
27. Village no.6, Ban Nong Rakam
22.54 45.73 68.27 0.33 7.44 7.77 13.50 6.03 19.53 1.32 4.45 5.77 0.18 0.98 1.16 0.93 153.00 153.93 0.13 47.01 47.14 0.93 88.00 88.93 0.13 27.04 27.17
28. Village no.5, Ban Khlong Phlu
37.21 45.73 82.94 0.60 7.44 8.04 15.20 6.03 21.23 2.09 4.45 6.54 0.30 0.98 1.28 1.47 153.00 154.47 0.21 47.01 47.22 1.47 88.00 89.47 0.21 27.04 27.25
29. Village no.7, Ban Wang Pla 46.99 43.47 90.46 0.70 7.07 7.77 16.59 3.93 20.52 1.64 3.14 4.78 0.35 0.64 0.99 1.15 148.00 149.15 0.25 45.48 45.73 1.15 87.00 88.15 0.25 26.73 26.98 30. Village no.8 , Ban Soi 13 38.36 43.47 81.83 0.60 7.07 7.67 16.72 3.93 20.65 1.87 3.14 5.01 0.31 0.64 0.95 1.31 148.00 149.31 0.22 45.48 45.70 1.31 87.00 88.31 0.22 26.73 26.95 31. Village no.4, Ban Chak
Manthed 26.46 73.95 100.41 0.28 12.03 12.31 15.93 7.86 23.79 1.43 5.24 6.67 0.16 1.28 1.44 1.00 295.00 296.00 0.11 90.65 90.76 1.00 109.00 110.00 0.11 33.49 33.60
Standard value 2/ 320 57 780 300 100 330 100 120 50 WHO 3/ 200 40 - 20 - - - 50 20
Remark: 1/ Concerning Table 5.1.1-8: Highest values in the existing data on air quality monitoring which are used to represent each receptor’s air pollutant concentration level 2/ Concerning the standards in :
Announcement of the National Environment Board No.10 (1995) and No.24 (2004) on ambient air quality standard specification
Announcement of the National Environment Board No.21 (2001) on sulfur dioxide ambient concentration standard specification Announcement of the National Environment Board No.33 (2009) on nitrogen dioxide ambient concentration standard specification
3/ Referenced from WHO Ambient Air Quality Guidelines in Environmental, Health, and Safety (EHS) Guidelines for International Finance Corporation (2007) * Frequency of occurrence of NO2 concentration higher than 25 percent of a national standard is less than 1 percent of the study period (3 years). Source: Team Consulting Engineering and Management Co., Ltd., 2018

Environmental Report for submission to ADB Chapter 5
Pluak Daeng Power Plant Anticipated Environmental Impacts and Mitigations
RNP/ENV/P05028/FR (ADB)/RE62049-chap 5 Page 5-61
TABLE 5.1.1-23 RESULTS OF THE PREDICTION OF AIR QUALITY BY USING THE AERMOD MODEL IN NORMAL CONDITION (WITH DOWNWASH EFFECT),
CASE 3: IMPACTS CAUSED BY PLUAK DAENG POWER PLANT PROJECT IN THE EVENT OF NATURAL GAS-FIRED OPERATION AT 100% LOAD; PLUS THE EXISTING IMPACTS CAUSED BY OTHER INDUSTRIAL PLANTS AS SPECIFIED IN THE ENVIRONMENTAL IMPACT ASSESSMENT REPORT THOUGH THERE IS NOT YET AIR POLLUTANT EMISSION WITHIN THE RADIUS OF 15 KILOMETERS FROM THE PROJECT
LOCATION; ARE ASSESSED IN CONJUNCTION WITH RESULTS OF AMBIENT AIR QUALITY MONITORING Study Area Estimated highest concentration levels of air pollutants in the case of impact from transporting activities (g/m3)
1-hour average NO2 1-year average NO2 1-hour average SO2 24-hour average SO2 1-year average SO2 24-hour average TSP 1-year average TSP 24-hour average PM-10 1-year average PM-10 Maximum concentration by model 254.09* 4.86 79.51 21.09 1.81 16.90 1.47 16.90 1.47 Grid reference 728828E, 1419114N 729328E, 1419614N 729328E, 1419114N 729328E, 1418614N 729328E, 1419614N 729328E, 1418614N 729328E, 1419614N 729328E, 1418614N 729328E, 1419614N Location Jom Hae Mountain Jom Hae Mountain Jom Hae Mountain Jom Hae Mountain Jom Hae Mountain Jom Hae Mountain Jom Hae Mountain Jom Hae Mountain Jom Hae Mountain Direction and distance from the project site
SSW SSW SSW SSW SSW SSW SSW SSW SSW 14.8 km 14.2 km 14.6 km 15.1 km 14.2 km 15.1 km 14.2 km 15.1 km 14.2 km
Land Use mountain mountain mountain mountain mountain mountain mountain mountain mountain
Sensitive Area Using the
model
Using existing
monitoring data 1/
Total Using the
model
Using existing
monitoring data 1/
Total Using the
model
Using existing
monitoring data 1/
Total Using the
model
Using existing
monitoring data 1/
Total Using the
model
Using existing
monitoring data 1/
Total Using the
model
Using existing
monitoring data 1/
Total Using the
model
Using existing
monitoring data 1/
Total Using the
model
Using existing
monitoring data 1/
Total Using the
model
Using existing
monitoring data 1/
Total
1. Map Yang Phon Sub-district Administrative Organization
54.83 73.95 128.78 2.02 12.03 14.05 17.67 7.86 25.53 2.65 5.24 7.89 0.66 1.28 1.94 1.88 295.00 296.88 0.53 90.65 91.18 1.88 109.00 110.88 0.53 33.49 34.02
2. Ban Map Toei School 54.71 73.95 128.66 2.01 12.03 14.04 17.67 7.86 25.53 2.72 5.24 7.96 0.66 1.28 1.94 1.93 295.00 296.93 0.53 90.65 91.18 1.93 109.00 110.93 0.53 33.49 34.02 3. Map Toei Temple 54.63 73.95 128.58 2.00 12.03 14.03 17.34 7.86 25.20 2.78 5.24 8.02 0.66 1.28 1.94 1.99 295.00 296.99 0.54 90.65 91.19 1.99 109.00 110.99 0.54 33.49 34.03 4. Nikhom Sang Ton Eng 9 School 92.80** 43.47 136.27 1.70 7.07 8.77 26.59 3.93 30.52 2.94 3.14 6.08 0.69 0.64 1.33 2.43 148.00 150.43 0.55 45.48 46.03 2.43 87.00 89.43 0.55 26.73 27.28 5. Prasitharam Temple 96.00** 43.47 139.47 1.73 7.07 8.80 27.69 3.93 31.62 2.90 3.14 6.04 0.69 0.64 1.33 2.40 148.00 150.40 0.54 45.48 46.02 2.40 87.00 89.40 0.54 26.73 27.27 6. Map Yang Phon Sub-district Health
Promoting Hospital 65.52 55.14 120.66 1.64 8.97 10.61 24.21 4.45 28.66 2.07 3.41 5.48 0.57 0.72 1.29 1.47 177.00 178.47 0.48 54.39 54.87 1.47 112.00 113.47 0.48 34.42 34.90
7. Ban Map Yang Phon School 68.74 55.14 123.88 1.72 8.97 10.69 24.95 4.45 29.40 2.17 3.41 5.58 0.61 0.72 1.33 1.54 177.00 178.54 0.50 54.39 54.89 1.54 112.00 113.54 0.50 34.42 34.92 8. Map Yang Phon Temple 70.79 55.14 125.93 1.91 8.97 10.88 25.58 4.45 30.03 2.45 3.41 5.86 0.68 0.72 1.40 1.73 177.00 178.73 0.56 54.39 54.95 1.73 112.00 113.73 0.56 34.42 34.98 9. Pluak Daeng Sub-district
Administrative Organization 49.31 88.44 137.75 1.13 16.94 18.07 17.46 44.28 61.74 2.02 10.49 12.51 0.40 1.88 2.28 1.45 295.00 296.45 0.32 90.65 90.97 1.45 99.21 100.66 0.32 45.00 45.32
10. Orawin Witthaya School 48.80 88.44 137.24 1.12 16.94 18.06 16.71 44.28 60.99 2.43 10.49 12.92 0.40 1.88 2.28 1.73 295.00 296.73 0.32 90.65 90.97 1.73 99.21 100.94 0.32 45.00 45.32 11. Pluak Daeng High Voltage
Electricity Station 57.60 88.44 146.04 1.52 16.94 18.46 15.41 44.28 59.69 1.78 10.49 12.27 0.46 1.88 2.34 1.36 295.00 296.36 0.39 90.65 91.04 1.36 99.21 100.57 0.39 45.00 45.39
12. Wang Pradu Temple 52.91 73.95 126.86 1.46 12.03 13.49 18.29 7.86 26.15 2.57 5.24 7.81 0.37 1.28 1.65 1.93 295.00 296.93 0.31 90.65 90.96 1.93 109.00 110.93 0.31 33.49 33.80 13. Wang Pradu School (closed down) 53.44 73.95 127.39 1.46 12.03 13.49 17.77 7.86 25.63 2.57 5.24 7.81 0.37 1.28 1.65 1.87 295.00 296.87 0.31 90.65 90.96 1.87 109.00 110.87 0.31 33.49 33.80 14. Village no.5, Ban Khlong Plu 71.49 43.47 114.96 1.74 7.07 8.81 20.21 3.93 24.14 3.28 3.14 6.42 0.59 0.64 1.23 2.56 148.00 150.56 0.47 45.48 45.95 2.56 87.00 89.56 0.47 26.73 27.20 15. Village no.7, Ban Wang Pla 98.23** 43.47 141.70 1.78 7.07 8.85 28.28 3.93 32.21 3.04 3.14 6.18 0.71 0.64 1.35 2.55 148.00 150.55 0.56 45.48 46.04 2.55 87.00 89.55 0.56 26.73 27.29 16. Village no.8 , Ban Soi 13 74.86 43.47 118.33 1.54 7.07 8.61 22.57 3.93 26.50 2.65 3.14 5.79 0.62 0.64 1.26 2.13 148.00 150.13 0.50 45.48 45.98 2.13 87.00 89.13 0.50 26.73 27.23 17. Village no.7, Ban Wang Pradu 53.37 73.95 127.32 1.51 12.03 13.54 16.93 7.86 24.79 2.48 5.24 7.72 0.38 1.28 1.66 1.77 295.00 296.77 0.32 90.65 90.97 1.77 109.00 110.77 0.32 33.49 33.81 18. Village no.4, Ban Khao Mapud 61.45 43.47 104.92 1.40 7.07 8.47 24.15 3.93 28.08 2.04 3.14 5.18 0.55 0.64 1.19 1.66 148.00 149.66 0.45 45.48 45.93 1.66 87.00 88.66 0.45 26.73 27.18 19. Village no.5, Ban Wang Tan Mon 82.95** 45.73 128.68 1.89 7.44 9.33 25.52 6.03 31.55 3.74 4.45 8.19 0.84 0.98 1.82 2.88 153.00 155.88 0.66 47.01 47.67 2.88 88.00 90.88 0.66 27.04 27.70 20. Village no.1, Ban Map Toei 62.24 73.95 136.19 1.87 12.03 13.90 14.19 7.86 22.05 2.88 5.24 8.12 0.57 1.28 1.85 2.02 295.00 297.02 0.46 90.65 91.11 2.02 109.00 111.02 0.46 33.49 33.95 21. Village no.7, Ban Chak Oi 64.65 73.95 138.60 1.92 12.03 13.95 18.92 7.86 26.78 2.94 5.24 8.18 0.48 1.28 1.76 2.09 295.00 297.09 0.39 90.65 91.04 2.09 109.00 111.09 0.39 33.49 33.88 22. Village no.6, Ban Map Yang Mai 52.54 66.99 119.53 1.50 10.90 12.40 17.70 5.24 22.94 1.94 3.67 5.61 0.56 0.85 1.41 1.43 258.00 259.43 0.47 79.28 79.75 1.43 116.00 117.43 0.47 35.65 36.12 23. Village no.6, Ban Thab Tong 74.65 73.95 148.60 1.89 12.03 13.92 14.75 7.86 22.61 1.87 5.24 7.11 0.53 1.28 1.81 1.42 295.00 296.42 0.44 90.65 91.09 1.42 109.00 110.42 0.44 33.49 33.93

Environmental Report for submission to ADB Chapter 5
Pluak Daeng Power Plant Anticipated Environmental Impacts and Mitigations
RNP/ENV/P05028/FR (ADB)/RE62049-chap 5 Page 5-62
TABLE 5.1.1-23 RESULTS OF THE PREDICTION OF AIR QUALITY BY USING THE AERMOD MODEL IN NORMAL CONDITION (WITH DOWNWASH EFFECT),
CASE 3: IMPACTS CAUSED BY PLUAK DAENG POWER PLANT PROJECT IN THE EVENT OF NATURAL GAS-FIRED OPERATION AT 100% LOAD; PLUS THE EXISTING IMPACTS CAUSED BY OTHER INDUSTRIAL PLANTS AS SPECIFIED IN THE ENVIRONMENTAL IMPACT ASSESSMENT REPORT THOUGH THERE IS NOT YET AIR POLLUTANT EMISSION WITHIN THE RADIUS OF 15 KILOMETERS FROM THE PROJECT
LOCATION; ARE ASSESSED IN CONJUNCTION WITH RESULTS OF AMBIENT AIR QUALITY MONITORING (CONT’D)
Study Area
Estimated highest concentration levels of air pollutants in the case of impact from transporting activities (g/m3) 1-hour average NO2 1-year average NO2 1-hour average SO2 24-hour average SO2 1-year average SO2 24-hour average TSP 1-year average TSP 24-hour average PM-10 1-year average PM-10
Using the
model
Using existing monitoring data
1/
Total Using the
model
Using existing monitoring data
1/
Total Using the
model
Using existing monitoring data
1/
Total Using the
model
Using existing monitoring data
1/
Total Using the
model
Using existing monitoring data
1/
Total Using the model
Using existing monitoring data
1/
Total Using the
model
Using existing monitoring data
1/
Total Using the model
Using existing monitoring data
1/
Total Using the
model
Using existing monitoring data
1/
Total
24. Village no.2, Ban Noen Sawan 54.53 55.14 109.67 2.61 8.97 11.58 19.47 4.45 23.92 3.59 3.41 7.00 1.06 0.72 1.78 2.53 177.00 179.53 0.83 54.39 55.22 2.53 112.00 114.53 0.83 34.42 35.25 25. Village no.4, Ban Wang Ta Phin 54.19 73.95 128.14 1.77 12.03 13.80 15.47 7.86 23.33 1.96 5.24 7.20 0.55 1.28 1.83 1.52 295.00 296.52 0.46 90.65 91.11 1.52 109.00 110.52 0.46 33.49 33.95 26. Village no.3, Ban Map Yang Phon 55.84 55.14 110.98 2.23 8.97 11.20 21.49 4.45 25.94 2.72 3.41 6.13 0.80 0.72 1.52 1.91 177.00 178.91 0.65 54.39 55.04 1.91 112.00 113.91 0.65 34.42 35.07 27. Village no.6, Ban Nong Rakam 50.13 45.73 95.86 1.38 7.44 8.82 13.53 6.03 19.56 2.38 4.45 6.83 0.35 0.98 1.33 2.04 153.00 155.04 0.30 47.01 47.31 2.04 88.00 90.04 0.30 27.04 27.34 28. Village no.5, Ban Khlong Phlu 70.29 45.73 116.02 1.65 7.44 9.09 19.36 6.03 25.39 3.17 4.45 7.62 0.53 0.98 1.51 2.58 153.00 155.58 0.43 47.01 47.44 2.58 88.00 90.58 0.43 27.04 27.47 29. Village no.7, Ban Wang Pla 93.43** 43.47 136.90 1.67 7.07 8.74 25.52 3.93 29.45 2.93 3.14 6.07 0.61 0.64 1.25 2.44 148.00 150.44 0.49 45.48 45.97 2.44 87.00 89.44 0.49 26.73 27.22 30. Village no.8 , Ban Soi 13 75.60 43.47 119.07 1.48 7.07 8.55 22.44 3.93 26.37 2.71 3.14 5.85 0.57 0.64 1.21 2.12 148.00 150.12 0.46 45.48 45.94 2.12 87.00 89.12 0.46 26.73 27.19 31. Village no.4, Ban Chak Manthed 56.90 73.95 130.85 1.06 12.03 13.09 20.07 7.86 27.93 2.11 5.24 7.35 0.31 1.28 1.59 1.52 295.00 296.52 0.25 90.65 90.90 1.52 109.00 110.52 0.25 33.49 33.74
Standard value 2/ 320 57 780 300 100 330 100 120 50 WHO 3/ 200 40 - 20 - - - 50 20
Remark: 1/ Concerning Table 5.1.1-8: Highest values in the existing data on air quality monitoring which are used to represent each receptor’s air pollutant concentration level 2/ Concerning the standards in :
Announcement of the National Environment Board No.10 (1995) and No.24 (2004) on ambient air quality standard specification
Announcement of the National Environment Board No.21 (2001) on sulfur dioxide ambient concentration standard specification Announcement of the National Environment Board No.33 (2009) on nitrogen dioxide ambient concentration standard specification
3/ Referenced from WHO Ambient Air Quality Guidelines in Environmental, Health, and Safety (EHS) Guidelines for International Finance Corporation (2007) * Frequency of occurrence of NO2 concentration higher than 25 percent of a national standard is less than 2 percent of the study period (3 years). ** Frequency of occurrence of NO2 concentration higher than 25 percent of a national standard is only one time. Source: Team Consulting Engineering and Management Co., Ltd., 2018

Environmental Report for submission to ADB Chapter 5 Pluak Daeng Power Plant Anticipated Environmental Impacts and Mitigations
RNP/ENV/P05028/FR (ADB)/RE62049-chap 5 Page 5-63
FIGURE 5.1.1-15 : CONTOUR MAP OF 1-HOUR AVERAGE NO2 CONCENTRATION CASE 3 WITHIN THE RADIUS OF 15 KILOMETERS FROM THE PROJECT

Environmental Report for submission to ADB Chapter 5 Pluak Daeng Power Plant Anticipated Environmental Impacts and Mitigations
RNP/ENV/P05028/FR (ADB)/RE62049-chap 5 Page 5-64
FIGURE 5.1.1-16 : CONTOUR MAP OF 1-YEAR AVERAGE NO2 CONCENTRATION CASE 3 WITHIN THE RADIUS OF 15 KILOMETERS FROM THE PROJECT

Environmental Report for submission to ADB Chapter 5 Pluak Daeng Power Plant Anticipated Environmental Impacts and Mitigations
RNP/ENV/P05028/FR (ADB)/RE62049-chap 5 Page 5-65
FIGURE 5.1.1-17 : CONTOUR MAP OF 1-HOUR AVERAGE SO2 CONCENTRATION CASE 3 WITHIN THE RADIUS OF 15 KILOMETERS FROM THE PROJECT
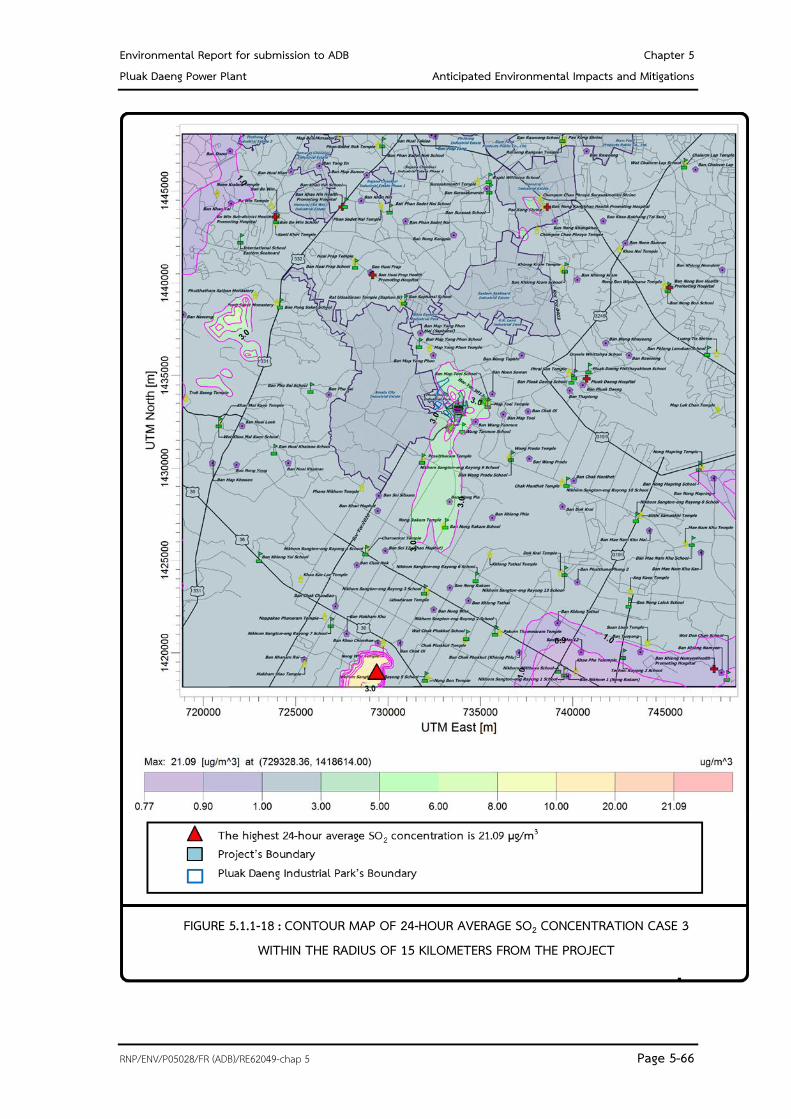
Environmental Report for submission to ADB Chapter 5 Pluak Daeng Power Plant Anticipated Environmental Impacts and Mitigations
RNP/ENV/P05028/FR (ADB)/RE62049-chap 5 Page 5-66
FIGURE 5.1.1-18 : CONTOUR MAP OF 24-HOUR AVERAGE SO2 CONCENTRATION CASE 3 WITHIN THE RADIUS OF 15 KILOMETERS FROM THE PROJECT

Environmental Report for submission to ADB Chapter 5 Pluak Daeng Power Plant Anticipated Environmental Impacts and Mitigations
RNP/ENV/P05028/FR (ADB)/RE62049-chap 5 Page 5-67
FIGURE 5.1.1-19 : CONTOUR MAP OF 1-YEAR AVERAGE SO2 CONCENTRATION CASE 3 WITHIN THE RADIUS OF 15 KILOMETERS FROM THE PROJECT

Environmental Report for submission to ADB Chapter 5 Pluak Daeng Power Plant Anticipated Environmental Impacts and Mitigations
RNP/ENV/P05028/FR (ADB)/RE62049-chap 5 Page 5-68
FIGURE 5.1.1-20 : CONTOUR MAP OF 24-HOUR AVERAGE TSP CONCENTRATION CASE 3 WITHIN THE RADIUS OF 15 KILOMETERS FROM THE PROJECT

Environmental Report for submission to ADB Chapter 5 Pluak Daeng Power Plant Anticipated Environmental Impacts and Mitigations
RNP/ENV/P05028/FR (ADB)/RE62049-chap 5 Page 5-69
FIGURE 5.1.1-21 : CONTOUR MAP OF 1-HOUR AVERAGE TSP CONCENTRATION CASE 3 WITHIN THE RADIUS OF 15 KILOMETERS FROM THE PROJECT

Environmental Report for submission to ADB Chapter 5 Pluak Daeng Power Plant Anticipated Environmental Impacts and Mitigations
RNP/ENV/P05028/FR (ADB)/RE62049-chap 5 Page 5-70
FIGURE 5.1.1-22 : CONTOUR MAP OF 24-HOUR AVERAGE PM-10 CONCENTRATION CASE 3 WITHIN THE RADIUS OF 15 KILOMETERS FROM THE PROJECT

Environmental Report for submission to ADB Chapter 5 Pluak Daeng Power Plant Anticipated Environmental Impacts and Mitigations
RNP/ENV/P05028/FR (ADB)/RE62049-chap 5 Page 5-71
FIGURE 5.1.1-23 : CONTOUR MAP OF 1-YEAR AVERAGE PM-10 CONCENTRATION CASE 3 WITHIN THE RADIUS OF 15 KILOMETERS FROM THE PROJECT

Environmental Report for submission to ADB Chapter 5 Pluak Daeng Power Plant Anticipated Environmental Impacts and Mitigations
RNP/ENV/P05028/FR (ADB)/RE62049-chap 5 Page 5-72
Case 4: Impacts caused by Pluak Daeng Power Plant Project in the event of diesel- fired operation at 100% load are assessed in conjunction with results of ambient air quality monitoring. The air quality assessment results of the operational period are shown in Table 5.1.1-24 and Appendix 5A-5.
Case 5: Impacts caused by Pluak Daeng Power Plant Project in the event of diesel- fired operation at minimum load are assessed in conjunction with results of ambient air quality monitoring. The air quality assessment results of the operational period are shown in Table 5.1.1-25 and Appendix 5A-5.
Case 6: Impacts caused by Pluak Daeng Power Plant Project in the event of diesel- fired operation at 100% load; plus the existing impacts caused by other industrial plants as specified in the environmental impact assessment report though there is not yet air pollutant emission within the radius of 15 kilometers from the project location; are assessed in conjunction with results of ambient air quality monitoring. The air quality assessment results of the operational period are shown in Table 5.1.1-26 and Figure 5.1.1-24 to Figure 5.1.1-32. Besides, the air pollutant values at the closest communities/properties to the project site are lower than the values stipulated in general ambient air quality standards. The details are as Appendix 5A-6

Environmental Report for submission to ADB Chapter 5
Pluak Daeng Power Plant Anticipated Environmental Impacts and Mitigations
RNP/ENV/P05028/FR (ADB)/RE62049-chap 5 Page 5-73
TABLE 5.1.1-24 RESULTS OF THE PREDICTION OF AIR QUALITY BY USING THE AERMOD MODEL IN NORMAL CONDITION (WITH DOWNWASH EFFECT),
CASE 4: IMPACTS CAUSED BY PLUAK DAENG POWER PLANT PROJECT IN THE EVENT OF DIESEL-FIRED OPERATION AT 100% LOAD ARE ASSESSED IN CONJUNCTION WITH RESULTS OF AMBIENT AIR QUALITY MONITORING
Study Area Estimated highest concentration levels of air pollutants in the case of impact from transporting activities (g/m3) 1-hour average NO2 1-year average NO2 1-hour average SO2 24-hour average SO2 1-year average SO2 24-hour average TSP 1-year average TSP 24-hour average PM-10 1-year average PM-10
Maximum concentration by model 263.70* 3.20 108.68 26.10 2.10 16.03 1.29 13.16 1.06 Grid reference 720828E, 1437614N 729328E, 1419614N 721328E, 1437614N 729328E, 1418614N 729328E, 1419614N 729328E, 1418614N 729328E, 1419614N 729328E, 1418614N 729328E, 1419614N Location Song Phi Nong Mountain Jom Hae Mountain Song Phi Nong Mountain Jom Hae Mountain Jom Hae Mountain Jom Hae Mountain Jom Hae Mountain Jom Hae Mountain Jom Hae Mountain
Direction and distance from the project site
NW SSW NW SSW SSW SSW SSW SSW SSW 13.6 km 14.2 km 13.1 km 15.1 km 14.2 km 15.1 km 14.2 km 15.1 km 14.2 km
Land Use mountain mountain mountain mountain mountain mountain mountain mountain mountain
Sensitive Area Using the
model
Using existing
monitoring data 1/
Total Using the
model
Using existing
monitoring data 1/
Total Using the
model
Using existing
monitoring data 1/
Total Using the
model
Using existing
monitoring data 1/
Total Using the
model
Using existing
monitoring data 1/
Total Using the
model
Using existing
monitoring data 1/
Total Using the
model
Using existing
monitoring data 1/
Total Using the
model
Using existing
monitoring data 1/
Total Using the
model
Using existing
monitoring data 1/
Total
1. Map Yang Phon Sub-district Administrative Organization
41.59 73.95 115.54 1.15 12.03 13.18 25.03 7.86 32.89 3.76 5.24 9.00 0.76 1.28 2.04 2.31 295.00 297.31 0.47 90.65 91.12 1.90 109.00 110.90 0.39 33.49 33.88
2. Ban Map Toei School 42.48 73.95 116.43 1.15 12.03 13.18 25.01 7.86 32.87 3.86 5.24 9.10 0.77 1.28 2.05 2.37 295.00 297.37 0.47 90.65 91.12 1.95 109.00 110.95 0.39 33.49 33.88 3. Map Toei Temple 43.54 73.95 117.49 1.15 12.03 13.18 24.45 7.86 32.31 4.00 5.24 9.24 0.78 1.28 2.06 2.46 295.00 297.46 0.48 90.65 91.13 2.02 109.00 111.02 0.39 33.49 33.88 4. Nikhom Sang Ton Eng 9 School 81.58** 43.47 125.05 1.34 7.07 8.41 35.76 3.93 39.69 3.73 3.14 6.87 0.82 0.64 1.46 2.29 148.00 150.29 0.51 45.48 45.99 1.88 87.00 88.88 0.41 26.73 27.14 5. Prasitharam Temple 84.13** 43.47 127.60 1.35 7.07 8.42 35.56 3.93 39.49 3.66 3.14 6.80 0.82 0.64 1.46 2.25 148.00 150.25 0.50 45.48 45.98 1.85 87.00 88.85 0.41 26.73 27.14 6. Map Yang Phon Sub-district
Health Promoting Hospital 74.66 55.14 129.80 1.14 8.97 10.11 35.84 4.45 40.29 3.03 3.41 6.44 0.63 0.72 1.35 1.86 177.00 178.86 0.39 54.39 54.78 1.53 112.00 113.53 0.32 34.42 34.74
7. Ban Map Yang Phon School 79.93 55.14 135.07 1.21 8.97 10.18 36.96 4.45 41.41 3.19 3.41 6.60 0.67 0.72 1.39 1.96 177.00 178.96 0.41 54.39 54.80 1.61 112.00 113.61 0.34 34.42 34.76 8. Map Yang Phon Temple 84.88** 55.14 140.02 1.40 8.97 10.37 38.02 4.45 42.47 3.61 3.41 7.02 0.77 0.72 1.49 2.22 177.00 179.22 0.47 54.39 54.86 1.82 112.00 113.82 0.39 34.42 34.81 9. Pluak Daeng Sub-district
Administrative Organization 30.80 88.44 119.24 0.61 16.94 17.55 23.93 44.28 68.21 2.80 10.49 13.29 0.45 1.88 2.33 1.72 295.00 296.72 0.28 90.65 90.93 1.41 99.21 100.62 0.23 45.00 45.23
10. Orawin Witthaya School 39.61 88.44 128.05 0.62 16.94 17.56 22.82 44.28 67.10 3.44 10.49 13.93 0.46 1.88 2.34 2.11 295.00 297.11 0.28 90.65 90.93 1.73 99.21 100.94 0.23 45.00 45.23 11. Pluak Daeng High Voltage
Electricity Station 42.90 88.44 131.34 0.66 16.94 17.60 22.27 44.28 66.55 2.33 10.49 12.82 0.50 1.88 2.38 1.43 295.00 296.43 0.31 90.65 90.96 1.17 99.21 100.38 0.25 45.00 45.25
12. Wang Pradu Temple 44.70 73.95 118.65 0.60 12.03 12.63 27.12 7.86 34.98 3.74 5.24 8.98 0.40 1.28 1.68 2.30 295.00 297.30 0.25 90.65 90.90 1.89 109.00 110.89 0.20 33.49 33.69 13. Wang Pradu School (closed
down) 44.63 73.95 118.58 0.61 12.03 12.64 26.33 7.86 34.19 3.74 5.24 8.98 0.41 1.28 1.69 2.30 295.00 297.30 0.25 90.65 90.90 1.88 109.00 110.88 0.20 33.49 33.69
14. Village no.5, Ban Khlong Plu 57.65 43.47 101.12 1.16 7.07 8.23 26.19 3.93 30.12 4.21 3.14 7.35 0.69 0.64 1.33 2.59 148.00 150.59 0.42 45.48 45.90 2.12 87.00 89.12 0.35 26.73 27.08 15. Village no.7, Ban Wang Pla 84.67** 43.47 128.14 1.40 7.07 8.47 36.65 3.93 40.58 3.70 3.14 6.84 0.86 0.64 1.50 2.27 148.00 150.27 0.53 45.48 46.01 1.87 87.00 88.87 0.43 26.73 27.16 16. Village no.8 , Ban Soi 13 61.36 43.47 104.83 1.15 7.07 8.22 29.53 3.93 33.46 3.31 3.14 6.45 0.72 0.64 1.36 2.04 148.00 150.04 0.44 45.48 45.92 1.67 87.00 88.67 0.36 26.73 27.09 17. Village no.7, Ban Wang Pradu 43.63 73.95 117.58 0.62 12.03 12.65 25.08 7.86 32.94 3.61 5.24 8.85 0.42 1.28 1.70 2.22 295.00 297.22 0.26 90.65 90.91 1.82 109.00 110.82 0.21 33.49 33.70 18. Village no.4, Ban Khao Mapud 52.09 43.47 95.56 0.96 7.07 8.03 35.14 3.93 39.07 2.66 3.14 5.80 0.60 0.64 1.24 1.63 148.00 149.63 0.37 45.48 45.85 1.34 87.00 88.34 0.30 26.73 27.03 19. Village no.5, Ban Wang Tan
Mon 70.80 45.73 116.53 1.58 7.44 9.02 34.37 6.03 40.40 5.25 4.45 9.70 1.04 0.98 2.02 3.23 153.00 156.23 0.64 47.01 47.65 2.65 88.00 90.65 0.52 27.04 27.56
20. Village no.1, Ban Map Toei 48.13 73.95 122.08 0.95 12.03 12.98 20.27 7.86 28.13 4.25 5.24 9.49 0.65 1.28 1.93 2.61 295.00 297.61 0.40 90.65 91.05 2.14 109.00 111.14 0.33 33.49 33.82 21. Village no.7, Ban Chak Oi 48.71 73.95 122.66 0.87 12.03 12.90 27.41 7.86 35.27 4.17 5.24 9.41 0.56 1.28 1.84 2.56 295.00 297.56 0.34 90.65 90.99 2.10 109.00 111.10 0.28 33.49 33.77 22. Village no.6, Ban Map Yang Mai 57.21 66.99 124.20 0.97 10.90 11.87 26.12 5.24 31.36 2.62 3.67 6.29 0.60 0.85 1.45 1.61 258.00 259.61 0.37 79.28 79.65 1.32 116.00 117.32 0.30 35.65 35.95 23. Village no.6, Ban Thab Tong 37.21 73.95 111.16 0.82 12.03 12.85 21.01 7.86 28.87 2.56 5.24 7.80 0.59 1.28 1.87 1.57 295.00 296.57 0.37 90.65 91.02 1.29 109.00 110.29 0.30 33.49 33.79

Environmental Report for submission to ADB Chapter 5
Pluak Daeng Power Plant Anticipated Environmental Impacts and Mitigations
RNP/ENV/P05028/FR (ADB)/RE62049-chap 5 Page 5-74
TABLE 5.1.1-24 RESULTS OF THE PREDICTION OF AIR QUALITY BY USING THE AERMOD MODEL IN NORMAL CONDITION (WITH DOWNWASH EFFECT),
CASE 4: IMPACTS CAUSED BY PLUAK DAENG POWER PLANT PROJECT IN THE EVENT OF DIESEL-FIRED OPERATION AT 100% LOAD ARE ASSESSED IN CONJUNCTION WITH RESULTS OF AMBIENT AIR QUALITY MONITORING (CONT’D)
Study Area
Estimated highest concentration levels of air pollutants in the case of impact from transporting activities (g/m3) 1-hour average NO2 1-year average NO2 1-hour average SO2 24-hour average SO2 1-year average SO2 24-hour average TSP 1-year average TSP 24-hour average PM-10 1-year average PM-10
Using the
model
Using existing
monitoring data 1/
Total Using the
model
Using existing
monitoring data 1/
Total Using the
model
Using existing
monitoring data 1/
Total Using the
model
Using existing
monitoring data 1/
Total Using the
model
Using existing
monitoring data 1/
Total Using the
model
Using existing
monitoring data 1/
Total Using the
model
Using existing
monitoring data 1/
Total Using the
model
Using existing
monitoring data 1/
Total Using the
model
Using existing
monitoring data 1/
Total
24. Village no.2, Ban Noen Sawan
55.77 55.14 110.91 2.18 8.97 11.15 28.47 4.45 32.92 5.33 3.41 8.74 1.33 0.72 2.05 3.28 177.00 180.28 0.82 54.39 55.21 2.69 112.00 114.69 0.67 34.42 35.09
25. Village no.4, Ban Wang Ta Phin
50.44 73.95 124.39 0.87 12.03 12.90 22.75 7.86 30.61 2.63 5.24 7.87 0.60 1.28 1.88 1.61 295.00 296.61 0.37 90.65 91.02 1.33 109.00 110.33 0.30 33.49 33.79
26. Village no.3, Ban Map Yang Phon
66.92 55.14 122.06 1.68 8.97 10.65 31.50 4.45 35.95 4.05 3.41 7.46 0.91 0.72 1.63 2.49 177.00 179.49 0.56 54.39 54.95 2.04 112.00 114.04 0.46 34.42 34.88
27. Village no.6, Ban Nong Rakam
34.08 45.73 79.81 0.61 7.44 8.05 19.84 6.03 25.87 2.70 4.45 7.15 0.38 0.98 1.36 1.66 153.00 154.66 0.23 47.01 47.24 1.36 88.00 89.36 0.19 27.04 27.23
28. Village no.5, Ban Khlong Phlu
54.17 45.73 99.90 1.08 7.44 8.52 23.21 6.03 29.24 4.12 4.45 8.57 0.62 0.98 1.60 2.53 153.00 155.53 0.38 47.01 47.39 2.08 88.00 90.08 0.31 27.04 27.35
29. Village no.7, Ban Wang Pla 76.68 43.47 120.15 1.26 7.07 8.33 32.84 3.93 36.77 3.42 3.14 6.56 0.73 0.64 1.37 2.10 148.00 150.10 0.45 45.48 45.93 1.72 87.00 88.72 0.37 26.73 27.10 30. Village no.8 , Ban Soi 13 60.71 43.47 104.18 1.09 7.07 8.16 30.21 3.93 34.14 3.43 3.14 6.57 0.65 0.64 1.29 2.11 148.00 150.11 0.40 45.48 45.88 1.73 87.00 88.73 0.33 26.73 27.06 31. Village no.4, Ban Chak
Manthed 40.02 73.95 113.97 0.53 12.03 12.56 29.84 7.86 37.70 3.05 5.24 8.29 0.34 1.28 1.62 1.87 295.00 296.87 0.21 90.65 90.86 1.54 109.00 110.54 0.17 33.49 33.66
Standard value 2/ 320 57 780 300 100 330 100 120 50 WHO 3/ 200 40 - 20 - - - 50 20
Remark: 1/ Concerning Table 5.1.1-8: Highest values in the existing data on air quality monitoring which are used to represent each receptor’s air pollutant concentration level 2/ Concerning the standards in :
Announcement of the National Environment Board No.10 (1995) and No.24 (2004) on ambient air quality standard specification
Announcement of the National Environment Board No.21 (2001) on sulfur dioxide ambient concentration standard specification Announcement of the National Environment Board No.33 (2009) on nitrogen dioxide ambient concentration standard specification
3/ Referenced from WHO Ambient Air Quality Guidelines in Environmental, Health, and Safety (EHS) Guidelines for International Finance Corporation (2007) * Frequency of occurrence of NO2 concentration higher than 25 percent of a national standard is less than 1 percent of the study period (3 years). ** Frequency of occurrence of NO2 concentration higher than 25 percent of a national standard is only one time. Source: Team Consulting Engineering and Management Co., Ltd., 2018

Environmental Report for submission to ADB Chapter 5
Pluak Daeng Power Plant Anticipated Environmental Impacts and Mitigations
RNP/ENV/P05028/FR (ADB)/RE62049-chap 5 Page 5-75
TABLE 5.1.1-25 RESULTS OF THE PREDICTION OF AIR QUALITY BY USING THE AERMOD MODEL IN NORMAL CONDITION (WITH DOWNWASH EFFECT)
CASE 5: IMPACTS CAUSED BY PLUAK DAENG POWER PLANT PROJECT IN THE EVENT OF DIESEL-FIRED OPERATION AT MINIMUM LOAD ARE ASSESSED IN CONJUNCTION WITH RESULTS OF AMBIENT AIR QUALITY MONITORING
Study Area Estimated highest concentration levels of air pollutants in the case of impact from transporting activities (g/m3)
1-hour average NO2 1-year average NO2 1-hour average SO2 24-hour average SO2 1-year average SO2 24-hour average TSP 1-year average TSP 24-hour average PM-10 1-year average PM-10 Maximum concentration by model 246.34* 2.89 7.44 10.33 113.97 24.43 1.94 0.98 2.92 14.71 1.17 47.01 48.18 12.06 0.96 27.04 28.00 Grid reference 721328E, 1438114N 733728E, 1433914N 722328E, 1436114N 729328E, 1419114N 733828E, 1433814N 729328E, 1419114N 733828E, 1433814N 729328E, 1419114N 733828E, 1433814N Location Song Phi Nong Mountain Agricultural area nearby Pluak
Daeng Industrial Park Song Phi Nong Mountain Jom Hae Mountain Idel land nearby Pluak Daeng
Industrial Park Jom Hae Mountain Idel land nearby Pluak Daeng
Industrial Park Jom Hae Mountain Idel land nearby Pluak Daeng
Industrial Park Direction and distance from the project site
NW N NW SSW N SSW N SSW N 13.3 km 800 m 11.7 km 14.6 km 700 m 14.6 km 700 m 14.6 km 700 m
Land Use mountain Agricultural area mountain mountain Idel land mountain Idel land mountain Idel land
Sensitive Area Using the
model
Using existing
monitoring data 1/
Total Using the
model
Using existing
monitoring data 1/
Total Using the
model
Using existing
monitoring data 1/
Total Using the
model
Using existing
monitoring data 1/
Total Using the
model
Using existing
monitoring data 1/
Total Using the
model
Using existing
monitoring data 1/
Total Using the
model
Using existing
monitoring data 1/
Total Using the
model
Using existing
monitoring data 1/
Total Using the
model
Using existing
monitoring data 1/
Total
1. Map Yang Phon Sub-district Administrative Organization
39.16 73.95 113.11 1.15 12.03 13.18 26.94 7.86 34.80 3.90 5.24 9.14 0.78 1.28 2.06 2.35 295.00 297.35 0.47 90.65 91.12 1.93 109.00 110.93 0.39 33.49 33.88
2. Ban Map Toei School 41.35 73.95 115.30 1.16 12.03 13.19 27.18 7.86 35.04 4.04 5.24 9.28 0.79 1.28 2.07 2.43 295.00 297.43 0.48 90.65 91.13 1.99 109.00 110.99 0.39 33.49 33.88 3. Map Toei Temple 44.50 73.95 118.45 1.17 12.03 13.20 26.95 7.86 34.81 4.15 5.24 9.39 0.80 1.28 2.08 2.50 295.00 297.50 0.48 90.65 91.13 2.05 109.00 111.05 0.40 33.49 33.89 4. Nikhom Sang Ton Eng 9 School 83.01** 43.47 126.48 1.25 7.07 8.32 33.57 3.93 37.50 3.57 3.14 6.71 0.79 0.64 1.43 2.15 148.00 150.15 0.48 45.48 45.96 1.76 87.00 88.76 0.39 26.73 27.12 5. Prasitharam Temple 84.69** 43.47 128.16 1.26 7.07 8.33 32.95 3.93 36.88 3.50 3.14 6.64 0.79 0.64 1.43 2.11 148.00 150.11 0.48 45.48 45.96 1.73 87.00 88.73 0.39 26.73 27.12 6. Map Yang Phon Sub-district
Health Promoting Hospital 70.49 55.14 125.63 1.02 8.97 9.99 34.43 4.45 38.88 2.92 3.41 6.33 0.59 0.72 1.31 1.76 177.00 178.76 0.35 54.39 54.74 1.44 112.00 113.44 0.29 34.42 34.71
7. Ban Map Yang Phon School 76.14 55.14 131.28 1.09 8.97 10.06 35.79 4.45 40.24 3.08 3.41 6.49 0.63 0.72 1.35 1.85 177.00 178.85 0.38 54.39 54.77 1.52 112.00 113.52 0.31 34.42 34.73 8. Map Yang Phon Temple 84.03** 55.14 139.17 1.27 8.97 10.24 37.54 4.45 41.99 3.45 3.41 6.86 0.73 0.72 1.45 2.08 177.00 179.08 0.44 54.39 54.83 1.70 112.00 113.70 0.36 34.42 34.78 9. Pluak Daeng Sub-district
Administrative Organization 28.17 88.44 116.61 0.54 16.94 17.48 23.78 44.28 68.06 2.80 10.49 13.29 0.42 1.88 2.30 1.69 295.00 296.69 0.25 90.65 90.90 1.38 99.21 100.59 0.21 45.00 45.21
10. Orawin Witthaya School 38.86 88.44 127.30 0.55 16.94 17.49 22.89 44.28 67.17 3.24 10.49 13.73 0.42 1.88 2.30 1.95 295.00 296.95 0.25 90.65 90.90 1.60 99.21 100.81 0.21 45.00 45.21 11. Pluak Daeng High Voltage
Electricity Station 38.46 88.44 126.90 0.59 16.94 17.53 25.10 44.28 69.38 2.23 10.49 12.72 0.46 1.88 2.34 1.34 295.00 296.34 0.28 90.65 90.93 1.10 99.21 100.31 0.23 45.00 45.23
12. Wang Pradu Temple 41.06 73.95 115.01 0.54 12.03 12.57 25.53 7.86 33.39 3.67 5.24 8.91 0.38 1.28 1.66 2.21 295.00 297.21 0.23 90.65 90.88 1.81 109.00 110.81 0.19 33.49 33.68 13. Wang Pradu School (closed
down) 40.98 73.95 114.93 0.55 12.03 12.58 24.88 7.86 32.74 3.65 5.24 8.89 0.38 1.28 1.66 2.20 295.00 297.20 0.23 90.65 90.88 1.80 109.00 110.80 0.19 33.49 33.68
14. Village no.5, Ban Khlong Plu 57.26 43.47 100.73 1.08 7.07 8.15 26.65 3.93 30.58 4.29 3.14 7.43 0.67 0.64 1.31 2.58 148.00 150.58 0.40 45.48 45.88 2.12 87.00 89.12 0.33 26.73 27.06 15. Village no.7, Ban Wang Pla 84.55** 43.47 128.02 1.31 7.07 8.38 34.26 3.93 38.19 3.43 3.14 6.57 0.83 0.64 1.47 2.06 148.00 150.06 0.50 45.48 45.98 1.69 87.00 88.69 0.41 26.73 27.14 16. Village no.8 , Ban Soi 13 59.95 43.47 103.42 1.06 7.07 8.13 29.95 3.93 33.88 3.22 3.14 6.36 0.69 0.64 1.33 1.94 148.00 149.94 0.41 45.48 45.89 1.59 87.00 88.59 0.34 26.73 27.07 17. Village no.7, Ban Wang Pradu 40.28 73.95 114.23 0.57 12.03 12.60 24.65 7.86 32.51 3.55 5.24 8.79 0.39 1.28 1.67 2.14 295.00 297.14 0.24 90.65 90.89 1.75 109.00 110.75 0.19 33.49 33.68 18. Village no.4, Ban Khao Mapud 48.34 43.47 91.81 0.88 7.07 7.95 32.78 3.93 36.71 2.87 3.14 6.01 0.57 0.64 1.21 1.73 148.00 149.73 0.34 45.48 45.82 1.42 87.00 88.42 0.28 26.73 27.01 19. Village no.5, Ban Wang Tan Mon 70.68 45.73 116.41 1.58 7.44 9.02 35.42 6.03 41.45 5.25 4.45 9.70 1.06 0.98 2.04 3.16 153.00 156.16 0.64 47.01 47.65 2.59 88.00 90.59 0.53 27.04 27.57 20. Village no.1, Ban Map Toei 46.53 73.95 120.48 0.94 12.03 12.97 20.55 7.86 28.41 4.41 5.24 9.65 0.65 1.28 1.93 2.65 295.00 297.65 0.39 90.65 91.04 2.18 109.00 111.18 0.32 33.49 33.81 21. Village no.7, Ban Chak Oi 47.41 73.95 121.36 0.80 12.03 12.83 27.23 7.86 35.09 4.05 5.24 9.29 0.53 1.28 1.81 2.44 295.00 297.44 0.32 90.65 90.97 2.00 109.00 111.00 0.26 33.49 33.75 22. Village no.6, Ban Map Yang Mai 52.99 66.99 119.98 0.90 10.90 11.80 34.23 5.24 39.47 2.70 3.67 6.37 0.58 0.85 1.43 1.63 258.00 259.63 0.35 79.28 79.63 1.33 116.00 117.33 0.29 35.65 35.94 23. Village no.6, Ban Thab Tong 33.78 73.95 107.73 0.76 12.03 12.79 21.56 7.86 29.42 2.49 5.24 7.73 0.57 1.28 1.85 1.50 295.00 296.50 0.34 90.65 90.99 1.23 109.00 110.23 0.28 33.49 33.77

Environmental Report for submission to ADB Chapter 5
Pluak Daeng Power Plant Anticipated Environmental Impacts and Mitigations
RNP/ENV/P05028/FR (ADB)/RE62049-chap 5 Page 5-76
TABLE 5.1.1-25 RESULTS OF THE PREDICTION OF AIR QUALITY BY USING THE AERMOD MODEL IN NORMAL CONDITION (WITH DOWNWASH EFFECT)
CASE 5: IMPACTS CAUSED BY PLUAK DAENG POWER PLANT PROJECT IN THE EVENT OF DIESEL-FIRED OPERATION AT MINIMUM LOAD ARE ASSESSED IN CONJUNCTION WITH RESULTS OF AMBIENT AIR QUALITY MONITORING (CONT’D)
Study Area
Estimated highest concentration levels of air pollutants in the case of impact from transporting activities (g/m3) 1-hour average NO2 1-year average NO2 1-hour average SO2 24-hour average SO2 1-year average SO2 24-hour average TSP 1-year average TSP 24-hour average PM-10 1-year average PM-10
Using the
model
Using existing
monitoring data 1/
Total Using the
model
Using existing
monitoring data 1/
Total Using the
model
Using existing
monitoring data 1/
Total Using the
model
Using existing
monitoring data 1/
Total Using the
model
Using existing
monitoring data 1/
Total Using the
model
Using existing
monitoring data 1/
Total Using the
model
Using existing
monitoring data 1/
Total Using the
model
Using existing
monitoring data 1/
Total Using the
model
Using existing
monitoring data 1/
Total
24. Village no.2, Ban Noen Sawan 59.50 55.14 114.64 2.19 8.97 11.16 31.64 4.45 36.09 5.38 3.41 8.79 1.36 0.72 2.08 3.24 177.00 180.24 0.82 54.39 55.21 2.65 112.00 114.65 0.67 34.42 35.09 25. Village no.4, Ban Wang Ta
Phin 45.65 73.95 119.60 0.81 12.03 12.84 25.34 7.86 33.20 2.56 5.24 7.80 0.57 1.28 1.85 1.54 295.00 296.54 0.35 90.65 91.00 1.26 109.00 110.26 0.28 33.49 33.77
26. Village no.3, Ban Map Yang Phon
79.33 55.14 134.47 1.56 8.97 10.53 31.23 4.45 35.68 4.19 3.41 7.60 0.87 0.72 1.59 2.52 177.00 179.52 0.53 54.39 54.92 2.07 112.00 114.07 0.43 34.42 34.85
27. Village no.6, Ban Nong Rakam 34.80 45.73 80.53 0.55 7.44 7.99 23.99 6.03 30.02 2.58 4.45 7.03 0.35 0.98 1.33 1.56 153.00 154.56 0.21 47.01 47.22 1.28 88.00 89.28 0.17 27.04 27.21 28. Village no.5, Ban Khlong
Phlu 56.63 45.73 102.36 0.98 7.44 8.42 26.85 6.03 32.88 4.04 4.45 8.49 0.59 0.98 1.57 2.43 153.00 155.43 0.36 47.01 47.37 1.99 88.00 89.99 0.29 27.04 27.33
29. Village no.7, Ban Wang Pla 74.86 43.47 118.33 1.15 7.07 8.22 30.20 3.93 34.13 3.22 3.14 6.36 0.69 0.64 1.33 1.94 148.00 149.94 0.42 45.48 45.90 1.59 87.00 88.59 0.34 26.73 27.07 30. Village no.8 , Ban Soi 13 60.52 43.47 103.99 0.99 7.07 8.06 30.74 3.93 34.67 3.52 3.14 6.66 0.61 0.64 1.25 2.12 148.00 150.12 0.37 45.48 45.85 1.74 87.00 88.74 0.30 26.73 27.03 31. Village no.4, Ban Chak
Manthed 41.20 73.95 115.15 0.47 12.03 12.50 30.70 7.86 38.56 2.80 5.24 8.04 0.32 1.28 1.60 1.68 295.00 296.68 0.19 90.65 90.84 1.38 109.00 110.38 0.16 33.49 33.65
Standard value 2/ 320 57 780 300 100 330 100 120 50 WHO 3/ 200 40 - 20 - - - 50 20
Remark: 1/ Concerning Table 5.1.1-8: Highest values in the existing data on air quality monitoring which are used to represent each receptor’s air pollutant concentration level 2/ Concerning the standards in :
Announcement of the National Environment Board No.10 (1995) and No.24 (2004) on ambient air quality standard specification
Announcement of the National Environment Board No.21 (2001) on sulfur dioxide ambient concentration standard specification Announcement of the National Environment Board No.33 (2009) on nitrogen dioxide ambient concentration standard specification
3/ Referenced from WHO Ambient Air Quality Guidelines in Environmental, Health, and Safety (EHS) Guidelines for International Finance Corporation (2007) * Frequency of occurrence of NO2 concentration higher than 25 percent of a national standard is less than 1 percent of the study period (3 years). ** Frequency of occurrence of NO2 concentration higher than 25 percent of a national standard is only one time. Source: Team Consulting Engineering and Management Co., Ltd., 2018

Environmental Report for submission to ADB Chapter 5
Pluak Daeng Power Plant Anticipated Environmental Impacts and Mitigations
RNP/ENV/P05028/FR (ADB)/RE62049-chap 5 Page 5-77
TABLE 5.1.1-26 RESULTS OF THE PREDICTION OF AIR QUALITY BY USING THE AERMOD MODEL IN NORMAL CONDITION (WITH DOWNWASH EFFECT),
CASE 6: IMPACTS CAUSED BY PLUAK DAENG POWER PLANT PROJECT IN THE EVENT OF DIESEL-FIRED OPERATION AT 100% LOAD; PLUS THE EXISTING IMPACTS CAUSED BY OTHER INDUSTRIAL PLANTS AS SPECIFIED IN THE ENVIRONMENTAL IMPACT ASSESSMENT REPORT THOUGH THERE IS NOT YET AIR POLLUTANT EMISSION WITHIN THE RADIUS OF 15 KILOMETERS FROM THE PROJECT LOCATION Study Area Estimated highest concentration levels of air pollutants in the case of impact from transporting activities (g/m3)
1-hour average NO2 1-year average NO2 1-hour average SO2 24-hour average SO2 1-year average SO2 24-hour average TSP 1-year average TSP 24-hour average PM-10 1-year average PM-10 Maximum concentration by model 278.85* 5.43 123.02 35.54 3.04 21.82 1.87 17.91 1.55 Grid reference 728828E, 1419114N 729328E, 1419614N 729328E, 1419114N 729328E, 1418614N 729328E, 1419614N 729328E, 1418614N 729328E, 1419614N 729328E, 1418614N 729328E, 1419614N Location Jom Hae Mountain Jom Hae Mountain Jom Hae Mountain Jom Hae Mountain Jom Hae Mountain Jom Hae Mountain Jom Hae14.2 km Mountain Jom Hae Mountain Jom Hae Mountain
Direction and distance from the project site
SSW SSW SSW SSW SSW SSW SSW SSW SSW
14.8 km 14.2 km 14.6 km 15.1 km 14.2 km 15.1 km 14.2 km 15.1 km 14.2 km
Land Use mountain mountain mountain mountain mountain mountain mountain mountain mountain
Sensitive Area Using the
model
Using existing
monitoring data 1/
Total Using the
model
Using existing
monitoring data 1/
Total Using the
model
Using existing
monitoring data 1/
Total Using the
model
Using existing
monitoring data 1/
Total Using the
model
Using existing
monitoring data 1/
Total Using the
model
Using existing
monitoring data 1/
Total Using the
model
Using existing
monitoring data 1/
Total Using the
model
Using existing
monitoring data 1/
Total Using the
model
Using existing
monitoring data 1/
Total
1. Map Yang Phon Sub-district Administrative Organization
59.08 73.95 133.03 2.22 12.03 14.25 26.25 7.86 34.11 3.97 5.24 9.21 1.10 1.28 2.38 2.45 295.00 297.45 0.68 90.65 91.33 2.03 109.00 111.03 0.56 33.49 34.05
2. Ban Map Toei School 59.66 73.95 133.61 2.22 12.03 14.25 26.25 7.86 34.11 4.07 5.24 9.31 1.11 1.28 2.39 2.52 295.00 297.52 0.68 90.65 91.33 2.08 109.00 111.08 0.56 33.49 34.05 3. Map Toei Temple 60.31 73.95 134.26 2.21 12.03 14.24 25.72 7.86 33.58 4.27 5.24 9.51 1.11 1.28 2.39 2.63 295.00 297.63 0.69 90.65 91.34 2.16 109.00 111.16 0.57 33.49 34.06 4. Nikhom Sang Ton Eng 9 School 107.85** 43.47 151.32 1.96 7.07 9.03 44.01 3.93 47.94 4.85 3.14 7.99 1.14 0.64 1.78 2.98 148.00 150.98 0.71 45.48 46.19 2.44 87.00 89.44 0.58 26.73 27.31 5. Prasitharam Temple 111.66** 43.47 155.13 1.98 7.07 9.05 45.57 3.93 49.50 4.88 3.14 8.02 1.14 0.64 1.78 2.99 148.00 150.99 0.70 45.48 46.18 2.46 87.00 89.46 0.58 26.73 27.31 6. Map Yang Phon Sub-district Health
Promoting Hospital 77.67 55.14 132.81 1.85 8.97 10.82 36.69 4.45 41.14 3.16 3.41 6.57 0.98 0.72 1.70 1.94 177.00 178.94 0.61 54.39 55.00 1.60 112.00 113.60 0.50 34.42 34.92
7. Ban Map Yang Phon School 82.60*** 55.14 137.74 1.94 8.97 10.91 37.82 4.45 42.27 3.31 3.41 6.72 1.04 0.72 1.76 2.04 177.00 179.04 0.64 54.39 55.03 1.67 112.00 113.67 0.53 34.42 34.95 8. Map Yang Phon Temple 88.04*** 55.14 143.18 2.16 8.97 11.13 38.75 4.45 43.20 3.73 3.41 7.14 1.16 0.72 1.88 2.29 177.00 179.29 0.72 54.39 55.11 1.88 112.00 113.88 0.59 34.42 35.01 9. Pluak Daeng Sub-district
Administrative Organization 50.96 88.44 139.40 1.25 16.94 18.19 26.57 44.28 70.85 3.04 10.49 13.53 0.67 1.88 2.55 1.88 295.00 296.88 0.42 90.65 91.07 1.56 99.21 100.77 0.34 45.00 45.34
10. Orawin Witthaya School 51.92 88.44 140.36 1.24 16.94 18.18 25.41 44.28 69.69 3.65 10.49 14.14 0.67 1.88 2.55 2.26 295.00 297.26 0.41 90.65 91.06 1.87 99.21 101.08 0.34 45.00 45.34 11. Pluak Daeng High Voltage
Electricity Station 60.31 88.44 148.75 1.63 16.94 18.57 23.05 44.28 67.33 2.85 10.49 13.34 0.79 1.88 2.67 1.76 295.00 296.76 0.49 90.65 91.14 1.45 99.21 100.66 0.40 45.00 45.40
12. Wang Pradu Temple 53.84 73.95 127.79 1.57 12.03 13.60 27.78 7.86 35.64 4.11 5.24 9.35 0.64 1.28 1.92 2.53 295.00 297.53 0.39 90.65 91.04 2.08 109.00 111.08 0.33 33.49 33.82 13. Wang Pradu School (closed down) 54.43 73.95 128.38 1.57 12.03 13.60 27.00 7.86 34.86 3.98 5.24 9.22 0.64 1.28 1.92 2.45 295.00 297.45 0.39 90.65 91.04 2.01 109.00 111.01 0.33 33.49 33.82 14. Village no.5, Ban Khlong Plu 78.47 43.47 121.94 1.96 7.07 9.03 32.74 3.93 36.67 5.36 3.14 8.50 0.99 0.64 1.63 3.29 148.00 151.29 0.61 45.48 46.09 2.70 87.00 89.70 0.50 26.73 27.23 15. Village no.7, Ban Wang Pla 114.08** 43.47 157.55 2.05 7.07 9.12 46.39 3.93 50.32 5.38 3.14 8.52 1.17 0.64 1.81 3.30 148.00 151.30 0.72 45.48 46.20 2.71 87.00 89.71 0.60 26.73 27.33 16. Village no.8 , Ban Soi 13 86.60*** 43.47 130.07 1.75 7.07 8.82 36.40 3.93 40.33 4.41 3.14 7.55 1.04 0.64 1.68 2.72 148.00 150.72 0.64 45.48 46.12 2.24 87.00 89.24 0.53 26.73 27.26
17. Village no.7, Ban Wang Pradu 55.37 73.95 129.32 1.63 12.03 13.66 25.74 7.86 33.60 3.79 5.24 9.03 0.66 1.28 1.94 2.33 295.00 297.33 0.41 90.65 91.06 1.92 109.00 110.92 0.33 33.49 33.82 18. Village no.4, Ban Khao Mapud 71.66 43.47 115.13 1.57 7.07 8.64 36.69 3.93 40.62 3.47 3.14 6.61 0.93 0.64 1.57 2.13 148.00 150.13 0.58 45.48 46.06 1.76 87.00 88.76 0.48 26.73 27.21 19. Village no.5, Ban Wang Tan Mon 96.66*** 45.73 142.39 2.18 7.44 9.62 40.81 6.03 46.84 5.89 4.45 10.34 1.38 0.98 2.36 3.62 153.00 156.62 0.85 47.01 47.86 2.97 88.00 90.97 0.70 27.04 27.74 20. Village no.1, Ban Map Toei 67.09 73.95 141.04 2.03 12.03 14.06 21.58 7.86 29.44 4.32 5.24 9.56 0.96 1.28 2.24 2.66 295.00 297.66 0.59 90.65 91.24 2.19 109.00 111.19 0.49 33.49 33.98 21. Village no.7, Ban Chak Oi 65.21 73.95 139.16 2.08 12.03 14.11 28.30 7.86 36.16 4.41 5.24 9.65 0.82 1.28 2.10 2.73 295.00 297.73 0.51 90.65 91.16 2.26 109.00 111.26 0.42 33.49 33.91 22. Village no.6, Ban Map Yang Mai 64.09 66.99 131.08 1.66 10.90 12.56 26.75 5.24 31.99 3.02 3.67 6.69 0.96 0.85 1.81 1.86 258.00 259.86 0.60 79.28 79.88 1.54 116.00 117.54 0.49 35.65 36.14 23. Village no.6, Ban Thab Tong 74.96 73.95 148.91 2.04 12.03 14.07 22.05 7.86 29.91 2.88 5.24 8.12 0.90 1.28 2.18 1.78 295.00 296.78 0.55 90.65 91.20 1.47 109.00 110.47 0.46 33.49 33.95
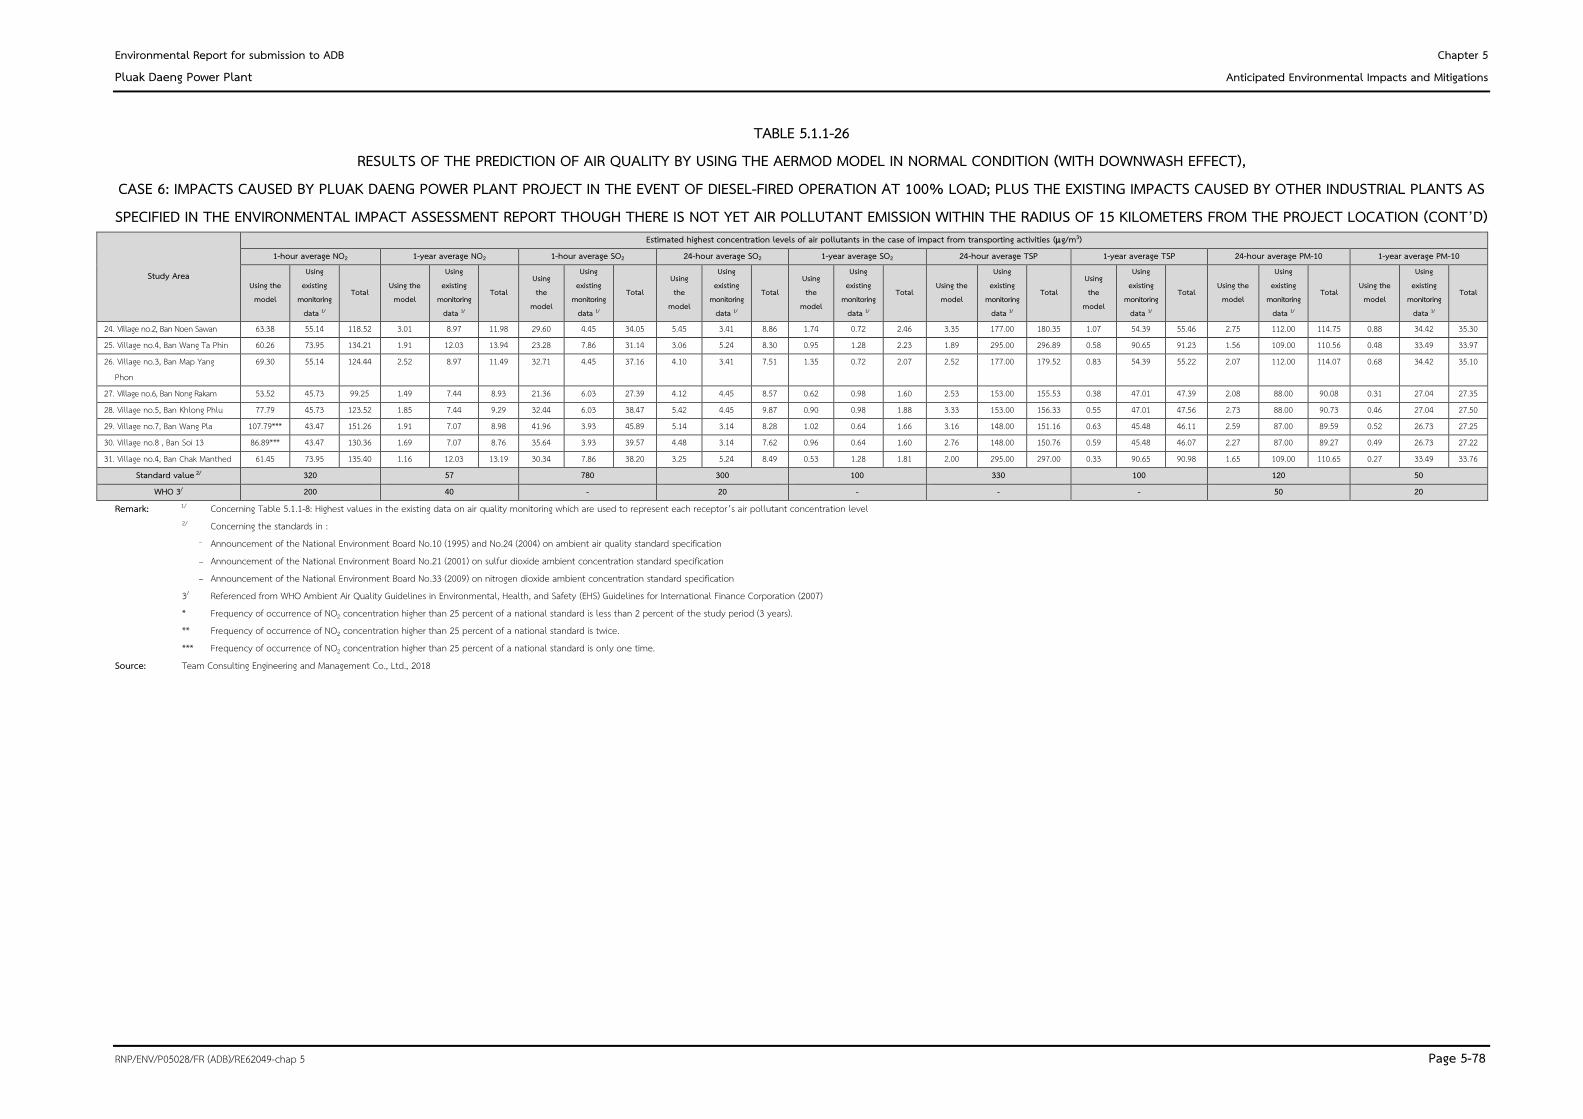
Environmental Report for submission to ADB Chapter 5
Pluak Daeng Power Plant Anticipated Environmental Impacts and Mitigations
RNP/ENV/P05028/FR (ADB)/RE62049-chap 5 Page 5-78
TABLE 5.1.1-26 RESULTS OF THE PREDICTION OF AIR QUALITY BY USING THE AERMOD MODEL IN NORMAL CONDITION (WITH DOWNWASH EFFECT),
CASE 6: IMPACTS CAUSED BY PLUAK DAENG POWER PLANT PROJECT IN THE EVENT OF DIESEL-FIRED OPERATION AT 100% LOAD; PLUS THE EXISTING IMPACTS CAUSED BY OTHER INDUSTRIAL PLANTS AS SPECIFIED IN THE ENVIRONMENTAL IMPACT ASSESSMENT REPORT THOUGH THERE IS NOT YET AIR POLLUTANT EMISSION WITHIN THE RADIUS OF 15 KILOMETERS FROM THE PROJECT LOCATION (CONT’D)
Study Area
Estimated highest concentration levels of air pollutants in the case of impact from transporting activities (g/m3) 1-hour average NO2 1-year average NO2 1-hour average SO2 24-hour average SO2 1-year average SO2 24-hour average TSP 1-year average TSP 24-hour average PM-10 1-year average PM-10
Using the model
Using existing
monitoring data 1/
Total Using the model
Using existing
monitoring data 1/
Total Using the
model
Using existing
monitoring data 1/
Total Using the
model
Using existing
monitoring data 1/
Total Using the
model
Using existing
monitoring data 1/
Total Using the model
Using existing
monitoring data 1/
Total Using the
model
Using existing
monitoring data 1/
Total Using the model
Using existing
monitoring data 1/
Total Using the model
Using existing
monitoring data 1/
Total
24. Village no.2, Ban Noen Sawan 63.38 55.14 118.52 3.01 8.97 11.98 29.60 4.45 34.05 5.45 3.41 8.86 1.74 0.72 2.46 3.35 177.00 180.35 1.07 54.39 55.46 2.75 112.00 114.75 0.88 34.42 35.30 25. Village no.4, Ban Wang Ta Phin 60.26 73.95 134.21 1.91 12.03 13.94 23.28 7.86 31.14 3.06 5.24 8.30 0.95 1.28 2.23 1.89 295.00 296.89 0.58 90.65 91.23 1.56 109.00 110.56 0.48 33.49 33.97 26. Village no.3, Ban Map Yang
Phon 69.30 55.14 124.44 2.52 8.97 11.49 32.71 4.45 37.16 4.10 3.41 7.51 1.35 0.72 2.07 2.52 177.00 179.52 0.83 54.39 55.22 2.07 112.00 114.07 0.68 34.42 35.10
27. Village no.6, Ban Nong Rakam 53.52 45.73 99.25 1.49 7.44 8.93 21.36 6.03 27.39 4.12 4.45 8.57 0.62 0.98 1.60 2.53 153.00 155.53 0.38 47.01 47.39 2.08 88.00 90.08 0.31 27.04 27.35 28. Village no.5, Ban Khlong Phlu 77.79 45.73 123.52 1.85 7.44 9.29 32.44 6.03 38.47 5.42 4.45 9.87 0.90 0.98 1.88 3.33 153.00 156.33 0.55 47.01 47.56 2.73 88.00 90.73 0.46 27.04 27.50 29. Village no.7, Ban Wang Pla 107.79*** 43.47 151.26 1.91 7.07 8.98 41.96 3.93 45.89 5.14 3.14 8.28 1.02 0.64 1.66 3.16 148.00 151.16 0.63 45.48 46.11 2.59 87.00 89.59 0.52 26.73 27.25 30. Village no.8 , Ban Soi 13 86.89*** 43.47 130.36 1.69 7.07 8.76 35.64 3.93 39.57 4.48 3.14 7.62 0.96 0.64 1.60 2.76 148.00 150.76 0.59 45.48 46.07 2.27 87.00 89.27 0.49 26.73 27.22 31. Village no.4, Ban Chak Manthed 61.45 73.95 135.40 1.16 12.03 13.19 30.34 7.86 38.20 3.25 5.24 8.49 0.53 1.28 1.81 2.00 295.00 297.00 0.33 90.65 90.98 1.65 109.00 110.65 0.27 33.49 33.76
Standard value 2/ 320 57 780 300 100 330 100 120 50 WHO 3/ 200 40 - 20 - - - 50 20
Remark: 1/ Concerning Table 5.1.1-8: Highest values in the existing data on air quality monitoring which are used to represent each receptor’s air pollutant concentration level 2/ Concerning the standards in :
Announcement of the National Environment Board No.10 (1995) and No.24 (2004) on ambient air quality standard specification
Announcement of the National Environment Board No.21 (2001) on sulfur dioxide ambient concentration standard specification Announcement of the National Environment Board No.33 (2009) on nitrogen dioxide ambient concentration standard specification
3/ Referenced from WHO Ambient Air Quality Guidelines in Environmental, Health, and Safety (EHS) Guidelines for International Finance Corporation (2007) * Frequency of occurrence of NO2 concentration higher than 25 percent of a national standard is less than 2 percent of the study period (3 years). ** Frequency of occurrence of NO2 concentration higher than 25 percent of a national standard is twice. *** Frequency of occurrence of NO2 concentration higher than 25 percent of a national standard is only one time. Source: Team Consulting Engineering and Management Co., Ltd., 2018

Environmental Report for submission to ADB Chapter 5
Pluak Daeng Power Plant Anticipated Environmental Impacts and Mitigations
RNP/ENV/P05028/FR (ADB)/RE62049-chap 5 Page 5-79
FIGURE 5.1.1-24 : CONTOUR MAP OF 1-HOUR AVERAGE NO2 CONCENTRATION CASE 6 WITHIN THE RADIUS OF 15 KILOMETERS FROM THE PROJECT

Environmental Report for submission to ADB Chapter 5
Pluak Daeng Power Plant Anticipated Environmental Impacts and Mitigations
RNP/ENV/P05028/FR (ADB)/RE62049-chap 5 Page 5-80
FIGURE 5.1.1-25 : CONTOUR MAP OF 1-YEAR AVERAGE NO2 CONCENTRATION CASE 6 WITHIN THE RADIUS OF 15 KILOMETERS FROM THE PROJECT

Environmental Report for submission to ADB Chapter 5
Pluak Daeng Power Plant Anticipated Environmental Impacts and Mitigations
RNP/ENV/P05028/FR (ADB)/RE62049-chap 5 Page 5-81
FIGURE 5.1.1-26 : CONTOUR MAP OF 1-HOUR AVERAGE SO2 CONCENTRATION CASE 6 WITHIN THE RADIUS OF 15 KILOMETERS FROM THE PROJECT

Environmental Report for submission to ADB Chapter 5
Pluak Daeng Power Plant Anticipated Environmental Impacts and Mitigations
RNP/ENV/P05028/FR (ADB)/RE62049-chap 5 Page 5-82
FIGURE 5.1.1-27 : CONTOUR MAP OF 24-HOUR AVERAGE SO2 CONCENTRATION CASE 6 WITHIN THE RADIUS OF 15 KILOMETERS FROM THE PROJECT

Environmental Report for submission to ADB Chapter 5
Pluak Daeng Power Plant Anticipated Environmental Impacts and Mitigations
RNP/ENV/P05028/FR (ADB)/RE62049-chap 5 Page 5-83
FIGURE 5.1.1-28 : CONTOUR MAP OF 1-YEAR AVERAGE SO2 CONCENTRATION CASE 6 WITHIN THE RADIUS OF 15 KILOMETERS FROM THE PROJECT

Environmental Report for submission to ADB Chapter 5
Pluak Daeng Power Plant Anticipated Environmental Impacts and Mitigations
RNP/ENV/P05028/FR (ADB)/RE62049-chap 5 Page 5-84
FIGURE 5.1.1-29 : CONTOUR MAP OF 24-HOUR AVERAGE TSP CONCENTRATION CASE 6 WITHIN THE RADIUS OF 15 KILOMETERS FROM THE PROJECT

Environmental Report for submission to ADB Chapter 5
Pluak Daeng Power Plant Anticipated Environmental Impacts and Mitigations
RNP/ENV/P05028/FR (ADB)/RE62049-chap 5 Page 5-85
FIGURE 5.1.1-30 : CONTOUR MAP OF 24-YEAR AVERAGE TSP CONCENTRATION CASE 6 WITHIN THE RADIUS OF 15 KILOMETERS FROM THE PROJECT
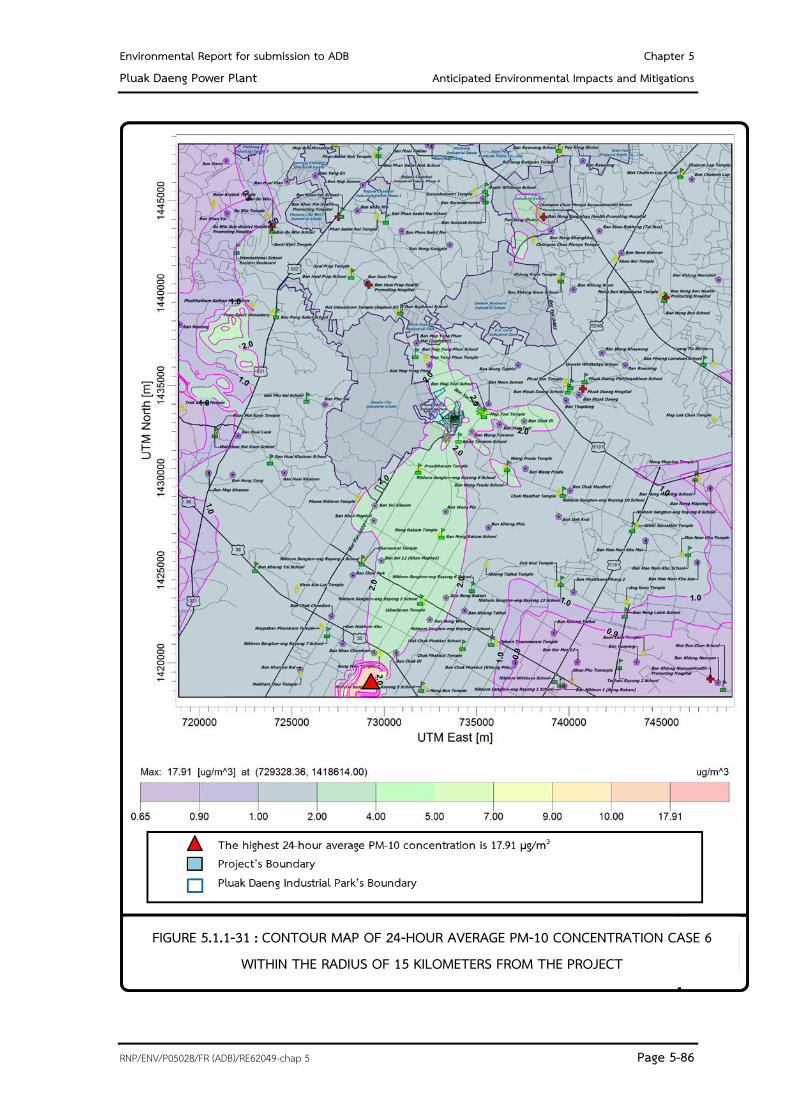
Environmental Report for submission to ADB Chapter 5
Pluak Daeng Power Plant Anticipated Environmental Impacts and Mitigations
RNP/ENV/P05028/FR (ADB)/RE62049-chap 5 Page 5-86
FIGURE 5.1.1-31 : CONTOUR MAP OF 24-HOUR AVERAGE PM-10 CONCENTRATION CASE 6 WITHIN THE RADIUS OF 15 KILOMETERS FROM THE PROJECT

Environmental Report for submission to ADB Chapter 5
Pluak Daeng Power Plant Anticipated Environmental Impacts and Mitigations
RNP/ENV/P05028/FR (ADB)/RE62049-chap 5 Page 5-87
FIGURE 5.1.1-32 : CONTOUR MAP OF 1-YEAR AVERAGE PM-10 CONCENTRATION CASE 6 WITHIN THE RADIUS OF 15 KILOMETERS FROM THE PROJECT

Environmental Report for submission to ADB Chapter 5
Pluak Daeng Power Plant Anticipated Environmental Impacts and Mitigations
RNP/ENV/P05028/FR (ADB)/RE62049-chap 5 Page 5-88
(2.4) 25% emissions limit for the airshed (a) At Maximum Ground Level Concentration According to the predicted results, the maximum concentration of 1-hour average concentration of NO2 is higher than 25 percent of national ambient air quality standards value (see Table 5.1.1-27). That maximum concentration takes place at Song Phi Nong Mountain and Jom Hae Mountain which are located at a distance of 13-15 kilometers from the project area. The mountain is covered with dry evergreen forest, tropical rain forest, and mixed deciduous forest. From the conversation with the officer of Royal Forest Department (RFD), it was revealed that the mountains are under the responsibility of RFD; hence, any development, utilization, or survey in these forests must obtain a permit from RFD. At present, they are not informed about the plan for these mountains. Thus, it is anticipated that these areas will remain in the same condition in the future. However, comparing maximum concentrations of 1- year average with NO2 and SO2 with WHO guidelines for the effects of them on vegetation (critical level), they are far below the critical level as shown in Table 5.1.1-28. Accordingly, the impact on the forest at Song Phi Nong Mountain and Jom Hae Mountain is considered to be insignificant. Considering impact on forest on Song Phi Nong Mountain and Jom Hae Mountain from both particulate matter having size below 10 (PM-10) and 2.5 microns (PM 2.5) , it is found that the maximum concentration of 1-year and 24-hour average PM-10 from the 100-percent load operation of the project (case 1 and 4) is below and is not over 25% of National ambient air quality standards value (See Table 5.1.1-28). For PM-2.5, it is not a controlled parameter as required by Thai law for emission from gas-fired power plant, so the project did not monitor PM-2.5 in ambient. Also, the project is not a generator of PM-2.5. However, the project has tried to assess the impact of PM-2.5 on air quality by establishing hypotheses regarding particle sources to put into the model, consisting of 2 components.
In case of using natural gas as a fuel, PM Emission Factors for PM-10 to PM-2.5 is equal to 0.94 (Reference from the document of Karen Olson and Louis Corio, Zephyr Environmental Corporation).
In case of using diesel as a fuel, the ratio of PM-2.5/PM-10 is 0.83. (Reference: Table 3.4-2 from 3.4 Large Stationary Diesel And All Stationary Dual-fuel Engines of AP42).

Environmental Report for submission to ADB Chapter 5
Pluak Daeng Power Plant Anticipated Environmental Impacts and Mitigations
RNP/ENV/P05028/FR (ADB)/RE62049-chap 5 Page 5-89
TABLE 5.1.1-27 SUMMARY AIR QUALITY STUDY RESULTS OF OPERATION PERIOD
Results from the assessment on ambient air quality using mathematical model AERMOD (µg/m3) Detail NO2 SO2 TSP PM-10 PM-2.5
1 hr 1 year 1 hr 24 hr 1 year 24 hr 1 year 24 hr 1 year 24 hr 1 year Case 1 Impacts Caused by Pluak Daeng Power Plant Project in the Event of Natural Gas-fired Operation at 100% Load Max 209.53 2.54 73.48 17.28 1.40 12.06 0.97 12.06 0.97 11.34 0.91
Area Song Pe Nong Mountain
Jom Hae Mountain
Song Pe Nong Mountain
Jom Hae Mountain
Jom Hae Mountain
Jom Hae Mountain
Jom Hae Mountain
Jom Hae Mountain
Jom Hae Mountain
Jom Hae Mountain
Jom Hae Mountain
Direction /distance NW 13.6 km
SSW/ 14.2 km
NW/ 13.1 km
SSW/ 15.1 km
SSW/ 14.2 km
SSW/ 15.1 km
SSW/ 14.2
SSW/ 15.1 km
SSW/ 14.2 km
SSW/ 15.1 km
SSW/ 14.2 km
Case 3 Impacts caused by Pluak Daeng Power Plant Project in the event of natural gas- fired operation at 100% load; plus the existing impacts caused by other industrial plants as specified in the environmental impact assessment report though there is not yet air pollutant emission within the radius of 15 kilometers from the project location
Max 254.09 4.86 79.51 21.09 1.81 16.90 1.47 16.90 1.47 15.89 1.38
Area Jom Hae Mountain
Jom Hae Mountain
Jom Hae Mountain
Jom Hae Mountain
Jom Hae Mountain
Jom Hae Mountain
Jom Hae Mountain
Jom Hae Mountain
Jom Hae Mountain
Jom Hae Mountain
Jom Hae Mountain
Direction/distance SSW/ 14.8 km
SSW/ 14.2 km
SSW/ 14.6 km
SSW/ 15.1 km
SSW/ 14.2 km
SSW/ 15.1 km
SSW/ 14.2 km
SSW/ 15.1 km
SSW/ 14.2 km
SSW/ 15.1 km
SSW/ 14.2 km
Case 4 Impacts Caused by Pluak Daeng Power Plant Project in the Event of Deisel-fired Operation at 100% Load Max 263.70 3.20 108.68 26.10 2.10 16.03 1.29 13.16 1.06 10.92 0.88
Area Song Phi Nong
Mountain Jom Hae Mountain
Song Phi Nong Mountain
Jom Hae Mountain
Jom Hae Mountain
Jom Hae Mountain
Jom Hae Mountain
Jom Hae Mountain
Jom Hae Mountain
Jom Hae Mountain
Jom Hae Mountain
Direction/ distance NW/
13.6 km SSW/
14.2 km NW/
13.1 km SSW/
15.1 km SSW/
14.2 km SSW/
15.1 km SSW/
14.2 km SSW/
15.1 km SSW/
14.2 km SSW/
15.1 km SSW/
14.2 km
Case 6 Impacts caused by Pluak Daeng Power Plant Project in the event of diesel- fired operation at 100% load; plus the existing impacts caused by other industrial plants as specified in the environmental impact assessment report though there is not yet air pollutant emission within the radius of 15 kilometers from the project location
Max 278.85 5.43 123.02 35.54 3.04 21.82 1.87 17.91 1.55 14.87 1.29
Area Jom Hae Mountain
Jom Hae Mountain
Jom Hae Mountain
Jom Hae Mountain
Jom Hae Mountain
Jom Hae Mountain
Jom Hae Mountain
Jom Hae Mountain
Jom Hae Mountain
Jom Hae Mountain
Jom Hae Mountain
Direction/distance SSW/
14.8 km SSW/
14.2 km SSW/
14.6 km SSW/
15.1 km SSW/
14.2 km SSW/
15.1 km SSW/
14.2 km SSW/
15.1 km SSW/
14.2 km SSW/
15.1 km SSW/
14.2 km National Standard 1/ 320 57 780 300 100 330 100 120 50 50 25
WHO guideline 2/ 200 40 - 20 - - - 50 - 25 10 Remark: 1/ Referenced from
- The National Environment Board’s Notification No. 10 (B.E. 2538) and No. 24 (B.E.2547) re: Prescribing Ambient Air Quality Standards - The National Environment Board’s Notification No. 33 (B.E. 2552) re: Prescribing Ambient Nitrogen Dioxide Standards - The National Environment Board’s Notification No. 21 (B.E.2554) re: Prescribing Ambient 1 hr sulfur dioxide Standards - OSHA Standard, Part title: Safety and health regulations for construction, Subpart title: Occupational health and environmental controls, Standard number 1926.55 App A
2/ Referenced from WHO Ambient Air Quality Guidelines in Environmental, Health, and Safety (EHS) Guidelines for International Finance Corporation (2007)

Environmental Report for submission to ADB Chapter 5
Pluak Daeng Power Plant Anticipated Environmental Impacts and Mitigations
RNP/ENV/P05028/FR (ADB)/RE62049-chap 5 Page 5-90
TABLE 5.1.1-28 COMPARISON OF POLLUTION CONCENTRATION FROM THE PROJECT OPERATION
AND THE POLLUTION CONCENTRATION STARTED TO AFFECT PLANT Highest concentration value from the results of the assessment
(µg/m3) NO2 Avr. 1 yr SO2 Avr. 1 yr
Case 1 2.54 1.40 Case 4 3.20 2.10 WHO critical levels* 30 20
Remarks: case 1: Impacts caused by Pluak Daeng Power Plant Project in the event of natural gas-fired operation at 100% load
case 4: Impacts caused by Pluak Daeng Power Plant Project in the event of diesel-fired operation at 100% load
* WHO Regional Publications, 2000. European Series, No. 91 “Guideline values for individual substances based on effects on terrestrial vegetation”
Ther predicted PM-2.5 is as shown in Table 5.1.1-27 of which 1-year concentrations is below 25 percent of national ambient air quality standards value. There are only 24- hr average PM- 2. 5 exceeds 25 percent of both guidelines. The effect of particulate matter ( PM) on crops when it coats on leave led to crops cannot be synthesized. PM on leaves is removed by rainfall events (28–48% of PM) and strong winds (27–36% of PM) , and more precipitation or higher maximum wind speed could remove more PM from leaves. Rainfall removed mainly large and coarse particles, while fine particles adhered more strongly to the foliage. These results suggested that the effects of local weather conditions (e.g., rainfall, strong wind), different seasons, and pollution levels should be considered in evaluating total PM accumulation on leaves. (Reference from Huixia Wang, Hui Shi, and Yanhui Wang“Effects of Weather, Time, and Pollution Level on the Amount of Particulate Matter Deposited on Leaves of Ligustrum lucidum”) Moreover, the forecast of 1- year average PM-10 and PM-2. 5 concentration are less than 25 percent of standard values. Therefore, the impact of PM is expected to below. (b) At Sensitive Receptors As the considered sensitive receptors also are the places where the occupants are more susceptible to the adverse effects of exposure to pollutants such as hospital and school, the concentration of all pollutants at sensitive receptors in case

Environmental Report for submission to ADB Chapter 5
Pluak Daeng Power Plant Anticipated Environmental Impacts and Mitigations
RNP/ENV/P05028/FR (ADB)/RE62049-chap 5 Page 5-91
of 100-percent load of natural gas firing is below 25% of National ambient air quality standards value as shown in Table 5.1.1-29. In case of 100-percent load of diesel firing, the maximum concentration of 1-hr average NO2 at receptors no. 4, 5, 8, 15 is 81.58, 84.13, 84.88 and 84.67 µg/m3, respectively (Table 5.1.1-24). They are higher than 25% of National ambient air quality standard value. However, the exceedance at each receptor will occur only for 1 hour in 26,280 hour period. Moreover, comparing those values with the US.EPA’s National Ambient Air Quality Standards (2011) (NO2 concentration is 183 µg/m3) , in the category of primary standards provide public health protection, including protecting the health of sensitive populations such as asthmatics, children, and the elderly, the values of NO2 at receptors are within the standard. Thus, the impact of NO2 at receptors is considered to be insignificant. Mitigation Measures
(a) Construction Phase Trucks transporting construction materials shall be covered
and/or fastened to prevent the falling of materials and reduce the diffusion of dust. While being transported, construction materials will be
covered with tarpaulin sheets to prevent accidents and dust. Water shall be sprayed at the construction site, earth piles or
the areas where construction activities cause diffusion of dust, such as roads, land levelling, etc. , to reduce dust diffusion at least twice a day (morning-afternoon). However, when it is dry or windy, and it is considered that the sprayed areas are getting dry and dust dispersion is likely to occur, water spraying will be additionally done.
Inspection, maintenance or checking of vehicles and construction engines/machinery shall be performed every month to reduce air pollution emissions.
Truck wheels shall be washed before the trucks leave the construction site or construction- related areas to prevent dirt and sand from falling onto the roads, both inside and outside the project area.
Truck speed limits shall be 20 kilometers/ hour for the construction site and Pluak Daeng Industrial Park and 80 kilometers/hour for the highway.
Construction waste or garbage shall not be incinerated in the construction site.

Environmental Report for subm
ission to ADB Chapter 5
Pluak Daeng Power Plant Anticipated Environm
ental Impacts and M
itigations
RNP/ENV/P05028/FR (ADB)/RE62049-chap 5 Page 5-92
TABLE 5.1.1-29 THE MAXIMUM CONCENTRATION AT SENSITIVE RECEPTORS
Pollutants Natural Gas with 100 % load Diesel with 100 %
National STD (µg/m3)
WHO Guideline (µg/m3)
µg/m3 % of STD % of guideline µg/m3 % of STD % of guideline
NO2 1hr. 24.46-67.44 7.64-21.08 12.23-33.72 30.08-84.88 9.63-26.53 15.40-42.44 320 200 NO2-annual 0.42-1.74 0.74-3.05 1.05-4.35 0.53-2.18 0.93-3.82 1.33-5.45 57 40
SO2-1hr. 13.18-25.20 1.69-3.23 - 19.84-38.02 2.54-4.87 - 780 - SO2-24hr. 1.54-3.54 0.51-1.18 - 2.33-5.33 0.78-1.78 - 300 -
SO2-annual 0.23-0.88 0.23-0.88 1.15-4.40 0.34-1.33 0.34-1.33 1.70-6.65 100 20 TSP-24 hr 1.08-2.47 0.33-0.75 - 1.43-3.28 0.43-0.99 - 330 -
TSP- annual 0.16-0.62 0.16-0.62 - 0.21-0.82 0.21-0.82 - 100 - PM10-24 hr 1.08-2.47 0.90-0.62 2.15-4.94 1.17-2.69 0.98-2.24 2.34-5.38 120 50
PM10- annual 0.16-0.62 0.32-1.24 0.80-3.10 0.17-0.67 0.34-1.34 0.85-3.35 50 20

Environmental Report for submission to ADB Chapter 5
Pluak Daeng Power Plant Anticipated Environmental Impacts and Mitigations
RNP/ENV/P05028/FR (ADB)/RE62049-chap 5 Page 5-93
Construction site shall be controlled, and construction works undertaken quickly.
Workers shall be provided to clean the road surface in front of the project area after the arrival-departure of trucks.
The project will conduct quantification and monitoring of greenhouse gas emission annually in accordance with internationally recognition methodologies.
During construction activities, in case project find cultural heritage resources in the area the project has to stop activity and report to relevant agencies according to the law.
Measure particulate matter at the construction site for 3 consecutive days at the beginning of dusty activites such as piling activities.
(b) Operation Phase The Continuous Emission Monitoring System (CEMs) shall be
installed at the stacks of the power plant for continuous emission monitoring. Measurement parameters include nitrogen oxides ( NOx) , sulfur dioxide ( SO2) , total suspended particulate (TSP) , oxygen (O2) , and the flow rate. Besides, the display of air quality monitoring results (NOX, SO2, and TSP) shall be installed in front of the project area. Monitoring results shall be reported to Pluak Daeng Industrial Park throughout the project life.
CEMs shall be audited once a year throughout the project life. Air pollution emissions shall not exceed the values
determined in the environmental impact assessment report. Details are provided below. Natural gas as fuel scenario Full load
SO2: concentration not to exceed 10 ppm at 7 % O2 and emission rate not to exceed 13.9 g/s/stack
NOx: concentration not to exceed 59 ppm at 7 % O2 and emission rate not to exceed 58.6 g/s/stack
Particulate: concentration not to exceed 20 mg/m3 at 7% O2 and emission rate not to exceed 9.7 g/s/stack

Environmental Report for submission to ADB Chapter 5
Pluak Daeng Power Plant Anticipated Environmental Impacts and Mitigations
RNP/ENV/P05028/FR (ADB)/RE62049-chap 5 Page 5-94
Minimum load SO2: concentration not to exceed 10 ppm at 7 % O2 and
emission rate not to exceed 8.4 g/s/stack NOx: concentration not to exceed 59 ppm at 7 % O2 and
emission rate not to exceed 35.4 g/s/stack Particulate: concentration not to exceed 20 mg/m3 at 7% O2
and emission rate not to exceed 5.9 g/s/stack Diesel oil as fuel scenario Full load
SO2: concentration not to exceed 20 ppm at 7 % O2 and emission rate not to exceed 21.0 g/s/stack
NOx: concentration not to exceed 99 ppm at 7 % O2 and emission rate not to exceed 74.0 g/s/stack
Particulate : concentration not to exceed 35 mg/m3 at 7% O2 and emission rate not to exceed 12.9 g/s/stack Minimum load
SO2: concentration not to exceed 20 ppm at 7% O2 and emission rate not to exceed 17.6 g/s/stack
NOx: concentration not to exceed 99 ppm at 7 % O2 and emission rate not to exceed 61.2 g/s/stack
Particulate: concentration not to exceed 35 mg/m3 at 7% O2
and emission rate not to exceed 10.6 g/s/stack In case of using natural gas as fuel: Dry low NOx combustion
shall be applied to control NOx during combustion. In case of using diesel oil as fuel: Water injection system shall
be applied to control NOx during combustion. The concentration of the above pollutants is calculated in the
normal temperature of 2 5 degree Celsius, one atmospheric pressure and 7% of excess oxygen during combustion.
In case of the air pollution control system failure and the emission rate exceeds the control value, the project will stop the gas turbine engine in order to check NOx control system immediately and fix the problem quickly.

Environmental Report for submission to ADB Chapter 5
Pluak Daeng Power Plant Anticipated Environmental Impacts and Mitigations
RNP/ENV/P05028/FR (ADB)/RE62049-chap 5 Page 5-95
Knowledgeable personnel shall be provided for regulating the air emission rates of the Project.
The project will quantify direct emissions from the facilities within the physical project boundary.
The project will determine the preventive and preventive maintenance plan for machinery and equipment to operate at full capacity.
The project will conduct quantification and monitoring of greenhouse gas emission annually in accordance with internationally recognition methodologies.
GPD will carry out monitoring events at sensitive receptor within 5 km of the site with greatest forecast exposure to emissions from the site based on peak loading schedule from EGAT and when running on diesel.
In an event of the plant being required to run on diesel for more than 500 hours in any year, GPD is committed to install an additional continuous ambient air quality monitoring station at the sensitive receptor within 5 km of the site with greatest forecast or measured exposure to emissions from the site.
A continuous ambient air quality monitoring program will be undertaken by collecting ambient air quality data from existing AQMS at Pluak Daeng Public Health Office of PCD and Mab Yang Pon Health Promoting Hospital of Amata City Industrial Estate (Rayong) during operation phase.
If one or more of the existing two continuous monitoring stations cease to operate – GPD is committed to install monitoring station(s) for the continuous ambient air quality monitoring purpose for the project to compensate for the non-operating continuous monitoring station(s).
5.1.1.2 Climate Change Thailand is one of the countries affected by climate change. From measurement data on the surface and in the atmosphere from nationwide meteorological stations indicates that the temperature in Thailand over the past 55 years (1955-2009) significantly increased. The annual average of the highest, average and the lowest temperature tend to increase 0.86, 0.95 and 1.45 degree Celsius, respectively. The impact that has occurred from climate change in Thailand can be summarized as follows

Environmental Report for submission to ADB Chapter 5
Pluak Daeng Power Plant Anticipated Environmental Impacts and Mitigations
RNP/ENV/P05028/FR (ADB)/RE62049-chap 5 Page 5-96
Impact on Water Resource Based on the assessment of climate change in the Mekong River Basin during the decade indicates that by the year 2030 there will be an increasing trend of rainfall in the northern part of Thailand during the dry season. In the eastern part, there will be a decrease in rainfall. However, it is anticipated that the total annual rainfall in Thailand will increases. In addition, it is forecasted that run-off and flooding will increase. Impact on Sea Level Rising Climate change will affect sea level especially in the area near the equator like Thailand as a result of the melting of ice and expansion of ocean water mass from rising sea temperature. The average sea level in the Gulf of Thailand is likely to increase. The data from 4 water-level station in the Gulf of Thailand collected more than 60 years (1895-2004) indicates that the average sea level is likely to increase at a rate of 3-5 mm per year. The 17-year satellite data (1993-2009) also shows the increasing rate of average sea level. As mentioned above, the effects of climate change on the project are focused on the aspect related to those climate change impacts like flooding. The project has considered the climate change impact in the project design, so the project is designed to cover the temperature range from 13.0 to 39.9 degree Celsius. The design point already considered the mean maximum temperature of 32.5 Celsius, which is above the mean temperature of 28.8 degree Celsius. The project is also designed to have stormwater pond capacity of 99,797 m3 calculated based on the 100 mm of rainfall/h x 3 hours, with c value of pre-project is 0.3 and c value of post-project is 0.7. The 3-hour rainfall for 10 year return period is 82 mm. Hence, the 300 mm rainfall design criteria are much more than the actual 82 mm rainfall and are enough to cover the climate change effect on rainfall precipitation of flood risk. This is to say, the impact of climate change on the project in terms of temperature rising, flooding and the storm will be at a low level.

Environmental Report for submission to ADB Chapter 5
Pluak Daeng Power Plant Anticipated Environmental Impacts and Mitigations
RNP/ENV/P05028/FR (ADB)/RE62049-chap 5 Page 5-97
5.1.1.3 Greenhouse Gas (GHGs) Fuel combustion for electricity generation is the main source of greenhouse gases (GHGs) emission for the Project. The quantities of GHG emissions will depend primarily on the consumption rate and heating value of the fuel used. The quantities of GHGs emission have been calculated using a simple mathematical model or equation together with the emission factors from the 2006 IPCC Guidelines for National Greenhouse Gas Inventories. Details are provided in Table 5.1.1-30. Almost of GHG emitting from the project is derived from engine combustion and the project has already prepared the mitigation measures to mitigate GHG emission as follows. Mitigation Measures
Regular inspection, maintenance, and repair shall be carried out for tools, machinery, and equipment to be in good condition at all times and maintenance manuals shall be continuously complied with.
Regular check and maintenance shall be performed for vehicles used in the project.
5.1.2 Noise and Vibration 5.1.2.1 Noise (1) Selection of representatives for assessment of noise impacts The project is located in Pluak Daeng Industrial Park, Map Yang Phon sub-district, Pluak Daeng district, Rayong province. Therefore, the land use pattern is the factory in a close building. The consultant selected potential monitoring stations which will be most affected by noise due to the project operation, namely houses outside Pluak Daeng Industrial Park and the ones closest to the project as the representatives for the assessment of noise impacts (Figure 5.1.2-1) as follows:
The house at the west of the project site (N2): it is located in village no. 2 , Map Yang Phon sub- district at the distance of about 243 m from the project boundary.

Environmental Report for submission to ADB Chapter 5
Pluak Daeng Power Plant Anticipated Environmental Impacts and Mitigations
RNP/ENV/P05028/FR (ADB)/RE62049-chap 5 Page 5-98
TABLE 5.1.1-30 GREENHOUSE GAS EMISSION FROM TRANSPORT OF PROJECT CONSUMPTION
Project Activities
Activity data Emission Factor Emission
Global Warming Potential 4/
Tonne CO2eq/yr Data
Working Duration
C=A*B A B D
Data Source 1/,2/,3/
E F
1. Construction Phase
1.1 Tap Water Used Water consumption 1,711 m3/day 365 day/yr 624,515 m3/yr 0.2722 Kg CO2eq/
m3
Thai National LCI
Database/MTEC - - - 169.99 C*D/1000
1.2 Wastewater Treatment
Septic tank B0 ; maximum CH4 producing capacity
0.6 kg CH4/kg
BOD - - - 0.3
kg CH4/kg BOD
=B0*MCF
IPCC 2006 Vol 5 Ch6.2.2
Domestic Wastewater
28.47 kg CH4/yr
=(U*T*EF)(TOW-S)-R)
25 0.71 E*F/1000
MCF ; methane correction factor
0.5 fraction - - - - - -
TOW ; total organics in wastewater in inventory year
94.9 kg BOD/yr - - - - - -
S ; organic component removed as sludge in inventory year
0 kg BOD/yr - - - - - -
Ui ; fraction of population in income group i in inventory year, See Table 6.5.
1 - - - - - - -
Ti,j ; degree of utilisation of treatment/discharge pathway or system, j, for each income group fraction i in inventory year, See Table 6.5.
1 - - - - - - -
R ; amount of CH4 recovered in inventory year
0 kg CH4/yr - - - - - -
1.3 Fuel combustion of diesel vehicles
Engine transportation ; trailer Loading Weight 32 tonne 365 day/yr 1,168,000 tonne-km/yr
0.0409 Kg CO2eq/ tonne-km
TGO,2015 - - - 47.77 C*D/1000
daily vehicle kilometers traveled, DVKT
100 vehicle-km - - -

Environmental Report for submission to ADB Chapter 5
Pluak Daeng Power Plant Anticipated Environmental Impacts and Mitigations
RNP/ENV/P05028/FR (ADB)/RE62049-chap 5 Page 5-99
TABLE 5.1.1-30
GREENHOUSE GAS EMISSION FROM TRANSPORT OF PROJECT CONSUMPTION (CONT’D)
Project Activities
Activity data Emission Factor Emission
Global Warming Potential 4/
Tonne CO2eq/yr Data
Working Duration
C=A*B A B D
Data Source 1/,2/,3/
E F
Worker transportation ; small truck Loading Weight 7 tonne 365 day/yr 1,226,400 tonne-km/yr
0.1402 Kg CO2eq/ tonne-km
TGO,2015 - - - 171.94 C*D/1000
daily vehicle kilometers traveled, DVKT
480 vehicle-km - - -
Equipment transportation ; trailer Loading Weight 32 tonne 365 day/yr 3,504,000 tonne-km/yr
0.0409 Kg CO2eq/ tonne-km
TGO,2015 - - - 143.31 C*D/1000
daily vehicle kilometers traveled, DVKT
300 vehicle-km - - -
Total 533.72 2. Operation Phase
2.1 Stationary combustion in processes
- Natural Gas Consumption 150,380.00 MMSCF/yr 365 day/yr - - 56,100.00 Kg CO2/TJ IPCC 2006 Vol 2
table 2.2 9,611,359,838.51 Kg CO2/yr 1
9,611,359.84
E*F/1000
162,260,020.00 MMBtu/yr - - - - 1 Kg CH4/TJ IPCC 2006 Vol 2
table 2.2 171,325.49 Kg CH4/yr 25 4,283.14 E*F/1000
171,325.49 TJ/yr - - - - 0.1 Kg N2O/TJ IPCC 2006 Vol 2
table 2.2 17,132.55 Kg N2O/yr 298 5,105.50 E*F/1000
(HHV of Natural Gas) 1,079 Btu/scf - - - -
- Diesel Consumption 25,893,000 L/yr 365 day/yr - - 0.0741 kgCO2/MJ IPCC 2006 Vol 2
table 2.2 69,839,635.32 Kg CO2/yr 1 69,839.64 E*F/1000
942,505,200.00 MJ/yr - - - - 0.000003 Kg CH4/MJ IPCC 2006 Vol 2
table 2.2 2,827.52 Kg CH4/yr 25 70.69 E*F/1000
(Heating Value of Diesel) 36.4 MJ/L - - - - 0.0000006 Kg N2O/MJ IPCC 2006 Vol 2
table 2.2 565.50 Kg N2O/yr 298 168.52 E*F/1000
2.2 Diesel fuel combustion of Stationary Pumps for Fire Protection
Diesel consumption 3,000 gallon/min 2 hr/yr 1,362,747.60 Litre/yr 2.708 Kg CO2eq/L IPCC 2006 Vol.2
table 2.2, DEDE
- - - 3,690.32 C*D/1000
2.3 Tap water used Water consumption 30 m3/day 365 day/yr 23,073,840.00 m3/yr 0.2722 Kg CO2 eq/
m3
Thai National LCI
Database/MTEC - - - 2.98 C*D/1000
2.4 Wastewater Treatment
Septic tank B0 ; maximum CH4 producing capacity
0.6 kg CH4/kg
BOD - - - 0.3
kg CH4/kg BOD
=B0*MCF
IPCC 2006 Vol 5 Ch6.2.2
Domestic Wastewater
28.47 kg CH4/yr
=(U*T*EF)(TOW-S)-R)
25 0.71 E*F/1000

Environmental Report for submission to ADB Chapter 5
Pluak Daeng Power Plant Anticipated Environmental Impacts and Mitigations
RNP/ENV/P05028/FR (ADB)/RE62049-chap 5 Page 5-100
TABLE 5.1.1-30
GREENHOUSE GAS EMISSION FROM TRANSPORT OF PROJECT CONSUMPTION (CONT’D)
Project Activities
Activity data Emission Factor Emission
Global Warming Potential 4/
Tonne CO2eq/yr Data
Working Duration
C=A*B A B D
Data Source 1/,2/,3/
E F
MCF ; methane correction factor
0.5 fraction - - - - - - - - -
TOW ; total organics in wastewater in inventory year
94.9 kg BOD/yr - - - - - - - - -
S ; organic component removed as sludge in inventory year
0 kg BOD/yr - - - - - - - - -
Ui ; fraction of population in income group i in inventory year, See Table 6.5.
1 - - - - - - - - - -
Ti,j ; degree of utilisation of treatment/discharge pathway or system, j, for each income group fraction i in inventory year, See Table 6.5.
1 - - - - - - - - - -
R ; amount of CH4 recovered in inventory year
0 kg CH4/yr - - - - - - - - -
2.5 Fuel combustion of gasoline and diesel vehicles
Commuting power plant personnel ; personal car
Gasoline consumption 57.12 L/day 365 day/yr 20,848.80 L/yr 2.2376 Kg CO2 eq/L IPCC 2006 Vol.2
table 3.2.1, 3.2.2, DEDE
- - - 46.65 C*D/1000
Solid wastes transportation ; small truck
Loading Weight 7 tonne 365 day/yr 25,550.00 tonne-km/yr
0.1402 Kg CO2
eq/tonne-km
TGO,2015 - - - 3.58 C*D/1000
daily vehicle kilometers traveled, DVKT
10 vehicle-km - - -
Transportation of sediment from water pre-treatment plant ; 10-wheeled trucks
Loading Weight 16 tonne 30 day/yr 115,200 tonne-km/yr
0.053 Kg CO2
eq/tonne-km
TGO, 2015 - - - 6.11 C*D/1000
daily vehicle kilometers traveled, DVKT
240 vehicle-km - - -

Environmental Report for submission to ADB Chapter 5
Pluak Daeng Power Plant Anticipated Environmental Impacts and Mitigations
RNP/ENV/P05028/FR (ADB)/RE62049-chap 5 Page 5-101
TABLE 5.1.1-30
GREENHOUSE GAS EMISSION FROM TRANSPORT OF PROJECT CONSUMPTION (CONT’D)
Project Activities
Activity data Emission Factor Emission
Global Warming Potential 4/
Tonne CO2eq/yr Data
Working Duration
C=A*B A B D
Data Source 1/,2/,3/
E F
Transportation of chemical ; Trailer Loading Weight 32 tonne 365 day/yr 2,803,200 tonne-km/yr
0.0409 Kg CO2
eq/tonne-km
TGO, 2015 - - - 114.65 C*D/1000
daily vehicle kilometers travelled, DVKT
240 vehicle-km - - -
Total 9,694,692.33 Source: 1/ IPCC Guideline For National Greenhouse Gas Inventories, 2006
2/ Emission Factor of National Metal and Materials Technology Center (MTEC), 2015 3/ Emission Factor of Thai National Life Cycle Inventory Database of Thailand Greenhouse Gas Management Organization (Public Organization) (TGO), 2015
4/ Global Warming Potential (GWP), the Fourth Assessment Report (AR4) in 2007, IPCC, 2007
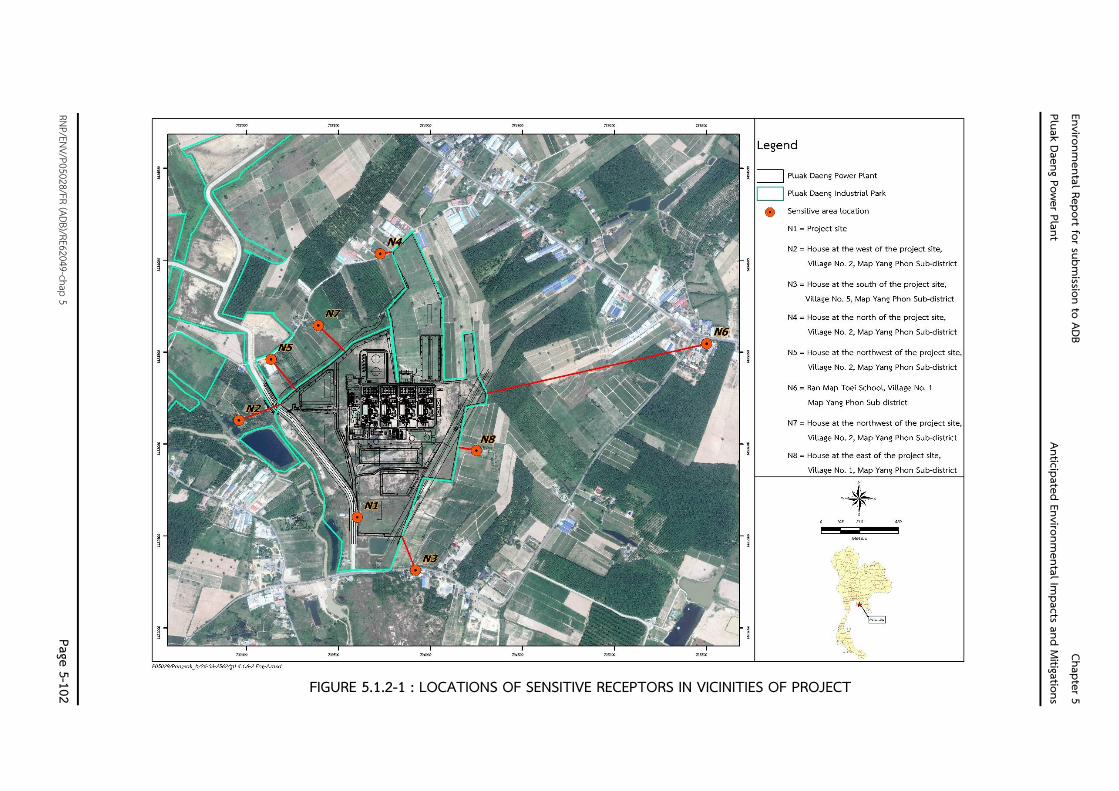
Environmental Report for subm
ission to ADB Chapter 5
Pluak Daeng Power Plant Anticipated Environm
ental Impacts and M
itigations
RNP/ENV/P05028/FR (ADB)/RE62049-chap 5 Page 5-102
FIGURE 5.1.2-1 : LOCATIONS OF SENSITIVE RECEPTORS IN VICINITIES OF PROJECT

Environmental Report for submissionto ADB Chapter 5
Pluak Daeng Power Plant Anticipated Environmental Impacts and Mitigations
RNP/ENV/P05028/FR (ADB)/RE62049-chap 5 Page 5-103
The house at the south of the project site (N3) : it is located in village no. 5, Map Yang Phon sub-district at the distance of about 193 m from the project boundary.
The house at the north of the project site (N4) : it is located in village no. 2, Map Yang Phon sub-district at the distance of about 71 km from the project boundary.
The house at the northwest of the project site (N5) : it is a rental house in village No. 2, Map Yang Phon sub-district at the distance of about 202 m. from project boundary.
The School at the northeast of the project site (N6): Ban Map Toei School is located in Village No. 1, Map Yang Phon sub-district at the distance of about 1,226 m. from project boundary.
The house at the northwest of the project site (N7): it is located in village No. 2, Map Yang Phon sub-district at the distance of about 195 m. from project boundary.
The house at the east of the project site (N8): it is located in village No. 1, Map Yang Phon sub-district at the distance of about 114 m from project boundary. (a) Environment and positions for installation of noise monitoring equipment
Details of the environment and positions for installation of noise monitoring equipment at six representatives monitoring stations are as follows:
The house at the west of the project site (N2): The measurement position is an open space, as shown in Photo 5.1.2-1 . The noise monitoring equipment is installed about 300 and 190 m from the roadside.
The house at the south of the project site (N3): The measurement position is a one- storey concrete house adjacent to an open space as illustrated in Photo 5.1.2-1. The noise monitoring equipment was installed about 22 m from the roadside and about 13 and 6 m from houses.
The house at the north of the project site (N4): The measurement position is a one-storey concrete house adjacent to open space as illustrated in Photo 5.1.2-2. The noise monitoring equipment was installed about 8 and 20 m from the roadside.

Environmental Report for submissionto ADB Chapter 5
Pluak Daeng Power Plant Anticipated Environmental Impacts and Mitigations
RNP/ENV/P05028/FR (ADB)/RE62049-chap 5 Page 5-104
The house at the west of the project site
(N2) The house at the south of the project site
(N3)
The house at the north of the project site
(N4) The house at the northwest of the project site
(N5)
Ban Map Toei School (N6) The house at northwest of the project site (N7)
PHOTO 5.1.2-1: GENERAL CONDITION OF NOISE MONITORING EQUIPMENT

Environmental Report for submission to ADB Chapter 5
Pluak Daeng Power Plant Anticipated Environmental Impacts and Mitigations
RNP/ENV/P05028/FR (ADB)/RE62049-chap 5 Page 5-105
Amendm
ent Report for Changes of Project Details
in the Environmental Im
pact Assessment Report Sriracha Power Plant
Gulf SRC Co , Ltd
The house at the northwest of the project site ( N5) : The measurement position is a one- storey concrete house adjacent to open space as illustrated in Photo 5.1.2-1. The noise monitoring equipment was installed about 15 m from the roadside and about 15 m from a commercial building.
Ban Map Toei School (N6) : The measurement position is a one-storey concrete house adjacent to open space as illustrated in Photo 5 .1 .2 -1 . The noise monitoring equipment was installed about 33 m from the roadside and about 18 m from school.
The house at the northwest of the project site ( N7) : The measurement position is a one- storey concrete house adjacent to open space as illustrated in Photo 5 .1 .2 - 1 . The noise monitoring equipment was installed about 100 m from the roadside and about 10 m from houses.
(b) Representatives of current noise levels Representatives of current noise levels for the assessment of noise impacts from the project operation are summarized in Table 5.1.2-1. (2) Construction phase (a) Assessment of noise impacts Construction activities, such as transportation of construction materials, operation of heavy machinery, pile driving, piping, etc. may generate noise that disturbs people in the sensitive receptor surrounding the project. The Manual for Environmental Impact Assessment of Canter (1997) specified five construction activities that cause Lmax, namely land levelling, excavation for foundation construction, foundation construction, structural and building construction and finishing/inspection. Details are given in Table 5.1.2-2. According to Table 5.1.2-2 , the power plant project is categorized as building and structure. Therefore, assessment of noise impacts is made in the worst-case scenario that the machinery or equipment are used concurrently for excavation for foundation construction at the distance of 15 m from the noise source of 89 dB(A). This is the representative of the noise level generated from construction activities.

Environmental Report for submission to ADB Chapter 5
Pluak Daeng Power Plant Anticipated Environmental Impacts and Mitigations
RNP/ENV/P05028/FR (ADB)/RE62049-chap 5 Page 5-106
Amendm
ent Report for Changes of Project Details
in the Environmental Im
pact Assessment Report Sriracha Power Plant
Gulf SRC Co , Ltd
TABLE 5.1.2-1 REPRESENTATIVES OF CURRENT NOISE LEVELS OF RECEPTOR AREAS
Sensitive Receptors Measurement Dates
Measurement Results (Leq. 24 hr)
Maximum Leq. 24 hr
Pluak Daeng Power Plant 13-20/03/2019 58.1-69.4 69.4 The house at the west of the project site (N2) 13-20/03/2019 52.3-56.8 56.8 The house at the south of the project site (N3) 13-20/03/2019 58.9-62.9 62.9 The house at the north of the project site (N4) 13-20/03/2019 57.2-58.4 58.4 The house at the northwest of the project site (N5) 8-15/03/2019 51.5-53.4 53.4 Ban Map Toei School (N6) 8-15/03/2019 56.2-77.1 68.61/ The house at the northwest of the project site (N7) 13-20/03/2019 48.7-51.1 51.1
Remark: 1/ Noise level of Leq 24 hr. at Ban Map Toei School on 13 March, 2019 during 07.40 am.-03.20 pm is higher than standard because on the measurement day has school activities such as educational activities, stage performance etc., that used an amplifier. Therefore, the noise level on that day will not be considered. The second highest noise level is considered as noise level at Ban Map Toei School.
TABLE 5.1.2-2 MAXIMUM NOISE LEVEL OF EACH CONSTRUCTION ACTIVITY, 15 METERS AWAY FROM
NOISE SOURCE Unit: Decibel (A)
Construction Activities
Types of Building/Structure
Residential Building
Office Building, Hotel, School and Public
Utilities
Factory, Parking Lot, Department and Service
Station
Road, Highway and Drainage
System
I II I II I II I II - Land leveling 83 83 84 84 84 83 84 84 - Excavation for foundation
construction 88 75 89 79 89 71 88 78
- foundation construction 81 81 78 78 77 77 88 88 - Structural and building
construction 81 65 87 75 84 72 79 78
- Finishing/inspection 88 72 89 75 89 74 84 84 Remarks: I = Maximum noise level in case the machinery and all pertinent equipment are used. II = Maximum noise level in case use of the machinery and equipment meet the minimum
requirement. Source: Carry W. Canter, Environmental Impact Assessment, 1997

Environmental Report for submission to ADB Chapter 5
Pluak Daeng Power Plant Anticipated Environmental Impacts and Mitigations
RNP/ENV/P05028/FR (ADB)/RE62049-chap 5 Page 5-107
Amendm
ent Report for Changes of Project Details
in the Environmental Im
pact Assessment Report Sriracha Power Plant
Gulf SRC Co , Ltd
(a.1) Calculation of noise level The equation used to calculate the maximum noise level at the
distance of 1 m or 15 m from the noise source for Leq 1 hr, Leq 8 hr, Leq 24 hr and noise annoyance in the sensitive receptor is given below.
Calculation of noise level for a certain period of time The following equation is used to calculate noise level from the noise source and converted it into the average noise level for a certain period of time.
LeqT = Lp + 10 log (1)
Where LeqT = Noise level occurs for a certain period of time (T) [dB(A)]
Lp = Noise level from noise source [dB(A)] t = Duration of noise from noise source (hour) T = Duration of noise needed to be known (hour)
Calculation of noise level from noise source to receiver Noise level at the distance of 1 m or 15 m from the noise source (machinery) is converted into the noise level that the person will be affected, using the following equation.
Lp2 = Lp1- 20 log ( ) ...................... (2)
Where Lp1 = Noise level measured at the distance r1 from a noise source
Lp2 = Noise level occurs at the distance r2 from a noise source
r1, r2 = Distance from noise source where Lp1 and Lp2 noise levels are measured, respectively.
Calculation of combined noise level A combined noise level generated from activities of the project and the noise level measured at the sensitive receptor is calculated using the following equation.
Lptotal = ...... (3)
T
t
1
2
r
r
n
1i
/10Lpi1010log

Environmental Report for submission to ADB Chapter 5
Pluak Daeng Power Plant Anticipated Environmental Impacts and Mitigations
RNP/ENV/P05028/FR (ADB)/RE62049-chap 5 Page 5-108
Amendm
ent Report for Changes of Project Details
in the Environmental Im
pact Assessment Report Sriracha Power Plant
Gulf SRC Co , Ltd
Where Lptotal = Combined noise level, dB(A) Lpi = Noise level from each noise source, dB(A) n = Number of noise sources (a.2) Noise impact during construction phase
Leq 8 hr and Leq 24 hr The loudest sound from the machinery or equipment used
for excavation for foundation construction will be considered for noise impact. The 89 dB(A) - Lmax at the distance of 15 m from the noise source is the representative of noise generated from construction activities for 8 working hours in the worst case scenario. Leq 1 hr, Leq 8 hr and Leq 24 hr is calculated as follows:
Leq 1 hr. = 89.0 + 10 log = 89.0 dB(A)
Leq 8 hr. = 89.0 + 10 log = 89.0 dB(A)
Leq 24 hr.= 89.0 + 10 log = 84.2 dB(A)
Noise impact on construction workers and staff at the construction site: Construction workers will expose to 89. 0 dB(A) of noise level from construction activities. Combined with the maximum Leq 8 hr measured in the current project location ( 5 1 . 0 dB(A) ) , it will reach into 89. 0 dB(A) . This noise level exceeds the standard stated in the Notification of Ministry of Labour B.E. 2561 re: the Standard of Noise Exposure in the Workplace. The standard determines that an average noise level for 8 consecutive working hours shall not exceed 85 dB(A) . To reduce the noise impact on construction workers or staff working in the noisy area, they are required to wear personal protective equipment, i.e. ear muffs and earplugs all the time. Therefore, the noise impact on construction workers or staff at the construction site is at a low level (negative impact level = 1). Noise impact on communities and sensitive receptors: The combined noise level between Leq 24 hr from construction activities and the current maximum measured noise level (Table 5 .1 .2 - 1 ) in the sensitive receptors closest the project area, i. e. the house in the east of the project at the distance of 263 m from the construction site at which pile driving is undertaken do not exceed the standard. As a result, noise impacts on communities, and the sensitive receptors are at a low level (Table 5.1.2-3).
1
1
8
8
24
8

Environmental Report for submission to ADB Chapter 5
Pluak Daeng Power Plant Anticipated Environmental Impacts and Mitigations
RNP/ENV/P05028/FR (ADB)/RE62049-chap 5 Page 5-109
Amendm
ent Report for Changes of Project Details
in the Environmental Im
pact Assessment Report Sriracha Power Plant
Gulf SRC Co , Ltd
Comparison of Noise Level Results and International Standard
The noise level assessment was done only daytime (08. 00-17.00 excepted lunchtime, 12.00-13.00) because the activities that caused loud noise such as piling will be limited only that period. There will be only activities which do not make a loud noise, e. g. , concrete casting that allowed to do at night time and the site will be illuminated enough for the work to be carried out safely in any cases. Total noise level at the house in the south of the project site (N3) and Ban Map Toei School (N6) will increase over 55 dB(A) . Considering only the periods having a total noise level over 55 dB(A) , the incremental noise level from background noise is not over 3 dB(A). Therefore, incremental noise from construction activities at those receptors complies with IFC noise level guidelines. But total noise level at the house at the west of project (N2) , the house at the north of the project (N4), the rental house at the northwest of the project (N5), the house at the northwest of the project site (N7), and the house at the east of the project site (N8) will increase over 55 dB(A) . Considering only the periods having total noise level over 55 dB(A), the incremental noise level from background noise is over 3 dB(A) which is exceeded the IFC noise level guidelines as shown in Table 5.1.2-3. Hence, temporary noise barriers shall be installed in the west, the east, the south and the north of the project where pile driving is undertaken. Metal sheets having a thickness of 1 . 27 mm (Steel 18 ga) or thicker will be selected. Optionally, other materials with sound transmission loss (TL) of 25 decibels (A) may be used (Table 5.1.2-4).
Total sound pressure level calculation at receptors after installation of noise barrier Total sound pressure level at receptors after installation of noise barrier calculated in case that a metal material with the thickness of 1.27 mm (Steel 18 ga) or thicker is used as a noise barrier. Its transmission loss is 25 dB(A). The calculation of noise level when it travels through the metal material conducted by computing Fresnel number from Equation (4).
N0 = 2(𝑎+𝑏−𝑐)
𝑤 (4)
Where N0 = Fresnel number a = Displacement from noise source to upper edge of wall (m) b = Displacement from upper edge of wall to receiver (m) c = Displacement from noise source to receiver (m) W = Sound wavelength (m) = v/f

Environmental Report for subm
isson to ADB Chapter 5
Pluak Daeng Power Plant Anticipated Environm
ental Impacts and M
itigations
RNP/ENV/P05028/FR (ADB)/RE62049-chap 5 Page 5-110
TABLE 5.1.2-3 NOISE STUDY RESULTS OF CONSTRUCTION PHASE
Unit: dB(A)
Sensitive Area
Distance from Pile Driving
Activity (m)
Leq 24 hr Leq 1 hr (Daytime)* Maximum existing
Construction Activity
Maximum existing + activity
construction
existing Construction Activity
existing + activity construction
Total Noise Level*– existing
1. The house at the west of the project site (N2)
594.3 56.8 52.2 58.1 46.1-61.5 57.0 57.3-62.8 1.3-11.2
2. The house at the south of the project site (N3)
701.0 62.9 50.8 63.2 57.3-69.7 55.6 59.5-69.9 0.2-2.2
3. The house at the north of the project site (N4)
530.0 58.4 53.2 59.5 56.6-63.4 58.0 60.4-64.5 1.1-3.8
4. The house at the northwest of the project site (N5)
420.7 53.4 55.2 57.4 48.6-57.7 60.0 60.3-62.0 4.3-11.7
5. Ban Map Toei School (N6) 1,512.5 68.6 44.1 68.6 56.2-83.3 48.9 56.9-83.3 0.0-0.7 6. The House at the northwest
of the project site (N7) 300.6 51.1 58.2 59.0 45.5-58.6 63.0 63.1-64.3 5.7-17.6
7. The House at the east of the project site (N8) **
263.0 60.2 59.3 62.8 53.9-79.1 64.1 64.5-79.2 0.1-10.6
National Standard 1/ 70 - - WHO Guideline (Residential;
institutional; education)2/ - 55 3
Remark: * Considered only the time having a total noise level over 55 dB(A). ** Additional assessment of Noise impact of house at east of the project site (N8) was conducted. The existing of noise level at the project site is selected to use in this assessment
due to closest to the N8. The maximum value of 24-hour average noise level at the project site is 73.9 dB(A) which is higher than the national standard. High level of noise on the measurement day ( 19 March 2019 between 08. 00- 12.00 am. ) caused from Pluak Daeng Industrial Park has activities such as washing, painting and using a blower with 50 meters far from the noise monitoring station. Thus, the second-highest value of 24-hour average noise level is selected which is 60.2 dB(A).
Source: 1/ Standard as prescribed in the National Environment Board’s Notification No. 15 re: Prescribing Noise Level Standard, B.E. 2540. 2/ Guidelines for Community Noise, World Health Organization (WHO), 1999.

Environmental Report for submission to ADB Chapter 5
Pluak Daeng Power Plant Anticipated Environmental Impacts and Mitigations
RNP/ENV/P05028/FR (ADB)/RE62049-chap 5 Page 5-111
Amendm
ent Report for Changes of Project Details
in the Environmental Im
pact Assessment Report Sriracha Power Plant
Gulf SRC Co , Ltd
TABLE 5.1.2-4 TRANSMISSION LOSS DUE TO USE OF SOUND ABSORBING MATERIALS
Materials Thickness
(mm)
Surface Density (Kg/m2)
Transmission Loss* (dB)
- Concrete block 200×200×400 light weight 200 151 34 - Dense concrete 100 244 40 - Light concrete 150 244 39 - Light concrete 100 161 36 - Brick 150 288 40 - Steel, 18 ga 1.27 9.8 25 - Steel, 20 ga 0.95 7.3 22 - Steel, 22 ga 0.79 6.1 20 - Steel, 24 ga 0.64 4.9 18 Remark: *Values assuming no openings or gaps in the barriers Source: Modified from Environmental Protection Department and Highways Department, Government of the
Hong Kong SAR., 2003
v = Speed of sound (m/sec) = 331.4 [1+ (Tc / 273.2)]1/2
Tc = Average temperature of the atmosphere. Source: 11 years of climate statistics of Huai Pong Meteorological Station = 28.0 Celcius degree
f = Frequency of sound wave = 550 Hz Noise barriers will be installed surrounding the piling working area at a distance of 10 m from the noisy machinery which is the noise source. The height of the noise barrier at each side should be 5 m, which is higher than the height of the affected receptor (1.5 m) (Figure 5.1.2-2). The calculation of the reduced noise level due to travel through the metal material is shown in Table 5. 1. 2-5 . Then use the resulting Fresnel number to calculate the reduced noise level after it travels through the metal material from the graph (Figure 5.1.2-3). After that, subtract the reduced noise level with the noise level generated from construction activities at the sensitive receptor will give the noise level that sensitive receptors will be exposed after installation of a noise barrier.

Environmental Report for submission to ADB Chapter 5
Pluak Daeng Power Plant Anticipated Environmental Impacts and Mitigations
RNP/ENV/P05028/FR (ADB)/RE62049-chap 5 Page 5-112
Amendm
ent Report for Changes of Project Details
in the Environmental Im
pact Assessment Report Sriracha Power Plant
Gulf SRC Co , Ltd
FIGURE 5.1.2-2 : DISTANCE AND DISPLACEMENT FOR CALCULATION OF REDUCED NOISE LEVEL DUE TO TRAVEL THROUGH TEMPORARY NOISE BARRIER
Four sides of the barriers are determined to be 5 m high from the ground. After installation of noise barriers, total noise level at the house at the west of project site (N2) , the house at the north of the project site (N4) , the house at the northwest of the project site (N5), the house at the northwest of the project site (N7), and the house at the east of the project site (N8) is still over 55 dB(A) . Considering only the periods having a total noise level over 5 5 dB( A) , the incremental noise level from background noise is not over 3 dB(A) . Therefore, incremental noise from construction activities at those receptors complies with IFC noise level guidelines, as shown in Table 5.1.2-6. In conclusion, the noise from construction activities of the project will result in increase in background noise over 3 dB(A) at close receptors, and the noise barrier surrounding the piling work area will be implemented to attenuate noise at receptors. Howerver, if there is a complaint, the project will take it into emergency complaint procedure in order to find a corrective solution to the problem.

Environmental Report for subm
isson to ADB Chapter 5
Pluak Daeng Power Plant Anticipated Environm
ental Impacts and M
itigations
RNP/ENV/P05028/FR (ADB)/RE62049-chap 5
Page 5-113
TABLE 5.1.2-5 DESCRIPTIONS OF TRANSMISSION LOSS DUE TO TRAVEL THROUGH METAL MATERIAL
Descriptions
The house at the west of project site
(N2)
The house at the north of
the project site (N4)
The house at the northwest of the project site
(N5)
The house at northwest of
the project site (N7)
The House at the east of the
project site (N8)
Displacement from noise source to the upper edge of wall (m) a=(d2+ga2)1/2 11.0 11.0 11.0 11.0 11.0
Displacement from the upper edge of wall to affected receptor (m)
b=(e2+gb2)1/2
584.3 520.0 410.7 290.6 253.0
Displacement from noise source to affected receptor (m) c 594.3 530.0 420.7 300.6 263.0 Distance from noise barrier to affected receptor (m) e 584.3 520.0 410.7 290.6 253.0 Height of noise barrier (m) f 5.0 5.0 5.0 5.0 5.0 Displacement from noise source to wall (m) d 10.0 10.0 10.0 10.0 10.0 Height from noise source to the upper edge of wall (m) ga=(f-0.5) 4.5 4.5 4.5 4.5 4.5 Height from affected receptor to the upper edge of wall (m) gb=(f-1.5) 3.5 3.5 3.5 3.5 3.5 Average temperature of atmosphere, Source: A 11-year period climate statistics (Celcius degree)
Tc 28 28 28 28 28
Speed of sound (m/sec) v =(331.4 [1+ (Tc / 273.2)]1/2)
348.0 348.0 348.0 348.0 348.0
Frequency of sound wave (Hz) F 550.0 550.0 550.0 550.0 550.0 Sound wavelength (m) W =(v/F) 0.6 0.6 0.6 0.6 0.6 Fresnel number N0 = 2
(a+b-c)/W 3.3 3.3 3.3 3.3 3.3
Reduced noise level due to travel through sound absorbing material (dB(A)) (Comparison with graph in Figure 5.1.2-3)
14.8 14.8 14.8 14.8 14.8

Environmental Report for submission to ADB Chapter 5
Pluak Daeng Power Plant Anticipated Environmental Impacts and Mitigations
RNP/ENV/P05028/FR (ADB)/RE62049-chap 5 Page 5-114
Amendm
ent Report for Changes of Project Details
in the Environmental Im
pact Assessment Report Sriracha Power Plant
Gulf SRC Co , Ltd
FIGURE 5.1.2-3: GRAPH SHOWING CORRELATION BETWEEN NOISE REDUCTION NUMBER OF METAL MATERIAL AND FRESNEL NUMBER

Environmental Report for subm
isson to ADB Chapter 5
Pluak Daeng Power Plant Anticipated Environm
ental Impacts and M
itigations
RNP/ENV/P05028/FR (ADB)/RE62049-chap 5 Page 5-115
TABLE 5.1.2-6 NOISE STUDY RESULTS OF CONSTRUCTION PHASE (IN CASE OF BARRIER INSTALLATION)
Unit: dB(A)
Sensitive Area Leq 1 hr (Daytime)*
Total Noise Level* – existing
existing Construction Activity after barrier installation
existing + activity construction
1. The house at the west of the project site (N2) 46.1-61.5 42.2 47.6-61.6 0.1-0.2 2. The house at the north of the project site (N4) 56.6-63.4 43.2 56.8-63.4 0.0-0.2 3. The house at the northwest of the project site (N5) 48.6-57.7 45.2 50.2-57.9 0.2-0.5 4. The house at the northwest of the project site (N7) 45.5-58.6 48.2 48.5-59.0 0.2-0.5
WHO Guideline (Residential; institutional; education)2/
55 <3
Remark: * Considered only the time having total noise level over 55 dB(A). Source: 1/ Standard as prescribed in the National Environment Board’s Notification No. 15 re: Prescribing Noise Level Standard, B.E. 2540. 2/ Guidelines for Community Noise, World Health Organization (WHO), 1999.

Environmental Report for submission to ADB Chapter 5
Pluak Daeng Power Plant Anticipated Environmental Impacts and Mitigations
RNP/ENV-P/P2809/FR (ADB)/RE62049-chap 5 Page 5-116
Amendm
ent Report for Changes of Project Details
in the Environmental Im
pact Assessment Report Sriracha Power Plant
Gulf SRC Co , Ltd
(3) Operation Phase The main noise sources during the operation phase will be power generation activity that the following equipment and machinery are used.
Gas turbine HRSG Steam turbine Generator The machinery of cooling tower Water pump for cooling water recirculation The water pump that feeds water to the steam generation system Electrical motor Air compressor Control valve and pipe system Gas compressor Transformer cooling fan
As for the project, tools, machinery, and equipment that cause low noise level with 85 dB(A) at a maximum at the distance of 1 m from the noise source of power generation are selected. This is exceptional for a cooling tower that the maximum noise level from the impact of water on the floor shall not exceed 91.0 dB(A) at a distance of 1 m. (Table 5.1.2-7)
Leq 8 hr and Leq 24 hr With regard to the noise impacts from the electricity generation on the employees working at the Project site, the devices, machines, and equipment used for generating electricity are the kinds that produce lower noise. Also, the Project requires that those working in the areas with prolonged exposure to loud noise use personal protective equipment such as ear muffs and earplugs at all time, as well as the time limit for working in the areas with the average sound pressure level of 85 dB(A) must not exceed 8 hr. As a result, the level of noise impacts on the employees of the Project was low. In this regard, some machines are placed inside the building enclosed with metal materials of about 0.64 mm thickness (steel, 24 ga) or more, yielding the transmission loss of 18 dB(A) as shown in Table 5.1.2-4, thus reducing their sound pressure level to 67 dB(A). These machines include gas turbines, steam turbines and generators.

Environmental Report for submission to ADB Chapter 5
Pluak Daeng Power Plant Anticipated Environmental Impacts and Mitigations
RNP/ENV/P05028/FR (ADB)/RE62049-chap 5 Page 5-117
TABLE 5.1.2-7 DISTANCES BETWEEN MACHINERY AND SENSITIVE RECEPTORS
Machinery
Noise Level from
Machinery (dB(A))
Distance from
Machinery (m)
Distance from Sensitive Receptor and Noise Source (m) Forecast Noise1/ dB(A) The house at the west of the project site (N2)
The house at the south of the project site (N3)
The house at the north of the project site (N4)
The house at the northwest of the project
site (N5)
Ban Map Toei School
(N6)
The house at the northwest of the project
site (N7)
The house at the east of the project site (N8)
The house at the west of the project site (N2)
The house at the south of the project site (N3)
The house at the north of the project site (N4)
The house at the northwest of the project
site (N5)
Ban Map Toei School
(N6)
The house at the northwest of the project
site (N7)
The house at the east of the project site (N8)
1. CT Blow down Transfer Pump
85 1.0 1064.4 1048.1 728.4 871.5 1515.1 672.7 473.5 24.5 24.6 27.8 26.2 21.4 28.4 31.5
2. Cooling Tower # 1 91 1.0 784.0 1015.6 724.8 608.0 1795.6 472.2 641.1 33.1 30.9 33.8 35.3 25.9 37.5 34.9
3. Cooling Tower # 2 91 1.0 981.0 997.1 750.1 804.3 1596.2 629.7 484.1 31.2 31.0 33.5 32.9 26.9 35.0 37.3
4. Steam Turbine #1 672/ 1.0 690.4 934.9 831.2 571.2 1887.5 507.0 663.6 10.2 7.6 8.6 11.9 1.5 12.9 10.6
5. Steam Turbine #2 672/ 1.0 790.2 910.9 827.1 662.5 1788.9 563.9 571.4 9.0 7.8 8.6 10.6 1.9 12.0 11.9
6. Steam Turbine #3 672/ 1.0 890.7 896.9 835.6 756.9 1689.8 632.5 481.8 8.0 7.9 8.6 9.4 2.4 11.0 13.3
7. Steam Turbine #4 672/ 1.0 991.7 894.0 856.4 853.2 1590.7 709.4 397.0 7.1 8.0 8.3 8.4 3.0 10.0 15.0
8. Generator # 1 85 1.0 688.6 915.9 851.0 580.4 1891.0 524.3 656.5 28.2 25.8 26.4 29.7 19.5 30.6 28.7
9. Generator # 2 85 1.0 788.7 891.5 846.7 670.4 1792.5 579.4 563.2 27.1 26.0 26.4 28.5 19.9 29.7 30.0
10. Generator # 3 85 1.0 889.3 877.8 854.6 763.5 1693.8 646.0 472.4 26.0 26.1 26.4 27.3 20.4 28.8 31.5
11. Generator # 4 85 1.0 990.4 874.8 874.9 859.1 1594.9 721.4 385.7 25.1 26.2 26.2 26.3 20.9 27.8 33.3
12. Gas Turbine # 1 672/ 1.0 687.2 897.1 870.6 589.9 1894.9 541.6 650.1 10.3 7.9 8.2 11.6 1.4 12.3 10.7
13. Gas Turbine # 2 672/ 1.0 787.4 872.1 866.6 678.7 1796.6 595.2 555.7 9.1 8.2 8.2 10.4 1.9 11.5 12.1
14. Gas Turbine # 3 672/ 1.0 888.2 857.9 874.4 770.8 1698.1 660.3 463.3 8.0 8.3 8.2 9.3 2.4 10.6 13.7
15. Gas Turbine # 4 672/ 1.0 989.4 854.8 894.3 865.7 1599.5 734.3 374.5 7.1 8.4 8.0 8.3 2.9 9.7 15.5
16. HRSG # 1 85 1.0 690.4 859.8 907.9 613.1 1898.7 577.1 635.3 28.2 26.3 25.8 29.2 19.4 29.8 28.9
17. HRSG # 2 85 1.0 790.9 834.2 904.5 699.7 1800.6 628.4 538.9 27.0 26.6 25.9 28.1 19.9 29.0 30.4
18. HRSG # 3 85 1.0 891.7 819.9 912.4 789.9 1702.7 690.9 444.1 26.0 26.7 25.8 27.0 20.4 28.2 32.1
19. HRSG # 4 85 1.0 992.4 817.9 931.2 882.3 1605.1 761.7 352.6 25.1 26.7 25.6 26.1 20.9 27.4 34.1
20. Air Compressor #1 85 1.0 822.5 767.5 967.8 756.0 1787.7 696.3 494.6 26.7 27.3 25.3 27.4 20.0 28.1 31.1
21. Air Compressor #2 85 1.0 822.9 761.4 974.0 759.2 1789.5 701.4 493.4 26.7 27.4 25.2 27.4 19.9 28.1 31.1
22. Air Compressor #3 85 1.0 823.5 755.3 980.1 762.5 1791.0 706.6 492.2 26.7 27.4 25.2 27.4 19.9 28.0 31.2
23 Gas Compressor Station # 1
85 1.0 840.6 758.0 975.4 774.5 1772.5 711.7 476.0 26.5 27.4 25.2 27.2 20.0 28.0 31.4
24. Gas Compressor Station # 2
85 1.0 841.3 749.4 984.1 779.0 1774.9 718.8 474.3 26.5 27.5 25.1 27.2 20.0 27.9 31.5
25. Gas Compressor Station # 3
85 1.0 842.2 740.9 992.7 783.6 1777.3 726.0 472.8 26.5 27.6 25.1 27.1 20.0 27.8 31.5

Environmental Report for submission to ADB Chapter 5
Pluak Daeng Power Plant Anticipated Environmental Impacts and Mitigations
RNP/ENV/P05028/FR (ADB)/RE62049-chap 5 Page 5-118
TABLE 5.1.2-7 DISTANCES BETWEEN MACHINERY AND SENSITIVE RECEPTORS (CONT’D)
Machinery Noise Level from
Machinery (dB(A))
Distance from
Machinery (m)
Distance from Sensitive Receptor and Noise Source (m) Forecast Noise1/ dB(A) The house at the west of the project site (N2)
The house at the south of the project site (N3)
The house at the north of the project site (N4)
The house at the northwest of the project
site (N5)
Ban Map Toei School
(N6)
The house at the northwest of the project
site (N7)
The house at the east of the project site (N8)
The house at the west of the project site (N2)
The house at the south of the project site (N3)
The house at the north of the project site (N4)
The house at the northwest of the project
site (N5)
Ban Map Toei School
(N6)
The house at the northwest of the project
site (N7)
The house at the east of the project site (N8)
26. Gas Compressor Station # 4
85 1.0 843.2 732.3 1001.4 788.3 1779.7 733.2 471.4 26.5 27.7 25.0 27.1 20.0 27.7 31.5
27. Gas MR Station 85 1.0 988.6 728.3 1016.4 912.5 1637.9 819.4 328.3 25.1 27.8 24.9 25.8 20.7 26.7 34.7 Total Noise Level from Noise Source to Sensitive Receptor3/ (dB(A)) 40.4 40.3 40.5 41.7 34.3 43.2 45.3 Standard Value4/ (dB(A)) 70
Remarks: 1/ Formula: Lp2 = Lp1 – 20 log (r2/r1) 2/ The machinery are placed in a close building equipped with a metal material having the transmission loss (TL) of dB(A))
(85-18 = 67 dB(A))
3/ Formula: Lptotal = 10log
N
1i
10/Lpi )10(
4/ The noise level standard in accordance with the Announcement of the National Environment Board, No. 15 (B.E. 2540)

Environmental Report for submission to ADB Chapter 5
Pluak Daeng Power Plant Anticipated Environmental Impacts and Mitigations
RNP/ENV/P05028/FR (ADB)/RE62049-chap 5 Page 5-119
Regarding the noise impacts of the Project on the seven noise-sensitive areas with different distances from the machinery as shown in Table 5.1.2-7, it is required that the 24-hr continuous sound pressure level of the electricity generation activities must be measured in the case where all machinery operates simultaneously, except for control valves and safety relief valves. The noise level at the sources is used to calculate the transmission loss by distance to the receivers, using this equation:
Lp2 = Lp1- 20 log ( )
For example, the noise level of a CT blow down transfer pump in the community, west of the project is calculated as follows: Lp1 = Noise level measured at the distance of 1 m from the noise
source (85 dB(A)) Lp2 = Noise level at the sensitive receptor r1 = Distance from the noise source that noise level is measured
(1 m) r2 = Distance from the noise source to the sensitive receptor (in the
community, west of the noise source 1,064.4 m)
Thus, noise level of CT blowdown transfer pump in the community, west of the project
= 85 – 20 log1,064.4
1 = 24.5 dB(A)
Then, the noise impacts of primary noise sources of electricity generation activities on the sensitive areas is combined with the current sound pressure level measurement result using the following equation:
Lptotal =
N
1i
10/1LP10log10
1
2
r
r

Environmental Report for submission to ADB Chapter 5
Pluak Daeng Power Plant Anticipated Environmental Impacts and Mitigations
RNP/ENV/P05028/FR (ADB)/RE62049-chap 5 Page 5-120
For example, a total noise level in the community, west of the project is calculated as follows: Lptotal in community, the west of project = 10 log(10(24.5/10)+10(33.1/10)+ 10(31.2/10)+10(10.2/10)
+10(9.0/10) +10(8.0/10)+10(7.1/10)+10(28.2/10)
+10(27.1/10)+10(26.0/10)+10(25.1/10)+10(10.3/10)
+10(9.1/10) +10(8.0/10) +10(7.1/10) +10(28.2/10) +10(27.0/10) +10(26.0 /10) +10(25.1/10) +10(26.7/10) +10(26.7/10) +10(26.7/10) +10(26.5/10) +10(26.5/10) +10(26.5/10) +10(26.5/10) +10(25.1/10))
= 40.4 dB(A) Where the power generation activity takes up 24 hours, noise level from this activity in the community, west of the project is calculated as follows:
Leq 1 hr = 40.4+ 10 log 1
1 = 40.4 dB(A)
Leq 24 hr= 40.4 + 10 log 24
24 = 40.4 dB(A)
Considering a total maximum Leq 24 hr from the field survey as illustrated in Table 5.1.2-1), it meets the standard as illustrated in Table 5.1.2-8.
Summary of noise impact forecast results during the operation phase Impact on staff in the project area: Noise level from the power generating machine at the distance of 1 m shall not exceed 85 dB(A). This is exceptional for a cooling tower that the noise level is determined at 91.0 dB(A). The power generating machine is designed to be installed in the building where the sound-reducing material is provided. These noise levels meet the standard stated in the Notification of Ministry of Labour, B.E.2561 re: the Standard of Noise Exposure in the Workplace. The standard determines that an average noise level for 8 consecutive working hours shall not exceed 85 dB( A) . Therefore, the noise impact is at a low level (Negative impact level = 1).

Environmental Report for submission to ADB Chapter 5
Pluak Daeng Power Plant Anticipated Environmental Impacts and Mitigations
RNP/ENV/P05028/FR (ADB)/RE62049-chap 5 Page 5-121
TABLE 5.1.2-8 FORECAST RESULTS OF NOISE IMPACT ON SENSITIVE RECEPTORS
DURING OPERATION PHASE
Noise-Sensitive Receptors
Leq 24 hr (dB(A)) Power
Generation Activity
Maximum Measurement
Values1/
Total Noise Level
1. The house at the west of the project site (N2) 40.4 56.8 56.9 2. The house at the south of the project site (N3) 40.3 62.9 62.9 3. The house at the north of the project site (N4) 40.5 58.4 58.5 4. The house at the northwest of the project site (N5) 41.7 53.4 53.7 5. Ban Map Toei School (N6) 34.3 68.6 68.6 6. The House at the northwest of the project site (N7) 43.2 51.1 51.8 7. The house at the east of the project site (N8) 45.3 60.2 60.3
Standard 702/ Remarks: 1/ Measurement results of the maximum Leq 24 hr during 8 th -15 th March 2019 and 13 th -20 th March
2019 from the field survey by Team Consulting Engineering and Management Co., Ltd., 2019 2/ The standard in accordance with the Announcement of the National Environment Board, No. 15 (B.E.
2540) on a determination of noise level in general. * Additional assessment of Noise impact of house at east of the project site (N8) was conducted. The
existing of noise level at the project site is selected to use in this assessment due to closest to the N8 . The maximum value of 24 -hour average noise level at the project site is 73 .9 dB(A) which is higher than the national standard. High level of noise on the measurement day ( 1 9 March 2019 between 08.00-12.00 am.) caused from Pluak Daeng Industrial Park has activities such as washing, painting and using a blower with 50 meters far from the noise monitoring station. Thus, the second-highest value of 24-hour average noise level is selected which is 60.2 dB(A).
Forecast results of Leq 24 hr and noise annoyance during the operation phase in communities in the west, the south and the north of the project: Leq 24 hr meets the standard. Hence, noise impact during the operation phase is at a low level. (Negative impact level = 1).

Environmental Report for submission to ADB Chapter 5
Pluak Daeng Power Plant Anticipated Environmental Impacts and Mitigations
RNP/ENV/P05028/FR (ADB)/RE62049-chap 5 Page 5-122
Comparison of Noise Level Results and International Standard Total noise level at the house at the west of the project site (N2) , the
house at the south of the project site (N3), the house at the north of project site (N4), the house at the northwest of the project site (N5), and Ban Map Toei School (N6) will increase over 55 and 45 dB(A) in daytime and nighttime respectively. Considering only the periods having a total noise level over 5 5 and 45 dB( A) , the incremental noise level from background noise is not over 3 dB(A). Therefore, incremental noise from operation of Pluak Daeng Power Plant at those receptors complies with IFC noise level guidelines. Only at the house at the northwest of the project site (N7) and the house at the east of the project site (N8) have total noise level over 55 and 45 dB(A), and at the periods having exceeded total noise level has incremental noise level over 3 dB(A) . It is exceeded IFC noise level guidelines as shown in Table 5.1.2-9. (1) Noise barrier Installation Measure during Operation Period As incremental noise is over 3 dB(A) at the house at the northwest and at the east of the project site (N7 and N8, respectively) , permanent noise barrier or planting trees as a noise barrier shall be installed at the northern fence and in the east next to power blocks (Figure 5.1.2-4) as follows: Case 1: The permanent noise barrier shall be installed at the northern fence of the project and in the east next to power blocks. Metal sheets having a thickness of 1 . 27 mm (Steel 18 ga) or thicker will be selected. Optionally, other materials with sound transmission loss (TL) of 25 dB(A) may be used (Table 5.1.2-4). The specification of noise barriers at each location is as follows.
At the northern fence of the project: the length of the noise barrier is 400 meters, and its height is 6.5 meters (Figure 5.1.2-4).
In the east next to power blocks: the length of the noise barrier is 350 meters, and its height is 5 meters (Figure 5.1.2-4).

Environmental Report for subm
isson to ADB Chapter 5
Pluak Daeng Power Plant Anticipated Environm
ental Impacts and M
itigations
RNP/ENV/P05028/FR (ADB)/RE62049-chap 5 Page 5-123
TABLE 5.1.2-9 NOISE STUDY RESULTS OF OPERATION PHASE
Sensitive Area
Noise from operation actitvity
Leq 1 hr (Daytime) Leq 1 hr (Nighttime)
existing existing + activity
operation
Total Noise Level* - existing
existing existing + activity
operation
Total Noise Level* - existing
1. The house at the west of the project site (N2) 40.4 46.1-61.5 47.1-61.5 0.0-0.1 39.9-61.1 43.2-61.1 0.0-1.2 2. The house at the south of the project site (N3) 40.3 55.6-71.1 55.7-71.1 0.0-0.1 47.1-60.7 47.9-60.7 0.0-0.8 3. The house at the north of the project site (N4) 40.5 53.8-64.0 54.0-64.0 0.0-0.1 40.2-62.0 43.4-62.0 0.0-1.7 4. The house at the northwest of the project site (N5) 41.7 46.1-57.7 47.4-57.8 0.1-0.2 35.8-56.5 42.7-56.6 0.1-2.5
5. Ban Map Toei School (N6) 34.3 53.6-83.3 53.7-83.3 0.0 43.9-65.1 44.4-65.1 0.0-0.3 6. The house at the northwest of the project site (N7) 43.2 41.0-60.8 45.2-60.9 0.1-0.3 36.2-51.3 44.0-51.9 0.63-4.57 7. The house at the east of the project site (N8) (outdoor) 45.3** 53.8-79.1 54.4-79.1 0.0-0.4 40.7-62.2 46.6-62.3 0.1-5.9 8. The house at the east of the project site (N8) (indoor) 35.3*** 53.8-79.1 53.9-79.1 0.0 40.7-62.2 41.8-62.2 0.0-0.5 WHO Guideline (Residential; institutional; education) 2/ 55 <3 45 <3
Remark : * Considered only the time having total noise level over 55 dB(A). ** Additional assessment of Noise impact of house at east of the project site (N8) was conducted. The existing of noise level at project site is selected to use in this assessment
becaue it is closest to the N8. *** Transmission Loss value after adsorbing by concrete block wall with fraction of 0.1% is approximately 10 dB(A) . Hence, noise level from project activities during operation
phase at the house at east of the project site is 35.3 dB(A) (45.3-10 = 35.3 dB(A)). Source: 1/ Standard as prescribed in the National Environment Board’s Notification No. 15 re: Prescribing Noise Level Standard, B.E. 2540. 2/ Guidelines for Community Noise, World Health Organization (WHO), 1999.

Environmental Report for subm
isson to ADB Chapter 5
Pluak Daeng Power Plant Anticipated Environm
ental Impacts and M
itigations
RNP/ENV/P05028/FR (ADB)/RE62049-chap 5 Page 5-124
FIGURE 5.1.2-4: PLANTING TREES AS NOISE BARRIER OR NOISE BARRIER

Environmental Report for submission to ADB Chapter 5
Pluak Daeng Power Plant Anticipated Environmental Impacts and Mitigations
RNP/ENV/P05028/FR (ADB)/RE62049-chap 5 Page 5-125
The calculation of the reduced noise level due to travel through the metal material is shown in Table 5.1.2-10. Then use the resulting Fresnel number to calculate the reduced noise level after it travels through the metal material from the graph ( Figure 5. 1. 2-5) . In conclusion, the installation of a noise barrier at both locations will help reduce the noise level from project activities. The noise level received by the house at the northwest and the east of the project site (N7 and N8, respectively) will be reduced from 43.2 dB(A) to 35.8 dB(A) at N7; and will be reduced from 45.3 dB(A) to 37.9 dB(A) at N8 as shown in Table 5. 1. 2-11. In addition, the total noise level at the house at the northwest and the east of the project site ( N7 and N8, respectively) will increase in background level less than 3 dB(A) in accordance with IFC noise level guidelines because background noise level has sometimes exceeded the standard. Case 1: The permanent noise barrier shall be installed at north of project fence. Metal sheets having a thickness of 1.27 mm (Steel 18 ga) or thicker will be selected. Optionally, other materials with sound transmission loss (TL) of 25 dB(A) may be used (Table 5.1.2-4). The length of the noise barrier is 400 meters. The calculation of the reduced noise level due to travel through the metal material is shown in Table 5.1.2-10. Then use the resulting Fresnel number to calculate the reduced noise level after it travels through the metal material from the graph (Figure 5.1.2-5). In conclusion, the installation of a noise barrier at the north of the project fence will help reduce the noise level from project activities. The noise level received by the house at the northwest of the project site (N7) will be reduced from 43.2 dB(A) to 35.8 dB(A) as shown in Table 5.1.2-11. Therefore, the total noise level at the house at the northwest of the project site (N7) will increase in background level less than 3 dB(A) in accordance with IFC noise level guidelines because background noise level has sometimes exceeded the standard.

Environmental Report for submission to ADB Chapter 5
Pluak Daeng Power Plant Anticipated Environmental Impacts and Mitigations
RNP/ENV/P05028/FR (ADB)/RE62049-chap 5 Page 5-126
TABLE 5.1.2-10 DESCRIPTIONS OF TRANSMISSION LOSS DUE TO TRAVEL THROUGH METAL MATERIAL
IN OPERATION PHASE
Descriptions The house at the northwest
of the project site (N7) Displacement from the noise source to the upper edge of the wall (m)
a 277.2
Displacement from the upper edge of the wall to an affected receptor (m)
b 195.1
Displacement from the noise source to the affected receptor (m)
c 472.2
Distance from noise barrier to the affected receptor (m) e 195.0 Height of noise barrier (m) f 6.5 Displacement from the noise source to the wall (m) d 277.2 Height from the noise source to the upper edge of the wall (m)
ga=(f-0.5) 4.5
Height from affected receptor to the upper edge of the wall (m)
gb=(f-1.5) 5.0
The average temperature of the atmosphere, Source: 11 years of climate statistics (Celcius degree)
Tc 28
Speed of sound (m/sec) v 348.0 Frequency of sound wave (Hz) F 550.0 Sound wavelength (m) W 0.6
Fresnel number N0 = 2 (a+b-c)/W
0.33
Reduced noise level due to travel through sound-absorbing material ( dB( A) ) ( Comparison with the graph in Figure 5.1.2-5)
7.4

Environmental Report for submission to ADB Chapter 5
Pluak Daeng Power Plant Anticipated Environmental Impacts and Mitigations
RNP/ENV/P05028/FR (ADB)/RE62049-chap 5 Page 5-127
Source: Modified from Rudy W. Hendriks, 1998
FIGURE 5.1.2-5: GRAPH SHOWING CORRELATION BETWEEN NOISE REDUCTION NUMBER OF METAL MATERIAL AND FRESNEL NUMBER IN OPERATION PHASE
Case 2: Planting trees as noise barrier shall be installed at the northern fence of the project and in the east next to power blocks. According to Technical Noise Supplement of California Department of Transportation ( 2009) , the planting trees with a thickness of 30 m and a height not lower than 5 m are able to attenuate 5 dB(A) of noise. If the project applies this planting tree with a length of 400 m at the northern fence and of 350 m in the east next to power blocks, noise level received by the House at northwest of the project site will be reduced from 43.2 dB(A) to 38.2 dB(A) at N7; and from 45.3 dB(A) to 40.3 dB(A), respectively as shown in Table 5. 1. 2- 11. Therefore, the total noise level at the house at the northwest and the east of the project site ( N7 and N8, respectively) will increase in background level less than 3 dB( A) in accordance with IFC noise level guidelines. Evaluation of noise impact on sensitive receptors was conducted by calculation, which can reflect the worst impact on receptors, because the calculation equation does not consider factors that attenuate noise such as geometrical divergence, ground effect, screening (berms, barriers, buildings, etc.), but it calculates noise directly from sources to receptors without consideration of those factors. However, during the construction and operation period, the project will ensure that incremental values do not exceed 3 dB(A) as per the IFC guidelines. In addition, noise mapping/noise contour will be created to determine the noisy area of the project in the first year of operation and every three years.

Environmental Report for subm
isson to ADB Chapter 5
Pluak Daeng Power Plant Anticipated Environm
ental Impacts and M
itigations
RNP/ENV/P05028/FR (ADB)/RE62049-chap 5
Page 5-128
TABLE 5.1.2-11 NOISE STUDY RESULTS OF OPERATION PHASE (IN CASE OF BARRIER INSTALLATION)
Sensitive Area
Noise form operation
Activity after barrier
installation/tree
Leq 1 hr (Daytime) Leq 1 hr (Nighttime)
existing
existing + activity
operation
Total Noise Level* - existing
existing
existing + activity
operation
Total Noise Level* - existing
Case 1: The permanent noise barrier
The house at the northwest of the project site (N7)
35.8 41.0-60.8 42.1-60.8 0.0-0.1 36.2-51.3 39.0-51.4 0.1-0.5
The house at the east of the project (N8)
37.9 53.8-79.1 53.9-79.1 0.0-0.1 40.7-62.2 42.5-62.2 0.0-1.8
Case 2: The tree as a noise barrier
The house at the northwest of the project site (N7)
38.2 41.0-60.8 42.8-60.8 0.0-0.1 36.2-51.3 40.3-51.5 0.2-1.0
The house at the east of the project site (N8)
40.3 53.8-79.1 54.0-79.1 0.0-0.2 40.7-62.2 43.5-62.2 0.0-2.8
WHO Guideline (Residential; institutional; education) 1/
- 55 <3 45 <3
Remark : * Considered only the time having total noise level over 55 dB(A). Source: 1/ Guidelines for Community Noise, World Health Organization (WHO), 1999.

Environmental Report for submission to ADB Chapter 5
Pluak Daeng Power Plant Anticipated Environmental Impacts and Mitigations
RNP/ENV/P05028/FR (ADB)/RE62049-chap 5 Page 5-129
Mitigation Measures (a) Construction Phase
Noisy construction equipment shall be only used during the daytime during 08.00-17.00 hr. If it is necessary to use such construction equipment outside the aforesaid period, permission or approval must be sought from involved agencies. Furthermore, adjacent communities and factories shall be notified 2 weeks in advance.
Relations campaigns shall be conducted to inform the nearby communities of the planned high level noise-generating construction activities together with noise control measures at least 2 weeks in advance before construction.
Regular inspection, maintenance, and repair shall be carried out for tools, machinery, and equipment to be in good condition at all times and maintenance manuals shall be continuously complied with.
A warning sign shall be installed in a noisy area. Personal protective equipment, e. g. earplugs or earmuffs, shall be provided for construction workers in the noisy area where the noise level exceeds 85 decibels (A) . Furthermore, construction workers shall be instructed to wear personal protective equipment in noisy areas.
Contractors shall be supervised to strictly adhere to noise mitigation measures. Equipment/ machinery generating low noise level will be used.
Temporary barriers will be installed at the pile driving areas in the west, the east, the south and the north of the project site. Preliminarily, a metal sheet of 1.27 millimeters thick onwards (Steel 18 ga) is chosen. Alternatively, other materials with sound transmission loss of 25 decibel (A) can be used. The height of four sidewalls in the west, the east, the south and the north will be 5 m high from the ground.
GPD will install continuous noise monitor at site boundary – location will be based on the high noise activities.
If there is a complaint, the project will take it into an emergency complaint procedure in order to find a corrective solution to the problem. (b) Operation Phase
A warning sign shall be installed in the noisy area, such as a combustion chamber of a gas turbine, where the noise level exceeds 85 decibels (A). The operator in the noisy area shall be worn or supervised to wear personal protective equipment, e.g., ear plugs or ear muffs.

Environmental Report for submission to ADB Chapter 5
Pluak Daeng Power Plant Anticipated Environmental Impacts and Mitigations
RNP/ENV/P05028/FR (ADB)/RE62049-chap 5 Page 5-130
The employee shall not work in areas where noise level exceeds 85 decibels (A) for more than 8 consecutive hours.
The average sound level of noisy machinery and equipment, such as gas turbine, steam turbine, and fuel gas compressor or sound absorption material shall not exceed 85 decibels (A) from the distance of 1 m.
Noisy machinery of Pluak Daeng Power Plant Project shall be installed with a silencer at the end of the pipe that may cause loud noise. Cover structure for machinery shall be built for a combustion chamber of a gas turbine, gas turbine generator, pump motor, and the Heat Recovery Steam Generator (HRSG) . A cooling unit fan shall cause low noise, etc.
Control the noise level at the area adjacent to the project’s fence to be no more than 70 dB(A).
A silencer shall always be checked and inspected for its efficiency. Noise mapping/noise contour shall be created to determine the
noisy area of the project in the first year of service and every three years. The staff of the power plant shall be trained at least once a year
for the understanding and good attitude and the right behaviour regarding occupational health and safety at work.
A Hearing Conservation Program shall be established to prevent staff from being exposed to loud noise for a prolonged period. For example, the duration of work shall be determined so that workers will be less exposed to loud noise. Also, alternation of shifts/ alternation of working days in the noisy area shall be made. The information shall be updated at least once a year.
Installing noise barrier with a height of 6. 5 m and a length of 400 m; and with a height of 5 m and a length of 350 m, which are made from a metal sheet of 1.27 millimeters thick onwards (Steel 18 ga) or other materials with sound transmission loss of 25 dB(A)at the northern fence of the project and in the east next to power blocks, respectively. Or planting the tree as noise barrier at the northern fence of the project and in the east next to power blocks with a height of 5.0 m, a thickness of 30 m and a length of 400 m and 350 m, respectively.

Environmental Report for submission to ADB Chapter 5
Pluak Daeng Power Plant Anticipated Environmental Impacts and Mitigations
RNP/ENV/P05028/FR (ADB)/RE62049-chap 5 Page 5-131
5.1.2.2 Vibration Vibration source levels from typical construction equipment are provided in Table 5.1.2-12. It presents average source levels in terms of velocity for various types of construction equipment measured under a wide variety of construction activities. The procedures on how to estimate construction vibration for damage and annoyance are provided below. (1) Assess for building damage for each piece of equipment individually. Construction vibration is generally assessed in terms of peak particle velocity (PPV) . The calculation of PPV is as follows.
- Determine the vibration source level (PPVref) for each piece of equipment at a reference distance of 25 ft as presented in Table 5.1.2-12. - Use Equation 1 to apply the propagation adjustment to the source reference level to account for the distance from the equipment to the receiver.
TABLE 5.1.2-12 VIBRATION SOURCE LEVELS FOR CONSTRUCTION EQUIPMENT
Equipment PPV
at 25 ft, in/sec Approximate Lv *
at 25 ft Pile Driver (impact) upper range 1.518 112 typical 0.644 104 Pile Driver (sonic) upper range 0.734 105 typical 0.17 93 Clam shovel drop (slurry wall) 0.202 94 Hydromill (slurry wall) in soil 0.008 66 in rock 0.017 75 Vibratory Roller 0.21 94 Hoe Ram 0.089 87 Large bulldozer 0.089 87 Caisson drilling 0.089 87 Loaded trucks 0.076 86 Jackhammer 0.035 79 Small bulldozer 0.003 58
Remark : * RMS velocity in decibels, VdB re 1 micro-in/sec Source : Transit Noise and Vibration Impact Assessment Manual, September 2018.

Environmental Report for submission to ADB Chapter 5
Pluak Daeng Power Plant Anticipated Environmental Impacts and Mitigations
RNP/ENV/P05028/FR (ADB)/RE62049-chap 5 Page 5-132
PPVequip = PPVref x(25
D)1.5
Equation 1
where:
PPVequip = the peak particle velocity of the equipment adjusted for distance, in/sec PPVref = the source reference vibration level at 25 ft, in/sec D = distance from the equipment to the receiver, ft
(2) Annoyance Assessment Assess for annoyance for each piece of equipment individually. Ground-borne vibration related to human annoyance is related to rms velocity levels, expressed in VdB. Estimate the vibration level (Lv) using Equation 2.
Lv.distance = Lv.ref x30 𝑙𝑜𝑔 (𝐷
25)
where:
Lv.distance = the rms velocity level adjusted for distance, VdB
Lv.ref = the source reference vibration level at 25 ft, VdB D = distance from the equipment to the receiver, ft Compare the predicted vibration levels from the Quantitative Construction Vibration Assessment with impact criteria to assess the impact of construction vibration. Compare the PPV and approximate Lv for each piece of equipment determined, the vibration damage criteria in Table 5.1.2-13, which is presented by the building/structural category, to assess impact.

Environmental Report for submission to ADB Chapter 5
Pluak Daeng Power Plant Anticipated Environmental Impacts and Mitigations
RNP/ENV/P05028/FR (ADB)/RE62049-chap 5 Page 5-133
TABLE 5.1.2-13 CONSTRUCTION VIBRATION DAMAGE CRITERIA
Building/ Structural Category PPV, in/sec Approximate Lv* I. Reinforced-concrete, steel or timber (no plaster) 0.5 102 II. Engineered concrete and masonry (no plaster) 0.3 98 III. Non-engineered timber and masonry buildings 0.2 94 IV. Buildings extremely susceptible to vibration damage 0.12 90
Remark: * RMS velocity in decibels, VdB re 1 micro-in/sec Source: Transit Noise and Vibration Impact Assessment Manual, September 2018.
Considering vibration at houses and the school near the project site as shown in Table 5.1.2-14, the vibration from pile-driving does not damage them even they are building extremely susceptible to vibration damage.
TABLE 5.1.2-14 IMPACT ASSESSMENT OF VIBRATION FROM PILE DRIVING
Receptor Distance from Pile Driving
Activity PPV,
in/sec Approximate
Lv (m) (ft)
1. The house at the west of project site (N2)
594.3 1,949.80 0.0022 55.24
2. The house at the south of the project site (N3)
701.0 2,299.87 0.0017 53.09
3. The house at the north of the project site (N4)
563.0 1,847.11 0.0024 55.94
4. The house at the northwest of the project site (N5)
420.7 1,380.25 0.0037 59.74
5. Ban Map Toei School (N6) 1,512.5 4,962.27 0.0005 43.07 6. The house at the northwest of
the project site (N7) 300.6 9,86.22 0.0061 64.12
7. The house at the east of the project site (N8)
263.0 862.86 0.0075 65.86

Environmental Report for submission to ADB Chapter 5
Pluak Daeng Power Plant Anticipated Environmental Impacts and Mitigations
RNP/ENV/P05028/FR (ADB)/RE62049-sec-5.1.3 Page 5-134
5.1.3 Surface Water Hydrology (1) Construction Phase During the construction phase, wastewater sources will be bathrooms and toilets of construction workers. Wastewater will be treated by a septic tank or a prefabricated wastewater treatment system, installed at the project office. The effluent will be released into an inspection pond (capable of holding water for at least 1 day) to ensure that the effluent from the project meets the effluent quality standards of Building Type C according to the Notification of the Ministry of Natural Resources and Environment on Establishment of Building Effluents Standards for some Building Types and Sizes before discharging outside. The effluent quality will be checked once a month. During the construction phase, there will be approx. 3,200 construction workers and staff who use 224 m3/day of water, or 70 l/person/day. Wastewater volume will be 179.2 m3/day, or 80% of water use (Thongchai Phansawat, 1987) . Contractors shall provide bathrooms and toilets for construction workers and construction supervision staff ( 15 persons per 1 bathroom/ toilet (Source: Ministerial Regulation, No.63 (B.E.2551) issued by virtue of the Building Control Act, B.E. 2552). As for water discharge from the hydrostatic test each time, it will be about 180 m3. After the test is completed, the characteristics of hydrostatic test water discharges will be checked: pH, temperature, total suspended solids, oil, and grease for compliance with the standards of Pluak Daeng Industrial Park. After that, it will be conveyed to the central wastewater treatment system of the Industrial Park. Therefore, the project construction will affect surface water hydrology at a low level (Negative impact level = 1). (2) Operation Phase During the operation phase, wastewater includes effluent from the cooling tower and wastewater from the power generation process. The project provides the cooling water holding pond to inspect the effluent before draining into the cooling water holding pond of Pluak Daeng Industrial Park. Wastewater from power generation process and others will be treated in accordance with the requirements of Pluak Daeng Industrial Park before draining into the central wastewater treatment system of Pluak Daeng Industrial Park. Moreover, the impact of cooling water discharge analyzed the streamflow pattern in the project area, using MIKE 11 HD model to analyze floods at different return periods, from 5 years to 100 years, for both pre- and post-project conditions. The analysis results regarding flood level changes due to the discharge of cooling water from Pluak Daeng

Environmental Report for submission to ADB Chapter 5
Pluak Daeng Power Plant Anticipated Environmental Impacts and Mitigations
RNP/ENV/P05028/FR (ADB)/RE62049-sec-5.1.3 Page 5-135
Power Plant showed that cooling water discharge of the project will not cause any increase in the maximum flood level. The project’s cooling water discharge volume is very small. When compared to the flood volume from the upstream areas at 5 - to 100-year return periods, it is found that the maximum flood level is in the range of 90.4 – 141.4 m3/s. This is much higher than the project’ s cooling water volume ( 0 . 142 m3/ s) which is equivalent to about 0.16% and 0.10% of the maximum flood volume at return periods of 5 years and 100 years, respectively. As a result, it will not cause trouble to water bodies around the project area, and the hydrological impact is expected at a low level (Negative impact level = 1).
5.1.4 Surface Water Quality (1) Construction Phase Wastewater generated during the construction phase of the project will be about 234.2 m3/day, which consists of (1) 55 m3/day of uncontaminated wastewater from construction activities collected and conveyed to the wastewater pond for inspection for compliance with the requirements of Pluak Daeng Industrial Park before discharging into the central wastewater treatment system of the Industrial Park; (2) 179.2 m3/day of wastewater from utilization and consumption of construction workers which will be collected and conveyed to a septic tank or the prefabricated wastewater treatment system for standard treatment; (3) 180 m3 of water discharges from the hydrostatic test of natural gas pipeline and fuel pipeline (do not occur every day but only when the hydrostatic test is performed, and this test is performed 1 time). As for rainfall within the project area, it will be collected in the storm drains and conveyed to a temporary sedimentation pond. The temporary sedimentation pond will store and allow sedimentation of rainfall within the project area. Settleable solids will be separated from rainfall. Clearwater will be used to spray the project area to reduce the diffusion of dust. The remaining water will be drained into the storm drains of Pluak Daeng Industrial Park. As a result, it will not affect water quality in the areas nearby the project. (2) Operational Phase (a) Wastewater from the power generation process Wastewater from the power generation process consists of the effluent from the cooling tower, wastewater from the water treatment plant, wastewater from the laboratory and wastewater from utilization and consumption. As the project is located in Pluak Daeng Industrial Park, wastewater management shall have adhered to environmental

Environmental Report for submission to ADB Chapter 5
Pluak Daeng Power Plant Anticipated Environmental Impacts and Mitigations
RNP/ENV/P05028/FR (ADB)/RE62049-sec-5.1.3 Page 5-136
impact prevention and mitigation measures of Pluak Daeng Industrial Park. According to Pluak Daeng Industrial park, wastewater shall be separated into two parts: (1) wastewater from power generation process, consisting of wastewater from the water treatment system, wastewater from the laboratory and sanitary wastewater. After being treated, the wastewater will be conveyed to the central wastewater treatment system of Pluak Daeng Industrial Park and (2) the effluent from the cooling tower from the cooling water system of the power plant, which will be held in the cooling water holding pond and carried to the cooling water holding pond of Pluak Daeng Industrial Park. The effluent from these 2 parts will be drained into Huai Phu Sai. Huai Phu Sai converges into Khlong Lek and Huai Wang Krarok before flowing into Dok Krai Reservoir. Pluak Daeng Industrial Park will not release the effluent from the central wastewater treatment system in the dry season. Therefore, the evaluation of the impact on water quality is divided into two parts.
Effluent from the cooling tower The effluent from the cooling tower is slightly dirty. The effluent temperature is about 34 degrees Celcius. It also contains total dissolved solids ( TDS) generated from a chemical substance used for water treatment. The chemical substance does not have a high concentration, and it is the general chemical substance for water treatment. As Pluak Daeng Power Plant Project is located in Pluak Daeng Industrial Park, it shall adhere to environmental impact prevention and mitigation measures regarding surface water quality. According to EIA report of Pluak Daeng Industrial Park Project (First Extension Phase) , after being treated, the effluent will be released into Huai Phu Sai in the dry season (November-April). (Appendix 3S).
Pluak Daeng Industrial Park shall not release the effluent from the central wastewater treatment into Huai Phu Sai.
Effluent quality from the cooling water holding pond of the power plant’s cooling tower shall be controlled as follows: - BOD shall not exceed 15 mg/l - Dissolved oxygen shall be 4 mg/l at a minimum. - TDS shall not exceed 1,300 mg/l

Environmental Report for submission to ADB Chapter 5
Pluak Daeng Power Plant Anticipated Environmental Impacts and Mitigations
RNP/ENV/P05028/FR (ADB)/RE62049-sec-5.1.3 Page 5-137
Additionally, wastewater management measures for Independent Power Producer (IPP) shall be applied. The effluent from the cooling tower shall meet the Notification of the Ministry of Industry, B. E. 2560 (2017) , dated 30 May 2017 Regarding Determination of Effluent Standards for Industrial Plants, published in the Royal Government Gazette, Vol. 134, Part 153, dated 7 June B.E.2560 (2017) on determination quality of wastewater discharged from factories. Hence, the management of wastewater from the power generation process of the power plant shall comply with the measures of Pluak Daeng Industrial Park. Wastewater from the power plant shall be divided into two groups. (1) Wastewater from the power generation process: It comprises wastewater from the water treatment system, wastewater from the laboratory, and sanitary wastewater. After receiving treatment and quality inspection, it shall be conveyed to the central wastewater treatment system of Pluak Daeng Industrial Park. (2) Effluent from the cooling system of the power plant: After being stored in the cooling water holding pond of the project and receiving quality inspection for compliance with the Notification of the Ministry of Industry, B.E.2560 (2017), dated 30 May 2017 Regarding Determination of Effluent Standards for Industrial Plants, published in the Royal Government Gazette, Vol. 134, Part 153, dated 7 June B. E. 2560 ( 2017) on determination quality of wastewater discharged from factories, it shall be carried to the cooling water holding pond of Pluak Daeng Industrial Park. These two groups of effluent will be released to Huai Phu Sai (Effluent from the central wastewater treatment system shall not be discharged in the dry season. ) by Pluak Daeng Industrial Park. Huai Phu Sai (a brook) converges into Khlong Lek (a brook) and Huai Wang Krarok (a brook) before flowing into Dok Krai Reservoir. A comparison diagram of the effluent temperature of the project and effluent from Pluak Daeng Industrial Park and Huai Phu Sai is shown in Figure 5.1.4-1. Based on the analysis report of impacts from BOD and TDS in the effluent from the power plant project in Pluak Daeng Industrial Park on water quality of Huai Phu Sai and Dok Krai Reservoir (December 2015), as shown in Appendix 4F-1, the impacts will be at a low level.

Environmental Report for submission to ADB Chapter 5
Pluak Daeng Power Plant Anticipated Environmental Impacts and Mitigations
RNP/ENV/P05028/FR (ADB)/RE62049-sec-5.1.3 Page 5-138
FIGURE 5.1.4-1: COMPARISON DIAGRAM OF EFFLUENT FROM PROJECT AND EFFLUENTS FROM PLUAK DAENG INDUSTRIAL PARK AND HUAI PHU SAI
a. Scoping study of impacts from effluent from the cooling tower
The study of impacts from BOD and TDS in the effluent from the cooling tower of the project on Huai Phu Sai and Dok Krai Reservoir compared with existing conditions (without the project) both in the rainy and the dry season
The study of impact from SAR in the effluent from the cooling tower of the project on Huai Phu Sai and Dok Krai Reservoir
Monitoring stations for the analysis of BOD and TDS impacts are as follows:
- Station 1: Huai Phu Sai, about 4 km upstream of the project
Cooling Water Holding Pond of Project
Cooling Water Holding Pond of Pluak Daeng Industrial Park
Existing condition of Huai Phu Sai (a brook) Temperature in the rainy season: 27.2 - 27.7 oC Temperature in the dry season: 30.5 - 37.0 oC
Wastewater Pond of Project
Central Wastewater Treatment System of Pluak Daeng Industrial Park
Temperature ≤34 oC
Wastewater Pond of Pluak Daeng Industrial Park
Temperature ≤45 oC
Temperature ≤40 oC
Temperature ≤34 oC

Environmental Report for submission to ADB Chapter 5
Pluak Daeng Power Plant Anticipated Environmental Impacts and Mitigations
RNP/ENV/P05028/FR (ADB)/RE62049-sec-5.1.3 Page 5-139
- Station 2: Huai Phu Sai in front of the project location - Station 3: Huai Phu Sai, about 3 km downstream of the
project location - Station 4: Dok Krai Reservoir, about 1 km from the
entrance of Huai Phu Sai - Station 5: Dok Krai Reservoir, about 2 km from the
entrance of Huai Phu Sai
1) Source of data The data of pH, electrical conductivity, BOD, DO, TDS, Na, Ca, Mg, in Huai Phu Sai and Dok Krai Reservoir and the discharge rate of Pluak Daeng Industrial Park in the rainy season are obtained from the analysis of impacts from BOD and TDS in the effluent of the power plant project in Pluak Daeng Industrial Park (December, 2015) (as shown in Appendix 4F-1)
2) Criteria for analysis of impacts from BOD and TDS in the effluent Criteria for analysis of impacts from potential BOD and TDS in the effluent on surface water quality are as follows:
Effluent from the cooling system: The overall analysis is made: The effluent from the cooling system of the project is released from Pluak Daeng Industrial Park into Huai Phu Sai and Dok Krai Reservoir.
- The maximum effluent rate of the project is 11, 660 m3/day or 0.135 m3/sec (natural gas as fuel scenario: 100% Load).
The maximum effluent rate of Pluak Daeng Industrial Park, which excludes the one from the project is 1,111 m3/day or 0.013 m3/sec. The discharge shall be done in the rainy season only (May-October).
The flow rate of Huai Phu Sai in each season was as follows: - The average flow rate in the rainy season was 3 . 5 2
m3/sec. (Measurements in the rainy season: August 12th-16th, 2015).

Environmental Report for submission to ADB Chapter 5
Pluak Daeng Power Plant Anticipated Environmental Impacts and Mitigations
RNP/ENV/P05028/FR (ADB)/RE62049-sec-5.1.3 Page 5-140
- The average flow rate in the dry season was 0 . 5 8 m3/sec. (Measurements in the dry season: April 14th-16th, 2015).
Water quality parameters: TDS (total dissolved solids) and BOD in the effluent were used for the analysis of impacts on surface water quality.
Analysis of impacts: Considerations were made for the following issues.
- TDS: The analysis was made for water quality, and utilization of water bodies, such as utilization and consumption, cultivation, etc.
- BOD: The analysis was made for surface water quality in terms of classification of water bodies and the utilization of water bodies
- TDS and BOD: Results of the analysis were further analyzed for continuous impacts on aquatic ecology, fisheries, and water animal production.
3) Water quality of Huai Phu Sai and Dok Krai Reservoir Based on the analysis of impacts from BOD and TDS in the effluent from the power plant project in Pluak Daeng Industrial Park, measurement of water quality in Huai Phu Sai and Dok Krai Reservoir was made on August 3rd, 2015 ( the rainy season) . The measurement result was compared with the one measured in March 2019 (the dry season) (Appendix 4F-2). It was found that TDS and BOD in the dry season are higher than the one in the rainy season. Therefore, measurement results in the dry season were used for the analysis of impacts in the rainy and the dry seasons. In the worst-case scenario, the levels of pH, DO and BOD in Huai Phu Sai and Dok Krai Reservoir are as follows:
Huai Phu Sai 1) Upstream of the project
pH = 8.4 Electrical Conductivity = 2,406 S/cm TDS = 1,304.5 mg/l DO = 10.4 mg/l

Environmental Report for submission to ADB Chapter 5
Pluak Daeng Power Plant Anticipated Environmental Impacts and Mitigations
RNP/ENV/P05028/FR (ADB)/RE62049-sec-5.1.3 Page 5-141
BOD = 6 mg/l 2) In front of the project location
pH = 7.2 Electrical Conductivity = 1,841 S/cm TDS = 931.7 mg/l DO = 3.9 mg/l BOD = 4 mg/l
3) About 3 km downstream of the project pH = 7.6 Electrical Conductivity = 543 S/cm TDS = 313.3 mg/l DO = 5.6 mg/l BOD = 4 mg/l
Dok Krai Reservoir 1) In Dok Krai Reservoir, about 1 km from the entrance
of Huai Phu Sai pH = 8.8 Electrical Conductivity = 371.6 S/cm TDS = 226.7 mg/l DO = 6.1 mg/l BOD = 4 mg/l
2) In Dok Krai Reservoir, about 2 km from the entrance of Huai Phu Sai pH = 8.7 Electrical Conductivity = 984 S/cm TDS = 220.5 mg/l DO = 5.4 mg/l BOD = 3 mg/l
Water quality measurements from 5 monitoring stations yield the following results.

Environmental Report for submission to ADB Chapter 5
Pluak Daeng Power Plant Anticipated Environmental Impacts and Mitigations
RNP/ENV/P05028/FR (ADB)/RE62049-sec-5.1.3 Page 5-142
The electrical conductivity in Dok Krai Reservoir was less than the one in Huai Phu Sai and the electrical conductivity and TDS in Huai Phu Sai, downstream from the project location, was less than the one in front of the project location. This is because TDS in front of Pluak Daeng Power Plant Project may consist of biodegradable organic material with low electrical conductivity and dark brown water. However, clear yellow water was found in other areas. Chemical fertilizer was applied in the agriculture area, downstream of the project. Also, high-density communities were found along the stream and near the golf courses.
BOD in Huai Phu Sai was higher than 2 mg/l. It is categorized as the surface water source, Class 5 according to the announcement of the National Environment Board, No. 8 , B. E. 2 5 3 7 . That is to say, it is the water source receiving wastewater from some kinds of activities and can be used for transportation. This means water bodies may be affected by wastewater from communities, agriculture area and golf courses around Huai Phu Sai and Dok Krai Reservoir. Nonetheless, measurement results reveal that DO at all monitoring stations was nearly or higher than 4 mg/ l according to Surface Water Quality Standards, Class 3. In Huai Phu Sai, in front of the project location, DO was 3. 9 mg/ l, and at the downstream of the project location, DO was 5. 6 mg/ l In addition to this, DO at monitoring stations in Dok Krai Reservoir was 6.1 mg/l and 5.4 mg/l, respectively. It indicates unpolluted water with no unpleasant smell. This is in line with the view of people living near Huai Phu Sai and those who fish at Dok Krai Reservoir that the water had not been polluted or stinking. The above measurement results of BOD and DO indicate that Huai Phu Sai is classified as surface water source Class 5 which is the water source receiving wastewater from some kinds of activities and can be used for transportation.
4) Quality of effluent from Pluak Daeng Industrial Park According to environmental impact prevention and mitigation measures of Pluak Daeng Industrial Park, the discharge rate and quality of effluent are as follows:
The discharge rate equals 0.013 m3/sec The discharge shall be done in the rainy season only, from May to October.
BOD shall not exceed 15 mg/l TDS shall not exceed 3,000 mg/l and DO should larger than
2 mg/l

Environmental Report for submission to ADB Chapter 5
Pluak Daeng Power Plant Anticipated Environmental Impacts and Mitigations
RNP/ENV/P05028/FR (ADB)/RE62049-sec-5.1.3 Page 5-143
5) Quality of effluent discharged from the project The effluent from the cooling system of the project: TDS shall not exceed 1,300 mg/l, BOD shall not exceed 2 mg/l (Water use treatment shall be similar to portable water with DO of about 4 mg/l)
6) Analysis of surface water quality from BOD and TDS in the effluent released from the cooling tower into Huai Phu Sai ( through drainage from Pluak Daeng Industrial Park). The calculation for the combination of BOD and TDS with effluent
C Total = C1Q1+C2Q2+C3Q3
Q1+Q2+Q3
C = Concentration of BOD or TDS in Huai Phu Sai after the effluent combines with water in Huai Phu Sai C1 = BOD or TDS of water in Huai Phu Sai before combining with the effluent C2 = BOD or TDS of the effluent from Pluak Daeng Industrial Park C3 = BOD or TDS of the effluent from the project Q1 = Flow rate in Huai Phu Sai before combining with th effluent Q2 = Flow rate of the effluent from Pluak Daeng Industrial Park Q3 = Flow rate of the effluent from the project Total Q in Huai Phu Sai Total Q in the dry season = Q1 + Q2 + Q3 = 0.58 + 0 + 0.135
= 0.715 m3/sec Total Q in the rainy season = 3.52 + 0.013 + 0.135 = 3.67 m3/sec In the dry season (November-April, totaling six months) : No drainage of effluent from Pluak Daeng Industrial Park. Q2 = 0. Total BOD in Huai Phu Sai in front of the project location
Total BOD in the dry season = (0.58×4)+(0×15)+(0.135×2)
0.715
= 3.62 mg/l

Environmental Report for submission to ADB Chapter 5
Pluak Daeng Power Plant Anticipated Environmental Impacts and Mitigations
RNP/ENV/P05028/FR (ADB)/RE62049-sec-5.1.3 Page 5-144
Total BOD in the rainy season = (3.52×4)+(0.013×15)+(0.135×2)
3.67
= 3.96 mg/l Total TDS in Huai Phu Sai in front of the project location
Total TDS in the dry season = (0.58×931.7)+(0×3,000)+(0.135×1,300)
0.715
= 1,001.24 mg/l
Total TDS in the rainy season = (3.52×931.7)+(0.013×3,000)+(0.135×1,300)
3.67
= 952.07 mg/l In the rainy season, the effluent from the cooling system resulted in 3.91 mg/l of BOD and 941.44 mg/l of TDS in Huai Phu Sai. This excluded the effluent from Pluak Daeng Industrial Park.
7) Analysis of BOD and TDS impacts on water quality and utilization of water in Huai Phu Sai for agricultural purpose and water supply Based on the above calculation, the levels of BOD and TDS in Huai Phu Sai without Pluak Daeng Power Plant Project and with Pluak Daeng Power Plant Project (Table 5.1.4-1) are summarized below.
(a) Considerations of BOD and TDS in the dry season Without the project and with the project, BOD will exceed 2 mg/l but will not exceed 4 mg/l (4 and 3.62 mg/l, respectively). Thus, it is categorized as a surface water source, Class 4. As a result, the existence of the project will not affect Huai Phu Sai because BOD of Huai Phu Sai will be a bit better than the existing one. Furthermore, water from Huai Phu Sai is not pumped for water treatment purpose. Without the project, TDS will equal to 931.7 mg/l while with the project, TDS will be 1,001.24 mg/l. These levels do not exceed the maximum standard level of TDS in water (1,500 mg/ l) , which can still be used for plants but in highly permeable soil. Moreover, water pumping for agricultural use in the dry season is minimal. Most of the plants, such as cassava and rubber trees, rely on rainwater. Therefore, in the dry season, the effluent from the project will have an impact on agricultural use at a low level.
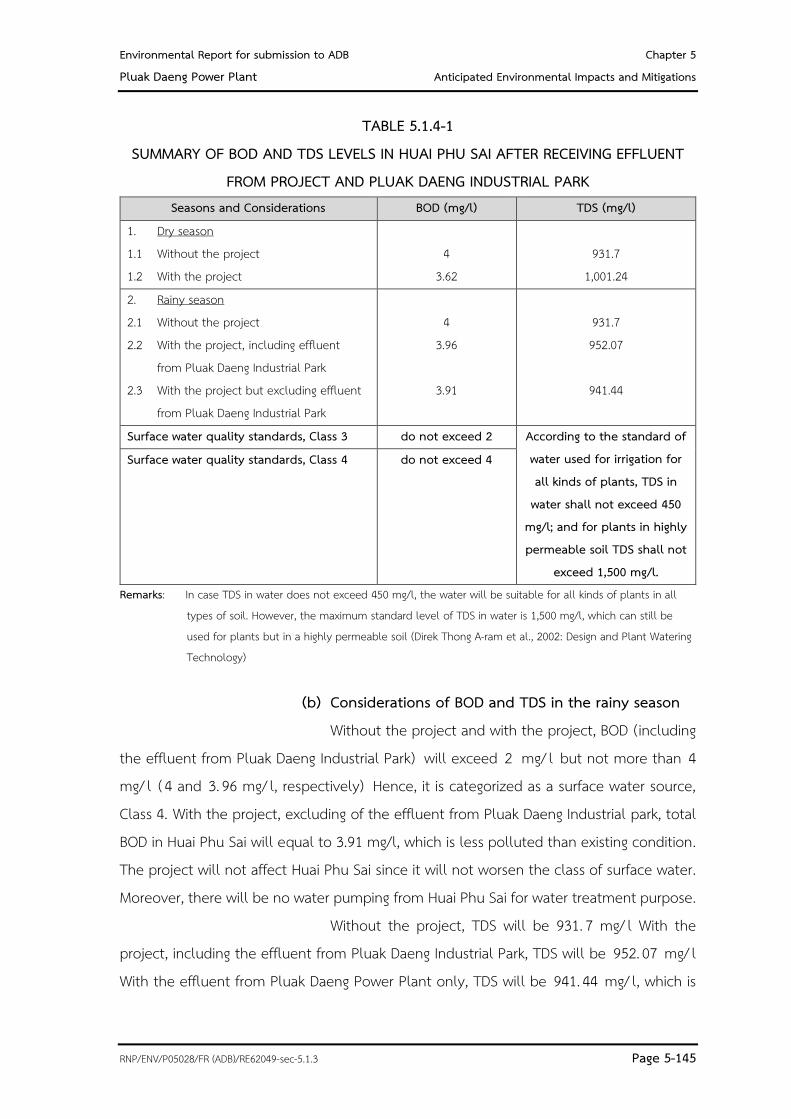
Environmental Report for submission to ADB Chapter 5
Pluak Daeng Power Plant Anticipated Environmental Impacts and Mitigations
RNP/ENV/P05028/FR (ADB)/RE62049-sec-5.1.3 Page 5-145
TABLE 5.1.4-1 SUMMARY OF BOD AND TDS LEVELS IN HUAI PHU SAI AFTER RECEIVING EFFLUENT
FROM PROJECT AND PLUAK DAENG INDUSTRIAL PARK Seasons and Considerations BOD (mg/l) TDS (mg/l)
1. Dry season 1.1 Without the project 1.2 With the project
4
3.62
931.7
1,001.24 2. Rainy season 2.1 Without the project 2.2 With the project, including effluent
from Pluak Daeng Industrial Park 2.3 With the project but excluding effluent
from Pluak Daeng Industrial Park
4
3.96
3.91
931.7 952.07
941.44
Surface water quality standards, Class 3 do not exceed 2 According to the standard of water used for irrigation for all kinds of plants, TDS in
water shall not exceed 450 mg/l; and for plants in highly permeable soil TDS shall not
exceed 1,500 mg/l.
Surface water quality standards, Class 4 do not exceed 4
Remarks: In case TDS in water does not exceed 450 mg/l, the water will be suitable for all kinds of plants in all types of soil. However, the maximum standard level of TDS in water is 1,500 mg/l, which can still be used for plants but in a highly permeable soil (Direk Thong A-ram et al., 2002: Design and Plant Watering Technology)
(b) Considerations of BOD and TDS in the rainy season Without the project and with the project, BOD (including the effluent from Pluak Daeng Industrial Park) will exceed 2 mg/ l but not more than 4 mg/ l (4 and 3. 96 mg/ l, respectively) Hence, it is categorized as a surface water source, Class 4. With the project, excluding of the effluent from Pluak Daeng Industrial park, total BOD in Huai Phu Sai will equal to 3.91 mg/l, which is less polluted than existing condition. The project will not affect Huai Phu Sai since it will not worsen the class of surface water. Moreover, there will be no water pumping from Huai Phu Sai for water treatment purpose. Without the project, TDS will be 931. 7 mg/ l With the project, including the effluent from Pluak Daeng Industrial Park, TDS will be 952. 07 mg/ l With the effluent from Pluak Daeng Power Plant only, TDS will be 941. 44 mg/ l, which is

Environmental Report for submission to ADB Chapter 5
Pluak Daeng Power Plant Anticipated Environmental Impacts and Mitigations
RNP/ENV/P05028/FR (ADB)/RE62049-sec-5.1.3 Page 5-146
similar to an existing condition. These levels do not exceed the maximum standard level of TDS in water (1,500 mg/ l) , which can still be used for plants but in highly permeable soil. Therefore, in the rainy season, the effluent from the project will have an impact on agricultural use at a low level. Figure 5. 1. 4-2 and Figure 5. 1. 4-3 show the locations where BOD and TDS impacts on water quality in the dry and the rainy seasons are analyzed.
8) Analysis of BOD and TDS impacts on water quality and utilization of water in Dok Krai Reservoir (a) Quality of water in Dok Krai Reservoir at present, considering BOD and TDS Dok Krai Reservoir has a water storage capacity of 7 2 million m3 with the average storage water volume of 53.95 million m3. In the dry season, use of water from the reservoir for industrial purpose, utilization and consumption, and agriculture on average (November to April) was 6.9 million m3/month. In the rainy season, use of water (May to October) was 7 . 3 2 million m3/month on average (Source: Royal Irrigation Department, B.E.2540-2557. See Attachment 3 in Appendix 4F-1).
Current water quality: the analyzed BOD and TDS are the average levels from measurement results of 2 monitoring stations in Dok Krai Reservoir on August 3 , 2015. The measurement result was compared with the one measured in March 2019 (the dry season) (Appendix 4F-2). It was found that TDS and BOD in the dry season are higher than the one in the rainy season. Therefore, measurement results in the dry season were used for the analysis of impacts in the rainy and the dry seasons in the worst-case scenario.
Average BOD = 3.5 mg/l Average TDS = 223.6 mg/l
(b) Analysis of BOD and TDS impacts on Dok Krai Reservoir The rate of inflow of Dok Krai Reservoir
In the dry season ( November to April) : 7 . 9 8 million m3/month on average
In the rainy season ( May to October) 1 8 . 6 2 million m3/month on average

Environmental Report for submission to ADB Chapter 5
Pluak Daeng Power Plant Anticipated Environmental Impacts and Mitigations
RNP/ENV/P05028/FR (ADB)/RE62049-sec-5.1.3 Page 5-147
near
FIGURE 5.1.4-2 : MONITORING STATIONS FOR ANALYSIS OF BOD AND TDS IMPACTS ON HUAI PHU SAI IN DRY SEASON
Huai Phu Sai Without the project BOD = 4 mg/l TDS = 931.7 mg/l With the project and include the effluent from the industrial park BOD = 3.62 mg/l TDS = 1,001.24 mg/l
Dok Krai Reservoir Without the project BOD = 3.5 mg/l TDS = 223.6 mg/l With the project and include the effluent from the industrial park BOD = 3.52 mg/l TDS = 249.92 mg/l

Environmental Report for submission to ADB Chapter 5
Pluak Daeng Power Plant Anticipated Environmental Impacts and Mitigations
RNP/ENV/P05028/FR (ADB)/RE62049-sec-5.1.3 Page 5-148
FIGURE 5.1.4-3 : MONITORING STATIONS FOR ANALYSIS OF BOD AND TDS IMPACTS ON HUAI PHU SAI IN RAINY SEASON
near
Huai Phu Sai Without the project BOD = 4 mg/l TDS = 931.7 mg/l With the project and include the effluent from the industrial park BOD = 3.96 mg/l TDS = 952.07 mg/l With the project but not include the effluent from the industrial park BOD = 3.91 mg/l TDS = 941.44 mg/l
Dok Krai Reservoir Without the project BOD = 3.5 mg/l TDS = 223.6 mg/l With the project and include the effluent from the industrial park BOD = 3.57 mg/l TDS = 337.23 mg/l

Environmental Report for submission to ADB Chapter 5
Pluak Daeng Power Plant Anticipated Environmental Impacts and Mitigations
RNP/ENV/P05028/FR (ADB)/RE62049-sec-5.1.3 Page 5-149
The monthly average of water volume in the reservoir
In the dry season: 56.80 million m3/month In the rainy season: 51.09 million m3/month
Rainfall and evaporation from the reservoir In the dry season, there was 0 . 5 7 million m3/
month of rainfall and 1.45 million m3/month of evaporation from the reservoir.
In the rainy season, there was 1.70 million m3/ month of rainfall and 1.17 million m3/month of evaporation from the reservoir.
The average drained water from the reservoir in the dry season was 3.59 million m3/month and the average drained water from the reservoir in the rainy season was 6.87 million m3/month.
According to the inspection of the monthly inflow and outflow of Dok Krai Reservoir, water use volume for industrial purpose and evaporated volume were relatively stable. However, the reservoir inflow was getting steadily higher in May and much higher in September. The highest reservoir inflow was found in October and November. After that, it gradually declined until the rainy season started again. The subtraction of reservoir inflow and outflow showed the remaining water in the reservoir from October to November, as illustrated in Figure 5.1.4-4. In terms of water resources, the monthly average of water volume in Dok Krai Reservoir in November in the rainy season was less than the one in the dry season.
With the project in Pluak Daeng Industrial Park, a summary of inflow of Dok Krai Reservoir after receiving water from Huai Phu Sai, BOD and TDS in the reservoir is made as follows: In the dry season
The average inflow of Dok Krai Reservoir after receiving water from Huai Phu Sai in the dry season equals to 1.87 million m3/month.
BOD from Huai Phu Sai equals to 3.62 mg/l TDS from Huai Phu Sai equals to 1,001.24 mg/l

Environmental Report for submission to ADB Chapter 5
Pluak Daeng Power Plant Anticipated Environmental Impacts and Mitigations
RNP/ENV/P05028/FR (ADB)/RE62049-sec-5.1.3 Page 5-150
FIGURE 5.1.4-4: GRAPHS OF MONTHLY INFLOW OF DOK KRAI RESERVOIR
In the rainy season The average inflow of Dok Krai Reservoir after
receiving water from Huai Phu Sai in the rainy season equals to 9.54 million m3/month.
BOD from Huai Phu Sai equals to 3.96 mg/l TDS from Huai Phu Sai equals to 952.07 mg/l
Calculation of BOD and TDS in the inflow and the outflow of Dok Krai Reservoir (with the project)
Total BOD or TDS in the reservoir (with the project) = C1Q1+C2(Q2+Q3-Q4)
QT
C1 = BOD or TDS in water from Huai Phu Sai C2 = BOD or TDS in water from Dok Krai Reservoir Q1 = Inflow of Dok Krai Reservoir after receiving water
from Huai Phu Sai Q2 = Monthly water volume in Dok Krai Reservoir
(million m3/month)
Dry Season Rainy Season
Average Water Volume in Dok Krai Reservoir from 1997-2014
May Jun Jul Aug Sep Oct Nov Dec Jan Mar Feb Apr
Monthly inflow volume of reservoir
Monthly flow volume through drainage
Monthly water volume use for industy
Monthly evaporate volume from reservoir
Total water volume in reservoir
mill
ion m
3
0
10
20
30
40
50
60
70
80
90 Water Resources in Reservoir from November onwards

Environmental Report for submission to ADB Chapter 5
Pluak Daeng Power Plant Anticipated Environmental Impacts and Mitigations
RNP/ENV/P05028/FR (ADB)/RE62049-sec-5.1.3 Page 5-151
Q3 = Monthly rainfall in Dok Krai Reservoir ( million m3/month)
Q4 = Monthly evaporation from Dok Krai Reservoir (million m3/month)
QT = Total net water volume Q1 + Q2 + Q3 –Q4
BOD in the dry season = (3.62x1.87)+(3.5x(56.80+0.57-1.45))
57.79
= 3.52 mg/l
BOD in the rainy season = (3.96x9.54)+(3.5x(51.09+1.70-1.17))
61.16
= 3.57 mg/l
TDS in the dry season = (1,001.24x1.87)+(223.6x(56.80+0.57-1.45))
57.79
= 249.92 mg/l
TDS in the rainy season = (952.07x9.54)+(223.6x(51.09+1.70-1.17))
61.16
= 337.23 mg/l Based on the above calculations, a summary is made below.
BOD in the inflow of Dok Krai Reservoir after receiving water from Huai Phu Sai, which contains effluent from the project, is similar to the current level, with minor increase. In the dry season, BOD increases from 3.5 mg/ l to 3.52 mg/ l while in the rainy season, it increases from 3.5 mg/l to 3.57 mg/l (Table 5.1.4-2). As for water quality, it can be used for utilization and consumption.
TDS in the inflow of Dok Krai Reservoir after receiving water from Huai Phu Sai, which contains effluent from the project, in the dry season, is 249. 92 mg/ l. In the rainy season, the combination of effluent from Pluak Daeng Power Plant and that of Pluak Daeng Industrial Park results in TDS of 337.23 mg/l (Table 5.1.4-2) . This level still falls within the standard of irrigation water determined that TDS in water lower than 450 mg/l will not affect the growth of plants. In addition, TDS in water did not exceed 1,000 mg/l will also not affect tap water production.

Environmental Report for submission to ADB Chapter 5
Pluak Daeng Power Plant Anticipated Environmental Impacts and Mitigations
RNP/ENV/P05028/FR (ADB)/RE62049-sec-5.1.3 Page 5-152
TABLE 5.1.4-2 SUMMARY OF BOD AND TDS LEVELS IN DOK KRAI RESERVOIR AFTER RECEIVING
WATER FROM HUAI PHU SAI
Seasons BOD mg/l
TDS mg/l
1. In the dry season - Water from Huai Phu Sai (with the project)
3.62
1,001.24
- The average BOD and TDS in the existing condition of the reservoir.
3.5 223.60
- The combination of water from Huai Phu Sai (with the project) and water in the existing condition of the reservoir.
3.52 249.92
2. In the rainy season - The combination of water from Huai Phu Sai (with the project)
and the effluent from Pluak Daeng Industrial Park
3.96
952.07
- The average BOD and TDS in the existing condition of the reservoir.
3.5 223.60
- The combination of water from Huai Phu Sai (with the project) and water in the existing condition of the reservoir
3.57 337.23
Remarks: In case TDS in water does not exceed 450 mg/l, the water will be suitable for all kinds of plants in all types of soil. However, the maximum standard level of TDS in water is 1,500 mg/l, which can still be used for plants but in a highly permeable soil (Direk Thong A-ram et al., 2002: Design and Plant Watering Technology)
TDS accumulation will not take place (Figure 5.1.4-5)
because Dok Krai Reservoir is not a closed system. The project adopted the inflow and outflow data of Dok Krai Reservoir prepared by the Royal Irrigation Department and Eastern Water Resources Development and Management PLC. for the analysis of BOD and TDS impacts on Dok Krai Reservoir. (1) The reservoir inflow means water from Huai Phu Sai and other canals. (2) The reservoir outflow means water pumped for industrial use, the water discharged into the existing water body, downstream from the reservoir, for agricultural use and water discharged through the spillway of the reservoir. In the dry season, the monthly average of 6.9 million m3 water volume from Dok Krai Reservoir will be used for various activities. Furthermore, in the dry season, the monthly average of 3.59 million m3 water volume will be released into downstream of Dok Krai Reservoir. In the rainy season, the monthly average water use will be 7.32 million m3 while the monthly average water

Environmental Report for submission to ADB Chapter 5
Pluak Daeng Power Plant Anticipated Environmental Impacts and Mitigations
RNP/ENV/P05028/FR (ADB)/RE62049-sec-5.1.3 Page 5-153
released into downstream of Dok Krai Reservoir will be 6.87 million m3 Thus, a total water volume in Dok Krai Reservoir, from which TDS will be removed, equals to 148.08 million m3/year. Nonetheless, TDS from Huai Phu Sai in the inflow of Dok Krai reservoir in the dry and the rainy season is 68.46 million m3/year. In summary, TDS will be removed based on the reservoir outflow rather than the reservoir inflow. The analysis of BOD and TDS generated from the project and Pluak Daeng Industrial Park shows that (BOD and TDS are important parameters for the effluent quality of the power plant) there will be no accumulation of BOD and TDS. However, TDS in the reservoir may increase slightly (new balance of TDS after the existence of the project), i.e. from 223.6 mg/l to 249.92 mg/l in the dry season and 337.23 mg/l in the rainy season (Figure 5.1.4-5) . This level of TDS is lower than the level of brackish water (5,000 mg/l). It is also lower than 1,000 mg/l. Therefore, it is suitable for water treatment. Furthermore, TDS in the reservoir is less than 450 mg/ l which means it is suitable for agricultural use for all kinds of plants according to the Royal Irrigation Department. 10) Analysis of the impacts of the SAR value in the wastewater of all types of effluents released by the project A high amount of Na may affect the use of water for plant watering. Generally, it is analyzed in the form of SAR (Sodium absorption ratio) , which is the ratio of Na to the square root of the sum amount of Ca and Mg (Unit: millimole per liter). The analysis of the impacts of SAR is outlined below:
1. 50% Sodium hydroxide ( NaOH) solution with the utilization rate of 142.29 kg/day. Thus, the mixture of NaOH amounts to 71.145 kg/day and that of Na amounts to 41.91 kg/day (the Na’s atomic weight = 23 O = 16 H = 1).
2. 1% Sodium metabisulphite (Na2 S2 O5) solution with the utilization rate of 15 m3/year, which is 0.041 m3/day or 44.69 kg/day (specific gravity = 1.09). The weight of Na is 10.82 kg, which equals 10,819,684 mg/l (atomic weight of S = 32).
3. Sodium chlorite (NaClO2) solution is used for producing ClO2 and eliminating microorganisms and slime mould in water used for electricity generation and cooling water. The amounts of Na and ClO2 (or ClO-
2) are as follows:

Environmental Report for submission to ADB Chapter 5
Pluak Daeng Power Plant Anticipated Environmental Impacts and Mitigations
RNP/ENV/P05028/FR (ADB)/RE62049-sec-5.1.3 Page 5-154
In the Dry Season
TDS 223.6 mg/l New TDS
249.92 mg/l
Water Volume
56.80
Net Water Volume
57.79
Water Use for Industrial Purpose 5.97*
Water Use for Agricultural Purpose 0.93*
Rainfall 0.57* Evaporation 1.45*
Reservoir Inflow Rate: TDS is calculated as follows: 1.87* (TDS = 1,001.24 mg/l)
Removed TDS from Outflow
Remarks: 1) The unit of water volume is million m3/month. 2) TDS in water with no impact
No impact on plant: Not exceed 450 mg/l (irrigation water supply) No impact on freshwater animal: Less than 5,000 mg/l (brackish water)
3) * The flow rate and water volume unit is million m3/month.
TDS 223.60 mg/l
New TDS 337.23 mg/l
Water Volume
51.09
Net Water Volume
61.16
Water Use for Industrial Purpose 5.67*
Water Use for Agricultural Purpose 1.65*
Rainfall 1.70* Evaporation
1.17*
Reservoir Inflow Rate: TDS is calculated as follows: 9.54* (TDS = 952.07 mg/l)
Removed TDS from Outflow
FIGURE 5.1.4-5 : DIAGRAM OF CHANGES IN TDS AND TDS BALANCE IN DOK KRAI RESERVOIR DUE TO RELEASE OF EFFLUENT FROM POWER PLANT PROJECT IN PLUAK DAENG INDUSTRIAL PARK
In the Rainy season

Environmental Report for submission to ADB Chapter 5
Pluak Daeng Power Plant Anticipated Environmental Impacts and Mitigations
RNP/ENV/P05028/FR (ADB)/RE62049-sec-5.1.3 Page 5-155
3.1 25% NaClO2 (specific gravity = 1 .28 ) , which is used for producing ClO2 to killing microorganisms in water used for electricity generation and consumption, amounts to 2 m3/year. ClO2 produced is 2.56 tons/year, which equals 7.01 kg/day. At the 25% concentration, the weight of NaClO2 is 1.75 kg/day, which can produce 1.31 kg of ClO2 daily. At a 90% production capacity, the amount of ClO2 is 1.17 kg/day. A hundred percent of Na is derived from NaClO2, equivalent to 0.44 kg/day. If ClO2 is added into 3,125 m3 of raw water per day, the ClO2 concentration will be equal to 0.14 mg/l. The amount of Na drained into the wastewater holding pond equals 447 , 0 00 mg ( atomic weight of Cl = 35.5). 3.2 25% NaClO2 is used for filling water circulating in the cooling water system. Details are outlined as follows:
The amount of cooling water is 56,866 m3/day. After evaporation, the remaining amount drained equals 11,660 m3/day.
The maximum amount of 25% NaClO2 used is 180 m3/year, which amounts to 0.493 m3/day and 631.4 kg/day. At the 25% concentration, its weight is equal to 157.85 kg/day, which can produce 117.73 kg of ClO2 per day. Na will be equal to 40.11 kg/day, which is 40,116,575 mg/day. Thus, if the maximum values are used in the case of raw water, the maximum concentration in cooling water drained is equal to 3.91 mg/l. Water circulated in the cooling water system is contaminated with, for example, metal, e.g. Fe, Zn, Mn, Al, Cd, organic substances, H2S and NO2.
For 25% NaClO2, in the general utilization condition of cooling water, 10.3 kg of ClO2
- is used per day, which will produce 0.88 mg of ClO-
2 per liter. 4. 10% Tri-Sodium Phosphate (Na3 PO4) is used at 1.24 m3/year, which amounts to 0.0034 m3/day or 5.51 kg/day. Thus, the amount of Na3PO4 is 0.551 kg, equivalent to 0.23 kg/day (230,000 mg/l) of Na and 0.321 kg/day of PO4
-3 (atomic weight of P = 31, O = 16, Na = 23). Na3 PO4 is used in boilers. Each day, 1,434 m3 of blowdown water is released to the recycle cooling water pond. Combining with drained cooling water, its daily amount is 11,660 m3. 5. Based on water quality data by East Water Resources Development and Management Public Company Limited, 2015, water that was pumped out for produce tap water contains 20.56 mg of Na per liter, 39 mg of Ca per liter, and 17 mg

Environmental Report for submission to ADB Chapter 5
Pluak Daeng Power Plant Anticipated Environmental Impacts and Mitigations
RNP/ENV/P05028/FR (ADB)/RE62049-sec-5.1.3 Page 5-156
of Mg per liter. When the cooling water evaporated by 4.87 times, the amount of Na, Ca, and Mg in the drained cooling water is 100.12, 189.93, and 82.79 mg/l, respectively. Na in the cooling water comes from NaClO2 added to the cooling water and Na3 PO4. So the total amount of Na equals 40,629,444 mg (the maximum value). Thus, out of 11,660 m3 of cooling water per day, the amount of Na is 3.48 mg/l, which leads to Na concentration of 103.60 mg/l, Ca concentration of 189.93 mg/l, and Mg concentration of 82.79 mg/l. 6. Wastewater from electricity generation and consumption amount to 48 m3/day. The sources of Na are NaOH, Na2, S2, O5, and NaClO2 used in electricity generation. The total amount of Na equals 52,337,980 mg, resulting in 1,090.37 mg/l of Na concentration. The amount ClO2 (or ClO-
2) is 30.42 mg/l, and the amount of Ca and Mg are 39 mg/l and 17 mg/l, respectively. 7. The concentration of Na, Ca and Mg of all wastewater from the power plants (cooling water and wastewater from electricity generation) equals 11,708 m3/day (Cooling water blowdown clarifier of 11,660 m3/day + wastewater holding pond of 48 m3/day). The concentration of Na, Ca, and Mg is 107.64 mg/l, 189.31 mg/l, and 82.52 mg/l, respectively. (a) Calculation of existing SAR value in Huai Phu Sai
According to the measurement of water quality of Huai Phu Sai in March 2019 in front of the project location, the levels of Na, Ca and Mg are 263, 49 and 7.52 mg/l, respectively (Table 4.1.8-9). The formula to calculate SAR is given below.
SAR = Na
√(Ca+Mg)
The weight per unit (mmol/l) of each element = The atomic weight: Na = 23, Ca = 40, and Mg = 24
Na = 263
23 = 11.44 mmol/l
Ca = 49
40 = 1.23 mmol/l
Weight of element (mg/l) Atomic Weight

Environmental Report for submission to ADB Chapter 5
Pluak Daeng Power Plant Anticipated Environmental Impacts and Mitigations
RNP/ENV/P05028/FR (ADB)/RE62049-sec-5.1.3 Page 5-157
Mg = 7.52
24 = 0.31 mmol/l
SAR = 11.44
√(1.23+0.31)
= 9.23 (b) Calculation of SAR value in effluent from the project Calculation of SAR in the effluent from Pluak Daeng Power Plant, which is not released into Huai Phu Sai Na = 107.64 mg/l Ca = 189.31 mg/l Mg = 82.52 mg/l Calculation of the weight: mmol/l
Na = 107.64
23 = 4.68 mmol/l
Ca = 189.31
40 = 4.73 mmol/l
Mg = 82.52
24 = 3.44 mmol/l
SAR = 4.68
√(4.73+3.44)
= 1.70
(c) Calculation of SAR value in Huai Phu Sai after receiving effluent from the project Calculation of total concentration of the effluents directly released from the project and Huai Phu Sai Na = 370.64 mg/l (107.64+263) Ca = 238.31 mg/l (189.31+49) Mg = 90.04 mg/l (82.52+7.52) Calculation of the weight: mmol/l
Na = 370.64
23 = 16.12 mmol/l
Ca = 238.31
40 = 5.96 mmol/l

Environmental Report for submission to ADB Chapter 5
Pluak Daeng Power Plant Anticipated Environmental Impacts and Mitigations
RNP/ENV/P05028/FR (ADB)/RE62049-sec-5.1.3 Page 5-158
Mg = 90.04
24 = 3.75 mmol/l
SAR = 16.12
√(5.96+3.75)
= 5.17 Comparison of SAR according to irrigation water quality standards of the Royal Irrigation Department Level 1: SAR 0-10 can be used for general soil and plants. Level 2 : SAR 10 -18 is suitable for plants and coarse loamy textured soil or soil which is rich in organic matter. Level 3 : SAR 1 8 - 2 6 is suitable for a highly permeable soil which is rich in organic matter. Poor permeability will be dangerous for plants. Level 4: SAR is greater than 26, which is unsuitable for soil. This is exceptional for soil with low salinity. However, it is required to add gypsum. Based on the results of SAR calculation, in case the effluent from Pluak Daeng Industrial Park and the one from the power plant project are released into Huai Phu Sai, and prior to being released into Huai Phu Sai, these effluents have the range of SAR from 0-10, they can be used for all kinds of plants and general soil. Therefore, effluent from the project can be used for tree watering. Furthermore, water from Huai Phu Sai can be used as irrigation water. The effluent will not affect the aquatic ecology of Huai Phu Sai as the concentration of sodium is lower than 5,000 mg/l (salinity that affects living creature in freshwater = 5,000 mg/l). Additionally, an electrical conductivity (EC) analysis was made for the effluent from the project by evaluating TDS in the effluent released into Huai Phu Sai in the dry season, which equals to 1,001.24 mg/l and in the rainy season, which equals to 952.07 mg/l Then these values are converted into EC by dividing with Factor (0.64). The resulting EC equals to 1,564.44 and 1 ,487.61 µmho/cm, respectively. Compared with irrigation water quality standards of the Royal Irrigation Department, determining EC in irrigation water at 2,000 µmho/cm at maximum. Thus, the quality of water in Huai Phu Sai after receiving the effluent from the project is suitable for agricultural use. Apart from this, cooling water management was performed by the project, making it consistent with the management measures of the effluent from the cooling system of the power plant in Pluak Daeng Industrial Park and the management

Environmental Report for submission to ADB Chapter 5
Pluak Daeng Power Plant Anticipated Environmental Impacts and Mitigations
RNP/ENV/P05028/FR (ADB)/RE62049-sec-5.1.3 Page 5-159
measures of the effluent from the cooling system. According to the additional study and control for compliance with the Notification of the Ministry of Industry, B. E. 2560 (2017) , dated 30 May 2017 Regarding Determination of Effluent Standards for Industrial Plants, published in the Royal Government Gazette, Vol. 134, Part 153, dated 7 June B. E. 2560 ( 2017) on determination quality of wastewater discharged from factories. This is exceptional for total dissolved solids which shall meet the standards of wastewater quality, Royal Irrigation Department. The project’ s cooling water management methods are detailed below. 1) In case the effluent from the cooling tower and the boiler effluent of the power plant meet the set standards of water quality, it will be released into the cooling water holding pond of Pluak Daeng Industrial Park. The management of the effluent from the cooling tower from the power plant will comply with environmental impact prevention and mitigation measures of Pluak Daeng Industrial Park, as illustrated in Appendix 3S. 2) In case the effluent from the cooling tower and the boiler effluent of the power plant do not meet the set standards of Pluak Daeng Industrial Park, they will be re-treated. Details are given below. 2.1) In case the effluent from the cooling tower and the boiler effluent of the power plant do not meet the set standards of Pluak Daeng Industrial Park, water quality monitors will signal and the 1st valve will be shut off shortly. This is to prevent the effluent from flowing into cooling water holding ponds. The power plant will provide cooling water holding pond that can hold the effluent from the cooling tower and the boiler effluent for one day at minimum, which is sufficient for problem-solving whether the abnormalities of pH or electrical conductivity. By this, the power plant can proceed even though no effluent is released from the cooling system and the boiler. For example, in case the effluent in the cooling system contains lower pH compared with the standard, it will receive neutralization in the cooling water holding pond of the power plant. In case an electrical conductivity in the effluent from the power plant exceeds the standard, it will be managed by several ways, such as changing a chemical substance to prevent sedimentation, or increasing coolant to reduce the concentration in the system, etc. The power plant operation without discharging the effluent shall last for one day at a minimum.

Environmental Report for submission to ADB Chapter 5
Pluak Daeng Power Plant Anticipated Environmental Impacts and Mitigations
RNP/ENV/P05028/FR (ADB)/RE62049-sec-5.1.3 Page 5-160
2.2) In case it is impossible to perform the above management after one day passes, the power plant will prepare the cooling water holding ponds 2 and 3 . Either of them will become the cooling water holding pond for the poor quality effluent or an emergency pond; the other will hold the typical effluent or the quality effluent. For example, if the wastewater holding pond two is provided to hold the poor quality effluent or an emergency pond. The effluent from the cooling tower will be released into this pond. Meanwhile, water from the cooling system will be released into this pond through the 2nd valve. At that time, the 3rd valve will be shut off so that the cooling water holding pond 3 is available for the quality effluent that meets the standards and ready for release. If the cooling water holding pond three is chosen for holding the poor quality effluent, three the cooling watera holding pond two will be managed to store the quality effluent. There are several ways to manage the effluent, depending on the root cause, such as carrying it to the neutralization systems or sending it for disposal by the authorized company. In addition, to this, the power plant will establish additional preventive measures to monitor water quality at the location where the effluent is released from the cooling water holding pond 2 or 3. In case it is detected that water quality at location 1 does not meet the standards, the 7th valve will be shut off and the 6th valve will be turned on to convey the effluent that exceeds the standards back to the cooling water holding pond for re-treatment and improvement.
Wastewater from the power generation process Wastewater from power generation process, such as about 1 3 m3/day of wastewater from the water treatment system, 5 m3/day of wastewater from the laboratory and 30 m3/day of sanitary wastewater, etc. Wastewater generated from each source will receive pre-treatment before being carried to the wastewater holding pond to control the effluent quality for compliance with the requirements of Pluak Daeng Industrial Park (Table 3. 1 1 -5) . The online monitoring system will be installed in the wastewater holding pond of the project to measure temperature, pH, and conductivity before carrying to the sanitary sewer and the central wastewater treatment system of Pluak Daeng Industrial Park (Negative impact level = 1).

Environmental Report for submission to ADB Chapter 5
Pluak Daeng Power Plant Anticipated Environmental Impacts and Mitigations
RNP/ENV/P05028/FR (ADB)/RE62049-sec-5.1.3 Page 5-161
(b) Wastewater from stormwater drainage system of project Wastewater from the stormwater drainage system will be collected and managed as follows:
Uncontaminated stormwater from the uncontaminated area or a roof will be drained into the stormwater drainage system of Pluak Daeng Industrial Park.
Oil contaminated stormwater from the oil-contaminated area, such as a concrete dike surrounding a diesel oil drum/ tank, etc. The rain falls into the concrete dike will be collected there. After that, the stormwater will be gradually conveyed to an oil separator to separate oil before pumping water for the central wastewater treatment system. (c) Wastewater holding capacity of the central wastewater treatment system After being treated, about 48 m3/day of the treated wastewater will be sent for treatment at the central wastewater treatment system of Pluak Daeng Industrial Park. According to the Environmental Impact Assessment Report of Pluak Daeng Industrial Park Project (First Extension Phase) (February 2016), the central wastewater treatment system is capable of storing 2 , 0 0 0 m3/ day of the wastewater. That is the central wastewater treatment system of Pluak Daeng Industrial Park accounts for 2.4% of wastewater from the project, which is sufficient (No impact). (d) The capacity of Pluak Daeng Industrial Park to hold the effluent from the cooling tower There will be about 11, 660 m3/day of the effluent from the cooling tower that needs inspection for the effluent from the cooling tower characteristics for compliance with the Notification of the Ministry of Industry, B.E.2560 (2017), dated 30 May 2017 Regarding Determination of Effluent Standards for Industrial Plants, published in the Royal Government Gazette, Vol. 134, Part 153, dated 7 June B. E. 2560 ( 2017) on determination quality of wastewater discharged from factories. However, total dissolved solids (TDS) shall meet the standards of wastewater quality, Royal Irrigation Department prior to being discharged outside the power plant through the collection pipe to the cooling water holding pond with the capacity of at least 1 5 , 0 00 m3 of Pluak Daeng Industrial Park. As a result, the effluent from the cooling tower of the project accounts for 81 .55% of the cooling water holding pond of the Industrial Park. It is apparent that the

Environmental Report for submission to ADB Chapter 5
Pluak Daeng Power Plant Anticipated Environmental Impacts and Mitigations
RNP/ENV/P05028/FR (ADB)/RE62049-sec-5.1.3 Page 5-162
cooling water holding pond of Pluak Daeng Industrial Park is sufficiently capable of holding the effluent from the cooling tower from Pluak Daeng Power Plant. There will be no problem of effluent control (No impact).
(e) Impact of Thermal Discharges Thermal Discharges Cooling Tower
Q = 11,660 m3/day
Temp. = 34 C
Cooling Water Holding Ponds capacity :19,000 m3
surface area: 7,628 m2 (hold for 1 day)
Q = 11,660 m3/day
Cooling Water Holding Ponds capacity :15,000 m3
surface area: 4,924 m2 (hold for 1 day)
Q = 11,660 m3/day
Huai Phu Sai (1) The temperature of cooling water in the project’ s cooling water holding pond When cooling water is hold in cooling water holding pond, there are heat transfer from water mass and evaporation. That they occur result in decrease of cooling water temperature. The decrease temperature can be calculated by law of conservation of energy as follows:
tfinal oC qgain = mv Lv
T1 = 34 oC
qlost = m cp t
Vpond = 19,000 m3 Apond = 7,628 m2

Environmental Report for submission to ADB Chapter 5
Pluak Daeng Power Plant Anticipated Environmental Impacts and Mitigations
RNP/ENV/P05028/FR (ADB)/RE62049-sec-5.1.3 Page 5-163
qlost = qgain (1)
qlost = qquantity of heat lost from water body = mcpt (2) qgain = qquantity of heat gain by water vaporization = mv Lv (3)
m cp t = mv Lv where m = mass of water in pond (kg) cp = specific heat capacity = 1 cal/g oC or 1 kcal/kg oC
t = t3 = 34 - tfinal oC
mv = mass of water evaporating in 1 day (kg) Lv = latent heat of vaporization = 540 kcal/kg where m or mass of remaining water in cooling water holding pond ( kg)
is calculated as follows; m = mass of water in cooling water holding pond - a mass
of water evaporating in 1 day (mv) = D(Vpond-Vevap) D = density of water at 34 oC = 994 kg/m3 Vpond = volume of water in cooling water holding pond (m3)
= 19,000 m3 Vevap = volume of water evaporating in 1 day (m3) = minimum monthly evaporation rate of the study area
or nearby area (m/d) coefficient of evaporation pan
surface area of cooling water holding pond (m2) retention time (day)
= 3.2610-3 m/day 0.75 7,628 m2 1 day = 18.65 m3
when substitute 18. 65 m3 for Vevap, then remaining water in cooling water holding pond (m) becomes:
= 994 kg/m3 [19,000 m3 – 18.65 m3] = 18,867,461.90 kg Thus, temperature of cooling water before discharge can be solved as follow: qlost = qgain m cp t = mv Lv

Environmental Report for submission to ADB Chapter 5
Pluak Daeng Power Plant Anticipated Environmental Impacts and Mitigations
RNP/ENV/P05028/FR (ADB)/RE62049-sec-5.1.3 Page 5-164
t =
(34 - tfinal) = 18.65 m3 994 kg/m3 540 kcal/kg
18,867,461.90 kg 1 kcal/kg oC (34 - tfinal) = 0.53 oC tfinal = 33.47 oC
The temperature of cooling water before discharge from the project’ s cooling water holding pond is 33.47 oC. (2) The temperature of cooling water hold in Pluak Daeng Industrial Park’s cooling water holding pond The temperature of cooling water drained from cooling water holding pond of the project is 33.47 oC. This water will be retained in Pluak Daeng Industrial Park’s cooling water holding pond for 1 day before discharge to Huai Phu Sai. As mentioned in item 1, the temperature of water will be decrease which can be calculated as below.
qlost = qgain (1)
qlost = qquantity of heat lost from water body = mcpt (2) qgain = qquantity of heat gain by water vaporization = mv Lv (3)
m cp t = mv Lv where m = mass of water in pond (kg) cp = specific heat capacity = 1 cal/g oC or 1 kcal/kg oC
t = t3 = 33.47 - tfinal oC
mv = mass of water evaporating in 1 day (kg) Lv = latent Heat of Vaporization = 540 kcal/kg where m or mass of remaining water in Pluak Daeng Induatrial Park's
cooling water holding pond (kg) is calculated as follows:
p
vv
mc
Lm
tfinal oC qgain = mv Lv
T1 = 33.47 oC
qlost = m cp t
Vpond = 15,000 m3 Apond = 4,924 m2

Environmental Report for submission to ADB Chapter 5
Pluak Daeng Power Plant Anticipated Environmental Impacts and Mitigations
RNP/ENV/P05028/FR (ADB)/RE62049-sec-5.1.3 Page 5-165
m = mass of water in Pluak Daeng Induatrial Park 's cooling water holding pond - mass of water evaporating in 1 day (mv)
= D(Vpond-Vevap) D = density of water at 33.47 oC = 994 kg/m3 Vpond = volume of water in cooling water holding pond (m3)
= 15,000 m3 Vevap = volume of water evaporating in 1 day (m3) = minimum monthly evaporation rate of the study area
or nearby area (m/d) coefficient of evaporation pan
surface area of Pluak Daeng Induatrial Park 's cooling
water holding pond (m2) retention time (day)
= 3.2610-3 m/day 0.75 4,924 m2 1 day = 12.04 m3 when substitute 12. 04 m3 for Vevap, then remaining water in Hemaraj ESIE's
cooling water holding pond (m) becomes:
= 994 kg/m3 [15,000 m3 – 12.04 m3] = 14,898,033 kg Thus, temperature of cooling water before discharge can be solved as follow: qlost = qgain
m cp t = mv Lv
t =
(34 - tfinal) = 12.04 m3 994 kg/m3 540 kcal/kg
14,898,033 kg 1 kcal/kg oC (34 - tfinal) = 0.43 oC tfinal = 33.57 oC The temperature of cooling water before discharge from the Pluak Daeng Industrial Park's cooling water holding pond is 33.57 oC.
p
vv
mc
Lm

Environmental Report for submission to ADB Chapter 5
Pluak Daeng Power Plant Anticipated Environmental Impacts and Mitigations
RNP/ENV/P05028/FR (ADB)/RE62049-sec-5.1.3 Page 5-166
(3) The temperature of mixing between discharged cooling water and water in Huai Phu Sai
The calculation for heat transfer in term of the temperature of water mixing between a mass of discharged cooling water and of water in Huai Phu Sai. The temperature of Huai Phu Sai at the discharge point of Pluak Daeng Industrial Park is the maximum temperature measured by TEAM Consulting Engineering and Management PCL. and TLT Consultants Co., Ltd. In the year 2015-2016 and 2019 during both rainy and dry seasons which are 27.7 and 34.3 oC, respectively while the minimum is 27.2 and 30.2 oC in the rainy and dry season, respectively. A flow rate of water in Huai Phu Sai during rainy and dry seasons are 3. 52 and 0. 58 m3/ s, respectively. The temperature of cooling water in Hemaraj ESIE’s holding pond is 32.42 oC. The detail of mixing water temperature at effluent point is as follows:
Rainy season
qlost = qgain meffluent Cp (33.57 oC – tfinal) = mHuai Phu Sai Cp (tfinal – tHuai Phu Sai) where meffluent = mass of water discharged from Pluak Daeng Induatrial
Park's cooling water holding pond (kg) = (water volume drained into Pluak Daeng Induatrial
Park's cooling water holding pond – volume of water
evaporation per day) density of water
= [11,660 m3/d – 1.00 m3/d] 994 kg/m3 = 11,589,046 kg/d or 134.13 kg/s
teffluent = temperature of cooling water before discharged from Pluak Daeng Induatrial Park's cooling water holding pond
= 33.57 oC (from the calculation in item 2) mHuai Phu Sai = mass of water in Huai Phu Sai at discharge point (kg/s)
teffluent = 33.57 oC q = meffluent cp (33.57 oC-tfinal)
qlost = qgain
Huai Phu Sai
tHuai Phu Sai = 27.7 oC /27.2 oC q = mHuai Phu Sai cp (tfinal – tHuai Phu Sai) tfinal

Environmental Report for submission to ADB Chapter 5
Pluak Daeng Power Plant Anticipated Environmental Impacts and Mitigations
RNP/ENV/P05028/FR (ADB)/RE62049-sec-5.1.3 Page 5-167
= 3.52 m3/s 994 kg/m3 = 3,498.88 kg/s tHuai Phu Sai = maximum and minimum temperature of water in
Huai Phu Sai at discharge point measured by TEAM and TLT in 2015-2016 and 2019
tfinal = temperature of mixing water in Huai Phu Sai at discharge point (oC)
Cp = specific heat capacity of water equals to 1 cal/g oC or 1 kcal/kg oC
Thus, maximum and minimum temperature of mixing water in Huai Phu Sai at discharge point of Pluak Daeng Induatrial Park are calculated as follows:
134.13 kg/s Cp (33.57 oC – tfinal) = 3,498.88 kg/s Cp (tfinal – 27.7 oC) tfinal = 27.91 oC
134.13 kg/s Cp (33.57 oC – tfinal) = 3,498.88 kg/s Cp (tfinal – 27.2 oC) tfinal = 27.43 oC From above calculation, maximum and minimum temperature of water mixing between discharged cooling water and water in Kram canal at effluent point during rainy season are 27.91and 27.43 oC, respectively which differs from the maximum and minimum temperature of water in Kram canal before project operation not more than 3 oC which complies with effluent guidelines for thermal power plant. Dry season qlost = qgain meffluent Cp (33.57 oC – tfinal) = mHuai Phu Sai Cp (tfinal – tHuai Phu Sai) where meffluent = mass of water discharged from Pluak Daeng Industrial
Park's cooling water holding pond (kg)
teffluent = 33.57 oC q = meffluent cp (33.57 oC-tfinal)
qlost = qgain
Huai Phu Sai
tHuai Phu Sai = 34.3 oC/30.2 oC q = mHuai Phu Sai cp (tfinal – tHuai Phu Sai) tfinal

Environmental Report for submission to ADB Chapter 5
Pluak Daeng Power Plant Anticipated Environmental Impacts and Mitigations
RNP/ENV/P05028/FR (ADB)/RE62049-sec-5.1.3 Page 5-168
= (water volume drained into Pluak Daeng Industrial Park's cooling water holding pond – volume of water
evaporation per day) density of water
= [11,660 m3/d – 1.00 m3/d] 994 kg/m3 = 11,589,046 kg/d or 134.13 kg/s
teffluent = temperature of cooling water before discharged from Pluak Daeng Industrial Park 's cooling water holding pond
= 33.57 oC (from the calculation in item 2) mHuai Phu Sai = mass of water in Huai Phu Sai at discharge point (kg/s)
= 0.58 m3/s 994 kg/m3 = 576.52 kg/s tHuai Phu Sai = maximum and minimum temperature of water in
Huai Phu Sai at discharge point measured by TEAM and TLT in 2015-2016 and 2019
tfinal = temperature of mixing water in Huai Phu Sai at discharge point (oC)
Cp = specific heat capacity of water equals to 1 cal/g oC or 1 kcal/kg oC
Thus, maximum and minimum temperature of mixing water in Huai Phu Sai at discharge point of Pluak Daeng Industrial Park are calculated as follows:
134.13 kg/s Cp (33.57 oC – tfinal) = 576.52 kg/s Cp (tfinal – 34.3 oC) tfinal = 34.16 oC
134.13 kg/s Cp (33.57 oC – tfinal) = 576.52 kg/s Cp (tfinal – 30.2 oC) tfinal = 30.84 oC From above calculation, maximum and minimum temperature of water mixing between discharged cooling water and water in Huai Phu Sai at effluent point during dry season are 34. 16 and 30. 84 oC, respectively which differs from the maximum and minimum temperature of water in Huai Phu Sai before project operation not more than 3 oC which complies with effluent guidelines for thermal power plant.

Environmental Report for submission to ADB Chapter 5
Pluak Daeng Power Plant Anticipated Environmental Impacts and Mitigations
RNP/ENV/P05028/FR (ADB)/RE62049-sec-5.1.3 Page 5-169
Although wastewater generated from the project is not directly discharged into surface water sources, the project determined the locations of surface water quality monitoring stations to measure the effluent released from Pluak Daeng Industrial Park in water sources. This is to monitor impacts from the project operation on Huai Phu Sai and Dok Krai Reservoir. Determination of monitoring stations (Figure 5.1.4-6) is as follows: 1) Location of Monitoring Station 1: It is located about 4 km upstream in the north from Pluak Daeng Power Plant location before the outfall of Amata City Industrial Estate (Rayong) . The data of water quality before it flowed through Amata City Industrial Estate (Rayong) , which is close to the project area, was obtained. According to the measurement, water was uncontaminated from the industrial effluent or very slightly contaminated. As a result, water quality from this area is the representative of water which is not affected by Amata City Industrial Estate (Rayong). 2) Location of Monitoring Station 2: It is located before the outfall of the cooling water holding pond of Pluak Daeng Industrial Park. The water sample was collected from Wang Tan Mon weir before it reaches the crest of overflow weir. According to the measurement results, water quality from this area is the representative of water which flowed past Amata City Industrial Estate (Rayong) , but was not affected yet by effluent from the project. The quality of water that flowed past Amata City Industrial Estate (Rayong) is used to compare with the quality of water from Monitoring Station 1. 3) Location of Monitoring Station 3: It is located at the outfall of the cooling water holding pond of Pluak Daeng Industrial Park. The water sample was collected at the overflow weir on Ror. Yor. 2026 roadside before it reaches the crest of the overflow weir. According to the measurement result, water in this area was affected by the project operation. Comparison of water quality at this monitoring station and those at Monitoring Station 1 and Monitoring Station 3 will clearly show the impacts of the project operation on the quality of water in Huai Phu Sai. 4) Location of Monitoring Station 4 : It is located at Huai Phu Sai, downstream of the weir crest, about 1 km from Ror. Yor. 2026 roadside. The purpose of measurement is to compare the quality of water in front of the weir (Monitoring Station 3) and behind the weir (Monitoring Station 4).

Environmental Report for subm
ission to ADB Chapter 5
Pluak Daeng Power Plant Anticipated Environm
ental Impacts and M
itigations
RNP/ENV/P05028/FR (ADB)/RE62049-sec-5.1.3 Page 5-170
FIGURE 5.1.4-6 : MONITORING STATIONS OF SURFACE WATER QUALITY DURING THE CONSTRUCTION AND OPERATION PHASES

Environmental Report for submission to ADB Chapter 5
Pluak Daeng Power Plant Anticipated Environmental Impacts and Mitigations
RNP/ENV/P05028/FR (ADB)/RE62049-sec-5.1.3 Page 5-171
5) Location of Monitoring Station 5 : It is located downstream about 3 km from Pluak Daeng Power Plant. This location is adjacent to communities. Measurement results of water quality in this area is used as the representative of impact from the project operation on communities. The measurement result will indicate whether effluent from the project affects communities. 6) Location of Monitoring Station 6: It is located in Dok Krai Reservoir, 1 km. from the entrance of Huai Phu Sai. This is the area where the reservoir does not receive water from other sources in addition to Huai Phu Sai ( including the branches of Huai Phu Sai) . The measurement result of water quality in this area is used as the representative of water quality in Dok Krai Reservoir, which is affected by water flowing from Huai Phu Sai. 7) Location of Monitoring Station 7: It is located in Dok Krai Reservoir, 2 km.from the entrance of Huai Phu Sai. This is the area where the reservoir receives water from the canal and other water bodies, which is not Huai Phu Sai. This includes water mass from Huai Phu Sai, which may flow from Monitoring Station 5 . Compared with the measurement result of water quality at Monitoring Station 5 , water quality at this station could clearly indicate the impacts of other water bodies combined with water in Dok Krai Reservoir. Mitigation Measures (a) Construction Phase Stormwater management measures
Temporary drainage ditches and sedimentation pond shall be provided for stormwater storage and sedimentation in the project area. Solids will be separated from stormwater while clear water will be used to spray the project area to alleviate dust diffusion. The remaining water will be drained into the storm drains of Pluak Daeng Industrial Park.
If material scrap falls into the drainage ditches and block or obstructs the water flow, it should be removed.
Material scrap and dirt shall not be dumped into the drainage ditch.

Environmental Report for submission to ADB Chapter 5
Pluak Daeng Power Plant Anticipated Environmental Impacts and Mitigations
RNP/ENV/P05028/FR (ADB)/RE62049-sec-5.1.3 Page 5-172
Wastewater management measures: wastewater from construction workers and construction activities
Sanitary toilets shall be adequately provided for construction workers as required by law. Additionally, a septic tank or prefabricated wastewater treatment tank shall be constructed to treat wastewater from water use and consumption by construction workers so that treated effluents meet the effluent standards. The responsible agency shall be contacted to pump out sewage in the prefabricated wastewater treatment tank for further disposal. The prefabricated wastewater treatment tank will be always maintained to ensure its efficiency throughout the construction phase. The plant shall treat wastewater from bathrooms and toilets of construction workers to meet the effluent quality standards of Building Type C according to the Notification of the Ministry of Natural Resources and Environment on Establishment of Building Effluents Standards for some Building Types and Sizes. Effluent parameters include pH, BOD, suspended solids, sulfide, Total Dissolved Solids, settleable solids, oil and grease, and TKN. A monitoring pond shall be provided for effluent storage for at least 1 day for inspection once a month.
The drainage ditch and wastewater holding pond shall be provided at the construction site to hold uncontaminated wastewater from construction activities. The uncontaminated wastewater quality shall be inspected for compliance with the requirements of Pluak Daeng Industrial Park prior to being drained into the central wastewater treatment system of Pluak Daeng Industrial Park.
Contaminated wastewater e. g. wastewater from changing engine oil, shall be controlled, and will be kept in a drum and delivered to the agency authorized by government agencies for disposal.
Regular maintenance shall be performed for vehicles and all types of machinery to prevent oil leakage. The maintenance shall be performed in the designated area or on a solid surface with a pad to prevent oil leakage into Huai Phu Sai. Wastewater management measures: wastewater from workers’ camp
Sanitary toilets shall be adequately provided for construction workers as required by law. Additionally, a septic tank or prefabricated wastewater treatment tank shall be constructed to treat wastewater from water use and consumption by construction workers so that treated effluents meet the effluent standards. The responsible agency shall be contacted to pump out sewage in the prefabricated wastewater treatment tank

Environmental Report for submission to ADB Chapter 5
Pluak Daeng Power Plant Anticipated Environmental Impacts and Mitigations
RNP/ENV/P05028/FR (ADB)/RE62049-sec-5.1.3 Page 5-173
for further disposal. The prefabricated wastewater treatment tank will be always maintained to ensure its efficiency throughout the construction phase. The plant shall treat wastewater from bathrooms and toilets of construction workers to meet the effluent quality standards of Building Type C according to the Notification of the Ministry of Natural Resources and Environment on Establishment of Building Effluents Standards for some Building Types and Sizes. Effluent parameters include pH, BOD, suspended solids, sulfide, Total Dissolved Solids, settleable solids, oil and grease, and TKN. A monitoring pond shall be provided for effluent storage for at least 1 day for inspection once a month. Wastewater management measures for Discharges from the Power Plant and Hydrostatic Test
Screens shall be installed at the drain pipe to trap garbage and solids in water discharges after hydrostatic tests.
The characteristics of hydrostatic test water discharges, i. e. pH, temperature, total suspended solids, oil, and grease, shall be checked to strictly comply with the requirements of Pluak Daeng Industrial Park
In the event that the effluent quality does not comply with the one required by Pluak Daeng Industrial Park, it will be sent for disposal by the agency authorized by government agencies. (2) Operation Phase Cooling water management measures
Two cooling water holding ponds shall be provided with the holding capacity of 19,000 m3 each for at least one (1) day discharge volume. These two cooling water holding ponds will hold the blowdown from a cooling tower. The ponds shall be paved with high density polyethylene (HDPE) or concrete to prevent leakage.
The online monitoring system shall be installed at the water holding ponds to check the temperature, pH, conductivity and dissolved oxygen. The monitoring results shall be reported to the display in front of the project area and wastewater control center of Pluak Daeng Industrial Park.
The Project shall control the quality of effluent discharged from a cooling tower to be in compliance with the measures of Pluak Daeng Industrial Park. The Industrial Park requires that the quality of cooling water shall meet the Notification of the Ministry of Industry, B. E. 2560 ( 2017) , dated 30 May 2017 Regarding Determination of

Environmental Report for submission to ADB Chapter 5
Pluak Daeng Power Plant Anticipated Environmental Impacts and Mitigations
RNP/ENV/P05028/FR (ADB)/RE62049-sec-5.1.3 Page 5-174
Effluent Standards for Industrial Plants, published in the Royal Government Gazette, Vol. 134, Part 153, dated 7 June B. E. 2560 ( 2017) on determination quality of wastewater discharged from factories, except total dissolved solid shall be complied with RID’ s standard of effluent quality discharge into irrigation system (TDS shall not exceed 1,300 mg/l) and temperature shall not exceed 34 ºC.
One emergency pond with the capacity of 19,000 m3 shall be provided with the holding capacity of at least one (1) day discharge volume. The emergency pond will hold the blowdown from a cooling tower. In case the monitoring results show that the quality of effluent from a cooling water does not comply with the measures of Pluak Daeng Industrial Park, which is based on the Notification of the Ministry of Industry, B.E.2560 (2017) , dated 30 May 2017 Regarding Determination of Effluent Standards for Industrial Plants, published in the Royal Government Gazette, Vol. 134, Part 153, dated 7 June B.E.2560 (2017) on determination quality of wastewater discharged from factories. This is exceptional for total dissolved solids which shall comply with RID is standard of effluent quality discharge into irrigation system (TDS shall not exceed 1,300 mg/l) and temperature shall not exceed 34 ºC (In normal working conditions, the emergency pond shall be dry.)
An aerator shall be installed in cooling water holding ponds to increase dissolved oxygen in the effluent.
The aerator shall be run when dissolved oxygen in the effluent is lower than 4 mg/l and shall be run until dissolved oxygen is higher than 4 mg/l.
The project will design a wastewater drainage method by which wastewater can absorb more oxygen to be installed at discharge point to the holding pond.
Chlorite in blowdown from the cooling tower shall not exceed 1 mg/l. If chlorite exceeds the criteria, the effluent shall not be discharged from the project.
In the event that blowdown from the cooling tower will be used for watering plant within the project area, SAR shall be control in the range 0-10. Conductivity shall not exceed 2,000 µmho/cm. and TDS shall not exceed 1,300 mg/l. if these effluent parameters do not comply with the criteria, they shall be improved prior to watering plant within the project area.
Management of blowdown from the cooling tower (Figure 9-3)

Environmental Report for submission to ADB Chapter 5
Pluak Daeng Power Plant Anticipated Environmental Impacts and Mitigations
RNP/ENV/P05028/FR (ADB)/RE62049-sec-5.1.3 Page 5-175
- Cooling water holding pond and emergency pond: Before being discharged from the power plant, cooling water will be held in the cooling water holding pond 1, which is capable of managing water at least for 1 day. The cooling water holding ponds 2 and 3 are capable of holding the effluent for 1 day each. The cooling water holding ponds will be paved with HDPE or of concrete type to prevent leakage. Typically, either the cooling water holding pond 2 or 3 will be used. The one that is not in use will be kept dry as an emergency pond.
- Control valve: The system consists of the 1st valve which will be closed when the quality of water at the cooling tower exceeds the standards. The 2nd valve and the 3 rd valve manage to convey blowdown water to the cooling water holding ponds 2 and 3, respectively. The 6th valve and the 7th valve manage blowdown from the cooling tower before it is drained into the cooling tower holding pond of Pluak Daeng Industrial Park for the increase in effluent management.
- Water pump: The effluent from the cooling water holding pond 2 or 3 will be pumped by the water pump and conveyed outside the power plant. The size of water pump will be designed for pumping capacity that makes the basin dry within a short period of time and ready to used as an emergency pond
- Water quality and control at cooling tower, blowdown and blowdown management: Water in the cooling system will be checked and improved all the time to control the quality of recirculated water and the water released from the cooling system, such as control of pH, concentration, water filling and partial drainage of water, etc. Measurements will be made for the temperature, pH, dissolved oxygen and conductivity. This is continuous monitoring. The control signal will be sent to a valve/water pump. Furthermore, the values of continuous monitoring will be displayed at a control room. The characteristics of blowdown from the cooling tower shall comply with the requirements of Pluak Daeng Industrial Park. Blowdown management can be performed in various ways, depending on causes of problems. For example, the blowdown may be sent to the pH neutralization system within the power plant, or it may be sent for disposal by the authorized agency.
Regular check and maintenance shall be performed for condenser and cooling towers so as to control the quality of effluent from the cooling tower prior to discharging out of the project.

Environmental Report for submission to ADB Chapter 5
Pluak Daeng Power Plant Anticipated Environmental Impacts and Mitigations
RNP/ENV/P05028/FR (ADB)/RE62049-sec-5.1.3 Page 5-176
Management measures for effluent from the process The quality of effluent to be carried to the central wastewater
treatment system of Pluak Daeng Industrial Park shall comply with the requirements of Pluak Daeng Industrial Park.
An oil separator shall be provided to separate oil from oil contaminated effluent. Then the contaminated effluent shall be carried to a wastewater holding pond for quality check prior to being discharged to the central wastewater treatment system of Pluak Daeng Industrial Park.
Adequate sanitary toilets shall be prepared for staff as required by law. In addition, a septic tank or prefabricated wastewater treatment tank shall be constructed to treat wastewater generated by utilization and consumption of staff before being discharged to the wastewater holding pond of the project and carried to the central wastewater treatment system of Pluak Daeng Industrial Park.
A neutralization pit shall be provided for pH neutralization before draining the effluent into the wastewater holding pond of the project and the central wastewater treatment system of Pluak Daeng Industrial Park.
The wastewater holding pond of the project, which can hold the effluent for 24 hours at minimum, shall be provided so that the quality of effluent is checked before being discharged to the central wastewater treatment system of Pluak Daeng Industrial Park.
The online monitoring system shall be installed at the wastewater holding pond to check the temperature, pH and conductivity. The monitoring results shall be reported to the wastewater control center of Pluak Daeng Industrial Park.
The effluent that passes quality check from the wastewater holding pond shall be carried through the drain pipe for treatment at the central wastewater treatment system of Pluak Daeng Industrial Park.

Environmental Report for submission to ADB Chapter 5
Pluak Daeng Power Plant Anticipated Environmental Impacts and Mitigations
RNP/ENV/P05028/FR (ADB)/RE62049-sec-5.1.3 Page 5-177
5.1.5 Soil Resource (1) Construction phase Land leveling is to be executed by Pluak Daeng Industrial Estate before the area is entrusted to Pluak Daeng Power Plant Project. In this way, the land in the project area will already be leveled before the construction of the project starts. The only activity that might have impacts on the soil resources is topsoil excavation to lay the foundation of the buildings and dig ponds. Possible impacts on the soil resources are as follows: (a) Soil erosion Because of land leveling but with no cover cropping, and topsoil excavation; there is more likelihood of natural soil erosion. Assessment of soil erosion in the project area in the construction phase is conducted by employing the Universal Soil Loss Equation (USLE) , in which the cropping factor (C) = 0. 80 ( for unused land and developed the land, as shown in Table 4.1.3-7) and the conservation practice factor (P) = 1.0. As there is no practice to prevent soil erosion such as contour cultivation and terrace cropping, etc., prediction of the average soil loss according to the USLE is as follows:
Average annual soil loss (A) = 237.93 0.09 0.567 0.80 1.0 = 9.71 tons/hectare/year (1.55 tonne/rai/year)
The average soil loss due to erosion in the project site in the construction phase during the excavating operation at 1.55 tonne/rai/year, when put into comparison with the Soil Tolerance Goal with reference to the Land Development Department (2002) at 2 tons/ rai/year, shows that soil erosion caused by the excavating operation in the construction of the project is less than that caused by natural circumstances. Therefore, the impact on soil loss in the project area is considered low (no impact). (b) Soil fertility As land leveling is to be executed by Pluak Daeng Industrial Estate before the area is entrusted to Pluak Daeng Power Plant Project and the construction is to be executed only in the project site, there is no impact to the soil fertility (no impact).

Environmental Report for submission to ADB Chapter 5
Pluak Daeng Power Plant Anticipated Environmental Impacts and Mitigations
RNP/ENV/P05028/FR (ADB)/RE62049-sec-5.1.3 Page 5-178
(2) Operation phase (a) Soil fertility In the operation phase, pollutants are to be emitted from the electricity generation process through the emission stacks. Sulfur dioxide, the main cause of acid rain, is produced in the project’s electricity generation, in which the main fuel used is natural gas, less than when other fuel fossils are used. According to the Pollution Control Department’ s website, Thailand is a member of the Acid Deposition Monitoring Network in East Asia (EANET) . Under the charge of the Pollution Control Department, the Acid Deposition Monitoring Network in Thailand has been established comprising relevant government agencies and authorities from various academic institutes with a view to monitoring acid deposition including both wet and dry precipitation and assessing risk impacts of this problem through the investigation of changes in the ecology and environment, including the ecological condition of the water, soil, and forest resources affected. The surveillance is aimed to cover extensive areas in all the regions in Thailand and is still in progress in many areas. Table 5. 1. 5-1 shows the urban, industrial and nature reserve areas which have been continuously monitored since the end of 1998. However, there is no surveillance of the project area by the said network.
TABLE 5.1.5-1 ACID DEPOSITION SAMPLE COLLECTION POINTS IN THAILAND Samples Collected Sample Collection Point
1. Samples of wet acid precipitation deposition 1. Khao Laem Dam, Kanchanaburi Province 2. Office of Natural Resources and Environmental
Policy and Planning (ONEP) 3. Meteorological Department, Bangkok 4. Environmental Research and Training Centre,
Pathum Thani Province 2. Samples of dry acid precipitation deposition
gas aerosol
1. Khao Laem Dam, Kanchanaburi Province 2. Office of Natural Resources and Environmental
Policy and Planning (ONEP) 3. Samples of acid deposition in soil and plants 1. Khao Laem Dam, Kanchanaburi Province 4. Samples of acid deposition in water bodies
and deposits of soil particles 1. Khao Laem Dam, Kanchanaburi Province
Source: http://www.pcd.go.th/info_serv/air_aciddeposition.html#s6 (retrieved on 12 October 2016)

Environmental Report for submission to ADB Chapter 5
Pluak Daeng Power Plant Anticipated Environmental Impacts and Mitigations
RNP/ENV/P05028/FR (ADB)/RE62049-sec-5.1.3 Page 5-179
Also, according to the report on the investigation of rainwater quality during August-September 2015 by the Regional Environmental Office 1-16, in which the pH of rainwater is measured in the rural, urban and industrial areas in Mueang Rayong District ( the capital district) and Klaeng District, Rayong Province by the Regional Environmental Office 13. It is found that the pH of the three rainwater samples are above 5.6 (rainwater having a pH of less than 5.6 is considered to be acid rain - Appendix 5B). Nevertheless, only three samples are not enough to generalize on the pH of rainwater in the entire Rayong Province. Moreover, the three samples are not collected in the project area. All in all, no agency yet has monitored acid precipitation deposition in the project area. The review of the data on soil properties in the project area according to the Land Development Department’ s soil survey report in Rayong Province ( 1985) (Table 4.1.3-2) reveals that the pH of the topsoil of each soil series fall into the range of 5.2-6.5 (highly acidic to mildly acidic soil) - except in the case of Thai Muang series, the pH of which is 7.5 (mildly alkaline soil). In addition, the laboratory analysis of four soil samples collected from the project site and the area under study in the project reveals the pH in the range of 5.13-6.17 (highly acidic to mildly acidic soil) , as shown in Appendix 4B) . All in all, the soils in the area under study in the project range from highly acidic to mildly alkaline. However, if there is acid rain in Rayong Province, especially in the area under study in the project; agriculture, the activity that utilizes the said area most, will be negatively affected. Despite its natural acidity, the acidity level in the soil will be increased. The impacts of highly acidic soil with respect to nutrient deficiency and toxicity in soil are as follows:
In soil with pH level lower than 5.0, phosphate can be less utilized by the plant as it is fixed in the forms of iron and aluminum phosphate. Furthermore, iron and manganese become increasingly soluble, and potentially toxic to the plant if their amounts are large enough.
In soil with pH level lower than 5. 5, the plant may suffer from deficiency of potassium, calcium, and magnesium.

Environmental Report for submission to ADB Chapter 5
Pluak Daeng Power Plant Anticipated Environmental Impacts and Mitigations
RNP/ENV/P05028/FR (ADB)/RE62049-sec-5.1.3 Page 5-180
In addition, the data from the investigation on acid deposition in Songkhla Province1 are referred to. The findings are as follows: The concentration of sulphate (SO4
2- ) in the rainwater is higher than that of nitrate (NO3
- ) . The ratio of NO3- SO4
2- is 0.58, which is less than 1 means that the acidity of the rainwater is more attributable to sulfur compounds than to nitrogen compounds. The deposition of wet acid precipitation is 2. 5 times higher than the deposition of dry acid precipitation. Also, the amount of SO4
2- and NO3- in the deposition
of wet acid is 21. 8 and 11. 2 microgram per square meter a year. These show that the majority of acid deposition is caused by Sulphate, not Nitrate. As a result, in the operation phase, pollutants are to be emitted from the electricity generation process through the emission stacks. In spite of the facts that Sulfur Dioxide, the main cause of acid rain, is produced in the project’s electricity generation, in which the main fuel used is natural gas, less than when other fuel fossils are used; and that the project prescribes that the amounts of air pollutant emitted must be lower than those established in the Ambient Air Quality Standards; because of pollutants already released into the air by the plants in the vicinity, the pH of rainwater and acid deposition acid in soil are monitored all through the project from its pre-construction and construction phases to the operation phase, as discussed in the Environmental Action Plan in Chapter 7. For this, Sulphate radical and Nitrate radical in the soil samples are analyzed. The samples are collected from the project area at the depth level of 0-15 cm and also from the agricultural area around Khao Song Phi Nong Mountain in the north-west of the project ( the area around Khao Song Phi Nong Mountain is the worst case in terms of the highest concentration of Sulfur Dioxide and Nitrogen Dioxide resulting from the execution of the project). All in all, the impact on soil fertility is considered low (negative impact level = 1).
1 Naowarat Raksakan, Acid Deposition in the Southern Region of Thailand, Master’ s Degree Thesis, Department of Environmental Technology, School of Energy, Environment and Materials, 2001.

Environmental Report for submission to ADB Chapter 5
Pluak Daeng Power Plant Anticipated Environmental Impacts and Mitigations
RNP/ENV/P05028/FR (ADB)/RE62049-sec-5.1.3 Page 5-181
5.1.6 Earthquake (1) Construction Phase
The project site is located far away from seismic risk zones and faults capable of producing earthquakes. Up to the present no earthquake has ever been reported. Also, there is no record of any damage resulting from an earthquake nor detection of seismic waves in the project area and in the vicinity. Therefore, there is no seismic impact on the project’s construction activity (no impact). (2) Operation Phase The project area is located in seismic zone IV according to the Mercalli scale, with moderate intensity of shaking (can be felt by passers-by). The structure of the buildings in the project is designed in compliance with construction standards with respect to the capacity to withstand the said seismic intensity. Also, no earthquake, has ever been reported in the project area. Therefore, there is no seismic impact on the project operation (no impact).
5.1.7 Associated Facilities 5.1.7.1 Transmission Line The impact of land acquisition The Electricity Generating Authority of Thailand (EGAT) is responsible for the right-of-way, easements and access rigths necessary for the contruction and operation of transmission line. There are 66 land plots which are crossed by transmission line. The construction of a transmission line to dispatch electricity from Pluak Daeng power plant to Pluak Daeng substation may impact on land owners where a transmission line passes through including the demolition of buildings, structures, and crops on those lands situated within right- of- way of the transmission line. In addition, land owner will lose the opportunity to use land in the future such as decrease value of land, type and height of plant will be limited in the area under transmission line. However, this process of right-of-way acquisition will be governed by the Energy Regulatory Commission (ERC) under the Energy Industry Act 2007. All the process help ensure that the impact from land acquisition will be minimized and the land owners will be paid fair and reasonable compensation.

Environmental Report for submission to ADB Chapter 5
Pluak Daeng Power Plant Anticipated Environmental Impacts and Mitigations
RNP/ENV/P05028/FR (ADB)/RE62049-sec-5.1.3 Page 5-182
Meanwhile, the land use within right-of-way of the transmission line surveyed by TLT Consultants Co., Ltd. showed that majority of land use along the transmission line route is agricultural area and idle land. Therefore, the impact on displacement of people will not occur. Apart from measurement according to law and regulation as described, the project has set up mitigation measurement related to construction and right- of- way acquisition for transmission line process to assist the affected people as much as possible including
Having representatives on site to coordinate, communicate and assist people in the area.
Coordinate with EGAT to inform the public of the schedule for construction, and address any concerns that the people in surrounding area may have.
For people within 5 km radius from the project site, GPD will form an environmental committee to consider and mitigate any possible impacts and also to ensure paying fair compensation for affected people.
For people outside the 5 km radius, we will form environmental committee in case- by- case basis when there are impacts from transmission line construction.
The committee set up will include representatives from EGAT, GPD, community leaders, authorities in the area etc.
The impact from electromagnetic field In addition, design and construction of transmission line will be in accordance with EGAT Operation Code for Transmission Line System. There is requirement of electric field and magnetic field of international commission on non- ionizing radiation protection ( ICNIRP) on electromagnetic radiation (Table 5.1.7-1) . To check the compliance with the requirement, EGAT has designed the value of electric field, magnetic field, radio interference, audible noise and short circuit current density by selecting type and clearance of transmission line. The expected results of impact are as shown in Table 5. 1. 7- 2 that calculated by BVCORONA program. All quantities are not exceeded the standard. It can be assured that the construction of transmission line by EGAT will not pose impact of electric field and magnetic field to people living near the line.

Environmental Report for submission to ADB Chapter 5
Pluak Daeng Power Plant Anticipated Environmental Impacts and Mitigations
RNP/ENV/P05028/FR (ADB)/RE62049-sec-5.1.3 Page 5-183
TABLE 5.1.7-1 REQUIREMENT OF ELECTRIC FIELD AND MAGNETIC FIELD OF INTERNATIONAL
COMMISSION ON NON-IONIZING RADIATION PROTECTION (ICNIRP) ON ELECTROMAGNETIC RADIATION
Exposure Electric Field (kV/m)
Magnetic Field (mG)
Working related to magnetic field All day exposure Short time exposure Only arms and legs exposing to magnetic field
10 30 -
5000 50000 250000
People 24 hrs/day 2 - 3 hrs/day
5 10
1000 10000
Remark: Summation of electric field should not exceed 80 kV/m for all day work.
TABLE 5.1.7-2
RESULTS CALCULATED BY BVCORONA PROGRAM
Quantity Unit Quantity at the boundary of R.O.W.
Standard Calculated value Electric Field Magnetic Field Radio Interference Audible Noise
kV/m mG dB dBA
2 200 40 55
1.125 112.68 28.8 35.8
Source: Electricity Generating Authority of Thailand, 2012
Impact on habitats and birds The area of transmission line construction is agricultural area which is a habitat for fauna. Hence, the area of modified habitat is only the area underneath the transmission line. It is not considered heavily modified habitat. There are 41 bird species listed as protected species under Wild Animal Reservation and Protection Act and comprise endemic and migratory birds. The bird collision and electrocution are minimized as according to the Notification of EGAT re: Requirements for Safety in Energy Network System restricts growing perennial plants with height of over 10 meters within the right of way of the transmission line. This will help protect birds from
Environmental Report for submission to ADB Chapter 5
Pluak Daeng Power Plant Anticipated Environmental Impacts and Mitigations
RNP/ENV/P05028/FR (ADB)/RE62049-sec-5.1.3 Page 5-184
electrocution because trees are bird’ s habitats. Moreover, the nearby area of the project already has several 500 kV transmission lines as the EGAT’ s Pluak Daeng Substation is the junction substation in the area. However, there is no report on the effect of the existing transmission lines route on bird migration.
5.1.7.2 Water Pipeline (1) Construction phase The water pipeline will be laid at the right of way of the highway or local road where it passes by East Water. The method to lay water pipeline is open cut, so the impact from water pipeline construction is dust dispersion. However, East Water has established environmental impact prevention and mitigation measures and monitoring measures to manage the impact. (2) Operation phase The activities in the operation phase are water transmission, therefore, there will no impact from water pipeline during this phase. Mitigation measure Construction phase (1) Air quality
Trucks transporting soil shall be covered and always keep the truck in good condition
Truck speed limits shall be 30 kilometers/ hour for the community route and temporary road with unstable surface.
Truck wheels shall be washed before the trucks leave the construction site through the construction period.
Water shall be sprayed at the road of project entrance and construction area to reduce dust diffusion at least twice a day.
Collecting and cleaning, fallen soil or sand on the road twice a day (before noon and in the evening after working) in order to reduce dust diffusion and road safety.
Engines/ machinery shall be inspected, maintenance or checked in order to reduce air pollution emissions.
Environmental Report for submission to ADB Chapter 5
Pluak Daeng Power Plant Anticipated Environmental Impacts and Mitigations
RNP/ENV/P05028/FR (ADB)/RE62049-sec-5.1.3 Page 5-185
(2) Noise Ear plug or ear muff shall be provided for worker who work at loud
machine. Permanent loud machine such as generator shall be put in the building
in order to reduce the noise level. Engines/machinery shall be frequently inspected. Project construction shall be conducted only during daytime during
08.00-17.00 hr. in order to not disturb community during night time. (3) Surface water quality
In the construction area, sanitary toilets shall be provided for construction workers (1 bathroom and 1 toilet).
After finishing of construction, bathroom and toilet shall be demolished and restored area.
Effluent from wastewater holding pond shall be used to spray on the road of project entrance and construction area to reduce dust diffusion
Wastewater holding pond and septic tanks shall be 100 meters far from surface water resources.
Temporary drainage ditches and sedimentation pond shall be prepared by contractor. Sedimentation pond size is 1 meter of width 1 meter of length and 1 meter of depth. Solid will be precipitated while clear water will be discharged out of project.
After finishing construction, contractor shall be restored area and quickly growing grass to cover the area. (4) Water drainage
Drainage earth ditches (Slope 1: 2) shall be made in the construction period in order to drain water at the road side. Drainage earth ditches in the construction area shall be connected to drainage earth ditches at the road side.
Regular maintenance shall be performed for the drainage earth ditch to prevent clogging. (5) Land utilization
Construction activities shall be strictly done in the construction area only. Public relation shall be conducted in order to let people known about
the rational and necessity of project.

Environmental Report for submission to ADB Chapter 5
Pluak Daeng Power Plant Anticipated Environmental Impacts and Mitigations
RNP/ENV/P05028/FR (ADB)/RE62049-sec-5.1.3 Page 5-186
(6) Transportation Drivers shall be strictly followed traffic rules together with clearly showing
the notice of name, address, and phone number of contractor at the behind truck. Truck speed limits shall be 30 kilometers/hour for the community route
and temporary road with unstable surface together with clearly showing the notice of name, address, and phone number of contractor at the behind truck.
Trucks shall be covered with tarpaulin sheets or other materials to prevent materials from falling onto the road.
A warning sign shall be installed at road intersection and at risk of accident area. Driver must not use drug or drink alcohol during working otherwise driver
must be punished immediately. Loading and parking location of truck shall be properly specified in order
to reduce traffic accumulation on road. All trucks must park in the project site only. Collecting and cleaning, fallen soil or sand on the road twice a day (before
noon and in the evening after working) in order to reduce dust diffusion and road safety. Water shall be sprayed at the entrance road of project at least twice a
day (morning-afternoon) to reduce dust diffusion except for rainy day. (7) Solid waste management
The 240 liters of covered waste bins shall be provided and put in the construction control building and rest area of worker. Solid waste shall be gathered and sent to municipality. Cost of waste collecting and transportation will be responsible by contractor.
Recycle waste of contractor will be moved out after finishing project construction.
Construction workers shall be supervised to throw solid waste in prepared waste bin only. (8) Socio-economic
Notice of location to complaint shall be installed at clear position and easily accessible.
Local people shall have the priority to be hired in order to help local people to have a job and income.

Environmental Report for submission to ADB Chapter 5
Pluak Daeng Power Plant Anticipated Environmental Impacts and Mitigations
RNP/ENV/P05028/FR (ADB)/RE62049-sec-5.1.3 Page 5-187
(9) Safety Personal protective equipment shall be provided for workers and
supervised to use during working. Machinery/equipment shall be inspected before using. Workers shall be followed rule and regulation for safety as stipulated in
Labour law. First aid unit shall be provided in construction site together with basic
medicine and first aid kid for small injury. Construction area shall be closed to avoid outside people come into the
working machine area. In construction site shall be kept clean in order to reduce accidents. Notice or warning sign shall be installed to avoid unrelated people come
into construction site and reduce accidents. Also, security guard shall be provided in the construction site.
5.1.7.3 Gas Transmission Pipeline (1) Construction phase Gas transmission pipeline will be laid in the project area by open cut method. The impact of gas pipeline construction is dust which will disperse in the project site. (2) Operation phase The activities in operation phase are gas transmission, but the potential impact of gas pipeline is gas leak. Considering likelihood of occurrence and severity of incident, the risk level is acceptable level, but the project has to set up or review the control measures. The details of major hazard from gas transmission pipeline and mitigation measures are in Section 5.5.

Environmental Report for submission to ADB Chapter 5
Pluak Daeng Power Plant Anticipated Environmental Impacts and Mitigations
RNP/ENV/P05028/FR (ADB)/RE62049-sec-5.1.3 Page 5-188
5.2 BIOLOGICAL RESOURCES 5.2.1 Aquatic Ecology (1) Construction phase During the construction phase, the construction waste, such as dirt, rubble, sand, etc. , if leached by the rain to water bodies, may affect aquatic ecology. Impact mitigation measures are, therefore, established. Truck wheels shall be washed before the trucks leave the construction site or construction- related areas to prevent dirt and sand from falling onto the roads, both inside and outside the project area, and water bodies. Uncontaminated wastewater from construction activities shall be collected to the wastewater holding pond for quality check for compliance with the requirements of Pluak Daeng Industrial Park prior to being discharged to the central wastewater treatment system of Pluak Daeng Industrial Park. Meanwhile, wastewater from utilization and consumption by construction workers shall be collected to the septic tank or the prefabricated wastewater treatment plant for standard treatment. Regarding rainfall within the project area, storm drains shall be provided to collect stormwater and send it to the temporary sedimentation pond. The temporary sedimentation pond will store and allow sedimentation of stormwater within the power plant project area. Furthermore, Settleable Solids shall be separated from stormwater. Clear water will be used to spray in the project area to reduce the diffusion of dust. The remaining water shall be released into the storm drain of Pluak Daeng Industrial Park. It is forecast that the project construction will affect the aquatic ecology at a low level (Negative impact level = 1). (2) Operation Phase As the project is located in Pluak Daeng Industrial Park, wastewater management shall comply with environmental impact prevention and mitigation measures of the Industrial Park. According to the measures, the power plant located in Pluak Daeng Industrial Park shall separate wastewater into two parts: Wastewater from power generation process (consisting of wastewater from the water treatment plant, laboratory wastewater, and sanitary wastewater). Each type of wastewater will be treated with suitable method. After that, the treated wastewater shall be compiled and sent to the wastewater holding pond of the project for quality check for compliance with the standards of Pluak Daeng Industrial Park. Then it shall be drained into the central wastewater treatment

Environmental Report for submission to ADB Chapter 5
Pluak Daeng Power Plant Anticipated Environmental Impacts and Mitigations
RNP/ENV/P05028/FR (ADB)/RE62049-sec-5.1.3 Page 5-189
system of Pluak Daeng Industrial Park. The effluent from the cooling tower of the power plant will be held at the cooling water holding ponds of the project for quality check for compliance with the standards of Pluak Daeng Industrial Park before being carried to the cooling water holding pond of the Industrial Park. Since the project and Pluak Daeng Industrial Park strictly controls the effluent from the cooling tower quality, it is predicted that the effluent discharged will have a low impact on Huai Phu Sai. Based on the analysis report of impacts from the discharge of BOD and TDS in the effluent from the power plant project in Pluak Daeng Industrial Park in the dry and the rainy seasons (December 2015), as shown under Section 5.1.4 Surface Water Quality, includes the following details. 1) Scoping study
The study of impacts from BOD, TDS and ammonia effluent from the cooling tower of the project in Pluak Daeng Industrial Park on aquatic ecology and fisheries and aquatic animal production in Huai Phu Sai and Dok Krai Reservoir. Regarding ClO2, consideration was made including effluent from power generation activity.
The study of use of phosphate that may cause eutrophication and impact on Huai Phu Sai and Dok Krai Reservoir 2) Source of data Measurement results of BOD and DO levels in Huai Phu Sai and Dok Krai Reservoir, August 2015. 3) Physical characteristics of studied surface water
Huai Phu Sai The average width of Huai Phu Sai or the canal ( the section that flows past the location of Pluak Daeng Power Plant) is 2 0 m. The average depth of the canal from the riverbed to the bank is 2.5 m In the rainy season, the canal flows fast, with flooding, while in the dry season, the riverbed contains silt and pubble. Both sides of the canal are covered with papyrus, grass, and reed alternating with rubber orchard. Furthermore, high-density communities and agriculture area were found along the canal. Huai Phu Sai holds the effluent from Pluak Daeng Industrial Park which will flow into Dok Krai Reservoir, about 3.3 km from Pluak Daeng Power Plant Location. Huai Phu Sai flow in front of Pluak Daeng Industrial Park is illustrated in Photo 5.2.1-1.

Environmental Report for submission to ADB Chapter 5
Pluak Daeng Power Plant Anticipated Environmental Impacts and Mitigations
RNP/ENV/P05028/FR (ADB)/RE62049-sec-5.1.3 Page 5-190
PHOTO 5.2.1-1: HUAI PHU SAI FLOW IN FRONT OF PLUAK DAENG INDUSTRIAL PARK
Dok Krai Reservoir Dok Krai Reservoir is the large water source, holding water flow from Huai Phu Sai. Also, water from this reservoir will be used for industrial and agricultural purposes, as well as utilization and consumption. Furthermore, it serves as the fishery source. The reservoir is characterized by lateritic soil, sandy and skeleton soil. The average water retention in Dok Krai Reservoir is 53 . 95 million m3 Photo 5 .2.1- 2 illustrates the appearance of Dok Krai Reservoir, 1 km from the entrance of Huai Phu Sai.
PHOTO 5.2.1-2: APPEARANCE OF DOK KRAI RESERVOIR, 1 KM FROM ENTRANCE
OF HUAI PHU SAI

Environmental Report for submission to ADB Chapter 5
Pluak Daeng Power Plant Anticipated Environmental Impacts and Mitigations
RNP/ENV/P05028/FR (ADB)/RE62049-sec-5.1.3 Page 5-191
4) Fishery and aquatic animal production in Huai Phu Sai and Dok Krai Reservoir The following summary is made from a survey on area condition and the compilation of documents related to fishery and aquatic animal production in the study area.
Huai Phu Sai: People in this area do not earn a living by fisheries or aquatic animal production; they catch aquatic animals by using fishhook and fishnet for consumption in the household or selling them for supplement income. Types of fish found in Huai Phu Sai include Nile Tilapia, Mystus nigriceps, carp, minnows, tiny freshwater shrimp, etc. Each type of fish is not abundant.
Dok Krai Reservoir: Fisheries are made for 3 purposes. earning a living consumption in a household sporting and recreation
The abundant aquatic animals include carp, pangasius sutchi, Nile Tilapia, giant freshwater prown, followed by Probabus jullieni and climbing perch. Fishing tackle includes fishhook, net, and fishnet. Those who catch aquatic animals to earn a living have the income between 500 baht to 1,000 baht per day per person. 5) Evaluation of BOD and TDS impacts from effluent released from project on aquatic ecology 5.1 Evaluation of BOD impact on surface water quality
BOD level in Huai Phu Sai at the location of Pluak Daeng Power Plant location, without the project and with project: Huai Phu Sai is categorized as surface water source, Class 4 . This water source is capable of holding the effluent and useable for industrial purpose. However, utilization and consumption require special water treatment as BOD exceeds 2 mg/ l but not exceeds 4 mg/ l both in the dry and the rainy seasons. Since dissolved oxygen (DO) in Huai Phu Sai is relatively high compared with BOD, that is, the average DO in front of the power plant location and downstream of the power plant location exceeds 7 mg/l This level is sufficient for BOD degradation. As a result, water will not polluted and living things in Huai Phu Sai will survive.

Environmental Report for submission to ADB Chapter 5
Pluak Daeng Power Plant Anticipated Environmental Impacts and Mitigations
RNP/ENV/P05028/FR (ADB)/RE62049-sec-5.1.3 Page 5-192
BOD level in Dok Krai Reservoir at the location of Pluak Daeng Power Plant location, without project and with project: It is categorized as surface water source, Class 4. The average BOD, without project, equals to 3.5 mg/ l With the project, the average BOD in the dry season equals to 3.52 mg/l and in the rainy season, it equals to 3.57 mg/ l Nontheless, the average DO in Dok Krai Reservoir equals to 5.75 mg/ l This level will be sufficient for BOD degradation with sufficient DO left for aquatic living things. 5.2 Evaluation of TDS on surface water quality
Huai Phu Sai: Without project, TDS will be about 931.7 mg/ l With project, The average TDS in the dry season will be 1,001. 24 mg/ l and in the rainy season, it will be 952.07 mg/l, which are less than 5,000 mg/l to 15,000 mg/l (brackish water criteria). Hence, with project, TDS in Huai Phu Sai will be higher. However, it will not lead to brackwish water, which is harmful to aquatic living things.
Dok Krai Reservoir: Without project, in the dry season and the rainy season, TDS will be 223. 6 mg/ l With project, TDS in the dry season will be 249. 92 mg/l and in the rainy season, it will be 337.23 mg/l These levels are lower than the range of brackish water from 5,000 mg/l to 15,000 mg/l Therefore, it is summarized that with project, TDS in Dok Krai Reservoir will be higher but it does not cause brackish water, which is harmful to aquatic living things. 6) Evaluation of chlorine dioxide (ClO2) impacts on aquatic ecology
Impacts on Huai Phu Sai Chlorine dioxide (ClO2) is chosen to eliminate slime mold and microorganisms in cooling water. As there is no reaction between ClO2 and an organic substance, it will not result in trihalomethane ( THMs) ( Petrucci and Rosellini, 2005) . Trihalomethane (THMs) are chemical compounds ( carcinogen) in case of exposure or intake for a long period of time. Apart from this, there is no reaction between ClO2 and ammonia, so, it will not result in chloramine. According to these properties, ClO2 has been employed for water treatment and cooling water in the power plants in several countries in Europe and America to reduce the occurrence of trihalomethane. Other benefits of ClO2 are given below.

Environmental Report for submission to ADB Chapter 5
Pluak Daeng Power Plant Anticipated Environmental Impacts and Mitigations
RNP/ENV/P05028/FR (ADB)/RE62049-sec-5.1.3 Page 5-193
- ClO2 eliminates biofilms which are adhered by legionella. (M.J. Turvey. Ashland Chemicals, UK. “ THE USE OF CHLORINE DIOXIDE FOR CONTROLLING LEGIONNAIRES DISEASE” Published by Ashland /Drew Ameroid, 2nd International Conference on Chlorine Dioxide in Paris)
- ClO2 inhibits the growth of microorganisms better than chlorine (Cl2). It also takes shorter time to disinfect microorganisms.
- ClO2 eliminates inorganic matters, such as iron, manganese, etc while chlorine does not have this property. Use of ClO2 will not cause trihalomethane, which is a carcinogen. As a result, it is not required to measure trihalomethane. Nontheless, ClO2 is likely to affect an aquatic ecology and aquatic living animals because ClO2 is converted into ClO-
2. Effluent from the project will be released into the wastewater holding pond of the project. The concentration of chloride shall not exceed 1 mg/l (Calculation is shown in Section 5.1.4: Surface Water Quality) . The discharge rate of effluent from the cooling tower including wastewater from power generation process will be 11, 660 m3/day, or equals to 0 . 135 m3/ sec (The effluent shall not be discharged from Pluak Daeng Industrial Park in the dry season). The waterflow rate in Huai Phu Sai will be 0.58 m3/sec. The effluent from the cooling tower and wastewater from the project will not directly discharged into Huai Phu Sai, but they will be stored in the cooling water holding pond for at least 1 day. (The power plant’s cooling water holding pond can hold cooling water for at least 1 day) The Material Safety Data Sheet of Vulcon Chemical ( 2002) describes that when used in water, sodium chlorite ( NaClO2) will change into chloride. The concentration of chlorine dioxide (ClO2) in the effluent will not exceed 1 mg/l Calculation is shown in Section 5.1.4: Surface Water Quality). This concentration is lower than the salinity of brackwish water ( 5 , 000 mg/ l) . According to the evaluation of chlorite from the effluent from the cooling tower of the power plant, it will not change into the form of chloride (worst case scenario). The concentration of chlorite is 1 mg/l.
Total concentration in water = C1Q1+C2Q2
Q1+Q2
C1 Chlorite concentration in effluent 1 mg/l C2 Chlorite concentration in Huai Phu Sai 0 mg/l Q1 Effluent flow rate 0.135 m3/sec
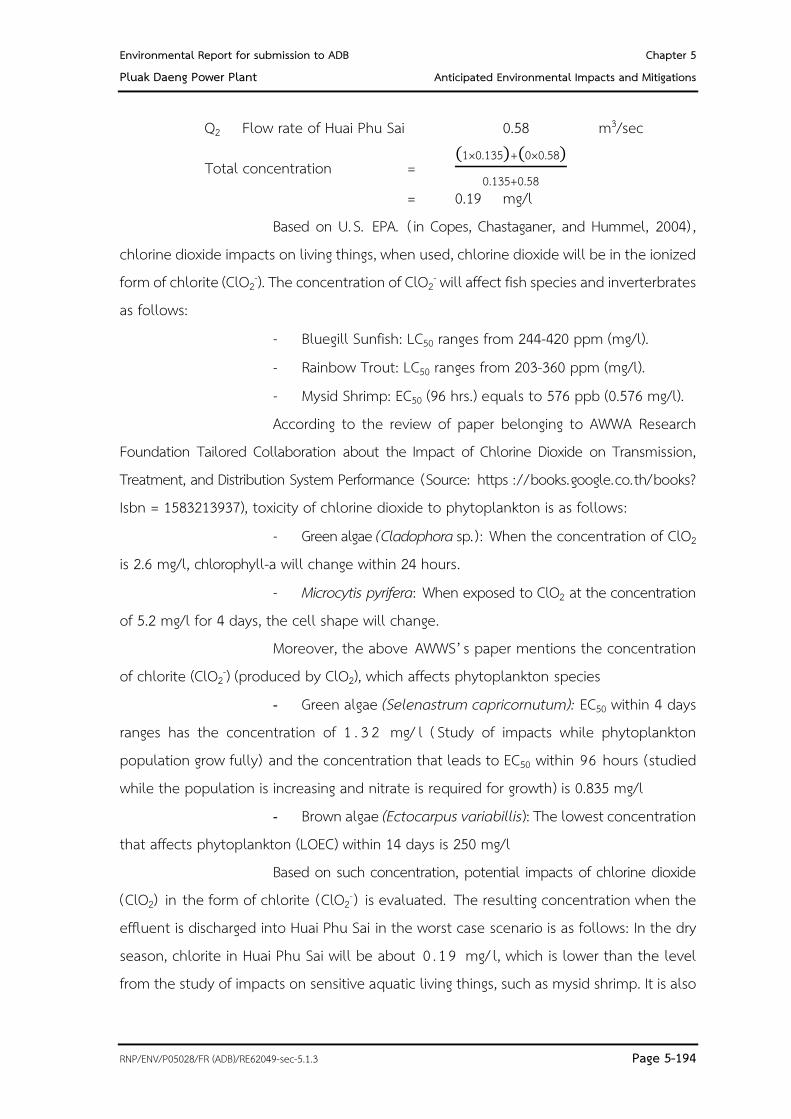
Environmental Report for submission to ADB Chapter 5
Pluak Daeng Power Plant Anticipated Environmental Impacts and Mitigations
RNP/ENV/P05028/FR (ADB)/RE62049-sec-5.1.3 Page 5-194
Q2 Flow rate of Huai Phu Sai 0.58 m3/sec
Total concentration = (1×0.135)+(0×0.58)
0.135+0.58
= 0.19 mg/l Based on U.S. EPA. ( in Copes, Chastaganer, and Hummel, 2004) , chlorine dioxide impacts on living things, when used, chlorine dioxide will be in the ionized form of chlorite (ClO2
-). The concentration of ClO2- will affect fish species and inverterbrates
as follows: - Bluegill Sunfish: LC50 ranges from 244-420 ppm (mg/l). - Rainbow Trout: LC50 ranges from 203-360 ppm (mg/l). - Mysid Shrimp: EC50 (96 hrs.) equals to 576 ppb (0.576 mg/l).
According to the review of paper belonging to AWWA Research Foundation Tailored Collaboration about the Impact of Chlorine Dioxide on Transmission, Treatment, and Distribution System Performance (Source: https ://books.google.co.th/books? Isbn = 1583213937), toxicity of chlorine dioxide to phytoplankton is as follows:
- Green algae (Cladophora sp. ): When the concentration of ClO2 is 2.6 mg/l, chlorophyll-a will change within 24 hours.
- Microcytis pyrifera: When exposed to ClO2 at the concentration of 5.2 mg/l for 4 days, the cell shape will change. Moreover, the above AWWS’ s paper mentions the concentration of chlorite (ClO2
-) (produced by ClO2), which affects phytoplankton species - Green algae (Selenastrum capricornutum): EC50 within 4 days
ranges has the concentration of 1 . 3 2 mg/ l ( Study of impacts while phytoplankton population grow fully) and the concentration that leads to EC50 within 96 hours (studied while the population is increasing and nitrate is required for growth) is 0.835 mg/l
- Brown algae (Ectocarpus variabillis): The lowest concentration that affects phytoplankton (LOEC) within 14 days is 250 mg/l Based on such concentration, potential impacts of chlorine dioxide (ClO2) in the form of chlorite (ClO2
-) is evaluated. The resulting concentration when the effluent is discharged into Huai Phu Sai in the worst case scenario is as follows: In the dry season, chlorite in Huai Phu Sai will be about 0 . 1 9 mg/ l, which is lower than the level from the study of impacts on sensitive aquatic living things, such as mysid shrimp. It is also

Environmental Report for submission to ADB Chapter 5
Pluak Daeng Power Plant Anticipated Environmental Impacts and Mitigations
RNP/ENV/P05028/FR (ADB)/RE62049-sec-5.1.3 Page 5-195
more than 50% (EC50) lower than the concentration that affects phytoplankton cells. It is very low compared with C50 of the studied fish. Hence, it is evaluated that impacts of the project’s effluent on living things in Huai Phu Sai is at a low level. In addition, the review of the Material Safety Data Sheet of sodium chlorite solution, Vulcan Chemicals (2002) found that regarding fish toxicity, LC50 for 48 hours that affects crustacea (Daphnia magna) equals to 0.29 mg/l Based on the reference value of LC50, it is evaluated that chlorite from the effluent released from the project into Huai Phu Sai will not affect fish or other aquatic animals and phytoplankton. Also, it has minimal impact on zooplankton (taking into account LC50 of Daphnia magna).
Impacts on Dok Krai Reservoir Evaluation ctiteria are given below.
- The minimum flow rate of Huai Phu Sai in Dok Krai Reservoir in the dry season is used to evaluate the impacts.
- ClO2 that is released into Huai Phu Sai will be in the form of chlorite (ClO2
-). Evaluation consists of: Analysis of ClO2
- from Huai Phu Sai into Dok Krai Reservoir. CT = C1Q1 + C2Q2
Q1 + Q2 CT = Total ClO2
- C1 = ClO2
- in Huai Phu Sai C2 = ClO2
- in Dok Krai Reservoir Q1 = Flow Rate in Huai Phu Sai in the dry season Q2 = Water volume rate in Dok Krai Reservoir per second
CT = (0.19 x 0.58) + (0 x 775.46) (0.58 + 775.46)
= 0.0001 mg/l Compared with the above reference document about toxicity level, the minimum value of ClO2
- in water from Huai Phu Sai, flowing into Dok Krai Reservoir that affects aquatic living things is 0.29 mg/l (LC50 within 48 hours of Daphnia magna) . The minimum value of ClO2
- in water from Huai Phu Sai, flowing into Dok Krai Reservoir that affects phytoplankton is 0 .835 mg/ l. It is apparent that ClO2
- in Dok Krai Reservoir is lower than the one which is harmful to phytoplankton, zooplankton, and

Environmental Report for submission to ADB Chapter 5
Pluak Daeng Power Plant Anticipated Environmental Impacts and Mitigations
RNP/ENV/P05028/FR (ADB)/RE62049-sec-5.1.3 Page 5-196
aquatic animal, such as fish, etc. As a result, the overall impact on aquatic ecology in Dok Krai Reservoir is at a low level. Meanwhile, there will be no impact on fisheries because ClO2
- is very low and it is not harmful to fishing resources (fish, shrimp). Moreover, ClO2- in
water will be converted into chloride, which is not dangerous to aquatic living things (The value is lower than brackish water criteria.) However, aquatic ecology, fisheries and aquatic animal production measures are established by the project, such as releasing aquatic animal species into Huai Phu Sai and Dok Krai Reservoir, etc. 7) Evaluation of ammonia impacts from effluent from the cooling tower The project will employ 25% aqueous ammonia 81 m3/year to control water quality in a boiler/ the pipe system of boiler, which will later become the effluent combined with cooling water of about 56,866 m3/day. After evaporation, the effluent will be 11,660 m3/day. 25% ammonia solutions means one liter of the solution contains 250 grams of ammonia. The amount of 81 m3/year, or 0 .22 m3/day of this solution will be employed. Ammonia content will be 5 5 , 0 0 0 , 0 00 milligrams per the cooling water of 56,866 m3/day. However, the cooling water will be evaporated by the cooling tower 4.88 times (56,866 ÷ 11,660). Therefore, the remaining ammonia will be 11,270,492 milligrams. Hence, the concentration of ammonia in the effluent from the cooling system is 0.97 mg/l (11,270,492 ÷ (11,660 x 1,000)). The effluent from the cooling system of the project will be released into Huai Phu Sai with the following details.
The discharge rate of effluent from the project is 0.135 m3/sec and the concentration of ammonia is 0.97 mg/l
The average flow rate in Huai Phu Sai in the dry season is 0 . 5 8 m3/sec and the concentration of ammonia in Huai Phu Sai is 0.1 mg/l
The average ammonia in water in Huai Phu Sai combined with the effluent from the cooling system of the project will be 0 . 2 6 mg/ l According to surface water quality standards from the Announcement of the National Environment Board, No. 8 (November, B.E. 2537), the ammonia level in water bodies, Class 1, Class 2 and Class 3, which are clean water bodies suitable for living things, shall not exceed 0.5 mg/l Therefore, when the effluent from the cooling system is discharged into Huai Phu Sai, the total

Environmental Report for submission to ADB Chapter 5
Pluak Daeng Power Plant Anticipated Environmental Impacts and Mitigations
RNP/ENV/P05028/FR (ADB)/RE62049-sec-5.1.3 Page 5-197
ammonia in Huai Phu Sai will still meet the standards. This will not affect aquatic ecology. As ammonia evaporates from water body, ammonia level will reduce. Additionally, ammonia will not accumulate in Dok Krai Reservoir as water is pumped from the reservoir and ammonia can evaporate from water. 8) Evaluation of use of phosphate in boiler that leads to eutrophication Phosphate will be used in the boiler of the power plant to prevent slag. The remaining water in the boiler will become the effluent that is combined with the effluent from cooling system at the discharge rate of 11,660 m3/day. The 10% trisodium phosphate concentration will be applied in the project (One liter of solution contains 100 grams of Na3PO4.) 1.24 m3/year, or 0.003 m3/day on average. Based on Na3PO4 formula, phosphate content will be as follows: 164 grams of Na3PO4 contain 95 grams of phosphate content, or ratio of phosphate in Na3PO4 equals to 0.579. Phosphate content before use in the bolier is 173 ,700 mg/day (100 g x 0.579 x 0.003 m3 x 1,000 l x 1,000 mg) . If the entire 0.003 m3 of phosphate is used in the boiler ( not the entire phosphate is employed in the project operation) without thermal degradation, when combined with the effluent from the cooling tower, the concentration of phosphate released into the outside will be 0.015 mg/l (173 ,700 ÷ (11 ,660 x 1,000)) and the phosphorus content is 0.005 mg/l The study of phosphate level that causes eutrophication in freshwater in Ecological Toxicology (Maliwan Boonsanue, 2012) reveals that phosphate content that lead to eutrophication is 1.3 mg/l with approx. 9.1 mg/l of TKN in water. (The production of phytoplankton and algae cells needs the ratio of phosphorus to nitrogen 1: 7 ) . The released concentration of phosphorus from the project is 0 .005 mg/ l The data of water quality in Huai Phu Sai show that TKN equals to 0.2 mg/l and phosphorus (calculated from the phosphate level at discharge point equals to 1.01 mg/ l) equals to 0. 3 3 mg/ l. The concentration of phosphorus in Huai Phu Sai in front of the project location combined with the effluent from the project will decrease (When the average flow rate in Huai Phu Sai in the dry season is 0.58 m3/sec) to 0.27 mg/l and TKN in Huai Phu Sai equals to 0.2 mg/l. Hence, the ratio of phosphorus to nitrogen is 1:0.74, which is less than 1:7, so, it will not cause eutrophication. Phosphate will be swept away by water mass of Dok Krai Reservoir, or bonded to calcium in water or suspended sediment and some will be pumped together with water mass, resulting in low eutrophication. Nontheless, according

Environmental Report for submission to ADB Chapter 5
Pluak Daeng Power Plant Anticipated Environmental Impacts and Mitigations
RNP/ENV/P05028/FR (ADB)/RE62049-sec-5.1.3 Page 5-198
to the review of technical documents, monitoring of eutrophication can be performed through the measurement of chlorophyll a. Therefore, chlorophyll a and phosphate monitoring are included in the surface water quality monitoring measures of the project. 9) Evaluation of impacts from benthos after the project is implemented According to the measures of Pluak Daeng Industrial Park in the EIA report, the IPP in the Industrial Park has to separate wastewater into 2 parts. (a.) Wastewater from power generation process consists of wastewater from water treatment system, laboratory wastewater and sanitary wastewater. After receiving treatment and quality check, it shall be carried to the central wastewater treatment system of Pluak Daeng Industrial Park. (b.) The effluent from the cooling water system of the power plant, which will be held in the cooling water holding pond for quality check and shall be carried to the cooling water holding pond of Pluak Daeng Industrial Park. Hence, wastewater will not be directly discharged into natural water bodies; it will receive treatment according to the requirements of Pluak Daeng Industrial Park with quality check before being conveyed to the Industrial Park. The online monitoring system will be installed at the cooling water holding ponds and the wastewater holding pond of the project. In case the effluent does not meet the standards, it will be carried to the emergency pond for treatment prior to carrying to the Industrial Park. BOD Impacts on benthos: Before and after the project operation, in the dry and the rainy seasons, BOD in Huai Phu Sai is not much different (Before and after the project operation in the dry season, BOD equals to 4 and 3.62 mg/l, respectively; meanwhile in the rainy season, BOD equals to 4 and 3.96 mg/l, respectively). Additionally, the measurement result of dissolved oxygen at the monitoring station in Huai Phu Sai is relatively high ( 8 . 2 mg/ l) and sufficient for BOD degradation. Therefore, water is not polluted and it affects benthos and aquatic living animals at a low level. TDS from the cooling system will be discharged into the cooling water holding pond of the project before releasing into the cooling water holding pond of Pluak Daeng Industrial Park and Huai Phu Sai. As a result, the average TDS in Huai Phu Sai will be about 1,001.24 and 952.07 mg/l in the dry and the rainy seasons, respectively. These TDS values are lower than 5,000-15,000 mg/l. It is concluded that the project operation will

Environmental Report for submission to ADB Chapter 5
Pluak Daeng Power Plant Anticipated Environmental Impacts and Mitigations
RNP/ENV/P05028/FR (ADB)/RE62049-sec-5.1.3 Page 5-199
cause the slight increase in TDS in Huai Phu Sai. Furthermore, it will not cause brackish water. Thus, the impacts on survival of benthos and aquatic living things are at the low level. Chlorine dioxide will be used to eliminate slime mold and micro-organism in the cooling system. The cooling blowdown will be collected and carried to the cooling water holding pond of the project for at least 1 day before being released into the cooling water holding pond of Pluak Daeng Industrial Park and the effluent will be drained into Huai Phu Sai. Chlorine dioxide will be converted into chlorite which may affect aquatic living organisms, especially sessile benthos which move slowly. However, the concentration of chlorite in the effluent from the cooling system will not exceed 1 mg/l, or about 0.2 mg/l for the maximum discharge rate of 11 ,660 m3/day, or 0 .135 m3/sec (natural gas as fuel scenario and 100% Load/Full load) (no discharge from the central wastewater treatment system of Pluak Daeng Industrial Park in the dry season, except the effluent from the cooling water holding pond of the power plant) The average flow rate of Huai Phu Sai is 0.58 m3/sec. According to the evaluation of impact from chlorine dioxide, which is in the form of chlorite, on Huai Phu Sai in case the discharge is done in the dry season, it will be very low. Chlorite from the project operation in Huai Phu Sai will be about 0.19 mg/ l, which is less than the value from the study of impacts on sensitive aquatic living things, such as mysid shrimp (EC50 (96 hrs) = 0.576 mg/l), etc. Apart from this, the stronger current in Huai Phu Sai will dilute the concentration of chlorite. Therefore, it is forecast that the effluent from the project will have low impacts on living things in Huai Phu Sai.
5.2.2 Terrestrial Ecology
5.2.2.1 Forest Resources (1) Construction Phase Pluak Daeng Power Plant Project is located in Pluak Daeng Industrial Park, Map Yang Phon sub-district, Pluak Daeng district, Rayong province. Pluak Daeng Industrial Park shall complete land leveling before making the hand-over to the project. Currently, land leveling is undertaken partially, as illustrated in Photo 5 . 2. 2- 1 . Due to no forest resource in the project area, the construction of Pluak Daeng Power Plant Project will not affect forest resources. As a result, no impact will arise (No impact).

Environmental Report for submission to ADB Chapter 5
Pluak Daeng Power Plant Anticipated Environmental Impacts and Mitigations
RNP/ENV/P05028/FR (ADB)/RE62049-sec-5.1.3 Page 5-200
PHOTO 5.2.2-1: EXISTING CONDITION IN PLUAK DAENG INDUSTRIAL PARK
For impact on invasive species, according to the survey, it was found 3 plant invasive species within 5-kilometer radius from the project boundary, namely, Siam Weed ( Eupatorium odoratum Linn. ) , Hedge Flower ( Lantana camara Linn. ) , Sensitive Plant (Mimosa pigra Linn. ) . As they are weed, they have spread through many areas especially in idle land. At present, the project site has already been cleared and leveled, so there are no import soil or sand which may contain invasive species from outside the project. Hence, the project activities will not cause further spreading of invasive species. (2) Operation Phase The power plant project will use natural gas as a primary fuel. Potential major impacts from the project operation include air quality and surface water quality. Environmental impact prevention and mitigation measures are established as detailed below.
Air quality: Air pollutant emission rates from emission stacks shall not exceed the setting standards in the EIA report. Dry Low NOx (DLN) combustion shall be applied to control NOx during combustion in case of natural gas as fuel scenario. Water Injection NOx combustion shall be applied to control NOx during combustion in case of diesel oil as fuel scenario.

Environmental Report for submission to ADB Chapter 5
Pluak Daeng Power Plant Anticipated Environmental Impacts and Mitigations
RNP/ENV/P05028/FR (ADB)/RE62049-sec-5.1.3 Page 5-201
Surface water quality: The cooling water effluent quality shall be controlled for compliance with the measures of Pluak Daeng Industrial Park. The Industrial Park requires that the quality of cooling water shall meet the Notification of the Ministry of Industry, B. E. 2560 ( 2017) , dated 30 May 2017 Regarding Determination of Effluent Standards for Industrial Plants, published in the Royal Government Gazette, Vol. 134, Part 153, dated 7 June B.E.2560 (2017) on determination quality of wastewater discharged from factories. Total dissolved solids (TDS) shall meet standard quality of water discharge to irrigation canal. The online monitoring system shall be installed to measure the temperature, pH, conductivity and dissolved oxygen at the cooling water holding ponds of the power plant. The monitoring results shall be reported to the display in front of the project area and wastewater control center of Pluak Daeng Industrial Park. According to the field survey results, forest resources were not found in the 5 km radius of the study area from the boundary of the project area. Plants scattered only on the roadside. Land use comprises community area, government compound, industrial estate, reservoir and agriculture area, etc. Hence, it will affect terrestrial ecology at a low level (Negative impact level = 1).
5.2.2.2 Wildlife Resources (1) Construction phase Pluak Daeng Power Plant Project is located in Pluak Daeng Industrial Park, Map Yang Phon sub-district, Pluak Daeng district, Rayong province. The Industrial Park shall complete land leveling before delivering the land to the project. Currently, part of the area is leveled as shown in Photo 5.2.2-1, hence, the project site is not a habitat for fauna. The construction of Pluak Daeng Power Plant Project will not affect wildlife resources as the area is not the shelter and foraging habitat of wild animals (No impact). (2) Operation Phase During the operation phase, there will be power generation activity only within the project area. Air pollutant emission control measures and the project’s effluent characteristics are established. Therefore, the project operation will not disturb or affect wildlife resources. It is expected that certain species of wild animals, such as pigeons, that are able to adapt to the environment will live in the project area. Overall, the project operation will not affect wildlife resources (No impact).

Environmental Report for submissionl to ADB Chapter 5 Pluak Daeng Power Plant Anticipated Environmental Impacts and Mitigations
RNP/ENV/P5028/FR (ADB)/RE62049-sec 5.3 Page 5-202
5.3 HUMAN USE VALUES 5.3.1 Transportation (1) Construction phase The project development during the construction phase comprises transportation of equipment, machinery, construction workers and construction materials for the project construction. The activities will affect traffic volume in the area. Traffic volume on highways and roads around the project area and nearby areas are employed to evaluate transportation impacts. Moreover, the increased traffic volume due to the project development is adopted for the evaluation of the proportion of traffic volume to highway capacity and other related road capacity. The v/ c ratio is taken into account for evaluation of traffic flow in the area at present and during the project development. Details are given below.
Vehicles are categorized into 8 types. The Passenger Car Unit (PCU) is calculated from Passenger Car Equivalents (PCE) as shown in Table 5.3.1-1.
Where V is the traffic volume ( from PCU peak hour) , the v/c ratio is calculated for comparison with the standard of the Traffic Engineering Division, which shall not exceed 0.8 (80%). Highway capacity by type is shown in Table 5.3.1-2.
TABLE 5.3.1-1 WEIGHTED VALUE OF EACH TYPE OF VEHICLE
Vehicles Passenger Car Equivalents Factor (PCE) Passenger car and taxi 1.00 Light bus 1.25 Heavy bus 2.00 Light truck 1.50 Medium truck 1.75 Heavy truck 2.00 Motorcycle 0.33 Two-wheelers, tricycle 0.20
Source : Phaophong, 1997 and Department of Highways, 2001

Environmental Report for submissionl to ADB Chapter 5 Pluak Daeng Power Plant Anticipated Environmental Impacts and Mitigations
RNP/ENV/P5028/FR (ADB)/RE62049-sec 5.3 Page 5-203
TABLE 5.3.1-2 HIGHWAY CAPACITY BY TYPE
Type of Highway Traffic Carrying Capacity (vehicle/hr.) Multi-lane highway 2,000 (per 1 lane) Bidirectional 2 lanes 2,000 (bidirectional) Bidirectional 3 lanes 4,000 (bidirectional)
Source : Paopong, 2540
The comparison of v/c ratio standard for future traffic flow conditions is made as shown in Table 5.3.1-3.
The v/ c ratio is calculated to evaluate impacts on traffic flow on highways and roads in the project area and vicinities. Traffic volumes on highways and roads (Table 4.3.2-1 to Table 4.3.2-3) are applied to calculate PCU as shown in Table 4.3.2-7. According to the evaluation, the existing v/ c ration before the project development was 0.16-0.33 (2015). This means highways and roads adjacent to the project area has a very high traffic flow as shown in Table 5.3.1-3.
TABLE 5.3.1-3
V/C RATIO STANDARD FOR FUTURE TRAFFIC FLOW CONDITIONS V/C Ratio Future Traffic Flow Conditions
0.89-1.00 hr Severe traffic flow 0.68-0.88 hr Very high traffic congestion 0.53-0.67 hr Medium traffic flow 0.37-0.52 hr Good traffic flow 0.20-0.36 hr Excellent traffic flow
Source: Improved from the study of Phaopong, 1997
The following formula is used to calculate v/c ratio V/C ratio = Increased traffic volume due to project development + existing traffic volume Carrying capacity of each highway

Environmental Report for submissionl to ADB Chapter 5 Pluak Daeng Power Plant Anticipated Environmental Impacts and Mitigations
RNP/ENV/P5028/FR (ADB)/RE62049-sec 5.3 Page 5-204
During the construction phase, traffic volume will increase from the transportation of equipment, machinery, construction workers and construction materials for the project construction. The calculation of v/c ratio during the construction phase is shown in Table 5.3.1-4.
TABLE 5.3.1-4
MAXIMUM VEHICLES TO BE USED DURING CONSTRUCTION PHASE
Transportation Types of Vehicle Trips
(Trip/Day) Safety Factor
(10%) Equipment and machinery Trailer 20 22 Construction workers Van/light truck 96 106 Construction materials Trailer 60 66
Total 176 194
Transportation of equipment and machinery The transportation of equipment and machinery requires 10 trailers. There will be 20 trips/day (round trip).
A 10% safety factor (201.1) = 22 trips/day In case of 1 day of 8 working hours
Therefore, traffic volume from transportation of machinery = 3 trips/hr
Traffic volume due to project operation in PCU = 32.0 PCU/hr = 6 PCU/hr Transportation of construction workers The transportation of total 3 , 2 00 construction workers requires 48 vans/light trucks. There will be 96 trips/day (round trip).
A 10% safety factor (961.1) = 106 trips/day In case of 1 day for 2-hour travelling ( in the morning and in the
evening) Therefore, traffic volume from transportation
of construction workers = 53 trips/hr.

Environmental Report for submissionl to ADB Chapter 5 Pluak Daeng Power Plant Anticipated Environmental Impacts and Mitigations
RNP/ENV/P5028/FR (ADB)/RE62049-sec 5.3 Page 5-205
Traffic volume due to project operation in PCU = 531.5 PCU/hr = 79.5 PCU/hr Transportation of construction materials The transportation of construction materials requires 30 trailers. There will be 60 trips/day (round trip).
A 10% safety factor (601.1) = 66 trips/day In case of 1 day of 8 working hours
Therefore, traffic volume from transportation of construction materials = 9 trips/hr
Traffic volume due to project operation in PCU = 92.0 PCU/hr = 18 PCU/ hr Transportation of construction workers will be in the morning and in the evening only. However, the evaluation is made in the worst case scenario. That is equipment and machinery, construction workers and construction materials are transported concurrently. The increased traffic volume will be as follows: Trailers for transportation of equipment and machinery =6 PCU/ hr Vans/ light trucks for transportation of construction workers = 79 . 5 PCU/hr Trailers for transportation of construction materials = 18PCU/ hr Thus, a total incremental traffic volume due to the transportation of equipment and machinery, construction workers and construction materials will be (6+79.5+18 PCU/hr) = 103.5 PCU/hr A total incremental traffic volume due to the transportation of equipment and machinery, construction workers and construction materials will be 1 94 trips/day, or 103.5 PCU/hr. The v/c ratio of traffic on highways and roads will be from 0.17 hr-0.38 hr. This means activities during the construction phase will not affect traffic flow on each transportation route (Table 5.3.1-5). Details are given below.
National Highway No. 331: At the count station at km 68+900, the existing v/c ratio is 0.18. In case of construction activities, the v/c ratio will increase to 0.19, with a very high traffic flow. Hence, impacts on the traffic condition on the National Highway No.331 will be insignificant.

Environmental Report for submissionl to ADB Chapter 5 Pluak Daeng Power Plant Anticipated Environmental Impacts and Mitigations
RNP/ENV/P5028/FR (ADB)/RE62049-sec 5.3 Page 5-206
TABLE 5.3.1-5 V/C RATIO ON HIGHWAYS RELATING TO PROJECT AT PRESENT AND DURING
CONSTRUCTION PHASE
Locations
Traffic Volume3/
on Road at Present (PCU/hr)
Increased Traffic volume during
Construction Phase
(PCU/hr)
Total traffic Volume on
Road at Present and
during Construction
Phase (PCU/hr)
Number of Lanes
Carrying Capacity (PCU/hr)
V/C ratio
At Present During
Construction Phase
National Highway No. 3311/ at Km 68+900
1,418 103.5 1,521.50 4 8,000 0.18 0.19
National Highway No. 361/ at Km 2+000
2,189 103.5 2,292.5 4 8,000 0.27 0.29
Rural Road No. Ro.Yor. 20262/ at Km 12+300
611 103.5 714.5 2 2,000 0.31 0.36
Rural Road No. Ro.Yor. 30132/ at Km 14+250
665 103.5 768.5 2 2,000 0.33 0.38
Remark : v/c ratio : 0.89-1.00 = Severe traffic flow 0.68-0.88 = Very high traffic congestion 0.53-0.67 = Medium traffic flow 0.37-0.52 = Good traffic flow 0.20-0.36 = Excellent traffic flow Sources : 1/ Traffic Volume on Highways Report 2014-2018 (Department of Highways, Ministry of Transport), 2019 2/ Field traffic count results by Team Consulting Engineering and Management Co. , Ltd. ,
March 13th-14th, 2016 (The day with maximum traffic count will be applied.). 3/ Reference is traffic volume in the latest year (PCU/hr) only (existing condition).
National Highway No. 36: At the count station at km 2+000, the
existing v/ c ratio is 0. 27. In case of construction activities, the v/ c ratio will increase to 0. 29, indicating a very high traffic flow. Thus, impacts on the traffic condition on the National Highway No. 36 will be insignificant.
Rural Highway No. Ro. Yor. 2026: At the count station at km12+300, the existing v/c ratio is 0.31. In case of construction activities, the v/c ratio will increase to 0.36, with a very high traffic flow. Therefore, impacts on the traffic condition on the Rural Road No. Ro. Yor. 2026 will be insignificant.

Environmental Report for submissionl to ADB Chapter 5 Pluak Daeng Power Plant Anticipated Environmental Impacts and Mitigations
RNP/ENV/P5028/FR (ADB)/RE62049-sec 5.3 Page 5-207
Rural Highway No. Ro. Yor. 3013: At the count station at km14+250, the existing v/c ratio is 0.33. In case of construction activities, the v/c ratio will increase to 0.38, with a good traffic flow. Therefore, impacts on the traffic condition on the Rural Road No. Ro. Yor. 3013 will be insignificant. (2) Operation phase During the operation phase, traffic volume will increase from passenger cars, visitors’ vehicles, garbage, sludge and chemical substance transport vehicles. Thus, the highest number of transport vehicles during the operation phase will be 157 vehicles/day, or 314 trips/day (Table 5.3.1-6). Details are given below.
TABLE 5.3.1-6 HIGHEST NUMBERS OF VEHICLES TO BE USED DURING OPERATION PHASE
Transportation Activities Types of Vehicle Numbers of Vehicle
(vehicle/day) Numbers of Trip
(trips/day) Travel of power plant staff and visitors
Passenger car 84 168
Garbage transportation Garbage transport vehicle 1 2 Transportation of chemical substance
Trailer 1 2
Transportation of diesel oil Trailer 71 142 Total 157 314
Source : Implementation Results of Environmental Measures of Uthai Power Plant Project Report (January-June 2016) by Gulf JP UT Co., Ltd.
Travel of power plant staff and visitors There will be 84 passenger cars/day, or 168 trips/day (round trip) of power plant staff and visitors
A 10% safety factor (1681.1) = 185 trips/day In case of 1 day for 2-hour travelling (In the morning and in the evening )
Therefore, traffic volume from transportation of staff = 93 trips/hr
Traffic volume due to project operation in PCU = 931.0 PCU/hr = 93 PCU/hr

Environmental Report for submissionl to ADB Chapter 5 Pluak Daeng Power Plant Anticipated Environmental Impacts and Mitigations
RNP/ENV/P5028/FR (ADB)/RE62049-sec 5.3 Page 5-208
Garbage transportation There will be 51 kg/day of garbage from utilization-consumption of staff. A garbage transport vehicle will collect garbage for disposal every 2 days. In the worst case scenario, the garbage shall be transported every day. There will be 1 garbage transport vehicle, or 2 trips/day (round trip).
A 10% safety factor (21.1) = 3 trips/day In case of 1 day for 8 working hours
Therefore, traffic volume from garbage transportation = 1 trips/hr
Traffic volume due to project operation in PCU = 12.0 PCU/hr = 2 PCU/hr Transportation of chemical substance Chemical substances used in the power plant will be transported about 140 trips/year, or 3 trips/week on average by trailers. In the worst case scenario, chemical substances shall be transported every day. There will be 1 trailer, or 2 trips/day ( round trip).
A 10% safety factor (21.1) = 3 trips/day In case of 1 day for 8 working hours
Therefore, traffic volume from chemical substance transportation = 1 trip/hr
Traffic volume due to project operation in PCU = 12.0 PCU/hr = 2 PCU/hr Transportation of diesel oil Diesel oil will be reserved as backup fuel with volume of 42,500,000 liters which will be transported within 15 days by 40,000-liter trailer. There will be 71 trailers or 142 trips/day (round trip).
A 10% safety factor (1421.1) = 157 trips/day In case of 1 day for 22 working hours (avoid rush hour durgin 7.30-8.30 hr.
and 16.00-17.00 hr.) Therefore, traffic volume from sludge transportation = 8 trip/hr
Traffic volume due to project operation in PCU = 82.0 PCU/hr = 16 PCU/hr
Environmental Report for submissionl to ADB Chapter 5 Pluak Daeng Power Plant Anticipated Environmental Impacts and Mitigations
RNP/ENV/P5028/FR (ADB)/RE62049-sec 5.3 Page 5-209
As a result, during the operation phase, 113 PCU/hr of traffic volume will increase from the travel of the power plant staff/visitors, transportation garbage, chemical substances, and diesel oil. The v/c ratio will be in the range of 0.18-0.39. This will not affect traffic flow on each transportation route (Table 5.3.1-7). Details are given below.
National Highway No. 331: At the count station at Km 68+900 , the existing v/ c ratio is 0. 18. During the operation phase, the v/ c ratio will increase to 0. 19, with a very high traffic flow. Hence, impacts on the traffic condition on the National Highway No. 331 will be insignificant.
National Highway No. 3 6 : At the count station at Km 2+ 000 , the existing v/ c ratio is 0. 27. During the operation phase, the v/ c ratio will increase to 0. 29, with a very high traffic flow Thus, impacts on the traffic condition on the National Highway No. 36 will be insignificant.
Rural Road No. Ro.Yor. 2026: At the count station at Km 12+300, the existing v/c ratio is 0.31. During the operation phase, the v/c ratio will increase to 0.36 with a very high traffic flow. Therefore, impacts on the traffic condition on the Rural Road No. Ro. Yor. 2026 will be insignificant.
Rural Road No. Ro.Yor. 3013: At the count station at Km 14+250, the existing v/c ratio is 0.33. During the operation phase, the v/c ratio will increase to 0.39, with good traffic flow. Therefore, impacts on the traffic condition on the Rural Road No. Ro. Yor. 3013 will be insignificant. Mitigation Measures (1) Construction Period
Transportation routes of construction materials and equipment shall be planned to avoid traffic problems.
Regular review and modification of Transportation routes of construction materials and equipment shall be performed so as to be in line with current situation.
Transport of construction materials during rush hours, i.e. from 07.30-08.30 hr and 16.00-17.00 hr, shall be avoided to reduce traffic congestion. If it is necessary to transport construction materials during rush hours, prior permission or approval shall be obtained from relevant agencies. Additionally, communities shall be notified 2 weeks in advance

Environmental Report for submissionl to ADB Chapter 5 Pluak Daeng Power Plant Anticipated Environmental Impacts and Mitigations
RNP/ENV/P5028/FR (ADB)/RE62049-sec 5.3 Page 5-210
TABLE 5.3.1-7 V/C RATIO ON HIGHWAYS RELATING TO PROJECT AT PRESENT AND DURING
OPERATION PHASE
Locations
Traffic Volume3/
on Road at Present (PCU/hr)
Increased Traffic Volume
during Operation
Phase (PCU/hr)
Total Traffic Volume on
Road at Present and
during Operation
Phase (PCU/hr)
Numbers of Lanes
Carrying Capacity (PCU/hr)
V/C Ratio
At Present
During Operation
Phase
National Highway No. 3311/ at Km 68+900
1,418 113 1,531 4 8,000 0.18 0.19
National Highway No. 361/ at Km 2+000
2,189 113 2,302 4 8,000 0.27 0.29
Rural Road No. Ro.Yor. 20262/ at Km 12+300
611 113 724 2 2,000 0.31 0.36
Rural Road No. Ro.Yor. 30132/ at Km 14+250
665 113 778 2 2,000 0.33 0.39
Remark : v/c ratio : 0.89-1.00 = Severe traffic flow 0.68-0.88 = Very high traffic congestion 0.53-0.67 = Medium traffic flow 0.37-0.52 = Good traffic flow 0.20-0.36 = Excellent traffic flow Sources : 1/ Traffic Volume on Highways Report 2011-2015 (Department of Highways, Ministry of Transport), 2016 2/ Field traffic count results by Team Consulting Engineering and Management Co., Ltd.,
March 13th-14th, 2016 (The day with maximum traffic count will be applied.). 3/ Reference is traffic volume in the latest year (PCU/hr) only (existing condition).
Trucks shall be covered with tarpaulin sheets to prevent materials from
falling onto the road. Contractors shall supervise drivers to strictly follow traffic rules. Truck weight limits shall be controlled to comply with law. Drivers shall be trained and supervised to strictly follow traffic rules. Regular check and maintenance shall be performed for vehicles used
in the project. Coordination with traffic police regarding transport of materials and
equipment.

Environmental Report for submissionl to ADB Chapter 5 Pluak Daeng Power Plant Anticipated Environmental Impacts and Mitigations
RNP/ENV/P5028/FR (ADB)/RE62049-sec 5.3 Page 5-211
Truck speed limits shall be 80 kilometers/ hour for the highway according to the Land Transport Act, B.E.2522 and the Highway Act, Volume 2 and Volume 3, B.E.2542. Also, speed limits shall not exceed 40 kilometers/hour in communities.
A warning sign shall be installed and speed shall not exceed 20 kilometers per hour at the construction site.
A telephone number of the responsible person shall be posted on transportation trucks as a channel for complaints to the project.
Security guards shall be provided for facilitation at the access road. (2) Operation Period
Drivers shall strictly follow traffic rules. Transport and safety regulations shall be established for vehicles
coming in and out of the Project so as to prevent accidents. Sufficient parking space shall be provided in a suitable area. Also, traffic
signs shall be installed within the project area and the access road. A warning sign shall be installed and speed shall not exceed 20
kilometers per hour in the project area. The number of vehicles coming in the generation unit shall be limited
to reduce accidents in that area. Types and volume of vehicles coming in the project area shall be
recorded. The obtained information shall be used for traffic management in the project area, especially in the parking space, where parking outside the designated area within the Project area shall be prohibited.
The condition of transportation vehicles shall be checked regularly. A telephone number of the responsible person shall be posted on
transportation trucks as a channel for complaints to the project. Hazardous chemicals or waste transporter companies shall be
supervised to strictly adhere to relevant laws. ( such as the manual for transport of hazardous objects of Pollution Control Department, September 2011, the manual for hazardous chemical management and handling in the place of business, July 2013, and the Notification of Department of Industrial Works on manual for storage of hazardous chemicals and objects, B.E.2550 and the Notification of Ministry of Industry on transportation of hazardous substances responsible by Department of Industrial Works, B.E.2558, etc.)
Environmental Report for submissionl to ADB Chapter 5 Pluak Daeng Power Plant Anticipated Environmental Impacts and Mitigations
RNP/ENV/P5028/FR (ADB)/RE62049-sec 5.3 Page 5-212
Chemical substance and waste transporting vehicles shall have the clear and easy to understand warning sign. The warning sign shall contain name of chemical substance and details according to international standards, such as UN Recommendations and HAZCHEM code, etc
5.3.2 Water Use (1) Construction phase During the construction phase, contractors will provide construction workers water for utilization and consumption as well as construction activities. (a) Water use for construction activities, utilization and consumption by construction workers accounts for 224 m3/ day. ( calculated from 7 0 l/ person/ day (Kriangsak, 1996) with 3,200 construction workers in total) Contractors will provide water. As for drinking water, contractors will purchase bottled drinking water. (b) About 55 m3/day of water will be used for construction activities. (c) Water use for spraying the project area to reduce the diffusion of dust during the construction phase will be 1,182 m3/day. (calculated from single spraying/round = 0.75 l/sq.m, at least 2 times/day in the area of 492 rai) Hydrostatic test water of 180 m3 will be provided by Pluak Daeng Industrial Park. A total water use during the construction phase of Pluak Daeng Power Project will be 1 , 711 m3/ day. The water supply during the construction period can be supplied by Rojana industrial park. Their water supply facility is under final stage of construction and will be ready in Q4/2019. Alternatively, water can be supplied from water supplier, which will be arranged by Contractor. Consequently, it will not affect water use of people in nearby communities (No impact). (2) Operation phase During the operation phase, there will be cooling water and water use in the process (wastewater from water treatment system, laboratory wastewater, and sanitary wastewater) with a total water use of 59,991 m3/day. Water will be supplied by Eastern Water Resources Development and Management PLC. (East Water). The power plant will not use water from Pluak Daeng Industrial Park. East Water has a confirmation letter that it is capable of supplying adequate water for the project, as shown in Appendix 3J. Therefore, it will not affect water use of other business premises in Pluak Daeng Industrial

Environmental Report for submissionl to ADB Chapter 5 Pluak Daeng Power Plant Anticipated Environmental Impacts and Mitigations
RNP/ENV/P5028/FR (ADB)/RE62049-sec 5.3 Page 5-213
Park. Furthermore, the source of water for the project is different from the one for
communities, it will not affect people living in nearby communities (No impact). Mitigation Measures (1) Construction Period
Contractors shall provide sufficient water for construction activities. Contractors shall provide sufficient and safe drinking water for
construction workers. Contractors shall coordinate with Pluak Daeng Industrial Park for water
allocation regarding hydrostatic test for natural gas transmission pipeline and fuel pipeline within the project.
Storm water from storm water holding pond will be used as the spray water for dust suppression purpose. (2) Operation Period
Efficient water use shall be considered, such as reduction in water drainage from the cooling system or recirculation of water within the project, etc.
Water pipes shall be checked. Leaking pipes shall be fixed immediately to prevent water loss.
In the event of water shortage and Eastern Water Resources Development and Management PLC. is unable to convey water to the project, the project shall reduce power generation capacity or stop the operation.
Many streams of water are reused in the process as much as possible. Storm water collected in the storm water holding pond can be used as raw water supply for the project, if its quality allows.

Environmental Report for submissionl to ADB Chapter 5 Pluak Daeng Power Plant Anticipated Environmental Impacts and Mitigations
RNP/ENV/P5028/FR (ADB)/RE62049-sec 5.3 Page 5-214
5.3.3 Water Drainage and Flood Control 5.3.3.1 Methodology (1) Study Method The rational formula (Thongchai, 1991) is adopted to calculate flood in the sub-retention area and the run-off. As the water retention area of the project is less than 25 sq.km as shown in Table 5.3.3-1, the equation is given as follows:
Q = 0.278 10-6 CIA …………….. (1) Where Q = Maximum flow rate (m3/sec) C = Run-off coefficient I = Rainfall intensity (mm/sec) A = Stormwater retention area (sq.m) The detail of each variable is given below.
Run-off coefficient (C) The calculation of run-off coefficient (C) is adhered to the Environmental Engineering Association of Thailand (2003) , which collected and determined the run-off coefficient based on the surface of the drainage area and land use pattern (Table 5.3.3-2 and Table 5.3.3-3).
Area before the project development A total area before the project development is 787,682 sq.m. At present, it is an open space with land leveling and no building. This area is less developed or not developed. The run-off coefficient is 0.30 (Undeveloped area).
Area after the project development After the project development, there will be uncontaminated and contaminated run-off areas. (a) Uncontaminated run-off area
Area of buildings, power block, road and green area encompass 668 , 6 49 sq. m. After the project development, The main part of this area will become concrete lining, asphalt or roofing while part of it will be improved to serve as a green area. It is categorized as the light industry area. The average run-off coefficient is 0. 7 0 (industrial area).
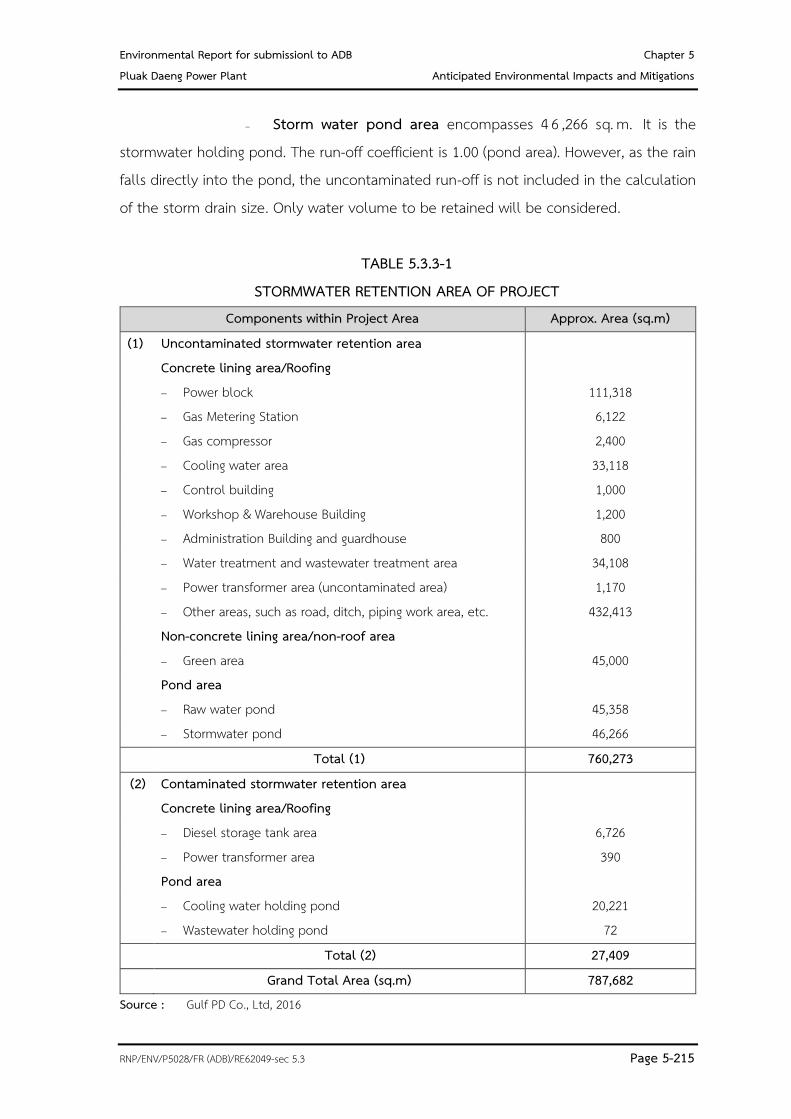
Environmental Report for submissionl to ADB Chapter 5 Pluak Daeng Power Plant Anticipated Environmental Impacts and Mitigations
RNP/ENV/P5028/FR (ADB)/RE62049-sec 5.3 Page 5-215
Storm water pond area encompasses 4 6 ,266 sq. m. It is the stormwater holding pond. The run-off coefficient is 1.00 (pond area). However, as the rain falls directly into the pond, the uncontaminated run-off is not included in the calculation of the storm drain size. Only water volume to be retained will be considered.
TABLE 5.3.3-1 STORMWATER RETENTION AREA OF PROJECT
Components within Project Area Approx. Area (sq.m) (1) Uncontaminated stormwater retention area Concrete lining area/Roofing Power block 111,318
Gas Metering Station 6,122 Gas compressor 2,400 Cooling water area 33,118 Control building 1,000 Workshop & Warehouse Building 1,200 Administration Building and guardhouse 800
Water treatment and wastewater treatment area 34,108 Power transformer area (uncontaminated area)
Other areas, such as road, ditch, piping work area, etc. 1,170
432,413 Non-concrete lining area/non-roof area
Green area 45,000 Pond area Raw water pond 45,358 Stormwater pond 46,266
Total (1) 760,273 (2) Contaminated stormwater retention area Concrete lining area/Roofing Diesel storage tank area 6,726 Power transformer area 390 Pond area Cooling water holding pond 20,221 Wastewater holding pond 72 Total (2) 27,409
Grand Total Area (sq.m) 787,682 Source : Gulf PD Co., Ltd, 2016

Environmental Report for submissionl to ADB Chapter 5 Pluak Daeng Power Plant Anticipated Environmental Impacts and Mitigations
RNP/ENV/P5028/FR (ADB)/RE62049-sec 5.3 Page 5-216
TABLE 5.3.3-2 RUN-OFF COEFFICIENT BASED ON SURFACE OF DRAINAGE AREA
Surface Run-off Coefficient Paving Material Asphalt or concrete 0.70-0.95 Brick or worm concrete paving block 0.70-0.85 Roof 0.75-0.95 Field (Sandy soil) 2% plain-slope 0.05-0.10 2-7% slope 0.10-0.15 7% slope or more 0.15-0.20 Field (compacted soil) 2% plain-slope 0.13-0.17 2-7% slope 0.18-0.22 7% slope or more 0.25-0.35
Source : Environmental Engineering Association of Thailand, 2003
TABLE 5.3.3-3 RUN-OFF COEFFICIENT BASED ON LAND USE PATTERN
Land Use Pattern Run-off Coefficient Business zone High-density 0.70-0.95 Around business 0.50-0.70 Residential zone Nuclear family 0.30-0.50 Extended family (separate) 0.40-0.60 Extended family (adjacent) 0.60-0.75 Residential zone (suburban) 0.25-0.40 Apartment zone 0.50-0.70 Industrial zone Light 0.50-0.80 Heavy 0.60-0.90 Public park 0.10-0.25 Playground 0.20-0.35 Railway station and railway junction 0.20-0.35 Waste land 0.10-0.30
Source : Environmental Engineering Association of Thailand, 2003

Environmental Report for submissionl to ADB Chapter 5 Pluak Daeng Power Plant Anticipated Environmental Impacts and Mitigations
RNP/ENV/P5028/FR (ADB)/RE62049-sec 5.3 Page 5-217
Raw water pond encompasses 4 5 ,358 sq. m. The pond stores water for the production process of the project and holds rainwater falling in the pond area. The run-off coefficient is 1.00 (pond area). However, as the rain falls directly into the pond, the uncontaminated run-off is not included in the calculation of the storm drain size, or water volume to be retained. (b) Contaminated run-off area
Dike to prevent the leak from the diesel storage tank area covers 6,726 sq.m. The dike is similar to a dam or a reservoir that is likely to be oil-contaminated. The run-off coefficient is 1.00 (pond area). However, the potential oil-contaminated run-off shall be carried to the oil separator. Therefore, the contaminated run-off is not included in the calculation of the storm drain size or water volume to be retained in the storm water pond.
Transformer area covers 390 sq. m and is likely to be oil-contaminated. The run-off coefficient is 0.9 (concrete lined floor). However, the potential oil-contaminated run-off shall be carried to the oil separator. Therefore, the contaminated run-off is not included in the calculation of the storm drain size or water volume to be retained in the storm water pond.
Wastewater holding pond and cooling water holding pond areas cover 20 ,293 sq.m. These ponds hold the effluents before they are released into the outside. The run-off coefficient is 1.00 (pond area). However, as the rain falls directly into the pond, the contaminated run-off is not included in the calculation of the storm drain size, or water volume to be retained.
Return period Based on the criteria for designing the drainage channel of the Royal Irrigation Department, a 10- year return period of equal rainfall or greater will be used for the calculation of hydrological conditions of the area before and after the project development and the design of the stormwater collection and drainage systems of the project as the project is located in the industrial park and land leveling is undertaken.

Environmental Report for submissionl to ADB Chapter 5 Pluak Daeng Power Plant Anticipated Environmental Impacts and Mitigations
RNP/ENV/P5028/FR (ADB)/RE62049-sec 5.3 Page 5-218
Time of Concentration (Tc) Time of Concentration (Tc) for the design of storm water pond and the storm drain system of the area after the project development according to the approach of the Pollution Control Department and Environmental Engineering Association of Thailand (2003) is determined below. They are upon existing land use. Not more than 30 mins is recommended for densely developed area, while not more than 15 mins is recommended for less developed area.
- Area before project development: The entire wasteland with land leveling and no building is less developed. The area is plain with minimum slope. Time of Concentration (Tc) is 20-30 minutes. As a result, time of Concentration (Tc) to the outfall during the pre-development phase is 30 minutes or 0.50 hour.
- Area after project development: Mainly, the area will be developed to the concrete lined or roof area, such as building, access road, etc. Hence, the run-off cannot percolate to soil. It is considered the highly developed area, which is flat with minimum slope. Time of Concentration ( Tc) is 1 0 - 1 5 minutes. As a result, time of Concentration (Tc) during the development phase is 15 minutes or 0.25 hour.
Rainfall Intensity (I) According to the survey, the nearest rainfall station to the project location is Rainfall Station Z. 4 in Pluak Daeng district, Rayong province. As Pluak Daeng Rainfall Station measured and collected the rainfall data up to 1988 (1967-1988), the project applied Gumbel distribution to analyze the rainfall data from Rayong Rainfall Station from 1990-2011 (Meteorological Department, 2014). The analyzed rainfall data will be the representative of Pluak Daeng Rainfall Station (Figure 5.3.3-1). Taking into account the return period and time of concentration (TC) to the outfall ( storm drain) , rainfall intensity ( I) will be as follows:
- Area before project development: With the 10- year return period and and time of concentration (Tc) of 0.50 hour, rainfall intensity (I) will be 82.85 mm/hr.
- Area after project development: With the 10-year return period and and time of concentration (Tc) to the storm drain is 0.25 hour, rainfall intensity (I) will be 116.22 mm/hr.

Environmental Report for submissionl to ADB Chapter 5 Pluak Daeng Power Plant Anticipated Environmental Impacts and Mitigations
RNP/ENV/P5028/FR (ADB)/RE62049-sec 5.3 Page 5-219
However, to make the evaluation and the design of the storm drain of the project comprehensive, rainfall intensity (I) of 116.22 mm/hr. will be applied both in the pre-development and development phases.
Source : Data from Meteorological Department, Rayong Rainfall Station 1990-2008
Analyzed by Team Consulting Engineering and Management Co., Ltd., 2014
FIGURE 5.3.3-1 : RAINFALL DURATION FREQUENCY CURVE OF PLUAK DAENG RAINFALL STATION
5.3.3.2 Study Results (1) Construction phase A total area before the project development is 787, 6 8 2 sq. m. It is an industrial area with land leveling and no building. This area is less developed. The run-off coefficient is 0.30. Mostly, rainfall in this area is permeable to the soil. The maximum flow rate is 7 . 6 3 m3/ sec. During the construction phase, the existing condition of the area is concrete lining or roof area. So, soil permeability will be more difficult. Run-off coefficient will be higher than the existing condition and the run- off increases according to the construction schedule of the project. When the construction is completed, it will increase from 7.63 m3/sec to 15.12 m3/sec.

Environmental Report for submissionl to ADB Chapter 5 Pluak Daeng Power Plant Anticipated Environmental Impacts and Mitigations
RNP/ENV/P5028/FR (ADB)/RE62049-sec 5.3 Page 5-220
Temporary storm drains are designed along the edge of the road or buildings during the construction phase. The storm drain system separates contaminated run-off and uncontaminated run-off. The uncontaminated run-off will be collected and conveyed to the 99,797 m3 storm water pond of the project which can hold water for 3 hours. The duration of time allows sedimentation before releasing clear water into the storm drain of Pluak Daeng Industrial Park, as depicted in Figure 3.11-1. The stormwater pond will be constructed at the beginning of the project construction. The storm drain system will be improved to be the permanent re-inforced one during the operation phase. Furthermore, the storm drain and the storm water pond of Pluak Daeng Industrial Park are designed to accommodate the maximum flow rate of 51 m3/sec, which is highly sufficient for the potential run-off due to the project development. Therefore, the project development will not affect nearby areas (No impact). Stormwater will be collected via temporary drainage system and sent to sediment pond where solids will be separated while clear water will be used to spray the project area to alleviate dust diffusion or discharge to Pluak Daeng Industrial Park’ s drainage system. For erosion and sediment control, the project will design and construct the sediment pond within the construction area, sediment pond will be calculated based on the quantity of storm water (Q=CIA) to reduce the velocity at 0.3 m/s to prevent the erosion problem and collected the sediment within the pond. Detailed layout and size of this storm drain and sedimentation pond can be developed during the beginning of project execution phase. In addition, the project area was leveling for construction by Pluak Daeng Industrial Park to be about 70 m MSL which is above the maximum water level at weir at Ban Wang Tan Mon, and a community located near Dok Krai Reservoir (From the report on the study and evaluation of impact of flood on water resources for Pluak Daeng power plant (2014), at the 100-year return interval, the maximum water level at Klong Kram and Wangkayang weir is about 54 and 58 m MSL respectively) . Therefore, risk of flooding can be considered as very low.

Environmental Report for submissionl to ADB Chapter 5 Pluak Daeng Power Plant Anticipated Environmental Impacts and Mitigations
RNP/ENV/P5028/FR (ADB)/RE62049-sec 5.3 Page 5-221
(2) Operation phase (a) Uncontaminated run-off Run-off volume before project development Before being developed, the area of leveled land which covers 787,682 sq.m has no building. It is less developed. The run-off coefficient is 0.30. Rainfall intensity (I) is 116.22 mm/hr. The formula to calculate the run-off is given below.
Maximum flow rate = 0.278 10-60.30 116.22 787,682 = 7.63 m3/sec = 27,485 m3/hr Run-off volume after project development
Area of buildings, power block, road and green area encompass 668 , 6 49 sq. m. After the project development, the main part of this area will become concrete lining, asphalt or roofting while part of it will be improved to serve as a green area. The average run-off coefficient is 0.70. Rainfall intensity ( I) is 116.22 mm/hr. The formula to calculate the run-off is given below.
Maximum flow rate = 0.278 10-60.70 116.22 668,649 = 15.12 m3/sec = 54,441 m3/hr
Storm water pond area encompasses 4 6 ,266 sq. m. It is the stormwater holding pond. The run-off coefficient is 1.00. Rainfall intensity ( I) is 116 .22 mm/hr
Maximum flow rate = 0.278 10-61.00 116.22 46,266 = 1.49 m3/sec = 5,381 m3/hr However, as the rain falls directly into the pond, the uncontaminated run-off is not included in the calculation of the storm drain size. Only water volume to be retained will be considered.
Raw water pond encompasses 4 5 ,358 sq. m. The pond stores water for the production process of the project and holds rainwater falling in the pond area. The run-off coefficient is 1.00. Rainfall intensity (I) is 116.22 mm/hr. The formula to calculate the run-off is given below.

Environmental Report for submissionl to ADB Chapter 5 Pluak Daeng Power Plant Anticipated Environmental Impacts and Mitigations
RNP/ENV/P5028/FR (ADB)/RE62049-sec 5.3 Page 5-222
Maximum flow rate = 0.278 10-61.00 116.22 45,358 = 1.47 m3/sec = 5,276 m3/hr However, as the rain falls directly into the pond and water is used for the production process, it is not included in the calculation of the storm drain size, or water volume to be retained. So, the maximum flow rate for the design of the storm drain system will be 15.12 m3/sec, or 54,441 m3/hr (excluding the run-off of storm water pond and raw water pond). Change in run-off volume before and after project development Taking into account the change in uncontaminated run-off before and after the project development, the run-off will increase from 7.63 to 16.59 m3/sec after the project development, or 8.95 m3/sec (32,231 m3/hr). Therefore, water retention is required to reduce hydrological impacts on the outside area. Stormwater shall be retained for at least 3 hours. The formula to calculate the pond size is given below. v = Qt …………….. (2) Where v = Volume needed for storm water pond, m3/hr Q = Run-off volume to be retained, m3/hr (32,231 m3/hr) t = Time needed for water retention, hr (3 hr) Thus,
v = 32,231 m3/hr. 3 hrs = 96,694 m3 The two storm water ponds with the total capacity of 99,797 m3 of the project can retain the entire incremental run-off, with no overflow outside. In addition, the drainage system of Pluak Daeng Industrial Park is capable of holding the maximum rainfall of 51 m3/sec. (Appendix 3Y). Therefore, it is capable of holding the entire run-off in the project area and will not affect nearby areas (No impact).
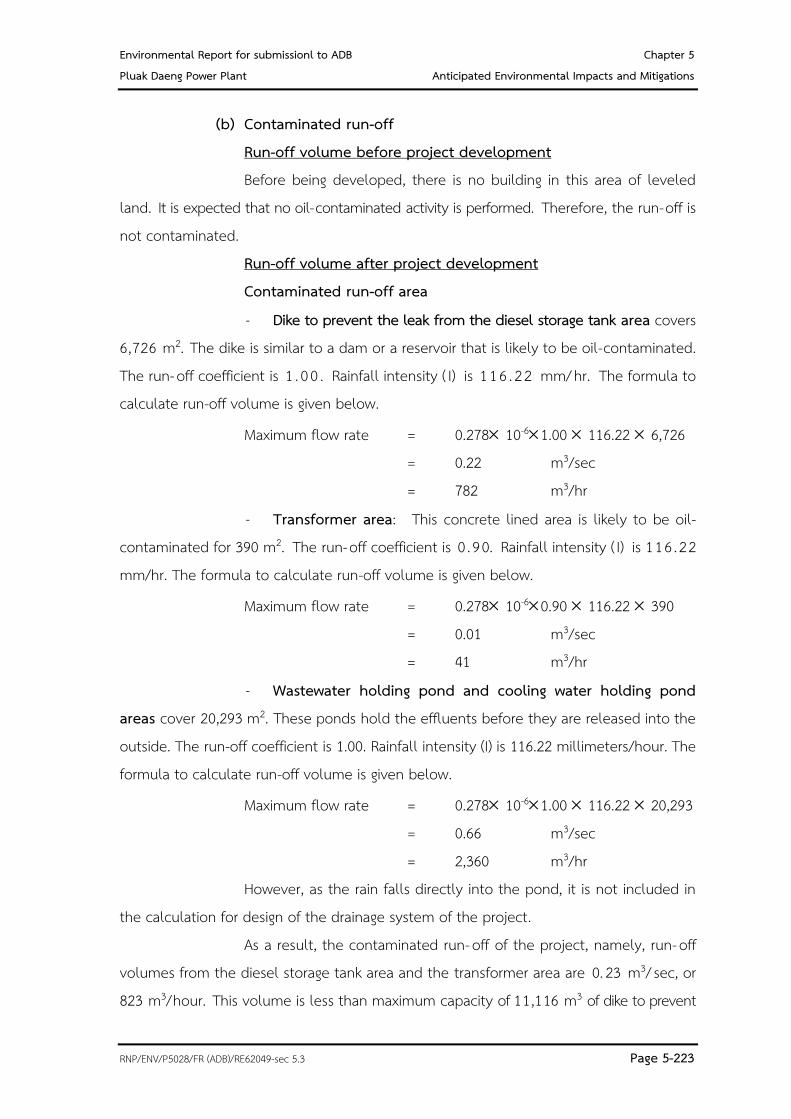
Environmental Report for submissionl to ADB Chapter 5 Pluak Daeng Power Plant Anticipated Environmental Impacts and Mitigations
RNP/ENV/P5028/FR (ADB)/RE62049-sec 5.3 Page 5-223
(b) Contaminated run-off Run-off volume before project development Before being developed, there is no building in this area of leveled land. It is expected that no oil-contaminated activity is performed. Therefore, the run-off is not contaminated. Run-off volume after project development Contaminated run-off area
- Dike to prevent the leak from the diesel storage tank area covers 6,726 m2. The dike is similar to a dam or a reservoir that is likely to be oil-contaminated. The run-off coefficient is 1 . 00 . Rainfall intensity ( I) is 116 . 22 mm/hr. The formula to calculate run-off volume is given below.
Maximum flow rate = 0.278 10-61.00 116.22 6,726 = 0.22 m3/sec = 782 m3/hr
- Transformer area: This concrete lined area is likely to be oil-contaminated for 390 m2. The run-off coefficient is 0 .90. Rainfall intensity ( I) is 116 .22 mm/hr. The formula to calculate run-off volume is given below.
Maximum flow rate = 0.278 10-60.90 116.22 390 = 0.01 m3/sec = 41 m3/hr
- Wastewater holding pond and cooling water holding pond areas cover 20,293 m2. These ponds hold the effluents before they are released into the outside. The run-off coefficient is 1.00. Rainfall intensity (I) is 116.22 millimeters/hour. The formula to calculate run-off volume is given below.
Maximum flow rate = 0.278 10-61.00 116.22 20,293 = 0.66 m3/sec = 2,360 m3/hr However, as the rain falls directly into the pond, it is not included in the calculation for design of the drainage system of the project. As a result, the contaminated run-off of the project, namely, run-off volumes from the diesel storage tank area and the transformer area are 0. 23 m3/ sec, or 823 m3/hour. This volume is less than maximum capacity of 11,116 m3 of dike to prevent

Environmental Report for submissionl to ADB Chapter 5 Pluak Daeng Power Plant Anticipated Environmental Impacts and Mitigations
RNP/ENV/P5028/FR (ADB)/RE62049-sec 5.3 Page 5-224
the leak. This capacity can hold water for more than 24 hours (Calculation details are shown in Appendix 3P) . The contaminated stormwater will be conveyed to an oil separator. As a result, it will not affect nearby areas (No impact). From the calculation above showed that stormwater management of the Pluak Deang Power Plant Project complies with EHS guidelines. Mitigation Measures (1) Construction Phase
Debris and waste generated from construction activities shall be collected and sorted before sending to the authorized agency for proper disposal so as to prevent bebris and construction waste from clogging the drainage ditch of the project.
The storm drainage system of the project shall be designed to prevent blockage of existing waterway and flooding in adjacent areas.
Construction waste and construction debris shall not be dumped into the drainage ditch.
Regular maintenance shall be performed for the drainage ditch to prevent clogging. (2) Operation Phase
Storm drains shall be provided in the project area and connected with the stormwater drainage system of Pluak Daeng Industrial Park.
The storm water ponds of at least 99,797 cu.m. shall be provided. The storm water ponds shall hold stormwater for 3 hours for appropriate drainage rates and flood prevention in the project area.
Contaminated stormwater shall be discharged to the oil separator to separate oil before releasing to the wastewater holding pond for quality check based on effluent standards established by Pluak Daeng Industrial Park. The effluent will then be drained into the central wastewater treatment system of Pluak Daeng Industrial Park.
The storm drains shall be checked continuously and regularly to prevent clog.
Drainage ditches shall be cleaned in the dry season each year to increase the efficiency of drainage in the project area.
The responsible agencies for Huai Phu Sai shall be supported for dredging activity.

Environmental Report for submissionl to ADB Chapter 5 Pluak Daeng Power Plant Anticipated Environmental Impacts and Mitigations
RNP/ENV/P5028/FR (ADB)/RE62049-sec 5.3 Page 5-225
5.3.4 Solid Waste Management (1) Construction phase During the construction phase, there will be about 3 , 2 00 construction workers. About 2,720 kg/day (calculated from solid waste of 0.85 kg/person/day, Kriangsak Udomsinrot, 1994) of general waste will include plastic, waste paper, glass bottle, plastic bottle, etc. Contractors shall provide 200-liter covered waste bins. At least, the number of 46 covered waste bins is required (0.3 kg of waste density/l) to hold the solid waste within the project area and around the field office. It shall be specified in the contract that the contractor deals with solid waste management. The garbage will be collected by Map Yang Phon Sub-district Administration Organization (SAO). At present, Map Yang Phon SAO disposes of garbage at waste disposal center of Rayong Province which could provide waste disposal service to 68 local administration organization in Rayong Province. Solid waste/ construction waste will include material scrap from soil excavation, such as dirt and sand, broken brick, etc. ; construction waste, such as structural scrap or material scrap, etc. and hazardous waste, such as battery, used lubricant oil, hydraulic oil, filter, mineral oil, detergent or used solvent, coatings, poor quality paint, ect. The project will provide special areas for the storage of each type of solid waste. Also, suitable containers will be used to collect the solid waste. The recycled waste will be kept or sold to buyers. Hazardous waste will be collected and disposed of by the agency authorized by Department of Industrial Works. (2) Operation phase There will be 2 types of waste generated from the project operation: waste not required permission for removal from the factory and waste required permission for removal from the factory according to Notification of Ministry of Industry on industrial waste disposal, B.E.2548. (a) industrial waste not required permission for removal from the factory according to Notification of Ministry of Industry on industrial waste disposal, B.E.2548 General waste according to the Public Health Act, B. E. 2 5 35 includes waste paper, material scrap, and food scraps. There will be 60 project staff. It is predicted that 5 1 kg of solid waste/ day will be generated ( calculated from 0 . 8 5 kg of solid waste/person/day, Kriangsak Udomsinrot, 1994). General waste will be collected by Map
Environmental Report for submissionl to ADB Chapter 5 Pluak Daeng Power Plant Anticipated Environmental Impacts and Mitigations
RNP/ENV/P5028/FR (ADB)/RE62049-sec 5.3 Page 5-226
Yang Phon Sub-district Administration Organization (SAO). At present, Map Yang Phon SAO disposes of garbage at waste disposal center of Rayong Province which could provide waste disposal service to 68 local administration organization in Rayong Province. (b) industrial waste required permission for removal from the factory according to Notification of Ministry of Industry on industrial waste disposal, B.E.2548
Used lubricant oil and oil from an oil separator: About 800 liters/month of deteriorated oil will be stored in a 200-liter covered steel tank. The tanks will be placed in the hazardous waste storage area of the project. After that, they will be sent for disposal to the company authorized by Department of Industrial Works.
Used resin: About 1 m3/year of resin will be replaced. Used resins will be returned to the distributors or stored in a 200- liter tank, collected and placed in plastic bags and sent for disposal to the company authorized by Department of Industrial Works.
Used air filter: This device prevents dust from sticking in a gas turbine. This is because dust will reduce the effectiveness of the gas turbine. Air filters will be replaced every 1.5 years. Air filters of approx. 47,040 kg/1.5 years will be used. Used air filters will be compiled and stored in the gas turbine building and sent for disposal to the company authorized by Department of Industrial Works. During the operation phase, solid waste management will comply with the Notification of Ministry of Industry on industrial waste disposal, B. E. 2 5 48 or other government agencies. Solid waste will be collected, stored and transported for disposal by the company authorized by Department of Industrial Works. Therefore, it is predicted that the impact caused by the project’ s solid waste management will be at a low level (Negative impact level = 1). Mitigation Measures (1) Construction Phase
Responsible workers shall be assigned to collect solid waste in the designated area at least once a day.
Hazardous waste shall be proper disposed according to the Notification of Ministry of Industry on disposal of waste or unusable materials, B.E. 2548.

Environmental Report for submissionl to ADB Chapter 5 Pluak Daeng Power Plant Anticipated Environmental Impacts and Mitigations
RNP/ENV/P5028/FR (ADB)/RE62049-sec 5.3 Page 5-227
Adequate covered waste bins shall be provided in the areas at the construction site. Coordination shall be made with the agency authorized by local government agencies for waste collection and disposal. Waste disposal shall be made at the disposal sites.
Scraps of materials, dirt and construction waste shall be compiled, packed and disposed in an appropriate way.
Oil management, such as oil change, construction materials, etc. shall be controlled. The oil shall be contained in a drum and carried for proper disposal or treatment according to the Notification of Ministry of Industry on disposal of waste or unusable materials, B.E. 2548.
Construction workers shall be supervised to throw solid waste in a waste bin. Waste shall be disposed regularly.
Stackpiles shall be place in the designated area. Waste shall not be incinerated at the construction site. The collected recyclable waste of the project, such as scraps of wood,
scrap iron, rubble, paint tin, paint brush, spray can, etc. should be sorted for reuse or sale to waste purchasing companies.
Wastes should be segregated and labelled for their types. Contractors shall coordinate with the Sub- district Administrative
Organization or the agency authorized by local government agencies for collection so that the solid waste is not left in the project area, which will be the carrier of diseases and the source of unpleasant smell.
Sanitary toilets shall be adequately provided for construction workers as required by Thai Law. Additionally, a septic tank or a prefabricated wastewater treatment plant shall be constructed to treat wastewater from water used by construction workers so that treated effluents meet the effluent standard. The sewage in the prefabricated wastewater treatment plant shall be pump out for further disposal. The prefabricated wastewater treatment plant will be always maintained to ensure its efficiency throughout the construction phase.

Environmental Report for submissionl to ADB Chapter 5 Pluak Daeng Power Plant Anticipated Environmental Impacts and Mitigations
RNP/ENV/P5028/FR (ADB)/RE62049-sec 5.3 Page 5-228
(2) Operation Period Adequate covered waste bins shall be provided for solid waste
collection. Collected waste shall be carried for disposal by the agency authorized by local government agencies. Waste disposal shall be made by means required by law.
A storage place for solid waste shall be provided. The storage place shall be roofed and floored with concrete. Waste shall be sorted and labelled.
Wastes should be segregated and labelled for their types. The collected recyclable solid waste should be sorted and utilized as
much as possible or sold to waste purchasing companies. The remaining waste shall be collected for disposal by the agency authorized by government agencies.
Hazardous waste that has characteristics and properties defined in the Notification of Ministry of Industry on disposal of waste or unusable materials, B. E. 2548, such as lubricant oil and cleaning solutions for devices, etc. shall be separated from general waste to be disposed or treated by methods as prescribed in related regulations.
Drums/tanks shall be provided to collect solid waste, such as resin, oil, etc. from power generation process before disposal or treatment according to the Notification of Ministry of Industry on disposal of waste or unusable materials, B.E.2548
Types and volume of solid waste and transportation out of the project area shall be recorded. Purchasing companies or disposal sites shall be identified.
5.4 QUALITY OF LIFE 5.4.1 Socio-Economics The social impact assessment ( SIA) was applied for assessment of socio-economics impacts of the project. Focus is made on human use values (quality of life) and concerns of people. Considerations were made from secondary data compiled from government agencies and other reference documents, interview of target community leaders and household members. Furthermore, review of community way of life was made. Additionally, potential impacts on society, the way of life of people, occupation and daily life were evaluated. Environmental impact prevention and mitigation measures and monitoring measures, which are consistent with the community context were proposed.

Environmental Report for submissionl to ADB Chapter 5 Pluak Daeng Power Plant Anticipated Environmental Impacts and Mitigations
RNP/ENV/P5028/FR (ADB)/RE62049-sec 5.3 Page 5-229
All phases of project development will cause both positive and negative impacts on communities. According to the compilation of the studies, the overall social impacts during the pre- construction, construction and operation phases are summarized below (Table 5.4.1-1).
TABLE 5.4.1-1
SUMMARY OF OVERALL IMPACTS DURING PROJECT DEVELOPMENT
Social Impacts Impacts from Project Development
Construction Phase Operation Phase Positive Negative Positive Negative
Environment Impacts - Air/noise pollution - Water/aquatic ecology - Water use - Solid waste management - Transportation/traffic
Social Impacts (way of life/quality of life) - Social and cultural conflicts
Increase/ reduction in population, migration, or change in population structure
Social relation, social problems- crimes or others; community development, such as community expansion, social service or degree of urbanization
Culture, livelihood or change in way of life, belief, or others
- Community economy (employment/local income) - Health and safety - Benefits for communities (power development fund) - Promotion of knowledge to communities (power plant
visit)
Public Participation (role/channel) - People policy (community relations)
Quality of life development plan for change and/or development of people’s quality of life
Mental impact - Concern/stress

Environmental Report for submissionl to ADB Chapter 5 Pluak Daeng Power Plant Anticipated Environmental Impacts and Mitigations
RNP/ENV/P5028/FR (ADB)/RE62049-sec 5.3 Page 5-230
(1) Pre-construction phase (a) Positive impacts (community relations activities) The community relations plan is established for implementation during the preparation of EIA report. Community relations activities aim at making familiar to communities and good relationship with local people as the importance of public participation in the long run is realized. Community relations activities will be performed regularly, such as support for community activities in the district/ sub-district/ village, etc. (Details are in Chapter 9 Mitigation Action Plan). In addition, to this, the development plan for the quality of life of people living in communities near the power plant is established, such as support for education, promotion for religious understanding, culture and tradition, sport, public health and the environment, etc. This policy is in accordance with the community relations plan of the project from the pre- construction phase (Details are in Chapter 9 Mitigation Action Plan) , which shows social responsibilities through continuous promotion/ support for community activities. (b) Negative impacts
Mental impact - Concern
During the enquiry/ interview, the project staff explained the interviewees the project information. It was found that the project information were recognized by community leaders. Almost all of the community leaders have known about the project before. Meanwhile the household members who live within the radius of 0-3 km from the project boundary have acknowledged the project information more than those living within the radius of 3-5 km from the project boundary. Compared with the household members, acknowledgement of the project information by community leaders are apparently better. However, the interview results reveal that most of the community leaders and household members expressed no concern about the project development, especially, those living within 3-5 km from the project boundary. Most reasons given by the interviewees are as follows: The project area is remote from residential area. The project is not developed yet. These people are confident in the implementation of environmental impact prevention and mitigation measures of the project. Concerns about the project development include air

Environmental Report for submissionl to ADB Chapter 5 Pluak Daeng Power Plant Anticipated Environmental Impacts and Mitigations
RNP/ENV/P5028/FR (ADB)/RE62049-sec 5.3 Page 5-231
pollution, effluent from the project, sufficiency of water use in communities, etc. It could be said distance from the project location and the reliability in environmental impact prevention and mitigation measures of the project are the variables that make the interviewees, who know about the project information for the first time, express no concern about the project developmen. Therefore, if community people understand potential impacts from the project development, prevention and mitigation measures and are reliable in the measures, their concerns will be reduced. However, modern technologies and communication enable fast acknowledgement, especially negative impacts of the power plants in various areas in the past. To disseminate the project information to local people, public relations campaign is be made to promote the understanding of the power plant operation, power plant impacts and prevention and mitigation measures. These activities are performed in the district/sub-district/village level at the same time of EIA report preparation (Details are in Chapter 9). In addition, public relations campaign is performed to promote the understanding of people regularly and continuously from the pre- construction, construction and operation phases (Details are in Chapter 9, Mitigation Action Plan) . People will be more reliable on the project operation. Therefore, the impacts will be at a low level (Negative impact level = 1). (2) Construction phase (a) Positive impacts (a.1) Social impacts
Community economy - Increase in local employment
Even though the highest number of construction workers during the construction phase is approximately 3,200 persons, the employment of local people will be at a low level. This is because the employment during the construction phase will depond on contractors, who practically will employ construction workers from their suppliers (Positive impact level = 1). Nontheless, the environmental impact prevention and mitigation measures determine that local people will have the priority for employment to mitigate impacts from migrant labours and increase benefits for communities.

Environmental Report for submissionl to ADB Chapter 5 Pluak Daeng Power Plant Anticipated Environmental Impacts and Mitigations
RNP/ENV/P5028/FR (ADB)/RE62049-sec 5.3 Page 5-232
- Promotion of local economy During the construction phase, there will be more cash flow from approximately 3 , 2 00 the staff and workers. Daily expenses of these people will increase community income, especially food stalls and sellers in the area. Taking into account the minimum wage rate of Rayong province, which is 300 baht/ day/ person (Notification of Wage Committee on minimum wage rate (No.7), October 17, 2011) and 25 working days/month of labours, there will be 24 , 000 , 000 baht/month of cash flow, or 288,000,000 baht/year. During the construction phase (48 months), approx. cash flow will be 152,000,000 baht. This is the positive impact on local economy (calculated from 88.2% of income for consumption expenditures, Source: National Statistical Office, Summary Results of Survey on Socio- Economics of Households in the First 6 Months of Year, 2013, http://service.nso.go.th/nso/nsopublish/themes/files/socioSum56-6.pdf. Retrival: March 9, 2015.) (Positive impact level = 1).
Employment opportunity According to the survey on socio- economics, some household members work for wages. Therefore, it is an opportunity for them to be hired by the project for the positions that do not need high skills since qualified local people will be the first priority for employment (Positive impact level = 1).
Benefits of power development fund for communities During the construction phase ( from the starting day of power plant construction according to the construction contract to the commercial operation date (COD). Money shall be transferred by the project to the power development fund in the rate of 50,000 baht/megawatt/year based on the installed capacity of the power plant. As the installed capacity of the power plant is 2,920 megawatt s, approximately 146,000,000 baht/ year shall be transferred to the power development fund ( according to Notification of the Energy Regulatory Commission on money transfer to power development fund for Electricity Operation Operator, Electricity Generation License, B. E. 2553) throughout the construction phase for 48 months. The power development fund will be allocated for community development (Positive impact level = 2).

Environmental Report for submissionl to ADB Chapter 5 Pluak Daeng Power Plant Anticipated Environmental Impacts and Mitigations
RNP/ENV/P5028/FR (ADB)/RE62049-sec 5.3 Page 5-233
(a.2) Community relations activities The complaint receiving channel and opportunity of people to be involved in the project development in the form of the Environmental Monitoring Committee show monitoring transparency. Furthermore, the continuously allocated budget for community development activities will contribute to better quality of life of people based on the social plan for communities nearby the project (Positive impact level = 2). Furthermore, the power plant establishes people policy under “Social Activity in a Proactive and Consistent Manner” strategy. Community activities will be supported as appropriate for good relationship and benefit to community/society. (Details are in Chapter 9 Mitigation Action Plan). (b) Negative impacts (b.1) Mental impact According to the interview, most of the interviewees viewed that they would not affected by the project during the construction phase. However, some of the interviewees thought that they would be affected from dust due to construction activities and contruction material transportation, traffic congestion due to material transportation, theft due to migrant labours, inadequacy of water supply and electricity, etc. Construction activities that may cause impacts on communities will not be undertaken all the time. In addition, comprehensive prevention and mitigation measures are established. Moreover, a complaint receiving center is established to receive complaints from community people who suffer from construction activities. Remedial action will be taken immediately. As a result, the impact will be at a low level (Negative impact level = 1). (b.2) Physical impacts
Air quality During the construction phase, the construction site will be water sprayed at least 2 times per day to reduce the diffusion of dust. The 24-hour average total suspended particulate (TSP) will increase to 9 2 . 7 7 µg/m3. Combined with the highest measurement value from field survey, the total suspended particulate will be 198. 77 µg/m3, or 60.23% of the standard value of ambient air quality. According to the standard value of ambient air quality, total suspended particulate shall not exceed 330 micrograms/cubic meters. Therefore, the measured ambient air quality at the construction

Environmental Report for submissionl to ADB Chapter 5 Pluak Daeng Power Plant Anticipated Environmental Impacts and Mitigations
RNP/ENV/P5028/FR (ADB)/RE62049-sec 5.3 Page 5-234
site still meets the standard value of ambient air quality and the impact from increased total suspended particulate will be at a low level (Negative impact level = 1).
Noise During the construction phase, incremental noise at a sensitive receptor is higher than the existing noise more than 3 dB(A) . However, environmental impact prevention and mitigation measures are established. Contractors are required to use the machinery and equipment that generate low noise. In addition, temporary noise barriers shall be installed in the west, the east, the south and the north of the project where pile driving is undertaken. Preliminarily, a metal sheet of 1. 27 millimeters thick onwards (Steel 18 ga) is chosen. Alternatively, other materials with sound transmission loss of 25 decibel (A) can be used. The height of four sidewalls in the west, the east, the south and the north will be 5 m from the ground so that noise level at the sensitive receptor will increase from the existing noise level less than 3 dB(A) . Therefore, it is expected that noise generated from construction activities will temporarily affect the livelihood of people at a low level (Negative impact level = 1).
Water use During the construction phase, there will be about 3,200 construction workers. All of them will stay outside the project area. The demand for an average water supply will be 224 m3/day (calculated from the water use rate of 70 l/person/day). Water for consumption will be adequately provided by contractors. Bottled water will be provided for drinking. Therefore, during the construction phase, water use of the project will not affect water use of local people (No impact).
Solid waste management During the construction phase, solid waste will be generated from construction workers and a temporary site office. It is forecast that 3 , 2 00 construction workers will generate solid waste of 2 , 7 2 0 kg/ day ( calculated from the solid waste generation rate of 0.85 kg/person/day) . The storage area for solid waste or each type of waste will be separated. Suitable containers will be used to collect solid waste. Waste will be recycled or sold to buyers. Hazardous waste will be collected and sent for disposal by the company authorized by Department of Industrial Works. Therefore, the impact will be at a low level (Negative impact level = 1).

Environmental Report for submissionl to ADB Chapter 5 Pluak Daeng Power Plant Anticipated Environmental Impacts and Mitigations
RNP/ENV/P5028/FR (ADB)/RE62049-sec 5.3 Page 5-235
(b.3) Social impacts Social and cultural changes may cause conflicts between migrant
labours and community people or migrant labours and local labours. Other problems include change in population structure, quarrel, theft, narcotics, and difference in livelihood. However, currently, a large number of migrant labours live in Pluak Daeng district and nearby areas, the above social and cultural changes may affect the project area at a low level. Moreover, the policy to hire local people as the first priority according to the socio-economics action plan enables low impacts (Negative impact level = 1).
During the construction phase, community people may have conflicts due to concerns and lack of understanding about the project operation and impacts. Dissemination of the project information, such as the construction schedule, the environmental measurement action plan shall be made. Public relations campaign shall be made urgently in case of conflicts between the project and communities. In addition, the complaint receiving channel shall be provided during the construction phase so that affected persons can make the project staff informed as shown in Figure 5. 4. 1- 1 and Figure 5.4.1-2. People involvement in the form of the Environmental Impact Monitoring Committee will contribute to transparency and affect community people at a low level (Negative impact level =1).
Construction activities may affect the physical environment near the project area and health of people in nearby communities. Local public facilities will have more burden to treat migrant labours. As most of the migrant labours are non-registered population, local public facilities could not request additional budget or medical personnel. Moreover, construction workers may cause unsafety in life and asset of people living around the project area. Therefore, construction worker monitoring measures are established to strictly control the behavior of construction workers. In case of a minor illness, construction workers will be treated within the project area to lessen the burden of the local public facilities. Hence, the impacts will be at a low level (Negative impact level = 1).

Environmental Report for submissionl to ADB Chapter 5 Pluak Daeng Power Plant Anticipated Environmental Impacts and Mitigations
RNP/ENV/P5028/FR (ADB)/RE62049-sec 5.3 Page 5-236
FIGURE 5.4.1-1 : LAYOUT OF COMPLAINT RECEIVING STEPS OF PLUAK DAENG POWER PLANT PROJECT

Environmental Report for submissionl to ADB Chapter 5 Pluak Daeng Power Plant Anticipated Environmental Impacts and Mitigations
RNP/ENV/P5028/FR (ADB)/RE62049-sec 5.3 Page 5-237
FIGURE 5.4.1-2 : STEPS IN COMPLAINT RECEIVING IN EMERGENCY CASE
Complainant
Forward to management to assign personnel to undertake corrective action
Inform Complainant of Progress
Monitor progress and report to local administrative organization
Corrective action in 24 hr.
Pluak Daeng Power Plant Complaint Center

Environmental Report for submissionl to ADB Chapter 5 Pluak Daeng Power Plant Anticipated Environmental Impacts and Mitigations
RNP/ENV/P5028/FR (ADB)/RE62049-sec 5.3 Page 5-238
(3) Operation phase (a) Positive impacts (a.1) Social impact
The revenue of the Local Administation Organization, i.e. Map Yang Phon Sub-District Administrative Organization will raise. The benefit will come from collection of property tax. The calculation of property tax will depend on each Sub- District Administrative Organization. Moreover, the continuous development as a result of the existence of the power plant enables the Sub-District Administrative Organization to collect other taxes, such as land tax, property tax, wheeled vehicle tax and signboard tax, etc. These contribute to the increased budget for local development (Positive impact level = 1).
Communities will receive benefits from power generation from the commercial operation date (COD) onwards. The revenue from power generation using natural gas as fuel will be allocated to the power development fund in the rate of 1 satang/power units generated for sale each month. This excludes the payment for energy used in power generation process in the power plant throughout the project life ( about 25 years) (Positive impact level = 2).
The project development will contribute to the increase in power generation of the country so that people have adequate power supply. Also, it support other manufacturing fields, especially the industry sector. This is because the electricity is the main factor for industrial expansion, which leads to employment and the increase in Gross Domestic Product (GDP) in the provincial and national levels (Positive impact level = 2).
Community people will be trained for the understanding of the project development. They will be supported by the project in several ways, such as occupational training, scholoarship for students, etc. These supports will be made throughout the project operation for the development of community people. The trained people are important for future development of communities (Positive impact level = 1). (a.2) Community relations activities Community relations activities will be organized by Gulf PD Co. , Ltd. , which is the project owner. These activities aim at enhancing the understanding of community people in the district/ sub-district/village level. Community activities, such as occupational training, support for education, promotion for religious understanding, culture

Environmental Report for submissionl to ADB Chapter 5 Pluak Daeng Power Plant Anticipated Environmental Impacts and Mitigations
RNP/ENV/P5028/FR (ADB)/RE62049-sec 5.3 Page 5-239
and tradition, sport and music, public health and the environment, etc. Community relations activities are also the channels for idea sharing and recommendations between the project and communities, enhancement of understanding and alleviation of concerns, which are beneficial for the co-existence of communities and the project. However, to make activities according to the community development plan sustainable, the activities/ programs should be based on the understanding and recognition that community development needs the ideas and implementation by community people. Communities need to be responsible for such activities/programs, such as the quality of life development program to change/ improve the quality of life of people in terms of basic social services, public facilities, natural resources and the environment, occupational development promotion and income, educational support, public health and personal hygiene, etc. (Positive impact level = 1) (Details are in Chapter 9). (b) Negative impacts (b.1) Mental impact According to the interview, most of the community leaders and household members viewed that they would not be affected during the operation phase. The proportion of community leaders who stated that the project operation may not have impacts on communities are higher than that of the household members. This may be because community leaders acknowledge more project information than the household members. The sample viewed that potential impacts include air quality due to fuel combustion, effluent quality in public water bodies, noise from the power plant operation, solid waste/waste from the project operation, insufficient water use for people due to water consumption by the project, agricultural impacts, etc. Environmental issues are the main concerns of the sample. Therefore, environmental prevention and mitigation measures and monitoring measures, which are comprehensive, are established. (Details are in Chapter 9). To reduce anxiety about impacts from the project operation, the Environmental Monitoring Committee will be appointed since the pre- construction phase. The Environmental Monitoring Committee consists of representatives from communities within 5 km radius from the project boundary, representatives from the government agencies, experts and the power plant representative. The committee will comment or

Environmental Report for submissionl to ADB Chapter 5 Pluak Daeng Power Plant Anticipated Environmental Impacts and Mitigations
RNP/ENV/P5028/FR (ADB)/RE62049-sec 5.3 Page 5-240
give recommendations for improvements or changes in the project operation so that they will be in line with the EIA report. Also, the Committee will recommend the government agencies to temporarily stop the project operation if it does not comply with the EIA report. Moreover, the project staff will be provided to receive complaints and make a good relationship with local people through regular visits and remedial actions when problems arise from the project. These methods make people less anxious. Therefore, the impacts will be at a low level (Negative impact level = 1). (b.2) Physical impacts
Air quality The AERMOD model was adopted to forecast impacts on ambient air quality in the study area and the sensitive receptor. It was found that the concentration of air pollutants, i.e. nitrogen dioxide (NO2) , sulphur dioxide (SO2) , and total suspended particulate (TSP) in 6 cases within 15 km radius from the project location were lower than the standard values. As the considered sensitive receptors also are the places where the occupants are more susceptible to the adverse effects of exposure to pollutants such as hospital and school, the concentration of all pollutants at sensitive receptors in case of 100- percent load of natural gas firing is below 25% of National ambient air quality standards value. In case of 100-percent load of diesel firing, maximum concentration of 1-hr average NO2 at receptors no. 4, 5, 8, 15 is higher than 25% of National ambient air quality standard value. However, the exeedance at each receptor will occur only for 1 hour in 26,280-hour period. This indicates that the study area has a potential for future development of Pluak Daeng Power Project. Hence, the project operation will affect the air quality at a moderate level. Air quality impacts can be reduced through the establishment of environmental prevention and mitigation measures and monitoring measures. These measures shall be strictly complied with. This will affect the air quality at a low level (Negative impact level= 1).

Environmental Report for submissionl to ADB Chapter 5 Pluak Daeng Power Plant Anticipated Environmental Impacts and Mitigations
RNP/ENV/P5028/FR (ADB)/RE62049-sec 5.3 Page 5-241
Noise Incremental noise levels generated from the machinery and equipment during the operation phase at sensitive receptors around the project area are higher than existing noise levels more than 3 dB(A) except at a receptor located in the south of the project. Therefore, measures are established to reduce incremental noise levels at nearby receptors. Examples of those measures are installing noise barrier with a height of 6.5 m and a length of 400 m, which is made from a metal sheet of 1.27 millimeters thick onwards (Steel 18 ga) or other materials with sound transmission loss of 25 dB(A) at the project’ s fence or planting tree as noise barrier fence or Planting trees as noise barrier shall be installed at north of project fence in the north of project fence with a height of 5.0 m and a length of 400 m. Thus, sensitive receptor in the north of project has noise incremental levels less than 3 dBA. Furthermore, continuous noise monitoring will be performed throughout the operation phase. Thus, noise impacts will be at a low level (Negative impact level = 1).
Water pollution/Aquatic ecology The effluent from the project can be divided into 2 types as follows: 1. Cooling water blowdown (11,600 m3/day) will be conveyed to a cooling water holding pond. The two cooling water holding ponds with the capacity of 19,000 m3 each will hold the effluent and serve as an emergency pond. After that, the effluent will be drained into the cooling water holding pond of Pluak Daeng Industrial Park, which is capable of holding the effluent for 1 day. The effluent temperature will meet the standards of Pluak Daeng Industrial Park. The online monitoring system will be installed at the cooling water holding pond to measure the temperature, pH, dissolved oxygen (DO) and electric conductivity ( EC) of the discharged effluent for compliance with such standards. 2. Wastewater from process: 48 m3/day
Wastewater from water treatment system (demineralization system) and wastewater from mixed bed regeneration (13 m3/day) which will be carried to the neutralization pond for pH neutralization before releasing into the wastewater pond of the project

Environmental Report for submissionl to ADB Chapter 5 Pluak Daeng Power Plant Anticipated Environmental Impacts and Mitigations
RNP/ENV/P5028/FR (ADB)/RE62049-sec 5.3 Page 5-242
Laboratory wastewater (5 m3/day) which will be carried to the neutralization pond for pH neutralization before releasing into the wastewater pond of the project
Wastewater from utilization and consumption (30 m3/day) which will be treated in the septic tank before being conveyed to the wastewater pond of the project Wastewater from process in Item 2 will be stored in the wastewater holding pond. The two wastewater holding ponds with the holding capacity of 75 m3 ( for 3 days in total) will be equipped with the online monitoring system to measure the temperature, pH and electrical conductivity (EC) of the discharged effluent for compliance with such standards before discharging into the central wastewater treatment system of Pluak Daeng Industrial Park. The wastewater holding pond’ s floor is designed to prevent leakage of water to the underground ( such as lining) . Inspection and maintenance will always be performed for the wastewater holding pond. In case of damage, the wastewater holding pond will be repaired shortly. The uncontaminated stormwater from storm drains will be collected and released into the drainage system of the project. It is apparent that wastewater from the power generation process will be treated by the wastewater treatment system of the project. The effluent will be controlled for compliance with the standards of Pluak Daeng Industrial Park. Also, environmental impact prevention and mitigation measures proposed in the EIA report will be strictly complied with. Thus, the impacts will be at a low level (Negative impact level = 1).
Soid waste management General waste: About 5 1 kg/ day of general waste
(calculated from 60 staff and the waste generation rate of 0.85 kg/person/day, Kriangsak Udomsinrot, 1994) will be generated from the office. General waste consisting of food scraps, plastic bag, scrap paper will be collected by Map Yang Phon Sub- district Administration Organization (SAO). At present, Map Yang Phon SAO disposes of garbage at waste disposal center of Rayong Province which could provide waste disposal service to 68 local administration organization in Rayong Province.

Environmental Report for submissionl to ADB Chapter 5 Pluak Daeng Power Plant Anticipated Environmental Impacts and Mitigations
RNP/ENV/P5028/FR (ADB)/RE62049-sec 5.3 Page 5-243
Air filter: The air filter prevents dust and scraps of material in the air from moving into the power generation system. It is a synthetic fiber designed for single use only. As the dust sticking to the fiber of the air filter is thick and moist, it is impossible to blow or wash it. When used over a period of time, it will be damaged and needs to be replaced. About 47,040 kg/1.5 years of an air filter will be used. Used filters will be sent for disposal to the company authorized by Department of Industrial Works.
Used lubricant oil and oil from an oil separator: About 800 liters/month of deteriorated oil and oil from an oil separator will be stored in a 200- liter covered steel tank. They will be sent for disposal to the company authorized by Department of Industrial Works.
Used resin: About 1 m3/year of resin will be replaced. Used resins will be returned to the distributors or collected and placed in plastic bags, stored in a 200- liter tank and sent for disposal to the company authorized by Department of Industrial Works. Considering solid waste and waste disposal method during the operation phase, impacts are expected to be at a low level (Negative impact level = 1). (b.3) Social impact (health and safety) During the operation phase, there will be 60 staff. However, the first priority for employment will be given to local people. Staff/workers monitoring measures are established to strictly control the behavior of these people. In addition, measures to reduce the risk of of communicable diseases and environmental sanitation are established. Also, the Environmental Monitoring Committee will be involved in mitigating the environmental impacts so that people are confident in the project operation and transparency. Thus, the impacts will be at a low level (Negative impact level = 1). Mitigation measures (a) Construction Period
A “Complaint Center” shall be established to disseminate the project information, hear people’ s opinion, recommendations and complaints. Affected persons can make complaints or raise problems through any channels, as appropriate, such as verbal communication, telephone, memo, letter, electronic mail, fax, etc. , as shown in Figure 9-1 and in case of emergency as in Figure 9-2. Complaints could be able to be anonymous as well.

Environmental Report for submissionl to ADB Chapter 5 Pluak Daeng Power Plant Anticipated Environmental Impacts and Mitigations
RNP/ENV/P5028/FR (ADB)/RE62049-sec 5.3 Page 5-244
Environmental impact prevention and mitigation measures shall be strictly adhered to.
Complaints and sufferings of people in communities due to construction activities shall be received and solved urgently.
Life and asset safety measures Qualified local people shall be given priority to be hired for any
vacancy. A register of migrant labour and foreign labour shall be established. A project supervisor shall be assigned to supervise construction
workers. Moreover, staff shall be provided to strictly supervise the entrance and exit to the construction site.
Construction activities and construction workers’ behavior shall be supervised to prevent impacts on local people.
The boundaries of temporary workers’ camp and construction site shall be clearly demarcated.
Working regulations shall be explicitly established. Construction workers shall be supervised strictly.
In the event that workers’ camp is close to a community, workers’ behavior shall be closely supervised to prevent disturbance and annoyance.
In case of conflicts between the power plant and communities, the project information shall be urgently disseminated to people through channels or media so that people acknowledge facts. This means the project is responsible for communities and aware of people’s concerns.
If it is proven that the power plant is the cause of any impact, the problem shall be solved urgently. The database of an affected person or affected group shall be created. The impact prevention measures shall be established.
A register of affected persons shall be established. Complaints or incidence shall be registered. Facts, remedial action and negotiations shall be compiled and registered to be used as evidence of the power plant operation.

Environmental Report for submissionl to ADB Chapter 5 Pluak Daeng Power Plant Anticipated Environmental Impacts and Mitigations
RNP/ENV/P5028/FR (ADB)/RE62049-sec 5.3 Page 5-245
(b) Operation Period General Measures
Qualified local people shall have the priority to be hired for any vacancy in order to mitigate the impact of relationship between the Project and people and communities. Local people should be always notified for any vacancy every time.
The project will request the Contractor to consider hiring local people first. During project execution, the project will monitor Contractor’s hiring process to ensure that the Contractor will hire local workers as much as possible and available. In addition, the Contractor will report the numbers of workers to the project every month.
Measures for benefit return for communities shall be established, such as maintenance of Huai Phu Sai with Pluak Daeng Industrial Park, other factories or involved agencies, support for local educational institutes or public health facilities, promotion of religious maintenance, contribution to public health benefit, etc.
Responsible persons shall be assigned for receiving complaints, hearing comments and suggestions. Affected persons can complain via channels like verbal communication, telephone, memo, letter, electronic mail, fax, etc. to the power plant as shown in Figure 9-1 and in case of emergency as in Figure 9-2. Complaints could be able to be anonymous as well.
The quality of life improvement policy shall be set up. Community businesses shall be supported and promoted for sustainable economic and social development.
Project’ s action plan shall be implemented and strictly adhered to so as to reduce accidents and impacts on the Project and communities.
If it is proven that the power plant is the cause of any impact, the problem shall be solved urgently. The database of an affected person or affected group shall be created. The impact prevention measures shall be established.
A register of affected persons shall be established. Complaints or incidence shall be registered. Facts, remedial action and negotiations shall be compiled and registered to be used as evidence of the power plant operation.

Environmental Report for submissionl to ADB Chapter 5 Pluak Daeng Power Plant Anticipated Environmental Impacts and Mitigations
RNP/ENV/P5028/FR (ADB)/RE62049-sec 5.3 Page 5-246
In case of conflicts between the power plant and communities, the project information shall be urgently disseminated to people through channels or media so that people acknowledge facts. This means the project is responsible for communities and aware of people’s concerns.
5.4.2 Health impact assessment (1) Construction Phase Construction activities may lead to health threats to the staff and people living within 5 km radius of the project boundary. Health effects resulting from health threats include dust, noise, accidents from traffic and transportation as well as operation, stress and anxiety about impacts or activities. The health effect appraisal results using risk matrix during the construction phase are as follows:
Air quality (dust) The major air pollutant during the construction phase will be total suspended particle (TSP) generated from construction activities, such as foundation work and building construction, etc. and construction material, equipment transportation and construction waste, etc. Details are given below. (a) Health effect characteristics Health effects from particulate matter include irritation to eyes and the respiratory system in case of inhalation. Parts of the respiratory system will be irritated. Coarse particulate will be traped at nose hair while fine particulate can escape into the respiratory system, resulting in irritant symptoms, nasal inflammation, cough, sniff, wet cough or dust accumulation in pulmonary alveoli, which deteriorates pulmonary function. Moreover, particulate matter can cause visual impairment, dirtiness and annoyance. The study conducted by Chulalongkorn University reveals that students living in the area having particulate matter with a diameter less than 10 microns (PM-10) more than 100 g/m3 had the higher rate of respiratory system diseases compared with those living in the area where PM-10 was lower than 50 g/m3 Furthermore, severity of illness changed depending on concentrations of particulate matter (Collage of Public Health, 1998).
Environmental Report for submissionl to ADB Chapter 5 Pluak Daeng Power Plant Anticipated Environmental Impacts and Mitigations
RNP/ENV/P5028/FR (ADB)/RE62049-sec 5.3 Page 5-247
(b) Major activities leading to health effects Major activities that are sources of particulate matter during the construction phase include construction work, transportation of construction materials and equipment and construction waste, which will be temporary and intermittent. An important health threat will be total suspended particulate ( TSP) from construction activities and transportation of construction materials and equipment. (c) Vulnerable groups to health effects Vulnerable groups that are likely to be affected from air pollutant during the construction phase will be construction workers in case they do not wear personal protection equipment (PPE) , or air quality prevention and mitigation measures are not implemented, as these people are exposed to total suspended particulate for 8 working hours (TWA) . The secondary vulnerable group will be people living within 5 km radius from the project boundary. Likelihood and severity depend on the health status of people who are exposed to total suspended particulate during a particular period of time and the duration of exposure. (d) Consideration of likelihood and severity of health effects 1. Consideration of Likelihood
Construction workers Construction workers at the construction site are likely to be affected at a high level as they have to work in the area for at least 8 hours. Therefore, the likelihood of exposure is at a high level (4 scores), i.e with support from available statistics for likelihood forecast in case of inadequate prevention measures.
People living within 5 km radius from the project boundary Taking into account TSP 24 hr from the first measurement during September 9th-16th, 2015; the second measurement during February 13rd-20th, 2016; and the third measurement during January 25th-February 1st, 2019 at 5 monitoring stations: (1) Pluak Daeng Power Plant Project area, (2) Nuen Sawan community, Village no. 2, Map Yang Phon sub-district, (3) Wat Prasittharam, (4) Ban Map Toie School and (5) community, west of the project, Village no. 2, Map Yang Phon sub-district. TSP 24 hr was measured 3 times at each station for 7 consecutive days, covering holidays and working days, the concentration of TSP 24 hr met the standard (not exceeding 330 g/m3). The forecast result of total

Environmental Report for submissionl to ADB Chapter 5 Pluak Daeng Power Plant Anticipated Environmental Impacts and Mitigations
RNP/ENV/P5028/FR (ADB)/RE62049-sec 5.3 Page 5-248
suspended particulate during the construction phase will be 198.77 g/m3 or 60.23% of the standard value. According to morbidity statistics of outpatients in Ror Ngor. 504 from Tambon Health Promoting Hospitals in the study area during 2014-2018, the majority of people in the study area suffered from diseases of the respiratory system; other symptoms, signs and abnormal clinical and laboratory findings, not elsewhere classified; and diseases of the digestive system, respectively. According to morbidity statistics of inpatients in Ror. Ngor. 505 during 2014-2018, diseases of the respiratory system were not the main causes of the illness of people in the study area. Major diseases were Endocrine, nutritional and metabolic diseases; other symptoms, signs and abnormal clinical and laboratory findings, not elsewhere classified; and Single spontaneous delivery (Details are included in Chapter 4, Collection of Public Health Baseline). Based on air quality measurement results at present in the study area, the project vicinities can increasingly accommodate total suspended particulate (TSP) with close monitoring. Since vulnerable groups have lived in the study area and some household members suffered from respiratory system diseases, therefore, the likelihood of health effects will be at a moderate level ( 3 scores) which means that there is likelihood to have impact on health, if there are no sufficient protective measures. 2. Consideration of severity of consequences
Construction workers During the construction phase, severity of consequences is at a moderate level ( 2 scores) . As land leveling was already undertaken for industrial development, the consequences from total suspended particulate will be at a low level. However, construction activities and transportation of construction materials and equipment may cause dust diffusion.
People living within 5 km radius from the project boundary As the construction site of the project which is located in Pluak Daeng Industrial Park is adjacent to the sensitive receptors, i.e. communities at Village no. 2 and Village no. 5 Map Yang Phon sub-district, the communities may be affected from dust generating activities, such as equipment transportation and construction worker travel, etc. However, land leveling is not undertaken, the severity of health effects will be

Environmental Report for submissionl to ADB Chapter 5 Pluak Daeng Power Plant Anticipated Environmental Impacts and Mitigations
RNP/ENV/P5028/FR (ADB)/RE62049-sec 5.3 Page 5-249
at a moderate level (2 scores). Activities during the construction phase may lead to injuries, accumulation of vulnerable groups, strike and the impact on communities. (e) Health risk assessment
Construction workers During the construction phase, construction workers will be affected at a moderate level. As these people have to work at the construction site for 8 working hours, the probability of exposure will be at a high level (4 scores). Impact severity level will be a moderate level ( 2 scores) . Impact significant level, therefore, will be at a moderate level ( 8 scores) . The health risk level is acceptable; however, health effect prevention and mitigation measures shall be established, or existing measures may be improved.
People living within 5 km radius from the project boundary Taking into account risk matrix, construction activities at the construction site in a short period of time and the concentration of total suspended particulate meets the standard. Nonetheless, potential health effects include eye and skin itrritation. The affected persons will recover if they are not exposed to total suspended particulate. This is a short- term health effect. Also, dust diffusion may be caused by transportation. Moreover, the sensitive receptors are adjacent to the project area, the impact severity level will be at a moderate level (2 scores). According to morbidity statistics of outpatients in Ror. Ngor. 504, the majority of people living in the study area suffered from respiratory system diseases and local public health personnel viewed that these diseases were the main causes of illness. Therefore, the level of health effects will be at a moderate level (3 scores). Hence, health effect significance level from exposure to total suspended particulate will be at a moderate level ( 6 scores) . Impact prevention and mitigation measures shall be checked for sufficiency. Additional, Impact prevention and mitigation measures may be established to be in line with health effects.
Noise (a) Health effect characteristics The impacts of noise on physical health include destruction of auditory system efficiency and side effects, such as stress, headache, hypertension, fatigue, and heart disease, etc. Loud noise exposure may lead to 2-3 hours destruction of auditory

Environmental Report for submissionl to ADB Chapter 5 Pluak Daeng Power Plant Anticipated Environmental Impacts and Mitigations
RNP/ENV/P5028/FR (ADB)/RE62049-sec 5.3 Page 5-250
system, having tinnitus, temporary deaf or permanent deaf. A prolonged exposure to loud sound will impair hearing ability, hypacusia or even deafness. The study of Department of Pollution Control reveals that exposure to noise of greater than 120 dB(A) means a high risk of deafness. Moreover, exposure to an average noise level of 85 dB(A) or higher for 8 hours/day or 70 dB(A) onwards all the time, will lead to hearing loss and impair hearing ability. The impact of noise on mental health includes annoyance, and failure in communication and understanding. Furthermore, Noise obstructs people’s concentration while working. Noise also affects people’s emotion, relaxation and privacy (Crocker, 1998) (b) Main activities that result in health effects Main activities during the construction phase that will be noise sources are pile driving, foundation construction, structural or building construction, decoration and transportation of construction materials and equipment, etc. (c) Vulnerable groups to health effects Vulnerable groups to health effects consist of construction workers woring near the noisy engine and machinery as well as people living close to the construction site. (d) Consideration of likelihood of health effects and severity of consequences 1. Consideration of likelihood of health effects The power plant project is categorized as a factory of building and structure type. As a result, in the worst case scenario, at the distance of 15 m from the noise source which are the machinery or equipment employed concurrently while excavating for foundation construction, the noise level will be 89 dB(A) , which is the representative of noise level from construction activity.
Construction workers During the construction phase, construction workers will be exposed to 89. 0 dB(A) of the noise level. Combined with the maximum Leq 8 hr in the project area at present (51 .0 dB(A) ) , the noise level will be 89.0 dB(A) . This noise level exceeds the standard stated in the Notification of Ministry of Labour B.E.2561 re: the Standard of Noise Exposure in the Workplace. The standard determines that an average noise level for 8 consecutive working hours shall not exceed 85 dB(A). To reduce the noise impact on construction workers or staff working in the noisy area, they are required to wear personal

Environmental Report for submissionl to ADB Chapter 5 Pluak Daeng Power Plant Anticipated Environmental Impacts and Mitigations
RNP/ENV/P5028/FR (ADB)/RE62049-sec 5.3 Page 5-251
protective equipment, i.e. ear muffs and earplugs all the time. As a result, the likelihood of health effect mitigation will be at a moderate level (3 scores).
People living in the project vicinities According to noise measurement results at the sensitive receptors in the study area during March 13 rd-20 th, 2019 at 6 measurement stations: (1) the house at the west of the project sit (N2) (2) the house at the south of the project site (N3), (3) the house at the north of the project site (N4) , (4) the house at the northwest of the project site (N5), (5) Ban Map Toei School (N6), (6) the house at the northwest of the project site (N7), Leq 24 hr ranged from 48.7-77.1 dB(A). Maximum noise level measured at Ban Map Toei School, is greater than noise standard, which determines Leq 24 hr shall not exceed 70 dB(A) because there was school festival during the noise measurement. However, during the general days its noise levels (56. 2-68. 6 dB(A) ) meet the noise standard. Lmax ranged from 80.9-101.2 dB(A). Maximum measured value was at Ban Map Toei School. It accounted for 88.0% of general noise standard where Lmax over a specific period of time shall not exceed 115 decibels (A). In the worst case scenario, at the distance of 15 m from the noise source which are the machinery or equipment employed concurrently while excavating for foundation construction, the noise level will be 89 dB (A) , which is the representative of noise level from construction activity. According to forecast results of Leq 24 hr at the sensitive receptors, i. e. the house at the west of the project site, the house at the south of the project site, and the house at the north of the project site, it was less than the standard. As a result, the impact of noise on communities and sensitive receptors will be at a low level. Eventhough the forecast noise level falls within the standard, the maximum value is 95 .0% of the standard value. Therefore, the likelihood of health effects during the construction phase will be at a moderate level (3 scores). 2. Consideration of Severity of Consequences
Construction workers As construction activities will be undertaken for a short period of time, severity of consequences will be at a moderate level (2 scores). Exposure to noise may result in temporary, permanent hearing loss, absence from work, and impacts on construction activities and power generation process.

Environmental Report for submissionl to ADB Chapter 5 Pluak Daeng Power Plant Anticipated Environmental Impacts and Mitigations
RNP/ENV/P5028/FR (ADB)/RE62049-sec 5.3 Page 5-252
People living in the project vicinities According to forecast results, incremental noise at a sensitive receptor is higher than the existing noise more than 3 dB(A) . However, environmental impact prevention and mitigation measures are established. Temporary barriers will be installed at the pile driving areas in the west, the east, the south and the north of the project, as well as at the fence in the north. Preliminarily, a metal sheet of 1.27 millimeters thick onwards ( Steel 18 ga) is chosen. Alternatively, other materials with sound transmission loss of 25 dB(A) can be used. The height of four sidewalls in the west, the east, the south and the north will be 5 m from the ground. (e) Health risk assessment
Construction phase Eventhough construction activities occur intermittently, construction workers may be injured and vulnerable groups may be accumulated. As a result, Health effects will be at a moderate level (2 scores) . The likelihood will be at a moderate level (3 scores) . As construction workers have to work in the area where the machinery operates throughout working hours. Thus, level of significance will be at a moderate level (6 scores) , which is acceptable. However, health effect prevention and mitigation measures shall be established, or existing measures may be improved.
People living in the project vicinities There are people living in the project vicinities where have not much carrying capacity of the increased noise level. Therefore, noise from construction activities may affect communities. Severity of consequences will be at a moderate level (2 scores). The likelihood will be at a moderate level (3 scores). Thus, level of significance will be at a moderate level ( 6 scores) , which is acceptable. However, health effect prevention and mitigation measures shall be established, or existing measures may be improved.
Solid waste, construction waste and wastewater (a) Health effect characteristics Construction waste during the construction phase includes scraps of material from soil excavation, structural scraps, hazardous waste, such as battery and lubricant oil. Apart from this, there will be 2 , 7 20 kg/day of general waste from 3 , 2 0 0 construction workers. (Based on the setting criteria, general people will generate approx.

Environmental Report for submissionl to ADB Chapter 5 Pluak Daeng Power Plant Anticipated Environmental Impacts and Mitigations
RNP/ENV/P5028/FR (ADB)/RE62049-sec 5.3 Page 5-253
0.85 kg/person/day of solid waste (Kriangsak, 1994)). Contamination to the environment may result in the breeding source of vectors, odour and conflicts with communities. There will be about 179.2 m3/day of wastewater from utilization-consumption by 3,200 persons (Approx. 80% of wastewater is based on 70 liters/person/day of water demand for utilization-consumption, (Kriangsak, 1996)) and approx. 180 m3 of water discharges from the hydrostatic test. (b) Main activities that cause health effects Waste from construction activities and utilization-consumption by construction workers will be causes of health effects. (c) Vulnerable groups to health effects Vulnerable groups to health effects include construction workers and people living in the project vicinities. (d) Consideration of likelihood and severity of consequences 1. Consideration of likelihood
Construction workers Construction workers who collect general waste and waste are most likely to be affected. Nonetheless, waste is segregrated by type and suitably collected according to the Notification of Ministry of Industry on disposal of waste or unusable materials, B.E. 2548. Moreover, construction workers are required to wear personal protection equipment (PPE) , such as rubber gloves, and protective clothing according to occupational health, safety and work environment. However, during the construction phase, there will be 3,200 construction workers and 2,720 kg/day of solid waste, it may affect solid waste management by local agencies and cause solid waste accumulation. Hence, the likelihood of construction worker health effects will be at a moderate level (3 scores).
People living within 5 km radius from the project boundary During the construction phase, the designated areas for general waste and each type of waste will be provided. Also, proper containers will be provided for the storage of each type of waste and for suitable disposal. General waste consisting of food scraps, plastic bag, scrap paper will be collected by Map Yang Phon Sub-district Administration Organization (SAO). At present, Map Yang Phon SAO disposes of

Environmental Report for submissionl to ADB Chapter 5 Pluak Daeng Power Plant Anticipated Environmental Impacts and Mitigations
RNP/ENV/P5028/FR (ADB)/RE62049-sec 5.3 Page 5-254
garbage at waste disposal center of Rayong Province which could provide waste disposal service to 68 local administration organization in Rayong Province. About 179.2 m3/day of wastewater from construction workers utilization-consumption and wastewater from toilets will be collected and treated through the prefabricated wastewater treatment plant so as to comply with effluent standards. Meanwhile, approx. 180 m3 of water discharges from the hydrostatic test will be checked for compliance with the requirements of Pluak Daeng Industrial Park before being conveyed to the central wastewater treatment system of the Industrial Park. As a result, the likelihood of people’ s health effects will be at a moderate level (3 scores). 2. Consideration of severity of consequences
Constructionn workers Severity of consequences for construction workers will be at a moderate level (2 scores) because these people will be directly exposed to waste, which results in health effects.
People living within 5 km radius from the project boundary During the construction phase, generated solid waste, construction waste and wastewater will be as follows: General waste: About 2,720 kg/day of general waste Construction waste, such as broken brick, structural scrap, scraps of material, etc. Waste, such as battery, lubricant oil, hydaulic oil, detergent, etc. The designated areas for waste storage and sorting will be provided. Also, proper containers will be provided for the storage of each type of waste and for suitable disposal. Therefore, severity of consequences will be at a moderate level ( 2 scores) , i. e. the increased morbidity rate, injuries, accumulation of vulnerable groups, budgeting, strike, impacts on power generation and communities.

Environmental Report for submissionl to ADB Chapter 5 Pluak Daeng Power Plant Anticipated Environmental Impacts and Mitigations
RNP/ENV/P5028/FR (ADB)/RE62049-sec 5.3 Page 5-255
(e) Health risk assessment Construction workers
Construction workers who collect and transport general waste and waste will have health effects. The likelihood will be at a moderate level (3 scores) since these people are most likely to be exposed to waste. Nonetheless, waste is segregrated by type and suitably collected according to the Notification of Ministry of Industry on disposal of waste or unusable materials, B. E. 2548. Moreover, Construction workers are required to wear personal protection equipment (PPE), such as rubber gloves, and protective clothing according to occupational health, safety and work environment. Severity of consequences will be at a moderate level. (2 scores). Thus, significance level of construction worker health effects will be at a moderate level (6 scores). Health effect prevention and mitigation measures shall be checked for sufficiency. Additional measures may be established to be in line with health effects.
People living in the project vicinities The likelihood of impacts of general waste and waste on people living in the project vicinities will be at a moderate level ( 3 scores) . Severity of consequences will be at a moderate level ( 2 scores) . Thus, significance level of health effects on people living in the project vicinities will be at a moderate level ( 6 scores) , which is acceptable. Health effects prevention and mitigation measures need to be established. Additional, measures may be established.
Transportation (a) Health effect characteristics During the construction phase, transportation of construction materials, equipment and construction workers to the project area may affect traffic flow in the project area and vicinities. Apart from this, in case of accident, it may lead to injury or death. According to an assessment of impacts on transportation, national highways that are transportation routes, i.e. the National Highway No. 3 31 , the National Highway No. 36 , the rural road Ro Yor 2026 and the rural road Ro Yor 3013 had a very high traffic flow. Transportation suring the construction phase will not affect traffic flow on roads related to the project. Also, contractors shall strictly adhere to traffic rules. Local involved agencies and persons, such as local police, community leaders, etc. will be notified

Environmental Report for submissionl to ADB Chapter 5 Pluak Daeng Power Plant Anticipated Environmental Impacts and Mitigations
RNP/ENV/P5028/FR (ADB)/RE62049-sec 5.3 Page 5-256
in advance for facilitation when materials, equipment and heavy machinery are transported. Moreover, community people will be notified in advance every time for the safety of operators and road users. (b) Activities that lead to health effects Transportation of construction materials, equipment and construction workers. (c) Vulnerable groups to health effects Vulnerable groups to health effects due to road accidents during the construction phase include road users around the project area and construction workers who commute from camp site to work at the construction site. (d) Consideration of likelihood of health effects and severity of consequences 1. Consideration of likelihood
Construction workers Since construction workers do not live at the construction site but they commute from camp site to work, sharing transportation routes with people living in the project area may cause road accidents. However, health effect prevention and mitigation measures contribute to a low level of health effects ( 2 scores) , i. e. low likelihood, likely to impact, with the availability of prevention and mitigation measures.
People living in the project vicinities According to traffic forecast in Section 5.3.1 Transportation, traffic conditions will not be different from the existing ones, i. e. a very high traffic flow. The transportation routes will sufficiently accommodate the increased traffic. Nonetheless, based on the public health facilities database, traffic road accidents are the leading cause of illness in the study area. Hence, the likelihood of people’ s health effects will be at a low level (2 scores) , i.e. low possibility with the availability of prevention and mitigation measures. 2. Consideration of severity of consequences
Construction workers Serious road accidents during the construction phase may result in death. Severity of consequences will be at a high level (3 scores), i.e. injury, strike, impact on work or even death.
Environmental Report for submissionl to ADB Chapter 5 Pluak Daeng Power Plant Anticipated Environmental Impacts and Mitigations
RNP/ENV/P5028/FR (ADB)/RE62049-sec 5.3 Page 5-257
People living in the project vicinities As construction activities will take up 51 months and as road accidents are the leading cause of death and the mortality rate in the study area, the travel of construction workers and transportation may lead to minor injuries, deformities, or death. Thus, severity of consequences on people’s health effects will be at a high level ( 3 scores) . That is severity of consequences may lead to injuries or even death of community people. (e) Health risk assessment
Construction workers Eventhough health effects on construction workers will be over a short period of time, severity of consequences will be at a high level (3 scores) and the likelihood will be at a low level (2scores) . Hence, significance level of health effects will be at a moderate level ( 6 scores) , which is acceptable. However, health effect prevention and mitigation measures shall be established, or existing measures may be improved.
People living in the project vicinities Health effects on people who share transportation routes with the project staff will be over a short period of time but with a high level of severity of consequences ( 3 scores) and low likelihood ( 2 scores) . Hence, significance level of health effects will be at a moderate level (6 scores) , i.e. injuries and budgeting. Existing health effect prevention and mitigation measures shall be checked for adequacy and suitability.
Socio-economics The opportunity for local people employment is expected to be at a moderate level (3) because employment during the construction phase will be responsible by contractors. Therefore, this benefit will depend on the management of contractors. However, prevention and mitigation measures require that contractors hire local people as many as possible to reduce the impact from migrant labours and increase benefits for communities. Moreover, local people shall be given priority to be hired for any vacancy. The employment by this project will enhance liquidity of the community economy, decrease the unemployment rate, promote the quality of life of people for better healthcare with a choice to receive better health service. The benefit for local people

Environmental Report for submissionl to ADB Chapter 5 Pluak Daeng Power Plant Anticipated Environmental Impacts and Mitigations
RNP/ENV/P5028/FR (ADB)/RE62049-sec 5.3 Page 5-258
employment will be at a moderate level (2). Thus, significance level of local employment will be at a moderate level (6), which acceptable. However, health effect prevention and mitigation measures shall be established, or existing measures may be improved.
Occupational Health, Safety and work Environment (a) Health effect characteristics During the construction phase, the following construction activities are likely to lead to accidents and illness: welding, short circuiting of power tools, construction in a confined space, noisy areas, brightly lit areas or dim ones, high heat areas, exposure to chemical substances, unsuitable ergonomics in the workplace, etc. These may cause illness and death. According to impact assessment, occupational Health, Safety and work Environment of construction workers are realized. Safety will be always checked. Training will be provided for operators prior to starting work. Also, occupational health, safety and work environment measures will be made for safety during working hours. The main goal of the project is making zero accident. (b) Construction activities that cause health effects Construction activities that cause health effects include:
- Dust from construction activities, removal of scraps of material from the construction site, transportation of construction workers, etc.
- Exhaust from vehicles used in the transportation of construction machines, equipment and materials, relocation of construction materials/parts
- Noise and vibration from machine operation - Work environment like heat, bright areas or dim ones, and
work in a confined space, work at a high place, work in a noisy area, unsuitable ergonomics at work, etc. (c) Vulnerable group to health effects The vulnerable group to health effects will be construction workers, especially works that need special caution and prevention. For example, structural construction in a specific area where machine control is difficult and an experienced operator is required and machine maintenance, etc.

Environmental Report for submissionl to ADB Chapter 5 Pluak Daeng Power Plant Anticipated Environmental Impacts and Mitigations
RNP/ENV/P5028/FR (ADB)/RE62049-sec 5.3 Page 5-259
(d) Consideration of likelihood of health effects and severity of consequences 1. Consideration of likelihood of health effects
Construction workers During the construction phase, the following construction activities are likely to lead to accidents and illness: construction at a high place, construction in a confined space, noisy areas, brightly areas or dim ones, high heat areas, unsuitable ergonomics in the workplace, etc. These may cause illness and death. Pluak Daeng Power Plant Project realizes occupational health, safety and work environment for maximum safety during working hours. The main goal of the project is zero accident. Hence, the likelihood of construction worker health effects will be at moderate level ( 3 scores) , i. e. support from available statistics for likelihood forecast. 2. Consideration of severity of consequences
Construction workers If a contractor does not pay attention to or does not consider the safety of construction workers, accidents at work may occur. The severity of accident may lead to injury or death. As a result, severity of consequences will be at a high level (3 scores) , i.e. with injury, death, expenses for recovery and impact on power generation process. (e) Health risk assessment
Construction workers Construction workers health effects have 9 scores, which is at a moderate level and acceptable. However, health effect prevention and mitigation measures shall be established, or existing measures may be improved.
Public health service system and the increase in migrant labours (a) Health effect characteristics The entry of migrant labours to undertake construction activities may have cause the epidemic of communicable diseases, namely diarrhea, sexually transmitted diseases, and other diseases, etc. Furthermore, migrant labours may cause social problems, such as narcotics, reduced safety, and conflicts with communities if they are not screened or well managed. Additionally, in case of on- the- job injuries or illness,

Environmental Report for submissionl to ADB Chapter 5 Pluak Daeng Power Plant Anticipated Environmental Impacts and Mitigations
RNP/ENV/P5028/FR (ADB)/RE62049-sec 5.3 Page 5-260
migrant labours may be the cause of inadequacy in public health service system, since they will be sent to a local hospital or infirmary like local people. Also, transportation of materials, equipment, machines and construction workers, an accident at work and an emergency case will lead to injuries and death. According to the interview of local public health personnel, 8 8 . 9% stated that medical personnel and medical devices, namely nurse, dental officer/dental nurse and public health officer/public health technician, etc. are insufficient. Inadequate medical devices included dental equipment, respirator and dressing set, etc. The existence of the project will increase the burden of local public health facilities. Nowadays, there is a shortage of medical personnel in Tambon Health Promotion Hospitals and government hospitals in the study area; the entry of migrant labours means the sharing of public health personnel and may induce diseases from other areas. However, a suitable occupational health, safety and work environment plan and an evaluation and monitoring plan are established. An infirmary will be provided for construction workers for first aid to reduce the burden of the local public health service. (b) Activities that may lead to health effects Accidents from construction activities and the increase in 3,200 migrant labours during the construction period (c) Vulnerable groups to health effects Vulnerable groups to health effects include construction workers and people living in the areas nearby the construction site. (d) Consideration of likelihood and severity of consequences 1. Consideration of likelihood of health effects
Construction workers During the construction phase, there will be about 3 , 2 0 0 migrant workers. It is likely that accidents and illness while working occur. As a result, the likelihood of health effects will be a moderate level (3 scores).
People living in the project vicinities During the construction phase, 3,200 construction workers will enter the project area, leading to diseases and accidents and increased users in local public health facilities despite the shortage of medical personnel and medical devices. In

Environmental Report for submissionl to ADB Chapter 5 Pluak Daeng Power Plant Anticipated Environmental Impacts and Mitigations
RNP/ENV/P5028/FR (ADB)/RE62049-sec 5.3 Page 5-261
addition to this, the survey on opinion of local public health personnel reveals, the shortage of professional nurse, dental officer/ dental nurse and public health officer/public health technician, etc. Thus, the likelihood of impacts on the public health service system will be at a moderate level (3 scores). Also, migrant labours may cause social and sanitation issues in communities. Contractors have to provide camps for construction workers in the project vicinities, it is likely to result in communicable diseases, narcotics, and crime. Furthermore, 8 8 . 9 % of public health personnel stated that nowadays, the project area has social problems and crime, such as theft/plunder and quarrel and fight among teenagers in the entertainment venue. Hence, the likelihood of people’ s health effects due to communicable diseases in the project area, narcotics and crime will be at a moderate level (3 scores) i.e. support from available statistics for likelihood forecast. 2. Consideration of severity of consequences
Construction workers In case contractors do not provide a proper sanitary system at their camps of construction workers and at the construction site, and the unavailability of infirmary, medical supplies, and an ambulance, there might be severe injuries. Therefore, severity of consequences will be at a moderate level (2 scores) , i.e. with the increased morbidity rate, injury, death, expenses for recovery and impact on the operation during the construction phase.
People living in the project vicinities If a contractor does not pay attention to or does not consider the safety of construction workers, accidents at work or communicable diseases may occur. Construction workers may be sent to local hospitals which increases the burden of medical personnel. As a result, severity of consequences will be at a moderate level (2 scores) , i. e. with the increased morbidity rate, injury, accumulated vulnerable groups, budgeting, strike, impact on power generation process and communities.
People living in the project vicinities As there will be about 3,200 construction workers during the construction phase, in case contractors do not screen migrant labours or migrant labours are not well managed, it may lead to an epidemic of diseases and impacts on the local

Environmental Report for submissionl to ADB Chapter 5 Pluak Daeng Power Plant Anticipated Environmental Impacts and Mitigations
RNP/ENV/P5028/FR (ADB)/RE62049-sec 5.3 Page 5-262
public health service system and social problems like narcotics, crime and the safety in life and asset. Currently, gamble, narcotics, theft, plunder/ robbery are problems in this area. Therefore, training on hygiene, disease and narcotic prevention will be provided for construction workers. Moreover, contractors shall adhere to the Labour Protect Action Act on a risk-based physical examination, prepare a list of construction workers, notify the number of construction workers, and congenital diseases to responsible public health facilities to mitigate and prevent these problems. Therefore, severity of consequences on people health effects will be at a moderate level (2 scores). That is, if construction workers snatch and run away, it may result in loss of assets of people. (e) Health risk assessment
Construction workers Construction workers during the construction phase will have health risk at a moderate level (3 scores). Severity of consequences will be at a moderate level (2). As a result, health risk level of construction workers will be at a moderate level ( 6 ) , which is acceptable; however, health effect prevention and mitigation measures shall be established, or existing measures may be improved.
People living in the project vicinities The local public health system will have more responsibilities. Migrant labours may cause the following problems: communicable diseases, narcotics and crime. The impact will be at a moderate level (3). Severity of consequences will be at a moderate level (2). Therefore, the risk of impact will be at a moderate level (6), which is acceptable; however, health effect prevention and mitigation measures shall be established, or existing measures may be improved.
Mental health effects Construction workers
1. Mental health effect characteristics Construction workers will be directly affected from work. Health and mental health effects include exposure to dust from land leveling, noise from machine operation, solid waste, construction waste, polluted water, accidents from transportation (materials and equipment and construction workers) , occupational health, safety and the environment, the public health service system and the increase in migrant labours. These issues may be the causes of stress and anxiety while working.

Environmental Report for submissionl to ADB Chapter 5 Pluak Daeng Power Plant Anticipated Environmental Impacts and Mitigations
RNP/ENV/P5028/FR (ADB)/RE62049-sec 5.3 Page 5-263
2. Health risk assessment Although construction workers are the most vulnerable group, comprehensive prevention and mitigation measures for all activities are established. Additionally, activities will be performed under the occupational health, safety and environmental management plan and according to legal requirements. Also, the staff have to wear a personal protective equipment (PPE) while working, as appropriate. Moreover, a personal protective equipment (PPE) is required to be checked regularly or in accordance with the safety procedure of the project. An infirmary and medical supplies as well as an ambulance will be provided for emergency cases according to the ministerial regulations of Ministry of Labour on welfare facilities at workplaces, B.E. 2548 (2005) at the construction site, etc. The construction phase will take up about 51 months with 3,200 construction workers/day. As a result, the likelihood will be at a moderate level (3) and severity of consequences will be at a moderate level (2) . Severity of accidents from transportation of construction materials and equipment and occupational health, safety and the environment will be at a high level ( 3 ) as theses may cause serious injuries or death. Hence, significance level of mental health effects and the livelihood of local people will be at a moderate Level (6-9), which is acceptable; however, health effect prevention and mitigation measures shall be established, or existing measures may be improved.
People living in the project vicinities 1. Health effect characteristics Transportation of tools, equipment, heavy machinery and construction workers will increase traffic on roads in the project area, cause delay in travel, increase road accidents and stress from travel and concerns for road accidents. Additionally, the employment of migrant labours who have different livelihood from local people may cause conflicts. Dust, noise from construction material and equipment transportation, etc. contribute to stress and anxiety of people living in the project vicinities. Although psychiatric disorders (neurosis) are likely to increase in Rayong province, the data of outpatients in Ror Ngor. 504 show that they are not the main cause of illness in the study area.

Environmental Report for submissionl to ADB Chapter 5 Pluak Daeng Power Plant Anticipated Environmental Impacts and Mitigations
RNP/ENV/P5028/FR (ADB)/RE62049-sec 5.3 Page 5-264
2. Health risk assessment Although psychiatric disorders (neurosis) are likely to increase in Rayong province with no prevention and mitigation measures for the effects on mental health and the livelihood of local people, the construction schedule will be publicized. This is to make communities confident that contractors are supervised to be in compliance with the measures included in the environmental impact assessment report which be attached to the contract. Therefore, it is expected that only the project area will be affected at a moderate level (3), severity of consequences will be at a moderate level (2). The impact on transportation will be at a low level (2) and severity of consequences will be at a high level ( 3 ) . Hence, significance level of effects on mental health and the livelihood of local people will be at a moderate level (6), which are acceptable; however, health effect prevention and mitigation measures shall be established, or existing measures may be improved. (2) Operation Phase During the operation phase, the project operation may result in health threats to operators and people living within the sensitive receptors 5 km radius from the project boundary, such as changes in the air quality, noise, occupational health, safety and work environment, solid waste and hazardous waste. Health effect characteristics and risk assessment will be as follows:
Air quality (a) Health effect characteristics During the operation phase, natural gas will be used as primary fuel and diesel oil will be used as reserve fuel. So, air pollution emission from the power plant may be harmful to health. These pollutants include nitrogen oxides (NOX) , sulphur dioxide ( SO2) and total suspended particulate ( TSP) , which affect human respiratory system. Inhalation of nitrogen oxides (NOX) may irritate pulmonaryalveolus and tracheal collapse, especially, in the person who has asthma. Exposure to 210 g/m3 of sulphur dioxide (SO2) will lead to the abnormal respiratory system and exposure to 290 g/m3 of sulphur dioxide (SO2) will cause an arrhythmia, with short and shallow breathing, increased pulmonary resistance, reduced nasal mucus and nasopharynx size (Wongphan Limpasenee, 2000) . Health effects depend on various factors, such as the duration of exposure, the health of

Environmental Report for submissionl to ADB Chapter 5 Pluak Daeng Power Plant Anticipated Environmental Impacts and Mitigations
RNP/ENV/P5028/FR (ADB)/RE62049-sec 5.3 Page 5-265
affected person and the concentrations of pollutants. Details are shown in Table 5.4.2-1 and Table 5.4.2-2. AERMOD atmospheric dispersion modeling system is adopted to assess the impact on air quality in 6 cases (Details are given in Chapter 5, Section Air Quality Assessment), namely Case 1: Impacts caused by Pluak Daeng Power Plant Project in the event of natural gas-fired operation at 100% load are assessed in conjunction with results of ambient air quality monitoring. Case 2: Impacts caused by Pluak Daeng Power Plant Project in the event of natural gas- fired operation at minimum load are assessed in conjunction with results of ambient air quality monitoring. Case 3: Impacts caused by Pluak Daeng Power Plant Project in the event of natural gas- fired operation at 100% load; plus the existing impacts caused by other industrial plants as specified in the environmental impact assessment report though there is not yet air pollutant emission within the radius of 15 kilometers from the project location; are assessed in conjunction with results of ambient air quality monitoring. Case 4: Impacts caused by Pluak Daeng Power Plant Project in the event of diesel- fired operation at 100% load are assessed in conjunction with results of ambient air quality monitoring. Case 5: Impacts caused by Pluak Daeng Power Plant Project in the event of diesel- fired operation at minimum load are assessed in conjunction with results of ambient air quality monitoring. Case 6: Impacts caused by Pluak Daeng Power Plant Project in the event of diesel- fired operation at 100% load; plus the existing impacts caused by other industrial plants as specified in the environmental impact assessment report though there is not yet air pollutant emission within the radius of 15 kilometers from the project location; are assessed in conjunction with results of ambient air quality monitoring. (b) Activity that leads to health effects Stack emission

Environmental Report for submissionl to ADB Chapter 5 Pluak Daeng Power Plant Anticipated Environmental Impacts and Mitigations
RNP/ENV/P5028/FR (ADB)/RE62049-sec 5.3 Page 5-266
TABLE 5.4.2-1 IMPACTS OF FUEL COMBUSTION ON HUMAN HEALTH
Pollutants Health Effects Sulphur Dioxide (SO2)
Inhalation of the high amount of SO2 (Gaseous SO2) over a short period of time will cause breathing difficulty for a moment for those who have asthma or those working outdoors. Exposure to SO2 or SO2 particle will cause the respiratory system diseases and worsen heart disease.
Inhalation of SO2 particles: SO2 will have a chemical interaction with other substances in the air, causing fine solid particles of sulphate. Once inhaled, the fine solid particles of sulphate will accumulate in the lung, irritate the respiratory system, cause breathing difficulty, and respiratory system diseases and premature deaths.
Visibility impairment: In case of refraction of light or the light is absorbed by gas or SO2 particles, it will impair visibility.
Total Suspended Particulate (TSP)
Severe respiratory symptoms, i. e. respiratory irritation, cough or breathing difficulty
Impaired pulmonary function More laboured breathing for those who have asthma Chronic bronchitis Arrhythmia Heart disease, such as heart failure Premature deaths for those who have heart disease or pneumonosis
Nitrogen oxides (NOx)
Nitric Oxide (NO) and nitrogen dioxide (NO2) are compounds that are harmful to human. Inhalation of 140 g/m3 of nitrogen dioxide (NO2) will cause slow dark adaptation (Wongphan Limpasenee, 2003). Those who have asthma will worsen from labored breathing in case of exposure to 190 g/ m3 of this gas together with bronchioconstrictor. The abnormal respiratory system in human occurs if exposed to 1,300-3,800 g/m3 of this gas. The comparison of acute conditions between NO and NO2 on pulmonary function shows that NO is apparently less harmful.

Environmental Report for submissionl to ADB Chapter 5 Pluak Daeng Power Plant Anticipated Environmental Impacts and Mitigations
RNP/ENV/P5028/FR (ADB)/RE62049-sec 5.3 Page 5-267
TABLE 5.4.2-1 IMPACTS OF FUEL COMBUSTION ON HUMAN HEALTH (CONT’D)
Pollutants Health Effects Nitrogen oxides cause smog because of the interaction between NOx
and volatile organic compound ( VOC) while the light is the catalyst. Vulnerable groups include children, the senior people, those who have pneumonosis or bronchitis, such as asthma and those who work or exercise outdoors. Prolonged and regular exposure to nitrogen oxides will destroy lung tissue, impairing pulmonary function. In addition, ozone may be blown out far from an emission source affecting people or the environment in remote areas and agricultural products.
Nitrogen Oxides (NOx) (cont’d)
Weather changes: Nitrous Oxide (N2O) which belongs to the family of nitrogen oxide, causes the greenhouse effect. Accumulation of this gas in the atmosphere makes global temperature higher which is a risk factor to human, causes the sea level rise and a considerable change in plants and animals.
The reaction of a toxic NOx with other compounds, especially organic compound or ozone will form new toxic compounds. Some new toxic compounds are the cause of biological mutation. Examples of toxic compounds are nitrate radical, nitroarenes and nitrosamines.
Source: http://hpe4.anamai.moph.go.th/hia/air_pollutant.php, 2010

Environmental Report for submissionl to ADB Chapter 5 Pluak Daeng Power Plant Anticipated Environmental Impacts and Mitigations
RNP/ENV/P5028/FR (ADB)/RE62049-sec 5.3 Page 5-268
TABLE 5.4.2-2 EFFECTS OF NITROGEN DIOXIDE ON HUMAN
Concentrations Duration of Exposure
Reasons Bibliography g/m3 ppm
230 0.12 - 3 Out of 9 healthy males, smell the odour.
Henschier et al. (1960)
230 0.12 - Among 14 persons, most of them smell the odour immediately when the test starts.
Salamberidze (1967)
200 0.11 - 26 Out of 28 persons, smell the odour immediately when the test starts.
Feldman (1974)
Effects on pulmonary function 1,300-3,800 0.7-2.0 10 min Increase in respiratory system
resistance when inhaling and exhaling
Suzuki & Ishikawa (1965)
190 0.1 1 hr/day Increase in respiratory system resistance and increase in restrictive impairment in 13 persons who have asthma among 20 persons
Orehek et al. (1976)
560,000-940,000 300-500 - Death due to pulmonary edema or loss of consciousness as a result of cerebral hypoxia
Grayson (1956)
Efects on community 94 - - Two groups of population living in
the same region, different town, and different concentrations of nitrogen dioxide were compared. Results show that the concentration of 43 g/m3 nitrogen dioxide did not affect pulmonary function and did not increase the morbidity rate of respiratory system in non- smoking persons in urban population (Control Group)
Choen et al. (1972)
940 0.50 1 hr Housewives who cooked with a gas oven did not have an acute respiratory syndrome, compared with those who used an electric oven.
US.EPA (1976 b)
Source: Air pollution Control System Textbook, Department of Industrial Works, 2004

Environmental Report for submissionl to ADB Chapter 5 Pluak Daeng Power Plant Anticipated Environmental Impacts and Mitigations
RNP/ENV/P5028/FR (ADB)/RE62049-sec 5.3 Page 5-269
(c) Vulnerable groups to health effects The project staff and people living in the project vicinities, especially vulnerable groups like children, the senior people and patients with chronic respiratory system (d) Consideration of likelihood and severity of consequences 1. Consideration of likelihood
Project staff During the operation phase, the likelihood of project staff to be affected by air pollutants will be at a moderate level (3 scores) as they have to work in an operational area for a specific period of time and the operational area is the source of pollutants.
People living in the project vicinities Forecast results of air quality through AERMOD atmospheric dispersion modeling system show the maximum concentrations of nitrogen dioxide (NO2), sulphur dioxide (SO2) and total suspended particulate (TSP) in case 1: Impacts caused by Pluak Daeng Power Plant Project in the event of natural gas-fired operation at 100% load are assessed. It was found that the incremental concentrations in 31 sensitive receptors of such pollutants were lower than 25 percents of national ambient air quality standards. According to morbidity statistics of outpatients in Ror Ngor. 504 from Tambon Health Promoting Hospitals in the study area during 2014-2018, the majority of people in the study area suffered from diseases of the respiratory system; other symptoms, signs and abnormal clinical and laboratory findings, not elsewhere classified; and diseases of the digestive system, respectively. According to morbidity statistics of inpatients in Ror. Ngor. 505 during 2014-2018, diseases of the respiratory system were not the main causes of the illness of people in the study area. Major diseases were Endocrine, nutritional and metabolic diseases; Other symptoms, signs and abnormal clinical and laboratory findings, not elsewhere classified; and Single spontaneous delivery (Details are included in Chapter 4, Collection of Public Health Baseline). In addition, 66 . 7% of local public health personnel viewed that the existing environment affects illness, such as air quality, water quality and chemical substances, etc.

Environmental Report for submissionl to ADB Chapter 5 Pluak Daeng Power Plant Anticipated Environmental Impacts and Mitigations
RNP/ENV/P5028/FR (ADB)/RE62049-sec 5.3 Page 5-270
According to the information of existing environmental conditions of the study area, the project vicinities can still accommodate pollutants. However, as the project operation will be in the long- run, it is likely that air pollutants are accumulated. Therefore, the likelihood of people health effects will be at a moderate level (3 scores) . That is, there are potential health effects which require strict control measures. 2. Consideration of severity of consequences
Project staff The Continuous Emission Monitoring System (CEMS) will be installed at the stacks of the power plant to continuously monitor the air pollution emission rate. Monitoring results will be reported to Pluak Daeng Industrial Park. Also, the air pollution emission rate will be controlled for not exceeding the one mentioned in the EIA report. Therefore, severity of the project staff health effects will be at a moderate level (2 scores).
People living in the project vicinities Forecast results of air quality through AERMOD atmospheric dispersion modeling system show the maximum concentrations of nitrogen dioxide (NO2), sulphur dioxide (SO2) and total suspended particulate (TSP) in case 1: Impacts caused by Pluak Daeng Power Plant Project in the event of natural gas-fired operation at 100% load are assessed. It was found that the incremental concentrations in 31 sensitive receptors of such pollutants were lower than 25 percents of national ambient air quality standards. Maximum concentrations were found at Song Phi Nong Mountain and Jom Hae Mountain, about 13-15 km from the project area. Hence, severity of consequences on people living in the project vicinities will be at a moderate level ( 2 scores) . It is likely to affect people and increase illness because of air pollution.
Health risk assessment Project staff
During the operation phase, the likelihood of the project staff exposure to air pollutants will be at a moderate level ( 3 scores) , severity of consequences will be at a moderate level (2 scores) and significance level of impact will be at a moderate level (6 scores). The strict air quality impact prevention and mitigation measures shall be established.

Environmental Report for submissionl to ADB Chapter 5 Pluak Daeng Power Plant Anticipated Environmental Impacts and Mitigations
RNP/ENV/P5028/FR (ADB)/RE62049-sec 5.3 Page 5-271
People living in the project vicinities As pollutants released, i.e. particulate matter, nitrogen dioxide and sulphur dioxide meet the standards, severity of consequences will be at a moderate level (2 scores) . According to morbidity statistics in Ror Ngor. 504, respiratory system diseases are the majority illness of people in the study area. Hence, the likelihood of people health effects will be at a moderate level (3 scores). Significance level of people health effects due to exposure to total suspended particulate will be at a moderate level ( 6 scores) . Existing prevention and mitigation measures shall be checked for sufficiency and suitability.
Noise (a) Health effect characteristics Exposure to noise levels that exceed 120 decibels (A) is likely to cause deafness and exposure to an average noise level of 85 decibels (A) or higher for more than 8 hours per day, or noise levels of 70 decibels (A) or higher all the time, is likely to cause hearing loss and deterioration in hearing. Prolonged exposure to noise may lead to mental health effects, namely stress, poor concentration, thought, and learning as well as decreased efficiency and effectiveness at work.
During the operation phase, tools, machines and equipment that generate 85 dB(A) of noise level at maximum at the distance of 1 m from the noise source will be chosen for power generation. This is exceptional for a cooling tower where maximum noise level of water impact on the floor shall not exceed 91.0 dB(A) at the distance of 1 m. The project staff are required to wear personal protective equipment, namely ear muff and earplugs all the time while working in a noisy area. Also, in the area where the noise level is 85 dB(A), the work shall not exceed 8 hours. Furthermore, some machines will be placed in a closed building installed with a metal sheet of 0.64 mm thick (Steel 24 ga) or thicker, with the transmission loss (TL) of 18 dB(A), or a material with the transmission loss (TL) of 18 dB(A) . Therefore, noise level from the machines, namely a gas turbine, steam turbine and generator will be reduced to 6 7 dB(A) . Regarding the sensitive receptors: incremental noise levels generated from the machinery and equipment during the operation phase at sensitive receptors around the project area are higher than existing noise levels more than 3 dB(A) except at a receptor located in the south of the project. Therefore, measures are established to reduce incremental noise levels at nearby receptors. Examples of those measures are Installing noise barrier with a height of 6. 5 m and a length of 400 m, which is made from a metal sheet of 1.27 millimeters thick onwards

Environmental Report for submissionl to ADB Chapter 5 Pluak Daeng Power Plant Anticipated Environmental Impacts and Mitigations
RNP/ENV/P5028/FR (ADB)/RE62049-sec 5.3 Page 5-272
(Steel 18 ga) or other materials with sound transmission loss of 25 dB(A) at the northern fence of the project or planting tree as noise barrier fence in the north of project fence with a height of 5. 0 m, a thickness of 30 m and a length of 400 m, installing silencers at the end of pipe of the noisy machinery to reduce noise and building enclosure for gas turbine engines and generators. Details for appraisal for noise impact are provided in Chapter 5 Section 5.1.2.1. (b) Activities that lead to health effects Noise from the machinery and electric generation equipment (c) Vulnerable groups to health effects The first vulnerable group is the project staff followed by people living within 5 km radius from the project boundary. (d) Consideration of likelihood and severity of consequences 1. Consideration of likelihood
Project staff During the operation phase, the likelihood of the project staff health effects will be at a moderate level (3 scores) as these people will be exposed to noise all the time while working.
People living in the project vicinities During the operation phase, the likelihood of noise exposure of people living in the project vicinities will be at a moderate level (3 scores) as the impact may be in the long-run. 2. Consideration of severity of consequences
Project staff During the operation phase, the project staff are required to wear personal protective equipment (PPE), namely earplugs or earmuff throughout working hours and noise prevention and mitigation measures are established. Nonetheless, as the projects staff have to work for a continuous working time, severity of consequences will be at a moderate level (2 scores).
People living in the project vicinities Forecast results of noise in general reveal that incremental noise levels generated from the machinery and equipment during the operation phase at sensitive receptors around the project area are higher than existing noise levels more than 3 dB(A) except at a receptor located in the south of the project. Therefore, measures are

Environmental Report for submissionl to ADB Chapter 5 Pluak Daeng Power Plant Anticipated Environmental Impacts and Mitigations
RNP/ENV/P5028/FR (ADB)/RE62049-sec 5.3 Page 5-273
established to reduce incremental noise levels at nearby receptors. Examples of those measures are installing noise barrier with a height of 6. 5 m and a length of 400 m, which is made from a metal sheet of 1. 27 mm thick onwards (Steel 18 ga) or other materials with sound transmission loss of 25 dB(A) at the northern fence of the project or planting tree as noise barrier fence in the north of project fence with a height of 5.0 m and a length of 30 m, installing silencers at the end of pipe of the noisy machinery to reduce noise and building enclosure for gas turbine engines and generators. As a result, severity of consequences on people health effects will be at a moderate level (2 scores). (e) Health risk assessment
Project staff During the operation phase, the likelihood of the project staff exposure to noise will be at a moderate level (3 scores), severity of consequences will be at a low level ( 2 scores) and significance level of impact will be at a moderate level ( 6 scores). The strict noise impact prevention and mitigation measures shall be established.
People living in the project vicinities During the operation phase, the likelihood of noise exposure of people living in the project vicinities will be at a moderate level (3 scores). Severity of consequences will be at a low level (2 scores) . Significance level of impact will be at a moderate level (6 scores) . The strict noise impact prevention and mitigation measures shall be established.
Solid waste and hazardous waste
(a) Health effect characteristics Waste during the operation phase is classified into 2 types: waste from power generation process and, i. e. scraps of material and container, air filter, used lubricant oil, resin, sludge and general waste generated from staff activities, i. e. sanitary waste. Contamination to the environment may result in the breeding source of vectors, odour and conflicts with communities. (b) Activities that may lead to health effects Increased solid waste and waste from the project operation

Environmental Report for submissionl to ADB Chapter 5 Pluak Daeng Power Plant Anticipated Environmental Impacts and Mitigations
RNP/ENV/P5028/FR (ADB)/RE62049-sec 5.3 Page 5-274
(c) Vulnerable groups to health effects Project staff and people living in the project vicinities (d) Consideration of the likelihood and severity of consequences 1. Consideration of likelihood
Project staff The project staff and workers who collect general waste and waste are most likely to be affected eventhough waste are segregrated by type and suitably collected according to the Notification of Ministry of Industry on disposal of waste or unusable materials, B.E. 2548. Moreover, workers are required to wear personal protection equipment (PPE) , such as rubber gloves, and protective clothing according to occupational health, safety and work environment. However, it is possible that the project staff are exposed to waste. Hence, the likelihood of cworkers and the project staff health effects will be at a moderate level ( 3 scores) . The strict impact prevention and mitigation measures shall be established.
People living in the project vicinities The systematic solid waste and waste management measures are available. For example, solid waste from the office building will be collected for disposal by local agencies. Other waste such as lubricant oil, air filter and resin will be sent for disposal by the authorized agency. As a result, the likelihood of people health effects will be at a moderate level (3 scores). Strict prevention and mitigation measures shall be established to mitigate exposure. 2. Consideration of severity of consequences
Project staff Severity of consequences on the project staff and operators will be at a moderate level (2 scores) because these people are likely to be directly exposed to waste, leading to injuries and the impact on power generation.
People living in the project vicinities The increase in solid waste and waste above may be harmful to health in case of direct exposure and accumulation in the body. However, suitable solid waste collection and disposal methods are provided by the project to prevent health effects on people living in the project vicinities.

Environmental Report for submissionl to ADB Chapter 5 Pluak Daeng Power Plant Anticipated Environmental Impacts and Mitigations
RNP/ENV/P5028/FR (ADB)/RE62049-sec 5.3 Page 5-275
As a result, severity of consequences on people will be at a moderate level (2 score). (e) Health risk assessment
Project staff The likelihood of the project staff to be exposed to hazardous waste will be at a moderate level (3 scores) . Exposure to hazardous waste will cause health effects. As a result, severity of consequences will be at a moderate level (2 scores). Significance level of health effects on the project staff wil be at a moderate level ( 6 scores) . Prevention and mitigation measures shall be established. Alternatively, existing Prevention and mitigation measures shall be improved.
People living in the project vicinities The likelihood of exposure will be at a moderate level (3 scores) . As exposure to hazardous waste can affect human health, severity of consequences will be at a moderate level (2 scores). Therefore, significance level of health effects will be at a moderate level (6 scores) . Prevention and mitigation measures shall be established. Alternatively, existing ย revention and mitigation measures shall be improved.
Transportation (a) Health effect characteristics During the operation phase, transportation of chemical substances, oil and the project staff to the project location may affect transportation in the project area and the project vicinities, cause accidents, injuries or deaths. Based on transportation impact assessment, the national highways which are the transportation route are in a good condition and do not affect traffic flow in the project vicinities. (b) Activities that cause health effects Transportation of chemical substances, oil and the project staff (c) Vulnerable groups to health effects Vulnerable groups to road traffic accidents during the operation phase include road users in the project vicinities and the project staff who commute from home to work in the project location.

Environmental Report for submissionl to ADB Chapter 5 Pluak Daeng Power Plant Anticipated Environmental Impacts and Mitigations
RNP/ENV/P5028/FR (ADB)/RE62049-sec 5.3 Page 5-276
(d) Consideration of the likelihood and severity of consequences 1. Consideration of likelihood
Project staff During the operation phase, the project staff and local people will commute on the same roads. However, as there will be only 60 projects staff, the likelihood of health effects will be at a low level (2 scores).
People living in the project vicinities According to the forecast of increased traffic during the operation phase in Section 4 .12: Transportation, traffic conditions will not be different from the existing conditions. That is there will be a very good traffic flow on the National Highway No. 331, the National Highway No. 36, the Rural Road Ror Yor 2026 and the Rural Road Ror Yor 3 013 . These roads have sufficient carrying capacity for increased traffic. Although the project staff and local people use the same roads, the likelihood of people health effects will be at a low level ( 2 scores) , i. e. low possibility with prevention and mitigation measures. 2. Consideration of severity of consequences
Project staff Severity of consequences on the project staff during the operation phase will be at a high level ( 3 scores) due to injuries, strike, impact on work and deaths.
People living in the project vicinities Since activities during the operation phase take a long time and accidents result in minor injuries, deformity or even deaths. Therefore, severity of consequences on people health effects will be at a high level (3 scores) due to injuries, impacts on communities or even deaths. (e) Health risk assessment
Project staff Severity of consequences on the project staff health effects will be at a high level (3 scores) and the likelihood will be at a low level (2 scores). Therefore, significance level of impact will be at a moderate level (6 scores). Prevention and mitigation measures shall be established. Alternatively, existing measures shall be improved.

Environmental Report for submissionl to ADB Chapter 5 Pluak Daeng Power Plant Anticipated Environmental Impacts and Mitigations
RNP/ENV/P5028/FR (ADB)/RE62049-sec 5.3 Page 5-277
People living in the project vicinities Severity of consequences on health effects of road users who use the same roads of the project staff will be at a high level (3 scores) and the likelihood will be at a low level ( 2 scores) . As a result, significance level of impact will be at a moderate level ( 6 scores) Prevention and mitigation measures shall be established. Alternatively, existing measures shall be improved.
Socio-economics (employment and employment of local people) The likelihood of employment will be at a moderate level (3). Qualified local people will have the priority for employment. This is to mitigate the impacts from migrant labours and increase benefits for communities, employment and job creation. Local employment and job creation will lead to better quality of life, better healthcare and better option for health service. Therefore, benefits for communities will be at a moderate level (2). Significance level of impact on local employment will be at a moderate level (6), which are positive impacts.
Occupational Health, Safety and work Environment (a) Health effect characteristics During the operation phase, an accident at work and on- the- job illness may occur, such as exposure to chemical substances, noise, heat, fire, boiler explosion, leaking oil tank, major hazard, etc. These may cause illness or deaths to operators or people living in the project vicinities. Because of the prolonged operation, if the work environment is unsuitable and if occupational health, safety and work environment regulations of the project is not adhered to, an accident at work and on-the-job illness may occur. (b) Activities that may lead to health effects During the operation phase, activities that may lead to health effects include
- Working with machinery - Office work, such as paperwork, working with computer,
brightly lit areas or dim ones, etc. - Working with chemical substances
(c) Vulnerable group to health effects The project staff are the vulnerable group to health effects.

Environmental Report for submissionl to ADB Chapter 5 Pluak Daeng Power Plant Anticipated Environmental Impacts and Mitigations
RNP/ENV/P5028/FR (ADB)/RE62049-sec 5.3 Page 5-278
(d) Consideration of the likelihood and severity of consequences 1. Consideration of likelihood
Project staff During the operation phase, accidents and illness may occur due to some activities, such as machine maintenance, working in noisy areas, dim areas or brightly lit ones, working in high heat areas, unsuitable ergonomics in the workplace, etc. These may be the cause of illness or even deaths. Pluak Daeng Power Plant Project realizes occupational health, safety and work environment for maximum safety during working hours. The main goal of the project is zero accident. Hence, the likelihood of the project staff health effects will be at a low level (2 scores) , i.e. low possibility with supporting data but prevention and mitigation measures are established by the project. 2. Consideration of severity of consequences
Project staff If an operator does not pay attention to or does not consider the safety while working, accidents at work may occur. The severity of accident may lead to injury or death. As a result, severity of consequences will be at a high level (3 scores), i.e. death and high cost for medical treatment. (e) Health risk assessment
Project staff The risk level of the project staff health effects will be at a moderate level ( 6 scores) . That is the prevention and mitigation measures shall be established. Alternatively, existing measures may be improved.
Public health service and the increase in migrant labours (a) Health effect characteristics and vulnerable groups During the operation phase, the number of project staff working in the project area, accidents and illness because of the project activities, transportation of chemical substances, staff and accidents at work as well as unexpected accidents will increase the burden of local public health facilities and affect local people who have medical treatment at such local public health facilities.

Environmental Report for submissionl to ADB Chapter 5 Pluak Daeng Power Plant Anticipated Environmental Impacts and Mitigations
RNP/ENV/P5028/FR (ADB)/RE62049-sec 5.3 Page 5-279
However, a suitable occupation health, safety and work environment plan, the evaluation and monitoring plan of implementation are provided. An infirmary will be provided for treatment of minor illness so as to reduce the burden of local public health facilities. Pre-placement examination and general health check-up will be provided for health promotion and accurate diagnosis by physicians. (b) Health risk assessment
Project Staff The likelihood of impacts on local public health facilities service because of illness or injuries will be at a moderate level (3). Because of these long-run impacts and the shortage of medical personnel and devices, severity of consequences will be at a moderate level (2). As a result, the health risk level will be at amoderate level ( 6 ) , which is acceptable but needed to strictly adhere to prevention and mitigation measures.
People living in the project vicinities The likelihood of impacts on local public facilities service will be at a moderate level (3). The project staff will receive medical treatment at these local public facilities, causing delay for general people. Because of these long-run impacts and the shortage of medical personnel and devices, severity of consequences will be at a moderate level (2). As a result, the health risk level will be at a moderate level (6), which is acceptable but needed to strictly adhere to prevention and mitigation measures.
Chemical substances Since acidic and basic chemical substances and scale and corrosion inhibitor, in solid and liquid forms will be used in the project. The leakage or residue of the substances will have direct impacts on the project staff health effects. Therefore, appraisal of health effect or health risk because of chemical exposure was performed. (a) Hazard identification Preliminary assessment of health risk is based on data collection from MSDS of each type of chemical substances and the data of health effects from U.S. EPA (www. epa. gov/ iris) . Physical and chemical properties of each chemical substances (Table 5.4.2-3) and chemical exposure routes (Table 5.4.2-4) and health effects from chemical exposure are taken into account.

Environmental Report for subm
issionl to ADB
Chapter 5
Pluak Daeng Power Plant Anticipated Environm
ental Impacts and M
itigations
RNP/ENV/P5028/FR (ADB)/RE62049-sec 5.3 Page 5-280
TABLE 5.4.2-3 PHYSICAL AND CHEMICAL PROPERTIES OF CHEMICAL SUBSTANCES USED IN PLUAK DAENG POWER PLANT PROJECT
Name of Chemical Substances (Trade Name)
Chemical Formula
Boiling Point (oC)
Melting Point (oC)
Vapor Pressure (millimeter of
mercury) at 20 oC
Specific Gravity
(water = 1)
Molecular Weight
(g/mole)
Autoignition Temperature
(oC)
Flash Point (oC)
Solubility (gram/100
ml.)
Appearance Color and Odor
1. Sodium Chlorite 25% NaClO2 - - - - 90.45 - - soluble Solid, white 2. Hydrochloric Acid 35% HCl 53 -74 - 1.1-1.19 - - - soluble Liquid, pale yellow,
pungent 3. Sodium Hydroxide 50% NaOH 1390 318 <18 2.13 40 - - 111 at 20 oC Liquid, colorless, odorless 4. Sodium MetaBisulfite
1% (Na2S2O5) * - - 300 - 1.48 - - - soluble Solid, white
5. RO Antiscalant (100%) - - - - - - - - - Solid, white 6. Sulfuric Acid 98% H2SO4 100 10 1 1.84 98.08 - - soluble Liquid, colorless, odorless 7. Citric Acid (15%) C6H8O7 - 155-157 - - - - - - Solid, colorless, odorless 8. Aqueous Ammonia 25% NH3 - -77 115 0.99 35.05 - - soluble Liquid, colorless, pungent 9. Trisodium Phosphate (Na3PO4.12H2O) - - - 1.62 - - - soluble Solid, white / colorless,
odorless 10. Scale and Corrosion
Inhibitor - - -5 - 1.14-1.30 - - - soluble Liquid, pale
yellow/brown subtle smell
11. Poly Aluminum Chloride
{Aln(OH)mCl3n-m} x - - - 1.15-1.25 - - - soluble Solid/Amber to Light Pale Yellow/Odorless
12. Scale Inhibitor - - -5 - 1.14-1.30 - - - soluble Liquid/LIght Yellow/Brown/Odorless
Remark: * Na2S2O5 + H2O NaHSO3 Sources: - Gulf PD Co., Ltd., 2019 - Center of Excellence on Hazardous Substance Management and Chulalongkorn University, 2016

Environmental Report for subm
issionl to ADB
Chapter 5
Pluak Daeng Power Plant Anticipated Environm
ental Impacts and M
itigations
RNP/ENV/P5028/FR (ADB)/RE62049-sec 5.3 Page 5-281
TABLE 5.4.2-4 CHEMICAL EXPOSURE ROUTE BY TYPE AND CHEMICAL INTAKE
Name of Chemical Substances (Trade Name) Chemical Intake
Skin Exposure Inhalation Eating or Swollowing Eye Exposure 1. Sodium Chlorite 25% 2. Hydrochloric Acid 35% 3. Sulfuric Acid 98% 4. Sodium Hydroxide 50% 5. Sodium Metabisulfite 1% 6. RO Antiscalant 100% 7. Citric Acid 15% 8. Aqueous Ammonia 25% 9. Trisodium Phosphate 10. Scale and Corrosion Inhibitor 11. Poly Aluminum Chloride 12. Scale Inhibitor
Sources : - Gulf PD Co., Ltd., 2019 - Center of Excellence on Hazardous Substance Management and Chulalongkorn University, 2016

Environmental Report for submissionl to ADB Chapter 5 Pluak Daeng Power Plant Anticipated Environmental Impacts and Mitigations
RNP/ENV/P5028/FR (ADB)/RE62049-sec 5.3 Page 5-282
En
viro
nm
en
tal R
ep
ort fo
r su
bm
ittal to
AD
B
C
ha
pte
r 5
Srira
ch
a P
ow
er P
lan
t Pro
ject G
ulf S
RC
Co
., Ltd
. An
ticip
ate
d E
nv
iron
me
nta
l Imp
ac
ts a
nd
Mitig
atio
ns
1. Sodium Chlorite (NaClO2) Skin exposure : Skin exposure will cause irritation and
burning pain. Inhalation : Inhalation of the vapor of this substance
will lead to breathing difficulty, lung destruction, and irritation of respiratory system.
Eating or swallowing : Eating or swollowing of this substance will cause gastrotestinal tract irritation, stomachach, diarrhea, vomit, ecchymosis and anemia
Eye exposure : Eye exposure will bring about eye irritation or burning eyes, conjunctivitis and eye tissue.
2. Hydrochloric Acid (HCl) Skin exposure : Skin exposure will cause irritation, rash
and burning pain. Exposure to high concentration hydrochloric acid will result in blister.
Inhalation : Inhalation of the vapor of this substance will lead to cough, breathing difficulty, nasal inflammation, pharyngitis and upper respiratory tract problems. In the severe case, it will cause pulmonary edema, respiratory failure and death.
Eating or swollowing: Eating or swollowing of this substance will cause irritation, burned mouth, throat, oesophagus, gastrotestinal tract irritation, nausea, vomit, diarrhea and death.
Eye exposure : Eye exposure will bring about eye irritation or burning eyes, conjunctivitis and eye tissue.

Environmental Report for submissionl to ADB Chapter 5 Pluak Daeng Power Plant Anticipated Environmental Impacts and Mitigations
RNP/ENV/P5028/FR (ADB)/RE62049-sec 5.3 Page 5-283
En
viro
nm
en
tal R
ep
ort fo
r su
bm
ittal to
AD
B
C
ha
pte
r 5
Srira
ch
a P
ow
er P
lan
t Pro
ject G
ulf S
RC
Co
., Ltd
. An
ticip
ate
d E
nv
iron
me
nta
l Imp
ac
ts a
nd
Mitig
atio
ns
Carcinogenicity : Prolonged exposure to the vapor of this substance will cause corrosion and corrosion activity. Those who have dermal disorders or eye diseases are susceptible to the vapor. This substance is not classified as carcinogen according to NTP but it is classified as carcinogen, Type 3 according to IARC
3. Sodium Hydroxide (NaOH) Skin exposure : Skin exposure will cause irritation. Inhalation : Inhalation of this substance will severely
destroy mucosa and the upper respiratory system.
Eating or swallowing : It will be hazardous. Eye exposure : Eye exposure will cause severe irritation
(burn). 4. Sodium Metabisulfite (Na2S2O5) Skin exposure : Skin exposure will cause irritation. Inhalation : Inhalation of this substance will bring
about mucosa irritation, cough and breathing difficulty.
Eating or swallowing : Eating or swallowing will cause the irritation of oral mucosa, trachea, oesophagus and the digestive system.
Eye exposure : Eye exposure will cause eye irritation. 5. RO Antiscalant Skin exposure : Skin exposure will cause irritation. Inhalation : Inhalation of this substance will bring
about irritation to the upper respiratory system.
Eating or swallowing : Eating or swallowing will be hazardous. Eye exposure : Eye exposure will cause irritation.

Environmental Report for submissionl to ADB Chapter 5 Pluak Daeng Power Plant Anticipated Environmental Impacts and Mitigations
RNP/ENV/P5028/FR (ADB)/RE62049-sec 5.3 Page 5-284
En
viro
nm
en
tal R
ep
ort fo
r su
bm
ittal to
AD
B
C
ha
pte
r 5
Srira
ch
a P
ow
er P
lan
t Pro
ject G
ulf S
RC
Co
., Ltd
. An
ticip
ate
d E
nv
iron
me
nta
l Imp
ac
ts a
nd
Mitig
atio
ns
6. Sulfuric Acid (H2SO4) Skin exposure : The corrosion activity of this substance
will cause burn and burning pain. Inhalation : The corrosion activity of this substance
will cause irritation to the respiratory system and the respiratory tract, pulmonary edema, sore throat, cough, breathing difficulty, and wheeze.
Eating or swallowing : Eating or swallowing this substance will cause nausea, vomit, etc.
Eye exposure : The corrosion activity of this substance will case bloodshort eyes, eye pain and blurred vision.
7. Citric Acid (C6H8O7) Skin exposure : Skin exposure will cause irritation. Inhalation : Inhalation of this substance will bring
about irritation to mucosa and the upper respiratory system.
Eating or swallowing : Eating or swallowing will be hazardous. Eye exposure : Eye exposure will cause severe irritation 8. Aqueous Ammonia (NH3) Skin exposure : Skin exposure will cause irritation and
burn. Inhalation : Inhalation of this substance will irritation
to the respiratory system, pulmonary edema and death.
Eating or swallowin : Eating or swollowing of this substance will cause irritation to oesophagus, stomach, peritonisis,nausea, vomit, diarrhea and unconciousness.
Eye exposure : Eye exposure will cause eye irritation and eye pain.

Environmental Report for submissionl to ADB Chapter 5 Pluak Daeng Power Plant Anticipated Environmental Impacts and Mitigations
RNP/ENV/P5028/FR (ADB)/RE62049-sec 5.3 Page 5-285
En
viro
nm
en
tal R
ep
ort fo
r su
bm
ittal to
AD
B
C
ha
pte
r 5
Srira
ch
a P
ow
er P
lan
t Pro
ject G
ulf S
RC
Co
., Ltd
. An
ticip
ate
d E
nv
iron
me
nta
l Imp
ac
ts a
nd
Mitig
atio
ns
9. Trisodium Phosphate (Na3PO4.12H2O) Skin exposure : Skin exposure will cause burn. Inhalation : Inhalation of this substance will bring
about irritation to mucosa and the upper respiratory system.
Eating or swallowing : Eating or swallowing will be hazardous. Eye exposure : Eye exposure will cause eye irritation. 10. Scale and Corrosion Inhibitor Skin exposure : Skin exposure will cause minor irritation. Inhalation : Inhalation of this substance will irritation
to the respiratory system. Eating or swallowing : Eating or swallowing will irritate the
stomach. Eye exposure : Eye exposure will cause eye irritation. 11. Poly Aluminum Chloride Based on MSDS, skin and eye directly exposure to Poly Aluminum Chloride in human will cause irritation; repeated skin exposure may cause dermatitis; and ingestion will cause irritation of mucous membrane brought into direct contact. There is no data in impacts on human. 12. Scale Inhibitor Based on MSDS, this substance causes irritation to the body in case of direct exposure. (b) Dose-response Assessment When exposed in large amount doses, a chemical substance will be harmful or cause illness, indicating by dose- response relationship from the study in laboratory animals, which assess dose-response in human. A chemical substance is classified into 2 groups: noncarcinogenic substance and carcinogenic substance in human. Chemical substances used in the project are categorized as follows: (b.1) Noncarcinogenic substance
1. Sodium Chlorite (NaClO2) - Acute Oral Toxicity (LD50) with the concentration of 165
mg/kg in a guinea pig.

Environmental Report for submissionl to ADB Chapter 5 Pluak Daeng Power Plant Anticipated Environmental Impacts and Mitigations
RNP/ENV/P5028/FR (ADB)/RE62049-sec 5.3 Page 5-286
En
viro
nm
en
tal R
ep
ort fo
r su
bm
ittal to
AD
B
C
ha
pte
r 5
Srira
ch
a P
ow
er P
lan
t Pro
ject G
ulf S
RC
Co
., Ltd
. An
ticip
ate
d E
nv
iron
me
nta
l Imp
ac
ts a
nd
Mitig
atio
ns
- Exposure of laboratory animal to Sodium Chlorite (NaClO2): LD50 for Sodium Chlorite (NaClO2) is 165 mg/kg, which makes 50% of guinea pig died.
2. Hydrochloric Acid (HCl) - Acute Oral Toxicity (LD50) with the concentration of 900
mg/kg in a rabbit - Exposure of laboratory animal: LD50 for hydrochloric acid
(HCI) is 900 mg/kg which makes 50% of rabbits died. 3. Sodium Hydroxide (NaOH)
Based on MSDS, direct exposure to sodium hydroxide (NaOH) in human will cause irritation but there is no data in laboratory animals and impacts on human.
4. Sodium Metabisulfite (Na2S2O5) - Acute Oral Toxicity (LD50) with the concentration greater
than 2,000 mg/kg in a guinea pig - Exposure of laboratory animal: LD50 for sodium
metabisulfite is greater than 2,000 mg/kg which makes 50% of guinea pig died.
5. RO Antiscalant - Oral Toxicity (LD50) with the concentration of 7,400 mg/kg
in a guinea pig - Exposure of laboratory animal: LD50 for RO Antiscalant is
7,400 mg/kg which makes 50% of guinea pig died. 6. Sulfuric Acid (H2SO4) - Acute Oral Toxicity (LD50) with the concentration of 2,140
mg/kg in a guinea pig - Acute Toxicity of the Dust (LC50) 1/ with the concentration
of 510 mg/m3 for 2 hours - Exposure of laboratory animal: LD50 for sulfuric acid is
2,140 mg/ kg which makes 50% of guinea pig died. Also, with the concentration of 510 mg/m3 for 2 hours, 50% of guinea pig died.
1/ The concentration of a chemical substance in the air that is likely to make half ( 50% ) of laboratory animals, that
inhales it in a specific period of time, die.
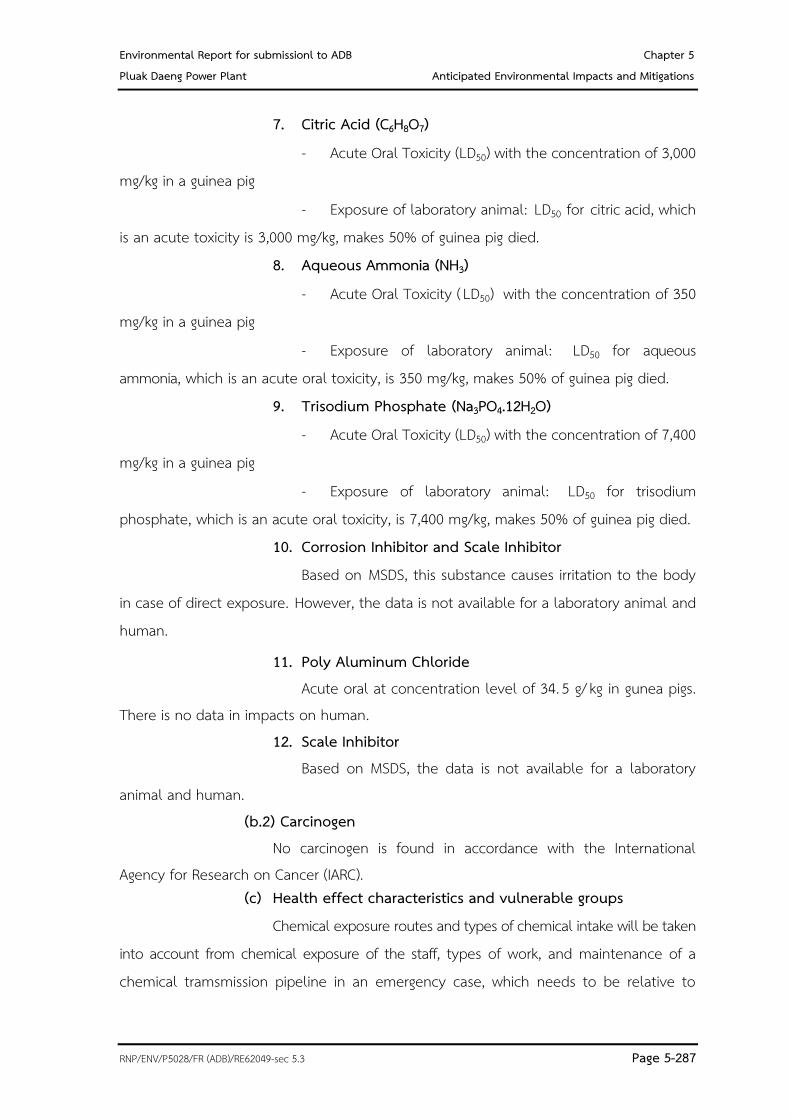
Environmental Report for submissionl to ADB Chapter 5 Pluak Daeng Power Plant Anticipated Environmental Impacts and Mitigations
RNP/ENV/P5028/FR (ADB)/RE62049-sec 5.3 Page 5-287
En
viro
nm
en
tal R
ep
ort fo
r su
bm
ittal to
AD
B
C
ha
pte
r 5
Srira
ch
a P
ow
er P
lan
t Pro
ject G
ulf S
RC
Co
., Ltd
. An
ticip
ate
d E
nv
iron
me
nta
l Imp
ac
ts a
nd
Mitig
atio
ns
7. Citric Acid (C6H8O7) - Acute Oral Toxicity (LD50) with the concentration of 3,000
mg/kg in a guinea pig - Exposure of laboratory animal: LD50 for citric acid, which
is an acute toxicity is 3,000 mg/kg, makes 50% of guinea pig died. 8. Aqueous Ammonia (NH3) - Acute Oral Toxicity (LD50) with the concentration of 350
mg/kg in a guinea pig - Exposure of laboratory animal: LD50 for aqueous
ammonia, which is an acute oral toxicity, is 350 mg/kg, makes 50% of guinea pig died. 9. Trisodium Phosphate (Na3PO4.12H2O) - Acute Oral Toxicity (LD50) with the concentration of 7,400
mg/kg in a guinea pig - Exposure of laboratory animal: LD50 for trisodium
phosphate, which is an acute oral toxicity, is 7,400 mg/kg, makes 50% of guinea pig died. 10. Corrosion Inhibitor and Scale Inhibitor
Based on MSDS, this substance causes irritation to the body in case of direct exposure. However, the data is not available for a laboratory animal and human.
11. Poly Aluminum Chloride Acute oral at concentration level of 34. 5 g/ kg in gunea pigs. There is no data in impacts on human. 12. Scale Inhibitor Based on MSDS, the data is not available for a laboratory animal and human. (b.2) Carcinogen No carcinogen is found in accordance with the International Agency for Research on Cancer (IARC). (c) Health effect characteristics and vulnerable groups Chemical exposure routes and types of chemical intake will be taken into account from chemical exposure of the staff, types of work, and maintenance of a chemical tramsmission pipeline in an emergency case, which needs to be relative to

Environmental Report for submissionl to ADB Chapter 5 Pluak Daeng Power Plant Anticipated Environmental Impacts and Mitigations
RNP/ENV/P5028/FR (ADB)/RE62049-sec 5.3 Page 5-288
En
viro
nm
en
tal R
ep
ort fo
r su
bm
ittal to
AD
B
C
ha
pte
r 5
Srira
ch
a P
ow
er P
lan
t Pro
ject G
ulf S
RC
Co
., Ltd
. An
ticip
ate
d E
nv
iron
me
nta
l Imp
ac
ts a
nd
Mitig
atio
ns
physical and chemical properties of each chemical substance. According to the review in Chapter 2, activities that cause chemical exposure include chemical transfer, use of chemical substance in the water treatment process, the wastewater treatment process, etc. The project staff or operators in nearby areas are likely to be exposed to a chemical substance through inhalation, skin, and eyes as well as accident from swallowing the chemical substance. Chemical exposure may cause irritation, or rash in the affected area. Moreover, swallowing or eating a chemical substance accidentally while working may cause a stomachache or vomit. However, occupational health, safety and the work environment measures are provided. For example, the staff are required to wear a personal protective equipment (PPE) suitable for each type of work, namely a dust mask or respirator mask, safety gloves, protective clothing, safety glasses, safety shoes, full face mask, eye shield, etc. Staff will be strictly supervised to use such equipment. Additionally, a washing area will be provided in a chemical storage area and the area where a chemical substance is used. Furthermore, MSDS and a kit for chemical leakage management, consisting of a chemical container, chemical absorbing material, etc. Also, a training on safety at work will be provided and awareness building will be made. (d) Capability to accept risk Base on occupational health, safety and the work environment measures, the likelihood of impact from exposure to a chemical substance will be at a moderate level (3). Severity of consequences will be at a high level (3) since a chemical intake can be through skin, inhalation, eating or swallowing and exposure to eyes which are hazardous. As a result, risk of chemical exposure will be at a moderate level (9) which is acceptable. However, health effect prevention and mitigation measures shall be established, or existing measures may be improved.
Mental health Staff
(a) Health effect characteristics The project operation may cause the project staff stress and anxiety as they work in the project area for a long time with heavy machinery operation, and air pollutant emissions. In addition, they are concerned about an unexpected event. Health effect matters that may lead to the mental health impact include an air quality (pollutant emissions) , noisy machines, solid waste and hazardous waste, accidents from

Environmental Report for submissionl to ADB Chapter 5 Pluak Daeng Power Plant Anticipated Environmental Impacts and Mitigations
RNP/ENV/P5028/FR (ADB)/RE62049-sec 5.3 Page 5-289
En
viro
nm
en
tal R
ep
ort fo
r su
bm
ittal to
AD
B
C
ha
pte
r 5
Srira
ch
a P
ow
er P
lan
t Pro
ject G
ulf S
RC
Co
., Ltd
. An
ticip
ate
d E
nv
iron
me
nta
l Imp
ac
ts a
nd
Mitig
atio
ns
transportation, occupational health, safety and the environment, the public health service system and exposure to a chemical substance. (b) Health impact assessment Despite the unavailability of mental health impact prevention and mitigation measures, activities will be performed under the occupational health, safety and the environment plan and legal requirements. Furthermore, the staff are required to wear a personal protective equipment, as appropriate. Also, a personal protective equipment is required to be regularly checked or based on the project’s safety procedure. A first aid unit and medical supplies as well as an ambulance shall be provided according to ministerial regulations on welfare facilities at workplaces, B. E. 2548 ( 2005) at the construction site, etc. During the operation phase and throughout the project life, there will be about 60 staff. As a result, the likelihood of health effects will be at a moderate level (3). Severity of consequences will be at a moderate level (2). Severity of accidents due to material and equipment transportation, occupational health, safety and the environment and exposure to a chemical substance will be at a high level ( 3 ) since these may lead to severe injuries and deaths. As a result, significance level of mental health and the livelihood of project staff impacts will be at a moderate level ( 6 - 9 ) , which is acceptable However, health effect prevention and mitigation measures shall be established, or existing measures may be improved.
People living in the project vicinities (a) Health effect characteristics and vulnerable group Changes in the air quality may cause anxiety and stress. Also, people may be concerned about an unexpected event to the project, the increased traffic on roads in the project area which may cause delay in travel and the risk in road accident. Furthermore, cultural difference and difference in the way of life of the project staff and local people may cause problems. Mental health problems are potentially increased in the study area. Nontheless, the employment of local people will mitigate the conflicts. Qualified local people will be employed as the first priority so as to lessen the impacts from migrant labours and increase benefits for communities.

Environmental Report for submissionl to ADB Chapter 5 Pluak Daeng Power Plant Anticipated Environmental Impacts and Mitigations
RNP/ENV/P5028/FR (ADB)/RE62049-sec 5.3 Page 5-290
En
viro
nm
en
tal R
ep
ort fo
r su
bm
ittal to
AD
B
C
ha
pte
r 5
Srira
ch
a P
ow
er P
lan
t Pro
ject G
ulf S
RC
Co
., Ltd
. An
ticip
ate
d E
nv
iron
me
nta
l Imp
ac
ts a
nd
Mitig
atio
ns
(b) Capability to accept risk Despite the lack of prevention andmitigation for mental health and the livelihood of local people impacts, the people sector is enhanced to monitor the project operation, especially the power plant environmental management, to mitigate people’s concerns and build the community confidence. As a result, this will be long run impacts. The likelihood of impacts will be at a moderate level (3) . Severity of consequences will be at a moderate level (2) . Therefore, significance level of the mental health and the livelihood of local people impacts will be at a moderate level (6). Mitigation Measures (1) Construction Period Public Health
First aid unit, basic medical supplies and an ambulance shall be provided in case of emergency according to the Ministerial Regulation of the Ministry of Labour concerning the Provision of Labour Welfare in Workplace, B.E.2548.
Clean drinking water shall be provided for construction workers. Sanitary toilets shall be provided for construction workers: 1 5
persons/unit. Before hiring workers, Contractor has the process to interview and carry
out health & physical check-up and request for medical check certificate to confirm that the person has no incurable disease and congenital disease which obstruct to work. Contractor will provide first aid facility at Project site and worker’ s accommodation. Local hospitals are used in case of emergency. All medical record will be maintained by Contractor at the project.
Construction workers shall be trained on hygiene and disease prevention, supervised for their behaviors, annoyance and narcotics.
2 health awareness raising events per year are held for local community members, including, if possible targeted measures for girl's education in WASH practices, HIV/AIDS and safety.
Contractors shall be supervised to follow the labour law on conducting health check-up and health check-up according to risk-factor related work.

Environmental Report for submissionl to ADB Chapter 5 Pluak Daeng Power Plant Anticipated Environmental Impacts and Mitigations
RNP/ENV/P5028/FR (ADB)/RE62049-sec 5.3 Page 5-291
En
viro
nm
en
tal R
ep
ort fo
r su
bm
ittal to
AD
B
C
ha
pte
r 5
Srira
ch
a P
ow
er P
lan
t Pro
ject G
ulf S
RC
Co
., Ltd
. An
ticip
ate
d E
nv
iron
me
nta
l Imp
ac
ts a
nd
Mitig
atio
ns
The list of construction workers shall be created. The number of construction workers and the congenital disease of the construction workers shall be notified to the responsible public facilities before starting operations.
Before the commencement of construction, construction workers, project staff, etc. should be trained on health issues and how to cope with severe accidents or emergencies.
Environmental sanitation shall be provided at workers’ camp and the construction site.
Adequate public utilities and facilities shall be provided for a temporary workers’ camp. Apart from this, the related standards or laws shall be followed, i.e. the Notification of Ministry of Public Health No. 7/2538 on the number of workers per space of workers’ camp, etc.
The accommodation of staff shall be provided according to the announcement of the Labour Welfare Committee on labour welfare measures for accommodation of workers for construction business.
Security and safety shall be provided at the workers’ camp. Construction workers’ behavior shall be closely controlled to prevent
nuisance and for the safety of nearby communities. Communicable disease surveillance shall be provided by local public
health agencies and the project. Contractors shall be supervised to strictly adhere to terms and
conditions, such as monitoring a worker’s camp, narcotics sampling, separating solid waste at the workers’ camp based on the monitoring method of sub- contractor’ s waste management.
Provide channel of complaints through the Environmental Impacts Monitoring Committee.
Contractors shall be supervised to coordinate with schools, especially a kindergarten to an elementary school, at least 6 months in advance in case construction workers want their children to attend schools in the project area.
Project will follow IFC Environmental, Health and Safety ( EHS) Guidelines, effective as of 30 April 2007, IFC Environmental, Health and Safety Guidelines
Environmental Report for submissionl to ADB Chapter 5 Pluak Daeng Power Plant Anticipated Environmental Impacts and Mitigations
RNP/ENV/P5028/FR (ADB)/RE62049-sec 5.3 Page 5-292
En
viro
nm
en
tal R
ep
ort fo
r su
bm
ittal to
AD
B
C
ha
pte
r 5
Srira
ch
a P
ow
er P
lan
t Pro
ject G
ulf S
RC
Co
., Ltd
. An
ticip
ate
d E
nv
iron
me
nta
l Imp
ac
ts a
nd
Mitig
atio
ns
for Thermal Power, effective as of 19 December 2008; and ADB's Safeguard Policy Statement (2009) Occupational Health, Safety and Environment Measures on General Safety
The agreement on occupational health and safety with the contractor shall be clearly identified
- The project determined that the contractor and team perform operation within the power plant in the contract. It is mandatory that the contractor adheres to the occupational health, safety and working environment measures in terms of design, construction and operation so as to comply with the standards and regulations of occupational health and safety.
- Knowledgeable personnel shall be assigned to be responsible for occupational health, safety and working environment.
- The project and the main contractor shall appoint the safety, occupational health and working environment committee. The committee shall cover the supervisors from sub- contractors of the project. The Environmental health, and safety manager shall directly report to the project manager. A meeting shall be organized at least once a month for evaluation and suggestions.
- First aid, basic medical supplies and an ambulance shall be provided in case of emergency according to Ministry of Labour regulation on Labour Welfare at workplace, B.E.2548.
- Personal Protective Equipment shall be regulary checked according to the manual for project safety procedures. Risks Mitigation Measures
A steel structure shall be installed for the Heat Recovery Steam Generator. Also, a walkway and a ladder shall be provided for stability and safety.
The insulation of the steam pipe system and hot water shall be installed for safety while operating.
Equipment installation and construction shall be performed by the reliable and experienced contractor. A safety officer shall supervise the operations for compliance with safe work practices. The installation shall be checked and tested whether it meets the standard by an engineer.

Environmental Report for submissionl to ADB Chapter 5 Pluak Daeng Power Plant Anticipated Environmental Impacts and Mitigations
RNP/ENV/P5028/FR (ADB)/RE62049-sec 5.3 Page 5-293
En
viro
nm
en
tal R
ep
ort fo
r su
bm
ittal to
AD
B
C
ha
pte
r 5
Srira
ch
a P
ow
er P
lan
t Pro
ject G
ulf S
RC
Co
., Ltd
. An
ticip
ate
d E
nv
iron
me
nta
l Imp
ac
ts a
nd
Mitig
atio
ns
Before the commissioning is performed, the safety of the Heat Recovery Steam Generator shall be checked also, the operating conditions of a safety valve shall be tested and controlled by the authorized engineer for boiler testing according to the Engineering Act. Fire control and fire fighting systems
The main contractor shall prepare adequate fire fighting equipment for operators working in the dangerous area or works related to heat with the risk of fire. For example, while welding, the welders shall always have chemical fire extinguisher at the work station. As for welding on a high place, an insulation shall be paved under the area of welding to prevent splash from falling beneath which is unsafe for those working beneath.
The main contractor shall prepare the cooperation plan with the local fire fighting agency for readiness in case of emergency.
The entrance-exit of dangerous area due to the construction work and traffic shall be controlled by a supervisor or a safety officer.
Working conditions and construction equipment shall be checked, especially in the area where danger or fire is likely to occur.
Fire fighting equipment shall be always checked according to the manual for project safety procedures. (2) Operation Period Public Health
First aid, basic medical supplies and an ambulance shall be provided in case of emergency according to Ministry of Labour regulation on Labour Welfare at Workplace, B.E.2548.
Pre-placement examination and the annual health check-up shall be provided for staff at lease once a year.
Health promotion activities shall be organized. Public relations campaign about environmental aspect and health issues for communities shall be done.
2 health awareness raising events per year are held for local community members, including, if possible targeted measures for girl's education in WASH practices, HIV/AIDS and safety
Local public health facilities shall be supported in terms of health promotion, rehabilitation, disease prevention and healthcare for communities.

Environmental Report for submissionl to ADB Chapter 5 Pluak Daeng Power Plant Anticipated Environmental Impacts and Mitigations
RNP/ENV/P5028/FR (ADB)/RE62049-sec 5.3 Page 5-294
En
viro
nm
en
tal R
ep
ort fo
r su
bm
ittal to
AD
B
C
ha
pte
r 5
Srira
ch
a P
ow
er P
lan
t Pro
ject G
ulf S
RC
Co
., Ltd
. An
ticip
ate
d E
nv
iron
me
nta
l Imp
ac
ts a
nd
Mitig
atio
ns
Morbidity survey on people living within 5 km. radius of the project location shall be conducted.
Project will follow IFC Environmental, Health and Safety ( EHS) Guidelines, effective as of 30 April 2007, IFC Environmental, Health and Safety Guidelines for Thermal Power, effective as of 19 December 2008; and ADB's Safeguard Policy Statement (2009) Occupational Health, Safety and Environment
The occupational health, safety and working environment committee shall be appointed to oversight operations. The occupational health, safety and working environment committee meeting shall be held at least once a month to evaluate, suggest solutions for problems, make improvements and promote occupational health, safety and working environment activities.
Manual for project safety procedures shall be established for reference while working and providing training for the power plant staff. This manual is consistent with the details of machinery and equipment installed in the power plant. The manual also complies with the Occupational Safety, Health and Environment Act. For example, the training course on safety at work will be provided for all new staff.
Adequate personal protective equipment, which is suitable for working conditions shall be provided for all staff.
First aid, basic medical supplies and an ambulance shall be provided in the power plant in case of emergency according to Ministry of Labour regulation on Labour Welfare at Workplace, B.E.2548.
Types and number of safety equipment shall be identified. The equipment shall meet the standards. The equipment shall be checked regularly for readiness.
Lighting systems: The Project shall provide a backup electrical system in case of emergency. Lighting systems shall be designed for safety purpose and adequate light while working.
Pre-placement examination and the annual health check-up shall be provided for staff.
A safety week activity shall be organized to urge and perform safety drills.

Environmental Report for submissionl to ADB Chapter 5 Pluak Daeng Power Plant Anticipated Environmental Impacts and Mitigations
RNP/ENV/P5028/FR (ADB)/RE62049-sec 5.3 Page 5-295
En
viro
nm
en
tal R
ep
ort fo
r su
bm
ittal to
AD
B
C
ha
pte
r 5
Srira
ch
a P
ow
er P
lan
t Pro
ject G
ulf S
RC
Co
., Ltd
. An
ticip
ate
d E
nv
iron
me
nta
l Imp
ac
ts a
nd
Mitig
atio
ns
A fire protection system and fire fighting system shall be provided by the power plant according to National Fire Protection Association (NFPA) and related requirements and standards.
The fire fighting system shall be always checked according to the manual for project safety procedures.
An emergency shall be established for operations in emergency cases. Emergencies can be divided into 3 levels (as illustrated in Figure 9-4).
- Emergency Level One: It means the emergency that occurs in the power plant area. The emergency coordinator can control the situation. Damage can be limited by staff, workers and equipment available in the power plant until the situation returns to normal conditions.
- Emergency Level Two: It means the emergency that occurs inside the power plant. When the emergency coordinator evaluates that the incident can not be controlled, request for assistance from emergency response team of the power plant shall be made.
- Emergency Level Three: It means the emergency that occurs inside and outside the power plant. When the emergency coordinator evaluates that the emergency plan for the emergency level two is incapable, request for assistance shall be made in terms of manpower and equipment from Pluak Daeng Industrial Park to control the situation.
The annual emergency drill shall be performed for the power plant itself and together with Pluak Daeng Industrial Park. Moreover, training on emergency preparedness and response shall be provided for personnel at least once a year. Diesel fuel transfer measures
Training on the practice according to the emergency plan - Environmental Health & Safety (EH&S) Committee shall provide
the staff the training on working regulations, work instructions and related documents. In case of changes in the details of working regulations / support documents in relation to emergency preparedness, and emergency prevention and suppression, EH&S Committee shall notify all staff.
Oil leakage prevention

Environmental Report for submissionl to ADB Chapter 5 Pluak Daeng Power Plant Anticipated Environmental Impacts and Mitigations
RNP/ENV/P5028/FR (ADB)/RE62049-sec 5.3 Page 5-296
En
viro
nm
en
tal R
ep
ort fo
r su
bm
ittal to
AD
B
C
ha
pte
r 5
Srira
ch
a P
ow
er P
lan
t Pro
ject G
ulf S
RC
Co
., Ltd
. An
ticip
ate
d E
nv
iron
me
nta
l Imp
ac
ts a
nd
Mitig
atio
ns
- The division/department that has to deal with oil shall follow the fuel oil unloading procedure.
- The operator who handle oil shall work carefully to prevent oil spill to the outside environment. The operator shall follow the fuel oil unloading procedure and MSDS.
Preparation/ inspection of equipment in case of emergency: The following equipment shall be prepared for emergency.
- Personal protective equipment, such as rubber gloves, mask, air filter mask or other absorbing materials, as appropriate, such as sand, sawdust, cloth, or other materials having absorbing property or preventing oil diffusion. The operator who deals with oil shall operate carefully to prevent oilspill to the outside environment. The fuel oil unloading procedure and MSDS shall be follow.
- Suitable personal protective equipment, such as rubber gloves, mask, air filter mask or other absorbing materials
- The container of contaminated oil, drums, valves, and safety valves shall be checked on a monthly basis by the qualified person required by law
The following materials shall be prepared all the time in response to emergency.
- In case of small oil leak The person who notice an abnormal situation shall solve the
problem shortly. Scatter sand, sawdust, or other materials prepared by the
division/department around the area of oil leak to limit the boundary of oilspill. Shortly notify the supervisor and the responsible staff to
suppress the event. Use remnant of cloth or oil absorbing material to clean the
area of oil leak. Compile all materials used for oil leak control and dump
them into a hazardous waste container (according to solid waste management procedure). Clean the area of oil leak to prevent environmental impacts. The supervisor and the responsible person of the area where
oil leaks organize the meeting to prevent the recurrence

Environmental Report for submissionl to ADB Chapter 5 Pluak Daeng Power Plant Anticipated Environmental Impacts and Mitigations
RNP/ENV/P5028/FR (ADB)/RE62049-sec 5.3 Page 5-297
En
viro
nm
en
tal R
ep
ort fo
r su
bm
ittal to
AD
B
C
ha
pte
r 5
Srira
ch
a P
ow
er P
lan
t Pro
ject G
ulf S
RC
Co
., Ltd
. An
ticip
ate
d E
nv
iron
me
nta
l Imp
ac
ts a
nd
Mitig
atio
ns
- In case of large oil leakage The person who notice an abnormal situation shall
immediately notify the supervisor or the responsible person of the area and involved persons to fix the problem.
The area of large oil leak shall be enclosed to prevent diffusion to a broader area and to make it convenient for control.
The operator who controls oil leak shall be in the windward side to avoid air vapour. The operator shall wear safety equipment, such as a vapor prevention mask.
Oil leak suppression shall be in accordance with the oil leak prevention and response plan. Safety measures for transport of chemicals The operators of hazardous chemicals or objects shall adhere to the manual for project safety procedures for safe transport and the safety of communities, assets and the environment. Related laws and standards shall be followed. These include manual for transport of hazardous objects of Pollution Control Department, September 2011, manual for hazardous chemical management and handling in the place of business, July 2013 and the Notification of Department of Industrial Works on manual for storage of hazardous chemicals and objects, B. E. 2 5 50 and notification of Ministry of Industry on transport of hazardous objects under Department of Industrial Works, B.E.2558, such as
Applying for transportation permit Affixing a label and tag on a chemical transport truck that meets the
requirements of Department of Land Transport Separating and transporting chemicals in an appropriate and safe
manner Preparing shipping paper Preparing Material Safety Data Sheet (MSDS) based on the properties
of specific material both in Thai and English Providing personal protective equipment on a chemical transport truck Providing training on the hazard of transported chemicals and skills for
safe driving while transporting chemicals for drivers. Also, drivers shall be trained on a preliminary solution in case of emergency

Environmental Report for submissionl to ADB Chapter 5 Pluak Daeng Power Plant Anticipated Environmental Impacts and Mitigations
RNP/ENV/P5028/FR (ADB)/RE62049-sec 5.3 Page 5-298
En
viro
nm
en
tal R
ep
ort fo
r su
bm
ittal to
AD
B
C
ha
pte
r 5
Srira
ch
a P
ow
er P
lan
t Pro
ject G
ulf S
RC
Co
., Ltd
. An
ticip
ate
d E
nv
iron
me
nta
l Imp
ac
ts a
nd
Mitig
atio
ns
Safety measures for chemical storage Regarding safety measures for chemical storage, Pluak Daeng Power Plant shall follow the Notification of Department of Industrial Works on manual for storage of hazardous chemicals and objects, B.E.2550 and manual for hazardous chemical management and handling, July 2013, such as
Preparing Material Safety Data Sheet (MSDS) about the characteristics of hazardous objects both in Thai and English
Categories of hazardous object: Category 1 (The criteria and established method shall be followed.), Category 2 (The competent authority shall be notified before following the criteria and established method. ) Category 3 (A license shall be obtained. ) and Category 4 (Manufacturing, sale or possession shall be prohibited.)
The storage place and storage method of hazardous chemicals shall be safe based on the nature or properties of hazardous chemicals. Measures for safe use of chemical substances With regards to measures for safe use of chemical substances, Pluak Daeng Power Plant Project shall adhere to OSHA standard and the ministerial regulations on the management, handling, and operation of safety, occupational health and working environment on hazardous chemicals, B.E.2556. Details of such measures are provided in manual for project safety procedures. Details consist of
Preparing Material Safety Data Sheet (MSDS) about the characteristics of hazardous objects both in Thai and English. MSDS shall be available in working area
Installing the prohibition sign, instruction sign or warning sign for working with hazardous chemicals in a public place
Providing places and equipment for safety in working area for hazardous chemicals such as emergency eye wash, face and hand wash basin, and emergency showers
Providing personal protective equipment for staff according to the hazards and severity of chemicals or the nature of work to prevent hazards that are likely to occur
Establishing preventive measures for chemicals in the storage place of hazardous chemicals; establishing preliminary measures for remedy of hazards, such as an appropriate ventilation system; preventing the potential cause of fire; constructing a dike

Environmental Report for submissionl to ADB Chapter 5 Pluak Daeng Power Plant Anticipated Environmental Impacts and Mitigations
RNP/ENV/P5028/FR (ADB)/RE62049-sec 5.3 Page 5-299
En
viro
nm
en
tal R
ep
ort fo
r su
bm
ittal to
AD
B
C
ha
pte
r 5
Srira
ch
a P
ow
er P
lan
t Pro
ject G
ulf S
RC
Co
., Ltd
. An
ticip
ate
d E
nv
iron
me
nta
l Imp
ac
ts a
nd
Mitig
atio
ns
to prevent the leak of hazardous chemicals from the storage place and providing drains for spills for safe disposal. Drains for spills shall be separated from the drainage system
Establishing preventive and control systems so that the atmospheric concentrations of hazardous chemicals in the workplace or the storage place shall not exceed the limits
Measuring and analyzing the atmospheric concentrations of hazardous chemicals of the workplace and storage place
Preparing fire fighting equipment and appropriate medical supplies for first aid
Assigning the responsible person ( chemist) for improvement of chemical safety plan
The chemist and Environmental health and safety manager shall check and create a hazardous chemical checking plan for each working area. The hazardous chemical checking plan shall be reviewed and updated at least once a year
Providing training for staff working with chemicals on how to use chemicals safely and guidelines for prevention and check of chemical leak
5.4.3 Construction Site Lighting In the construction phase, the project will have construction activities that do not cause noise during the night, such as frame structure, steel rod-tied activities, etc. To conduct those activities during the night, the project will provide sufficient lighting for illuminating the working area on the site itself. The illumination radius covers only the work area which is in the project area. Therefore, the impact on nearby areas is low.

Environmental Report for submission to ADB Chapter 5 Pluak Daeng Power Plant Anticipated Environmental Impacts and Mitigations
RNP/ENV/P05028/FR (ADB)/RE62049-sec 5.5 Page 5-300
5.5 MAJOR HAZARD ASSESSMENT
5.5.1 Introducttion The main fuel used in generating electricity in the project is natural gas and diesel is used as reserved fuel. Also, chemical substances are used in water quality enhancement. Accidental release of these fuels and chemical substances may incur environmental impacts due to their toxic, flammable or explosive properties. Apart from the properties and amount of the fuel or chemical substance accidentally released, the hazard level depends on the storage place and condition. Furthermore, in the event of the project’ s mechanical failure, there is likelihood of harm caused to property and life, which may occur not only in the project boundary but also the communities in the vicinity. It is necessary that the project be planned, organized, managed, and executed in a systematic and exacting manner to minimize the likelihood of such hazards. Major hazard assessment is thus conducted to identify potential hazards and their severity levels. Measures developed for the project with a view to forestalling the potential hazards identified range from the designing to the operational management processes, including installing the safety equipment in compliance with international standards.
5.5.2 Methodology Guidelines from relevant organizations such as the World Bank and the American Petroleum Institute ( API) are used in the major hazard assessment. The process and approaches involved are as shown in Figure 5.5.2-1.
5.5.3 R i s k a nd Hazard Assessment of Natural Gas ( Primary Fuel) and Diesel (Reserve Fuel) for Power Generation
The study of hazard assessment followed guidelines provided by relevant organizations, namely World Bank and American Petroleum Institute (API). Natural gas and diesel are the primary fuel and reserve fuel source, respectively. The route of natural gas and diesel pipeline, pipe diameter, pressure, temperature, total length of pipeline, and properties of diesel tank are as shown in Table 5. 5. 3-1 to Table 5. 5. 3-3. The impact assessment of the leakage and ignition of natural gas and diesel were carried out as details below.

Environmental Report for submission to ADB Chapter 5 Pluak Daeng Power Plant Anticipated Environmental Impacts and Mitigations
RNP/ENV/P05028/FR (ADB)/RE62049-sec 5.5 Page 5-301
Process Approach
Hazard Identification
Revision/check from Project details
Operational procedures
Measures regulating the project’s
operational process
Scenario Assumption Review of literature concerning
Operational procedures Project details Chemicals transported
In accordance with guidelines from the
World Bank/API/US.EPA By referring to relevant research
documents/papers/ reports By referring to past operating
results By referring to statistics on
mishaps of similar projects By calculation
Probability Analysis
Consequence Analysis
Risk Analysis
Deliberation on the measures/plans to tackle the possible failures identified
Formulation guidelines/
measures to prevent/mitigate the
impact incurred by the possible failures identified
FIGURE 5.5.2-1 : DIAGRAM SHOWING THE SCOPE AND PROCESS OF MAJOR HAZARD
ASSESSMENT

Environmental Report for subm
ission to ADB Chapter 5
Pluak Daeng Power Plant Anticipated Environm
ental Impacts and M
itigations
RNP/ENV/P05028/FR (ADB)/RE62049-sec 5.5 Page 5-302
TABLE 5.5.3-1 SPECIFICATION OF NATRUAL GAS PIPELINE OF PLUAK DAENG POWER PLANT
Section Beginning Point End Poing Number of Pipeline Length
(m)
Pipe Diameter
(inch)
Pressure (barg) Temperature (oC)
Design Operate Design Operate
1. Sale Tap Gas Metering Station
1 170 28 86.2 34.5 ~ 86.2 (500 psig ~ 1,250 psig)
65.6 15.6 ~ 48.9 (60 degF ~ 120 degF)
2. Gas Metering Station
Fuel Gas Compressor
1 (Fuel Gas Compressor #1) 80 12 57 31.0 ~ 32.4 (450 psig ~ 470 psig)
50 15.6 ~ 28.3 (60 degF ~ 83 degF)
2 (Fuel Gas Compressor#2) 80 12 57 31.0 ~ 32.4 (450 psig ~ 470 psig)
50 15.6 ~ 28.3 (60 degF ~ 83 degF)
3 (Fuel Gas Compressor #3) 80 12 57 31.0 ~ 32.4 (450 psig ~ 470 psig)
50 15.6 ~ 28.3 (60 degF ~ 83 degF)
4 (Fuel Gas Compressor#4) 80 12 57 31.0 ~ 32.4 (450 psig ~ 470 psig)
50 15.6 ~ 28.3 (60 degF ~ 83 degF)
Total length of 4 pipes 320 - 3. Fuel Gas
Compressor Pass through Flow Meter to
Fuel Gas Heater
1 (Fuel Gas Heater #1) 270 10 57 47.7 120 70 2 (Fuel Gas Heater #2) 170 10 57 47.7 120 70 3 (Fuel Gas Heater #3) 180 10 57 47.7 120 70 4 (Fuel Gas Heater #4) 300 10 57 47.7 120 70
Total length of 4 pipes 920 - 4. Fuel Gas
Heater Gas Turbine 1 (Gas Turbine #1) 50 10 57 47.7 370 325
2 (Gas Turbine #2) 50 10 57 47.7 370 325 3 (Gas Turbine#3) 50 10 57 47.7 370 325 4 (Gas Turbine #4) 50 10 57 47.7 370 325
Total length of 4 pipes 200 - Grand Total Length 1,610 -
Source : Gulf PD Co., Ltd., 2019

Environmental Report for subm
ission to ADB Chapter 5
Pluak Daeng Power Plant Anticipated Environm
ental Impacts and M
itigations
RNP/ENV/P05028/FR (ADB)/RE62049-sec 5.5 Page 5-303
TABLE 5.5.3-2 SPECIFICATION OF DIESEL OIL PIPELINE OF PLUAK DAENG POWER PLANT
Section Beginning Point End Point Number of Pipeline Length (m)
Pipe Diameter
(inch)
Pressure (barg) Temperature (oC)
Design Operate Design Operate
1 Fuel Oil Storage Tank
Fuel Oil Transfer Pump
1 150
14
4 1 60 30
2 Fuel Oil Transfer Pump
End point to 10-inch pipeline
1 1,100
10 14 6 60 30
3 Branching point to Gas Turbine
Main Fuel Oil Pump 1 (Main Fuel Oil Pump #1) 200 8 14 6 60 30 2 (Main Fuel Oil Pump #2) 200 8 14 6 60 30 3 (Main Fuel Oil Pump #3) 140 8 14 6 60 30 4 (Main Fuel Oil Pump #4) 140 8 14 6 60 30
Total length of 4 pipelines 680 4 Main Fuel Oil
Pump Gas Turbine 1 (Gas Turbine #1) 30 6 120 100 60 30
2 (Gas Turbine #2) 30 6 120 100 60 30 3 (Gas Turbine #3) 30 6 120 100 60 30 4 (Gas Turbine #4) 30 6 120 100 60 30
Total length of 4 pipelines 120 - Grand total of pipe 2,050 -
Source : Gulf PD Co., Ltd., 2019

Environmental Report for submission to ADB Chapter 5
Pluak Daeng Power Plant Anticipated Environmental Impacts and Mitigations
RNP/ENV/P05028/FR (ADB)/RE62049-sec 5.5 Page 5-304
TABLE 5.5.3-3 SPECIFICATION OF DIESEL OIL STORAGE TANK OF PLUAK DAENG POWER PLANT
Tank Diameter
(m) Height
(m) Volume
(m3) Diameter of Connecting
Pipeline (inch) 1 45 15 21,250 14
2 45 15 21,250 14 Remark : Diesel oil is stored at atmospheric storage tank. Source : Gulf PD Co., Ltd., 2019
(1) Study Model The study employed the mathematical model - BREEZE Incidents Analyst, which developed under the principle of Quantitative Risk Assessment (QRA) by Trinity Consultants Inc., USA. This model is recognized by the U.S. EPA and relevant agencies for analyzing the amount of chemical from leakages in various situations prior to conducting the assessments for dispersion, fire, and explosion and establishing an emergency response plan. (2) Hazard Classification The hazard classification method follows the same technique outlined in the paper “Techniques for Assessing Industrial Hazards a Manual (1990)” of by World Bank and American Petroleum Institute Techniques and the paper “ Risk- Based Inspection Technology; API Recommended Practice 581, 2nd edition, September 2008” . Details are as follows:
1) Potential leakage areas such as weld joints area or area accessible by the third party, etc.
2) Type of leakage: there are two types of leakage, namely instantaneous release and continuous release
3) Ignition: there are two types of ignition, namely immediate ignition and delayed ignition
4) Fire can be classified into four types as follows: - Pool Fire: This type of fire is started at a storage tank or due to
spillage of flammable substance that spreads into a large circle on the ground. The circle of fire depends on the scale of the cross-sectional area of flammable substance

Environmental Report for submission to ADB Chapter 5
Pluak Daeng Power Plant Anticipated Environmental Impacts and Mitigations
RNP/ENV/P05028/FR (ADB)/RE62049-sec 5.5 Page 5-305
- Jet Fire: This type of fire usually occurs as a result of an ignition of flammable substance in a pressurized storage tank. In this situation, the flammable substance is rapidly released into the atmosphere. The intensity of a jet fire depends on volume and pressure of the flammable substance, which could result in a larger or longer jet fire.
- Fireball and BLEVE (Boiling Liquid Expanding Vapor Explosion): This type of fire usually occurs due to the presence of heat near a flammable substance storage tank. As a result, the storage tank gets hotter, causing the internal pressure to rise. The tank is eventually torn apart, releasing the flammable substance to the atmosphere, in turn causing the fire to turn into a large fireball
- Flash Fire: This type of fire is caused by leakage of chemical into the atmosphere. The chemical turns to vapor cloud that later ignites but not explode. (3) Identifying assumptions for natural gas/diesel leakage (a) The probability of leakage of natural gas/diesel transmission pipelines and diesel storage tank
A risk analysis of the project’ s natural gas and diesel pipeline system and diesel storage tank was based on the incident frequency reported in the paper “API Recommended Practice 581: Risk Base Inspection Technology, 2008” published by American Petroleum Institute (API), as shown in Table 5.5.3-4. For a pipeline, the highest frequency of incidents is observed when the leak size is one inch. For a fuel storage tank, the highest frequency of incidents is seen when the leak size in 0.25 inch. Therefore, the study findings of impact assessment were
based on the scenarios that give the highest probability of occurrence (leakage diameter
of 1 inch and 0.25 inch); the broken pipe was used as the worst case scenario. (b) Release Characteristics In determining the severity of the impact of leakage and ignition, two types of release were considered in the study:
- Instantaneous Release occurs when there is a moderate leak size or larger. The release exceeds 10,000 pounds in 3 minutes or is caused by serious damage and rupture of pipeline/tank. This could cause fire immediately.
- Continuous Release lasts longer than instantaneous release. It is caused by a smaller leak or a release that is less than 10,000 pounds in 3 minutes.

Environmental Report for submission to ADB Chapter 5
Pluak Daeng Power Plant Anticipated Environmental Impacts and Mitigations
RNP/ENV/P05028/FR (ADB)/RE62049-sec 5.5 Page 5-306
TABLE 5.5.3-4 FREQUENCY OF MISHAPS OF PIPE AND VARIOUS SIZES OF
PIPELINE SUGGESTED BY API
Pipe Diameter (inch) Frequency of Leakage (times/yr)
Hole size 0.25 inch
Hole size 1 inch
Hole size 4 inch Rupture
Piping, 1 inch diameter 2.8010-5 0 0 2.6010-6 Piping, 2 inch diameter 2.8010-5 0 0 2.6010-6 Piping, 4 inch diameter 8.00 10-6 2.0010-5 0 2.6010-6 Piping, 6 inch diameter 8.00 10-6 2.0010-5 0 2.6010-6 Piping, 8 inch diameter 8.00 10-6 2.0010-5 2.0010-6 6.0010-7 Piping, 10 inch diameter 8.00 10-6 2.0010-5 2.0010-6 6.0010-7 Piping, 12 inch diameter 8.00 10-6 2.0010-5 2.0010-6 6.0010-7 Piping, 16 inch diameter 8.00 10-6 2.0010-5 2.0010-6 6.0010-7 Piping, >16 inch diameter 8.00 10-6 2.0010-5 2.0010-6 6.0010-7 Tank650/TANKBOTTOM 7.00 10-4 0 0 2.0010-6
Remark : 1/ Rupture : Use pipe diameter with a maximum length no greater than 16 inches Source : Adapt from API Recommnded Practice 581: Risk Base Inspection Technology, 2008 (c) Leak Size The pipeline leakage sizes in this study follow to the guidelines of American Petroleum Institute (API) , which specifies 4 leak sizes − small, moderate, large, and pipe breakage as shown in Table 5.5.3-5.
Table 5.5.3-5
PIPE LEAKAGE SIZE ACCORDING TO AMERICAN PETROLEUM INSTITUTE (API) STANDARDS
Leakage Size Consideration Range Value Used Small 0 - 0.25 inch 0.25 inch
Medium 0.25 – 2 inches 1 inch
Large 2 - 6 inches 4 inches
Broken > 6 inches Use pipe diameter with a maximum length no greater than 16 inches
Source: Adapted from API Recommended Practice 581: Risk Base Inspection Technology, 2008

Environmental Report for submission to ADB Chapter 5
Pluak Daeng Power Plant Anticipated Environmental Impacts and Mitigations
RNP/ENV/P05028/FR (ADB)/RE62049-sec 5.5 Page 5-307
(d) Release Duration Both Detection System and Isolation System were used for determining the duration of risk assessment of natural gas/diesel transmission pipelines at the project site. The study followed the guidelines of American Petroleum Institute (API) as written in API Recommended Practice 581: Risk Base Inspection Technology, 2008. The control and monitoring of natural gas/diesel transmission pipeline system of the project employ a detection system of methane gas and oil vapor leaks at the connecting joints of transmission pipelines. If the leakage of natural gas or diesel is detected, the isolation system will be activated immediately. This system is classified as Class A detection and isolation system, based on criteria stated in the publication mentioned above. American Petroleum Institute (API) suggested specifying the release duration for risk assessment of pipeline transmission system that has the Class A detection and isolation systems. For the assessment using leak sizes of 4 inches, 1 inch and 0. 25 inch, it is advised to set the release duration of natural gas/diesel at 5, 10, and 20 minutes. For the scenario where the pipe is broken, set the release duration at 3 minutes. The assessment revealed that a 1-inch leak size had the highest possibility of occurrence; the broken pipe was considered herein the worst case scenario. Thus, the assessment was based on the release duration of natural gas/ diesel pipelines from the pipe at 10 and 3 minutes. The leakage of diesel storage tank will be detected by the isolation system, which is manually controlled by the operation staff. This is considered as Class B. In case of assessment of leak sizes of 4 inches, 1 inch, and 0.25 inch, the release duration of diesel fuel will be set at 10, 20, and 30 minutes. For the broken pipe scenario, set the release duration at 10 minutes, equivalent to 4-inch leak. The assessment indicated that a 0. 25- inch leak size had the highest possibility of occurrence; the broken pipe was considered herein the worst case scenario. Thus, the risk assessment was made based on leak time of diesel storage tank at 30 and 10 minutes. (e) Meteorological conditions
Meteorological condition is a factor influencing the nature of toxic substance dispersion from its origin to the receptor. How severe the incident is depends on meteorological factors. According to the Guidance on the Application of Refined Dispersion Models for Hazardous/Toxic Air Releases US. EPA (1993) , the meteorological

Environmental Report for submission to ADB Chapter 5
Pluak Daeng Power Plant Anticipated Environmental Impacts and Mitigations
RNP/ENV/P05028/FR (ADB)/RE62049-sec 5.5 Page 5-308
factors affecting and involving dispersion of toxic substance include the wind speed, atmospheric stability, temperature, relative humidity, and air pressure. In the risk analysis of major hazards caused by accidental release and consequent ignition in the project’ s natural gas/diesel transmission pipeline, 13- year meteorological statistics from 2006 to 2018 ( Meteorological Department, 2019) were collected from Huay Pong Air quality monitoring Station, as this is the station nearest to the project location. The details of input data used in the mathematical model are as follows:
Average wind speed – 1.1 knots
Average temperature – 28.0 oC
Average relative humidity – 77.0%
Average atmospheric pressure - 1009.32 hPa
(f) Severity of incident
Determination of severity of incident considers impact magnitude of heat radiation radius and pressure from leak and ignition by using model called BREEZE Incidents Analyst. Likelihood of leak of gas ( C1- C2) and liquid ( C9- C16) from API Recoomended Practice 581: Risk Base Inspection Technoligy (2008) is shown in Table 5.5.3-6 and Table 5.5.3-7 and can be concluded as follow:
- Impact evaluation of leak and ignition in form of jet fire, pool fire and fireball considers heat energy which is measured as energy per area. The impacts of fire at each level of heat energy are shown in Table 5.5.3-8.
- Impact evaluation of leak and ignition in form of vapor cloud exp;osion (VCE) considers pressure caused from explosion as classified in Table 5.5.3-9.
- Impact evaluation of leak and ignition in form of flash fire which occurs from leaking gas into atmosphere becoming vapor cloud and ignite later. The fire is flash, but it does not cause explosion because of insufficient pressure to cause explosion and rapid occurrence of flash fire. Therefore, its impact is assessed by calculation of the maximum radius where concentration of leaking gas equals to lower flammable limit (LFL) of methane (CH4) (50,000 ppm) referred to chemical database of BREEZE Incidents Analyst. Methane has the lowest LFL at atmospheric stability class F with wind speed of 1. 5 m/ s which is the condition promoting maximum concentration from dispersion. Hence, the area in this radius considers as affected area.

Environmental Report for submission to ADB Chapter 5
Pluak Daeng Power Plant Anticipated Environmental Impacts and Mitigations
RNP/ENV/P05028/FR (ADB)/RE62049-sec 5.5 Page 5-309
TABLE 5.5.3-6
PROBABILITY OF INCIDENT OF GAS (C1-C2)
Leakage
Probability of incident
Probabilityof leak and ignition
No Ignition
Ignition Vapor Cloud
Explosion (VCE)
Fireball Flash Fire
Jet Fire
Pool Fire
instantaneous release 0.8 0.2 0.04 0.01 0.15 - - continuous release 0.8 0.2 0.04 - 0.06 0.1 -
Source : Adapted from API Recommnded Practice 581: Risk Base Inspection Technology, 2008
TABLE 5.5.3-7
PROBABILITY OF INCIDENT OF LIQUID (C9-C16)
Release
Probability of incident
Probabilityof leak and ignition
No Ignition
Ignition Vapor Cloud
Explosion (VCE)
Fireball Flash Fire
Jet Fire
Pool Fire
instantaneous release 0.95 0.05 - - - - 0.05
continuous release 0.95 0.05 - - - 0.01 0.04
Source : Adapted from API Recommnded Practice 581: Risk Base Inspection Technology, 2008
TABLE 5.5.3-8
IMPACTS OF FLAMING AT VARIOUS LEVELS OF HEAT ENERGY Heat energy Type and size of impact
level (kW/m2) Impact on devices Impact on human
37.5 Destroy equipments in the manufacturing process
100 %death if present in the area for 1 minand 1 % death if present in the area for 10 sec
25.0 Burning of wooden structures without flame
100 %death if present in the area for 1 min and severely injured within 10 sec
12.5 Burning of wooden structures with flame and melting of plastics
1 % death if present in the area for 1 min and skin burnt within 10sec
4.0 - Skin irritation if present in the area for longer than 20sec but no swelling
1.6 - Causing abnormality to a body if exposure for long period
Source : World Bank Technical Paper No.35, 1988

Environmental Report for submission to ADB Chapter 5
Pluak Daeng Power Plant Anticipated Environmental Impacts and Mitigations
RNP/ENV/P05028/FR (ADB)/RE62049-sec 5.5 Page 5-310
TABLE 5.5.3-9
IMPACT OF EXPLOSION AT VARIOUS LEVELS OF PRESSURE Pressure (psig) Impact
0.345 1-99 % of human directly exposing to pressure will die
0.138 Nearby constructions and equipment are completely destroyed.
0.069 Nearby constructions and equipment are severe damaged.
0.039 Glasses shake and partly break, but can be fixed.
Source: Lees, Frank P. , Loss Prevention in the Process Industries, Vol. 1. London and Boston (1980)
(4) Risk assessment Assessment of risk applied criteria of classification of risk in accordance to Rules of Department of Industrial Works re: Principles of Risk Identification, Risk Assessment, and Risk Management Planning B.E. 2543 (2000) as shown in Table 5.5.3-10. Risk assessment considers 2 factors consisting of 1) likelihood of incident (see Table 5.5.3-11) and 2) severity of incident (see Table 5.5.3-12). Therefore, risk level can be derived from likelihood of incident multiply by severity of incident as Equation 1 below.
Consideration result = likelihood of incident x severity of incident…….(1)
TABLE 5.5.3-10 CLASSIFICATION OF RISK LEVEL
Risk Level Result Definition 1 1 - 2 Slight risk 2 3 - 6 Acceptable risk but control measures needed 3 8 - 9 High risk and action to reduce risk needed 4 12 - 16 Unacceptable risk and must immediately stop operation and improve
to reduce risk Source : Rules of Department of Industrial Works re: Principles of Risk Identification, Risk Assessment,
and Risk Management Planning B.E. 2543 (2000)

Environmental Report for submission to ADB Chapter 5
Pluak Daeng Power Plant Anticipated Environmental Impacts and Mitigations
RNP/ENV/P05028/FR (ADB)/RE62049-sec 5.5 Page 5-311
TABLE 5.5.3-11 CLASSIFIACATION OF PROBABILITY OF INCIDNET OCCURRENCE
Level Definition 1 Difficult to occur such as never occur within 10 years or more
2 Less probability to occur such as frequency of occurrence is once in 5-10 years.
3 Moderate probability to occur such as frequency of occurrence is once in 1-5 years.
4 High probability to occur such as frequency of occurrence is once in a year.
Source : Rules of Department of Industrial Works re: Principles of Risk Identification, Risk Assessment,
and Risk Management Planning B.E. 2543 (2000)
TABLE 5.5.3-12 CLASSIFICATION OF SEVERITY TO PEOPLE AND PROPERTIES
Severity Impact on people Impact on properties
1 (Slight) Slight injury can cure by first aid. Very slight damage or no damage
2 (Moderate) Injury must have medical care. Moderate damage that can continue
production process.
3 (High) Severe injury or sickness Severe damage that needs to stop
some productions.
4 (Very high) Handicap or death Severe damage that needs to stop all
productions. Source: Adapt from Rules of Department of Industrial Works re: Principles of Risk Identification, Risk
Assessment, and Risk Management Planning B.E. 2543 (2000)
(5) Study results (a) Release rate Release rate of transmission pipeline of natural gas/ diesel and oil storage tank is as shown in Table 5.5.3-13

Environmental Report for submission to ADB Chapter 5
Pluak Daeng Power Plant Anticipated Environmental Impacts and Mitigations
RNP/ENV/P05028/FR (ADB)/RE62049-sec 5.5 Page 5-312
TABLE 5.5.3-13 NATURAL GAS/DIESEL PIPELINE AND DIESEL TANK RELEASE RATES
Leak size Release duration
(min)
Release rate (kg/sec)
Release quantity of 3 min (lb) Release Characteristics 1/
1. Natural gas transmission pipeline 1.1 Natural gas transmission pipeline from the sale tap to the gas metering station (28 inch in diameter)
1 inch 10 5.217 3,129.906 continuous release Rapture 3 1,335.426 240,376.745 instantaneous release
1.2 Natural gas transmission pipeline from the gas metering station to the gas compressor (12 inch in diameter) 1 inch 10 3.532 1,401.50 continuous release
Rapture 3 517.58 205,391.24 instantaneous release 1.3 Natural gas transmission pipeline from the gas compressor to the fuel gas heater (10 inch in diameter)
1 inch 10 3.202 1,270.61 continuous release Rapture 3 320.190 127,061.60 instantaneous release
1.4 Natural gas transmission pipeline from the fuel gas heater to the gas turbine (10 inch in diameter) 1 inch 10 2.503 993.42 continuous release
Rapture 3 43.919 17,428.60 instantaneous release 2. Diesel transportation pipeline 2 . 1 Diesel transportation pipeline from the fuel oil storage tank to the fuel oil transfer pump ( 14 inch in
diameter) 1 inch 10 10.828 4,296.94 continuous release
Rapture 3 2,122.314 842,201.08 instantaneous release 2.2 Diesel transportation pipeline from the fuel oil transfer pump to the branching point (10 inch in diameter)
1 inch 10 20.257 8,038.62 continuous release Rapture 3 2,025.698 803,860.96 instantaneous release
2.3 Diesel transportation pipeline from the branching point to the main fuel oil pump (8 inch in diameter) 1 inch 10 20.257 8,038.62 continuous release
Rapture 3 1,296.447 514,471.01 instantaneous release 2.4 Diesel transportation pipeline from the main fuel oil pump to the gas turbine (6 inch in diameter)
1 inch 10 59.308 23,535.18 continuous release Rapture 3 2,135.079 847,266.77 instantaneous release
3. Diesel storage tank 0.25 inch 30 0.332 131.57 continuous release
Rapture (10 inches) 2/ 10 763.916 303,146.07
instantaneous release Remarks : 1/ Release Characteristics
- Instantaneous Release: The release exceeds 10,000 pounds in 3 minutes. - Continuous Release: The release is less than 10,000 pounds in 3 minutes.
2/ Rupture : Use pipe diameter with a maximum length no greater than 16 inches

Environmental Report for submission to ADB Chapter 5
Pluak Daeng Power Plant Anticipated Environmental Impacts and Mitigations
RNP/ENV/P05028/FR (ADB)/RE62049-sec 5.5 Page 5-313
(b) Probability of incident occurrence Leakage probability of the natural gas/diesel transmission pipe
and oil storage tank Consideartion of leakage of transmission pipeline of gas/diesel and oil storage tank of the project using the occurrence frequency of a related incident recorded by American Petroleum Institute (API) published in the paper “API Recommended Practice 581: Risk-Based Inspection Technology, 2008” (Table 5.5.3-4) found that for the project’s natural gas and diesel transmission pipelines, a 1- inch leak size had the highest chance of occurrence at 2.00×10⁻⁵ time/year. The pipeline breakage, which is considered the worst scenario, had the possibility of incident occurrence of 2.60×10⁻⁶ times/year ( for a 6 inches-sized pipe) and 6.00×10⁻⁷ times/year (for an 8, 10, 12, 14 and 28 inches-sized pipe). As for a diesel storage tank, the most likely accident was with the leak size of 0. 25 inch with the highest frequency equal to 7. 00 × 10-4 time/ year. In the worst case scenario of tank rupture, the probability of an accident was 2.00×10⁻⁶ time/year.
The probability of ignition of natural gas and diesel oil
According to API Recommended Practice 581: Risk- Based Inspection Technology (2008) (Table 5.5.3-6 and Table 5.5.3-7), the probability of leakage and ignition of substance in a gaseous state (C1-C2) and liquid state (C9-C16) are as follows: Natural gas: Based on the release rates at various leak sizes as shown in Table 5.5.3-13, the study indicated the potential ignition of VCE, flash fire and jet fire from 1- inch leak size with the continuous release. The pipe rupture with instantaneous release could cause an ignition of VCE, fireball and flash fire (Table 5.5.3-6). Diesel oil: Based on the release rate at various leak sizes as shown in Table 5.5.3-13, the study indicated the potential ignition of jet and pool fire at 1 inch (diesel pipe) and 0.25- inch leak size (oil storage tank) with the continuous release. The pipe/tank rupture with instantaneous release could cause a pool fire ignition (Table 5. 5. 3-7) . Based on the diesel oil properties, its boiling point falls in the range of 180-340 degree Celsius, negating the possibility of having a jet fire. Moreover, accumulated diesel leakage at the pipeline or storage tank could cause a fireball and VCE explosion. Hence, the assessment of the risk impact of diesel leakage and ignition that could cause damage to human lives and properties of the project concentrated on a pool fire, fireball, and VCE. The study identified the probability of leakage and ignition of natural gas/diesel transmission pipeline and oil storage tank within range of 6. 00×10-9 to 2.80×10⁻⁵ times/year. Comparing with probability of incedent occurrence in accordance to

Environmental Report for submission to ADB Chapter 5
Pluak Daeng Power Plant Anticipated Environmental Impacts and Mitigations
RNP/ENV/P05028/FR (ADB)/RE62049-sec 5.5 Page 5-314
Rules of Department of Induatrial Works re: Principles of Risk Identification, Risk Assessment, Risk Management Planning B.E. 2543, the possibility of leakage and ignition in various forms is at level 1 which means that it is difficult to occur and never happens within 10 years or more. The detailed results are in Table 5.5.3-14 and Table 5.5.3-15.
TABLE 5.5.3-14 LEVEL OF PROBABILITY OF INCIDENT OCCURRENCE AROUND THE NATURAL GAS
PIPELINE OF THE PROJECT
Leak size
Probability of pipe leakage
(tmes/year)
Release Characteristics
Probability of Incident occurrence2/ (times/year)
Level of probability of
incident occurrence 3/ Probability of leak an
ignition1/
Igintion VCE Fireball Flash Fire Jet Fire
Continuouse release 0.04 - 0.06 0.10
Instantaneous release 0.04 0.01 0.15 -
1. Natural gas pipeline from the sale tap to the gas metering station (28 inch in diameter) 1 inch 2.0010-5 Continuous
release 8.0010-7 0 1.2010-6 2.0010-6 1
(Difficultl to occur) Rupture 6.0010-7 Instantaneous
release 2.4010-8 6.0010-9 9.0010-8 0 1
(Difficultl to occur) 2. Natural gas pipeline from the gas metering station to the fuel gas compressor (12 inch in diameter) 1 inch 2.0010-5 Continuous
release 8.0010-7 0 1.2010-6 2.0010-6 1
(Difficultl to occur) Rupture 6.0010-7 Instantaneous
release 2.4010-8 6.0010-9 9.0010-8 0 1
(Difficultl to occur) 3. Natural gas pipeline from the fuel gas compressor to the fuel gas heater (10 inch in diameter) 1 inch 2.0010-5 Continuous
release 8.0010-7 0 1.2010-6 2.0010-6 1
(Difficultl to occur) Rupture 6.0010-7 Instantaneous
release 2.4010-8 6.0010-9 9.0010-8 0 1
(Difficultl to ccur) 4. Natural gas pipeline from the fuel gas heater to the gas turbine (10 inch in diameter) 1 inch 2.0010-5 Continuous
release 8.0010-7 0 1.2010-6 2.0010-6 1
(Difficultl to ccur) Rupture 6.0010-7 Instantaneous
release 2.4010-8 6.0010-9 9.0010-8 0 1
(Difficultl to ccur) Remark : 1/ According to the probability of leak and ignition of gads (C1-C2) (API Recommended Practice 581 :
Risk Base Inspection Technology, 2008) 2/ Probability of incident occurrence calculated from probability of pipe leak multiply by probability
of leak and ignition. 3/ Level of probability of incident occurrence in accordance to Rules of Department of Induatrial Works
re: Principles of Risk Identification, Risk Assessment, Risk Management Planning B.E. 2543

Environmental Report for submission to ADB Chapter 5
Pluak Daeng Power Plant Anticipated Environmental Impacts and Mitigations
RNP/ENV/P05028/FR (ADB)/RE62049-sec 5.5 Page 5-315
TABLE 5.5.3-15 LEVEL OF PROBABILITY OF INCIDENT OCCURRENCE AROUND THE DIESEL OIL
TRANSPORTATION PIPELINE AND THE DIESEL STORAGE TANK OF THE PROJECT
Leak size
Probability of pipe leakage (tmes/year)
Release Characteristics Probability of Incident
occurrence2/ (times/year) Level of
probability of incident
occurrence 3/ Probability of leak an ignition1/
Igintion Pool fire Fireball VCE Continuouse release 0.04 - -
Instantaneous release 0.05 - -
1. Diesel transmission pipeline 1.1 Diesel transmission pipeline from the fuel oil storage tank to the fuel oil transfer pump (14 inch in diameter) 1 inch 2.0010-5 Continuous release 8.0010-7 8.0010-7 8.0010-7 1
(Difficultl to ccur) Rupture 6.0010-7 Instantaneous release 3.0010-8 3.0010-8 3.0010-8 1
(Difficultl to ccur) 1.2 Diesel transmission pipeline from the fuel oil transfer pump to the end poin of 10-inch pipeline (10 inch in diameter) 1 inch 2.0010-5 Continuous release 8.0010-7 8.0010-7 8.0010-7 1
(Difficultl to ccur) Rupture 6.0010-7 Instantaneous release 3.0010-8 3.0010-8 3.0010-8 1
(Difficultl to ccur) 1.3 Diesel transmission pipeline from the branching point to the main fuel oil pump (8 inch in diameter) 1 inch 2.0010-5 Continuous release 8.0010-7 8.0010-7 8.0010-7 1
(Difficultl to ccur) Rupture 6.0010-7 Instantaneous release 3.0010-8 3.0010-8 3.0010-8 1
(Difficultl to ccur) 1.4 Diesel transmission pipeline from the main fuel oil pump to the gas turbine (6 inch in diameter) 1 inch 2.0010-5 Continuous release 1.0010-6 1.0010-6 1.0010-6 1
(Difficultl to ccur) Rupture 2.6010-6 Instantaneous release 1.3010-7 1.3010-7 1.3010-7 1
(Difficultl to ccur) 2. Diesel storage tank
0.25 inch
7.0010-4 Continuous release 2.8010-5 2.8010-5 2.8010-5 1 (Difficultl to ccur)
Rupture (14 inch)*
2.0010-6 Instantaneous release 1.0010-7 1.0010-7 1.0010-7 1 (Difficultl to ccur)
Remark : 1/ According to the probability of leak and ignition of gads (C9-C16) (API Recommended Practice 581: Risk Base Inspection Technology, 2008), the probability of leak and ignition in the form of Fireball and VCE cannot be found; therefore, the probability of leak and ignition in the form of Pool fire of continuous and instantaneous release was used instead.
2/ Probability of incident occurrence calculated from probability of pipe leak multiply by probability of leak and ignition.
3/ Level of probability of incident occurrence in accordance to Rules of Department of Induatrial Works re: Principles of Risk Identification, Risk Assessment, Risk Management Planning B.E. 2543
* In case of rupture considers diameter of pipe connecting to the tanks.

Environmental Report for submission to ADB Chapter 5
Pluak Daeng Power Plant Anticipated Environmental Impacts and Mitigations
RNP/ENV/P05028/FR (ADB)/RE62049-sec 5.5 Page 5-316
(c) Heat radiation/pressure from explosion caused by leak and ignition Leak and ignition of natural gas transmission pipeline
Study results of heat radiation/pressure from explosion caused by various forms of leak and ignition of natural gas pipeline are shown in Table 5.5.3-16. It was found that natural gas transmission pipeline from the sale tap to the gas metering station results in maximum radius of heat radiation, therefore, this pipeline was considered as representative of assessment of incident severity. The areas affected by maximum heat radiation are shown in Figure 5.5.3-1 to Figure 5.5.3-3.
Leak and ignition of diesel transportation pipeline Study results of heat radiation/pressure from explosion caused by various forms of leak and ignition of diesel transportation pipeline are shown in Table 5.5.3-17. It was found that diesel transportation pipeline from the main fuel oil pupm to the gas turbine results in maximum radius of heat radiation, therefore, this pipeline was considered as representative of assessment of incident severity. The areas affected by maximum heat radiation are shown in Figure 5.5.3-4 to Figure 5.5.3-6.
Leak and ignition of diesel storage tank Study results of heat radiation/pressure from explosion caused by various forms of leak and ignition of diesel storage tank are shown in Table 5.5.3-17. The areas affected by maximum heat radiation are shown in Figure 5.5.3-7 to Figure 5.5.3-9. (d) Severity of incident Asseessment of severity of incident considers impact on people and properties as follows:
- Impact on people ( ignition in form of Jet Fire, Pool Fire and Fireball) considers at energy level of 12. 5 kW/m2 because it is an extent starting cause death.
- Impact on people and properties ( explosion in form of VCE) considers at pressure level of 0. 069 bar( g) because it is an extent starting cause severe damage to structures and nearby production equipment.

Environmental Report for subm
ission to ADB Chapter 5
Pluak Daeng Power Plant Anticipated Environm
ental Impacts and M
itigations
RNP/ENV/P05028/FR (ADB)/RE62049-sec 5.5 Page 5-317
TABLE 5.5.3-16 RADIUS OF HEAT RADIATION/PRESSURE FROM EXPLOSION RESULTING FROM LEAK AND IGNITION IN FORM OF JET FIRE, FIREBALL, VCE
AND FLASH FIRE OF NATURAL GAS PIPELINE OF THE PROJECT
Leak size
Radius of heat radiation/pressue from explosion (m) Jet Fire (kW/m2) Fireball (kW/m2) VCE (bar(g)) Flash Fire
4.0 12.5 25.0 37.5 4.0 12.5 25.0 37.5 0.039 0.069 0.138 0.345
Atmospheric stability class F, wind speed 1.5
m/s
1. Natural gas pipeline from the sale tap to the gas metering station (28 inch in diameter)
- 1 inch 51 44 41 39 No probability to ignition in form of Fireball2/ 459 264 134 70 -
- Rupture No probability to ignition in form of Jet Fire 1/ 1,879 1,063 751 614 1,950 1,120 571 297 -
2. Natural gas pipeline from the gas metering station to the fuel gas compressor (12 inch in diameter)
- 1 inch 43 37 35 33 No probability to ignition in form of Fireball2/ 355 234 149 82 -
- Rupture No probability to ignition in form of Jet Fire 1/ 1,359 769 544 444 1,244 822 522 287 -
3. Natural gas pipeline from the fuel gas compressor to the fuel gas heater (10 inch in diameter)
- 1 inch 40 35 32 31 No probability to ignition in form of Fireball2/ 343 227 144 79 -
- Rupture No probability to ignition in form of Jet Fire 1/ 1,164 659 466 380 1,066 704 448 246 -
4. Natural gas pipeline from the fuel gas heater to the gas turbine (10 inch in diameter)
- 1 inch 33 29 27 26 No probability to ignition in form of Fireball2/ 316 209 133 73 -
- Rupture No probability to ignition in form of Jet Fire 1/ 598 339 239 195 550 363 231 127 550
Remark : 1/ There is no probability to ignition in form of Jet Fire because release characteristics are instantaneous. 2/ There is no probability to ignition in form of Fireball because release characteristics are continuous. - means that there is no radius of ignition could be calculated because concentration of leaking gas is less than lower flammable limit (50,000 ppm).

Environmental Report for subm
ission to ADB Chapter 5
Pluak Daeng Power Plant Anticipated Environm
ental Impacts and M
itigations
RNP/ENV/P05028/FR (ADB)/RE62049-sec 5.5 Page 5-318
FIGURE 5.5.3-1: AREA AFFECTED FROM LEAK AND IGNITION IN FORM OF JET FIRE AT SALE TAP
Energy Level 37.5 kW/m2 (Radius = 39 meters)
Energy Level 25.0 kW/m2 (Radius = 41 meters)
Energy Level 12.5 kW/m2 (Radius = 44 meters)
Energy Level 4.0 kW/m2 (Radius = 51 meters)
Rupture
Sale tap

Environmental Report for subm
ission to ADB Chapter 5
Pluak Daeng Power Plant Anticipated Environm
ental Impacts and M
itigations
RNP/ENV/P05028/FR (ADB)/RE62049-sec 5.5 Page 5-319
FIGURE 5.5.3-2: AREA AFFECTED FROM LEAK AND IGNITION IN FORM OF FIREBALL AT SALE TAP
Rupture
Energy Level 37.5 kW/m2 (Radius = 614 meters)
Energy Level 25.0 kW/m2 (Radius = 751 meters)
Energy Level 12.5 kW/m2 (Radius = 1,063 meters)
Energy Level 4.0 kW/m2 (Radius = 1,879 meters)
Sale tap

Environmental Report for subm
ission to ADB Chapter 5
Pluak Daeng Power Plant Anticipated Environm
ental Impacts and M
itigations
RNP/ENV/P05028/FR (ADB)/RE62049-sec 5.5 Page 5-320
FIGURE 5.5.3-3: AREA AFFECTED FROM LEAK AND IGNITION IN FORM OF VCE AT SALE TAP
Sale tap
Rupture
Pressure Level 0.345 Bar (Radius = 297 meters)
Pressure Level 0.138 Bar (Radius = 571 meters)
Pressure Level 0.069 Bar (Radius = 1,120 meters)
Pressure Level 0.039 Bar (Radius = 1,950 meters)
Pressure Level 0.345 Bar (Radius = 70 meters)
Pressure Level 0.138 Bar (Radius = 134 meters)
Pressure Level 0.069 Bar (Radius = 264 meters)
Pressure Level 0.039 Bar (Radius = 459 meters)
Release hole size of 1 inch

Environmental Report for subm
ission to ADB Chapter 5
Pluak Daeng Power Plant Anticipated Environm
ental Impacts and M
itigations
RNP/ENV/P05028/FR (ADB)/RE62049-sec 5.5 Page 5-321
TABLE 5.5.3-17 RADIUS OF HEAT RADIATION RESULTING FROM LEAK AND IGNITION IN FORM OF POOL FIRE, FIREBALL, AND VCE OF DIESEL
TRANSMISSION PIPELINE OF THE PROJECT
Leak size Radius of heat radiation (m)
Pool Fire (kW/m2) Fireball (kW/m2) VCE (bar(g)) 4.0 12.5 25.0 37.5 4.0 12.5 25.0 37.5 0.039 0.069 0.138 0.345
1. Diesel transmission pipeline 1.1 Diesel transmission pipeline from the fuel oil storage tank to the fuel oil transfer pump (14 inch in diameter)
- 1 inch 34 24 20 18 517 293 207 169 488 323 205 113
- Rupture 281 181 136 110 2,025 1,146 810 661 1,899 1,254 797 438 1.2 Diesel transmission pipeline from the fuel oil transfer pump to the end poin of 10-inch pipeline (10 inch in diameter)
- 1 inch 44 31 25 22 638 361 255 208 602 397 253 139
- Rupture 276 178 133 108 1,994 1,128 798 651 1,870 1,235 785 432 1.3 Diesel transmission pipeline from the branching point to the main fuel oil pump (8 inch in diameter)
- 1 inch 44 31 25 22 638 361 255 208 602 397 253 139
- Rupture 230 150 114 93 1,717 971 687 561 1,611 1,064 677 372 1.4 Diesel transmission pipeline from the main fuel oil pump to the gas turbine (6 inch in diameter)
- 1 inch 68 47 38 32 792 448 317 259 861 569 362 199
- Rupture 281 182 136 110 2,029 1,148 812 663 1,903 1,257 799 439 2. Diesel storage tank
- 0.25 inch 7 5 4 3 236 134 95 77 224 148 94 52
- Rupture (14 inch)* 195 109 72 55 2,427 1,373 971 793 2,274 1,502 955 525 Remark * In case of rupture considers diameter of pipe connecting to the tanks.

Environmental Report for subm
ission to ADB Chapter 5
Pluak Daeng Power Plant Anticipated Environm
ental Impacts and M
itigations
RNP/ENV/P05028/FR (ADB)/RE62049-sec 5.5 Page 5-322
FIGURE 5.5.3-4: AREA AFFECTED FROM LEAK AND IGNITION IN FORM OF POOL FIRE AT CONNCTING POINT OF DIESEL PIPELINE FROM MAIN FUEL OIL PUMP TO GAS TURBINE

Environmental Report for subm
ission to ADB Chapter 5
Pluak Daeng Power Plant Anticipated Environm
ental Impacts and M
itigations
RNP/ENV/P05028/FR (ADB)/RE62049-sec 5.5 Page 5-323
FIGURE 5.5.3-5: AREA AFFECTED FROM LEAK AND IGNITION IN FORM OF FIREBALL AT CONNCTING POINT OF DIESEL PIPELINE FROM MAIN FUEL OIL PUMP TO GAS TURBINE

Environmental Report for subm
ission to ADB Chapter 5
Pluak Daeng Power Plant Anticipated Environm
ental Impacts and M
itigations
RNP/ENV/P05028/FR (ADB)/RE62049-sec 5.5 Page 5-324
FIGURE 5.5.3-6: AREA AFFECTED FROM LEAK AND IGNITION IN FORM OF VCE AT CONNCTING POINT OF DIESEL PIPELINE FROM MAIN FUEL OIL PUMP TO GAS TURBINE

Environmental Report for subm
ission to ADB Chapter 5
Pluak Daeng Power Plant Anticipated Environm
ental Impacts and M
itigations
RNP/ENV/P05028/FR (ADB)/RE62049-sec 5.5 Page 5-325
FIGURE 5.5.3-7: AREA AFFECTED FROM LEAK AND IGNITION IN FORM OF POOL FIRE AT DIESEL STORAGE TANK

Environmental Report for subm
ission to ADB Chapter 5
Pluak Daeng Power Plant Anticipated Environm
ental Impacts and M
itigations
RNP/ENV/P05028/FR (ADB)/RE62049-sec 5.5 Page 5-326
FIGURE 5.5.3-8: AREA AFFECTED FROM LEAK AND IGNITION IN FORM OF FIREBALL AT DIESEL STORAGE TANK

Environmental Report for subm
ission to ADB Chapter 5
Pluak Daeng Power Plant Anticipated Environm
ental Impacts and M
itigations
RNP/ENV/P05028/FR (ADB)/RE62049-sec 5.5 Page 5-327
FIGURE 5.5.3-9 : AREA AFFECTED FROM LEAK AND IGNITION IN FORM OF VCE AT DIESEL STORAGE TANK

Environmental Report for submission to ADB Chapter 5
Pluak Daeng Power Plant Anticipated Environmental Impacts and Mitigations
RNP/ENV/P05028/FR (ADB)/RE62049-sec 5.5 Page 5-328
Considering area affected by leak and various forms of ignition from Figure 5.5.3-1 ot Figure 5.5.3-9) , it can be concluded that the affected area and people consist of project area, field crops (cassava/pineapple) , rubber trees, orchards (coconuts, cashew nuts, jack fruits) , palm trees, idle lands, business areas, residential areas, government offices/state enterprises, educational institutes, religious places/archeological and historical sites, factories/ warehouses, industrial estate/ industrial park, recreational area, reservoirs/ponds, project staff, staff of nearby factories and nearby local people. Assessing impact on people and properties, and classification of severity to people and properties in compliance with Rules of Department of Industrial Works re: Principles of Risk Identification, Risk Assessment, and Risk Management Planning B.E. 2543, it was found that severity is in very high level ( level 4) . This level will cause people to have handicap, or death, and cause severe damage leading to stop all production up to incident. Severity level of leak and ignition of natural gas pipeline is shown in Table 5.5.3-18, while that of diesel transmission pipeline and diesel storagetank is shown in Table 5.5.3-19. (e) Risk Level Multiplying level of probability of occurrence (see Table 5.5.3-14 and Table 5.5.3-15) by level of severity of incident (see Table 5.5.3-18 and Table 5.5.3-19), The result is equal to 4 (Table 5.5.3-20) . it is indicated that risk level of the project is in level 2 which means that the risk is acceptable, but there should be risk control measures.
5.5.4 Assessment of Major Hazards Resulting from Leakage of Chemical Substances
The majority of chemicals consumption within production process are water treatment chemicals, which are used to prevent dregs or sediment in pipes. Details on chemical sources, usage volume and purpose for each type of chemical substance are described in Section 3.5: Chemical in Chapter 3: Description of the Project.

Environmental Report for subm
ission to ADB Chapter 5
Pluak Daeng Power Plant Anticipated Environm
ental Impacts and M
itigations
RNP/ENV/P05028/FR (ADB)/RE62049-sec 5.5 Page 5-329
TABLE 5.5.3-18 RESULT OF SEVERITY ASSESSMENT AT NATURAL GAS TRANSMISSION PIPELINE
Leak size (inch)
Heat radiation/pressure from explosion (m) Affected area Level of severity4/
Jet Fire2/ Fireball2/ VCE3/ Jet Fire2/ Fireball2/ VCE3/ Natural gas pipeline from the sale tap to the gas metering station (28 inch in diameter)1/
- 1 inch 44 No probability to ignition in form
of Fireball
264 Project area and field crops (cassava/ pineapple)
No probability to ignition in form of Fireball
Project area, industrial estate/industrial park, residential areas and field crops (cassava/pineapple)
4 (very high)
- Ruptue No probability to ignition in form of Jet
Fire
1,063 1,120 No probability to ignition in form of Jet Fire
Project area, field crops (cassava/pineapple), rubber trees, orchards (coconuts, cashew nuts, jack fruits), palm trees, idle lands, business areas, residential areas, industrial estate/industrial park, and reservoirs/ponds
Project area, field crops (cassava/pineapple), rubber trees, orchards (coconuts, cashew nuts, jack fruits), palm trees, idle lands, business areas, residential areas, factories/warehouses, industrial estate/industrial park, and reservoirs/ponds
4 (very high)
Remark : 1/ Ignition of natural gas transmission pipeline from gas metering station to fuel gas compressor will cause maximum radius of heat radiation, hence it was used as representative to assess level of severity.
2/ Ignition in form of Jet Fire and Fireball considers impat at energy level of 12.5 kW/m2 because this level starts causing 1-percent probability of death . If people have exposed to that energy level for a minute or more, and at this energy level can burn skin within 10 seconds.
3/ Explosion in form of VCE considers impact at pressure level of 0.069 bar(g) because at this extent can cause severe damage to structures and nearby production equipment.
4/ Level of severity of incident is assessed in compliance with Rules of Department of Industrial Works re: Principles of Risk Identification, Risk Assessment, and Risk Management Planning B.E. 2543.

Environmental Report for subm
ission to ADB Chapter 5
Pluak Daeng Power Plant Anticipated Environm
ental Impacts and M
itigations
RNP/ENV/P05028/FR (ADB)/RE62049-sec 5.5 Page 5-330
TABLE 5.5.3-19 RESULT OF SEVERITY ASSESSMENT AT DIESEL TRANSMISSION PIPELINE AND DIESEL STORAGE TANK
Leak size (inch)
Heat radiation/pressure from explosion (m)
Affected area Levl of severity
Pool Fire2/ Fireball2/ VCE3/ Pool Fire2/ Fireball2/ VCE3/ 1. Diesel transmission pipeline from the main fuel oil pump to the gas turbine (6 inch in diameter)1/
- 1 inch 47 448 569 Project area project area, field crops (cassava/ pineapple), rubber trees, palm trees, idle lands, residential areas, and industrial estate/industrial park
project area, field crops (cassava/ pineapple), rubber trees, orchards (coconuts, cashew nuts, jack fruits), palm trees, idle lands, residential areas, industrial estate/industrial park, and reservoirs/ponds
4 (very high)
- Rupture 182 1,148 1,257 Project area project area, field crops (cassava/ pineapple), rubber trees, orchards (coconuts, cashew nuts, jack fruits), palm trees, idle lands, business areas, residential areas, government offices/ state enterprises, factories/warehouses, industrial estate/industrial park, recreational area, and reservoirs/ponds
project area, field crops (cassava/ pineapple), rubber trees, orchards (coconuts, cashew nuts, jack fruits), palm trees, idle lands, business areas, residential areas, government offices/ state enterprises, factories/warehouses, industrial estate/industrial park, recreational area, and reservoirs/ponds
4 (very high)

Environmental Report for subm
ission to ADB Chapter 5
Pluak Daeng Power Plant Anticipated Environm
ental Impacts and M
itigations
RNP/ENV/P05028/FR (ADB)/RE62049-sec 5.5 Page 5-331
TABLE 5.5.3-19 RESULT OF SEVERITY ASSESSMENT AT DIESEL TRANSMISSION PIPELINE AND DIESEL STORAGE TANK (CONT’D)
Leak size (inch)
Heat radiation/pressure from explosion (m)
Affected area Level of severity 4/
Pool Fire2/ Fireball2/ VCE3/ Pool Fire2/ Fireball2/ VCE3/ 2. Diesel storage tank
- 0.25 inch 5 134 148 Project area Project area Project area 4 (very high)
- Rupture 109 1,373 1,502 Project area project area, field crops (cassava/ pineapple), rubber trees, orchards (coconuts, cashew nuts, jack fruits), palm trees, idle lands, business areas, residential areas, government offices/ state enterprises, factories/warehouses, industrial estate/industrial park, recreational area, and reservoirs/ponds
project area, field crops (cassava/ pineapple), rubber trees, orchards (coconuts, cashew nuts, jack fruits), palm trees, idle lands, business areas, residential areas, government offices/ state enterprises, factories/warehouses, industrial estate/industrial park, recreational area, and reservoirs/ponds
4 (very high)
Remark : 1/ Ignition of diesel transmission pipeline from main fuel oil pump to gas turbine will cause maximum radius of heat radiation, hence it was used as representative to assess level of severity.
2/ Ignition in form of Pool Fire and Fireball considers impat at energy level of 12.5 kW/m2 because this level starts causing 1-percent probability of death . If people have exposed to that energy level for a minute or more, and at this energy level can burn skin within 10 seconds.
3/ Explosion in form of VCE considers impact at pressure level of 0.069 bar(g) because at this extent can cause severe damage to structures and nearby production equipment.
4/ Level of severity of incident is assessed in compliance with Rules of Department of Industrial Works re: Principles of Risk Identification, Risk Assessment, and Risk Management Planning B.E. 2543.

Environmental Report for submission to ADB Chapter 5 Pluak Daeng Power Plant Anticipated Environmental Impacts and Mitigations
RNP/ENV/P05028/FR (ADB)/RE62049-sec 5.5 Page 5-332
TABLE 5.5.3-20 RISK LEVEL OF INCIDENT OCCURRENCE OF THE PROJECT
Leak size Level of probability
of incident occurrence
Level of incident severity
Risk level1/
Result Risk level
1. Natural gas pipeline from the sale tap to the gas metering station (28 inch in diameter)
1 inch 1
(Difficult to occur) 4
(very high) 1 x 4 = 4
level 2 acceptable risk
Rupture 1
(Difficult to occur) 4
(very high) 1 x 4 = 4
level 2 acceptable risk
2. Diesel transmission pipeline from the main fuel oil pump to the gas turbine (6 inch in diameter)
1 inch 1
(Difficult to occur) 4
(very high) 1 x 4 = 4
level 2 acceptable risk
Rupture 1
(Difficult to occur) 4
(very high) 1 x 4 = 4
level 2 acceptable risk
3. Diesel storage tank
0.25 inch 1
(Difficult to occur) 4
(very high) 1 x 4 = 4
level 2 acceptable risk
Rupture 1
(Difficult to occur) 4
(very high) 1 x 4 = 4
level 2 acceptable risk
Remark : 1/ Risk level was considered in compliance with Rules of Department of Industrial Works re: Principles of Risk Identification, Risk Assessment, and Risk Management Planning B.E. 2543

Environmental Report for submission to ADB Chapter 5 Pluak Daeng Power Plant Anticipated Environmental Impacts and Mitigations
RNP/ENV/P05028/FR (ADB)/RE62049-sec 5.5 Page 5-333
There are 12 types of chemicals used in this project. On chemical storage, the project has allocated an area for storing different types of chemicals based on their properties. This is to ensure safety and to prevent any chemical reaction between chemical substances. The project has also assigned a separated flammable chemical storage area. The project’s chemical storage measures are outlined as follows:
- Prepare MSDS of all type of chemicals and store them in the building, and attach a descriptive label on all chemical containers.
- Separate reactive chemicals from each other i. e. separate acid-base chemistry or chemical that should not be stored near each other such as flammable substances.
- The chemical storage area must have a good ventilation system to allow a good air flow.
- Build a concrete dike around the chemical containers to contain potential leaks and prevent chemical spill onto the building ground or spread to the water gutters
- Post warning signs to prohibit activities that could cause ignition within the building.
- Provide sufficient and appropriate fire extinguisher equipment in the building area. With these measures provided, the probability of incident occurrence is low. The severity analysis of incident occurrence indicated that chemical storage/usage area is located within power plant and only accessible to power plant staff. Furthermore, in addition to chemical storage measures, the project will put up warning signage and distribute Material Safety Data Sheet for staff operating within the area. Moreover, personal protective equipment that protects against hazards is provided for staff that involves in chemical transportation and handling on site. The protective equipment includes safety shower and eyewash, protective masks, gloves, and chemical transporting tools. Furthermore, chemical spill removal kits are placed in an appropriate place in sufficient numbers and always ready- to-be-used. Staff are also advised on safety facts sheet for each chemical type prior to task execution. Therefore, the incident severity to individuals, communities and environment is minimal. According to Rules of Department of Industrial Works re: Principles of Risk Identification, Risk Assessment, and Risk Management Planning B.E. 2543, the risk rating of the project is 1 or low risk.

Environmental Report for submission to ADB Chapter 5 Pluak Daeng Power Plant Anticipated Environmental Impacts and Mitigations
RNP/ENV/P05028/FR (ADB)/RE62049-sec 5.5 Page 5-334
5.5.5 Assessment of Major Hazards Resulting from Mechanical Failure (1) Screening of things that pose risks and may be hazardous in the project Screening things that pose risks and may be hazardous in the project or listing them helps lead to revision of the project’ s fundamental production process by assessing the manners and procedures of production with likelihood of serious incidents. The data collected are to be verified prior to being further employed in the major hazard assessment. Regarding the project’s electricity production process, things that pose risks and may be hazardous include the gas turbine, steam boiler, steam turbine, electricity generator, and electricity transformer, for example. (2) Identification of hazards Listing things that pose risks and may be hazardous in the project helps lead to identification of risks and hazards. To analyze the causes and results of the faults identified and define the nature of the related mishaps, Fault Tree Analysis ( FTA) is employed. FTA is a tool for safety analysis whereby undesired outcomes from an initiating event are assessed. The causes of the initiating event are also assessed with respect to their natures represented by symbols such as ‘And Gate’ , ‘Or Gate’ , or others (Table 5.5.5-1) . Possible sequences of events that could result in an incident are analyzed until preventive measures can be formulated. Steps in the Fault Tree Analysis are as follows: (a) Select a failure possible to happen as the ‘top event’. (b) Assess the failure - which may happen because of only one of certain possible event inputs, represented by the symbol “or”. (c) In case the failure happens because of several possible event inputs, this is represented by the symbol “and”. (d) The event input identified may happen because of another possible event input or several possible event inputs, for which the symbol “or” or “and” is used depending on the case. (e) The final input can be as follows:
Basic event
Undeveloped event (can be because it is of insufficient consequence
or because information is unavailable)

Environmental Report for submission to ADB Chapter 5 Pluak Daeng Power Plant Anticipated Environmental Impacts and Mitigations
RNP/ENV/P05028/FR (ADB)/RE62049-sec 5.5 Page 5-335
External event( including natural phenomena such as thunder
and lightning)
The results of hazard identification are shown from Figure 5.5.5-1 to Figure 5.5.5-4.
TABLE 5.5.5-1 SYMBOLS USED IN HAZARD IDENTIFICATION ANALYSIS
Symbol Name Meaning AND Gate
An event occurs if several input conditions are met
Or Gate
An event occurs as long as one of the input events takes place
Basic Event
A basic initiating fault requiring no further investigation for its cause.
Fault Tree Event
An intermediate event that causes another event to happen, leading to the failure which is the top event
Undeveloped Event
An intermediate event requiring no further investigation for its cause because of a lack of supporting information.
External Event
An external event or factor causing a failure to occur
Source : Regulations of Department of Industrial Works on criteria in hazard identification, risk assessment, and formulation of risk management plans, 2000

Environmental Report for subm
ission to ADB Chapter 5
Pluak Daeng Power Plant Anticipated Environm
ental Impacts and M
itigations
RNP/ENV/P05028/FR (ADB)/RE62049-sec 5.5 Page 5-336
FIGURE 5.5.5-1 : FAULT TREE ANALYSIS IN THE CASE OF GAS TURBINE EXPLOSION
Gas turbine explosion
Operational failures
Malfunction of the machine control system
Malfunction of the gas purge system
Too high temperature
Damage to the gas detector
Damage to the gas
purge unit
No alarm from the controller
Damage to the shut off valve
Damage to the temperature
sensor
Malfunction of the alarm
receiver
Damage to the control equipment
Malfunction of the control program
Malfunction of the gas distribution control
system
Residual gas left during startup System incoherence

Environmental Report for subm
ission to ADB Chapter 5
Pluak Daeng Power Plant Anticipated Environm
ental Impacts and M
itigations
RNP/ENV/P05028/FR (ADB)/RE62049-sec 5.5 Page 5-337
Steam boiler explosion
Operational failures Safety equipment failures
Steam boiler overload
Too high pressure in the steam boiler
The pressure not checked by the staff
Constant fuel feed Boiler leak
Malfunction of the
pressure indication controller
No alarm from the controller
Power outage
Water supply failures
Water supply out of control
Scale formation in pipe
No alarm from the water gauge when water level reduce
The float not in the proper position
Boiler leak
The water system not
regulated by the staff
Inappropriate water quality
No check-up by the staff according to
schedule
The equipment not checked by
the staff
Damage to the
equipment
Deformation of the float
Scale deformation
Damage to the gauge
The equipment
not checked by the staff
injv’;yf
Malfunction of the
safety valve
No alarm from the water gauge when water level reduce
Malfunction of the safety
valve
Malfunction of the alarm receiver
Malfunction of the
pressure indication controller
Malfunction of the water
pump
FIGURE 5.5.5-2 : FAULT TREE ANALYSIS IN THE CASE OF STEAM BOILER EXPLOSION

Environmental Report for subm
ission to ADB Chapter 5
Pluak Daeng Power Plant Anticipated Environm
ental Impacts and M
itigations
RNP/ENV/P05028/FR (ADB)/RE62049-sec 5.5 Page 5-338
FIGURE 5.5.5-3 : FAULT TREE ANALYSIS IN THE CASE OF STEAM TURBINE EXPLOSION

Environmental Report for subm
ission to ADB Chapter 5
Pluak Daeng Power Plant Anticipated Environm
ental Impacts and M
itigations
RNP/ENV/P05028/FR (ADB)/RE62049-sec 5.5 Page 5-339
FIGURE 5.5.5-4 : FAULT TREE ANALYSIS IN THE CASE OF ELECTRICITY GENERATOR EXPLOSION

Environmental Report for submission to ADB Chapter 5
Pluak Daeng Power Plant Anticipated Environmental Impacts and Mitigations
RNP/ENV/P05028/FR (ADB)/RE62049-sec 5.5 Page 5-340
(3) Risk assessment Risk assessment involves the analysis of the probability and severity of identified hazards. In this study, major hazards having been identified are to be analyzed with respect to their risk level - whether they are at a low, acceptable, high, or unacceptable level of risk. The data acquired are to be used in the risk control management. From the hazard identification, possible hazards include explosion of the steam boiler, steam turbine, electricity generator; and accidental release of chemical substances. The criteria and results of the assessment are in accordance with those stipulated in the Regulations of Department of Industrial Works on criteria in hazard identification, risk assessment, and formulation of risk management plans (2000) . In the assessment the probability of the incident is multiplied by the severity level that impacts an individual/ community/ environment and property, as follows: (a) Four levels of failure probability are defined, as follows:
Level Definition 1 rare probability of occurrence – for example never in more than
ten years 2 low probability of occurrence – for example once in 5-10 years 3 moderate probability of occurrence – for example once in 1-5
years 4 high probability of occurrence – for example more than once in
a year
(b) Levels of failure severity are defined based on its impact on an individual/community/environment and property, as follows: (b1) Levels of failure severity based on its impact on an individual
Level Severity Definition 1 low The failure could result in minor injury for which only
first aid administration is required. 2 moderate The failure could result in injury requiring medical
treatment. 3 high The failure could result in severe injury or illness. 4 very high The failure could result in disability or death.

Environmental Report for submission to ADB Chapter 5
Pluak Daeng Power Plant Anticipated Environmental Impacts and Mitigations
RNP/ENV/P05028/FR (ADB)/RE62049-sec 5.5 Page 5-341
(b2) levels of failure severity based on its impact on a community Level Severity Definition
1 low The failure could incur no or only negligible impact on the communities nearby.
2 moderate The failure could have impact on the communities nearby, but can be manageable in a short period of time.
3 high The failure could have impact on the communities nearby, and it takes time to manage.
4 very high The failure could have extensive impact on the communities nearby and needs to be tackled by the government.
Remark : Impact on the communities include disturbances, injuries or illnesses incurred to the people, and damage to property.
(b3) Levels of failure severity based on its impact on the environment
Level Severity Definition 1 low The failure could incur marginal impact on the
environment and is manageable. 2 moderate The failure could have moderate impact on the
environment, but can be manageable in a short period of time.
3 high The failure could have impact on the environment, and it takes time to manage.
4 very high The failure could have extensive impact and it takes a lot of resources and time to manage.
Remark : Impact on the environment means the deterioration of the environment and the destruction of ecosystems such as air, water, and soil.

Environmental Report for submission to ADB Chapter 5
Pluak Daeng Power Plant Anticipated Environmental Impacts and Mitigations
RNP/ENV/P05028/FR (ADB)/RE62049-sec 5.5 Page 5-342
(b4) Levels of failure severity based on its impact on the property Level Severity Definition
1 low The failure could incur no or only negligible damage to the property.
2 moderate The failure could incur moderate damage to the property, but will not disrupt the production process.
3 high The failure could incur considerable damage to the property, and will disrupt some parts of the production process.
4 very high The failure could incur severe damage to the property, and will completely disrupt the production process.
Remark : The levels of property damage can be defined and adapted according to each plant’s production capacity.
(c) Levels of risk are defined by the results of the probability of the incident multiplied by the severity level that impacts an individual/ community/ environment and property. If the levels of risk affecting individuals, communities, property or the environment are different, the highest risk level shall be selected as the outcome of the assessment of the risk in question. Four levels of risk are classified as follows:
Level Severity Definition 1 1-2 The risk is of low level. 2 3-6 The risk is of acceptable level and revision of the
control measures is required. 3 8-9 The risk is of high level and mitigative action is required. 4 12-16 The risk is of unacceptable level, immediately
requiring a cease in operation and corrective action to reduce the risk.
According to data on the possible hazards resulting from mechanical failures, as shown in Table 5. 5. 5-2 and Table 5. 5. 5-3, the failure rates, which are the numbers of times the failures identified can occur in a year are as follows:
Failure caused by an individual = 1 10-3 time per year Failure due to the safety valve = 0.02 time per year
Failure due to the steam boiler = 9.3981 10-3 time per year

Environmental Report for submission to ADB Chapter 5
Pluak Daeng Power Plant Anticipated Environmental Impacts and Mitigations
RNP/ENV/P05028/FR (ADB)/RE62049-sec 5.5 Page 5-343
Failure due to the pressure indication controller = 1.15 time per year
Failure due to the relay = 0.08 time per year Failure due to the temperature sensor = 0.94 time per year
Failure due to the water gauge = 8.2 10-6 time per year Failure due to power outage = 10 time per year
Failure due to the nuts, bolts, or seals = 1.708 10-3 time per year As shown in Table 5. 5. 6- 14, the failure rates, which are the numbers of times the failures occur in a year are as follows: Failure due to malfunction of the pump = 0.026 time per year Failure due to steam turbine governor = 0.0026 time per year Instrument failure = 0.0087 time per year The levels of risk or failure probability due to the equipment mentioned above are evaluated in accordance with the criteria and results stipulated in the Regulations of the Department of Industrial Works on criteria in hazard identification, risk assessment, and formulation of risk management plans ( 2000) . Four levels of failure probability are defined, as follows:
Level definition 1 rare probability of occurrence – for example never in more than ten years 2 low probability of occurrence – for example once in 5-10 years 3 moderate probability of occurrence – for example once in 1-5 years 4 high probability of occurrence – for example more than once in a year
The levels of risk or failure probability due to the equipment aforementioned are shown in Table 5.5.5-2 and Table 5.5.5-3. Failure caused by an individual level of failure probability = 1 Failure due to the safety valve level of failure probability = 1 Failure due to the steam boiler level of failure probability = 1 Failure due to the pressure indication
controller level of failure probability = 3 Failure due to the relay level of failure probability = 1

Environmental Report for submission to ADB Chapter 5
Pluak Daeng Power Plant Anticipated Environmental Impacts and Mitigations
RNP/ENV/P05028/FR (ADB)/RE62049-sec 5.5 Page 5-344
TABLE 5.5.5-2 FREQUENCY PROBABILITY OF INCIDENTS OCCURRING DUE TO MECHANICAL FAILURES
Type of mechanical failures Frequency (time/year)
Level of failure probability
Smith and Warwick (1981) Power Failure (PEA) 10 4 (high probability of occurrence) Limit switch failure 110-4 1 (rare probability of occurrence)
Level switch failure 8.210-6 1 (rare probability of occurrence)
Operator Error 110-3 1 (rare probability of occurrence)
Pressure control fault 110-4 1 (rare probability of occurrence)
Solenoid valve fail to close 110-3 1 (rare probability of occurrence)
Level alarm failure 8.210-6 1 (rare probability of occurrence)
Vent Gas failure 210-5 1 (rare probability of occurrence)
Inter-unit pipe (general) 3.510-7 1 (rare probability of occurrence)
Emergency gen. Fault 1 10-5 1 (rare probability of occurrence)
Mechanical failure 7 10-3 1 (rare probability of occurrence)
P. Trip signal 5.410-4 1 (rare probability of occurrence)
No immediate ignition 1.410-3 1 (rare probability of occurrence)
Immediate ignition 0.9386 3 (moderate probability of occurrence) Sudden Weather Change 110-2 1 (rare probability of occurrence)
Third Party Error 110-3 1 (rare probability of occurrence)
Impulse lines (blocked or leaking) 0.09 1 (rare probability of occurrence) Pressure switch 0.13 2 (low probability of occurrence) Cable (fractured or severed) 0.03 1 (rare probability of occurrence) Loss of electric power Steam 0.05 1 (rare probability of occurrence) Relay (complete with wire) 0.08 1 (rare probability of occurrence) Solenoid valve 0.30 3 (moderate probability of occurrence) Loss of electric power 0.05 1 (rare probability of occurrence) Trip valve 0.25 3 (moderate probability of occurrence) Air Supply line (block, broken) 0.02 1 (rare probability of occurrence) Loss of air supply 0.02 1 (rare probability of occurrence) Relay, etc., as above 0.08 1 (rare probability of occurrence) Pressure relief valve 0.02 1 (rare probability of occurrence) Flame-failure detector 1.69 4 (high probability of occurrence)
Source : ILO (International Labor Organization, Major Hazard Control), 1998

Environmental Report for submission to ADB Chapter 5
Pluak Daeng Power Plant Anticipated Environmental Impacts and Mitigations
RNP/ENV/P05028/FR (ADB)/RE62049-sec 5.5 Page 5-345
TABLE 5.5.5-2 FREQUENCY PROBABILITY OF INCIDENTS OCCURRING DUE TO MECHANICAL FAILURES
(CONT’D)
Type of mechanical failures Frequency (time/year)
Level of failure probability
Less, 1983; King ,1990 Pressure vessels (general) 0.026 1 (rare probability of occurrence) Pressure vessels (high standard) 2.5610-3 1 (rare probability of occurrence) Pipes 1.7110-3 1 (rare probability of occurrence) Pipe joints 4.2710-3 1 (rare probability of occurrence) Gaskets 4.2710-3 1 (rare probability of occurrence) Bellows 0.043 1 (rare probability of occurrence) Diaphragms (metal) 0.043 1 (rare probability of occurrence) Diaphragms (rubber) 0.068 1 (rare probability of occurrence) Unions 3.4210-3 1 (rare probability of occurrence) Hoses (heavily stressed) 0.342 1 (rare probability of occurrence) Hoses (lightly stressed) 0.0342 1 (rare probability of occurrence) Relief valves (leakage) 0.017 1 (rare probability of occurrence) Relief valves (blockage) 4.2710-3 1 (rare probability of occurrence) Valves (hand-operated) 0.128 2 (low probability of occurrence) Valves (ball) 4.2710-3 1 (rare probability of occurrence) Seals (rotating) 0.0598 1 (rare probability of occurrence) Seals (sliding) 0.0256 1 (rare probability of occurrence) Seals (“o” ring) 1.70810-3 1 (rare probability of occurrence) Filters (blockage) 8.54410-3 1 (rare probability of occurrence) Filters (leakage) 8.54410-3 1 (rare probability of occurrence) Pins 0.128 2 (low probability of occurrence) Nuts 1.70810-3 1 (rare probability of occurrence) Bolts 1.70810-3 1 (rare probability of occurrence) Boiler (all types) 9.39810-3 1 (rare probability of occurrence) Pressure-indicating controller 1.15 4 (high probability of occurrence) Pressure-recovery controller 1.29 4 (high probability of occurrence) Flow-indicating controller 1.51 4 (high probability of occurrence) Flow-recording controller 2.14 4 (high probability of occurrence) Level-indicating controller 2.37 4 (high probability of occurrence) Level-recording controller 2.25 4 (high probability of occurrence) Temperature-indicating controller 0.94 3 (moderate probability of occurrence) Temperature- recording controller Trip initiator
1.99 4 (high probability of occurrence)
Source : ILO (International Labor Organization, Major Hazard Control), 1998

Environmental Report for submission to ADB Chapter 5
Pluak Daeng Power Plant Anticipated Environmental Impacts and Mitigations
RNP/ENV/P05028/FR (ADB)/RE62049-sec 5.5 Page 5-346
TABLE 5.5.5-3 PROBABILITY OF MECHANICAL FAILURES
Equipment involved Nature of failure Failure rate Level of failure probability
Batteries Power supplies No output 310-6 time/hour 1 (rare probability of occurrence)
Circuit breakers Failure to operate 110-3 time/hour 4 (high probability of occurrence)
Premature transfer 110-6 time/hour 1 (rare probability of occurrence)
Diesel (complete plant) Failure to start 310-2 time/day 4 (high probability of occurrence)
(emergency loads) Failure to run 310-3 time/hour 4 (high probability of occurrence)
Diesel (engine only) Failure to run 310-4 time/hour 4 (high probability of occurrence)
Electric Motors Failure to start 310-4 time/day 2 (low probability of occurrence)
Failure to run 110-5 time/year 1 (rare probability of occurrence)
Failure to run-extreme environment
110-3 time/hour 4 (high probability of occurrence)
Fuses Premature, open 110-6 time/hour 1 (rare probability of occurrence)
Failure to open 110-5 time/hour 1 (rare probability of occurrence)
Gaskets Leak 310-6 time/hour 1 (rare probability of occurrence)
Flanges, Closures, Elbows Leak/rupture 310-7 time/hour 1 (rare probability of occurrence)
Instrumentation(amplification, annunciators,
Failure to operate 110-6 time/hour 1 (rare probability of occurrence)
transducers, calibration, combination)
Shifts 310-5 time/hour 3 (moderate probability of occurrence)
Pipe >3”, high quality Rupture (section) 110-10 time/hour 1 (rare probability of occurrence)
Pipes <3” Rupture 110-9 time/hour 1 (rare probability of occurrence)
Pumps Failure to start 110-3 time/day 3 (moderate probability of occurrence)
Failure to run-normal 310-5 time/hour 3 (moderate probability of occurrence)
Failure to run-extreme environment
110-3 time/hour 4 (high probability of occurrence)

Environmental Report for submission to ADB Chapter 5
Pluak Daeng Power Plant Anticipated Environmental Impacts and Mitigations
RNP/ENV/P05028/FR (ADB)/RE62049-sec 5.5 Page 5-347
TABLE 5.5.5-3 PROBABILITY OF MECHANICAL FAILURES (CONT’D)
Equipment involved Nature of failure Failure rate Level of failure probability
Relays Failure to energize 110-4 time/day 1 (rare probability of occurrence)
Failure-no contact to close
310-7 time/hour 1 (rare probability of occurrence)
Short Across NO/NC contact
110-8 time/hour 1 (rare probability of occurrence)
Open NC contact 110-7 time/hour 1 (rare probability of occurrence)
Solid State Devices Fails to function 310-6 time/hour 1 (rare probability of occurrence)
Shorts 110-6 time/hour 1 (rare probability of occurrence)
Hi Power Application Fails to function 110-6 time/hour 1 (rare probability of occurrence)
Low Power Application Short 110-7 time/hour 1 (rare probability of occurrence)
Switches Limit: fail to operate 310-4 time/day 2 (low probability of occurrence)
Switches Limit: fail to operate 310-4 time/day 2 (low probability of occurrence)
Torque: fail to operate 110-4 time/day 1 (rare probability of occurrence)
Pressure: fail to operate
110-4 time/day 1 (rare probability of occurrence)
Manual: fail to operate 110-4 time/day 1 (rare probability of occurrence)
Manual: contacts short 110-8 time/hour 1 (rare probability of occurrence)
Transformers Open 110-6 time/hour 1 (rare probability of occurrence)
Short 110-6 time/hour 1 (rare probability of occurrence)
Manually operated valve Fails to operate (plug) 110-3 time/day 3 (moderate probability of occurrence)
Failure to remain open 110-4 time/day 1 (rare probability of occurrence)
External leak-rupture 110-8 time/hour 1 (rare probability of occurrence)
Solenoid operated valve Fails to operate 110-3 time/day 3 (moderate probability of occurrence)
Air operated valve Fails to operate 310-4 time/day 4 (high probability of occurrence)

Environmental Report for submission to ADB Chapter 5
Pluak Daeng Power Plant Anticipated Environmental Impacts and Mitigations
RNP/ENV/P05028/FR (ADB)/RE62049-sec 5.5 Page 5-348
TABLE 5.5.5-3 PROBABILITY OF MECHANICAL FAILURES (CONT’D)
Equipment involved Nature of failure Failure rate Level of failure probability
Failure to remain open 110-4 time/day 3 (moderate probability of occurrence)
External leak-rupture 110-8 time/hour 1 (rare probability of occurrence)
Check valve Failure to open 110-4 time/day 1 (rare probability of occurrence)
Reverse to remain open
110-7 time/hour 1 (rare probability of occurrence)
External leak-rupture 110-8 time/hour 1 (rare probability of occurrence)
Vacuum valve Fails to operate 310-5 time/day 1 (rare probability of occurrence)
Rupture 110-8 time/hour 1 (rare probability of occurrence)
Valve: orifices, flow, meters, (test)
Rupture 110-8 time/hour 1 (rare probability of occurrence)
Valves (relief) Failure to open 110-5 time/day 1 (rare probability of occurrence)
Premature open 110-5 time/hour 1 (rare probability of occurrence)
Weld Leak 310-9 time/hour 1 (rare probability of occurrence)
Source: Cryogenic and Oxygen Deficiency Hazard Safety: ODH Risk Assessment Procedures, 27th Feb 2006 (update 13 Feb 2009) SLAC-1-730-0A06C-001-R001.

Environmental Report for submission to ADB Chapter 5
Pluak Daeng Power Plant Anticipated Environmental Impacts and Mitigations
RNP/ENV/P05028/FR (ADB)/RE62049-sec 5.5 Page 5-349
Failure due to the temperature sensor level of failure probability = 1 Failure due to the water gauge level of failure probability = 1 Failure due to the nuts, bolts, or seals level of failure probability = 1 Failure due to malfunction of the pump level of failure probability = 1 Failure due to steam turbine governor level of failure probability = 1 Instrument failure level of failure probability = 1 For failure due to power outage, the level of failure probability is 1, for there is emergency generator in the project. (4) Results of risk assessment From the analysis of the causes of possible failures which can consequently incur major hazards, the results as well as relevant preventive measures are summarized as follows:
Explosion of the gas turbine
Because the results of the risk assessment of explosion of the gas turbine, which can occur due to several causes as shown in Table 5.5.5-4, reveal different risk levels; the higher risk level is chosen for the assessment. The risk of gas turbine explosion is thus at the level of 2, which is regarded as an acceptable risk. However, revision of the control measures is required as follows:
- Check-up of the gas detector of the gas turbine is to be conducted regularly.
- Check-up and maintenance of the purge system of the gas turbine are to be conducted according to schedule.
- Check-up and maintenance of the gas distribution control system of the gas turbine are to be conducted according to schedule.
- Check-up of the operation of the temperature sensor of the gas turbine is to be conducted regularly.
- Check-up of the controller of the gas turbine is to be conducted regularly to ensure its operational consistency.
- Check-up and maintenance of the control equipment of the gas turbine are to be conducted according to schedule.
- Equipment and control system to be used must have been approved in accordance with international standards.

Environmental Report for subm
ission to ADB Chapter 5
Pluak Daeng Power Plant Anticipated Environm
ental Impacts and M
itigations
RNP/ENV/P05028/FR (ADB)/RE62049-sec 5.5 Page 5-350
TABLE 5.5.5-4 CAUSES OF THE EVENTS LEADING TO POSSIBLE GAS TURBINE EXPLOSION AND THE COUNTERMEASURES
Causes of the events leading to major hazards
Hazards or subsequent events
Preventive and control measures
Risk assessment Likelihood Severity Consequence Risk level
In the case of operational failures Residual gas left during startup Damage to the pressure
indication controller
Gas turbine explosion Check-up of the gas detector of the gas
turbine to be conducted regularly
1 4 4 2
Damage to the gas detector Gas turbine explosion Check-up and maintenance of the purge
system of the gas turbine to be conducted
according to schedule
1 4 4 2
Too high temperature Damage to the shut off valve Gas turbine explosion Check-up and maintenance of the gas
distribution control system of the gas turbine
to be conducted according to schedule
1 4 4 2
Damage to the temperature
sensor
No alarm from the
controller
Check-up of the operation of the temperature
sensor of the gas turbine to be conducted
regularly
3 1 3 2
Malfunction of the alarm
receiver
No alarm from the
controller
Check-up of the controller of the gas turbine
to be conducted regularly to ensure its
operational consistency
1 1 1 1

Environmental Report for subm
ission to ADB Chapter 5
Pluak Daeng Power Plant Anticipated Environm
ental Impacts and M
itigations
RNP/ENV/P05028/FR (ADB)/RE62049-sec 5.5 Page 5-351
TABLE 5.5.5-4 CAUSES OF THE EVENTS LEADING TO POSSIBLE GAS TURBINE EXPLOSION, AND THE COUNTERMEASURES (CONT’D)
Causes of the events leading to major hazards
Hazards or subsequent events
Preventive and control measures
Risk assessment Likelihood Severity Consequence Risk level
System incoherence Damage to the control
equipment
Gas turbine explosion Check-up and maintenance of the control
equipment of the gas turbine to be
conducted according to schedule
1 4 4 2
Failure in the control system Gas turbine explosion Equipment and control system to be used
having been approved in accordance with
international standards
1 4 4 2

Environmental Report for submission to ADB Chapter 5
Pluak Daeng Power Plant Anticipated Environmental Impacts and Mitigations
RNP/ENV/P05028/FR (ADB)/RE62049-sec 5.5 Page 5-352
Explosion of the steam turbine
Because the results of the risk assessment of explosion of the steam turbine, which can occur due to several causes as shown in Table 5.5.5-5, reveal different risk levels; the higher risk level is chosen for the assessment. The risk of steam turbine explosion is thus at the level of 2, which is regarded as an acceptable risk. However, revision of the control measures is required as follows:
- Check-up of the condition of the safety valve is to be conducted regularly.
- The rupture disc is to be installed for the steam turbine as a safety measure in case the pressure exceeds the limit.
- Training is to be provided regularly in order that the staff can perform their work properly.
- Check-up of the condition of the steam turbine governor is to be conducted regularly.
- Check-up of the pressure indication controller is to be conducted regularly.
- Check-up of emergency generator is to be conducted regularly. - Check-up of the controller of the steam turbine is to be conducted
regularly to ensure its operational consistency. - Experts are to be on duty all the time the system is on.
Explosion of the steam boiler
Because the results of the risk assessment of explosion of the steam boiler, which can occur due to several causes as shown in Table 5.5.5-6, reveal different risk levels; the higher risk level is chosen for the assessment. The risk of the steam boiler explosion is thus at the level of 2, which is regarded as an acceptable risk. However, revision of the control measures is required as follows:
- Check-up of the condition of the safety valve is to be conducted regularly.
- The safety valve of the steam boiler must meet the standards set by the American Society of Mechanical Engineers – ASME, and those by the Department of Industrial Works.

Environmental Report for subm
ission to ADB Chapter 5
Pluak Daeng Power Plant Anticipated Environm
ental Impacts and M
itigations
RNP/ENV/P05028/FR (ADB)/RE62049-sec 5.5 Page 5-353
TABLE 5.5.5-5 CAUSES OF THE EVENTS LEADING TO POSSIBLE STEAM TURBINE EXPLOSION AND THE COUNTERMEASURES
Causes of the events leading to major hazards
Hazards or subsequent events
Preventive and control measures
Risk assessment likelihood Severity Consequence Risk level
Malfunction of the steam
turbine governor
Steam turbine
explosion
Check-up of the condition of the steam
turbine governor is to be conducted regularly
1 4 4 2
Malfunction of the component
equipment in the steam turbine
governing system
Steam turbine
explosion
Training to be provided regularly in order that
the staff can perform their work properly
1 4 4 2
No check-up of the component
equipment in the steam turbine
governing system by the staff
Steam turbine
explosion
Training to be provided regularly in order that
the staff can perform their work properly
Experts to be on duty all the time the system
is on
1 4 4 2
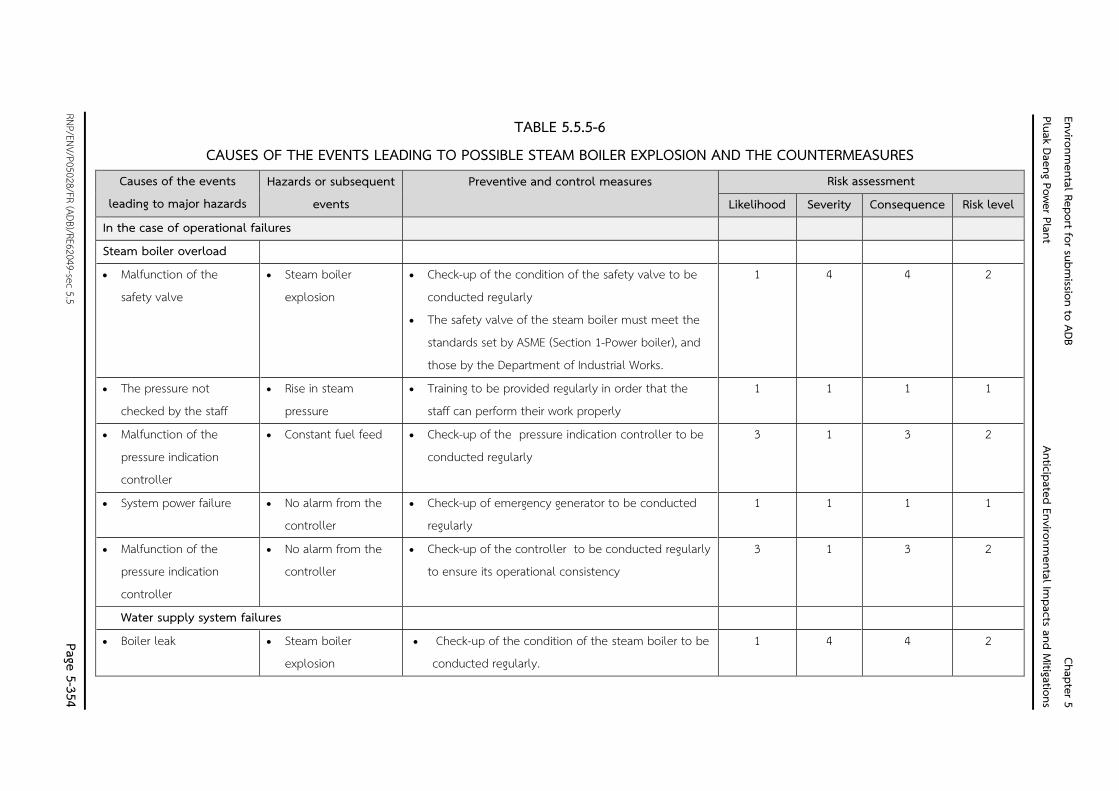
Environmental Report for subm
ission to ADB Chapter 5
Pluak Daeng Power Plant Anticipated Environm
ental Impacts and M
itigations
RNP/ENV/P05028/FR (ADB)/RE62049-sec 5.5 Page 5-354
TABLE 5.5.5-6 CAUSES OF THE EVENTS LEADING TO POSSIBLE STEAM BOILER EXPLOSION AND THE COUNTERMEASURES
Causes of the events leading to major hazards
Hazards or subsequent events
Preventive and control measures
Risk assessment Likelihood Severity Consequence Risk level
In the case of operational failures Steam boiler overload Malfunction of the
safety valve Steam boiler
explosion Check-up of the condition of the safety valve to be
conducted regularly The safety valve of the steam boiler must meet the
standards set by ASME (Section 1-Power boiler), and those by the Department of Industrial Works.
1 4 4 2
The pressure not checked by the staff
Rise in steam pressure
Training to be provided regularly in order that the staff can perform their work properly
1 1 1 1
Malfunction of the pressure indication controller
Constant fuel feed Check-up of the pressure indication controller to be conducted regularly
3 1 3 2
System power failure No alarm from the controller
Check-up of emergency generator to be conducted regularly
1 1 1 1
Malfunction of the pressure indication controller
No alarm from the controller
Check-up of the controller to be conducted regularly to ensure its operational consistency
3 1 3 2
Water supply system failures Boiler leak Steam boiler
explosion Check-up of the condition of the steam boiler to be
conducted regularly. 1 4 4 2

Environmental Report for subm
ission to ADB Chapter 5
Pluak Daeng Power Plant Anticipated Environm
ental Impacts and M
itigations
RNP/ENV/P05028/FR (ADB)/RE62049-sec 5.5 Page 5-355
TABLE 55.5-6 CAUSES OF THE EVENTS LEADING TO POSSIBLE STEAM BOILER EXPLOSION, AND THE COUNTERMEASURES (CONT’D)
Causes of the events leading to major hazards
Hazards or subsequent events
Preventive and control measures
Risk assessment Likelihood Severity Consequence Risk level
Malfunction of the water pump
Steam boiler explosion
Check-up of the condition of the water pump to be conducted regularly.
There must be a water pump in reserve for the steam boiler.
In case of malfunction of the water pump, the system to be off until the repair is done.
1 4 4 2
The water system not regulated by the staff then
Steam boiler explosion
Training to be provided regularly in order that the staff can perform their work properly
1 4 4 2
Malfunction of the water gauge
Steam boiler explosion
Check-up of the water gauge to be conducted regularly to ensure its operational consistency
1 4 4 2
The water gauge not checked by the staff
Steam boiler explosion
Training to be provided regularly in order that the staff can perform their work properly
1 4 4 2
In the case of operational failures Inappropriate water
quality Steam boiler
explosion Training to be provided regularly in order that the
staff can perform their work properly Experts to be on duty all the time the steam boiler
system is on.
1 4 4 2
No check-up by the staff according to schedule
Steam boiler explosion
Training to be provided regularly in order that the staff can perform their work properly
1 4 4 2

Environmental Report for subm
ission to ADB Chapter 5
Pluak Daeng Power Plant Anticipated Environm
ental Impacts and M
itigations
RNP/ENV/P05028/FR (ADB)/RE62049-sec 5.5 Page 5-356
TABLE 55.5-6 CAUSES OF THE EVENTS LEADING TO POSSIBLE STEAM BOILER EXPLOSION, AND THE COUNTERMEASURES (CONT’D)
Causes of the events leading to major hazards
Hazards or subsequent events
Preventive and control measures
Risk assessment Likelihood Severity Consequence Risk level
In the case of safety equipment failures Malfunction of the
safety valve Steam boiler
explosion Check-up of the condition of the safety valve to be
conducted regularly two sets of safety valves on hand – one set in
reserve
1 4 4 2
Malfunction of the water gauge
Steam boiler explosion
Training to be provided regularly in order that the staff can perform their work properly
1 4 4 2
The water gauge not checked by the staff
Steam boiler explosion
Training to be provided regularly in order that the staff can perform their work properly
Experts to be on duty all the time the system is on
1 4 4 2

Environmental Report for submission to ADB Chapter 5
Pluak Daeng Power Plant Anticipated Environmental Impacts and Mitigations
RNP/ENV/P05028/FR (ADB)/RE62049-sec 5.5 Page 5-357
- Training is to be provided regularly in order that the staff can perform their work properly.
- Check-up of the pressure indication controller is to be conducted regularly.
- Check-up of emergency generator is to be conducted regularly. - Check-up of the controller of the steam boiler is to be conducted
regularly to ensure its operational consistency. - Check-up of the condition of the water pump is to be conducted
regularly. - There must be a water pump in reserve for the steam boiler. - In case of malfunction of the water pump, the system must be off
until the repair is done. - Check- up of the water gauge is to be conducted regularly to
ensure its operational consistency. - Experts are to be on duty all the time the system is on. - The scale condition is to be checked regularly.
Explosion of the electricity generator
Because the results of the risk assessment of explosion of the electricity generator, which can occur due to several causes as shown in Table 5. 5. 5-7, reveal different risk levels; the higher risk level is chosen for the assessment. The risk of the electricity generator explosion is thus at the level of 2, which is regarded as an acceptable risk. However, revision of the control measures is required as follows:
- The operation of the overcurrent protection relay system must be checked to ensure that the current is in the preset limit.
- Training is to be provided regularly in order that the staff can perform their work properly.
- Check- up of the temperature sensing coil is to be conducted regularly.
- The temperature controller must be checked to ensure that it the temperature is in the predetermined limit.
- The sensor in reserve must be checked to ensure its ready-for-use condition.

Environmental Report for subm
ission to ADB Chapter 5
Pluak Daeng Power Plant Anticipated Environm
ental Impacts and M
itigations
RNP/ENV/P05028/FR (ADB)/RE62049-sec 5.5 Page 5-358
TABLE 5.5.5-7 CAUSES OF THE EVENTS LEADING TO POSSIBLE ELECTRICITY GENERATOR EXPLOSION AND THE COUNTERMEASURES
Causes of the events leading to major hazards
Hazards or subsequent events
Preventive and control measures Risk assessment Likelihood Severity Consequence Risk level
In the case of operational failures Electricity generator overload Malfunction of the
overcurrent protection relay system
Explosion resulting from the coil burning and the consequent short circuit
The operation of the overcurrent protection relay system must be checked to ensure that the current is in the preset limit.
1 4 4 2
The meter not checked by the staff
Overcurrent Training to be provided regularly in order that the staff can perform their work properly
1 1 1 1
Malfunction of the temperature sensing coil
Temperature of the coil higher than the predetermined limit, thus the relay system not opening the circuit
The coil overheating, resulting in the insulator burning and explosion
Check-up of the temperature sensing coil to be conducted regularly
The temperature controller must be checked to ensure that it the temperature is in the predetermined limit
The sensor in reserve must be checked to ensure its ready-for-use condition
1 4 4 2

Environmental Report for subm
ission to ADB Chapter 5
Pluak Daeng Power Plant Anticipated Environm
ental Impacts and M
itigations
RNP/ENV/P05028/FR (ADB)/RE62049-sec 5.5 Page 5-359
TABLE 5.5.5-7 CAUSES OF THE EVENTS LEADING TO POSSIBLE ELECTRICITY GENERATOR EXPLOSION, AND THE COUNTERMEASURES (CONT’D)
Causes of the events leading to major hazards
Hazards or subsequent events
Preventive and control measures Risk assessment Likelihood Severity Consequence Risk level
In the case of operation control system failures While the system is on
and when electricity is supplied from outside
Failure of the interlock system
Explosion at the controller Explosion at the electricity
generator
Procedures concerning the operation of electrical equipment to be clearly delineated.
The condition to be established that electricity from different generators is not to be combined unless first synchronized.
The synchronized system and the interlock system must be checked to ensure its operational consistency.
1 4 4 2
In the case of electric fault in the system Damage to the
transformer Fault in the electricity
supply system and malfunction of the prevention system
Malfunction of the prevention system
Valent short circuit at the power box resulting in the explosion of both the power box and the electricity generator
Training to be provided regularly in order that the staff have good understanding concerning the functions of the equipment
The operation of the protection equipment for example the overcurrent protection relay, voltage relay for leakage protection, and other types of relays must be checked.
Check-up of the protection system in power system to be scheduled in the annual maintenance plan and also at a regular basis to ensure that all the electric equipment in the protection system functions properly.
1 4 4 2

Environmental Report for submission to ADB Chapter 5
Pluak Daeng Power Plant Anticipated Environmental Impacts and Mitigations
RNP/ENV/P05028/FR (ADB)/RE62049-sec 5.5 Page 5-360
En
viro
nm
en
tal R
ep
ort fo
r su
bm
ittal to
AD
B
C
ha
pte
r 5
Srira
ch
a P
ow
er P
lan
t Pro
ject G
ulf S
RC
Co
., Ltd
. An
ticip
ate
d E
nv
iron
me
nta
l Imp
ac
ts a
nd
Mitig
atio
ns
- Procedures concerning the operation of electrical equipment are to be clearly delineated.
- The condition is to be established that electricity from different generators is not to be combined unless first synchronized.
- The synchronized system and the interlock system must be checked to ensure its operational consistency.
- The operation of the protection equipment for example the overcurrent protection relay, voltage relay for leakage protection, and other types of relays, must be checked.
- Check- up of the protection system in power system is to be scheduled in the annual maintenance plan and also at a regular basis to ensure that all the electric equipment in the protection system functions properly.
5.5.6 Summary of the Major Hazard Assessment The study reveals that in case that accidental release of natural gas and diesel which results in ignition occurs, the radius of the heat radiation is mostly within the compound of the power plant in the project and its vicinity and its severity is very high. However, from the risk probability analysis, the project’s incident occurrence is difficult to occur. Hence, risk level of major hazards owing to this cause is acceptable risk. With respect to hazards owing to chemical substances and explosion of equipment and machinery, with reference to the hazard analysis conducted in accordance with the Department of Industrial Works’ guideline, probability of the hazards is found to be at a low and acceptable level. In addition, for utmost safety, measures on safety management have been developed for the project encompassing the design, installation, operation and annual inspection phases. Mitigation Measures (1) Construction Phase
Specify natural gas pipeline and diesel pipeline interconnecting area as restrictive areas. Hot work shall be prohibited in the area. A warning sign shall be installed in that restrictive area. In the event that it is necessary to enter into the area, permit work governance shall be required with strict inspection and control.

Environmental Report for submission to ADB Chapter 5
Pluak Daeng Power Plant Anticipated Environmental Impacts and Mitigations
RNP/ENV/P05028/FR (ADB)/RE62049-sec 5.5 Page 5-361
En
viro
nm
en
tal R
ep
ort fo
r su
bm
ittal to
AD
B
C
ha
pte
r 5
Srira
ch
a P
ow
er P
lan
t Pro
ject G
ulf S
RC
Co
., Ltd
. An
ticip
ate
d E
nv
iron
me
nta
l Imp
ac
ts a
nd
Mitig
atio
ns
A barrier shall be provided for the welding area. Furthermore, a warning sign indicating restriced area shall be installed and a work permit system shall be adopted.
Before the construction begins, the contractors shall establish and send the operation plan of safety and occupational health to Gulf PD Co., Ltd. for approval. Controls shall be performed to be in line with the operation plan.
Adequate personal protective equipment shall be provided for all staff, and shall be suitable for working conditions.
A safety officer shall be provided to control and check operating conditions and ensure workers wear suitable personal protective equipment while working.
Adequate portable chemical fire extinguishers shall be provided in the areas where construction activities may cause fire.
First aid, basic medical supplies and an ambulance shall be provided in case of emergency according to Ministry of Labour regulation on Labour Welfare at workplace, B.E.2548.
A warning sign shall be installed in the hazardous area. Working in the area for a prolonged period of time without wearing personal protective equipment shall be prohibited.
Coordination with nearby hospitals shall be made to carry patients in emergency cases. (2) Operation Phase Preventive measures for natural gas and diesel fuel transmission pipeline system in the project area
The Metering and Regulation Station (MRS) is a restrictive area. Hot work shall be prohibited in the area. A warning sign shall be installed in the Metering and Regulation Station (MRS) area. In the event that it is necessary to enter into the area, permit work governance shall be required with strict inspection and control.
Maintenance of natural gas and diesel fuel transmission pipeline system and equipment shall be performed for readiness to use. Regular monitoring shall be done for safety.
The thickness and level of wear of the natural gas pipeline shall always be checked.

Environmental Report for submission to ADB Chapter 5
Pluak Daeng Power Plant Anticipated Environmental Impacts and Mitigations
RNP/ENV/P05028/FR (ADB)/RE62049-sec 5.5 Page 5-362
En
viro
nm
en
tal R
ep
ort fo
r su
bm
ittal to
AD
B
C
ha
pte
r 5
Srira
ch
a P
ow
er P
lan
t Pro
ject G
ulf S
RC
Co
., Ltd
. An
ticip
ate
d E
nv
iron
me
nta
l Imp
ac
ts a
nd
Mitig
atio
ns
Leakage survey on natural gas and diesel fuel transmission pipeline system shall be performed according to involved standards.
Hazardous zones shall be defined. Furthermore, control and preventive measures shall be established and strictly followed for safety purpose. For example, smoking prohibition zone or hot work area shall be permitted, etc.
The natural gas leak detection system shall be provided using a gas meter to detect gas leak at the joint above the ground level at the Metering and Regulation Station (MRS) and gas compressor manual for project safety procedures.
The sign indicating pipeline alignment and warning shall be provided to prevent any action in the area above the pipeline, which may affect the pipeline. The person who notice an abnormal situation shall keep the responsible person informed.
Working regulations shall be established and applicable for safety while performing natural gas pipeline work.
The shutdown control system and relief valve shall be provided to correctly and rapidly check abnormal pressure in the pipe.
A diesel oil drum/ tank shall be placed in a concrete dike, which can accommodate 110% of the fuel oil from the largest drum/tank in case the drum/tank is broken according to the ministerial regulation of Ministry of Energy, B.E.2556 on oil depot.
The oil pumping station for truck shall be surrounded by a concrete dike so that the leached oil stains will be conveyed to the wastewater collection pipe and the oil separator, respectively. Monitoring measures
Hazardous areas shall be defined. The persons who enter into hazardous areas shall strictly follow the control and preventive measures for safety, such as
No smoking A lighter, match or object that sparks a fire shall not be allowed in
the designated hazardous areas. Materials that stimulate combustion shall not be brought into or
stored in hazardous areas. Combustible materials shall not be brought into or stored in
hazardous areas, such as yellow phosphorus or white phosphorus and magnesium alloys, etc.

Environmental Report for submission to ADB Chapter 5
Pluak Daeng Power Plant Anticipated Environmental Impacts and Mitigations
RNP/ENV/P05028/FR (ADB)/RE62049-sec 5.5 Page 5-363
En
viro
nm
en
tal R
ep
ort fo
r su
bm
ittal to
AD
B
C
ha
pte
r 5
Srira
ch
a P
ow
er P
lan
t Pro
ject G
ulf S
RC
Co
., Ltd
. An
ticip
ate
d E
nv
iron
me
nta
l Imp
ac
ts a
nd
Mitig
atio
ns
Hot work like welding, metal cutting, etc. shall be permitted from the authorized person first.
Safety measures shall be planned before starting operations. Uninvolved persons shall not be allowed to enter into hazardous
areas. Prevention and suppression plan for emergency and fire that causes by natural gas 1) Objectives
To prevent fire due to natural gas To prepare and take appropriate action when a fire breaks out
2) Basic information that should be known To be safe while operating on natural gas, it is necessary to realize properties of natural gas that cause hazard and general instructions.
Natural gas properties and the properties that cause hazard Natural gas used for power generation units is mainly methane,
that is called dry gas. Vapor density of natural gas equals to 0.6 compared with the air
weight (Air =1). Methane is in the form of vapor in normal temperature and
atmospheric pressure. Compared with other gases, liquid methane expands many times
if vaporized. A mixture of methane and air which is flammable is called
“Flammable and Explosive Limit”, ranging from 5.0-14.0% (Low to High Limit). Hazard from use of natural gas
Flow and emission to the atmosphere is harmful. ( Methane is dangerous when it mixes with the air in appropriate amount.)
Natural gas is colorless and not harmful to humans. However, exposure to a mass of gas may cause loss of consciousness as result of suffocation
Instructions in case of gas leak Approach to a fire or the position of gas leak shall be in the
windward side
Environmental Report for submission to ADB Chapter 5
Pluak Daeng Power Plant Anticipated Environmental Impacts and Mitigations
RNP/ENV/P05028/FR (ADB)/RE62049-sec 5.5 Page 5-364
En
viro
nm
en
tal R
ep
ort fo
r su
bm
ittal to
AD
B
C
ha
pte
r 5
Srira
ch
a P
ow
er P
lan
t Pro
ject G
ulf S
RC
Co
., Ltd
. An
ticip
ate
d E
nv
iron
me
nta
l Imp
ac
ts a
nd
Mitig
atio
ns
All persons shall leave the areas where a mass of gas and gas move. In addition, flammable objects shall be eliminated immediately
Staff who are required to work in the gas leak area shall be provided. Other people shall be at least 200 feet away from the gas leak area.
In case of gas leak but incombustible. : A valve shall be turned off to stop gas leak. : Water spraying shall be done in the reverse direction of the gas to
reduce vapor. Spraying may be done to change into the safe direction.
: In the event that gas leakage or a mass of gas cannot be stopped, flames shall be controlled through injecting considerable volume of water into hot metal, such as pipe, or hot surface of metal, etc.
: Ignition sources shall be avoided. In case of gas leak and combustible
: A valve shall be turned off to stop gas leak. : A fire extinguisher shall not be used until the gas leak is
completely stopped. : Water shall be injected into a very hot area, such as concrete,
metal surface. Combustion shall be allowed at drains. : If the combustion takes place at the valve which is the equipment
that stops gas leak, water spraying at the valve shall be done. The person who will turn off the valve shall wear fire fighter suits.
: Dry chemical fire extinguisher is workable for small volume of gas. The dry chemicals shall be injected into gas leakage position. Additionally, CO2 shall be used for fire extinguishment of gas in a very low pressure.
: In case of an uncontrollable leak, vapor shall be controlled through injecting water to protect the equipment around the area where gas leak takes place.
Prevention of hazard in case of gas leak : When gas leak is recognized, all electrical equipment of non-
explosion proof type in the leak area shall be stopped. : The valve shall be turned off to stop gas leak.

Environmental Report for submission to ADB Chapter 5
Pluak Daeng Power Plant Anticipated Environmental Impacts and Mitigations
RNP/ENV/P05028/FR (ADB)/RE62049-sec 5.5 Page 5-365
En
viro
nm
en
tal R
ep
ort fo
r su
bm
ittal to
AD
B
C
ha
pte
r 5
Srira
ch
a P
ow
er P
lan
t Pro
ject G
ulf S
RC
Co
., Ltd
. An
ticip
ate
d E
nv
iron
me
nta
l Imp
ac
ts a
nd
Mitig
atio
ns
: Sources of ignition, such as flame, heat, spark, etc. shall be controlled.
: Air- Fuel Ratio at the leak position shall be measured in order to know hazardous level. Ventilation shall be performed to let gas dispersed outside.
: Operators who do not wear protective outfit while working should check the clothing by themselves. This is because their clothing may be stained with gas, which may be dispersed and harmful after the operation is complete.
Detection for the position where gas may leak The position where gas leak will be measured shall be
determined. The serial number of all valves and flanges to be checked shall
be determined in order to create the check table. The check table including check duration shall be created. Gas leak shall be checked by a gas leak detector. Maintenance or repairing of equipment or pipe that gas flows shall
be performed. : The area shall be enclosed before repairing the equipment or
pipe that the gas flows. : Ventilation shall be sufficient in the area of repair work. : Fuel-Air Ratio shall be intermittently measured before starting
the repair work and while performing the repair work. : Repair tool or equipment shall be non-sparking type. : Good maintenance shall be performed, such as regular check
of facilities, check and measurement of the thickness of pipe, which may cause leakage, etc.
The annual emergency drills shall be performed at the power plant and with Pluak Daeng Industrial Park. Besides, training on emergency preparedness and response shall be provided for personnel at least once a year. Emergency preparation plan for oil spill Diesel oil transfer measures in the public health/occupational health and safety action plan during the operation phase shall be followed.