Enhancing Reservoir Management Through the Use of Mechanical Evaporation Reduction Techniques
10
Enhancing Reservoir Management Through the Use of Mechanical Evaporation Reduction Techniques Fernanda Helfer, Hong Zhang and Charles Lemckert Griffith University ABSTRACT Large drinking water storage reservoirs are a critical component for the supply of quality water. With a growing population and limited resources water managers are required to seek efficient and effective methods to ensure a secure and adequate water supply. It is certainly evident that it is becoming difficult to secure and develop new dam sites (both on environmental and engineering grounds) and that new sources of fresh water (such as desalination) are costly and not environmentally sensitive. In south east Queensland up to 1/3 of freshwater is lost through evaporation, so it seems sensible to seek solutions to reduce such losses in a sustainable manner. This paper will examine three different evaporation reduction techniques – hard covers (eg. floating barriers), destratification and wind reduction devices (eg. windbreaks). A simple one- dimensional model was adapted to investigate the effectiveness of each technique for large storages. It was found that each of the techniques has it limitations for large storages, but that it appears the application of hard covers is the most efficient solution. INTRODUCTION Australia is regarded as the driest inhabited continent in the world. High evaporation rates, combined with low rainfall, lead to low river flows, and most of the country have to rely on the capacity of the dams for water supply to meet urban, industrial and irrigation requirements. However, current growing population and economy have been imposing great pressure on water resources, and the country has been demanding new strategies for increasing water availability and reducing water losses. Generally in the past, loss of water due to evaporation process had not posed a major problem in the country while opportunities to construct additional storages to save water had existed. However, today, with water demand often exceeding water availability, and with the threat of climate change and its unpredictable consequences, reducing evaporation from water storages is becoming a significant point. Mechanisms to Reduce Evaporation Using hard covers is one of the most effective measures to reduce evaporation. Suspended covers are horizontal sail-like structures that are suspended over the water surface and are supported externally by steel cables and poles. Floating covers are supported by the water itself, and need no extra support. Both covers reduce evaporation by blocking incoming solar radiation onto the water surface, thus reducing water surface temperature (Finn & Barnes, 2007; Martínez Álvarez et al., 2006). The suspended covers also reduce the wind action on the water surface and trap water vapour between themselves and the water surface, lowering the vapour pressure gradient over water and, consequently, the evaporation rate. The water-saving efficiency is dependent upon how the covers are installed and the rate at which water vapour can pass through the material. The water-saving efficiency is dependent upon the design and the shape of the modules, as well as the material. Reservoir destratification systems are mechanical devices designed to reduce water column stratification and increase the vertical transfer of dissolved oxygen. When operational, destratification systems lift cold bottom water to the surface, whereupon it mixes with the warmer surface waters before falling back down to a level of neutral buoyancy. This action uses the mechanical energy imparted by the destratification systems to reduce the level of stratification in the water column, which in turn allows natural processes to further mix the Enhancing Reservoir Management Through the Use of Mechanical Evaporation Reduction Techniques Helfer, Zhang, Lemckert Full Paper Peer Reviewed 2009 SSEE International Conference – Solutions for a Sustainable Planet 1 Society for Sustainability & Environmental Engineering, Melbourne, Victoria, Australia – 22-24 November 2009
Transcript of Enhancing Reservoir Management Through the Use of Mechanical Evaporation Reduction Techniques
Enhancing Reservoir Management Through the Use of Mechanical Evaporation Reduction Techniques
Fernanda Helfer, Hong Zhang and Charles LemckertGriffith University
ABSTRACTLarge drinking water storage reservoirs are a critical component for the supply of quality water. With a growing population and limited resources water managers are required to seek efficient and effective methods to ensure a secure and adequate water supply. It is certainly evident that it is becoming difficult to secure and develop new dam sites (both on environmental and engineering grounds) and that new sources of fresh water (such as desalination) are costly and not environmentally sensitive. In south east Queensland up to 1/3 of freshwater is lost through evaporation, so it seems sensible to seek solutions to reduce such losses in a sustainable manner. This paper will examine three different evaporation reduction techniques – hard covers (eg. floating barriers), destratification and wind reduction devices (eg. windbreaks). A simple one-dimensional model was adapted to investigate the effectiveness of each technique for large storages. It was found that each of the techniques has it limitations for large storages, but that it appears the application of hard covers is the most efficient solution.
INTRODUCTIONAustralia is regarded as the driest inhabited continent in the world. High evaporation rates, combined with low rainfall, lead to low river flows, and most of the country have to rely on the capacity of the dams for water supply to meet urban, industrial and irrigation requirements. However, current growing population and economy have been imposing great pressure on water resources, and the country has been demanding new strategies for increasing water availability and reducing water losses. Generally in the past, loss of water due to evaporation process had not posed a major problem in the country while opportunities to construct additional storages to save water had existed. However, today, with water demand often exceeding water availability, and with the threat of climate change and its unpredictable consequences, reducing evaporation from water storages is becoming a significant point.
Mechanisms to Reduce EvaporationUsing hard covers is one of the most effective measures to reduce evaporation. Suspended covers are horizontal sail-like structures that are suspended over the water surface and are supported externally by steel cables and poles. Floating covers are supported by the water itself, and need no extra support. Both covers reduce evaporation by blocking incoming solar radiation onto the water surface, thus reducing water surface temperature (Finn & Barnes, 2007; Martínez Álvarez et al., 2006). The suspended covers also reduce the wind action on the water surface and trap water vapour between themselves and the water surface, lowering the vapour pressure gradient over water and, consequently, the evaporation rate. The water-saving efficiency is dependent upon how the covers are installed and the rate at which water vapour can pass through the material. The water-saving efficiency is dependent upon the design and the shape of the modules, as well as the material.
Reservoir destratification systems are mechanical devices designed to reduce water column stratification and increase the vertical transfer of dissolved oxygen. When operational, destratification systems lift cold bottom water to the surface, whereupon it mixes with the warmer surface waters before falling back down to a level of neutral buoyancy. This action uses the mechanical energy imparted by the destratification systems to reduce the level of stratification in the water column, which in turn allows natural processes to further mix the
Enhancing Reservoir Management Through the Use of Mechanical Evaporation Reduction Techniques
Helfer, Zhang, Lemckert
Full Paper Peer Reviewed
2009 SSEE International Conference – Solutions for a Sustainable Planet 1Society for Sustainability & Environmental Engineering, Melbourne, Victoria, Australia – 22-24 November 2009
water column. This process may subsequently lead to reduced surface water temperature and evaporation rates.
Windbreaks can also reduce evaporation by limiting the volume of hot air that passes over the warm water surface. A moisture blanket over the water surface is developed as a consequence of the reduction of the rate at which moisture is removed from the water surface. The development of this moist layer acts to further reduce evaporation by reducing the humidity gradient between the water surface and the overlaying air. Additionally, decreasing effective wind speed will reduce the size and number of waves generated on the water surface and, therefore, minimise the area in contact with the atmosphere, restricting the potential of the evaporation process. The efficiency of a windbreak on wind speed reduction depends mainly on its permeability, height and orientation in relation to the prevailing wind (Hipsey et al. 2004; Heisler & Dewalle 1988; FAO 1989; Cleugh et al. 2002; Wang et al. 2001).
In this paper, a one-dimensional model was developed and was applied to understand the evaporation reduction from large storages when using hard covers, destratification devices and windbreaks. The one-dimensional approximation is valid when the forces acting to destabilize a water body (wind stress, surface cooling or plunging inflows) do not act over prolonged periods of time.
METHODSThe Penman-Monteith equation (Monteith 1965) was used to obtain a baseline estimate of evaporation from the studied water body:
(1)
where E (mm.d-1) is the daily evaporation rate; λ (MJ.Kg-1) is the latent heat of vaporisation; Δw (kPaoC-1) is the slope of the temperature saturation water vapour curve at surface water temperature; Q* (MJ.m-2.d-1) is the net radiation; N (MJ.m-2.d-1) is the change of heat storage in the water body; ρa (Kg.m-3) is the air density; Ca (MJ.Kg-1.oK-1) is the specific heat of air; ew* (kPa) is the saturated vapour pressure at water temperature; ea (kPa) is the vapour pressure above water; ra (s.m-1) is the aerodynamic resistance; and γ (kPaoC-1) is the psychrometric constant.
This model requires four sets of meteorological data: air temperature (Ta), vapour pressure (ea), wind speed (U10) and incoming solar radiation (K↓). Ta influences Q* and water temperature (Tw); ea influences the vapour pressure gradient and Tw; U10 affects ra and Tw; and K↓ affects Q*, N, Δw and Tw. Tw is a critical parameter in evaporation estimation, as all input data influences the output through influencing Tw.
The modifications made to the Penman-Monteith equation for testing each of the methods (i.e., hard covers, destratification and windbreaks) are presented below.
Hard CoversUnder covered conditions, the radiation energy balance at the water surface is influenced by the reflective, transmissive and absorptive properties of the cover, which depend on the cover material and cover colour. According to Martínez Álvarez et al. (2006), when the surface water is shaded by suspended covers of porous cloth, the net radiation balance equation becomes:
(2)
Enhancing Reservoir Management Through the Use of Mechanical Evaporation Reduction Techniques
Helfer, Zhang, Lemckert
Full Paper Peer Reviewed
2009 SSEE International Conference – Solutions for a Sustainable Planet 2Society for Sustainability & Environmental Engineering, Melbourne, Victoria, Australia – 22-24 November 2009
where βts is the short-wave radiation transmitted ratio through the cover; βtl is the long-wave radiation transmitted ratio through the cover; βrl is the long-wave radiation reflected ratio by the cover; K↓ and L↓ are incoming short-wave and long-wave radiation; L↑ is the outgoing long-wave radiation from the water body. In this study, the published black polyethylene cover parameters were used, with βtl = 6.4%, βrl = 15% and βts = 78.6% (Martínez Álvarez et al. 2006). As also proposed by these authors, the wind speed U10 is reduced by:
(3)
where U10cover is the equivalent wind speed at 10 m height with suspended covers; U10 is the wind speed at 10 m height without suspended covers; and z0 is the surface roughness. The wind speed is then converted to different heights:
(4)
where U0.15cover is the wind speed at 0.15 m height after using covers; U2 is the wind speed at 2 m height. The reduced wind due to the suspended cover affects the aerodynamic resistance to evaporative mass transfer.
Floating sheets were chosen as the floating covers to be studied. The radiation balance in this case becomes:
(5)
where βas is the short-wave absorption ratio of the floating sheets and βal is the short-wave absorption ratio of the floating sheets and QA is the sensible heat transfer from the surface to the air. The surface temperature due to the cover and the sensible heat transfer QA can be estimated using (Cooley 1970):
(6)
where σ is the Stefan-Boltzman constant for blackbody radiation. The published parameters for white floating sheet were used, where the absorption ratio, βas = 20%, and βal = 95% (Martínez Álvarez et al. 2006).
To assess the effectiveness of the coverage, the annual evaporation, according to different coverage, is calculated by:
(7)
where E is the daily evaporation, x is the fraction of covered area, ranging from 0 to 1; Ebase is the daily evaporation without the use of covers; and Ecover is the daily evaporation with 100% coverage.
Enhancing Reservoir Management Through the Use of Mechanical Evaporation Reduction Techniques
Helfer, Zhang, Lemckert
Full Paper Peer Reviewed
2009 SSEE International Conference – Solutions for a Sustainable Planet 3Society for Sustainability & Environmental Engineering, Melbourne, Victoria, Australia – 22-24 November 2009
DestratificationIn order to obtain an estimate of evaporation under destratification conditions, the temperature profile within the water column was modelled to obtain an accurate energy budget. In the present study, the vertical temperature profile was simulated using the following one-dimensional model (Orlob 1983; Schertzer & Lam 1989):
(8)
where A(zn) (km2) is the area of water surface at depth z(n); Tw(zn) (°C) is the water temperature at depth z(n); KH (m2 s-1) is the vertical eddy diffusion coefficient for energy in the water defined in Jacobs et al. (1998) and Molina Martínez et al. (2006); β (m2 s-1) is the molecular diffusion coefficient for energy in the water; and K(zn) (MJ m-2 d-1) is the short-wave radiation penetrating at depth z(n) defined by Lee et al. (2005), Lei and Patterson (2002) and Sweeney et al. (2005) by:
(9)
where α is the albedo, Ex is the light extinction coefficient and Z is the elevation of depth z(n).
The purpose of calculating the water body temperature profile is to obtain the water column mean temperature (Tmean), which is equivalent to the temperature obtained if the water column was well-mixed (i.e., destratified).
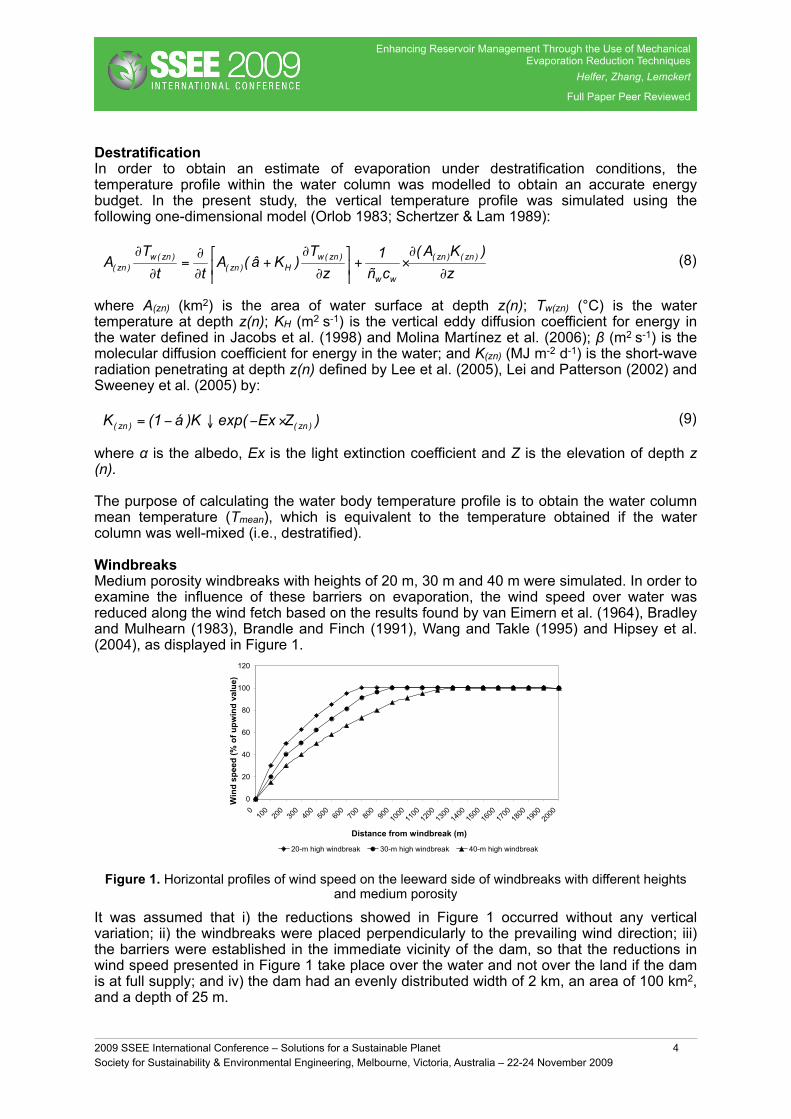
WindbreaksMedium porosity windbreaks with heights of 20 m, 30 m and 40 m were simulated. In order to examine the influence of these barriers on evaporation, the wind speed over water was reduced along the wind fetch based on the results found by van Eimern et al. (1964), Bradley and Mulhearn (1983), Brandle and Finch (1991), Wang and Takle (1995) and Hipsey et al. (2004), as displayed in Figure 1.
Figure 1. Horizontal profiles of wind speed on the leeward side of windbreaks with different heights and medium porosity
It was assumed that i) the reductions showed in Figure 1 occurred without any vertical variation; ii) the windbreaks were placed perpendicularly to the prevailing wind direction; iii) the barriers were established in the immediate vicinity of the dam, so that the reductions in wind speed presented in Figure 1 take place over the water and not over the land if the dam is at full supply; and iv) the dam had an evenly distributed width of 2 km, an area of 100 km2, and a depth of 25 m.
Enhancing Reservoir Management Through the Use of Mechanical Evaporation Reduction Techniques
Helfer, Zhang, Lemckert
Full Paper Peer Reviewed
2009 SSEE International Conference – Solutions for a Sustainable Planet 4Society for Sustainability & Environmental Engineering, Melbourne, Victoria, Australia – 22-24 November 2009
RESULTSThe studied domain was Wivenhoe Dam, located in Queensland, Australia (27.4944 S, 152.6889 E). The reservoir is built on the Brisbane River, about 65 km from Brisbane city. It was selected as the reservoir to examine the influence of hard covers, destratification and windbreaks on evaporation reduction. The surface area and water storage data of the reservoir were provided by Southeast Queensland Water. At full supply level (67 m above sea level), Wivenhoe Dam has a surface area of 107.5 km2 and a capacity of 1,165,238 ML (SEQ Water). Its average width at full supply level is about 2 km, and its average depth is 25 m (Yao 2008).
The period of simulation used in the analysis of hard covers and windbreaks ran from January 2007 to January 2008. The meteorological data set was obtained from University of Queensland Gatton station (site no. 040082). For destratification, the period of simulation was from January 1984 to December 1986, with data set obtained from BOM. The wind speed was measured at 10 m above ground.
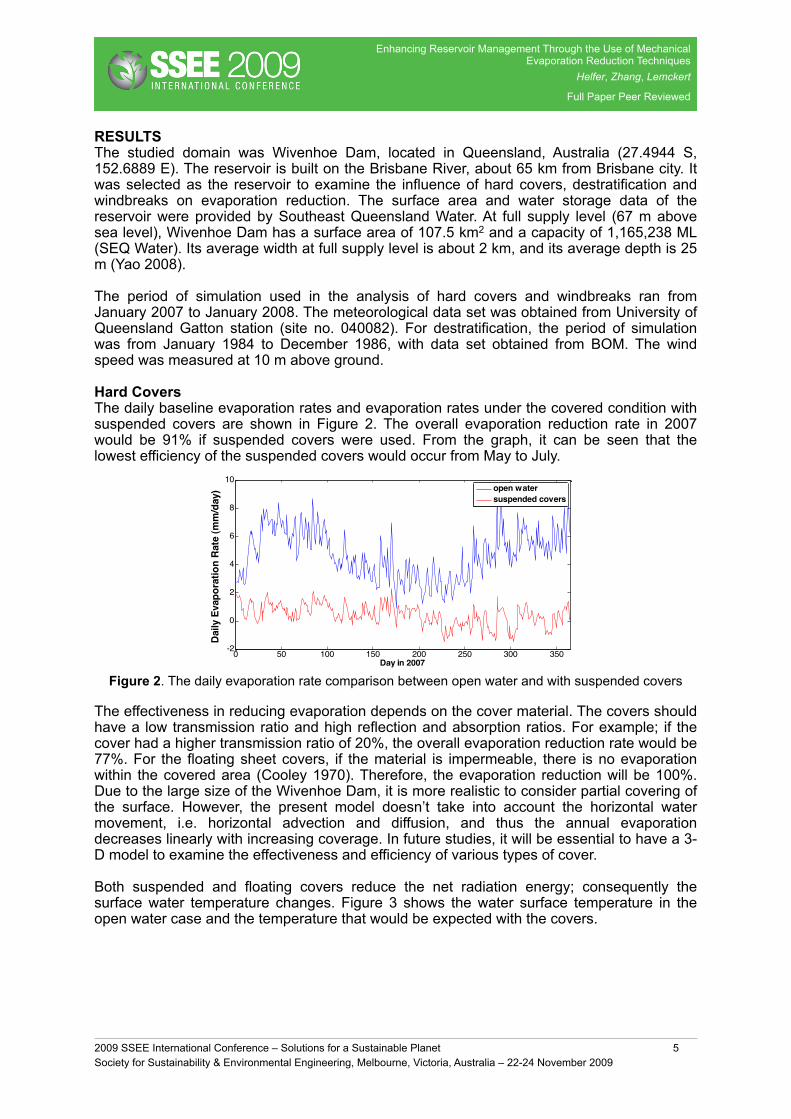
Hard CoversThe daily baseline evaporation rates and evaporation rates under the covered condition with suspended covers are shown in Figure 2. The overall evaporation reduction rate in 2007 would be 91% if suspended covers were used. From the graph, it can be seen that the lowest efficiency of the suspended covers would occur from May to July.
Figure 2. The daily evaporation rate comparison between open water and with suspended covers
The effectiveness in reducing evaporation depends on the cover material. The covers should have a low transmission ratio and high reflection and absorption ratios. For example; if the cover had a higher transmission ratio of 20%, the overall evaporation reduction rate would be 77%. For the floating sheet covers, if the material is impermeable, there is no evaporation within the covered area (Cooley 1970). Therefore, the evaporation reduction will be 100%. Due to the large size of the Wivenhoe Dam, it is more realistic to consider partial covering of the surface. However, the present model doesn’t take into account the horizontal water movement, i.e. horizontal advection and diffusion, and thus the annual evaporation decreases linearly with increasing coverage. In future studies, it will be essential to have a 3-D model to examine the effectiveness and efficiency of various types of cover.
Both suspended and floating covers reduce the net radiation energy; consequently the surface water temperature changes. Figure 3 shows the water surface temperature in the open water case and the temperature that would be expected with the covers.
Enhancing Reservoir Management Through the Use of Mechanical Evaporation Reduction Techniques
Helfer, Zhang, Lemckert
Full Paper Peer Reviewed
2009 SSEE International Conference – Solutions for a Sustainable Planet 5Society for Sustainability & Environmental Engineering, Melbourne, Victoria, Australia – 22-24 November 2009
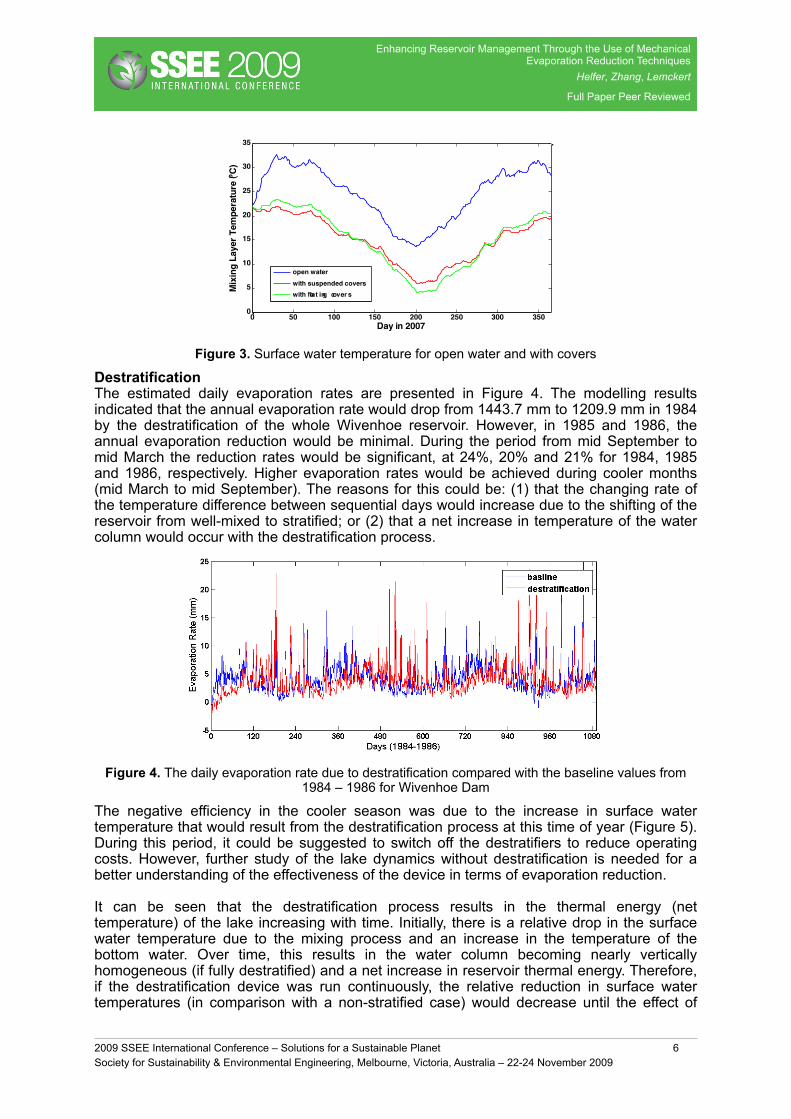
Figure 3. Surface water temperature for open water and with covers
DestratificationThe estimated daily evaporation rates are presented in Figure 4. The modelling results indicated that the annual evaporation rate would drop from 1443.7 mm to 1209.9 mm in 1984 by the destratification of the whole Wivenhoe reservoir. However, in 1985 and 1986, the annual evaporation reduction would be minimal. During the period from mid September to mid March the reduction rates would be significant, at 24%, 20% and 21% for 1984, 1985 and 1986, respectively. Higher evaporation rates would be achieved during cooler months (mid March to mid September). The reasons for this could be: (1) that the changing rate of the temperature difference between sequential days would increase due to the shifting of the reservoir from well-mixed to stratified; or (2) that a net increase in temperature of the water column would occur with the destratification process.
Figure 4. The daily evaporation rate due to destratification compared with the baseline values from 1984 – 1986 for Wivenhoe Dam
The negative efficiency in the cooler season was due to the increase in surface water temperature that would result from the destratification process at this time of year (Figure 5). During this period, it could be suggested to switch off the destratifiers to reduce operating costs. However, further study of the lake dynamics without destratification is needed for a better understanding of the effectiveness of the device in terms of evaporation reduction.
It can be seen that the destratification process results in the thermal energy (net temperature) of the lake increasing with time. Initially, there is a relative drop in the surface water temperature due to the mixing process and an increase in the temperature of the bottom water. Over time, this results in the water column becoming nearly vertically homogeneous (if fully destratified) and a net increase in reservoir thermal energy. Therefore, if the destratification device was run continuously, the relative reduction in surface water temperatures (in comparison with a non-stratified case) would decrease until the effect of
Enhancing Reservoir Management Through the Use of Mechanical Evaporation Reduction Techniques
Helfer, Zhang, Lemckert
Full Paper Peer Reviewed
2009 SSEE International Conference – Solutions for a Sustainable Planet 6Society for Sustainability & Environmental Engineering, Melbourne, Victoria, Australia – 22-24 November 2009
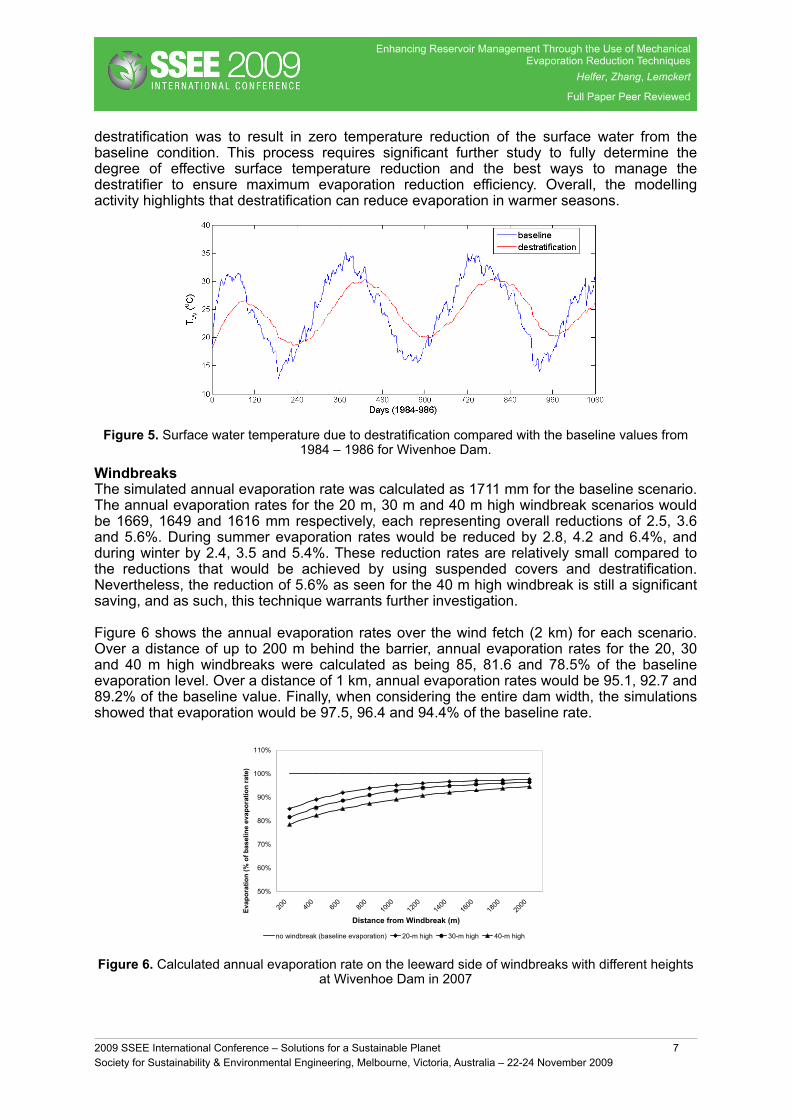
destratification was to result in zero temperature reduction of the surface water from the baseline condition. This process requires significant further study to fully determine the degree of effective surface temperature reduction and the best ways to manage the destratifier to ensure maximum evaporation reduction efficiency. Overall, the modelling activity highlights that destratification can reduce evaporation in warmer seasons.
Figure 5. Surface water temperature due to destratification compared with the baseline values from 1984 – 1986 for Wivenhoe Dam.
WindbreaksThe simulated annual evaporation rate was calculated as 1711 mm for the baseline scenario. The annual evaporation rates for the 20 m, 30 m and 40 m high windbreak scenarios would be 1669, 1649 and 1616 mm respectively, each representing overall reductions of 2.5, 3.6 and 5.6%. During summer evaporation rates would be reduced by 2.8, 4.2 and 6.4%, and during winter by 2.4, 3.5 and 5.4%. These reduction rates are relatively small compared to the reductions that would be achieved by using suspended covers and destratification. Nevertheless, the reduction of 5.6% as seen for the 40 m high windbreak is still a significant saving, and as such, this technique warrants further investigation.
Figure 6 shows the annual evaporation rates over the wind fetch (2 km) for each scenario. Over a distance of up to 200 m behind the barrier, annual evaporation rates for the 20, 30 and 40 m high windbreaks were calculated as being 85, 81.6 and 78.5% of the baseline evaporation level. Over a distance of 1 km, annual evaporation rates would be 95.1, 92.7 and 89.2% of the baseline value. Finally, when considering the entire dam width, the simulations showed that evaporation would be 97.5, 96.4 and 94.4% of the baseline rate.
Figure 6. Calculated annual evaporation rate on the leeward side of windbreaks with different heights at Wivenhoe Dam in 2007
Enhancing Reservoir Management Through the Use of Mechanical Evaporation Reduction Techniques
Helfer, Zhang, Lemckert
Full Paper Peer Reviewed
2009 SSEE International Conference – Solutions for a Sustainable Planet 7Society for Sustainability & Environmental Engineering, Melbourne, Victoria, Australia – 22-24 November 2009
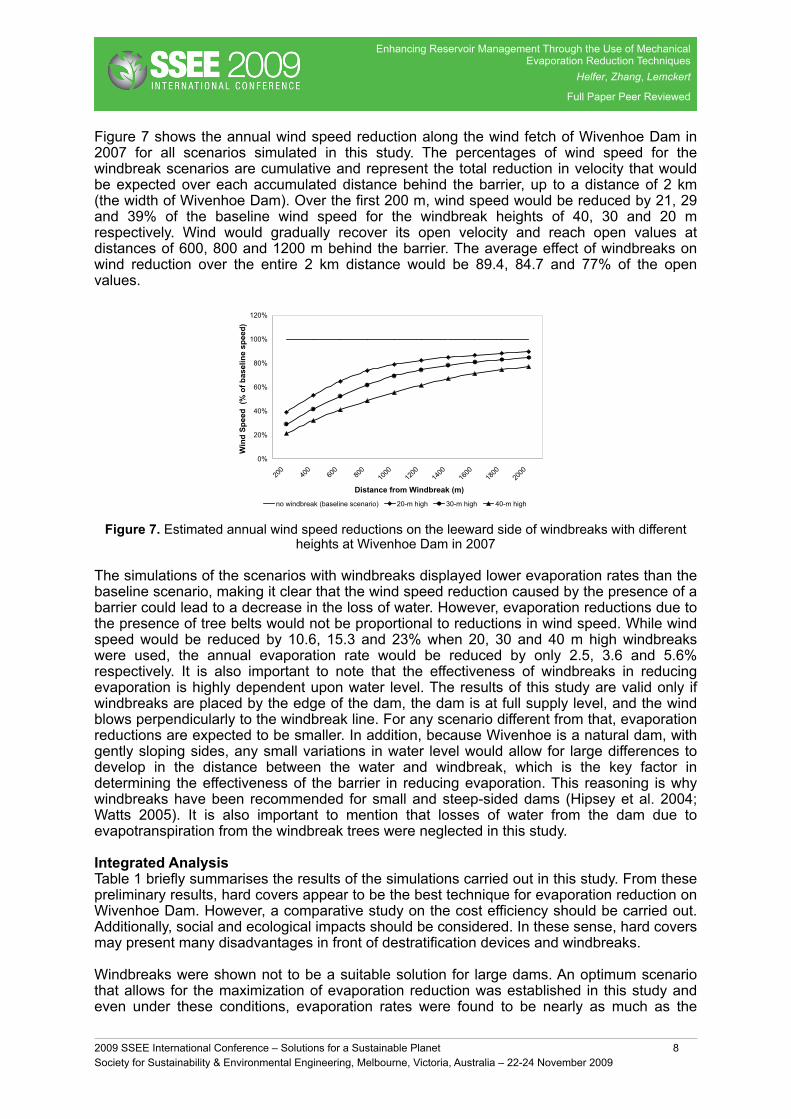
Figure 7 shows the annual wind speed reduction along the wind fetch of Wivenhoe Dam in 2007 for all scenarios simulated in this study. The percentages of wind speed for the windbreak scenarios are cumulative and represent the total reduction in velocity that would be expected over each accumulated distance behind the barrier, up to a distance of 2 km (the width of Wivenhoe Dam). Over the first 200 m, wind speed would be reduced by 21, 29 and 39% of the baseline wind speed for the windbreak heights of 40, 30 and 20 m respectively. Wind would gradually recover its open velocity and reach open values at distances of 600, 800 and 1200 m behind the barrier. The average effect of windbreaks on wind reduction over the entire 2 km distance would be 89.4, 84.7 and 77% of the open values.
Figure 7. Estimated annual wind speed reductions on the leeward side of windbreaks with different heights at Wivenhoe Dam in 2007
The simulations of the scenarios with windbreaks displayed lower evaporation rates than the baseline scenario, making it clear that the wind speed reduction caused by the presence of a barrier could lead to a decrease in the loss of water. However, evaporation reductions due to the presence of tree belts would not be proportional to reductions in wind speed. While wind speed would be reduced by 10.6, 15.3 and 23% when 20, 30 and 40 m high windbreaks were used, the annual evaporation rate would be reduced by only 2.5, 3.6 and 5.6% respectively. It is also important to note that the effectiveness of windbreaks in reducing evaporation is highly dependent upon water level. The results of this study are valid only if windbreaks are placed by the edge of the dam, the dam is at full supply level, and the wind blows perpendicularly to the windbreak line. For any scenario different from that, evaporation reductions are expected to be smaller. In addition, because Wivenhoe is a natural dam, with gently sloping sides, any small variations in water level would allow for large differences to develop in the distance between the water and windbreak, which is the key factor in determining the effectiveness of the barrier in reducing evaporation. This reasoning is why windbreaks have been recommended for small and steep-sided dams (Hipsey et al. 2004; Watts 2005). It is also important to mention that losses of water from the dam due to evapotranspiration from the windbreak trees were neglected in this study.
Integrated AnalysisTable 1 briefly summarises the results of the simulations carried out in this study. From these preliminary results, hard covers appear to be the best technique for evaporation reduction on Wivenhoe Dam. However, a comparative study on the cost efficiency should be carried out. Additionally, social and ecological impacts should be considered. In these sense, hard covers may present many disadvantages in front of destratification devices and windbreaks.
Windbreaks were shown not to be a suitable solution for large dams. An optimum scenario that allows for the maximization of evaporation reduction was established in this study and even under these conditions, evaporation rates were found to be nearly as much as the
Enhancing Reservoir Management Through the Use of Mechanical Evaporation Reduction Techniques
Helfer, Zhang, Lemckert
Full Paper Peer Reviewed
2009 SSEE International Conference – Solutions for a Sustainable Planet 8Society for Sustainability & Environmental Engineering, Melbourne, Victoria, Australia – 22-24 November 2009
baseline values. This made it clear that in Wivenhoe Dam, it would be more important to reduce the amount of incident solar radiation upon the water instead of just minimising wind speed.
The efficiency of destratification, in turn, was shown to be a function of the operation of the destratification system, and therefore, further simulation is required. An appropriate strategy for operating the system may provide higher evaporation reductions. In addition, this method contributes to the improvement of water quality, and this should also be considered. Finally, other methods such as the use of monolayers and modifying the dam’s shape should be integrated in an analysis for choosing the best mechanism for reducing evaporation from any large dam.
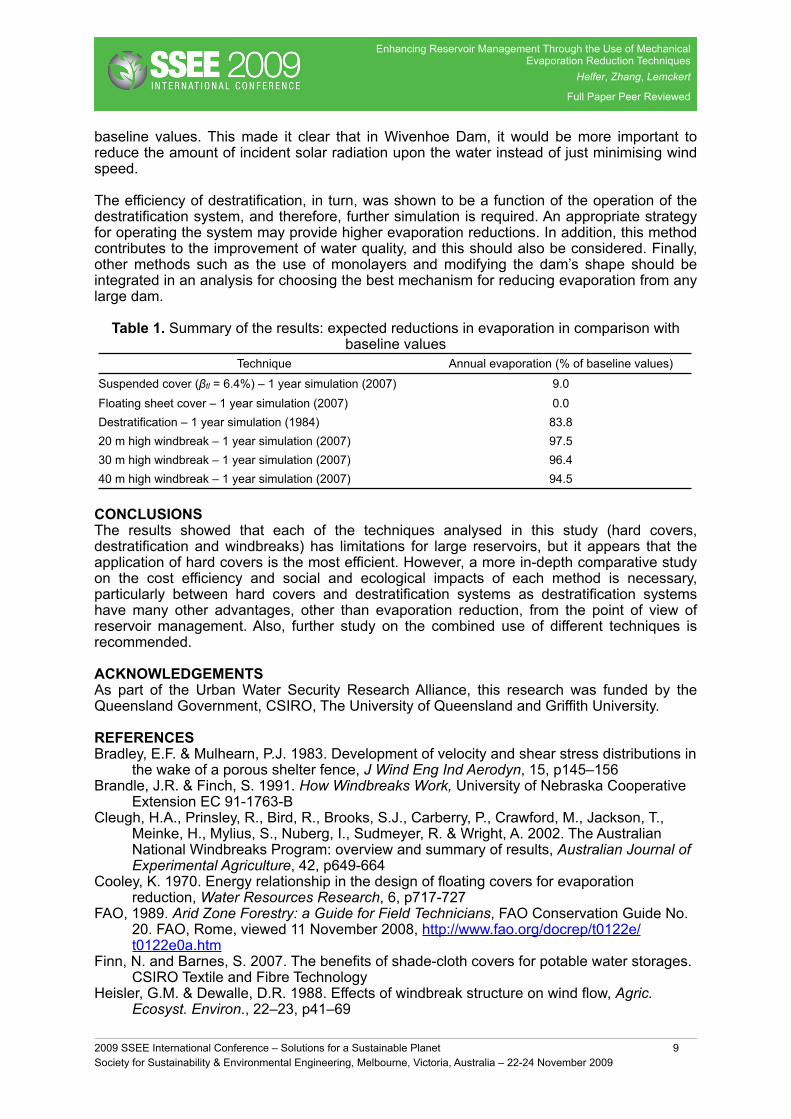
Table 1. Summary of the results: expected reductions in evaporation in comparison with baseline values
Technique Annual evaporation (% of baseline values)
Suspended cover (βtl = 6.4%) – 1 year simulation (2007) 9.0Floating sheet cover – 1 year simulation (2007) 0.0Destratification – 1 year simulation (1984) 83.820 m high windbreak – 1 year simulation (2007) 97.530 m high windbreak – 1 year simulation (2007) 96.440 m high windbreak – 1 year simulation (2007) 94.5
CONCLUSIONSThe results showed that each of the techniques analysed in this study (hard covers, destratification and windbreaks) has limitations for large reservoirs, but it appears that the application of hard covers is the most efficient. However, a more in-depth comparative study on the cost efficiency and social and ecological impacts of each method is necessary, particularly between hard covers and destratification systems as destratification systems have many other advantages, other than evaporation reduction, from the point of view of reservoir management. Also, further study on the combined use of different techniques is recommended.
ACKNOWLEDGEMENTSAs part of the Urban Water Security Research Alliance, this research was funded by the Queensland Government, CSIRO, The University of Queensland and Griffith University.
REFERENCESBradley, E.F. & Mulhearn, P.J. 1983. Development of velocity and shear stress distributions in
the wake of a porous shelter fence, J Wind Eng Ind Aerodyn, 15, p145–156Brandle, J.R. & Finch, S. 1991. How Windbreaks Work, University of Nebraska Cooperative
Extension EC 91-1763-BCleugh, H.A., Prinsley, R., Bird, R., Brooks, S.J., Carberry, P., Crawford, M., Jackson, T.,
Meinke, H., Mylius, S., Nuberg, I., Sudmeyer, R. & Wright, A. 2002. The Australian National Windbreaks Program: overview and summary of results, Australian Journal of Experimental Agriculture, 42, p649-664
Cooley, K. 1970. Energy relationship in the design of floating covers for evaporation reduction, Water Resources Research, 6, p717-727
FAO, 1989. Arid Zone Forestry: a Guide for Field Technicians, FAO Conservation Guide No. 20. FAO, Rome, viewed 11 November 2008, http://www.fao.org/docrep/t0122e/t0122e0a.htm
Finn, N. and Barnes, S. 2007. The benefits of shade-cloth covers for potable water storages. CSIRO Textile and Fibre Technology
Heisler, G.M. & Dewalle, D.R. 1988. Effects of windbreak structure on wind flow, Agric. Ecosyst. Environ., 22–23, p41–69
Enhancing Reservoir Management Through the Use of Mechanical Evaporation Reduction Techniques
Helfer, Zhang, Lemckert
Full Paper Peer Reviewed
2009 SSEE International Conference – Solutions for a Sustainable Planet 9Society for Sustainability & Environmental Engineering, Melbourne, Victoria, Australia – 22-24 November 2009
Hipsey, M.R., Sivapalan, M. & Clement, T.P. 2004. A numerical and field investigation of surface heat fluxes from small wind-sheltered water bodies in semi-arid Western Australia, Environ. Fluid Mech., 4, p79-106
Jacobs, A.F.G., Heusinkveld, B.G. and Lucassen, D.C. 1998. Temperature variation in a class A evaporation pan, Journal of Hydrology, 206, p75-83
Lee, Z.-P., Du, K.P., Arnone, R., Liew, S.C. and Penta, B. 2005. Penetration of solar radiation in the upper ocean: a numerical model for oceanic and coastal waters, Journal of Geophysical Research, 110, C09019
Lei, C. and Patterson, J.C. 2002. Natural convection in a reservoir sidearm subject to solar radiation: a two-dimensional simulation, Numerical Heat Transfer, 42, p13-32
Martínez Álvarez, V., Baille, A., Molina Martínez, J.M. and Gonzáles-Real, M.M. 2006. Effect of black polyethylene shade covers on the evaporation rate of agricultural reservoirs, Spanish Journal of Agricultural Research, 4, p280-288
Molina Martínez, J.M., Martínez Álvarez, V., Gonzáles-Real, M.M. and Baille, A. 2006. A simulation model for predicting hourly pan evaporation from meteorological data. Journal of Hydrology, 318, p250-261
Monteith, J.L. 1965. Evaporation and the environment. In The State and Movement of Water in Living Organisms (G.E. Fogg, ed). London: Cambridge University Press
Orlob, G.T. 1983. One-dimensional Models for Simulation of Water Quality in Lakes and Reservoirs. In Mathematical modelling of water quality: streams, lakes, and reservoirs (G.T. Orlob, ed). New York: John Wiley & Sons
Schertzer, W.M. and Lam, D.C.L. 1989. Modelling Lake Erie Water Quality — A Case Study (trans.) R.H. French. In Decision Support Techniques for Lakes and Reservoirs (B. Henderson-Sellers, ed), Water Quality Modelling. Boca Raton, Florida: CRC Press, Inc
Sweeney, C., Gnanadesikan, A., Griffies, S.M., Harrison, M.J., Rosati, A.J. and Samuels, B.L. 2005. Impacts of Shortwave Penetration Depth on Large-Scale Ocean Circulation and Heat Transport, Journal of Physical Oceanography, 35, p1103-1119
van Eimern, J., Karshon, R., Razumova, L.A. and Robertson, G.W. 1964. Windbreaks and Shelterbelts, World Meteorol. Org. Technical Note No. 59
Wang, H. and Takle, E.S. 1995. Numerical simulations of shelterbelt effects on wind direction, Boundary-Layer Meteorol., 75, p141–173
Wang, H., Takle, A. and Shen, J. 2001. Shelterbelts and Windbreaks: mathematical modelling and computer simulations of turbulent flows. Annu. Rev. Fluid Mech., 33, p549-86
Watts, P.J. 2005. Scoping Study – Reduction of Evaporation from Farm Dams. Final report to the National Program for Sustainable Irrigation. Feedlot Services Australia Pty Ltd, Toowoomba
Yao, X. 2008. An Improved 2-D Numeric Model for Open-Water Daily Evaporation Estimation. BSc Thesis, Griffith University
Enhancing Reservoir Management Through the Use of Mechanical Evaporation Reduction Techniques
Helfer, Zhang, Lemckert
Full Paper Peer Reviewed
2009 SSEE International Conference – Solutions for a Sustainable Planet 10Society for Sustainability & Environmental Engineering, Melbourne, Victoria, Australia – 22-24 November 2009