Enhanced viral production and infection of bacterioplankton during an iron-induced phytoplankton...
11
Enhanced viral production and infection of bacterioplankton during an iron-induced phytoplankton bloom in the Southern Ocean Markus G. Weinbauer, a,b,* Jesus-Maria Arrieta, b,c Christian Griebler, d and Gerhard J. Herndl b,e a CNRS, Laboratoire d’Oce ´anographie de Villefranche, France; Universite ´ Pierre et Marie Curie-Paris6, Laboratoire d’Oce ´anographie de Villefranche, France b Department of Biological Oceanography, Royal Netherlands Institute for Sea Research (NIOZ), Texel, The Netherlands c Instituto Mediterra ´ neo de Estudios Avanzados (IMEDEA), CSIC-UIB, Esporles, Mallorca, Spain d Institute of Groundwater Ecology, Helmholtz Center Munich, German Research Center for Environmental Health, Neuherberg, Germany e Department of Marine Biology, University of Vienna, Vienna, Austria Abstract We followed the viral response to Fe-enrichment over 3 weeks during the second iron-enrichment experiment (EisenEx) in the Southern Ocean. Although viral abundance increased in a rather constant way during the course of the experiment inside the patch, the production of bacterial viruses and the fraction of infected cells in bacterioplankton exhibited pronounced maxima on days 7 and 21. In contrast, these parameters remained fairly constant outside the Fe-fertilized patch. Viral production was also stimulated directly after the Fe-enrichment. Within the Fe-replete patch, viral abundance and production was on average 2- and 3-fold, respectively, higher than outside the patch. On average 40% of the bacteria contained viruses in a lytic stage inside the Fe-replete patch compared to 21% outside the patch. About 11–12% of the bacteria contained a viral genome inducible with mitomycin C in both inside and outside the patch. Randomly amplified polymorphic desoxyribonucleic acid polymerase chain reaction analysis suggested the development of a specific viral community in the patch. Although short-term stimulation of viral production was likely due to increased bacterial activity, the long-term stimulation was likely also influenced by an increased encounter rate between bacterial viruses and hosts. Viral lysis was responsible for most of the bacterioplankton mortality in the patch. Overall, most of the bacterial carbon production entered the detrital or dissolved organic matter pool via the viral shunt in the patch. Iron is required for almost all life forms and participates in many biological processes such as respiration and desoxyribonucleic acid (DNA) synthesis (Andrews et al. 2003). Vast parts of the ocean are high-nutrient low- chlorophyll (HNLC) areas, now attributed to iron limita- tion. In several mesoscale in situ experiments it was shown that iron enrichment induced phytoplankton blooms leading to a draw-down of atmospheric CO 2 and transporting organic carbon out of the surface mixed layer (Boyd et al. 2007). Such experiments have also shown an enhancement of bacterial biomass and production in the Pacific (Cochlan 2001) and Southern Ocean (Hall and Safi 2001; Oliver et al. 2004). However, it is still unclear, whether bacteria in HNLC areas are iron- (Pakulski et al. 1996; Tortell et al. 1996) or carbon- and nitrogen-limited (Church et al. 2000; Kirchman et al. 2000). A certain level of co-limitation of Fe and organic carbon and nitrogen has also been observed (Church et al. 2000). Heterotrophic bacteria are responsible for 20–45% of biological iron uptake, compete directly with phytoplankton for iron (Tortell et al. 1996) and may thus be partially responsible for HNLC conditions. Viruses infecting bacteria can play different roles in microbial food webs (Wommack and Colwell 2000). Lytic viruses infect cells, replicate and then destroy cells by lysis, setting free viral progeny and cellular lysis products. It was estimated that between 6% and 26% of photosynthetically fixed carbon will ultimately be shunted into the detrital and dissolved organic carbon pool by viral lysis of cells at all trophic levels (Wilhelm and Suttle 1999). This carbon can be used by bacteria and is, therefore, largely diverted from higher trophic levels, resulting in an overall stimulation of bacterial production and respiration (Fuhrman 1999). Thus, viruses can be seen as catalysts of carbon and nutrient cycling (Suttle 2005). Temperate viruses remain within the cell in a dormant stage and replicate along with the hosts, until the lytic cycle is induced. It has been shown that solar radiation and hydrogen peroxide can induce the lytic cycle in marine bacterial communities (Jiang and Paul 1996; Weinbauer and Suttle 1999). Also, it was suggested that enhanced growth causes temperate viruses to enter the lytic cycle (Wilson and Mann 1997). The significance and nature of inducing agents in situ remain largely unknown. The association between temperate viruses and hosts can increase the fitness of the host by conferring morphologic or metabolic traits encoded in the viral genome and, thus, influence bacterial diversity and activity. To the best of our knowledge, nothing is known on the role of iron for marine lysogens or on responses of lysogenic bacterioplankton in iron-induced phytoplankton blooms. The role of iron for viral dynamics is poorly studied. Poorvin et al. (2004) found that viral lysis regenerates iron, which can sustain a significant fraction of primary productivity, and Daughney et al. (2005) have shown that viruses might serve as nuclei for iron adsorption and precipitation. Mioni et al. (2005) demonstrated that * Corresponding author: [email protected] Limnol. Oceanogr., 54(3), 2009, 774–784 E 2009, by the American Society of Limnology and Oceanography, Inc. 774
Transcript of Enhanced viral production and infection of bacterioplankton during an iron-induced phytoplankton...

Enhanced viral production and infection of bacterioplankton during an iron-induced
phytoplankton bloom in the Southern Ocean
Markus G. Weinbauer,a,b,* Jesus-Maria Arrieta,b,c Christian Griebler,d and Gerhard J. Herndlb,e
a CNRS, Laboratoire d’Oceanographie de Villefranche, France; Universite Pierre et Marie Curie-Paris6, Laboratoire d’Oceanographie deVillefranche, France
bDepartment of Biological Oceanography, Royal Netherlands Institute for Sea Research (NIOZ), Texel, The Netherlandsc Instituto Mediterraneo de Estudios Avanzados (IMEDEA), CSIC-UIB, Esporles, Mallorca, SpaindInstitute of Groundwater Ecology, Helmholtz Center Munich, German Research Center for Environmental Health, Neuherberg,
Germanye Department of Marine Biology, University of Vienna, Vienna, Austria
Abstract
We followed the viral response to Fe-enrichment over 3 weeks during the second iron-enrichment experiment(EisenEx) in the Southern Ocean. Although viral abundance increased in a rather constant way during the courseof the experiment inside the patch, the production of bacterial viruses and the fraction of infected cells inbacterioplankton exhibited pronounced maxima on days 7 and 21. In contrast, these parameters remained fairlyconstant outside the Fe-fertilized patch. Viral production was also stimulated directly after the Fe-enrichment.Within the Fe-replete patch, viral abundance and production was on average 2- and 3-fold, respectively, higherthan outside the patch. On average 40% of the bacteria contained viruses in a lytic stage inside the Fe-repletepatch compared to 21% outside the patch. About 11–12% of the bacteria contained a viral genome inducible withmitomycin C in both inside and outside the patch. Randomly amplified polymorphic desoxyribonucleic acidpolymerase chain reaction analysis suggested the development of a specific viral community in the patch.Although short-term stimulation of viral production was likely due to increased bacterial activity, the long-termstimulation was likely also influenced by an increased encounter rate between bacterial viruses and hosts. Virallysis was responsible for most of the bacterioplankton mortality in the patch. Overall, most of the bacterial carbonproduction entered the detrital or dissolved organic matter pool via the viral shunt in the patch.
Iron is required for almost all life forms and participatesin many biological processes such as respiration anddesoxyribonucleic acid (DNA) synthesis (Andrews et al.2003). Vast parts of the ocean are high-nutrient low-chlorophyll (HNLC) areas, now attributed to iron limita-tion. In several mesoscale in situ experiments it was shownthat iron enrichment induced phytoplankton blooms leadingto a draw-down of atmospheric CO2 and transportingorganic carbon out of the surface mixed layer (Boyd et al.2007). Such experiments have also shown an enhancement ofbacterial biomass and production in the Pacific (Cochlan2001) and Southern Ocean (Hall and Safi 2001; Oliver et al.2004). However, it is still unclear, whether bacteria in HNLCareas are iron- (Pakulski et al. 1996; Tortell et al. 1996) orcarbon- and nitrogen-limited (Church et al. 2000; Kirchmanet al. 2000). A certain level of co-limitation of Fe and organiccarbon and nitrogen has also been observed (Church et al.2000). Heterotrophic bacteria are responsible for 20–45% ofbiological iron uptake, compete directly with phytoplanktonfor iron (Tortell et al. 1996) and may thus be partiallyresponsible for HNLC conditions.
Viruses infecting bacteria can play different roles inmicrobial food webs (Wommack and Colwell 2000). Lyticviruses infect cells, replicate and then destroy cells by lysis,setting free viral progeny and cellular lysis products. It wasestimated that between 6% and 26% of photosyntheticallyfixed carbon will ultimately be shunted into the detrital and
dissolved organic carbon pool by viral lysis of cells at alltrophic levels (Wilhelm and Suttle 1999). This carbon canbe used by bacteria and is, therefore, largely diverted fromhigher trophic levels, resulting in an overall stimulation ofbacterial production and respiration (Fuhrman 1999).Thus, viruses can be seen as catalysts of carbon andnutrient cycling (Suttle 2005).
Temperate viruses remain within the cell in a dormantstage and replicate along with the hosts, until the lytic cycleis induced. It has been shown that solar radiation andhydrogen peroxide can induce the lytic cycle in marinebacterial communities (Jiang and Paul 1996; Weinbauerand Suttle 1999). Also, it was suggested that enhancedgrowth causes temperate viruses to enter the lytic cycle(Wilson and Mann 1997). The significance and nature ofinducing agents in situ remain largely unknown. Theassociation between temperate viruses and hosts canincrease the fitness of the host by conferring morphologicor metabolic traits encoded in the viral genome and, thus,influence bacterial diversity and activity. To the best of ourknowledge, nothing is known on the role of iron for marinelysogens or on responses of lysogenic bacterioplankton iniron-induced phytoplankton blooms.
The role of iron for viral dynamics is poorly studied.Poorvin et al. (2004) found that viral lysis regenerates iron,which can sustain a significant fraction of primaryproductivity, and Daughney et al. (2005) have shown thatviruses might serve as nuclei for iron adsorption andprecipitation. Mioni et al. (2005) demonstrated that* Corresponding author: [email protected]
Limnol. Oceanogr., 54(3), 2009, 774–784
E 2009, by the American Society of Limnology and Oceanography, Inc.
774
organically complexed iron in viral lysis products is highlybioavailable and Strzepek et al. (2005) report on highlyvariable virus-mediated iron regeneration rates during theFeCycle mesoscale experiment. During the EisenEx exper-iment, a phytoplankton bloom was induced upon ironaddition and its development was followed for 3 weeks(Gervais et al. 2002). Bacterial biomass formation andenzymatic activity was enhanced as well and a short-termstimulation of bacterial activity could be observed (Arrietaet al. 2004). An enhanced bacterioplankton production andbiomass could also result in a stimulation of viralproduction, either by enhanced infection or by a fasterturnover of the microbial food web. Finally, an enhancedbacterial growth could also induce the lytic cycle inlysogenic bacterioplankton and thus, increase viral abun-dance without new infection. Here we report that viralproduction and infection of bacterioplankton were en-hanced during the iron induced phytoplankton bloom ofthe EisenEx experiment, suggesting an important role ofviral lysis for carbon and nutrient cycling.
Methods
Iron enrichment and sampling—The experiment wasperformed in the Atlantic sector of the Southern Ocean(21uE, 48uS) in austral spring (06–29 Nov 2000) during thecruise ANT XVIII/2 of RV Polarstern. For details consultGervais et al. (2002). Briefly, a mesoscale eddy originatingfrom the Polar Front was identified, fertilized with acidifiediron sulfate solution and marked with the tracer SF6. Inaddition, drifting buoys were placed into the fertilizedwater mass. Iron enrichment was repeated twice withintervals of 8 d and sampling was performed inside andoutside the iron-enriched water mass. Samples werecollected with a rosette sampler (Sea-Bird SBE 32)equipped with 24, 12-liter Niskin bottles, conductivity–temperature–depth probes (Sea-Bird Electronics SBE911plus), and a Haardt fluorometer. For viral abundance,six samples were collected at each station between 10 m and150 m depth. At selected stations, a large-volume watersample (150–200 liters) was collected from 20 m to 30 mdepth for assessing viral production and infection ofbacterioplankton.
Enumeration of viruses and bacteria; burst size—Samplesfor counting viruses and bacteria were preserved briefly(,30 min) in formaldehyde (2% final concentration) at4uC. Samples of 1.5 mL were filtered onto 0.02-mm pore-size Anodisc filters (Whatman), stained with SYBR Green I(10,0003 in dimethyl sulfide; Molecular Probes, ChemicalNo. S-7567; concentration of staining solution, 2.5 3 1023
of stock), mounted in an anti-fade solution (glycerol,phosphate buffered saline, p-phenylenediamine), stored at220uC and enumerated by epifluorescence microscopy asdescribed by Noble and Fuhrman (1998). Data on bacterialabundance are reported in Arrieta et al. (2004).
To assess in situ burst size (i.e., the number of virusesreleased upon cell lysis), 1 mL of the bacterial concentrates(see below) from three stations inside and three stationsoutside the patch was preserved in glutaraldehyde (0.5%
final concentration), kept briefly at 4uC and then stored at280uC until analysis. Upon thawing, bacteria werecollected by centrifugation onto formvar-coated transmis-sion electron microscope (TEM) grids (copper, 400 meshsize) and stained with uranyl acetate (Weinbauer and Suttle1999). The minimum burst size (BS) was estimated asaverage from $20 visibly infected cells. This number is aconservative estimate because viruses could still be assem-bled in the cells; therefore, a conversion was used tocalculate maximum burst size (max. burst size 5 1.41 min.BS + 0.87; Parada et al. 2006).
Bacterial production—Bacterial production rates in theviral production assays (see below) were estimated from therate of [3H]-thymidine (Arrieta et al. 2004). A conversionfactor of 1.1 3 1018 cells produced per mol thymidine wasapplied to convert thymidine incorporation to cell produc-tion (Fuhrman and Azam 1982). In situ data on thymidineand leucine incorporation reported below are from Arrietaet al. (2004).
Viral production and infection of bacterioplankton—Viralproduction, the fraction of infected cells (FIC) and thefraction of lysogenic cells (FLC) were estimated using adilution technique (Wilhelm et al. 2002) with the modifi-cation described elsewhere (virus-reduction approach[VRA]; Weinbauer et al. 2002). Large water samples(150–200 liters) were filtered through 0.8-mm pore-sizepolycarbonate filters (142-mm diameter; Millipore) andbacteria were concentrated using a Pellicon (Millipore)tangential flow filtration system equipped with an 0.2-mm-filter cartridge (Durapore, Millipore) as described in(Arrieta et al. 2004). The first 20 liters of the 0.2-mmfiltrate were processed with a 30 kDa cutoff polysulfonecartridge (Amicon S1) to produce virus-free water.Aliquots of the bacterial concentrate were added to virus-free water at roughly in situ abundance assuming that halfof the bacteria were lost during the prefiltration andultrafiltration step. This procedure reduces contact ratesbetween viruses and hosts and, thus, new infection.Incubations were performed in the dark at in situtemperature (2.0–4.2uC) in duplicate 50-mL sterile conicaltubes, which were acid-cleaned between experiments.Samples were typically taken at T0h, T4h, T8h, T12h,T18h and T24h.
Viral production (VP) was calculated as
VP ~V2 { V1
t2 { t1ð1Þ
where V1 and V2 are viral abundances at t1 and t2
incubation times. Note that individual incubations weretreated separately and values at the start of incubationswere not always used for calculations. In contrast, thelower viral abundance serves as starting point forcalculation (e.g., when viral abundance decreased afterthe start of the experiment). Thus, V1 and V2 are theminimum and maximum of viral abundance in theincubation. Dividing the number of produced viruses bythe burst size yields the number of lysed cells and, thus,gives an estimation of FIC (Weinbauer et al. 2002). FIC
Viral response to iron fertilization 775

was calculated (as percentage) by
FIC ~ 100V2 { V1
BS | Bð2Þ
where BS is the burst size and B is bacterial abundance atthe start of the experiment. This treatment also served ascontrol in the lysogeny bioassays. To induce lysogenicviruses, samples were treated with mitomycin C (SigmaChemicals; final concentration, 1 mg mL21; Weinbauer etal. 2002). The difference in virus abundance between thistreatment and the control is the number of induced viruses,which is divided by the burst size to estimate the number ofinduced cells and, thus, FLC. FLC was calculated as
FLC ~ 100VMC { VC
BS | Bð3Þ
where VMC and VC is the maximum difference in viralabundance at corresponding time points in mitomycin Cand control treatments, respectively.
Contact rates—The rate of contact (R) between virusesand bacteria was calculated using the following equations(Murray and Jackson 1992):
R ~ Sh | 2w | Dv | V | P ð4Þ
where Sh is the Sherwood number (1.06 for a bacterialcommunity with 10% motile cells; Wilhelm et al. 1998), w isthe equivalent spherical cell diameter (0.5 mm), V and P arethe abundances of viruses and bacteria, respectively, andDv is the diffusivity of viruses.
Dv ~k | T
3 | p | m | dvð5Þ
where k is the Boltzmann constant (1.38 3 10–23 JKelvin21), T is the in situ temperature (uKelvin), m is theviscosity of water (in Pascal s21) and dv is the diameter ofthe viral capsid (60 nm). The contact rate was corrected forthe bacterial abundance to estimate the number of contactsper cell on a daily basis.
Viral community fingerprint—Viral communities from150 liters to 200 liters of 0.2 mm filtered water wereconcentrated to 200–300 mL using a 30-kDa cutoff cartridge(see above) and stored frozen at 280uC. Viruses were furtherconcentrated to ,200 mL by centrifugation through 30-kDfilters (Amicon Ultra-15; Millipore). Randomly amplifiedpolymorphic DNA (RAPD) polymerase chain reaction(PCR) analysis was performed as described in Winget andWommack (2008). Briefly, 2–50 ng of virioplankton DNAserved as the template DNA in each reaction. Foramplification, the decamer primer OPA-13 (59-CAG CACCCA C-39) was used, acting as both, forward and reverseprimer. PCR conditions are found in Winget and Wommack(2008). All RAPD-PCR products were separated by gelelectrophoresis on 2.5% agarose gels in 1 TAE buffer at9 V cm21, visualized by ethidium bromide (1 mg mL21)staining, and imaged in a gel imager (Intas). Similarity ofresulting banding patterns was assessed by a group-averaged
cluster analysis based on a Bray–Curtis similarity matrix andan analysis of similarity (ANOSIM). Uncertainty in thehierarchical cluster analysis of viral communities wascalculated by multi-scale bootstrap resampling using the Rpackage ‘‘pvclust’’ (http://cran.r-project.org/). NonmetricMultidimensional Scaling (NMDS) was computed usingfunction ‘‘metaMDS’’ of R package ‘‘vegan’’ with Bray–Curtis similarities.
Statistical analysis—In order to detect relationshipsbetween viral and bacterial parameters, a Pearson correla-tion matrix was calculated. Data were arcsine (for FIC andFLC after converting the percentage to fractions), square-root or log-transformed (all others). Parameters were alsotested against time since iron addition. Differences ofparameters inside and outside the Fe patch were tested forsignificance using a Mann–Whitney U-test. Significancelevel of p , 0.05 was assumed for statistical analysis.
Results
Description of study site and experimental approach—Sampling started on 07 November 2000, the day before theFe enrichment started, and lasted for 22 d. Day 0 denotes thesampling directly after enrichment. Water temperature was,5uC and increased during the experiment by 0.7–1.5uCdepending on the strata sampled. Chlorophyll a (Chl a)concentrations increased almost linearly after 4 d of the ironaddition to values ,4-fold higher than at the start of theexperiment (Gervais et al. 2002) and bacterial abundanceincreased during the first 12 d and remained then 2-foldhigher inside compared to outside the patch (Arrieta et al.2004). The Fe-fertilized patch, as identified by SF6 concen-trations, was initially confined to the top 40 m of the watercolumn but extended in the third week to 80 m, probably dueto mixing caused by storms (days 5–8 and 12–15).
Viral abundance and burst size—Generally, viral abun-dance increased inside the Fe-fertilized patch during thecourse of the experiment with elevated viral abundancedown to 100-m depth towards the end of the experiment(Fig. 1). Viral abundance, averaged over the first 40 m,ranged from 2.3 3 106 mL21 to 7.0 3 106 mL21 inside andfrom 1.4 3 106 mL21 to 2.5 3 106 mL21 outside the patch.Although viral abundance increased inside the patch,despite some fluctuations, it remained comparativelyconstant outside the patch. Viral abundance integratedover time was 2.1 times higher in the patch than outside(Table 1). The depth-integrated values of viral abundanceincreased significantly with time within the Fe-enrichedpatch (y 5 27.66 + 1.49x, r2 5 0.56, p , 0.01). A similarregression (y 5 26.95 + 1.26x, r2 5 0.52, p , 0.01) wasfound when only viral abundances were used from thedepth of the VRA incubations. The virus : bacteria ratioaveraged 17 inside the patch and 12 outside the patch.Maximum BS ranged from 29 to 49 (average 5 38) at sixstations with no significant differences between inside (day1, 9, and 22 after iron addition) and outside the patch (day0, 8, and 19). Thus, the average BS value of 38 was used forcalculations.
776 Weinbauer et al.

Recovery efficiency of the viral production assays—Viralabundance in the viral production assays was reduced by,80% of in situ abundances. Bacterial abundance in thevirus reduction approach was 20–30% higher than in situ(Table 2). This suggests that the recovery efficiency of cellswas ,70–80%, because we assumed a loss rate of 50% andadjusted volumes accordingly.
Viral production and bacterial mortality—Data on viralproduction and infection of bacterioplankton were ob-tained from samples collected in the Chl a maximum layerof the center of the Fe-fertilized patch. Viral productionwas corrected for the changes in bacterial abundance in theviral production assays (Fig. 2). Inside the patch, viralproduction was significantly higher (Mann–Whitney U-test, p , 0.01), averaging 1.90 3 106 mL21 d21 (range 50.86 3 106 – 3.63 3 106 mL21 d21) than outside the patch(mean 5 0.56 3 106 mL21 d21, range 5 0.33 3 106 – 0.803 106 mL21 d21; Fig. 2). For comparison, net viralproduction estimated from the increase in the viralabundance was 1.44 3 106 mL21 d21. Viral productionwas more than three times higher 1 d after than directlybefore the Fe addition (Fig. 2). Viral production continuedto increase until day 8 and dropped to values close to
outside conditions afterwards. At the end of the survey, asecond maximum occurred, which was slightly higher thanthe maximum at day 8. Viral production was 8–9-foldhigher at the two maxima compared to the start of theexperiment. On average, viral production was four timeshigher inside than outside the iron-fertilized patch (Ta-ble 1). Viral turnover averaged 0.52 d21 (range 5 0.15–1.05 d21) inside the patch and 0.27 d21 (0.17–0.33 d21)outside the patch (Table 1). Lowest and highest viralturnover occurred at the same time as viral production;viral turnover and production were significantly correlated.
In situ bacterial production correlated with that in theVRA (r2 5 0.63, p , 0.0005, n 5 12) but was on averagetwo times higher in the VRA than in situ. Virus-mediatedmortality (VMM) of bacterioplankton was calculated intwo ways (Table 2); first, using in situ bacterial productionand in situ viral production (i.e., viral production in theVRA corrected for the changes in bacterial abundanceduring sample preparation; Fig. 2) and second, usingbacterial and viral production data from the VRAincubation (given in Table 2). Outside the patch, VMMaveraged 69% (range 5 31–131%) using in situ productiondata and 39% (range 5 14–70%) using production datafrom the VRA. Within the patch, estimates were 182%(range 5 67–565%) for in situ production and 104% (range5 41–172%) for VRA. On average, estimates of VMMwere approximately two times higher using in situproduction compared to production in the VRA.
Viral infection of bacterioplankton and viral contactrates—The FIC ranged from 20% to 88% inside the patch,whereas it varied only little outside the patch ranging from16% to 25% (Fig. 3a). On average, FIC was significantly(,23) higher inside the patch (Mann–Whitney U-test, p ,0.05). Maximums of FIC coincided with peaks in viralproduction (i.e., at day 8 and 22). Maximum FIC was 3.1-and 5.4-fold higher inside the patch than at the start of theexperiment (Fig. 4a). The FLC was similar inside (range 55–17%; average 5 11%) and outside the patch (range 5 5–16%; average 5 13%; Fig. 3b). Inside the patch, FLCvalues decreased slightly from day 0 to day 8, and from day20 to 22, but increased in between to levels roughly similarto that of day 0. No significant differences were found in
Table 1. Average values and ranges (in brackets) of viral parameters inside and outside the Fe-fertilized patch. The average ratio ofparameters between inside and outside the patch is also shown. Parameters significantly different (Mann–Whitney U-test, p , 0.05)between inside and outside the Fe-fertilized patch are in bold.
Parameter*
Inside Outside
Average ratioMean Range SE Mean Range SE
FIC (%) 40 20–88 10 21 26–24 2 1.9FLC (%) 11 5–17 2 12 5–16 2 0.9Viral production (106 mL21 d21) 1.90 0.86–3.63 0.48 0.56 0.33–0.80 0.09 3.3Burst size 40 34–49 4 36 29–42 4 1.1Viral abundance (106 mL21) 4.3 2.3–7.0 5.5 2.1 1.4–2.5 2.0 2.1Viral contacts per cell (d21) 15 8–25 1 7 5–8 2 2.1Viral turnover (d21) 0.52 0.15–1.05 0.12 0.27 0.17–0.33 0.03 1.9
* FIC 5 fraction of infected cells; FLC 5 fraction of lysogenic cells. Note that burst size data represent only three samples from each, inside and outsidethe patch. Viral abundance was averaged over the first 40 m. For viral turnover, viral abundance from the water samples collected for the viral-reductionapproach (VRA) incubations was used.
Fig. 1. Viral abundance along depth profiles during Feenrichment. Symbols indicate inside (full circles, gray back-ground) and outside (open circles, white background) of the Fe-enriched patch. The arrows at the bottom indicate the dates of Ferelease. Units for viral abundance are given in 105 mL21.
Viral response to iron fertilization 777

FLC inside and outside the Fe-fertilized patch (Mann–Whitney U-test, p . 0.2). Viral contact rates weresignificantly higher inside (average 5 15 cell21 d21; range5 8–25 cell21 d21) than outside the patch (average 5 7
cell21 d21; range, 4–8 cell21 d21; Mann–Whitney U-test, p, 0.05).
Correlation analysis of data inside and out of the patch—When testing viral parameters against time elapsed in themesoscale experiment, viral abundance in the patch was theonly parameter that showed a significant correlation. Datatransformation did not increase correlation coefficients(data not shown). It has been shown before that bacterialproduction and enzymatic activity did not change linearlywith time, whereas there was a slightly positive correlationfor bacterial abundance (Arrieta et al. 2004).
The results of the correlation analysis of viral andbacterial parameters outside and inside the patch are shownin Table 3 for parameters exhibiting a significant relation-ship with viral parameters. Outside the patch, FICincreased with bacterial abundance and viral abundanceincreased with thymidine incorporation. Inside the patch,FIC increased with viral production and leucine incorpo-ration, whereas FLC was negatively related to thymidineincorporation. A strong correlation was found betweenviral and bacterial abundance.
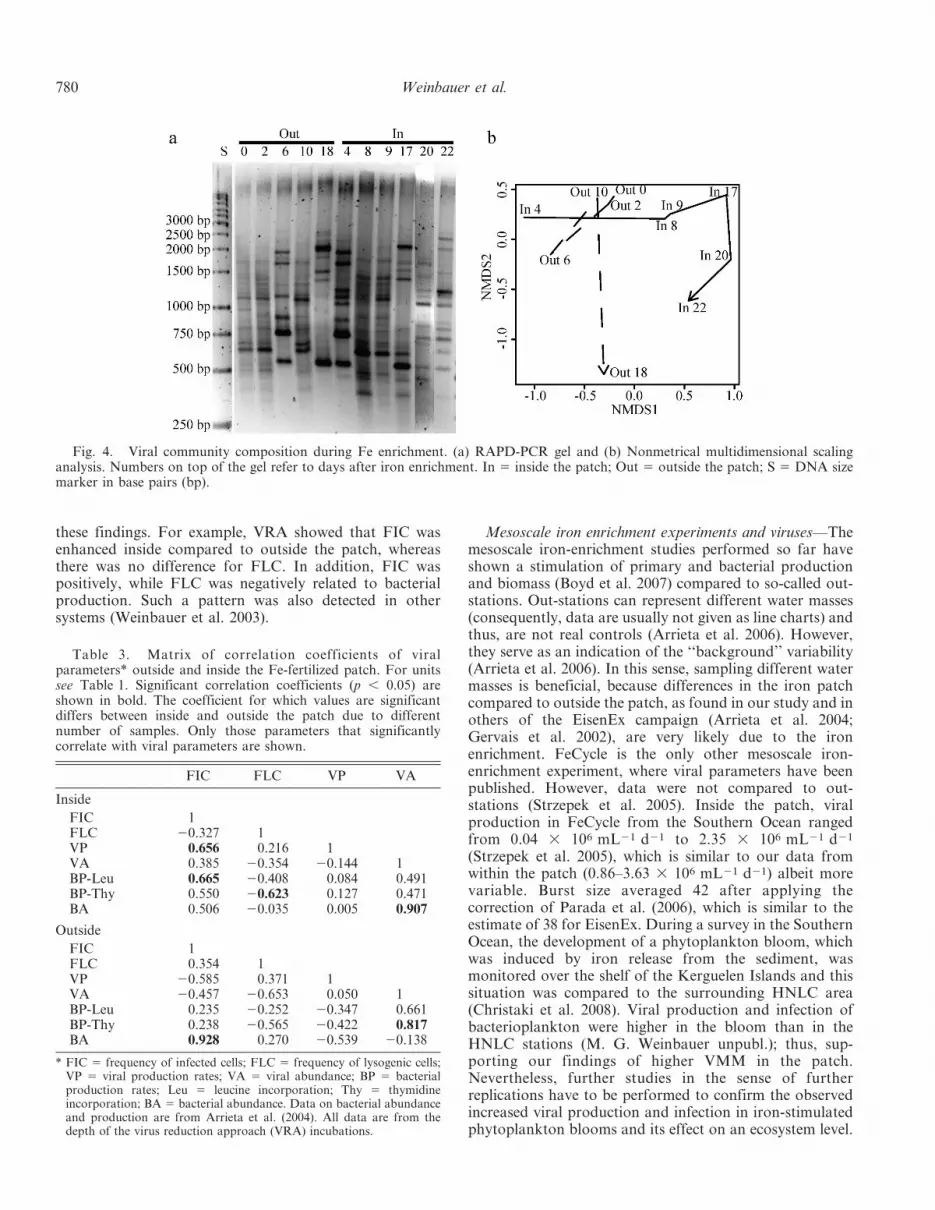
Viral community composition—The viral communityfingerprinting by RAPD-PCR revealed 6–15 distinguish-able bands for the individual samples (i.e., viral commu-nities), from inside and outside the patch. The lowestnumber of bands was found outside and the highest insidethe patch (Fig. 4a). Viral community composition wassimilar at several time points; however, band patterns didalso vary strongly both inside and outside the patch. Basedon ANOSIM, no significant differences between inside andoutside the patch were found (R 5 0.1667, p 5 0.099).However, when the first sample taken after Fe addition was
Table 2. Evaluating the virus reduction approach (VRA) for estimating viral production and virus-induced losses of bacterialproduction inside and outside the Fe-fertilized patch. Note that viral production data in Fig. 2 were corrected for changes inbacterial abundance.
DayBPin situ
(104 mL21 d21)*BPVRA
(104 mL21 d21)* BAVRA : BAin situ*VPVRA
(106 mL21 d21)*% BPin situ
lysed*%BPVRA
lysed*
Inside
Day 1 3.4 5.6 1.22 1.73 110 80Day 4 3.8 7.1 1.35 3.19 164 118Day 8 1.4 6.5 1.42 4.25 565 172Day 9 1.4 4.9 1.33 1.15 163 62Day 13 3.8 7.2 1.28 1.97 107 72Day 17 5.4 9.4 1.05 1.44 67 41Day 20 2.1 2.6 1.44 1.49 130 149Day 22 6.1 8.6 1.26 4.58 157 139
Average 3.4 6.5 1.29 2.48 182 104
Outside
Day 0 2.4 3.8 1.01 0.53 58 37Day 2 2.1 4.2 1.29 0.43 42 26Day 6 3.8 8.9 1.07 0.48 31 14Day 10 2.5 4.1 0.99 0.79 84 50Day 18 1.4 3.2 1.23 0.86 131 70
Average 2.4 4.9 1.19 0.62 69 39
* BP 5 bacterial production; BA 5 bacterial abundance; VP 5 viral production. In situ bacterial abundance and production data are from Arrieta et al.(2004).
Fig. 2. Viral production during Fe enrichment. Bars indicatethe range of duplicate incubations. Data were corrected for thedifferences in bacterial abundance in the VRA compared to insitu. Symbols indicate inside (full circles) or outside (open circles)of the Fe-enriched patch.
778 Weinbauer et al.

removed, differences between inside and outside the patchwere significant (R 5 0.358, p 5 0.023). Using NMDS, onecan define a path of change in the viral communities.Fig. 4b shows that the community inside the patch changedcontinuously and followed a different path than the outsidecommunity (at least starting from day 4).
Discussion
Evaluation of approaches used to assess VMM—Insidethe Fe-fertilized patch, VMM estimates based on in situbacterial production were in almost all samples higher than100% of bacterial production. In steady state, a VMMhigher than 100% means a decrease of abundance;however, we found an increase of bacterial abundance inthe patch (Arrieta et al. 2004). In contrast, using bacterialproduction in the VRA, VMM was on average ,100% and
hence, appears to be more realistic than the estimates basedon in situ bacterioplankton production. It is noteworthythat bacterial production in situ and in the VRA wasrelated, although bacterial production in the VRA washigher probably due to the release of organic matter fromcells during filtration. Nevertheless, VMM estimates usingbacterial production in the VRA were sometimes too highto be sustained. Similar conclusions have been reportedpreviously for other environments as well (Helton et al.2005; Winget et al. 2005).
Several potential explanations are discussed below toexplain this apparent discrepancy. Manipulations duringthe VRA approach could stimulate viral production (e.g.,by stimulating burst size). However, some data suggest thatthe VRA does not influence the burst size, because differentdilutions, which changed bacterial growth rates, did notaffect FIC values (Weinbauer et al. 2002). This is furthersupported by the finding that the burst size of bacter-ioplankton collected in situ was essentially the same as inthe VRA (Weinbauer and Suttle 1999). Nevertheless it isknown that, in situ, the burst size can increase withbacterial production (Parada et al. 2006). Therefore, wecannot exclude the possibility that the strong enhancementof bacterial production in the VRA increased burst sizeand, thus, viral production. Bacterial production wasstimulated in pulses following the iron additions insidethe fertilized patch but otherwise presented similar averagevalues inside and outside the patch (Arrieta et al. 2004).This could be one of the reasons why the burst size wassimilar inside and outside the patch. Although we usedmaximum burst size estimates, we cannot fully exclude thepossibility of a TEM-based underestimation of the burstsize, possibly due to failing to distinguish or identify allviral particles using the whole cell approach. Such anunderestimation of the burst size would result in anoverestimation of virus-mediated mortality. The averagevalue of 38 is similar to the average maximum burst size of42 for the Southern Ocean (Strzepek et al. 2005) calculatedby using the correction of Parada et al. (2006). In addition,it might not be the burst size that is changed but the rate atwhich viruses are produced. This would result in anoverestimation of VMM estimated based on viral produc-tion rates. Such a mechanisms might explain why mortalityestimates based on FIC are often more realistic thanestimates based on viral production in a single VRA(Winter et al. 2004a; Winter et al. 2005). Also, the reducedcontact rates in the incubations, could result in lessinfection and lysis and thus, in increased bacterialproduction. Finally, it is well-know that relating theincorporation of a radiolabeled substrate to cell productionis problematic, even if habitat-specific conversion factorsare determined (Robarts 1998), which, was not done in thepresent study. Thus, an underestimation of bacterial cellproduction by the thymidine incorporation method couldhave contributed to an overestimation of mortality.
It has been shown that the VRA results in ecologicallymeaningful trends of VMM such as changes along fronts(Wilhelm et al. 2002), trophic gradients (Helton et al. 2005;Winget et al. 2005) or diel (Winter et al. 2004a) andseasonal variations (Winter et al. 2005). Our study supports
Fig. 3. Viral infection of bacterioplankton during Fe enrich-ment. (a) Lytic-stage and (b) lysogenic infection. Bars indicate therange of duplicate incubations. Symbols indicate inside (full circles)or outside (open circles) of the Fe-enriched patch. FIC 5 fraction oflytically infected cells; FLC 5 fraction of lysogenic cells.
Viral response to iron fertilization 779
these findings. For example, VRA showed that FIC wasenhanced inside compared to outside the patch, whereasthere was no difference for FLC. In addition, FIC waspositively, while FLC was negatively related to bacterialproduction. Such a pattern was also detected in othersystems (Weinbauer et al. 2003).
Mesoscale iron enrichment experiments and viruses—Themesoscale iron-enrichment studies performed so far haveshown a stimulation of primary and bacterial productionand biomass (Boyd et al. 2007) compared to so-called out-stations. Out-stations can represent different water masses(consequently, data are usually not given as line charts) andthus, are not real controls (Arrieta et al. 2006). However,they serve as an indication of the ‘‘background’’ variability(Arrieta et al. 2006). In this sense, sampling different watermasses is beneficial, because differences in the iron patchcompared to outside the patch, as found in our study and inothers of the EisenEx campaign (Arrieta et al. 2004;Gervais et al. 2002), are very likely due to the ironenrichment. FeCycle is the only other mesoscale iron-enrichment experiment, where viral parameters have beenpublished. However, data were not compared to out-stations (Strzepek et al. 2005). Inside the patch, viralproduction in FeCycle from the Southern Ocean rangedfrom 0.04 3 106 mL21 d21 to 2.35 3 106 mL21 d21
(Strzepek et al. 2005), which is similar to our data fromwithin the patch (0.86–3.63 3 106 mL21 d21) albeit morevariable. Burst size averaged 42 after applying thecorrection of Parada et al. (2006), which is similar to theestimate of 38 for EisenEx. During a survey in the SouthernOcean, the development of a phytoplankton bloom, whichwas induced by iron release from the sediment, wasmonitored over the shelf of the Kerguelen Islands and thissituation was compared to the surrounding HNLC area(Christaki et al. 2008). Viral production and infection ofbacterioplankton were higher in the bloom than in theHNLC stations (M. G. Weinbauer unpubl.); thus, sup-porting our findings of higher VMM in the patch.Nevertheless, further studies in the sense of furtherreplications have to be performed to confirm the observedincreased viral production and infection in iron-stimulatedphytoplankton blooms and its effect on an ecosystem level.
Table 3. Matrix of correlation coefficients of viralparameters* outside and inside the Fe-fertilized patch. For unitssee Table 1. Significant correlation coefficients (p , 0.05) areshown in bold. The coefficient for which values are significantdiffers between inside and outside the patch due to differentnumber of samples. Only those parameters that significantlycorrelate with viral parameters are shown.
FIC FLC VP VA
Inside
FIC 1FLC 20.327 1VP 0.656 0.216 1VA 0.385 20.354 20.144 1BP-Leu 0.665 20.408 0.084 0.491BP-Thy 0.550 20.623 0.127 0.471BA 0.506 20.035 0.005 0.907
Outside
FIC 1FLC 0.354 1VP 20.585 0.371 1VA 20.457 20.653 0.050 1BP-Leu 0.235 20.252 20.347 0.661BP-Thy 0.238 20.565 20.422 0.817BA 0.928 0.270 20.539 20.138
* FIC 5 frequency of infected cells; FLC 5 frequency of lysogenic cells;VP 5 viral production rates; VA 5 viral abundance; BP 5 bacterialproduction rates; Leu 5 leucine incorporation; Thy 5 thymidineincorporation; BA 5 bacterial abundance. Data on bacterial abundanceand production are from Arrieta et al. (2004). All data are from thedepth of the virus reduction approach (VRA) incubations.
Fig. 4. Viral community composition during Fe enrichment. (a) RAPD-PCR gel and (b) Nonmetrical multidimensional scalinganalysis. Numbers on top of the gel refer to days after iron enrichment. In 5 inside the patch; Out 5 outside the patch; S 5 DNA sizemarker in base pairs (bp).
780 Weinbauer et al.
Estimation of virus-mediated mortality of bacterioplank-ton—It is possible that other viruses than bacteriophagescontributed to the increase in viral abundance during theFe-enrichment, because not only bacteria (Arrieta et al.2004) but also phytoplankton (Gervais et al. 2002)increased in biomass in the Fe-enriched patch. However,viruses infecting phytoplankton constitute only a minorfraction of the viral community (except for cyanoviruses,which might be occasionally abundant [Maranger and Bird1995]). Cyanobacterial abundance was low at the study site(Gervais et al. 2002). Moreover, viral and bacterialabundance inside the patch were more strongly correlated(Table 3; r 5 0.907) than viruses and Chl a (r 5 0.748;calculated using data published in Gervais et al. [2002]).Thus, the majority of the viruses were likely virusesinfecting the domain bacteria and the increase in viralabundance during the experiment was, therefore, mainlydue to lysis of bacterial cells.
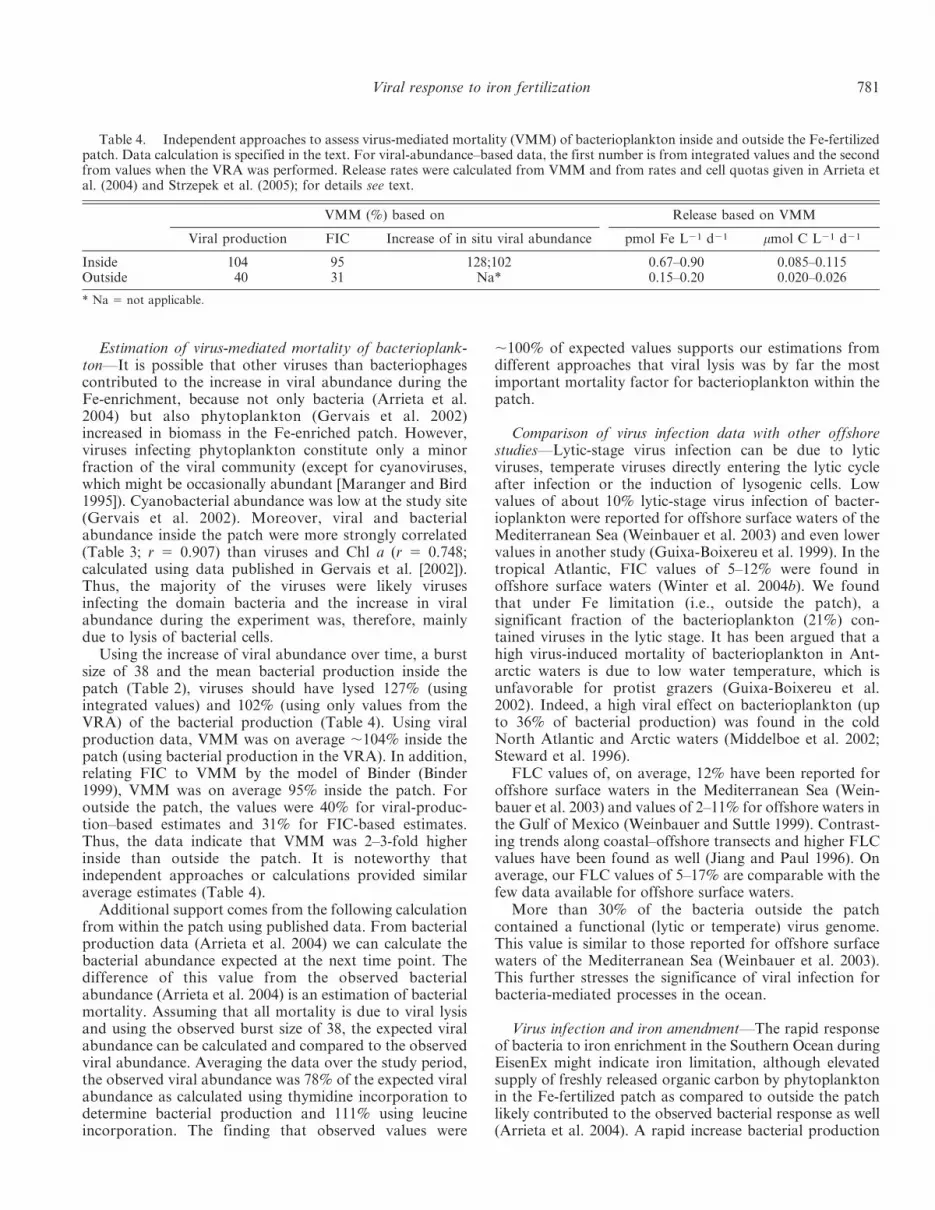
Using the increase of viral abundance over time, a burstsize of 38 and the mean bacterial production inside thepatch (Table 2), viruses should have lysed 127% (usingintegrated values) and 102% (using only values from theVRA) of the bacterial production (Table 4). Using viralproduction data, VMM was on average ,104% inside thepatch (using bacterial production in the VRA). In addition,relating FIC to VMM by the model of Binder (Binder1999), VMM was on average 95% inside the patch. Foroutside the patch, the values were 40% for viral-produc-tion–based estimates and 31% for FIC-based estimates.Thus, the data indicate that VMM was 2–3-fold higherinside than outside the patch. It is noteworthy thatindependent approaches or calculations provided similaraverage estimates (Table 4).
Additional support comes from the following calculationfrom within the patch using published data. From bacterialproduction data (Arrieta et al. 2004) we can calculate thebacterial abundance expected at the next time point. Thedifference of this value from the observed bacterialabundance (Arrieta et al. 2004) is an estimation of bacterialmortality. Assuming that all mortality is due to viral lysisand using the observed burst size of 38, the expected viralabundance can be calculated and compared to the observedviral abundance. Averaging the data over the study period,the observed viral abundance was 78% of the expected viralabundance as calculated using thymidine incorporation todetermine bacterial production and 111% using leucineincorporation. The finding that observed values were
,100% of expected values supports our estimations fromdifferent approaches that viral lysis was by far the mostimportant mortality factor for bacterioplankton within thepatch.
Comparison of virus infection data with other offshorestudies—Lytic-stage virus infection can be due to lyticviruses, temperate viruses directly entering the lytic cycleafter infection or the induction of lysogenic cells. Lowvalues of about 10% lytic-stage virus infection of bacter-ioplankton were reported for offshore surface waters of theMediterranean Sea (Weinbauer et al. 2003) and even lowervalues in another study (Guixa-Boixereu et al. 1999). In thetropical Atlantic, FIC values of 5–12% were found inoffshore surface waters (Winter et al. 2004b). We foundthat under Fe limitation (i.e., outside the patch), asignificant fraction of the bacterioplankton (21%) con-tained viruses in the lytic stage. It has been argued that ahigh virus-induced mortality of bacterioplankton in Ant-arctic waters is due to low water temperature, which isunfavorable for protist grazers (Guixa-Boixereu et al.2002). Indeed, a high viral effect on bacterioplankton (upto 36% of bacterial production) was found in the coldNorth Atlantic and Arctic waters (Middelboe et al. 2002;Steward et al. 1996).
FLC values of, on average, 12% have been reported foroffshore surface waters in the Mediterranean Sea (Wein-bauer et al. 2003) and values of 2–11% for offshore waters inthe Gulf of Mexico (Weinbauer and Suttle 1999). Contrast-ing trends along coastal–offshore transects and higher FLCvalues have been found as well (Jiang and Paul 1996). Onaverage, our FLC values of 5–17% are comparable with thefew data available for offshore surface waters.
More than 30% of the bacteria outside the patchcontained a functional (lytic or temperate) virus genome.This value is similar to those reported for offshore surfacewaters of the Mediterranean Sea (Weinbauer et al. 2003).This further stresses the significance of viral infection forbacteria-mediated processes in the ocean.
Virus infection and iron amendment—The rapid responseof bacteria to iron enrichment in the Southern Ocean duringEisenEx might indicate iron limitation, although elevatedsupply of freshly released organic carbon by phytoplanktonin the Fe-fertilized patch as compared to outside the patchlikely contributed to the observed bacterial response as well(Arrieta et al. 2004). A rapid increase bacterial production
Table 4. Independent approaches to assess virus-mediated mortality (VMM) of bacterioplankton inside and outside the Fe-fertilizedpatch. Data calculation is specified in the text. For viral-abundance–based data, the first number is from integrated values and the secondfrom values when the VRA was performed. Release rates were calculated from VMM and from rates and cell quotas given in Arrieta etal. (2004) and Strzepek et al. (2005); for details see text.
VMM (%) based on Release based on VMM
Viral production FIC Increase of in situ viral abundance pmol Fe L21 d21 mmol C L21 d21
Inside 104 95 128;102 0.67–0.90 0.085–0.115Outside 40 31 Na* 0.15–0.20 0.020–0.026
* Na 5 not applicable.
Viral response to iron fertilization 781

4 h after Fe enrichment was shown for the subtropicalPacific (Mioni et al. 2007). FIC (day 4) and viral production(day 1 and 4) were stimulated shortly after iron addition(Figs. 3, 4). Bacterial production during EisenEx showedshort pulses right after Fe addition as well (Arrieta et al.2004). Viral community composition also changed rapidlyafter the three Fe additions. This suggests that bacterialactivity enhanced viral production. Induction of lysogenicbacteria due to relieving iron stress from bacteria and/orincreased bacterial growth rates could have caused thisincreased bacterial mortality inside the patch. However,because FLC was low and did not differ between inside andoutside the patch, induction cannot explain the increase ofFIC within the patch. Thus, lytic viruses or temperate virusesdirectly entering the lytic cycle after infection were mainlyresponsible for the stimulated viral production and VMM ofbacterioplankton during iron enrichment.
An enhanced bacterial production may, on the one hand,allow for higher infection frequencies (e.g., due to a higherexpression of receptors as docking sites for viruses) and, onthe other hand, increase viral production rates even if thesame percentage of cells is infected. It is known that someviruses use the iron uptake system as receptors forattachment to the cell (Lenski 1988). The finding thatouter membrane receptor for siderophores (i.e., extracellu-lar high-affinity iron-uptake ligands), are only expressedduring Fe limitation has been interpreted as a strategy toreduce the targeting of the outer membrane receptors byviruses and confer temporal resistance (Andrews et al.2003). Because FIC increased within the patch, such apossible protection mechanism could not prevent anincrease of virus infection during the mesoscale Fe-additionexperiment. However, bacterial production and cell-specificleucine and thymidine incorporation rates peaked brieflyafter each of the Fe amendments (Arrieta et al. 2004). Also,a significant induction of hydrolytic ectoenzymes wasobserved inside the Fe-fertilized patch (Arrieta et al.2004), which should have been accompanied by enhancedsynthesis of the corresponding uptake systems. Thesesurface-associated hydrolases and uptake systems couldserve as viral receptors, resulting in increasing infectionrates. In addition, bacterial abundance increased inside thepatch (Arrieta et al. 2004) and viral contacts per cell weretwice as high inside as outside the patch (Table 2). Possibly,an increased bacterial activity and an enhanced contact rateacted synergistically during the experiment and resulted inan increase of virus infection and viral abundance insidecompared to outside the Fe fertilized patch.
Multidimensional scaling analysis revealed that in the Fe-enriched patch a specific viral community developed. Thefinding of a rather stable bacterial (Arrieta et al. 2004) and aspecific viral community could be explained by viral controlof bacterial phylotypes, which would out-compete othermembers of the bacterial community. Such a keeping incheck of consecutively changing bacterial winners fornutrient acquisition could result in strong changes of theviral community and keep bacterial composition relativelystable. This is compatible with the idea that the virus-susceptible phylotypes can be low in number but have a highpotential growth rate (Bouvier and del Giorgio 2007). An
alternative scenario is that the development of resistance in aphylotype reduces infection rates and abundance of aspecific virus and allows the increase of other viruses. Thus,a succession of different viral types with an overlapping oridentical host range and changing resistance patterns couldalso explain a relatively stable bacterial and a dynamic viralcommunity. Such scenarios are based on assumptions suchas that the viral community was mainly composed ofbacteriophages (see above), RAPDs are a useful proxy forviral community composition (Winget and Wommack 2008)and terminal restriction fragment length polymorphismspatterns are a useful proxy for the bacterial community(Arrieta et al. 2004). Our data suggests that the higherinfection of bacterioplankton inside the patch is caused byan interplay of phenotypic and genotypic effects.
Role of viral lysis for biogeochemical processes—Despitesome uncertainty about the absolute values, our data suggestthat viruses were an important mortality factor forbacterioplankton outside the patch and the major factorwithin the patch. Interestingly, during a study in theSouthern Ocean around the Kerguelen Island plateau,bacterial mortality due to protistan grazing was high in theHNLC area, but negligible in the phytoplankton bloom(Christaki et al. 2008), whereas viral infection showed theopposite trend (M. G. Weinbauer unpubl.). These datasuggest a switch from grazing to viral lysis as the maincontrol mechanism of bacterial biomass and a change of thefate of bacterial carbon production due to iron addition.
Viral lysis of bacterioplankton results in a reduced carbonflow to higher trophic levels via grazing of bacteria byprotists; this and the release of lysis products can fuelbacterial growth (Fuhrman 1999; Middelboe et al. 2003). Weestimated that a significant fraction of the bacterialproduction within the patch (up to 100%; Table 4) shouldbe diverted from being utilized by higher trophic levels,shunted into the detrital and dissolved organic matter pool(Wilhelm and Suttle 1999), and become available to (infectedand noninfected) bacteria. Using the conversion factors andcell quotas from Strzepek et al. (2005), average thymidineincorporation data from Arrieta et al. (2004) and assumingVMM from Table 4, 0.085–0.115 mmol C L21 d21 would bereleased (Table 4). In addition, data suggest that viral lysisreduces the growth efficiency and increases respiration ratesof bacterioplankton (Middelboe et al. 1996). This has alsobeen shown for the Southern Ocean and could increaseremineralization rates (Bonilla-Findji et al. 2008).
Viral lysis has several potential consequences for ironand carbon cycling. Enhanced production of mainlycolloidal organic iron as the result of viral lysis of bacteriaduring natural and anthropogenic Fe additions wouldretain reduced and bioavailable Fe in the euphotic zone.Using the conversion factors and cell quotas from Strzepeket al. (2005), average thymidine incorporation data fromArrieta et al. (2004) and assuming VMM from Table 4,0.67–0.90 pmol Fe L21 d21 would be released. This is atthe lower range of values (0.4–28 pmol Fe L21 d21)reported before for viral lysis (Strzepek et al. 2005).Retaining iron could be significant during natural ephem-eral Fe dust-fall events or when icebergs melt in HNLC
782 Weinbauer et al.
zones. With respect to the potential of relieving ironlimitation as a mechanism stimulating carbon sequestrationand export, an increased release of lysis products couldresult in a reduced carbon sequestration because viral lysisconverts living particulate organic matter to nonlivingdissolved and detrital organic matter, which is finallyrespired. However, the actual outcome of an increased virallysis by Fe pulses will depend on whether the majorconsequence is an increased retention time and organicmatter oxidation or an increased Fe regeneration.
AcknowledgmentsWe are grateful to V. Smetacek for the invitation to the
EisenEx cruise and providing the opportunity to perform thiswork. The expertise of V. Strass (physical oceanography), A.Watson (SF6 measurements), H. de Baar (Fe measurements), andtheir coworkers has made this work possible. Also, we thank theofficers and the crew of the RV Polarstern for their support. S.Schmidt is acknowledged for support in statistical analysis. Twoanonymous referees provided very valuable comments. Financialsupport was provided by the Earth and Life Sciences of the DutchResearch Council (ALW-NWO), the Royal Netherlands Institutefor Sea Research (NIOZ), and the French Science Ministry(ANR-AQUAPHAGE). J. M. A. was supported by a predoctoralgrant from the Basque Government.
References
ANDREWS, S. C., A. K. ROBINSON, AND F. RODRIGUEZ-QUINONES.2003. Bacterial iron homeostasis. FEMS Microbiol. Rev. 27:215–237.
ARRIETA, J. M., M. G. WEINBAUER, AND G. J. HERNDL. 2006.Response to: ‘‘Interpreting the results of oceanic mesoscaleenrichment experiments: Caveats and lessons from limnologyand coastal ecology’’ by M. S. Hale and R. B. Rivkin. Limnol.Oceanogr. 52: 916–918.
———, M. G. WEINBAUER, C. LUTE, AND G. J. HERNDL. 2004.Response of bacterioplankton to iron addition in theSouthern Ocean. Limnol. Oceanogr. 49: 799–808.
BINDER, B. 1999. Reconsidering the relationship between virallyinduced bacterial mortality and frequency of infected cells.Aquat. Microb. Ecol. 18: 207–215.
BONILLA-FINDJI, O., A. MALITS, D. LEFEVRE, E. ROCHELLE-NEWALL, L. LEMEE, M. G. WEINBAUER, AND J.-P. GATTUSO.2008. Viral effects on bacterial respiration, production andgrowth efficiency: Consistent trends in the Southern Ocean andthe Mediterranean Sea. Deep-Sea Res. Part II 55: 790–800.
BOUVIER, T., AND P. A. DEL GIORGIO. 2007. Key role of selectiveviral-induced mortality in determining marine bacterialcommunity composition. Environ. Microbiol. 9: 287–297.
BOYD, P. W., AND oTHERS. 2007. Mesoscale iron enrichmentexperiments 1993–2005: Synthesis and future directions.Science 315: 612–617.
CHRISTAKI, U., I. OBERNOSTERER, F. VAN WAMBEKE, M. VELDHUIS,N. GARCIA, AND P. CATALA. 2008. Microbial food wen structurein a naturally iron-fertilized area in the Southern Ocean(Kerguelen Plateau). Deep-Sea Res. Part II 55: 706–719.
CHURCH, M. J., D. A. HUTCHINS, AND H. W. DUCKLOW. 2000.Limitation of bacterial growth by dissolved organic matterand iron in the Southern ocean. Appl. Environ. Microbiol. 66:455–466.
COCHLAN, W. 2001. The heterotrophic bacterial response during amesoscale iron enrichment experiment (IronEx II) in theeastern equatorial Pacific Ocean. Limnol. Oceanogr. 46:428–435.
DAUGHNEY, C., X. CHATELLIER, A. CHAN, P. KENWARD, D. FORTIN,C. A. SUTTLE, AND D. A. FOWLE. 2005. Adsorption andprecipitation of iron from seawater on a marine bacteriophage(PWH3a-P1). Mar. Chem. 91: 101–115.
FUHRMAN, J. A. 1999. Marine viruses and their biogeochemicaland ecological effects. Nature 399: 541–548.
———, AND F. AZAM. 1982. Thymidine incorporation as ameasure of heterotrophic bacterioplankton production inmarine surface waters: Evaluation and field results. Mar. Biol.66: 109–120.
GERVAIS, F., U. RIEBESELL, AND M. Y. GORBUNOV. 2002. Changesin primary productivity and chlorophyll a in response to ironfertilization in the Southern polar frontal zone. Limnol.Oceanogr. 47: 1324–1335.
GUIXA-BOIXEREU, N., D. VAQUE, J. GASOL, AND C. PEDROS-ALIO.1999. Distribution of viruses and their potential effect onbacterioplankton in an oligotrophic marine system. Aquat.Microb. Ecol. 19: 205–213.
———, ——— , ———, J. SANCHEZ-CAMARA, AND C. PEDROS-ALIO. 2002. Viral distribution and activity in Antarctic waters.Deep-Sea Res. Part II 49: 827–845.
HALL, J., AND K. SAFI. 2001. The impact of in situ Fe fertilizationon the microbial food web in the Southern Ocean. Deep-SeaRes. Part II 48: 2591–2613.
HELTON, R., M. COTTRELL, D. KIRCHMAN, AND K. E. WOMMACK.2005. Evaluation of incubation-based methods for estimatingvirioplankton production in estuaries. Aquat. Microb. Ecol.41: 209–219.
JIANG, S. C., AND J. H. PAUL. 1996. Occurrence of lysogenicbacteria in marine microbial communities as determined byprophage induction. Mar. Ecol. Prog. Ser. 142: 27–38.
KIRCHMAN, D., B. MEON, M. COTTRELL, AND D. HUTCHINS. 2000.Carbon versus iron limitation of bacterial growth in theCalifornia upwelling regime. Limnol. Oceanogr. 45:1681–1688.
LENSKI, R. E. 1988. Dynamics of interactions between bacteriaand virulent bacteriophage. Adv. Microb. Ecol. 10: 1–44.
MARANGER, R., AND D. F. BIRD. 1995. Viral abundance in aquaticsystems: A comparison between marine and fresh waters.Mar. Ecol. Prog. Ser. 121: 217–226.
MIDDELBOE, M., N. O. G. JØRGENSEN, AND N. KROER. 1996.Effects of viruses on nutrient turnover and growth efficiencyof noninfected marine bacterioplankton. Appl. Environ.Microbiol. 62: 1991–1997.
———, T. NIELSEN, AND P. BJØRNSEN. 2002. Viral and bacterialproduction in the North Water: In situ measurements, batchculture experiments and characterization and distribution of avirus-host system. Deep-Sea Res. Part II 49: 5063–5079.
———, L. RIEMANN, C. STEWARD, W. HANNSEN, AND O. NYBROE.2003. Virus-induced transfer of organic carbon releasedbetween marine bacteria in a model community. Aquat.Microb. Ecol. 33: 1–10.
MIONI, C. E., J. D. PAKULSKI, L. POORVIN, A. BALDWIN, M. R.TWISS, W. H. JEFFREY, AND S. W. WILHELM. 2007. Variabilityin the in situ bioavailability of Fe to bacterioplanktoncommunities in the eastern subtropical Pacific Ocean. Aquat.Microb. Ecol. 46: 239–251.
———, L. POORVIN, AND S. W. WILHELM. 2005. Virus andsiderophore-mediated transfer of available Fe betweenheterotrophic bacteria: Characterization using an Fe-specificbioreporter. Aquat. Microb. Ecol. 41: 233–245.
MURRAY, A. G., AND G. A. JACKSON. 1992. Viral dynamics: Amodel of the effects of size, shape, motion and abundance ofsingle-celled planktonic organisms and other particles. Mar.Ecol. Prog. Ser. 89: 103–116.
Viral response to iron fertilization 783

NOBLE, R. T., AND J. A. FUHRMAN. 1998. Use of SYBR Green I forrapid epifluorescence counts of marine viruses and bacteria.Aquat. Microb. Ecol. 14: 113–118.
OLIVER, J. L., R. T. BARBER, W. O. SMITH, AND H. W. DUCKLOW.2004. The heterotrophic bacterial response during theSouthern Ocean Iron Experiment (SOFeX). Limnol. Ocea-nogr. 49: 2129–2140.
PAKULSKI, J., AND oTHERS. 1996. Iron stimulation of Antarcticbacteria. Nature 383: 133–134.
PARADA, V., G. J. HERNDL, AND M. G. WEINBAUER. 2006. Viralburst size of heterotrophic prokaryotes in aquatic systems. J.Mar. Biol. Assoc. UK 86: 613–621.
POORVIN, L., J. RINTO-KANTP, D. A. HUTCHINS, AND S. WILHELM.2004. Viral release of iron and its bioavailability to marineplankton. Limnol. Oceanogr. 49: 1734–1741.
ROBARTS, R. 1998. Incorporation of radioactive precursors intomacromolecules as measures of bacterial growth: Problemsand pitfalls, p. 472–486. In K. Cooksey [ed.], Molecularapproaches to the study of the ocean. Chapman and Hall.
STEWARD, F. G., D. C. SMITH, AND F. AZAM. 1996. Abundance andproduction of bacteria and viruses in the Bering and ChukchiSea. Mar. Ecol. Prog. Ser. 131: 287–300.
STRZEPEK, R. F., M. T. MALDONADO, J. L. HIGGINS, J. HALL, K.SAFI, S. W. WILHELM, AND P. W. BOYD. 2005. Spinning the‘‘Ferrous Wheel’’: The importance of the microbial commu-nity in an iron budget during the FeCycle experiment. Glob.Biogeochem. Cycles 19: GB4S26, doi:10.1029/2005GB002490.
SUTTLE, C. A. 2005. Viruses in the sea. Nature 437: 356–361.TORTELL, P. D., M. T. MALDONANDO, AND N. M. PRICE. 1996. The
role of heterotrophic bacteria in iron-limited ocean systems.Nature 383: 330–332.
WEINBAUER, M., I. BRETTAR, AND M. HOFLE. 2003. Lysogeny andvirus-induced mortality of bacterioplankton in surface, deep,and anoxic waters. Limnol. Oceanogr. 48: 1457–1465.
———, C. WINTER, AND M. HOFLE. 2002. Reconsideringtransmission electron microscopy based estimates of viralinfection of bacterioplankton using conversion factors derivedfrom natural communities. Aquat. Microb. Ecol. 27: 103–110.
WEINBAUER, M. G., AND C. A. SUTTLE. 1999. Lysogeny andprophage induction in coastal and offshore bacterial commu-nities. Aquat. Microb. Ecol. 18: 217–225.
WILHELM, S. W., S. BRIGDEN, AND C. SUTTLE. 2002. A dilutiontechnique for the direct measurement of viral production: Acomparison in stratified and tidally mixed coastal waters.Microb. Ecol. 43: 168–173.
———, AND C. A. SUTTLE. 1999. Viruses and nutrient cycles in theSea. Bioscience 49: 781–788.
———, M. G. WEINBAUER, C. A. SUTTLE, AND W. H. JEFFREY.1998. The role of sunlight in the removal and repair of virusesin the sea. Limnol. Oceanogr. 43: 586–592.
WILSON, W. H., AND N. H. MANN. 1997. Lysogenic and lytic viralproduction in marine microbial communities. Aquat. Microb.Ecol. 13: 95–100.
WINGET, D. M., K. WILLIAMSON, R. HELTON, AND K. E.WOMMACK. 2005. Tangential flow dilafiltration: An improvedtechnique for estimation of virioplankton production. Aquat.Microb. Ecol. 41: 207–216.
———, AND K. E. WOMMACK. 2008. Randomly amplifiedpolymorphic DNA (RAPD)-PCR as a tool for assessmentof marine viral richness. Appl. Environ. Microbiol. 74:2612–1618.
WINTER, C., G. HERNDL, AND M. G. WEINBAUER. 2004a. Dielcycles in viral infection of bacterioplankton in the North Sea.Aquat. Microb. Ecol. 35: 207–216.
———, A. SMIT, G. HERNDL, AND M. WEINBAUER. 2004b. Impactof virioplankton on archaeal and bacterial communityrichness in seawater batch cultures. Appl. Environ. Microbiol.70: 804–813.
———, A. SMIT, T. SZOEKE-DENES, G. J. HERNDL, AND M. G.WEINBAUER. 2005. Modelling viral impact on bacterioplank-ton in the North Sea using artificial neural networks. Environ.Microbiol. 7: 881–893.
WOMMACK, K. E., AND R. R. COLWELL. 2000. Virioplankton:Viruses in aquatic ecosystems. Microbiol. Mol. Biol. Rev. 64:69–114.
Associate editor: Wade H. Jeffrey
Received: 15 May 2008Accepted: 22 December 2008Amended: 08 February 2009
784 Weinbauer et al.