Abrahams, Ian, Backhouse, Anita, Bloom
158
Abrahams, Ian, Backhouse, Anita, Bloom, Katy ORCID: https://orcid.org/0000-0002-4907-425X, Griffin-James, Hannah and Mat Noor, Syafiq (2021) Research-2-Practice Supporting Secondary Science Teachers to Engage with Education Research. Documentation. University of Lincoln. Downloaded from: http://ray.yorksj.ac.uk/id/eprint/5962/ The version presented here may differ from the published version or version of record. If you intend to cite from the work you are advised to consult the publisher's version: Research at York St John (RaY) is an institutional repository. It supports the principles of open access by making the research outputs of the University available in digital form. Copyright of the items stored in RaY reside with the authors and/or other copyright owners. Users may access full text items free of charge, and may download a copy for private study or non-commercial research. For further reuse terms, see licence terms governing individual outputs. Institutional Repository Policy Statement RaY Research at the University of York St John For more information please contact RaY at [email protected]
-
Upload
khangminh22 -
Category
Documents
-
view
0 -
download
0
Transcript of Abrahams, Ian, Backhouse, Anita, Bloom
Abrahams, Ian, Backhouse, Anita, Bloom,Katy ORCID: https://orcid.org/0000-0002-4907-425X, Griffin-James,Hannah and Mat Noor, Syafiq (2021) Research-2-Practice Supporting Secondary Science Teachers to Engage with Education Research. Documentation. University of Lincoln.
Downloaded from: http://ray.yorksj.ac.uk/id/eprint/5962/
The version presented here may differ from the published version or version of record. If
you intend to cite from the work you are advised to consult the publisher's version:
Research at York St John (RaY) is an institutional repository. It supports the principles of
open access by making the research outputs of the University available in digital form.
Copyright of the items stored in RaY reside with the authors and/or other copyright
owners. Users may access full text items free of charge, and may download a copy for
private study or non-commercial research. For further reuse terms, see licence terms
governing individual outputs. Institutional Repository Policy Statement
RaYResearch at the University of York St John
For more information please contact RaY at [email protected]
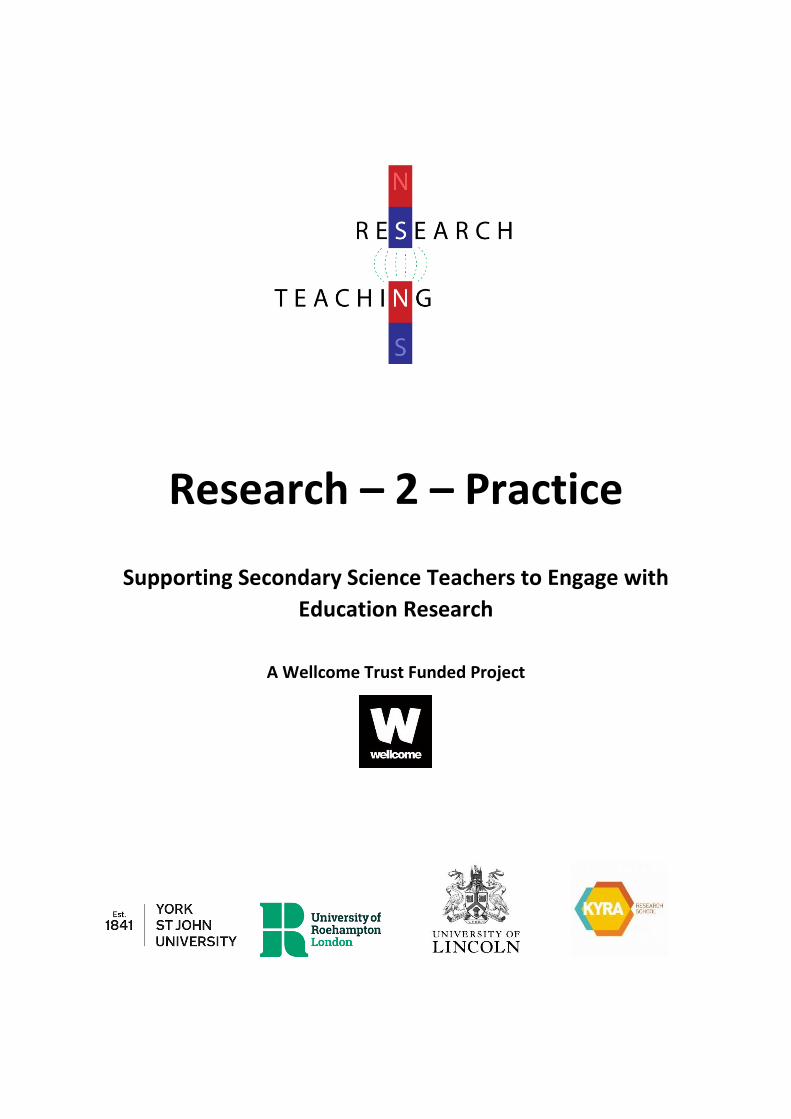
Research – 2 – Practice
Supporting Secondary Science Teachers to Engage with
Education Research
A Wellcome Trust Funded Project
Background to the Research-2-Practice Project
Evidence-informed teaching has been a focus for the UK government since 2014 and whilst there is a suggestion that engagement with research to inform practice can enhance the quality of teaching, access to high quality research is a challenge for school-based practitioners. Successful schools make research more accessible to staff by building research resource banks and by collaborating with universities. Whilst stronger schools also support teaching staff to become more independent in their engagement with research, there can be a tension between access to research and the judgement of its quality. Furthermore, teacher workload has been highlighted as a concern across the education sector and this includes that of trainees engaged in initial teacher education. Lesson planning has been identified as something that can be burdensome for trainees and the expectation that they develop individual lesson plans should be reviewed to help address workload issues.
Project Details
The research team at the University of Lincoln, University of Roehampton, York St John University and KYRA Research School worked together to develop packages of research summaries and lesson plans to enhance the quality of teaching and learning in a bid to reduce trainee workload and help them to engage with research. These materials have been designed to support primary PGCE trainees and their school-based mentors.
There are 20 research summaries and exemplar lesson plans available for a range of science topics across Key Stage 3 and Key Stage 4. The materials comprise two documents per science topic:
A research summary that synthesises and condenses academic science education research about tricky topics in a short summary about what the research says about these issues and how they can be remedied through specific pedagogical approaches.
A lesson plan that has been developed by experienced classroom practitioners to illustrate the most effective way of teaching science in a way that draws on the findings reported in the research summaries.
The materials are also available to download from www.research-2-practice.org.uk

Contents Key Stage 3
Biology
Structure and function of living organisms 1
Cellular respiration 10
Ecosystems 18
Chemistry
Atoms, elements and compounds 37
The particulate nature of matter 42
Earth and Atmosphere 48
Physics
Motion and forces 54
Electricity 61
Space physics 68
Light 76
Key Stage 4
Biology
Photosynthesis 81
Structure and function of living organisms 87
Ecosystems 94
Chemistry
Chemical equilibrium 100
Haber Process 113
Electrolysis 120
Atomic structure and the Periodic Table 126
Physics
Radioactivity 131
Wave motion - sound 138
Electromagnetism 146
Research Summary
Structure and function of living organisms Using educational games to teach about parts of a cell Students should be taught: the functions of the cell wall, cell membrane, cytoplasm, nucleus, vacuole, mitochondria and chloroplasts Science (Biology) – KS3
Statement of issue
There are two commonly found misconceptions in the literature, (i) the fried egg model, where students place the nucleus in the centre of a cell (Clément, 2007), (ii) students draw round shapes to illustrate the cell (Clément, 2007; Flores, 2003). At the core of these misconceptions is a limited understanding of the functions of the various organelles. This was demonstrated by Flores (2003), who measured the knowledge of 1200 Year 10-12 students of cells, finding that although students recognize that the cell is the structural unit in which organisms are formed, they found it challenging to identify the internal structure of a cell. In addition, research shows that students erroneously assigned all functions to the nucleus (Flores, 2003); this emphasises the issue that other researchers have found (Dikmenli, 2010) that students know the name of the organelles but not their corresponding function. Consequently, students lacking this core understanding confuse the cell membrane and cell wall (Barrass, 1984). Critically knowledge of cell parts and their functions is foundational to understanding life processes, from the cellular level to the level of the organisms (Carlan et al., 2014).
Main findings from the research
Recently, there has been an increasing interest in educational games' effectiveness because of the perceived levels of motivation and engagement from students (Boyan & Sherry, 2011) that they might generate. The following research tests the effectiveness of playing three different games on developing students’ understanding of organelles and their functions.
Research shows… Uzun (2012) evaluated a game-based intervention for teaching the cell and assessed students’ understanding. A sample of 193 students, comprising five Year 7 classes from two schools, was assessed; three classes received the intervention and played the cell game (121 students), and two classes received their normal lessons without the game (72 students). The students in the intervention classes played a game called Cell Model, which the researcher developed. The game has three game tasks that can be split over three lessons:
• Animation: Students worked in small groups and were assigned an organelle to animate (i.e. hand-drawnanimation). The students drew the organelle using A4 paper and coloured pencils, they were then giveninformation about the functions of their organelles and asked to learn this for the next lesson.
• Play at being a model plant cell: Students wore labels of which organelle they were and went to a largespace with the teacher. The students were asked to have conversations in pairs about the functionalinteraction between the organelle and organelle, and nucleus and organelle (e.g. Nucleus said‘Mitochondria! The cell needs energy, generate energy!’, Mitochondria said ‘The required energy has been generated’). The teacher played the role of the nucleus and managed the cell.
• Play at being a model animal cell: After exploring through dialogue, the functions of each organelle witheach student, the cell wall and chloroplast were recast, and an animal cell was created. The same gameensued with an additional emphasis comparing the previous plant cell with the new animal cell.
Before and after the sessions students’ knowledge of cells was tested, notably, both the intervention and control classes (the later were taught the same material using a traditional didactic approach), had similarly low scores on the test before teaching. Comparing the students’ scores after teaching, students in the intervention classes performed statistically significantly higher on the knowledge test than the students in the control classes. This
1
suggests that teaching the topic of cell parts through games is a a more effective pedagogy for improving student knowledge of organelles and their functions than a traditional didactic approach.
Spiegel et al., (2008) tested whether using a board game to support secondary students’ learning about organelles and their functions improved students understanding. The game was designed collaboratively by the researchers and their graduate students, and they were keen for the cell depicted on the board not to be the same image that is commonly seen in textbooks (i.e. with a single mitochondrion, round plasma membrane and nucleus in the centre), as they believed this common representation causes misconceptions. Players are asked to solve Cases related to cells (e.g. how are lipids organised in the plasma membrane? – learning about lipids and cell membranes), they need to discuss and interpret clues while moving through cell organelles and structures that are represented on the game board. Each Case takes approximately 45 minutes of game playing to complete; full details of the game can be found in the paper Discovering the cell (Spiegel et al., 2008). The game was thoroughly tested in Brazil across 14 schools with 697 secondary students, students’ knowledge was tested after they had played the game with a short test that asked them to name a selection of organelles and their function. They found that students, on average, could correctly name 81% of the organelles and their functions after playing the game. However, students knowledge was not compared to students learning the same content through another approach. Learning achievement gains were also measured by how many students completed the game with the correct solution, and the researchers qualitatively measured students understanding of the concepts in a discussion after the game with 151 students. Although 32% of students did not correctly solve the game, a higher portion than those who correctly solved the game could answer the test questions (81%) and demonstrate their understanding in qualitative discussions with the researchers. Therefore, showing students learnt about organelles and their functions through playing a board game.
Jaipal and Figg (2009) tested the effectiveness of playing the computer game Nano Legends, to improve students’ learning about animal cell organelles and their functions. Nano Legends is an educational game designed to support the Canadian Biology curriculum for the equivalent of KS3 students. The player uses nanobots to patrol the human body to protect it from disease, to accomplish tasks the player must learn how the cell works. There are seven levels, and each level takes 35-45 minutes to complete. The four teachers involved in the study focused on the level in the game designed to teach organelles and their functions (one criticism being that the game did not have any material on plant cells). Six biology classes totalling 164 Year 9 students used Nano Legends as the primary pedagogical strategy. To compare the effectiveness of playing the computer game Nano Legends one teacher who had two Year 9 classes, taught one class using the game Nano Legends and the other class of 32 students did not play the video game (using a traditional didactic approach), however the statistical outcome of this is not reported in the paper. Students’ knowledge was tested before and after playing the game. Also, pre-and-post test scores were analysed, showing a statistically significant improvement across all students who played the game. A subset of 25 students who played the game were interviewed, showing that they gained an understanding of concepts illustrated in the game, this was demonstrated through students use of scientific vocabulary. Therefore, this research suggests that playing the computer game Nano Legends is a useful pedagogy to support students’ learning about animal organelles and their functions. The researchers did not report on the control group compared to the intervention, and therefore it cannot be assumed that playing Nano Legends is more effective than not playing.
Thompson et al., (2020) created and tested the virtual reality game Cellverse, where students complete challenges by exploring and diagnosing a cell. Cellverse is a collaborative computer game that students can use to learn about organelles. Students play in pairs, one using an Oculus Rift with Touch contollers, the other a laptop or tablet. A sample of 111 students from Year 9 to 6th Form played the game, and completed a pre-and-post knowledge test where they answered multiple choice questions and drew a cell. There was a statistically significant increase in knowledge after playing the game. They also found that after playing the game students cell drawings were more complex as they contained more organelles. The important element from Thompson et al., (2020) study is that the students experience haptic feedback (i.e. feeling the shape, size of an organelle). Minogue et al., (2006) work further supports the importance of students experiencing haptic feedback. They designed a computer game Cell Exploration that provides haptic feedback using a desktop virtual environment connected to a PHANToM device. Eighty Year 8 students took part, all students played the computer game, 40 students received visual and haptic feedback, and the other 40 visual feedback only as they played the game. Although both groups of students started with the same level of knowledge of organnels, the students that received both visual and haptic feedback performed statistically significantly better on the knowledge test.
2
Access to these devices may not be possible or suitable, and Yazici et al., (2020), demonstrated a similar haptic experience (i.e. feel of the internal structure of a cell) can be gained by students making a model of a cell using modelling clay or plasticine. They were interested in making learning about organelles accessible to visually impaired students by incorporating tactile experiences (i.e. where students receive haptic feedback). A small sample of 15 Year 8 students, used tactile activities to learn about the structure and function of organelles, this included role playing the function of cells, and making a cell from modelling clay. They found an overall improvement in understanding about the organelles functions, but stressed that more adaptions were needed for students to remember the names of the organelles, as they were only read or verbalised by the teacher.
Research into successful game creation suggests it is necessary to support students in creating mental models of the educational content (Boyan & Sherry, 2011). In the examples of research given, the games supported students development of mental models of organelles and their functions through intrinsic challenges, for example: • Uzun (2012) players needed to apply their knowledge from drawings to playing the part of an organelle,
• Spiegel et al., (2008) players needed to solve Cases by interpreting clues,• Jaipal and Figg (2009) players used their understanding to complete challenges, i.e. creating a glucose
molecule to use as a disguise to pass through a cell membrane,• Thompson et al., (2020) Cellverse a virtual reality game where players explore a virtual cell and can dignose
disease,• Minogue et al., (2006), Cell Exploration a desktop computer game where players receive feedback from a
haptic device whilst they explore a virtual animal cell.
The game feature of challenging players to use their knowledge as a necessary intrinsic aspect of the game is an important feature to identify when selecting a game to teach about organelles and their functions. Another important feature, is the navigation through a cell to learn about the structure, organelles and their functions, whether using representations on a board (Spiegel et al., 2008), physically moving around players who are representing the organelles (Uzun, 2012), or virtually moving a character through the cell (Jaipal & Figg, 2009). The research suggests students will also benefit from being able to feel the size and shape of the organelles (Thompson et al., 2020; Minogue et al., 2006). Although specialist devices were used to provide haptic feedback, this can also be achieved when students play at being a cell (Uzun, 2012; Yazici, 2020), as they also experience the size and shape of the organelle when they physically move around players who are representing organelles. The research on using games to teach organelles and their functions suggests that games that have an intrinsic challenge and navigation through the cell successfully improve students' understanding of cell parts (Jaipal & Figg, 2009; Spiegel et al., 2008; Uzun, 2012).
Therefore, a lesson was produced to incorporate games into teaching organelles and their functions.
References Barrass, R. (1984). Some misconceptions and misunderstandings perpetuated by teachers and textbooks of
biology. Journal of Biological Education, 18(3), 201-206. Boyan, A., & Sherry, J. L. (2011). The challenge in creating games for education: Aligning mental models with game
models. Child Development Perspectives, 5(2), 82-87. Carlan, F. D. A., Sepel, L. M. N., & Loreto, E. L. S. (2014). Teaching cell biology in primary schools. Education Research
International, 2014, Article 272475. Clément, P. (2007). Introducing the cell concept with both animal and plant cells: A historical and didactic approach.
Science and Education, 16(3), 423-440. Dikmenli, M. (2010). Misconceptions of cell division held by student teachers in biology: A drawing analysis. Scientific
Research and Essays, 5(2), 235-247. Flores, F. (2003). Representation of the cell and its processes in high school students: An integrated view.
International Journal of Science Education, 25(2), 269-286. Jaipal, K., & Figg, C. (2009). Using video games in science instruction: Pedagogical, social, and concept-related
aspects. Canadian Journal of Science, Mathematics and Technology Education, 9(2), 117-134.
3

Minogue, J., Jones, M. G., Broadwell, B., & Oppewall, T. (2006). The impact of haptic augmentation on middle school students’ conceptions of the animal cell. Virtual Reality, 10(3), 293-305.
Spiegel, C. N., Alves, G. G., Cardona, T. D. S., Melim, L. M., Luz, M. R., Araújo-Jorge, T. C., & Henriques-Pons, A. (2008). Discovering the cell: An educational game about cell and molecular biology. Journal of Biological Education, 43(1), 27-36.
Thompson, M. M., Wang, A., Bilgin, C. U., Anteneh, M., Roy, D., Tan, P., Eberhart, R., & Klopfer, E. (2020). Influence of Virtual Reality on High School Students' Conceptions of Cells. Journal of Universal Computer Science, 26(8), 929-946.
Uzun, N. (2012). A sample of active learning application in science education: The thema “cell” with educational games. Procedia-Social and Behavioral Sciences, 46, 2932-2936.
Yazici, F., & Sozbilir, M. (2020). Teaching Cell to 6th Grade Students with Visual Impairment. Education and Science, 45(204), 227-251.
4
Lesson Plan
Structure and function of living organisms
Using educational games to teach about parts of a cell
Students should be taught: the functions of the cell wall, cell membrane, cytoplasm, nucleus, vacuole, mitochondria and chloroplasts
Science (Biology) – KS3
Research recommendation(s) and rationale
Research suggests that students better understand the structure and function of cell parts (i.e. organelles) when they learn about these by playing games. There are a few game components that the research suggest we incorporate to encourage learning about cell parts.
- Challenging players to use their knowledge or organelles and their functions needs to be an intrinsic component aspect to agame (Jaipal & Figg; 2009; Minogue et al., 2006; Spiegel et al., 2008; Thompson et al,. 2020; Unzun, 2012).
- It is beneficial for students to explore the inside of a cell, by moving inside the space, this could be by moving pieces on a boardgame (Spiegel et al., 208), through role play and moving around the other players representing organelles with their body(Unzun, 2012), or virtually moving through a cell on a Virtual Reality Headset (Thompson et al., 2020) or a computer screen(Minogue et al., 2006).
- Students benefit from being able to see and feel the size and shape of organelles (Thompson et al., 2020; Minogue et al., 2006),this could be achieved using computer devices like PHANToM or virtual reality headsets, or by making a cell using modelling clayor plasticine (Yazici et al, 2020).
Lesson aim To use games to teach about the structure and function of organelles.
Learning objective At the end of this lesson, students will: i. Be able to name the different parts of a cell.ii. Understand the function of the different parts of a cell.
Intended learning outcomes At the end of the lesson, students will be able to: i. Draw an accurate diagram of a cell.
ii. Annotate a diagram of a cell with the function of each organelle.
Prior Knowledge Students should have knowledge of: - Living things are made up of cells.- Cells are small and cannot be seen using your eye, you need to use a microscope to see a cell
Scientific vocabularly Organelle – is the name for a part of a cell. Cell wall – outer structure that surrounds the cell and gives support. Cell membrane – surrounds the cell, and allows nutrients to enter, and waste to leave. Cytoplasm – jelly-like substance in which chemical reactions happen. Nucleus – controls what happens in the cell. Vacuole – space within the cytoplasm of plant cells that contains sap. Mitochondria – powerhouse of a cell. Where respiration takes place.
5

Chloroplasts – contain chlorophyll and are the site of photosynthesis.
Suggested lesson sequence and activities
Do Now: As students enter the class display a model or diagram of both an animal and plant cell. Ask them to list the similarities and differences.
Activity 1: Link to prior knowledge Once sufficient organelles have been identified from the activity on the board as they enter the room, the key vocabulary can be written on the board. To bridge to the next activity, demonstrate using an onion that plants are composed of cells. First show the whole onion, then break it into pieces and then a membrane. Use a microscope to allow further examination of the membrane.
Activity 2: Make a flipbook Individually or in small groups students make a flipbook. Each flipbook should contain a page for each of the 7 organelles (cell wall, cell membrane, cytoplasm, nucleus, vacuole, mitochondria and chloroplasts). Each flipbook will needs 4 pieces of A4 paper, to fold in half to make a flip book.
On the front cover, students can: 1- Draw an animal and plant cell
On the front of the internal pages, students need to include: 1- The name of the organelle2- A drawing of the organelle3- The location of the organelle within the cell
On the back of the internal pages, students need to write: 1- Organelle function2- Whether the organelle is found in plant cells, animal cells, or both (if organelle is found in both, explain how it functions
differently)
Activity 3: Role play at being a cell Make large labels, which have the organelle name and a picture. Each student will need two labels, for their front and back that can be seen as they move. Assign organelles to students (teacher will need to be the nucleus to begin with), involve students in working out how many students will play each role, e.g. you will need more students playing the role of cell membrane than mitochondria. If the classroom is not suitable, take students to a large space (playground or hall). Ask students to use the knowledge of the functions from their flipbooks.
6

Making a plant cell: Ask students who are playing roles that can be found in a plant cell to assemble themselves to make a plant cell. Then ask students to have conversations in pairs about the functional interaction between the organelles (e.g. Nucleus can say to the Mitochondria: the cell needs energy, generate energy). Through dialogue and movement each student will be exploring the function of the organelle they have been assigned. Have students role play their organelles main function, e.g. the student playing cell wall could create a barrier together, and also remind students to thing about the shape they are forming to avoid the fried egg model.
To take this further now ask students to work together to be an animal cell, the role of nucleus can be given to a student.
Activity 4: Make a cell Display a picture of an animal and plant cell and ask students to make an accurate cell (either animal or plant). Use plasticine or modelling clay, so you do not need to store it to prevent it from drying out.
Activity 5: Bingo Provide students with a 3x3 bingo card with the middle square blanked out. The bingo card has 8 spaces. Ask students to fill in these squares with different drawings of organelles from animal and plant cells. Note the curriculum states students need to learn the functions of 7, in this game there is the opportunity to further develop students’ knowledge by adding an additional organelle, e.g. ribosomes – a tiny organelle where protein synthesis occurs.
Make a stack of cards that list out the functions of the cell parts. Include both animal and plant cells to give students more options for their bingo card spaces. The more variety students have in the cards they make the more fun the game will be. Give students counters or squares of paper to cover the individual squares of the bingo card.
To play draw from your stack of function cards and read out the function of an organelle. Wait for students to cover the square on their bingo cards with the organelle that performs that function. Reward the student who gets three squares in a row with a small prize (e.g. the winner can call the bingo for the next round). After each round, let the students clear off their board and play again.
Activity 6: Assessment Informal assessment by questioning should be used throughout.
Draw an animal cell and a plant cell and label the functions of the cell parts.
Key questions Activity 1: Link to prior knowledge What are the differences between living and non-living things? What are cells?
Activity 2: Make a flipbook
7
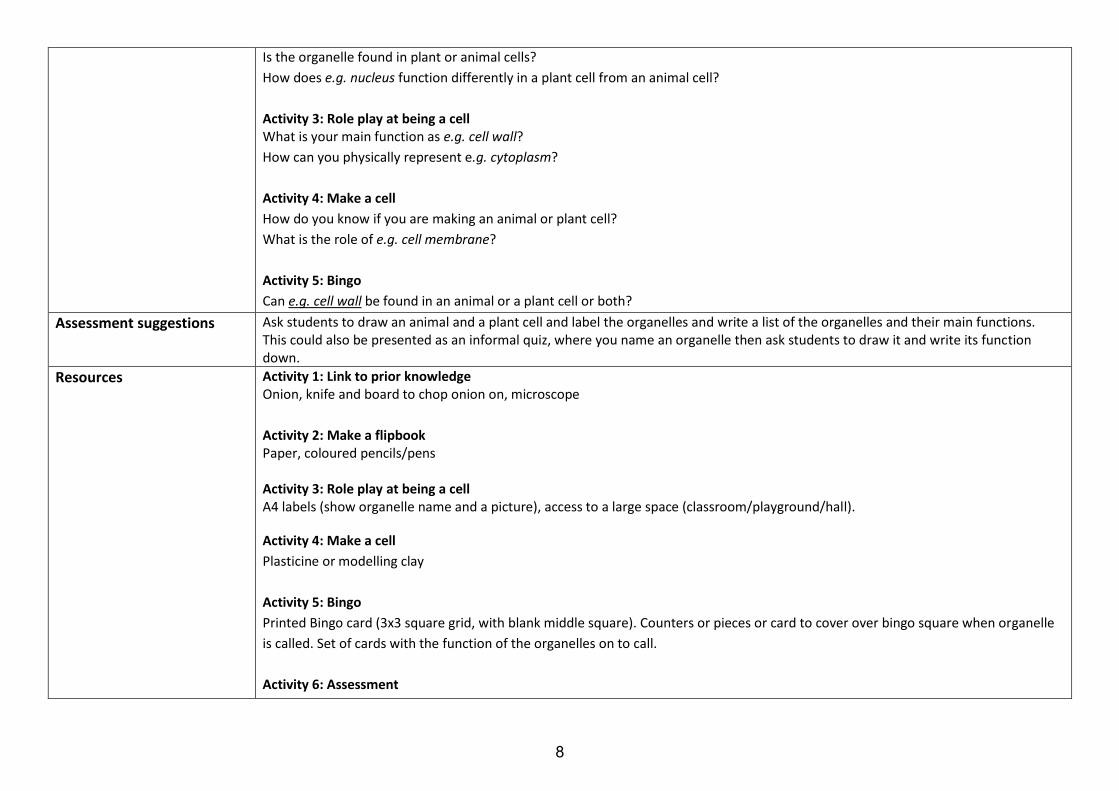
Is the organelle found in plant or animal cells?
How does e.g. nucleus function differently in a plant cell from an animal cell?
Activity 3: Role play at being a cell What is your main function as e.g. cell wall?
How can you physically represent e.g. cytoplasm?
Activity 4: Make a cell
How do you know if you are making an animal or plant cell?
What is the role of e.g. cell membrane?
Activity 5: Bingo
Can e.g. cell wall be found in an animal or a plant cell or both?
Assessment suggestions Ask students to draw an animal and a plant cell and label the organelles and write a list of the organelles and their main functions. This could also be presented as an informal quiz, where you name an organelle then ask students to draw it and write its function down.
Resources Activity 1: Link to prior knowledge Onion, knife and board to chop onion on, microscope
Activity 2: Make a flipbook Paper, coloured pencils/pens
Activity 3: Role play at being a cell A4 labels (show organelle name and a picture), access to a large space (classroom/playground/hall).
Activity 4: Make a cell
Plasticine or modelling clay
Activity 5: Bingo
Printed Bingo card (3x3 square grid, with blank middle square). Counters or pieces or card to cover over bingo square when organelle
is called. Set of cards with the function of the organelles on to call.
Activity 6: Assessment
8

Paper, coloured pencils/pens
H&S considerations Hazard Activity 1: Link to prior knowledge Chopping with a sharp knife could be hazardous, only the teacher should carry out this activity.
Making a flipbook, role play, making a cell, and playing bingo should not be hazardous.
9

Research Summary
Cellular respiration Using conceptual change texts and concept maps to teach cellular respiration Students should be taught: aerobic and anaerobic respiration in living organisms, including the breakdown of organic molecules to enable all the other chemical processes necessary for life Science (Biology) – KS3
Statement of issue
Misconceptions about cellular respiration have been widely reported in the literature (Mann & Treagust, 1998; Songer & Mintzes, 1994), with students holding misconceptions such as respiration is the same as breathing (Alparslan et al., 2003) or erroneously believing that “during anaerobic respiration reactions CO2 is used instead of O2” (Al khawaldeh & Al Olaimat, 2010, p. 122,). Research by Sanders and Cramer (1992) suggests that students’ misconceptions about cellular respiration is driven by their struggle to interlink biological concepts (namely, digestion, energy in food chains, and photosynthesis). Therefore, research has examined which strategies can change students’ misconceptions (Alparslan et al., 2003; Al khawaldeh & Al Olaimat, 2010) and support students in linking biological concepts (Brown, 2003).
Main findings from the research
Conceptual change It is possible to elicit conceptual change in students using several different methods (e.g. analogy-based teaching, critical discussion (Gafoor & Akhilesh, 2010). The research on teaching strategies for cellular respiration focused on two strategies, contextual change texts and concept maps. Conceptual change texts are typically developed by the class teacher in response to their students’ misconceptions (Posner et al., 1982), first stating the misconception, and then presenting text (including diagrams and tables) explaining the scientific explanation of the topic, and including some text explaining why the misconception is wrong (Guzzetti et al., 1993). Concept maps are a visual representation of interlinked scientific concepts, students can draw these on a blank piece of paper, starting with a concept of cellular respiration in a box (e.g., oxygen), then drawing arrows and adding another concept (e.g., water) and linking words can be added to describe the relationship between the concepts (e.g., contains).
What the research shows Alparslan et al. (2003) examined the effectiveness of students reading conceptual change texts to address their understanding of cellular respiration. The researchers and biology teacher wrote the texts in response to students’ misconceptions, which were elicited with written questions. The resulting conceptual change texts were given to students 3 days before their class on that topic with the expectation that they would read the text; students were also given opportunities to read through the relevant text during class time. The texts highlighted misconceptions about cellular respiration by posing a question and giving misconceptions as potential answers, then presenting scientific explanations to undermine the misconceptions. Each misconception was studied separately and was followed with a class discussion. Two Year 12 classes from the same school took part; one class of 34 students received the intervention and another class of 34 students who received their normal teacher-directed teaching (lecture and discussion) acting as a control, all classes were taught by the same biology teacher. Both classes received four 40-minute classes over 5-weeks, working through the same assignments and worksheets, the main difference was the use of conceptual change texts by the intervention class. Also, the teaching in the intervention class was guided by students’ misconceptions, whereas in the control class, students' misconceptions were not directly acknowledged.
Students’ understanding was tested with a tiered multiple-choice concept test on cellular respiration (developed by Haslam & Treagust, 1987), in which students had to identify the correct concept and the reason for identifying that
10
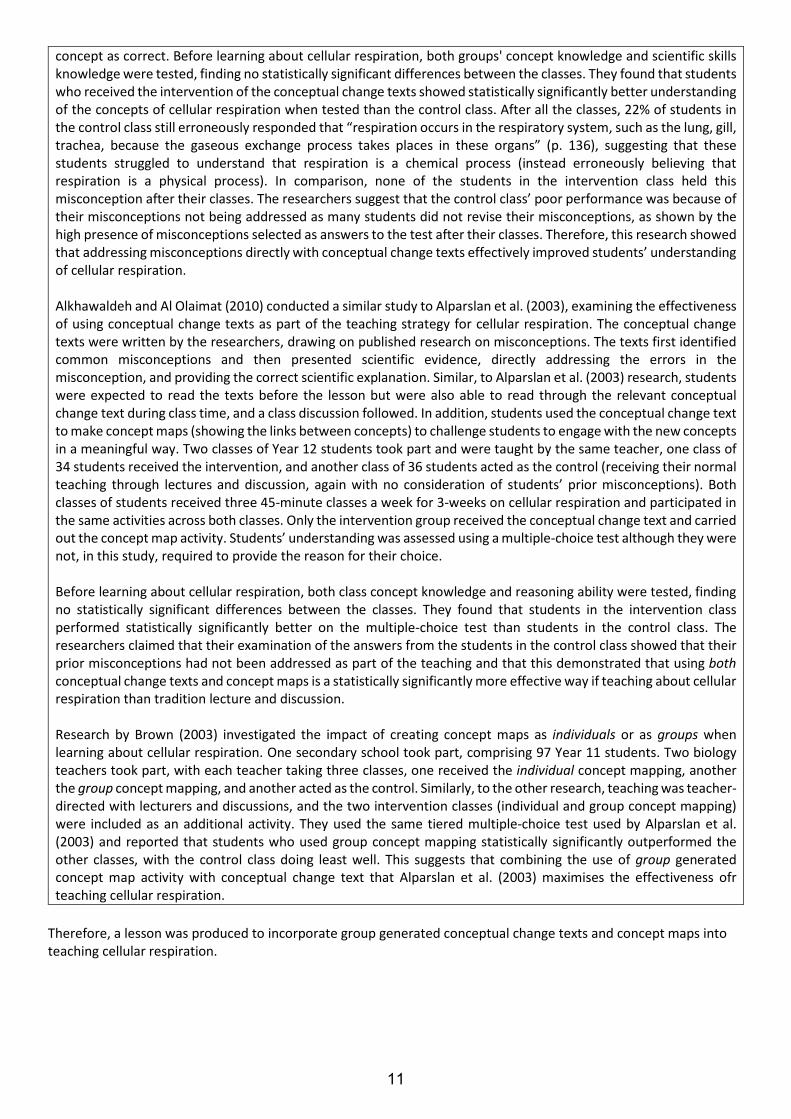
concept as correct. Before learning about cellular respiration, both groups' concept knowledge and scientific skills knowledge were tested, finding no statistically significant differences between the classes. They found that students who received the intervention of the conceptual change texts showed statistically significantly better understanding of the concepts of cellular respiration when tested than the control class. After all the classes, 22% of students in the control class still erroneously responded that “respiration occurs in the respiratory system, such as the lung, gill, trachea, because the gaseous exchange process takes places in these organs” (p. 136), suggesting that these students struggled to understand that respiration is a chemical process (instead erroneously believing that respiration is a physical process). In comparison, none of the students in the intervention class held this misconception after their classes. The researchers suggest that the control class’ poor performance was because of their misconceptions not being addressed as many students did not revise their misconceptions, as shown by the high presence of misconceptions selected as answers to the test after their classes. Therefore, this research showed that addressing misconceptions directly with conceptual change texts effectively improved students’ understanding of cellular respiration.
Alkhawaldeh and Al Olaimat (2010) conducted a similar study to Alparslan et al. (2003), examining the effectiveness of using conceptual change texts as part of the teaching strategy for cellular respiration. The conceptual change texts were written by the researchers, drawing on published research on misconceptions. The texts first identified common misconceptions and then presented scientific evidence, directly addressing the errors in the misconception, and providing the correct scientific explanation. Similar, to Alparslan et al. (2003) research, students were expected to read the texts before the lesson but were also able to read through the relevant conceptual change text during class time, and a class discussion followed. In addition, students used the conceptual change text to make concept maps (showing the links between concepts) to challenge students to engage with the new concepts in a meaningful way. Two classes of Year 12 students took part and were taught by the same teacher, one class of 34 students received the intervention, and another class of 36 students acted as the control (receiving their normal teaching through lectures and discussion, again with no consideration of students’ prior misconceptions). Both classes of students received three 45-minute classes a week for 3-weeks on cellular respiration and participated in the same activities across both classes. Only the intervention group received the conceptual change text and carried out the concept map activity. Students’ understanding was assessed using a multiple-choice test although they were not, in this study, required to provide the reason for their choice.
Before learning about cellular respiration, both class concept knowledge and reasoning ability were tested, finding no statistically significant differences between the classes. They found that students in the intervention class performed statistically significantly better on the multiple-choice test than students in the control class. The researchers claimed that their examination of the answers from the students in the control class showed that their prior misconceptions had not been addressed as part of the teaching and that this demonstrated that using both conceptual change texts and concept maps is a statistically significantly more effective way if teaching about cellular respiration than tradition lecture and discussion.
Research by Brown (2003) investigated the impact of creating concept maps as individuals or as groups when learning about cellular respiration. One secondary school took part, comprising 97 Year 11 students. Two biology teachers took part, with each teacher taking three classes, one received the individual concept mapping, another the group concept mapping, and another acted as the control. Similarly, to the other research, teaching was teacher-directed with lecturers and discussions, and the two intervention classes (individual and group concept mapping) were included as an additional activity. They used the same tiered multiple-choice test used by Alparslan et al. (2003) and reported that students who used group concept mapping statistically significantly outperformed the other classes, with the control class doing least well. This suggests that combining the use of group generated concept map activity with conceptual change text that Alparslan et al. (2003) maximises the effectiveness ofr teaching cellular respiration.
Therefore, a lesson was produced to incorporate group generated conceptual change texts and concept maps into teaching cellular respiration.
11
References
Alkhawaldeh, S. A., & Al Olaimat, A. M. (2010). The contribution of conceptual change texts accompanied by concept mapping to eleventh-grade students understanding of cellular respiration concepts. Journal of Science Education and Technology, 19(2), 115-125. Alparslan, C., Tekkaya, C., & Geban, Ö. (2003). Using the conceptual change instruction to improve learning. Journal of Biological Education, 37(3), 133-137. Brown, D. S. (2003). High school biology: A group approach to concept mapping. The American Biology Teacher, 65(3), 192-197. Gafoor, K. A., & Akhilesh, P. T. (2010). Strategies for facilitating conceptual change in school physics. Online Submission, 3(1), 34-42. Guzzetti, B. J., Snyder, T. E., Glass, G. V., & Gamas, W. S. (1993). Promoting conceptual change in science: A comparative meta-analysis of instructional interventions from reading education and science education. Reading Research Quarterly, 28, 117-159. Haslam, F., & Treagust, D. F. (1987). Diagnosing secondary students' misconceptions of photosynthesis and respiration in plants using a two-tier multiple choice instrument. Journal of Biological Education, 21(3), 203-211. Mann, M., & Treagust, D. F. (1998). A pencil and paper instrument to diagnose students’ conceptions of breathing, gas exchange and respiration. Australian Science Teachers Journal, 44, 55-60. Posner, G. J., Strike, K. A., Hewson, P. W., & Gertzog, W. A. (1982). Accommodation of a scientific conception: Toward a theory of conceptual change. Science Education, 66, 211-227. Sanders, M., & Cramer, F. (1992). Matric biology pupils’ ideas about respiration: Implications for science educators. South African Journal of Science, 88, 543-548. Songer, C. J., & Mintzes, J. J. (1994). Understanding cellular respiration: An analysis of conceptual change in college biology. Journal of Research in Science Teaching, 31, 621-637.
12

Lesson Plan
Cellular respiration
Using conceptual change texts and concept maps to teach cellular respiration Students should be taught:
Science (Biology) – KS3
Research recommendation(s) and rationale
Misconceptions about cellular respiration have been widely reported in the literature (Mann & Treagust, 1998; Songer & Mintzes, 1994). Research by Sanders and Cramer (1992) suggests that students’ misconceptions about cellular respiration is driven by their struggle to interlink biological concepts.
Conceptual change It is possible to elicit conceptual change in students using several different methods (e.g., analogy-based teaching, critical discussion (Gafoor & Akhilesh, 2010). The research on teaching strategies for cellular respiration focused on two strategies, contextual change texts and concept maps. Conceptual change texts are typically developed by the class teacher in response to their students’ misconceptions (Posner et al., 1982), first stating the misconception, and then presenting text (including diagrams and tables) explaining the scientific explanation of the topic, and including some text explaining why the misconception is wrong (Guzzetti et al., 1993). Concept maps are a visual representation of interlinked scientific concepts, students can draw these on a blank piece of paper, starting with a concept of cellular respiration in a box (e.g., oxygen), then drawing arrows and adding another concept (e.g., water) and linking words can be added to describe the relationship between the concepts (e.g., contains).
Lesson aim To use conceptual change texts and concept maps to understand cellular respiration.
Learning objective To understand aerobic and anaerobic respiration are key processes in enabling all chemical reactions necessary for life.
Intended learning outcomes At the end of the lesson, pupils will be able to: i. Identify key features of aerobic and anaerobic respiration.
ii. Describe the similarities and differences between aerobic and anaerobic respiration.
iii. Explain how aerobic and anaerobic respiration enables all other chemical processes necessary for life.
Scientific vocabulary Respiration – a chemical reaction that happens in all living cells, including plant cells and animal cells. It is the way that energy is released from glucose so that all the other chemical processes needed for life can happen. Aerobic respiration – respiration that requires oxygen. Anaerobic respiration – respiration that does not require oxygen. Chemical processes – where chemicals are changed involving a chemical reaction. Organism - Any animal, plant, fungus, bacterium.
• aerobic and anaerobic respiration in living organisms• the breakdown of organic molecules to enable all the other chemical processes necessary for life
13
Suggested lesson sequence and activities
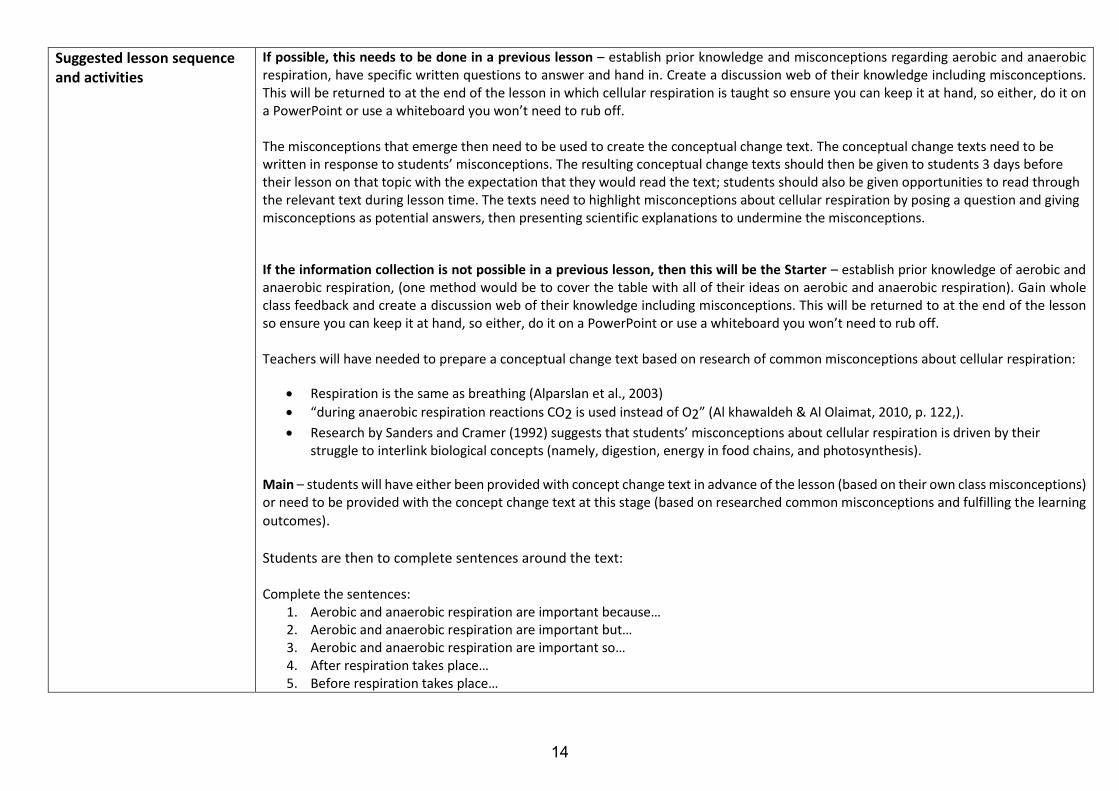
If possible, this needs to be done in a previous lesson – establish prior knowledge and misconceptions regarding aerobic and anaerobic respiration, have specific written questions to answer and hand in. Create a discussion web of their knowledge including misconceptions. This will be returned to at the end of the lesson in which cellular respiration is taught so ensure you can keep it at hand, so either, do it on a PowerPoint or use a whiteboard you won’t need to rub off.
The misconceptions that emerge then need to be used to create the conceptual change text. The conceptual change texts need to be written in response to students’ misconceptions. The resulting conceptual change texts should then be given to students 3 days before their lesson on that topic with the expectation that they would read the text; students should also be given opportunities to read through the relevant text during lesson time. The texts need to highlight misconceptions about cellular respiration by posing a question and giving misconceptions as potential answers, then presenting scientific explanations to undermine the misconceptions.
If the information collection is not possible in a previous lesson, then this will be the Starter – establish prior knowledge of aerobic and anaerobic respiration, (one method would be to cover the table with all of their ideas on aerobic and anaerobic respiration). Gain whole class feedback and create a discussion web of their knowledge including misconceptions. This will be returned to at the end of the lesson so ensure you can keep it at hand, so either, do it on a PowerPoint or use a whiteboard you won’t need to rub off.
Teachers will have needed to prepare a conceptual change text based on research of common misconceptions about cellular respiration:
• Respiration is the same as breathing (Alparslan et al., 2003)
• “during anaerobic respiration reactions CO2 is used instead of O2” (Al khawaldeh & Al Olaimat, 2010, p. 122,).
• Research by Sanders and Cramer (1992) suggests that students’ misconceptions about cellular respiration is driven by theirstruggle to interlink biological concepts (namely, digestion, energy in food chains, and photosynthesis).
Main – students will have either been provided with concept change text in advance of the lesson (based on their own class misconceptions) or need to be provided with the concept change text at this stage (based on researched common misconceptions and fulfilling the learning
outcomes).
Students are then to complete sentences around the text:
Complete the sentences: 1. Aerobic and anaerobic respiration are important because…2. Aerobic and anaerobic respiration are important but…3. Aerobic and anaerobic respiration are important so…4. After respiration takes place…5. Before respiration takes place…
14
6. When respiration takes place…7. Respiration links to digestion because…8. Respiration links to photosynthesis because…9. Respiration links to food chains because.
Bring their answers together and discuss with the class the significantly correct explanations of the concepts.
Once this is complete students are to complete a group concept mapping instruction exercise. It has been reported that students who used group concept mapping statistically significantly outperformed those that have used individual concept maps. They can then use their concept map to help with the plenary.
Plenary – use the graphic discussion web aid (created from a previous lesson or in the starter) to ask students to choose a position on the prior knowledge. So, do they now agree or disagree with the knowledge they had in the previous lesson or at the beginning of the lesson. For example, respiration is the same as breathing – agree or disagree. This can be established whole class with the use of traffic light cards. Red for disagree and green for agree. Students then need to give their reasons for their position supported by evidence from their concept map/ conceptual text.
An alternative plenary could be a multiple-choice quiz.
Dependent on class this lesson could run to a series of lessons.
What does the science say? (correcting misconceptions)
Misconceptions about cellular respiration have been widely reported in the literature (Mann & Treagust, 1998; Songer & Mintzes, 1994), with students holding misconceptions such as respiration is the same as breathing (Alparslan et al., 2003) or erroneously believing that “during anaerobic respiration reactions CO2 is used instead of O2” (Al khawaldeh & Al Olaimat, 2010, p. 122,). Research by Sanders and
Cramer (1992) suggests that students’ misconceptions about cellular respiration is driven by their struggle to interlink biological concepts (namely, digestion, energy in food chains, and photosynthesis). Therefore, research has examined which strategies can change students’ misconceptions (Alparslan et al., 2003; Al khawaldeh & Al Olaimat, 2010) and support students in linking biological concepts (Brown, 2003).
Key questions 1. What is respiration?2. What is aerobic respiration?3. What is anaerobic respiration?4. Can you give the equation for aerobic respiration?5. Can you give the equation for anaerobic respiration?6. What is different about aerobic and anaerobic respiration?7. What is the same about aerobic and anaerobic respiration?
15
8. Where does respiration take place?9. Which organisms (plants, animals, bacteria, fungi) respire?10. What does respiration allow organisms to do? Why is it important?11. Respiration enables all of the other chemical processes to happen that are necessary to life. How does it do this? What does it
provide?12. Does respiration link to digestion? If so how?13. Does respiration link to photosynthesis? If so, how?14. Does respiration link to energy in food chains? If so, how?
Assessment suggestions • Prior knowledge assessment using questions and answers that are used to complete the conceptual change text or cover the tableand circulation of teacher. Feedback from all students and prior knowledge and misconceptions turned into a graphical webdiscussion for later in the lesson.
• Circulation of teacher whilst students are answering key questions based on conceptual text.
• Q and A session of the questions when discussing the correct explanations.
• Traffic light cards to be used for whole class assessment of whether the misconceptions have been eliminated when students choosetheir position on the graphical web discussion from the starter. Cold calling can then be used for students to justify their position.This will give the teacher the knowledge that the student truly understands their position. If the student still chooses to believe amisconception this can also be addressed by asking the students to justify their position. When this happens students usually correctthemselves when they realise their explanation actually contradicts the statement they are agreeing with.
• Or a multiple-choice quiz can be used that can then be either self, peer or teacher assessed.
Resources Create the conceptual change text, here is a link to some examples to help at the end of the paper: The role of conceptual change texts to improve students' understanding of alkenes - Chemistry Education Research and Practice (RSC Publishing) DOI:10.1039/C3RP00019B
Have a template for a graphical web discussion ready for the starter, here is a link to some examples that could be adapted: Reading Educator Discussion Web - KMS Coaching (weebly.com)
Make sure you are able to confidently complete the concept mapping instruction exercise: How to Use Concept Mapping in the Classroom: A Complete Guide (evidencebasedteaching.org.au)
16
H&S considerations Normal classroom working environment Health and Safety apply.
17
Research Summary
Ecosystems Using ‘systems thinking’ in combination with a computer simulation to teach about the interdependence of organisms in an ecosystem. Students should be taught about: the interdependence of organisms in an ecosystem, including food webs and insect pollinated crops Science (Biology) – KS3
Statement of issue
Learning about relationships in an ecosystem is a challenging topic for students as it requires them to draw on their previous knowledge and recognize how the concepts interlink within an ecosystem (Moore-Anderson, 2021). The curriculum is structured so that learning about relationships in an ecosystem comes towards the end of KS3 - with students starting KS3 learning about physically small biological constructs (i.e. cell structure and organisation) and then subsequently learning about systems within living organisms (e.g. the muscles and skeleton, and digestion), and then ending on interlinked systems (e.g. ecosystem; Department of Education, 2013) - thereby seeking to develop students’ ability to think about the scientific concepts they learn at the start of KS3 within a larger network of living systems (Davies, 2015). However, misconceptions on the topic of relationships in an ecosystem are prevalent. For example, Butler et al. (2015) focused on the role of energy in an ecosystem using food chains (i.e. a simplified food web) and demonstrated that students mistakenly conclude that animals at the top of the food chain have the most energy, and exclude producers (e.g. plants, which make food via the process of photosynthesis) from the food chain. In addition, research shows that students find it challenging to recognise the links between the scientific concepts they previously learned at the start of KS3 (i.e. cell function) within the concept of larger nested systems like an ecosystem (Covitt et al., 2009; Ebert-May et al., 2003). Therefore, it is challenging for students to incorporate their previous knowledge of scientific concepts and apply these to understand the interdependence of organisms within an ecosystem (Davies, 2015; Moore-Anderson, 2021).
Main findings from the research
Research suggests that to better support students in developing an understanding of the interdependence of organisms within an ecosystem, their learning needs to be framed within a systems thinking (Ben-Zvi Assaraf & Orpaz, 2010; Fanta et al., 2020; Hmelo-Silver et al., 2017; Riess & Mischo, 2010). Systems thinking Adopting a systems thinking approach to teaching highlights how life is organised into many nested systems – rather like Russian Dolls – by drawing students’ attention to the interlinking of the different processes in an ecosystem. An example of systems thinking is to imagine something small travelling through a much more extensive network of nested living systems (Moore-Anderson, 2021); this could be an oxygen molecule travelling through an aquatic ecosystem. There are many paths that the oxygen molecule could take, however, here is an example of how an oxygen molecule could move in a pond ecosystem: green algae on the surface of the pond (producer) uses the Sun’s energy via photosynthesis to create oxygen which dissolves into the pond water → a mayfly (in the aquatic nymph stage) living in the pond (primary consumer) of ‘breaths’ (i.e. respiration) absorbing oxygen from the pond water → then a fish in the pond (secondary consumer) eats the mayfly, consuming the oxygen molecule. Outlining the interlinked processes within an ecosystem using systems thinking supports students in moving their focus away from the differences in the scientific concepts that they are applying (e.g. different organisms cellular respiration), focusing on how the different components are linked, and indeed how there are systems embedded within systems (e.g. how energy moves through an ecosystem), and that there are processes which interact similarly
18
across all living organisms (Capra & Luisi, 2014). Systems thinking is an approach to teach about the relationships in an ecosystem in biology, as systems thinking highlights these links (e.g. the interdependence of organisms within an ecosystem). Research suggests that in addition to adopting a systems thinking approach to teaching, including a computer simulation for students to use, further supports their learning (Hmelo-Silver et al., 2017; Riess & Mischo, 2010). Computer simulations can be used to promote students’ exploration of the links between organisms by asking students to play a role in the ecosystem – as can be seen in the following research where students are asked to manage a forest (Riess & Mischo, 2010).
What the research shows Hmelo-Silver et al. (2009, 2015, 2017) have conducted several studies demonstrating that students’ understanding of the interdependence of organisms within an ecosystem can be improved using systems thinking teaching by organising the way new information is presented to students as this supports students in making connections between phenomena and mechanisms (Liu & Hmelo-Silver, 2009). They have also demonstrated that simulations that emphasise a phenomenon's underlying mechanism (Hmelo-Silver et al., 2009, 2015) effectively support students in developing a solid understanding of a concept.
Using these different methods of concept representation (structured presentation of information and computer simulations) Hmelo-Silver et al., (2017) examined the effectiveness of teaching by promoting systems thinking using the structured presentation of information, simulations, and in addition conceptual modelling. In their previous studies, they found that students lacked support in explaining concepts; therefore, conceptual modelling was used to support students in sharing their thinking and testing ideas in a discussion. This took the form of building links between the different components in a pond ecosystem. A variety of teaching strategies was used to explore relationships in an aquatic ecosystem, from listening to podcasts, writing reflections to computer simulations.
Five classes from one school took part in the research over 8-weeks, comprising 65 students who received the intervention (three classes) and 47 students who acted as a control (two classes, traditional teaching using textbooks and hands-on activities). Problematically the impact of teacher style was not controlled; however, Riess and Mischo (2010) address this in their study. Students’ knowledge was assessed using two drawing tasks (aquatic and rainforest ecosystem) before and after the intervention, which were coded by the researchers for their level of understanding—comparing the scores from the drawings, they found statistically significant improvement in students’ knowledge in the intervention classes compared to the control classes. In addition, 4 students’ work was further examined qualitatively (2 students from the intervention, 2 students from the control), showing that students who received the intervention drew a more complete picture (i.e. drew the predator-prey relationship and expanded the food chain to include the sun and plants), therefore identifying more visible structures and cause-and-effect mechanisms, than students in the control classes who received traditional teaching. Building on previous research, this suggests that teaching the interdependence of organisms within an ecosystem using a system thinking approach to teaching effectively develops students’ knowledge about relationships in an ecosystem and that using more than one teaching strategy is important. However, what is not clear from these studies is which teaching strategy is most effective; Riess and Mischo (2010) address this.
Riess and Mischo (2010) similarly examined the effectiveness of using systems thinking to teach about the interdependence of organisms within an ecosystem. However, they tested different teaching strategies, namely the effectiveness of a computer simulation (i.e. forest game), and framing teaching using systems thinking, and a mix of the two. Please note that the forest game is not available; however an alternative can be accessed (Tyto Online: Ecology module, here https://www.tytoonline.com/ which contains the same features as Riess and Mischo (2010) forest game.
For example, both the forest game, and Tyto Online have been: - developed by academics and experts to allow students to experience the interlinked processes within an
ecosystem (forest, and in additional ecosystems desert, rainforest, grassland, and tundra),- allow students to experience the interlinked processes holistically within the ecosystem (i.e.
photosynthesis, decomposition, biodiversity),- uses systems thinking to support students understanding of the interdependence of organisms within an
ecosystem.
19
The students aim in the game is to create a sustainable ecosystem. Students start their ecosystem from scratch by placing plants, fungi, insects and later herbivores and predators, and observe how organisms depend on living factors (e.g. competing for food, decomposition), and explore these interactions over time (please note, time can be sped up in the game). The teaching using systems thinking (was developed by Stollenwerk as cited in Riess & Mischo, 2010), adopted several different methods, namely short lectures, making cause-and-effect diagrams, experimenting with the eating habitats of woodlice, analysing decomposition of a worm farm, games, and simulations; and focused on relationships in an ecosystem of a forest (e.g. food chains and the food network, cycles of matter, biodiversity). To enable comparison of the two interventions (teaching using systems thinking and a mix of systems thinking approach with a computer simulation), they lasted for the same length of time (11 lessons), with the computer simulation being replaced with a film and story for the teaching using systems thinking intervention classes.
A sample of 424 Year 7 students, comprising 15 classes from 6 schools, took part in the research. Four classes received each intervention: meaning that 4 classes received lessons using the computer-simulation forest game, 4 classes received lessons using systems thinking, 4 classes received a mix of computer simulation and systems thinking teaching, and 3 classes acted as a control, who were taught traditionally (didactic approach). To exclude the potential impact of differences in teaching style, each teacher taught at least one class across different teaching strategies. Students’ knowledge was measured using a written assessment, for example, they were asked to finish a drawing highlighting the relationships in a forest, draw a cause-and-effect diagram, and write long answers about the interdependence between mice and foxes. Students completed the assessment before and after the intervention. There were no statistically significant differences in the assessment scores across the classes before the intervention. To be sure that it was the intervention that led to any observed effect, the researchers also measured and controlled several additional variables using 4 scales: reasoning ability, memory span, academic self-concept in biology, motivational goal orientation. There were significant differences in memory span between classes, and these were controlled for statistically when examining the effect of the intervention.
It was found that students who received the mixed intervention of teaching using systems thinking and computer simulation performed statistically significantly better on the assessment after the intervention than students in the other interventions. Critically the other interventions (simulation only, systems thinking teaching only, or control) showed no statistically significant improvement in students’ scores. Therefore, suggesting the importance of supplementing systems thinking teaching with a computer simulation.
In summary, the research has shown that combining both a systems thinking teaching approach with a computer simulation is effective in supporting students understanding of the interdependence of organisms within an ecosystem (Hmelo-Silver et al., 2017; Riess & Mischo, 2010).
Therefore, a lesson was produced to incorporate systems thinking teaching in combination with a computer simulation to teach about relationships in an ecosystem.
References Ben-Zvi Assaraf, O., & Orpaz, I. (2010). The “life at the poles” study unit: Developing junior high school students’ ability
to recognize the relations between earth systems. Research in Science Education, 40(4), 525-549. Butler, J., Mooney Simmie, G., & O’Grady, A. (2015). An investigation into the prevalence of ecological misconceptions
in upper secondary students and implications for pre-service teacher education. European Journal of Teacher Education, 38(3), 300-319.
Capra, F., & Luisi, P. L. (2014). The systems view of life: A unifying vision. Cambridge University Press. Covitt, B. A., Gunckel, K. L., & Anderson, C. W. (2009). Students' developing understanding of water in environmental
systems. The Journal of Environmental Education, 40(3), 37-51. Davies, P. (2015). Learning about biology: Challenging the new biology school curriculum in England. Edukacja
Biologiczna i Środowiskowa, 2015, 39-50. Department of Education, (2013). National Curriculum in England: Science programmes of study.
https://www.gov.uk/government/publications/national-curriculum-in-england-scienceprogrammes-of-study Ebert-May, D., Batzli, J., & Lim, H. (2003). Disciplinary research strategies for assessment of learning. BioScience,
53(12), 1221-1228.
20
Fanta, D., Braeutigam, J., & Riess, W. (2020). Fostering systems thinking in student teachers of biology and geography–an intervention study. Journal of Biological Education.
Hmelo-Silver, C. E., Liu, L. E. I., & Jordan, R. (2009). Visual representation of a multidimensional coding scheme for understanding technology-mediated learning about complex natural systems. Research and Practice in Technology Enhanced Learning, 4(03), 253-280.
Hmelo‐Silver, C. E., Liu, L., Gray, S., & Jordan, R. (2015). Using representational tools to learn about complex systems: A tale of two classrooms. Journal of Research in Science Teaching, 52(1), 6-35.
Hmelo-Silver, C. E., Jordan, R., Eberbach, C., & Sinha, S. (2017). Systems learning with a conceptual representation: A quasi-experimental study. Instructional Science, 45(1), 53-72.
Liu, L., & Hmelo‐Silver, C. E. (2009). Promoting complex systems learning through the use of conceptual representations in hypermedia. Journal of Research in Science Teaching: The Official Journal of the National Association for Research in Science Teaching, 46(9), 1023-1040.
Moore-Anderson, C. (2021). Designing a curriculum for the networked knowledge facet of systems thinking in secondary biology courses: a pragmatic framework. Journal of Biological Education, 1-16.
Riess, W., & Mischo, C. (2010). Promoting systems thinking through biology lessons. International Journal of Science Education, 32(6), 705-725.
21
Lesson Plan
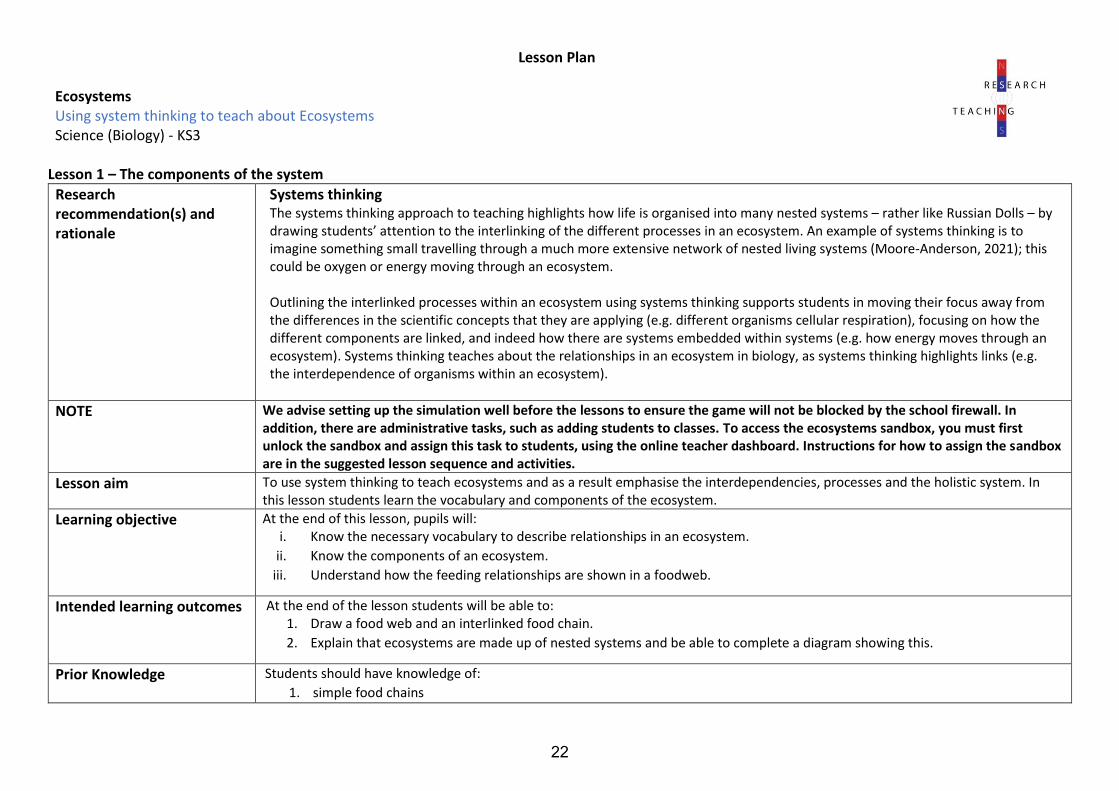
Ecosystems Using system thinking to teach about Ecosystems Science (Biology) - KS3
Lesson 1 – The components of the system
Research recommendation(s) and rationale
Systems thinking The systems thinking approach to teaching highlights how life is organised into many nested systems – rather like Russian Dolls – by drawing students’ attention to the interlinking of the different processes in an ecosystem. An example of systems thinking is to imagine something small travelling through a much more extensive network of nested living systems (Moore-Anderson, 2021); this could be oxygen or energy moving through an ecosystem.
Outlining the interlinked processes within an ecosystem using systems thinking supports students in moving their focus away from the differences in the scientific concepts that they are applying (e.g. different organisms cellular respiration), focusing on how the different components are linked, and indeed how there are systems embedded within systems (e.g. how energy moves through an ecosystem). Systems thinking teaches about the relationships in an ecosystem in biology, as systems thinking highlights links (e.g. the interdependence of organisms within an ecosystem).
NOTE We advise setting up the simulation well before the lessons to ensure the game will not be blocked by the school firewall. In addition, there are administrative tasks, such as adding students to classes. To access the ecosystems sandbox, you must first unlock the sandbox and assign this task to students, using the online teacher dashboard. Instructions for how to assign the sandbox are in the suggested lesson sequence and activities.
Lesson aim To use system thinking to teach ecosystems and as a result emphasise the interdependencies, processes and the holistic system. In this lesson students learn the vocabulary and components of the ecosystem.
Learning objective At the end of this lesson, pupils will: i. Know the necessary vocabulary to describe relationships in an ecosystem.
ii. Know the components of an ecosystem.
iii. Understand how the feeding relationships are shown in a foodweb.
Intended learning outcomes At the end of the lesson students will be able to: 1. Draw a food web and an interlinked food chain.
2. Explain that ecosystems are made up of nested systems and be able to complete a diagram showing this.
Prior Knowledge Students should have knowledge of:
1. simple food chains
22
2. mitochondria and basic knowledge of cellular respiration
3. photosynthesis
Scientific vocabulay Community - all the populations of different organisms that live together in a habitat. Consumer - an animal that eats a plant or another animal. Decomposer - bacteria and fungi, which break down dead organisms in a process called decomposition or rotting. Ecosystem - an ecosystem is a group of living organisms interacting with the non-living parts of an environment. Habitat - the place where an organism lives. Population - all the members of a single species that live in a habitat. Predator - an animal that hunts, kills, and eats other animals for food. Prey - an animal that is hunted by another for food. Producer - plants or algae, which photosynthesise using energy from the sun.
Suggested lesson sequence and activities
Do Now: As students enter the class, show students a picture of one or more ecosystem, with very different scales, such as a rock pool and the amazon forest. Ask them to list the similarities and differences. If one is available the small-scale example could be a terrarium, biosphere, aquarium, or other example of an ecosystem.
Activity 1: Link to Prior Knowledge Once sufficient components of the ecosystem have been identified from the activity on the board as they enter the room the key terms can be defined for the class. To bridge to the next activity and check prior knowledge, students are asked to write down, on mini whiteboards if they are unsure, a food chain from one of the systems.
Activity 2: Construct a food web. The keywords listed above are defined by the teacher, derived from the food chains constructed in the previous activity and input from the class.
Students are each given a card with a population printed upon it and a piece of string. The students begin by finding other members of their chain by looking for their prey or their predator. Once in food-chain-groups, students can discuss the relationships in their group using the keywords. It may help to display the keywords for students. It is useful if the populations are colour coded into food chains, with some having dual colours, or more, so the teacher can quickly see if the correct groups have formed. Colour coding also allows the teacher to easily pick out group member who could have been included in other food chains, which helps in the step in the task.
Once the individual chains have formed the class can expand to form a food web incorporating all the chains and adding even more links between the initial chains. The arrows in the food chain are formed using string linking the students holding the populations. The web is most easily formed by starting with a single food chain:
23
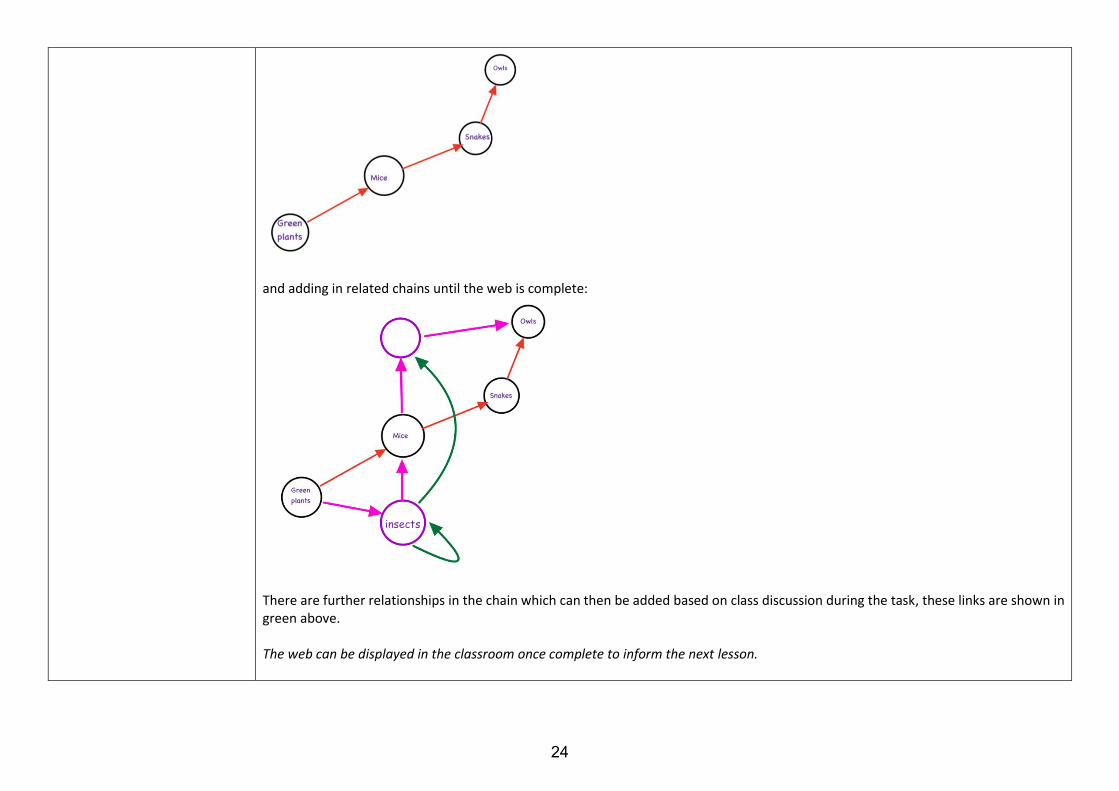
and adding in related chains until the web is complete:
There are further relationships in the chain which can then be added based on class discussion during the task, these links are shown in green above.
The web can be displayed in the classroom once complete to inform the next lesson.
insects
24
During the completion of this activity when student make links between their populations using string, they can be reminded that the strings represent the energy flow between components of the system.
Upon completion of this activity students should be asked to draw their own food web from some suggested examples. Completed food webs can be placed at points around the room for students to refer to once they have completed theirs and they should be encouraged to complete and correct their own diagrams.
Activity 3: Create a simulated ecosystem. In this activity students create an ecosystem using a computer simulation, to promote students’ exploration of the links between organisms. We recommend signing up for Tyto Online, which is an educational simulation game for KS3 and KS4 students. Tyto Online is a single player simulation game, where a player builds and balances an ecosystem, with the option to spend more time developing other ecosystems with the aim of building and maintaining a biome.
It will take time for students to create their ecosystem and fully experience the interdependent relations of their ecosystem. Therefore, in this first lesson, spend 20-30minutes setting up their character, watching tutorials, and getting into the game. Student’s who are faster can free play in the game, whilst others receive support. In the second lesson, we suggest you assign the sandbox activity to students, where students create their ecosystem.
**Important instructions for assigning the sandbox** Open the teacher dashboard, go to “Explore & Assign” on the left dropdown, choose “Ecology”, then on the top of the page that loads, choose “Sandbox”, scroll down to a green button “Unlock Sandbox”, select this and fill in the pop-up box with students/class and assign. This allows the sandbox immediately open after the student has set up their character and tested the controls. Once the sandbox has been unlocked and assigned, students are blocked from other activities, and are taken straight to the sandbox aspect of the game. If this step is skipped students have at least 2 hours of in game missions to complete before being able to unlock the sandbox themselves. Unlocking and assigning the ecology sandbox to students is an important step to carry out before the lesson.
Activity 4: Assessment Informal assessment by questioning should be used throughout.
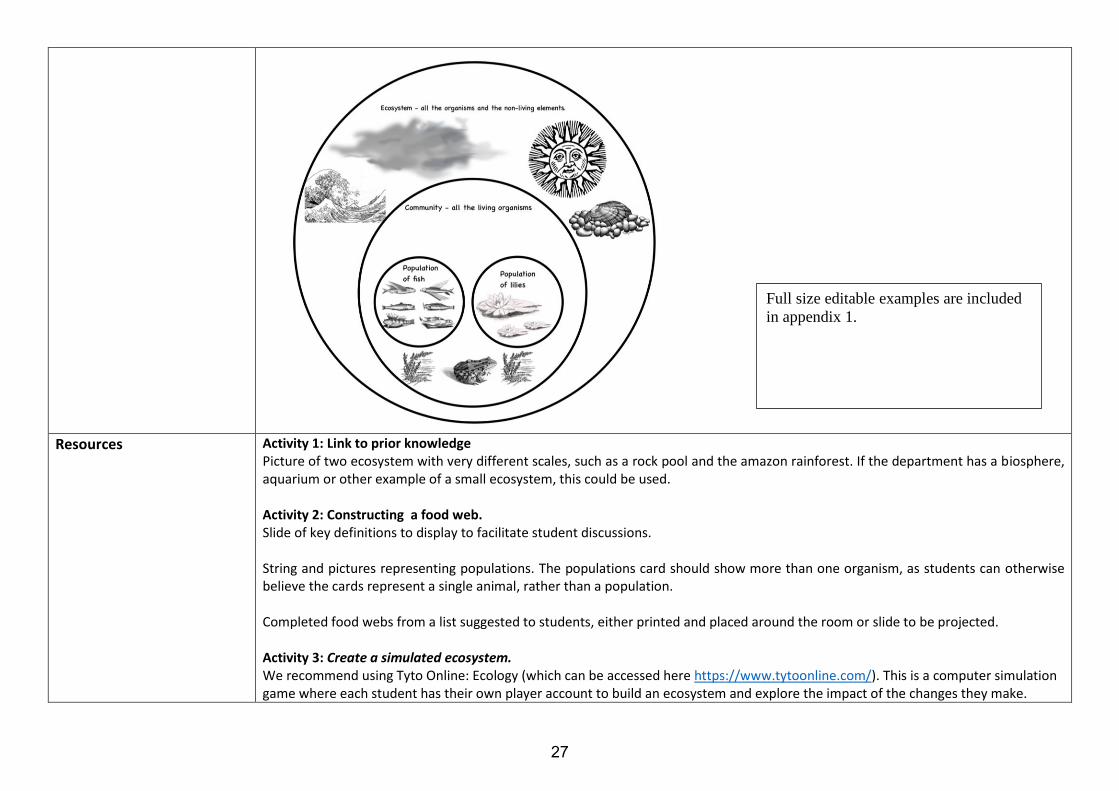
Students are asked to sort the components of an ecosystem into living and non-living parts. An example is included below. Higher ability students could also/instead be asked to draw a diagram showing the relationship of the components of an ecosystem or to complete a diagram showing this. A completed version is also included below.
Key questions Activity 1: Link to prior knowledge. What do the organisms at the start of the food chain have in common? What do the arrows represent?
25
Activity 2: How many producers do you have in your food chain? Where does the energy for all the organisms come from? How many populations are shown in your food chain? What would happen if (choose a consumer) was removed from your food chain?
Activity 3: Create a simulated ecosystem. Why do you add plants first in your ecosystem? Why might your herbivores start dying in your ecosystem? What would happen in your ecosystem if you didn’t have any insects?
Activity 4: Assessment Examples of assessment questions included below. Links to BEST questions included in the resources section.
Assessment suggestions
26
Resources Activity 1: Link to prior knowledge Picture of two ecosystem with very different scales, such as a rock pool and the amazon rainforest. If the department has a biosphere, aquarium or other example of a small ecosystem, this could be used.
Activity 2: Constructing a food web. Slide of key definitions to display to facilitate student discussions.
String and pictures representing populations. The populations card should show more than one organism, as students can otherwise believe the cards represent a single animal, rather than a population.
Completed food webs from a list suggested to students, either printed and placed around the room or slide to be projected.
Activity 3: Create a simulated ecosystem. We recommend using Tyto Online: Ecology (which can be accessed here https://www.tytoonline.com/). This is a computer simulation game where each student has their own player account to build an ecosystem and explore the impact of the changes they make.
Full size editable examples are included
in appendix 1.
27
There are several different simulations, with accompanying materials that can be used, however, the research summary suggests students will benefit most from a simulation that allows students to explore the complexity of interdependency in an ecosystem – in the guidance online this is referred to as the sandbox. For students to benefit from the simulation it takes approximately 3-5 hours of play.
Before the lesson, register for a free account, set up student accounts. Students can access the game online. It is likely that the IT department may need to white-list a number of URLs to prevent the school firewall from blocking the game. The internet requirements can be found here. Remember to test Tyto Online on a student device before the lesson. Tyto Online offers a lot of support for teachers, including a set up guide for installing the simulation, and a live chat which they answer quickly. Remember it is important to unlock and assign the ecology sandbox to students prior to the lesson, so that the simulation can be accessed without completing lengthy missions.
Activity 4: Assessment. Diagrams of ecosystems in varying states of completeness, depending on the needs of the class. One such diagram in included below.
H&S considerations Hazard Activity 2: Constructing the food web: Using string to connect students could prove a tripping hazard and students could potentially become entangled. They should be encouraged to hold the string loosely at a sensible height.
Lesson 2 - Interdependence
Lesson aim To use system thinking to teach ecosystems and as a result emphasise the interdependencies and look at the holistic system rather than focusing on the components. In this lesson students focus on the interdependent nature of the ecosystem.
Learning objective At the end of the lesson, pupils will: iv. Know that the components of an ecosystem are interdependent.
v. Demonstrate understanding of cause and effect in an ecosystem.
vi. Demonstrate understanding of the indirect effect of making changes in an ecosystem.
Intended learning outcomes At the end of the lesson students will be able to: 1. Discuss what will happen if a component of an ecosystem is changed.
2. Describe what would happen to a population if a change is made to the system.
3. Explain why insects are key in land ecosystems.
Prior Knowledge Students should have knowledge of:
1. Food chains and webs.
2. Definition of and ecosystem and knowledge of the living and non-living components.
3. Key vocabulary from the previous lesson.
28
4. Energy transfers, specifically energy transferred as heat to the surroundings.
Scientific vocabulary Cause and effect – A cause-effect relationship is one in which a certain event (the cause) makes another event happen (the effect) Indirect effect –effect caused by a change in another effect, which is separated from the initial cause. Interdependence - All organisms in an ecosystem depend upon each other.
Suggested lesson sequence and activities
Do now: As students enter there is a matching task on the board to ensure they have understood, and can recall, the key vocabulary from the previous lesson. For example (from the BEST questions):
Activity 1: Energy movement through the food chain. Think, pair, share: Ask students to consider what they ate for breakfast. Ask students to think about whether their breakfast came from plant, or animals and share this.
Once students have considered their breakfast foods, they should construct food chain from their breakfast. Extend the food chain by asking them the origin of the energy in the food chain.
29
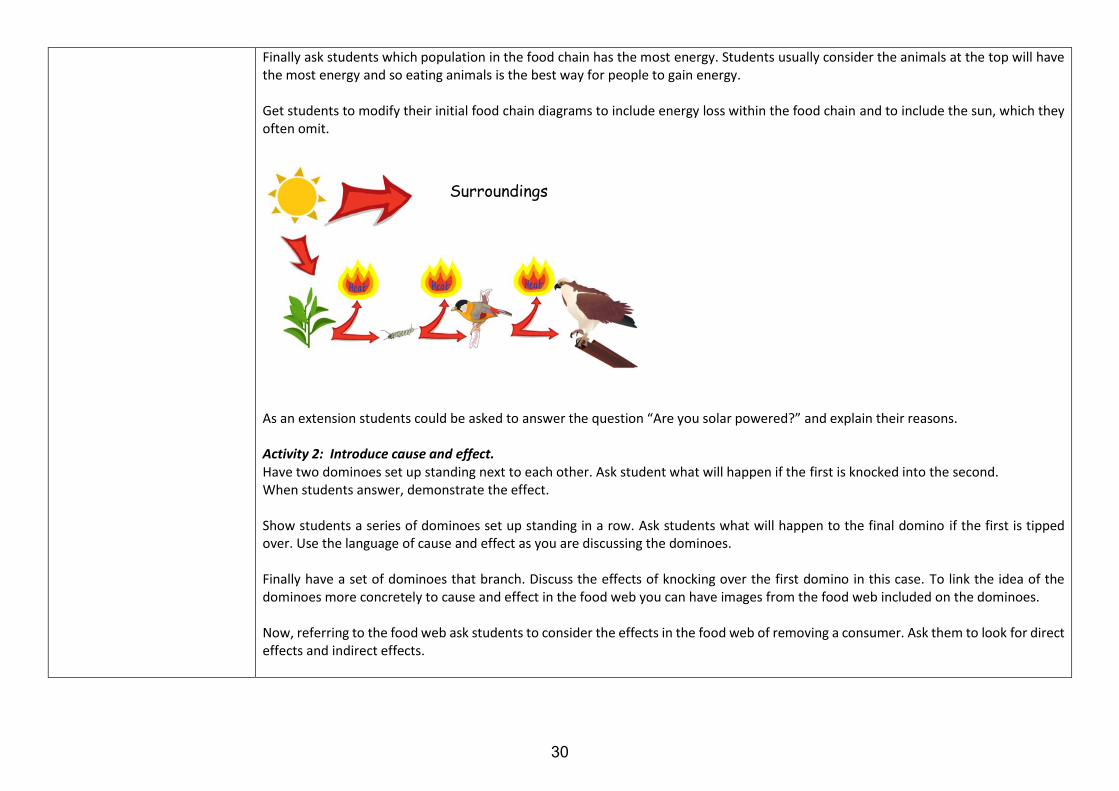
Finally ask students which population in the food chain has the most energy. Students usually consider the animals at the top will have the most energy and so eating animals is the best way for people to gain energy.
Get students to modify their initial food chain diagrams to include energy loss within the food chain and to include the sun, which they often omit.
As an extension students could be asked to answer the question “Are you solar powered?” and explain their reasons.
Activity 2: Introduce cause and effect. Have two dominoes set up standing next to each other. Ask student what will happen if the first is knocked into the second. When students answer, demonstrate the effect.
Show students a series of dominoes set up standing in a row. Ask students what will happen to the final domino if the first is tipped over. Use the language of cause and effect as you are discussing the dominoes.
Finally have a set of dominoes that branch. Discuss the effects of knocking over the first domino in this case. To link the idea of the dominoes more concretely to cause and effect in the food web you can have images from the food web included on the dominoes.
Now, referring to the food web ask students to consider the effects in the food web of removing a consumer. Ask them to look for direct effects and indirect effects.
Surroundings
30
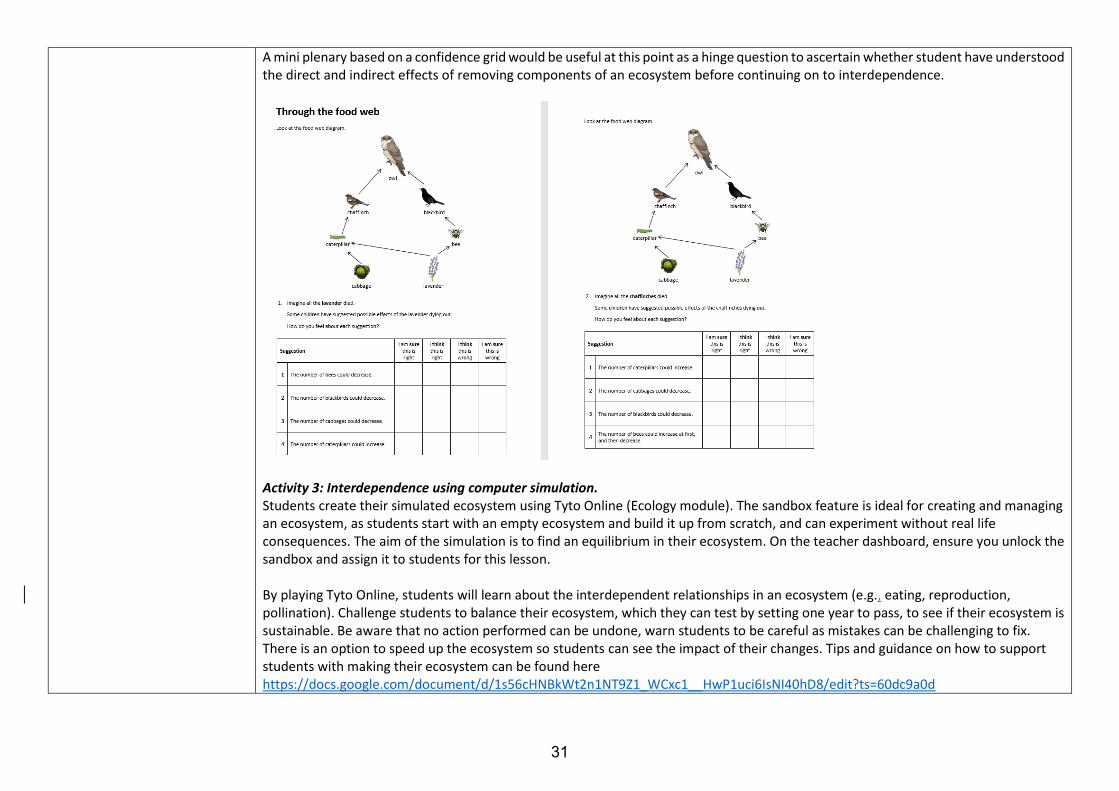
A mini plenary based on a confidence grid would be useful at this point as a hinge question to ascertain whether student have understood the direct and indirect effects of removing components of an ecosystem before continuing on to interdependence.
Activity 3: Interdependence using computer simulation. Students create their simulated ecosystem using Tyto Online (Ecology module). The sandbox feature is ideal for creating and managing an ecosystem, as students start with an empty ecosystem and build it up from scratch, and can experiment without real life consequences. The aim of the simulation is to find an equilibrium in their ecosystem. On the teacher dashboard, ensure you unlock the sandbox and assign it to students for this lesson.
By playing Tyto Online, students will learn about the interdependent relationships in an ecosystem (e.g., eating, reproduction, pollination). Challenge students to balance their ecosystem, which they can test by setting one year to pass, to see if their ecosystem is sustainable. Be aware that no action performed can be undone, warn students to be careful as mistakes can be challenging to fix. There is an option to speed up the ecosystem so students can see the impact of their changes. Tips and guidance on how to support students with making their ecosystem can be found here https://docs.google.com/document/d/1s56cHNBkWt2n1NT9Z1_WCxc1__HwP1uci6IsNI40hD8/edit?ts=60dc9a0d
31
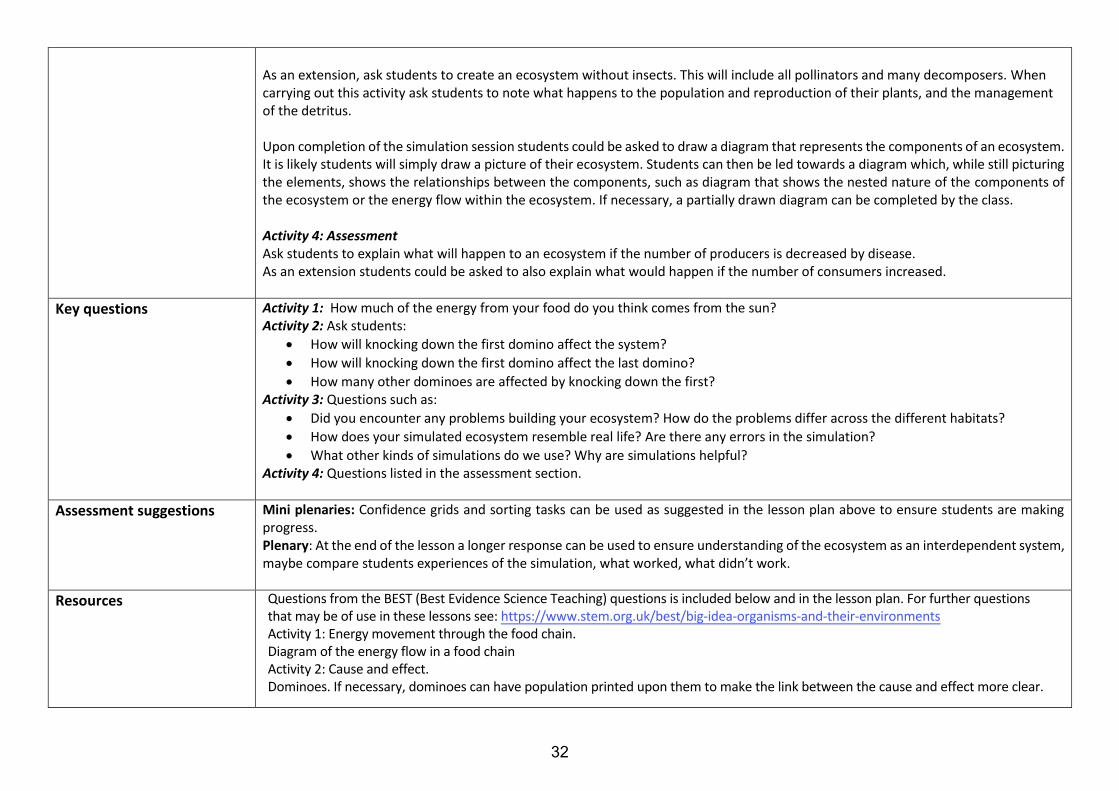
As an extension, ask students to create an ecosystem without insects. This will include all pollinators and many decomposers. When carrying out this activity ask students to note what happens to the population and reproduction of their plants, and the management of the detritus.
Upon completion of the simulation session students could be asked to draw a diagram that represents the components of an ecosystem. It is likely students will simply draw a picture of their ecosystem. Students can then be led towards a diagram which, while still picturing the elements, shows the relationships between the components, such as diagram that shows the nested nature of the components of the ecosystem or the energy flow within the ecosystem. If necessary, a partially drawn diagram can be completed by the class.
Activity 4: Assessment Ask students to explain what will happen to an ecosystem if the number of producers is decreased by disease. As an extension students could be asked to also explain what would happen if the number of consumers increased.
Key questions Activity 1: How much of the energy from your food do you think comes from the sun? Activity 2: Ask students:
• How will knocking down the first domino affect the system?
• How will knocking down the first domino affect the last domino?
• How many other dominoes are affected by knocking down the first?Activity 3: Questions such as:
• Did you encounter any problems building your ecosystem? How do the problems differ across the different habitats?
• How does your simulated ecosystem resemble real life? Are there any errors in the simulation?
• What other kinds of simulations do we use? Why are simulations helpful?Activity 4: Questions listed in the assessment section.
Assessment suggestions Mini plenaries: Confidence grids and sorting tasks can be used as suggested in the lesson plan above to ensure students are making progress. Plenary: At the end of the lesson a longer response can be used to ensure understanding of the ecosystem as an interdependent system, maybe compare students experiences of the simulation, what worked, what didn’t work.
Resources Questions from the BEST (Best Evidence Science Teaching) questions is included below and in the lesson plan. For further questions that may be of use in these lessons see: https://www.stem.org.uk/best/big-idea-organisms-and-their-environmentsActivity 1: Energy movement through the food chain.Diagram of the energy flow in a food chainActivity 2: Cause and effect. Dominoes. If necessary, dominoes can have population printed upon them to make the link between the cause and effect more clear.
32
Activity 3: Interdependence Tyto Online: Although there are several different ways to use the Tyto Online, the Ecology module is designed to support students learning about the interdependent relationships within an ecosystem. The research summary recommends that we use a simulation that allows students to explore the complexity of interdependency in an ecosystem. Please note, for students to benefit from the simulation it takes approximately 3-5 hours of play. Activity 4: Assessment Assessment questions listed above. More formal assessment material is included below.
H&S considerations Hazard The dominoes and computer simulation activities should not be hazardous.
33
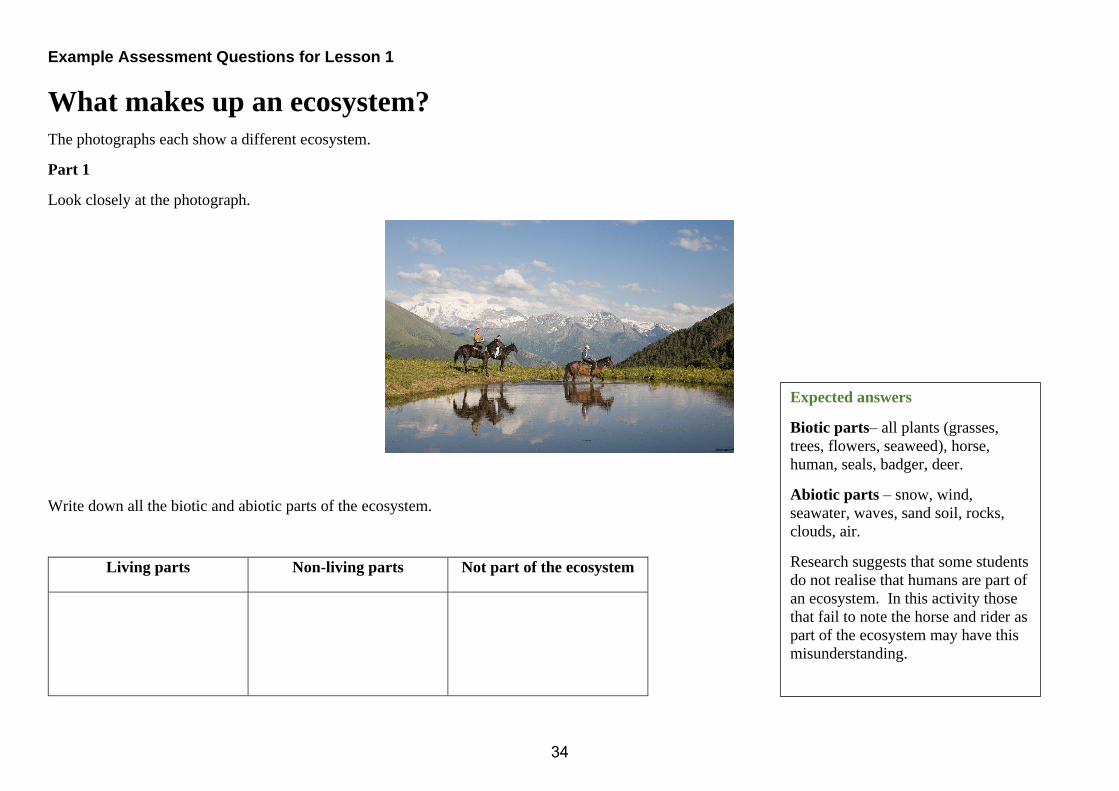
Example Assessment Questions for Lesson 1
What makes up an ecosystem?
The photographs each show a different ecosystem.
Part 1
Look closely at the photograph.
Write down all the biotic and abiotic parts of the ecosystem.
Living parts Non-living parts Not part of the ecosystem
Expected answers
Biotic parts– all plants (grasses,
trees, flowers, seaweed), horse,
human, seals, badger, deer.
Abiotic parts – snow, wind,
seawater, waves, sand soil, rocks,
clouds, air.
Research suggests that some students
do not realise that humans are part of
an ecosystem. In this activity those
that fail to note the horse and rider as
part of the ecosystem may have this
misunderstanding.
34

35
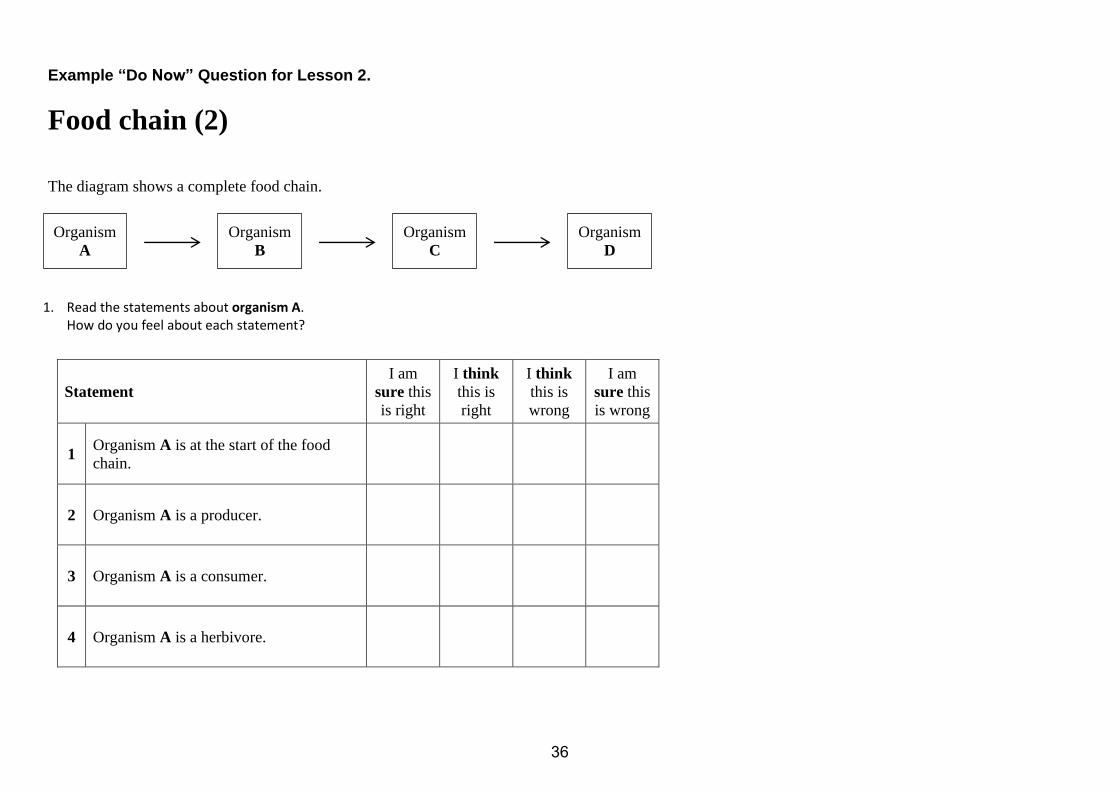
Example “Do Now” Question for Lesson 2.
Food chain (2)
The diagram shows a complete food chain.
1. Read the statements about organism A.How do you feel about each statement?
Statement
I am
sure this
is right
I think
this is
right
I think
this is
wrong
I am
sure this
is wrong
1 Organism A is at the start of the food
chain.
2 Organism A is a producer.
3 Organism A is a consumer.
4 Organism A is a herbivore.
Organism
A
Organism
B
Organism
C
Organism
D
36
Research Summary
Atoms, elements, and compounds Using a history-based approach to teach a simple Dalton atomic model Students should be taught: a simple (Dalton) atomic model Science (Chemistry) – KS3
Statement of issue
Students have difficulties understanding atomic structure (Harrison & Treagust, 1996) because of the sub-micro world's abstract nature (Bucat & Mocerino, 2009).
As a way to address this, students are often introduced to atomic structure using the historical development of atomic theory. For example, in Germany, the historical development of atomic theory is emphasised, with lessons discussing Dalton, Rutherford, Thomson and Bohr (Eilks, 2005). The current science curriculum in England emphasises Dalton’s model and this research summary focuses on how a historical approach for teaching the simple Dalton atomic model can be effective.
Main findings from the research
History-based pedagogy There are different types of history-based pedagogy, and these can broadly be categorised as (i) reproduction of historical experiments, (ii) narrative approaches, (iii) historical scientific models. Reproduction of historical experiments To make history more tangible, research suggests including hands-on experiments (Lin, 1998). Usselman (2000) details Dalton’s experiments, and if the instructions are carried out precisely, Dalton’s results can be reproduced. Hands-on experiments can be useful to show the student what happens next and are guide them towards an understanding of theory (Levere, 2006). Narrative approaches A narrative approach involves telling someone else about something that has happened (Herrestein-Smith, 1981) and can involve a narrator who shares the events (Norris et al., 2005). There are many variations available when using a narrative approach, and examples include (i) anecdotes from atomic structure theorists (Teichmann, 2015), (ii) the story of assembling the first atomic bomb (Klassen, 2007), (iii) biographies and interviews (Kauffman & Kauffman, 1996).Historical scientific model A model represents an idea, process, object, or system (Gilbert et al., 2000). Therefore, a historical scientific model can be produced within a scientific context but be superseded by scientific developments (Justi, 1997). Dalton’s original model of the atom suits the adoption of a historical scientific model approach because there has been new experimental evidence that cannot be explained using that original model.
What the research shows Lin (1998) explored whether a history-based teaching approach, in which students reproduced historical experiments, promoted students' conceptual problem-solving ability. 220 Chinese Year 8 students took part with half of the students experiencing the history-based teaching approach, and the other half experiencing a more traditional lesson without the historical content. The history-based approach focused on two case studies, (i) atmospheric pressure and (ii) atomic theory. Both cases used hands-on experiments based on historical models. For example, using three different sized Lego pieces, placed in individual beakers, students used a balance to weigh the Lego. They were asked to write down the weight of the two heavier pieces if the weight of the lightest piece was defined as 1 (analogous to Dalton’s atomic weight definition). They found statistically significantly better exam performance for those students who were taught using the history-based approach, as well as better problem-solving abilities than those students who experienced the traditional pedagogy. They also
37

explored the impact of the history-based approach on low and high achievers, finding that low achievers benefited more from the history-based approach. Lin (1998) also interviewed a small sample of students who had experienced the history-based approach and found that none of the students displayed misconceptions suggesting that a history-based approach might also be effective at addressing these.
In a university setting, Pekdağ and Azizoğlu (2020) examined the effect of history-based pedagogy of the atom on students’ academic achievement. 90 undergraduate Turkish chemistry students participated in this study, with 45 students experiencing the historical scientific model lecture and 45 students experiencing traditional lectures. The topic of the atom was taught over six 45-minute lectures. In lesson 1, students learnt about Ancient Greek theorists and Dalton’s model of the atom through historical narrative and exploring Dalton’s experiments. The other five lectures focused on different scientists and their experiments or discoveries (Thomson, Millikan, Rutherford, Bohr, Chadwick). They found that the history-based lectures were statistically significantly more effective at increasing students’ learning about the atom and they were more stimulated and interested when they were taught through a history-based approach.
Research suggests that all three history-based approaches (reproducing historical experiments, historical scientific models, and narrative approaches) improved students’ understanding of atomic theory (Lin, 1998; Pekdağ & Azizoğlu, 2020; Sendur et al., 2017).
Therefore, a lesson was produced to incorporate a history-based approach to teaching Dalton’s atomic model.
References Bucat, R., & Mocerino, M. (2009). Learning at the sub-micro level: Structural representations, in J.K. Gilbert, & D.
Treagust, (Eds.) Multiple representations in chemical education, (pp 11–29), Springer. Eilks, I. (2005). Experiences and reflections about teaching atomic structure in a jigsaw classroom in lower secondary
school chemistry lessons. Journal of Chemical Education, 82(2), 313. Gilbert, J. K., Boulter, C. J., & Rutherford, M. (2000). Explanations with models in science education. In Developing
models in science education (pp. 193-208). Springer. Harrison, A. G., & Treagust, D. F. (1996). Secondary students' mental models of atoms and molecules: Implications
for teaching chemistry. Science education, 80(5), 509-534. Herrestein-Smith, B. (1981). Narrative versions, narrative theories. In W. Mitchel (Ed.), On narrative, (pp 209–232).
Chicago. Justi, R. (1997). Models of teaching of chemical kinetics (Doctoral dissertation, University of Reading). Kauffman, G. B., & Kauffman, L. M. (1996). An interview with Linus Pauling, Journal of Chemical Education, 73, 29–32. Klassen, S. (2007). The application of historical narrative in science learning: The Atlantic cable story. Science &
Education, 16(3), 335-352. Levere, T. H. (2006). What history can teach us about science: Theory and experiment, data, and
evidence. Interchange, 37(2), 115-128. Lin, H. S. (1998). The effectiveness of teaching chemistry through the history of science. Journal of Chemical
Education, 75(10), 1326. Norris, S. P., Guilbert, S. M., Smith, M. L., Hakimelahi, S., & Phillips, L. M. (2005). A theoretical framework for
narrative explanation in science. Science Education, 89(4), 535-563. Pekdağ, B., & Azizoğlu, N. (2020). History-based instruction enriched with various sources of situational interest on
the topic of the atom: The effect on students’ achievement and interest. Research in Science Education, 50(3), 1187-1215.
Sendur, G., Polat, M., & Kazancı, C. (2017). Does a course on the history and philosophy of chemistry have any effect on prospective chemistry teachers’ perceptions? The case of chemistry and the chemist. Chemistry Education Research and Practice, 18(4), 601-629.
Teichmann, J. (2015). Historical experiments and science education-From conceptual planning of exhibitions to continuing education for teachers. Interchange, 46, 31-43.
Usselman, M. (2000). Multiple combining proportions: The experimental evidence. In F.L. Holmes, & T.H. Levere, (Eds.), Instruments and experimentation in the history of chemistry (pp. 243-271). MIT Press.
38
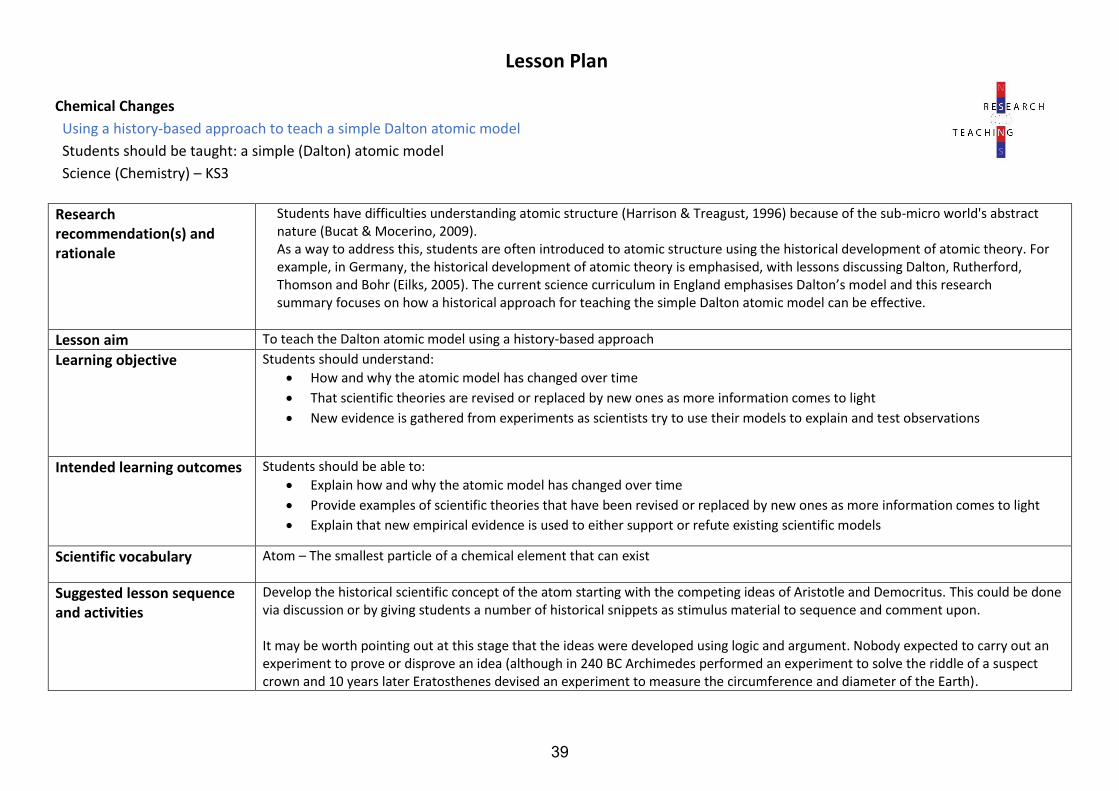
Lesson Plan
Chemical Changes
Using a history-based approach to teach a simple Dalton atomic model
Students should be taught: a simple (Dalton) atomic model
Science (Chemistry) – KS3
Research recommendation(s) and rationale
Students have difficulties understanding atomic structure (Harrison & Treagust, 1996) because of the sub-micro world's abstract nature (Bucat & Mocerino, 2009). As a way to address this, students are often introduced to atomic structure using the historical development of atomic theory. For example, in Germany, the historical development of atomic theory is emphasised, with lessons discussing Dalton, Rutherford, Thomson and Bohr (Eilks, 2005). The current science curriculum in England emphasises Dalton’s model and this research summary focuses on how a historical approach for teaching the simple Dalton atomic model can be effective.
Lesson aim To teach the Dalton atomic model using a history-based approach
Learning objective Students should understand:
• How and why the atomic model has changed over time
• That scientific theories are revised or replaced by new ones as more information comes to light
• New evidence is gathered from experiments as scientists try to use their models to explain and test observations
Intended learning outcomes Students should be able to:
• Explain how and why the atomic model has changed over time
• Provide examples of scientific theories that have been revised or replaced by new ones as more information comes to light
• Explain that new empirical evidence is used to either support or refute existing scientific models
Scientific vocabulary Atom – The smallest particle of a chemical element that can exist
Suggested lesson sequence and activities
Develop the historical scientific concept of the atom starting with the competing ideas of Aristotle and Democritus. This could be done via discussion or by giving students a number of historical snippets as stimulus material to sequence and comment upon.
It may be worth pointing out at this stage that the ideas were developed using logic and argument. Nobody expected to carry out an experiment to prove or disprove an idea (although in 240 BC Archimedes performed an experiment to solve the riddle of a suspect crown and 10 years later Eratosthenes devised an experiment to measure the circumference and diameter of the Earth).
39
The debate was about how small you can divide a grain of sand. Aristotle argued that you could keep on cutting it if you had a small enough knife and you would just end up with a smaller and smaller grain of sand. Democritus said that if you cut it small enough, you would get to a point where the particle could not be cut any more. He called this the ‘atomos’ which means ‘indivisible’. Aristotle (who believed that there were four elements: air, earth, fire and water) was more influential so his ideas prevailed, and Democritus’ were forgotten about for almost 2000 years.
Although the Islamic world had a rich tradition of scientific experimentation from the 8th century AD to the 13th century AD (proving amongst other things that light travels in straight lines and that blood circulates around the body) in the West, there were no attempts to challenge Aristotle’s thinking until about 1572 when Danish astronomer Tycho Brahe observed a supernova and used this as evidence against Aristotle’s idea that the heavens were perfect and unchanging.
By 1789 Antoine Lavoisier has shown that the total mass in a chemical reaction is constant.
In 1799 Joseph Proust published is law of definite proportions in which he said that if a compound is broken down into its constituent elements, these will always have the same proportion regardless of where the compound came from or how large the sample was.
In the early 1800s, John Dalton started experimenting with nitrogen and oxygen and proposed his law of multiple proportions that said if two elements can be combined to form a third, they will always combine in a ratio that is a small whole number.
Over the course of the next few years he developed his theories and said that atoms cannot be created or destroyed and that they can combine to make compounds. However, he did not think atoms formed compounds. He though oxygen was O not O2. He also thought that the chemical formula for water was HO not H2O.
The atom is much more complicated than Dalton thought, but his findings are still valid for chemical reactions.
Over the next one hundred and thirty years we discovered the electron (Thompson 1897), the nucleus (Rutherford, Geiger and Marsden 1911), the proton (Rutherford 1917) and the neutron (Chadwick 1932)
We now believe the atom has a nucleus made of protons and neutrons and electrons surrounding the nucleus.
Key questions Why were Democritus’ ideas not accepted?
How do we find evidence to support our theories these days?
What evidence (other than his own experiments) did John Dalton use to support his ideas?
What do we still find useful about Dalton’s ideas today?
What do we now believe about the atom?
40
Which of Dalton’s ‘elements’ are not actually chemical elements?
Assessment suggestions Write a newspaper article describing Dalton’s discovery of the atom. In your article, show how Dalton used the ideas of other scientists, as well as his own experiments, to develop his ideas.
Resources H&S considerations
Dalton’s Chemical elements See for example: https://www.wired.com/2008/09/sept-3-1803-dalton-introduces-atomic-symbols/ Ensure that all activities are carried out safely and calmly. Follow all your school’s health and safety protocols. Please discuss health and safety with your mentor.
41
Research Summary
The particulate nature of matter Using inquiry instruction to teach about the particulate nature of matter Students should be taught about: (i) the properties of the different states of matter (solid, liquid and gas) in terms of the particle model, including gas pressure, and (ii) changes of state in terms of the particle model. Science (Chemistry) – Key stage 3
Statement of issue
The particulate nature of matter is one of the foundational concepts that promotes, shapes, and constrains the understanding of subsequent concepts in science, particularly in chemistry, notably solution chemistry and chemical reactions (Hadenfeldt et al., 2016). Understanding the notion of the particulate nature of matter is also essential for acquiring “deep and satisfying answers to key questions that we all ask about the world around us: What are things made of and how can we explain their properties? ...” (Smith et al., 2006, p. 11). Dow et al. (1978), in exploring students’ particle ideas in the solid state, found that although they could depict the solid state as an ordered arrangement of molecules, they gave no reason for why the structure should hold together, nor were they able to explain the incompressibility of solids. In the liquid state, Novick and Naussbaum (1981) found that, even after instruction in the kinetic theory, over 10% of Year 9 students depicted the particles of air as changed to continuous liquid air when sufficiently cooled. These students did not appear to apply the particle model to liquids. In the gaseous state, Ben-Zvi et al. (1987) also revealed that only 10% of Year 11 students visualised the symbol O2(g) as many scattered molecules of oxygen.
Main findings from the research
Students are expected to understand that matter is made of unseen tiny particles and that these particles are in continuous motion with nothing (a vacuum) in between them (Pozo & Gómez-Crespo, 2005). Research indicates that students may develop profound conceptual understandings when they are able to properly employ their current learning in multiple contexts, and also to build strongly connected and highly structured conceptual frameworks (Stevens et al., 2010). For conceptual change, students need to recognise the conflict between an (alternative – non-scientific) conception they hold and the currently presented scientific one, and become dissatisfied with their own conception; the resolution of conceptual competition then follows the relative status of intelligibility, plausibility, and fruitfulness of opposing conceptions (Posner et al., 1982).
Inquiry-based instruction With inquiry-based instruction, students simulate scientific inquiry processes in the school science laboratory, through exploring phenomena, utilising methods similar to practising scientists, as well as developing well-established conceptual understandings in such a context (Cairns, 2019). Inquiry-based instruction can be beneficial for science teaching and learning, as it can: (i) support students’ understanding of abstract science concepts, and (ii) help students to develop scientific practices such as manipulating variables, arranging experimental setup,collecting and interpreting data (Bridle & Yezierski, 2012; Cairns, 2019; Stern et al., 2008). Research suggests thatwhile teaching the particulate nature of matter, students should be engaged in inquiry instruction to predict andexplain macroscopically observed phenomena, and also to generate and discuss their verbal and pictorialrepresentations of such phenomena with their peers in class (see Bell et al., 2005; Stevens et al., 2010; Talanquer,2011).
The most recent study in this regard was carried out by Adadan and Ataman (2021) to examine the change in two groups of Year 7 students’ (n=112) understanding of the particulate nature of matter before and after each group was involved in related instructions, namely inquiry-based instruction and regular instruction. In the inquiry-based instruction, students carefully observed the macroscopic phenomenon, and then their verbally explained and pictorially illustrated particulate representations, based on their observations. In addition, students viewed the dynamic particulate representations of matter for almost all observed phenomena so that they compared their own
42
pictorial particulate representations with the scientifically accepted dynamic representations and discussed the differences between the two with their peers in class. Furthermore, students wrote their verbal explanations and drew their pictorial particulate representations on the activity sheets and wrote a one-page handwritten journal entry.
Findings from the study showed that both groups of students held similar but inconsistent and poor understandings of the particulate nature of matter prior to the instruction (Adadan & Ataman, 2021). Although both groups of students exhibited substantial progress toward a scientific understanding of the particulate nature of matter from the pre- to post-instruction phase, the inquiry-based instruction students noticeably outperformed the regular students in developing a scientific understanding of the particulate nature of matter and its associated aspects. The study suggested that the essential role of written communication (activity sheets, drawings, journal entries) in science teaching and learning should be recognised. Moreover, teachers should consider utilising dynamic particulate representations in their instruction when teaching about chemical phenomena.
Bridle and Yezierski (2012) investigated the effectiveness of inquiry-based curriculum, particulate modelling experiences in improving 54 Year 11 students’ conceptual understanding of the phases of matter, as well as chemical versus physical changes in matter. The intervention was carried out in two high-schools, and both were exposed to the same inquiry-based curriculum, thus data were not compared to a control group. The study therefore only provides evidence for the effectiveness of the inquiry-based curriculum within a specific population and makes no claims about it being more, or less, effective than other ways of teaching the same topic. The findings from the study indicated that the majority of students produced correct descriptions of liquids and gases at the particulate level. Students could also clearly distinguish between chemical and physical changes at the particulate level. When asked to identify the macroscopic process as a physical or chemical change, all of the students seemed to recognise that their macroscopic and particulate descriptions should have matched.
In another study, Stern et al. (2008) studied the effect of a dynamic software simulation in an example of inquiry-based instruction, by exploring Year 8 students’ understanding of the kinetic molecular theory. Students in the control group (n=62) studied a curricular unit that addressed differences in the arrangement and motion of molecules in the three phases of matter. The experimental group (n=71) studied the same unit combined with a number of computer-generated lessons using a software simulation. The results indicated that the students in the experimental group scored statistically significantly higher than those in the control group. Nonetheless, while both groups of students improved their understanding of the kinetic molecular theory, their overall achievements were very low. These findings suggest that whilst the simulation in inquiry-based instruction improved the students’ understanding compared to those in the control group, the overall effectiveness of the intervention for developing conceptual understanding was relatively low.
In summary, research has focused much attention on the possible role of inquiry-based instruction as compared to regular instruction, when teaching and learning about the particulate nature of matter.
Therefore, a lesson plan was produced to incorporate inquiry-based instruction to teach students about the particulate nature of matter.
References
Adadan, E., & Ataman, M. M. (2021). Promoting senior primary school students’ understanding of particulate nature of matter through inquiry instruction with multiple representations. Education 3-13, 49(3), 317-329.
Bell, R. L., Smetana, L., & Binns, I. (2005). Simplifying inquiry instruction. The Science Teacher, 72(7), 30-33. Ben-Zvi, R., Eylon, B., & Silberstein, J. (1987). Students’ visualisation of chemical reactions. Education in Chemistry,
24(4), 117-120. Bridle, C. A., & Yezierski, E. J. (2012). Evidence for the effectiveness of inquiry-based, particulate-level instruction on
conceptions of the particulate nature of matter. Journal of Chemical Education, 89(2), 192-198. Cairns, D. (2019). Investigating the relationship between instructional practices and science achievement in an inquiry-
based learning environment. International Journal of Science Education, 41(15), 2113-2135. Dow, W. M., Auld, J., & Wilson, D. T. (1978). Pupils’ concepts of gases, liquids, solids. Dundee College of Education.
43
Hadenfeldt, J. C., Neumann, K., Bernholt, S., Liu, X., & Parchmann, I. (2016). Students’ progression in understanding the matter concept. Journal of Research in Science Teaching, 53(5), 683-708.
Novick, S., & Nussbaum, J. (1981). Pupils’ understanding of the particulate nature of matter: A cross-age study. Science Education, 65(2), 187-96.
Posner, G. J., Strike, K. A., Hewson, P. W., & Gertzog, W. A. (1982). Accommodation of a scientific conception: Toward a theory of conceptual change. Science Education, 66(2), 211-227.
Pozo, J. I., & Gomez Crespo, M. A. (2005). The embodied nature of implicit theories: The consistency of ideas about the nature of matter. Cognition and Instruction, 23(3), 351-387.
Smith, C. L., Wiser, M., Anderson, C. W., & Krajcik, J. (2006). Implications of research on children’s learning for standards and assessment: A proposed learning progression for matter and the atomic-molecular theory. Measurement: Interdisciplinary Research & Perspective, 4(1-2), 1-98.
Stern, L., Barnea, N., & Shauli, S. (2008). The effect of a computerized simulation on middle school students’ understanding of the kinetic molecular theory. Journal of Science Education and Technology, 17(4), 305-315.
Stevens, S. Y., Delgado, C., & Krajcik, J. S. (2010). Developing a hypothetical multi-dimensional learning progression for the nature of matter. Journal of Research in Science Teaching, 47(6), 687-715.
Talanquer, V. (2011). Macro, submicro, and symbolic: The many faces of the chemistry “triplet”. International Journal of Science Education, 33(2), 179-195.
44
Lesson Plan The particulate nature of matter
Using inquiry-based instruction to teach the particulate nature of matter
Students should be taught about: the particulate nature of matter
Science (Chemistry) – KS3
Research recommendation(s) and rationale
The particulate nature of matter is one of the foundational concepts that promotes, shapes, and constrains the understanding of subsequent concepts in science, particularly in chemistry, notably solution chemistry and chemical reactions (Hadenfeldt et al., 2016). Understanding the notion of the particulate nature of matter is also essential for acquiring “deep and satisfying answers to key questions that we all ask about the world around us: What are things made of and how can we explain their properties? ...” (Smith et al., 2006, p. 11). Dow et al. (1978), in exploring students’ particle ideas in the solid state, found that although they could depict the solid state as an ordered arrangement of molecules, they gave no reason for why the structure should hold together, nor were they able to explain the incompressibility of solids. In the liquid state, Novick and Naussbaum (1981) found that, even after instruction in the kinetic theory, over 10% of Year 9 students depicted the particles of air as changed to continuous liquid air when sufficiently cooled. These students did not appear to apply the particle model to liquids. In the gaseous state, Ben-Zvi et al. (1987) also revealed that only 10% of Year 11 students visualised the symbol O2(g) as many scattered molecules of oxygen.
Lesson aim To teach the particulate nature of matter using an inquiry-based approach
Learning objective Be able to:
• Understand that matter is made of particles that do not change even when the state changes
• Use the particle model to explain a range of observed phenomena
Intended learning outcomes Students should:
• describe all matter as being made up of particles
• explain that these particles move in all directions
• explain how temperature affects the speed of movement of these particles
• explain that particles exert forces on each other and on the walls of their container
Scientific vocabulary Particle – a tiny (microscopic) portion of matter States of matter – solid, liquid or gas Solid - state of matter where particles are packed close together and vibrate but do not move from their place Liquid – state of matter in which particles are tightly packed but move around, sliding over each other Gas – the particles are spread out with empty space between them Vibrate – move back and forth
45
Melting – change of state from solid to liquid Boiling – change of state from liquid to gas Freezing – change of state from liquid to solid Condensing – change of state from gas to liquid
Suggested lesson sequence and activities
Elicit students’ ideas about particles. Ask them to explain the following phenomena: A football is inflated on a warm day until it is hard, but in the evening, when it is cooler, feels softer (assume it does not leak). A block of ice taken out of the fridge and melts
This will help students to recognise their own ideas, and to see where these might not fit with the phenomena under discussion. It might also help them to see that other students hold differing views.
Pay particular attention to possible misconceptions including:
• Applying macroscopic ideas to particles, such as shrinking, melting, and swelling.
• Particles stopping at 00C
• Confusion between vibration and other forms of motion
• Not being aware that there is empty space between particles
Lead students in a range of activities in which they are invited to observe phenomena and then describe what is happening in terms of the particle model. Examples could include:
• Heating water and letting it condense on a surface
• Perfume diffusing through a room
• Blowing up a balloon and pinching the neck so the air does not escape, then holding a balloon in front of your face and lettingthe air our through the neck of the balloon. Ask students what they can feel.
• The collapsing can experiment:Put about 1cm of water into an empty drink can. Fill a washing-up bowl with cold water and place it nearby. Hold it with tongs or the clamp from a retort stand and heat it with a Bunsen burner (make sure it does not have rubber facings – these will catch fire and fill the room with acrid smoke). Once the water is boiling and there is a steam coming out of the top, quickly turn the can upside down in the water. (The can was initially full of air and 1 cm of water. When heated the can is now full of steam. Once it is upended in the water, the steam condenses rapidly, and the can has no air and only a little water in it. Atmospheric pressure causes the can to crush).
• The magic glass trick:Fill an empty jam jar right to the top with water so it is brimming over the rim of the jar. Take a piece of cardboard big enough to cover the jar (shiny cardboard works best). Carefully slide the card onto the rim, making sure there are no air bubbles trapped. Hold the card in place as you turn the jar over. Let go of the card and it will stay in place.
46
(mass of water is perhaps 300g, so it has a weight mg = 0.300 x 10 = 3 N). Air pressure is 100 000 N/m2. The card is perhaps 8 cm in diameter, so its area is 5 x 10⁻³ m2. The force upwards is Pressure x area = 100 000 x 5 x 10-3 = 500 N, so the upwards force is considerably larger than the weight). See also the resources in the Gatsby Science Enhancement Programme: Stuff and Substance: Ten Key Practicals in Chemistry *suitable for home teaching* | STEM Ask students to write up their observations and explain them with reference to the particle model. They can use diagrams, or prose, but this step should not be omitted as the research suggests that the written communication was a key component of the students’ understanding.
Key questions How do we explain evaporation/condensation/freezing/melting?
How are the particles arranged in a solid/liquid/gas?
What is happening to the particles in x situation?
Assessment suggestions Students could be given an unfamiliar situation and asked to apply the particle model to explain it – this could be a practical activity they have not done from the list above or any other situation.
Resources H&S considerations
Kettle and convenient surface for condensing such as a pane of Perspex or card Empty drink cans Clamps or tongs Balloons Jam jars Pieces of shiny card Washing-up bowls Bunsen Burners Matches Or see Stuff and Substance: Ten Key Practicals in Chemistry *suitable for home teaching* | STEM Wear goggles for collapsing can experiment Care when heating cans Or see Stuff and Substance: Ten Key Practicals in Chemistry *suitable for home teaching* | STEM
47
Research Summary
Earth and atmosphere Using slowmation to teach about plate tectonics Students should be taught about: the structure of the Earth Science (Chemistry) – Key stage 3
Statement of issue
Research has shown that school students experience considerable difficulty in understanding the concept of plate tectonics (see Mills et al., 2017). This is partly due to the scales used to measure distance and the long time periods associated with many geological phenomena. Research has found that students hold misconceptions about the key ideas of plate tectonics and are also not interested in learning about this topic (Dolphin & Benoit, 2016; Mills et al., 2017). Some of the misconceptions are: tectonic plates are located deep underground and are not exposed to the Earth’s surface, tectonic plate boundaries are located at the edge of continents, and earthquakes occur at tectonic plate boundaries when two tectonic plates crash together.
Research has also found that misconceptions were identified among practising UK science teachers, with regards to the states (solid, partial solid, partial liquid or liquid) of the different layers of the Earth and of the thickness of the crust (King, 2010). A poor understanding was also shown with regards to how earthquakes, and heat flow distributions on Earth, were linked to plate tectonics. Later on, King (2010) reported that misconceptions included the idea that the mantle is liquid and made of magma, and that plates are made of crust. It was found in the 51 science textbooks, or textbook series used in secondary schools in England and Wales.
Issues related to students’ and teachers’ understanding of plate tectonics reported in the research literature include: poor understanding of the nature of continents and oceans, little understanding of the concept of tectonic plates, and poor knowledge of the links between earthquakes, volcanoes, and plate movement (King, 2010). Therefore, the identification of effective conceptual change pedagogical approaches to plate tectonics is important (Dawson & Carson, 2013).
Main findings from the research
The classical view of conceptual change holds that misconceptions can be altered by, or replaced with, more scientifically accurate understandings of phenomena. Research suggests that rather than an emphasis on content knowledge acquisition, the nature of conceptual change should consider the role of students’ conceptions in science learning (Treagust & Duit, 2008). Several conceptual change pedagogical approaches have been offered by researchers to align better students’ misconceptions of Earth science with scientific consensus views. These include: natural observations, physical models, simulations, student-constructed animations, analogy, cognitive conflict, refutational text, and other specific teaching and learning sequences (Mills et al., 2016).
What is slowmation? Student-constructed animations such as ‘slowmation’ (abbreviated from ‘slow animation’) is a new pedagogical approach, which has gained prominence recently in the field of science education (see Brown et al., 2013; Mills et al., 2019; Nielsen & Hoban, 2015). Previous research suggests that the iterative construction and reconstruction of multiple representations of slowmation should be able to address students’ firmly held misconceptions and encourage deeper levels of understanding (Mills et al., 2019). The construction of a slowmation representation does not require any particular software. The creation process involves a series of still digital photographs that are displayed in quick succession. There are four main stages: (1) planning, (2) chunking and sequencing information, (3) constructing and reconstructing, and (4) presentation (Loughran et al., 2012; Mills et al., 2019).
What are the main research findings? In a mixed methods case study, Mills et al. (2019) investigated the impact of the slowmation construction process on students’ knowledge of plate tectonics. The study was conducted with two Year 9 science classes, comprising 52
48
students and their teachers at a secondary school in Australia. The findings showed an increase in the number of students with scientific conceptions of plate tectonics and a decrease in the number of students with misconceptions, from pre-test to post-test. This indicates that students’ participation in the construction of a slowmation enhanced their conceptual understanding of a range of geological concepts, including the nature and movement of tectonic plates, and the formation of landforms at tectonic plate boundaries. Data from the audio-recorded lessons undertaken as part of the study also indicated that teachers were able to address students’ conflicting ideas about plate tectonics, as they were brought to the fore by the slowmation construction process. The study suggests that teachers should position themselves as facilitators of learning rather than providers of knowledge, and effectively realise the potential for slowmation to bring about knowledge reconstruction.
In a recent study, Mills et al. (2020) investigated the influence of the slowmation construction process on 95 Australian students’ aged 14 to 15 interest in learning about science and geology. Two classes worked in small groups to construct a slowmation about a type of tectonic plate boundary, and two classes experienced the usual approaches employed to teach about tectonic plate boundaries. The findings reported that students who constructed a slowmation demonstrated a statistically significant increase in their interest in learning about science and geology, while students who experienced regular classroom instruction demonstrated lower levels of interest by the end of the study. The study also claimed that the slowmation construction process enhanced students’ interests, as it allowed opportunities for students to work and learn in active, hands-on and collaborative ways; to exercise creativity; and to engage with technology.
What are the findings from other related research? In another study of the slowmation construction process. Hoban et al. (2011) conducted a case study of three pre-service elementary teachers, who were audio and video recorded as they created a slowmation. This study illustrated how the construction process enabled them to engage with a science concept in multiple ways. The findings indicate that the participants were making meaning (as interpretants) as they made decisions about which modes to use (the representation), as well as thinking about how to integrate them best into their existing teaching strategies. Similarly, Nielsen & Hoban (2015) conducted a study on the slowmation construction process, which saw pre-service teachers demonstrate their understanding of moon phases using different modes. The results indicated that the slowmation construction process was effective at bringing about conceptual change, as the pre-service teachers were presented with multiple opportunities to consider and revise their own misconceptions.
Brown et al.’s (2013) study explored how primary students' engagement in the construction of a slowmation impacted their use of science discourse and multi-modal representations of key concepts. Evidence from the study showed that student engagement in the collaborative process of creating a slowmation facilitated opportunities for students to use discourse as a representational form that supported their development of science understandings.
Student-constructed animations such as slowmation are one of the conceptual change pedagogical approaches that have gained a strong evidence base, as cited in the research above. This research summary has highlighted misconceptions related to plate tectonics. Therefore, a lesson plan was produced that incorporated slowmation to teach about plate tectonics.
Therefore, a lesson was produced to incorporate slowmation into plate tectonics teaching.
References
Brown, J., Murcia, K., & Hackling, M. (2013). Slowmation: A multimodal strategy for engaging children with primary science. Teaching Science, 59(4), 14.
Dawson, V., & Carson, K. (2013). Science teachers’ and senior secondary schools students’ perceptions of Earth and environmental science topics. Australian Journal of Environmental Education, 29, 202-220.
Dolphin, G., & Benoit, W. (2016). Students’ mental model development during historically contextualized inquiry- How the ‘tectonic plate’ metaphor impeded the process. International Journal of Science Education, 38(2), 276-297.
Hoban, G., Loughran, J., & Nielsen, W. (2011). Slowmation: Preservice elementary teachers representing science knowledge through creating multimodal digital animations. Journal of Research in Science Teaching, 48(9), 985-1009.
49
King, C. (2000). The Earth’s mantle is solid: Teachers’ misconceptions about the Earth and plate tectonics. School Science Review, 82, 57–64.
King, C. J. H. (2010). An analysis of misconceptions in science textbooks- Earth science in England and Wales. International Journal of Science Education, 32(5), 565-601.
Loughran, J., Berry, A., Cooper, R., Keast, S., & Hoban, G. (2012). Preservice teachers learning about teaching for conceptual change through slowmation. Asia-Pacific Forum on Science Learning and Teaching, 13(1), 1–28.
Mills, R., Tomas, L., & Lewthwaite, B. (2016). Learning in Earth and space science- a review of conceptual change instructional approaches. International Journal of Science Education, 38(5), 767-790.
Mills, R., Tomas, L., & Lewthwaite, B. (2017). Junior secondary school students' conceptions about plate tectonics. International Research in Geographical and Environmental Education, 26(4), 297-310.
Mills, R., Tomas, L., & Lewthwaite, B. (2019). The impact of student-constructed animation on middle school students’ learning about plate tectonics. Journal of Science Education and Technology, 28(2), 165-177.
Mills, R., Tomas, L., Whiteford, C., & Lewthwaite, B. (2020). Developing middle school students’ interest in learning science and geology through slowmation. Research in Science Education, 50, 1501–1520.
Nielsen, W., & Hoban, G. (2015). Designing a digital teaching resource to explain phases of the moon - a case study of preservice elementary teachers making a slowmation. Journal of Research in Science Teaching, 52(9), 1207-1233.
Treagust, D. F., & Duit, R. (2008). Conceptual change: A discussion of theoretical, methodological and practical challenges for science education. Cultural Studies of Science Education, 3(2), 297-328.
50
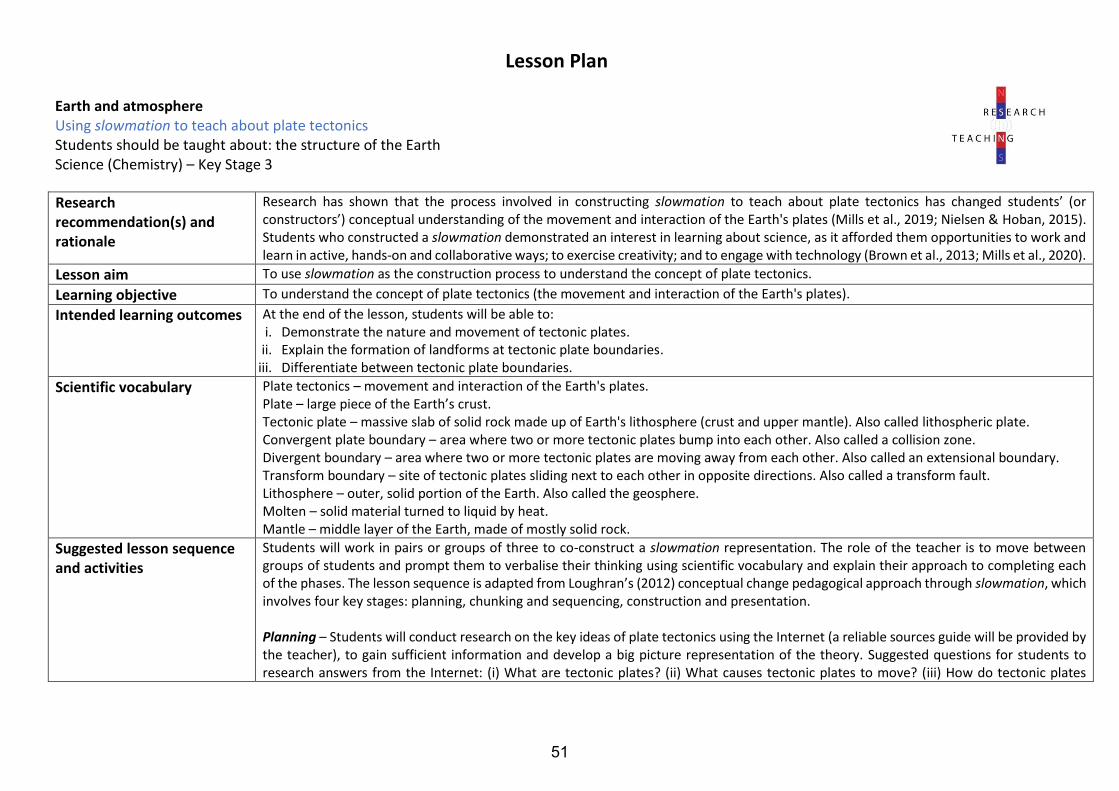
Lesson Plan
Earth and atmosphere Using slowmation to teach about plate tectonics Students should be taught about: the structure of the Earth Science (Chemistry) – Key Stage 3
Research recommendation(s) and rationale
Research has shown that the process involved in constructing slowmation to teach about plate tectonics has changed students’ (or constructors’) conceptual understanding of the movement and interaction of the Earth's plates (Mills et al., 2019; Nielsen & Hoban, 2015). Students who constructed a slowmation demonstrated an interest in learning about science, as it afforded them opportunities to work and learn in active, hands-on and collaborative ways; to exercise creativity; and to engage with technology (Brown et al., 2013; Mills et al., 2020).
Lesson aim To use slowmation as the construction process to understand the concept of plate tectonics.
Learning objective To understand the concept of plate tectonics (the movement and interaction of the Earth's plates).
Intended learning outcomes At the end of the lesson, students will be able to: i. Demonstrate the nature and movement of tectonic plates.
ii. Explain the formation of landforms at tectonic plate boundaries.iii. Differentiate between tectonic plate boundaries.
Scientific vocabulary Plate tectonics – movement and interaction of the Earth's plates. Plate – large piece of the Earth’s crust. Tectonic plate – massive slab of solid rock made up of Earth's lithosphere (crust and upper mantle). Also called lithospheric plate. Convergent plate boundary – area where two or more tectonic plates bump into each other. Also called a collision zone. Divergent boundary – area where two or more tectonic plates are moving away from each other. Also called an extensional boundary. Transform boundary – site of tectonic plates sliding next to each other in opposite directions. Also called a transform fault. Lithosphere – outer, solid portion of the Earth. Also called the geosphere. Molten – solid material turned to liquid by heat. Mantle – middle layer of the Earth, made of mostly solid rock.
Suggested lesson sequence and activities
Students will work in pairs or groups of three to co-construct a slowmation representation. The role of the teacher is to move between groups of students and prompt them to verbalise their thinking using scientific vocabulary and explain their approach to completing each of the phases. The lesson sequence is adapted from Loughran’s (2012) conceptual change pedagogical approach through slowmation, which involves four key stages: planning, chunking and sequencing, construction and presentation.
Planning – Students will conduct research on the key ideas of plate tectonics using the Internet (a reliable sources guide will be provided by the teacher), to gain sufficient information and develop a big picture representation of the theory. Suggested questions for students to research answers from the Internet: (i) What are tectonic plates? (ii) What causes tectonic plates to move? (iii) How do tectonic plates
51
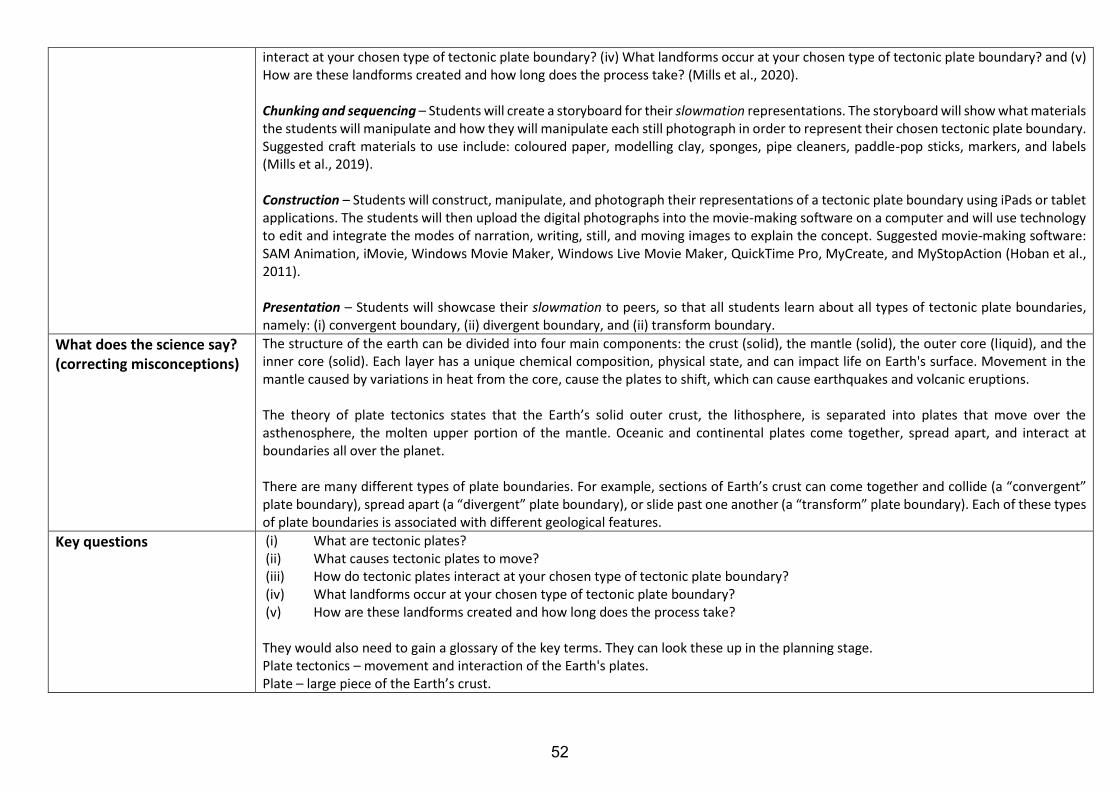
interact at your chosen type of tectonic plate boundary? (iv) What landforms occur at your chosen type of tectonic plate boundary? and (v) How are these landforms created and how long does the process take? (Mills et al., 2020).
Chunking and sequencing – Students will create a storyboard for their slowmation representations. The storyboard will show what materials the students will manipulate and how they will manipulate each still photograph in order to represent their chosen tectonic plate boundary. Suggested craft materials to use include: coloured paper, modelling clay, sponges, pipe cleaners, paddle-pop sticks, markers, and labels (Mills et al., 2019).
Construction – Students will construct, manipulate, and photograph their representations of a tectonic plate boundary using iPads or tablet applications. The students will then upload the digital photographs into the movie-making software on a computer and will use technology to edit and integrate the modes of narration, writing, still, and moving images to explain the concept. Suggested movie-making software: SAM Animation, iMovie, Windows Movie Maker, Windows Live Movie Maker, QuickTime Pro, MyCreate, and MyStopAction (Hoban et al., 2011).
Presentation – Students will showcase their slowmation to peers, so that all students learn about all types of tectonic plate boundaries, namely: (i) convergent boundary, (ii) divergent boundary, and (ii) transform boundary.
What does the science say? (correcting misconceptions)
The structure of the earth can be divided into four main components: the crust (solid), the mantle (solid), the outer core (liquid), and the inner core (solid). Each layer has a unique chemical composition, physical state, and can impact life on Earth's surface. Movement in the mantle caused by variations in heat from the core, cause the plates to shift, which can cause earthquakes and volcanic eruptions.
The theory of plate tectonics states that the Earth’s solid outer crust, the lithosphere, is separated into plates that move over the asthenosphere, the molten upper portion of the mantle. Oceanic and continental plates come together, spread apart, and interact at boundaries all over the planet.
There are many different types of plate boundaries. For example, sections of Earth’s crust can come together and collide (a “convergent” plate boundary), spread apart (a “divergent” plate boundary), or slide past one another (a “transform” plate boundary). Each of these types of plate boundaries is associated with different geological features.
Key questions (i) What are tectonic plates?(ii) What causes tectonic plates to move?(iii) How do tectonic plates interact at your chosen type of tectonic plate boundary?(iv) What landforms occur at your chosen type of tectonic plate boundary?(v) How are these landforms created and how long does the process take?
They would also need to gain a glossary of the key terms. They can look these up in the planning stage. Plate tectonics – movement and interaction of the Earth's plates. Plate – large piece of the Earth’s crust.
52
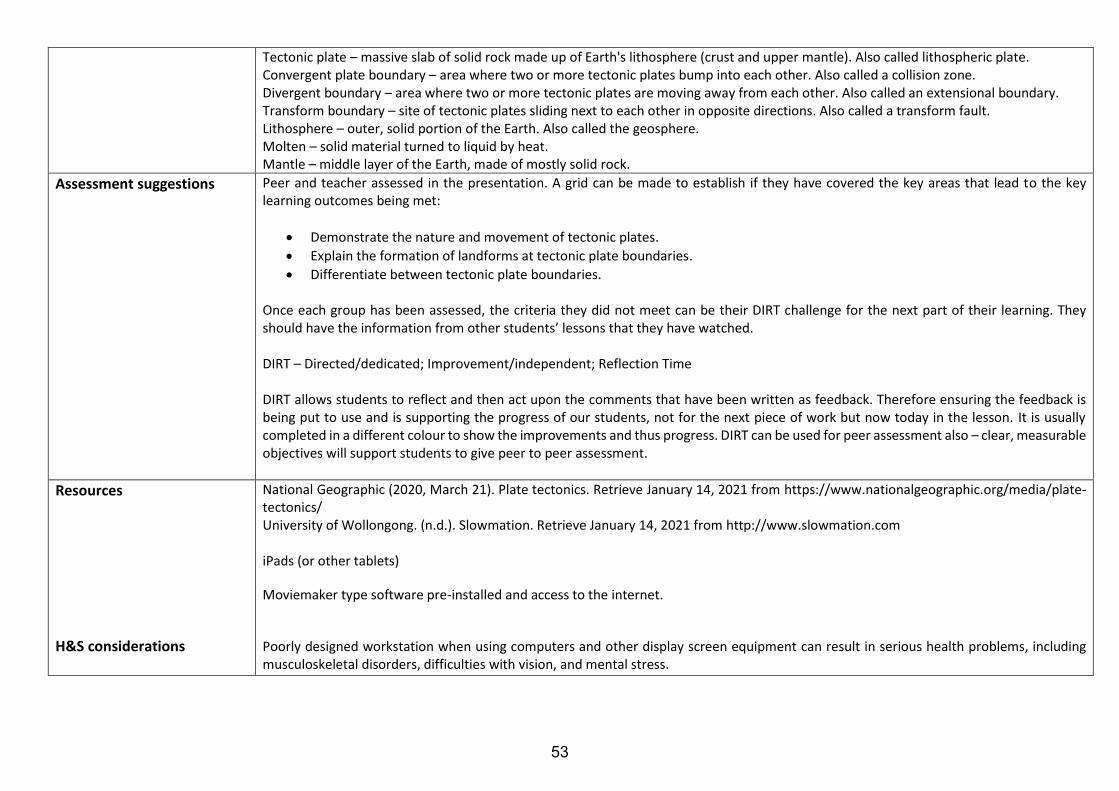
Tectonic plate – massive slab of solid rock made up of Earth's lithosphere (crust and upper mantle). Also called lithospheric plate. Convergent plate boundary – area where two or more tectonic plates bump into each other. Also called a collision zone. Divergent boundary – area where two or more tectonic plates are moving away from each other. Also called an extensional boundary. Transform boundary – site of tectonic plates sliding next to each other in opposite directions. Also called a transform fault. Lithosphere – outer, solid portion of the Earth. Also called the geosphere. Molten – solid material turned to liquid by heat. Mantle – middle layer of the Earth, made of mostly solid rock.
Assessment suggestions Peer and teacher assessed in the presentation. A grid can be made to establish if they have covered the key areas that lead to the key learning outcomes being met:
• Demonstrate the nature and movement of tectonic plates.
• Explain the formation of landforms at tectonic plate boundaries.
• Differentiate between tectonic plate boundaries.
Once each group has been assessed, the criteria they did not meet can be their DIRT challenge for the next part of their learning. They should have the information from other students’ lessons that they have watched.
DIRT – Directed/dedicated; Improvement/independent; Reflection Time
DIRT allows students to reflect and then act upon the comments that have been written as feedback. Therefore ensuring the feedback is being put to use and is supporting the progress of our students, not for the next piece of work but now today in the lesson. It is usually completed in a different colour to show the improvements and thus progress. DIRT can be used for peer assessment also – clear, measurable objectives will support students to give peer to peer assessment.
Resources
H&S considerations
National Geographic (2020, March 21). Plate tectonics. Retrieve January 14, 2021 from https://www.nationalgeographic.org/media/plate-tectonics/ University of Wollongong. (n.d.). Slowmation. Retrieve January 14, 2021 from http://www.slowmation.com
iPads (or other tablets)
Moviemaker type software pre-installed and access to the internet.
Poorly designed workstation when using computers and other display screen equipment can result in serious health problems, including musculoskeletal disorders, difficulties with vision, and mental stress.
53

Research Summary
Motion and Forces Using bridging analogies to teach about balanced forces Students should be taught about: using force arrows in diagrams, adding forces in one dimension, balanced and unbalanced forces. Science (Physics) – KS3
Statement of issue
There is a long history of research establishing that forces and motion are an inherently difficult area to teach in science (Brown & Clement, 1989; Driver et al., 1994; Kruger et al., 1990; Tao & Gunstone, 2000). Misconceptions based on motion frameworks are primarily reported in the literature (Demirci, 2005; Nie et al., 2019).
There are three main misconceptions: (i) if an object is moving there is a force acting on it in the direction of movement, (ii) sustaining motion requires a continued force, (iii) if an object is not moving no forces are acting on it (Gilbert & Watts, 1983). We will focus on the last misconception as this has been repeatedly highlighted in the literature (for example, Demirci, 2005; Nie et al., 2019) that students commonly believe that an absence of motion means that forces are absent.
Main findings from the research
To tackle this misconception research suggests using bridging analogies (Brown & Clement, 1989; Bryce & MacMillan, 2005; Minstrell, 1982).
What are bridging analogies in science education? An analogy, drawing on Driver and Bell’s (1986) model, comprises two parts: the target and base. The target is the situation to be explained by the analogy. The base is the better understood analogous situation. The teacher and student draw attention to the relations between elements in the base and elements in the target (unless the relation is considered obvious). The individual perceives these elements as characteristics or relationships, and they are similar across both the base and the target.
Think of an analogy as the mapping of knowledge from one topic (the base) onto another (the target; Gentner, 1983). For example, in the lesson plan, we are mapping the knowledge about upward force, by engaging with the analogies the students gain direct experience of upward force (i.e. the “feeling of” a book held up by a hand, book suspended from a spring, spring being pushed down by a hand). In the final analogy, this relation of experience is replaced with pliable wood demonstrating the cause of the upward force. Research shows the more shared relations, the more useful the analogy (Gentner, 1989).
What is an anchoring concept?…is an “intuitive knowledge structure that is in rough agreement with accepted physical theory” (Clement et al., 1989, p. 555). One way to identify students’ anchoring concepts is to use an anchoring example; this offers the students a problem situation to demonstrate their knowledge. Ideally, students will confidently give a correct response to the problem thereby demonstrating their anchoring concept that can be used. Be careful to distinguish between memorised answers and intuitive knowledge, as memorised answers cannot be used as anchoring concepts. Brown and Clement (1989) combined anchoring intuitions and analogical reasoning (using individual experiments and class discussions), to tackle misconceptions. They found that secondary students who experienced anchoring and analogy performed statistically significantly better than those with no analogy/anchoring.
54
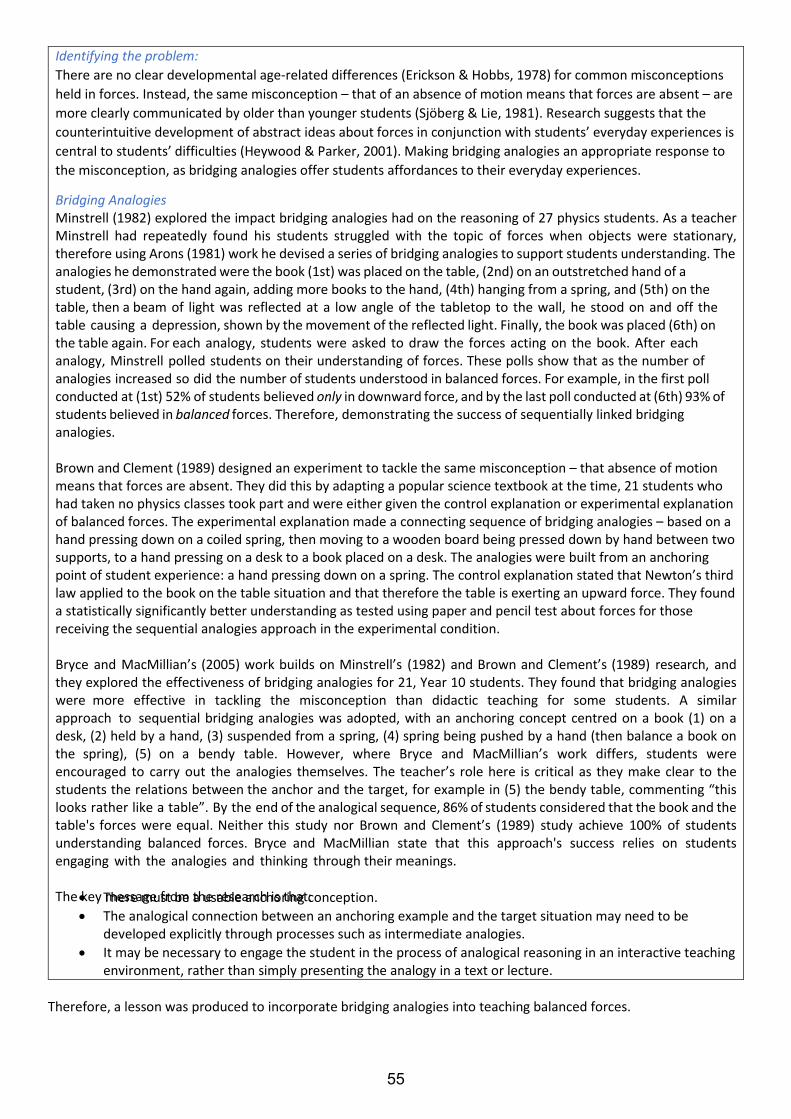
Identifying the problem: There are no clear developmental age-related differences (Erickson & Hobbs, 1978) for common misconceptions held in forces. Instead, the same misconception – that of an absence of motion means that forces are absent – are more clearly communicated by older than younger students (Sjöberg & Lie, 1981). Research suggests that the counterintuitive development of abstract ideas about forces in conjunction with students’ everyday experiences is central to students’ difficulties (Heywood & Parker, 2001). Making bridging analogies an appropriate response to the misconception, as bridging analogies offer students affordances to their everyday experiences.
Bridging Analogies Minstrell (1982) explored the impact bridging analogies had on the reasoning of 27 physics students. As a teacher Minstrell had repeatedly found his students struggled with the topic of forces when objects were stationary, therefore using Arons (1981) work he devised a series of bridging analogies to support students understanding. The analogies he demonstrated were the book (1st) was placed on the table, (2nd) on an outstretched hand of a student, (3rd) on the hand again, adding more books to the hand, (4th) hanging from a spring, and (5th) on the table, then a beam of light was reflected at a low angle of the tabletop to the wall, he stood on and off the table causing a depression, shown by the movement of the reflected light. Finally, the book was placed (6th) on the table again. For each analogy, students were asked to draw the forces acting on the book. After each analogy, Minstrell polled students on their understanding of forces. These polls show that as the number of analogies increased so did the number of students understood in balanced forces. For example, in the first poll conducted at (1st) 52% of students believed only in downward force, and by the last poll conducted at (6th) 93% of students believed in balanced forces. Therefore, demonstrating the success of sequentially linked bridging analogies.
Brown and Clement (1989) designed an experiment to tackle the same misconception – that absence of motion means that forces are absent. They did this by adapting a popular science textbook at the time, 21 students who had taken no physics classes took part and were either given the control explanation or experimental explanation of balanced forces. The experimental explanation made a connecting sequence of bridging analogies – based on a hand pressing down on a coiled spring, then moving to a wooden board being pressed down by hand between two supports, to a hand pressing on a desk to a book placed on a desk. The analogies were built from an anchoring point of student experience: a hand pressing down on a spring. The control explanation stated that Newton’s third law applied to the book on the table situation and that therefore the table is exerting an upward force. They found a statistically significantly better understanding as tested using paper and pencil test about forces for those receiving the sequential analogies approach in the experimental condition.
Bryce and MacMillian’s (2005) work builds on Minstrell’s (1982) and Brown and Clement’s (1989) research, and they explored the effectiveness of bridging analogies for 21, Year 10 students. They found that bridging analogies were more effective in tackling the misconception than didactic teaching for some students. A similar approach to sequential bridging analogies was adopted, with an anchoring concept centred on a book (1) on a desk, (2) held by a hand, (3) suspended from a spring, (4) spring being pushed by a hand (then balance a book on the spring), (5) on a bendy table. However, where Bryce and MacMillian’s work differs, students were encouraged to carry out the analogies themselves. The teacher’s role here is critical as they make clear to the students the relations between the anchor and the target, for example in (5) the bendy table, commenting “this looks rather like a table”. By the end of the analogical sequence, 86% of students considered that the book and the table's forces were equal. Neither this study nor Brown and Clement’s (1989) study achieve 100% of students understanding balanced forces. Bryce and MacMillian state that this approach's success relies on students engaging with the analogies and thinking through their meanings.
The key message from the research is that: • There must be a usable anchoring conception.• The analogical connection between an anchoring example and the target situation may need to be
developed explicitly through processes such as intermediate analogies.• It may be necessary to engage the student in the process of analogical reasoning in an interactive teaching
environment, rather than simply presenting the analogy in a text or lecture.
Therefore, a lesson was produced to incorporate bridging analogies into teaching balanced forces.
55
References Arons, A. (1981). Thinking, reasoning and understanding in introductory physics courses. The Physics Teacher, 19(3),
166-172.Brown, D. E., & Clement, J. (1989). Overcoming misconceptions in mechanics: A comparison of two example-based
teaching strategies. Instructional Science, 18, 237-261. Bryce, T., & MacMillan, K. (2005). Encouraging conceptual change: The use of bridging analogies in the teaching of
action-reaction forces and the ‘at rest ’condition in physics. International Journal of Science Education, 27(6), 737-763.
Clement, J., Brown, D. E., & Zietsman, A. (1989). Not all preconceptions are misconceptions: Finding ‘anchoring conceptions’ for grounding instruction on students’ intuitions. International Journal of Science Education, 11(5), 554-565.
Demirci, N. (2005). A study about students' misconceptions in force and motion concepts by incorporating a web-assisted physics program. Turkish Online Journal of Educational Technology-TOJET, 4(3), 40-48.
Driver, R., & Bell, B. (1986). Students' thinking and the learning of science: A Constructivist view. School Science Review, 67(240), 443-456.
Driver, R., Squires, A., Rushworth, P., & Wood-Robinson, V. (Eds.). (1994) Making sense of secondary science: Research into children’s Ideas. Routledge.
Erickson, G., & Hobbs, E. (1978). A developmental study of student beliefs about force concepts. Annual Convention of the Canadian Society for the Study of Education.
Gentner, D. (1983). Structure-mapping: A theoretical framework. Cognitive Science, 7, 155– 170. Gentner D. (1989). The mechanisms of analogical learning. In S. Vosniadou & A. Ortony, (Eds.), Similarity and
analogical reasoning (pp. 199–241). Cambridge University Press. Gilbert, J. K., & Watts, D. M. (1983). Concepts, misconceptions and alternative conceptions: Changing perspectives in
science education. Studies in Science Education, 10, 61-98. Heywood, D., & Parker, J. (2001). Describing the cognitive landscape in learning and teaching about
forces. International Journal of Science Education, 23(11), 1177-1199. Kruger, C., Summers, M. K., & Palacio, D. J. (1990). A survey of primary school teachers’ conceptions of force and
motion. Educational Research, 32(2), 83 – 94. Minstrell, J. (1982). Explaining the “at rest” condition of an object. The Physics Teacher, 20(1), 10-14. Nie, Y., Xiao, Y., Fritchman, J. C., Liu, Q., Han, J., Xiong, J., & Bao, L. (2019). Teaching towards knowledge integration
in learning force and motion. International Journal of Science Education, 41(16), 2271-2295. Sjöberg, S., & Lie, S. (1981). Ideas about force and movement among Norwegian pupils and students. Report 81-11.
University of Olso. Tao, P., & Gunstone, R. F. (2000). The process of conceptual change in force and motion during computer supported
physics instruction. Journal of Research in Science and Technology, 36(7), 859 – 882.
56

Lesson Plan
Motion and Forces
Using bridging analogies to teach about balanced forces
Pupils should be taught about: using force arrows in diagrams, adding forces in one dimension, balanced and unbalanced forces.
Science (Physics) – KS3
Research recommendation(s) and rationale
The topic of forces is inherently difficult (Tao & Gunstone, 2000). A common misconception is that an absence of motion means that forces are absent (Demirci, 2005; Nie et al., 2019). To tackle this misconception research suggests using bridging analogies (Brown & Clement, 1989; Bryce & MacMillan, 2005; Minstrell, 1982).
Lesson aim To use bridging analogies to teach about balanced forces.
Learning objective To understand that an absence of motion does not mean an absence of forces.
Intended learning outcomes At the end of the lesson, pupils will be able to: i. Describe the magnitude and direction of forces acting on a stationary object.
ii. Be able to use vector arrows to draw those forces acting on a stationary object.
Scientific vocabulary Balanced forces – forces are of equal size but opposite in directions. Force – a push or a pull. Reaction force – force exerted in the opposite direction to an action force.
Suggested lesson sequence and activities
The lesson plan is adapted from the work of Bryce and MacMillan (2005), and Minstrell (1982), each analogy is designed to progressively encourage the pupils to think through (or in some instances actively change) their ideas about upward force.
Draw out pupils’ pre-conceptions of forces when an object is stationary. Task: Ask what forces are acting on the book? Illustrate using vector arrows the forcing acting on the book.
Practical Analogies For each analogy, ask pupils to think about the forces involved and then draw the forces acting on the object to explain its stationary position.
1- Book held up by a handAsk pupils to hold a book up and keep it stationary and think about how it feels. This task gives an easy introduction to upwardforce, as the upward force of their hand is a familiar experience to pupils. (If pupils are struggling, stack more books on the pupil’shand one at a time).2- Book suspended from a spring
57
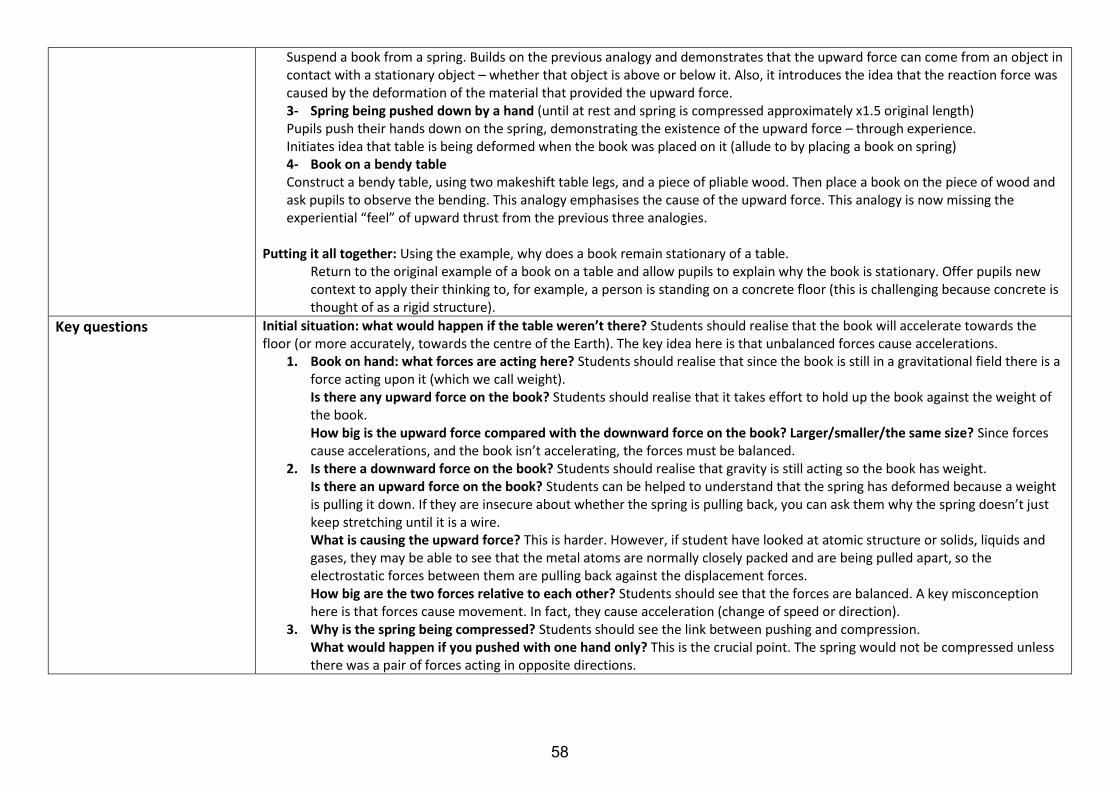
Suspend a book from a spring. Builds on the previous analogy and demonstrates that the upward force can come from an object in contact with a stationary object – whether that object is above or below it. Also, it introduces the idea that the reaction force was caused by the deformation of the material that provided the upward force. 3- Spring being pushed down by a hand (until at rest and spring is compressed approximately x1.5 original length)Pupils push their hands down on the spring, demonstrating the existence of the upward force – through experience.Initiates idea that table is being deformed when the book was placed on it (allude to by placing a book on spring)4- Book on a bendy tableConstruct a bendy table, using two makeshift table legs, and a piece of pliable wood. Then place a book on the piece of wood andask pupils to observe the bending. This analogy emphasises the cause of the upward force. This analogy is now missing theexperiential “feel” of upward thrust from the previous three analogies.
Putting it all together: Using the example, why does a book remain stationary of a table. Return to the original example of a book on a table and allow pupils to explain why the book is stationary. Offer pupils new context to apply their thinking to, for example, a person is standing on a concrete floor (this is challenging because concrete is thought of as a rigid structure).
Key questions Initial situation: what would happen if the table weren’t there? Students should realise that the book will accelerate towards the floor (or more accurately, towards the centre of the Earth). The key idea here is that unbalanced forces cause accelerations.
1. Book on hand: what forces are acting here? Students should realise that since the book is still in a gravitational field there is aforce acting upon it (which we call weight).Is there any upward force on the book? Students should realise that it takes effort to hold up the book against the weight ofthe book.How big is the upward force compared with the downward force on the book? Larger/smaller/the same size? Since forcescause accelerations, and the book isn’t accelerating, the forces must be balanced.
2. Is there a downward force on the book? Students should realise that gravity is still acting so the book has weight.Is there an upward force on the book? Students can be helped to understand that the spring has deformed because a weightis pulling it down. If they are insecure about whether the spring is pulling back, you can ask them why the spring doesn’t justkeep stretching until it is a wire.What is causing the upward force? This is harder. However, if student have looked at atomic structure or solids, liquids andgases, they may be able to see that the metal atoms are normally closely packed and are being pulled apart, so theelectrostatic forces between them are pulling back against the displacement forces.How big are the two forces relative to each other? Students should see that the forces are balanced. A key misconceptionhere is that forces cause movement. In fact, they cause acceleration (change of speed or direction).
3. Why is the spring being compressed? Students should see the link between pushing and compression.What would happen if you pushed with one hand only? This is the crucial point. The spring would not be compressed unlessthere was a pair of forces acting in opposite directions.
58

4. Why does the table bend? Draw out the analogy with the spring. The key point here is that all objects compress a bit whenyou place a weight on them. A sponge will deform fairly obviously whereas in a block of concrete the deformation ismicroscopic (but still there).
5. Why does a book remain stationary on a table? Students should now see that there is a pair of balanced forces in eachsituation where an object is stationary. You can now test this understanding with a circus of experiments where the studentsadd force arrows to each situation.
Assessment suggestions Make a number of differently sized arrows to represent forces. Students can look at a circus of activities in which they add force arrows with blu-tac to a number of stationary objects such as:
• A mass on a spring (weight downwards from centre of mass and equally sized elastic force upward from the point of contactbetween the spring and the mass)
• A ball on a sponge (weight force downwards from centre of mass of ball, equally sized upward reaction force from the surfaceof the sponge)
• A ball on a table (weight force downwards from centre of mass of ball, equally sized upward reaction force from the surface ofthe table)
• A cork floating in a bowl of water (weight force downwards from the centre of mass of the cork, equally sized buoyancy forceupwards from the surface of the water – students can stick the arrows on the outside of the bowl to represent the forces)
• A mass at the bottom of the bowl (weight force downwards from the centre of mass of the object, equally sized reactionforce upwards from the base of the bowl – students can stick the arrows on the outside of the bowl to represent the forces.Alternatively, they could place the weight force downwards and two force arrows pointing upwards – buoyancy and reactionforce providing these two arrows add together to the same length as the downwards arrow)
• Two magnets repelling (two equal and opposite magnetic force arrows pointing away from each other)
• A magnet held in a clamp attracting a paperclip on a thread that has been stuck to a bench - see diagram below. (weightforce acting downwards from the centre of the paperclip and an equally sized arrow pointing upwards from the top of thepaperclip to represent the magnetic attractive force
59
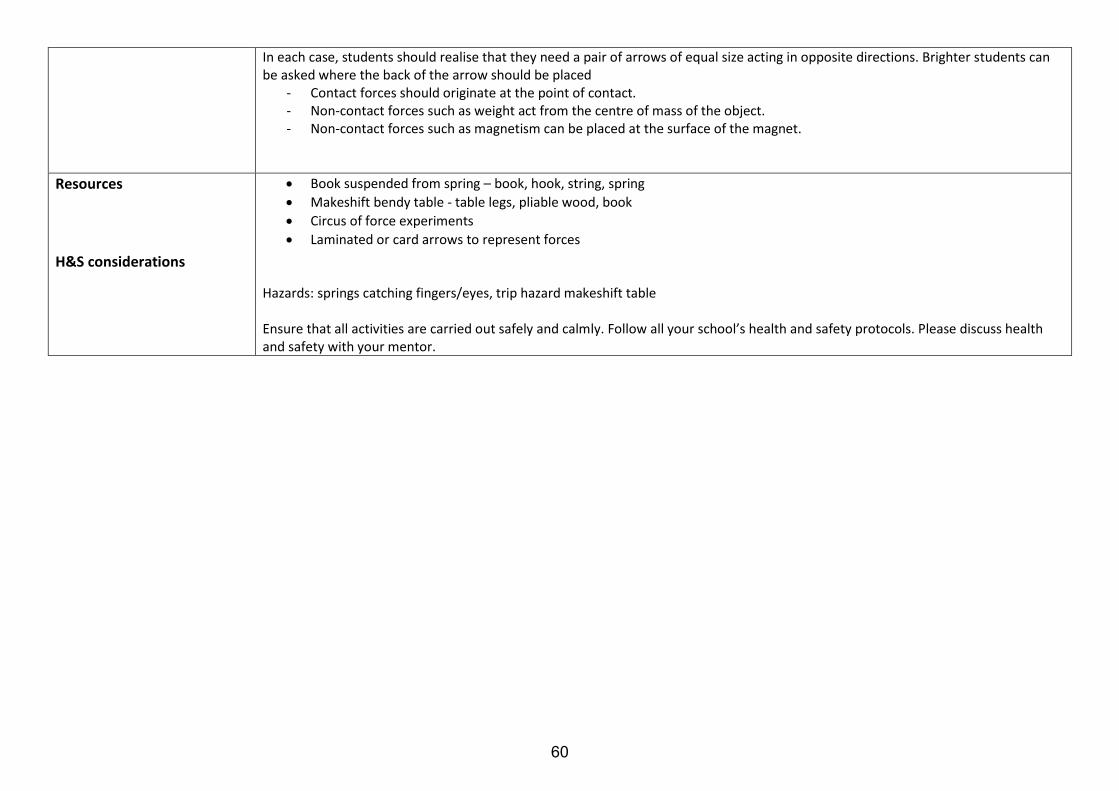
In each case, students should realise that they need a pair of arrows of equal size acting in opposite directions. Brighter students can be asked where the back of the arrow should be placed
- Contact forces should originate at the point of contact.- Non-contact forces such as weight act from the centre of mass of the object.- Non-contact forces such as magnetism can be placed at the surface of the magnet.
Resources
H&S considerations
• Book suspended from spring – book, hook, string, spring
• Makeshift bendy table - table legs, pliable wood, book
• Circus of force experiments
• Laminated or card arrows to represent forces
Hazards: springs catching fingers/eyes, trip hazard makeshift table
Ensure that all activities are carried out safely and calmly. Follow all your school’s health and safety protocols. Please discuss health and safety with your mentor.
60
Research Summary
Electricity Using analogies to teach about current electricity Students should be taught about: (i) potential difference, measured in volts, battery and bulb ratings, and (ii) resistance, measured in ohms, as the ratio of potential difference to current Science (Physics) – KS3
Statement of issue
Research has established that students between 12 and 18 years old hold erroneous models about current flow (Shipstone, 1984). Common misconceptions include the short circuit model (Shipstone et al., 1988), topology, (Engelhardt & Beichner, 2004), the battery as a current source (Borges & Gilbert, 1999).
Research clearly shows that practical activity alone is not enough to tackle misconceptions held about current electricity (Saxena, 1992). Even those whose misconceptions were corrected were unable to apply their knowledge to solve similar problems. Research suggests that a different approach is needed, to use analogies (Clement et al., 1989).
Main findings from the research
Analogies Analogy is a commonly used word and has loose meanings, and different interpretations (Mayer, 1983) – this vagueness creates problems when trying to construct an analogy for teaching purposes. Therefore, we shall provide a definition from the research.
Typically, in teaching the analogy is formed of two parts: the target and base. The target is the situation to be explained by the analogy. The base is the better understood analogous situation. The role of the teacher and students is to draw attention to the relations between elements in the base and elements in the target (unless the relation is considered obvious). Certain assumptions are made when making an analogy:
• that the student has little knowledge of the target situation and needs an analogy,• that the base situation is understood,• that the student accepts the analogy is sound, and an expert would also view the analogy as sound,• that the student (with support) can make the correct relations, and• those students are motivated to attend to comparisons.
Think of an analogy as mapping of knowledge from one topic (the base) onto another (the target; Gentner, 1983). Let us make an imperfect analogy between a hand with a glove, and a foot with a shoe, there is the common relation – covered by – the hand is covered by a glove and a foot is covered by a shoe. Adapting this example, so that thebase and target have common attributes but do not share relations, consider the relation – is protected by – a footis given protection by a shoe. However, a hand does not receive much protection by a glove. Good analogies arisewhere the base and target do not have common attributes, but do share relations, for example, a hand with a glove,and a key with lock and the relation – fits perfectly (Brown & Salter, 2010). Research shows the more sharedrelations, the more useful the analogy (Gentner, 1989).
However, not all previously held conceptions are misconceptions, and these can be identified and used as anchoring conceptions to foreground the analogy (Clement et al., 1989).
What is an anchoring concept?…is an “intuitive knowledge structure that is in rough agreement with accepted physical theory” (Clement et al., 1989, p. 555). One way to identify students anchoring concept is to use an anchoring example; this offers the students a problem situation to demonstrate their knowledge. Ideally, students will confidently give a correct response to the problem. Therefore, demonstrating their anchoring concept that can
61
be used. Be careful to distinguish between memorised answers and intuitive knowledge, as memorised answers cannot be used as anchoring concepts. Brown and Clement (1987) combined anchoring intuitions and analogical reasoning (using individual experiments and class discussions), to tackle misconceptions. They found that secondary students who experienced anchoring and analogy performed statistically significantly better than those who had no analogy/anchoring.
What does the research show The factors influencing the successful use of analogies in the presence of misconceptions:
• use the anchoring conception,• engage student in analogical reasoning in an interactive teaching environment,• support the student in viewing the target situation in a new way (Brown & Clement, 1989).
Paatz et al., (2004) focused on exploring what the students learned throughout the teaching sequence by conducting a case study on a student aged 16, studying simple electric circuits through an analogy-based teaching sequence. The teaching followed Gentner’s (1989) structure mapping theory outlined above in the example. There is evidence suggesting that the successful use of analogies uses analogy based on water-flow through pipes. However, the authors caution that students must first be familiar with the base situation of water-flow and benefit from carrying out practical experiments with water first before moving onto electricity.
Chiu and Lin (2004) explored the impact of multiple analogies in students’ learning about an electric circuit, where 32 students were randomly assigned to one of four different groups/conditions (Nonanalogy, Single Analogy, Similar Analogies, Complementary Analogies). Findings from the study indicated that students who worked with analogies performed statistically significantly better than students in the other three groups. Specifically, measuring conceptual understanding students in the Similar Analogies group performed best from the four conditions, followed by the Single Analogy, Complementary Analogies, and Nonanology group.
Experimental conditions for students learning about electric circuits. Condition Details of Analogy Nonanalogy No analogy used. Single Analogy One analogy was used: simple water circulation. Similar Analogies Need to represent equivalent things in terms of “perspective, precision, modality,
specificity, and complexity” (Chiu & Jing-Wen, 2017, p. 79), transforming the analogical representation from base to target easier. Four analogies were used: based around the similar analogies of water-flow and block running (integrated x4 analogies into an obstacle course: crowded people, particle analogy, marathon runner, bridge analogy).
Complementary Analogies Need to represent two different perspectives - the circuit and energy in electricity - and present different points of view. Two analogies were used, block running and complex water system (modified the design of a circulating water wheel model to a closed water wheel system).
Before using the analogy, students took part in a prediction-observation-explanation activity to create a conceptual conflict context for students to confront their understanding: anchoring. Liu and Chiu (2017) evaluated the use of multiple analogies from the students’ perspective in a follow-up to their previous 2004 study. They found that the students in Similar Analogies and Complementary Analogies groups held a more secure grasp of the scientific concepts (and were less likely to hold misconceptions) and did not perceive an increased cognitive load, despite the increase in the number of analogies.
Therefore, it is essential to plan out analogies, and ensure that they have numerous relations between the target and base (Gentner, 1989), and make these relations explicit to students (Chiu & Lin, 2004). Use of anchoring concepts can guide teachers in developing meaningful learning materials for students (Brown & Clement, 1987). Research demonstrates that using more than one analogy for current electricity statistically significantly increases students’ conceptual understanding (Chiu & Lin, 2004).
Therefore, a lesson was produced to incorporate the use of analogies into teaching current electricity.
62

References Borges, A., & Gilbert, J. (1999). Mental models of electricity. International Journal of Science Education, 21(1), 95-117. Brown, S., & Salter, S. (2010). Analogies in science and science teaching. Advances in Physiology Education, 34(4), 167-
169. Brown, D. E., & Clement, J. (1987, April). Overcoming misconceptions in mechanics: A comparison of two example-
based teaching strategies [Paper presentation]. American Educational Research Association, DC, USA. Brown, D. E., & Clement, J. (1989). Overcoming misconceptions via analogical reasoning: Abstract transfer versus
explanatory model construction. Instructional Science, 18(4), 237-261. Chiu, M. H., & Lin, J. W. (2004). Promoting fourth graders’ conceptual change of their understanding of electric current
via multiple analogies. Journal of Research in Science Teaching, 42(4), 429-464. Clement, J., Brown, D. E., & Zietsman, A. (1989). Not all preconceptions are misconceptions: Finding ‘anchoring
conceptions’ for grounding instruction on students’ intuitions. International Journal of Science Education, 11(5), 554-565.
Engelhardt, P. V., & Beichner, R. J. (2004). Students’ understanding of direct current resistive electrical circuits. American Journal of Physics, 72(1), 98-115.
Gentner, D. (1983). Structure-mapping: A theoretical framework. Cognitive Science, 7, 155– 170. Gentner D. (1989). The mechanisms of analogical learning. In S. Vosniadou, & A. Ortony, (Eds.), Similarity and
analogical reasoning (pp. 199–241). Cambridge University Press. Lin, J. W., & Chiu, M. H. (2017). Evaluating Multiple Analogical Representations from Students’ Perceptions. In D. F.
Treagust., R. Duit, & H. E. Fischer, (Eds.), Multiple representations in physics education (pp. 71-91). Springer. Mayer, R. (1983). What have we learned about increasing meaningfulness of science prose? Science Education, 67, pp.
223-237.Paatz, R., Ryder, J., Schwedes, H., Scott, P., (2004). A case study analysing the process of analogy-based learning in a
teaching unit about simple electric circuits. International Journal of Science Education 26, 1065–1081. Saxena, A. B. (1992). An attempt to remove misconceptions related to electricity. International Journal of Science
Education, 14(2), 157-162. Shipstone, D. M. (1984). A study of children’s understanding of electricity in simple DC circuits. European Journal of
Science Education, 6(2), 185-198. Shipstone, D.M., Jung, W. & Dupin, J.J. (1988). A study of students’ understanding of electricity in five European
countries. International Journal of Science Education, 10(3), 303-316.
63
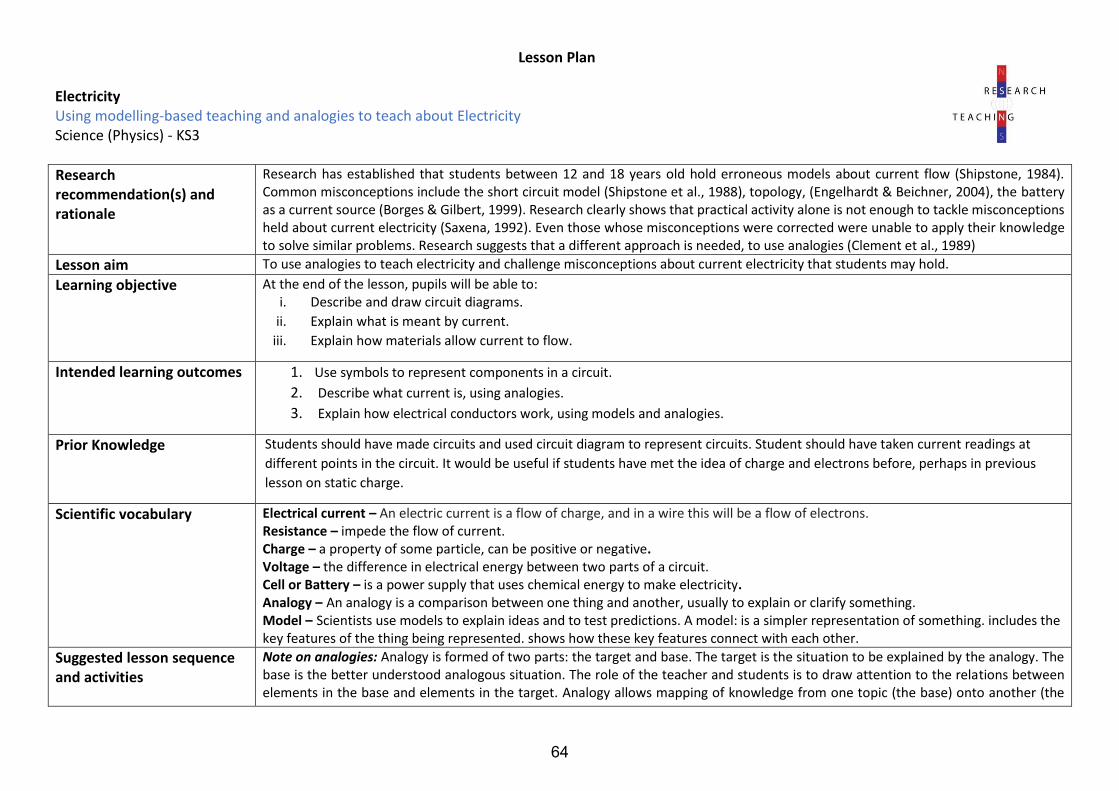
Lesson Plan
Electricity Using modelling-based teaching and analogies to teach about Electricity Science (Physics) - KS3
Research recommendation(s) and rationale
Research has established that students between 12 and 18 years old hold erroneous models about current flow (Shipstone, 1984). Common misconceptions include the short circuit model (Shipstone et al., 1988), topology, (Engelhardt & Beichner, 2004), the battery as a current source (Borges & Gilbert, 1999). Research clearly shows that practical activity alone is not enough to tackle misconceptions held about current electricity (Saxena, 1992). Even those whose misconceptions were corrected were unable to apply their knowledge to solve similar problems. Research suggests that a different approach is needed, to use analogies (Clement et al., 1989)
Lesson aim To use analogies to teach electricity and challenge misconceptions about current electricity that students may hold.
Learning objective At the end of the lesson, pupils will be able to: i. Describe and draw circuit diagrams.
ii. Explain what is meant by current.
iii. Explain how materials allow current to flow.
Intended learning outcomes 1. Use symbols to represent components in a circuit.
2. Describe what current is, using analogies.
3. Explain how electrical conductors work, using models and analogies.
Prior Knowledge Students should have made circuits and used circuit diagram to represent circuits. Student should have taken current readings at
different points in the circuit. It would be useful if students have met the idea of charge and electrons before, perhaps in previous
lesson on static charge.
Scientific vocabulary Electrical current – An electric current is a flow of charge, and in a wire this will be a flow of electrons. Resistance – impede the flow of current. Charge – a property of some particle, can be positive or negative. Voltage – the difference in electrical energy between two parts of a circuit. Cell or Battery – is a power supply that uses chemical energy to make electricity. Analogy – An analogy is a comparison between one thing and another, usually to explain or clarify something. Model – Scientists use models to explain ideas and to test predictions. A model: is a simpler representation of something. includes the key features of the thing being represented. shows how these key features connect with each other.
Suggested lesson sequence and activities
Note on analogies: Analogy is formed of two parts: the target and base. The target is the situation to be explained by the analogy. The base is the better understood analogous situation. The role of the teacher and students is to draw attention to the relations between elements in the base and elements in the target. Analogy allows mapping of knowledge from one topic (the base) onto another (the
64
target) Not all analogies map well and not all analogies are well understood by students. For instance, water flow is familiar but not well understood by children and so this analogy is of limited use beyond an initial link. The rope model maps better from base to target and the demonstration allows it to be well understood by students. It can also continue to be of use in KS4.
Activity 1: Link to Prior Knowledge Ask student to draw and label a simple electrical circuit. Make and demonstrate the circuit from one of the student’s instructions. Show that the current is the same at all points in the circuit. Define current as the rate of flow of charge in the circuit. Show students a diagram of electrons in a circuit.
Activity 2: Leading students towards using analogies Show students pictures of a river and a convoy of trucks. Ask them how this might be related to an electrical circuit. Working in pairs or small groups they should attempt to relate the pictures to the circuits. Select pairs/groups to share their ideas. Extend the analogies based on their ideas. This activity also allows for the detection of misconceptions.
Activity 3: Rope loop analogy/model Introduce the rope loop analogy. A loop of rope is held lightly by students and the teacher. The teacher moves the rope by pulling hand over hand, making the movement as smooth as possible. This represents a steady current. Discuss the following points:
• The steady rate of the rope at all points representing the fact that the current is the same at al points in the circuit.
• If a student increases their grip and resists the movement of the rope, this reduces the flow of rope everywhere in the looprepresenting resistance.
• The teacher makes the rope move but does not make (create) the rope. This represents the battery causing charges to movebut not storing or creating them.
• The teacher can point out that all the rope that moves out from the teacher(battery) to the circuit comes back, it is not used up.All of these activities challenge the misconceptions often held by students.
Activity 4: Assessment Informal assessment by questioning should be used throughout.
Key questions Activity 1: When the circuit is switched on the bulb lights up immediately, even if the bulb was the other side of the school field the bulb would come on immediately, how can the energy be transferred so quickly? Activity 2: Is the current is the same all over the circuit. Activity 3: Questions that lead the students to discuss the bullet pointed points in the section above. Questions such as:
• What do you notice about how the rope is moving in the circle?
• What happens if student a holds the rope more tightly?
65
Activity 4: Questions listed in the assessment section.
Assessment suggestions Towards the end of the lesson students are asked to decide if a series of statements are correct, students can be asked to correct the statements and higher ability students can be challenged to use the rope analogy to explain why they are incorrect. Statements could include:
• Charged particles got used up as they went through the bulb.
• The bulb cannot light until the energy is carried to it.
• The charges travel from the battery to bulb, and light it when they get there.
More formal assessment: Questions such as the ones included below, from the EPSE website, can be used.
Resources Activity 1: Demonstration of Circuit Make a simple circuit containing a battery, a bulb and an ammeter. Demonstrate the current is the same at all points in the circuit. Activity 2: Pictures of Analogies Pictures of a convoy of trucks, a river, or other often used analogies for electrical current. Activity 2: For the rope modelling: A long piece of rope marked at equal distance along the entire length. Pen marks rather than tape should be used so that the rope can run freely through a reasonably tight hand grip. Activity 6: Assessment Assessment questions listed above. More formal assessment material is included below.
H&S considerations Hazard Less than 30V AC or DC and at currents over 5 mA is a low electrical hazard. Some cells can contain TOXIC or CORROSIVE materials. Using the rope may lead to entanglement and tripping or, if a student holds too tightly, rope burns. The rope should be kept below neck height.
66
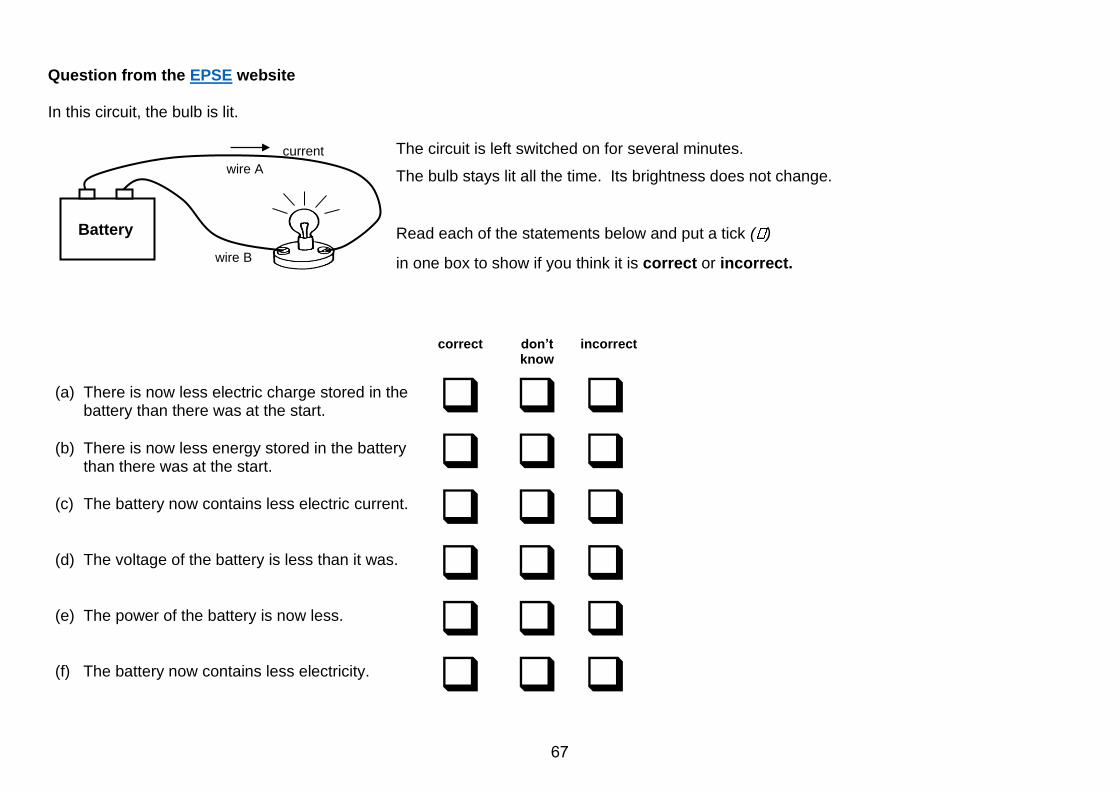
Question from the EPSE website
In this circuit, the bulb is lit.
The circuit is left switched on for several minutes.
The bulb stays lit all the time. Its brightness does not change.
Read each of the statements below and put a tick ( )
in one box to show if you think it is correct or incorrect.
correct don’t know
incorrect
(a) There is now less electric charge stored in thebattery than there was at the start. ❑ ❑ ❑
(b) There is now less energy stored in the batterythan there was at the start. ❑ ❑ ❑
(c) The battery now contains less electric current.❑ ❑ ❑
(d) The voltage of the battery is less than it was.❑ ❑ ❑
(e) The power of the battery is now less.❑ ❑ ❑
(f) The battery now contains less electricity.❑ ❑ ❑
current
wire B
wire A
Battery
67
Research Summary Space Physics Using mental model building strategy to teach about the Sun-Earth-Moon system Students should be taught about: (i) our Sun as a star, other stars in our galaxy, other galaxies, and (ii) the seasons and the Earth’s tilt, day length at different times of year, in different hemispheres. Science (Physics) – Key stage 3
Statement of issue
Space science has long been considered an exciting yet terrifying topic in the science curriculum (Roche et al., 2012). In the UK, many teachers identify space science as a challenging part of their teaching, despite various initiatives existing to help them develop pedagogical tools in this area (Roche et al., 2012). Their reluctance is partly due to the fact that most science teachers have not studied space science at university level and may have problems mastering the content (Benacchio, 2001). A study from a survey of 388 respondents found that pre- and in-service science teachers held numerous misconceptions about space science, with particular regards to the reasons why seasons exist, the Sun’s position, the Moon’s phases, and the Moon’s phase in a solar eclipse (Kanli, 2014). Roche et al.’s (2012) research found that the most prominent teaching issues associated with space science in the UK were:
• Poor weather, which restricts access to the night sky • The cost of astronomical equipment and the requisite logistical issues associated with its usage • Schools being located in areas near cities with high levels of light pollution • The conceptually challenging nature of space science, which involves vast scales and distances, and
mathematical complexity • The often poor coverage of astronomy in general physics textbooks
Main findings from the research
What are mental models? A model is a representation of an idea, object, event, process or system (Gilbert & Boulter, 2000). Models can comprise different modes: visual, verbal, gestural, mathematical, and concrete (Boulter & Buckley, 2000). They are key tools for scientists, science teachers and students and play an essential role in the practice of science (Ogborn & Martins, 1996). The role of models in science education has been gaining an increasing amount of research attention (Gilbert & Boulter, 2000). Mental models are a special form of model and are defined as human cognitive constructions used to describe and explain phenomena that cannot be experienced directly (Coll et al., 2005). There are two main approaches to the study of mental models (Gentner, 2001). One approach seeks to characterise the knowledge and processes that support understanding and reasoning in knowledge-rich domains. The other approach focuses on mental models as working-memory constructs that support logical reasoning. Most of the research found in the literature focuses mainly on the knowledge-based approach. Coll et al. (2005) indicate that helping students to understand the key mental models of science will be most effective when:
• Students are helped to understand the role that mental models play in the construction of scientific models, and to be aware of the strengths and limitations of models in describing and explaining scientific concepts
• Students are able to construct and critique both their own models and scientists’ models of scientific phenomena, and
• Teachers have good pedagogical content knowledge about the nature of science — in particular, the role of models, metaphors and analogies in scientific communities of practice — and are also aware of the range of possible mental models of scientific phenomena that their students may hold.
68
Main findings of previous research Mental models are commonly utilised by astronomers to understand phenomena and to transmit that understanding to others (Sutter et al., 1993; Weller 1970). Attempts to understand the place of the Earth within the universe have been articulated via a series of mental models, which are constantly evolving (Glynn, 1997). In an effort to promote better understanding of space science, research suggests that teaching needs to become a process in which students construct and validate mental models that bind individual knowledge and conceptions into a coherent whole (Taylor et al., 2003). A group of researchers in New Zealand conducted a study on developing a mental model building strategy to promote a better understanding of space science (see Taylor et al., 2003). They argued that this crucial skill may also promote a better understanding of the nature of science among students, as it resonates with current understandings of students’ learning in science. The Sun–Earth–Moon mental model-building teaching intervention was implemented with a typical classroom of 33 Year 7–8 students (aged 11 – 13 years old) over a 16-day period. The findings from the study, as measured from post-study interviews and survey data indicated that:
• 90% of the students were able to identify that Model E (from Jones et al., 1987) – the Moon orbits the Earth, which orbits the Sun – was the closest model to the scientists’ model of the Sun – Earth – Moon system.
• 90% of the students were able to correctly name “an orrery” as a scientist’s model. All six interviewed students also identified “the orrery” as a model used by scientists to represent the Sun – Earth – Moon system.
• Only three students initially expressed ideas about the purpose of the models. However, after the intervention, almost all the students had come to understand that models have a variety of uses, such as “to show ideas using a scaled-down version of something” (52%) and “to show and test new theories” (19%) (Taylor et al., p.1218).
• Students did acquire and retain adequate traditional space science knowledge with respect to the relative distance of the planets from the Sun, descriptions of the planets, relative sizes of the planets, solar eclipses, the Moon as the main cause of tides on Earth, and the reasons why we can sometimes see the Moon during the day (Taylor et al., 2003, p.1219).
Ogan-Bekiroglu (2007) investigated the effects of a mental model building strategy on 36 pre-service teachers’ conceptions of the Moon, Moon phases, and other Moon phenomena. The findings from the study indicated that some of the pre-service teachers’ mental models shifted from flawed or incomplete to correct, through the facilitation of mental model building strategy. The most positive effects of mental model building strategy were identified with regards to the following conceptions: (i) the relationship between tidal effects on the Earth and the appearance of the Moon, and (ii) seeing the same phase of the Moon all over the world at the same time. In another earlier study, Lynch (1996) found that 72% of Grade 6 (Year 7) children in Tasmania were able to construct the scientist’s mental model of the Earth-Sun-Moon system, and, in particular, understandings related to shape, relative size, the solar model, day and night, and the sequence of one year after being taught using mental model building strategy. Meanwhile, in England, an attempt was made, using enabling concepts and influences, to place students’ models or constructs of day and night, the seasons, phases of the Moon and the solar system into intuitive, scientific and synthetic categories (Sharp, 1996). The findings of the study indicated that most of the students were able to state the correct Earth-Sun-Moon system.
Therefore, a lesson was produced using a mental model building strategy to teach about the Sun-Earth-Moon system. References Benacchio, L. (2001). The importance of the moon in teaching astronomy at the primary school. In C. Barbieri, F.
Rampazzi, (Eds.), Earth-Moon relationships (pp. 51-60). Springer. Boulter, C., & Buckley, C. (2000). Constructing a typology of models for science education. In K. Gilbert, & C. Boulter
(Eds.), Developing models in science education (pp. 41-57). Springer.
69
Coll, R. K., France, B., & Taylor, I. (2005). The role of models/and analogies in science education: Implications from research. International Journal of Science Education, 27(2), 183-198.
Gentner, D. (2001). Mental models, psychology of. In J. Wright (Ed.) International Encyclopedia of the Social & Behavioral Sciences (pp. 9683-9687). Elsevier.
Gilbert, J. K., & Boulter, C. (2000). Developing models in science education. Springer. Glynn, S. (1997). Drawing mental models. The Science Teacher, 64(1), 30–32. Jones, B. L., Lynch, P. P., & Reesink, C. (1987). Children's conceptions of the Earth, Sun and Moon. International Journal
of Science Education, 9(1), 43-53. Kanli, U. (2014). A study on identifying the misconceptions of pre-service and in-service teachers about basic
astronomy concepts. Eurasia Journal of Mathematics, Science and Technology Education, 10(5), 471-479. Lynch, P. P. (1996). Students' alternative frameworks: linguistic and cultural interpretations based on a study of a
western-tribal continuum. International Journal of Science Education, 18(3), 321-332. Ogan-Bekiroglu, F. (2007). Effects of model-based teaching on pre-service physics teachers’ conceptions of the moon,
moon phases, and other lunar phenomena. International Journal of Science Education, 29(5), 555-593. Ogborn, J., Kress, G., & Martins, I. (1996). Explaining science in the classroom. McGraw-Hill Education. Roche, P., Roberts, S., Newsam, A., & Barclay, C. (2012). Teaching astronomy in UK schools. School Science Review,
93(344), 63-68. Sharp, J. G. (1996). Children’s astronomical beliefs: A preliminary study of Year 6 children in south-west England.
International Journal of Science Education, 18(6), 685–712. Sutter, D., Sneider, C., Gould, A., Willard, C., & de Vore, E. (1993). Moons of Jupiter Teacher’s Guide. University of
California. Taylor, I., Barker, M., & Jones, A. (2003). Promoting mental model building in astronomy education. International
Journal of Science Education, 25(10), 1205-1225. Weller, C. M. (1970). The role of analogy in teaching science. Journal of Research in Science Teaching, 7(2), 113–119.
70
Lesson Plan Space Physics Using mental model building to teach about the Sun-Earth-Moon system Students should be taught about: (i) our Sun as a star, other stars in our galaxy, other galaxies, and (ii) the seasons and the Earth’s tilt, day length at different times of year, in different hemispheres. Science (Physics) – Key stage 3 (Year 7/8)
Research recommendation(s) and rationale
Research has shown that a mental model building strategy has been able to promote a better understanding of space science, with particular regards to the Sun–Earth–Moon system (Ogan-Bekiroglu, 2007; Taylor et al., 2003). Research has found that students were able to construct a scientist’s mental model of the relative distance of the planets from the Sun (Lynch, 1996; Taylor et al., 2003; Sharp, 1996). Research suggests that students most effectively understand key mental models of science when they actively partake in the construction of scientific models, and are aware of the strengths and limitations of models in describing and explaining scientific concepts (Taylor et al., 2003).
Lesson aim To use mental model building strategy to promote a better understanding of the Sun–Earth–Moon system.
Learning objective To understand mental models of the Sun-Earth-Moon system (as well as the role of seasons and day lengths at different times of year, in different hemispheres).
Intended learning outcomes At the end of the lesson, students will be able to: i. Observe, operate, and critique the orrery
ii. Explain the mental model of the Sun–Earth–Moon system, and iii. Describe how the Earth’s rotation causes periods of light and darkness (day and night), which determines the seasons
Scientific vocabulary Star – large ball of gas and plasma that radiates energy through nuclear fusion, such as the sun. Sun – an ordinary star, one of about 100 billion in our galaxy, the Milky Way. Moon – an object that orbits a planet or something else that is not a star. Earth's only natural satellite. Earth – the third planet from the Sun. The Earth is the only place in the known universe that supports life. Seasons – period of the year distinguished by special climatic conditions. Orrery – is a mechanical model of the solar system.
Suggested lesson sequence and activities
The lesson sequences describe how to teach about the Sun-Earth-Moon system using a four-phase pedagogical approach of mental model building, adopted from Taylor et al.’s (2003) work. Phase 1: Focus on the mental models The teacher will probe and interpret students’ prior mental models and students’ views on how scientists use models. Students will state and compare their prior mental models within their group and class. Suggested models to use include: charts, telescopes, orreries, solar system models, computer programmes, and maps (for example: a map of the London Underground), or five mental models of the Sun–Earth–Moon system, as utilised by Jones et al. (1987).
71
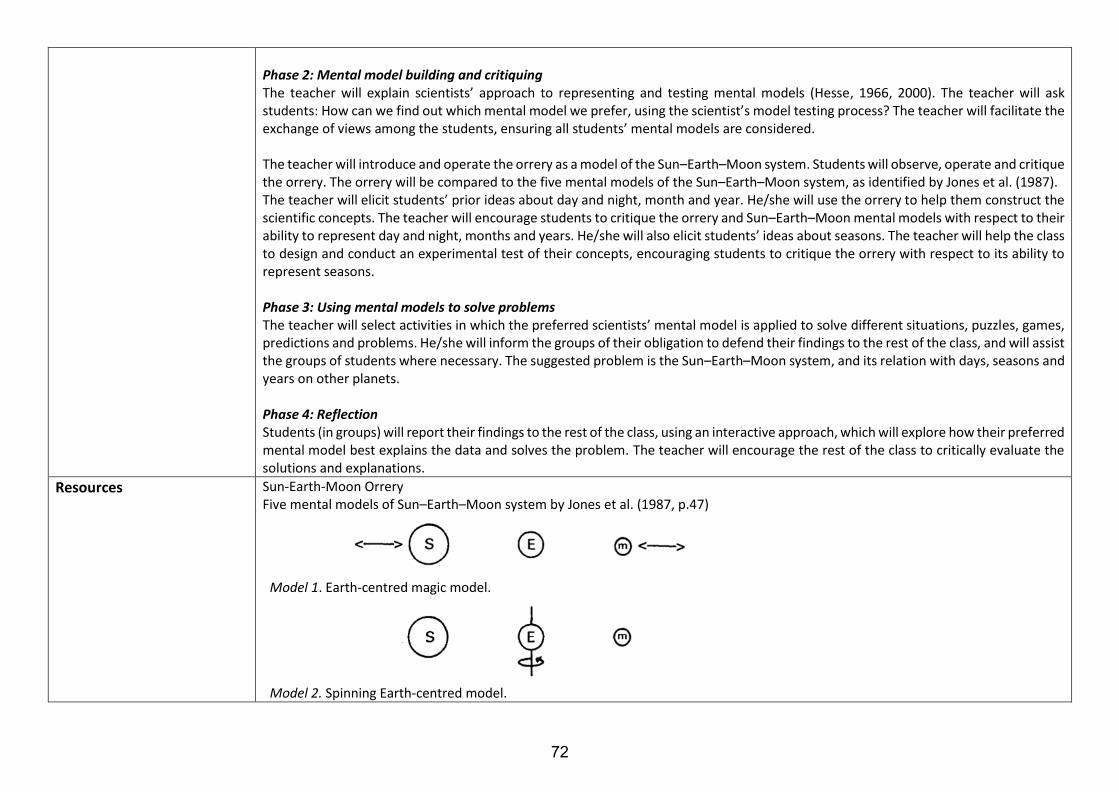
Phase 2: Mental model building and critiquing The teacher will explain scientists’ approach to representing and testing mental models (Hesse, 1966, 2000). The teacher will ask students: How can we find out which mental model we prefer, using the scientist’s model testing process? The teacher will facilitate the exchange of views among the students, ensuring all students’ mental models are considered. The teacher will introduce and operate the orrery as a model of the Sun–Earth–Moon system. Students will observe, operate and critique the orrery. The orrery will be compared to the five mental models of the Sun–Earth–Moon system, as identified by Jones et al. (1987). The teacher will elicit students’ prior ideas about day and night, month and year. He/she will use the orrery to help them construct the scientific concepts. The teacher will encourage students to critique the orrery and Sun–Earth–Moon mental models with respect to their ability to represent day and night, months and years. He/she will also elicit students’ ideas about seasons. The teacher will help the class to design and conduct an experimental test of their concepts, encouraging students to critique the orrery with respect to its ability to represent seasons. Phase 3: Using mental models to solve problems The teacher will select activities in which the preferred scientists’ mental model is applied to solve different situations, puzzles, games, predictions and problems. He/she will inform the groups of their obligation to defend their findings to the rest of the class, and will assist the groups of students where necessary. The suggested problem is the Sun–Earth–Moon system, and its relation with days, seasons and years on other planets. Phase 4: Reflection Students (in groups) will report their findings to the rest of the class, using an interactive approach, which will explore how their preferred mental model best explains the data and solves the problem. The teacher will encourage the rest of the class to critically evaluate the solutions and explanations.
Resources
Sun-Earth-Moon Orrery Five mental models of Sun–Earth–Moon system by Jones et al. (1987, p.47)
Model 1. Earth-centred magic model.
Model 2. Spinning Earth-centred model.
72
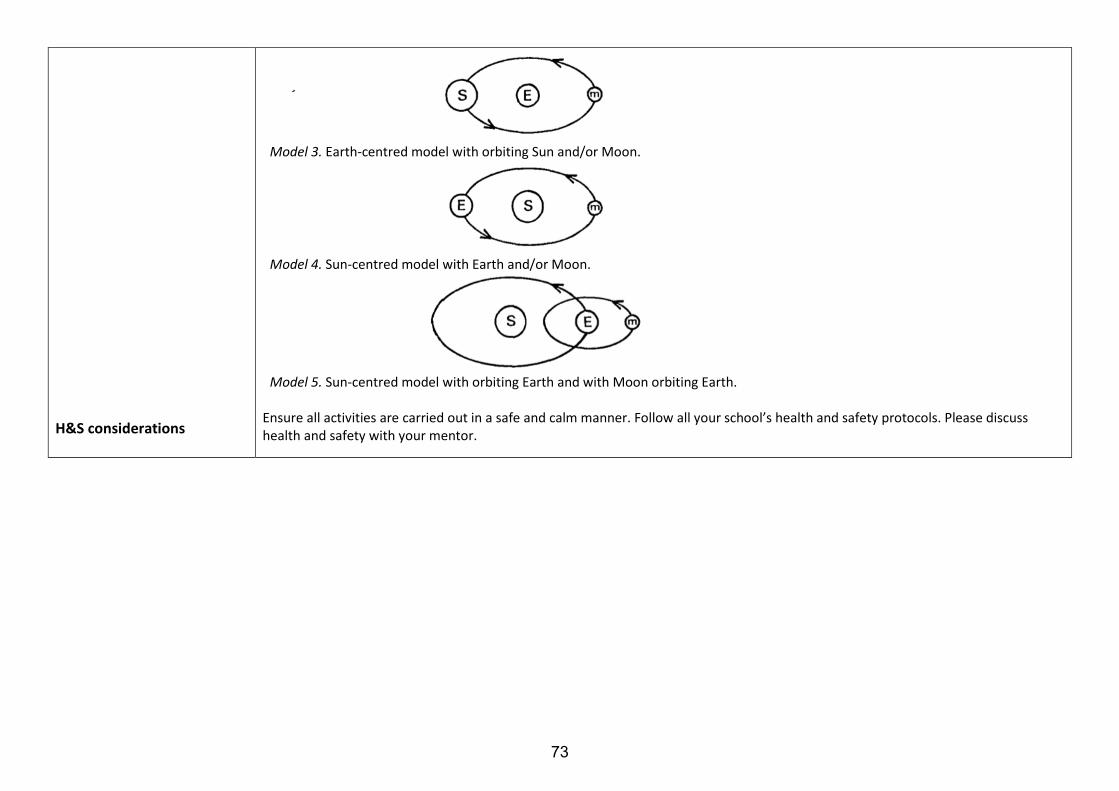
H&S considerations
Model 3. Earth-centred model with orbiting Sun and/or Moon.
Model 4. Sun-centred model with Earth and/or Moon.
Model 5. Sun-centred model with orbiting Earth and with Moon orbiting Earth.
Ensure all activities are carried out in a safe and calm manner. Follow all your school’s health and safety protocols. Please discuss health and safety with your mentor.
73
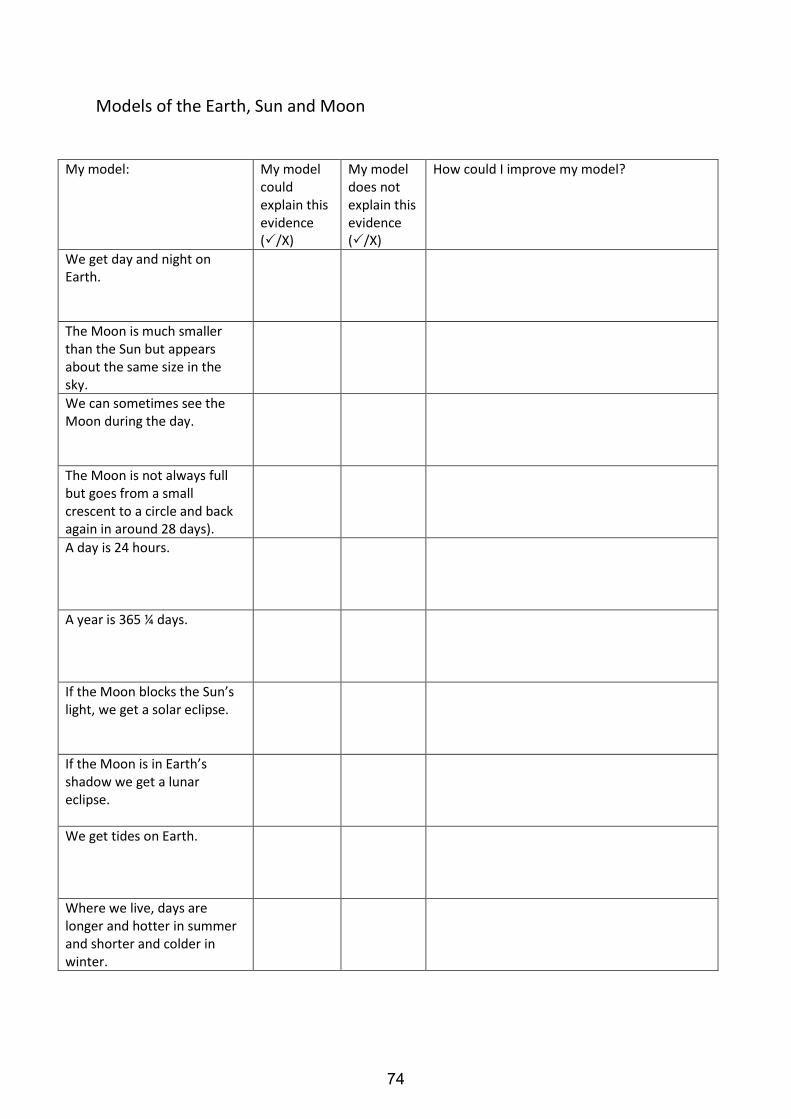
Models of the Earth, Sun and Moon
My model:
My model could explain this evidence (/X)
My model does not explain this evidence (/X)
How could I improve my model?
We get day and night on Earth.
The Moon is much smaller than the Sun but appears about the same size in the sky.
We can sometimes see the Moon during the day.
The Moon is not always full but goes from a small crescent to a circle and back again in around 28 days).
A day is 24 hours.
A year is 365 ¼ days.
If the Moon blocks the Sun’s light, we get a solar eclipse.
If the Moon is in Earth’s shadow we get a lunar eclipse.
We get tides on Earth.
Where we live, days are longer and hotter in summer and shorter and colder in winter.
74

Model
75
Research Summary Light Using the history of science as a context within which to teach about light Students should be taught: (i) colours and the different frequencies of light, white light and prisms (qualitative only), and (ii) differential colour effects in absorption and diffuse reflection Science (Physics) – KS3
Statement of issue
Light is a complex and challenging topic in which there exist frequent, and very common, misconceptions (Tsui & Treagust, 2010) of which one of the most strongly held is that colour is an intrinsic property of an object (Chauvet, 1996; Guesne, 1985; Haagen-Schützenhöfer, 2017; Kolokouri & Plakitsi, 2012).
Main findings from the research
Research has established that students struggle, because of common everyday experiences, to understand that colour is not an intrinsic property of an object in the same way that mass is an intrinsic property (Guesne, 1985). It has been found (Kolokouri & Plakitsi, 2012, Matthews, 1994), that using a didactic lesson, supported with simple practical activities, that is set within a historical context, provides an effective, and memorable, approach to addressing this misconception. What is the history of science? It is a discipline that combines history, philosophy and science, that focuses on science from a historical approach (Brush, 1989). A historical approach can be beneficial for some scientific concepts as it highlights that the concept is not static (Galili & Hazan, 2000), can help reduce the abstract nature of science (Matthews, 1994), and also illustrates how science advances (Bevilacqua & Bordoni, 1998). Research shows Matthews (1994) was the first to write about the advantages of using a historical approach to design science educational materials and Galili and Hazan (2001) developed and tested this approach for the teaching of light at secondary school level. Galili and Hazan (2000) conducted a year-long study comparing 4 classes (141 students in Year 10) whose physics classes on the topic of light used a history of science approach and compared these with 3 classes (93 students in Year 10), who were taught about light traditionally with no historical context. They found (Galili & Hazan, 2000, 2001), using quantitative and qualitative methods that students who were taught about colour using an approach that incorporated the history of science achieved statistically significantly greater improvements in their conceptual understanding of colour than the control group (no history of science). Additional research, Kolokouri and Plakitsi (2012), examined pre-service primary teachers' successful use of a history of science approach to teach about colour in five different primary classrooms within science lessons for 2-weeks. They used Newton’s presentation of colour to the Royal Society to create a narrative to contextualise the scientific concepts within that presentation. Their qualitative findings showed that such an approach contributed students being better able to integrate their prior knowledge, and having an improved confidence in handling scientific views in class and connecting them with history. What might this look like? Chauvet (1996) examined the topic of colour and explored lesson sequences and pedagogies used with Year 10 students and found that linking the visual and physical processes, something easily achievable when using a didactic lesson, supported with simple practical activities, that is itself set within a novel historical approach provide has the potential to be an effective way of teaching this material.
76

Therefore, a lesson was produced to incorporate the history of science into teaching of light. References Bevilacqua, F., & Bordoni, S. (1998). New contents for new media: Pavia project physics. Science & Education, 7(5),
451-469. Brush, S. G. (1989). History of science and science education. Interchange, 20(2), 60-70. Chauvet, F. (1996). Teaching colour: Designing and evaluation of a sequence. European Journal of Teacher
Education, 19(2), 121-136. Galili, I., & Hazan, A. (2000). The influence of an historically oriented course on students’ content knowledge in optics
evaluated by means of facets-schemes analysis. American Journal of Physics 68(7), S3–S15. Galili, I., & Hazan, A. (2001). The effect of a history-based course in optics on students' views about science. Science &
Education, 10(1), 7-32. Guesne, E. (1985). Light. In R. Driver., E. Guesne, & A. Tiberghien (Eds.). Children’s ideas in science. Open University. Haagen-Schützenhöfer, C. (2017). Students’ conceptions on white light and implications for teaching and learning
about colour. Physics Education, 52(4), 044003. Kolokouri, E., & Plakitsi, K. (2012). Color visions from the past in science teaching within a cultural historical activity
theory (CHAT) context. World Journal of Education, 2(3), 2-15. Matthews M. (1994). Science teaching: The role of history and philosophy of science. Routledge. Tsui, C. Y., & Treagust, D. (2010). Evaluating secondary students’ scientific reasoning in genetics using a two-tier
diagnostic instrument. International Journal of Science Education, 32(8), 1073-1098.
77
Lesson Plan Light
Using history of science to teach about light and colour
Colours and the different frequencies of light, white light and prisms (qualitative only); differential colour effects in absorption and diffuse
reflection.
Science (Physics) – KS3 (Year 8)
Research recommendation(s) and rationale
Research suggests that light can be taught effectively using a didactic approach supported with the use of practical activities that is embedded within a historical framework (e.g. Galili & Hazan, 2001, Kolokouri & Plakitsi, 2012). The core misconception that emerges from the literature is that students frequently have the misconception that colour is an intrinsic property of an object is the same way that mass is (e.g. Haagen-Schützenhöfer, 2017; Kolokouri & Plakitsi, 2012).
Lesson aim To use practical work embedded within a historical setting to teach about light and colour. It is assumed that students already know that white light is made up of a spectrum of colours. If this is not the case, it is worth visiting this idea first by using a prism to split (refract) white light into its constituent colours. This can also be done ‘in character’ as Newton used a prism to split white light into its constituents. He went on to note that once white light had been refracted into single colour beams, there was no further change of colour when it passed through a second prism. “When any one sort of Rays hath been well parted from those of other kinds, it hath afterwards obstinately retained its colour, notwithstanding my utmost endeavours to change it.”
Learning objectives For students to understand that: i. Colour is not an intrinsic property of an object. ii. An object appears the colour it does because it reflects only that colour(s) shone at it and absorbs all other colours. iii. A filter only lets certain colours pass through it and absorbs all other colours e.g. a red filter only lets red pass through it.
Intended learning outcomes At the end of the lesson, students will be able to: i. Explain why objects appear a different colour when illuminated by different coloured light.
ii. Can name the three primary colours of light. iii. Be able to explain what a light filter does.
Scientific vocabulary Intrinsic property: This is a property that an object (a thing) has of itself, independently of other things, including its context – that is it does not change, for example, if you change the temperature, or the colour light that shines on it. Primary light colours: Red, Blue, and Green. Absorb: When something is taken in by something else. Reflect: When something is not taken in by something else but is ‘bounced off’ it.
Suggested lesson sequence and activities
• Introduce scientific vocabulary as and when it arises throughout the lesson.
• Set the scene: Newton (played by the teacher and, if possible, wearing period costume to make this a memorable lesson) wants to convince some fellow scientists (the students) that objects have no intrinsic colour.
78
• Newton encourages students to suggest way that they might be convinced that a red strawberry is not intrinsically red.
• If the students do not suggest it themselves, Newton can propose they use an experiment to investigate this.
• Provide each group with ray-boxes, coloured filters, and the objects of known colour, and a worksheet to record their predict-observe-explain ideas.
• Ask students what colour the red object appears under white light – clearly red.
• Newton asks the students to use the apparatus in their groups to illuminate the red object using red light – i.e. place a red filter in front of the ray-box. Newton asks the class what colour it appears?
• Newton then asks the students to predict (we suggest the use of a worksheet table – for each group) what colour the red object will appear if they illuminate it with a blue light – i.e. place a blue filter in front of the ray-box. Why does it appear black?
• Newton explains that a red object looks red because it absorbs all non-red light and only reflects red light which is why you see it as red. Newton then explains that if you shine only blue light on a red object it will absorb all the blue light and reflect none – if no light is reflected, we see it as black and if you shine red light on it, it looks red as it reflects all red light.
• Newton asks students to now predict what colour the red object will appear (and to write this in the worksheet) if illuminated by green light. Newton then asks the groups to place a green filter in front of the ray-box. Were their predictions correct and can they explain them? Newton can now explain that as an object appears a different colour, depending on the colour of the light shone on it, the object cannot have intrinsic colour.
• With a more academically able class you might develop further the notion of the subjective nature of a colour sensation. Adopting Einstein’s famous use of ‘thought experiments’ ask students to think what colour a banana would appear in a pitch-dark room i.e. one in which there was absolutely no light – answer you could not see it. Using a model/diagram of the eye, in which no light gets into the brain (where the conscious them is) via the optic nerve, ask them to explain how they can ever see that a banana is yellow unless their brain is making the colour up inside their head? This suggests that the perception of colour is a private experience and that colours only exist in the mind of the person, not in their external world.
Key questions
What happens when you shine white light through a prism? Answer: the (white) light is refracted (split) into its different colours Why does a red dress appear red in ordinary light? Answer: white light falls on the dress. It absorbs all the colours apart from the red. Ask students if they have had the experience whilst shopping, of being advised to look at some item of clothing outside in the daylight to see what it really looks like. Why are you asked to do this? Answer: the light in the shop is artificial light which may be a slightly different colour to daylight (it is probably yellower) What happens when light passes through a blue filter? Answer: the filter absorbs all the colours apart from blue (in practice, unless it is a pure blue filter, it will probably allow some green, blue, indigo and violet through. Your eye will interpret this as ‘average blue’). Possible misconception: Students may think that a blue filter adds the blue colour to the white light. What do you predict will happen if you shine blue light onto a red dress? Answer: the red dress only reflects red light. The blue filter won’t allow red light through, so there is no red light available to reflect and the dress will therefore appear black. The teaching challenge here is to emphasise the point that filters work by subtracting colours from the incident light. A good way of helping students visualise this is to use diagrams, such as those presented in the Physics Narrative, which show the difference between the colours present in the incident light and those in the transmitted light.
79
A further point is that the light that is transmitted through a filter is always less bright (of lower intensity) than the incident light, simply because of the absorption of colours by the filter.
Assessment suggestions
Ask students to draw pictures using a range of coloured pens on white card or paper (or provide them with pre-prepared drawings). Ask them to predict what colours they will see (and which bits of the picture will be visible). Take care if you use filters that are secondary colours: Cyan filters absorb red light and transmit blue and green frequencies; Magenta filters absorb green light and transmit red and blue frequencies; Yellow filters absorb blue light and transmit green and red frequencies. Even primary filters will tend to transmit colours either side of the colour you perceive: Red filters may transmit some orange light; Blue filters will probably transmit some green, indigo and violet; Green filters may transmit some yellow and blue frequencies.
Resources H&S considerations
Power supplies, ray boxes, coloured filters, a worksheet (to record predictions observations and explanations), and a selection of coloured items e.g. a green apple, a red strawberry etc. The teacher could dress up in Newtonian style costume if available. Be aware that filters that transmit only one colour are rare. Much more common are filters that rely on how the eye sees colour. These allow a number of frequencies through, but humans cannot tell the difference. It is worth checking the filters you have in your setting to avoid introducing misconceptions. Hazards: Some care might be needed if the ray boxes become hot, and students should be told not to stare into a bright source of
light. If you use fruit tell students that they are not to eat it in a lab. Follow all your own school’s health and safety protocols and we
advise that you discuss health and safety issues with your mentor before undertaking this lesson.
80

Research Summary Photosynthesis Using conceptual change texts instruction to teach about photosynthesis Students should be taught about: (i) photosynthesis as the key process for food production and therefore biomass for life, (ii) the process of photosynthesis, and (iii) factors affecting the rate of photosynthesis. Science (Biology) – Key stage 4
Statement of issue
Students’ misconceptions about photosynthesis and plant respiration have been widely studied in the literature (see Anderson et al., 1990; Haslam & Treagust, 1987; Marmaroti & Galanopoulou, 2006; Özay & Öztas, 2003; Svandova, 2014). For example, in Haslam and Treagust’s (1987) study, the researchers found that a high percentage of secondary school students do not comprehend the nature and function of plant respiration and have little understanding of the relationship between photosynthesis and respiration in plants. Since photosynthesis is a biochemical process, it is therefore crucially important for students to study this topic, in order to understand the functioning of the ecosystem and the interaction of living and non-living things (Lin & Hu, 2003).
Main findings from the research
In broad terms, misconceptions related to concepts arise from interpretations and meanings that are not scientifically accurate (Bahar, 2003). The conceptual change approach proposes that if students are to change their ideas, they must first become dissatisfied with their existing knowledge (dissatisfaction); new concepts must provide a better explanation and be understandable (intelligible); these concepts must appear to propose solutions to problems and must be in accordance with knowledge related to other ideas and must be believable (plausible); and they must lead to new insights and have potential for new discoveries (fruitful) (Duit & Treagust, 2003; Posner et al., 1982). Conceptual change texts instruction is one of the conceptual change instructional strategies employed by a number researchers in the field of biology education to teach about photosynthesis and/or cellular respiration (Al Khawaldeh & Al Olaimat, 2010; Çakir et al., 2002; Mikkilä-Erdmann, 2001; Yenilmez & Tekkaya, 2006). Therefore, it is suggested that this instructional strategy be central to the teaching of photosynthesis and/or cellular respiration. Case study 1 Yenilmez and Tekkaya (2006) conducted a study on the effectiveness of combining conceptual change texts and discussion web strategies when working to improve 233 students’ (Year 9) understanding of photosynthesis and respiration in plants. The study was conducted over a 4-week period, with classes lasting 45 minutes per week. The classes used a conceptual change text accompanied by a discussion web. Conceptual change texts were given to students for the following topics: plants’ food, the role of soil and the leaf in photosynthesis, and respiration in plants. Graphic discussion web aids were given to students and they were required to choose a position – to agree or disagree – and to offer their reasons for their positions, supported by evidence from the texts. The findings from the study indicated that the students performed better on a post-intervention test and demonstrated a positive change in their understanding of photosynthesis and respiration in plant concepts. Students were involved in activities that helped them to revise their prior knowledge and to address their misconceptions. The use of discussion webs as a form of social interaction helped students to share their ideas and to ponder them in greater detail. However, the instruction requires enough time to identify and express students’ conceptions, examine the soundness and utility of their existing ideas and apply new ideas in a context familiar to them. Case study 2 Çakir et al. (2002) investigated the effect of conceptual change text-oriented instruction on 84 students’ (Year 12) understanding of cellular respiration concepts and their attitudes toward biology as a school subject. The study was conducted over a 4-week period, with each class lasting 40 minutes per week. The students first read conceptual
81
change texts prepared by the researchers, which were obtained from the literature. These texts explored the following topics: anaerobic respiration, glycolysis, and aerobic respiration. The teacher then asked the students questions about the texts and a significantly correct explanation of the concept was thoroughly discussed. The study reported that the conceptual change text-oriented instruction led to a significantly better acquisition of scientific knowledge than traditional instruction, as well as the elimination of alternative conceptions. On the one hand, text-oriented instruction dealt with students’ misconceptions, whereas traditional instruction did not, as it constructed an alternative schema to replace the students’ misconceptions. On the other hand, the study found that no significant difference existed between post-attitude mean scores of the students taught with the conceptual change text-oriented instruction method, and those taught using traditional instruction methods, as both groups of students were involved in the study of textual information. Case study 3 Al Khawaldeh and Al Olaimat’s (2010) study explored the effect of conceptual change texts, followed by a concept mapping instruction exercise, with the aim of improving 70 students’ (Year 12) understanding of cellular respiration concepts. The study was undertaken over 3 weeks, with each class lasting 45 minutes a week. Students were given conceptual change texts, according to the following topics: anaerobic respiration, glycolysis, and aerobic respiration. In each text, the topics were introduced with questions, and the possible scientifically accepted answers were not mentioned directly. Students were also given examples and figures in relation to the texts. Students were then required to construct their own concept maps to show the interrelationships between cellular respiration concepts. The results of the study showed that the conceptual change approach, accompanied by concept mapping instruction, led to a significantly better acquisition of scientific understanding of cellular respiration concepts than traditional instruction. The greater success of students can be explained as follows: students were involved in activities that helped them revise their prior knowledge and to challenge their misconceptions. After the implementation of the conceptual change text, students prepared their own concept maps on related concepts. This allowed students to externalise all the relationships formed in their cognitive structure and to learn about cellular respiration in a meaningful way. Case study 4 In another study, Mikkilä-Erdmann (2001) examined the effect of text design on 209 primary school pupils’ (Year 6) comprehension of photosynthesis. The conceptual change text design adopted the critical difference in the production of energy to produce a cognitive conflict with the pupil’s misconceptions. The pupils were instructed to read the text and answer comprehension questions as they normally do when working on their assignments. They were told that the target of the learning was not to memorise information, but rather to understand it. It took approximately one hour for pupils to read the text and to undertake the assignments. The findings of this study demonstrated that the conceptual change text design used helped the pupils to go through the conceptual change concerning photosynthesis. The study suggested that the possibility of designing a scientific text to promote conceptual change does not required a lot of resources - e.g. - time and teacher-pupil interaction. This marks it out from other interventions. It is therefore possible to produce a significant change in pupils’ understanding of one important concept in science with a relatively easy and economical investment in the design of a conceptual change text design. Even with low levels of prior knowledge, pupils seem to profit from a conceptual change text design.
Therefore, a lesson plan was produced to incorporate conceptual change texts instruction into the teaching of photosynthesis. References Al Khawaldeh, S. A., & Al Olaimat, A. M. (2010). The contribution of conceptual change texts accompanied by concept
mapping to eleventh-grade students understanding of cellular respiration concepts. Journal of Science Education and Technology, 19(2), 115-125.
Anderson, C. W., Sheldon, T. H., & Dubay, J. (1990). The effects of instruction on college non-majors’ conceptions of respiration and photosynthesis. Journal of Research in Science Teaching, 27(8), 761–776.
82
Bahar, M. (2003). Misconceptions in biology education and conceptual change strategies. Educational Sciences: Theory & Practice, 3(1), 55-64.
Çakir, Ö. S., Geban, Ö., & Yürük, N. (2002). Effectiveness of conceptual change text-oriented instruction on students’ understanding of cellular respiration concepts. Biochemistry and Molecular Biology Education, 30(4), 239-243.
Duit, R., & Treagust, D. F. (2003). Conceptual change: A powerful framework for improving science teaching and learning. International Journal of Science Education, 25(6), 671-688.
Haslam, F., & Treagust, D. F. (1987). Diagnosing secondary students’ misconceptions of photosynthesis and respiration in plants using a two-tier multiple-choice instrument. Journal of Biological Education, 21(3), 203-211.
Lin, C. Y., & Hu, R. (2003). Students’ understanding of energy flow and matter cycling in the context of the food chain, photosynthesis, and respiration. International Journal of Science Education, 25(12), 1529-1544.
Marmaroti, P., & Galanopoulou, D. (2006). Pupils’ understanding of photosynthesis: A questionnaire for the simultaneous assessment of all aspects. International Journal of Science Education, 28(4), 383–403.
Mikkilä-Erdmann, M. (2001). Improving conceptual change concerning photosynthesis through text design. Learning and Instruction, 11(3), 241-257.
Özay, E., & Öztas, H. (2003). Secondary students’ interpretations of photosynthesis and plant nutrition. Journal of Biological Education, 37(2), 68–70.
Posner, M.G., Strike, K. A., Hewson, P. W., & Gertzog, W. A. (1982). Accommodation of scientific conception: Toward a theory of conceptual change. Science Education, 66(2), 211–227.
Svandova, K. (2014). Secondary school students’ misconceptions about photosynthesis and plant respiration: Preliminary results. Eurasia Journal of Mathematics, Science and Technology Education, 10(1), 59-67.
Yenilmez, A., & Tekkaya, C. (2006). Enhancing students’ understanding of photosynthesis and respiration in plant through conceptual change approach. Journal of Science Education and Technology, 15(1), 81-87.
83

Lesson Plan Photosynthesis
Using conceptual change texts instruction to teach about photosynthesis Students should be taught about:
(i) photosynthesis as the key process for food production and therefore biomass for life (ii) the process of photosynthesis (iii) factors affecting the rate of photosynthesis.
Science (Biology) – KS4
Research recommendation(s) and rationale
The conceptual change approach proposes that if students are to change their ideas, they must first become dissatisfied with their existing knowledge (dissatisfaction); new concepts must provide a better explanation and be understandable (intelligible); these concepts must appear to propose solutions to problems and must be in accordance with knowledge related to other ideas and must be believable (plausible); and they must lead to new insights and have potential for new discoveries (fruitful) (Duit & Treagust, 2003; Posner et al., 1982). Conceptual change texts instruction is one of the conceptual change instructional strategies employed by a number of researchers in the field of biology education to teach about photosynthesis and/or cellular respiration (Al Khawaldeh & Al Olaimat, 2010; Çakir et al., 2002; Mikkilä-Erdmann, 2001; Yenilmez & Tekkaya, 2006). Therefore, it is suggested that this instructional strategy be central to the teaching of photosynthesis and/or cellular respiration.
Lesson aim To use conceptual change texts to understand the concepts of photosynthesis.
Learning objective To understand photosynthesis as the key process for production of food and factors that affect its rate.
Intended learning outcomes At the end of the lesson, pupils will be able to: i. Identify photosynthesis as the key process for food production and therefore biomass for life
ii. Describe the process of photosynthesis
iii. Explain factors affecting the rate of photosynthesis.
Scientific vocabulary Photosynthesis – the process by which a plant uses carbon dioxide from the air, water from the ground, and energy from the sun to make its own food and oxygen. Biomass – the total amount of living material in a given habitat Rate – the speed with which something happens or changes.
Suggested lesson sequence and activities
Starter – establish prior knowledge of photosynthesis, (one method would be to cover the table with all of their ideas on photosynthesis). Gain whole class feedback and create a discussion web of their knowledge including misconceptions. This will be returned to at the end of the lesson so ensure you can keep it at hand, so either, do it on a PowerPoint or use a whiteboard you will not need to rub off. Main – provide students with conceptual change texts that fulfil the following criteria:
i. Identify photosynthesis as the key process for food production and therefore biomass for life ii. Describe the process of photosynthesis
84
iii. Explain factors affecting the rate of photosynthesis.
Students are then to answer questions around the text:
1. Why is photosynthesis important? Your answer must include an equation to help explain this. 2. What is biomass? 3. Is there a relationship between biomass and photosynthesis? If yes, what is that relationship? 4. How does photosynthesis happen? Describe the process. 5. What does the term rate mean? 6. What factors affect the rate of photosynthesis? Why do they affect the rate of photosynthesis? 7. These are known as limiting factors. Why do you think they are called this?
Bring their answers together and discuss with the class the significantly correct explanations of the concepts. Once this is complete students are to complete a concept mapping instruction exercise. They can then use their concept map to help with the plenary. Plenary – use the graphic discussion web aid created in the starter for students to choose a position on the prior knowledge. So, do they now agree or disagree with the knowledge they had at the beginning of the lesson. For example, photosynthesis occurs in the dark – agree or disagree. This can be established whole class with the use of traffic light cards. Red for disagree and green for agree. Students then need to give their reasons for their position supported by evidence from their concept map/ conceptual text. Dependent on class this lesson could run to a series of lessons.
What does the science say? (correcting misconceptions)
Students’ misconceptions about photosynthesis and plant respiration have been widely studied in the literature (see Anderson et al., 1990; Haslam & Treagust, 1987; Marmaroti & Galanopoulou, 2006; Özay & Öztas, 2003; Svandova, 2014). For example, in Haslam and Treagust’s (1987) study, the researchers found that a high percentage of secondary school students do not comprehend the nature and function of plant respiration and have little understanding of the relationship between photosynthesis and respiration in plants. Since photosynthesis is a biochemical process, it is therefore crucially important for students to study this topic, in order to understand the functioning of the ecosystem and the interaction of living and non-living things (Lin & Hu, 2003).
Key questions
1. Why is photosynthesis important? Your answer must include an equation to help explain this. 2. What is biomass? 3. Is there a relationship between biomass and photosynthesis? If yes, what is that relationship? 4. How does photosynthesis happen? Describe the process. 5. What does the term rate mean? 6. What factors affect the rate of photosynthesis? Why do they affect the rate of photosynthesis?
85
7. These are known as limiting factors. Why do you think they are called this?
Assessment suggestions
• Prior knowledge assessment using cover the table and circulation of teacher. Feedback from all students and prior knowledge and misconceptions turned into a graphical web discussion for later in the lesson.
• Circulation of teacher whilst students are answering key questions based on conceptual text.
• Q and A session of the questions when discussing the correct explanations.
• Traffic light cards to be used for whole class assessment of whether the misconceptions have been eliminated when students choose their position on the graphical web discussion from the starter. Cold calling can then be used for students to justify their position. This will give the teacher the knowledge that the student truly understand their position. If the student still chooses to believe a misconception this can also be addressed by asking the students to justify their position. When this happens students usually correct themselves when they realise their explanation actually contradicts the statement they are agreeing with.
Resources H&S considerations
Create the conceptual change text, here is a link to some examples to help at the end of the paper: The role of conceptual change texts to improve students' understanding of alkenes - Chemistry Education Research and Practice (RSC Publishing) DOI:10.1039/C3RP00019B Have a template for a graphical web discussion ready for the starter, here is a link to some examples that could be adapted: Reading Educator Discussion Web - KMS Coaching (weebly.com) Make sure you are able to confidently complete the concept mapping instruction exercise: How to Use Concept Mapping in the Classroom: A Complete Guide (evidencebasedteaching.org.au) Normal classroom working environment Health and Safety apply.
86
Research Summary Structure and function of living organisms Using diagrams to teach about meiosis Students should be taught about: reproduction in humans (as an example of a mammal), including the structure and function of the male and female reproductive systems, menstrual cycle (without details of hormones), gametes, fertilisation, gestation and birth, to include the effect of maternal lifestyle on the foetus through the placenta Science (Biology) – KS3
Statement of issue
Misconceptions about cell division process are common (Kalas et al., 2013; Newman et al., 2012), for example, 54% of undergraduate biology students could not correctly draw meiosis (Dikmenli, 2010). When introducing cell division, the two topics meiosis and mitosis are typically introduced together, which can be confusing (Rodríguez Gil et al., 2019). Cell division is a challenging topic, and research shows there is additional confusion over the genetic terminology (i.e. gene, allele, chromosome) which makes it more difficult for students to differentiate between meiosis and mitosis (Pashley, 1994), particularly when these topics are taught together (Bahar et al., 1999). Briefly mitosis is used for almost all human cell division it adds new cells during development and replaces old and worn-out cells throughout a lifespan. The goal of mitosis is to produce daughter cells that are genetically identical to their mothers, with the same number of chromosomes. Meiosis is used for just one purpose – reproduction: the production of gametes (i.e. sex cells, sperm or eggs). The goal of meiosis is to make daughter cells with exactly half as many chromosomes as the starting cell.
Main findings from the research
When Finley et al. (1982) surveyed 326 secondary biology teachers they rated meiosis as one of the most challenging topics to teach. Rodríguez Gil et al. (2019) demonstrated that secondary students typically learn about meiosis from simplified diagrams on the internet, leading them to develop erroneous understanding through omission of important information. Knowledge of meiosis in genetics is important because it is fundamental for students to understand other topics such as the theory of evolution and familiar phenotypic relations (Rodríguez Gil et al., 2019). Schmidt-Weigand et al. (2010) and Schwonke et al. (2009) identified when learning about genetics that students spent longer reading the text than inspecting the diagrams. Therefore, Hung and Fung (2017) developed and tested a teaching method to improve the communication of ideas in genetics by increasing the amount of time students would spend studying diagrams. Research shows Hung and Fung (2017) examined the impact of spending more time studying diagrams on students’ knowledge. The intervention took place in an enrichment course after school, during school hours students still attended their regular lessons on cell division and genetics from their class biology teacher. Twenty-two Year 12 students in Hong-Kong volunteered to take part in the enrichment course taught by the researcher, where they received 16 hours of extra tuition. The enrichment course used a a mix of didactic instruction and a student-centred approach (same as the students’ regular lessons). The intervention focused on giving students more time with diagrams, there were 3 steps, (i) visualisation of the deconstruction of a genetic diagram, (ii) verbalisation of a genetic diagram, (iii) verbalisation of pedigree (i.e. a diagram that shows the presence or absence of a trait). For example, in the meiotic cell division class, students first watched a video about the process of mitotic cell division and were asked to describe what happened inside the cell. Students then worked in small groups (4-5 students) and watched multiple animations of the major steps of meiosis, and they were asked to re-arrange the animation into the correct sequence of events for meiosis. They then worked through a hand-out and described the animations using genetic
87
terminology. Students were also set homework and prompted to study for a test the following week. Therefore, students were given multiple opportunities to engage with static and animated diagrams. Students’ understanding was tested before the enrichment course and after. They found a statistically significant improvement in students’ understanding of meiosis. Six students were interviewed to explore their understanding, demonstrating that they understood the organisation of different Punnett squares (a diagram that allows you to work out the expected percentage of different genotypes in children of two parents) and cell division diagrams and how they are used to explain inheritance. Suggesting including more opportunities to inspect diagrams will support students learning of meiosis. However, Hung and Fung (2017) did not identify whether the effect was due to extra tuition or using diagrams, Murtonen et al. (2020) addressed this weekness indirectly by comparing two classes, one class who drew diagrams and one who did not. Murtonen et al. (2020) also tested the effect of students spending more time on diagrams of meiosis, however, with older students. Eighty-two undergraduate Biology students were split into two classes, the control class who attended traditional teaching (lectures with practical) and the experimental class who had an additional drawing task before the practical. The additional drawing task involved students drawing the major phases of meiosis and highlight given concepts (e.g. chromosome number) in the drawing—the task-focused on highlighting the differences between meiosis and mitosis; the drawings were marked and then discussed in detail as a class. The control group were also asked to draw meiosis for comparison with the experimental group at the end of the unit, however, there was no discussion or class analysis of their answers. Analysis of students’ drawings from the experimental class showed considerable progress in understanding meiosis when the drawing task was repeated in the next class, for some students progress was dramatic (e.g. unable to complete two-thirds of the drawing task, to completing all drawing tasks correctly). Comparing the experimental class to the control class, they found that students in the experimental class benefited from the additional task, outperforming the control class in the drawing task. The experimental class students also showed a statistically significant improvement in their understanding of meiosis (shown by the number of correctly drawn concepts) than the control class. Therefore, suggesting that students additional engagement with diagrams supports their development of a deep understanding of meiosis. Wynne et al. (2001) examined secondary students’ understanding of meiosis as they solved computer-generated genetic problems; part of the intervention also involved students drawing diagrams to apply their understanding of meiosis to the problems (although drawing was not central to the Wynne et al. hypothesis). Students worked in small groups (3-4 students) to solve genetic problems (e.g. autosomal-linkage) that required them to make connections between meiosis and the simple dominance model (of inheritance) through drawing diagrams, making karyotypes, and drawing Punnett squares. The genetic problems required students to recall, revise and apply their knowledge of meiosis and the simple dominance model, for example, when solving a problem about autosomal-linkage students drew a meiotic diagram to determine what gametes would be formed. Nineteen Year 10 and 11 American students took part in the elective genetics course over nine-weeks, to examine their understanding seven weeks of the classes were audiotaped. Qualitative analysis of the students’ class talk revealed that the students used their knowledge of meiosis to solve the genetic problems, this is counter to previous research that shows that students will not engage with their knowledge of meiosis to solve genetic problems (Kindfield, 1991; Tolman, 1982). Therefore, suggesting the extra engagement with drawing the process of meiosis for each problem was beneficial to students understanding as they were able to revise their understanding and apply it to problems. Students were presented with increasing complex genetic problems that challenged their current understanding, in response the students revised and corrected their understanding of meiosis. This suggests that the additional time spent working with meiosis diagrams, karyotypes and Punnett squares supported secondary students understanding of meiosis. Research suggests that more time spent inspecting, drawing, or using meiosis diagrams enables students to develop a deep understanding of meiosis (Hung & Fung, 2017; Murtonen et al., 2020; Wynne et al., 2001). Two commonalities across the research is for (i) students to work in small groups (approximately 4 students) to enable group knowledge of meiosis to develop (Hung & Fung, 2017; Wynne et al., 2001), and (ii) for students to use their knowledge of meiosis to either compare to mitosis or to solve genetic problems (Murtonen et al., 2020; Wynne et al., 2001).
Therefore, a lesson was produced to incorporate more time inspecting, drawing and applying diagrams of meiosis into teaching cell division.
88
References Bahar, M., Johnstone, A.H., & Hansell, M.H. (1999). Revisiting learning difficulties in biology. Journal of Biological
Education, 33, 84-86. Dikmenli, M. (2010). Misconceptions of cell division held by student teachers in biology: A drawing analysis. Scientific
Research and Essays, 5(2), 235-247. Finley, F., Stewart, J., & Yarroch, W. (1982). Teachers’ perceptions of important and difficult science content. Science
Education, 66(4), 531-538. Hung, V., & Fung, D. (2017). The effectiveness of hybrid dynamic visualisation in learning genetics in a Hong Kong
secondary school. Research in Science & Technological Education, 35(3), 308-329. Kalas, P., O’Neill, A., Pollock, C., & Birol, G. (2013). Development of a meiosis concept inventory. CBE—Life Sciences
Education, 12(4), 655-664. Kindfield, A. C. H. (1991). Confusing chromosome number and structure: A common student error. Journal of Biological
Education, 25(3), 193-200. Murtonen, M., Nokkala, C., & Södervik, I. (2020). Challenges in understanding meiosis: Fostering metaconceptual
awareness among university biology students. Journal of Biological Education, 54(1), 3-16. Newman, D. L., Catavero, C. M., & Wright, L. K. (2012). Students fail to transfer knowledge of chromosome structure
to topics pertaining to cell division. CBE—Life Sciences Education, 11(4), 425-436. Pashley, M. (1994). A chromosome model. Journal of Biological Education, 28(3), 157-161. Rodríguez Gil, S. G., Fradkin, M., & Castañeda-Sortibrán, A. N. (2019). Conceptions of meiosis: Misunderstandings
among university students and errors. Journal of Biological Education, 53(2), 191-204. Schmidt-Weigand, F., Kohnert, A., & Glowalla, U. (2010). A closer look at split visual attention in system-and self-paced
instruction in multimedia learning. Learning and Instruction, 20(2), 100-110. Schwonke, R., Berthold, K., & Renkl, A. (2009). How multiple external representations are used and how they can be
made more useful. Applied Cognitive Psychology, 23(9), 1227-1243. Tolman, R. R. (1982). Difficulties in genetics problem solving. American biology teacher, 44(9), 525-27. Wynne, C. F., Stewart, J., & Passmore, C. (2001). High school students' use of meiosis when solving genetics
problems. International Journal of Science Education, 23(5), 501-515.
89
Lesson Plan Meiosis Using diagrams to teach about meiosis Students should be taught: To explain the role of meiotic cell division, including the production of four daughter cells, each with half the number of chromosomes, and that this results in the formation of genetically different haploid gametes. The stages of meiosis are not required Science (Biology) – KS4
Research recommendation(s) and rationale
When Finley et al. (1982) surveyed 326 secondary biology teachers they rated meiosis as one of the most challenging topics to teach. Rodríguez Gil et al. (2019) demonstrated that secondary students typically learn about meiosis from simplified diagrams on the internet, leading them to develop erroneous understanding through omission of important information. Knowledge of meiosis in genetics is important because it is fundamental for students to understand other topics such as the theory of evolution and familiar phenotypic relations (Rodríguez Gil et al., 2019). Schmidt-Weigand et al. (2010) and Schwonke et al. (2009) identified when learning about genetics that students spent longer reading the text than inspecting the diagrams. Therefore, Hung and Fung (2017) developed and tested a teaching method to improve the communication of ideas in genetics by increasing the amount of time students would spend studying diagrams.
Research suggests that more time spent inspecting, drawing, or using meiosis diagrams enables students to develop a deep understanding of meiosis (Hung & Fung, 2017; Murtonen et al., 2020; Wynne et al., 2001). Two commonalities across the research is for (i) students to work in small groups (approximately 4 students) to enable group knowledge of meiosis to develop (Hung & Fung, 2017; Wynne et al., 2001), and (ii) for students to use their knowledge of meiosis to either compare to mitosis or to solve genetic problems (Murtonen et al., 2020; Wynne et al., 2001).
Lesson aim To use diagrams to develop an understanding of meiosis.
Learning objective To understand the process of meiosis linking this to the formation of gametes and simple genetic dominance theory.
Intended learning outcomes At the end of the lesson, pupils will be able to: i. Draw and describe the process of meiosis.
ii. Compare the process to mitosis (prior learning) iii. Use the process of meiosis to solve genetic problems.
Scientific vocabulary Meiosis - special type of cell division that happens in two stages and produces four cells, each with half the number of chromosomes of the original cell, for the purpose of sexual reproduction Mitosis - the usual process by which cells divide, producing two cells each with the same number of chromosomes as the original cell
90
Dominant - dominant gene causes a person to have a particular physical characteristic, for example brown eyes, even if only one of their parents has passed on this gene
Recessive - a recessive physical characteristic only appears in a child if it has two genes for this characteristic, one from each parent
Chromosome - The structure made of DNA that codes for all the characteristics of an organism.
Genetic - To do with inheritance because of genes
Diploid - A cell that contains two sets of chromosomes.
Haploid - sex cell (gamete) that contains one set of chromosomes.
Genotype - The two alleles inherited for a particular gene.
Phenotype - The visible characteristics of an organism which occur as a result of its genes.
Gametes - Sex cell (sperm in males and ova/eggs in females).
Fertilisation - The joining of a male and female gamete.
Suggested lesson sequence and activities
Starter – Retrieval practice of prior learning. 1. What are gametes?2. What is fertilisation?3. Why are gametes important?
Self/ peer-assess the answers. Main
Watch a video of meiotic cell division. Watch it once straight through asking students to focus on the diagrams. Re-watch the video and at each stage stop the video and ask the students to describe what is happening at each stage. The video in the resources list is best used from 3.45-7.03 minutes for this process. The students can think, pair, share the description of each cell to give confidence in this process. Circulate once they are sharing.
Go through the animation of meiosis describing each stage again but this time they can write it down. Peer or self-assess their answers. Students can at this point amend their answers to use the correct terminology also using the model answers from the board.
91
Next give the students handouts of pictures of meiosis in the wrong order with no written information and ask them to arrange them into the correct order. They can do this without any help or they can use their own written descriptions from the previous task to put them in the correct order. Peer or self-assess their answers.
Students should now be able to compare meiosis to mitosis using a Venn diagram. The video in the resources section could be watched to go through the answers or the teacher could do it on the board. The teacher could draw the Venn diagram on the board as the video plays. Self/ peer-assess. This can only be completed if mitosis has already been covered by students in lessons.
Using their understanding of meiosis and the production of gametes students can now relate this to simple dominance theory. To do this they can draw the stages of meiosis where alleles have been separated. Simple dominance could be used here so as not to confuse, for example the ability to tongue roll, whether someone has an unattached ear lobe or the disease Huntington’s. See the link to the example of this with Mendel’s pea plants for clarification. This example where there are two different phenotypes (height and colour) could also be used as a more challenging example. An example could be modelled on the board first depending on how much scaffolding is needed for the students.
Once they have solved the genetic problems using meiosis being drawn out they can simplify their diagrams and produced punnet squares with lettering. An example should be modelled first. They can then calculate the percentage chances of different genotypes.
Teacher assessed through circulation.
Plenary – with no resources, just a blank piece of paper students are to draw the stages of meiosis. This can then be teacher assessed. It could also be done on mini whiteboards and held up.
What does the science say? (correcting misconceptions)
Misconceptions about cell division process are common (Kalas et al., 2013; Newman et al., 2012), for example, 54% of undergraduate biology students could not correctly draw meiosis (Dikmenli, 2010). When introducing cell division, the two topics meiosis and mitosis are typically introduced together, which can be confusing (Rodríguez Gil et al., 2019). Cell division is a challenging topic, and research shows there is additional confusion over the genetic terminology (i.e. gene, allele, chromosome) which makes it more difficult for students to differentiate between meiosis and mitosis (Pashley, 1994), particularly when these topics are taught together (Bahar et al., 1999).
Key questions 1. What are gametes?2. What is fertilisation?3. Why are gametes important?
Assessment suggestions • Retrieval practice of priory learning. Peer/ self-assessed using questioning of class and teacher model answers.
• Circulation of teacher whilst students are completing the think/ pair/ share.
92
• Descriptions shared with questioning and peer/self-assessed. You could complete further assessment here using traffic light cards.Do the other students agree with the description – yes green, not sure amber, no red. The teacher can then ask why studentsdisagree or are unsure eliminating misconceptions and building on the description given. Students are to amend their descriptionsto model answers.
• Rearrangement of the meiosis pictures – peer/self-assessed with model answer on the board.
• Venn diagram of mitosis and meiosis peer/ self-assessed using model answer from video and on the board.
• Solving of genetic problems – teacher assessed through circulation, students will reach very different points.
• Drawing of meiosis – teacher assessed inside class time or outside of classroom ready for feedback the following lesson.
Resources
H&S considerations
Video of meiosis: https://www.youtube.com/watch?v=VzDMG7ke69g
Animation of meiosis: https://www.cellsalive.com/meiosis_js.htm
Comparison of meiosis/ mitosis: https://www.youtube.com/watch?v=zrKdz93WlVk
Medels genetic diagram using meiosis: https://ib.bioninja.com.au/higher-level/topic-10-genetics-and-evolu/101-meiosis/mendel-and-meiosis.html
Normal classroom working environment Health and Safety apply.
93
Research Summary
Ecosystem Using metaphors to teach about energy transfer in the ecosystem Students should be taught how materials cycle through abiotic and biotic components of ecosystems. Science (Biology) – KS4
Statement of issue
Whilst energy is a unifying concept across biology, chemistry, and physics differences might exist between a physicist’s notion of energy in a system and that of a biologist (Hartley et al., 2012; Opitz et al., 2017). Energy is introduced in biology when learning about ecosystems (Nordine, 2016) and, in particular, energy flow can be a challenging topic for students (Sadler et al., 2013) and result in a number of misconceptions (Burger, 2001). Lancor (2014) suggested that misconceptions around energy flow were driven by students’ difficulty in distinguishing between matter and energy in biological systems. This misunderstanding can lead students to believe that energy can be recycled (e.g. by decomposers) and reused (e.g. by plants in an ecosystem when this is not the case (Burger, 2001; Lancor, 2014).
From a biological perspective, energy can be transformed from one form to another and transferred from one place to another. From a biological perspective, energy cannot be conserved (Reece et al., 2011). If these notions are applied to an ecosystem, where energy flow and the carbon and nitrogen cycles are the central processes, then, energy is dissipated as thermal energy, which cannot be retained as it is no longer available biologically. Therefore, the difficulty students have distinguishing between energy and matter leads to difficulties distinguishing between energy and matter within the ecosystem (Burger, 2001; Lancor, 2014).
Main findings from the research
Energy transfer in ecosystems is an abstract and challenging topic for learners. Metaphors are widely used in scientific and educational contexts to communicate ideas about abstract phenomena. However, whilst metaphors are considered to be valuable teaching tools, they can be ambiguous and misleading when used in educational contexts. However, little is known about the way students deal with metaphors relating to specific scientific content.
Metaphors in science education A metaphor is a word (or phrase) that can be understood beyond its literal meaning. For example, the ‘guardianship’ metaphor where the Earth is compared to a household in which humans hold the position of a guardian whose responsibility is to look after that household. Metaphors can be useful as they influence our perspective on the World.
Metaphors can be a valuable teaching tool, as they help students to visualise an abstract phenomenon such as energy (Duit, 1991). Consideration of the conceptual metaphor theory can be useful when teaching science (Lakoff & Johnson, 1980) because it suggests that metaphors help students to build image schemata as a way to categorise, or organise, their thinking. In the topic of energy transfer, this could be a diagram of a path or cycle (Wernecke et al., 2018a). These image schemata are useful as they can support students’ thinking about more abstract scientific concepts such as energy flow and the carbon and nitrogen cycles (Niebert & Gropengiesser, 2015).
What the research shows In an exploratory study, Wernecke et al. (2018a) examined whether or not students could understand and apply the metaphors commonly presented in textbooks to describe energy transfer through an ecosystem. Two of the metaphors they used were energy flow and the notion of a one-way street. The teachers provided a short lesson on
94

energy transfer in an ecosystem and delivered this to 50 Year 9 German students. Slides were read by students and they were then asked to illustrate their understanding by completing an energy flow diagram through a forest ecosystem. The study found that the students were not confident in their understanding and use of metaphors (or did not use them as intended).
In recognition of this, a follow-up study was carried out with 304 Year 9 students using the metaphor of an energy flow diagram (i.e. a food web) (Wernecke et al., 2018b). This time, the effect of inserting errors into the flow diagram (for e.g. indicating that energy could be recycled - a common misconception) was tested. The decision to include deliberate errors was based on studies that suggested that students were shown to benefit more from learning resources that included deliberate errors (Große & Renkl, 2007; Heemsoth & Heinze, 2014) but these also emphasised that good levels of prior knowledge were needed. To take account of this, the students were grouped and specifically taught about the relevant image-based metaphors - meanings were explored and discussed. The following resources were then provided to the groups: Group 1 – a diagram with deliberate errors without the errors highlighted; Group 2 – a diagram with deliberate errors with the errors highlighted; Group 3 – a diagram with no errors. The Werenecke et al. (2018b) study found that the students provided with diagrams that contained deliberate errors gained statistically significantly more in terms of conceptual knowledge acquisition than those who had been presented with a correct energy flow diagram. It should be noted that the Group 1 activity (no highlighting of the errors) was found to be more difficult for students with lower levels of prior knowledge and understanding about the relevance of the metaphors. For Group 2 students, being provided with a highlighted deliberate errors diagram resulted in statistically significantly greater acquisition of conceptual knowledge than either Group 1 or Group 3 students.
Therefore, the research suggests that there some important considerations when including metaphors in science lessons:
1. It is important to clarify the underlying meaning of metaphors if they are not self-explanatory becausestudents may have limited direct experience of energy as an abstract concept. For example, what does aone-way street mean in real-life and how can this help to explain energy flow? This prior knowledge isimportant.
2. Providing students with representations of image-based metaphors (diagrams) that include highlighted,deliberate errors can lead to greater gains in conceptual knowledge and understanding.
Therefore, a lesson was produced that incorporated specific reference to and discussion of image-based metaphors (diagrams depicting energy flow and other common metaphors) together with the inclusion of deliberate errors into the diagrammatic metaphors for energy flow through ecosystems.
References Burger, J. (2001). Student conceptions on energy in biological contexts—assessment, analyses and conclusions.
[Doctoral dissertation, University of Bielefeld]. Cachelin, A., Norvell, R., & Darling, A. (2010). Language fouls in teaching ecology: Why traditional metaphors
undermine conservation literacy. Conservation Biology, 24(3), 669-674. Duit, R. (1991). On the role of analogies and metaphors in learning science. Science Education, 75(6), 649–672. Große, C. S., & Renkl, A. (2007). Finding and fixing errors in worked examples: Can this foster learning outcomes?
Learning and Instruction, 17(6), 612–634. Hartley, L. M., Momsen, J., Maskiewicz, A., & D’Avanzo, C. (2012). Energy and matter: Differences in discourse in
physical and biological sciences can be confusing for introductory biology students. Bioscience 62(5), 488–496. Heemsoth, T., & Heinze, A. (2014). The impact of incorrect examples on learning fractions: A field experiment with 6th
grade students. Instructional Science, 42(4), 639–657. Lakoff, G., & Johnson, M. (1980). Metaphors we live by. University of Chicago Press. Lancor, R. (2014). Using metaphor theory to examine conceptions of energy in biology, chemistry, and physics. Science
& Education, 23(6), 1245-1267. Niebert, K., & Gropengiesser, H. (2015). Understanding starts in the Mesocosm: Conceptual metaphor as a framework
for external representations in science teaching. International Journal of Science Education, 37(5-6), 903-933.
95

Nordine, J. (Ed.). (2016). Teaching energy across the sciences, K-12. NSTA Press, National Science Teachers Association. Opitz, S. T., Neumann, K., Bernholt, S., & Harms, U. (2017). How do students understand energy in biology, chemistry,
and physics? Development and validation of an assessment instrument. Eurasia Journal of Mathematics, Science and Technology Education, 13(7), 3019-3042.
Reece, J., Enroth, J., & Rikkinen, J. (2011). Campbell biology, global edition (9th ed.). Pearson Education Ltd. Sadler, P. M., Coyle, H., Smith, N. C., Miller, J., Mintzes, J., Tanner, K., & Murray, J. (2013). Assessing the life science
knowledge of students and teachers represented by the K–8 national science standards. CBE—Life Sciences Education, 12, 553–575.
Wernecke, U., Schwanewedel, J., & Harms, U. (2018a). Metaphors describing energy transfer through ecosystems: Helpful or misleading? Science Education, 102(1), 178-194.
Wernecke, U., Schütte, K., Schwanewedel, J., & Harms, U. (2018b). Enhancing conceptual knowledge of energy in biology with incorrect representations. CBE—Life Sciences Education, 17(1), 1-11.
96
Lesson Plan
Energy Transfers in Ecosystems Using metaphors to teach about energy transfer in the ecosystem Students should be taught how materials cycle through abiotic and biotic components of ecosystems. Science (Biology) – KS4
Research recommendation(s) and rationale
Whilst energy is a unifying concept across biology, chemistry, and physics differences might exist between a physicist’s notion of energy in a system and that of a biologist (Hartley et al., 2012; Opitz et al., 2017). Energy is introduced in biology when learning about ecosystems (Nordine, 2016) and, in particular, energy flow can be a challenging topic for students (Sadler et al., 2013) and result in a number of misconceptions (Burger, 2001). Lancor (2014) suggested that misconceptions around energy flow were driven by students’ difficulty in distinguishing between matter and energy in biological systems. This misunderstanding can lead students to believe that energy can be recycled (e.g. by decomposers) and reused (e.g. by plants in an ecosystem when this is not the case (Burger, 2001; Lancor, 2014). From a biological perspective, energy can be transformed from one form to another and transferred from one place to another. From a biological perspective, energy cannot be conserved (Reece et al., 2011). If these notions are applied to an ecosystem, where energy flow and the carbon and nitrogen cycles are the central processes, then, energy is dissipated as thermal energy, which cannot be retained as it is no longer available biologically. Therefore, the difficulty students have distinguishing between energy and matter leads to difficulties distinguishing between energy and matter within the ecosystem (Burger, 2001; Lancor, 2014).
Lesson aim To use metaphors to teach about energy transfer in the ecosystem.
Learning objective To understand how to use metaphors to explain how materials cycle through abiotic and biotic ecosystems.
Intended learning outcomes At the end of the lesson, students will be able to: i. Define the term metaphor.
ii. Describe how metaphors can be used in relation to energy transfer in an ecosystem.
iii. Identify mistakes in ecosystem diagrams and justify why they are mistakes.
Scientific vocabulary
Suggested lesson sequence and activities
Starter – Define the term metaphor using examples. Give the students examples of metaphors related to the everyday world. Ask students on post-it notes to come up with a definition of a metaphor and stick this on the board at the front of the class. Collaborate all of the student’s answers to come up with a class definition of the term metaphor. Compare this to the dictionary definition and then students can
Ecosystem - The living organisms in a particular area, together with the non-living components of the environment. Energy - The capacity of a system to do work or the quantity required for mechanical work to take place. Measured in joules (J). For example, a man transfers 100 J of energy when moving a wheelbarrow.Abiotic - Non-living elements of an ecosystem, such as climate, temperature, water, and soil type. Biotic – living elements of an ecosystem, for example predation.
97
critically assess whether the class answer is good enough in class-based discussion. Once this has been determined, they can write the meaning of the term metaphor in their books. To ensure understanding the teacher can then put a series of metaphors and non-metaphors on the board. Students need to identify which is the metaphor and which is not. This can be done using traffic light cards (red- not a metaphor, green – a metaphor) then you can cold call on students to justify their position.
Main – provide students with pictures of everyday examples of the two metaphors commonly used in textbooks in regard to ecosystems. The metaphors are energy flow and one-way street. Give students an example of an energy flow diagram such as a food chain or food web depending on the level of the students. Ask them to describe how the metaphors can be used in relation to the energy flow diagram. This can be increased in difficulty by applying it to a more difficult concept, for example the carbon cycle or nitrogen cycle.
Bring students together in small groups to discuss their answers and volunteer a spokesperson from each group to feed back in the class discussion. At this point, the teacher will have an understanding of their progress and whether they can move forward.
Plenary – provide students with representations of image-based metaphors (diagrams) that include highlighted, deliberate errors. For example, the misconception that energy can be recycled. Students are to identify the errors and justify why they are incorrect. They can do this as a written task and peer or self-assess when the teacher goes through the answers as a class discussion.
What does the science say? (correcting misconceptions)
Therefore, the research suggests that there are some important considerations when including metaphors in science lessons: 1. It is important to clarify the underlying meaning of metaphors if they are not self-explanatory. Students may have limited direct
experience of energy as an abstract concept. For example, what does a one-way street mean in real-life and how can this helpexplain energy flow? This prior knowledge is important.
2. Providing students with representations of image-based metaphors (diagrams) that include highlighted, deliberate errors can leadto greater gains in conceptual knowledge and understanding.
Key questions 1. What is a metaphor?2. What does a one-way street mean in real-life and how can this help explain energy flow?
3. How do the metaphors energy flow and one-way street apply to ecosystems?4. Why is the highlighted part of the image-based metaphors (diagram) an error?
Assessment suggestions • Prior knowledge assessment using post-it notes. Further assessment of progress using traffic light cards to identify whether they think the phrase on the board is a metaphor or not (red for no, green- for yes). The students can then be cold-called upon to justify their position.
• Circulation of teacher whilst students are discussing metaphors linked to energy flow diagrams. Followed by feedback in small groups then feedback to whole class via spokesperson for whole group.
• Q & A session when discussing the correct explanations.
98
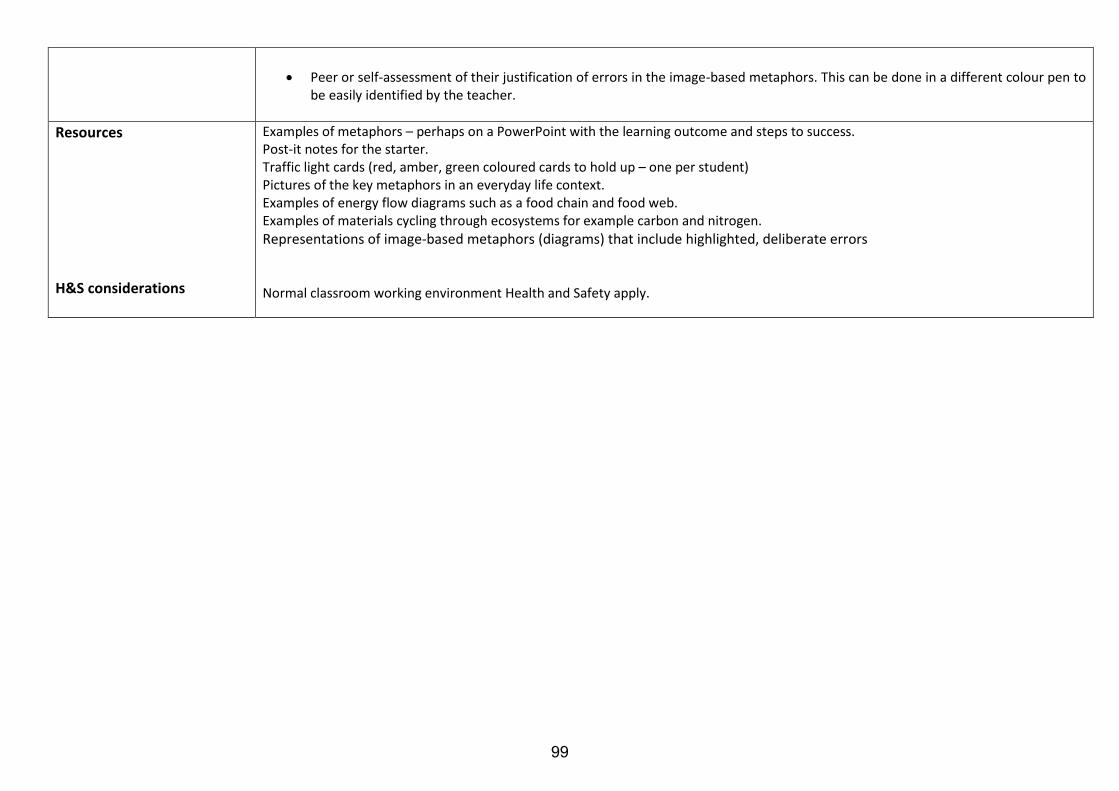
• Peer or self-assessment of their justification of errors in the image-based metaphors. This can be done in a different colour pen tobe easily identified by the teacher.
Resources
H&S considerations
Examples of metaphors – perhaps on a PowerPoint with the learning outcome and steps to success. Post-it notes for the starter. Traffic light cards (red, amber, green coloured cards to hold up – one per student) Pictures of the key metaphors in an everyday life context. Examples of energy flow diagrams such as a food chain and food web. Examples of materials cycling through ecosystems for example carbon and nitrogen.
Representations of image-based metaphors (diagrams) that include highlighted, deliberate errors
Normal classroom working environment Health and Safety apply.
99
Research Summary
Rate and extent of chemical change Using modelling-based teaching to teach about chemical equilibrium Students should be taught about: factors affecting reversible reactions. Science (Chemistry) – Key stage 4
Statement of issue
Scientists explain chemical equilibrium using a thermodynamic approach, according to which, dStotal = dSsyst + dSsurr ≥ 0, where Ssyst is the entropy of the system and Ssurr is the entropy of the surroundings (Solomonov & Mukhametzyanov, 2016). However, this approach is complex and counter-intuitive, particularly for those who do not understand the entropy concept, as well as the mathematical tools involved (Maia & Justi, 2009). Research has indicated that conceptual problems arise when students, who have been introduced to chemical reactions through examples that evidently go to completion first, meet examples of incomplete reactions (Chiu et al., 2002; Piquette & Heikkinen, 2005). Maia and Justi (2009) have also identified that students’ misconceptions originate mainly from a failure to recognise and teach chemical equilibrium as a process, as also highlighted in the outcomes of a study of chemical equilibrium teaching (see Piquette & Heikkinen, 2005). As a result, it is difficult for students to understand chemical equilibrium as a phenomenon, as well as its related processes.
Main findings from the research
What is modelling in science? A model may be defined as a simplified representation of an object, event, process, or idea produced for the specific purpose of providing an explanation of that entity (Gobert & Buckley, 2000). Modelling is a dynamic and continuous process of creating, testing, and communicating models. It is a core skill in scientific enquiry, especially in the field of chemistry, in which the explanations offered are essentially abstract. Modelling and the use of models enable scientists to visualise entities and processes, to think about related questions (Maia & Justi, 2009). Researchers emphasise the importance of modelling-based teaching and learning to promote scientific literacy, as well as an understanding of the nature of and processes by which scientific knowledge is developed (Boulter & Gilbert, 2000; Erduran, 2001).
Main findings of previous research Science teaching should promote the acquisition of knowledge and development of skills that meaningfully contributes to students’ general education (Millar & Osborne, 1998). In particular, science knowledge should go beyond the rote memorisation of facts, equations, and procedures (Maia & Justi, 2009). Research has emphasised that science teaching should value learning about how, rather than learning about what, because the skills involved in integrating and using knowledge in problem situations require the selection of relevant information, a comprehensive understanding of adequate processes, and the awareness of how and when specific knowledge should be applied (Darling-Hammond et al., 2020). Modelling-based teaching is one of the approaches used to facilitate students’ understanding of the nature and processes by which scientific knowledge is developed (Maia & Justi, 2009).
In a previous study, conducted in a regular chemistry classroom of 26 students (14–15 years old) from a public school in a big city from the Southeast of Brazil (see Maia & Justi, 2009), a modelling-based teaching approach was applied to teach about chemical equilibrium, following the ‘Model of Modelling’ diagram proposed by Justi and Gilbert (2002). The study aimed to improve students’ understanding of how the equilibrium process occurs, thus making it easier for students to visualise it (Maia & Justi, 2009). This process is something unlikely to occur either from a simple observation of a system in equilibrium or from the manipulation of chemical formulas.
Maia and Justi (2009) offer strong evidence that modelling-based teaching can promote successful learning about chemical equilibrium, as well as the development of students’ visualisation and representation skills. They found that modelling-based teaching, drawn from the ‘Model of Modelling’ diagram, can offer a powerful approach for
100
authentic, comprehensive, and meaningful science learning. Modelling-based teaching is an approach that can provide students with opportunities to learn about scientific content, how it is produced and used, and to develop skills related to the knowledge construction process (Ferreira & Justi, 2008; Maia & Justi, 2009).
In another study, Chiu et al. (2002) examined Grade 10 (Year 11) students’ mental models of chemical equilibrium using dynamic science assessments in a cognitive apprenticeship context, including coaching, modelling, scaffolding, articulation, reflection, and exploration. The findings indicated that the students in the intervention group were capable of constructing mental models of chemical equilibrium, including the dynamic and random activities of molecules and interactions between molecules in the microworld, whereas the students in the control group failed to construct correct mental models of chemical equilibrium.
A further study described the multiple analogical models (a type of mental models) used to teach students about chemical equilibrium (Harrison & De Jong, 2005). The study used key analogical models, namely: the “school dance”, the “sugar in a teacup”, the “pot of curry”, and the “busy highway”. The findings indicated that most students learned that equilibrium reactions are dynamic, occur in closed systems, and have balanced forward and reverse reactions. The students reported that they enjoyed the teaching and built variable mental models of equilibrium. The researchers identified that teachers always show where the analogy breaks down and carefully negotiate the conceptual outcomes.
In an earlier study, Thiele and Treagust (1994) investigated the use of balls and dance analogy in modelling-based teaching approach to teach about chemical equilibrium. The study reported how teachers’ analogies of increasing student activity led to an increase in the number of body collisions, which likely increased particle kinetic energy, and reaction rates. The teachers also used the analogy of people moving in and out of a shop to represent the rates of forward and reverse reactions. The study found that the teachers appeared able to ascertain that the students required an alternative representation without overtly seeking evidence to this effect. The presented analogies also appeared to have a motivational effect on the students.
In short, mental models were chosen as this approach expected to support students’ understanding, reasoning, and prediction in the situations in which they are involved, from logical reasoning in everyday situations to solving complex problems in knowledge-rich domains (Gentner, 2002).
Therefore, in this research, a lesson was produced using a modelling-based teaching approach to teach about chemical equilibrium.
References
Boulter, C. J., & Gilbert, J. K. (2000). Challenges and opportunities of developing models in science education. In J. K. Gilbert & C. J. Boulter (Eds.), Developing models in science education (pp. 343–362). Kluwer.
Chiu, M. H., Chou, C. C., & Liu, C. J. (2002). Dynamic processes of conceptual change: Analysis of constructing mental models of chemical equilibrium. Journal of Research in Science Teaching, 39(8), 688-712.
Darling-Hammond, L., Flook, L., Cook-Harvey, C., Barron, B., & Osher, D. (2020). Implications for educational practice of the science of learning and development. Applied Developmental Science, 24(2), 97-140.
Erduran, S. (2001). Philosophy of chemistry: An emerging field with implications for chemistry education. Science & Education, 10, 581–593.
Ferreira, P. F. M., & Justi, R. (2008). Um modelo para ‘fazer ciência’ [A model for ‘doing science’]. Química Nova na Escola, 28, 32–36.
Gentner, D. (2002). Psychology of mental models. In N. J. Smelser & P. B. Bates (Eds.), International Encyclopedia of the Social and Behavioral Sciences (pp. 9683–9687). Elsevier Science.
Gobert, J. D., & Buckley, B. C. (2000). Introduction to model-based teaching and learning in science education. International Journal of Science Education, 22(9), 891-894.
Harrison, A. G., & De Jong, O. (2005). Exploring the use of multiple analogical models when teaching and learning chemical equilibrium. Journal of Research in Science Teaching, 42(10), 1135-1159.
Justi, R., & Gilbert, J. (2006). The role of analog models in the understanding of the nature of models in Chemistry. In P. Aubusson, A. Harrison, & S. Ritchie (Eds.), Metaphor and analogy in science education (pp. 119-130). Springer.
101

Maia, P. F., & Justi, R. (2009). Learning of chemical equilibrium through modelling‐based teaching. International Journal of Science Education, 31(5), 603-630.
McClary, L., & Talanquer, V. (2011). College chemistry students’ mental models of acids and acid strength. Journal of Research in Science Teaching, 48(4), 396-413.
Millar, R. and Osborne, J. (1998). Beyond 2000: Science education for the future. King’s College London. Piquette, J. S., & Heikkinen, H. W. (2005). Strategies reported used by instructors to address student alternate
conceptions in chemical equilibrium. Journal of Research in Science Teaching, 42, 1112–1134. Solomonov, B., & Mukhametzyanov, T. (2016). Basic elements of chemical and statistical thermodynamics. In B.
Solomonov, & T. Mukhametzyanov (Eds.), Encyclopedia of Physical Organic Chemistry (pp. 1-53). Wiley. Thiele, R. B. & Treagust, D. F. (1994). An interpretive examination of high school chemistry teachers’ analogical
explanations. Journal of Research in Science Teaching, 31, 227–242.
102
Lesson Plan
Lesson 1 of 2 Rate and extent of chemical change Using modelling-based teaching to teach about chemical equilibrium Students should be taught about: factors affecting reversible reactions. Science (Chemistry) – Key stage 4
Research recommendation(s) and rationale
Research has shown that engaging students in modelling-based teaching can be a powerful approach for engaging in an authentic, comprehensive, and meaningful learning process about chemical equilibrium (Harrison & De Jong, 2005; Maia & Justi, 2009: Thiele & Treagust, 1994). In the process, students construct mental models of chemical equilibrium (Chiu et al., 2002). The constructive process of modelling requires that students: (i) sort out and build explanations of scientific phenomena, rather than merely memorise facts and definitions; (ii) define and revise problems over time; and (iii) search for information and data sources (Maia & Justi, 2009).
Lesson aim To use modelling-based teaching to teach about the concept of chemical equilibrium.
Learning objective To understand chemical equilibrium as the state in which the forward reaction rate and the reverse reaction rate are equal.
Intended learning outcomes At the end of the lesson, students will be able to: i. Describe the relationship between the forward and reverse reaction rates when a reaction is at equilibrium.
ii. Demonstrate models to represent the relationship between the forward and reverse reaction rates when a reaction is atequilibrium.
Scientific vocabulary Dynamic equilibrium – The state of a reaction in which the rates of the forward and reverse reactions are the same. Forward reaction – The reaction, as written, towards products, in the direction of the reaction arrow in a reversible reaction. Reverse reaction – The reaction, as written, from products to reactants in a reversible reaction. Closed system - If a chemical reaction happens in a container where none of the reactants or products can escape, you have a closed system. Reversible reaction – a reaction which can proceed in both directions i.e. forward and baackward reactions. The reactants are not completely converted to products.
Suggested lesson sequence and activities
Activity 1: Study of the system N2O4(g) → 2NO2(g) (See resources section for alternatives to the demonstration and further details)
The teacher will demonstrate to students the process of the transformation of dinitrogen tetroxide (N2O4) into nitrogen dioxide (NO2) through the gentle heating of a closed tube containing the first substance, N2O4 . The demonstration should only be carried out by the teacher, due to the toxicity of the gas. If available, liquid nitrogen should be used to cool the closed tube beforehand so that only the colourless N2O4 is initially contained in the tube. In this way the forward reaction only can be demonstrated in this initial step.
103
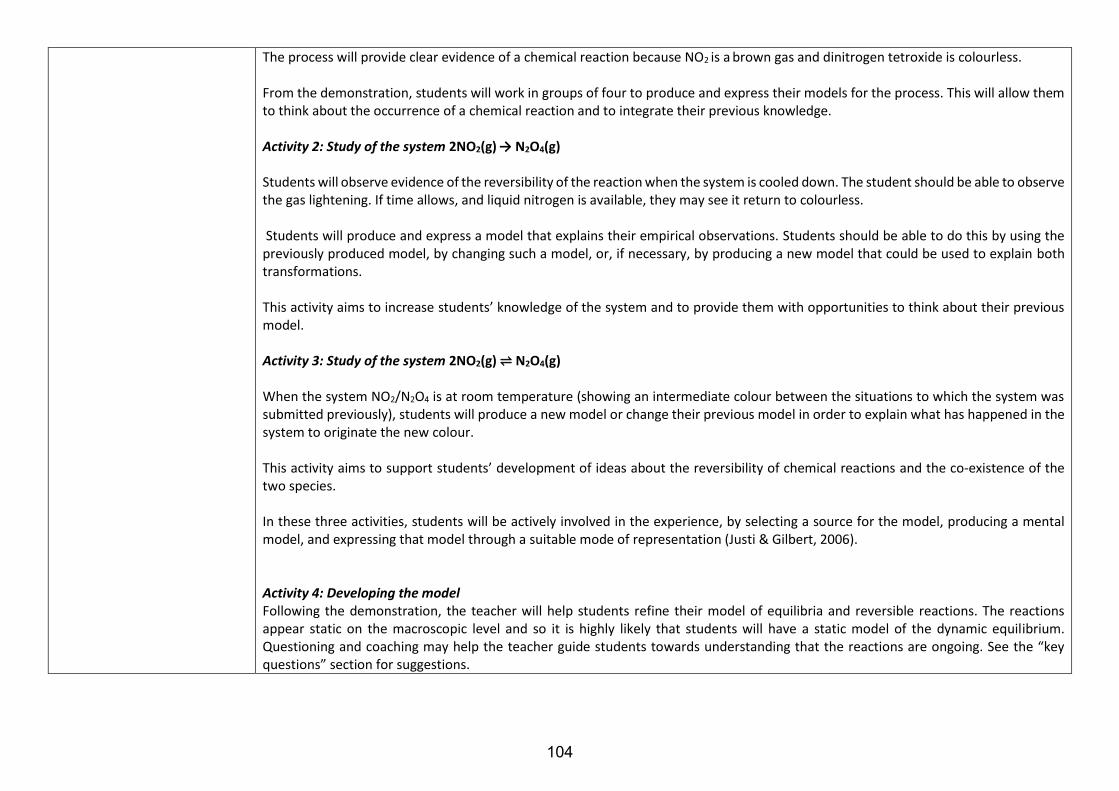
The process will provide clear evidence of a chemical reaction because NO2 is a brown gas and dinitrogen tetroxide is colourless.
From the demonstration, students will work in groups of four to produce and express their models for the process. This will allow them to think about the occurrence of a chemical reaction and to integrate their previous knowledge.
Activity 2: Study of the system 2NO2(g) → N2O4(g)
Students will observe evidence of the reversibility of the reaction when the system is cooled down. The student should be able to observe the gas lightening. If time allows, and liquid nitrogen is available, they may see it return to colourless.
Students will produce and express a model that explains their empirical observations. Students should be able to do this by using the previously produced model, by changing such a model, or, if necessary, by producing a new model that could be used to explain both transformations.
This activity aims to increase students’ knowledge of the system and to provide them with opportunities to think about their previous model.
Activity 3: Study of the system 2NO2(g) ⇌ N2O4(g)
When the system NO2/N2O4 is at room temperature (showing an intermediate colour between the situations to which the system was submitted previously), students will produce a new model or change their previous model in order to explain what has happened in the system to originate the new colour.
This activity aims to support students’ development of ideas about the reversibility of chemical reactions and the co-existence of the two species.
In these three activities, students will be actively involved in the experience, by selecting a source for the model, producing a mental model, and expressing that model through a suitable mode of representation (Justi & Gilbert, 2006).
Activity 4: Developing the model Following the demonstration, the teacher will help students refine their model of equilibria and reversible reactions. The reactions appear static on the macroscopic level and so it is highly likely that students will have a static model of the dynamic equilibrium. Questioning and coaching may help the teacher guide students towards understanding that the reactions are ongoing. See the “key questions” section for suggestions.
104
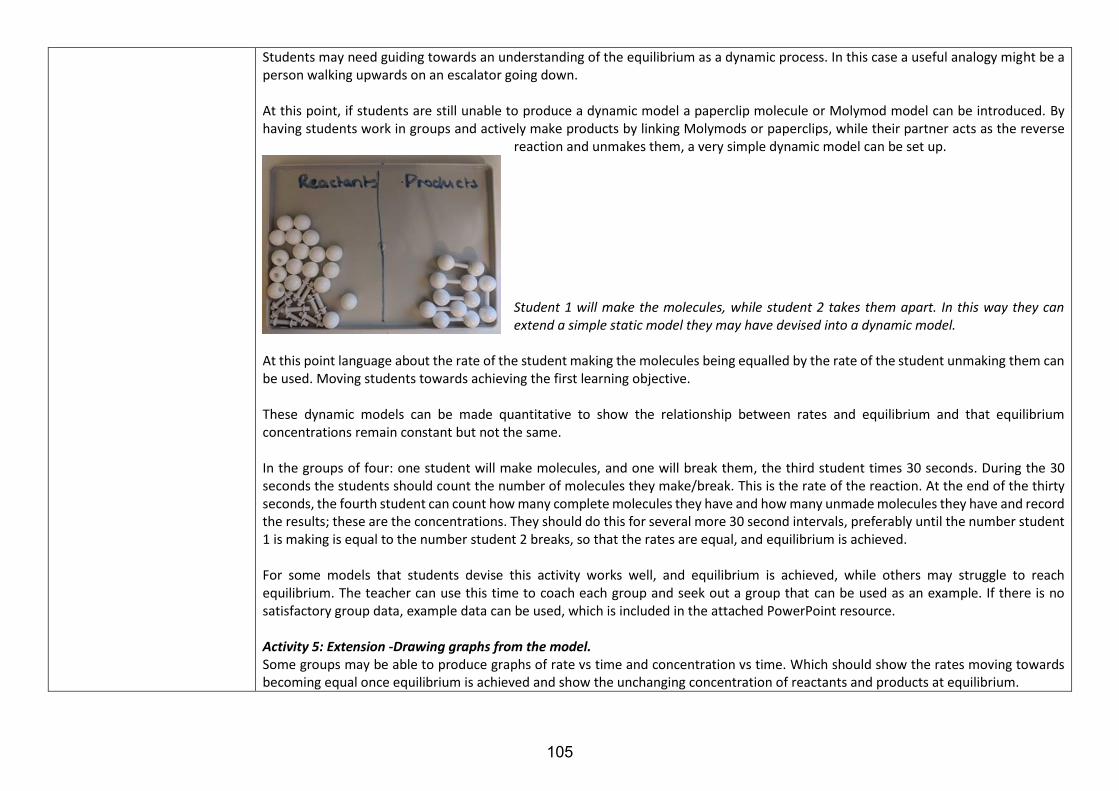
Students may need guiding towards an understanding of the equilibrium as a dynamic process. In this case a useful analogy might be a person walking upwards on an escalator going down.
At this point, if students are still unable to produce a dynamic model a paperclip molecule or Molymod model can be introduced. By having students work in groups and actively make products by linking Molymods or paperclips, while their partner acts as the reverse
reaction and unmakes them, a very simple dynamic model can be set up.
Student 1 will make the molecules, while student 2 takes them apart. In this way they can extend a simple static model they may have devised into a dynamic model.
At this point language about the rate of the student making the molecules being equalled by the rate of the student unmaking them can be used. Moving students towards achieving the first learning objective.
These dynamic models can be made quantitative to show the relationship between rates and equilibrium and that equilibrium concentrations remain constant but not the same.
In the groups of four: one student will make molecules, and one will break them, the third student times 30 seconds. During the 30 seconds the students should count the number of molecules they make/break. This is the rate of the reaction. At the end of the thirty seconds, the fourth student can count how many complete molecules they have and how many unmade molecules they have and record the results; these are the concentrations. They should do this for several more 30 second intervals, preferably until the number student 1 is making is equal to the number student 2 breaks, so that the rates are equal, and equilibrium is achieved.
For some models that students devise this activity works well, and equilibrium is achieved, while others may struggle to reach equilibrium. The teacher can use this time to coach each group and seek out a group that can be used as an example. If there is no satisfactory group data, example data can be used, which is included in the attached PowerPoint resource.
Activity 5: Extension -Drawing graphs from the model. Some groups may be able to produce graphs of rate vs time and concentration vs time. Which should show the rates moving towards becoming equal once equilibrium is achieved and show the unchanging concentration of reactants and products at equilibrium.
105
Activity 6: Assessment The teacher will assess students’ conceptions of chemical equilibrium based on questions related to four core areas: the coexistence of reactants and products in a system in equilibrium, the necessity of a closed system for establishing dynamic equilibrium, dynamics of the process, constant concentrations of reactants and products in the equilibrium state. To this end an assessment grid with images is provided allowing students to answer a series of questions and check for understanding.
Key questions Activity 1: Ask students why the reaction between dinitrogen tetroxide and nitrogen dioxide was done in a closed tube. At the end of the activity, ask students what they think will happen if the sealed tube is cooled down again.
Activity 2: Ask student why the colour change is occurring and what it means is happening to the system. They should answer that more dinitrogen tetroxide is forming and that the concentration of nitrogen dioxide is decreasing. This question aims to ensure they understand a colourless gas is formed in the backward reaction and ensures they understand nitrogen oxide is coloured and dinitrogen tetroxide is colourless.
Activity 3: Why is the colour an intermediate brown colour at room temperature? How does your model show this? A useful series of questions to lead student towards a dynamic model could be: Are the gas molecules still moving? Are they still colliding? What happens when they collide? Ask them why on the macroscopic level it appears nothing is happening. Finally, ask if the dynamic nature of the equilibrium in shown by their model. Encourage them to improve their models to make it dynamic.
Activity 4: While completing the more quantitative modelling activity the teacher can ask about how students know when equilibrium is achieved.
Activity 5: Extension, ask whether the graphs show equilibrium is achieved. If it is, ask at what point is equilibrium achieved and what characteristics of the two graphs show key features of dynamic equilibrium.
Activity 6: Questions contained in the Assessment suggestions section.
Assessment suggestions Assessment grid containing pictures of the equilibrium mixtures on the macroscopic (observable)scale and microscopic (modelled) scale for students to match.
106

The pictures could also be used to hold up in answer to a series of plenary questions, such as: Which diagram represents:
• the cold NO2/N2O4 system• the hottest NO2/N2O4 system• the room temperature NO2/N2O4 system• the system with the most NO2
• the system with all N2O4
• a dynamic equilibrium?
Open ended questions such as discussing the limitations of representing the dynamic equilibrium with still pictures should be included.
Resources For the modelling throughout: Suggested materials to use to build the models: coloured playdough, different sizes of polystyrene balls or pompoms, sticks, paperclips, rubber bands and/or Molymods.
Activity 1-3: Sealed tube of dinitrogen tetroxide. Ice water bath and a warm water bath. Liquid nitrogen is necessary if the starting point of pure dinitrogen tetroxide is required. This article contains information on the demonstration, including the preparation of the dinitrogen tetroxide: https://edu.rsc.org/experiments/le-chateliers-principle-the-effect-of-pressure-and-temperature-on-equilibrium/1739.article
If the resources are not available an alternative a video could be shown. Clips from this video, by Cardiff university for the RSC, are contained in the attached PowerPoint resource. Video by Cardiff University school of chemistry and the RSC: https://youtu.be/yARmI6cPjZQ Clips
Activity 4:
107
Handout with pictures of sealed tubes of dinitrogen tetroxide, nitrogen dioxide and a microscopic snap-shot of the make-up at equilibrium.
H&S considerations Hazard Nitrogen dioxide, NO2(g), and dinitrogen tetroxide, N2O4(g) are both VERY TOXIC – see CLEAPSS Hazcard HC068B.
Demonstration must be done in a fume cupboard in case of leaks.
108
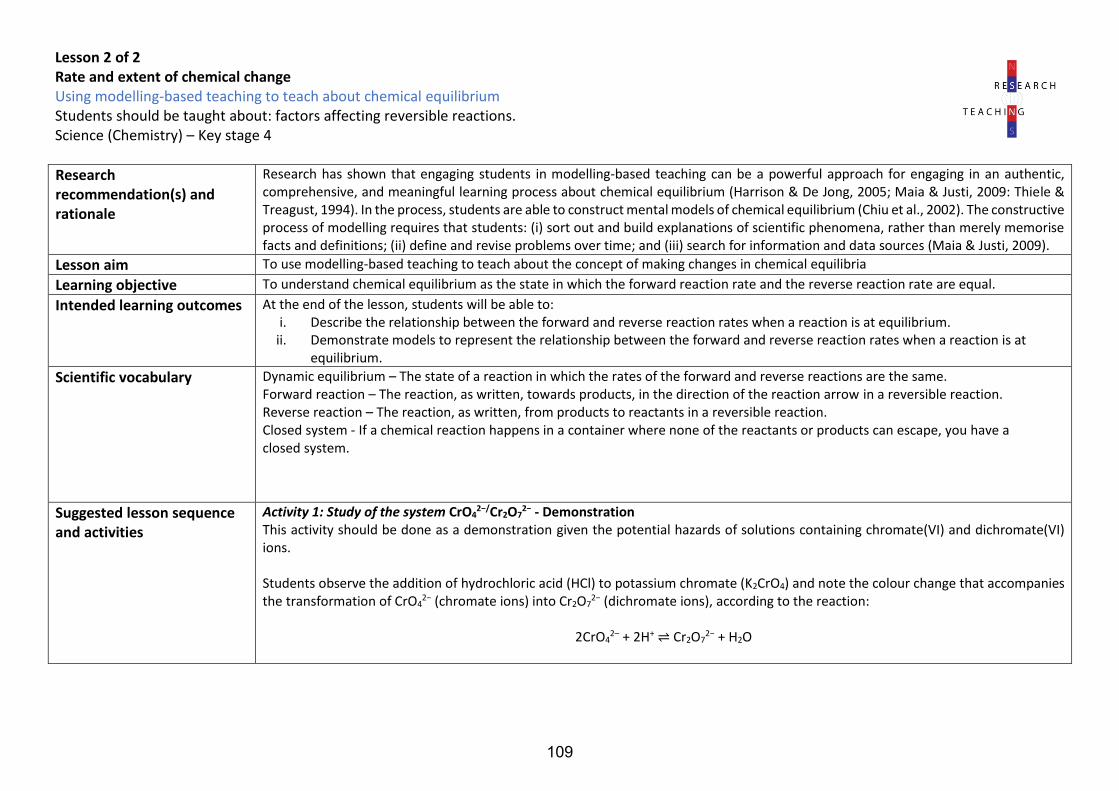
Lesson 2 of 2 Rate and extent of chemical change Using modelling-based teaching to teach about chemical equilibrium Students should be taught about: factors affecting reversible reactions. Science (Chemistry) – Key stage 4
Research recommendation(s) and rationale
Research has shown that engaging students in modelling-based teaching can be a powerful approach for engaging in an authentic, comprehensive, and meaningful learning process about chemical equilibrium (Harrison & De Jong, 2005; Maia & Justi, 2009: Thiele & Treagust, 1994). In the process, students are able to construct mental models of chemical equilibrium (Chiu et al., 2002). The constructive process of modelling requires that students: (i) sort out and build explanations of scientific phenomena, rather than merely memorise facts and definitions; (ii) define and revise problems over time; and (iii) search for information and data sources (Maia & Justi, 2009).
Lesson aim To use modelling-based teaching to teach about the concept of making changes in chemical equilibria
Learning objective To understand chemical equilibrium as the state in which the forward reaction rate and the reverse reaction rate are equal.
Intended learning outcomes At the end of the lesson, students will be able to: i. Describe the relationship between the forward and reverse reaction rates when a reaction is at equilibrium.
ii. Demonstrate models to represent the relationship between the forward and reverse reaction rates when a reaction is atequilibrium.
Scientific vocabulary Dynamic equilibrium – The state of a reaction in which the rates of the forward and reverse reactions are the same. Forward reaction – The reaction, as written, towards products, in the direction of the reaction arrow in a reversible reaction. Reverse reaction – The reaction, as written, from products to reactants in a reversible reaction. Closed system - If a chemical reaction happens in a container where none of the reactants or products can escape, you have a closed system.
Suggested lesson sequence and activities
Activity 1: Study of the system CrO42−/Cr2O7
2− - Demonstration This activity should be done as a demonstration given the potential hazards of solutions containing chromate(VI) and dichromate(VI) ions.
Students observe the addition of hydrochloric acid (HCl) to potassium chromate (K2CrO4) and note the colour change that accompanies the transformation of CrO4
2− (chromate ions) into Cr2O72− (dichromate ions), according to the reaction:
2CrO42– + 2H+ ⇌ Cr2O7
2− + H2O
109
In this system, the colour should change from yellow to orange. The addition of acid encourages the equilibrium towards the right, producing more orange-coloured dichromate(VI) ions. The addition of hydroxide ions causes the concentration of hydrogen ions to decrease, and this brings the equilibrium back to the left-hand side, regenerating yellow chromate(VI) ions.
Activity 2: Modelling the reaction. From the initial activity, students will create a model to explain the behaviour of the system. In this activity, students will be supported in by the teacher in expressing a new model in a suitable mode of representation (Justi & Gilbert, 2006), which will allow the modelling of the modification of the equilibrium position.
In this case the suggested resources, water, and beakers, allow an alternative model of the dynamic equilibrium. Small beakers can be used to transfer water from one large beaker to the other, modelling the dynamic equilibrium. Beakers of different size model different reaction rates. Eventually the rate of the student with the bigger beaker will reduce, as there is less water. The forward reaction can then be increased by adding more reactants/products, allowing the bigger beaker to be filled and increasing the rate.
Activity 3: Study of the system Co(H2O)62+ /Co(Cl)42+ - Practical
This activity will focus on the modification of the equilibrium using temperature by the students. Students will observe visual changes in the system by adding placing a test tube containing Co(H2O)6
2+ /Co(Cl)42+
into an ice water bath and a warm water bath. The cold water bath will make the system more pink (thus marking the existence of more Co(H2O)6
2+ ). The warm water bath will make the system more blue (thus marking the existence of more Co(Cl)4
2+ ).
Students will interpret such evidence in terms of the production of Co(H2O)62+ and Co(Cl)4
2+ and they should understand that the reaction
could be ‘forced’ to happen in a given way. This activity will lead to the use of students’ former model to explain what is happening when the equilibrium is altered.
The teacher will help students to establish relationships between the current and the previous lesson’s system (NO2/N2O4), to make them think about the equilibrium process in a more comprehensive way. Both equilibria have been modified by changing the temperature. This is difficult to model, and the simulation included with the resources may help as an alternative.
Activity 4: Assessment of student’s learning The teacher will assess students’ conceptions of chemical equilibrium based on questions related to four core areas: the coexistence of reactants and products in a system in equilibrium, dynamics of the process, constant concentrations of reactants and products in the equilibrium state, and modifications of equilibrium states. This approach is valuable, as previous research has suggested that open questions allow students to better express and detail their ideas at the end of the teaching process (Chin & Osborne, 2008).
110
Key questions Activity 1: While doing the demonstration the teacher asks about modifying the equilibrium, for instance asking students to predict how the equilibrium can be returned to the original yellow.
Activity 2: Once students have established an equilibrium between the two big beakers, they can be asked how to model the addition of more H+ ions and the re-establishment of equilibrium.
Activity 3: Ask students about the colour at equilibrium and ask them to consider what this might mean in terms of the concentrations of the reactants and products. Change the position of the equilibrium, by adding acid or alkali and ask the same questions. Try to ensure students understand the concentrations are unchanging at equilibrium, but not the same.
Assessment suggestions Open ended questions on the equilibrium such as:
• What is equilibrium?
• Explain what happens to the concentrations at equilibrium.
• Explain what happens to the colours (of a specific, named equilibrium) as conditions are modified.
A document is attached containing more specific examples.
Resources For the modelling throughout: Suggested materials to use to build the models: Plastic beakers in a few sizes, water. This YouTube video shows the model: https://www.youtube.com/watch?v=jKeP9I0JZII The addition of more H+ ions can be modelled by adding more water to the reactants’ large beaker once equilibrium is achieved.
Activity 1-2: Potassium dichromate and hydrochloric acid demonstration. RSC instructions: https://edu.rsc.org/experiments/a-chromate-dichromate-equilibrium/1710.article
Activity 3: Cobalt chloride class practical. This is deemed safe for use from Y9 by CLEAPSS however this practical also uses temperature to change the equilibrium point and this replicates some of the concepts from the dinitrogen tetroxide demonstration in the first activity and does not introduce another means of moving the equilibrium point. Link to the CLEAPSS resource: http://science.cleapss.org.uk/Resource/PP036-Exploring-equilibria-cobalt-II-complexes.pdf
111
Activity 4: Assessment question included in resource.
H&S considerations Hazard Potassium chromate – (i) health hazard, (ii) an immediate skin, eye or respiratory tract irritant, or narcotic, and (iii) environmental hazard. Hydrochloric acid – (i) causing skin corrosion/burns or eye damage on contact, or that are corrosive to metals, and (ii) an immediate skin, eye, or respiratory tract irritant, or narcotic.
Cobalt(II) chloride–6–water, CoCl2.6H2O(s), (TOXIC, DANGEROUS FOR THE ENVIRONMENT) – see CLEAPSS Hazcard HC025. As cobalt(II) chloride is a skin sensitiser, take care to avoid skin contact and wash hands well after use.
Laboratory googles should be worn by all students. (Ensure all activities are carried out in a safe and calm manner. Follow all your school’s health and safety protocols. Please discuss health and safety with your mentor).
112
Research Summary
Rate and extent of chemical change Using creative drama to teach about reversible reactions involved in the Haber process Pupils should be taught about: factors affecting reversible reactions Chemistry – Key stage 4
Statement of issue
Research has shown that pupils hold many misconceptions concerning the fundamental laws of chemistry (Banerjee, 1991; Hackling & Garnett, 1985; Härmälä-Braskén et al., 2020; Stefani & Tsaparlis, 2009; Zoller, 1990). The conservation of matter and chemical change are two fields that manifest key problems for pupils (Johnson, 2000; 2002; Solsona et al., 2003). Because scientific knowledge in chemistry is based on the understanding of these principles, the shortcomings of education in dealing with these notions unquestionably obstruct pupils’ ability to progress in the sciences (Agung & Schwartz, 2007). As a result, Boujaoude & Barakat (2000) reported that only a small number of pupils in secondary school and in their first year at university could solve conceptual problems in chemistry.
A number of researchers have suggested that creative drama has great potential to help pupils to develop a deeper understanding of scientific concepts (Alrutz, 2004; Arieli, 2007; Danckwardt-Lillieström et al., 2020; Dorion, 2009; Hendrix et al., 2012; Ødegaard, 2003; Osama, 2016). In science education, the scientific concepts targeted in previous research on creative drama have related to electricity, mixtures and solutions (Arieli, 2007), sound and solar energy (Hendrix et al., 2012), molecules in the different states of matter (Arieli, 2007; Osama, 2016), chemical bonding (Danckwardt-Lillieström et al., 2020), and chemical reactions (Najami et al., 2019). All studies have reported great success in enhancing pupils’ understanding of scientific concepts.
Main findings from the research
What is creative drama? Creative drama is a method used in science teaching, which involves pupils enacting roles within the known framework of scientific theories: for instance playing electrons in a circuit to illustrate the scientific concept of electricity (Ødegaard, 2003). In chemistry, pupils may reconstruct their knowledge by moving between a model or description, displayed in a textbook and a three-dimensional living model, experienced within their own bodies (Danckwardt-Lillieström et al., 2020). This enables the pupils to reconstruct and develop their understanding of specific scientific concepts (Ødegaard, 2015). For example, Danckwardt-Lillieström et al.’s (2018) study showed that when pupils used creative drama as part of the learning process in chemistry subjects, they were able to collaboratively create meaning in an embodied way. This was combined with the verbal and written modes of semiotic work that are usually offered in regular teaching.
Researchers have suggested that multiple modes of meaning making can be expanded in creative drama, by widening the types of semiotic resources used in teaching (e.g. bodily resources such as voice, gestures, and facial expressions; digital resources such as audio, video and simulations; text resources such as different kinds of paper, scissors, tape, crayons, etc.) (Danckwardt-Lillieström et al., 2018; 2020).
Mortimer and Scott’s (2006) work also emphasised that through creative drama, teachers can engage in a dialogue with pupils to promote learning and to guide them to the turning point – the move from everyday language to a scientific language. Abrahams and Braund (2012) illustrated four techniques for teaching science through drama, namely focusing games (warm-ups, exercises), tableaux/freeze frame (using a still image to show or explore the scientific concept being studied), animated diagrams (to bring a diagram off the page and animate it), and role play (further development of the animate diagrams and tableaux by using scientific knowledge and understanding).
113
Danckwardt-Lillieström et al.’s (2020) investigation explored how creative drama may be used to facilitate pupils’ explorations of electronegativity and chemical bonding in a Swedish secondary school. The study involved 105 pupils in two schools, who participated in single-lesson-interventions, which lasted for 30–60 minutes. These consisted of drama activities and discussions in whole-class and pupil groups. The findings of the study indicated that creative drama enabled the pupils to link the electronegativity and polarity of molecules to formations of molecular grid structures, using their own bodies to represent how molecules were organised in different states of matter. The study also suggested that creative drama may enhance pupils’ agency in their explorations of electronegativity and the linking of electronegativity to intramolecular and intermolecular bonding.
Arieli (2007) also explored the integration of creative drama into science teaching as an instructional strategy for enhancing primary school pupils’ understanding of scientific concepts (mixtures and solutions). The study reported that creative drama activities enhanced pupils’ scientific knowledge and understanding, and pupils who were interviewed asserted that creative drama activities helped them to better understand difficult scientific concepts. The participating pupils found the drama activities fun and enjoyable and attested that they had an impact on social interaction in the science class and beyond.
In another study, Osama (2016) investigated the effect of drama-based science teaching on pupils’ understanding of scientific concepts related to states of matter (solid, liquid and gas), and their attitudes towards science learning. The results indicated that there were statistically significant differences between the treatment and control groups of pupils for both variables of the study. Similarly, Najami’s et al. (2019) study found that teaching chemistry using drama contributed both to pupils’ achievements and to their interest in studying chemistry, and that it positively affected pupils’ achievements in a light and photosynthesis chemistry unit.
Boujaoude et al. (2005) also investigated the effect of using drama as a supporting learning strategy on pupils’ conceptions of the nature of science with 32 Lebanese secondary school pupils. The findings from the study indicated that drama activities brought positive changes to pupils’ views of various nature of science aspects. The study suggested that the discussion/reflection sessions, especially the whole group sessions that took place after the final performance, served a pivotal role in influencing pupils’ views.
Therefore, a lesson plan was produced to incorporate creative drama into approaches to teaching about the reversible reactions involved in the Haber process.
References
Abrahams, I., & Braund, M. (2012). Performing science: Teaching chemistry, physics and biology through drama. Continuum.
Agung, S., & Schwartz, M. S. (2007). Students’ understanding of conservation of matter, stoichiometry and balancing equations in Indonesia. International Journal of Science Education, 29(13), 1679-1702.
Alrutz, M. (2004). Granting science a dramatic license: Exploring a 4th grade science classroom and the possibilities for integrating drama. Teaching Artist Journal, 2(1), 31–39.
Arieli, B. (2007). The integration of creative drama into science teaching [Unpublished doctoral dissertation]. Kansas State University.
Banerjee, A. C. (1991). Misconceptions of students and teachers in chemical equilibrium. International Journal of Science Education, 13(4), 487-494.
Boujaoude, S., & Barakat, H. (2000). Secondary school students’ difficulties with stoichiometry. School Science Review, 296, 91–98.
Boujaoude, S., Sowwan, S., & Abd-El-Khalick, F. (2005). The effect of using drama in science teaching on students’ conceptions of the nature of science. In Boersma, K., Goedhart, M., de Jong, O. & Eijkelhof, H. (Eds.), Research and the Quality of Science Education (pp. 259-267). Springer.
Danckwardt-Lillieström, K., Andrée, M., & Enghag, M. (2018). Creative drama in chemistry education: A social semiotic approach. Nordic Studies in Science Education, 14(3), 250-266.
Danckwardt-Lillieström, K., Andrée, M., & Enghag, M. (2020). The drama of chemistry–supporting student explorations of electronegativity and chemical bonding through creative drama in upper secondary school. International Journal of Science Education, 42(11), 1862-1894.
114
Dorion, K. R. (2009). Science through drama: A multiple case exploration of the characteristics of drama activities used in secondary science lessons. International Journal of Science Education, 31(16), 2247–2270.
Hackling, M. W., & Garnett, P. J. (1985). Misconceptions of chemical equilibrium. The European Journal of Science Education, 7(2), 205-214.
Härmälä-Braskén, A. S., Hemmi, K., & Kurtén, B. (2020). Misconceptions in chemistry among Finnish prospective primary school teachers–a long-term study. International Journal of Science Education, 42(9), 1447-1464.
Hendrix, R., Eick, C., & Shannon, D. (2012). The integration of creative drama in an inquiry-based elementary program: The effect on student attitude and conceptual learning. Journal of Science Teacher Education, 23(7), 823–846.
Johnson, P. (2000). Children’s understanding of substances, part 1: recognizing chemical change. International Journal of Science Education, 22(7), 719-737.
Johnson, P. (2002). Children's understanding of substances, part 2: Explaining chemical change. International Journal of Science Education, 24(10), 1037-1054.
Mortimer, E., & Scott, P. (2006). Meaning making in secondary science classroom. Open University Press. Najami, N., Hugerat, M., Khalil, K., & Hofstein, A. (2019). Effectiveness of teaching science by drama. Creative
Education, 10(1), 97-110. Ødegaard, M. (2003). Dramatic science. A critical review of drama in science education. Studies in Science Education,
39(1), 75–101. Ødegaard, M. (2015). Science theater/drama. In R. Gunstone (Ed.), Encyclopedia of Science Education (pp. 928–930).
Springer. Osama, H. A. (2016). Drama-based science teaching and its effect on students’ understanding of scientific concepts
and their attitudes towards science learning. International Education Studies, 9(10), 163–173. Solsona, N. R., Izquierdo, M., & De Jong, O. (2003). Exploring the development of students’ conceptual profiles of
chemical change. International Journal of Science Education, 25(1), 3-12. Stefani, C., & Tsaparlis, G. (2009). Students’ levels of explanations, models, and misconceptions in basic quantum
chemistry: A phenomenographic study. Journal of Research in Science Teaching, 46(5), 520-536. Zoller, U. (1990). Students’ misunderstandings and misconceptions in college freshman chemistry (general and
organic). Journal of Research in Science Teaching, 27(10), 1053-1065.
115
Lesson Plan Rate and extent of chemical change Using creative drama to teach about reversible reactions involved in the Haber process Pupils should be taught about: factors affecting reversible reactions Science (Chemistry) – KS4
Research recommendation(s) and rationale
Research has shown that creative drama can be an effective tool for enhancing pupils’ conceptual understanding of scientific concepts in chemistry units (Arieli, 2007; Danckwardt-Lillieström et al., 2018; 2020; Najami et al., 2019; Osama, 2016) and attitudes towards science (Arieli, 2007; Najami et al., 2019; Osama, 2016). Research has also suggested that creative drama brings positive changes to pupils’ views of some nature of science aspects (Boujaoude et al., 2005). The suggested activities in this lesson plan are adopted from Abrahams and Braund’s (2012, pp. 70-72) work, which uses a tableaux/freeze frame technique – a still image to explore the scientific ideas being studied, like a photograph or a freeze frame on a DVD.
Lesson aim To use creative drama to teach about the reversible reactions involved in the Haber process. Learning objective To understand the scientific concept of the Haber process, which involves a reversible reaction at dynamic equilibrium. Intended learning outcomes At the end of the lesson, pupils will be able to:
Apply the principles of dynamic equilibrium to reversible reactions and dynamic equilibrium to the Haber process. Scientific vocabulary Reversible reaction – A reaction in which the conversion of reactants to products and the conversion of products to reactants occur
simultaneously. Haber process – The industrial chemical process that makes ammonia by reacting nitrogen and hydrogen together. Equilibrium – The state of a reaction in which the rates of the forward and reverse reactions are the same. Exothermic – of a chemical reaction that releases energy in the form of heat. Endothermic – of a chemical reaction that absorbs heat energy from its surroundings.
Suggested lesson sequence and activities
***The instructions can either be read out by the teacher, or a confident pupil narrator, or each of the different players can be given their script of actions in advance to learn their parts. In essence, the narrator/teacher can guide as necessary and support the initiation of the scenes. Story 1 – The reaction between hydrogen and oxygen to produce water Pre-story: Two hydrogen molecules and one oxygen molecule are needed (six pupils), holding ‘bonds’ to join them and band hats to identify them as H or O atoms. Pupils need to practise having the right number of pieces of paper to make new bonds in the product molecules. For the freeze frame at the end, a further two hydrogen and one oxygen molecules are needed (six more pupils with hats and bonds).
116
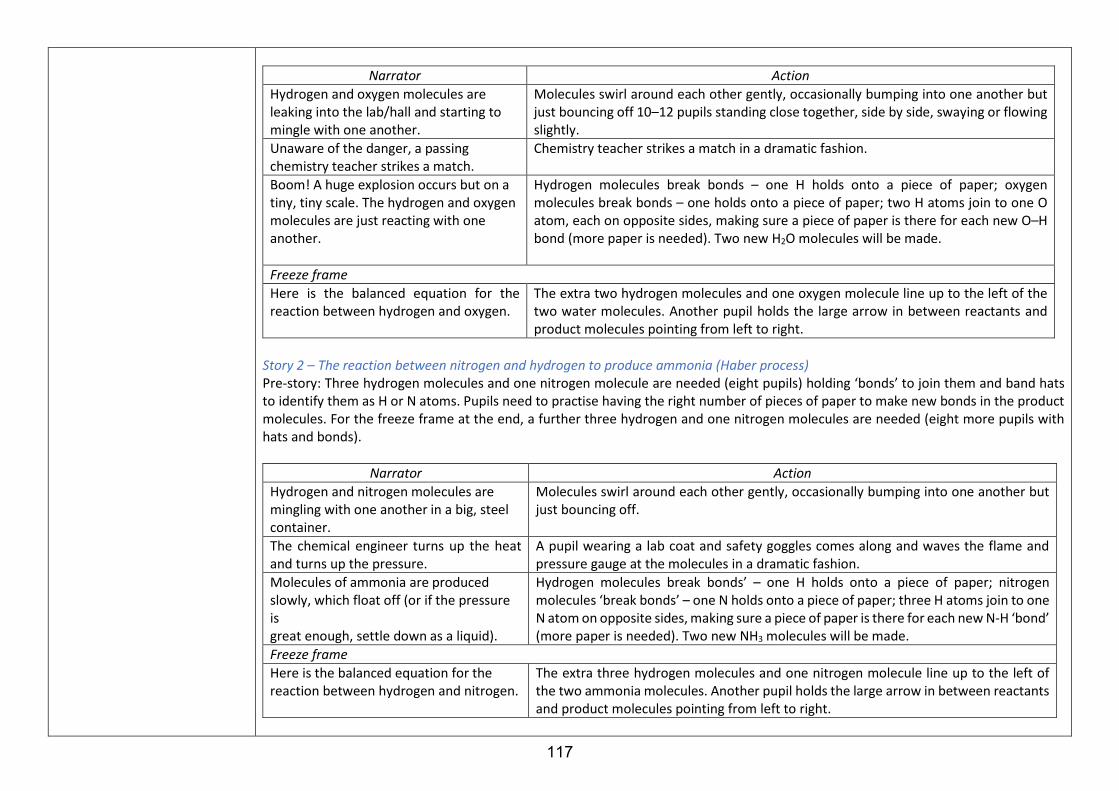
Narrator Action
Hydrogen and oxygen molecules are leaking into the lab/hall and starting to mingle with one another.
Molecules swirl around each other gently, occasionally bumping into one another but just bouncing off 10–12 pupils standing close together, side by side, swaying or flowing slightly.
Unaware of the danger, a passing chemistry teacher strikes a match.
Chemistry teacher strikes a match in a dramatic fashion.
Boom! A huge explosion occurs but on a tiny, tiny scale. The hydrogen and oxygen molecules are just reacting with one another.
Hydrogen molecules break bonds – one H holds onto a piece of paper; oxygen molecules break bonds – one holds onto a piece of paper; two H atoms join to one O atom, each on opposite sides, making sure a piece of paper is there for each new O–H bond (more paper is needed). Two new H2O molecules will be made.
Freeze frame Here is the balanced equation for the reaction between hydrogen and oxygen.
The extra two hydrogen molecules and one oxygen molecule line up to the left of the two water molecules. Another pupil holds the large arrow in between reactants and product molecules pointing from left to right.
Story 2 – The reaction between nitrogen and hydrogen to produce ammonia (Haber process) Pre-story: Three hydrogen molecules and one nitrogen molecule are needed (eight pupils) holding ‘bonds’ to join them and band hats to identify them as H or N atoms. Pupils need to practise having the right number of pieces of paper to make new bonds in the product molecules. For the freeze frame at the end, a further three hydrogen and one nitrogen molecules are needed (eight more pupils with hats and bonds).
Narrator Action Hydrogen and nitrogen molecules are mingling with one another in a big, steel container.
Molecules swirl around each other gently, occasionally bumping into one another but just bouncing off.
The chemical engineer turns up the heat and turns up the pressure.
A pupil wearing a lab coat and safety goggles comes along and waves the flame and pressure gauge at the molecules in a dramatic fashion.
Molecules of ammonia are produced slowly, which float off (or if the pressure is great enough, settle down as a liquid).
Hydrogen molecules break bonds’ – one H holds onto a piece of paper; nitrogen molecules ‘break bonds’ – one N holds onto a piece of paper; three H atoms join to one N atom on opposite sides, making sure a piece of paper is there for each new N-H ‘bond’ (more paper is needed). Two new NH3 molecules will be made.
Freeze frame Here is the balanced equation for the reaction between hydrogen and nitrogen.
The extra three hydrogen molecules and one nitrogen molecule line up to the left of the two ammonia molecules. Another pupil holds the large arrow in between reactants and product molecules pointing from left to right.
117
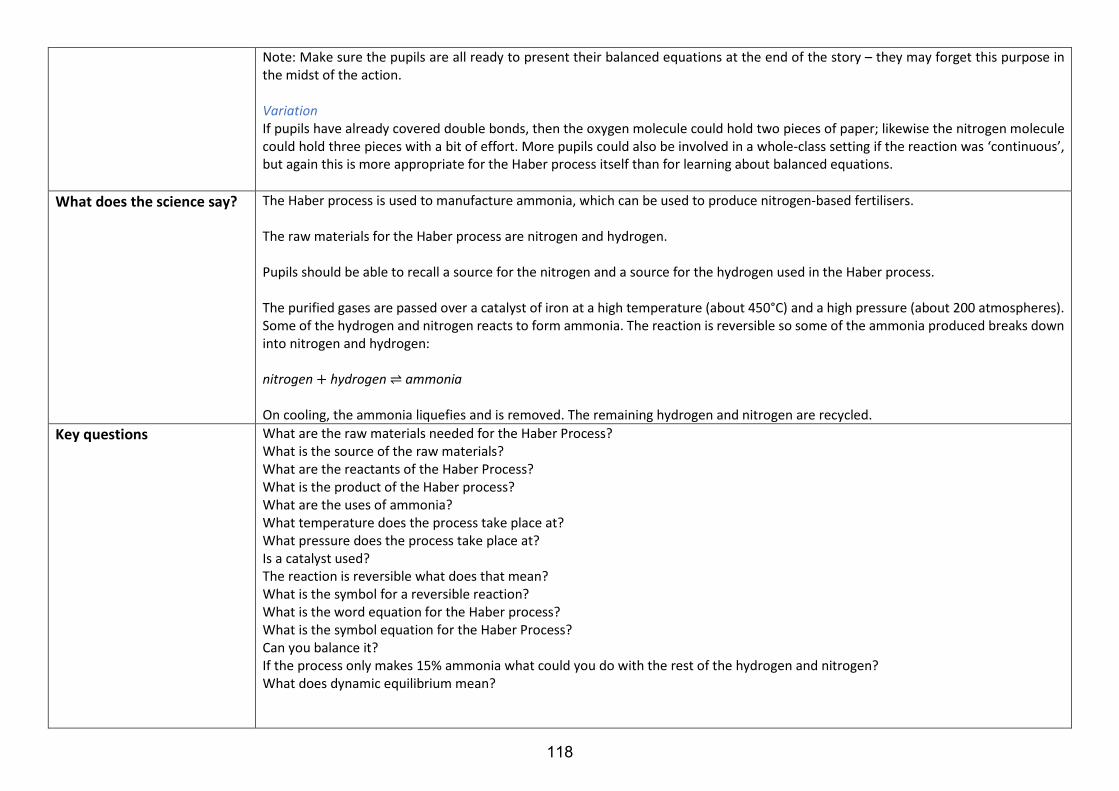
Note: Make sure the pupils are all ready to present their balanced equations at the end of the story – they may forget this purpose in the midst of the action. Variation If pupils have already covered double bonds, then the oxygen molecule could hold two pieces of paper; likewise the nitrogen molecule could hold three pieces with a bit of effort. More pupils could also be involved in a whole-class setting if the reaction was ‘continuous’, but again this is more appropriate for the Haber process itself than for learning about balanced equations.
What does the science say? The Haber process is used to manufacture ammonia, which can be used to produce nitrogen-based fertilisers. The raw materials for the Haber process are nitrogen and hydrogen. Pupils should be able to recall a source for the nitrogen and a source for the hydrogen used in the Haber process. The purified gases are passed over a catalyst of iron at a high temperature (about 450°C) and a high pressure (about 200 atmospheres). Some of the hydrogen and nitrogen reacts to form ammonia. The reaction is reversible so some of the ammonia produced breaks down into nitrogen and hydrogen: nitrogen + hydrogen ⇌ ammonia On cooling, the ammonia liquefies and is removed. The remaining hydrogen and nitrogen are recycled.
Key questions What are the raw materials needed for the Haber Process? What is the source of the raw materials? What are the reactants of the Haber Process? What is the product of the Haber process? What are the uses of ammonia? What temperature does the process take place at? What pressure does the process take place at? Is a catalyst used? The reaction is reversible what does that mean? What is the symbol for a reversible reaction? What is the word equation for the Haber process? What is the symbol equation for the Haber Process? Can you balance it? If the process only makes 15% ammonia what could you do with the rest of the hydrogen and nitrogen? What does dynamic equilibrium mean?
118
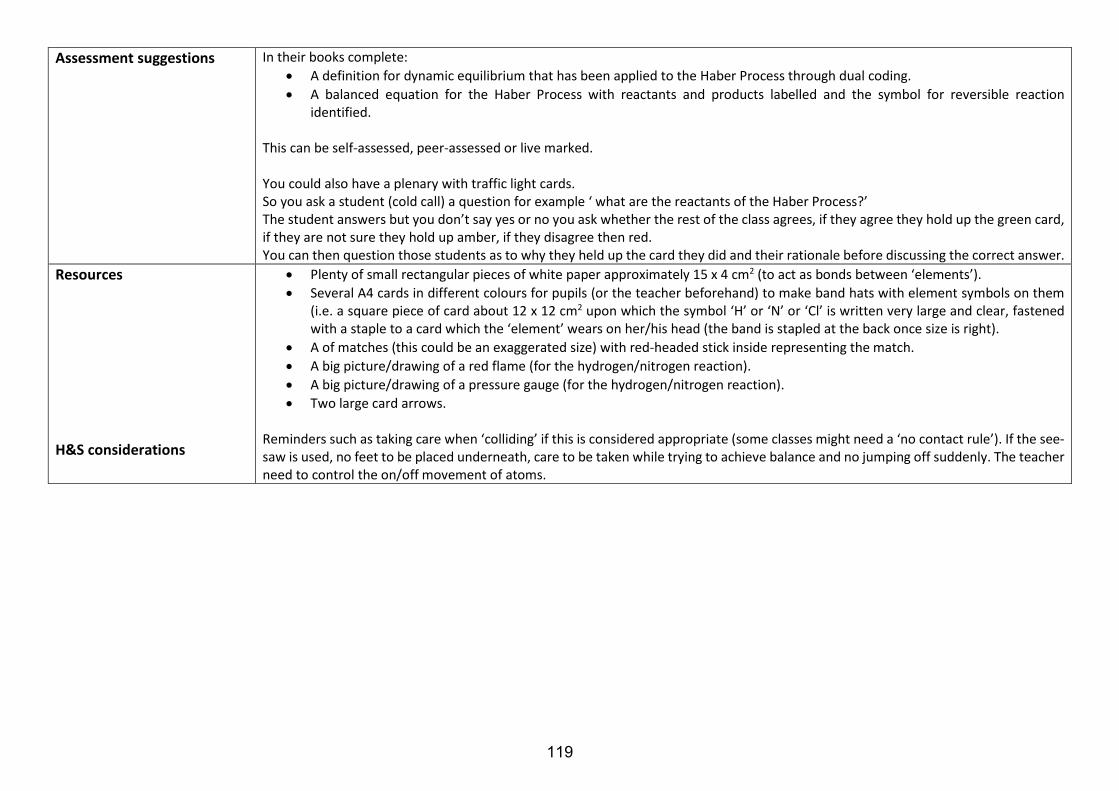
Assessment suggestions In their books complete: • A definition for dynamic equilibrium that has been applied to the Haber Process through dual coding. • A balanced equation for the Haber Process with reactants and products labelled and the symbol for reversible reaction
identified. This can be self-assessed, peer-assessed or live marked. You could also have a plenary with traffic light cards. So you ask a student (cold call) a question for example ‘ what are the reactants of the Haber Process?’ The student answers but you don’t say yes or no you ask whether the rest of the class agrees, if they agree they hold up the green card, if they are not sure they hold up amber, if they disagree then red. You can then question those students as to why they held up the card they did and their rationale before discussing the correct answer.
Resources H&S considerations
• Plenty of small rectangular pieces of white paper approximately 15 x 4 cm2 (to act as bonds between ‘elements’). • Several A4 cards in different colours for pupils (or the teacher beforehand) to make band hats with element symbols on them
(i.e. a square piece of card about 12 x 12 cm2 upon which the symbol ‘H’ or ‘N’ or ‘Cl’ is written very large and clear, fastened with a staple to a card which the ‘element’ wears on her/his head (the band is stapled at the back once size is right).
• A of matches (this could be an exaggerated size) with red-headed stick inside representing the match. • A big picture/drawing of a red flame (for the hydrogen/nitrogen reaction). • A big picture/drawing of a pressure gauge (for the hydrogen/nitrogen reaction). • Two large card arrows.
Reminders such as taking care when ‘colliding’ if this is considered appropriate (some classes might need a ‘no contact rule’). If the see-saw is used, no feet to be placed underneath, care to be taken while trying to achieve balance and no jumping off suddenly. The teacher need to control the on/off movement of atoms.
119
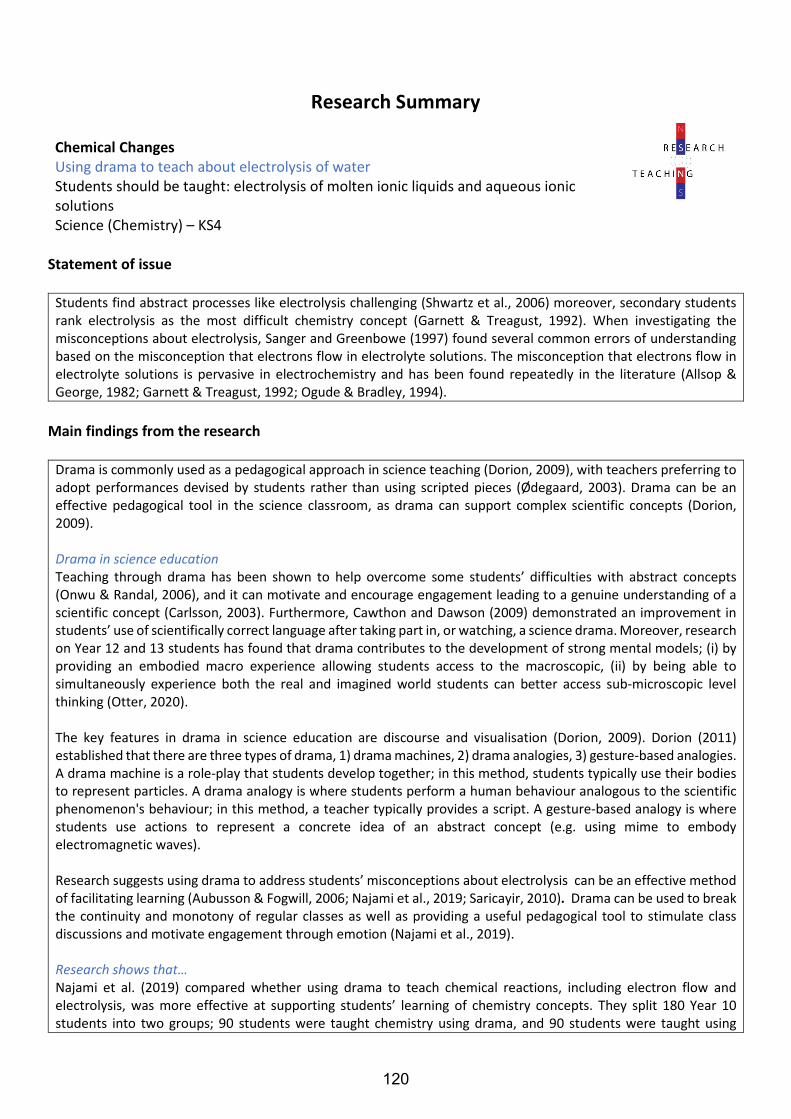
Research Summary
Chemical Changes Using drama to teach about electrolysis of water Students should be taught: electrolysis of molten ionic liquids and aqueous ionic solutions Science (Chemistry) – KS4
Statement of issue
Students find abstract processes like electrolysis challenging (Shwartz et al., 2006) moreover, secondary students rank electrolysis as the most difficult chemistry concept (Garnett & Treagust, 1992). When investigating the misconceptions about electrolysis, Sanger and Greenbowe (1997) found several common errors of understanding based on the misconception that electrons flow in electrolyte solutions. The misconception that electrons flow in electrolyte solutions is pervasive in electrochemistry and has been found repeatedly in the literature (Allsop & George, 1982; Garnett & Treagust, 1992; Ogude & Bradley, 1994).
Main findings from the research
Drama is commonly used as a pedagogical approach in science teaching (Dorion, 2009), with teachers preferring to adopt performances devised by students rather than using scripted pieces (Ødegaard, 2003). Drama can be an effective pedagogical tool in the science classroom, as drama can support complex scientific concepts (Dorion, 2009).
Drama in science education Teaching through drama has been shown to help overcome some students’ difficulties with abstract concepts (Onwu & Randal, 2006), and it can motivate and encourage engagement leading to a genuine understanding of a scientific concept (Carlsson, 2003). Furthermore, Cawthon and Dawson (2009) demonstrated an improvement in students’ use of scientifically correct language after taking part in, or watching, a science drama. Moreover, research on Year 12 and 13 students has found that drama contributes to the development of strong mental models; (i) by providing an embodied macro experience allowing students access to the macroscopic, (ii) by being able to simultaneously experience both the real and imagined world students can better access sub-microscopic level thinking (Otter, 2020).
The key features in drama in science education are discourse and visualisation (Dorion, 2009). Dorion (2011) established that there are three types of drama, 1) drama machines, 2) drama analogies, 3) gesture-based analogies. A drama machine is a role-play that students develop together; in this method, students typically use their bodies to represent particles. A drama analogy is where students perform a human behaviour analogous to the scientific phenomenon's behaviour; in this method, a teacher typically provides a script. A gesture-based analogy is where students use actions to represent a concrete idea of an abstract concept (e.g. using mime to embody electromagnetic waves).
Research suggests using drama to address students’ misconceptions about electrolysis can be an effective method of facilitating learning (Aubusson & Fogwill, 2006; Najami et al., 2019; Saricayir, 2010). Drama can be used to break the continuity and monotony of regular classes as well as providing a useful pedagogical tool to stimulate class discussions and motivate engagement through emotion (Najami et al., 2019).
Research shows that… Najami et al. (2019) compared whether using drama to teach chemical reactions, including electron flow and electrolysis, was more effective at supporting students’ learning of chemistry concepts. They split 180 Year 10 students into two groups; 90 students were taught chemistry using drama, and 90 students were taught using
120

traditional pedagogies (lecture and practical demonstrations). The chemistry teacher and a drama specialist prepared the script on chemical reactions, including electrolysis. Unlike the other studies, Najami et al., (2019) did not introduce the scientific concepts first, instead they only used the drama pedagogy. Students were cast in their roles with students either having a main role (i.e. large speaking part) or were a chorus member (i.e. spoke their lines together with other cast members). The teacher explained the functions of each role with the students individually. Students performed the piece and then followed this with a class discussion in which the teacher checked students understanding of the scientific concepts. A statistically significant positive effect of drama on students’ scientific achievement was found. On interviewing the students, it was found that those who experienced the drama approach had a better understanding of the topic and were more motivated to continue their studies in chemistry.
Saricayir (2010) evaluated the effects of drama on the teaching of electrolysis of water in a study involving two Turkish Year 7 classes; one class of 19 students was taught electrolysis using drama whilst the other class of 21 students were taught electrolysis using the more traditional text-book and lecture. The drama class were introduced to the concepts of formation and decomposition of water in the classroom setting, and then they took part in the drama activity. For the drama activity, the class of 19 worked in two large groups. The drama was based on the electrolysis of water, with one group performing (8 students), the other group as the audience (11 students). The chemistry teacher wrote the script, assigned students to roles and costumes. Students were encouraged to discuss their parts and work out where they should stand and how to enter/exit the stage. They found that the drama class, including those who simply watched the drama as part of the audience, performed statistically significantly better on the scientific achievement test than the traditional pedagogy class. Students were tested by drawing atoms and molecules and it was found that 16 of the 19 in the drama class were able to draw the water molecule correctly, compared to 7 of the 21 in the traditional class.
Aubusson and Fogwill (2006) investigated student-directed drama on the process of extracting copper from copper ore. Year 11 students designed and performed physical simulations of the process (representing the sub-micro level descriptions of copper carbonate and sulphuric acid and the electrolysis of copper sulphate) in which they used their bodies to represent particles. Copper ions were identified by the use of labels which the students wore. The students’ drama simulations were re-visited over three lessons and it was found that by students designing the performance this encouraged discussion of analogical reasoning, which supported the student’s visualisation at an atomic level. Research demonstrates that both teacher-directed drama and student-directed drama effectively increases student understanding of the concept of electrolysis (Aubusson & Fogwill, 2006; Najami et al., 2019; Saricayir, 2010).
Student-directed or Teacher-directed? Yoon (2006) investigated the impact of providing students with a script or not. Findings indicated increased student autonomy when there was no script, and students were able to improvise when writing their script. The authors suggested that this might help to create a sense of ownership and encourage student engagement (Swick, 1999), and subsequently enhance learning (Bateson, 1994). Sutton (1996) found that interpreting a script also supports students to consolidate their learning. However, when Otter (2020) compared two groups of Year 12 and 13 students; one group used a pre-prepared script (teacher-directed), and the other group devised their play (student-directed), there was found to be no significant difference between teacher-led, or student-led, drama on their understanding of scientific concepts.
Therefore, using drama as a pedagogical tool in the science classroom has been shown to support some students’ development of mental models about abstract ideas (Otter, 2020) and improve students’ visualisation (Aubusson & Fogwill, 2006) and use of scientific language (Cawthon & Dawson, 2009).
Therefore, a lesson was produced to incorporate drama into the teaching of electrolysis.
References Allsop, R. T., & George, N. H. (1982). Redox in Nuffield advanced chemistry. Education in Chemistry, 19, 57-59. Aubusson, P. J., & Fogwill, S. (2006). Role play as analogical modelling in science. In Metaphor and analogy in science
education (pp. 93-104). Springer.
121
Bateson, M. C. (1994). Peripheral visions: Learning along the way. Harper Collins. Carlsson, B. (2003). Dramatic photosynthesis. Australian Science Teachers Journal, 49, 26-36. Cawthon, S. W., & Dawson, K. (2009). Drama for schools: Impact of a drama-based professional development program
on teacher self-efficacy and authentic instruction. Youth Theatre Journal, 23(2), 144-161. Dorion, K. R. (2009). Science through drama: A multiple case exploration of the characteristics of drama activities used
in secondary science lessons. International Journal of Science Education, 31(16), 2247-2270. Dorion, K. C. (2011). An exploration of how a drama-based pedagogy can promote understanding of chemical concepts
in 11-15 year old science students (Doctoral dissertation, University of Cambridge). Garnett, P. J., & Treagust, D. F. (1992). Conceptual difficulties experienced by senior high school students of
electrochemistry: Electric circuits and oxidation-reduction equations. Journal of Research in Science Teaching, 29(2), 121-142.
Najami, N., Hugerat, M., Khalil, K., & Hofstein, A. (2019). Effectiveness of teaching science by drama. Creative Education, 10(1), 97-110.
Ødegaard, M. (2003). Dramatic science: A critical review of drama in science education. Studies in Science Education, 39, 75.
Ogude, A. N., & Bradley, J. D. (1994). Ionic conduction and electrical neutrality in operating electrochemical cells: Pre-college and college student interpretations. Journal of chemical education, 71(1), 29.
Onwu, G. O. M., & Randal, M. (2006). Some aspects of students’ understanding of a representational model of the particulate nature of matter in chemistry in three different countries. Chemistry Education Research and Practice, 7, 226-239.
Otter, C. A. (2020). The use of drama in A level chemistry: A study into the effects of simulation-role-play on the quality of, and student attitudes towards, learning of organic reaction mechanisms (Doctoral dissertation, University of Leeds).
Sanger, M. J., & Greenbowe, T. J. (1997). Students' misconceptions in electrochemistry regarding current flow in electrolyte solutions and the salt bridge. Journal of chemical education, 74(7), 819.
Saricayir, H. (2010). Teaching electrolysis of water through drama. Journal of Baltic Science Education, 9(3), 179-186. Shwartz, Y., Ben-Zvi, R., & Hofstein, A. (2006). The use of scientific literacy taxonomy for assessing the development of
chemical literacy among high-school students. Chemistry Education Research and Practice, 7(4), 203-225. Sutton, C. (1996). Beliefs about science and beliefs about language. International Journal of Science Education, 18, 1-
18. Swick, M. E. (1999). Student ownership in the drama classroom. Youth theatre journal, 13, 72-81. Yoon, H. G. (2006, May). The nature of science drama in science education. In the 9th international conference on
public communication of science and technology (PCST-9). Seoul, Korea.
122
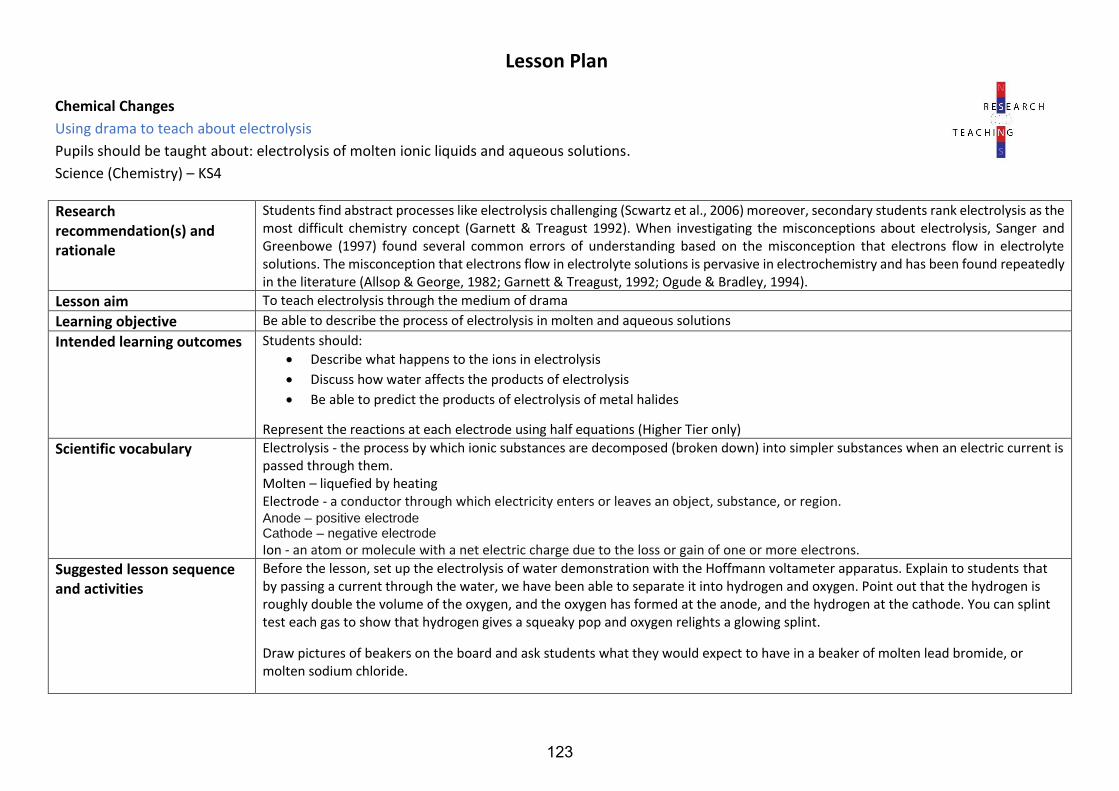
Lesson Plan
Chemical Changes
Using drama to teach about electrolysis
Pupils should be taught about: electrolysis of molten ionic liquids and aqueous solutions.
Science (Chemistry) – KS4
Research recommendation(s) and rationale
Students find abstract processes like electrolysis challenging (Scwartz et al., 2006) moreover, secondary students rank electrolysis as the most difficult chemistry concept (Garnett & Treagust 1992). When investigating the misconceptions about electrolysis, Sanger and Greenbowe (1997) found several common errors of understanding based on the misconception that electrons flow in electrolyte solutions. The misconception that electrons flow in electrolyte solutions is pervasive in electrochemistry and has been found repeatedly in the literature (Allsop & George, 1982; Garnett & Treagust, 1992; Ogude & Bradley, 1994).
Lesson aim To teach electrolysis through the medium of drama
Learning objective Be able to describe the process of electrolysis in molten and aqueous solutions
Intended learning outcomes Students should:
• Describe what happens to the ions in electrolysis
• Discuss how water affects the products of electrolysis
• Be able to predict the products of electrolysis of metal halides
Represent the reactions at each electrode using half equations (Higher Tier only)
Scientific vocabulary Electrolysis - the process by which ionic substances are decomposed (broken down) into simpler substances when an electric current is passed through them. Molten – liquefied by heating Electrode - a conductor through which electricity enters or leaves an object, substance, or region.Anode – positive electrode Cathode – negative electrode
Ion - an atom or molecule with a net electric charge due to the loss or gain of one or more electrons. Suggested lesson sequence and activities
Before the lesson, set up the electrolysis of water demonstration with the Hoffmann voltameter apparatus. Explain to students that by passing a current through the water, we have been able to separate it into hydrogen and oxygen. Point out that the hydrogen is roughly double the volume of the oxygen, and the oxygen has formed at the anode, and the hydrogen at the cathode. You can splint test each gas to show that hydrogen gives a squeaky pop and oxygen relights a glowing splint.
Draw pictures of beakers on the board and ask students what they would expect to have in a beaker of molten lead bromide, or molten sodium chloride.
123

Next ask what they would expect to find in a beaker of an aqueous solution of sodium chloride. You can reinforce this by talking about aqueous solutions of potassium bromide or any other metal halide.
Through discussion, explain to students what happens when you pass a current through a molten solution and through an aqueous solution, discuss what happens at the electrodes and which elements will be formed in each case.
For higher tier students, you may wish to show them the half equations at each electrode.
Explain to students that they are going to model electrolysis through drama. (There is an opportunity here to collaborate or co-teach with a drama teacher). You can ask students to devise their own scripts for the ‘production’ or assign roles and give suggestions. There is scope here to discuss the reactivity series and the effect this will have on the element formed at each electrode, movement of the various ions through the solution and so on.
Review with students what they now understand about electrolysis of water and of aqueous solutions of metal halides.
Key questions What happens in the electrolysis of a molten solution of lead bromide? (They should realise that as bromine is in group 7, it accepts an
electron from lead – in fact lead has 2 electrons to donate so we have PbBr2 This means there are Br- ions and Pb2+ ions. In electrolysis,
the ions are split up and move towards their respective electrodes, where they either gain or lose electrons depending on their charge).
Which way does each ion move? (Students should realise that the lead ions move towards the negative electrode or cathode, and
the bromine ions move towards the positive electrode or anode).
What happens if we ionise water? (students may need leading here to understand that there are hydrogen ions and hydroxide ions).
If we have two ions making their way to an electrode, which one will produce an element? (Students should realise that the less reactive
element will usually be formed)
What happens at the cathode during electrolysis of water? (2𝐻+(𝑎𝑞) + 2𝑒− → 𝐻2(𝑔) )What happens at the anode during electrolysis of water? (4𝑂𝐻−(𝑎𝑞) → 2𝐻2𝑂(𝑙) + 𝑂2(𝑔) + 4𝑒−)
What exactly is contained in a beaker of NaCl solution? (draw out student ideas, perhaps by drawing a beaker on the board and asking
students to discuss what is in the beaker. They should realise that there are some water molecules as well as chlorine ions, sodium ions,
hydrogen ions and OH ions).
Which is more reactive, hydrogen or sodium? (group 1 metals are all more reactive than hydrogen)
So what will we get at the cathode? (answer, always hydrogen)
What would happen if there was a reasonably high concentration of halide ions in solution? (The halide ion is discharged and the halogen
is formed).
124
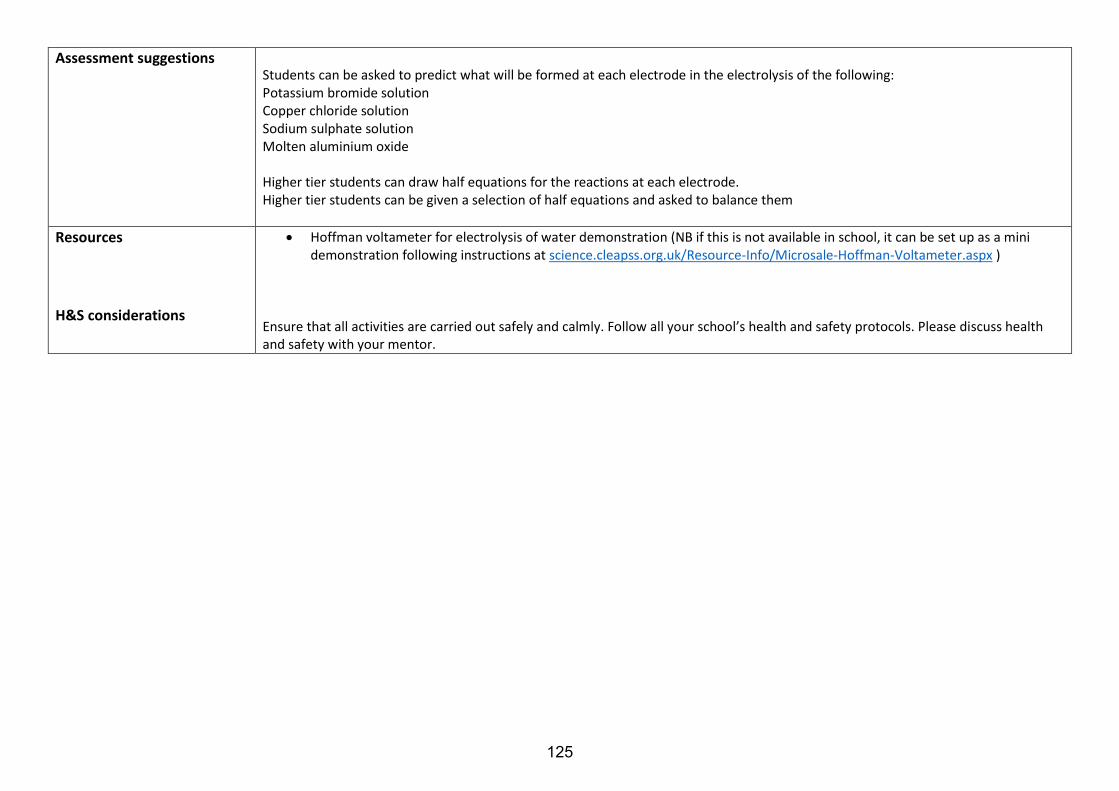
Assessment suggestions Students can be asked to predict what will be formed at each electrode in the electrolysis of the following: Potassium bromide solution Copper chloride solution Sodium sulphate solution Molten aluminium oxide
Higher tier students can draw half equations for the reactions at each electrode. Higher tier students can be given a selection of half equations and asked to balance them
Resources
H&S considerations
• Hoffman voltameter for electrolysis of water demonstration (NB if this is not available in school, it can be set up as a minidemonstration following instructions at science.cleapss.org.uk/Resource-Info/Microsale-Hoffman-Voltameter.aspx )
Ensure that all activities are carried out safely and calmly. Follow all your school’s health and safety protocols. Please discuss health and safety with your mentor.
125
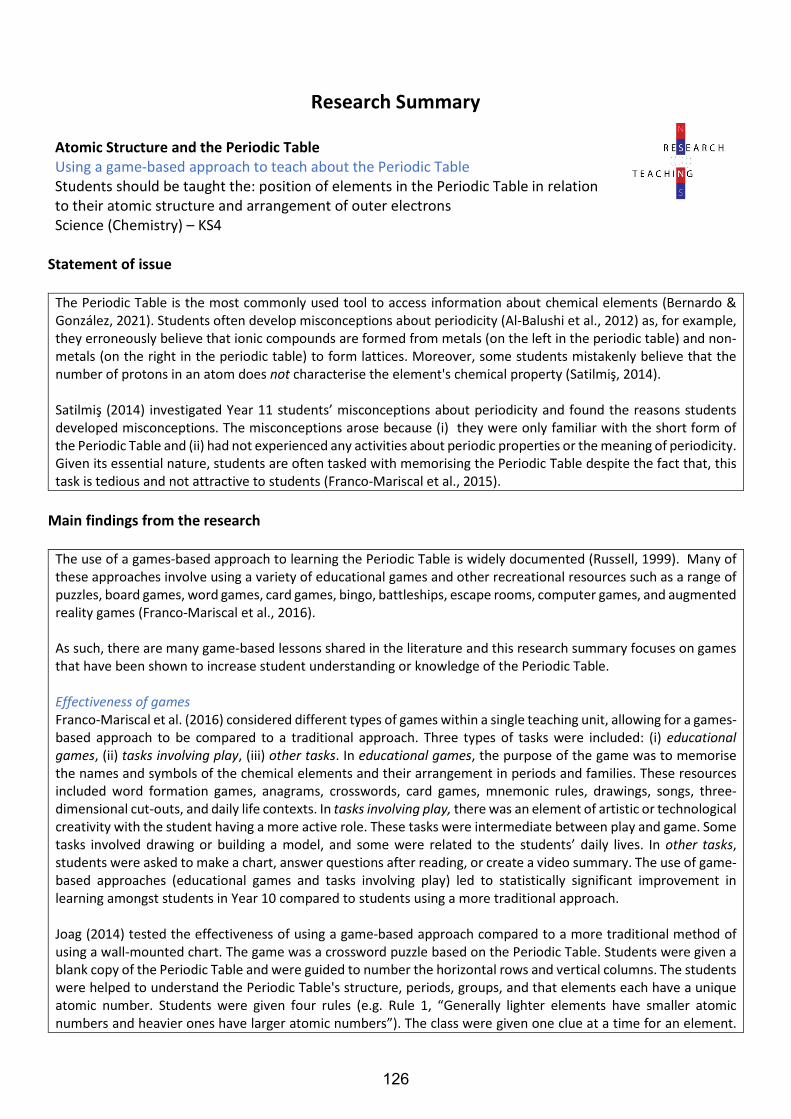
Research Summary
Atomic Structure and the Periodic Table Using a game-based approach to teach about the Periodic Table Students should be taught the: position of elements in the Periodic Table in relation to their atomic structure and arrangement of outer electrons Science (Chemistry) – KS4
Statement of issue
The Periodic Table is the most commonly used tool to access information about chemical elements (Bernardo & González, 2021). Students often develop misconceptions about periodicity (Al-Balushi et al., 2012) as, for example, they erroneously believe that ionic compounds are formed from metals (on the left in the periodic table) and non-metals (on the right in the periodic table) to form lattices. Moreover, some students mistakenly believe that the number of protons in an atom does not characterise the element's chemical property (Satilmiş, 2014).
Satilmiş (2014) investigated Year 11 students’ misconceptions about periodicity and found the reasons students developed misconceptions. The misconceptions arose because (i) they were only familiar with the short form of the Periodic Table and (ii) had not experienced any activities about periodic properties or the meaning of periodicity. Given its essential nature, students are often tasked with memorising the Periodic Table despite the fact that, this task is tedious and not attractive to students (Franco-Mariscal et al., 2015).
Main findings from the research
The use of a games-based approach to learning the Periodic Table is widely documented (Russell, 1999). Many of these approaches involve using a variety of educational games and other recreational resources such as a range of puzzles, board games, word games, card games, bingo, battleships, escape rooms, computer games, and augmented reality games (Franco-Mariscal et al., 2016).
As such, there are many game-based lessons shared in the literature and this research summary focuses on games that have been shown to increase student understanding or knowledge of the Periodic Table.
Effectiveness of games Franco-Mariscal et al. (2016) considered different types of games within a single teaching unit, allowing for a games-based approach to be compared to a traditional approach. Three types of tasks were included: (i) educational games, (ii) tasks involving play, (iii) other tasks. In educational games, the purpose of the game was to memorise the names and symbols of the chemical elements and their arrangement in periods and families. These resources included word formation games, anagrams, crosswords, card games, mnemonic rules, drawings, songs, three-dimensional cut-outs, and daily life contexts. In tasks involving play, there was an element of artistic or technological creativity with the student having a more active role. These tasks were intermediate between play and game. Some tasks involved drawing or building a model, and some were related to the students’ daily lives. In other tasks, students were asked to make a chart, answer questions after reading, or create a video summary. The use of game-based approaches (educational games and tasks involving play) led to statistically significant improvement in learning amongst students in Year 10 compared to students using a more traditional approach.
Joag (2014) tested the effectiveness of using a game-based approach compared to a more traditional method of using a wall-mounted chart. The game was a crossword puzzle based on the Periodic Table. Students were given a blank copy of the Periodic Table and were guided to number the horizontal rows and vertical columns. The students were helped to understand the Periodic Table's structure, periods, groups, and that elements each have a unique atomic number. Students were given four rules (e.g. Rule 1, “Generally lighter elements have smaller atomic numbers and heavier ones have larger atomic numbers”). The class were given one clue at a time for an element.
126
Joag split 200 Year 11 students into two groups, 100 students experienced the crossword puzzle, and 100 students received the traditional approach. They found students who used the crossword puzzle performed statistically significantly better when tested on their understanding the Periodic Table, in terms of their understanding of periodicity and prediction of properties, than students who experienced the traditional teaching method. Engagement with games Franco-Mariscal et al. (2016) found that when games were used to support learning about the Periodic Table, they the students preferred the educational games to those tasks involving play in terms of engagement. Previously Franco-Mariscal et al., (2015) investigated 127 Year 10 students’ perceptions of educational games for the Periodic Table. They found that students positively perceived education games, and games were more favourable to the control group's traditional teaching method. Whilst in this case, student perception and increased engagement does not necessarily mean increased learning gains, educational games and tasks involving play within a small group context can be useful to support Periodic Table learning (Bernardo & González, 2021; Franco-Mariscal et al., 2016). It is important to remember that collaboration within groups to reward playing and learning might further support the learning (Franco-Mariscal et al., 2016).
Therefore, a lesson was produced to incorporate a games-based approach into teaching about the Periodic Table. References Al-Balushi, S. M., Ambusaidi, A. K., Al-Shuaili, A. H., & Taylor, N. (2012). Omani twelfth grade students' most common
misconceptions in chemistry. Science Education International, 23(3), 221-240. Bernardo, J. M., & González, A. (2021). Chemical Battleship: Discovering and learning the Periodic Table playing a
didactic and strategic board game. Journal of Chemical Education. Franco-Mariscal, A. J., Oliva-Martínez, J. M., & Almoraima Gil, M. L. (2015). Students’ perceptions about the use of
educational games as a tool for teaching the periodic table of elements at the high school level. Journal of Chemical Education, 92(2), 278-285.
Franco-Mariscal, A. J., Oliva-Martínez, J. M., Blanco-López, Á., & Espana-Ramos, E. (2016). A game-based approach to learning the idea of chemical elements and their periodic classification. Journal of Chemical Education, 93(7), 1173-1190.
Joag, S. D. (2014). An effective method of introducing the periodic table as a crossword puzzle at the high school level. Journal of Chemical Education, 91(6), 864-867.
Russell, J. V. (1999). Using games to teach chemistry: An annotated bibliography. Journal of Chemical Education, 76(4), 481-484.
Satilmiş, Y. (2014). Misconceptions about periodicity in secondary chemistry education: The case of Kazakhstan. International Online Journal of Primary Education, 3(2), 53-58.
127
Lesson Plan
Atomic structure and the Periodic Table
Using a game-based approach to teach about the Periodic Table
Students should be taught about: The position of the elements in the Periodic Table in relation to their atomic structure and the
arrangement of outer electrons
Science (Chemistry) – KS4
Research recommendation(s) and rationale
The Periodic Table is the most commonly used tool to access information about chemical elements (Bernardo & González, 2021). Students often develop misconceptions about periodicity (Al-Balushi et al., 2012) as, for example, they erroneously believe that ionic compounds are formed from metals (on the left in the periodic table) and non-metals (on the right in the periodic table) to form lattices. Moreover, some students mistakenly believe that the number of protons in an atom does not characterise the element's chemical property (Satilmiş, 2014). Satilmiş (2014) investigated Year 11 students’ misconceptions about periodicity and found the reasons students developed misconceptions. The misconceptions arose because (i) they were only familiar with the short form of the Periodic Table and (ii) had not experienced any activities about periodic properties or the meaning of periodicity. Given its essential nature, students are often tasked with memorising the Periodic Table despite the fact that, this task is tedious and not attractive to students (Franco-Mariscal et al., 2015).
Lesson aim To teach the Periodic Table through a games-based approach
Learning objective Be able to describe the position of elements in the Periodic Table in relation to their atomic structure and the arrangement of outer electrons.
Intended learning outcomes Students should:
• Describe how atomic structure is related to the Periodic Table
• Discuss how metals and non-metals differ in their electronic structure and position in the Periodic Table
Scientific vocabulary Proton – a positively charged particle found in the nucleus Neutron – a neutrally charged particle found in the nucleus Electron – a negatively charged particle found in the atom but outside the nucleus in electron ‘shells’ Atomic number – the number of protons in the nucleus Mass number – the average number of protons and neutrons in the nucleus Relative atomic mass – the ratio of the average mass of one atom of an element to one twelfth of the mass of an atom of carbon-12 Isotope – an element with the same number of protons but different numbers of neutrons
128

Suggested lesson sequence and activities
You will need to make a set of cards with information about the first 20 elements in the Periodic Table (differentiated according to the students you are teaching) and photocopy a large (A3) version of the Periodic Table. At the beginning of the lesson, introduce the students to the notation used on the Periodic Table and explain what each of the numbers and symbols in each box of the Periodic Table represents. Explain carefully that the atomic number represents both the proton number and the number of electrons in a neutral atom of the element. Depending on the class, you can discuss the mass number or the relative atomic mass. It might be worth considering chlorine’s mass number (35.5) and discussing isotopes at this point. Tell students that they will receive a set of cards with information on them and it is their job to match their cards to elements on the Periodic Table. There is plenty of scope for differentiation here. For example, lower ability students can be given cards that show a chemical symbol or the atomic number. Higher ability students could be given cards with number of neutrons or electronic structure. Taking sodium for example, students could be given any (or all) of the following information: The atom has 11 protons in its nucleus The atom has 11 electrons surrounding its nucleus The atom usually has 12 neutrons in its nucleus The atom has 1 more electron than neon The atom has twice as many neutrons as carbon The electronic structure of this atom is 2, 8, 1 (or a pictorial representation of this) The atom is directly to the left of an atom with the electronic structure 2,8,2 (or pictorial representation) Once students have completed the activity, discuss what they have found out. Draw their attention to the following:
• The atomic number determines the position on the Periodic Table
• The number of electrons in the outer shell determines the element’s chemical properties
• The group number in the Periodic Table is equal to the number of electrons in the outer shell
• Metals tend to lose electrons whereas non-metals tend to gain them
• The elements in group 8 are unreactive because they have full outer shells
Key questions What patterns have you found?
What do all the elements in a particular group have in common?
What does the group number in the Periodic Table tell you about the electronic structure of the elements in the group?
How many elements in the Periodic Table are metals?
Why do the noble gases exist as single-atom gases whereas all other gases do not?
129
Assessment suggestions Students can be asked the following: In the Periodic Table, what is a group and what is a period? Potassium is in group 1, period 3, predict its electronic structure. How many electrons do each of the following have in their outer shells: Boron, Nitrogen, Helium, Radium, Xenon, Iodine, Phosphorus, Selenium, Bromine, Barium, Francium. Why do elements in the same group have similar chemical properties? Predict what happens to reactivity as you go down group 1 (Higher tier only) Predict what happens to reactivity as you go down group 7 (Higher tier only)
Resources H&S considerations
Before the lesson, produce some element information cards using the suggestions above. Ensure that all activities are carried out safely and calmly. Follow all your school’s health and safety protocols. Please discuss health and safety with your mentor.
130
Research Summary
Radioactivity Using an analogue activity to teach about radioactivity decay Students should be taught about: radioactive materials, half-life, irradiation, contamination and their associated hazardous effects, waste disposal. Science (Physics) – Key stage 4
Statement of issue
Students find radioactivity difficult to understand because they cannot feel it with their senses (Siersma et al., 2021). Therefore, teachers need not only to fully understand the physics related to this topic but also to be aware of the pedagogical difficulties associated with teaching about it (Strike & Posner, 1985; Hunt & Minstrell, 1996). Moreover, in a recent study, Morales and Tuzón (2020) found that the scientific teaching literature of the last 40 years has reported a great deal of misconceptions and conceptual errors related to radioactivity, which appear regardless of the context. The most common misconceptions are: (i) the terms ‘radioactivity’, ‘radiation’ and ‘radioactive material’ are often mixed up and ambiguously used (e.g. - Kaczmarek et al., 1987; Prather, 2005; Sesen & Ince, 2010), (ii) the terms ‘irradiation’ and ‘contamination’ are indistinguishably used (e.g. - Millar & Gill, 1996), (iii) the terms ‘isotope’, ‘radioisotope’, ‘atom’, and ‘chemical element’ are often confused or vaguely differentiated (e.g. - Nuclear Science Division & CPEP, 2017), and (iv) nuclear fusion and fission reactions are usually confused (e.g. - Tsaparlis et al., 2013).
Main findings from the research
To teach about radioactivity effectively, it is important to know which conceptions appeal most to students (Siersma et al., 2021). The teacher then can anticipate potential conceptual problems and hybrid ideas (Duit & Treagust, 2003; Potvin, 2017). Research suggests that analogies are useful in science teaching, as teachers can use a concrete or familiar source concept to essentially serve as a picture or metaphor that explains an abstract or unfamiliar target concept (Duit, 1991, Dupin & Joshua, 1989). This is particularly useful for physics, where many key concepts and processes are not visible or apparent on the Earth’s surface or on human timescales (Jee et al., 2010). Along with internalising the target concept, as students develop analogical reasoning skills, they are mimicking the reasoning skills used by scientists to create and use models for scientific phenomena (Sibley, 2009). These skills are essential for scientific literacy, and a lack of this understanding has been cited as one reason many students struggle with science in general (White & Frederiksen, 1998).
An analogy activity The use of analogies and analogical models in teaching has been shown to enhance students’ conceptual understanding and to enable them to build essential scientific reasoning skills (Jee et al., 2010). Therefore, several researchers have developed explicit guidelines for teaching with analogies. Dupin and Joshua (1989, p. 207) describe a set of guidelines with five characteristics as a ‘‘modelling analogy”, as it uses a hands-on physical model to relay the source concept (see also Jee et al., 2010). Later, Glynn (1991) proposed the “teaching with the analogue model” (p. 219), which has proven highly effective (see Harrison & Treagust, 1993; and similar instructional supports described in Jee et al., 2010). Glynn’s (1991) model for teaching with analogue highlights six main characteristics, including: (i) introduce the target concept to be learned, (ii) cue the students’ memory of the analogous situation, (iii) identify the relevant features of the analogy, (iv) map the similarities between the analogy and the targetconcepts, (v) identify the comparisons for which the analogy breaks down, and (vi) draw conclusions about thetarget concepts.
Claiborne and Miller (2012) carried out a laboratory activity for teaching about radioactive decay by using hydrodynamic processes as an analogue, and examined its efficacy with undergraduate students (18-22 years old). A fluid flowing from an upper beaker into a lower beaker (the study used shampoo) behaves mathematically identically to radioactive decay, mimicking the exponential decay process, depending on the amount of fluid in the upper beaker (which represents the amount of parent isotopes) and the size of the hole in the beaker (which
131
represents the decay constant). The participating students in Claiborne and Miller’s (2012) study measured the fluid depth with time for several runs with varied conditions, then graphed their results, created decay equations, manipulated these equations and used them to date another experiment. They then applied their new understanding to make predictions regarding complications involved in the decay process and its use in dating (such as daughter loss).
The findings from the study indicated that teaching using an analogue activity enhances students’ understanding of difficult, non-intuitive, unfamiliar concepts by relating them to more intuitive, familiar concepts, if the analogue is sufficiently similar to the target concept (Claiborne & Miller, 2012). The study claims that the laboratory activity carried out allows students to take advantage of the structural similarities of these two processes by studying and manipulating familiar and easily understood hydrodynamic principles and processes and relating them to the less accessible principles and processes of radioactive decay. The results of the study illustrate the effectiveness of the analogue activity as a powerful teaching tool for an important, but very difficult and often misunderstood, concept integral to many basic sciences.
An analogue activity can take many forms In an earlier study, Schultz (1997) suggested a simple and easily understood experiment involving dice-shaking, which can be used as an analogy to teach about radioactive decay. The dice-shaking analogue activity, in addition to establishing an intuitive view of the concepts of radioactivity and half-life, provides a natural connection to the mathematical formalism and graphical treatment that describes radioactive decay.
Similarly, McGeachy (1988) conducted an analogue activity using three sets of coloured playing cards (red, blue, and green). The red cards represent unstable nuclei, the green cards represent stable nuclei, and the blue cards represent background radiation. The study suggests the advantages of the analogue are: (i) “mass” of the sample is maintained throughout the study; and (ii) “radiations” counted by the “detector” don’t necessarily originate in unstable nuclei of the sample, thus reflecting more closely the problems of measuring half-life (McGeachy, 1988, p. 29). The analogue can be adjusted to stimulate a radioactive source containing more than one radioactive substance, each with a different half-life.
In summary, research suggests that the use of analogue activities in the science classroom not only promotes students’ conceptual understanding of radioactivity, but also can be easily carried out, particularly when schools do not have radioactive sources and/or lack Geiger counters – an instrument used for detecting and measuring ionising radiation (Jona & Vondracek, 2013).
Therefore, a lesson plan was produced to incorporate an analogue activity to teach students about radioactive decay.
References
Claiborne, L. L., & Miller, C. F. (2012). Teaching radioactive decay and radiometric dating: An analog activity based on fluid dynamics. Journal of Geoscience Education, 60(2), 114-122.
Duit, R. (1991). On the role of analogies and metaphors in learning science. Science Education, 75, 649–672. Duit, R., & Treagust, D. F. (2003). Conceptual change: A powerful framework for improving science teaching and
learning. International Journal of Science Education, 25(6), 671-688. Dupin, J. J., & Joshua, S. (1989). Analogies and ‘‘modeling analogies’’ in teaching: Some examples in basic electricity.
Science Education, 73, 207–224. Glynn, S. M. (1991). Explaining science concepts: A teaching-with-analogies model. In S. Glynn, R. Yeany, & B. Britton
(Eds.), The psychology of learning science (pp. 219-240). Erlbaum. Harrison, A. G., & Treagust, D. F. (1993). Teaching with analogies: A case study in grade-10 optics. Journal of Research
in Science Teaching, 30, 1291–1307. Hunt, E., & Minstrell, J. (1996). Effective instruction in science and mathematics: Psychological principles and social
constraints. Issues in Education, 2(2), 123–162. Jee, B. D., Uttal, D. H., Gentner, D., Manduca, C., Shipley, T. F., Tikoff, B., Ormand, C. J., & Sageman, B. (2010).
Commentary: Analogical thinking in geoscience education. Journal of Geoscience Education, 58(1), 2-13. Jona, K., & Vondracek, M. (2013). A remote radioactivity experiment. The Physics Teacher, 51(1), 25-27.
132
Kaczmarek R., Bednarek D., & Wong R. (1987). Misconceptions of medical students about radiological physics. Health Physics, 52,106-108.
McGeachy, F. (1988). Radioactive decay-An analog. Physics Teacher, 26(1), 28-29. Millar, R., & Gill, J. S. (1996). School students’ understanding of processes involving radioactive substances and ionizing
radiation. Physics Education, 31(1), 27. Morales, A. I., & Tuzón, P. (2020). Misconceptions, knowledge, and attitudes of secondary school students towards
the phenomenon of radioactivity. arXiv e-prints. Retrieved April 10, 2021, from https://arxiv.org/abs/2001.07746
Nuclear Science Division, & CPEP (the Contemporary Physics Education Project) (2017). The nuclear wall chart: Winner of the distinguished award from the Northern California Chapter of the Society for Technical Communication. Retrieved April 10, 2021, from https://www2.lbl.gov/abc/wallchart/index.html
Potvin, P. (2017). The coexistence claim and its possible implications for success in teaching for conceptual “change”. European Journal of Science and Mathematics Education, 5(1), 55–66.
Prather E. (2005). Students’ beliefs about the role of atoms in radioactive decay and half-life. Journal of Geoscience Education, 53, 345-354.
Schultz, E. (1997). Dice shaking as an analogy for radioactive decay and first order kinetics. Journal of Chemical Education, 74(5), 505.
Sesen, B. A., & Ince, E. (2010). Internet as a source of misconception: Radiation and radioactivity. The Turkish Online Journal of Educational Technology, 9, 94-100.
Sibley, D. F. (2009). A cognitive framework for reasoning with scientific models. Journal of Geoscience Education, 57(4), 255-263.
Siersma, P. T., Pol, H. J., van Joolingen, W. R., & Visscher, A. J. (2021). Pre-university students’ conceptions regarding radiation and radioactivity in a medical context. International Journal of Science Education, 43(2), 179-196.
Strike, K. A., & Posner, G. J. (1985). A conceptual change view of learning and understanding. In L. West, & L. Pines (Eds.), Cognitive structure and conceptual change (pp. 259–266). Academic Press.
Tsaparlis, G., Hartzavalos, S., & Nakiboğlu, C. (2013). Students’ knowledge of nuclear science and its connection with civic scientific literacy in two European contexts: The case of newspaper articles. Science & Education, 22(8), 1963-1991.
White, B. Y., & Frederiksen, J. R. (1998). Inquiry, modeling, and metacognition: Making science accessible to all students. Cognition and Instruction, 16(1), 3-118.
133

Lesson Plan
RadioactivityUsing analogies to teach about radioactive decay
Students should be taught about: modelling radioactive decay using analogical models
Science (Physics) – KS4
Research recommendation(s) and rationale
To teach about radioactivity effectively, it is important to know which conceptions appeal most to students (Siersma et al., 2021). The teacher then can anticipate potential conceptual problems and hybrid ideas (Duit & Treagust, 2003; Potvin, 2017). Research suggests that analogies are useful in science teaching, as teachers can use a concrete or familiar source concept to essentially serve as a picture or metaphor that explains an abstract or unfamiliar target concept (Duit, 1991, Dupin & Joshua, 1989). This is particularly useful for physics, where many key concepts and processes are not visible or apparent on the Earth’s surface or on human timescales (Jee et al., 2010). Along with internalising the target concept, as students develop analogical reasoning skills, they are mimicking the reasoning skills used by scientists to create and use models for scientific phenomena (Sibley, 2009). These skills are essential for scientific literacy, and a lack of this understanding has been cited as one reason many students struggle with science in general (White & Frederiksen, 1998).
Lesson aim To teach radioactive decay using models and analogies
Learning objective Be able to:
• describe radioactive decay as random
• define half-life
• explain the concept of half-life and how it relates to the random nature of radioactive decay
• determine the half-life of a radioactive isotope from information given
Intended learning outcomes Students should:
• Describe radioactive decay as random in nature
• Define half-life as the time it takes from half of the undecayed nuclei to decay
• Explain the concept of half-life with respect to the random nature of decay
• Compute the half-life of an isotope using information given
Scientific vocabulary Isotope – an atom with equal numbers of protons but different numbers of neutrons Half-life – the time it takes for half of the radioactive elements to decay (or the time it takes for activity to fall to half its original value) Radioactive decay – spontaneous breakdown of an unstable nucleus into a lighter nucleus Random – happening by chance
134
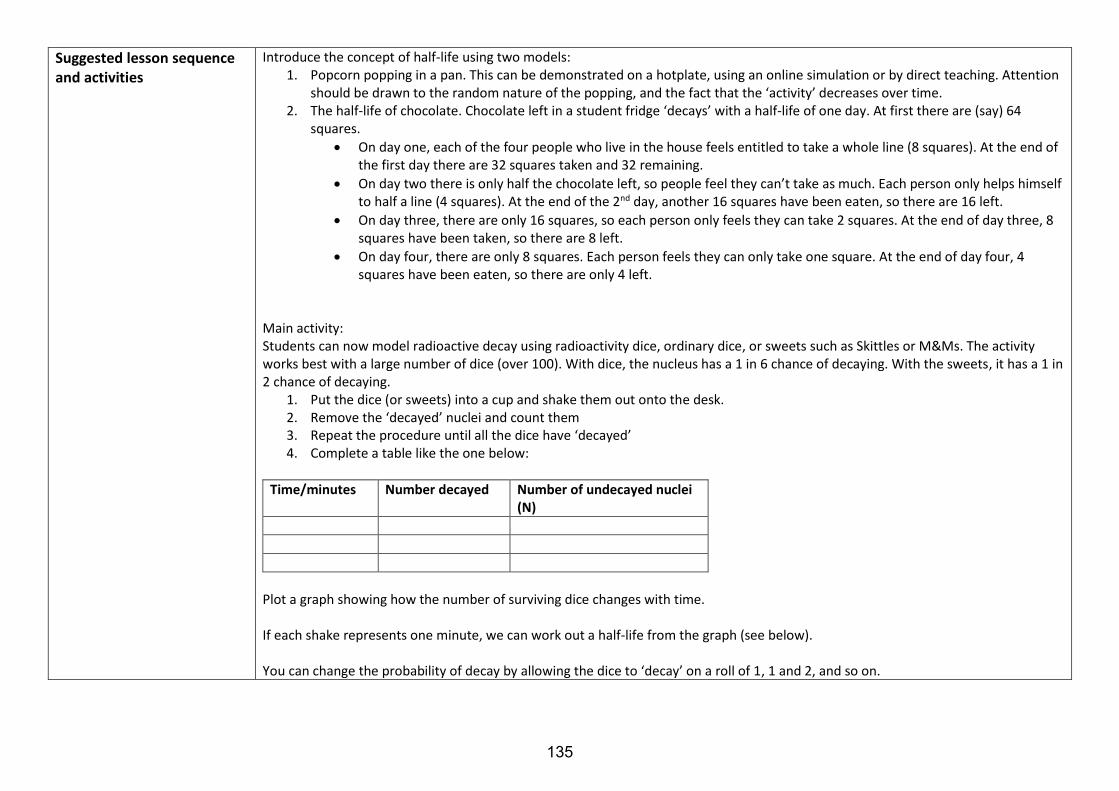
Suggested lesson sequence and activities
Introduce the concept of half-life using two models: 1. Popcorn popping in a pan. This can be demonstrated on a hotplate, using an online simulation or by direct teaching. Attention
should be drawn to the random nature of the popping, and the fact that the ‘activity’ decreases over time.2. The half-life of chocolate. Chocolate left in a student fridge ‘decays’ with a half-life of one day. At first there are (say) 64
squares.
• On day one, each of the four people who live in the house feels entitled to take a whole line (8 squares). At the end ofthe first day there are 32 squares taken and 32 remaining.
• On day two there is only half the chocolate left, so people feel they can’t take as much. Each person only helps himselfto half a line (4 squares). At the end of the 2nd day, another 16 squares have been eaten, so there are 16 left.
• On day three, there are only 16 squares, so each person only feels they can take 2 squares. At the end of day three, 8squares have been taken, so there are 8 left.
• On day four, there are only 8 squares. Each person feels they can only take one square. At the end of day four, 4squares have been eaten, so there are only 4 left.
Main activity: Students can now model radioactive decay using radioactivity dice, ordinary dice, or sweets such as Skittles or M&Ms. The activity works best with a large number of dice (over 100). With dice, the nucleus has a 1 in 6 chance of decaying. With the sweets, it has a 1 in 2 chance of decaying.
1. Put the dice (or sweets) into a cup and shake them out onto the desk.2. Remove the ‘decayed’ nuclei and count them3. Repeat the procedure until all the dice have ‘decayed’4. Complete a table like the one below:
Time/minutes Number decayed Number of undecayed nuclei (N)
Plot a graph showing how the number of surviving dice changes with time.
If each shake represents one minute, we can work out a half-life from the graph (see below).
You can change the probability of decay by allowing the dice to ‘decay’ on a roll of 1, 1 and 2, and so on.
135
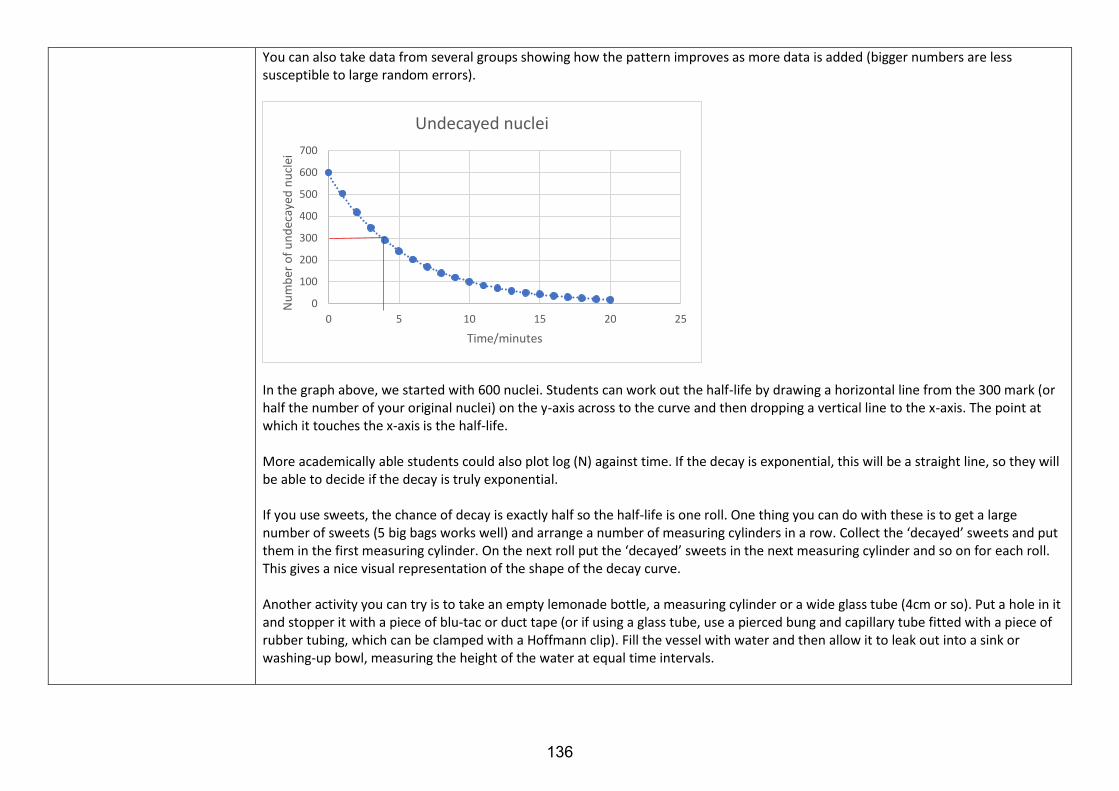
You can also take data from several groups showing how the pattern improves as more data is added (bigger numbers are less susceptible to large random errors).
In the graph above, we started with 600 nuclei. Students can work out the half-life by drawing a horizontal line from the 300 mark (or half the number of your original nuclei) on the y-axis across to the curve and then dropping a vertical line to the x-axis. The point at which it touches the x-axis is the half-life.
More academically able students could also plot log (N) against time. If the decay is exponential, this will be a straight line, so they will be able to decide if the decay is truly exponential.
If you use sweets, the chance of decay is exactly half so the half-life is one roll. One thing you can do with these is to get a large number of sweets (5 big bags works well) and arrange a number of measuring cylinders in a row. Collect the ‘decayed’ sweets and put them in the first measuring cylinder. On the next roll put the ‘decayed’ sweets in the next measuring cylinder and so on for each roll. This gives a nice visual representation of the shape of the decay curve.
Another activity you can try is to take an empty lemonade bottle, a measuring cylinder or a wide glass tube (4cm or so). Put a hole in it and stopper it with a piece of blu-tac or duct tape (or if using a glass tube, use a pierced bung and capillary tube fitted with a piece of rubber tubing, which can be clamped with a Hoffmann clip). Fill the vessel with water and then allow it to leak out into a sink or washing-up bowl, measuring the height of the water at equal time intervals.
0
100
200
300
400
500
600
700
0 5 10 15 20 25
Nu
mb
er o
f u
nd
ecay
ed n
ucl
ei
Time/minutes
Undecayed nuclei
136

Students can be asked to plot height (y-axis) against time (x-axis) and draw a curve. More-able student can be asked to plot log (h) against time. If the decay is exponential, they will get a straight line. In practice, the ‘decay’ of water is not truly exponential. This provides a good opportunity to discuss with students how well the model corresponds to reality.
Key questions How well does our popcorn model show radioactive decay? (Shows random nature of decay well but does not allow us to compute
half-life).
How well does our chocolate model show radioactive decay? (Shows half-life clearly but not random – you can guess which bit of
chocolate will ‘decay’ next).
What does it mean to say a nucleus has ‘decayed’? (The nucleus has undergone a change and now has a different number of protons
and neutrons and is therefore a different chemical element).
Does it matter how many dice/sweets you started with? (The numbers will differ, but the pattern is the same. For a particular
radionuclide, the time it takes for half the remaining atoms to decay is constant).
What happens when you get down to very small numbers? (The random nature of decay means that the pattern may not be as clear).
What are the limitations of our model? (One that you might wish to emphasise is that we have a relatively small number of ‘nuclei’
here. In reality, a radioactive sample contains many millions of nuclei, so although activity falls over time, it never reaches zero,
whereas we might have no dice left).
What is half-life? (The time it takes for half of the undecayed nuclei to decay, or the time it takes for the activity to fall to half of its
original value).
Assessment suggestions Students can compare each of the models and describe the strengths and weaknesses of each.
Resources
H&S considerations
Radioactivity dice Sweets such as M&Ms or Skittles (5 or more large bags works well for a class) Water model – 2 litre lemonade bottle or measuring cylinder with a hole in the bottom sealed with blu-tac or duct tape, or a wide glass tube fitted with a holed bung and capillary tube clamped with a Hoffmann clamp Marker pen Stopwatch Retort stand Boss and clamp
If using sweets, impress upon the students that they should not eat the sweets.
137
Research Summary
Wave motion Using musical instruments to teach about sound waves Students should be taught about: (i) amplitude, wavelength, frequency, relating velocity to frequency and wavelength, and (ii) transverse and longitudinal waves. Science (Physics) – Key stage 4
Statement of issue
Research has shown that students hold various misconceptions regarding the notion of sound. The literature has identified two major misconceptions (Houle & Barnett, 2008). The first major consensus across the existing literature suggests that students tend to hold a materialistic view of sound. Students view sound as a substance with the physical properties of matter rather than as a process of energy transmission through a substance (see Eshach & Schwartz, 2006; Linder & Erickson, 1989; Mazens & Lautrey, 2003; Wittmann et al., 1999). A second theme emerging from the small body of research highlights confusion regarding students’ written representations of sound as a transverse wave (Houle & Barnett, 2008). Sound is often portrayed in textbooks and lectures as a sinusoidal wave (see Linder, 1992; Eshach & Schwartz, 2006). While these waveforms may be useful in discussing the characteristics of waves, sound actually travels as a compression wave (Houle & Barnett, 2008).
Main findings from the research
Identifying students’ preconceptions, therefore, is a necessary stage in increasing teachers’ awareness of the difficulties and barriers faced by their students in understanding scientific phenomena (Eshach & Schwartz, 2006). This awareness, in turn, will enable teachers to design better and more effective learning environments (Galili & Hazan, 2000). Such learning environments that take into account students’ preconceptions may enable them to examine and refine their initial concepts and use them as solid anchors in the process of building scientific concepts (Clement, 1983; Smith et al., 1993).
In order to reconstruct students’ ideas and explain scientific phenomena, researchers presented a project in which the notion of sound was studied through students’ interaction with musical instruments. More specifically, LoPresto (2008) presented an experiment using computers and musical instruments, for introducing university students to Fourier synthesis and analysis. The study suggests that the approach of analysing and synthesising the waves produced by musical instruments provide a suitable and real-world example of the use of Fourier analysis. Moreover, Hechter and Bergman (2016) also explored harmonics and sound propagation with Year 12 students, both from the perspective of music and of physics, through the use of musical instruments and tablets. The findings from the study indicate that, at the end of the lesson, students can synthesise sounds of various instruments using computer-generated sine waves.
Iliaki et al. (2019) conducted a study to identify the evolution of students’ conceptions regarding the nature of sound and its properties (frequency, intensity and frequency spectrum) through a teaching-learning sequence about sound phenomena in an authentic musical context. The participants in the study were eight pre-service teachers, who had already attended an introductory physics course. During the teaching intervention, three musical instruments were used: two violins and a soprano recorder. The produced sounds were analysed by an Android smartphone in real time, aiming to present the correlation between the properties of sound waves (frequency, amplitude/intensity and frequency spectrum) with their graphical representation, as these were illustrated in the waveform and with the perceptive characteristics of sound (pitch, loudness and timbre).
The findings from the study revealed that during the teaching intervention, all student teachers evolved their ideas about sound-related concepts such as pitch, loudness and timbre and managed to consolidate links between the perceptive everyday experience of sounds and the underlying science concepts, notably frequency, intensity and frequency spectrum (Iliaki et al., 2019). As a result, at the end of the teaching experiment, half of the student teachers interpreted the sound as a composite wave with properties, while the rest interpreted it as a wave with
138
properties. To be specific, the student teachers involved in the study evolved their ideas about sound from a naïve to a more sophisticated level. Generally, the results of the study illustrate that it is possible to introduce concepts of sound such as frequency, intensity, and frequency spectrum to student teachers through the use of musical instruments and mobile applications.
Findings from other related research Two other studies investigated the use of Indonesian traditional musical instruments to teach about sound waves (see Naqiyah et al., 2019; Anwar et al., 2020). Naqiyah et al. (2019) developed physics learning tools based on local wisdom, using the musical instruments of Gandrang Bulo dance, as an educational tool for learning about sound waves. One characteristic of this dance is the musical instruments used, comprising typical South Sulawesi, Indonesian musical instruments, namely gendang bulo, suling bambu, and kacapaing. The study developed lesson plans with experts, physics teachers, and peer reviewers and trialled these with secondary school students. The study suggests that the students can relate well to the traditional musical instruments associated with the teaching of sound waves, and thus can be more actively involved in the physics learning process.
Meanwhile, Anwar et al. (2020) studied the basic concepts of the wave through traditional musical instruments integrated with computer-based software and smartphones, to identify the profile of and ways of improving pre-service physics teachers’ science process skills. The traditional musical instruments used were stringed instruments (Gambo Mbojo), wind instruments (Sundanese flute), and membrane instruments (Rebab), while the software used included Adobe AuditionTM. The results of the study concluded that the integration of traditional musical instruments and free software as part of the learning design, increased the quality of the physics learning process. This was also indicated by the improvement in participants’ science process skills, which had significantly increased after the teaching interventions.
Courtney and Althausen (2006) suggest using bass guitars, while Lago (2015) suggests using electric guitars as musical instruments to teach about sound waves. Lago’s (2015) study highlights that with the aid of an electric guitar, musical features such as tone, beats, harmonics (artificial and natural) and chord formation can easily be used to illustrate some physical concepts from a wave physics course among secondary school students. However, Courtney and Althausen (2006) argue that the use of a bass guitar rather than the six string electric guitar allows higher harmonics to be individually excited, and it is also easier for students to play the harmonics themselves. Courtney and Althausen’s (2006) study suggests that the bass guitar is not only an excellent instrument for teaching about wave physics and introducing Fourier analysis, but can also be a vehicle for demonstrating important ideas related to resonance energy transfer in photosynthesis and other phenomena among undergraduate students.
In summary, research suggests that musical instruments (traditional and contemporary) offer a great learning tool to teach about sound waves. The use of musical instruments should be assisted by computer applications and software to measure the properties of sound waves, such as frequency, intensity and the frequency spectrum, and/or their perceptive characteristics, such as pitch, loudness and timbre.
Therefore, a lesson plan was produced to incorporate musical instruments to teach students about sound waves.
References
Anwar, K., Rusdiana, D., Kaniawati, I., & Viridi, S. (2020). Teaching wave concepts using traditional musical instruments and free software to prepare prospective skillful millennial physics teachers. Journal of Physics: Conference Series, 1521(2).
Clement, J. (1983). A conceptual model discussed by Galileo and used intuitively by physics students. In D. Gentner, & A. L. Stevens (Eds.), Mental models (pp. 325–340). Lawrence Erlbaum Associates.
Courtney, M., & Althausen, N. (2006). Teaching fourier analysis and wave physics with the bass guitar. arXiv e-prints. Retrieved April 10, 2021, from https://arxiv.org/abs/physics/0605154
Eshach, H., & Schwartz, J. L. (2006). Sound stuff? Naïve materialism in middle-school students’ conceptions of sound. International Journal of Science Education, 28(7), 733-764.
Galili, I., & Hazan, A. (2000). Learners’ knowledge in optics: Interpretation, structure and analysis. International Journal of Science Education, 22(1), 57-88.
139
Hechter, R. P., & Bergman, D. (2016). In harmony: Inquiry based learning in a blended physics and music class. Physics Education, 51(6), 1-9.
Houle, M. E., & Barnett, G. M. (2008). Students’ conceptions of sound waves resulting from the enactment of a new technology-enhanced inquiry-based curriculum on urban bird communication. Journal of Science Education and Technology, 17(3), 242-251.
Iliaki, G., Velentzas, A., Michailidi, E., & Stavrou, D. (2019). Exploring the music: A teaching-learning sequence about sound in authentic settings. Research in Science & Technological Education, 37(2), 218-238.
Lago, B. L. (2015). A guitarra como um instrumento para o ensino de física ondulatória [The electric guitar as an instrument for teaching wave physics]. Revista Brasileira de Ensino de Física, 37(1), 1-9.
Linder, C. J. (1992). Understanding sound: So what is the problem?. Physics Education, 27(5), 258-264. Linder, C. J., & Erickson, G. L. (1989). A study of tertiary physics students’ conceptualizations of sound. International
Journal of Science Education, 11(5), 491-501. LoPresto, M. C. (2008). Experimenting with Fourier synthesis. Physics Education, 43(1), 30-36. Mazens, K., & Lautrey, J. (2003). Conceptual change in physics: Children’s naive representations of sound. Cognitive
Development, 18(2), 159-176. Naqiyah, M., Rosana, D., Sukardiyono, -., & Ernasari, -. (2019). Developing physics learning tools based on local wisdom
in the form of musical instrument of gandrang bulo dance as learning source in sound wave. Journal for the Education of Gifted Young Scientists, 7(3), 609-626.
Smith, J. P., DiSessa, A. A., & Roschelle, J. (1994). Misconceptions reconceived: A constructivist analysis of knowledge in transition. The Journal of the Learning Sciences, 3(2), 115-163.
Wittmann, M. C., Steinberg, R. N., & Redish, E. F. (1999). Making sense of how students make sense of mechanical waves. The Physics Teacher, 37(1), 15-21.
140
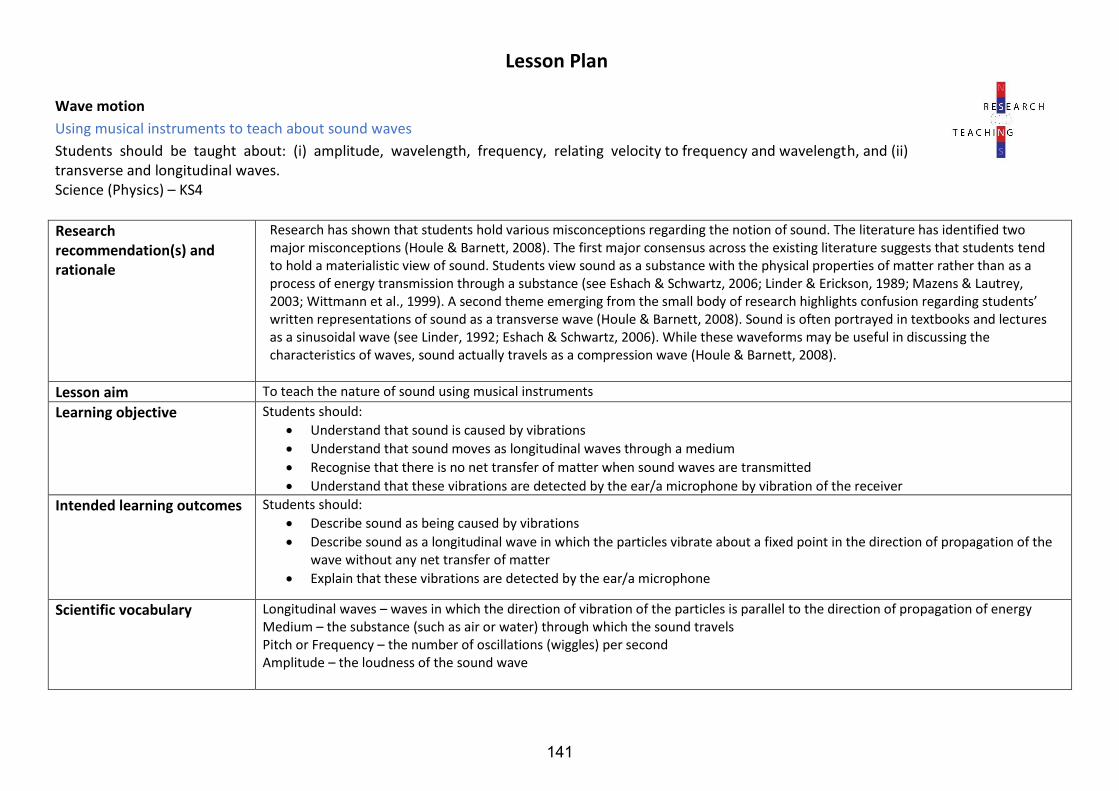
Lesson Plan
Wave motion
Using musical instruments to teach about sound waves
Students should be taught about: (i) amplitude, wavelength, frequency, relating velocity to frequency and wavelength, and (ii) transverse and longitudinal waves. Science (Physics) – KS4
Research recommendation(s) and rationale
Research has shown that students hold various misconceptions regarding the notion of sound. The literature has identified two major misconceptions (Houle & Barnett, 2008). The first major consensus across the existing literature suggests that students tend to hold a materialistic view of sound. Students view sound as a substance with the physical properties of matter rather than as a process of energy transmission through a substance (see Eshach & Schwartz, 2006; Linder & Erickson, 1989; Mazens & Lautrey, 2003; Wittmann et al., 1999). A second theme emerging from the small body of research highlights confusion regarding students’ written representations of sound as a transverse wave (Houle & Barnett, 2008). Sound is often portrayed in textbooks and lectures as a sinusoidal wave (see Linder, 1992; Eshach & Schwartz, 2006). While these waveforms may be useful in discussing the characteristics of waves, sound actually travels as a compression wave (Houle & Barnett, 2008).
Lesson aim To teach the nature of sound using musical instruments
Learning objective Students should:
• Understand that sound is caused by vibrations
• Understand that sound moves as longitudinal waves through a medium
• Recognise that there is no net transfer of matter when sound waves are transmitted
• Understand that these vibrations are detected by the ear/a microphone by vibration of the receiver
Intended learning outcomes Students should:
• Describe sound as being caused by vibrations
• Describe sound as a longitudinal wave in which the particles vibrate about a fixed point in the direction of propagation of thewave without any net transfer of matter
• Explain that these vibrations are detected by the ear/a microphone
Scientific vocabulary Longitudinal waves – waves in which the direction of vibration of the particles is parallel to the direction of propagation of energy Medium – the substance (such as air or water) through which the sound travels Pitch or Frequency – the number of oscillations (wiggles) per second Amplitude – the loudness of the sound wave
141
Suggested lesson sequence and activities
Introduce sound as a vibration. This can be done as a circus of activities or a series of teacher demonstrations. 1. Attach a fairly large loudspeaker to a signal generator set at an audible (but not annoying) frequency (a few hundred Hz is
ideal). Put the loudspeaker so the cone is facing up and sprinkle a few rice grains over it (you can protect it if necessary with apiece of cling film placed over the speaker).- Ask students to increase the volume. They should observe that the rice moves more violently (i.e., with greater amplitude)
and that the loudness of the sound increases.- Ask students to increase the frequency. They should observe that the rice moves more rapidly and that the pitch of the
sound gets higher.2. Ask students to speak or hum whilst touching the front of the throat. They should feel a vibration as they speak. This is even
more obvious if they locate the gap in the thyroid cartilage either side of the larynx and place a finger and thumb over it asthey speak. However, they should be told not to press too hard as it may be unpleasant, and they may hurt themselves.
3. Strum a guitar string and show students the vibration of the string as they hear the sound.4. Strike a tuning fork on the side of the desk. Students should be able to see it moving as they hear the note. If they have
difficulty seeing this, you can ask them to touch the end of the tuning fork to their ear lobe. They will feel the vibration.5. If you have access to a Ruben’s Tube, connect it to a signal generator or an amplifier and mp3 player or similar. The flames
‘dance’ due to variations of pressure in the tube.6. Set up a large loudspeaker connected to an amplifier and an mp3 player, phone or similar. Put a candle in front of the speaker.
Play a good ‘bassy’ song through the speaker. The candle should ‘dance’ as the flame moves back and forth due to thevibrations of the air.
Main activity: Draw together the ideas that in order to hear sound, the source of the sound must be vibrating. However, we know that this isn’t the whole story. In the case of the dancing candle (and the Ruben’s Tube if used) we can see that the air must also be vibrating. In order to model this, we can use a slinky spring.
Set up the slinky spring. This works well if it is stretched fairly tightly across a bench, either held at the far end by a student or attached to a retort stand clamped to the desk (or held down with several kg masses placed on the base).
142

Point out to students that although they can see the ‘wave’ travel across the bench, the spring does not move. When the wave stops, all the coils of the spring have returned to their original places. Thus, the spring is capable of transmitting the wave information without itself moving. All that is happening is that the coils in the spring are vibrating back and forth. If students are unconvinced, try tying a ribbon to a coil to show that the coil vibrates about a fixed point. This is a good place to introduce the terminology that a wave whose molecules vibrate parallel to the direction of wave travel is called a longitudinal wave. Examples of longitudinal waves are sound and ultrasound (which is just sound at a frequency too high for humans to hear).
Draw out the similarities between our model (the slinky) and the air. The molecules in the air are spaced out with nothing between them. In our model, the slinky coils represent the molecules and the air between them represents our ‘nothing’. When the source of our sound vibrates, it causes the air molecules nearest it to vibrate (remind students about the candle flame). Those vibrations are passed on to the next molecules, and the next, and so on, until the air next to our eardrum is vibrating (with the same loudness and pitch). These vibrations are picked up by the eardrum, which starts to vibrate at the same frequency. Loud sounds make the eardrum vibrate with greater amplitude.
We can model the air molecules as being equally spaced out initially. When a sound wave passes through them, the molecules oscillate backwards and forwards, creating areas of compression (molecules close together) and rarefaction (molecules further apart)
This is a good opportunity to draw a model on the board (or produce a worksheet and talk through it – or both).
Pluck the spring by drawing a few coils
together and letting go. You should see the
‘compression wave’ moving across the table
Direction of wave travel
143
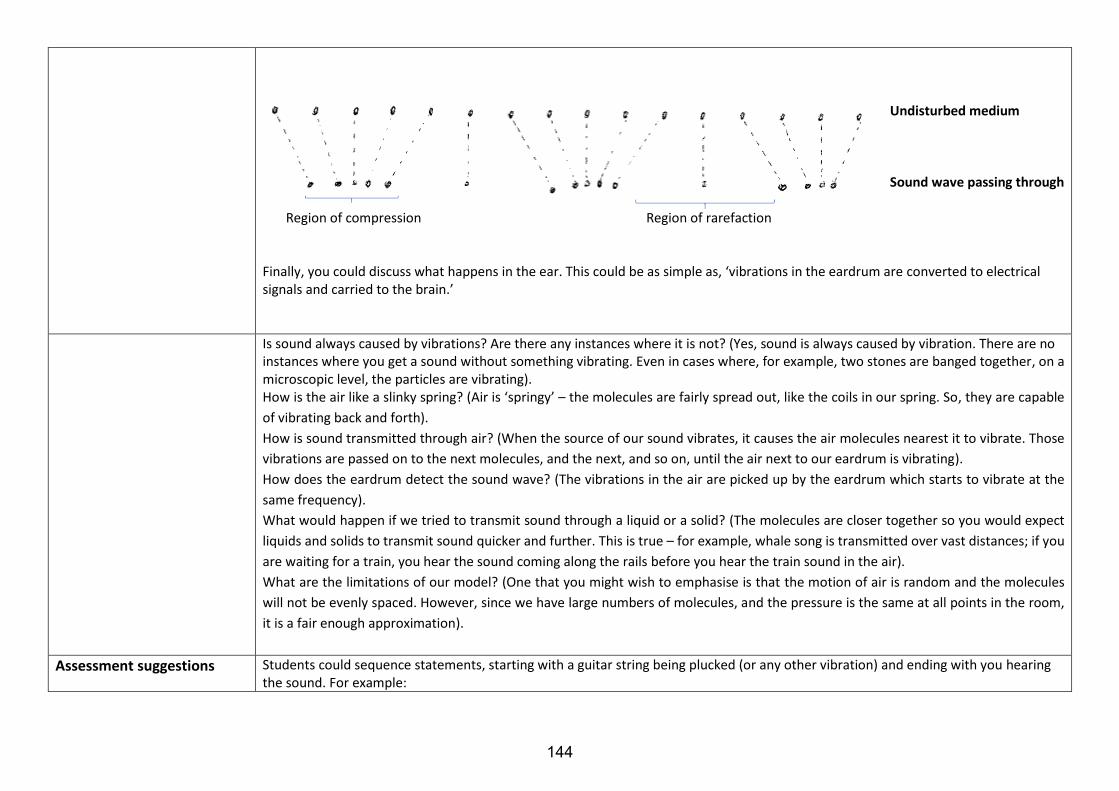
Undisturbed medium
Sound wave passing through
Region of compression Region of rarefaction
Finally, you could discuss what happens in the ear. This could be as simple as, ‘vibrations in the eardrum are converted to electrical signals and carried to the brain.’
Is sound always caused by vibrations? Are there any instances where it is not? (Yes, sound is always caused by vibration. There are no instances where you get a sound without something vibrating. Even in cases where, for example, two stones are banged together, on a microscopic level, the particles are vibrating). How is the air like a slinky spring? (Air is ‘springy’ – the molecules are fairly spread out, like the coils in our spring. So, they are capable
of vibrating back and forth).
How is sound transmitted through air? (When the source of our sound vibrates, it causes the air molecules nearest it to vibrate. Those
vibrations are passed on to the next molecules, and the next, and so on, until the air next to our eardrum is vibrating).
How does the eardrum detect the sound wave? (The vibrations in the air are picked up by the eardrum which starts to vibrate at the
same frequency).
What would happen if we tried to transmit sound through a liquid or a solid? (The molecules are closer together so you would expect
liquids and solids to transmit sound quicker and further. This is true – for example, whale song is transmitted over vast distances; if you
are waiting for a train, you hear the sound coming along the rails before you hear the train sound in the air).
What are the limitations of our model? (One that you might wish to emphasise is that the motion of air is random and the molecules
will not be evenly spaced. However, since we have large numbers of molecules, and the pressure is the same at all points in the room,
it is a fair enough approximation).
Assessment suggestions Students could sequence statements, starting with a guitar string being plucked (or any other vibration) and ending with you hearing the sound. For example:
144
A guitar string is plucked. The guitar string vibrates. The string pushes the air next to it. The air molecules move backwards and forwards at the same frequency as the guitar string. The air is like a spring, so the vibrations are passed through it as longitudinal waves. When the waves reach your ear, the eardrum vibrates with the same frequency. These vibrations are turned into electrical signals and carried to your brain along the auditory nerve.
Resources H&S considerations
• Signal generator and speaker with a few grains of rice (cling film to protect the speaker if necessary)
• Guitar
• Ruben’s Tube, amplifier and mp3 player or similar (if available)
• Speaker and sound system with candle mounted in petri dish
• Matches
• Tuning fork(s)
• Slinky spring Make sure sounds are not loud enough to cause pain or damage to eardrums Students should not lean over candle flame and should tie back long hair
145
Research Summary Magnetism and electromagnetism Using computer simulations to teach about electromagnetism Students should be taught about: (i) exploring the magnetic fields of permanent and induced magnets, and the Earth’s magnetic field, using a compass, (ii) magnetic effects of currents, how solenoids enhance the effect, and (iii) how transformers are used in the national grid and the reasons for their use. Science (Physics) – Key stage 4
Statement of issue
The electromagnetism topic can be subdivided into three components: the magnetic field (caused by moving charges), magnetic forces (moving charges and current-carrying wires), and electromagnetic induction. Despite the fact that electromagnetism is an important component of secondary school physics syllabuses, research has shown that secondary school students hold various misconceptions regarding this topic. A study conducted by Sağlam and Millar (2006) reported that many students’ responses demonstrated misunderstandings and inconsistencies that suggested they did not have a coherent framework of ideas about electromagnetism. Common errors included confusing electric and magnetic field effects, seeing field lines as indicating a flow, using cause–effect reasoning in situations where it does not apply, and dealing with effects associated with the rate of change of a variable (Sağlam & Millar, 2006).
Main findings from the research
Research has shown that students can sometimes learn better when they construct their own understanding of scientific ideas within the framework of their existing knowledge, which is the starting point of cognitive constructivism (Wieman et al., 2008). To accomplish this process, students must also be motivated to actively engage with the content and must be able to learn from this engagement (Kotoka & Kriek, 2014). In particular, Sağlam and Millar (2006) suggest that there is a need to develop teaching strategies that help students to visualise magnetic field patterns and effects, and assist them in integrating ideas into a more coherent framework. Therefore, research suggests that computer simulations can meet these needs. The use of computer simulations in physics education contexts The use of computer simulations can support meaningful learning and knowledge integration. Computer simulations are an example of education technology that can foster knowledge and concept representations that cater to a variety of learning styles (Jonassen et al., 1995). In the context of physics education, desktop experiments, for example, offer the possibility to integrate data acquisition with tools for data analysis, modelling, and computations, thus enabling students to use models as a bridge between the mathematical function that reproduces a result and the underlying physical concepts that give rise to such relationships (Scheker, 1998). Kotoka and Kriek (2014) studied the impact of computer simulations as interactive demonstration tools on the performance of Year 12 students in electromagnetism assessments. The teacher in the treatment group used a PhET computer simulation (an interactive computer simulation developed by the University of Colorado Boulder), and in the process was able to illustrate to students the interactions between a compass and bar magnet. Hence, the students were able to predict the direction of the magnetic field for different locations around a bar magnet and electromagnet, and to compare and contrast bar magnets and electromagnets using the computer applications. To conclude, the study found that the students in the treatment group achieved significantly higher scores on the post-test than the control group in their knowledge of the topic of electromagnetism. Recently, Oghlu Sharifov (2020) analysed the role and significance of the virtual laboratory on Year 10 students’ attainment of more in-depth scientific knowledge and demonstrated how it improved their practical skills in the topic of electromagnetism. Using a similar intervention to Kotoka and Kriek’s (2014) study, students were encouraged to use a PhET simulation for the topic of ‘Faraday’s law’. Using this simulator, students were able to
146

demonstrate an induction current, and the factors affecting its value. The findings from the study show that the virtual laboratory permitted the students to improve their critical thinking and creative abilities, as well as their capacity to solve complicated physics tasks relating to electromagnetism. To be specific, the students in the treatment group achieved significantly higher scores on the post-test than the control group in the electromagnetism topic.
The benefit of computer simulations in higher education contexts Dori and Belcher (2005) investigated the effects of technology-enabled active learning, which involves media-rich software for simulation and visualisation, on 811 undergraduate students’ cognitive and affective outcomes. The study suggested that these technology-based learning materials are especially useful when teaching about electromagnetism, as a means to help students conceptualise phenomena and processes. The objectives of the project are mainly to move away from a passive lecture and recitation format and increase students’ conceptual and analytical understanding of the nature and dynamics of electromagnetic fields and phenomena. The study incorporated a collaborative, active learning approach into the classroom, enhanced by visualisations, desktop experiments, Web-based assignments, a personal response system, and conceptual questions with peer discussions.
The findings from the study indicated that students statistically significantly improved their conceptual understanding of electromagnetism (Dori & Belcher, 2005). The net gain and relative improvement of the treatment group students’ conceptual understanding was found to be statistically significantly higher than that of the control group. The study suggests that technology-enabled active learning methods enhance students’ ability to transfer concepts such as electromagnetic field lines and associated phenomena from the abstract to the concrete level, thereby contributing to a better conceptual understanding of these physical phenomena.
In another study, a group of researchers investigated the impact of computational programming as a tool for teaching about electromagnetism in engineering courses on undergraduate students’ satisfaction with the simulation practices (Nogueira et al., 2019). The study suggests that the duration of lessons about electromagnetism (configurations of electric charges or currents, for instance) can be reduced using programming software such as MATLABTM and OCTAVETM. In addition, these software programmes allow students to deepen their understanding of more complex problems. The results indicate that the use of a computational programming methodology has positive effects related to the study of electromagnetism.
In summary, research suggests that the use of computer simulations can assist teachers to facilitate students in understanding the fundamental concept of electromagnetism.
Therefore, a lesson plan was produced to incorporate computer simulations to teach students about electromagnetism.
References
Dori, Y. J., & Belcher, J. (2005). How does technology-enabled active learning affect undergraduate students’ understanding of electromagnetism concepts?. The Journal of the Learning Sciences, 14(2), 243-279.
Jonassen, D., Davidson, M., Collins, M., Campbell, J., & Haag, B. B. (1995). Constructivism and computer-mediated communication in distance education. American Journal of Distance Education, 9(2), 7-26.
Kotoka, J., & Kriek, J. (2014). The impact of computer simulations as interactive demonstration tools on the performance of Grade 11 learners in electromagnetism. African Journal of Research in Mathematics, Science and Technology Education, 18(1), 100-110.
Nogueira, J. R., Alves, R., & Marques, P. C. (2019). Computational programming as a tool in the teaching of electromagnetism in engineering courses: Improving the notion of field. Education Sciences, 9(1), 64.
Oghlu Sharifov, G. M. (2020). The effectiveness of using a virtual laboratory in the teaching of electromagnetism in the lyceum. Physics Education, 55(6), 1-10.
Sağlam, M., & Millar, R. (2006). Upper high school students’ understanding of electromagnetism. International Journal of Science Education, 28(5), 543-566.
147

Scheker, H. P. (1998). Integration of experimenting and modeling by advanced educational technology: Examples from nuclear physics. In B. J. Fraser, & K. J. Tobin (Eds.), International Handbook of Science Education (pp. 383–398). Kluwer Academic.
Wieman, C. E., Adams, W. K., & Perkins, K. K. (2008). PhET: Simulations that enhance learning. American Journal of Physics, 76(4–5), 393–399.
148
Lesson Plan
Electromagnetism Using computer modelling to teach about induced potential. Science (Physics) - KS4
Research recommendation(s) and rationale
Research has shown that students can sometimes learn better when they construct their own understanding of scientific ideas within the framework of their existing knowledge, which is the starting point of cognitive constructivism. To accomplish this process, students must also be motivated to actively engage with the content and must be able to learn from this engagement. In particular, it has been suggested that there is a need to develop teaching strategies that help students to visualise magnetic field patterns and effects and assist them in integrating ideas into a more coherent framework. Therefore, research suggests that computer simulations can meet these needs.
Lesson aim To use computer simulations to teach electromagnetic induction.
Learning objective Students should understand that if an electrical conductor moves relative to a magnetic field or if there is a change in the
magnetic field around a conductor, a potential difference is induced across the ends of the conductor.
Intended learning outcomes At the end of the lesson, pupils will be able to: 1. Describe how to induce a potential difference and current in a circuit.
2. Explain how they could increase the induced potential difference/current.
3. Explain how they could change the direction of the induced potential difference/current.
4. Suggest uses for electrical induction and apply the principles in different contests
Prior Knowledge Students should understand that a magnet is surrounded by a magnetic field and be able to draw the field lines. Students
should be familiar with current and potential difference and simple circuits.
Scientific vocabulary Magnetic field – this describes the magnetic influence on moving electric charges, electric currents, and magnetic materials.Electric coil - is an electrical conductor such as a wire in the shape of a coil, spiral or helix Induction - the process by which an electrical conductor becomes electrified when near a charged body Induced magnet - this is a magnet that only becomes a magnet when it is placed in a magnetic field. The induced magnetism is
quickly lost when the magnet is removed from the magnetic field.
Magnetic field lines - These are a visual tool used to represent magnetic fields. They describe the direction of the magnetic force on a north monopole at any given position
Voltmeter - instrument that measures voltages
149
Ammeter - an instrument for measuring electric current Simulation - this is the re-creation of a real-world process in a controlled environment e.g. a computer model
Suggested lesson sequence and activities
Note: This lesson is based on a pHet computer simulation and should be carried out in an IT room so students can interact individually, or in pairs, with the simulation.
Activity 1: Link to Prior Knowledge Have students complete a diagram of the magnetic field lines around bar magnets and find the mistakes in some simple circuits, including coils, emphasising that circuits must be complete for a current to flow. Ask students how they can make a bulb glow more brightly.
Activity 2: Demonstration of electromagnetic braking. There is an MIT video of this demonstration on YouTube using spherical magnets. Demonstrate electromagnetic braking with a vertically clamped 22mm copper pipe and a 20mm diameter cylindrical rare earth magnet. The magnet is dropped through the pipe and it will move more slowly than expected. Contrast the movement of the magnet in the copper pipe and a similarly sized vertically clamped plastic pipe and by dropping a similarly sized ball, or cylinder of iron down the copper pipe.
Discuss the following points:
• The copper is NOT magnetic
• The magnet is not touching the pipe.Ask students to explain the braking.
If smaller pipes and magnets are available student can experience the phenomenon themselves.
Activity 3: Use of the simulation. Once students have had time to access the simulation and explore the controls, they should:
• Hold the magnet stationary within the coils of the circuit
• Try to maximise the brightness of the lamp/deflection of the voltmeter
• Try to minimise the brightness of the lamp/deflection of the voltmeter
• Find two ways of changing the direction of the deflection of the voltmeterThese four points should ensure students understand how to induce a voltage and the factors that affect the size and direction of the induced voltage.
150
The teacher should introduce the key vocabulary of induction and induced current and voltage and model its correct usage. The teacher should ensure that students understand that the movement of the magnetic field cutting the coil is what induces the voltage.
Activity 4: Mini-Plenary Ask students if they can now explain the electromagnetic braking from the initial demonstration. Some students may ask how it is that the induced eddy currents resist the motion of the magnet. Ensure at this point that it is made clear that the induced current generates a magnetic field that opposes the original change and resists the downward motion of the magnet.
Activity 5: Applying the idea of induction in different contexts. Depending on the length of the lesson and the students’ ability one, or some, of the following activities can be attempted or they could be set up as a round robin of tasks.
1. Students are asked to design a circuit, using the ideas of induced current which could detect and record the earthsmovement during an earthquake, given a list of available equipment including boss, clamp and stand, bar magnets, acoil, an ammeter. If equipment is available, students could do this as a practical task. Alternatively, laminateddiagrams of the individual equipment could be available which they could use to form a diagram of an experimentalset-up (pictured below) which could be used.
2. Students are given a diagram of the circuitry in a microphone and asked to describe how a microphone works.(Diagram included below)
3. Students are asked to discuss how this effect could be used to generate electricity, in anticipation of a subsequentlesson on alternators and dynamos. If the department has simple generators, such as shake generators made formfilm canisters and magnets, or wind-up torches or radios, these could be available for students to experience.
Activity 6: Assessment Informal assessment by questioning should be used throughout. There are additional assessments ideas and resources below.
Key questions Activity 2: Why does the magnet move slowly through the copper pipe? Activity 3: What do you have to do to make the current flow/induce a voltage and light the lamp? How do you minimise/maximise the current? How can you change the direction of deflection of the voltmeter? What does the different
151
deflection of the voltmeter mean for the current? Does the different deflection of the voltmeter have a different effect on the bulb? Activity 4: Why do you now think the magnet moves more slowly in the copper pipe? Activity 5: How can we use the induced current in useful ways?
Assessment suggestions Students should be given a list of actions that a teacher could take with a coil of wire attached to an ammeter and a magnet and asked what effect these actions would have. Could include:
• Holding the magnet stationary and moving the coil towards the magnet
• Holding the magnet stationary within the coils so neither element is moving
• Moving the magnet quickly towards the coils
• Reversing the magnet and moving it slowly towards the coils
To extend students they should be asked to write an explanation of what would happens when a bar magnet is moved towards a coil of wire attached to an ammeter.
Resources Activity 1: Worksheet or slides of magnetic fields to complete and incomplete/incorrect circuits for correction/completion. Some suggested images included below. Activity 2: A 50cm (suggested minimum) length 22mm copper pipe clamped vertically and a 20mm cylindrical rare earth magnet. (If desired, students could use shorter 15mm copper pipe and small rare earth magnets. The braking effect is less dramatic but still quite obvious).Activity 3: The pHet simulation of Faradays law . This is one of a series of free online computer simulations created by the University of Colorado, Boulder.
Activity 4: Assessment. Some images included below.
H&S considerations Hazard Strong magnets, such as the rare earth magnets in the demonstration in Activity 2, can snap together quickly and trap skin. They are very dangerous if swallowed.
152
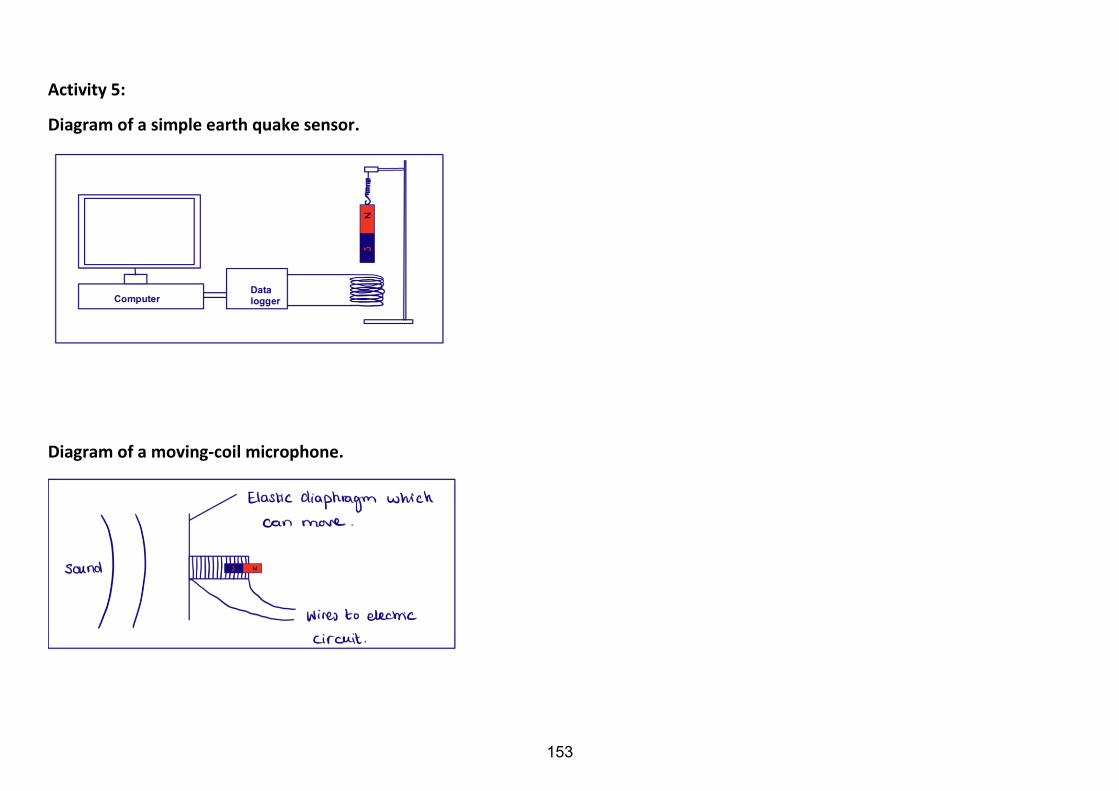
Activity 5:
Diagram of a simple earth quake sensor.
Diagram of a moving-coil microphone.
153
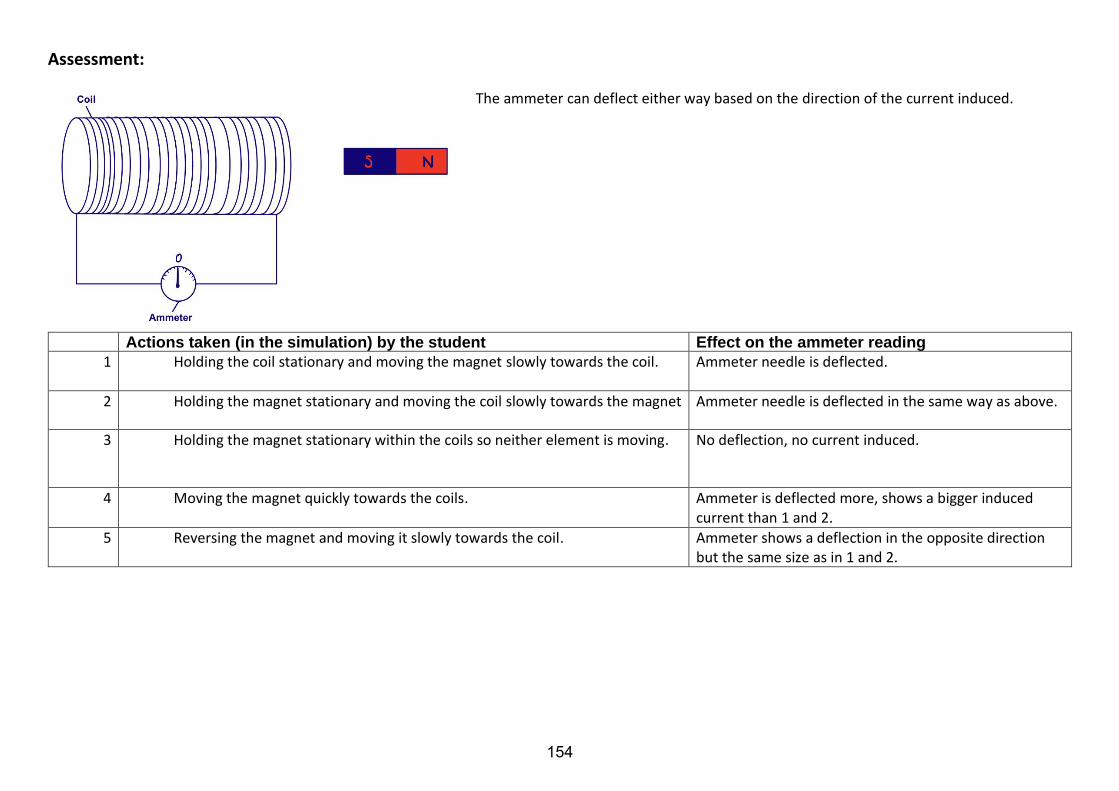
Assessment:
The ammeter can deflect either way based on the direction of the current induced.
Actions taken (in the simulation) by the student Effect on the ammeter reading
1 Holding the coil stationary and moving the magnet slowly towards the coil. Ammeter needle is deflected.
2 Holding the magnet stationary and moving the coil slowly towards the magnet Ammeter needle is deflected in the same way as above.
3 Holding the magnet stationary within the coils so neither element is moving. No deflection, no current induced.
4 Moving the magnet quickly towards the coils. Ammeter is deflected more, shows a bigger induced current than 1 and 2.
5 Reversing the magnet and moving it slowly towards the coil. Ammeter shows a deflection in the opposite direction but the same size as in 1 and 2.
154