Enhanced muscarinic M1 receptor gene expression in the corpus striatum of streptozotocin-induced...
11
BioMed Central Page 1 of 11 (page number not for citation purposes) Journal of Biomedical Science Open Access Research Enhanced muscarinic M1 receptor gene expression in the corpus striatum of streptozotocin-induced diabetic rats G Gireesh, T Peeyush Kumar, Jobin Mathew and CS Paulose* Address: Molecular Neurobiology and Cell Biology Unit, Centre for Neuroscience, Cochin University of Science and Technology, Cochin- 682 022, Kerala, India Email: G Gireesh - [email protected] ; T Peeyush Kumar - [email protected]; Jobin Mathew - [email protected]; CS Paulose* - [email protected] * Corresponding author Abstract Acetylcholine (ACh), the first neurotransmitter to be identified, regulate the activities of central and peripheral functions through interactions with muscarinic receptors. Changes in muscarinic acetylcholine receptor (mAChR) have been implicated in the pathophysiology of many major diseases of the central nervous system (CNS). Previous reports from our laboratory on streptozotocin (STZ) induced diabetic rats showed down regulation of muscarinic M1 receptors in the brainstem, hypothalamus, cerebral cortex and pancreatic islets. In this study, we have investigated the changes of acetylcholine esterase (AChE) enzyme activity, total muscarinic and muscarinic M1 receptor binding and gene expression in the corpus striatum of STZ – diabetic rats and the insulin treated diabetic rats. The striatum, a neuronal nucleus intimately involved in motor behaviour, is one of the brain regions with the highest acetylcholine content. ACh has complex and clinically important actions in the striatum that are mediated predominantly by muscarinic receptors. We observed that insulin treatment brought back the decreased maximal velocity (V max ) of acetylcholine esterase in the corpus striatum during diabetes to near control state. In diabetic rats there was a decrease in maximal number (B max ) and affinity (K d ) of total muscarinic receptors whereas muscarinic M1 receptors were increased with decrease in affinity in diabetic rats. We observed that, in all cases, the binding parameters were reversed to near control by the treatment of diabetic rats with insulin. Real-time PCR experiment confirmed the increase in muscarinic M1 receptor gene expression and a similar reversal with insulin treatment. These results suggest the diabetes-induced changes of the cholinergic activity in the corpus striatum and the regulatory role of insulin on binding parameters and gene expression of total and muscarinic M1 receptors. Background The most and well known effects of diabetes mellitus on CNS is dysfunction of neurotransmitters, which is second- ary to the metabolic disorders such as hyperglycemia and acidosis. It has been proposed that an unbalanced auto- nomic nervous system may be a major cause of the meta- bolic syndrome [1] Diabetes mellitus have also been reported to be accompanied by a number of behavioral and hormonal abnormalities, including hyperphagia, reduced motor activity [2,3]. CNS abnormalities includ- ing neuronal atrophy and axonal degenerations [4,5] are also associated with diabetes. The altered levels of neuro- transmitter in specific brain areas in patients with diabetes mellitus [6] and in animals with experimental diabetes [7- Published: 3 April 2009 Journal of Biomedical Science 2009, 16:38 doi:10.1186/1423-0127-16-38 Received: 12 November 2008 Accepted: 3 April 2009 This article is available from: http://www.jbiomedsci.com/content/16/1/38 © 2009 Gireesh et al; licensee BioMed Central Ltd. This is an Open Access article distributed under the terms of the Creative Commons Attribution License (http://creativecommons.org/licenses/by/2.0 ), which permits unrestricted use, distribution, and reproduction in any medium, provided the original work is properly cited.
Transcript of Enhanced muscarinic M1 receptor gene expression in the corpus striatum of streptozotocin-induced...

BioMed CentralJournal of Biomedical Science
ss
Open AcceResearchEnhanced muscarinic M1 receptor gene expression in the corpus striatum of streptozotocin-induced diabetic ratsG Gireesh, T Peeyush Kumar, Jobin Mathew and CS Paulose*Address: Molecular Neurobiology and Cell Biology Unit, Centre for Neuroscience, Cochin University of Science and Technology, Cochin- 682 022, Kerala, India
Email: G Gireesh - [email protected] ; T Peeyush Kumar - [email protected]; Jobin Mathew - [email protected]; CS Paulose* - [email protected]
* Corresponding author
AbstractAcetylcholine (ACh), the first neurotransmitter to be identified, regulate the activities of centraland peripheral functions through interactions with muscarinic receptors. Changes in muscarinicacetylcholine receptor (mAChR) have been implicated in the pathophysiology of many majordiseases of the central nervous system (CNS). Previous reports from our laboratory onstreptozotocin (STZ) induced diabetic rats showed down regulation of muscarinic M1 receptors inthe brainstem, hypothalamus, cerebral cortex and pancreatic islets. In this study, we haveinvestigated the changes of acetylcholine esterase (AChE) enzyme activity, total muscarinic andmuscarinic M1 receptor binding and gene expression in the corpus striatum of STZ – diabetic ratsand the insulin treated diabetic rats. The striatum, a neuronal nucleus intimately involved in motorbehaviour, is one of the brain regions with the highest acetylcholine content. ACh has complex andclinically important actions in the striatum that are mediated predominantly by muscarinicreceptors. We observed that insulin treatment brought back the decreased maximal velocity (Vmax)of acetylcholine esterase in the corpus striatum during diabetes to near control state. In diabeticrats there was a decrease in maximal number (Bmax) and affinity (Kd) of total muscarinic receptorswhereas muscarinic M1 receptors were increased with decrease in affinity in diabetic rats. Weobserved that, in all cases, the binding parameters were reversed to near control by the treatmentof diabetic rats with insulin. Real-time PCR experiment confirmed the increase in muscarinic M1receptor gene expression and a similar reversal with insulin treatment. These results suggest thediabetes-induced changes of the cholinergic activity in the corpus striatum and the regulatory roleof insulin on binding parameters and gene expression of total and muscarinic M1 receptors.
BackgroundThe most and well known effects of diabetes mellitus onCNS is dysfunction of neurotransmitters, which is second-ary to the metabolic disorders such as hyperglycemia andacidosis. It has been proposed that an unbalanced auto-nomic nervous system may be a major cause of the meta-bolic syndrome [1] Diabetes mellitus have also been
reported to be accompanied by a number of behavioraland hormonal abnormalities, including hyperphagia,reduced motor activity [2,3]. CNS abnormalities includ-ing neuronal atrophy and axonal degenerations [4,5] arealso associated with diabetes. The altered levels of neuro-transmitter in specific brain areas in patients with diabetesmellitus [6] and in animals with experimental diabetes [7-
Published: 3 April 2009
Journal of Biomedical Science 2009, 16:38 doi:10.1186/1423-0127-16-38
Received: 12 November 2008Accepted: 3 April 2009
This article is available from: http://www.jbiomedsci.com/content/16/1/38
© 2009 Gireesh et al; licensee BioMed Central Ltd. This is an Open Access article distributed under the terms of the Creative Commons Attribution License (http://creativecommons.org/licenses/by/2.0), which permits unrestricted use, distribution, and reproduction in any medium, provided the original work is properly cited.
Page 1 of 11(page number not for citation purposes)

Journal of Biomedical Science 2009, 16:38 http://www.jbiomedsci.com/content/16/1/38
12] have been documented and implicated in the CNSdisorders. ACh, a major neurotransmitter from auto-nomic nervous system, regulates the cholinergic stimula-tion of insulin secretion, through interactions withmuscarinic receptors. Recently we have reported that mus-carinic M1 receptor gene expressions were decreased inthe cerebral cortex, brainstem, hypothalamus and pancre-atic islets of STZ induced diabetic rats and insulin modu-lates the binding parameters and gene expression [13,14].Acetylcholine muscarinic receptors, members of thesuperfamily of G protein-coupled receptors, are classifiedpharmacologically into M1 to M5 subtypes, with M1, M3and M5 receptors preferentially coupling to Gq/11 pro-teins and M2 and M4 receptors to Gi/o proteins [9]. Allfive muscarinic receptors are expressed by striatal neu-rones, with M1 and M4 receptors as the predominant sub-types, conforming together nearly 80% of the receptorpopulation in the rat as shown by immunodetection[15,16] The main objective of the present study was todetermine whether uncontrolled hyperglycemia, as a con-sequence of diabetes, altered the acetylcholine esteraseenzyme activity, total and muscarinic M1 receptor bind-ing parameters and muscarinic M1 receptor gene expres-sion and the regulatory role of insulin in the rat corpusstriatum.
Materials and methodsBiochemicals used in the present study were purchasedfrom Sigma Chemical Co., St. Louis, USA. All other rea-gents were of analytical grade purchased locally. Quinuc-lidinyl benzilate, L- [Benzilic-4,4'-3H], ([3H] QNB)(Sp.Activity 42 Ci/mmol) was purchased from NEN life sci-ences products Inc., Boston, U.S.A. Tri-reagent kit was pur-chased from MRC, USA. Real Time PCR Taqman probeassays on demand were purchased from Applied Biosys-tems, Foster City, CA, USA.
Male adult Wistar rats of 180–240 g body weight wereused for all experiments. They were housed in separatecages under 12 hour light and 12 hour dark periods. Ratshave free access to standard food and water ad libitum. Allanimal care and procedures were in accordance with theInstitutional and National Institute of Health guidelines.Diabetes was induced in rats by single intrafemoral injec-tion of streptozotocin freshly dissolved in 0.1 M citratebuffer, pH 4.5, under anesthesia [17]. Streptozotocin wasgiven at a dose of 55 mg/Kg body weight [18,19]. Animalswere divided into the following groups: i) Control ii) dia-betic iii) insulin-treated diabetic rats. Each group con-sisted of 6–8 animals. The insulin-treated diabetic groupreceived subcutaneous injections (1 Unit/kg body weight)of Lente and Plain insulin (Boots India) daily during theentire period of the experiment. The last injection wasgiven 24 hrs before sacrificing the rats. Rats were sacrificedon 15th day by decapitation. The corpus striatum was dis-
sected out quickly over ice according to the procedure ofGlowinski and Iversen 1966[20], the tissues were stored at-70°C until assayed.
Estimation of blood glucoseBlood glucose was estimated by the spectrophotometricmethod using glucose oxidase-peroxidase reactions.Blood samples were collected from the tail vein at 0 hours(Before the start of the experiment), 3rd day, 6th day, 10th
day and 14th day and the glucose levels were estimated.Blood samples were collected 3 hrs after the administra-tion of morning dose. The results were expressed in termsof milligram per deciliter of blood.
Acetylcholine Esterase AssayAcetylcholine esterase asssay was done using the spectro-photometric method of Ellman et al, (1961) [21]. The cor-pus striatum homogenate (10%) was prepared in sodiumphosphate buffer (30 mM, pH-7). One ml of 1% Triton ×100 was added to the homogenate to release the mem-brane bound enzyme and centrifuged at 10,000 × g for 30minutes at 4°C. Different concentrations of acetylthio-choline iodide were used as substrate. The mercaptanformed as a result of the hydrolysis of the ester reacts withan oxidising agent 5,5'-dithiobis (2-Nitrobenzoate)absorbs at 412 nm.
Total Muscarinic and muscarinic M1 receptor binding studies in the corpus striatum[3H]QNB binding assay in corpus striatum was doneaccording to the modified procedure of Yamamura andSnyder (1981) [22]. Corpus striatum was homogenised ina polytron homogeniser with 20 volumes of cold 50 mMTris-HCl buffer, containing 1 mM EDTA, pH.7.4. Thesupernatant was then centrifuged at 30,000 × g for 30minutes and the pellets were resuspended in appropriatevolume of Tris-HCl-EDTA buffer.
Total muscarinic receptor binding parameter assays weredone using different concentrations i.e., 0.1–2.5 nM of[3H] QNB in the incubation buffer, pH 7.4 in a total incu-bation volume of 250 l containing appropriate proteinconcentrations (200–250 g). Non-specific binding wasdetermined using 100 M atropine. Competition studieswere carried out with 1 nM [3H]QNB in each tube withatropine concentrations varying from 10-9 – 10-4 M atro-pine. Tubes were incubated at 22°C for 60 minutes andfiltered rapidly through GF/C filters (Whatman). The fil-ters were washed quickly by three successive washing with5.0 ml of ice cold 50 mM Tris-HCl buffer, pH 7.4. Boundradioactivity was counted with cocktail-T in a Wallac 1409liquid scintillation counter. The non-specific bindingdetermined showed 10% in all our experiments.
Page 2 of 11(page number not for citation purposes)

Journal of Biomedical Science 2009, 16:38 http://www.jbiomedsci.com/content/16/1/38
Muscarinic M1 receptor binding assays were done usingdifferent concentrations i.e., 0.1–2.5 nM of [3H]QNB inthe incubation buffer, pH 7.4 in a total incubation vol-ume of 250 l containing appropriate protein concentra-tions (200–250 g). Non-specific binding wasdetermined using 100 M pirenzepine. Competition stud-ies were carried out with 1 nM [3H]QNB in each tube withpirenzepine concentrations varying from 10-9 – 10-4 M.Tubes were incubated at 22°C for 60 minutes and filteredrapidly through GF/C filters (Whatman). The filters werewashed quickly by three successive washing with 5.0 ml ofice cold 50 mM Tris-HCl buffer, pH 7.4. Bound radioactiv-ity was counted with cocktail-T in a Wallac 1409 liquidscintillation counter. The non-specific binding deter-mined showed 10% in all our experiments.
Protein determinationProtein was measured by the method of Lowry et al,(1951) [23] using bovine serum albumin as standard. Theintensity of the purple blue colour formed was propor-tional to the amount of protein, which was read in a spec-trophotometer at 660 nm
Receptor data analysisThe receptor binding parameters were determined usingScatchard analysis [24]. The specific binding was deter-mined by subtracting non-specific binding from the total.The binding parameters, maximal binding (Bmax) andequilibrium dissociation constant (Kd), were derived bylinear regression analysis by plotting the specific bindingof the radioligand on X-axis and bound/free on Y-axisusing Sigma plot software (version 2.0, Jandel GmbH,Erkrath, Germany). The maximal binding is a measure ofthe total number of receptors present in the tissue and theequilibrium dissociation constant is the measure of theaffinity of the receptors for the radioligand. The Kd isinversely related to receptor affinity.
Displacement curve analysisThe displacement data were analysed by nonlinear regres-sion using GraphPad PRISM™ software, GraphPad Inc.,San Diego, USA. The concentration of the competing drugthat competes for half the specific binding was defined asEC50 which is same as IC50. The affinity of the receptor forthe competing drug is designated as Ki and is defined asthe concentration of the competing ligand that will bindto half the binding sites at equilibrium in the absence ofradioligand or other competitors. The Hill slope was usedto indicate a one or two-sited model of curve-fitting.
Analysis of gene expression by Real-Time PCRRNA was isolated from the corpus striatum of experimen-tal rats using the Tri reagent (MRC, USA). Total cDNA syn-thesis was performed using ABI PRISM cDNA arhive kit in0.2 ml microfuge tubes. The reaction mixture of 20 l con-
tained 0.2 g total RNA, 10 × RT buffer, 25 × dNTP mix-ture, 10 × random primers, MultiScribe RT (50 U/l) andRNase free water. The cDNA synthesis reactions were car-ried out at 25°C for 10 minutes and 37°C for 2 hoursusing an Eppendorf Personal Cycler. Real-time PCR assayswere performed in 96-well plates in ABI 7300 real-timePCR instrument (Applied Biosystems). The primers andprobes were purchased from Applied Biosystems, FosterCity, California, USA. The TaqMan reaction mixture of 20l contained 25 ng of total RNA-derived cDNAs, 200 nMeach of the forward primer, reverse primer, and TaqManprobe for Muscarinic M1 receptor gene and endogenouscontrol (-actin) and 12.5 l of Taqman 2× Universal PCRMaster Mix (Applied Biosystems) and the volume wasmade up with RNAse free water. The following thermalcycling profile was used (40 cycles): 50°C for 2 min, 95°Cfor 10 min, 95°C for 15 sec and 60°C for 1 min.
Fluorescence signals measured during amplification wereconsidered positive if the fluorescence intensity was 20-fold greater than the standard deviation of the baselinefluorescence. The CT method of relative quantificationwas used to determine the fold change in expression. Thiswas done by first normalizing the resulting thresholdcycle (CT) values of the target mRNAs to the CT values ofthe internal control -actin in the same samples (CT =CTTarget – CT-actin). It was further normalize with the con-trol (CT = CT – CTControl). The fold change in expres-sion was then obtained as (2-CT) and the graph wasplotted using log 2-CT.
StatisticsStatistical evaluations were done by ANOVA, expressed asmean ± S.E.M using InStat (Ver.2.04a) computer pro-gramme.
ResultsBlood glucose level of all rats before streptozotocinadministration was within the normal range. Streptozo-tocin administration led to a significant increase (p <0.001) in blood glucose level of diabetic rats when com-pared to control rats. Insulin treatment was able to signif-icantly reduce (p < 0.001) the increased blood glucoselevel to near the control value when compared to diabeticgroup (Table 1)
Acetylcholine esterase activity in the Corpus striatum of experimental ratsAcetylcholine esterase kinetics studies showed that Vmaxwas significantly decreased (p < 0.001) in the corpus stria-tum of diabetic group with no significant change in Km.Insulin treatment significantly reversed the Vmax (p <0.001) to near control value when compared to diabeticgroup (Table 2).
Page 3 of 11(page number not for citation purposes)

Journal of Biomedical Science 2009, 16:38 http://www.jbiomedsci.com/content/16/1/38
Total Muscarinic receptor analysisScatchard analysis of [3H] QNB binding against atropine in the corpus striatum of Control, Diabetic and Diabetic+Insulin treated diabetic ratsThe Scatchard analysis showed that the Bmax and Kd of the[3H]QNB receptor binding decreased significantly (p <0.001) in the corpus striatum of diabetic rats when com-pared to control group. In insulin treated diabetic groupBmax and Kd were significantly (p < 0.001) reversed back tonear control value when compared to diabetic group. (Fig1 & Table 3)
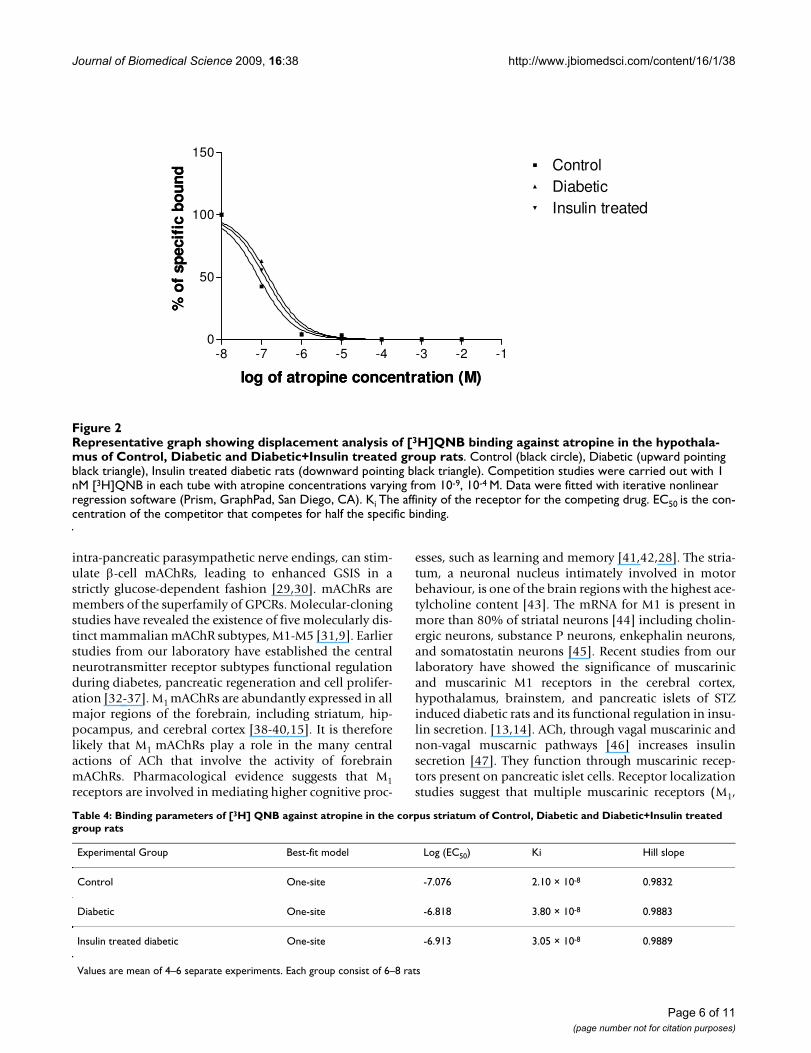
Displacement analysis of [3H]QNB using AtropineIn the displacement analysis, the competitive curve fittedto a one-sited model in all groups with Hill slope valueswere near to unity. The log (EC50) did not alter in all theexperimental groups. The Ki decreased in diabetic condi-tion (Fig 2 & Table 4).
Muscarinic M1 receptor analysisScatchard analysis of [3H]QNB binding against pirenzepine in the corpus striatum of Control, Diabetic, and Diabetic+Insulin treated diabetic ratsThe Scatchard analysis showed that the Bmax of muscarinicM1 receptors of corpus striatum was increased signifi-cantly (p < 0.001) in diabetic condition when comparedto control group while the Kd was decreased significantlywhen compared to control group (p < 0.001). In insulintreated diabetic rats Bmax was significantly (p < 0.001)reversed back to near control value when compared todiabetic group but Kd was not reversed back to near con-trol value when compared to diabetic group (Fig 3 & Table
5).
Displacement analysis of [3H]QNB using pirenzepineIn the displacement analysis, the competitive curve fittedto a one-site model in all the experimental conditions.Hill slopes were near unity confirming the one-site model.There were no changes in the log (EC50) values. The Kivalue was decreased in diabetic condition (Fig 4 & Table6).
Real Time-PCR analysisReal Time-PCR analysis showed that the muscarinic M1receptor gene expression was increased significantly (p <0.01) in diabetic condition and it reversed to near controlvalue in insulin treated diabetic rats (Fig 5 & Table 7).
DiscussionThe brain neurotransmitters receptor activity and hormo-nal pathways control many physiological functions in thebody. The present study analyzed the changes of acetyl-choline esterase enzyme activity, total muscarinic andmuscarinic M1 receptors in the corpus striatum of STZdiabetic and insulin-treated diabetic rats. CNS mAChRsregulate a large number of important central functionsincluding cognitive, behavioural, sensory, motor andautonomic processes [25-27]. A key feature of type 2 dia-betes is that pancreatic -cells fail to release sufficientamounts of insulin despite elevated blood glucose levels[28]. Glucose-stimulated insulin secretion (GSIS) is regu-lated by numerous hormones and neurotransmitters mostof which act on specific G-protein-coupled receptors(GPCRs) expressed by pancreatic -cells [29,30]. Manystudies have shown that ACh, following its release from
Table 1: Blood glucose (mg/dl) level in Experimental rats
Animal status 0 day (Before STZ injection) 3rd day (Initial) 6th day 10th day 14th day (Final)
Control 86.2 ± 1.4 93.5 ± 1.6 89.4 ± 0.8 101.2 ± 2.2 97.7 ± 1.21Diabetic 79.4 ± 1.5 253.1 ± 0.5 303.1 ± 0.8 309.7 ± 0.6 311.9 ± 1.4***D + I 85.2 ± 0.8 256.8 ± 0.5 303.6 ± 0.7 190.9 ± 1.5 137.0 ± 1.3
Values are mean ± S.E.M of 4–6 rats in each group. Each group consist of 6–8 rats*** P < 0.001 when compared to control, P < 0.001 when compared to diabetic group, p < 0.001 when compared with initial reading
Table 2: Acetylcholine esterase activity in the corpus striatum of Control, Diabetic and D+I group rats
Animal status Vmax(moles/min/mg protein)
Km (M)
Control 2420.0 ± 11.5 51.0 ± 0.5
Diabetic 1631.3 ± 16.1*** 51.3 ± 0.8
Diabetic + Insulin treated (D+I) 2647.0 ± 26.5 51.0 ± 0.5
Values are mean ± S.E.M of 4–6 separate experiments. Each group consist of 6–8 rats*** P < 0.001 when compared to control, P < 0.001 when compared to diabetic group
Page 4 of 11(page number not for citation purposes)

Journal of Biomedical Science 2009, 16:38 http://www.jbiomedsci.com/content/16/1/38
Page 5 of 11(page number not for citation purposes)
Representative graph showing Scatchard analysis of [3H]QNB binding against atropine in the corpus striatum of Control, Dia-betic and Diabetic+Insulin treated group ratsFigure 1Representative graph showing Scatchard analysis of [3H]QNB binding against atropine in the corpus striatum of Control, Diabetic and Diabetic+Insulin treated group rats. Control (black circle), Diabetic (open circle), Insulin treated diabetic rats (black triangle). Total muscarinic receptor binding parameter assays were done using different concentra-tions i.e., 0.1–2.5 nM of [3H]QNB in the incubation buffer, pH 7.4 in a total incubation volume of 250 l containing appropriate protein concentrations (200–250 g). Non-specific binding was determined using 100 M atropine. Tubes were incubated at 22°C for 60 minutes and filtered rapidly through GF/C filters (Whatman). The filters were washed quickly by three successive washing with 5.0 ml of ice cold 50 mM Tris-HCl buffer, pH 7.4. Bound radioactivity was counted with cocktail-T in a Wallac 1409 liquid scintillation counter. The non-specific binding determined showed 10% in all our experiments.
Bound (fmoles/mg protein)
0 50 100 150 200 250
Bou
nd/fr
ee (
fmol
es/m
g pr
otei
n/nM
)
0
200
400
600
800
1000
1200
1400
ControlDiabeticInsulin treated
Table 3: Scatchard analysis of [3H] QNB binding against atropine in the corpus striatum of Control, Diabetic, and Diabetic+Insulin treated group rats
Animal status Bmax(fmoles/mg protein)
Kd (nM)
Control 214.00 ± 3.05 0.19 ± 0.01
Diabetic 150.00 ± 5.77*** 0.27 ± 0.05***
Diabetic + Insulin treated 184.00 ± 3.05 0.17 ± 0.05
Values are mean ± S.E.M of 4–6 separate experiments. Each group consist of 6–8 rats*** P < 0.001 when compared to control, P < 0.001 when compared to diabetic group
Journal of Biomedical Science 2009, 16:38 http://www.jbiomedsci.com/content/16/1/38
intra-pancreatic parasympathetic nerve endings, can stim-ulate -cell mAChRs, leading to enhanced GSIS in astrictly glucose-dependent fashion [29,30]. mAChRs aremembers of the superfamily of GPCRs. Molecular-cloningstudies have revealed the existence of five molecularly dis-tinct mammalian mAChR subtypes, M1-M5 [31,9]. Earlierstudies from our laboratory have established the centralneurotransmitter receptor subtypes functional regulationduring diabetes, pancreatic regeneration and cell prolifer-ation [32-37]. M1 mAChRs are abundantly expressed in allmajor regions of the forebrain, including striatum, hip-pocampus, and cerebral cortex [38-40,15]. It is thereforelikely that M1 mAChRs play a role in the many centralactions of ACh that involve the activity of forebrainmAChRs. Pharmacological evidence suggests that M1receptors are involved in mediating higher cognitive proc-
esses, such as learning and memory [41,42,28]. The stria-tum, a neuronal nucleus intimately involved in motorbehaviour, is one of the brain regions with the highest ace-tylcholine content [43]. The mRNA for M1 is present inmore than 80% of striatal neurons [44] including cholin-ergic neurons, substance P neurons, enkephalin neurons,and somatostatin neurons [45]. Recent studies from ourlaboratory have showed the significance of muscarinicand muscarinic M1 receptors in the cerebral cortex,hypothalamus, brainstem, and pancreatic islets of STZinduced diabetic rats and its functional regulation in insu-lin secretion. [13,14]. ACh, through vagal muscarinic andnon-vagal muscarnic pathways [46] increases insulinsecretion [47]. They function through muscarinic recep-tors present on pancreatic islet cells. Receptor localizationstudies suggest that multiple muscarinic receptors (M1,
Representative graph showing displacement analysis of [3H]QNB binding against atropine in the hypothalamus of Control, Dia-betic and Diabetic+Insulin treated group ratsFigure 2Representative graph showing displacement analysis of [3H]QNB binding against atropine in the hypothala-mus of Control, Diabetic and Diabetic+Insulin treated group rats. Control (black circle), Diabetic (upward pointing black triangle), Insulin treated diabetic rats (downward pointing black triangle). Competition studies were carried out with 1 nM [3H]QNB in each tube with atropine concentrations varying from 10-9, 10-4 M. Data were fitted with iterative nonlinear regression software (Prism, GraphPad, San Diego, CA). Ki The affinity of the receptor for the competing drug. EC50 is the con-centration of the competitor that competes for half the specific binding.
-8 -7 -6 -5 -4 -3 -2 -10
50
100
150ControlDiabeticInsulin treated
log of atropine concentration (M)
% o
f sp
ecif
ic b
ound
log of atropine concentration (M)
% o
f sp
ecif
ic b
ound
Table 4: Binding parameters of [3H] QNB against atropine in the corpus striatum of Control, Diabetic and Diabetic+Insulin treated group rats
Experimental Group Best-fit model Log (EC50) Ki Hill slope
Control One-site -7.076 2.10 × 10⁻⁸ 0.9832
Diabetic One-site -6.818 3.80 × 10⁻⁸ 0.9883
Insulin treated diabetic One-site -6.913 3.05 × 10⁻⁸ 0.9889
Values are mean of 4–6 separate experiments. Each group consist of 6–8 rats
Page 6 of 11(page number not for citation purposes)

Journal of Biomedical Science 2009, 16:38 http://www.jbiomedsci.com/content/16/1/38
Page 7 of 11(page number not for citation purposes)
Representative graph showing Scatchard analysis of [3H]QNB binding against pirenzepine in the corpus striatum of Control, Diabetic and Diabetic+Insulin treated group ratsFigure 3Representative graph showing Scatchard analysis of [3H]QNB binding against pirenzepine in the corpus stria-tum of Control, Diabetic and Diabetic+Insulin treated group rats. Control (black circle), Diabetic (open circle), Insu-lin treated diabetic rats (black triangle). Muscarinic M1 receptor binding parameter assays were done using different concentrations i.e., 0.1–2.5 nM of [3H]QNB in the incubation buffer, pH 7.4 in a total incubation volume of 250 l containing appropriate protein concentrations (200–250 g). Non-specific binding was determined using 100 M pirenzepine. Tubes were incubated at 22°C for 60 minutes and filtered rapidly through GF/C filters (Whatman). The filters were washed quickly by three successive washing with 5.0 ml of ice cold 50 mM Tris-HCl buffer, pH 7.4. Bound radioactivity was counted with cocktail-T in a Wallac 1409 liquid scintillation counter. The non-specific binding determined showed 10% in all our experiments.
Table 5: Scatchard analysis of [3H] QNB binding against pirenzepine in the corpus striatum of Control, Diabetic and Diabetic+Insulin treated group rats
Animal status Bmax (fmoles/mg protein) Kd (nM)
Control 1460.00 ± 30.55 1.34 ± 0.02
Diabetic 2060.00 ± 30.55*** 0.45 ± 0.02***
Diabetic + Insulin treated 1550.00 ± 28.86 0.56 ± 0.01
Values are mean ± S.E.M of 4–6 separate experiments. Each group consist of 6–8 rats*** P < 0.001 when compared to control, P < 0.001 when compared to diabetic group

Journal of Biomedical Science 2009, 16:38 http://www.jbiomedsci.com/content/16/1/38
M3, M4, and M5) are expressed in pancreatic islets/-cells[48]. From our previous studies it was observed that mus-carinic M1 receptors were down-regulated during STZ dia-betes [13]. The enzyme AChE indirectly plays animportant role in transmission of nerve impulse. It hydro-lyses the ACh released at the cholinergic synapse and thusterminates the action of this neurotransmitter. In additionto their role in cholinergic transmission, cholinesterasesmay also play a role during morphogenesis and neurode-generative diseases [49,50]. We observed a significantdecrease in Vmax of acetylcholine esterase in the striatumof diabetic rats which was reversed to near control level by
insulin treatment. Akmayev et al (1978) [51] showed thatthere is a difference in distribution of enzyme in the neu-rons of the central vagal nuclei in normal and adult malerats. It is suggested that the changes in the plasma glucoseor insulin may be that stimulus that influence the activityof cholinergic neurons. Insulin treatment reversed thealtered maximum velocity toward the control level. Cor-pus striatum is best known for its role in the planning andmodulation movement pathways but also involved in avariety of cognitive process involving executive function.In corpus striatum total muscarinic receptor numbers andaffinity were decreased during diabetes, whereas mus-
Representative graph showing displacement analysis of [3H]QNB binding against pirenzepine in the corpus striatum of Control, Diabetic and Diabetic+Insulin treated group ratsFigure 4Representative graph showing displacement analysis of [3H]QNB binding against pirenzepine in the corpus striatum of Control, Diabetic and Diabetic+Insulin treated group rats. Control (black circle), Diabetic (upward pointing black triangle), Insulin treated diabetic rats (downward pointing black triangle). Competition studies were carried out with 1 nM [3H]QNB in each tube with pirenzepine concentrations varying from 10-9 to 10-4 M. Data were fitted with iterative nonlinear regression software (Prism, GraphPad, San Diego, CA). Ki – The affinity of the receptor for the competing drug. EC50 is the concentration of the competitor that competes for half the specific binding.
-7.5 -5.0 -2.5 0.00
50
100
150ControlDiabeticInsulin treated
log of Pirenzepine concentration (M)
% o
f sp
ecifi
c bo
und
log of Pirenzepine concentration (M)
% o
f sp
ecifi
c bo
und
Table 6: Binding parameters of [3H]QNB against pirenzepine in the corpus striatum of Control, Diabetic and Diabetic+Insulin treated group rats
Experimental Group Best-fit model Log (EC50) Ki Hill slope
Control One-site -7.107 2.23 × 10⁻⁸ 0.7224
Diabetic One-site -6.459 9.92 × 10⁻⁸ 0.7444
Insulin treated diabetic One-site -7.322 4.76 × 10⁻⁸ 0.6826
Values are mean of 4–6 separate experiments. Each group consist of 6–8 rats
Page 8 of 11(page number not for citation purposes)

Journal of Biomedical Science 2009, 16:38 http://www.jbiomedsci.com/content/16/1/38
carinic M1 receptors number was increased in STZ dia-betic rats with decrease in affinity. The changes in thereceptor number and affinity observed are due to the alter-ations of receptor protein and synthesis. Real-time PCRanalysis showed an up-regulation of the muscarinic M1receptor mRNA level in the striatum of diabetic rats,whereas it reversed to near control when treated withinsulin. This is in accordance with our receptor bindingstudies. ACh has complex and clinically important actionsin the striaturn that are mediated predominantly by mus-carinic receptors. Based on physiological and pharmaco-logical studies, several specific actions of ACh in thestriatum have been suggested. ACh regulates its ownrelease from cholinergic interneurons through presynap-tic autoreceptors. Noncholinergic striatal neurons aredirectly affected by ACh through postsynaptic receptorsand presynaptic heteroceptors and the release of excita-tory amino acids and dopamine by extrinsic striatal affer-
Representative graph showing Real-Time amplification of muscarinic M1 mRNA from the corpus striatum of control, diabetic and insulin treated diabetic ratsFigure 5Representative graph showing Real-Time amplification of muscarinic M1 mRNA from the corpus striatum of control, diabetic and insulin treated diabetic rats. Control, Diabetic, Insulin treated diabetic rats. The CT method of relative quantification was used to determine the fold change in expression. This was done by first normalizing the resulting threshold cycle (CT) values of the target mRNAs to the CT values of the internal control -actin in the same samples (CT = CTTarget – CT -actin). It was further normalize with the control (CT = CT – CTControl). The fold change in expression was then obtained (2-CT). The graph was plotted using log 2-CT. Values are mean ± S.D of 4–6 separate experiments. Relative Quantification values and standard deviations are shown in the table. The relative ratios of mRNA levels were calculated using the CT method normalized with -actin CT value as the internal control and Control CT value as the calibrator.
0
0.5
1
1.5
2
2.5
3
3.5
4
Control Diabetic D+I
��
������������
Table 7: Real Time amplification of Muscarinic M1 receptor mRNA from the Corpus striatum of Control, Diabetic, and Diabetic+Insulin treated group rats
Experimental group RQ Value
Control 0
Diabetic 3.14 ± 0.25**
Diabetic + Insulin treated 0.86 ± -0.66
Values are mean ± S.D of 4–6 separate experiments. Each group consist of 6–8 rats Relative Quantification values and standard deviations are shown in the table. The relative ratios of mRNA levels were calculated using the CT method normalized with -actin CT value as the internal control and Control CT value as the calibrator.** p < 0.01 when compared with controlp < 0.01 when compared with diabetic group
Page 9 of 11(page number not for citation purposes)
Journal of Biomedical Science 2009, 16:38 http://www.jbiomedsci.com/content/16/1/38
ents may be under presynaptic control of ACh throughpresynaptic heteroceptors [52-54]. In diabetic corpusstriatum total muscarinic receptors activities weredecreased. The insulin treatment reversed these alteredparameters to near control level. Muscarinic receptor sub-types other than M1 may also be affected by the diabeticcondition. Further studies have to be carried out to eluci-date the role of other subtypes. The present study suggeststhat drugs that can selectively activate muscarinic recep-tors may be of significant therapeutic benefit in the diabe-tes management. Thus our results revealed thesignificance of central muscarinic receptor changes duringdiabetes and the regulatory role of insulin on muscarinicreceptors.
Competing interestsThe authors declare that they have no competing interests.
Authors' contributionsGG and CSP designed research; GG performed experi-ments; PKT and JM helped GG in experiments; GG andCSP analyzed the data; GG and CSP wrote the paper. Allauthors read and approved the final manuscript.
AcknowledgementsThis work was supported by a research grant from KSCSTE, Govt. of Ker-ala, DST, and ICMR, Govt. of India to Dr. C.S.Paulose. Gireesh.G thanks KSCSTE for JRF
References1. Kreier F, Yilmaz A, Kalsbeek A, Romijn JA, Sauerwein HP, Fliers E,
Buijs RM: Hypothesis: shifting the equilibrium from activity tofood leads to autonomic unbalance and the metabolic syn-drome. Diabetes 2003, 52:2652-2656.
2. Marchall JF, Friedman TG, Heffner MI: Reduced anorexic andlocomotor – stimulant action of d-amphetamine in alloxan –diabetic rats. Brain Research 1976, 111:428-432.
3. Marchall JF: Further analysis of the resistance of the diabeticrat to d-amphetamine. Pharmacol Biochem Behav. 1978,8(3):281-286.
4. Rossi GL, Bestetti G: Morphological changes in the hypotha-lamic-hypophyseal-gonodal axis of male rats after twelvemonths of streptozotocin induced diabetes. Diabetologia 1981,21:476-481.
5. Reske-Nielsen E, Lunbeak K: Diabetic encephalopathy. Diffuseand focal lesions of the brain in long-term diabetes. Acta Neu-rol Scand Suppl. 1963, 39(4 Suppl 4):273-293.
6. Lackovic Z, Salkovic M, Kuci Z, Relja M: Dopamine, norepine-phrine and serotonin in the brain of diabetic rats and man.Journal of Neurochemistry 1985, 44:94-98.
7. Bitar M, Koulu M, Rapoport SI, Linnoila M: Dibetes induced alter-ations in brain monoamine metabolism in rats. Journal of Phar-macology and Experimental Therapeutics 1986, 236:432-437.
8. Saller CF: Dopaminergic activity is reduced in diabetic rats.Neuroscience Letters 1984, 49:301-306.
9. Caulfield MP, Birdsall NJM: Classification of muscarinic acetyl-choline receptors. Pharmacol Rev 1998, 50:279-290.
10. Kwok RPS, Walls EK, Juoria AV: The concentrations ofdopamine 5 Hydroxytryptamine and some of their acidmetabolites in the brain of genetically diabetic rats. Neuro-chemical Research 1985, 10:611-616.
11. Chen CC, Yang JC: Effects of short and long-lasting diabetesmellitus on mouse brain monoamines. Brain Research 1991,552:175-179.
12. Tasaka Y, Matsumoto H, Inove Y, Hirata Y: Brain catecholamineconcentrations in hyperosmolar diabetic and diabetic rats.Diabetes Research 1992, 19:1-7.
13. Gireesh G, Kaimal SB, Kumar TP, Paulose CS: Decreased mus-carinic M1 receptor gene expression in the hypothalamus,brainstem, and pancreatic islets of streptozotocin-induceddiabetic rats. J Neurosci Res 2007.
14. Gireesh G, Reas SK, Jobin M, Paulose CS: Decreased muscarinicM1 receptor gene expression in the cerebral cortex of strep-tozotocin-induced diabetic rats and Aegle marmelose leafextract's therapeutic function J. Ethnopharmacol 2007.
15. Levey AI, Kitt CA, Simonds WF, Price DL, Brann MR: Identificationand localization of muscarinic acetylcholine receptor pro-teins in brain with subtype-specific antibodies. J Neurosci 1991,11:3218-3226.
16. Yasuda RP, Ciesla W, Flores LR, Wall SJ, Li M, Satkus SA, WeissteinJS, Spagnola BV, Wolfe BB: Development of antisera selectivefor m4 and m5 muscarinic cholinergic receptors: distribu-tions of m4 and m5 receptors in rat brain. 1993, 43:149-157.
17. Junod A, Lambert AE, Staufferacher W, Renold AE: Diabetogenicaction of Streptozotocin: Relationship of dose to metabolicresponse. J Clin Invest 1969, 48:2129-2139.
18. Hohenegger M, Rudas B: Kidney functions in experimental dia-betic ketosis. Diabetologia 1971, 17:334-338.
19. Arison RN, Ciaccio EI, Glitzer MS, Cassaro AV, Pruss M: Light andelectron microscopy of lesions in rats rendered diabetic withstreptozotocin. Diabetes 1967, 16:51-56.
20. Glowinski J, Iversen LL: Regional studies of catecholamines inthe rat brain: the disposition of [3H] norepinephrine, [3H]dopa in various regions of brain. J Neurochem 1966, 13:655-669.
21. Ellman GL, Courtney KD, Andres V, Featherstone RM: A new andrapid colorimetric determination of acetylcholinesteraseactivity. Biochem Pharmacol 1961, 7:88-95.
22. Yamamura HI, Synder G: Binding of [3H] QNB in rat brain.Proc. Natl Acad Sci 1981, 71:1725-1729.
23. Lowry OH, Roserbrough NJ, Farr AL, Randall RJ: Protein measure-ment with Folin Phenol reagent. J Biol Chem 1951, 193:265-275.
24. Scatchard G: The attraction of proteins for small moleculesand ions. Ann N Y Acad Sci 1949, 51:660-672.
25. Felder CC, Bymaster FP, Ward J, DeLapp N: Therapeutic oppor-tunities for muscarinic receptors in the central nervous sys-tem. J Med Chem 2000, 43:4333-4353.
26. Wess J: Molecular biology of muscarinic acetylcholine recep-tors. Crit Rev Neurobiol 1996, 10:69-99.
27. Eglen RM: Muscarinic receptor subtype pharmacology andphysiology. Prog Med Chem 2005, 43:105-136.
28. Kahn SE: The importance of cell failure in the developmentand progression of type 2 diabetes. J Clin Endocrinol Metab 2001,86:4047-4058.
29. Ahren B: Autonomic regulation of islet hormone secretion –implications for health and disease. Diabetologia 2000,43:393-410.
30. Gilon P, Henquin JC: Mechanisms and physiological significanceof the cholinergic control of pancreatic cell function. EndocrRev 2001, 22:565-604.
31. Wess J: Muscarinic acetylcholine receptor knockout mice:novel phenotypes and clinical implications. Annu Rev PharmacolToxicol 2004, 44:423-450.
32. Sudha B, Paulose CS: Induction of DNA synthesis in primaryculture of rat hepatocyte by serotonin: Possible involvementof serotonin S2 receptor. Hepatology 1998, 27:62-66.
33. Biju MP, Pyroja S, Rajesh NV, Paulose CS: Hepatic GABA A recep-tor functional regulation during liver cell proliferation. Hepa-tol Res 2001, 21:136-146.
34. Renuka TR, Ani DV, Paulose CS: Alterations in the muscarinicM1 and M3 receptor gene expression in the brain stem dur-ing pancreatic regeneration and insulin secretion in weanlingrat. Life Sci 2004, 75:2269-2280.
35. Mohanan VV, Kaimal SB, Paulose CS: Decreased 5-HT1A recep-tor gene expression and 5HT1A receptor protein in the cer-ebral cortex and brain stem during pancreatic regenerationin rats. Neurochem Res 2005, 30:25-32.
36. Kaimal SB, Gireesh G, Paulose CS: Decreased GABAA receptorfunction in the brain stem during pancreatic regeneration inrats. Neurochem Res 2007.
Page 10 of 11(page number not for citation purposes)
http://www.ncbi.nlm.nih.gov/entrez/query.fcgi?cmd=Retrieve&db=PubMed&dopt=Abstract&list_uids=7028562
http://www.ncbi.nlm.nih.gov/entrez/query.fcgi?cmd=Retrieve&db=PubMed&dopt=Abstract&list_uids=7028562
http://www.ncbi.nlm.nih.gov/entrez/query.fcgi?cmd=Retrieve&db=PubMed&dopt=Abstract&list_uids=7028562
http://www.ncbi.nlm.nih.gov/entrez/query.fcgi?cmd=Retrieve&db=PubMed&dopt=Abstract&list_uids=3964838
http://www.ncbi.nlm.nih.gov/entrez/query.fcgi?cmd=Retrieve&db=PubMed&dopt=Abstract&list_uids=3964838
http://www.ncbi.nlm.nih.gov/entrez/query.fcgi?cmd=Retrieve&db=PubMed&dopt=Abstract&list_uids=6493613
http://www.ncbi.nlm.nih.gov/entrez/query.fcgi?cmd=Retrieve&db=PubMed&dopt=Abstract&list_uids=9647869
http://www.ncbi.nlm.nih.gov/entrez/query.fcgi?cmd=Retrieve&db=PubMed&dopt=Abstract&list_uids=9647869
http://www.ncbi.nlm.nih.gov/entrez/query.fcgi?cmd=Retrieve&db=PubMed&dopt=Abstract&list_uids=2409457
http://www.ncbi.nlm.nih.gov/entrez/query.fcgi?cmd=Retrieve&db=PubMed&dopt=Abstract&list_uids=2409457
http://www.ncbi.nlm.nih.gov/entrez/query.fcgi?cmd=Retrieve&db=PubMed&dopt=Abstract&list_uids=2409457
http://www.ncbi.nlm.nih.gov/entrez/query.fcgi?cmd=Retrieve&db=PubMed&dopt=Abstract&list_uids=1913176
http://www.ncbi.nlm.nih.gov/entrez/query.fcgi?cmd=Retrieve&db=PubMed&dopt=Abstract&list_uids=1913176
http://www.ncbi.nlm.nih.gov/entrez/query.fcgi?cmd=Retrieve&db=PubMed&dopt=Abstract&list_uids=1468182
http://www.ncbi.nlm.nih.gov/entrez/query.fcgi?cmd=Retrieve&db=PubMed&dopt=Abstract&list_uids=1468182
http://www.ncbi.nlm.nih.gov/entrez/query.fcgi?cmd=Retrieve&db=PubMed&dopt=Abstract&list_uids=1941081
http://www.ncbi.nlm.nih.gov/entrez/query.fcgi?cmd=Retrieve&db=PubMed&dopt=Abstract&list_uids=1941081
http://www.ncbi.nlm.nih.gov/entrez/query.fcgi?cmd=Retrieve&db=PubMed&dopt=Abstract&list_uids=1941081
http://www.ncbi.nlm.nih.gov/entrez/query.fcgi?cmd=Retrieve&db=PubMed&dopt=Abstract&list_uids=8429821
http://www.ncbi.nlm.nih.gov/entrez/query.fcgi?cmd=Retrieve&db=PubMed&dopt=Abstract&list_uids=8429821
http://www.ncbi.nlm.nih.gov/entrez/query.fcgi?cmd=Retrieve&db=PubMed&dopt=Abstract&list_uids=8429821
http://www.ncbi.nlm.nih.gov/entrez/query.fcgi?cmd=Retrieve&db=PubMed&dopt=Abstract&list_uids=4241908
http://www.ncbi.nlm.nih.gov/entrez/query.fcgi?cmd=Retrieve&db=PubMed&dopt=Abstract&list_uids=4241908
http://www.ncbi.nlm.nih.gov/entrez/query.fcgi?cmd=Retrieve&db=PubMed&dopt=Abstract&list_uids=4241908
http://www.ncbi.nlm.nih.gov/entrez/query.fcgi?cmd=Retrieve&db=PubMed&dopt=Abstract&list_uids=6015682
http://www.ncbi.nlm.nih.gov/entrez/query.fcgi?cmd=Retrieve&db=PubMed&dopt=Abstract&list_uids=6015682
http://www.ncbi.nlm.nih.gov/entrez/query.fcgi?cmd=Retrieve&db=PubMed&dopt=Abstract&list_uids=6015682
http://www.ncbi.nlm.nih.gov/entrez/query.fcgi?cmd=Retrieve&db=PubMed&dopt=Abstract&list_uids=5950056
http://www.ncbi.nlm.nih.gov/entrez/query.fcgi?cmd=Retrieve&db=PubMed&dopt=Abstract&list_uids=5950056
http://www.ncbi.nlm.nih.gov/entrez/query.fcgi?cmd=Retrieve&db=PubMed&dopt=Abstract&list_uids=8853955
http://www.ncbi.nlm.nih.gov/entrez/query.fcgi?cmd=Retrieve&db=PubMed&dopt=Abstract&list_uids=8853955
http://www.ncbi.nlm.nih.gov/entrez/query.fcgi?cmd=Retrieve&db=PubMed&dopt=Abstract&list_uids=9425918
http://www.ncbi.nlm.nih.gov/entrez/query.fcgi?cmd=Retrieve&db=PubMed&dopt=Abstract&list_uids=9425918

Journal of Biomedical Science 2009, 16:38 http://www.jbiomedsci.com/content/16/1/38
Publish with BioMed Central and every scientist can read your work free of charge
"BioMed Central will be the most significant development for disseminating the results of biomedical research in our lifetime."
Sir Paul Nurse, Cancer Research UK
Your research papers will be:
available free of charge to the entire biomedical community
peer reviewed and published immediately upon acceptance
cited in PubMed and archived on PubMed Central
yours — you keep the copyright
Submit your manuscript here:http://www.biomedcentral.com/info/publishing_adv.asp
BioMedcentral
37. Abraham A, Paulose CS: Age related alterations in noradrener-gic function in brain stem of streptozotocin-diabetic rats. JBiochem Mol Biol Biophys 1999, 31:171-176.
38. Levey AI: Immunological localization of M1–M5 muscarinicacetylcholine receptors in peripheral tissues and brain. LifeSci 1993, 52:441-48.
39. Vilaró MT, Mengod G, Palacios JM: Advances and limitations ofthe molecular neuroanatomy of cholinergic receptors: theexample of multiple muscarinic receptors. Prog Brain Res.1993:95-101.
40. Wolfe BB, Yasuda RP: Development of selective antisera formuscarinic cholinergic receptor subtypes. Ann NY Acad Sci1995, 757:186-93.
41. Quirion R, Aubert I, Lapchak PA, Schaum RP, Teolis S: Muscarinicreceptor subtypes in human neurodegenerative disorders:focus on Alzheimer's disease. Trends Pharmacol Sci. 1989,10:80-84.
42. Fisher A, Heldman E, Gurwitz D, Haring R, Karton Y: M1 agonistsfor the treatment of Alzheimer's disease. Novel propertiesand clinical update. Ann NY Acad Sci 1996, 177:189-196.
43. Hoover DB, Muth EA, Jacobowitz DM: A mapping of the distribu-tion of acetylcholine, choline acetyltransferase and acetyl-cholinesterase in discrete areas of rat brain. Brain Res 1978,153:295-306.
44. Weiner DM, Levey AI, Brann MR: Expression of muscarinic ace-tylcholine and dopamine receptor mRNAs in rat basal gan-glia. Proc Natl Acad Sci USA 1990, 87:7050-7054.
45. Bernard V, Normand E, Bloch B: Phenotypical characterizationof the rat striatal neurons expressing muscarinic receptorgenes. J Neurosci 1992, 12:3591-600.
46. Greenberg GR, Pokol-Daniel S: Neural modulation of glucose-dependent insulinotropic peptide (GIP) and insulin secretionin conscious dogs. Pancreas 1994, 9:531-535.
47. Tassava MT, Okuda T, Romsos DR: Insulin secretion from ob/obmouse pancreatic islets: effects of neurotransmitters. Am JPhysiol 1992:262.
48. Iismaa TP, Kerr EA, Wilson JR, Carpenter L, Sims N, Biden TJ: Quan-titative and functional characterization of muscarinic recep-tor subtypes in insulin-secreting cell lines and rat pancreaticislets. Diabetes 2000, 493:92-398.
49. Reyes AE, Perez DR, Alvarez A, Garrido J, Gentry MK, Doctor BP,Inestrosa NC: A monoclonal antibody against acetylcho-linesterase inhibits the formation of amyloid fibrils inducedby the enzyme. Biochem Biophys Res Commun 1997, 232:652-655.
50. Layer PG, Alber R, Sporns O: Quantitative development andmolecular forms of acetylcholinesterase and butyrylcho-linesterase during morphogenesi s and synaptogenesi s ofchick brain and retina. J Neurochem 1987, 49:175-182.
51. Akmayev IG, Rubberia E, Fiddina OV: CNS-endocrine pancreassystem. IV. Evidence for the existence of a direct hypotha-lamic-vagal descending pathway. Endokrinologie 1978,71:169-174.
52. Waelbroeck M, Tastenoy M, Camus J, Christophe J: Bindingofselective antagonists to four muscarinic receptors (M1 – M4)in rat forebrain. Mol Pharmacol 1990, 38:267-273.
53. Ehlert F, Tran LLP: Regional distribution of M 1, M2 and non-Ml, non-M2 subtypes of muscarinic binding sites in rat brain.J Pharmacol Exp Ther 1990, 255:1148-1157.
54. Sugita S, Chimura NU, Jiang ZG, North R: Distinct muscarinicreceptors inhibit release of gamma-aminobutyric acid andexcitatory amino acids in mammalian brain. Proc Natl Acad SciUSA 1991, 88:2608-2611.
Page 11 of 11(page number not for citation purposes)
http://www.ncbi.nlm.nih.gov/entrez/query.fcgi?cmd=Retrieve&db=PubMed&dopt=Abstract&list_uids=8441326
http://www.ncbi.nlm.nih.gov/entrez/query.fcgi?cmd=Retrieve&db=PubMed&dopt=Abstract&list_uids=8441326
http://www.ncbi.nlm.nih.gov/entrez/query.fcgi?cmd=Retrieve&db=PubMed&dopt=Abstract&list_uids=8248542
http://www.ncbi.nlm.nih.gov/entrez/query.fcgi?cmd=Retrieve&db=PubMed&dopt=Abstract&list_uids=8248542
http://www.ncbi.nlm.nih.gov/entrez/query.fcgi?cmd=Retrieve&db=PubMed&dopt=Abstract&list_uids=8248542
http://www.ncbi.nlm.nih.gov/entrez/query.fcgi?cmd=Retrieve&db=PubMed&dopt=Abstract&list_uids=7611674
http://www.ncbi.nlm.nih.gov/entrez/query.fcgi?cmd=Retrieve&db=PubMed&dopt=Abstract&list_uids=7611674
http://www.ncbi.nlm.nih.gov/entrez/query.fcgi?cmd=Retrieve&db=PubMed&dopt=Abstract&list_uids=2402490
http://www.ncbi.nlm.nih.gov/entrez/query.fcgi?cmd=Retrieve&db=PubMed&dopt=Abstract&list_uids=2402490
http://www.ncbi.nlm.nih.gov/entrez/query.fcgi?cmd=Retrieve&db=PubMed&dopt=Abstract&list_uids=2402490
http://www.ncbi.nlm.nih.gov/entrez/query.fcgi?cmd=Retrieve&db=PubMed&dopt=Abstract&list_uids=1527598
http://www.ncbi.nlm.nih.gov/entrez/query.fcgi?cmd=Retrieve&db=PubMed&dopt=Abstract&list_uids=1527598
http://www.ncbi.nlm.nih.gov/entrez/query.fcgi?cmd=Retrieve&db=PubMed&dopt=Abstract&list_uids=1527598
http://www.ncbi.nlm.nih.gov/entrez/query.fcgi?cmd=Retrieve&db=PubMed&dopt=Abstract&list_uids=7937701
http://www.ncbi.nlm.nih.gov/entrez/query.fcgi?cmd=Retrieve&db=PubMed&dopt=Abstract&list_uids=7937701
http://www.ncbi.nlm.nih.gov/entrez/query.fcgi?cmd=Retrieve&db=PubMed&dopt=Abstract&list_uids=7937701
http://www.ncbi.nlm.nih.gov/entrez/query.fcgi?cmd=Retrieve&db=PubMed&dopt=Abstract&list_uids=9126330
http://www.ncbi.nlm.nih.gov/entrez/query.fcgi?cmd=Retrieve&db=PubMed&dopt=Abstract&list_uids=9126330
http://www.ncbi.nlm.nih.gov/entrez/query.fcgi?cmd=Retrieve&db=PubMed&dopt=Abstract&list_uids=9126330
http://www.ncbi.nlm.nih.gov/entrez/query.fcgi?cmd=Retrieve&db=PubMed&dopt=Abstract&list_uids=3585328
http://www.ncbi.nlm.nih.gov/entrez/query.fcgi?cmd=Retrieve&db=PubMed&dopt=Abstract&list_uids=3585328
http://www.ncbi.nlm.nih.gov/entrez/query.fcgi?cmd=Retrieve&db=PubMed&dopt=Abstract&list_uids=3585328
http://www.ncbi.nlm.nih.gov/entrez/query.fcgi?cmd=Retrieve&db=PubMed&dopt=Abstract&list_uids=2385234
http://www.ncbi.nlm.nih.gov/entrez/query.fcgi?cmd=Retrieve&db=PubMed&dopt=Abstract&list_uids=2385234
http://www.ncbi.nlm.nih.gov/entrez/query.fcgi?cmd=Retrieve&db=PubMed&dopt=Abstract&list_uids=2385234
http://www.ncbi.nlm.nih.gov/entrez/query.fcgi?cmd=Retrieve&db=PubMed&dopt=Abstract&list_uids=2262898
http://www.ncbi.nlm.nih.gov/entrez/query.fcgi?cmd=Retrieve&db=PubMed&dopt=Abstract&list_uids=2262898
http://www.ncbi.nlm.nih.gov/entrez/query.fcgi?cmd=Retrieve&db=PubMed&dopt=Abstract&list_uids=1672454
http://www.ncbi.nlm.nih.gov/entrez/query.fcgi?cmd=Retrieve&db=PubMed&dopt=Abstract&list_uids=1672454