Beneficial metabolic effects of M 3 muscarinic acetylcholine receptor deficiency
13
Beneficial metabolic effects of M 3 muscarinic acetylcholine receptor deficiency Dinesh Gautam, 1 Oksana Gavrilova, 2 Jongrye Jeon, 1 Stephanie Pack, 2 William Jou, 2 Yinghong Cui, 1 Jian H. Li, 1 and Ju ¨ rgen Wess 1, * 1 Molecular Signaling Section, Laboratory of Bioorganic Chemistry 2 Mouse Metabolic Core Laboratory National Institute of Diabetes and Digestive and Kidney Diseases, Bethesda, Maryland 20892 *Correspondence: [email protected] Summary Most animal models of obesity and hyperinsulinemia are associated with increased vagal cholinergic activity. The M 3 muscarinic acetylcholine receptor subtype is widely expressed in the brain and peripheral tissues and plays a key role in mediating the physiological effects of vagal activation. Here, we tested the hypothesis that the absence of M 3 receptors in mice might protect against various forms of experimentally or genetically induced obesity and obesity-associated meta- bolic deficits. In all cases, the lack of M 3 receptors greatly ameliorated impairments in glucose homeostasis and insulin sensitivity but had less robust effects on overall adiposity. Under all experimental conditions tested, M 3 receptor-deficient mice showed a significant elevation in basal and total energy expenditure, most likely due to enhanced central sympathetic outflow and increased rate of fatty-acid oxidation. These findings suggest that the M 3 receptor may represent a potential pharmacologic target for the treatment of obesity and associated metabolic disorders. Introduction Obesity and obesity-associated type 2 diabetes have emerged as two of the major threats to human health in the 21st century (Yach et al., 2006). As a result, the molecular pathways regulat- ing appetite and fat storage have become the subject of intense investigation. Several lines of evidence indicate that central and peripheral cholinergic pathways play an important role in the regulation of glucose and energy homeostasis (Bray and York, 1979; Niijima, 1989; Rohner-Jeanrenaud, 1995; Ahren, 2000; Gilon and Henquin, 2001; Lam et al., 2005). Interestingly, most animal models of obesity and hyperinsulinemia are associated with increased vagal cholinergic activity and reduced sympa- thetic tone (Rohner-Jeanrenaud, 1995; Gilon and Henquin, 2001). Increases in the tone of peripheral parasympathetic (va- gal) nerves leads to enhanced acetylcholine release, triggering changes in the activity of various effector organs and tissues involved in the regulation of glucose and energy homeostasis (Niijima, 1989; Ahren, 2000; Gilon and Henquin, 2001). The physiological actions of acetylcholine released from para- sympathetic nerve endings are mediated by a family of G pro- tein-coupled receptors referred to as muscarinic acetylcholine receptors (Wess, 1996; Caulfield and Birdsall, 1998). Molecular cloning studies have revealed the existence of five different muscarinic receptor subtypes (M 1 –M 5 )(Wess, 1996; Caulfield and Birdsall, 1998). The M 3 muscarinic receptor subtype is widely expressed throughout the brain and in many peripheral organs (Levey et al., 1994; Eglen et al., 1996; Wess, 1996; Caul- field and Birdsall, 1998; Yamada et al., 2001) and mediates many of the physiological effects of vagal activation (Eglen et al., 1996; Wess, 1996; Caulfield and Birdsall, 1998). In this study, we tested the hypothesis that the absence of M 3 receptors might protect against different forms of experimen- tally and genetically induced obesity and the associated meta- bolic deficits. This work was prompted by our previous observa- tion that M 3 muscarinic receptor-deficient mice (M3R 2/2 mice) showed reduced adiposity when maintained on regular mouse chow (Yamada et al., 2001). In order to induce obesity, glucose intolerance, and insulin resistance, mice were maintained on a high-fat diet or were treated with gold-thioglucose (GTG), which induces hyperphagia by selectively destroying glucose- receptive neurons in the ventromedial nucleus of the hypothala- mus (Bergen et al., 1998). In addition, we also examined whether the lack of M 3 receptors was able to prevent the increase in body weight and the metabolic complications caused by the absence of leptin. To address this issue, we generated and analyzed mu- tant mice that were deficient in both leptin and M 3 receptors (M3R 2/2 ob/ob mice). In all three experimental models of obesity, M3R 2/2 mice were largely protected against obesity-associated glucose intolerance, insulin resistance, hyperinsulinemia, and hypergly- cemia. Our data suggest that enhanced energy expenditure caused by the absence of M 3 muscarinic receptors represents a major factor contributing to these findings. Results All studies were carried out with male M3R +/+ and M3R 2/2 mice (littermates) that had been backcrossed for 10 generations onto the C57BL/6NTac background. The absence of M 3 receptors protects against diet-induced obesity and associated metabolic deficits The consumption of an energy-rich, high-fat diet is known to trigger obesity and various metabolic changes including im- paired glucose tolerance, insulin resistance, and hyperglycemia. CELL METABOLISM 4, 363–375, NOVEMBER 2006 ª2006 ELSEVIER INC. DOI 10.1016/j.cmet.2006.09.008 363 ARTICLE
-
Upload
independent -
Category
Documents
-
view
0 -
download
0
Transcript of Beneficial metabolic effects of M 3 muscarinic acetylcholine receptor deficiency

A R T I C L E
Beneficial metabolic effects of M3 muscarinic acetylcholinereceptor deficiency
Dinesh Gautam,1 Oksana Gavrilova,2 Jongrye Jeon,1 Stephanie Pack,2 William Jou,2 Yinghong Cui,1 Jian H. Li,1
and Jurgen Wess1,*
1 Molecular Signaling Section, Laboratory of Bioorganic Chemistry2 Mouse Metabolic Core Laboratory
National Institute of Diabetes and Digestive and Kidney Diseases, Bethesda, Maryland 20892
*Correspondence: [email protected]
Summary
Most animal models of obesity and hyperinsulinemia are associated with increased vagal cholinergic activity. The M3
muscarinic acetylcholine receptor subtype is widely expressed in the brain and peripheral tissues and plays a key role inmediating the physiological effects of vagal activation. Here, we tested the hypothesis that the absence of M3 receptorsin mice might protect against various forms of experimentally or genetically induced obesity and obesity-associated meta-bolic deficits. In all cases, the lack of M3 receptors greatly ameliorated impairments in glucose homeostasis and insulinsensitivity but had less robust effects on overall adiposity. Under all experimental conditions tested, M3 receptor-deficientmice showed a significant elevation in basal and total energy expenditure, most likely due to enhanced central sympatheticoutflow and increased rate of fatty-acid oxidation. These findings suggest that the M3 receptor may represent a potentialpharmacologic target for the treatment of obesity and associated metabolic disorders.
Introduction
Obesity and obesity-associated type 2 diabetes have emergedas two of the major threats to human health in the 21st century(Yach et al., 2006). As a result, the molecular pathways regulat-ing appetite and fat storage have become the subject of intenseinvestigation. Several lines of evidence indicate that central andperipheral cholinergic pathways play an important role in theregulation of glucose and energy homeostasis (Bray and York,1979; Niijima, 1989; Rohner-Jeanrenaud, 1995; Ahren, 2000;Gilon and Henquin, 2001; Lam et al., 2005). Interestingly, mostanimal models of obesity and hyperinsulinemia are associatedwith increased vagal cholinergic activity and reduced sympa-thetic tone (Rohner-Jeanrenaud, 1995; Gilon and Henquin,2001). Increases in the tone of peripheral parasympathetic (va-gal) nerves leads to enhanced acetylcholine release, triggeringchanges in the activity of various effector organs and tissuesinvolved in the regulation of glucose and energy homeostasis(Niijima, 1989; Ahren, 2000; Gilon and Henquin, 2001).
The physiological actions of acetylcholine released from para-sympathetic nerve endings are mediated by a family of G pro-tein-coupled receptors referred to as muscarinic acetylcholinereceptors (Wess, 1996; Caulfield and Birdsall, 1998). Molecularcloning studies have revealed the existence of five differentmuscarinic receptor subtypes (M1–M5) (Wess, 1996; Caulfieldand Birdsall, 1998). The M3 muscarinic receptor subtype iswidely expressed throughout the brain and in many peripheralorgans (Levey et al., 1994; Eglen et al., 1996; Wess, 1996; Caul-field and Birdsall, 1998; Yamada et al., 2001) and mediatesmany of the physiological effects of vagal activation (Eglenet al., 1996; Wess, 1996; Caulfield and Birdsall, 1998).
In this study, we tested the hypothesis that the absence of M3
receptors might protect against different forms of experimen-
CELL METABOLISM 4, 363–375, NOVEMBER 2006 ª2006 ELSEVIER IN
tally and genetically induced obesity and the associated meta-bolic deficits. This work was prompted by our previous observa-tion that M3 muscarinic receptor-deficient mice (M3R2/2 mice)showed reduced adiposity when maintained on regular mousechow (Yamada et al., 2001). In order to induce obesity, glucoseintolerance, and insulin resistance, mice were maintained ona high-fat diet or were treated with gold-thioglucose (GTG),which induces hyperphagia by selectively destroying glucose-receptive neurons in the ventromedial nucleus of the hypothala-mus (Bergen et al., 1998). In addition, we also examined whetherthe lack of M3 receptors was able to prevent the increase in bodyweight and the metabolic complications caused by the absenceof leptin. To address this issue, we generated and analyzed mu-tant mice that were deficient in both leptin and M3 receptors(M3R2/2 ob/ob mice).
In all three experimental models of obesity, M3R2/2 micewere largely protected against obesity-associated glucoseintolerance, insulin resistance, hyperinsulinemia, and hypergly-cemia. Our data suggest that enhanced energy expenditurecaused by the absence of M3 muscarinic receptors representsa major factor contributing to these findings.
Results
All studies were carried out with male M3R+/+ and M3R2/2 mice(littermates) that had been backcrossed for 10 generations ontothe C57BL/6NTac background.
The absence of M3 receptors protects againstdiet-induced obesity and associated metabolic deficitsThe consumption of an energy-rich, high-fat diet is known totrigger obesity and various metabolic changes including im-paired glucose tolerance, insulin resistance, and hyperglycemia.
C. DOI 10.1016/j.cmet.2006.09.008 363

A R T I C L E
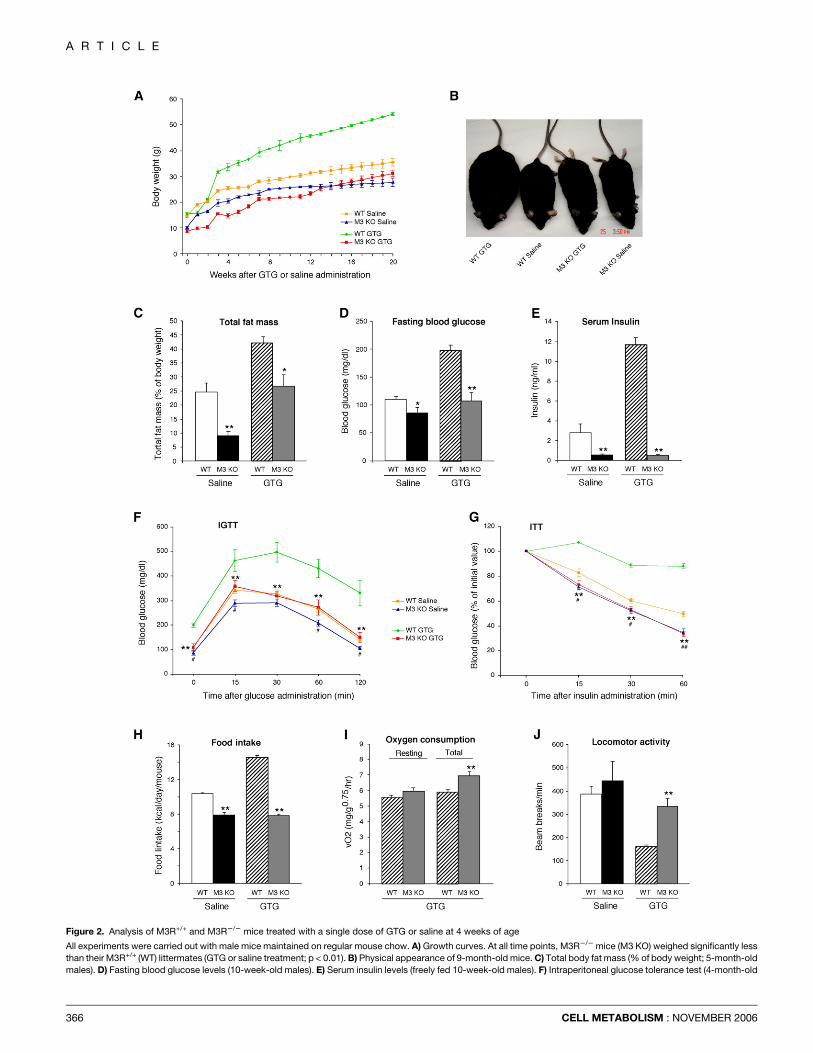
Figure 1. Analysis of male M3R+/+ and M3R2/2 mice maintained on a high-fat diet, as compared to mice consuming regular mouse chow
A) Growth curves. At all time points, M3R2/2 mice (M3 KO) weighed significantly less than their M3R+/+ (WT) littermates (HF, high-fat diet; RF, regular mouse chow;
p < 0.01). B) Physical appearance of 9-month-old mice. C) Total body fat mass (% of body weight; 5-month-old males). D) Fasting blood glucose levels (14-week-old
males). E) Serum insulin levels (freely fed 14-week-old males). F) Intraperitoneal glucose tolerance test (4-month-old males). G) Insulin tolerance test (4.5-month-old males).
H) Food intake (Kcal/day/mouse; 10-month-old males). I) Resting and total metabolic rate (O2 consumption; 5-month-old males). J) Locomotor activity (beam breaks per
min; 5-month-old males). Data are given as means 6 SEM (n = 6–9 per group). *p < 0.05; **p < 0.01 (panels F and G: *p < 0.05; **p < 0.01, as compared to the corresponding
WT HF group; #p < 0.05; ##p < 0.01, as compared to the corresponding WT RF group). vO2, volume of O2 consumed.
To investigate whether deletion of the M3 receptor gene couldprevent or reduce the severity of these metabolic deficits, 4-week-old M3R+/+ and M3R2/2 mice were fed a high-fat diet (fatcontent: 35.5%, w/w) and then monitored for 16 weeks. Mice
364
consuming regular chow (fat content: 5%, w/w) were analyzedin parallel for control purposes.
M3R2/2 mice maintained on regular chow showed a signifi-cant reduction in body weight and total body fat, reduced serum
CELL METABOLISM : NOVEMBER 2006
Effects of M3 muscarinic receptor ablation
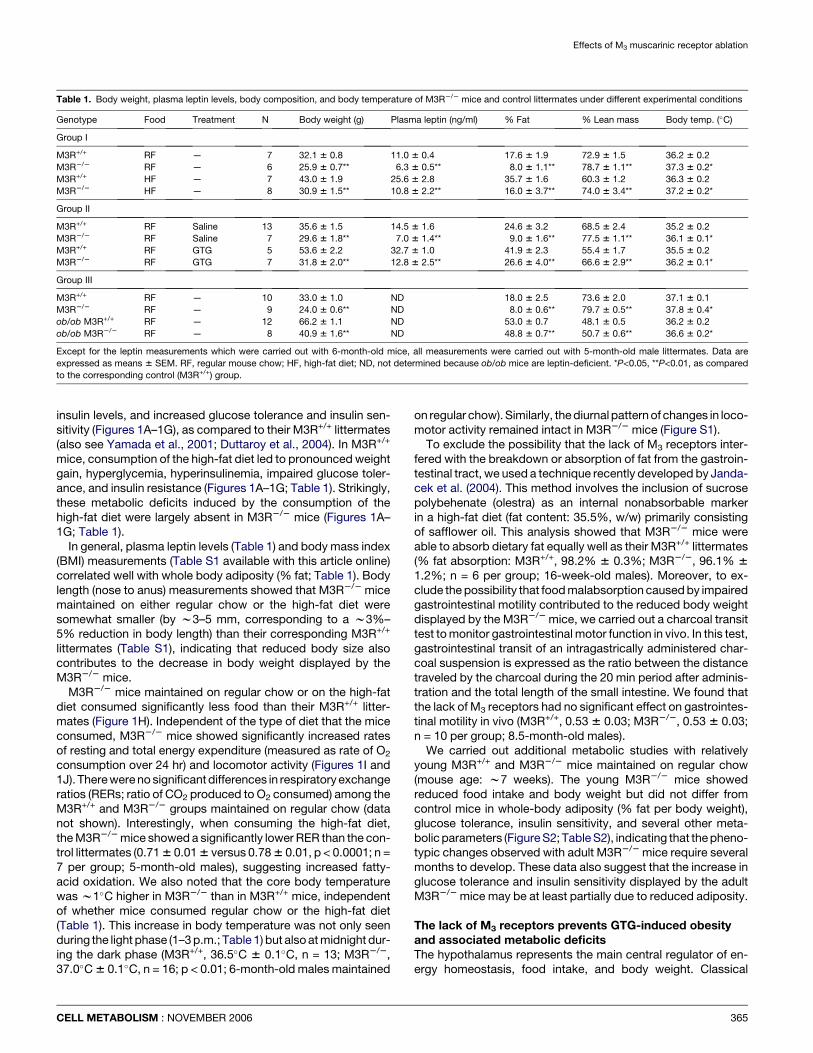
Table 1. Body weight, plasma leptin levels, body composition, and body temperature of M3R2/2 mice and control littermates under different experimental conditions
Genotype Food Treatment N Body weight (g) Plasma leptin (ng/ml) % Fat % Lean mass Body temp. (�C)
Group I
M3R+/+ RF — 7 32.1 6 0.8 11.0 6 0.4 17.6 6 1.9 72.9 6 1.5 36.2 6 0.2
M3R2/2 RF — 6 25.9 6 0.7** 6.3 6 0.5** 8.0 6 1.1** 78.7 6 1.1** 37.3 6 0.2*
M3R+/+ HF — 7 43.0 6 1.9 25.6 6 2.8 35.7 6 1.6 60.3 6 1.2 36.3 6 0.2
M3R2/2 HF — 8 30.9 6 1.5** 10.8 6 2.2** 16.0 6 3.7** 74.0 6 3.4** 37.2 6 0.2*
Group II
M3R+/+ RF Saline 13 35.6 6 1.5 14.5 6 1.6 24.6 6 3.2 68.5 6 2.4 35.2 6 0.2
M3R2/2 RF Saline 7 29.6 6 1.8** 7.0 6 1.4** 9.0 6 1.6** 77.5 6 1.1** 36.1 6 0.1*
M3R+/+ RF GTG 5 53.6 6 2.2 32.7 6 1.0 41.9 6 2.3 55.4 6 1.7 35.5 6 0.2
M3R2/2 RF GTG 7 31.8 6 2.0** 12.8 6 2.5** 26.6 6 4.0** 66.6 6 2.9** 36.2 6 0.1*
Group III
M3R+/+ RF — 10 33.0 6 1.0 ND 18.0 6 2.5 73.6 6 2.0 37.1 6 0.1
M3R2/2 RF — 9 24.0 6 0.6** ND 8.0 6 0.6** 79.7 6 0.5** 37.8 6 0.4*
ob/ob M3R+/+ RF — 12 66.2 6 1.1 ND 53.0 6 0.7 48.1 6 0.5 36.2 6 0.2
ob/ob M3R2/2 RF — 8 40.9 6 1.6** ND 48.8 6 0.7** 50.7 6 0.6** 36.6 6 0.2*
Except for the leptin measurements which were carried out with 6-month-old mice, all measurements were carried out with 5-month-old male littermates. Data are
expressed as means 6 SEM. RF, regular mouse chow; HF, high-fat diet; ND, not determined because ob/ob mice are leptin-deficient. *P<0.05, **P<0.01, as compared
to the corresponding control (M3R+/+) group.
insulin levels, and increased glucose tolerance and insulin sen-sitivity (Figures 1A–1G), as compared to their M3R+/+ littermates(also see Yamada et al., 2001; Duttaroy et al., 2004). In M3R+/+
mice, consumption of the high-fat diet led to pronounced weightgain, hyperglycemia, hyperinsulinemia, impaired glucose toler-ance, and insulin resistance (Figures 1A–1G; Table 1). Strikingly,these metabolic deficits induced by the consumption of thehigh-fat diet were largely absent in M3R2/2 mice (Figures 1A–1G; Table 1).
In general, plasma leptin levels (Table 1) and body mass index(BMI) measurements (Table S1 available with this article online)correlated well with whole body adiposity (% fat; Table 1). Bodylength (nose to anus) measurements showed that M3R2/2 micemaintained on either regular chow or the high-fat diet weresomewhat smaller (by w3–5 mm, corresponding to a w3%–5% reduction in body length) than their corresponding M3R+/+
littermates (Table S1), indicating that reduced body size alsocontributes to the decrease in body weight displayed by theM3R2/2 mice.
M3R2/2 mice maintained on regular chow or on the high-fatdiet consumed significantly less food than their M3R+/+ litter-mates (Figure 1H). Independent of the type of diet that the miceconsumed, M3R2/2 mice showed significantly increased ratesof resting and total energy expenditure (measured as rate of O2
consumption over 24 hr) and locomotor activity (Figures 1I and1J). There were no significant differences in respiratory exchangeratios (RERs; ratio of CO2 produced to O2 consumed) among theM3R+/+ and M3R2/2 groups maintained on regular chow (datanot shown). Interestingly, when consuming the high-fat diet,the M3R2/2 mice showed a significantly lower RER than the con-trol littermates (0.71 6 0.01 6 versus 0.78 6 0.01, p < 0.0001; n =7 per group; 5-month-old males), suggesting increased fatty-acid oxidation. We also noted that the core body temperaturewas w1�C higher in M3R2/2 than in M3R+/+ mice, independentof whether mice consumed regular chow or the high-fat diet(Table 1). This increase in body temperature was not only seenduring the light phase (1–3 p.m.; Table 1) but also at midnight dur-ing the dark phase (M3R+/+, 36.5�C 6 0.1�C, n = 13; M3R2/2,37.0�C 6 0.1�C, n = 16; p < 0.01; 6-month-old males maintained
CELL METABOLISM : NOVEMBER 2006
on regular chow). Similarly, the diurnal pattern of changes in loco-motor activity remained intact in M3R2/2 mice (Figure S1).
To exclude the possibility that the lack of M3 receptors inter-fered with the breakdown or absorption of fat from the gastroin-testinal tract, we used a technique recently developed by Janda-cek et al. (2004). This method involves the inclusion of sucrosepolybehenate (olestra) as an internal nonabsorbable markerin a high-fat diet (fat content: 35.5%, w/w) primarily consistingof safflower oil. This analysis showed that M3R2/2 mice wereable to absorb dietary fat equally well as their M3R+/+ littermates(% fat absorption: M3R+/+, 98.2% 6 0.3%; M3R2/2, 96.1% 61.2%; n = 6 per group; 16-week-old males). Moreover, to ex-clude the possibility that food malabsorption caused by impairedgastrointestinal motility contributed to the reduced body weightdisplayed by the M3R2/2 mice, we carried out a charcoal transittest to monitor gastrointestinal motor function in vivo. In this test,gastrointestinal transit of an intragastrically administered char-coal suspension is expressed as the ratio between the distancetraveled by the charcoal during the 20 min period after adminis-tration and the total length of the small intestine. We found thatthe lack of M3 receptors had no significant effect on gastrointes-tinal motility in vivo (M3R+/+, 0.53 6 0.03; M3R2/2, 0.53 6 0.03;n = 10 per group; 8.5-month-old males).
We carried out additional metabolic studies with relativelyyoung M3R+/+ and M3R2/2 mice maintained on regular chow(mouse age: w7 weeks). The young M3R2/2 mice showedreduced food intake and body weight but did not differ fromcontrol mice in whole-body adiposity (% fat per body weight),glucose tolerance, insulin sensitivity, and several other meta-bolic parameters (Figure S2; Table S2), indicating that the pheno-typic changes observed with adult M3R2/2 mice require severalmonths to develop. These data also suggest that the increase inglucose tolerance and insulin sensitivity displayed by the adultM3R2/2 mice may be at least partially due to reduced adiposity.
The lack of M3 receptors prevents GTG-induced obesityand associated metabolic deficitsThe hypothalamus represents the main central regulator of en-ergy homeostasis, food intake, and body weight. Classical
365
A R T I C L E
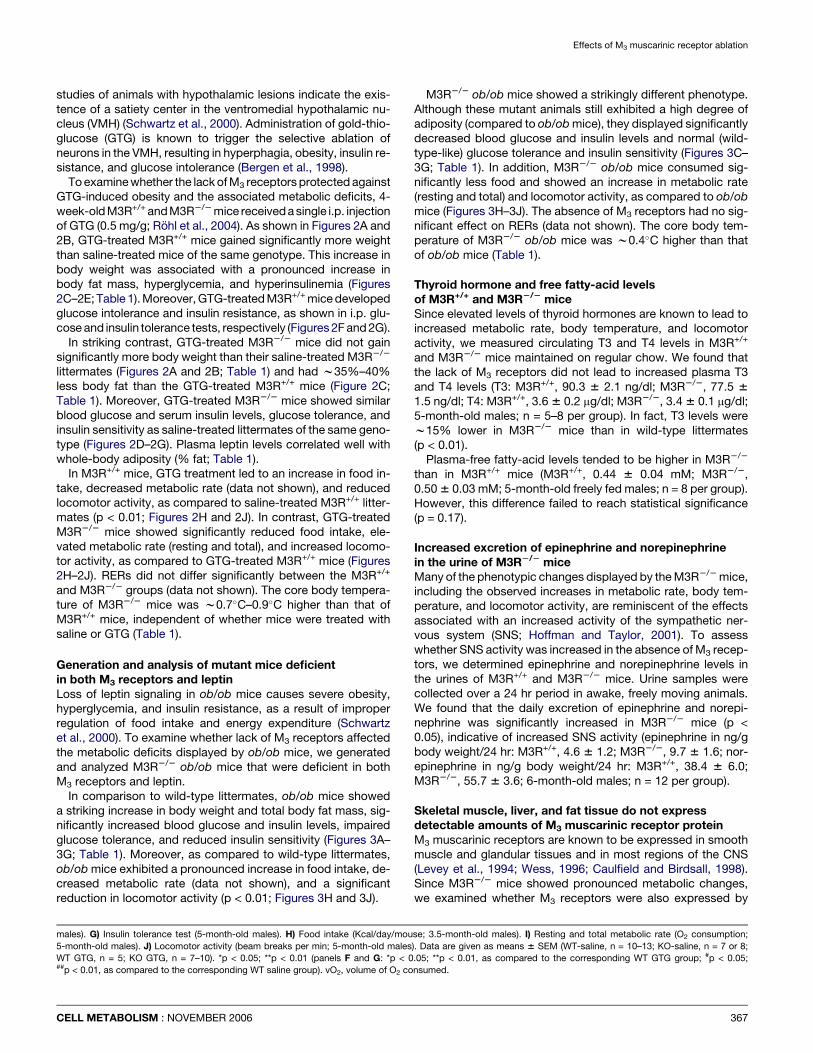
Figure 2. Analysis of M3R+/+ and M3R2/2 mice treated with a single dose of GTG or saline at 4 weeks of age
All experiments were carried out with male mice maintained on regular mouse chow. A) Growth curves. At all time points, M3R2/2 mice (M3 KO) weighed significantly less
than their M3R+/+ (WT) littermates (GTG or saline treatment; p < 0.01). B) Physical appearance of 9-month-old mice. C) Total body fat mass (% of body weight; 5-month-old
males). D) Fasting blood glucose levels (10-week-old males). E) Serum insulin levels (freely fed 10-week-old males). F) Intraperitoneal glucose tolerance test (4-month-old
366 CELL METABOLISM : NOVEMBER 2006
Effects of M3 muscarinic receptor ablation
studies of animals with hypothalamic lesions indicate the exis-tence of a satiety center in the ventromedial hypothalamic nu-cleus (VMH) (Schwartz et al., 2000). Administration of gold-thio-glucose (GTG) is known to trigger the selective ablation ofneurons in the VMH, resulting in hyperphagia, obesity, insulin re-sistance, and glucose intolerance (Bergen et al., 1998).
To examine whether the lack of M3 receptors protected againstGTG-induced obesity and the associated metabolic deficits, 4-week-oldM3R+/+ and M3R2/2 mice receiveda single i.p. injectionof GTG (0.5 mg/g; Rohl et al., 2004). As shown in Figures 2A and2B, GTG-treated M3R+/+ mice gained significantly more weightthan saline-treated mice of the same genotype. This increase inbody weight was associated with a pronounced increase inbody fat mass, hyperglycemia, and hyperinsulinemia (Figures2C–2E; Table 1). Moreover, GTG-treated M3R+/+ mice developedglucose intolerance and insulin resistance, as shown in i.p. glu-cose and insulin tolerance tests, respectively (Figures 2F and 2G).
In striking contrast, GTG-treated M3R2/2 mice did not gainsignificantly more body weight than their saline-treated M3R2/2
littermates (Figures 2A and 2B; Table 1) and had w35%–40%less body fat than the GTG-treated M3R+/+ mice (Figure 2C;Table 1). Moreover, GTG-treated M3R2/2 mice showed similarblood glucose and serum insulin levels, glucose tolerance, andinsulin sensitivity as saline-treated littermates of the same geno-type (Figures 2D–2G). Plasma leptin levels correlated well withwhole-body adiposity (% fat; Table 1).
In M3R+/+ mice, GTG treatment led to an increase in food in-take, decreased metabolic rate (data not shown), and reducedlocomotor activity, as compared to saline-treated M3R+/+ litter-mates (p < 0.01; Figures 2H and 2J). In contrast, GTG-treatedM3R2/2 mice showed significantly reduced food intake, ele-vated metabolic rate (resting and total), and increased locomo-tor activity, as compared to GTG-treated M3R+/+ mice (Figures2H–2J). RERs did not differ significantly between the M3R+/+
and M3R2/2 groups (data not shown). The core body tempera-ture of M3R2/2 mice was w0.7�C–0.9�C higher than that ofM3R+/+ mice, independent of whether mice were treated withsaline or GTG (Table 1).
Generation and analysis of mutant mice deficientin both M3 receptors and leptinLoss of leptin signaling in ob/ob mice causes severe obesity,hyperglycemia, and insulin resistance, as a result of improperregulation of food intake and energy expenditure (Schwartzet al., 2000). To examine whether lack of M3 receptors affectedthe metabolic deficits displayed by ob/ob mice, we generatedand analyzed M3R2/2 ob/ob mice that were deficient in bothM3 receptors and leptin.
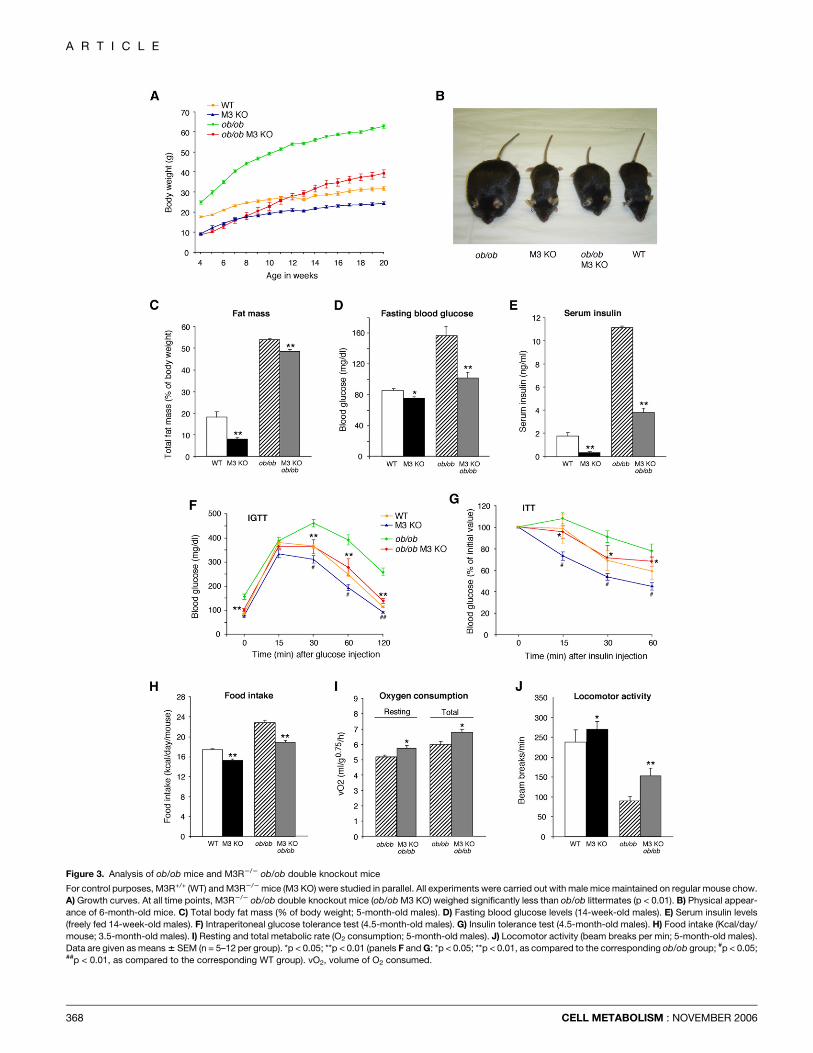
In comparison to wild-type littermates, ob/ob mice showeda striking increase in body weight and total body fat mass, sig-nificantly increased blood glucose and insulin levels, impairedglucose tolerance, and reduced insulin sensitivity (Figures 3A–3G; Table 1). Moreover, as compared to wild-type littermates,ob/ob mice exhibited a pronounced increase in food intake, de-creased metabolic rate (data not shown), and a significantreduction in locomotor activity (p < 0.01; Figures 3H and 3J).
CELL METABOLISM : NOVEMBER 2006
M3R2/2 ob/ob mice showed a strikingly different phenotype.Although these mutant animals still exhibited a high degree ofadiposity (compared to ob/ob mice), they displayed significantlydecreased blood glucose and insulin levels and normal (wild-type-like) glucose tolerance and insulin sensitivity (Figures 3C–3G; Table 1). In addition, M3R2/2 ob/ob mice consumed sig-nificantly less food and showed an increase in metabolic rate(resting and total) and locomotor activity, as compared to ob/obmice (Figures 3H–3J). The absence of M3 receptors had no sig-nificant effect on RERs (data not shown). The core body tem-perature of M3R2/2 ob/ob mice was w0.4�C higher than thatof ob/ob mice (Table 1).
Thyroid hormone and free fatty-acid levelsof M3R+/+ and M3R2/2 miceSince elevated levels of thyroid hormones are known to lead toincreased metabolic rate, body temperature, and locomotoractivity, we measured circulating T3 and T4 levels in M3R+/+
and M3R2/2 mice maintained on regular chow. We found thatthe lack of M3 receptors did not lead to increased plasma T3and T4 levels (T3: M3R+/+, 90.3 6 2.1 ng/dl; M3R2/2, 77.5 61.5 ng/dl; T4: M3R+/+, 3.6 6 0.2 mg/dl; M3R2/2, 3.4 6 0.1 mg/dl;5-month-old males; n = 5–8 per group). In fact, T3 levels werew15% lower in M3R2/2 mice than in wild-type littermates(p < 0.01).
Plasma-free fatty-acid levels tended to be higher in M3R2/2
than in M3R+/+ mice (M3R+/+, 0.44 6 0.04 mM; M3R2/2,0.50 6 0.03 mM; 5-month-old freely fed males; n = 8 per group).However, this difference failed to reach statistical significance(p = 0.17).
Increased excretion of epinephrine and norepinephrinein the urine of M3R2/2 miceMany of the phenotypic changes displayed by the M3R2/2 mice,including the observed increases in metabolic rate, body tem-perature, and locomotor activity, are reminiscent of the effectsassociated with an increased activity of the sympathetic ner-vous system (SNS; Hoffman and Taylor, 2001). To assesswhether SNS activity was increased in the absence of M3 recep-tors, we determined epinephrine and norepinephrine levels inthe urines of M3R+/+ and M3R2/2 mice. Urine samples werecollected over a 24 hr period in awake, freely moving animals.We found that the daily excretion of epinephrine and norepi-nephrine was significantly increased in M3R2/2 mice (p <0.05), indicative of increased SNS activity (epinephrine in ng/gbody weight/24 hr: M3R+/+, 4.6 6 1.2; M3R2/2, 9.7 6 1.6; nor-epinephrine in ng/g body weight/24 hr: M3R+/+, 38.4 6 6.0;M3R2/2, 55.7 6 3.6; 6-month-old males; n = 12 per group).
Skeletal muscle, liver, and fat tissue do not expressdetectable amounts of M3 muscarinic receptor proteinM3 muscarinic receptors are known to be expressed in smoothmuscle and glandular tissues and in most regions of the CNS(Levey et al., 1994; Wess, 1996; Caulfield and Birdsall, 1998).Since M3R2/2 mice showed pronounced metabolic changes,we examined whether M3 receptors were also expressed by
males). G) Insulin tolerance test (5-month-old males). H) Food intake (Kcal/day/mouse; 3.5-month-old males). I) Resting and total metabolic rate (O2 consumption;
5-month-old males). J) Locomotor activity (beam breaks per min; 5-month-old males). Data are given as means 6 SEM (WT-saline, n = 10–13; KO-saline, n = 7 or 8;
WT GTG, n = 5; KO GTG, n = 7–10). *p < 0.05; **p < 0.01 (panels F and G: *p < 0.05; **p < 0.01, as compared to the corresponding WT GTG group; #p < 0.05;##p < 0.01, as compared to the corresponding WT saline group). vO2, volume of O2 consumed.
367
A R T I C L E
Figure 3. Analysis of ob/ob mice and M3R2/2 ob/ob double knockout mice
For control purposes, M3R+/+ (WT) and M3R2/2 mice (M3 KO) were studied in parallel. All experiments were carried out with male mice maintained on regular mouse chow.
A) Growth curves. At all time points, M3R2/2 ob/ob double knockout mice (ob/ob M3 KO) weighed significantly less than ob/ob littermates (p < 0.01). B) Physical appear-
ance of 6-month-old mice. C) Total body fat mass (% of body weight; 5-month-old males). D) Fasting blood glucose levels (14-week-old males). E) Serum insulin levels
(freely fed 14-week-old males). F) Intraperitoneal glucose tolerance test (4.5-month-old males). G) Insulin tolerance test (4.5-month-old males). H) Food intake (Kcal/day/
mouse; 3.5-month-old males). I) Resting and total metabolic rate (O2 consumption; 5-month-old males). J) Locomotor activity (beam breaks per min; 5-month-old males).
Data are given as means 6 SEM (n = 5–12 per group). *p < 0.05; **p < 0.01 (panels F and G: *p < 0.05; **p < 0.01, as compared to the corresponding ob/ob group; #p < 0.05;##p < 0.01, as compared to the corresponding WT group). vO2, volume of O2 consumed.
368 CELL METABOLISM : NOVEMBER 2006
Effects of M3 muscarinic receptor ablation
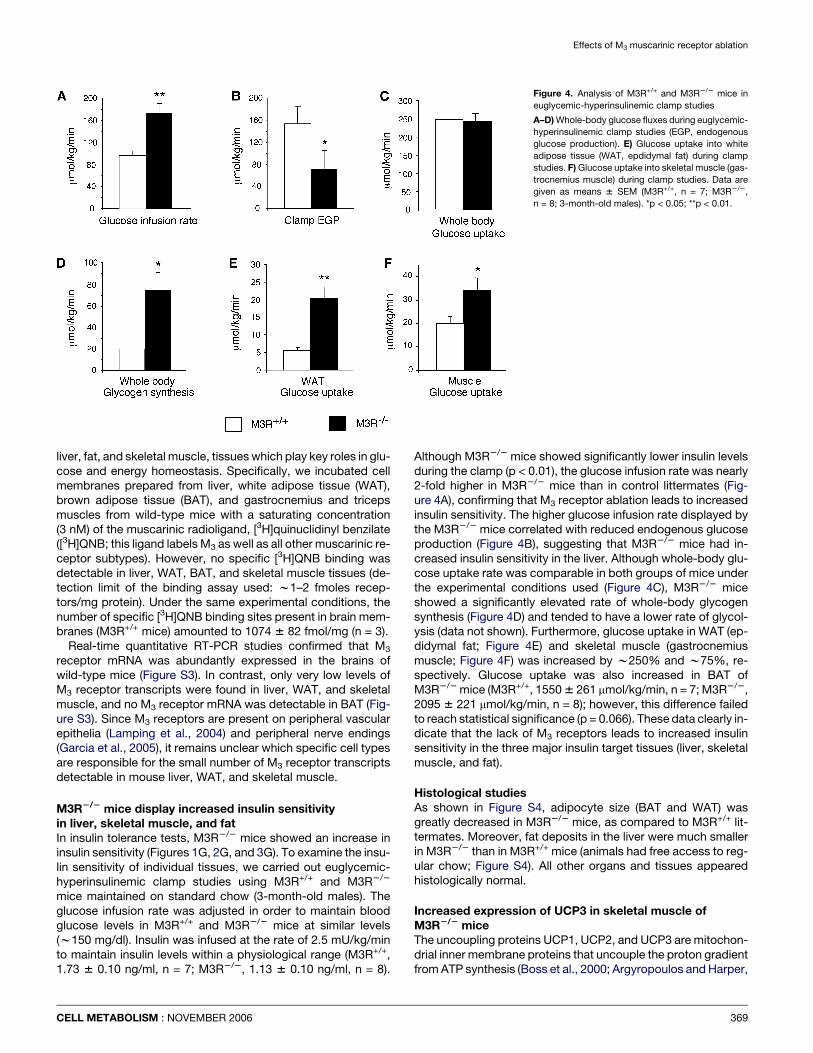
Figure 4. Analysis of M3R+/+ and M3R2/2 mice in
euglycemic-hyperinsulinemic clamp studies
A–D) Whole-body glucose fluxes during euglycemic-
hyperinsulinemic clamp studies (EGP, endogenous
glucose production). E) Glucose uptake into white
adipose tissue (WAT, epdidymal fat) during clamp
studies. F) Glucose uptake into skeletal muscle (gas-
trocnemius muscle) during clamp studies. Data are
given as means 6 SEM (M3R+/+, n = 7; M3R2/2,
n = 8; 3-month-old males). *p < 0.05; **p < 0.01.
liver, fat, and skeletal muscle, tissues which play key roles in glu-cose and energy homeostasis. Specifically, we incubated cellmembranes prepared from liver, white adipose tissue (WAT),brown adipose tissue (BAT), and gastrocnemius and tricepsmuscles from wild-type mice with a saturating concentration(3 nM) of the muscarinic radioligand, [3H]quinuclidinyl benzilate([3H]QNB; this ligand labels M3 as well as all other muscarinic re-ceptor subtypes). However, no specific [3H]QNB binding wasdetectable in liver, WAT, BAT, and skeletal muscle tissues (de-tection limit of the binding assay used: w1–2 fmoles recep-tors/mg protein). Under the same experimental conditions, thenumber of specific [3H]QNB binding sites present in brain mem-branes (M3R+/+ mice) amounted to 1074 6 82 fmol/mg (n = 3).
Real-time quantitative RT-PCR studies confirmed that M3
receptor mRNA was abundantly expressed in the brains ofwild-type mice (Figure S3). In contrast, only very low levels ofM3 receptor transcripts were found in liver, WAT, and skeletalmuscle, and no M3 receptor mRNA was detectable in BAT (Fig-ure S3). Since M3 receptors are present on peripheral vascularepithelia (Lamping et al., 2004) and peripheral nerve endings(Garcia et al., 2005), it remains unclear which specific cell typesare responsible for the small number of M3 receptor transcriptsdetectable in mouse liver, WAT, and skeletal muscle.
M3R2/2 mice display increased insulin sensitivityin liver, skeletal muscle, and fatIn insulin tolerance tests, M3R2/2 mice showed an increase ininsulin sensitivity (Figures 1G, 2G, and 3G). To examine the insu-lin sensitivity of individual tissues, we carried out euglycemic-hyperinsulinemic clamp studies using M3R+/+ and M3R2/2
mice maintained on standard chow (3-month-old males). Theglucose infusion rate was adjusted in order to maintain bloodglucose levels in M3R+/+ and M3R2/2 mice at similar levels(w150 mg/dl). Insulin was infused at the rate of 2.5 mU/kg/minto maintain insulin levels within a physiological range (M3R+/+,1.73 6 0.10 ng/ml, n = 7; M3R2/2, 1.13 6 0.10 ng/ml, n = 8).
CELL METABOLISM : NOVEMBER 2006
Although M3R2/2 mice showed significantly lower insulin levelsduring the clamp (p < 0.01), the glucose infusion rate was nearly2-fold higher in M3R2/2 mice than in control littermates (Fig-ure 4A), confirming that M3 receptor ablation leads to increasedinsulin sensitivity. The higher glucose infusion rate displayed bythe M3R2/2 mice correlated with reduced endogenous glucoseproduction (Figure 4B), suggesting that M3R2/2 mice had in-creased insulin sensitivity in the liver. Although whole-body glu-cose uptake rate was comparable in both groups of mice underthe experimental conditions used (Figure 4C), M3R2/2 miceshowed a significantly elevated rate of whole-body glycogensynthesis (Figure 4D) and tended to have a lower rate of glycol-ysis (data not shown). Furthermore, glucose uptake in WAT (ep-didymal fat; Figure 4E) and skeletal muscle (gastrocnemiusmuscle; Figure 4F) was increased by w250% and w75%, re-spectively. Glucose uptake was also increased in BAT ofM3R2/2 mice (M3R+/+, 1550 6 261 mmol/kg/min, n = 7; M3R2/2,2095 6 221 mmol/kg/min, n = 8); however, this difference failedto reach statistical significance (p = 0.066). These data clearly in-dicate that the lack of M3 receptors leads to increased insulinsensitivity in the three major insulin target tissues (liver, skeletalmuscle, and fat).
Histological studiesAs shown in Figure S4, adipocyte size (BAT and WAT) wasgreatly decreased in M3R2/2 mice, as compared to M3R+/+ lit-termates. Moreover, fat deposits in the liver were much smallerin M3R2/2 than in M3R+/+ mice (animals had free access to reg-ular chow; Figure S4). All other organs and tissues appearedhistologically normal.
Increased expression of UCP3 in skeletal muscle ofM3R2/2 miceThe uncoupling proteins UCP1, UCP2, and UCP3 are mitochon-drial inner membrane proteins that uncouple the proton gradientfrom ATP synthesis (Boss et al., 2000; Argyropoulos and Harper,
369
A R T I C L E
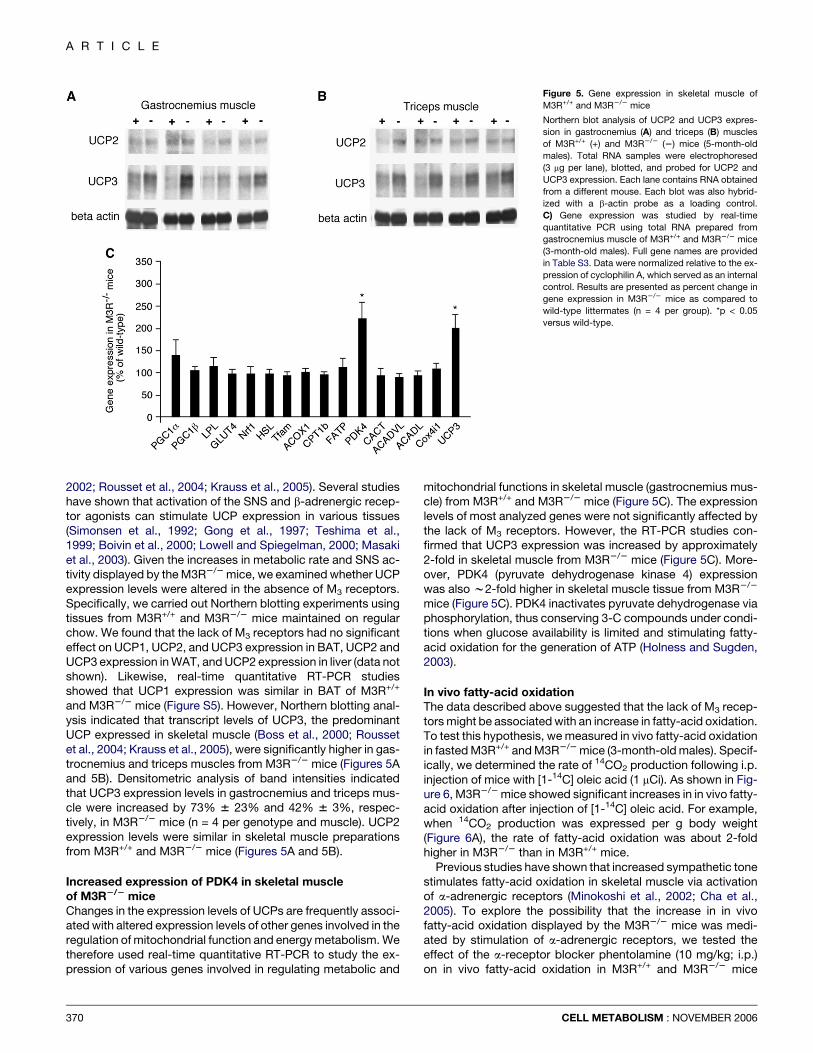
Figure 5. Gene expression in skeletal muscle of
M3R+/+ and M3R2/2 mice
Northern blot analysis of UCP2 and UCP3 expres-
sion in gastrocnemius (A) and triceps (B) muscles
of M3R+/+ (+) and M3R2/2 (2) mice (5-month-old
males). Total RNA samples were electrophoresed
(3 mg per lane), blotted, and probed for UCP2 and
UCP3 expression. Each lane contains RNA obtained
from a different mouse. Each blot was also hybrid-
ized with a b-actin probe as a loading control.
C) Gene expression was studied by real-time
quantitative PCR using total RNA prepared from
gastrocnemius muscle of M3R+/+ and M3R2/2 mice
(3-month-old males). Full gene names are provided
in Table S3. Data were normalized relative to the ex-
pression of cyclophilin A, which served as an internal
control. Results are presented as percent change in
gene expression in M3R2/2 mice as compared to
wild-type littermates (n = 4 per group). *p < 0.05
versus wild-type.
2002; Rousset et al., 2004; Krauss et al., 2005). Several studieshave shown that activation of the SNS and b-adrenergic recep-tor agonists can stimulate UCP expression in various tissues(Simonsen et al., 1992; Gong et al., 1997; Teshima et al.,1999; Boivin et al., 2000; Lowell and Spiegelman, 2000; Masakiet al., 2003). Given the increases in metabolic rate and SNS ac-tivity displayed by the M3R2/2 mice, we examined whether UCPexpression levels were altered in the absence of M3 receptors.Specifically, we carried out Northern blotting experiments usingtissues from M3R+/+ and M3R2/2 mice maintained on regularchow. We found that the lack of M3 receptors had no significanteffect on UCP1, UCP2, and UCP3 expression in BAT, UCP2 andUCP3 expression in WAT, and UCP2 expression in liver (data notshown). Likewise, real-time quantitative RT-PCR studiesshowed that UCP1 expression was similar in BAT of M3R+/+
and M3R2/2 mice (Figure S5). However, Northern blotting anal-ysis indicated that transcript levels of UCP3, the predominantUCP expressed in skeletal muscle (Boss et al., 2000; Roussetet al., 2004; Krauss et al., 2005), were significantly higher in gas-trocnemius and triceps muscles from M3R2/2 mice (Figures 5Aand 5B). Densitometric analysis of band intensities indicatedthat UCP3 expression levels in gastrocnemius and triceps mus-cle were increased by 73% 6 23% and 42% 6 3%, respec-tively, in M3R2/2 mice (n = 4 per genotype and muscle). UCP2expression levels were similar in skeletal muscle preparationsfrom M3R+/+ and M3R2/2 mice (Figures 5A and 5B).
Increased expression of PDK4 in skeletal muscleof M3R2/2 miceChanges in the expression levels of UCPs are frequently associ-ated with altered expression levels of other genes involved in theregulation of mitochondrial function and energy metabolism. Wetherefore used real-time quantitative RT-PCR to study the ex-pression of various genes involved in regulating metabolic and
370
mitochondrial functions in skeletal muscle (gastrocnemius mus-cle) from M3R+/+ and M3R2/2 mice (Figure 5C). The expressionlevels of most analyzed genes were not significantly affected bythe lack of M3 receptors. However, the RT-PCR studies con-firmed that UCP3 expression was increased by approximately2-fold in skeletal muscle from M3R2/2 mice (Figure 5C). More-over, PDK4 (pyruvate dehydrogenase kinase 4) expressionwas also w2-fold higher in skeletal muscle tissue from M3R2/2
mice (Figure 5C). PDK4 inactivates pyruvate dehydrogenase viaphosphorylation, thus conserving 3-C compounds under condi-tions when glucose availability is limited and stimulating fatty-acid oxidation for the generation of ATP (Holness and Sugden,2003).
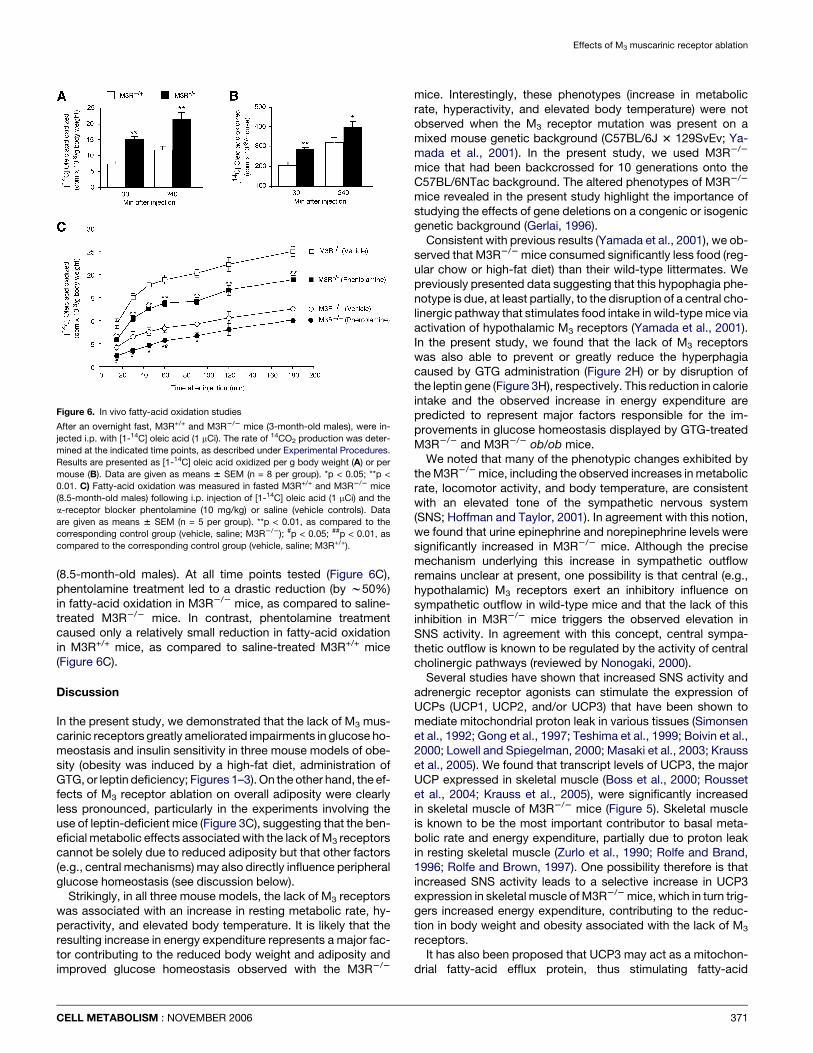
In vivo fatty-acid oxidationThe data described above suggested that the lack of M3 recep-tors might be associated with an increase in fatty-acid oxidation.To test this hypothesis, we measured in vivo fatty-acid oxidationin fasted M3R+/+ and M3R2/2 mice (3-month-old males). Specif-ically, we determined the rate of 14CO2 production following i.p.injection of mice with [1-14C] oleic acid (1 mCi). As shown in Fig-ure 6, M3R2/2 mice showed significant increases in in vivo fatty-acid oxidation after injection of [1-14C] oleic acid. For example,when 14CO2 production was expressed per g body weight(Figure 6A), the rate of fatty-acid oxidation was about 2-foldhigher in M3R2/2 than in M3R+/+ mice.
Previous studies have shown that increased sympathetic tonestimulates fatty-acid oxidation in skeletal muscle via activationof a-adrenergic receptors (Minokoshi et al., 2002; Cha et al.,2005). To explore the possibility that the increase in in vivofatty-acid oxidation displayed by the M3R2/2 mice was medi-ated by stimulation of a-adrenergic receptors, we tested theeffect of the a-receptor blocker phentolamine (10 mg/kg; i.p.)on in vivo fatty-acid oxidation in M3R+/+ and M3R2/2 mice
CELL METABOLISM : NOVEMBER 2006
Effects of M3 muscarinic receptor ablation
(8.5-month-old males). At all time points tested (Figure 6C),phentolamine treatment led to a drastic reduction (by w50%)in fatty-acid oxidation in M3R2/2 mice, as compared to saline-treated M3R2/2 mice. In contrast, phentolamine treatmentcaused only a relatively small reduction in fatty-acid oxidationin M3R+/+ mice, as compared to saline-treated M3R+/+ mice(Figure 6C).
Discussion
In the present study, we demonstrated that the lack of M3 mus-carinic receptors greatly ameliorated impairments in glucose ho-meostasis and insulin sensitivity in three mouse models of obe-sity (obesity was induced by a high-fat diet, administration ofGTG, or leptin deficiency; Figures 1–3). On the other hand, the ef-fects of M3 receptor ablation on overall adiposity were clearlyless pronounced, particularly in the experiments involving theuse of leptin-deficient mice (Figure 3C), suggesting that the ben-eficial metabolic effects associated with the lack of M3 receptorscannot be solely due to reduced adiposity but that other factors(e.g., central mechanisms) may also directly influence peripheralglucose homeostasis (see discussion below).
Strikingly, in all three mouse models, the lack of M3 receptorswas associated with an increase in resting metabolic rate, hy-peractivity, and elevated body temperature. It is likely that theresulting increase in energy expenditure represents a major fac-tor contributing to the reduced body weight and adiposity andimproved glucose homeostasis observed with the M3R2/2
Figure 6. In vivo fatty-acid oxidation studies
After an overnight fast, M3R+/+ and M3R2/2 mice (3-month-old males), were in-
jected i.p. with [1-14C] oleic acid (1 mCi). The rate of 14CO2 production was deter-
mined at the indicated time points, as described under Experimental Procedures.
Results are presented as [1-14C] oleic acid oxidized per g body weight (A) or per
mouse (B). Data are given as means 6 SEM (n = 8 per group). *p < 0.05; **p <
0.01. C) Fatty-acid oxidation was measured in fasted M3R+/+ and M3R2/2 mice
(8.5-month-old males) following i.p. injection of [1-14C] oleic acid (1 mCi) and the
a-receptor blocker phentolamine (10 mg/kg) or saline (vehicle controls). Data
are given as means 6 SEM (n = 5 per group). **p < 0.01, as compared to the
corresponding control group (vehicle, saline; M3R2/2); #p < 0.05; ##p < 0.01, as
compared to the corresponding control group (vehicle, saline; M3R+/+).
CELL METABOLISM : NOVEMBER 2006
mice. Interestingly, these phenotypes (increase in metabolicrate, hyperactivity, and elevated body temperature) were notobserved when the M3 receptor mutation was present on amixed mouse genetic background (C57BL/6J 3 129SvEv; Ya-mada et al., 2001). In the present study, we used M3R2/2
mice that had been backcrossed for 10 generations onto theC57BL/6NTac background. The altered phenotypes of M3R2/2
mice revealed in the present study highlight the importance ofstudying the effects of gene deletions on a congenic or isogenicgenetic background (Gerlai, 1996).
Consistent with previous results (Yamada et al., 2001), we ob-served that M3R2/2 mice consumed significantly less food (reg-ular chow or high-fat diet) than their wild-type littermates. Wepreviously presented data suggesting that this hypophagia phe-notype is due, at least partially, to the disruption of a central cho-linergic pathway that stimulates food intake in wild-type mice viaactivation of hypothalamic M3 receptors (Yamada et al., 2001).In the present study, we found that the lack of M3 receptorswas also able to prevent or greatly reduce the hyperphagiacaused by GTG administration (Figure 2H) or by disruption ofthe leptin gene (Figure 3H), respectively. This reduction in calorieintake and the observed increase in energy expenditure arepredicted to represent major factors responsible for the im-provements in glucose homeostasis displayed by GTG-treatedM3R2/2 and M3R2/2 ob/ob mice.
We noted that many of the phenotypic changes exhibited bythe M3R2/2 mice, including the observed increases in metabolicrate, locomotor activity, and body temperature, are consistentwith an elevated tone of the sympathetic nervous system(SNS; Hoffman and Taylor, 2001). In agreement with this notion,we found that urine epinephrine and norepinephrine levels weresignificantly increased in M3R2/2 mice. Although the precisemechanism underlying this increase in sympathetic outflowremains unclear at present, one possibility is that central (e.g.,hypothalamic) M3 receptors exert an inhibitory influence onsympathetic outflow in wild-type mice and that the lack of thisinhibition in M3R2/2 mice triggers the observed elevation inSNS activity. In agreement with this concept, central sympa-thetic outflow is known to be regulated by the activity of centralcholinergic pathways (reviewed by Nonogaki, 2000).
Several studies have shown that increased SNS activity andadrenergic receptor agonists can stimulate the expression ofUCPs (UCP1, UCP2, and/or UCP3) that have been shown tomediate mitochondrial proton leak in various tissues (Simonsenet al., 1992; Gong et al., 1997; Teshima et al., 1999; Boivin et al.,2000; Lowell and Spiegelman, 2000; Masaki et al., 2003; Krausset al., 2005). We found that transcript levels of UCP3, the majorUCP expressed in skeletal muscle (Boss et al., 2000; Roussetet al., 2004; Krauss et al., 2005), were significantly increasedin skeletal muscle of M3R2/2 mice (Figure 5). Skeletal muscleis known to be the most important contributor to basal meta-bolic rate and energy expenditure, partially due to proton leakin resting skeletal muscle (Zurlo et al., 1990; Rolfe and Brand,1996; Rolfe and Brown, 1997). One possibility therefore is thatincreased SNS activity leads to a selective increase in UCP3expression in skeletal muscle of M3R2/2 mice, which in turn trig-gers increased energy expenditure, contributing to the reduc-tion in body weight and obesity associated with the lack of M3
receptors.It has also been proposed that UCP3 may act as a mitochon-
drial fatty-acid efflux protein, thus stimulating fatty-acid
371
A R T I C L E
oxidation (Himms-Hagen and Harper, 2001; Argyropoulos andHarper, 2002). In agreement with this notion, we found thatM3R2/2 mice displayed a pronounced increase in the rate offatty-acid oxidation in vivo (Figure 6). This elevated fatty-acidoxidation rate could be greatly reduced by treatment of M3R2/2
mice with the a-receptor blocker phentolamine (Figure 6C), indi-cating that increased sympathetic tone makes a major contribu-tion to this phenotype. Consistent with our findings, previousstudies have shown that increased sympathetic tone stimulatesfatty-acid oxidation in skeletal muscle via activation of a-adren-ergic receptors (Minokoshi et al., 2002; Cha et al., 2005).
It should be noted, however, that UCP3 mRNA levels are usu-ally elevated in states associated with increased fat metabolism(Boss et al., 2000; Argyropoulos and Harper, 2002; Krauss et al.,2005). We therefore cannot exclude the possibility that theobserved increase in UCP3 expression in skeletal muscle ofM3R2/2 mice is secondary to the enhanced fatty-acid oxidationrate displayed by these mutant mice.
Quantitative RT-PCR studies showed that the expression ofPDK4 was also upregulated in skeletal muscle from M3R2/2
mice (Figure 5C). PDK4 inactivates pyruvate dehydrogenasevia phosphorylation, thus conserving 3-C compounds underconditions when glucose availability is limited and stimulatingfatty-acid oxidation for the generation of ATP (Holness and Sug-den, 2003). Because of the large contribution of skeletal muscleto whole-body glucose disposal, suppression of pyruvate dehy-drogenase by PDK4 in skeletal muscle is likely to be of particularrelevance for glucose homeostasis (Holness and Sugden, 2003).Our data are therefore consistent with the concept that the lackof M3 receptors leads to a relative shortage of glucose, resultingin increased expression of PDK4 in skeletal muscle, reduced ox-idative breakdown of glucose, and increased mitochondrialfatty-acid oxidation to ensure proper ATP production.
As discussed above, several lines of evidence suggest that thelack of M3 receptors leads to increased central sympathetic out-flow. Increased activity of the SNS usually leads to increasedexpression of UCP1 in BAT (Lowell and Spiegelman, 2000). Al-though adipocyte size was greatly decreased in BAT of M3R2/2
mice (compared to M3R+/+ littermates; Figure S4), Northern blot-ting studies (data not shown) and real-time quantitative RT-PCRanalysis (Figure S5) showed that UCP1 expression was similar inBAT of M3R+/+ and M3R2/2 mice. At present, we do not havea clear explanation for the observation that UCP1 expressionremains unchanged in BAT of M3R2/2 mice despite increasedSNS activity. One possibility is that other as yet unknown factorsor pathways that are affected by the lack of M3 receptors coun-teract the increase in UCP1 expression in BAT that is usuallyassociated with increased sympathetic outflow.
Under all experimental conditions used in the present study,the absence of M3 receptors was associated with a striking in-crease in insulin sensitivity. Euglycemic-hyperinsulinemic clampstudies demonstrated that deletion of the M3 receptor gene ledto a pronounced stimulation of glucose uptake in skeletal mus-cle and WAT (Figure 4). Radioligand binding studies indicatedthat skeletal muscle and WAT preparations from wild-typemice did not express detectable levels of M3 or other muscarinicreceptors, excluding the possibility that the increase in insulinsensitivity displayed by the M3R2/2 mice is due to the lack ofM3 receptors in these tissues. Since M3R2/2 ob/ob mutantmice showed only a rather small reduction in adiposity (as com-pared to ob/ob mice) but displayed greatly improved glucose
372
tolerance and insulin sensitivity (Figure 3), it is likely that factorsunrelated to overall adiposity, probably involving central cholin-ergic pathways, also contribute to the beneficial metaboliceffects associated with the absence of M3 receptors.
Whereas our data strongly suggest that activation of M3 mus-carinic acetylcholine receptors promotes adiposity (at least inthe case of diet-induced obesity), administration of the classicnicotinic acetylcholine receptor agonist, nicotine, inhibits foodintake, increases metabolic rate, and leads to reduced adiposity(Li et al., 2003). There are several other examples where stimu-lation of muscarinic and nicotinic acetylcholine receptors resultsin opposing physiological or behavioral responses. For instance,while nicotine exerts antidepressant-like effects and usuallyleads to locomotor stimulation (Picciotto et al., 2000), adminis-tration of centrally active muscarinic agonists causes depresso-genic effects and reduced locomotor activity (Bymaster andFelder, 2002; Wess, 2004). It is likely that the existence of multi-ple nicotinic and muscarinic receptor subtypes and the differentanatomical distributions of these receptor subtypes are majorfactors responsible for these opposing effects. It should alsobe noted that nicotine administration (smoking) promotes glu-cose intolerance, insulin resistance, and type 2 diabetes, involv-ing various sites and mechanisms of action (Kapoor and Jones,2005).
In conclusion, the lack of M3 receptors has pronouncedeffects on energy and glucose homeostasis in mice. M3R2/2
mice are largely protected against the detrimental metabolicdeficits triggered by a high-fat diet, chemical disruption of ven-tromedial hypothalamic neurons by GTG, and genetic disruptionof the leptin gene. The M3 receptor may therefore represent a po-tential pharmacologic target for the treatment of obesity andassociated metabolic disorders. However, since peripheral M3
receptors are known to play a key role in mediating acetylcho-line-induced glandular secretion and smooth muscle contrac-tions (Eglen et al., 1996; Caulfield and Birdsall, 1998; Wess,2004), the potential therapeutic use of M3 receptor antagonistsmay cause significant peripheral side effects. It is possible thatsuch side effects can be minimized by administration of antag-onist doses that do not block M3 receptor function completely orby the use of lipophilic M3 receptor antagonists that accumulatein the brain.
Experimental procedures
Animals
The generation of M3R2/2 mice has been described previously (Yamada
et al., 2001). M3R2/2 mice were backcrossed for 10 generations onto the
C57BL/6NTac background (Taconic Farms, Germantown, New York). All
mice used in the present study were male littermates resulting from hetero-
zygous matings. To generate ob/ob mice lacking the M3 receptor gene,
M3R2/2 males were first bred to ob/+ females (C57BL/6J background; The
Jackson Laboratory, Bar Harbor, Maine) to obtain compound heterozygotes
(M3R+/2 ob/+). These compound heterozygotes were then interbred to gen-
erate M3R2/2 ob/ob, ob/ob, M3R2/2, and M3R+/+ mice (wild-type litter-
mates). Genotypes were confirmed by PCR amplification of genomic DNA
(primer sequences are available upon request).
All animal studies were approved by the Animal Care and Use Committee
of the National Institute of Diabetes and Digestive and Kidney Diseases, Na-
tional Institutes of Health, Bethesda, Maryland.
Mouse maintenance and food intake studies
Mice were housed four to five per cage in a specific pathogen-free barrier
facility, maintained on a 12 hr light/dark cycle. Unless indicated otherwise,
CELL METABOLISM : NOVEMBER 2006
Effects of M3 muscarinic receptor ablation
all experiments were carried out with male littermates that were 3–6 months
old at the time of testing.
Mice were fed ad libitum with a standard mouse chow (5% [w/w] fat con-
tent; 4.08 kcal/g; Zeigler, Gardners, Pennsylvania). For diet-induced obesity
studies, 4-week-old male mice were put on a high-fat diet (35.5% [w/w] fat
content; 5.45 kcal/g; # F3282, Bioserv, Frenchtown, New Jersey) for 16
weeks. Obesity was also induced chemically by injecting 4-week-old male
mice with a single dose of GTG (0.5 mg/g, i.p.).
For food intake studies, mice were individually housed and fed ad libitum.
The food intake data shown in Figure 1H were obtained by using special tun-
nel-type feeders (Rodent Cafe Type-M; OYC International, Inc.). Food was
weighed daily for 6 days.
Glucose and insulin tolerance tests
For glucose and insulin tolerance tests, mice that had been subjected to an
overnight (10–12 hr) fast were given i.p. glucose (2 mg/g body weight) or in-
sulin (Humulin, 0.75 mIU/g; Eli Lilly), respectively. Tail blood was collected
before (time 0) and at indicated times after injection of glucose or insulin
for the measurement of glucose (Glucometer Elite; Bayer).
Biochemical assays
Serum insulin and plasma leptin concentrations were determined via ELISA
(Crystal Chem Inc.). Serum T3 and T4 levels were measured via RIA (Diag-
nostic Products). Serum-free fatty acids were determined via colorimetry
using a kit purchased from Roche Diagnostics Corp.
Body composition, metabolic rate, locomotor activity, and body
temperature measurements
Body composition was measured using the NMR analyzer Bruker Minispec
mq10 (Bruker Optics Inc.). O2 consumption, CO2 release rates, and locomo-
tor activity levels were determined at room temperature using the Oxymax
system (Columbus Instruments, Ohio), as described previously (Yu et al.,
2000). Body temperature measurements were taken between 1 and 3 pm
or at midnight using a rectal thermometer (model TH-5; Braintree Scientific,
Massachusetts).
Fat absorption studies and charcoal transit test
The high-fat diet used for fat absorption studies was composed as follows
(percentage weight): 35.5% fat (safflower oil), 50% nonfat dry milk, and
14.5% sucrose, providing 55:31:14 fat:protein:carbohydrate energy percent-
age. The fat component contained 5% weight sucrose polybehenate (oles-
tra), which is not hydrolyzed by pancreatic lipase and not absorbed from
the intestine. Fecal samples were collected from mice that had been fed
the high-fat diet for 3 days. Percent fat absorption was determined by com-
paring the known ratio of fat (triacylglycerol) to marker in the diet and the
measured ratio of fat (all forms of fatty acids: fatty acids, monoacylglycerols,
diacyglycerols, and triacylglycerols) to marker in the feces, as described in
detail by Jandacek et al. (2004). A charcoal transit test was used to measure
gastrointestinal motor function in vivo, as described in detail previously
(Yamada et al., 2001).
Determination of urine catecholamines
Urine samples were collected over a 24 hr period using mice housed in met-
abolic cages (2 mice per cage). Urine epinephrine and norepinephrine were
quantified by HPLC (Eisenhofer et al., 1986; measured by Ani Lytics Inc.).
Radioligand binding studies
Membranes prepared from different mouse tissues (liver, BAT, WAT, and
gastrocnemius and triceps muscles) were incubated with a saturating
concentration (3 nM) of the non-subtype-selective muscarinic antagonist,
[3H]QNB (42 Ci/mmol; PerkinElmer), essentially as described (Dorje et al.,
1991). Binding reactions were carried out for 1 hr at room temperature
(22�C). Nonspecific binding was determined in the presence of 10 mM
atropine.
Hyperinsulinemic-euglycemic clamp studies
Hyperinsulinemic-euglycemic clamp studies and in vivo glucose flux analysis
were carried out as previously described (Pennisi et al., 2006).
CELL METABOLISM : NOVEMBER 2006
In vivo fatty-acid oxidation
Fatty-acid ([1-14C] oleic acid) oxidation was measured in vivo using a method
similar to that described by Cha et al. (2005). Mice were fasted overnight, in-
jected with [1-14C] oleic acid (Perkin Elmer NEC317, 1 mCi in 200 ml of saline
i.p.), and placed into a sealed chamber connected to an air pump (Thomas
Scientific # 7893B05) and a 50 ml tube containing 3 M NaOH solution to
trap expired 14CO2. One milliliter aliquots were taken 30 and 240 min after
injection of [1-14C] oleic acid to calculate the oxidation of [1-14C] oleic acid
to 14CO2.
Northern analysis
Total RNA was prepared from different tissues of M3R+/+ and M3R2/2 mice
using the RNeasy fibrous tissue kit (Qiagen, Valencia, California) according to
the manufacturer’s instructions. Three micrograms of total RNA was ana-
lyzed by Northern blotting according to standard techniques using 32P-
labeled probes. The UCP1 and UCP3 probes were identical to the ones
used by Gong et al. (1997). The UCP2 probe used in the present study has
been described by McPherron and Lee (2002). Band intensities were mea-
sured via densitometry using ImageJ (NIH) and were normalized relative to
b-actin expression.
Real-time quantitative RT-PCR
Total RNA was isolated from mouse skeletal muscle (gastrocnemius muscle)
using the RNeasy fibrous tissue kit (Qiagen) and treated with DNase I for 15
min at room temperature. RNA integrity was confirmed by using the Agilent
2100 Bioanalyzer (Agilent Technologies). Reverse transcription was per-
formed using MultiScribe RT (Applied Biosystems), and gene expression
levels were measured by real-time quantitative RT-PCR (7900HT SDS; Ap-
plied Biosystems). PCR reactions (25 ml total volume) included cDNA (w10
ng of initial RNA sample), 100–120 nM of each primer, and 12.5 ml of 23
SYBR Green Master Mix (Applied Biosystems). The PCR cycling conditions
were as follows: 50�C for 2 min, 95�C for 10 min, and 40 cycles at 95�C for
15 s, and 60�C for 1 min, respectively. The specificity of each RT-PCR prod-
uct was checked via gel electrophoresis. The expression of cyclophilin A
served as an internal control. Four independent samples prepared from
four different mice were used per genotype. PCR reactions were carried
out in triplicate. The results were expressed as percent change in gene ex-
pression relative to cyclophilin A expression between M3R+/+ and M3R2/2
mice. Primer sequences are provided in Table S3.
Morphological studies
Mouse tissues were fixed in 10% neutral buffered formalin, processed into
paraffin blocks, sectioned at 6 microns, and stained with hematoxylin and
eosin. Stained sections were examined by light microscopy (Olympus
BX41). Photographs were taken with an Olympus DP12 digital camera, using
the 203 oil immersion lens.
Statistics
Data are expressed as means 6 SEM for the indicated number of observa-
tions. Statistical significance between groups was determined using two-
tailed Student’s t test or one-way analysis of variance followed by appropriate
post-hoc tests.
Supplemental data
Supplemental data include three tables and five figures and can be found
with the article online at http://www.cellmetabolism.org/cgi/content/4/5/
363/DC1/.
Acknowledgments
This work was supported by the Intramural Research Program, NIDDK, NIH,
US Department of Health and Human Services. We thank Dr. Ronald J. Jan-
dacek from the University of Cincinnati (Ohio) for carrying out the fat absorp-
tion studies, Dr. Se-Jin Lee for kindly providing the UCP2 probe, Dr. Lee
Weinstein for providing the sequences of several RT-PCR primers, Dr. Geor-
gina Miller for help with the histological analysis of mouse tissues, and
Drs. Kevin Hall and Juen Guo for advice and helpful discussions.
373
A R T I C L E
Received: April 20, 2006
Revised: September 6, 2006Accepted: September 26, 2006
Published: November 7, 2006
References
Ahren, B. (2000). Autonomic regulation of islet hormone secretion–implica-tions for health and disease. Diabetologia 43, 393–410.
Argyropoulos, G., and Harper, M.E. (2002). Uncoupling proteins and thermo-regulation. J. Appl. Physiol. 92, 2187–2198.
Bergen, H.T., Mizuno, T.M., Taylor, J., and Mobbs, C.V. (1998). Hyperphagiaand weight gain after gold-thioglucose: relation to hypothalamic neuropep-tide Y and proopiomelanocortin. Endocrinology 139, 4483–4488.
Boivin, M., Camirand, A., Carli, F., Hoffer, L.J., and Silva, J.E. (2000). Uncou-pling protein-2 and -3 messenger ribonucleic acids in adipose tissue andskeletal muscle of healthy males: variability, factors affecting expression,and relation to measures of metabolic rate. J. Clin. Endocrinol. Metab. 85,1975–1983.
Boss, O., Hagen, T., and Lowell, B.B. (2000). Uncoupling proteins 2 and3: potential regulators of mitochondrial energy metabolism. Diabetes 49,143–156.
Bray, G.A., and York, D.A. (1979). Hypothalamic and genetic obesity in ex-perimental animals: an autonomic and endocrine hypothesis. Physiol. Rev.59, 719–809.
Bymaster, F.P., and Felder, C.C. (2002). Role of the cholinergic muscarinicsystem in bipolar disorder and related mechanism of action of antipsychoticagents. Mol. Psychiatry 7 (Suppl. 1), S57–S63.
Caulfield, M.P., and Birdsall, N.J.M. (1998). International Union of Pharma-cology. XVII. Classification of muscarinic acetylcholine receptors. Pharma-col. Rev. 50, 279–290.
Cha, S.H., Hu, Z., Chohnan, S., and Lane, M.D. (2005). Inhibition of hypotha-lamic fatty acid synthase triggers rapid activation of fatty acid oxidation inskeletal muscle. Proc. Natl. Acad. Sci. USA 102, 14557–14562.
Dorje, F., Wess, J., Lambrecht, G., Tacke, R., Mutschler, E., and Brann, M.R.(1991). Antagonist binding profiles of five cloned human muscarinic receptorsubtypes. J. Pharmacol. Exp. Ther. 256, 727–733.
Duttaroy, A., Zimliki, C.L., Gautam, D., Cui, Y., Mears, D., and Wess, J.(2004). Muscarinic stimulation of pancreatic insulin and glucagon release isabolished in M3 muscarinic acetylcholine receptor-deficient mice. Diabetes53, 1714–1720.
Eglen, R.M., Hegde, S.S., and Watson, N. (1996). Muscarinic receptor sub-types and smooth muscle function. Pharmacol. Rev. 48, 531–565.
Eisenhofer, G., Goldstein, D.S., Stull, R., Keiser, H.R., Sunderland, T., Mur-phy, D.L., and Kopin, I.J. (1986). Simultaneous liquidchromatographic deter-mination of 3,4-dihydroxyphenylglycol, catecholamines, and 3,4-dihydroxy-phenylalanine in plasma, and their responses to inhibition of monoamineoxidase. Clin. Chem. 32, 2030–2033.
Garcia, N., Santafe, M.M., Salon, I., Lanuza, M.A., and Tomas, J. (2005). Ex-pression of muscarinic acetylcholine receptors (M1-, M2-, M3- and M4-type)in the neuromuscular junction of the newborn and adult rat. Histol. Histopa-thol. 20, 733–743.
Gerlai, R. (1996). Gene-targeting studies of mammalian behavior: is it themutation or the background genotype? Trends Neurosci. 19, 177–181.
Gilon, P., and Henquin, J.C. (2001). Mechanisms and physiological signifi-cance of the cholinergic control of pancreatic b-cell function. Endocr. Rev.22, 565–604.
Gong, D.W., He, Y., Karas, M., and Reitman, M. (1997). Uncoupling protein-3is a mediator of thermogenesis regulated by thyroid hormone, b3-adrenergicagonists, and leptin. J. Biol. Chem. 272, 24129–24132.
374
Himms-Hagen, J., and Harper, M.E. (2001). Physiological role of UCP3 maybe export of fatty acids from mitochondria when fatty acid oxidation predom-inates: an hypothesis. Exp. Biol. Med. (Maywood) 226, 78–84.
Hoffman, B.B., and Taylor, P. (2001). The autonomic and somatic motornervous systems. In Goodman & Gilman’s: The Pharmacological Basis ofTherapeutics 10th edition, J.G. Hardman, L.E. Limbird, and A.G. Gilman,eds. (New York: McGraw-Hill), pp. 115–153.
Holness, M.J., and Sugden, M.C. (2003). Regulation of pyruvate dehydroge-nase complex activity by reversible phosphorylation. Biochem. Soc. Trans.31, 1143–1151.
Jandacek, R.J., Heubi, J.E., and Tso, P. (2004). A novel, noninvasive methodfor the measurement of intestinal fat absorption. Gastroenterology 127, 139–144.
Kapoor, D., and Jones, T.H. (2005). Smoking and hormones in health and en-docrine disorders. Eur. J. Endocrinol. 152, 491–499.
Krauss, S., Zhang, C.Y., and Lowell, B.B. (2005). The mitochondrial uncou-pling-protein homologues. Nat. Rev. Mol. Cell Biol. 6, 248–261.
Lam, T.K., Pocai, A., Gutierrez-Juarez, R., Obici, S., Bryan, J., Aguilar-Bryan,L., Schwartz, G.J., and Rossetti, L. (2005). Hypothalamic sensing of circulat-ing fatty acids is required for glucose homeostasis. Nat. Med. 11, 320–327.
Lamping, K.G., Wess, J., Cui, Y., Nuno, D.W., and Faraci, F.M. (2004). Mus-carinic (M) receptors in coronary circulation: gene-targeted mice define therole of M2 and M3 receptors in response to acetylcholine. Arterioscler.Thromb. Vasc. Biol. 24, 1253–1258.
Levey, A.I., Edmunds, S.M., Heilman, C.J., Desmond, T.J., and Frey, K.A.(1994). Localization of muscarinic m3 receptor protein and M3 receptor bind-ing in rat brain. Neuroscience 63, 207–221.
Li, M.D., Kane, J.K., and Konu, O. (2003). Nicotine, body weight and potentialimplications in the treatment of obesity. Curr. Top. Med. Chem. 3, 899–919.
Lowell, B.B., and Spiegelman, B.M. (2000). Towards a molecular under-standing of adaptive thermogenesis. Nature 404, 652–660.
Masaki, T., Chiba, S., Yasuda, T., Tsubone, T., Kakuma, T., Shimomura, I.,Funahashi, T., Matsuzawa, Y., and Yoshimatsu, H. (2003). Peripheral, butnot central, administration of adiponectin reduces visceral adiposity and up-regulates the expression of uncoupling protein in agouti yellow (Ay/a) obesemice. Diabetes 52, 2266–2273.
McPherron, A.C., and Lee, S.J. (2002). Suppression of body fat accumulationin myostatin-deficient mice. J. Clin. Invest. 109, 595–601.
Minokoshi, Y., Kim, Y.B., Peroni, O.D., Fryer, L.G., Muller, C., Carling, D., andKahn, B.B. (2002). Leptin stimulates fatty-acid oxidation by activating AMP-activated protein kinase. Nature 415, 339–343.
Niijima, A. (1989). Neural mechanisms in the control of blood glucose con-centration. J. Nutr. 119, 833–840.
Nonogaki, K. (2000). New insights into sympathetic regulation of glucose andfat metabolism. Diabetologia 43, 533–549.
Pennisi, P., Gavrilova, O., Setser-Portas, J., Jou, W., Santopietro, S., Clem-mons, D., Yakar, S., and Leroith, D. (2006). Recombinant human insulin-likegrowth factor-I (rhigf-1) treatment inhibits gluconeogenesis in a transgenicmouse model of type 2 Diabetes Mellitus (DM). Endocrinology 147, 2619–2630.
Picciotto, M.R., Caldarone, B.J., King, S.L., and Zachariou, V. (2000). Nico-tinic receptors in the brain. Links between molecular biology and behavior.Neuropsychopharmacology 22, 451–465.
Rohl, M., Pasparakis, M., Baudler, S., Baumgartl, J., Gautam, D., Huth, M.,De Lorenzi, R., Krone, W., Rajewsky, K., and Bruning, J.C. (2004). Conditionaldisruption of IkB kinase 2 fails to prevent obesity-induced insulin resistance.J. Clin. Invest. 113, 474–481.
Rohner-Jeanrenaud, F. (1995). A neuroendocrine reappraisal of the dual-centre hypothesis: its implications for obesity and insulin resistance. Int. J.Obes. Relat. Metab. Disord. 19, 517–534.
CELL METABOLISM : NOVEMBER 2006
Effects of M3 muscarinic receptor ablation
Rolfe, D.F., and Brand, M.D. (1996). Contribution of mitochondrial protonleak to skeletal muscle respiration and to standard metabolic rate. Am. J.Physiol. 271, C1380–C1389.
Rolfe, D.F., and Brown, G.C. (1997). Cellular energy utilization and molecularorigin of standard metabolic rate in mammals. Physiol. Rev. 77, 731–758.
Rousset, S., Alves-Guerra, M.C., Mozo, J., Miroux, B., Cassard-Doulcier,A.M., Bouillaud, F., and Ricquier, D. (2004). The biology of mitochondrial un-coupling proteins. Diabetes 53 (Suppl 1), S130–S135.
Schwartz, M.W., Woods, S.C., Porte, D., Jr., Seeley, R.J., and Baskin,D.G. (2000). Central nervous system control of food intake. Nature 404,661–671.
Simonsen, L., Bulow, J., Madsen, J., and Christensen, N.J. (1992). Thermo-genic response to epinephrine in the forearm and abdominal subcutaneousadipose tissue. Am. J. Physiol. 263, E850–E855.
Teshima, Y., Saikawa, T., Yonemochi, H., Hidaka, S., Yoshimatsu, H., andSakata, T. (1999). Alteration of heart uncoupling protein-2 mRNA regulatedby sympathetic nerve and triiodothyronine during postnatal period in rats.Biochim. Biophys. Acta 1448, 409–415.
CELL METABOLISM : NOVEMBER 2006
Wess, J. (1996). Molecular biology of muscarinic acetylcholine receptors.Crit. Rev. Neurobiol. 10, 69–99.
Wess, J. (2004). Muscarinic acetylcholine receptor knockout mice: novelphenotypes and clinical implications. Annu. Rev. Pharmacol. Toxicol. 44,423–450.
Yach, D., Stuckler, D., and Brownell, K.D. (2006). Epidemiologic and eco-nomic consequences of the global epidemics of obesity and diabetes. Nat.Med. 12, 62–66.
Yamada, M., Miyakawa, T., Duttaroy, A., Yamanaka, A., Moriguchi, T.,Makita, R., Ogawa, M., Chou, C.J., Xia, B., Crawley, J.N., et al. (2001).Mice lacking the M3 muscarinic acetylcholine receptor are hypophagic andlean. Nature 410, 207–212.
Yu, S., Gavrilova, O., Chen, H., Lee, R., Liu, J., Pacak, K., Parlow, A.F., Quon,M.J., Reitman, M.L., and Weinstein, L.S. (2000). Paternal versus maternaltransmission of a stimulatory G protein a subunit knockout produces oppo-site effects on energy metabolism. J. Clin. Invest. 105, 615–623.
Zurlo, F., Larson, K., Bogardus, C., and Ravussin, E. (1990). Skeletal musclemetabolism is a major determinant of resting energy expenditure. J. Clin.Invest. 86, 1423–1427.
375