Enhanced live cell imaging via photonic crystal enhanced fluorescence microscopy
10
Enhanced live cell imaging via photonic crystal enhanced fluorescence microscopy† Weili Chen, a Kenneth D. Long, b Hojeong Yu, a Yafang Tan, a Ji Sun Choi, c Brendan A. Harley cd and Brian T. Cunningham * ab We demonstrate photonic crystal enhanced fluorescence (PCEF) microscopy as a surface-specific fluorescence imaging technique to study the adhesion of live cells by visualizing variations in cell– substrate gap distance. This approach utilizes a photonic crystal surface incorporated into a standard microscope slide as the substrate for cell adhesion, and a microscope integrated with a custom illumination source as the detection instrument. When illuminated with a monochromatic light source, angle-specific optical resonances supported by the photonic crystal enable efficient excitation of surface-confined and amplified electromagnetic fields when excited at an on-resonance condition, while no field enhancement occurs when the same photonic crystal is illuminated in an off-resonance state. By mapping the fluorescence enhancement factor for fluorophore-tagged cellular components between on- and off-resonance states and comparing the results to numerical calculations, the vertical distance of labelled cellular components from the photonic crystal substrate can be estimated, providing critical and quantitative information regarding the spatial distribution of the specific components of cells attaching to a surface. As an initial demonstration of the concept, 3T3 fibroblast cells were grown on fibronectin-coated photonic crystals with fluorophore-labelled plasma membrane or nucleus. We demonstrate that PCEF microscopy is capable of providing information about the spatial distribution of cell–surface interactions at the single-cell level that is not available from other existing forms of microscopy, and that the approach is amenable to large fields of view, without the need for coupling prisms, coupling fluids, or special microscope objectives. Introduction The adhesive interaction of cells with extracellular matrix (ECM) is one of the most fundamental mechanisms through which cells communicate with their environment. 1 Cell–surface interactions play a critical role in a wide range of processes such as growth, migration, proliferation, apoptosis, and differentia- tion that occur during drug exposure, cell-to-cell communica- tion, 2 the presence of chemical gradients, 3 introduction of growth factors, and programmed gene expression. Ultimately, these fundamental processes govern biological activity such as tissue growth, inammation, wound healing and metastasis. 4,5 Changes in cell–ECM adhesion that result from changes in the local environment (such as via introduction of drugs, growth factors, or other cells) are a contributing factor in the progres- sion of a variety of diseases. 6 While the signicance of cell– substrate adhesion has been realized for years, there are few tools currently available that enable visualization and quanti- cation of cell-to-surface coupling behavior. Current approaches for imaging cell–substrate interactions primarily utilize uorescent dyes that label specically targeted cell structures, and uorescent excitation methods that concentrate illumination energy within a conned zone that is in direct contact with adherent cells (see ESI, Table 1†). For example, total internal reection uorescence (TIRF) micros- copy can selectively excite uorophores near the adherent cell surface, while minimizing uorescence originating from the bulk of the cell 7 through a spatially restricted evanescent eld upon a substrate surface when total internal reection occurs. While TIRF microscopy has been broadly adopted through the availability of specialized microscope objectives, the approach is not able to identify a locus of high uorescence intensity that is bright because it is close to the cell–substrate interface or because it contains a high concentration of uorescent dye. 8 Confocal microscopy is another important technique that is a Department of Electrical and Computer Engineering, University of Illinois at Urbana-Champaign, 208 North Wright Street, Urbana, IL, 61801, USA. E-mail: [email protected] b Department of Bioengineering, University of Illinois at Urbana-Champaign, Urbana, IL, USA c Department of Chemical and Biomolecular Engineering, University of Illinois at Urbana-Champaign, Urbana, IL, USA d Institute for Genomic Biology, University of Illinois at Urbana-Champaign, Urbana, IL, USA † Electronic supplementary information (ESI) available. See DOI: 10.1039/c4an01508h Cite this: Analyst, 2014, 139, 5954 Received 17th August 2014 Accepted 18th September 2014 DOI: 10.1039/c4an01508h www.rsc.org/analyst 5954 | Analyst, 2014, 139, 5954–5963 This journal is © The Royal Society of Chemistry 2014 Analyst PAPER Published on 18 September 2014. Downloaded by University of Illinois - Urbana on 15/01/2015 20:09:42. View Article Online View Journal | View Issue
Transcript of Enhanced live cell imaging via photonic crystal enhanced fluorescence microscopy

Analyst
PAPER
Publ
ishe
d on
18
Sept
embe
r 20
14. D
ownl
oade
d by
Uni
vers
ity o
f Il
linoi
s -
Urb
ana
on 1
5/01
/201
5 20
:09:
42.
View Article OnlineView Journal | View Issue
Enhanced live ce
aDepartment of Electrical and Computer
Urbana-Champaign, 208 North Wright St
[email protected] of Bioengineering, University o
IL, USAcDepartment of Chemical and Biomolecula
Urbana-Champaign, Urbana, IL, USAdInstitute for Genomic Biology, University o
IL, USA
† Electronic supplementary informa10.1039/c4an01508h
Cite this: Analyst, 2014, 139, 5954
Received 17th August 2014Accepted 18th September 2014
DOI: 10.1039/c4an01508h
www.rsc.org/analyst
5954 | Analyst, 2014, 139, 5954–5963
ll imaging via photonic crystalenhanced fluorescence microscopy†
Weili Chen,a Kenneth D. Long,b Hojeong Yu,a Yafang Tan,a Ji Sun Choi,c
Brendan A. Harleycd and Brian T. Cunningham*ab
We demonstrate photonic crystal enhanced fluorescence (PCEF) microscopy as a surface-specific
fluorescence imaging technique to study the adhesion of live cells by visualizing variations in cell–
substrate gap distance. This approach utilizes a photonic crystal surface incorporated into a standard
microscope slide as the substrate for cell adhesion, and a microscope integrated with a custom
illumination source as the detection instrument. When illuminated with a monochromatic light source,
angle-specific optical resonances supported by the photonic crystal enable efficient excitation of
surface-confined and amplified electromagnetic fields when excited at an on-resonance condition, while
no field enhancement occurs when the same photonic crystal is illuminated in an off-resonance state.
By mapping the fluorescence enhancement factor for fluorophore-tagged cellular components between
on- and off-resonance states and comparing the results to numerical calculations, the vertical distance
of labelled cellular components from the photonic crystal substrate can be estimated, providing critical
and quantitative information regarding the spatial distribution of the specific components of cells
attaching to a surface. As an initial demonstration of the concept, 3T3 fibroblast cells were grown on
fibronectin-coated photonic crystals with fluorophore-labelled plasma membrane or nucleus. We
demonstrate that PCEF microscopy is capable of providing information about the spatial distribution of
cell–surface interactions at the single-cell level that is not available from other existing forms of
microscopy, and that the approach is amenable to large fields of view, without the need for coupling
prisms, coupling fluids, or special microscope objectives.
Introduction
The adhesive interaction of cells with extracellular matrix (ECM)is one of the most fundamental mechanisms through whichcells communicate with their environment.1 Cell–surfaceinteractions play a critical role in a wide range of processes suchas growth, migration, proliferation, apoptosis, and differentia-tion that occur during drug exposure, cell-to-cell communica-tion,2 the presence of chemical gradients,3 introduction ofgrowth factors, and programmed gene expression. Ultimately,these fundamental processes govern biological activity such astissue growth, inammation, wound healing and metastasis.4,5
Engineering, University of Illinois at
reet, Urbana, IL, 61801, USA. E-mail:
f Illinois at Urbana-Champaign, Urbana,
r Engineering, University of Illinois at
f Illinois at Urbana-Champaign, Urbana,
tion (ESI) available. See DOI:
Changes in cell–ECM adhesion that result from changes in thelocal environment (such as via introduction of drugs, growthfactors, or other cells) are a contributing factor in the progres-sion of a variety of diseases.6 While the signicance of cell–substrate adhesion has been realized for years, there are fewtools currently available that enable visualization and quanti-cation of cell-to-surface coupling behavior.
Current approaches for imaging cell–substrate interactionsprimarily utilize uorescent dyes that label specically targetedcell structures, and uorescent excitation methods thatconcentrate illumination energy within a conned zone that isin direct contact with adherent cells (see ESI, Table 1†). Forexample, total internal reection uorescence (TIRF) micros-copy can selectively excite uorophores near the adherent cellsurface, while minimizing uorescence originating from thebulk of the cell7 through a spatially restricted evanescent eldupon a substrate surface when total internal reection occurs.While TIRF microscopy has been broadly adopted through theavailability of specialized microscope objectives, the approachis not able to identify a locus of high uorescence intensity thatis bright because it is close to the cell–substrate interface orbecause it contains a high concentration of uorescent dye.8
Confocal microscopy is another important technique that is
This journal is © The Royal Society of Chemistry 2014

Paper Analyst
Publ
ishe
d on
18
Sept
embe
r 20
14. D
ownl
oade
d by
Uni
vers
ity o
f Il
linoi
s -
Urb
ana
on 1
5/01
/201
5 20
:09:
42.
View Article Online
used to visualize features of cell membranes, in which adiffraction-limited focal volume of laser illumination is scannedthrough of the cell in three dimensions. Although confocalmicroscopy can specically target volume elements of the cellthat are close to the boundary with the surface, the approachalso results in background excitation of components in the cellbody that are above/below the focal plane. Further, thethroughput of confocal microscopy for rapidly imaging manycells in a large eld of view is limited by the necessity forscanning the focused spot.9
In order to address the limitations of TIRF and confocalmicroscopy, there has been intense interest in the developmentof surfaces and nanostructures that can more effectively couplelight from a uorescence excitation source, and spatiallyconne it to the region of a cell that adheres to the surface.These techniques can be advantageous because they can effec-tively amplify the excitation intensity beyond that available froman ordinary glass surface, resulting in greater uorescentintensity than would be available from TIRF, given an identicalillumination intensity.
While the rst demonstrations of enhanced uorescenceappeared shortly aer the discovery of surface enhanced Ramanscattering almost three decades ago,10–12 the application of thismethod to improving bioassays has only occurred recently, inconjunction with the increased use of uorescence protocols inlife science research. Enhancing uorescence typically relies onan interaction between a uorophore and a resonant opticalstructure, the most common of which are metal nanoparticles,smooth metal surfaces, and nanostructured metal surfaces thatsupport plasmon resonances. These resonances can affect u-orophores in a variety of ways: they can amplify excitationlight,13 alter the spatial distribution of the uorophore emis-sion,14 modify the radiative lifetime of the uorophore,15 orsimultaneously perform more than one of these functions.16–18
Metal nanostructures have been demonstrated to enhanceuorescence for applications such as immunoassays19 and cellimaging.20 However, uorescence enhancement using metalsurfaces or metal nanoparticles suffers from quenching if theuorophore is too close to the metal, resulting in very stringentrequirements for surface-uorophore spacing.21 The lowquality-factor of metal-based resonances, due to opticalabsorption, further reduces the achievable amplication factorfor metal-enhanced uorescence.22,23
Photonic crystals (PCs), or periodic arrangements of mate-rials with differing dielectric constants, represent a powerfulclass of substrates for enhancing uorescence. The PCs used inour research are comprised of periodically modulated gratingstructure with low and high refractive index layers in which theperiod is smaller than the wavelength of light used to excite thestructure (Fig. 1a). A resonance in this structure is excited whenevanescent diffracted orders couple to modes of an effectivehigh refractive index layer, and are re-radiated throughdiffraction in-phase with the reected zeroth-order wave andout-of-phase with the transmitted zeroth-order wave.24 Thedispersion of the PC then reveals these resonances as sharp dipsin the transmission spectrum (Fig. 1d) upon white light illu-mination, resulting from the coupling of light at specic
This journal is © The Royal Society of Chemistry 2014
incidence angles and wavelengths to the structure. Theseresonances are capable of enhancing uorescence in a similarfashion to surface plasmon resonances, taking advantage of twophenomena: enhanced excitation and enhanced extraction.Enhanced excitation is the result of incident radiation couplingto a PC resonance, which increases the local electric eldintensity throughout the structure. These elds decay expo-nentially as one moves away from the substrate surface (Fig. 1eand f), in a similar fashion to TIRF microscopy, but the reso-nance coupling provides a constructive interference effect thatamplies the incident wave.25 Multiplied with this enhance-ment effect is enhanced extraction, whereby uorophore emis-sion is redirected along the PC dispersion26 to increase thepercentage of output photons that are available for detection.This mechanism helps to claim emitted light that otherwisemay have been lost to guided modes within the substrate or toemission at oblique angles not collected by the detection optics.Overall, photonic crystal enhanced uorescence (PCEF)provides an optically active surface capable of providinguniform uorescence enhancement over large areas without thequenching effects that limit metal enhanced uorescenceapproaches.
PCEF offers an additional unique feature that is not availablein TIRF microscopy. For effective uorescence enhancement byPCEF, the illumination angle of a monochromatic light sourcemust be chosen to match with the resonant coupling angle ofthe PC.27 However, by intentional adjustment of the incidentangle to an off-resonant condition, one may obtain “ordinary”laser illumination, and thus it is easy to adjust the illuminationbetween an “on-resonant” and an “off-resonant” state, effec-tively switching the enhancement effect on/off at will. In thiswork, we take advantage of this capability to create spatial mapsof the PCEF enhancement factor of uorescence-emittingregions on the surface and inside live cells. Rather thangenerating images of orescence intensity, as performed byTIRF, which results in uorescence intensities that are depen-dent upon both the local dye concentration and the position ofthe emitters with respect to the substrate surface, PCEFmicroscopy creates uorescence enhancement factor image,that derive their magnitude from the proximity of the uores-cent emitter from the surface (Fig. 1f). While previous publi-cations have described the application of PCEF in the context ofmicroarrays of biomolecular assays for multiplexed detection ofsoluble protein biomarkers,28 gene expression,29 and miRNA,30
this work represents the rst report of PCEF for uorescenceimaging of cells, in which alternating on/off-resonance imagesare used to derive maps of the surface engagement of cellstructures at the single-cell level.
MethodsFabrication method
The PC surfaces used in this study were prepared using a room-temperature nanoreplica molding fabrication approach, whichhas been used previously to produce PCs that are embeddedinto disposable labware such as microplates, microuidiccartridges, and microscope slides.31–34 Briey, a molding
Analyst, 2014, 139, 5954–5963 | 5955

Fig. 1 (a) Schematic diagram of the PC; (b) AFM image of the PC surface showing a grating period of 400 nm and grating depth of 50 nm; (c)photograph of the PC, fabricated on a standard microscope slide. (d) Reflection spectrum of a PC. The red and black curves indicate thereflection response of the PC under illumination of TM or TE polarized light. (e) FDTD simulation of evanescent electric field distributionwhen thePC is under resonant (left) and non-resonant (right) illumination. The electrical field intensity under on-resonance condition is enhancedmaximally 350 times compared to the incident light intensity, while the off-resonance electrical field exhibits little intensity increase. (f) Thedistance dependence of the enhancement factor.
Analyst Paper
Publ
ishe
d on
18
Sept
embe
r 20
14. D
ownl
oade
d by
Uni
vers
ity o
f Il
linoi
s -
Urb
ana
on 1
5/01
/201
5 20
:09:
42.
View Article Online
template patterned with a negative volumetric image of thedesired PC surface structure (L ¼ 400 nm, d ¼ 120 nm) isprepared with a silicon master wafer using deep ultravioletlithography and reactive ion etching (RIE). This template can beused repeatedly to inexpensively produce uniform, single-usedevices. To transfer the grating pattern from the mastertemplate to a PC, a small amount of liquid UV-curable polymer(UVCP) is squeezed between the template and a exible glasscoverslip (0.17 mm thick), followed by exposure to a highintensity ultraviolet lamp to solidify the polymer layer. The glasscoverslip is initially treated with an adhesive coating (hexame-thyldisilane (HMDS)), so the hardened polymer layer can pref-erentially adhere to glass coverslip when it is peeled away fromthe template. A RF sputtering system (PVD 75, Kurt Lesker) isused to apply the SiO2 (�200 nm) and TiO2 (�95 nm) layers.Finally, the glass coverslip with the PC is attached to a conven-tional glass microscope slide using adhesive (Norland 61).
Detection instrument
The detection instrument is congured to enable illuminationof cells from beneath the PC, so cell bodies are not exposed tothe illumination source when the PC is excited under the
5956 | Analyst, 2014, 139, 5954–5963
resonant coupling condition. The system is congured toprovide a focused line of TM-polarized illumination that is onlyfocused along the axis parallel to the grating lines, enabling allthe light that enters the PC with an axis perpendicular to thegrating lines to be incident at the same angle. This congura-tion is crucial for achieving efficient coupling of the laser to thePC, so all the incident light satises the on-resonant condi-tion.30,35 Using this approach, substantially large PC surfaceareas can be imaged by scanning the illumination line acrossthe device.
Fig. 2 shows a schematic diagram of the detection system,which is built upon the body of a standard microscope (CarlZeiss Axio Observer Z1). In addition to the light for ordinarybright eld imaging, a second illumination path is providedfrom a semiconductor laser (l ¼ 637 nm, AlGaAs, 35 mW) toexcite the uorescent dye. The laser is coupled to a polarizationmaintaining (PM) ber to provide a linearly-polarized beam,which is later collimated by a condenser lens yielding a laserbeam with a diameter of 6.7 mm. A half-wave plate is then usedto adjust the electric eld polarization to be perpendicular tothe PC grating lines, thus ensuring TM mode illumination. Theoutput beam is focused by a cylindrical lens (f ¼ 200 nm) toform a linear beam at the back focal plane of the objective lens
This journal is © The Royal Society of Chemistry 2014

Fig. 2 Schematic diagram of the detection instrumentation. Illumination from a fiber coupled semiconductor laser diode is collimated andpassed through a half waveplate to produce a polarization perpendicular to the PC grating lines. A cylindrical lens focusses the light to a line at theback focal plane of objective. The reflected light from PC is collected by a CCD camera after passing through an emission filter. The translationstage helps the adjustment of incident angle by moving the light source along the x-direction. (Top left) Angle reflection spectra of the PC whenilluminated with a collimated semiconductor laser at 637 nm over a range of illumination angles. Maximum reflection intensity occurs at the on-resonance condition at an incident angle of �1.14� from normal. The off-resonance condition refers to the laser illumination at an incidenceangle of 5�.
Paper Analyst
Publ
ishe
d on
18
Sept
embe
r 20
14. D
ownl
oade
d by
Uni
vers
ity o
f Il
linoi
s -
Urb
ana
on 1
5/01
/201
5 20
:09:
42.
View Article Online
(10�, Zeiss) via a 50/50 beamsplitter. Aer passing through theobjective lens, the laser is focused along the direction parallel tothe PC grating while remaining collimated in the directionperpendicular to the grating. The width of the illumination lineis 6 mm, effectively minimizing the exposure of uorophores inadjacent areas. The PC is placed on a motorized sample stage(MS2000, Applied Scientic Instruments) that moves in adirection perpendicular to the illumination line during experi-ments to cover a targeted area on the PC surface. The emitteduorescence is collected by the objective (10�, Zeiss, focallength f ¼ 16.45 mm) and projected, via a side port of theinverted microscope and a zoom lens onto an EM-CCD camera(Photometrics Cascade 512). An emission lter is placed in frontof the camera to block the laser light coming from the source,which passes only the uorescence emission photons. In orderto match the resonance condition of the PC, an angle tuning
This journal is © The Royal Society of Chemistry 2014
capability is needed to adjust the incident angle of the laserlight. For this purpose, an assembly including the end of the PMber, the collimator, the half waveplate and the cylindrical lensis mounted on a motorized translation stage (Zaber LSM-25)that shis the incident light along the horizontal direction. Thelateral position displacement (Dd) of the laser light focused atthe back focal plane of the objective effectively leads to a changein the angle (Dq) of illumination for the PC surface given by Dq¼ tan�1(Dd/f). The incident angle can be controlled from �10�
to +10� with an increment of 0.03� by translating the motorizedstage over a distance of 6 mm with a step size of 0.01 mm.
To construct a two-dimensional uorescence image, thesample stage holding the PC translates along the axis perpen-dicular to the imaged line with an increment of 0.6 mm per step,while the camera gathers the uorescence intensity of thecenter pixel line within the illuminated region at each step
Analyst, 2014, 139, 5954–5963 | 5957

Analyst Paper
Publ
ishe
d on
18
Sept
embe
r 20
14. D
ownl
oade
d by
Uni
vers
ity o
f Il
linoi
s -
Urb
ana
on 1
5/01
/201
5 20
:09:
42.
View Article Online
position. Using this technique, a series of lines is assembledinto an image at a rate of 0.1 s per line to form the whole image.Aer completing a scan, the stage can return to its startingposition to repeat the scan using a second incident angle. Thepixel resolution along the scan direction is determined by thestep increment (0.6 mm) and the pixel resolution in the otherdirection is also 0.6 mm, as determined by the camera resolutionand effective optical magnication of the system. Each image iscomprised of 512 � 512 pixels covering a 307 � 307 mm regionon the PC surface.
Cell culture and uorophore loading
The 3T3 broblasts (ATCC) were cultured in DMEMmedia with5% fetal bovine serum. Silicone rubber gaskets (prepared usingpolydimethylsiloxane (PDMS)) were attached to the sensorsurface to provide a media containment (1 mL volume).Prepared slides were treated with oxygen plasma, and incubatedwith 10 mg mL�1
bronectin to encourage attachment. Cellswere incubated on the PC surface for 12 hours prior to labellingwith uorescent dyes. For membrane staining, a non-lectin,amphipathic membrane dye that uoresces at a wavelength of l¼ 666 nm (Life Technologies, excitation/emission: 659/674 nm)was added at 1� concentration to the chamber and incubatedfor 10 minutes. Aerward, the chamber was rinsed with DMEMculture media. For nuclear staining, a cell-permanent nuclearstain that binds to DNA and uoresces at l ¼ 647 nm (LifeTechnologies, excitation/emission 638/686 nm) was added tothe chamber, and incubated for 30 minutes before imaging.Imaging was completed on the instrument as described abovewith the microscope stage enclosed within an environmentally-controlled incubation chamber (Zeiss) maintaining constant37�C temperature and 5% CO2.
ResultsPC biosensor design and structure
A schematic diagram the PC structure is shown in Fig. 1a. ThePC is comprised of a subwavelength grating structure formedin an ultraviolet curable polymer (UVCP) layer of low refractiveindex on a glass coverslip substrate. The polymer gratingstructure is coated with a �200 nm silicon dioxide (SiO2)spacer layer followed by a�95 nm titanium dioxide (TiO2) thinlm with high refractive index (n ¼ 2.35), acting as the opticalconnement layer to support establishment of a narrowbandwidth single-mode resonant reection at a wavelength ofl ¼ 635 nm when the device is covered in aqueous media, andilluminated at normal incidence. At specic combinations ofincident wavelength and angle of incidence, the PC surfacewill reect nearly 100% of the incident light, as an electro-magnetic standing wave is generated that extends from the PCsurface and into the surrounding media. Surface-connedelectromagnetic elds at the resonant coupling condition areintensied, compared to the eld intensity of the illuminationsource, resulting in surface-localized uorophores experi-encing greater excitation than would be achieved withoutthe presence of the nanostructure, or for “off-resonance”
5958 | Analyst, 2014, 139, 5954–5963
illumination that does not match the resonant couplingcondition of the PC. In this work, the PC was intentionallydesigned to interact efficiently with a laser in the red part ofthe optical spectrum (l ¼ 637 nm), which coincides with theexcitation wavelength of uorophores for labelling cell struc-tures. The approach described here may be extended to anyother wavelength from UV36 to IR37 by selection of the PCperiod, and we have demonstrated that a single PC may beused to excite uorophores with multiple excitation wave-lengths.38 The PCs used for all experiments reported here havea grating period of L ¼ 400 nm, depth of d ¼ 50 nm, and dutycycle of f ¼ 50%. The dimensional parameters were veried byatomic force microscopy (Fig. 1b). The PC was fabricated as a9 � 9 mm2 region on the surface of a conventional glassmicroscope slide, as shown in Fig. 1c.
In this study, the PC surface is engineered to exhibit strongoptical resonance at both the excitation (lex ¼ 637 nm) andemission (lem � 680 nm) wavelengths for dyes in the generalspectral range of cyanine-5 (Cy5) by utilizing two orthogonalpolarization modes of light: transverse magnetic (TM) andtransverse electric (TE). The electric eld component of the TMmode is perpendicular to the grating lines in the PC, while thatof the TE mode is parallel to the grating lines. Fig. 1d shows thereection spectrum of a PC under white light illumination atnormal incidence, in which each reection peak indicates aresonance. Compared to the TE resonance with half-width of Dl¼ 14.3 nm, the TM resonance has a much narrower linewidth(Dl ¼ 1.5 nm), implying a higher resonance quality factor,which is related to the ratio between the energy stored in aresonance and the energy dissipated. Thus, we design the TMmode to provide the enhanced excitation effect. The TE reso-nance, on the other hand, is designed to overlap with theuorescence emission spectrum with a resonant angle of0� (relative to surface normal) as the collection optics is orientedperpendicular to the sample surface. The uorescence outputefficiently coupled to the TE mode is channeled preferentiallyaway from the PC at an angle normal to the surface, signicantlyimproving the collection efficiency for uorescent emissionphotons that originate from the PC surface. While the enhancedexcitation effect can be turned off by illuminating the PC at anoff-resonant angle, the enhanced extraction effect is alwaysactive for emitters on the PC surface that match the TE modewavelength.
FDTD simulation
To characterize the resonant response of the PC under illumi-nation from a TM polarized laser, a commercially availableelectromagnetic simulation package (FDTD Solutions, Lumer-ical Inc.) was used to study the optical eld distribution(normalized to incident intensity) and the distance dependenceof the enhancement effect. Since the uorophores interact withexcitation light primarily through excitation of their internalelectrons, only electric eld components are considered. Oneperiod of the PC structure was studied with a periodic boundarycondition applied along the direction perpendicular to thegrating lines, as shown in Fig. 1e.
This journal is © The Royal Society of Chemistry 2014

Paper Analyst
Publ
ishe
d on
18
Sept
embe
r 20
14. D
ownl
oade
d by
Uni
vers
ity o
f Il
linoi
s -
Urb
ana
on 1
5/01
/201
5 20
:09:
42.
View Article Online
To simulate the electric eld associated with the PC used inexperiments, the corners of grating were slightly rounded tomatch the shape observed via AFM, and the superstrate materialwas chosen to represent water (nwater ¼ 1.33). The illuminationis provided by a monochromatic plane wave light source at awavelength l ¼ 637 nm, (the same wavelength used for experi-ments) and a magnitude, represented by the power of theincident electric eld of |E|2¼ 1 (Vm�1)2. In our simulation, theon-resonance incident angle for a wavelength of l ¼ 637 nm isdesigned to be 0� (normal incidence). Fig. 1e (le) shows thespatial distribution of the near-eld electric eld at the reso-nance condition. The resonant electromagnetic standing wavegenerates surface-conned electric eld power with magnitudesas high as |E|2 ¼ 100–300 (V m�1)2 in proximity to the TiO2 layerwith the evanescent tails penetrating both the substrate andsuperstrate materials. To demonstrate the difference betweenthe on-resonance and the off-resonance condition, a secondsimulation was performed for the identical device structure andillumination source, but incident at an off-resonant couplingangle 5� from normal. As shown in Fig. 1e (right), theenhancement effect is generally eliminated due to themismatch of incidence angle with the resonant coupling angleand the near-eld electric eld intensity is very close to |E|2 ¼ 1(V m�1)2. The distance dependence of the enhancement factorwas estimated through simulation. The enhancement factor at aparticular height was calculated as the ratio between the aver-aged electric eld intensity at on- and off-resonance conditions,and is plotted as a function of the distance above the PC surfaceranging from 2 nm to 600 nm, as shown in Fig. 1f. As expected,the enhancement effect decays exponentially as the uorescentemitter is translated vertically from the PC surface, with theenhancement effect nearly completely eliminated for distancesfrom the surface greater than 500 nm. Importantly, theenhancement factor at each vertical distance is unique, sug-gesting that we can estimate the distance between a uorescentemitter and the PC surface by measuring the uorescenceintensity at both on- and off-resonance and calculating theenhancement factor.
Fluorescent enhancement-factor cell imaging
In order to characterize the adhesion properties of live cells anddemonstrate the enhanced uorescence imaging capability ofPCEF microscopy, 3T3 broblast cells were cultured andobserved when they are adherent to bronectin-treated PCsurfaces. Fibroblasts are the most common resident cells inconnective tissue. Upon injury, broblast cells near the woundproliferate and produce large amounts of collagenous matrix tohelp isolate and repair the damaged tissue.39 The cell line wasselected for initial demonstration of PCEFmicroscopy due to itsbroad utility in tissue engineering and clinical applications.Cellular functions such as cell migration, division, endocytosisand exocytosis usually involve changes in the arrangement andinteraction of specic molecules and organelles. These changesoccur not only in the plane of the cell–substrate interface butalso in the dimension perpendicular to the substrate. Therefore,it is important to analyze the activities and distribution in three
This journal is © The Royal Society of Chemistry 2014
dimensions of specic molecules and organelles in living cellsduring normal functions.
When illuminated with the l ¼ 637 nm laser, the excitationefficiency for the nuclear dye is nearly 100%, but for themembrane dye, the excitation efficiency is expected to be�50%.Before each scan, an angle reection spectrum is obtained, asshown in Fig. 2 (top le), to determine the incident angle ofoptimal on-resonant coupling from the laser. The averagedintensity of the laser light reection from the PC surface isplotted as a function of the incident angle, and the peak in theangle reection spectrum is an indicator of the occurrence ofoptical resonant coupling of the incident light to the PC, whichalso leads to a heightened energy density on the PC surface. Theexperimentally measured on-resonance incident angle is �1.14degrees. The two peaks observed in the spectrum are the resultof bilateral symmetry of the PC along the grating lines, whichmeans that the incident angle can be equivalently coupled intothe resonance mode from two symmetrical angles. The off-resonance incident angle is selected to be 5 degrees away fromthe angle for resonant light coupling.
In order to avoid overestimation of the enhancement factordue to the effects of photobleaching (which will result in lowerintensity images obtained with the second scan), the off-reso-nance scan is always performed rst, followed by the on-reso-nance scan of the same eld of view. Other than the angle ofincidence, all other instrument settings were identical betweenthe two scans. To quantify the uorescence intensity loss aerthe rst off-resonance scan, a photobleaching test was per-formed by scanning the uorophore-labelled cells across thesame eld of view multiple times at a xed off-resonance inci-dent angle (see ESI, Fig. 1†). For the plasma membrane dye, theaveraged uorescence intensity measured from the second off-resonance scan is 64% of the rst scan; while for the nucleardye, nearly 93% of the uorescence intensity is maintained inthe second scan. Therefore, the uorescence enhancementeffect is underreported by a known factor that can be accountedfor in our analytical model of the distance of the uorophorefrom the PC surface.
(i) Modelling uorescence enhancement in the cell contactregion. To investigate the relationship between the uorescenceenhancement effect and the vertical location of a uorophore-labelled cell component, a quantitative analysis of the absoluteseparation distance between the cell membrane/nucleus andthe substrate is applied using a mathematical model thatdescribes the evanescent electric eld generated by the PCresonance. Consider an anchorage-dependent cell adhering tothe aqueous side of the PC/cell media interface that issequentially illuminated by off- and on-resonance incidentlight. The enhancement of the uorescence intensity can beassumed to be only caused by the amplication of the electriceld experienced by the uorophores since the concentration ofthe uorescent dye is the same between the two illuminations.The electric elds excited by the on-resonant illumination andthe 5� off-resonant illumination for the PC device have beencharacterized by the FDTD simulation (Fig. 1e) that deduces anexponentially decaying curve for the relationship between theelectric eld enhancement factor and the vertical distance
Analyst, 2014, 139, 5954–5963 | 5959
Analyst Paper
Publ
ishe
d on
18
Sept
embe
r 20
14. D
ownl
oade
d by
Uni
vers
ity o
f Il
linoi
s -
Urb
ana
on 1
5/01
/201
5 20
:09:
42.
View Article Online
above the PC surface. The curve can be t by a simple expo-nential function:
EF ¼ EF0 exp
�� z
d
�; (1)
where EF is the enhancement factor of the electric eld inten-sity, EF0 is the initial enhancement constant, z is the verticaldistance relative to the PC surface and d is the penetrationdepth of the evanescent eld. In this work, the cell membranedye is used to label the plasma membrane at the cell bound-aries, which is a very thin layer relative to the wavelength of thelaser (e.g. 4 nm/637 nm ¼ 0.006), so the electric eld intensity isapproximately constant throughout the membrane40 and theaveraged vertical location of the labelledmembrane zmem can bedirectly derived from (1) as:
zmem ¼ d lnEF0
EF; (2)
where the EF measured in the experiment is underestimated bya factor of a due to the photobleaching effect. On the otherhand, the uorescence enhancement effect for cell nucleus dyeused in this work is determined by the overlap integral of thedecaying evanescent intensity and the volume of distribution ofthe uorophores of dye-labelled DNA within the nucleus.41
Since the evanescent eld can penetrate only the bottomportion of the cell and the nucleus is located nominally in thecenter of the cell, the enhancement factor for the cell nucleusdye can be calculated as an integral from the lower bound of thecell nucleus znuc to innity to simplify the numerical analysis:
Fig. 3 Images of membrane-dye stained 3T3 fibroblast cells: (a) bright fie(e) 3D surface plot image of the enhancement factor.
5960 | Analyst, 2014, 139, 5954–5963
EF ¼ðNznuc
EF0 exp
�� z
d
�dz ¼ EF0d exp
�� znuc
d
�; (3)
and
znuc ¼ d lnEF0d
EF: (4)
The two different equations describing the relationshipbetween the uorescence enhancement factor and the verticallocation of the uorescence emitters for the plasma membranedye and the nucleus dye thus are determined by the differentspatial distribution of uorescent emitters. This model can beapplied to estimate the separation distance between thelabelled cell component and the substrate PC surface as shownby the following two imaging experiments.
(ii) Fluorescence imaging of cell membrane. Fig. 3a is abright eld image of 3T3 broblasts incubated on a PC surfaceshowing a stretched cellular morphology featuring membraneprotrusions (lamellipodia) consistent with substrate attach-ment. The cells also exhibit mostly round or ovalular nucleuscontour. The off-resonance uorescence image of the labelledcell membranes was taken rst (Fig. 3b), showing clear cellularattachment patterns, with a high degree of similarity to thebrighteld image. The high intensity regions in the imageindicate the locations with a high concentration of plasmamembrane dye since the excitation electric eld under off-resonance state has little correlation to the vertical distancefrom the PC surface. Immediately aer the off-resonance scan,the incident angle of the excitation laser was tuned to the
ld, (b) off-resonance, (c) on-resonance, (d) enhancement factor image,
This journal is © The Royal Society of Chemistry 2014

Paper Analyst
Publ
ishe
d on
18
Sept
embe
r 20
14. D
ownl
oade
d by
Uni
vers
ity o
f Il
linoi
s -
Urb
ana
on 1
5/01
/201
5 20
:09:
42.
View Article Online
resonant angle of the PC for an on-resonance scan of the sameeld of view, as shown in Fig. 3c, where the output uorescenceintensity is related to the combined effects of the distance-dependent electric eld and the local dye concentration. Bycomparing the two images, uorescence intensity enhancementis achieved via the resonant illumination of the PC surface. Toquantify the intensity amplication effect at each pixel position,an enhancement factor image was generated by dividing the on-resonance net intensity by the off-resonance net intensity(Fig. 3d), with an up to 5-fold enhancement in uorescent signalachieved via this method.
Important information about cell adhesion can be inferredfrom the enhancement factor image. The data contained in theenhancement factor image, other than providing the spatialproles of cell adhesion, can also be used to evaluate thestrength of the formed cellular binding to the PC surface. Thenon-uniformity of the uorescence signal shown for the plasmamembrane dye is a result of the variance in vertical distancefrom the PC surface, and can be modeled with an under-standing of the exponential decay of enhancement in theevanescent region of the PC. The enhancement factor image ofthe examined cells shows several regions of intense enhance-ment in the middle of the cells that do not correspond one-to-one with the high intensity regions in either the off-resonanceor on-resonance uorescence image. Many of the contactregions of the cell body, especially the ones near the cellnucleus, show average uorescence intensity in the uores-cence images but experience the highest enhancement in theenhancement factor image. This result suggests that the plasma
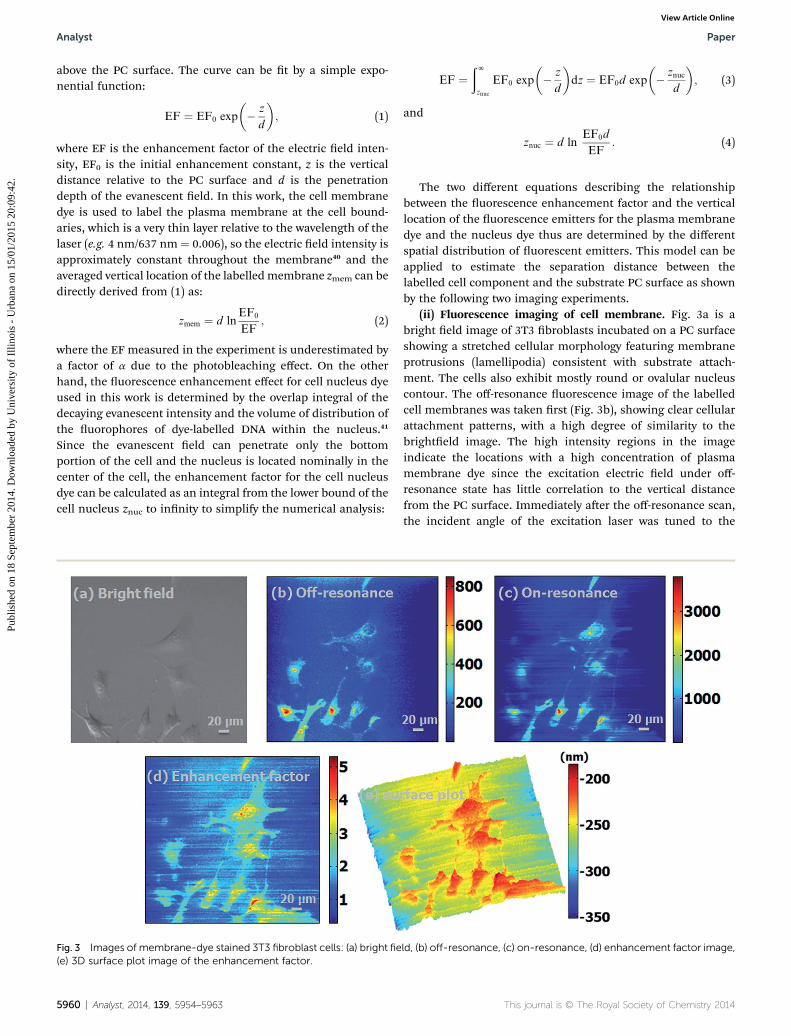
Fig. 4 Images of nuclear-dye stained 3T3 fibroblast cells: (a) bright field,3D surface plot image of the enhancement factor.
This journal is © The Royal Society of Chemistry 2014
membrane within these areas is located closest to the PCsurface, which could be a result of the cytoskeletal stress fromthe nucleus above it.42 The contact regions of the lamellipodia,which are very thin and contain a low concentration of plasmamembrane dye, are relatively low intensity regions in both theuorescence image and uorescence enhancement image. Thiswould agree with a previous nding that lamellipodia areweakly adherent, with the strongest adhesion occurring at theperiphery of lamellipodia.43 Such results can be observed moreclearly when the enhancement factor plot is presented in threedimensions (Fig. 3e) to resolve the spatial contours of the cellmembrane that contacts the PC surface as calculated by eqn (2)with the parameters EF0 ¼ 201, d ¼ 58 nm and a ¼ 0.64.
(iii) Fluorescence imaging of cell nucleus. To explore theeffects that would be measured by a PCEF image when internalcomponents of cells are labelled, we performed a secondexperiment using uorescently stained nuclei. The bright eld,on-resonance, off-resonance and enhancement factor imagesare shown in Fig. 4a–e. The cellular morphology exhibited in thebrighteld image (Fig. 4a) corresponds well with that of previ-ously studied stationary cells as the cell bodies are centrallylocated and surrounded by well-spread lamellipodia.44 Cellspreading was not as extensive as observed when using theplasma membrane dye. In contrast to the expected irregularmorphological uorescence patterns stemming from cellmembrane shapes, the labelled nuclei appear to be circular inthe off- and on-resonance uorescence images, as expected. Theuorescence intensity under off-resonance illumination (shownin Fig. 4b) is very low due to the weak excitation energy and the
(b) off-resonance, (c) on-resonance, (d) enhancement factor image, (j)
Analyst, 2014, 139, 5954–5963 | 5961

Analyst Paper
Publ
ishe
d on
18
Sept
embe
r 20
14. D
ownl
oade
d by
Uni
vers
ity o
f Il
linoi
s -
Urb
ana
on 1
5/01
/201
5 20
:09:
42.
View Article Online
spacing between the nucleus and the cell-substrate interface.However, when the incident angle is on-resonance (Fig. 4c), thepenetration of the evanescent eld into the cytoplasm is greatlyincreased and the emission of the uorophores in the bottomportions of cell nuclei located within the evanescent eld isenhanced up to 20 times the intensity observed in the off-resonance uorescence image (Fig. 4d). According to eqn (4),the spatial distribution of the bottom surface of the labellednuclei is plotted in Fig. 4e based on the uorescence enhance-ment factor image with the parameters EF0 ¼ 201, d ¼ 58 nm,and a ¼ 0.92. As observed in PCEF images of stained cellmembranes, the high intensity regions in the single scan uo-rescence images are not always spatially consistent with thehigh intensity regions in the enhancement factor image. Theestimation of vertical distance between emitter and the PCsurface based on the enhancement factor can efficiently removethe inuence brought by the nuclear dye concentration. Forexample, the cell in the bottom-le has an illuminated regionwith above average brightness in both the off- and on-resonanceimage, indicating a relatively high concentration of uorescentdye at that position, but has a below average value in theenhancement factor image, suggesting increased distancebetween PC surface and nuclei compared to other cells. Addi-tionally, we observe that the enhancement effect within a singlecell is not uniform, with the strongest enhancement occurringnear the center of the nucleus and gradually weakening towardsthe periphery.
Conclusion
This work demonstrates a sensor structure, imaging detectioninstrument, and image processing approach termed “PCEFmicroscopy” that provides a new tool for imaging and quanti-fying the interaction between uorescently-labelled cellcomponents and surfaces that cells are attached to. PCEFmicroscopy provides quantitative information about the verticallocation of specic cellular components relative to the celladhesion surface, as the resonantly excitation electric eldsupported by the PC has a strong dependence on the spatiallocation and can be switched between on/off-resonance statesby changing the angle of monochromatic illumination. Thepixel intensity in the enhancement factor image is determinedby the gap between the labelled cellular component and the PCsubstrate and it is not related to the local concentration ofuorescent dye. To interpret the enhancement factor image, anumerical analysis of the spatial distribution of the uo-rophores and the corresponding uorescence enhancementeffect is applied, which allows for the visualization of theproles of cell nucleus surface and the cell plasma membranesurface in three dimensions in the context of cell adhesion. Theseparation distance between cell membrane and its substratefor the cell-ECM contact sites has been reported to be largerthan 100 nm.45 In our experiments, the major parts of the cellmembrane are approximately 100–300 nm from the PCsubstrate and most of the cell nuclei are about 300–500 nmabove the PC substrate.
5962 | Analyst, 2014, 139, 5954–5963
The cell–substrate separation distance is an importantparameter in the characterization of cellular morphology andthe efficiency of cell adhesion to an extracellular matrix. Adhe-sion strength is highly non-uniform within an individual cell,and it changes dynamically as a function of time, as cellsundergo processes of their life cycle. The observation of celladhesion through PCEF microscopy can provide rich informa-tion about the spatial locations of cellular components that arenot available with other forms of microscopy, allowing for theinvestigation of cell–substrate interactions in several biologi-cally relevant applications. For example, the capabilitydescribed in this work may be used to study the role of thesurface functionalization on cell attachment. By coating thesensor surface with different ECM molecules, the differences incell attachment behavior may be directly observed. Bycompleting time-course studies of cell attachment, informationabout how chemical or mechanical changes in the media/substrate environment affect cellular motion and behavior canbe studied.
Except for the measurements of cell–substrate topology,PCEFmicroscopy can also be used to quantitatively estimate thelocation of the uorescently labelled cell organelles or mole-cules inside the cell body that are located within the evanescenteld above the PC surface. The evanescent eld induced by theon-resonance excitation penetrates into the cell body adjacentto the cell–substrate interface, and is capable of exciting uo-rophores residing in the immediate region near the interface.Specic cellular components associated with cell adhesion suchas nucleus, cytoskeleton and membrane proteins can be selec-tively labelled or stained and then examined by PCEF micros-copy to identify the vertical position of these targets of interestwithin the cell, which helps provide a better understandingabout the spatial organization of cellular structures during theperiod of cell adhesion.
Cell adhesion to the substrate is implicated in differences incellular shape, size and sub-cellular organization of organelles,which serves as a valuable indicator of viability as well as asensitive indicator of cellular response to the external environ-ment.46 To track the location of specic cellular components orproteins involved in the cellular attachment process is chal-lenging, especially in the context of complex and dynamic cell–ECM interactions such as neutrophil polarization and chemo-taxis. PCEF microscopy provides a novel methodology for theinvestigation of those attributes in these cellular processeswithout the need for coupling prisms, spatial pinhole, or specialmicroscope objectives. Due to the wide spectral tunability of theresonant wavelength of the PC structure, this microscopyapproach can be extended to work with most of the uorescentdyes used in cell biology.
Acknowledgements
The authors gratefully acknowledge funding from NationalScience Foundation (NSF CBET 11-32301) and the NCI Alliancefor Nanotechnology in Cancer Midwest Cancer NanotechnologyTraining Center (NIH Grant R25 CA154015A) for this work. Anyopinions, ndings, and conclusions or recommendations in
This journal is © The Royal Society of Chemistry 2014

Paper Analyst
Publ
ishe
d on
18
Sept
embe
r 20
14. D
ownl
oade
d by
Uni
vers
ity o
f Il
linoi
s -
Urb
ana
on 1
5/01
/201
5 20
:09:
42.
View Article Online
this work are those of the authors and do not necessarily reectthe views of the National Science Foundation.
References
1 M. Gardel and U. Schwarz, J. Phys.: Condens. Matter, 2010, 22,190301.
2 G. Pattabiraman, E. A. Lidstone, K. Palasiewicz,B. T. Cunningham and D. S. Ucker, Mol. Biol. Cell, 2014,25, 1704–1714.
3 M. Zelzer, R. Majani, J. W. Bradley, F. R. A. J. Rose,M. C. Davies and M. R. Alexander, Biomaterials, 2008, 29,172–184.
4 M. Barczyk, S. Carracedo and D. Gullberg, Cell Tissue Res.,2010, 339, 269–280.
5 N. J. Boudreau and P. L. Jones, Biochem. J., 1999, 339, 481–488.
6 U. Cavallaro and G. Christofori, Biochim. Biophys. Acta, Rev.Cancer, 2001, 1552, 39–45.
7 D. Axelrod, Traffic, 2001, 2, 764–774.8 F. Lanni, A. S. Waggoner and D. L. Taylor, J. Cell Biol., 1985,100, 1091–1102.
9 B. Joshi, S. S. Strugnell, J. G. Goetz, L. D. Kojic, M. E. Cox,O. L. Griffith, S. K. Chan, S. J. Jones, S. P. Leung,H. Masoudi, S. Leung, S. M. Wiseman and I. R. Nabi,Cancer Res., 2008, 68, 8210–8220.
10 W. H. Weber and C. F. Eagen, Opt. Lett., 1979, 4, 236–238.11 A. M. Glass, P. F. Liao, J. G. Bergman and D. H. Olson, Opt.
Lett., 1980, 5, 368–370.12 W. Knoll, M. R. Philpott, J. D. Swalen and A. Girlando, J.
Chem. Phys., 1981, 75, 4795–4799.13 Y.-J. Hung, I. I. Smolyaninov and C. C. Davis, Opt. Express,
2006, 14, 10825–10830.14 I. Gryczynski, J. Malicka, Z. Gryczynski and J. R. Lakowicz,
Anal. Biochem., 2004, 324, 170–182.15 O. L. Muskens, V. Giannini, J. A. Sanchez-Gil and J. G. Rivas,
Nano Lett., 2007, 7, 2871–2875.16 J. R. Lakowicz, Anal. Biochem., 2001, 298, 1–24.17 Y. Liu and S. Blair, Opt. Lett., 2003, 28, 507–509.18 Y. Chen, K. Munechika and D. S. Ginger, Nano Lett., 2007, 7,
690–696.19 J. Zhang, E. Matveeva, I. Gryczynski, Z. Leonenko and
J. R. Lakowicz, J. Phys. Chem. B, 2005, 109, 7969–7975.20 J. Zhang, Y. Fu, D. Liang, R. Y. Zhao and J. R. Lakowicz,
Langmuir, 2008, 24, 12542–12457.21 J. Zhang, Y. Fu, M. H. Chowdhury and J. R. Lakowicz, Nano
Lett., 2007, 7, 2101–2107.22 T. Hayakawa, S. T. Selvan and M. Nogami, Appl. Phys. Lett.,
1999, 74, 1513–1515.23 S. T. Selvan, T. Hayakawa and M. Nogami, J. Phys. Chem. B,
1999, 103, 7064–7067.
This journal is © The Royal Society of Chemistry 2014
24 D. Rosenblatt, A. Sharon and A. A. Friesem, IEEE J. QuantumElectron., 1997, 33, 2038–2059.
25 N. Ganesh, P. C. Mathias, W. Zhang and B. T. Cunningham,J. Appl. Phys., 2008, 103, 083104.
26 N. Ganesh, I. D. Block, P. C. Mathias, W. Zhang, E. Chow,V. Malyarchuk and B. T. Cunningham, Opt. Express, 2008,16, 21626–21640.
27 V. Chaudhery, M. Lu, A. Pokhriyal, S. C. Schulz andB. T. Cunningham, IEEE Sens. J., 2012, 12, 1272–1279.
28 C. S. Huang, S. George, M. Lu, V. Chaudhery, R. M. Tan,R. C. Zangar and B. T. Cunningham, Anal. Chem., 2011, 83,1425–1430.
29 P. C. Mathias, S. I. Jones, H. Y. Wu, F. Yang, N. Ganesh,D. O. Gonzalez, G. Bollero, L. O. Vodkin andB. T. Cunningham, Anal. Chem., 2010, 82, 6854–6861.
30 S. George, V. Chaudhery, M. Lu, M. Takagi, N. Amro,A. Pokhriyal, Y. F. Tan, P. Ferreira and B. T. Cunningham,Lab Chip, 2013, 13, 4053–4064.
31 C. J. Choi and B. T. Cunningham, Lab Chip, 2007, 7, 550–556.32 M. Lu, S. J. Park, B. T. Cunningham and J. G. Eden, J.
Microelectromech. Syst., 2007, 16, 1397–1402.33 C. J. Choi, I. D. Block, B. Bole, D. Dralle and
B. T. Cunningham, IEEE Sens. J., 2009, 9, 1697–1704.34 W. L. Chen, K. D. Long, M. Lu, V. Chaudhery, H. Yu,
J. S. Choi, J. Polans, Y. Zhuo, B. A. C. Harley andB. T. Cunningham, Analyst, 2013, 138, 5886–5894.
35 V. Chaudhery, M. Lu, C. S. Huang, J. Polans, R. M. Tan,R. C. Zangar and B. T. Cunningham, Opt. Lett., 2012, 37,2565–2567.
36 N. Ganesh, I. D. Block and B. T. Cunningham, Appl. Phys.Lett., 2006, 89, 023901.
37 J. N. Liu, M. V. Schulmerich, R. Bhargava andB. T. Cunningham, Opt. Express, 2011, 19, 24182–24197.
38 A. Pokhriyal, M. Lu, C. S. Huang, S. Schulz andB. T. Cunningham, Appl. Phys. Lett., 2010, 97, 121108.
39 B. Alberts, A. Johnson, J. Lewis, M. Raff, K. Roberts andP. Walter, Molecular biology of the cell, Garland Science,New York, 4th edn, 2002, 1467–1468.
40 W. Reichert and G. Truskey, J. Cell Sci., 1990, 96, 219–230.41 J. S. Burmeister, L. A. Olivier, W. Reichert and G. A. Truskey,
Biomaterials, 1998, 19, 307–325.42 K. N. Dahl, A. J. S. Ribeiro and J. Lammerding, Circ. Res.,
2008, 102, 1307–1318.43 E. S. Chhabra and H. N. Higgs, Nat. Cell Biol., 2007, 9, 1110–
1121.44 R. Badley, J. Couchman and D. Rees, J. Muscle Res. Cell
Motil., 1980, 1, 5–14.45 W.-T. Chen and S. Singer, J. Cell Biol., 1982, 95, 205–222.46 B. Geiger, J. P. Spatz and A. D. Bershadsky, Nat. Rev. Mol. Cell
Biol., 2009, 10, 21–33.
Analyst, 2014, 139, 5954–5963 | 5963