Energy partitioning during seismic slip in pseudotachylyte-bearing faults (Gole Larghe Fault,...
9
Energy partitioning during seismic slip in pseudotachylyte-bearing faults (Gole Larghe Fault, Adamello, Italy) Lidia Pittarello a , Giulio Di Toro a,b, ⁎ , Andrea Bizzarri c , Giorgio Pennacchioni a,d , Jafar Hadizadeh e , Massimo Cocco d a Dipartimento di Geoscienze, Università di Padova, via Giotto, 1, 35137-Padova, Italy b Istituto di Geoscienze e Georisorse, Unità operativa di Padova, CNR, via Giotto, 1, 35137-Padova, Italy c Istituto Nazionale di Geofisica Vulcanologia, Sezione di Bologna, via Donato Creti, 12, 40128–Bologna, Italy d Istituto Nazionale di Geofisica Vulcanologia, Sezione di Roma, via di Vigna Murata, 605, 00143-Roma, Italy e Department of Geography & Geosciences, University of Louisville, Louisville, Kentucky 40292, USA Received 4 June 2007; received in revised form 28 January 2008; accepted 30 January 2008 Editor: R.D. van der Hilst Available online 19 February 2008 Abstract The determination of the earthquake energy budget remains a challenging issue for Earth scientists, as understanding the partitioning of energy is a key towards the understanding the physics of earthquakes. Here we estimate the partition of the mechanical work density into heat and surface energy (energy required to create new fracture surface) during seismic slip on a location along a fault. Earthquake energy partitioning is determined from field and microstructural analyses of a fault segment decorated by pseudotachylyte (solidified friction-induced melt produced during seismic slip) exhumed from a depth of ~ 10 km—typical for earthquake hypocenters in the continental crust. Frictional heat per unit fault area estimated from the thickness of pseudotachylytes is ~ 27 MJ m − 2 . Surface energy, estimated from microcrack density inside clast (i.e., cracked grains) entrapped in the pseudotachylyte and in the fault wall rock, ranges between 0.10 and 0.85 MJ m − 2 . Our estimates for the studied fault segment suggest that ~ 97–99% of the energy was dissipated as heat during seismic slip. We conclude that at 10 km depth, less than 3% of the total mechanical work density is adsorbed as surface energy on the fault plane during earthquake rupture. © 2008 Elsevier B.V. All rights reserved. Keywords: earthquakes; pseudotachylyte; particle size distribution; energy partitioning; surface energy; frictional heat 1. Introduction The earthquake energy balance states that the total (elastic and gravitational) energy variation is partly radiated out of the source and partly absorbed on the fault plane by fracturing and frictional dissipation (Kanamori and Rivera, 2006 and refer- ences therein). The energy adsorbed on the fault plane during seismic ruptures is the mechanical work E f (Cocco et al., 2006, and references therein). In this study, we only consider the mechanical work density (work per unit area) since we are not interested here in the whole energy budget (which includes the radiated energy). At a specific point on the fault plane the mechanical work E f is partitioned into heat (Q) and surface energy (U s )(Kostrov and Das, 1988; Cocco et al., 2006): E f ¼ Q þ U s Jm 2 : ð1Þ In general, Q includes frictional heat as well as the work done by other dissipative processes within the fault zone, such as high frequency stress waves radiated by crack tips and plastic deformation of grains (Kostrov and Das, 1988; Cocco et al., 2006). It is worth noting that the mechanical work partitioning defined in Eq. (1) cannot be estimated by seismological analyses, because it is impossible to evaluate the surface energy created during dynamic sliding from seismic waves. Moreover, seismological investigations can only provide an estimate of the Available online at www.sciencedirect.com Earth and Planetary Science Letters 269 (2008) 131 – 139 www.elsevier.com/locate/epsl ⁎ Corresponding author. Dipartimento di Geoscienze, Università di Padova, via Giotto, 1, 35137-Padova, Italy. Tel.: +39 049 8271863; fax: +39 049 8272070. E-mail address: [email protected] (G. Di Toro). 0012-821X/$ - see front matter © 2008 Elsevier B.V. All rights reserved. doi:10.1016/j.epsl.2008.01.052
Transcript of Energy partitioning during seismic slip in pseudotachylyte-bearing faults (Gole Larghe Fault,...
Available online at www.sciencedirect.com
tters 269 (2008) 131–139www.elsevier.com/locate/epsl
Earth and Planetary Science Le
Energy partitioning during seismic slip in pseudotachylyte-bearing faults(Gole Larghe Fault, Adamello, Italy)
Lidia Pittarello a, Giulio Di Toro a,b,⁎, Andrea Bizzarri c, Giorgio Pennacchioni a,d,Jafar Hadizadeh e, Massimo Cocco d
a Dipartimento di Geoscienze, Università di Padova, via Giotto, 1, 35137-Padova, Italyb Istituto di Geoscienze e Georisorse, Unità operativa di Padova, CNR, via Giotto, 1, 35137-Padova, Italy
c Istituto Nazionale di Geofisica Vulcanologia, Sezione di Bologna, via Donato Creti, 12, 40128–Bologna, Italyd Istituto Nazionale di Geofisica Vulcanologia, Sezione di Roma, via di Vigna Murata, 605, 00143-Roma, Italy
e Department of Geography & Geosciences, University of Louisville, Louisville, Kentucky 40292, USA
Received 4 June 2007; received in revised form 28 January 2008; accepted 30 January 2008
Editor: R.DAvailable online
. van der Hilst19 February 2008
Abstract
The determination of the earthquake energy budget remains a challenging issue for Earth scientists, as understanding the partitioning of energy is akey towards the understanding the physics of earthquakes. Here we estimate the partition of the mechanical work density into heat and surface energy(energy required to create new fracture surface) during seismic slip on a location along a fault. Earthquake energy partitioning is determined from fieldand microstructural analyses of a fault segment decorated by pseudotachylyte (solidified friction-induced melt produced during seismic slip)exhumed from a depth of ~10 km—typical for earthquake hypocenters in the continental crust. Frictional heat per unit fault area estimated from thethickness of pseudotachylytes is ~27 MJ m−2. Surface energy, estimated from microcrack density inside clast (i.e., cracked grains) entrapped in thepseudotachylyte and in the fault wall rock, ranges between 0.10 and 0.85MJ m−2. Our estimates for the studied fault segment suggest that ~97–99%of the energy was dissipated as heat during seismic slip. We conclude that at 10 km depth, less than 3% of the total mechanical work density isadsorbed as surface energy on the fault plane during earthquake rupture.© 2008 Elsevier B.V. All rights reserved.
Keywords: earthquakes; pseudotachylyte; particle size distribution; energy partitioning; surface energy; frictional heat
1. Introduction
The earthquake energy balance states that the total (elasticand gravitational) energy variation is partly radiated out of thesource and partly absorbed on the fault plane by fracturing andfrictional dissipation (Kanamori and Rivera, 2006 and refer-ences therein). The energy adsorbed on the fault plane duringseismic ruptures is the mechanical work Ef (Cocco et al., 2006,and references therein). In this study, we only consider themechanical work density (work per unit area) since we are notinterested here in the whole energy budget (which includes the
⁎ Corresponding author. Dipartimento di Geoscienze, Università di Padova, viaGiotto, 1, 35137-Padova, Italy. Tel.: +39 049 8271863; fax: +39 049 8272070.
E-mail address: [email protected] (G. Di Toro).
0012-821X/$ - see front matter © 2008 Elsevier B.V. All rights reserved.doi:10.1016/j.epsl.2008.01.052
radiated energy). At a specific point on the fault plane themechanical work Ef is partitioned into heat (Q) and surfaceenergy (Us) (Kostrov and Das, 1988; Cocco et al., 2006):
Ef ¼ Qþ Us Jm�2� �
: ð1Þ
In general,Q includes frictional heat as well as the work doneby other dissipative processes within the fault zone, such as highfrequency stress waves radiated by crack tips and plasticdeformation of grains (Kostrov and Das, 1988; Cocco et al.,2006). It is worth noting that the mechanical work partitioningdefined in Eq. (1) cannot be estimated by seismologicalanalyses, because it is impossible to evaluate the surface energycreated during dynamic sliding from seismic waves. Moreover,seismological investigations can only provide an estimate of the

132 L. Pittarello et al. / Earth and Planetary Science Letters 269 (2008) 131–139
breakdown stress drop from seismic waves, but the magnitude ofthe shear stress on a fault is unknown (unless under extremelyfavorable circumstances; see Spudich et al., 1998). Therefore,they cannot determine the total mechanical dissipation Ef duringseismic slip (Kanamori andHeaton, 2000). For these reasons, webelieve that the field and microstructural observations discussedin the present study provide a unique occasion to constrain theenergy partitioning defined in Eq. (1).
Although some studies assume that fracture energy (G, theenergy that controls the dynamics of a propagating rupture)represents the new surface created during slip (i.e., G=Us,Yoshioka, 1986; Wilson et al., 2005), the fracture energy Gshould be not confused with the surface energy Us. Indeed,several recent studies have shown that fracture energy contains anindefinite mixture of surface energy and heat (Tinti et al., 2005;Chester et al., 2005; Ma et al., 2006).G increases with earthquakesize and it is of the order of 1–10 MJ m−2 for large earthquakes(Li, 1987; Tinti et al., 2005; Rice et al., 2005). However, thephysical meaning of G and its contribution to the earthquakeenergy balance is still being debated within the scientific com-munity (for an analysis on this issue, seeAbercrombie et al., 2006:Earthquakes, Radiated Energy and the Physics of Faulting).Therefore, seismological investigations can provide an estimateof the fracture energy (or equivalently the breakdown work,as defined by Tinti et al., 2005), but they cannot evaluate itspartitioning into surface energy and heat.
Here we attempt at using pseudotachylyte-bearing faults to getinformation on the energy partitioning between Q and Us and toenlighten the physical meaning of G. Pseudotachylyte (solidifiedfriction-induced melt produced during seismic slip) is the onlyfault rock univocally recognized as a record of an ancient seismicslip along an exhumed fault (Cowan, 1999). Unlike the case ofpseudotachylyte-free faults (Chester et al., 2005; Keulen et al.,2007), it is possible to estimate Q from the volume of pseudo-tachylyte, without any assumptions regarding the frictionalstrength of the fault (Sibson, 1975; Di Toro et al., 2005a). Inthis framework, Q represents the work absorbed in frictionalheating. In pseudotachylyte-bearing faults it is not easy to estimatethe Us associated with the seismic rupture, as the fine-grainedfault rock precursory to, and simultaneous with, pseudotachylyteis consumed by the frictional melt. In fact comminution is oftenconsidered as an essential precursor to melting by friction (Spray,1995). However, the pristine crushed rock may have locallyescaped melting and be preserved inside some clasts (internallycracked grains, or fragmented grainswhere individual parts can befit together, see Keulen et al., 2007) within pseudotachylyte, as itis the case investigated in this study. By comparing the surfaceenergy estimated from the amount of new surface producedduring seismic slip with the frictional heat estimated frompseudotachylyte vein thickness, we conclude that most mechan-ical work dissipated during an earthquake, at least at 10 km depthand in the studied fault segment, is heat.
2. Scientific rationale
Pseudotachylyte consists of a solidified melt including sur-vivor clasts of the wall rock. For seismic melts, the fric-
tional heat Q exchanged per unit fault area is (Di Toro et al.,2005a):
Q ¼ H 1� /ð Þ þ cp Tm � Thrð Þ� �qw Jm�2
� � ð2Þwhere ϕ is the volume ratio between survivor clasts and thepseudotachylyte matrix, H is the latent heat of fusion, cp is thespecific heat at constant pressure, Tm is the maximum temper-ature achieved by the melt, Thr is the host rock temperature, ρ isthe rock density and w is the pseudotachylyte average thickness.Main assumption in Eq. (2) is that frictional heating is adiabaticat seismic slip rates (~1 m/s) and seismogenic depths (~10 km):the soundness of this assumption is confirmed by theoreticalanalysis (Di Toro et al., 2006). It follows that Q can be deter-mined from field analysis by the measure of the pseudotachy-lyte average thickness (note that Q is an energy density).
The surface energy produced during rupture propagation is(Chester et al., 2005):
Us ¼ ASZ þ ADZð Þg J m�2� �
; ð3Þ
where ASZ and ADZ are the new surface per unit area producedin the slipping zone and in the damage zone of the wall rocks,respectively, and γ is the specific surface energy.
To determine the partitioning between surface energy andheat, we need to investigate fault segments exhumed fromseismogenic depths that record a single seismic rupture thatpropagated trough an intact rock. Examples of these faults canbe found in the Gole Larghe Fault in the Italian Southern Alps.
3. Selected pseudotachylyte-bearing fault segment withinthe Gole Larghe fault zone
The exhumed strike–slip Gole Larghe fault zone crosscut inan E–W-orientation the tonalites (granitoid rocks consisting of48% plagioclase, 29% quartz, 17% biotite and 6% K-feldspar(Di Toro and Pennacchioni, 2005) of the Adamello batholith(Italian Alps). It is exposed in large (1 km×0.5 km) and con-tinuous glaciated outcrops allowing the structure of an exhumedseismogenic source to be investigated in detail (Di Toro andPennacchioni, 2005). Deep creeks cutting the outcrop surfaceallow to reconstruct the 3D structure of the fault zone. The faultzone consists of ~200 main sub-parallel faults, exploiting aprecursor set of joints, and was active ~30 Ma ago at 9–11 kmdepth and 250 °C host rock temperature (Di Toro andPennacchioni, 2004; 2005; Pennacchioni et al., 2006). Faultrocks are cataclasites and pseudotachylytes, with the lattermostly developed during the last slip event along each fault. Thecataclasites are cohesive fault rocks cemented by the wide-spread deposition of epidote, K-feldspar and minor chlorite dueto fluid–rock interaction along the faults, mainly predating theproduction of pseudotachylyte (Di Toro and Pennacchioni,2005). This type of epidote- and K-feldspar-bearing fault rocksare referred to as cataclasites in the following text. An ambienttemperature of 250 °C during faulting is constrained by thedevelopment of the subgreenschist facies alteration (epidote+chlorite+ titanite+plagioclase saussuritization) along faults, bythe occurrence of local crystal plastic microstructures of quartz

Fig. 1. The pseudotachylyte-bearing fault segment selected in this study. (A) The fault consists of a planar segment (to the left—also shown in Fig. 3A) and sinistralstepover (to the right) located six meters apart along the fault. (B) Along the planar fault segment an aplite dike shows a separation resulting from a coseismic slip of1.44 m. (C) Detail of injection veins ramifying off the fault into the host rock. (D) Photomosaic of the breccia welded by pseudotachylyte developed at the left stepoverof the fault. Note that the planar segment and the stepover are hosted in an non-altered host rock. Moreover, there are no clasts of altered host rock and cataclasite in theplanar segment and in the pseudotachylyte breccia.
133L. Pittarello et al. / Earth and Planetary Science Letters 269 (2008) 131–139
within some cataclasites, and by other geological constraints(Di Toro and Pennacchioni, 2004; 2005). A few fault segmentscontain only pseudotachylytes without a precursor cataclasite
Fig. 2. Comparison between a fault with pseudotachylyte associated with precursmicroscope (polarized light) images. (A) Dark layers of cataclasite (cc) flank either sdeformation and a pervasive to complete alteration of the magmatic biotite (brownplagioclase altered to saussurite. (B) Pseudotachylyte vein within unaltered tonalite. Tand a “clean” plagioclase free of dusty alteration to saussurite. (C) Magmatic biotitetitanite (dark grains) inside the altered tonalite. (D) Typical biotite in the fresh tonal
and, therefore, they record a single seismic slip event. Thesingle-jerk nature of these fault segments is corroborated byseveral field (Fig. 1) and microstructural evidences (Fig. 2):
or cataclasite and a fault with only pseudotachylyte. All pictures are opticalides of a pseudotachylyte vein (pt). The wall rock tonalite shows diffuse brittlein color) to chlorite (green: inset C). The dusty gray zones of the tonalite arehe wall rock of the pseudotachylyte vein shows unaltered biotite (brown: inset D)(bt: brown in color) extensively pseudomorphosed into chlorite (chl: green) andite.

134 L. Pittarello et al. / Earth and Planetary Science Letters 269 (2008) 131–139
(1) the pseudotachylyte vein occur in contact with intact tonaliteand it is not flanked by the cataclasite; (2) the host rock of thepseudotachylyte does not show the pervasive alteration ofbiotite (transformed to chlorite+ titanite) and feldspar (saussur-itized) which is instead typical of tonalite adjacent to cataclasite(Di Toro and Pennacchioni, 2005); (3) the pseudotachylyte doesnot contain clasts of cataclasite, which are common in pseudo-tachylyte associated with cataclasite, and (4) the pseudotachy-lyte form a single vein and there is no sign of multiple meltingepisodes; the zoning features of the vein are symmetric andreferable to the cooling of the vein (chilled margin: Di Toro andPennacchioni, 2004). The observations at points (2) and (3)apparently exclude that cataclasite was produced first and then itwas completely consumed by frictional melting in the selectedpseudotachylyte-bearing fault segments. One of these pseudo-tachylyte-bearing, cataclasite-free faults was selected for studyand two separate portions of the faults (including a planarsegment and a contractional stepover) are shown in Fig. 1. Theplanar fault segment crosscuts an aplite dyke and this allows the
Fig. 3. Pseudotachylyte-bearing fault segment and microstructures in the pseudotachestimate of frictional heat (see Fig. 1). The arrow indicates the location of samplepseudotachylyte zooming in on type 1 (zoned) fragmented clasts. The boxes in the diffconsists of clasts suspended in a glassy-like matrix (B: optical microscope, polarizrespectively, in BSE SEM images (C). The plagioclase clasts show an internal fraboundaries drawn from the photo is shown on the right of the photo. In the BSE FESequence of microphotos (similar as in B–E) in a pseudotachylyte zooming in on tyunder high magnification in the BSE FE-SEM image (I).
fault slip to be estimated. The seismic slip of 1.44 m can beestimated from the measured separation of the aplite dykecrosscut by the fault (Fig. 1). This amount of slip is roughlyconsistent with a M6–M7 earthquake (Sibson, 1989).
4. Field and microstructural data from the selectedfault segment
The use of Eqs. (2) and (3) to estimate the energy budgetpartitioning from the exhumed fault requires the determination ofboth field andmicrostructural quantities from the pseudotachylyte-bearing fault. The average pseudotachylyte thickness w appearingin Eq. (2) is determined from field analysis. The new surface area(ASZ+ADZ) produced during seismic slip, used to estimate theUs,is determined from microstructural analysis. Below it is explainedhow w and ASZ were estimated in the selected fault segment, andwhy ADZ can be assumed negligible. The parameters appearing inEqs. (2) and (3), that are not a direct outcome of measurements ofthe current study, will be commented in the discussion section.
ylyte. (A) Sketch of the pseudotachylyte-bearing fault segment selected for thes used for the microstructural analyses. (B–E) Sequence of microphotos in aerent photos show the location of the next photo on the left. The pseudotachylyteed light), consisting of quartz and plagioclase of a black and light gray color,gmentation well evident in BSE SEM images (D). The network of fragment-SEM image (E) the fragments are zoned with lighter Ca-enriched rims. (F–I)pe 2 fragmented clasts. Note that plagioclase fragments do not show any zoning
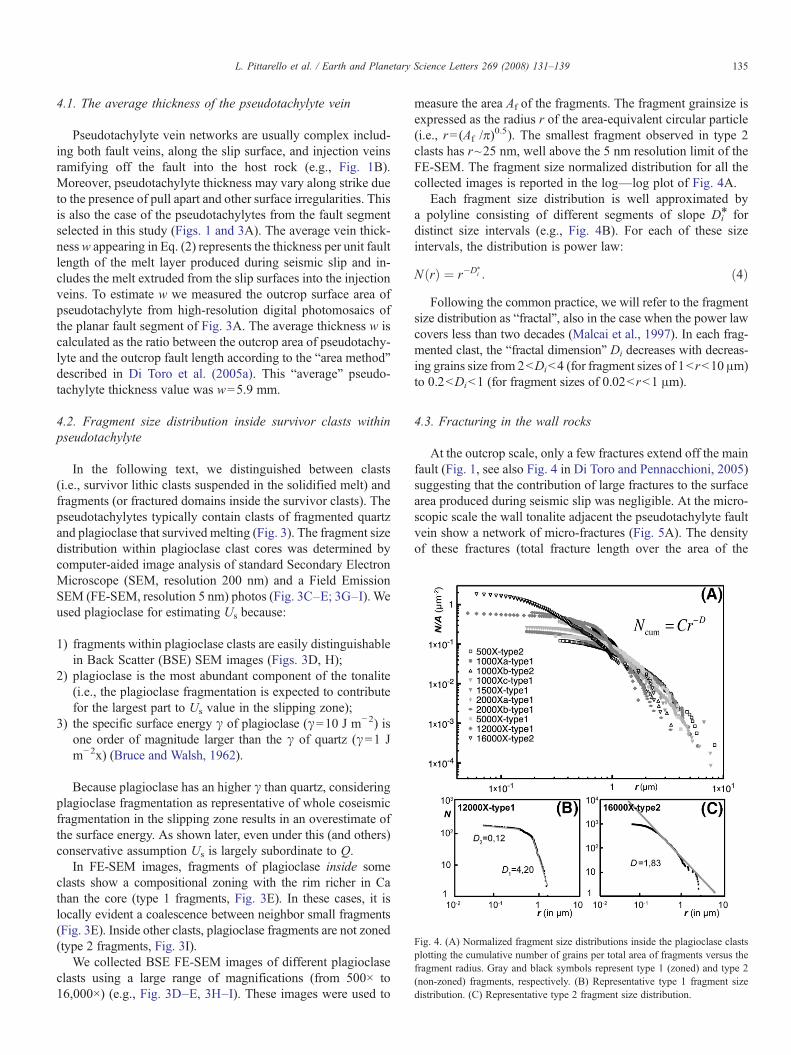
Fig. 4. (A) Normalized fragment size distributions inside the plagioclase clastsplotting the cumulative number of grains per total area of fragments versus thefragment radius. Gray and black symbols represent type 1 (zoned) and type 2(non-zoned) fragments, respectively. (B) Representative type 1 fragment sizedistribution. (C) Representative type 2 fragment size distribution.
135L. Pittarello et al. / Earth and Planetary Science Letters 269 (2008) 131–139
4.1. The average thickness of the pseudotachylyte vein
Pseudotachylyte vein networks are usually complex includ-ing both fault veins, along the slip surface, and injection veinsramifying off the fault into the host rock (e.g., Fig. 1B).Moreover, pseudotachylyte thickness may vary along strike dueto the presence of pull apart and other surface irregularities. Thisis also the case of the pseudotachylytes from the fault segmentselected in this study (Figs. 1 and 3A). The average vein thick-nessw appearing in Eq. (2) represents the thickness per unit faultlength of the melt layer produced during seismic slip and in-cludes the melt extruded from the slip surfaces into the injectionveins. To estimate w we measured the outcrop surface area ofpseudotachylyte from high-resolution digital photomosaics ofthe planar fault segment of Fig. 3A. The average thickness w iscalculated as the ratio between the outcrop area of pseudotachy-lyte and the outcrop fault length according to the “area method”described in Di Toro et al. (2005a). This “average” pseudo-tachylyte thickness value was w=5.9 mm.
4.2. Fragment size distribution inside survivor clasts withinpseudotachylyte
In the following text, we distinguished between clasts(i.e., survivor lithic clasts suspended in the solidified melt) andfragments (or fractured domains inside the survivor clasts). Thepseudotachylytes typically contain clasts of fragmented quartzand plagioclase that survived melting (Fig. 3). The fragment sizedistribution within plagioclase clast cores was determined bycomputer-aided image analysis of standard Secondary ElectronMicroscope (SEM, resolution 200 nm) and a Field EmissionSEM (FE-SEM, resolution 5 nm) photos (Fig. 3C–E; 3G–I). Weused plagioclase for estimating Us because:
1) fragments within plagioclase clasts are easily distinguishablein Back Scatter (BSE) SEM images (Figs. 3D, H);
2) plagioclase is the most abundant component of the tonalite(i.e., the plagioclase fragmentation is expected to contributefor the largest part to Us value in the slipping zone);
3) the specific surface energy γ of plagioclase (γ=10 J m−2) isone order of magnitude larger than the γ of quartz (γ=1 Jm−2x) (Bruce and Walsh, 1962).
Because plagioclase has an higher γ than quartz, consideringplagioclase fragmentation as representative of whole coseismicfragmentation in the slipping zone results in an overestimate ofthe surface energy. As shown later, even under this (and others)conservative assumption Us is largely subordinate to Q.
In FE-SEM images, fragments of plagioclase inside someclasts show a compositional zoning with the rim richer in Cathan the core (type 1 fragments, Fig. 3E). In these cases, it islocally evident a coalescence between neighbor small fragments(Fig. 3E). Inside other clasts, plagioclase fragments are not zoned(type 2 fragments, Fig. 3I).
We collected BSE FE-SEM images of different plagioclaseclasts using a large range of magnifications (from 500× to16,000×) (e.g., Fig. 3D–E, 3H–I). These images were used to
measure the area Af of the fragments. The fragment grainsize isexpressed as the radius r of the area-equivalent circular particle(i.e., r=(Af /π)
0.5). The smallest fragment observed in type 2clasts has r~25 nm, well above the 5 nm resolution limit of theFE-SEM. The fragment size normalized distribution for all thecollected images is reported in the log—log plot of Fig. 4A.
Each fragment size distribution is well approximated bya polyline consisting of different segments of slope Di⁎ fordistinct size intervals (e.g., Fig. 4B). For each of these sizeintervals, the distribution is power law:
N rð Þ ¼ r�D⁎i : ð4Þ
Following the common practice, we will refer to the fragmentsize distribution as “fractal”, also in the case when the power lawcovers less than two decades (Malcai et al., 1997). In each frag-mented clast, the “fractal dimension” Di decreases with decreas-ing grains size from 2bDib4 (for fragment sizes of 1brb10 μm)to 0.2bDib1 (for fragment sizes of 0.02brb1 μm).
4.3. Fracturing in the wall rocks
At the outcrop scale, only a few fractures extend off the mainfault (Fig. 1, see also Fig. 4 in Di Toro and Pennacchioni, 2005)suggesting that the contribution of large fractures to the surfacearea produced during seismic slip was negligible. At the micro-scopic scale the wall tonalite adjacent the pseudotachylyte faultvein show a network of micro-fractures (Fig. 5A). The densityof these fractures (total fracture length over the area of the
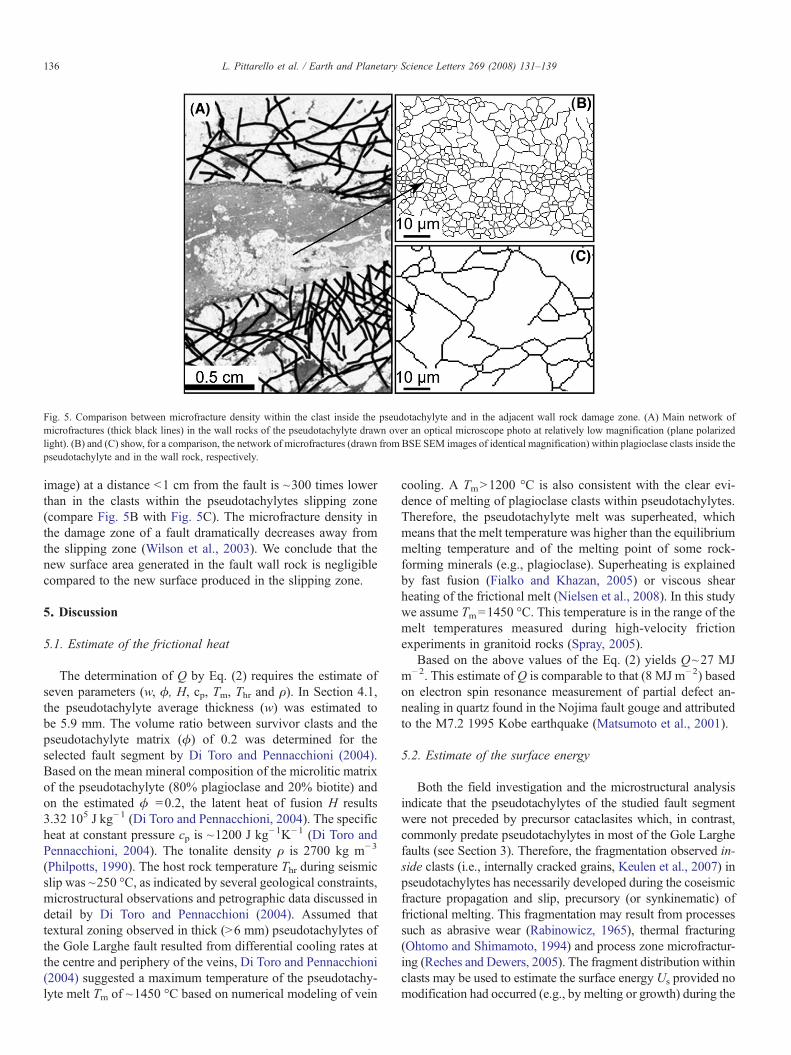
Fig. 5. Comparison between microfracture density within the clast inside the pseudotachylyte and in the adjacent wall rock damage zone. (A) Main network ofmicrofractures (thick black lines) in the wall rocks of the pseudotachylyte drawn over an optical microscope photo at relatively low magnification (plane polarizedlight). (B) and (C) show, for a comparison, the network of microfractures (drawn from BSE SEM images of identical magnification) within plagioclase clasts inside thepseudotachylyte and in the wall rock, respectively.
136 L. Pittarello et al. / Earth and Planetary Science Letters 269 (2008) 131–139
image) at a distance b1 cm from the fault is ~300 times lowerthan in the clasts within the pseudotachylytes slipping zone(compare Fig. 5B with Fig. 5C). The microfracture density inthe damage zone of a fault dramatically decreases away fromthe slipping zone (Wilson et al., 2003). We conclude that thenew surface area generated in the fault wall rock is negligiblecompared to the new surface produced in the slipping zone.
5. Discussion
5.1. Estimate of the frictional heat
The determination of Q by Eq. (2) requires the estimate ofseven parameters (w, ϕ, H, cp, Tm, Thr and ρ). In Section 4.1,the pseudotachylyte average thickness (w) was estimated tobe 5.9 mm. The volume ratio between survivor clasts and thepseudotachylyte matrix (ϕ) of 0.2 was determined for theselected fault segment by Di Toro and Pennacchioni (2004).Based on the mean mineral composition of the microlitic matrixof the pseudotachylyte (80% plagioclase and 20% biotite) andon the estimated ϕ =0.2, the latent heat of fusion H results3.32 105 J kg−1 (Di Toro and Pennacchioni, 2004). The specificheat at constant pressure cp is ~1200 J kg−1K−1 (Di Toro andPennacchioni, 2004). The tonalite density ρ is 2700 kg m−3
(Philpotts, 1990). The host rock temperature Thr during seismicslip was ~250 °C, as indicated by several geological constraints,microstructural observations and petrographic data discussed indetail by Di Toro and Pennacchioni (2004). Assumed thattextural zoning observed in thick (N6 mm) pseudotachylytes ofthe Gole Larghe fault resulted from differential cooling rates atthe centre and periphery of the veins, Di Toro and Pennacchioni(2004) suggested a maximum temperature of the pseudotachy-lyte melt Tm of ~1450 °C based on numerical modeling of vein
cooling. A TmN1200 °C is also consistent with the clear evi-dence of melting of plagioclase clasts within pseudotachylytes.Therefore, the pseudotachylyte melt was superheated, whichmeans that the melt temperature was higher than the equilibriummelting temperature and of the melting point of some rock-forming minerals (e.g., plagioclase). Superheating is explainedby fast fusion (Fialko and Khazan, 2005) or viscous shearheating of the frictional melt (Nielsen et al., 2008). In this studywe assume Tm=1450 °C. This temperature is in the range of themelt temperatures measured during high-velocity frictionexperiments in granitoid rocks (Spray, 2005).
Based on the above values of the Eq. (2) yields Q~27 MJm−2. This estimate of Q is comparable to that (8 MJ m−2) basedon electron spin resonance measurement of partial defect an-nealing in quartz found in the Nojima fault gouge and attributedto the M7.2 1995 Kobe earthquake (Matsumoto et al., 2001).
5.2. Estimate of the surface energy
Both the field investigation and the microstructural analysisindicate that the pseudotachylytes of the studied fault segmentwere not preceded by precursor cataclasites which, in contrast,commonly predate pseudotachylytes in most of the Gole Larghefaults (see Section 3). Therefore, the fragmentation observed in-side clasts (i.e., internally cracked grains, Keulen et al., 2007) inpseudotachylytes has necessarily developed during the coseismicfracture propagation and slip, precursory (or synkinematic) offrictional melting. This fragmentation may result from processessuch as abrasive wear (Rabinowicz, 1965), thermal fracturing(Ohtomo and Shimamoto, 1994) and process zone microfractur-ing (Reches and Dewers, 2005). The fragment distribution withinclasts may be used to estimate the surface energy Us provided nomodification had occurred (e.g., by melting or growth) during the

137L. Pittarello et al. / Earth and Planetary Science Letters 269 (2008) 131–139
high temperature stages of the seismic slip. This is probably truefor type 2 fragments, which are not zoned.
The size distributions of both type 1 and type 2 fragmentsshow a kink at about r=1 μmwhich is also observed in clast sizedistributions of feldspar within experimental cracked grainsproduced in granitoid rocks at 300 °C and in the absence offrictional melting (Heilbronner and Keulen, 2006; Keulen et al.,2007). This kink is probably related to a change in the defor-mationmechanism from brittle to plastic deformation at a criticalgrain size (rcrit) as demonstrated by Kendall (1978). Accordingto the equation by Kendall (1978):
rcrit ¼ 16 E g
3 Y 2ð5Þ
where E is the Young modulus (80 GPa), γ is the specific surfaceenergy and Y is the yield strength (2.17 GPa) the calculated criticalgrain size is 0.9 μm (values for plagioclase with anorthitecomposition, Bass 1995). This value corresponds to the grain sizeat which the kink occurs in the studied fragment size distribution.
The above distribution is different from those observed innatural (Shimamoto and Nagahama, 1992) and experimental(Tsutsumi, 1999) pseudotachylytes that show a change in slopeat larger clast sizes (5–10 μm) and have been interpreted toresult from preferential melting of the finest particles (Shima-moto and Nagahama, 1992). The kinking of the fragment sizedistribution for grain sizes is (i) similar to that measured(~1 μm) in cracked grains in the absence of frictional meltingand (ii) smaller than that measured (~5–10 μm) in the presenceof melting. This suggests that the studied distributions were notstrongly affected by melting.
Kinking in the distribution is more marked for type 1 than fortype 2 fragments, with Di values ranging from larger than 3 (forr≥1 μm) to less than 1 (for rb1 μm) (e.g., Fig. 4B). These Di
values are anomalous for standard fragmentation processes givingrise typically to two-dimensional D in the range of 1–2 (Sammiset al., 1986; Sammis andKing, 2007). The presence of zoning andcoalescence of type 1 fragments suggests that the type 1 fragmentdistribution may have been modified by growth, which likelyoccurred during the high temperature stages of cooling of thefrictional melt embedding the clasts. The anorthite-rich composi-tion and average thickness (~0.4 μm) of the rims of type 1fragments is consistent with growth under superheated conditionsof the friction-induced melt. The growth of these narrow rims hasa strong effect on the size distribution. The number of finerfragments (b1 μm) decreases because of coalescence and resultsin the relatively low values (Di~0.12 in Fig. 4B) (Sammis andBen-Zion, in press). Instead, coalescence has the effect ofincreasing the number of fragments of grain size around 1 μm.The effect of the growth of the submicron-thick rims becomesmore and more negligible with increasing fragment size (N1 μm).As a result, there is an increase in the Di value (e.g. Di=4.20, inFig. 4B) in the size range of 1–10 μm.
The fragments of some plagioclase clast cores do not show anyevidence of zoning or melting (type 2 fragments) and, therefore,they were probably not affected during the high temperaturestages of the frictional process. The fragments size distribution intype 2 clasts is well approximated by a power law distribution
withDi~1.8 (Fig. 4C) for most of the fragment size range, exceptfor the coarsest and finest fragments. This geometry of thedistribution curve at the two extreme ends of distribution dependson an implicit limit of the grain size analysis method that leads tounderestimate both the largest and smaller fragments. To correctthe measured fragment size distribution from this artifact we haveconsidered the size distribution as fractal, with a D~1.8 (typicalfor most of the grain sizes determined in this study) extended overthe full range of observed fragment dimensions: 0.025–10 μm.This assumption, disregarding the grinding limit of the distribu-tion, is conservative in the sense that by overestimating thenumber of the finest particles, it results in an overestimate of thetotal surface area and surface energy.
The corrected fragment distribution within type 2 clast maybe assumed to represent the relict pristine microstructureproduced during seismic fracture propagation and slip and isused to estimate Us over the whole volume of pseudotachylyte.To estimate the total surface energy from measured fragmentsize distribution the 2-dimensional D of the distribution curvemust be converted to the 3-dimensional D3Daccording to theequation (Bonnet et al., 2001):
D⁎ ¼ Dþ DV ð6Þwhere D′ is a real number in the range (0,1). It follows that D⁎
is in a range of 1.83–2.83.The total surface area of the fragments in the image area
(AimageSZi) can be calculated from the distribution curve as the
integral:
AimageSZi ¼
Z ri maxð Þ
r minð Þ4p r2 dNc
4p CD⁎i2� D⁎i
r2�D⁎
i
i maxð Þ � r2�D⁎
i
i minð Þ� �
ð7Þ
where the ri(max) and ri(min) are the lower and upper size of thefragments (0.025 μm and 8.32 μm respectively) and C (33.69) isthe ordinate axis-intercept of the straight line approximating thedistribution. The resulting Aimage
SZi is in the range 4.08 103–3.02 104 μm2.
To determineASZ (total surface of the fragments in the slippingzone for unit fault area), we determined how many times n thevolume VimageSZi of the fragments (assumed as spherical) isincluded in the slipping zone VSZ (in the studied fault segment,VSZ=w·1 m2=5.9 10−3 m3). From the fragment distribution(Eq. (4)):
V imageSZi ¼
Z ri maxð Þ
ri minð Þ
43p r3 dNc
4pC D⁎i3 3� D⁎ið Þ r
3�DTi
i maxð Þ � r3�DT
i
i minð Þ� �
ð8Þand
n ¼ VSZ
V imageSZi
ð9Þ
For the considered distribution and given the D⁎ valuesestimated above the equations yield Vimage
SZi in the range of2.64 103−2.11 103 μm3 and n=2.24 1012–2.80 1012.
The specific surface energy γ for plagioclase is 10 J m−2
(Bruce andWalsh, 1962). According to Eq. (3), the surface energy
138 L. Pittarello et al. / Earth and Planetary Science Letters 269 (2008) 131–139
in the slipping zone Us_SZ can be estimated in the range of 0.10–0.85 MJ m−2. As discussed in Section 4.3, the contribution in thenew surface area from fractures in the host rock is negligiblecompared to fragmentation measured in the slipping zone andUs_SZ can be taken as a good approximation of the total surfaceenergy dissipated during seismic slip along the studied faultsegment located at 10 km depth.
6. Conclusions
The above estimates indicate that the surface energy 0.10–0.85 MJ m−2 was negligible compared to Q (~27 MJ m−2), and,from Eq. (1), Ef≈Q and Us/Q≈0.004 to 0.03. It follows that, insilica-built rocks and at the nucleation depth (~10 km) of theearthquake analyzed here, the surface energy was less than 3% ofthe total mechanical work Ef and most of the energy absorbed onthe fault was dissipated as frictional heat. However, in the case ofseismic ruptures propagating at very shallow depths (b2 km, theBosman Fault, South Africa, Reches and Dewers, 2005; theMojave section of the San Andreas Fault, Dor et al., 2006) theamount of surface energy could be larger.
The small values forUs/Q are consistent with those determinedin low-velocity friction experiments (Us/Qb0.1%, Yoshioka,1986) and in industrial milling and grinding processes (Us/Qb1%, Harris, 1966).
How does Us relates to the seismological determined fractureenergy G? Di Toro et al. (2005b) found GN8 MJ m−2 to sustainrupture propagation in the case of the fault segment shown in Fig. 1.Therefore, our estimates indicate thatUs is negligible compared toG. These estimates corroborate the interpretation that most offracture energy is actually dissipated as heat. For this reason Tintiet al. (2005) and Cocco et al. (2006) defined the fracture energy asbreakdown work, being the only portion of Ef that is measurablethrough seismological analyses. However, we point out that theestimates determined in the present study arise from field obser-vations and microstructural studies and not from theoreticalpredictions.
There is another original contribution in the present study. Thesurface energy Us is estimated for a single seismic rupture (i.e., asingle earthquake) and the inferred value is consistent with themean of Us values estimated for an a priori assumed number ofseismic ruptures in exhumed strands of the San Andreas Faultsystem (Chester et al., 2005). In other words, the main advantageof using pseudotachylytes to infer the energy partitioning duringan earthquake is that it allows the absolute values of both Q andUs to be estimated independently and for a single seismic rupture.We believe that the energies estimated in the present study areuseful for the understanding of the earthquake energy balance, atleast at earthquake nucleation depths of about 10 km, and theyprovide a reliable measure of the order of magnitude of the wholemechanical work absorbed during earthquake ruptures.
Acknowledgments
F. Mulargia, S. Nielsen, Z. Reches, P. Spudich and E. Tintiare thanked for discussions. An anonymous reviewer is thankedfor his constructive comments. INGV, JEOL and ZEISS are
thanked for collecting FE-SEM images. A. Novello and L.Tauro are thanked for sample preparation. The costs of thisstudy were covered by grants from the Università degli Studi diPadova (Progetto di Ateneo 2003), INGV 2006, MUR 2006–2007 and CARIPARO. J. Hadizadeh was supported by NSF-Earth 0229654 during the course of this study. Image analysiswas conducted with SXM Image.
References
Abercrombie, R., McGarr, A., Di Toro, G., Kanamori, H., 2006. Earthquakes:Radiated Energy and the Physics of Faulting, Geophysical MonographSeries, vol. 170. American Geophysical Union, Washington, D.C. ISBN:978-0-87590-435-1, pp. 1–327.
Bass, J.D., 1995. Elasticity of minerals, glasses and melts. In: Ahrens, T. (Ed.),A Handbook of Physical Constants. Mineral Physics and Crystallography,AGU Reference Shelf 2, Washington D.C., pp. 45–63.
Bonnet, E., Bour, O., Odling, N.E., Davy, P., Main, I., Cowie, P., Berkowitz, B.,2001. Scaling of fracture systems in geological media. Rev. Geophys. 39,347–383.
Bruce, W.F., Walsh, J.B., 1962. Some direct measurements of the surface energyof quartz and orthoclase. Am. Mineral. 47, 1111–1122.
Chester, J.S., Chester, F.M., Kronenberg, A.K., 2005. Fracture surface energy ofthe Punchbowl Fault, San Andreas System. Nature 437, 133–136.
Cocco,M., Spudich, P., Tinti, E., 2006. On themechanical work absorbed on faultsduring earthquake ruptures. In: Abercrombie, R.E.,McGarr, A., Kanamori, H.,Di Toro, G. (Eds.), Radiated Energy and the Physics of Earthquake Faulting,AGU Monograph Series 170, Washington D.C., pp. 237–254.
Cowan, D.S., 1999. Do faults preserve a record of seismic faulting? A fieldgeologist's opinion. J. Struct. Geol. 21, 995–1001.
Di Toro, G., Pennacchioni, G., 2004. Superheated friction-induced melts inzoned pseudotachylytes within the Adamello tonalites (Italian SouthernAlps). J. Struct. Geol. 26, 1783–1801.
Di Toro, G., Pennacchioni, G., 2005. Fault plane processes and mesoscopicstructure of a strong-type seismogenic fault in tonalites (Adamello batholith,Southern Alps). Tectonophysics 402, 54–79.
Di Toro, G., Hirose, T., Nielsen, S., Shimamoto, T., 2006. Relating high-velocityrock friction experiments to coseismic slip in the presence of melts. In:Abercrombie, R., McGarr, A., Kanamori, H., Di Toro, G. (Eds.), RadiatedEnergy and the Physics of Faulting, Geophysical Monograph Series,vol. 170. American Geophysical Union, Washington, D.C., pp. 121–134.
Di Toro, G., Pennacchioni, G., Teza, G., 2005a. Can pseudotachylytes be used toinfer earthquake source parameters? An example of limitations in the studyof exhumed faults. Tectonophysics 402, 3–20.
Di Toro, G., Nielsen, S., Pennacchioni, G., 2005b. Earthquake dynamics frozenin exhumed ancient faults. Nature 436, 1009–1012.
Dor, O., Ben-Zion, Y., Rockwell, T.K., Brune, J., 2006. Pulverized Rocks in theMojave section of the San Andreas Fault Zone. Earth Planet. Sci. Lett. 245,642–654. doi:10.1016/j.epsl.2006.03.034, 2006.
Fialko, Y., Khazan, Y., 2005. Fusion by earthquake fault friction: stick or slip?J. Geophys. Res. 110. doi:10.1029/2005JB003869.
Harris, C.C., 1966. On the role of energy in comminution: a review of physicaland mathematical principles. Trans. Inst. Min. Metall. C 75 C37–C56.
Heilbronner, R., Keulen, N., 2006. Grain size and grain shape analysis of faultrocks. Tectonophysics 427, 199–216.
Kanamori, H., Heaton, T.H., 2000. Microscopic and macroscopic physics ofearthqukes. In: Rundle, J., Turcotte, D.L., Klein, W. (Eds.), GeoComplexityand the Physics of Earthquakes, AGU Monograph Series 120, WashingtonD.C., pp. 147–163.
Kanamori, H., Rivera, L., 2006. Energy Partitioning During an Earthquake,AGU Monograph Series 170, Washington D.C., pp. 3–14.
Kendall, K., 1978. The impossibility of comminuting small particles bycompression. Nature 272, 710–711.
Keulen, N., Heilbronner, R., Stünitz, H., Boullier, A.-M., Ito, H., 2007. Grain sizedistributions of fault rocks: a comparison between experimentally andnaturally deformed granitoids. J. Struct. Geol. doi:10.1016/j.jsg.2007.04.003..
139L. Pittarello et al. / Earth and Planetary Science Letters 269 (2008) 131–139
Kostrov, B., Das, S., 1988. Principles of Earthquake Source Mechanics.Cambridge University Press, London.
Li, V.C., 1987. Mechanics of shear rupture applied to earthquake zones. In:Atkinson, B.K. (Ed.), Fracture Mechanics of Rocks 2nd edn. Academic,London, pp. 351–428.
Ma, K.F., Song, S.R., Tanaka, H., Wang, C.Y., Hung, J.H., Tsai, Y.B., Mori, J.,Song, Y.F., Yeh, E.C., Sone, H., Kuo, L.W., Wu, H.Y., 2006. Slip zone andenergetics of a large earthquake from the Taiwan Chelungpu-fault DrillingProject (TCDP). Nature 444, 473–476.
Malcai, O., Lidar, D.A., Biham, O., Avnir, D., 1997. Scaling range and cutoffs inempirical fractals. Phys. Rev. E 56, 2817–2828.
Matsumoto, H., Yamanaka, C., Ikeya, M., 2001. ESR analysis of the Nojimafault gouge, Japan, from the DPRI 500 m borehole. Isl Arc 10, 479–485.
Nielsen, S., Di Toro, G., Hirose, T., Shimamoto, T., 2008. Frictional Melt andSeismic Slip. J. Geophys. Res. 113. doi:10.1029/2007JB005122 B01308.
Ohtomo, Y., Shimamoto, T., 1994. Significance of thermal fracturing in thegeneration of fault gouge during rapid fault motion: an experimentalverification (in Japanese with English abstract). Struct. Geol. 39, 35–44.
Pennacchioni, G., Di Toro, G., Brack, P., Menegon, L., Villa, I.M., 2006.Brittle–ductile–brittle deformation during cooling of tonalite (Adamello,Southern Italian Alps). Tectonophysics 427, 171–197.
Philpotts, A.R., 1990. Principles of Igneous and Metamorphic Petrology.Prentice Hall, Englewood Cliffs, New Jersey.
Rabinowicz, E., 1965. Friction and Wear of Materials. John Wiley, New York.Reches, Z., Dewers, T.A., 2005. Gouge formation by dynamic pulverization
during earthquake rupture. Earth Planet. Sci. Lett. 235, 361–374.Rice, J.R., Sammis, C.G., Parsons, R., 2005. Off-fault secondary failure induced
by a dynamic slip–pulse. Bull. Seismol. Soc. Am. 95, 109–134.Sammis, C.G., King, G.C.P., 2007.Mechanical origin of power law scaling in fault
zone rock. Geophys. Res. Lett. 34. doi:10.1029/2006GL028548 L04312.Sammis, C.G., Ben-Zion, Y., in press. Mechanics of grain-size reduction in fault
zones. J. Geophys. Res. 113. doi:10.1029/2006JB004892.
Sammis, C.G., Osborne, R.H., Anderson, J.L., Banerdt, M., White, P., 1986.Self-similar cataclasis in the formation of fault gouge. Pure Appl. Geophys.124, 53–78.
Shimamoto, T., Nagahama, H., 1992. An argument against the crush origin ofpseudotachylytes based on the analysis of clast size distribution. J. Struct.Geol. 14, 999–1006.
Sibson, R.H., 1975. Generation of pseudotachylyte by ancient seismic faulting.Geophys. J. R. Astron. Soc. 43, 775–794.
Sibson, R.H., 1989. Earthquake faulting as a structural process. J. Struct. Geol.11, 1–14.
Spray, J.G., 1995. Pseudotachylyte controversy: fact or friction? Geology 23,1119–1122.
Spray, J.G., 2005. Evidence for melt lubrication during large earthquakes.Geophys. Res. Lett. 32. doi:10.1029/2004GL022293.
Spudich, P., Guatteri, M., Otsuki, K., Minagawa, J., 1998. Use of fault striationsand dislocations models to infer tectonic shear stress during the 1995Hyogo-ken (Kobe) earthquake. Bull. Seism. Soc. Am. 88, 413–427.
Tinti, E., Spudich, P., Cocco, M., 2005. Earthquake fracture energy inferredfrom kinematic rupture models on extended faults. J. Geophys. Res. 110.doi:10.1029/2005JB003644 B12303.
Tsutsumi, A., 1999. Size distribution of clasts in experimentally producedpseudotachylyte. J. Struct. Geol. 21, 305–312.
Wilson, J.E., Chester, J.S., Chester, F.M., 2003. Microfracture analysis of faultgrowth and wear processes, Punchbowl Fault, San Andreas system,California. J. Struct. Geol. 25, 1855–1873.
Wilson, B., Dewers, T., Reches, Z., Brune, J., 2005. Particle size and energeticsof gouge from earthquake rupture zones. Nature 434, 749–752.
Yoshioka, N., 1986. Fracture energy and the variation of gouge and surfaceroughness during frictional sliding of rocks. J. Phys. Earth 34, 335–355.