Energy control strategies for the Fuel Cell Hybrid Power Source under unknown load profile
35
http://dx.doi.org/10.1016/j.energy.2015.03.118 Energy control strategies for the Fuel Cell Hybrid Power Source under unknown load profile Nicu Bizon 1)2) , Marin Radut 1)2) , Mihai Oproescu 1) , 1) University of Pitesti, 1 Targu din Vale, Arges, 110040 Pitesti, Romania 2) University Politehnica of Bucharest, 313 Splaiul Independentei, 060042 Bucharest, Romania Tel +40 348 453 201, Fax +40 348 453 200; [email protected], [email protected] Abstract: Four new energy control strategies are proposed here for the Fuel Cell Hybrid Power Source (FCHPS) used in stationary and mobile FC application (such as the FC backup source for a smart-house and FC vehicle, respectively) based on the Load Following (LF) control and Maximum Efficiency Point Tracking (MEPT) control of the fueling rates. The LF control approach is used to design simple strategies of the Energy Management Unit (EMU) that will assure a charge-sustaining mode for the batteries stack of the Energy Storage System (ESS). If a fueling rate is controlled based on the LF strategy, then the other is controlled based on MEPT strategy in order to maximize the FC net power available. The advantages of the proposed EMU strategies during an unknown load cycle are comparatively shown. Keywords: Fuel cell; Maximum Efficiency Point Tracking; Unknown load cycle. 1. Introduction In last decade the FC applications try to penetrate into the specific market and the FC issues are extensively revised in [1,2], as good references to start a FC system implementation. Nevertheless, the EMU strategies for energy management and optimization are still at an early stage for the FC applications [3,4]. Consequently, it is a challenge for the designers to develop an EMU strategy to optimize the operation of FC stack [2] and increase the lifetime of FCs and
Transcript of Energy control strategies for the Fuel Cell Hybrid Power Source under unknown load profile
http://dx.doi.org/10.1016/j.energy.2015.03.118
Energy control strategies for the Fuel Cell Hybrid Power Source under unknown load profile
Nicu Bizon1)2)
, Marin Radut1)2)
, Mihai Oproescu1)
,
1)University of Pitesti, 1 Targu din Vale, Arges, 110040 Pitesti, Romania
2)University Politehnica of Bucharest, 313 Splaiul Independentei, 060042 Bucharest, Romania
Tel +40 348 453 201, Fax +40 348 453 200; [email protected], [email protected]
Abstract: Four new energy control strategies are proposed here for the Fuel Cell Hybrid Power
Source (FCHPS) used in stationary and mobile FC application (such as the FC backup source for
a smart-house and FC vehicle, respectively) based on the Load Following (LF) control and
Maximum Efficiency Point Tracking (MEPT) control of the fueling rates. The LF control
approach is used to design simple strategies of the Energy Management Unit (EMU) that will
assure a charge-sustaining mode for the batteries stack of the Energy Storage System (ESS). If a
fueling rate is controlled based on the LF strategy, then the other is controlled based on MEPT
strategy in order to maximize the FC net power available. The advantages of the proposed EMU
strategies during an unknown load cycle are comparatively shown.
Keywords: Fuel cell; Maximum Efficiency Point Tracking; Unknown load cycle.
1. Introduction
In last decade the FC applications try to penetrate into the specific market and the FC issues are
extensively revised in [1,2], as good references to start a FC system implementation.
Nevertheless, the EMU strategies for energy management and optimization are still at an early
stage for the FC applications [3,4]. Consequently, it is a challenge for the designers to develop an
EMU strategy to optimize the operation of FC stack [2] and increase the lifetime of FCs and
http://dx.doi.org/10.1016/j.energy.2015.03.118
batteries [3], these being the main objectives in designing of a FCHPS. Thus, several EMU
strategies have been proposed based on the power flow balance to control the distribution of
power between the two energy sources (FC and ESS) and the load [5], but none based on the LF
control that is proposed here to optimize the size of the ESS. An equivalent consumption
minimization and a real time optimal EMU strategy based on the dynamic load strategy are
presented in [6] and [7], but the FC stack doesn’t operate close to the MEP. A MEPT strategy is
put forward here to increase the efficiency of the whole FCHPS. The power profile requested by
the equivalent load will be split into three frequency components based on the wavelet or other
filtering transformation [8,9], but this cannot be made in real-time, without increasing the control
circuit complexity. The idea to use the low frequency power component as the control reference
for the FC system (in order to protect it against sharp changes on real load cycles [8]) is very
good, but here it will be used in a different manner, which is easier to be implemented.
All strategies mentioned above were tested under standard load cycles, but in general the real
load profile is unknown. Thus, more input and state variables must be used in EMU strategy
(with expense of increasing the EMU complexity), if the LF control proposed here is not used.
For example, if both batteries and ultracapacitors stacks States-Of-Charge (SOC) are considered
and the power profile of the load cycle is unknown, then the basic rules of the fuzzy logic control
proposed in [10,11] will became too complex compared to the LF control proposed here. Note
that other two EMU strategies based on fuzzy logic controller are proposed in [10] and [12] to
include the dynamic restrictions of the power sources and regenerative braking power flow based
on new input variables considered. The LF control proposed here is based only on the load
power, so this has some advantages compared to these proposals. Thus, it is worth to mention the
two main advantages obtained based on LF control put forward here: (1) the EMU strategy is

http://dx.doi.org/10.1016/j.energy.2015.03.118
very easy to be implemented and (2) the size of battery stack is minimized (because the battery
SOC is maintained almost constant during a load cycle).
A perturbation approach to minimize the hydrogen consumption in Polymer Electrolyte
Membrane (PEM) FC systems was introduced in [2] and the main drawback of this technique
(related to the fixed values of the algorithm parameters) is solved here based on the Extremum
Seeking (ES) control scheme [13] used for the MEPT algorithm. The hydrogen consumption for
a given load current will be used as a performance indicator [14] to compare the use of the ES
control-based MEPT algorithm to other control techniques mentioned below.
It is worth mentioning that the energy efficiency of the whole FCHPS (including the power
interfaces [15]) depends on HPS architecture and battery charging ratios [16]. So, the series HPS
architecture is used here to exploit direct connection of the battery to the DC bus and other
advantages shown in [11,17-19] based on the minimization of the equivalent fuel consumption
[11], hysteresis band [17], state machine [18], or fuzzy logic control [19].
The main EMU objective is to efficiently sustain the load demand by controlling the FC power
flow. Consequently, the maximum FC power must be higher than the maximum load demand.
On the other hand, the control inputs for the LF and MEPT controllers from the fueling rates
must be determined: the air flow rate (AirFr) and the fuel flow rate (FuelFr). The LF control
based on the average (AV) power flows balance and MEPT control based on the ES control
scheme are proposed here to reduce the battery stack at minimum and operate the FC stack
efficiently. It will be shown that the hydrogen consumption under an unknown load cycle is
reduced with 12% compared to the static feed-forward (sFF) control scheme proposed in [20].
To conclude, using two controllers and two FC input rates means that four topological
combinations must to be tested here. The references for both controllers will be generated by a
http://dx.doi.org/10.1016/j.energy.2015.03.118
Single-Input Double-Output (SIDO) ES control scheme. To compare the results obtained, one of
the reference will be generated by the Single-Input Single-Output (SISO) ES control scheme and
the other will be generated by the sFF control scheme. All four configurations to fuel the FC
stack are compared based on the fuel consumption efficiency, which is the fuel consumption per
one kW of the FC net power delivered to the load.
This paper is organized as follows. Section 2 presents the FCHPS system and briefly explains the
control loops of the EMU. The experimental work performed in this study is shown in Section 3,
as follows: the four possible EMU configurations are detailed in Section 3.1 based on the power
flow balance; all the models used in simulation are briefly shown in Section 3.2; the
implementation of the EMU control loops is detailed in Section 3.3. The results obtained are
discussed and compared to other EMU strategies in Section 4. Section 5 concludes the paper.
2. FCHPS system
In this paper, a new FC fueling control strategy based on LF and MEPT control loops is
presented for the FCHPS system. It is clearly that PEMFC, due to their advantages compared to
other FC technologies (such as reduced size and weight, ease of implementation and so on
[1,21]), is the best candidate to be used in electric vehicles as a range extender [22]. Also, it is
known that the use of the FC stack under dynamic loads, as in the case of FC backup source for a
smart home, can destroy the FC stack. Consequently, the FCHPS system must include at least
one energy storage device [21, 23], which will improve the FCHPS system performance under
sharp power profile obtained when high levels are requested on the DC bus [24].
Usually, the hybrid batteries/ultracapacitors ESS topology is used [25]. The batteries used in
FCHPS have a higher specific energy than the ultracapacitors, and can sustain an extra power for
a period [24, 25]. Thus, the semi-active hybrid ESS topology based on bidirectional power
http://dx.doi.org/10.1016/j.energy.2015.03.118
convertor to the ultracapacitors stack is usually used due to the compromise of high performance
obtained (the ultracapacitors stack SOC can have the maximum available range to dynamically
compensate the power flow balance) at reduced cost (only a power converter is used) [15]. So,
this semi-active hybrid ESS topology is chosen in this paper, too.
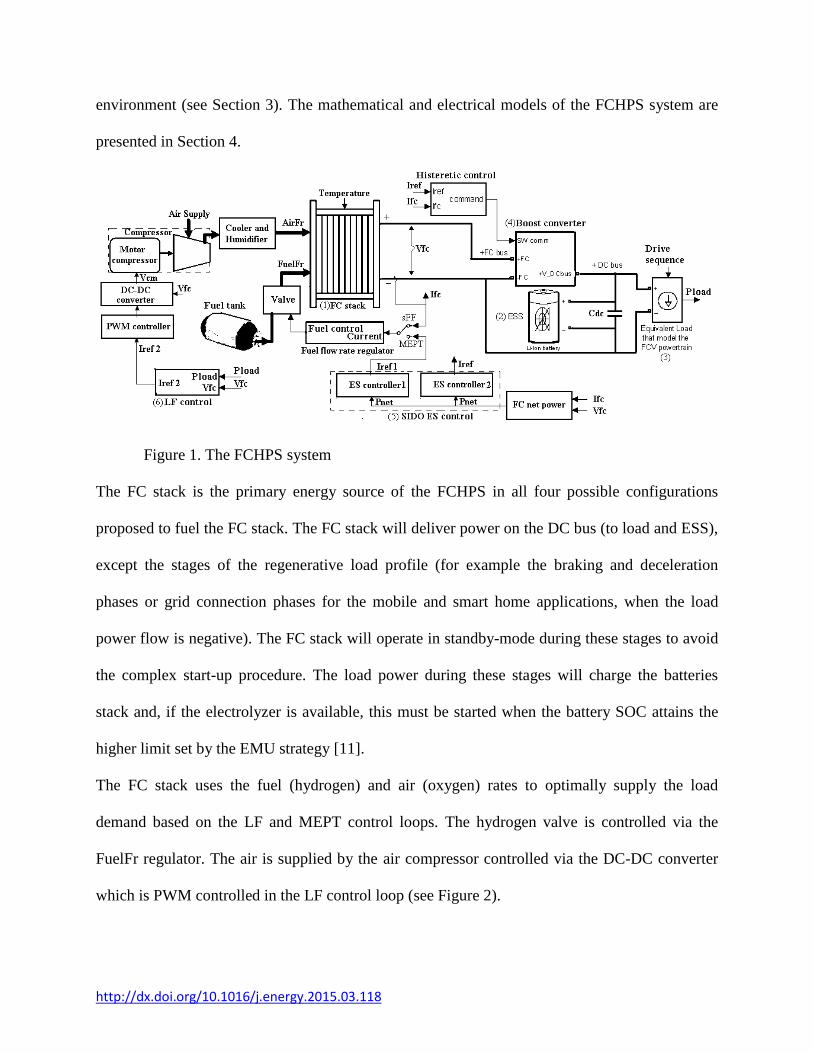
Figure 1 shows the architecture of the FCHPS system which is composed of: (1) FC stack; (2)
ESS (only the battery stack is shown in this Figure); (3) equivalent load; (4) boost converter; (5)
ES controllers which form the SIDO ES control scheme; (6) LF control block; and (7) auxiliary
services and control modules. For example, in mobile FC application (Figure 1), the traction
motor drives and the braking system are modeled by the equivalent load. If the FCHPS is used as
a backup source for a smart home (grid connected), then the equivalent load will also have an
unknown power profile. A sharp power profile will be set to test the FCHPS under all EMU
strategies proposed.
The EMU is partially shown in Figure 1 through the LF and MEPT control loops. If the switch is
on the sFF position, then the FuelFr input is classically controlled based on the sFF control
scheme [20]. If the switch is on the MEPT position, then the FuelFr input is efficiently controlled
based on the ES controller 1, having as input the FC net power (Pnet) and as output the reference
current 1 (Iref1). The second ES controller has as input the same signal, the FC net power (Pnet),
and as output the reference current (Iref) that controls the FC power flow delivered to the load via
boost power converter. The SIDO ES control scheme generates both references for the LF and
MEPT control loops, ensuring the efficient operation of the FCHPS.
In fact, the conceptual scheme presented in Figure 1 integrates both simulation diagrams shown
in Figure 2 (a and b), which are developed in detail using MATLAB – Simulink ® simulation
http://dx.doi.org/10.1016/j.energy.2015.03.118
environment (see Section 3). The mathematical and electrical models of the FCHPS system are
presented in Section 4.
Figure 1. The FCHPS system
The FC stack is the primary energy source of the FCHPS in all four possible configurations
proposed to fuel the FC stack. The FC stack will deliver power on the DC bus (to load and ESS),
except the stages of the regenerative load profile (for example the braking and deceleration
phases or grid connection phases for the mobile and smart home applications, when the load
power flow is negative). The FC stack will operate in standby-mode during these stages to avoid
the complex start-up procedure. The load power during these stages will charge the batteries
stack and, if the electrolyzer is available, this must be started when the battery SOC attains the
higher limit set by the EMU strategy [11].
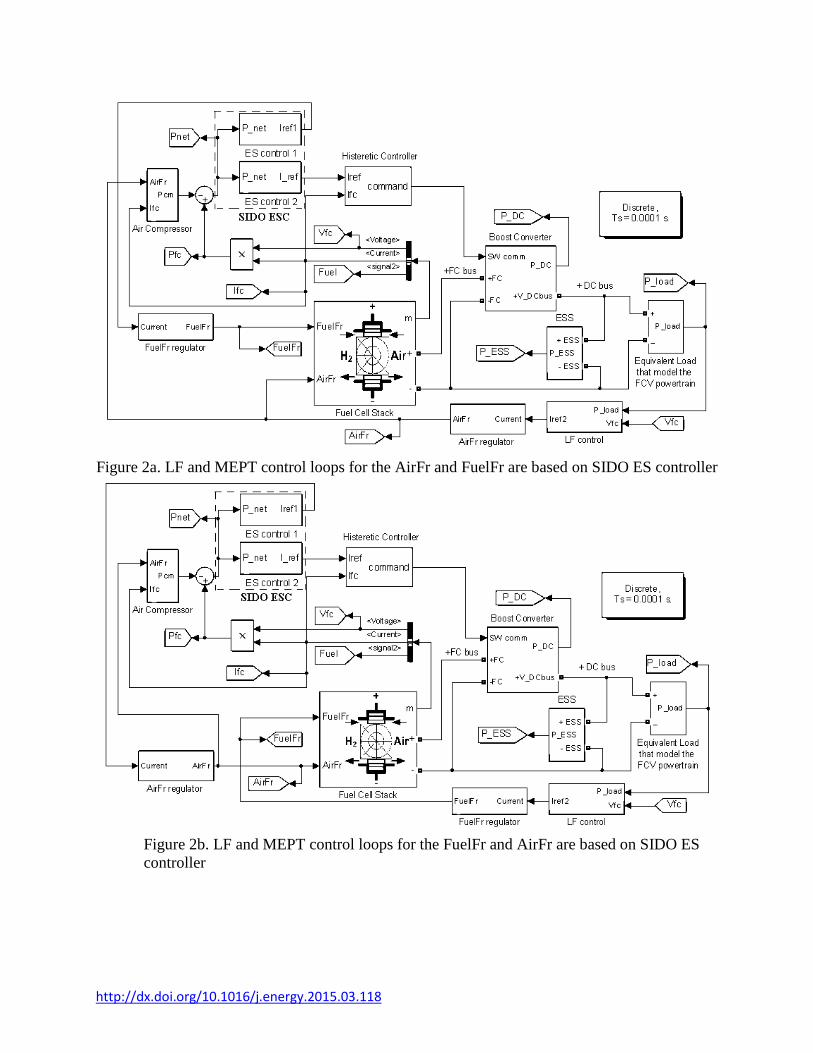
The FC stack uses the fuel (hydrogen) and air (oxygen) rates to optimally supply the load
demand based on the LF and MEPT control loops. The hydrogen valve is controlled via the
FuelFr regulator. The air is supplied by the air compressor controlled via the DC-DC converter
which is PWM controlled in the LF control loop (see Figure 2).
http://dx.doi.org/10.1016/j.energy.2015.03.118
Figure 2a. LF and MEPT control loops for the AirFr and FuelFr are based on SIDO ES controller
Figure 2b. LF and MEPT control loops for the FuelFr and AirFr are based on SIDO ES
controller
http://dx.doi.org/10.1016/j.energy.2015.03.118
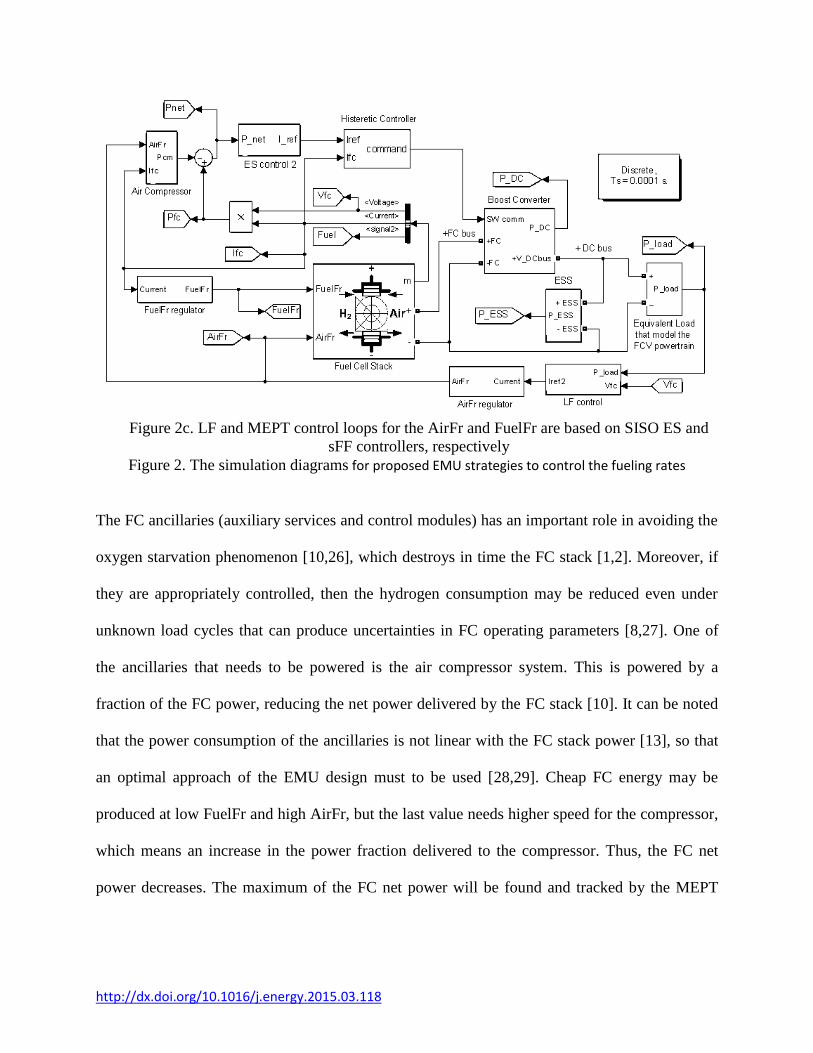
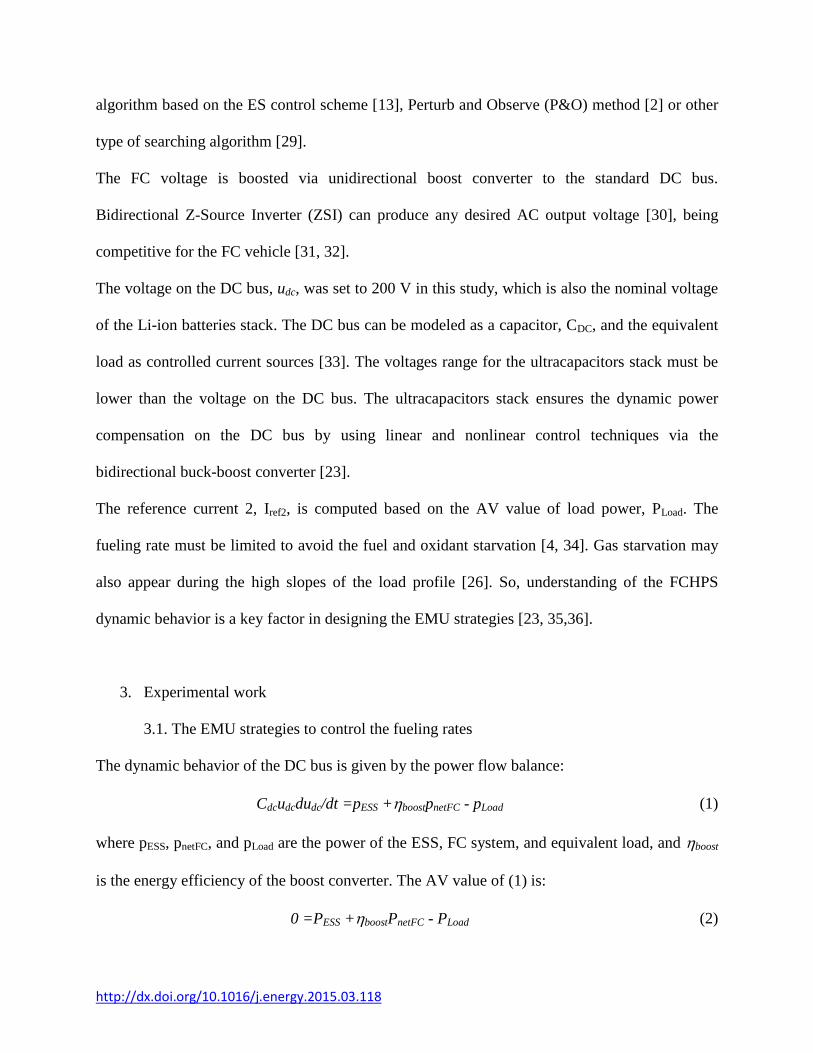
Figure 2c. LF and MEPT control loops for the AirFr and FuelFr are based on SISO ES and
sFF controllers, respectively
Figure 2. The simulation diagrams for proposed EMU strategies to control the fueling rates
The FC ancillaries (auxiliary services and control modules) has an important role in avoiding the
oxygen starvation phenomenon [10,26], which destroys in time the FC stack [1,2]. Moreover, if
they are appropriately controlled, then the hydrogen consumption may be reduced even under
unknown load cycles that can produce uncertainties in FC operating parameters [8,27]. One of
the ancillaries that needs to be powered is the air compressor system. This is powered by a
fraction of the FC power, reducing the net power delivered by the FC stack [10]. It can be noted
that the power consumption of the ancillaries is not linear with the FC stack power [13], so that
an optimal approach of the EMU design must to be used [28,29]. Cheap FC energy may be
produced at low FuelFr and high AirFr, but the last value needs higher speed for the compressor,
which means an increase in the power fraction delivered to the compressor. Thus, the FC net
power decreases. The maximum of the FC net power will be found and tracked by the MEPT
http://dx.doi.org/10.1016/j.energy.2015.03.118
algorithm based on the ES control scheme [13], Perturb and Observe (P&O) method [2] or other
type of searching algorithm [29].
The FC voltage is boosted via unidirectional boost converter to the standard DC bus.
Bidirectional Z-Source Inverter (ZSI) can produce any desired AC output voltage [30], being
competitive for the FC vehicle [31, 32].
The voltage on the DC bus, udc, was set to 200 V in this study, which is also the nominal voltage
of the Li-ion batteries stack. The DC bus can be modeled as a capacitor, CDC, and the equivalent
load as controlled current sources [33]. The voltages range for the ultracapacitors stack must be
lower than the voltage on the DC bus. The ultracapacitors stack ensures the dynamic power
compensation on the DC bus by using linear and nonlinear control techniques via the
bidirectional buck-boost converter [23].
The reference current 2, Iref2, is computed based on the AV value of load power, PLoad. The
fueling rate must be limited to avoid the fuel and oxidant starvation [4, 34]. Gas starvation may
also appear during the high slopes of the load profile [26]. So, understanding of the FCHPS
dynamic behavior is a key factor in designing the EMU strategies [23, 35,36].
3. Experimental work
3.1. The EMU strategies to control the fueling rates
The dynamic behavior of the DC bus is given by the power flow balance:
Cdcudcdudc/dt =pESS +boostpnetFC - pLoad (1)
where pESS, pnetFC, and pLoad are the power of the ESS, FC system, and equivalent load, and boost
is the energy efficiency of the boost converter. The AV value of (1) is:
0 =PESS +boostPnetFC - PLoad (2)
http://dx.doi.org/10.1016/j.energy.2015.03.118
The charge-sustaining mode for the ESS is obtained if the LF control ensures PESS=0. So, and the
AV value of the FC current is given by (3):
0 = boostPnetFC - PLoad IFC(AV) =PLoad/(VFCboost) (3)
The EMU strategies proposed in this paper (see Figure 2) are based on MEPT and LF
controllers, which generate the reference currents (Iref, Iref1 and Iref2) to optimally supply the FC
stack via the FuelFr and AirFr regulators.
If the value given by (3) is set for the reference current 2, Iref2, then the first two fueling
configurations will be obtained by using the reference current 1, Iref1, for the FuelFr regulator
(Figure 2a) or AirFr regulator (Figure 2b). These configurations will be compared based on the
following performance indicators: (1) the fuel consumption efficiency, and (2) increase in the FC
net power. The advantage of the MEPT control against the sFF control is shown maintaining the
LF control for the same fueling regulator. Thus, other two fueling configurations will be obtained
by using the FC current, IFC, for the FuelFr regulator (Figure 2c) or AirFr regulator (this topology
is not shown being excluded from comparison after the first tests).
The reference current (Iref) is the input of the hysteretic control for boost converter used in all
fueling configurations.
For example, the EMU strategy based on LF and MEPT control loops for the AirFr and FuelFr
regulators (shown in Figure 2a) works as follows. After the start-up procedure, the FC stack is
fueled based on present level of the load power and generates power. The SIDO ES controller
generates the reference currents (Iref and Iref1) based on the present level of the FC net power
using the ES control algorithm which is briefly presented in Section 4.5 and detailed in [37, 38].
The LF control block generates the reference current 2 (Iref2) based on the next level of the load
http://dx.doi.org/10.1016/j.energy.2015.03.118
power using (3). The fueling rates are updated based on the reference currents (Iref1 and Iref2) via
FuelFr and AirFr regulator.
The above operation will run in real time based on the short response (high search speed) of the
ES control scheme [38]. For example, if the load power is constant, then the stationary values of
the fueling rates will be found in a short time (few milliseconds; depending on the step level of
load demand) with about 99.9% stationary accuracy [38]. If the load power is not constant, then
the new values of the fueling rates will be computed based on the real time optimization
algorithm explained above.
The search speed of the proposed ES control scheme is higher, being limited to safe slopes
recommended for the FC power profile [26] via a slope limiter. The DC bus voltage is
maintained at 200 V by controlling the bidirectional power flow exchanged by the
ultracapacitors stack with the DC bus.
So, the contributions at the level of the FCHPS topologies are the following: (1) two advanced
fueling configurations are proposed and analyzed in comparison with the sFF control, which is
usually used in practice [23,26]; (2) the LF control is proposed to operate the ESS in charge-
sustaining mode, being simpler to be implemented compared to wavelet techniques shown in [8];
(3) the fueling configurations without MEPT control are easy to be adapted on commercially
solution based on sFF control [20] due to the simple signal processing operations made by the LF
control block; (4) the MEPT – based fueling configuration has the same performance as the
EMU strategy based on efficiency map shown in [35]. Further contributions will be highlighted
in Conclusion section based on the results obtained here.
3.2. Used models
3.2.1. Fuel cell system
http://dx.doi.org/10.1016/j.energy.2015.03.118
The FC stack produces electrical energy by a chemical reaction without emitting any gas. In
comparison with other FC types, PEMFC is the best option for FCHPS because of its high-
energy density of the hydrogen which is the ideal gas to store renewable energy overcapacity on
plug-in fueling station. Thus, the FCHPS can be operated indefinitely only by refueling it with
hydrogen, like as the diesel generator with gasoline, but only emitting water vapor. The PEMFC
has significant advantages, including no emissions, low operating temperature, high efficiency,
and capacity to rapidly adjust its power to the power demand [26], but the main problem of the
gas starvation phenomenon remains and further research must be made [34]. Furthermore, the
cost of the PEMFC stack and auxiliary components has decreased in the last decade to
competitive prices [39, 40]. The auxiliary components such as compressor, hydrogen tank,
humidifier, air cooler, and so on are energy consuming devices from the power delivered by the
FC stack, pFC. So, the FC net power is given by (4):
pnetFC = pFC - paux (4)
where paux is the power requested by the auxiliary components.
The FC system includes the PEMFC stack, auxiliary components, EMU, protection and safe
circuits, so it is obvious that it is a complex system. A lot of research has been carried out in this
direction [41]. In this paper, the model of the dynamic FC system included in the
SimPowerSystems library of the Matlab - Simulink® will be considered [42]. A 6 kW/45V
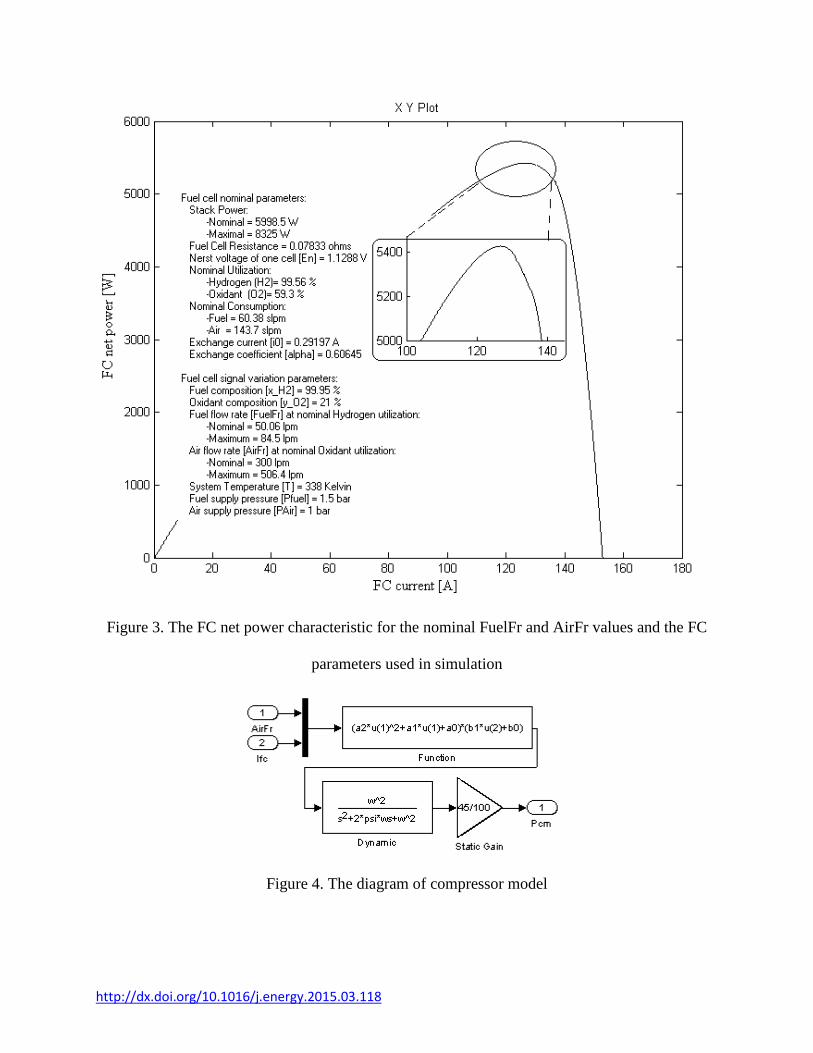
PEMFC system was chosen. The FC net power characteristic for the FuelFr and AirFr values of
50 lpm and 300 lpm is shown in Figure 3. The main FC parameters are also shown in Figure 3.
The MEP is about 5400 W, but it is obvious that MEP is difficult to be tracked under unknown
dynamic load. Besides the complex behavior of the PEMFC stack, which includes modeling of
http://dx.doi.org/10.1016/j.energy.2015.03.118
mass transport processes, the different dynamics of the auxiliary components have effect to the
paux power, affecting the behavior of the overall system. So, the pnetFC is difficult to be predicted
and could be tracked based on the MEPT control loop [13].
The main power consumer among the auxiliary components is the air compressor (up to 80%
power required by all auxiliary components [43]). Furthermore, in comparison with the time
constants of the PEMFC stack and air compressor, the thermal management loop is with at least
two order of magnitude slower and it can be neglected in the FC system time scale [41].
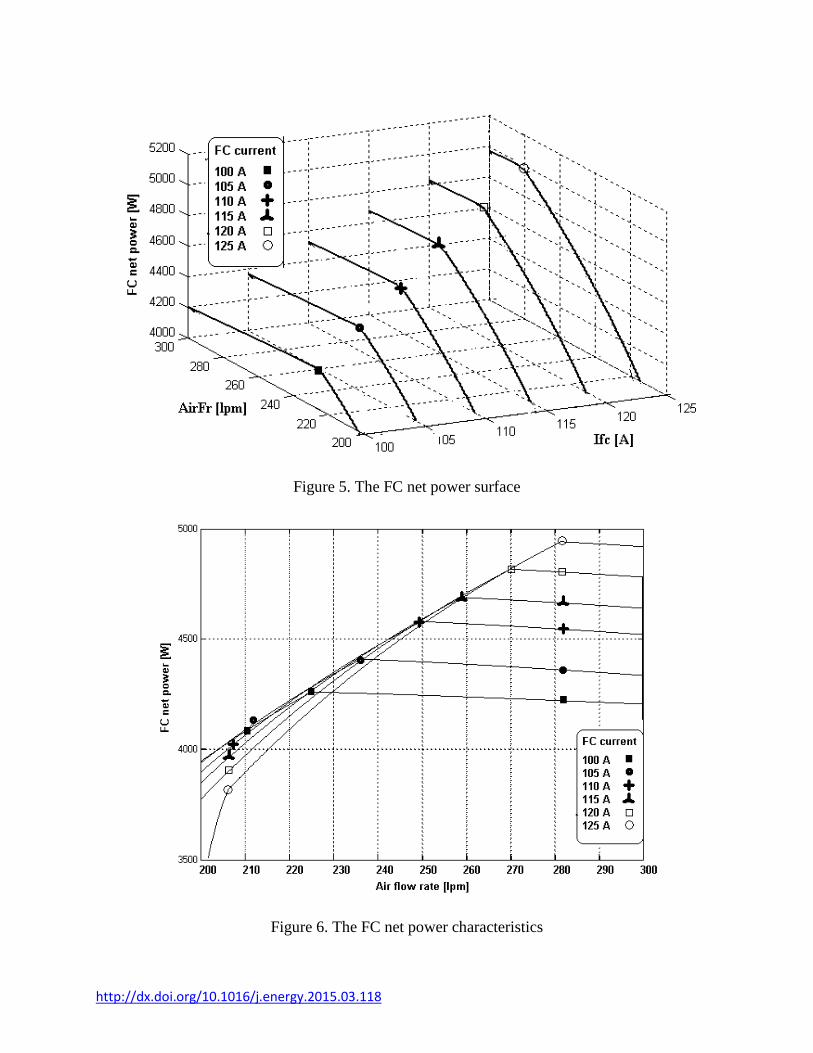
Consequently, besides the PEMFC stack model mentioned above, the compressor model showed
in Figure 4 will be used in simulation.
The power of the air compressor, Pcm, is computed based on (5) [27].
2
2 1 0 1 0cm cm cm FCP I V a AirFr a AirFr a a I a (5)
where a0 = 0.6, a1 = 0.04, a2 = -0.00003231, b0 = 0.9987, and b1 = 46.02.
The compressor dynamics is modeled through a 2nd
order system [27] or a dynamic system of
higher order [2]. The static gain easily adjusts the power of the air compressor to the different
levels of power of all auxiliary components in order to check if the MEPT and LF control
schemes proposed are dependent on this power level. For example, if the static gain is set to
0.45, then the Pcm power is about 1 kW for nominal FC operating conditions, and this represents
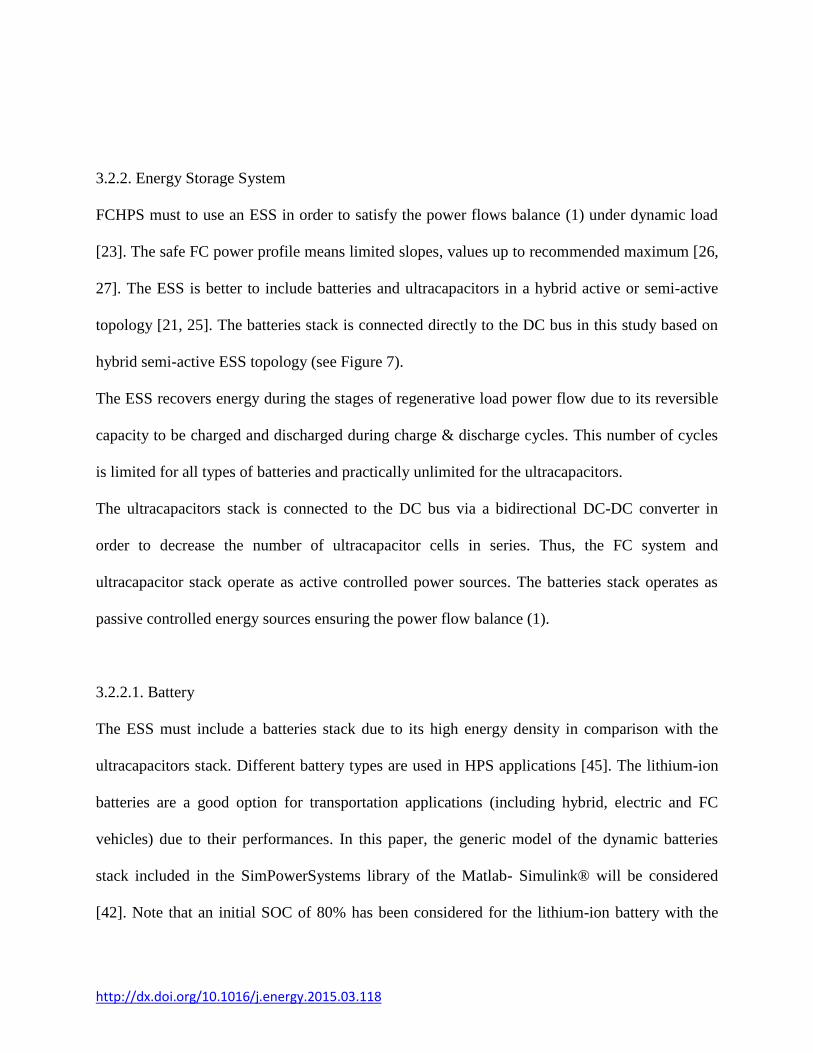
a power level in the usual power range that is up to 20% of the FC power available [44]. The FC
net power surface is shown in Figure 5 for different FC operating conditions. The FC net power
characteristics via AirFr variable are shown in Figure 6 to mark the MEPs values.
http://dx.doi.org/10.1016/j.energy.2015.03.118
Figure 3. The FC net power characteristic for the nominal FuelFr and AirFr values and the FC
parameters used in simulation
Figure 4. The diagram of compressor model
http://dx.doi.org/10.1016/j.energy.2015.03.118
Figure 5. The FC net power surface
Figure 6. The FC net power characteristics
http://dx.doi.org/10.1016/j.energy.2015.03.118
3.2.2. Energy Storage System
FCHPS must to use an ESS in order to satisfy the power flows balance (1) under dynamic load
[23]. The safe FC power profile means limited slopes, values up to recommended maximum [26,
27]. The ESS is better to include batteries and ultracapacitors in a hybrid active or semi-active
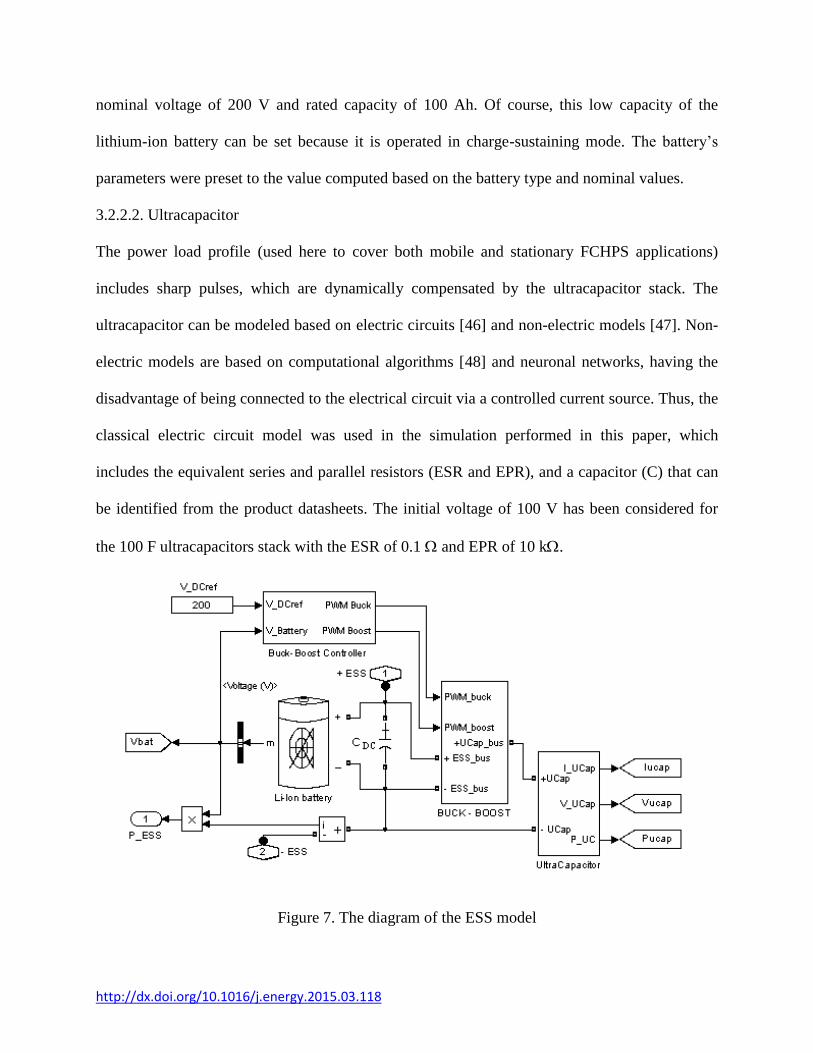
topology [21, 25]. The batteries stack is connected directly to the DC bus in this study based on
hybrid semi-active ESS topology (see Figure 7).
The ESS recovers energy during the stages of regenerative load power flow due to its reversible
capacity to be charged and discharged during charge & discharge cycles. This number of cycles
is limited for all types of batteries and practically unlimited for the ultracapacitors.
The ultracapacitors stack is connected to the DC bus via a bidirectional DC-DC converter in
order to decrease the number of ultracapacitor cells in series. Thus, the FC system and
ultracapacitor stack operate as active controlled power sources. The batteries stack operates as
passive controlled energy sources ensuring the power flow balance (1).
3.2.2.1. Battery
The ESS must include a batteries stack due to its high energy density in comparison with the
ultracapacitors stack. Different battery types are used in HPS applications [45]. The lithium-ion
batteries are a good option for transportation applications (including hybrid, electric and FC
vehicles) due to their performances. In this paper, the generic model of the dynamic batteries
stack included in the SimPowerSystems library of the Matlab- Simulink® will be considered
[42]. Note that an initial SOC of 80% has been considered for the lithium-ion battery with the
http://dx.doi.org/10.1016/j.energy.2015.03.118
nominal voltage of 200 V and rated capacity of 100 Ah. Of course, this low capacity of the
lithium-ion battery can be set because it is operated in charge-sustaining mode. The battery’s
parameters were preset to the value computed based on the battery type and nominal values.
3.2.2.2. Ultracapacitor
The power load profile (used here to cover both mobile and stationary FCHPS applications)
includes sharp pulses, which are dynamically compensated by the ultracapacitor stack. The
ultracapacitor can be modeled based on electric circuits [46] and non-electric models [47]. Non-
electric models are based on computational algorithms [48] and neuronal networks, having the
disadvantage of being connected to the electrical circuit via a controlled current source. Thus, the
classical electric circuit model was used in the simulation performed in this paper, which
includes the equivalent series and parallel resistors (ESR and EPR), and a capacitor (C) that can
be identified from the product datasheets. The initial voltage of 100 V has been considered for
the 100 F ultracapacitors stack with the ESR of 0.1 and EPR of 10 k.
Figure 7. The diagram of the ESS model
http://dx.doi.org/10.1016/j.energy.2015.03.118
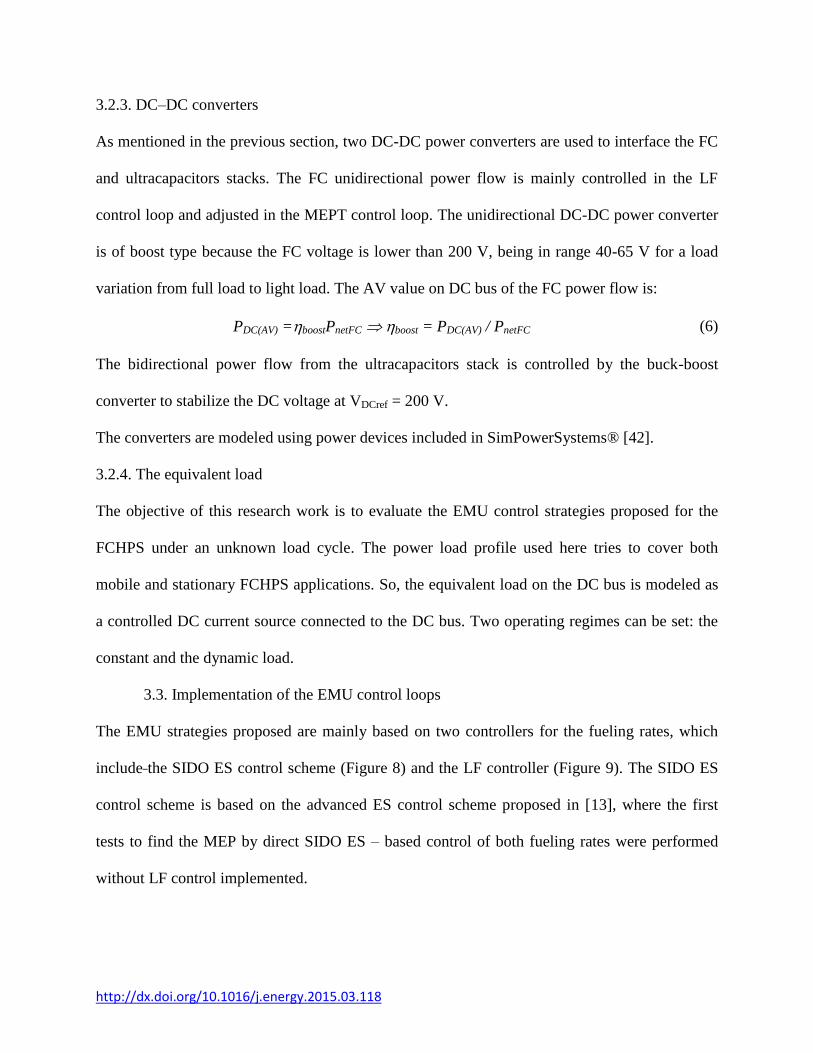
3.2.3. DC–DC converters
As mentioned in the previous section, two DC-DC power converters are used to interface the FC
and ultracapacitors stacks. The FC unidirectional power flow is mainly controlled in the LF
control loop and adjusted in the MEPT control loop. The unidirectional DC-DC power converter
is of boost type because the FC voltage is lower than 200 V, being in range 40-65 V for a load
variation from full load to light load. The AV value on DC bus of the FC power flow is:
PDC(AV) =boostPnetFC boost = PDC(AV) / PnetFC (6)
The bidirectional power flow from the ultracapacitors stack is controlled by the buck-boost
converter to stabilize the DC voltage at VDCref = 200 V.
The converters are modeled using power devices included in SimPowerSystems® [42].
3.2.4. The equivalent load
The objective of this research work is to evaluate the EMU control strategies proposed for the
FCHPS under an unknown load cycle. The power load profile used here tries to cover both
mobile and stationary FCHPS applications. So, the equivalent load on the DC bus is modeled as
a controlled DC current source connected to the DC bus. Two operating regimes can be set: the
constant and the dynamic load.
3.3. Implementation of the EMU control loops
The EMU strategies proposed are mainly based on two controllers for the fueling rates, which
include the SIDO ES control scheme (Figure 8) and the LF controller (Figure 9). The SIDO ES
control scheme is based on the advanced ES control scheme proposed in [13], where the first
tests to find the MEP by direct SIDO ES – based control of both fueling rates were performed
without LF control implemented.
http://dx.doi.org/10.1016/j.energy.2015.03.118
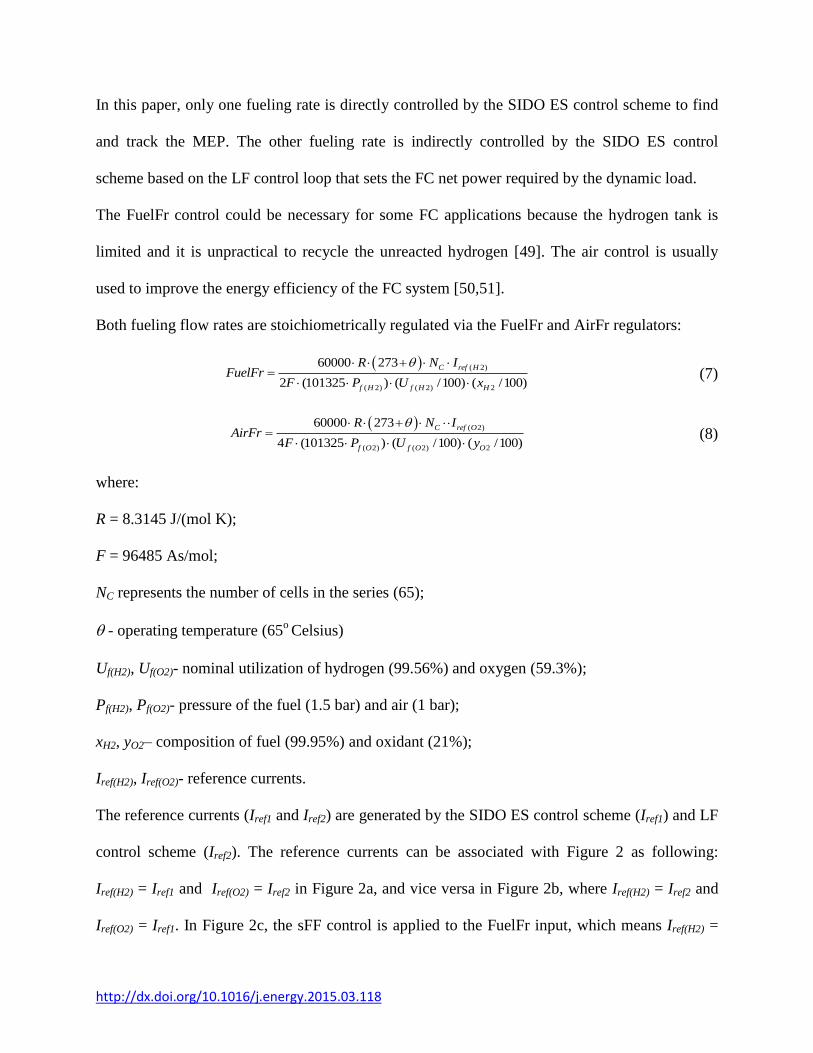
In this paper, only one fueling rate is directly controlled by the SIDO ES control scheme to find
and track the MEP. The other fueling rate is indirectly controlled by the SIDO ES control
scheme based on the LF control loop that sets the FC net power required by the dynamic load.
The FuelFr control could be necessary for some FC applications because the hydrogen tank is
limited and it is unpractical to recycle the unreacted hydrogen [49]. The air control is usually
used to improve the energy efficiency of the FC system [50,51].
Both fueling flow rates are stoichiometrically regulated via the FuelFr and AirFr regulators:
( 2)
( 2) ( 2) 2
60000 273
2 (101325 ) ( /100) ( /100)
C ref H
f H f H H
R N IFuelFr
F P U x
(7)
( 2)
( 2) ( 2) 2
60000 273
4 (101325 ) ( /100) ( /100)
C ref O
f O f O O
R N IAirFr
F P U y
(8)
where:
R = 8.3145 J/(mol K);
F = 96485 As/mol;
NC represents the number of cells in the series (65);
- operating temperature (65o Celsius)
Uf(H2), Uf(O2)- nominal utilization of hydrogen (99.56%) and oxygen (59.3%);
Pf(H2), Pf(O2)- pressure of the fuel (1.5 bar) and air (1 bar);
xH2, yO2– composition of fuel (99.95%) and oxidant (21%);
Iref(H2), Iref(O2)- reference currents.
The reference currents (Iref1 and Iref2) are generated by the SIDO ES control scheme (Iref1) and LF
control scheme (Iref2). The reference currents can be associated with Figure 2 as following:
Iref(H2) = Iref1 and Iref(O2) = Iref2 in Figure 2a, and vice versa in Figure 2b, where Iref(H2) = Iref2 and
Iref(O2) = Iref1. In Figure 2c, the sFF control is applied to the FuelFr input, which means Iref(H2) =
http://dx.doi.org/10.1016/j.energy.2015.03.118
IFC (because the FC current is a manageable variable). The AirFr value is regulated based on the
LF controller (Iref(O2) = Iref2) to evaluate the advantage of the MEPT control used in Figure 2a, in
comparison with the sFF control used in Figure 2c. In sFF control method [20] it can be noted
that both FuelFr and AirFr inputs are regulated through the FC current based on (7) and (8).
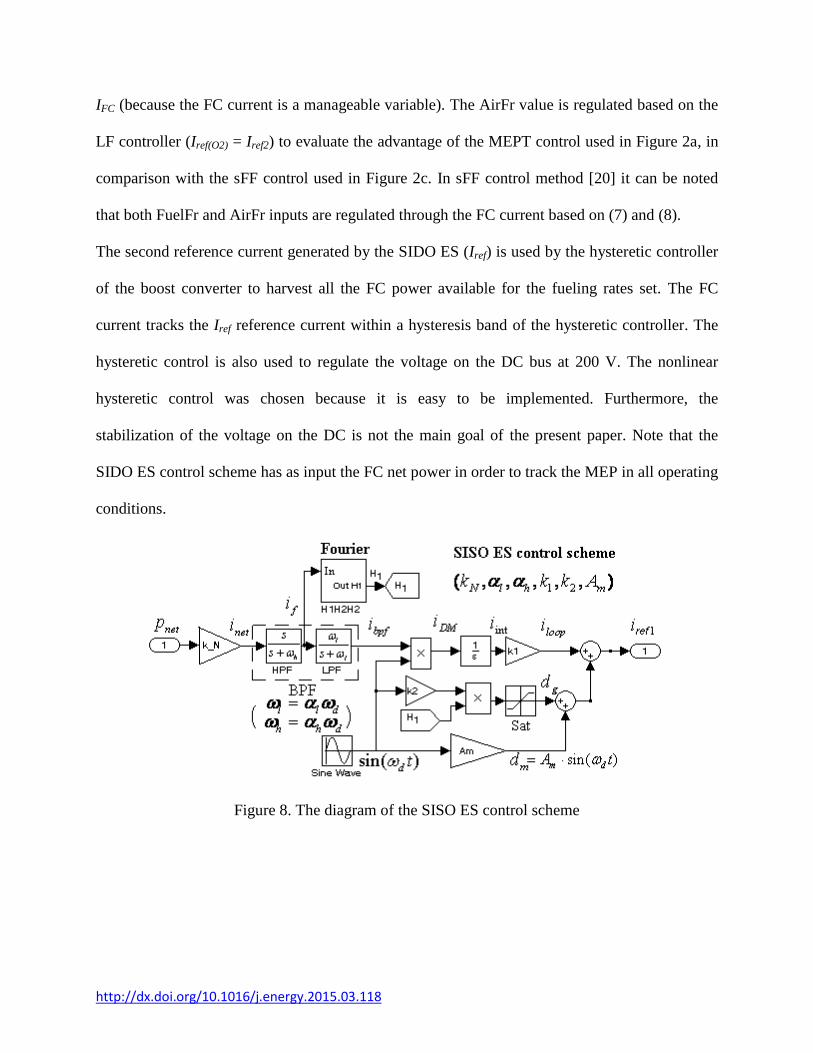
The second reference current generated by the SIDO ES (Iref) is used by the hysteretic controller
of the boost converter to harvest all the FC power available for the fueling rates set. The FC
current tracks the Iref reference current within a hysteresis band of the hysteretic controller. The
hysteretic control is also used to regulate the voltage on the DC bus at 200 V. The nonlinear
hysteretic control was chosen because it is easy to be implemented. Furthermore, the
stabilization of the voltage on the DC is not the main goal of the present paper. Note that the
SIDO ES control scheme has as input the FC net power in order to track the MEP in all operating
conditions.
Figure 8. The diagram of the SISO ES control scheme
http://dx.doi.org/10.1016/j.energy.2015.03.118
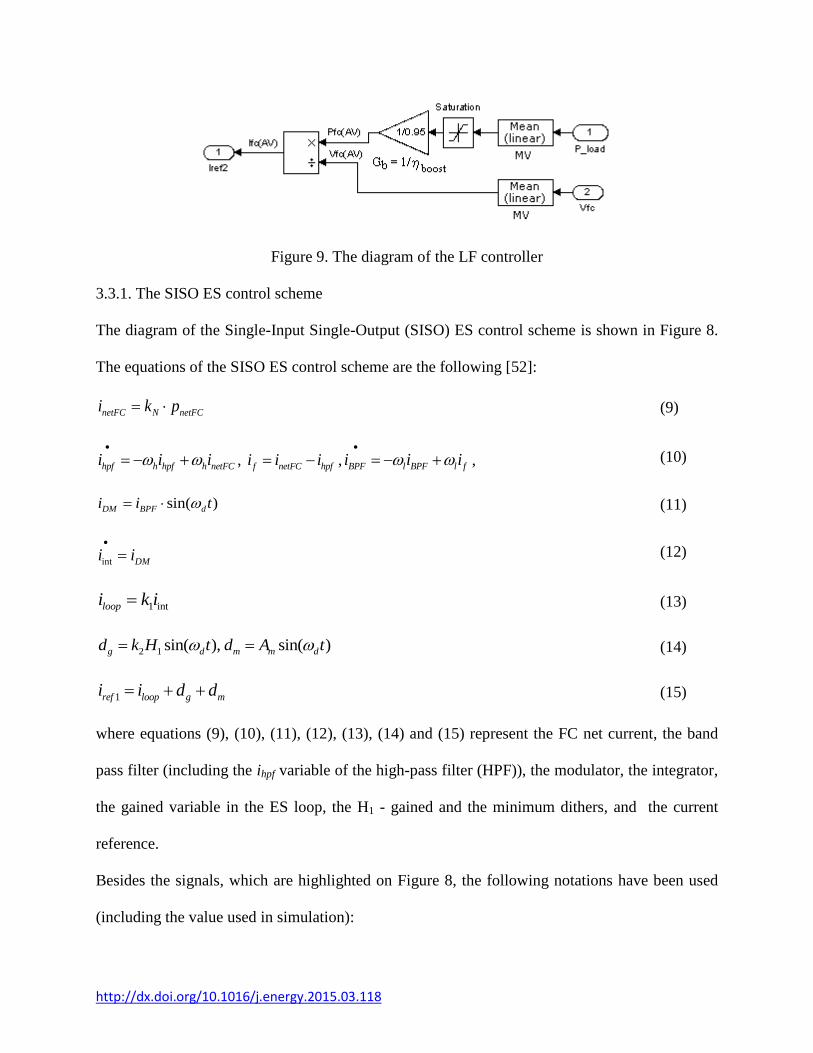
Figure 9. The diagram of the LF controller
3.3.1. The SISO ES control scheme
The diagram of the Single-Input Single-Output (SISO) ES control scheme is shown in Figure 8.
The equations of the SISO ES control scheme are the following [52]:
netFC N netFCi k p (9)
hpf h hpf h netFCi i i
, f netFC hpfi i i , BPF l BPF l fi i i
, (10)
sin( )DM BPF di i t (11)
int DMi i
(12)
1 intloopi k i (13)
2 1 sin( ), sin( )g d m m dd k H t d A t (14)
1ref loop g mi i d d (15)
where equations (9), (10), (11), (12), (13), (14) and (15) represent the FC net current, the band
pass filter (including the ihpf variable of the high-pass filter (HPF)), the modulator, the integrator,
the gained variable in the ES loop, the H1 - gained and the minimum dithers, and the current
reference.
Besides the signals, which are highlighted on Figure 8, the following notations have been used
(including the value used in simulation):
http://dx.doi.org/10.1016/j.energy.2015.03.118
fd = ωd/2 is the dither frequency (100 Hz)
k1 - the ES loop gain (k1 = 4fd =400);
k2 - the dither gain (2);
kN - the normalization gain (kN = 1/VFC=1/45);
ωl and ωh - the cut-off frequencies of the band pass filter (BPF), where ωl=ld, l=5.5, and
ωh=hd, h=0.1;
H1 - the magnitude of fundamental harmonic of the FC net current;
Am - the minimum amplitude of the dither (0.001);
- the convolution operator.
The optimization problem based on the ES control can be defined as:
Maximize:
( 2) ( 2)( , , , )net ref H ref O LoadP J x I I I (16)
Subject to:
( 2) ( 2)( , , , ),ref H ref O Loadx f x I I I x X
(17)
where Iref(H2) and Iref(O2) are the control inputs, ILoad is the disturbance input, and f is a smooth
function that represents the dynamics of the FC stack based on states model. Note that the state
vector, x, can be of a 9th
[20] or 6th
[53] order.
The orthogonal signals sd2=cos(ωdt) will be used for the second scheme of ES control in order to
generate the Iref reference current based on the same simulation parameters: d = 2100, kN
=1/45, h = 0.1d, l = 5.5d, k1= 4fd, k2= 2, Am= 0.001.
3.3.2. The LF controller
The diagram of the LF controller is shown in Figure 9. The AV block computes the mean value
over a running window of one dither period. The saturation block is used to set the lower limit at
http://dx.doi.org/10.1016/j.energy.2015.03.118
the standby power value, PFCmin, during the phases of the regenerative load power flow, light
load or without load. The upper limit set the maximum FC power, PFCmax. The energy efficiency
of the boost converter can be set to be constant (for example, 0.95) or estimated based on (6).
Thus, considering (3), the Iref2 reference current is estimated based on (18):
Iref2=IFC(AV)=PLoad(AV)/(VFC(AV)boost(AV)) (18)
The proposed EMU strategies were tested using the MATLAB-Simulink®.
4. Results and discussion
4.1. Constant load
The voltage on the DC bus is stabilized to VDCref = 200 V. Thus, the load power profile is set by
the load current profile.
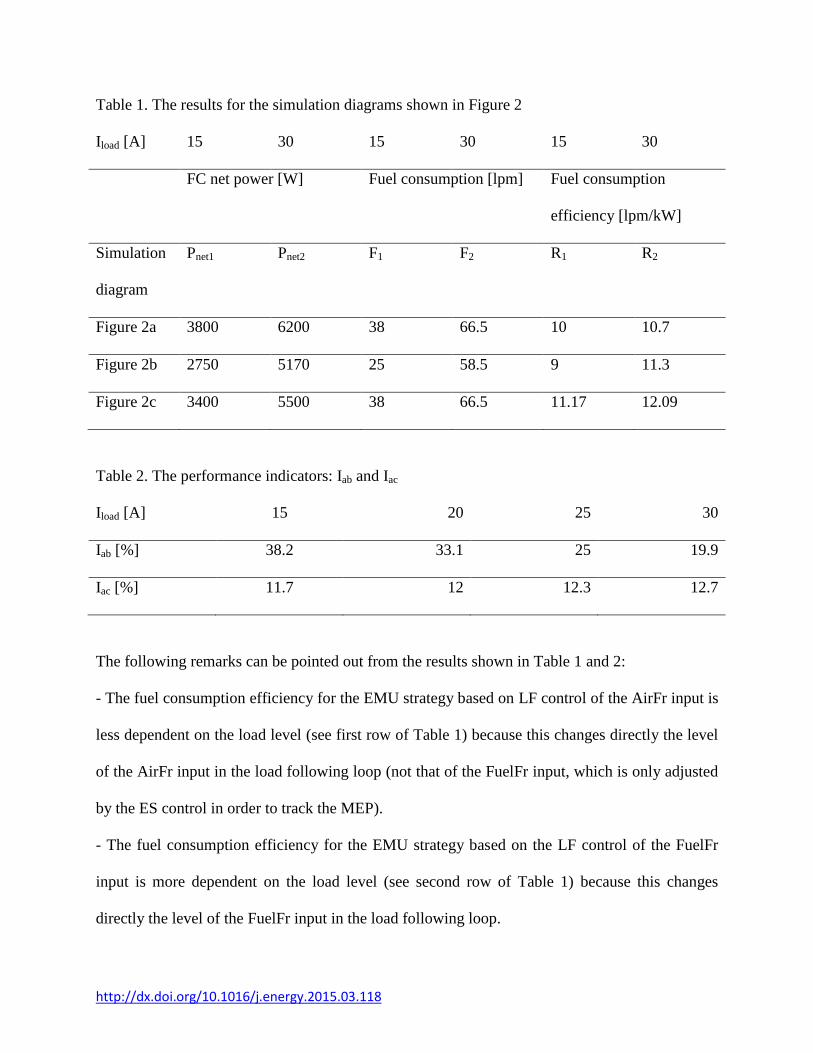
First, the load power is set as constant in all diagrams from Figures 2. The values of the FC net
power (Pnet) and fuel consumption (F) are given in Table 1 for load current of 15 A and 30 A.
The fuel consumption efficiency (R=F/Pnet) is computed in the last two columns of the Table 1.
The percentage increase in the FC net power, Iab = 100 (Pnet(a) - Pnet(b) / Pnet(b)), is computed in
the Table 2 for the EMU strategy based on load following via the FuelFr (Figure 2a) and AirFr
(Figure 2b). The percentage increase in the FC net power, Iac = 100 (Pnet(a) - Pnet(c) / Pnet(c)), is
also computed in the Table 2 for the EMU strategies that are both based on load following via
the AirFr input (Figure 2a and 2c).
http://dx.doi.org/10.1016/j.energy.2015.03.118
Table 1. The results for the simulation diagrams shown in Figure 2
Iload [A] 15 30 15 30 15 30
FC net power [W] Fuel consumption [lpm] Fuel consumption
efficiency [lpm/kW]
Simulation
diagram
Pnet1 Pnet2 F1 F2 R1 R2
Figure 2a 3800 6200 38 66.5 10 10.7
Figure 2b 2750 5170 25 58.5 9 11.3
Figure 2c 3400 5500 38 66.5 11.17 12.09
Table 2. The performance indicators: Iab and Iac
Iload [A] 15 20 25 30
Iab [%] 38.2 33.1 25 19.9
Iac [%] 11.7 12 12.3 12.7
The following remarks can be pointed out from the results shown in Table 1 and 2:
- The fuel consumption efficiency for the EMU strategy based on LF control of the AirFr input is
less dependent on the load level (see first row of Table 1) because this changes directly the level
of the AirFr input in the load following loop (not that of the FuelFr input, which is only adjusted
by the ES control in order to track the MEP).
- The fuel consumption efficiency for the EMU strategy based on the LF control of the FuelFr
input is more dependent on the load level (see second row of Table 1) because this changes
directly the level of the FuelFr input in the load following loop.

http://dx.doi.org/10.1016/j.energy.2015.03.118
It is obvious that it is difficult to compare these EMU strategies based on the fuel consumption
efficiency. The average value of the results shown in Table 1 is about 10.3 and 10.7 for the EMU
strategy based on the FuelFr and AirFr load following control, respectively. Thus, the increase in
the FC net power will be used to compare these two EMU strategies.
- The percentage increase in the FC net power, Ik(ab) = 100 (Pnetk(a) - Pnetk(b) / Pnetk(b)), k=1, 2, is of
38.2% (I1(ab) = 100 (3800 – 2750) / 2750) and 19.9% (I2(ab) = 100 (6200 – 5170) / 5170) for the
EMU strategy based on load following via AirFr input in comparison with the one based on load
following via the FuelFr input (see Table 1, first and second row that are related to the results
from the simulation diagrams shown in Figures 2a and 2b). Thus, the EMU strategy based on the
load following control via the AirFr input is more efficient than the one based on the load
following control via the FuelFr input. Moreover, it can be seen that the ratio of the percentage
increases is about I1(ab) / I2(ab) 1.91 for a ratio of the load currents of 15/30=1/2. The percentage
is dependent on the load level, having values in range 38% to 20% for the load current in range
15 A to 30 A. The Iab performance indicator decreases approximately linearly with the increase
of the load current, but only in this range can be made this approximation (see Table 2 and the
trend line on Figure 10).
So, the EMU strategies that are both based on load following via the AirFr input (see Table 1,
first and third row) must be further compared.
- The opportunity to use the ES control instead of the sFF control should be based on an
evaluation of both performance indicators because the cost of implementation of the ES
controller (or other MEPT controller) is low in the entire cost of the EMU and the advantages are
obvious. First, the fuel consumption efficiency for the ES control is better than that for the sFF
control under different load levels (see Table 1, first and third row). Secondly, the percentage
http://dx.doi.org/10.1016/j.energy.2015.03.118
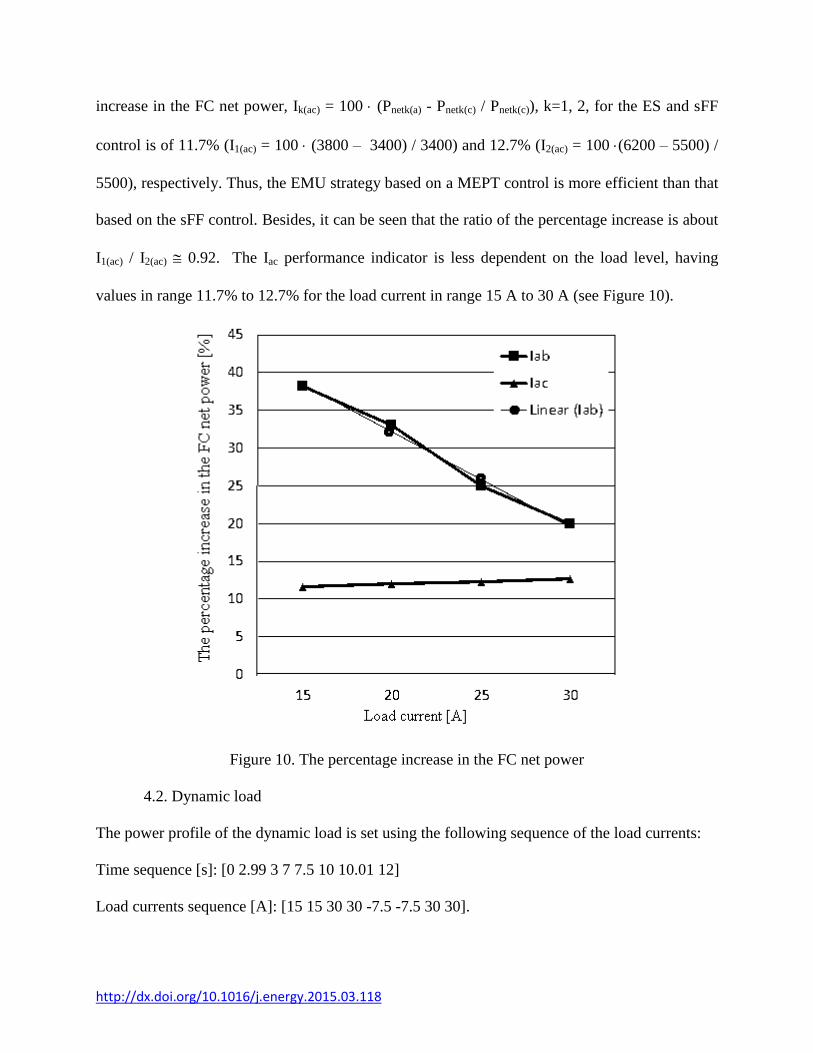
increase in the FC net power, Ik(ac) = 100 (Pnetk(a) - Pnetk(c) / Pnetk(c)), k=1, 2, for the ES and sFF
control is of 11.7% (I1(ac) = 100 (3800 – 3400) / 3400) and 12.7% (I2(ac) = 100 (6200 – 5500) /
5500), respectively. Thus, the EMU strategy based on a MEPT control is more efficient than that
based on the sFF control. Besides, it can be seen that the ratio of the percentage increase is about
I1(ac) / I2(ac) 0.92. The Iac performance indicator is less dependent on the load level, having
values in range 11.7% to 12.7% for the load current in range 15 A to 30 A (see Figure 10).
Figure 10. The percentage increase in the FC net power
4.2. Dynamic load
The power profile of the dynamic load is set using the following sequence of the load currents:
Time sequence [s]: [0 2.99 3 7 7.5 10 10.01 12]
Load currents sequence [A]: [15 15 30 30 -7.5 -7.5 30 30].
http://dx.doi.org/10.1016/j.energy.2015.03.118
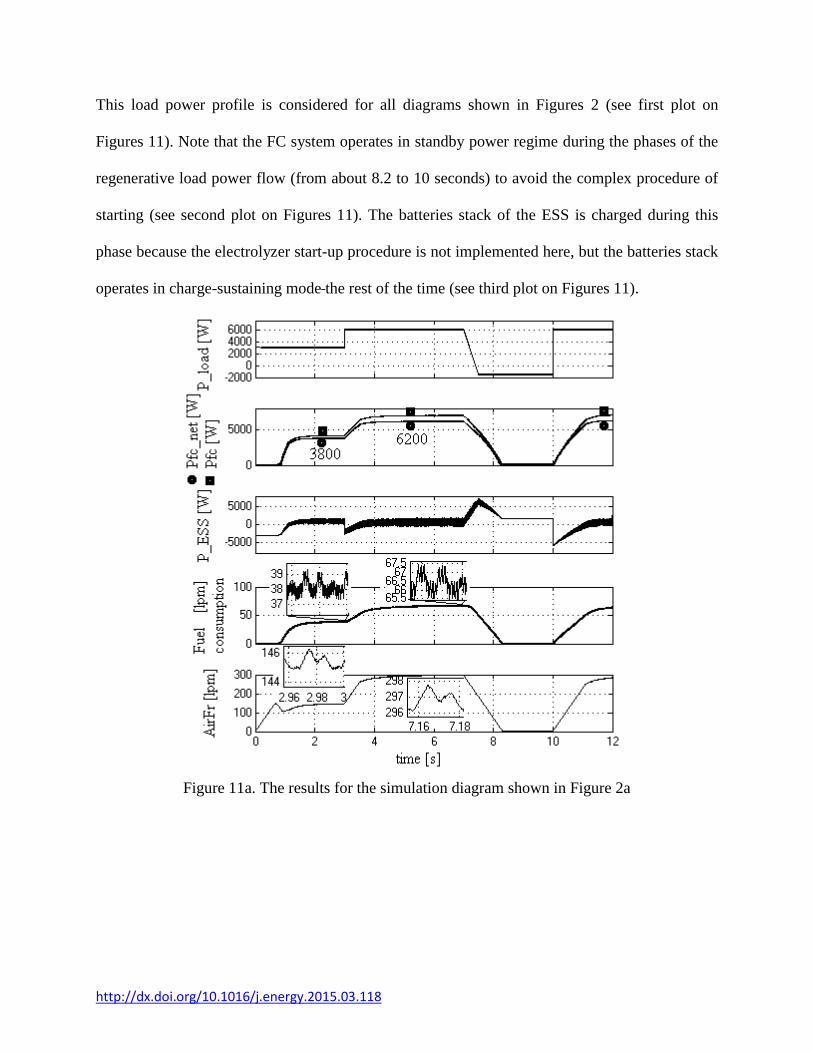
This load power profile is considered for all diagrams shown in Figures 2 (see first plot on
Figures 11). Note that the FC system operates in standby power regime during the phases of the
regenerative load power flow (from about 8.2 to 10 seconds) to avoid the complex procedure of
starting (see second plot on Figures 11). The batteries stack of the ESS is charged during this
phase because the electrolyzer start-up procedure is not implemented here, but the batteries stack
operates in charge-sustaining mode the rest of the time (see third plot on Figures 11).
Figure 11a. The results for the simulation diagram shown in Figure 2a
http://dx.doi.org/10.1016/j.energy.2015.03.118
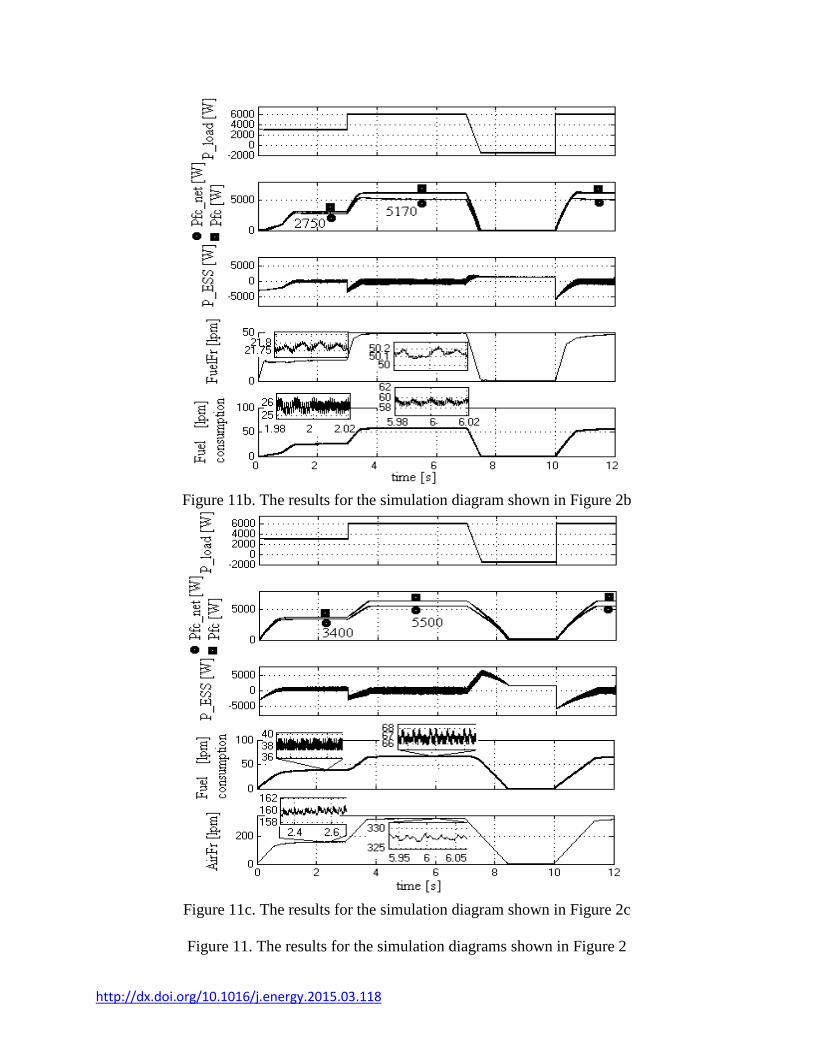
Figure 11b. The results for the simulation diagram shown in Figure 2b
Figure 11c. The results for the simulation diagram shown in Figure 2c
Figure 11. The results for the simulation diagrams shown in Figure 2
http://dx.doi.org/10.1016/j.energy.2015.03.118
The fueling rates are limited through the rate limiters included in both FuelFr and AirFr
regulators (see last two plots on Figures 11) in order to avoid the oxygen starvation phenomena.
Consequently, the power flow balance (1) written in instantaneous values is mainly sustained by
the ultracapacitors stack.
The values of the FC net power and fuel consumption (F), which are given in Table 1 for a load
current of 15 A and 30 A (which means a load power of 3000 W and 6000 W), are shown in the
plots of Figures 11 during the stationary regimes. The output of the LF controller controls are the
AirFr (Figures 2a and 2c) and FuelFr (Figure 2b) values obtained based on the AV FC power. .
Finally, it can be noted that the main advantages of the EMU strategies based on the LF and
MEPT control loops are the following: (1) the ESS operates in charge-sustaining mode and (2)
FC stack operates efficiently close to the MEP. Thus, the FC and batteries stacks size can be
reduced at minimum, with direct implications in the size and cost of the FCHPS.
5. Conclusion
The load following control of the FCHPS via one of the fueling rates is analyzed in this paper in
order to decide which option can be efficiently implemented. To further increase the energy
efficiency of the FCHPS, the other fueling rate was controlled based on a MEPT control scheme.
Consequently, this study was conducted to identify the optimal control configuration for the
AirFr and FuelFr inputs based on the LF and MEPT controllers. The first conclusion based on
the tests performed here for all possible configurations is with respect to AirFr – based LF
control: this reduces the dependence of the FCHPS efficiency by the load profile. The second
conclusion regarding the LF control is the following: the ESS will operate in charge-sustaining
mode and the size of the batteries stack can be reduced at minimum, with direct implications in
http://dx.doi.org/10.1016/j.energy.2015.03.118
the size and cost of the FCHPS. The third conclusion is related to the opportunity to implement a
MEPT control instead of the sFF control: the FC net power increases with more than 12 % based
on the results obtained, if the MEPT control was implemented. These conclusions clarify the
advantages of the AirFr/FuelFr – based LF/MEPT control scheme in comparison with the other
control topologies analyzed here. The next work will be focused on implementing this EMU
strategy based on two FC stacks to further reduce the size of the FCHPS: the FC stacks will
sustain (1) the nominal load and (2) difference to the maximal load.
Acknowledgement. The research leading to these results has received funding from the PhD
contract # SD4/45 /18.10.2013
References
[1] Lawlor V, Griesser S, Buchinger G, Olabi AG, Cordiner S, Meissner D. Review of the micro-
tubular solid oxide fuel cell: Part I. Stack design issues and research activities. J. Power Sources
2009;193(2):387–99
[2] Carton JG, Olabi AG, Design of experiment study of the parameters that affect performance
of three flow plate configurations of a proton exchange membrane fuel cell, Energy
2010;35(7):2796-806.
[3] Bruni G, Cordiner S, Muloneet V. Domestic distributed power generation: Effect of sizing
and energy management strategy on the environmental efficiency of a photovoltaic-battery-fuel
cell system. Energy 2014;77(1):133–143.
[4] Carton LG, Lawlor V, Olabi AG, Hochenauer C, Zauner G. Water droplet accumulation and
motion in PEM fuel cell mini-channels. Energy 2012;39(1):63 – 73.

http://dx.doi.org/10.1016/j.energy.2015.03.118
[5] Trovão JP, Pereirinha PG, Jorge HM, Antunes CH. A multi-level energy management system
for multi-source electric vehicles - An integrated rule-based meta-heuristic approach. Appl
Energy 2013;105:304–18.
[6] Garca P, Torreglosa JP, Fernndez LM, et al. Viability study of a FC-battery-SC tramway
controlled by equivalent consumption minimization strategy. Int J Hydrogen Energy
2012;37:9368–82.
[7] Laghrouche S, Matraji I, Ahmed FS, Jemei S, Wack M. Load governor based on constrained
extremum seeking for PEM fuel cell oxygen starvation and compressor surge protection. Int J
Hydrogen Energy 38(33) (2013) 14314–22.
[8] Erdinc O, Vural B, Uzunoglu M. A wavelet-fuzzy logic based energy management strategy
for a fuel cell/battery/ultra-capacitor hybrid vehicular power system. J Power Sources
2009;194:369–80.
[9] Mohammadia S, Mozafaria B, Solimania S, Niknamb T. An Adaptive Modified Firefly
Optimisation Algorithm based on Hong’s Point Estimate Method to optimal operation
management in a microgrid with consideration of uncertainties. Energy 2013;51:339–348.
[10] Ou T, Hong C. Dynamic operation and control of microgrid hybrid power systems. Energy
2014;66:314–323.
[11] Giaouris D, Papadopoulos AI, Ziogou C, Ipsakis D, Voutetakis S, Papadopoulou S, Seferlis
P, Stergiopoulos F, Elmasides C. Performance investigation of a hybrid renewable power
generation and storage system using systemic power management models. Energy 2013;61:621–
635.
[12] Hemi H, Ghouili J, Cheriti A. A real time fuzzy logic power management strategy for a fuel
cell vehicle. Energy Convers Manag 2014;80:63–70.
http://dx.doi.org/10.1016/j.energy.2015.03.118
[13] Bizon N. Improving the PEMFC energy efficiency by optimizing the fuelling rates based on
extremum seeking algorithm. Int J Hydrogen Energy 39(20), 2014, 10641–10654.
[14] Bizon N. Load-following Mode Control of a Standalone Renewable/Fuel Cell Hybrid Power
Source. Energy Convers Manag 2014;77:763–72.
[15] Fardoun AA, Ismail EH, Sabzali AJ, Al-Saffar MA. Bidirectional converter for high-
efficiency fuel cell powertrain. J Power Sources 2014;249:470–82.
[16] Dali M, Belhadj J, Roboam X. Hybrid solarewind system with battery storage operating in
grid-connected and standalone mode: control and energy management - experimental
investigation. Energy 2010;35(6):2587–95.
[17] Ipsakis D, Voutetakis S, Seferlis P, Stergiopoulos F, Papadopoulou S, Elmasides C. The
effect of the hysteresis band on power management strategies in a stand-alone power system.
Energy 2008;33:1537–1550
[18] Liangfei X, Jianqiu L, Jianfeng H, Xiangjun L, Minggao O. Adaptive supervisory control
strategy of a fuel cell/battery powered city bus. J Power Sources 2009;194(1):360–8.
[19] Torreglosa JP, Jurado F, García P, Fernández LM. Application of cascade and fuzzy logic
based control in a model of a fuel-cell hybrid tramway. Eng Appl Artif Intel 2011;24(1):1–11.
[20] Pukrushpan JT, Stefanopoulou AG, Peng H. Control of fuel cell power systems: principles,
modeling, analysis, and feedback design. London: Springer Verlag 2004.
[21] Mancarella P. MES (multi-energy systems): an overview of concepts and evaluation
models. Energy 2014;65:1–7.
[22] Sandy Thomas CE. Transportation options in a carbon-constrained world: hybrids, plug-in
hybrids, biofuels, fuel cell electric vehicles, and battery electric vehicles. Int J Hydrogen Energy
2009;34(23):9279–96.
http://dx.doi.org/10.1016/j.energy.2015.03.118
[23] Carton JG, Olabi AG. Wind/hydrogen hybrid systems: Opportunity for Ireland's wind
resource to provide consistent sustainable energy supply. Energy 2010;35 (12):4536-44.
[24] García P, Fernández LM, Torreglosa JP, Jurado F. Operation mode control of a hybrid
power system based on fuel cell/battery/ultracapacitor for an electric tramway. Comp Elec Eng
2013;39:1993–2004.
[25] Lee SC, Kwon O, Thomas S, Park S, Choi G-H. Graphical and mathematical analysis of
fuel cell/battery passive hybridization with K factors. Appl Energy 2014;114:135–45.
[26] Corbo P, Corcione FE, Migliardini F, Veneri V. Experimental study of a fuel cell power
train for road transport application. J Power Sources 2005;145(2):610–9.
[27] Restrepo C, Ramos-Paja CA, Giral R, Calvente J, Romero A. Fuel cell emulator for oxygen
excess ratio estimation on power electronics applications. Comp Elec Eng 2012;38:926–37.
[28] Xu L, Li J, Ouyang M, Hua J, Yang G. Multi-mode control strategy for fuel cell electric
vehicles regarding fuel economy and durability. Int J Hydrogen Energy 2014;39(5):2374–89.
[29] Hou C, Ouyang M, Xu L, Wang H. Approximate Pontryagin's minimum principle applied to
the energy management of plug-in hybrid electric vehicles. Appl Energy 2014;115:174–89.
[30] Peng FZ, Yuvan X, Fang X, Qian Z. Z-source inverter for motor drives. IEEE Trans Power
Electron 2005;20(4):857-63.
[31] Thangaprakashy S, Krishnan A. Current mode integrated control technique for Z-source
inverter fed induction motor drives. J Power Electron 2010;10(3):285-92.
[32] Emadi A, Lee YJ, Rajashekara K. Power electronics and motor drives in electric, hybrid
electric, and plug-in hybrid electric vehicles. IEEE Trans Ind Electron 2008;55(6):2237–45.
[33] Garcia P, Fernández LM, Garcia CA, Jurado F. Comparative study of PEM fuel cell models
for integration in propulsion systems of urban public transport. Fuel Cells 2010;10(6):1024–39.
http://dx.doi.org/10.1016/j.energy.2015.03.118
[34] Abdollahzadeh M, Pascoa JC, Ranjbar AA, Esmaili Q. Analysis of PEM (polymer
electrolyte membrane) fuel cell cathode two-dimensional modelling. Energy 2014;68:478–94.
[35] Feroldi D, Serra M, Riera J. Energy Management Strategies based on efficiency map for
Fuel Cell Hybrid Vehicles. J Power Source 2009;190:387–401.
[36] Entcheva E, Yanga L, Ghoraba M, Leeb EJ. Simulation of hybrid renewable
microgeneration systems in load sharing applications. Energy 2013;51:252–261.
[37] Bizon N, Oproescu M, Raducu M, Constantinescu LM. In: 5th
Int conf on Electronics,
Computers and Artificial Intelligence, 2013;1:81-88, 10.1109/ECAI.2013.6636153.
[38] Bizon N, Raducu M, Oproescu M, Constantinescu LM. In: 5th
Int conf on Electronics,
Computers and Artificial Intelligence, 2013;1:89-96, 10.1109/ECAI.2013.6636154.
[39] Rahini S, Meratizaman M, Monadizafeh S, Amidpour M. Techno-economic analysis of
wind turbine-PEM (polymer electrolyte membrane) fuel cell hybrid system in standalone area.
Energy 2014;67:381–96.
[40] De Bernardinis A. Synthesis on power electronics for large fuel cells: From power
conditioning to potentiodynamic analysis technique. Energy Convers Manag 2014;84:174–85.
[41] Gou B, Na WK, Diong B. Fuel Cells: Modeling, Control, and Applications, CRC Press
2010.
[42] SimPowerSystems TM Reference, Hydro-Québec and the MathWorks, Inc., Natick, MA;
2010.
[43] Ehsani M, Gao Y, Emadi A. Modern electric, hybrid electric, and fuel cell vehicles —
fundamentals, theory, and design, China Machine Press 2010.
[44] Becherif M, Hissel D. MPPT of a PEMFC based on air supply control of the
motocompressor group. Int J Hydrogen Energ 2010;35(22):12521–30.

http://dx.doi.org/10.1016/j.energy.2015.03.118
[45] Divya KC, Østergaard J. Battery energy storage technology for power systems – an
overview. Electr Power Syst Res 2009;79(4):511–20.
[46] Nelms RM, Spyker RL. Classical equivalent circuit parameters for a double-layer capacitor.
IEEE Trans Aerosp Electron Syst 2000;36(3):829–36.
[47] Weidner JW, Srinivasan V. Mathematical modeling of electrochemical capacitors. J
Electrochem Soc 1999;146(5):1650–8.
[48] Sikha G, White RE, Popov BN. A mathematical model for a lithium-ion battery /
electrochemical capacitor hybrid system. J Electrochem Soc 2005;152(8):1682–93.
[49] DalviA, Guay M. Control and real-time optimization of an automotive hybrid fuel cell
powers system. Control Eng Pract 2009;17:924–38.
[50] Lu J, Zahedi A. Air supply control for maximum efficiency point tracking in fuel cell
systems. J Renew Sust Energy 2012;4(3):033106, 10.1063/1.4717516.
[51] Tirnovan R, Giurgea S. Efficiency improvement of a PEMFC power source by
optimization of the air management. Int J Hydrogen Energ 2012;37:7745–56.
[52] Bizon N. Tracking the maximum efficiency point for the FC system based on extremum
seeking scheme to control the air flow. Appl Energy 129 (2014) 147–57.
[53] Kunusch C, Puleston PF, Mayosky MA, Riera J. Sliding mode strategy for PEM fuel cells
stacks breathing control using a super–twisting algorithm. IEEE T Contr Syst T 2009;17(1):167–
73.