Energy Consumption and Output Growth in Nigeria A Generalized Method of Moments Approach
101
ISSN XXXX-XXXX ISSN XXXX-XXXX SOCIETY OF BUSINESS AND SOCIAL SCIENCES (SBSS) LONDON, UK DOUBLE BLIND PEER REVIEWED ONLINE JOURNAL VOLUME – 1 NUMBER – 1 JULY – 2011
Transcript of Energy Consumption and Output Growth in Nigeria A Generalized Method of Moments Approach

ISSN XXXX-XXXX
ISSN XXXX-XXXX
SOCIETY OF BUSINESS AND SOCIAL SCIENCES (SBSS) LONDON, UK
DOUBLE BLIND PEER REVIEWED ONLINE JOURNAL
VOLUME – 1 NUMBER – 1 JULY – 2011

Business and Social Sciences Review (BSSR) Volume 1, Number 1, (July 2011) www.bssreview.org
2
Copyright © 2011 – Society of Business and Social Sciences (London – UK)
TABLE OF CONTENTS
DISCLAIMER
3
EDITORIAL BOARD
4
Impact of Recession on Various Sectors of Indian Economy Ravi Kiran and Prabhjot Kaur
5
Organization Development and Democratization of the Firm Frances A. Viggiani
21
The Effectiveness of Implementation of 5S on Employee Motivation Wan Asri Wan Abdul Aziz and Azman Che Mat
41
Hotel Front-Desk Clerks and Their Computers: Exploring the Phenomenological Terrain of Service Encounter Technology Michele R. Grottola
53
Successful School Improvement Khush Funer Murtaza
73
Energy Consumption and Output Growth in Nigeria, A Generalized Method of Moments Approach Ernest Simeon O. Odior
88

Business and Social Sciences Review (BSSR) Volume 1, Number 1, (July 2011) www.bssreview.org
3
Copyright © 2011 – Society of Business and Social Sciences (London – UK)
DISCLAIMER All the contributions are published in good faith and intentions to promote and
encourage research activities around the globe. The contributions are property of their
respective authors/owners and BSSR is not responsible for any content that hurts
someone’s views or feelings etc.
Editor BSSR

Business and Social Sciences Review (BSSR) Volume 1, Number 1, (July 2011) www.bssreview.org
4
Copyright © 2011 – Society of Business and Social Sciences (London – UK)
EDITORIAL BOARD T. Moerer Director, Master in Organizational Leadership Program, College of Saint Mary, Omaha, USA W. P. Jones Deputy Head, Glamorgan Business School, UK I. M. Tahir Associate Professor, University Sultan Zainal Abidin UniSZA, Malaysia F. M. Kreishan Dean, Faculty of B.A. & E, Al-Hussein bin Talal University, Jordan M.M. Siddiqui Chairman, Department of Commerce, FUUAST, Pakistan G. T. W. Han Faculty of Business and Finance, Universti Tunku Abdul Rahman, Malaysia K. Shahzad Head Graduate Program, Riphah School of Leadership, RIU, Pakistan M. R. Noruzi Payam e Noor university of Maraghe, Iran X. Zhao School of Business and Economics, Wilfrid laurier University, Canada M. O. Samuel University of Fort Hare, Alice, South Africa

Business and Social Sciences Review (BSSR) Volume 1, Number 1, (July 2011) www.bssreview.org
5
Copyright © 2011 – Society of Business and Social Sciences (London – UK)
Impact of Recession on Various Sectors of Indian Economy
Ravi Kiran
Professor, School of Management and Social Sciences, Thapar University, Patiala
Prabhjot Kaur
Project Associate, AICTE Project, School of Management and Social Sciences,
Thapar University, Patiala
ABSTRACT
After discussing the integration of the Indian Economy with the global economy, the
main objective of the research has been to study the performance of automobiles,
motorcycles, scooters & mopeds, Cement, IT, FDI, FII sectors, Sensex and GDP at
constant market prices of the Indian economy and to provide a comprehensive
sector-wise scenario to elucidate the weak as well as strong sectors of the economy
in the phase of recession. The secondary data of the production of the different
sectors of the economy has been used. The growth of various heads of production
has been analyzed with the help of trend rate of growth. To study the factors causing
recession, multiple regression model has been used by taking GDP at constant prices
as dependent variable and FDI, FII & IT sector production as the independent
variables. The year-wise growth rates have shown the true picture of recession in
the above mentioned sectors of the Indian economy, whereby most of the sectors
reported a slowdown in the recessionary period. So it can be concluded from the
above analysis that recession had its impact on Indian economy, but the impact has
been slower, as most of the sectors reported higher growth in period II of the
analyses. Regarding the factors influencing GDP growth, the regression results
highlight that the predictors of the model are: IT Sector, FII and FDI. These explain
99.10 percent of the variation.
Keywords: Recession, Globalization, India
INTRODUCTION Globalization has enhanced the importance of the study on business cycles particularly for emerging giants like India and China, whose integration with global output fluctuations are on the rise. For Indian economy, the fiscal year 2009-10 began as a difficult one. There was a significant slowdown in the growth rate in the second half of 2008-09, following the

Business and Social Sciences Review (BSSR) Volume 1, Number 1, (July 2011) www.bssreview.org
6
Copyright © 2011 – Society of Business and Social Sciences (London – UK)
financial crisis that began in the industrialized nations in 2007 and spread to the real economy across the world. While the developed world, including the U.S, the Euro Zone and Japan, has plunged into recession, the Indian Economy is being affected by the spill-over effects of the global financial crisis. The growth rate of the gross domestic product (GDP) in 2008-09 was 6.7 per cent, with growth in the last two quarters hovering around 6 per cent. There was an apprehension that this trend would persist for some time, as the full impact of the economic slowdown in the developed world worked through the system. It was also a year of reckoning for the policymakers, who had taken a calculated risk in providing substantial fiscal expansion to counter the negative fallout of the global slowdown. Inevitably, India’s fiscal deficit increased from the end of 2007-08, reaching 6.8 per cent (budget estimate, BE) of GDP in 2009-10. A delayed and severely subnormal monsoon added to the overall uncertainty. The continued recession in the developed world, for the latter part of 2009-10, meant a sluggish export recovery and a slowdown in financial flows into the economy. Yet, over the span of the year, the economy posted a remarkable recovery, not only in terms of overall growth figures but, more importantly, in terms of certain fundamentals, which justify optimism for the Indian economy in the medium to long term. (Economic Survey, Ministry of finance, Government of India, 2009-10). The study has been undertaken with the following broad objectives: • To determine whether the slowdown in the Indian Economy is really a phase of recession. • To identify the growing sectors of the Indian Economy in the global turmoil. • To identify the weak sectors of the Indian Economy in the global turmoil. For achieving the above objectives the following hypotheses have been framed: H1: Period II (2005 onwards) may be associated with higher GDP growth as compared to period I (2000-2004) H2: Period II (2005 onwards) may be associated with more output growth for all sectors as compared to period I (2000-04) H3: IT sector grows at a lower rate as compared with other sectors in Period II.
LITERATURE REVIEW Many economists believe that the recession of 2008-09 was triggered by a liquidity shortfall in the United States banking system. It has resulted in the collapse of large financial institutions, the bailout of banks by national governments and downturns in stock markets around the world. In many areas, the housing market has also suffered, resulting in numerous evictions, foreclosures and prolonged vacancies. Due to that the prices of oil reached at 147 US$ per barrel in the International market in September, 2008. That probably hit the Indian economy. A detailed review has been done to understand the impact of recession. Existing literature pertaining to the issues of business cycles, causes of crisis, impact on India, sectors hit by recession and remedies to tackle recession has been reviewed.

Business and Social Sciences Review (BSSR) Volume 1, Number 1, (July 2011) www.bssreview.org
7
Copyright © 2011 – Society of Business and Social Sciences (London – UK)
Krugman (2009) warns that, like diseases that have become resistant to antibiotics, the economic maladies that caused the Great Depression have made a comeback. The researcher lays bare the 2008 financial crisis--the greatest since the 1930s--tracing it to the failure of regulation to keep pace with an out-of-control financial system. With the classical NBER approach to determine the timing of recessions and expansions in the Indian economy, the reference chronology for business as well as growth rate cycles is determined on the basis of the consensus of key coincident indicators of the Indian economy, along with a composite coincident index comprised of those indicators, which tracks fluctuations in the current economic activity. A composite index of leading economic indicators is related to the drivers of business cycles in market economies, and includes swings in investment in inventory and fixed capital that determine, and are determined by movements in final demand. They are designed to anticipate business cycle and growth rate cycle upturns and downturns. (Dua and Banerji, 2006) There is indeed economic turbulence. Unstoppable India Inc. has hit a speed-breaker and the slowdown is there for all to see. Loan load worries, job search constraints, and making frequent fund value and investment assessment for more liquidity options in portfolio management – all these features of the global financial meltdown, prove that India is in the midst of one of the worst economic disasters or what is called the "worst global financial crisis since the Great Depression". The volatility of the developed economies has come to the developing economies in the era of globalization. Wall Street is clearly impacting the Indian job market. Banks are folding up. Deals are getting postponed. Outsourcing Industry is feeling the insidious effect of banks going out of business and everyone is trying to protect his/her job. (Hans, 2009) The study by Temin (2010) discusses parallels between current recession and the Great Depression for the intelligent general public. It stresses the role of economic models and ideas in public policy and argues that gold-standard mentality still holds sway today. The parallels are greatest in the generation of the crises, and they also illuminate the policy choices being made today. The study shows that the policy makers have escaped a repeat of the Depression, but they appear to have lost the opportunity for significant financial reform. Regarding the causes of crisis, Giuliano and Spilimbergo (2009) studied the relationship between recessions and beliefs by matching macroeconomic shocks during early adulthood with self-reported answers from the General Social Survey. Using time and regional variations in macroeconomic conditions to identify the effect of recessions on beliefs, the researchers show that individuals growing up during recessions tend to believe that success in life depends more on luck than on effort, support more government redistribution, but are less confident in public institutions. The study finds that recessions have a long-lasting effect on individuals’ beliefs. The global economic slowdown has fostered the need for unprecedented international policy coordination globally with key role players as US, Europe, Russia, China and India.

Business and Social Sciences Review (BSSR) Volume 1, Number 1, (July 2011) www.bssreview.org
8
Copyright © 2011 – Society of Business and Social Sciences (London – UK)
The turmoil is the product of global credit boom sponsoring mortgages, real estate and over capacitating stock markets/ stock market linked assets/products with no real assets to support. The World Economy is moving towards a new economic order. Looking at the globalised world, there is a need to free ourselves of barriers and allow the market mechanism to freely flow and be part of this large society. (Agarwal et al.,2008). The study by Misra (2008) focuses on the impact of India’s economic reforms on economic structure in less than 15 years; India has transformed itself from a near basket case to the hottest emerging market and even being preferred by many over China for investment. Goldman Sach's BRIC (Brazil, Russia, India and China) report (2006) places India in the third rank which is ahead of Japan in the global pecking order of economies by 2050. The significance of US slowdown stands reduced, due to growth in countries like India, China and Japan. India has shown that the boundaries separating nations into the first, second and third worlds can easily be transgressed. Proactive corporate sector has made India destined for economic greatness. The study also shows that the most important factor is that among the BRIC countries, India has the highest percentage of people in the working class. As per the results of Census of India 2001, about 39.1% of the total population was in the workforce, of which male workforce was about 51.7% and female workforce 25.6%. Female workforce in rural areas was 30.8% as compared to female work force of only 11.9% in urban areas. Male work force in rural areas was 52.1% whereas the same in urban areas was 50.6%. Further, India's weaknesses like inadequate infrastructure, poor coastal development and untapped rural markets etc. are itself potential areas of opportunity for investors. Consequently, all countries are showing interest in strengthening economic and commercial relations with India. India is equally interested in going global. The study by Mohan (2008) highlights that India, like most other Asian emerging market economies, has so far, not been seriously affected by the recent financial turmoil in developed economies. The study suggests the approach to the management of the exposures of the Indian financial sector entities to the collapse of major financial institutions in the US. The study reveals that the orderly conditions have been maintained in the domestic financial markets, which is attributable to a range of instruments available with the monetary authority to manage a variety of situations. The study concludes that India has by-and-large been spared of global financial contagion due to the subprime turmoil for a variety of reasons such as: domestic demand driven growth process; reliance on foreign savings has remained around 1.5% in 2008; comfortable level of foreign exchange reserves; etc. Financial stability in India has been achieved through perseverance of prudential policies which prevent institutions from excessive risk taking, and financial markets from becoming extremely volatile and turbulent. The study by Ghosh and Chandrasekhar (2009) reveals that the Indian Economy would be less adversely affected by the global economic crisis due to limited integration. The economic boom in India that happened before the current downturn was dependent upon greater global integration in three ways: (i) Greater reliance on exports particularly of

Business and Social Sciences Review (BSSR) Volume 1, Number 1, (July 2011) www.bssreview.org
9
Copyright © 2011 – Society of Business and Social Sciences (London – UK)
services; (ii) Increased dependence on capital inflows, especially of the short term variety; (iii) Decline in domestic credit raised consumption as well as investment. The authors opine that these in turn made the growth process more unprotected to internally and externally generated crisis. The study by De (2009) estimates the trade potential for India using the augmented Gravity model and attempts to determine the importance of trade remedies. Based on panel data, this Gravity model is the first-ever attempt to estimate India’s trade potential in the pre- and post- global economic and financial crisis period. The estimates of India’s global trade potential reveal that the magnitude of India’s trade potential is at its maximum in the Asia-Pacific region, followed by Africa and Latin America. Potential for expansion of trade in the post-crisis period is highest for countries such as China. In a large part of the world, India’s trade has remained unrealized, which provides further opportunities to expand despite the slowdown in global demand. There is a strong complementary role, as the findings of this paper indicate; i.e., tariff liberalization and trade facilitation, which taken together can help build export momentum in the crisis period. The studies of the sectors hit by recession have been done by Madhuvanthi et al. (2009), Vidyakala et al. (2009), Kumar and Vashisht (2009) and Shiralashetti and Hugar (2009). In these Madhuvanthi et al. (2009) highlights that the retail market in India is facing slow-down, with the ongoing financial crisis having impact on the world market. The study points out that the retail market in India is facing slowdown with the ongoing financial crisis happening across the world markets. The study shows that due to linkage between markets, the impact of the crisis is generally shared among all. With the suddenly disturbed economical status, consumers are gradually losing interest on buying. Slowing sales, lower inventory turnover and increasing working capital requirements to fuel growth have resulted in liquidity pressures for many domestic retailers. The authors conclude that demand reduction following a slowdown in the domestic economy has impacted the sales of retailers; and urged the government to increase spending on infrastructure and other development initiatives. The study by Vidyakala et al. (2009) highlights the recession in Indian Banking sector. The study shows that the Recession that began in December 2007 impacted the revenues and profitability of businesses worldwide. The authors point out that being a part of the globalised world; Indians are no more immune to the things happening outside our country. Going by the performance for the calendar year 2008, Indian public sector banks have not only been able to weather the storm of global recession but have been able to moderate its impact on the Indian economy as well, compared to its peers among the foreign and private banks. The banking sector faces profitability pressures due to higher funding costs, mark-to-market requirements on investment portfolios, and asset quality pressures due to a slowing economy. But Indian banks’ global exposure is relatively small, with international assets at about 6 per cent of the total assets. The strong economic growth in the past, low defaulter ratio, absence of complex financial products, regular

Business and Social Sciences Review (BSSR) Volume 1, Number 1, (July 2011) www.bssreview.org
10
Copyright © 2011 – Society of Business and Social Sciences (London – UK)
intervention by central bank, proactive adjustment of monetary policy and so called close banking culture has favored the banking industry in India in recent global financial turmoil. Kumar and Vashisht (2009) highlight that India has been effected by recession through financial markets, trade flows and exchange rates. The study explores that in order to reduce the impact of recession, governments and central banks all over the world, the Government and the Reserve Bank of India took aggressive countercyclical measures, sharply relaxing monetary policy and introducing a fiscal stimulus to boost domestic demand. The author argues that with very limited fiscal maneuverability and the limited traction of monetary policy, policy measures to restore the Indian gross domestic product growth back to its potential rate of 8–9% must focus on addressing the structural constraints that are holding down private investment demand. Shiralashetti and Hugar (2009) explore that Capital is the life blood of any production and distribution activity, and it plays an important role among the factors of production. The need of capital arises not only at the beginning of the venture, but also throughout the life span of the venture. However, capital, especially when in short supply, can be the limiting factor for starting, expansion and diversification of a venture. In view of the economic crisis on the one hand, and the perceived importance of foreign capital in the economic development of the country on the other, the Government of India has been making continuous efforts to attract foreign capital during the post-liberalization period. The efforts include providing concessions in taxes, announcing tax holidays and increasing the investment cap in various sectors of the Indian economy. As a result of the continuous efforts by the Government of India, there has been steady rise in the inflow of foreign capital on the one hand, and overall progress in various sectors of the Indian economy on the other. According to the Reserve Bank of India (RBI), India has received total Foreign Direct Investment (FDI) inflows of $50.1 bn since 1991. There has been tremendous progress in the various sectors of the Indian economy due to the inflow of foreign capital. The GDP growth rate has crossed 9% due to boom in manufacturing and service industries. Further, the Sensex points in Indian stock market have crossed 19, 000 points on October 15, 2007. In addition, the foreign exchange reserves have crossed $204 bn at the beginning of May, 2007. In addition, there has been improvement in the employment position, standard of living, infrastructure development, health and hygiene, GDP and NDP due to FDI inflows in India. Kumar and Bhatia (2009) tried to understand the contributory factors of high growth rate and to protect our economy from the recession. The study explores that there was a high rate of growth in the Indian Economy in the past few years. This growth was supported satisfactorily by structural and policy reforms and that trend was the long term trend. Liberalization, Privatization and Globalization were warmly welcomed and seemed mandatory for the process of growth of Indian Economy. According to Nair (2009) the Public Sector Enterprises (PSEs) in India have contributed immensely to the national self-reliance. It is widely believed that they have a much greater

Business and Social Sciences Review (BSSR) Volume 1, Number 1, (July 2011) www.bssreview.org
11
Copyright © 2011 – Society of Business and Social Sciences (London – UK)
potential and prospects for growth and profitability in future and will continue to play an important role in the economy. The study explores that under the globalized economic environment and especially under the present global economic slowdown the mission and role of public sector have to take a deviation from current practices and embrace a world of knowledge, information, practices and outlook to achieve the age old management commitment to improve the bottom line besides delivering prompt and quality services. The study by Choudhari (2009) elucidates the impact of global recession on Indian financial market, major initiatives taken up by the Government and Reserve Bank of India in the order to contain it with special focus on employment, import-export, interest rates, risk management, credit demand and taxation. The study shows that the global financial recession which started off as a sub-prime crisis of US has brought all nations including India into its fold. The GDP growth rate which was around nine per cent over the last four years has slowed since the last quarter of 2008 owing to deceleration in employment, export-import, tax-GDP ratio, reduction in capital inflows and significant outflows due to economic slowdown. The demand for bank credit is also slackening despite comfortable liquidity in the system. Higher input costs and dampened demand have dented corporate margins while the uncertainty surrounding the crisis has affected business confidence leading to the crash of Indian stock market and volatility in foreign exchange market. Kirkpatrick (2009) analyses the impact of failures and weaknesses in corporate governance on the financial crisis, including risk management systems and executive salaries. The financial crisis can be to an important extent attributed to failures and weaknesses in corporate governance arrangements which did not serve their purpose to safeguard against excessive risk taking in a number of financial services companies. Accounting standards and regulatory requirements have also proved insufficient in some areas. Last but not least, remuneration systems have in a number of cases not been closely related to the strategy and risk appetite of the company and its longer term interests.
METHODOLOGY With a view to accomplish the stipulated set of objectives of the study, Least square linear regression method has been used for calculating Compound Growth Rate of important variables covered by the study. As the study relates to time series, it is quite possible to notice different trends. The growth of various heads of production will be analyzed with the help of Compound annual rate of growth.
Y= abt Growth rates have been calculated. Inter period comparison of various parameters related to the Indian Economy. Comparing the same with the definition of Recession and, thus, arriving at a conclusion. The time period of the study will be divided into two phases: Phase I: 2000-2004 and Phase II: 2005 onwards and further the period before recession (2007-08) and period during recession (2008-09) have been studied. The purpose of the present research is to analyze the performance of different sectors of the Indian economy, to determine whether the slowdown in the Indian economy is really a

Business and Social Sciences Review (BSSR) Volume 1, Number 1, (July 2011) www.bssreview.org
12
Copyright © 2011 – Society of Business and Social Sciences (London – UK)
phase of recession. So the data of production for automobiles, motorcycles, scooters & mopeds, cement, Information technology, Foreign direct investment, Foreign institutional investment, Sensex, Gross Domestic Product of the economy has been collected and analyzed for the same period for the present research which has been divided into two phases, i.e. ,Phase I (2000-04) and Phase II (2004-09) along with the Period before recession (2007-08) and the Period during recession (2008-09). The growth rates of these sectors for Phase I and Phase II have been calculated and compared. Also the percentage rate of growth for each year has been calculated. It basically solves the purpose to represent a true sketch of all these sectors, to understand the impact of recession on major sectors and see which sectors have been hit more by recession.
RESULTS AND DISCUSSION Performance of different Sectors of the Indian Economy The in depth study of recessionary phase requires the basic understanding of the growth rate that has been followed by the above mentioned sectors over the period of study, so as to comprehend any noticeable variations, if any, in the production level of these sectors. The performance of the automobile sector depicts a deceleration in growth in the recession period and is the lowest since 2000-01. The growth rate of 37.24% recorded by this industry is the highest in 2003-04. Considering the two periods, period II depicts higher growth as compared to period I. (Table 1) The industry which relates to motor cycles, scooters and mopeds production (Table 2) had shown the least growth rate in the period 2007-08 but in 2008-09, this industry moved back on the track, with 4.40% growth. The overall growth rate is 1.59. Period wise comparison depicts acceleration in growth in period II, from 1.32 percent to 4.94 percent. Cement Industry is one of the most technologically advanced industries in India (Table 3). It plays a crucial role in the housing and infrastructure sector of the economy. The cement industry has kept pace with technological advancement and modernization. The induction of advanced technology has helped the industry immensely to conserve energy and fuel and to save materials substantially. Cement industry also contributes in Indian exports. Improvement in quality of Indian Cement has found its ready markets in Bangladesh, Indonesia, Malaysia, Nepal, Middle East countries, Burma, Africa and South East Asian countries. Expansion of cement capacity and production assumes great importance in view of the growing demand from the infrastructure sector. As shown in table 3, in the recessionary phase there is a small decline in the growth rate of this sector of the economy and the production is on the continuous increasing path due to the above mentioned reason. Table 4 shows that the rate of growth of the IT sector was more in period II as compared to the rate of growth of period I. The yearly rate of growth depicts that the highest growth in 2004-05 with 28.85% and the lowest rate of growth in 2009-10 with 10.41%. There is a sharp fall in yearly growth from 25.90 in 2007-08 to 10.41 in 2008-08, the year of recession.

Business and Social Sciences Review (BSSR) Volume 1, Number 1, (July 2011) www.bssreview.org
13
Copyright © 2011 – Society of Business and Social Sciences (London – UK)
Current Scenario of Foreign Direct Investment The Government of India has taken many initiatives to attract FDI inflows, to boost the Indian economy since economic liberalization. FDI inflows in India have been analyzed on the basis of the following categorization, viz., year-wise, country-wise, sector-wise and region-wise FDI inflows. In the present study, the year-wise as well as sector-wise FDI inflows in India have been shown. The year-wise FDI inflows in India are presented in Figure I. It is clear from the figure that FDI inflows went up in 2001-02. This is mainly due to the initiatives taken by the Government of India in attracting FDI inflows in India. However, there has been inconsistency in the growth rate of FDI inflows. The FDI growth rate was positive till 2001-02, but thereafter it was negative in 2002-03 and 2003-04 and positive in 2001-02, 2004-05 and 2005-06. The growth rate in FDI inflows has been the highest in 2006-07 and the least growth has been recorded in 2009-10, since 2000-01. In this study, the rate of growth of period I, is calculated to be 1.93 and the rate of growth of Period II is 1.09.This is the only sector in which, the hypothesis become true that the rate of growth of period I has been higher as compared to the rate of growth of period II and this sector clearly depicts the impact of recession. Status of Foreign Portfolio Investment Portfolio investment mainly comprises of foreign institutional investors’ (FIIs) investments and American depository receipts (ADRs)/global depository receipts (GDRs). It witnessed large net inflows due to large purchases by FIIs in the Indian capital market reflecting revival in growth prospects of the economy and improvement in global investors’ sentiment. Institutional investors include hedge funds, insurance companies, pension funds and mutual funds. The term FII is used most commonly in India to refer to outside companies investing in the financial markets of India. International institutional investors must register with the Securities and Exchange Board of India to participate in the market. One of the major market regulations pertaining to FIIs involves placing limits on FII ownership in Indian companies. Figure II highlights that the rate of growth of the FII’s (net) in India is falling after 2007-08 and in 2008-09 the growth rate fell to less than zero and the same situation is also prevalent in 2009-10. So the recessionary impact is visible in this sector. Progress on developing India’s capital market, which is already more competitive, deep and developed by international markets standards, Continued. Business in the country’s oldest stock exchange, namely the Bombay Stock Exchange (BSE) dating back to 1875, which is also one of the oldest stock exchanges in the world, continued to thrive. Overseen by Securities and Exchange Board of India (SEBI), an independent statutory regulatory authority, the country’s capital market dealt in scripts of a large number of listed companies with a wide geographical outreach, providing a world class trading and settlement system, a wide range of product availability with a fast growing derivatives market, and well laid down corporate governance and investor protection measures.

Business and Social Sciences Review (BSSR) Volume 1, Number 1, (July 2011) www.bssreview.org
14
Copyright © 2011 – Society of Business and Social Sciences (London – UK)
The Indian capital market began the year 2008 on a bullish note, with the BSE index touching new peaks of 20,873, on January 8, 2008 but was affected adversely thereafter reflecting the impact of global financial crisis. The movement in equity prices in Indian capital market was in tandem with trends in major international equity markets; the Indian equity market weakened further during September- December 2008, following sharp decline in stock markets across the globe and perceptible shift in investor’s preferences. Having regards to these trends, the regulatory measures initiated during the year were aimed at ensuring the soundness and stability of the Indian capital market. The fluctuations in the capital market with the help of BSE SENSEX have been shown (Figure III). The fluctuations depict that the highest value has been in the year 2008 and the highest-low in the year 2002. The fluctuations in the lowest values depict that the lowest value has been in 2001. There is a fall in the highest value of SENSEX in the year 2009 and 2010, as compared to 2008. So the impact of recession is visible on Indian stock market. Status of Gross Domestic Product: One of the basic objectives of the study has been to study the impact of recession on Gross Domestic Product (GDP). GDP is the total money value of all final goods and services produced within the geographical boundaries of the country during a given period of time. Real GDP growth rate shows the increasing trend but fell due to recession in the global economy in the year 2008-09. When the period-wise growth rates of the different sectors of the economy have been calculated, then it is found that the rate of growth of period I is less than the rate of growth of period II, except for the rate of growth of the FDI inflows, where FDI inflows in Period I is higher than the rate of growth of period II. For revealing the complete and clear impact of recession the year-wise growth rates have also been calculated and from these calculations, some important facts have come forward. H1: Period II (2005 onwards) may be associated with lower GDP growth as compared to period I (2000-2004) as period II coincides with the recessionary phase. Although the results highlight GDP growth rates slowed down during the recessionary period but they have been higher in the second period of analysis. So despite recession, Indian economy can be said to be a growing economy. So this hypothesis has been accepted. H2: Period II (2005 onwards) may be associated with slower output growth for all sectors as compared to period I (2000-04). This hypothesis has been rejected as most of the sectors except for FDI sector reported higher growth in Period II as compared to Period I. H3: IT sector grows at a lower rate as compared with other sectors in Period II. The growth rate of IT sector for Period II has increased to 5.33 percent from 1.23 percent in period I. If year on year growth is seen, then there is a sharp fall from 25.90 in 2007-08 to 10.41 in 2008-08, the year of recession. So this hypothesis has been partially accepted. In case of IT sector the recessionary trends are visible in the recessionary period.

Business and Social Sciences Review (BSSR) Volume 1, Number 1, (July 2011) www.bssreview.org
15
Copyright © 2011 – Society of Business and Social Sciences (London – UK)
So the above results highlight that the growth rates fell during 2008-09 in case of production of Coal (Including lignite), Petroleum crude, food grains, metallurgical industries, machine tools, automobiles, bicycles, agricultural tractors, power transformers, electric fans, Cement, Petroleum refinery products, Cotton cloth, Mixed/ Blended cloth, Man-made fiber fabrics, Spun Yarn, Filament Yarn, Staple Fiber, electricity generation, IT sector, imports and exports, FDI, FII. Indian financial markets are capable of withstanding the global shock, perhaps somewhat bruised but definitely not battered. India, with its strong internal drivers for growth, has been able to reduce the worst consequences of the global financial crisis, i.e., the fundamentals of the economy continue to be strong and robust. India is not unique as almost every country, whether or not directly affected, has to manage the current economic crisis under uncertainty. The year-wise growth rates do depict the true picture of recession of the different sectors of the Indian economy and here the results highlight that most of the sectors reported a slowdown in the recessionary period. So it can be concluded from the above analysis that recession had its impact on Indian economy, but the impact has been slower, as most of the sectors reported higher growth in period II of the analyses. Thus as corroborated by Mohan (2008); Ghosh and Chandrasekhar (2009); Vidyakala et al. (2009); Kumar and Vashisht (2009) India, like most other Asian emerging market economies, has been hit mildly by the recent recession. Future Scope: The present study has highlighted the growing sectors and weaker sectors of the economy. In depth study of these sectors can throw light on the steps taken in future to avoid a slow down. Similarly analysis of growing sectors can be an example for others to follow the policies adopted by these to reduce the impact of recession. Case studies of some of the leading firms can be taken up for further analysis.
REFERENCES Agarwal, V. and Agarwal, R. (2009), ‘Global Financial Turmoil, India and the World Economy’, Finance India , Vol. XXII, no. 1, pp- 19-40. Chidambaram P. (2008), ‘Spill-over effects of global crisis will be tackled’, The Hindu, Daily, November 19,2008,pp-15. Choudhari, Nidhi (2009), ‘Global Recession and its Impact on Indian Financial Markets’, ISSN 0924-9497, Volume 3, Issue ¾, Article no. 177. De, Prabir (2009), ‘Asia-Pacific Research and Training Network on Trade’, Working Paper Series, No.64. Dhar, P.K. (2002), ‘Indian Economy its Growing Dimensions’, Kalyani Publishers, New Delhi, pp-148,227,415,416,424,425.

Business and Social Sciences Review (BSSR) Volume 1, Number 1, (July 2011) www.bssreview.org
16
Copyright © 2011 – Society of Business and Social Sciences (London – UK)
Dua, Pami and Benerji, Anirvan (2006), ‘Business Cycles in India’, Working Paper no. 146, Centre for Development Economics. Ghosh, Jayati and Chandrasekhar, C.P. (2009), ‘The costs of ‘coupling’: the global crisis And the Indian economy’, Cambridge Journal of Economics, pp-725-739. Giuliano, Paula and Spilimbergo, Antoni (2009), ‘Growing up in a recession: beliefs and the Macro economy’, NBER working paper series, Working Paper 15321. Gujrati, D.N., Sangeetha (2008), ‘Basic Econometrics’, Fourth edition, Tata-McGraw Hill. Hans, Basil V. (2009), ‘Global Meltdown and India- Issues, Concerns and Challenges’, UGC sponsored two-day National Seminar on India – sixty years in a nation’s life. Hafer, Rik W (2005), ‘The Federal Reserve System :an encyclopedia’1 vol.(XXXII-450p), Greenwood Press, pp-329. Ivry, Bob (September 24, 2008). "(quoting Joshua Rosner as stating "It's not a liquidity problem, it's a valuation problem. ''"Bloomberg. Retrieved June 27, 2010. Jhingan M.L.(2003), ‘Macroeconomic Theory-11th Revised edition’, Vrinda Publications (P) Ltd., Delhi. Kirkpatrick, Grant (2009), ‘The Corporate Governance Lessons from the Financial Crisis’, ISSN 1995-2864, Financial Market trends© OECD 2009,pre-publication version for Vol. 2009/1. Krugman, Paul R. (2009), ‘The Return of Depression Economics and the Crisis of 2008’, W.W. Norton & Company – 224 pages. Kumar, Jayant and Bhatia, Hitesh (2009), ‘A Decade of Economic Growth in India: a Retrospective Analysis’, available at SSRN site. Kumar, R., and P. Vashisht. (2009), ‘The Global Economic Crisis: Impact on India and Policy Responses’, ADBI Working Paper 164. Tokyo: Asian Development Bank Institute. Mandhuvanthi, S., Vidyakala, K., Poornima, S. (2009), ‘Recession in Indian Banking Sector, available at SSRN site. Ministry of Finance & Company Affairs, Government of India (2008), ‘State of the Indian Economy’, Finance India, Vol. XXII, no. 1, pp- 31-56. Misra, Aveneendra (2008), ‘India Getting Better’, available at SSRN site.

Business and Social Sciences Review (BSSR) Volume 1, Number 1, (July 2011) www.bssreview.org
17
Copyright © 2011 – Society of Business and Social Sciences (London – UK)
Misra, S.K., Puri, V.K. (2004), ‘Indian Economy’, Twenty second edition, Himalaya Publishing House, Mumbai. Mohan, Rakesh (2008), ‘Global Financial Crisis and Key Risks: Impact on India and Asia’, Remarks prepared for IMF-FSF High- Level Meeting on the Recent Financial Turmoil and Policy Responses at Washington D.C. Nair, Sukumaran M.P. (2009), ‘Invigorate PSEs to Right the Global Economic Slowdown’, available at SSRN site. Paksha, Biru (2009), ‘Liberalization and India’s Business Cycle Synchronization with the US’, Indian Economic Review, Vol. XXXXIV, No. 2, pp- 275-298. Shiralashetti, AS and Hugar SS (2009), ‘Foreign Direct Investment and economic Development of India: A Diagnostic Study’, The Icfai University Journal of Managerial Economics, Vol. VII, No. 1, pp-55-67. Temin, Peter(2010), ‘The Great Recession and the Great Depression’, NBER Working Paper Series, Working Paper 15645. Vidyakala, K., Mandhuvanthi, S., Poornima, S. (2009), ‘Recession in Indian Retail Industry’, available at SSRN site. Table 1: Growth Rates of Automobiles
Serial no. Year Production of Automobiles (Total) (Thousand)
Growth %
1 2000-01 784.2
2 2001-02 765.1 -2.44
3 2002-03 934.9 22.19
4 2003-04 1283.1 37.24
5 2004-05 1564.5 21.93
6 2005-06 1701.6 8.76
7 2006-07 2065.6 21.39
8 2007-08 2313 11.98
9 2008-09 2010.9 -13.06
Rate of Growth Period I 1.61
Rate of Growth Period II 5.41
Rate of Growth (Entire Period) 1.86

Business and Social Sciences Review (BSSR) Volume 1, Number 1, (July 2011) www.bssreview.org
18
Copyright © 2011 – Society of Business and Social Sciences (London – UK)
Table 2: Growth Rates of Motor Cycles, Scooters and Moped
Serial no. Year Production of Motor cycles, scooters and mopeds (thousand)
Growth %
1 2000-01 3756.1 -
2 2001-02 3932.4 4.69
3 2002-03 5087.5 29.37
4 2003-04 5624.9 10.56
5 2004-05 6454.8 14.75
6 2005-06 7601.8 17.77
7 2006-07 8436.2 10.98
8 2007-08 8009.3 -5.06
9 2008-09 8361.4 4.40
Rate of Growth Period I 1.32
Rate of Growth Period II 4.94
Rate of Growth (Entire Period) 1.59
Table 3: Growth Rates of Cement
Serial no. Year Production of Cement (Million tons) Growth %
1 2000-01 99.2
2 2001-02 106.9 7.76
3 2002-03 116.3 8.79
4 2003-04 117 0.60
5 2004-05 125.3 7.09
6 2005-06 140.5 12.13
7 2006-07 154.7 10.11
8 2007-08 167.6 8.34
9 2008-09 181.4 8.23
Rate of Growth Period I 1.05
Rate of Growth Period II 5.07
Rate of Growth (Entire Period) 1.88

Business and Social Sciences Review (BSSR) Volume 1, Number 1, (July 2011) www.bssreview.org
19
Copyright © 2011 – Society of Business and Social Sciences (London – UK)
Table 4: Growth Rates of IT Sector
Serial no. Year IT Sector (Rs. millions) Growth %
1 2000-01 6885
2 2001-02 8012.4 16.37
3 2002-03 9700 21.06
4 2003-04 11890 21.95
5 2004-05 15242 28.85
6 2005-06 19030 24.85
7 2006-07 24400 28.22
8 2007-08 29582 21.24
9 2008-09 37245 25.90
10 2009-10 41122 10.41
Rate of Growth Period I 1.23
Rate of Growth Period II 5.33
Rate of Growth (Entire Period) 2.28
Figure I: Year-wise Growth Rates of FDI Inflows

Business and Social Sciences Review (BSSR) Volume 1, Number 1, (July 2011) www.bssreview.org
20
Copyright © 2011 – Society of Business and Social Sciences (London – UK)
Figure II: Growth Rates of FII’s (Net)
Figure III: The Highest and the Lowest Values of Sensex
Figure IV: The Growth Rates of GDP at Constant Market Price

Business and Social Sciences Review (BSSR) Volume 1, Number 1, (July 2011) www.bssreview.org
21
Copyright © 2011 – Society of Business and Social Sciences (London – UK)
Organization Development and Democratization of the Firm
Frances A. Viggiani
Associate Professor of Organizational Behavior
College of Business, Saxon Drive
Alfred University, Alfred, NY, 14802
[email protected]; 917-656-8234; fax: 607-871-2114
ABSTRACT Proposals for democratization of workplace behavior may fit into mainstream
management analysis of organization development and increased profitability in the
firm. Cooperatives allow us to explore how intents, values and organizational histories
shape the organization systems of espousedly democratic firms. How might
cooperatives be similar to, and different from, organizational systems created through
organization development (OD) interventions involving, for example, increased
participation of employees, people-focused systems, and large scale organizational
learning attempts? How might management approaches in cooperatives contribute to
our understanding of a general project of organizational change that democratizes the
workplace?
This conceptual paper contributes to theory building in the area of
organizational development and change. The paper 1) reviews selected democratic
theorists and related OD theory; 2) presents four Italian cooperatives; and 3) offers
research propositions suggesting potential in theory and practice for both effective
organization change and development, and management of an espousedly democratic,
self-governing economic enterprise.
INTRODUCTION Democratic organizational experiments and scholarly work examining them are well known among a small international circle of economists, sociologists and organization theorists. This paper seeks to further integrate this research on democratic work organizations into mainstream management research. The paper will review democratic theorists and OD scholars, present data suggesting four Italian cooperatives in Emilia-Romagna as exemplars of espousedly democratic firms, and present research propositions on how cooperatives might address OD themes and issues.

Business and Social Sciences Review (BSSR) Volume 1, Number 1, (July 2011) www.bssreview.org
22
Copyright © 2011 – Society of Business and Social Sciences (London – UK)
Cooperative members and managers espouse democratic organizational form, and we can examine the resulting structure and interactions. Argyris and Schon’s work organizational change (1974, 1996) discusses “espoused theory” in a “theory-in-use” model of action theory. This paper uses this concept of espoused theory, pointing to intended and stated democratic action, and suggesting potential limits of those ideas when expressed – and observable – in actual behaviors and systems. The research propositions presented in this paper suggest similarities and differences between espousedly democratic firms and OD interventions intending to increase participation of employees, create people-focused systems and promote large scale organizational learning. Research on democratic ownership and governance of the firm has often focused on questions about long-term success (Brown, 1985; Bartlett et al, 1992; Logue and Yates, 1999; Dow, 2003; Johnson, 2006). Some have predicted failure (Locke and Schweiger, 1979) and indeed, Kerr points to an “essential hierarchical nature” of organizations, distinguishing between the role of democratic processes in politics rather than in organizations, and concludes that organizational systems, managers and employees are generally unable or unwilling to develop democracy (2004: 83). However, studies of ownership and participation in the workplace generally present a wide variety of democratizing organizational forms (e.g. Poutsman et al, 2006; Smith, ed., 2006, Blasi, et al, 2003; Sun, 2003; Case et al 2005; Rosen et al 2005). Tyomina (1993:41) distinguishes among industrial democracy, workplace democracy, economic democracy, participatory democracy, participation in management, participation in industry, and organizational democracy. To these may be added: cooperatives, collectives, union democracy, the labor managed firm, employee governance, worker participation, worker-control, worker-self-management, all referring to organizational systems espousing re-definition of corporate management and ownership practices according to democratic ideals. Research on democracy and participation in the workplace Four major theorists have addressed important topics relevant to democracy in organizations. Applying democratic ideals and practices to the micro-institution of the firm has not been taken for granted. Dahl, in Democracy and Its Critics writes:
“I have no doubt that may people will immediately reject the idea of extending the democratic process to business firms as foolish and unrealistic. It may therefore be helpful to recall that not long ago most people took it as a matter of self-evident good sense that the idea of applying the democratic process to the government of the nation-state was foolish and unrealistic. This foolish and unrealistic idea was rejected on the one hand by antidemocratic elites throughout the world who thought it obvious that wisdom and realism required some form of guardianship; and on the other by many advocates of democracy, a tiny minority at best who contended that democracy on such a large scale was, as had been well known to all right thinking people for several thousand years, flatly impossible” (1989: 328, emphasis added).
Dahl traces two historical transitions in the development of democracies: the first, from the idea and practice of rule by the few to the idea and practice of rule by the many; the
Business and Social Sciences Review (BSSR) Volume 1, Number 1, (July 2011) www.bssreview.org
23
Copyright © 2011 – Society of Business and Social Sciences (London – UK)
second, from the city state to the nation state. Central to these historical and social processes is the dual meaning of "democracy", simultaneously a vision as well as an attainable actuality combining "normative and empirical aspects" (1989:6). This suggests two questions about a democratic firm: what might cause members to choose democratic form and process within the boundaries of a firm and what might the actual day-to-day of a democratic firm entail? In his discussion of the implementation of democracy in a particular unit or group, Dahl writes of "the Strong Principle of Equality”:
"members believe that no single member, and no minority of members, is so definitely better qualified to rule that the one or the few should be permitted to rule over the entire association. They believe, on the contrary, that all the members of the association are adequately qualified to participate on an equal footing with the others in the process of governing the association" (1989: 30)
In the firm this would mean that organizational participants apply democratic beliefs to the management of their company by the entire membership. Members of a democratic firm must then manage the "empirical" aspect, creating and maintaining its practical reality in structures and processes, while also building effective organizational form. Dahl suggests that a democratic “association” adopts rules concerning the making of binding decisions. These constitute governmental or “binding collective decisions” for the association. In addition, an association will create “democratic process”, or “ideal standards…against which procedures proposed ought to be evaluated”. These might include effective participation; voting equality at the decisive stage; enlightened understanding; and control of the agenda (1989:106-107). Hansmann, in his exhaustive analysis of ownership in organizations discusses “…employee participation in control of the firm through democratic processes”. He suggests that participation addresses several beliefs about governance: participation 1) “is a consumptive good”; 2) “provides a valued sense of control”;and 3) “stimulates and informs participation in political life beyond the boundaries of the firm” (1996:89). He claims that while "standard corporate structure, governance and finance" are taken for granted, "investor ownership is not a logically necessary concomitant of free markets and free enterprise" (1966:ix).
Hansmann suggests that no one form of ownership is necessarily superior -
investors, consumers, workers or suppliers might be "efficient" owners. He examines a variety of organizational forms: employee owned firms, producer cooperatives, consumer-owned utilities, service and supply cooperatives, occupant owned condominium and cooperatives, mutual companies and non-profit firms. Intending to develop a "means of measuring managerial efficiency", he notes that the costs of collective decision making explain why employee ownership is rare (1996: 94). He suggests that the capitalist ownership form is "contingent - simply a particular form of patron ownership that most

Business and Social Sciences Review (BSSR) Volume 1, Number 1, (July 2011) www.bssreview.org
24
Copyright © 2011 – Society of Business and Social Sciences (London – UK)
often but by no means always, proves efficient with the technologies presently at hand" (1996:297). Hansmann also argues that democratic management may not be feasible in all firm types or in all organizational environments, but may be more efficient in some cases.
Finally, in Democratic Governance, March and Olsen explore democratic governance structures and “the democratic citizen” who must “try to act within the democratic spirit as democratic traditions and discourse have come to define that spirit” (1995:251). To be a democratic citizen, they suggest, “…is to accept responsibility for crafting the practices, rules, forms, capabilities, structures, procedures, accounts and identities that construct democratic political life” (ibid). They conclude that democratic governance involves four main “tasks”: 1) developing the "identities" of citizens and groups in a political environment; 2) developing the "capabilities" for appropriate political action at the level of individuals, groups and institutions; 3) developing "accounts" or understandings of meaning and possibilities for action; and 4) developing "an adaptive political system" which can respond to change and can learn (1995:252). A large body of scholarly research on workplace democracy has examined several major topic areas: 1) participation (Blumberg 1968; Pateman 1970; Stern 1988; Michels 1911/62; Locke and Schweiger 1979); 2) industrial democracy (Bowles and Gintis 1986; Gustavson, 1983, Carnoy and Shearer 1980; Mansbridge, 1983; Deetz, 1992; Melman, 2001); 3) worker owned firms (Perry and Davis, 1985); 4) cooperatives and employee owned firms in the U.S. (Rothschild-Whitt 1976; Gunn 1984; Russell 1985; Brown, 1985); 5) international cases such as Norwegian workplace democratization (Gustavson & Hunnius, 1981), self-management in Eastern Europe (Vanek, 1971) worker-control in Chile (Espinoza & Zimbalist 1978), and the Mondragon cooperatives in Spain (Whyte and Whyte, 1988); 6) econometric studies of performance effects of participation (Sun, ed, 2003, Perotin and Robinson, eds, 2004, and Smith, ed, 2006); 7) Employee Stock Ownership Plans as democratizing organizational change (Blasi and Kruse,1992; Blasi, Kruse and Bernstein, 2003; Sesil, Kruse and Blasi, 2006). Organization development and change: research on participation and democratization Since the 1940’s OD theorists have proposed management strategies for employee participation, team development and system change in order to maximize business effectiveness. Huse and Cummings define OD as “a system wide application of behavioral science knowledge to the planned development and reinforcement of organizational strategies, structures, and processes for improving and organization’s effectiveness” (1985:2). Conceptual tools have included group dynamics, group process, quality circles, planned organizational change, organizational learning, quality-of-working-life, collaborative management, participative management and team-based management. Early work focused on management’s role in creating systems and cultures of managers and subordinates motivated by empowered participation and increased employee control over work. Classic OD models include Lewin’s field theory (1951); Trist’a psychoanalytic approaches to organizational systems (1963); Schein’s process consultation (1969);

Business and Social Sciences Review (BSSR) Volume 1, Number 1, (July 2011) www.bssreview.org
25
Copyright © 2011 – Society of Business and Social Sciences (London – UK)
Argyris and Schon’s work on the “learning organization” (1974); and Senge’s “five disciplines” for implementing organizational learning systems (1990). Recently Cloke and Goldsmith, in The End of Management and the Rise of Organizational Democracy (2002) argue that democratization is an inevitable result of the changes in organizations and management of the past generation. O’Toole and Lawler suggest in The New American Workplace (2006) that such organizations will employ “the same basic techniques that are used in political democracies: consensus and voting”. They claim that the traditional role of management “...in controlling the selection of leadership from above is ended. What takes its place are self-management, organizational democracy, empowered leadership, and shared responsibility for outcomes” (2006:54). In “Democratization of the Workplace Through Professionalization of Human Resource Development” Hatcher takes the position that HR professionals might work “to minimize undemocratic workplaces”(2006:67). Pfeffer (1998) points to “high involvement, high performance, or high commitment management practices”, and participative management and employee involvement, proposing characteristics of organizational systems “producing profits through people”, including self-managed teams and decentralization of decision making; extensive training; reduced status distinctions and barriers; extensive sharing of financial and performance information: and employment security” (1998: 64-65). Lawler 's work on the "high involvement organization" contrasts two competing management models: "control-oriented" and "commitment or involvement-oriented" (1992: 25). The first is based on "the assumption that hierarchy and vertical relationships are the best ways to assure that work gets produced". The second - "participative management" – involves goals of high quality products, quick response and innovation at competitive costs. Lawler concludes that organizational performance "depends on employees caring about the work they do, knowing how to do it, and doing the right thing. Involving individuals in the business is the most effective way to produce an organization in which people know more, care more and do the right things" (1992:347). Organization development and change scholars have also focused on organizational culture (Schein 1969/2004). Some have suggested that development of such cultures is a central feature of success, while others have argued that culture cannot be engineered or intentionally manipulated to achieve organizational goals (Kunda 1991). Viggiani argues that democratic hierarchies evolve a constellation of cultural forms such as democratic rituals (1991, 1997) and other cultural forms (Trice and Beyer, 1993, 1984). OD, Italian cooperatives and workplace democratization: propositions and selected case data This section presents propositions linking organization development and change – both practice and models - with cooperatives as a source of data for theory building. In these firms, members have chosen democratic form and process (Dahl). The propositions

Business and Social Sciences Review (BSSR) Volume 1, Number 1, (July 2011) www.bssreview.org
26
Copyright © 2011 – Society of Business and Social Sciences (London – UK)
predict characteristics of resulting organizational systems, and compare these systems with those found in large-scale OD projects. Cooperative organizations – for example, agricultural cooperatives, housing cooperatives, worker cooperatives -exist in many industries and nations. Some must abide by national legislative definitions, such as production cooperatives in Italy. Others are smaller and more informal, such as grocery cooperatives in the US. Generally cooperatives are legal entities, democratically controlled by their members. Examples of scholarly research on cooperatives include studies of Mondragon, the Basque cooperative system in Spain (Bradley & Gelb, 1983; Whyte & Whyte, 1988; Greenwood and Santos, 1991), British worker cooperatives (Jones, 1980; Cornforth, 1983), French cooperatives (Batestone), and cooperatives in Mexico (Hernandex, 2006) and in Brazil (Lima, 2007). Empirical data from four Italian cooperatives in the region illustrate the intentions of members to create democratized organizational systems. The companies are owned and managed according to shared espoused beliefs of members about the meaning of particular, unique forms, structures and processes through which they intend to enact shared understandings of democracy in the workplace. These cases, and prospects for organizational change and transformation they suggest, are important for our exploration of successful OD interventions focused on increased employee participation in management. The propositions presented here were developed through an iterative process based on primary and secondary research on espousedly democratic firms and OD. Primary research included three studies of cooperatives (author 1984, 1997, 2002). Secondary research included studies of cooperatives, worker-managed firms, ESOP’s and labor-managed firms, as well as research on OD theories, models and cases. These two literatures have been briefly reviewed above. An unpublished interview study was conducted with members and managers in the four Italian cooperatives cited in this paper. Observations, interviews, and the case material presented below from the four Italian companies frequently confirmed the propositions. The propositions suggest how the four Italian cooperatives may provide researchers and practitioners with opportunities to explore OD models and outcomes, and potential for democratizing organizations. For example, an OD focus on empowerment and increased employee control over work, echoes cooperatives’ stated goals of a “more horizontal, relational structure” and “a cooperative spirit” at work. OD seeks to encourage employees to care about the work they do, and participate in high-involvement systems and “binding collective decisions”. Cooperative managers hope to “put the company in the workers’ hands” and develop a “culture of cohesion and moral commitment”. Such shared intentions of central to OD, and similarly found in the intentions of cooperative members, point to actions and change processes in organizational systems. These cases, and prospects for organizational change and transformation they suggest, are useful for our exploration of new ideas about participative management.
Business and Social Sciences Review (BSSR) Volume 1, Number 1, (July 2011) www.bssreview.org
27
Copyright © 2011 – Society of Business and Social Sciences (London – UK)
Proposition 1 The Italian cases suggest how citizens in democratic nations in the 21st century are developing a spectrum of firms, from participatory conventional firms to espousedly democratic firms, constituting a continuing historical trend of importing democratic values and practices inside the boundary of the firm and applying them to organizational policies, processes and structures in the workplace. Proposition 2 The language and actions of organizational actors in these cooperative firms concerning values, goals, problem-solving and hierarchy are congruent with language and actions in conventional participatory firms engaged in organizational development for improved efficiency and effectiveness using people-focused managerial approaches. Italian Cooperatives The cooperative sector in Italy is the largest in Europe, and in 2005 the 420,000 firms in the Emilia-Romagna region near Bologna employed “10% of the workforce and generated about 30% of regional GDP and up to 60% of GDP in some cities like Imola” (Stefano Zamagni, University of Bologna, cited in Logue 2005/2006:4). Putnam (1993) characterized the region as being "among the most modern, bustling, affluent, technologically advanced society on the face of the earth. It is, however, the site of an unusual concentration of overlapping networks of social solidarity, peopled by citizens with an unusually well developed public spirit - a web of civic communities". He points to the "presence of associations" as well as "coordination and cooperative for mutual benefit” (114-115) According to Piore and Sabel (1984) small to medium-sized firms in the Emilia-Romagna region are well-studied, with companies seen as synergistic actors in markets leading to high levels of innovation and growth. Holmstrom, in his study of cooperative in the region (1989:30-31) finds that entreprenurial behavior was “enhanced by collective intents … [with] small-mid-sized firms operating in market conditions where traditionally capitalist and more ‘left’-oriented cooperative functioned side-by-side in a network of towns and mid-sized cities using [the latest technology]”. He suggests that local governments and local populations tended to support creation of alternative governance forms in business, fostering an environment for experimentation with structural forms. Bartlett et al examined “the effects of employee ownership and control on entrepreneurial behavior in comparison with privately owned profit-maximizing firms”, in a study of 49 producer cooperatives and 35 private firms in Emilia-Romagna (1992:103). This study provides comparative data on enterprise objectives; wages and employment; investment; economic performance; and non-economic performance such as strike activity, quit behavior and days lost per employee.

Business and Social Sciences Review (BSSR) Volume 1, Number 1, (July 2011) www.bssreview.org
28
Copyright © 2011 – Society of Business and Social Sciences (London – UK)
Smith discusses "recent institutional responses to growing competition and the need for increased level of innovation" among the Italian cooperatives in Emilia-Romagna and in Mondragon (2001). He claims that these organizations have been able to "maintain the essence of cooperative organization while effectively addressing market pressures". He says that they "not only stay in business, but keep their unusual form, over a period of significant shocks". One of his hypotheses includes a theory of "supporting administrative structures”. In a study of the Italian and Spanish associations of cooperatives, La Lega and Mondragon, he presents results from a systematic comparison of these two systems along nine dimensions. These highlight the impact on the firms of consortia, or industrial, regional and national association (2003:203). Four cases in Emilia-Romagna Four cooperatives were chosen for research because of their size (minimum one thousand participants) and longevity. All had been in operation for more than twenty-five years and have substantial international operations. Preliminary observations and interviews were completed with forty-five managers, members and employees over a period of four weeks, with each interviewee asked to describe and discuss their understanding of the organizational management hierarchy and their understanding of the meaning of entrepreneurship for their company. Permission was granted by managers in all four companies for future in-depth ethnographic studies. The following selected statements about organizational visions, goals and values are drawn from company publications, documents, websites and company histories. Italicized passages highlight stated intentions related to, or illustrating, propositions following the cases. Two pairs of cases are each followed by two propositions. IMOLA Co-operativa Ceramica d'Imola - The Imola Ceramics Cooperative Imola claims to be “the oldest working cooperative in Italy”, originating in “a 16th century craft workshop which, in 1874, after three centuries, became a cooperative”. A founding member, believing that "the union of individual efforts towards a common goal creates one single force greater than the sum of all the individual efforts...decided to let his own workers run his majolica ware and crockery factory on an experimental basis”.
According to its website, Imola is an enterprise that “challenges time itself: self-renewing, strengthened by a corporate culture that makes its products unique, it successfully combines values from the past with future technologies”. A ‘Covenant of Brotherhood’ was drawn up in 1875 in the name of “mutual, long-lasting friendship so that everyone could work together for the common good on both material and moral grounds.” Company documents describe an “unbreakable bond between economics and ethics or, to be more precise, the reintroduction of a more economics-oriented view of ethics that views human well-being in a social context [and]... the importance of work in terms of human fulfillment and the construction of a more caring society.” Founding

Business and Social Sciences Review (BSSR) Volume 1, Number 1, (July 2011) www.bssreview.org
29
Copyright © 2011 – Society of Business and Social Sciences (London – UK)
members believed that “the association’s success, and the individual development of each separate worker, called for personal interests to be left aside”. The company’s official history describes Imola’s internal organization: “ Administration functions were assigned to a Management Committee made up of five workers elected by the company assembly which was also responsible for electing the Managing Director and his Assistant...” “The workers, who formed the very backbone of the co-operative, were divided into members and non-members. When they turned the age of 21, workers were entitled to become members; there were both genuine ‘capitalists’ and co-operative members. You had to have worked for the company on a steady basis for at least three years to be allowed into the first group, whereas one year’s regular work experience let you into the second. Both groups were entitled to the same share of the profits, although the latter could not be elected into official positions and only had an advisory vote at company meetings...”
Imola “gives heavy importance to research, which results in launching new products every year...Each product has two distinct aspects: fashion and technology. The first aims to offer products capable of satisfying and interpreting the tastes and tendencies of the moment. The second aims to offer construction companies products of high technological content and superb aesthetic quality”. Members state their intention to be a leader in the cooperative sector:
“Even nowadays we still need to form co-operative workers, instilling in them that will to give of one’s best for the common cause, moving beyond the idea of personal gain as the only reason for working... “...This respect for work, a reflection of our responsibility towards the entire community, has led to a passion for the creation of quality goods and services that meet our customer's every need. Our responsibility, then, is to nurture this culture of cohesion and moral commitment - which has been the driving force behind our company for 128 years and the true secret of our success - and pass it on to future generations”. CIR Cooperativa Italiana di Ristorazione - Italian Catering Cooperative With six thousand members and approximately 80 premises, CIR is one of the largest self-catering companies in Italy (a Databank survey in 1999 listed CIR as the third company in Italy after McDonald's and Autogrill, with a 5.6% market share). The company operates a variety of venues: “collective catering” (business catering, catering for schools, hospital catering, catering for the armed forces, for rehabilitation centers and for communities) as well as commercial catering specializing in banquets. Through franchising and the development of pilot premises, CIR intends to promote development of managerial skills . As founding members describe their vision, the company’s goal “is to develop the catering service formulas drawn up by CIR with

Business and Social Sciences Review (BSSR) Volume 1, Number 1, (July 2011) www.bssreview.org
30
Copyright © 2011 – Society of Business and Social Sciences (London – UK)
managerial methods of franchising...CIR will also try to meet the demand of young people, of small family enterprises, of new entrepreneurial subjects wishing to start up an activity in catering service sector who can rely on the help, assistance and experience..." CIR’s pilot catering companies “...help candidates to learn the characteristics of the premises that they will eventually be able to run independently, evaluate the earning possibilities and follow specific courses. The main objective of CIR to assist these candidates from the point of view of both managing and marketing”. CIR’s mission statement lists the following goals:
To guarantee security of employment and optimum financial, social and professional conditions for its member-employees. To encourage a responsible and independent attitude in the workplace.
To provide members-consumers with products and catering services that are as convenient, healthy and safe as possible, so they may make basic choices as regards the nature of the service and to act as spokesperson, carrying out checks and quality controls on behalf of all consumers.
To encourage the nutritional awareness of consumers, so they may make informed choices.
To encourage a market situation that safeguards buying power and health.
To respect the work of employees and their contribution in terms of creativity and dedication.
To preserve our history and increase the wealth of the cooperative to guarantee the ongoing innovation we need.
To base each business relationship on the principles of transparency, fairness and efficiency.
To carry out social and business activities in a responsible manner so that members and employees behave in a manner consistent with the civic and social values typical of the cooperative spirit in all their dealings, services rendered and contractual activities. These examples of goal statements from IMOLA and CIR highlight commitments to successful business combined with concerns about fairness, “the cooperative spirit” and employment security. Proposition 3 Espousedly democratic firms will engage in behavior that is simultaneously democratic and business-oriented, that is, democratic behavior consistent with success of the firm. This recurrent behavior links the commitment to being a democratic institution with the work of functioning as a successful business.
Business and Social Sciences Review (BSSR) Volume 1, Number 1, (July 2011) www.bssreview.org
31
Copyright © 2011 – Society of Business and Social Sciences (London – UK)
Proposition 4 Organizational cultures in conventional participatory firms and espousedly democratic firms will have similar ritual and other cultural features as part of a developed participatory culture including rituals of communication, deliberation, decision-making, and individual voice; symbolic group events and projects; and rituals of community-building and social responsibility. SACMI Societa Anonima Co-operativa Meccanica d'lmola - Anonymous Co-operative Society of Imola Mechanics Founded by nine mechanics during the 1930’s, SACMI is now one of the world’s largest manufacturer of tile-producing machines. According to an official company:
“After the Second World War, SACMI's mechanics repaired the presses of a tile manufacturing company. This was the beginning of a new era. After that SACMI increased production step by step until it was manufacturing all machines required by the ceramics industry for the production of tiles…25 percent of profits were to be devoted to backing the struggle of the working class, while 50 would go to reserve, 20 to members, and the remaining 5 to promoting the co-operative ideal...” Globalization has played a key strategic role. Members believe that "emphasis on exports does not only mean making its market share grow, but also and above all, being able to respond to the requirements of each individual country." SACMI has taken over several Italian and foreign companies with similar or related business lines, becoming a group of more than thirty-five Italian and foreign firms. Company documents describe SACMI’s approach to innovation: “The company has introduced an ‘on process-based’ company management policy due to market globalization and increasingly unpredictable changes of the economic, social and political environment...The purpose of the process-based model is to work out the most suitable sequence and ensure the fullest integration of the various activities carried out by the individual management units, for the attainment of specific, common and shared goals...
“In the process-based company’s management policy, a process is not directly identified with one individual management unit or specific function. The rising company processes of different functions and operating units leads a change of vertical company structure into a more horizontal, relational structure. The company believes that the medium and long term effects of this readjustment will be beneficial for the achievement of a new competitive advantage: prompt response to the customer and market, increased flexibility, quality of products and services and innovating potential.” Company documents describe a view of entrepreneurship in the context of a cooperative firm:
Business and Social Sciences Review (BSSR) Volume 1, Number 1, (July 2011) www.bssreview.org
32
Copyright © 2011 – Society of Business and Social Sciences (London – UK)
“[the] entrepreneurial spirit is to be found in any individual or group of people who are prepared to risk their capital. In a cooperative there are many ‘entrepreneurs’- each shareholder is one.
CMC Cooperativa Muratori e Cementisti - Cement Workers and Masons Cooperative Founded by a group of thirty-five masons in 1901, CMC began operation in the Italian building and land reclamation sector. With a total workforce of over 5,000, CMC is currently one of the largest cooperatives in Europe operating in the civil construction field. After World War II the company “took part in the reconstruction process and in the considerable growth of Italy’s infrastructure and industrial structure. The company participated in the construction of the first Italian domestic highways and has “become dominant in the maritime, hydraulic engineering and transportation fields”. Since the 1960’s technological development led to increasing professional qualifications of members, and the adoption of new construction technologies. In 1975 the company began operating overseas and has worked in large construction projects for infrastructure development and buildings in over 20 countries. A company document describes the structure of the cooperative: “The company’s managers, middle management personnel, engineers and white and blue-collar staff are CMC’s most important resource. It is with them and through them that CMC. has developed the know-how and ability to address even the most complex issues. This process of close involvement is further reinforced by the cooperative structure of the firm which encourages the direct participation of all members and employees in decision-making processes and in the running of sites, offices and services”. The company’s mission states: “CMC’s tradition is important not only for the company but for the whole cooperative movement. The Cooperative must continue to be that social and organizational laboratory that was fundamental to its history ". The mission continues with the following goal statements: To realize the pact between the associates to cooperate in such a way as to increase the value of their enterprise and of their job. To develop the democratic basis for governing of the cooperative and to develop participation as a means of expression of the abilities and aspirations of all. To grow the enterprise, its ability to compete, its possibility to expand itself, its will to innovate and to invest. To render the production of value for the market, the backers and the communities...

Business and Social Sciences Review (BSSR) Volume 1, Number 1, (July 2011) www.bssreview.org
33
Copyright © 2011 – Society of Business and Social Sciences (London – UK)
To demonstrate to the knowledge and the responsibility of constructors who have to heart the emergency of the physical and social atmosphere… To represent in objects and in behaviors the values of the cooperative members who are the history of CMC, in order to transmit these to future generations… These excerpts from SACMI and CMC point to organizational systems of governance as well as concerns about technology and innovation. Statements evoke issues such as decision-making processes, compensation, and communication. The following propositions suggest characteristics of these systems and how OD programs for change may be explored using these cooperative cases. Proposition 5
Dual and parallel systems for governance will develop in espousedly democratic firms, representing ownership interests on one hand, and managerial-technology-innovation processes on the other hand. These two subsystems exist as institutionally separate, but are one in the sense that members collaborate to create and enact the various parts and processes of the system. Proposition 6
In both espousedly democratic firms and conventional participatory firms central problems will include 1) egalitarian concerns about compensation policy; 2) communication and involvement in decision-making, involvement processes and mechanisms; 3) the specifics of representative governance mechanisms and decision-making power.
Conclusions and future research This paper speculates that research on firms such as the cooperatives of Emilia-Romagna will allow us to explore democratizing intents and values that shape organization systems, leading to organizational systems similar to, and different from, those created through OD interventions. OD system change frequently focuses on increased participation of employees, people-focused systems and large scale organizational learning attempts. The successes and failures in these cooperatives contribute to our understanding of a general project of organizational change that democratizes ownership and management of firms. The propositions presented here, based on research to date, are preliminary to ethnographic research on large cooperatives. Themes developed from such ethnographies will allow us to explore the day-to-day reality in large cooperatives and confirm or contradict the links suggested here between management systems in OD and change practice and models, and management systems espousedly democratic firms.
REFERENCES Ackoff, R. (1994) The Democratic Corporation. New York: Wiley.

Business and Social Sciences Review (BSSR) Volume 1, Number 1, (July 2011) www.bssreview.org
34
Copyright © 2011 – Society of Business and Social Sciences (London – UK)
Argyris, C. and D. Schon (1974) Theory in Practice: Increasing Professional Effectiveness. San Francisco, CA: Jossey-Bass. Argyris, C. and D. Schon (1978) Organizational Learning. Reading, Mass.: Addison-Wesley. Bardhan, P., S. Bowles and M. Wallerstein (2006) Globalization and Egalitarian Redistribution. Princeton: Princeton University Press. Bartlett, W., J. Cable, S. Estrin, D. C. Jones and S. C. Smith (1992) ‘Labor-managed Cooperatives and Private Firms in North Central Italy: an Empirical Comparison’, Industrial and Labor Relations Review 46(1): 103-118. Bassani, A. (2000) It All Began with Nine Mechanics...SACMI – Eighty Years of Growth and Development. Imola: Editrice La Mandragora. Batstone, E (1983) ‘Organization and Orientation: A Life Cycle Model of French Co-operatives’, Economic and Industrial Democracy 4: 2, 139-161.Cornfor Blasi, J. and D. Kruse (1992) The New Owners. HarperInformation. Blasi, J., D. Kruse, and A. Bernstein (2003) In the Company of Owners: The Truth about Stock Options (and Why Every Employee Should Have Them). New York: Basic Books Group. Blumberg, P. (1968) Industrial Democracy: the Sociology of Participation. London: Constable. Bowles, S. and H. Gintis (1986) Democracy and Capitalism: Property, Community and the Contradictions of Modern Social Thought. New York: Basic Books. Bowles, S. and H. Gintis (1996) ‘Is the Demand for Workplace Democracy Redundant in a Liberal Economy?’ in U. Pagano and R. Rowthorn (eds) (1996) Democracy and Efficiency in the Economic Enterprise. New York: Routledge. Bowles, S., ed., et al. (1993) Markets and Democracy. Cambridge: Cambridge University Press. Bowles, S. and H. Gintis (1996) ‘The Distribution of Wealth and the Viability of the Democratic Firm’, in U. Pagano and R. Rowthorn (eds) (1996) Democracy and Efficiency in the Economic Enterprise. New York: Routledge. Bradley, K. and A. Gelb (1983) Cooperation at Work: The Mondragon Experience. London: Heinemann Educational Books Ltd.
Business and Social Sciences Review (BSSR) Volume 1, Number 1, (July 2011) www.bssreview.org
35
Copyright © 2011 – Society of Business and Social Sciences (London – UK)
Brown, L. (1985) ‘Democracy in Organizations: Membership Participation and Organizational Characteristics’, Organization Studies 6:313. Business Week (1996) ‘United We Own’. March 18: 96-102. Bussel, R. (1997) ‘Business Without a Boss: The Columbia Conserve Company and Workers’ Control, 1917-1943’, Business History Review 71(3): 417, 27pp. Carnoy, M. and D. Shearer (1980) Economic Democracy: the Challenge of the Eighties. New York: M.E. Sharpe, Inc. Carvajal, D. (2001) ‘Musicians are Gaining Bigger Voice in Orchestras’, New York Times. Case, J., C. Rosen, M. Staubus (2005) Equity: Why Employee Ownership is Good for Business. Cambridge: Harvard Business School Press. Cloke, K. and J. Goldsmith (2002) The End of Management and the Rise of Organizational Democracy. San Francisco: Jossey-Bass. Cooperativa Muratori & Cementisti C.M.C. di Ravenna (1994), company publication. Cornforth, C. J. (1983) ‘Some factors affecting the success or failure of worker co-operatives: a review of empirical research in the UK’, Economic and Industrial Democracy 4:2. Cornforth, C. (2004) ‘The Governance of Cooperatives and Mutual Associations; a Paradox Perspective’, Annals of Public and Cooperative Economics 75(1): 11. Dahl, R. A. (1989) Democracy and its Critics. New Haven: Yale University Press. Deetz, S. A. (1992) Democracy in an Age of Corporate Colonization. Albany: State University of New York Press. Dewey, J. (1939/1979) Freedom and Culture. New York: Paragon Books. Dow, G. (2003) Governing the Firm: Workers Control in Theory and Practice. Cambridge: Cambridge University Press. Ellerman, D. (1999) ‘The Democratic Firm: an Argument Based on Ordinary Jurisprudence’, Journal of Business Ethics 21:111-124. Erdal, D. (1999) The Psychology of Sharing: an Evolutionary Approach, unpublished doctoral dissertation, St. Andrews University.

Business and Social Sciences Review (BSSR) Volume 1, Number 1, (July 2011) www.bssreview.org
36
Copyright © 2011 – Society of Business and Social Sciences (London – UK)
Espinosa, J. and A. Zimbalist (1978) Economic Democracy: Worker Participation in Chilean Industry 1970-1973. New York: Academic Press. Feder, B. J. (1998) ‘The Little Project That Couldn’t: Others Learn From a Failed Test in Worker Democracy’, New York Times (January). Fenton, T. (2006) ‘Democracy in the Workplace’, The Christian Science Monitor. Frege, C. M. (2005) ‘Discourse of Industrial Democracy: Germany and the US Revisited’, Economic and Industrial Democracy 26(1): 151-175. Greenwood, D., J.L.G. Santos et al (1992) Industrial Democracy as Process. Stockhom: Van Gorcum, Assen/Maastricht. Gunn, C. (1984) Workers’ Self-Management in the United States. Ithaca, N.Y.: Cornell University Press. Gustavson, B. (1983) ‘Workplace Reform and Democratic Dialogue’, Economic and Industrial Democracy 6(4): 461-479. Gustavson, B. and G. Hunnius (1982) New Patterns of Work Reform: The Case of Norway. Oslo: Universitetsforlaget. Hansmann, H. (1996) The Ownership of Enterprise. Cambridge: Harvard University Press. Hatcher, T. (2006) ‘Democratizing the Workplace Through Professionalization of Human Resource Development’, International Training and Development 10(1):67-82. Hernandez, S. (2006) ‘Striving for Control: Democracy and Oligarchy at a Mexican Cooperative’, Economic and Industrial Democracy 27(1): 105-135. Holmstrom, M. (1989) Industrial Democracy in Italy: Workers Co-ops and the Self Management Debate. Aldershot, UK: Avebury, Gower Publishing Company Limited. Houston, R. (2001) ‘Participation as Chaos: Lessons from the Principles of Complexity Theory for Democracy’, World Futures 57(4): 315-338. Huse, E. F. and T. G. Cummings (1985) Organization Development and Change. New York: West Publishing Company. Imola Ceramics Co-operative (1998) The Imola Ceramics Co-operative: Over a Century’s Experience. Imola: Gruppo Editoriale Faenza Editrice S.p.A.
Business and Social Sciences Review (BSSR) Volume 1, Number 1, (July 2011) www.bssreview.org
37
Copyright © 2011 – Society of Business and Social Sciences (London – UK)
Johnson, P. (2006) ‘Whence Democracy? A Review and Critique of the Conceptual Dimensions and Implications of the Business Case for Organizational Democracy’, Organization 13(2): 245-274. Jones, D. (1980) “Producer Co-Operatives in Industrialized Western Economies”, British Journal of Industrial Relations XVIII (2) 141-154. Kato, T. and J. Pliskin (eds) (2003) The Determinants of the Incidence and the Effects of Participatory Organizations. Amsterdam: Elsevier Science Ltd. Kaufman, B. E. (2000) ‘The Early Institutionalists on Industrial Democracy and Union Democracy’, Journal of Labor Research 21(2): Kenworthy, L. (2004) Egalitarian Capitalism: Jobs, Incomes, and Growth in Affluent Countries. New York: Russell Sage Foundation. Kerr, J. L. (2004) ‘Limits of Organizational Democracy’, Academy of Management Executive 18(3):81-94. Kruse, D.(2002) ‘Research Evidence on the Prevalence and Effects of Employee Ownership’, Journal of Employee Ownership Law and Finance 14(4): 65-90. Kunda, G. (1991) Engineering Culture: control and Commitment in a High Technology corporation. Chicago: University of Chicago Press. Lawler, E. E. III. (1992) High Involvement Management. San Francisco: Jossey-Bass. Macmillan. Lewin, K. (1951) Field Theory in Social Science. New York: Harper & Row. Lima, J.C. (2007) ‘Workers' Cooperatives in Brazil: Autonomy vs Precariousness’, Economic and Industrial Democracy 28 (4): 589-621. Locke, E. A. and D. M. Schweiger (1979) ‘Participation in Decision-Making: One More Look’, Research in Organizational Behavior 1:265-340. Logue, J. and J. S. Yates (1999) ‘Worker Ownership American Style: Pluralism, Participation and Performance’, Economic and Industrial Democracy, 20:225-252. Logue, J.(2005/2006) ‘Economics, Cooperatives and Employee Ownership: the Emilia-Romagna Model’, Owners at Work XVII(2):4-9. Mansbridge, J. J. (1983) Beyond Adversary Democracy. Chicago: University of Chicago Press.
Business and Social Sciences Review (BSSR) Volume 1, Number 1, (July 2011) www.bssreview.org
38
Copyright © 2011 – Society of Business and Social Sciences (London – UK)
March, J. G. and J. P. Olsen (1995) Democratic Governance. New York: Free Press. Mayer, R. (2000) ‘Is There a Moral Right to Workplace Democracy’? Social Theory and Practice. Melman, S.(2001) After Capitalism: From Managerialism to Workplace Democracy. New York: Random House, Inc. Michels, R. (1911/1962) Political Parties. New York: Free Press. Mill, J. S. (1848) Principles of Political Economy. Oakeshott, R. (2000) Jobs and Fairness: the Logic and Experience of Employee Ownership. Wilby, Norwich: Michael Russell.
O'Connor, E. S. (1999) ‘The Politics of Management Thought: a Case Study of the Harvard Business School and the Human Relations School’, Academy of Management Review 24(1): 117-131. O’Toole, J.and E. E. Lawler III (2006) The New American Workplace. New York: Palgrave MacMillan. Pagano, U.and R.Rowthorn, eds. (1996) Democracy and Efficiency in the Economic Enterprise. New York: Routledge. Pateman, C. (1970) Participation and Democratic Theory. New York: Cambridge University Press. Perotin, V. and Andrew R.(2004) Employee Participation, Firm Performance and Survival. New York: JAI Press Elsevier. Perry, S.E. and H.C. Davis (1985) ‘The Worker-Owned Firm: The Idea and Its Conceptual Limits’, Economic and Industrial Democracy, 6:3 275-297. Pfeffer, J. (1998) The Human Equation: Building Profits by Putting People First. Boston: Harvard Business School Press. Piore, M. J. and C. F. Sable (1984) The Second Industrial Divide. New York: Basic Books. Poutsman, E., P. Kalmi and A.D. Pendleton (2006) ‘The Relationship Between Financial Participation and Other Forms of Employee Participation: New Survey Data from Europe’, Economic and Industrial Democracy 27 (4):637-667.
Business and Social Sciences Review (BSSR) Volume 1, Number 1, (July 2011) www.bssreview.org
39
Copyright © 2011 – Society of Business and Social Sciences (London – UK)
Przeworski, A. (1991) Democracy and the Market. Cambridge: Cambridge University Press. Putnam, R. O. (1995) ‘Bowling Alone’, Journal of Democracy: 66. Putnam, R.O. (1993) Making Democracy Work: Civic Traditions in Modern Italy. Princeton: Princeton University Press. Rosen, C., J.Case and M. Staubus (2005) Equity: Why Employee Ownership is Good For Business. Boston: Harvard Business School Press. Roth, W. (2000) ‘Dealing With the Corporate Hot Dogs’, The Journal for Quality and Participation, Fall. Rothschild-Whitte, J. (1976) ‘Conditions Facilitating Participatory-Democratic Organizations’, Sociological Inquiry 46(2): 75-86. Russell, R. (1985) Sharing Ownership in the Workplace. Albany: State University of New York Press. Schein, E.(1969) Process Consultation: Its Role in Organization Development. Reading, Mass.: Addison-Wesley. Sen, A. (2003) Democratic Management: The Path to Total Quality with Total Liberty and Equality. Lanham: University Press of America Senge, P. (1990) The Fifth Discipline. New York: Doubleday Currency. Sesil, J. C., D. Kruse and J. Blasi (2003) ‘Sharing Ownership via Employee Stock Ownership’ in L. Sun (ed) Ownership and Governance of Enterprises: Recent Innovation. New York: Palgrave MacMillan. Smith, S. C. (2003)‘Network Externalities and Cooperative Networks: Stylized Facts and Theory’, in L. Sun (ed) (2003) Ownership and Governance of Enterprise: Recent Innovative Developments, pp. 202-241. New York: Palgrave MacMillan. Smith, S. C. (2001) ‘Cooperative Adaptation and Organizational Comparative Advantage in Mondragon and the Italian Lega, unpublished conference paper, "Property Rights Regimes, Microeconomic Incentives, and Development", WIDER, Helsinki, April. Smith. V. (ed) (2006) Worker Participation: Current Reseach and Future Trends. New York: Elsevier. Stern, R. (1988) 'Participation by Representation', Work and Occupations 15(4): 396-422.

Business and Social Sciences Review (BSSR) Volume 1, Number 1, (July 2011) www.bssreview.org
40
Copyright © 2011 – Society of Business and Social Sciences (London – UK)
Sun, L. (2003) ‘Evolving and Functioning Mechanisms of Employee Stock Ownership in China’s Township and Village Enterprises’, in L. Sun (ed), Ownership and Governance of Enterprise, 159-181. New York: Palgrave MacMillan. Sun, L. (ed) (2003) Ownership and Governance of Enterprise: Recent Innovative Developments. New York: Palgrave MacMillan. Sun, L. (1994) ‘Innovation and Market Strategy in Italian Industrial Cooperatives: Econometric Evidence on Organizational Comparative Advantage’, Journal of Economic Behavior and Organization 23: 303-320. Taylor, P. L.(1994) ‘The Rhetorical Construction of Efficiency: Restructuring and Industrial Democracy in Mondragon, Spain’, Sociological Forum 9(3): 459-489. Trice, H. M. and J. M. Beyer (1993) The Cultures of Work Organizations. Englewood Cliffs, New Jersey: Prentice Hall. Trice, H.M. and J.M. Beyer (1984) ‘Studying organizational cultures through rites and ceremonials’, Academy of Management Review 9(4):653-690. Trist, E. and K. Banforth (1951) ‘Some Social and Psychological Consequences of the Long Wall Method of Coal Getting’, Human Relations 4: 3-38. Tyomkina, A. (1993) ‘The Problem of Advancing Industrial Democracy in a Post-Socialist Society’, Economic and Industrial Democracy 14: 29-42. Vanek, J. (1971) Self-Management: Economic Liberation of Man. Baltimore: Penquin Books, Ltd. Viggiani, F. A. (1999) ‘Doing the Right Thing: Organizational Structure and Process for Democratic Governance of the Firm’, Industrial Relations Journal, 30:3 Viggiani, F. A. (1997) ‘Democratic Hierarchies in the Workplace’, Economic and Industrial Democracy 18(2): 231-260. Viggiani, F. A. (1991) Democratic Hierarchies in the Workplace. Unpublished doctoral dissertation. Cornell University. Westenholz, A. (1999) ‘From a Logic Perspective to a Paradox Perspective in the Analysis of an Employee-owned Company’, Economic and Industrial Democracy 20(4): 503-534. Whyte, W. F. and K. K. Whyte (1988) The Making of Mondragon. Ithaca, NY: ILR Press.

Business and Social Sciences Review (BSSR) Volume 1, Number 1, (July 2011) www.bssreview.org
41
Copyright © 2011 – Society of Business and Social Sciences (London – UK)
The Effectiveness of Implementation of 5S on Employee Motivation
Wan Asri Wan Abdul Aziz, Senior Lecturer, Faculty of Business Study
Universiti Teknologi MARA, Dungun, Terengganu, Malaysia Email: [email protected]
Phone number: 0129564092
Azman Che Mat, Associate Professor Dr, Academy of Language Study
Universiti Teknologi MARA, Dungun, Terengganu, Malaysia Email: [email protected]
Phone number: 0139818980
ABSTRACT The main purpose of this study is to examine the relationship between
implementation factors of 5S (organizational culture, management role, employee
involvement and training for 5S) and employee motivation. A total of 154
respondents from Universiti Teknologi MARA (UiTM) Terengganu located in Dungun
and Kuala Terengganu was selected as samples in this study using stratified
random sampling techniques. A survey questionnaire was employed for data
collection. The study hypotheses were tested using Pearson Correlation analysis and
multiple regressions. The result of the Pearson Correlation analysis revealed that
Organizational culture for 5S, Management Role and 5S training have a significant
relationship with employee motivation, r=0.545**, 0.320**, 0.583**, p<0.01,
respectively. However, there was significant relationship between employee
Involvement (r=0.198, p<0.05) and employee motivation. The result of the Multiple
Regressions shows that organizational culture, training and management role for
5S are the most influence of variance on employee motivation outcome.
Area: Management / Strategy Keywords: Organizational culture, Management Role, Motivation, Training, 5S
INTRODUCTION
Developing countries are gradually restructuring their economic systems-government interventions are downsized and market mechanisms are facilitated. Many public-owned organizations are privatized, with the aim of improving efficiency and quality.
Research by Ho (1995) has shown that the western world seldom recognizes the significance of the 5-S practice although there are indications that some companies have included some aspects of the 5-S in their routines without being aware of its existence as a formalized technique. There are many examples of successful implementation of some
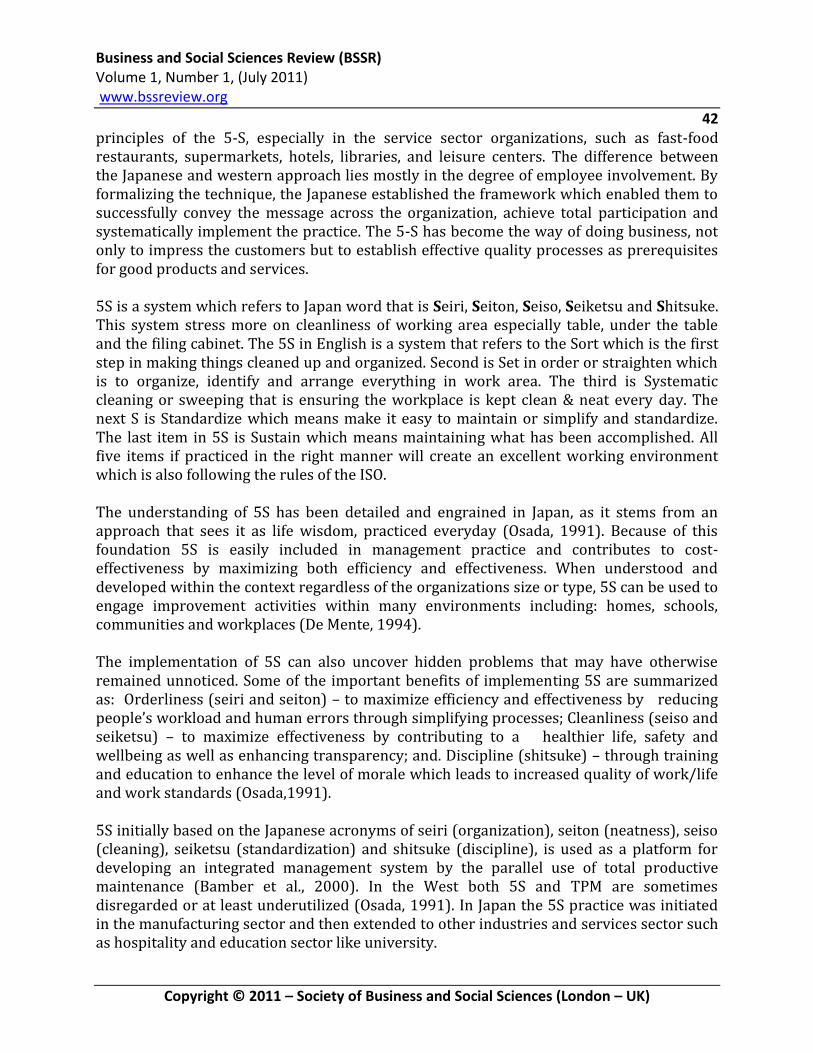
Business and Social Sciences Review (BSSR) Volume 1, Number 1, (July 2011) www.bssreview.org
42
Copyright © 2011 – Society of Business and Social Sciences (London – UK)
principles of the 5-S, especially in the service sector organizations, such as fast-food restaurants, supermarkets, hotels, libraries, and leisure centers. The difference between the Japanese and western approach lies mostly in the degree of employee involvement. By formalizing the technique, the Japanese established the framework which enabled them to successfully convey the message across the organization, achieve total participation and systematically implement the practice. The 5-S has become the way of doing business, not only to impress the customers but to establish effective quality processes as prerequisites for good products and services.
5S is a system which refers to Japan word that is Seiri, Seiton, Seiso, Seiketsu and Shitsuke. This system stress more on cleanliness of working area especially table, under the table and the filing cabinet. The 5S in English is a system that refers to the Sort which is the first step in making things cleaned up and organized. Second is Set in order or straighten which is to organize, identify and arrange everything in work area. The third is Systematic cleaning or sweeping that is ensuring the workplace is kept clean & neat every day. The next S is Standardize which means make it easy to maintain or simplify and standardize. The last item in 5S is Sustain which means maintaining what has been accomplished. All five items if practiced in the right manner will create an excellent working environment which is also following the rules of the ISO.
The understanding of 5S has been detailed and engrained in Japan, as it stems from an approach that sees it as life wisdom, practiced everyday (Osada, 1991). Because of this foundation 5S is easily included in management practice and contributes to cost-effectiveness by maximizing both efficiency and effectiveness. When understood and developed within the context regardless of the organizations size or type, 5S can be used to engage improvement activities within many environments including: homes, schools, communities and workplaces (De Mente, 1994).
The implementation of 5S can also uncover hidden problems that may have otherwise remained unnoticed. Some of the important benefits of implementing 5S are summarized as: Orderliness (seiri and seiton) – to maximize efficiency and effectiveness by reducing people’s workload and human errors through simplifying processes; Cleanliness (seiso and seiketsu) – to maximize effectiveness by contributing to a healthier life, safety and wellbeing as well as enhancing transparency; and. Discipline (shitsuke) – through training and education to enhance the level of morale which leads to increased quality of work/life and work standards (Osada,1991).
5S initially based on the Japanese acronyms of seiri (organization), seiton (neatness), seiso (cleaning), seiketsu (standardization) and shitsuke (discipline), is used as a platform for developing an integrated management system by the parallel use of total productive maintenance (Bamber et al., 2000). In the West both 5S and TPM are sometimes disregarded or at least underutilized (Osada, 1991). In Japan the 5S practice was initiated in the manufacturing sector and then extended to other industries and services sector such as hospitality and education sector like university.

Business and Social Sciences Review (BSSR) Volume 1, Number 1, (July 2011) www.bssreview.org
43
Copyright © 2011 – Society of Business and Social Sciences (London – UK)
Problem Statement In many organizations, whether it is manufacturing or services, cleanliness is very important in ensuring that workers are working comfortably and in good condition. With proper system used, it is a way to develop and care about quality at workplace. Housekeeping is one of the factors that influence quality improvement. In organizations that have been awarded with ISO compliance, it is a must for them to practice a good housekeeping. This is because with good housekeeping, they can improve their effectiveness and efficiency. The famous housekeeping model is 5-s which had been introduced by Japanese management. In ‘5S’, it is an effective approach to motivate workers, increase the productivity and having a good working environment. The 5S philosophy is to make sure that whole company staffs involve in every activity of 5S. With the implementation of 5S, many benefits will be gained such as quality working environment, increase of morale among workers, increase security, save time and cost and the most important thing is increase productivity and quality of workers. But in education sector, do they practice the housekeeping? Does the management encourage and support their employee in practicing housekeeping. This has caused organizations to overlook the crucial elements needed in the implementation of 5S. Thus, this issue has led to the study on the relationship between 5S implementation factors and perceived employee motivation. Objectives This research was conducted to analyze which 5S implementation factors (Organizational culture for 5S, Management Role, employee involvement and training for 5S) that will influence employee motivation.
LITERATURE REVIEW The 5s and theories are a set of straightforward steps to continual improvement. In practice, implementation of 5s is influenced by human factors and resource limitations that can interfere with the effectiveness of this technique. Maull et al. (2001) warns against the assumptions that culture is homogenous throughout an organization. Furthermore, their study into cultures within organizations revealed very different result for different departments. Based on McDonald (1998), criticizes the adoptions of the latest fad without consideration of suitable cultural fit. He also warns against undertaking a company-wide improvement initiative without first understanding the need for change and the assessment of cultural barriers to change. Bicheno (1998) lists management participation and interest as vital to keep a “5-S” program going. management must seen to practice 5-S themselves and to maintain commitment in practice, because of plethora of human factor that come into play, the situation is far more complex and the route to implementation and use of 5-S is not so clear cut. In their investigation into quality culture, Corbett and Rastrik (2000) describe the long held consensus that culture is an important component of business success and quality improvement. Kitazawa and Sarkis (2000) cultural change is necessary to support the implementation of environmental source reduction. Top management within an environmentally conscious organization should strive for a strong culture that allows its employee the freedom to make environmental improvement (Mallak

Business and Social Sciences Review (BSSR) Volume 1, Number 1, (July 2011) www.bssreview.org
44
Copyright © 2011 – Society of Business and Social Sciences (London – UK)
and Kurstedt, 1996). Darling (1992) says the importance of leadership and culture to the success of any organizational change effort is widely accepted. Classic model of change emphasizes the role of culture when it describes the process of “unfreezing” established norms and patterns and the “subsequence” movement toward a healthier, more adaptive pattern of response. It is therefore not a surprise that the literature on total quality management (TQM) has included leadership and culture as factors critical to the success of TQM initiatives. Management research has found that the commitment of top management is crucial to the success of any effort aimed at changing the operational philosophy of the organization. Without the support of management the behaviour of the members of the organization is unlikely to change. It has been argued that change will be more successful if upper management is committed to the change (Senge,1990). The critical role of top managers in shaping the success of strategic changes in organizations is also noted often (Bourgeois and Eisenhardt, 1988). Top management plays a decisive role in paradigm shifts in critical areas such as quality management, product development and innovation (Hoffman and Hagerty, 1994; Johne and Snelson, 1989; Krantz, (1989) mention, this strong influence attributed to top management is not terribly surprising. Employees throughout the organization need to impress upper management in order to advance up the corporate ladder. When top management reveals its commitment to a given strategy, this provides subordinates with salient clues for impressing upper management. Thus, when a firm attempts to implement a planned change, employees at all levels are more likely to invest time and effort in the change program if that program has the full and credible support of top management. Jeroen et al. (2007) claims that focusing on the innovative behaviour of employees and the role leaders have a play in enabling and enhancing such behaviour. Previous work has indicated that employees’ innovative behaviour depends greatly on their interaction with others in the workplace. In general, leaders have a powerful source of influence on employees’ work behaviour. Largely top management and organizational structure determine the culture of a firm. Human factors such as personalities of top and middle management influence the communication dynamics of a firm, which in turn determines the extent of involvement and motivation at the operative level. Managing improvement and change of practice even in a small firm requires strong leadership by example, not words. Opportunities to involve those at lower levels in the organization in improvement initiatives are created mainly at the top and cascade to middle managers. The success or failure of improvement techniques such as the 5Ss lies therefore in the hands of top management, as they play the key role in establishing the firm's culture
Bamber et al. (2000) suggests that 5S and TPM can be practiced not only simultaneously but also in conjunction with other process improvement methods used in total quality management (TQM), kaizen and just in time (JIT) methods so that organisations can take an integrated approach, which incorporates EMS. This view is empirically supported by Zutshi and Sohal (2005) who identified that there are benchmarking standards available

Business and Social Sciences Review (BSSR) Volume 1, Number 1, (July 2011) www.bssreview.org
45
Copyright © 2011 – Society of Business and Social Sciences (London – UK)
for the EMS which can be used to achieve optimum levels of operations or “best practice” in Australia, as shown in Figure 1.In practice, enormous effort may be required to achieve this integrated management system. Therefore small-to-medium organizations may resist taking this view due to economy of scale. Researchers recommend considering 5S in a more philosophical or at least strategic way. When 5S becomes a way of doing business, operations will need to be approached differently due to the behavioural changes required as a basis for 5S to succeed. While Sanjay (1998) says that high top management commitment propels TQM by creating values, goals, and systems that lead to satisfied customers and improved organizational performance. Sincere efforts by top management go beyond slogans and provide vision and broad goals that direct quality efforts. Furthermore, effective top managers conduct realistic assessments of resource requirements and plan for these resources. The clarity of quality goals in an organization determines the effectiveness of the quality efforts. A top management team committed to quality conveys the philosophy that quality receives priority over cost and schedule, and that in the long run, superior and consistent quality leads to improvements in cost and delivery performance. Upper management should not only give quality the highest priority possible, but upper management should also demonstrate its commitment to quality by providing adequate resources for implementing quality management. In particular, this is accomplished through investments in human and financial resources. Employee involvement strategies like quality circles and cross-functional teams have been used successfully by many organizations to realize gains in different phases of quality improvement.
Based on Flynn et al. (1995), an empirical assessment of the manner in which it affects quality efforts and outcomes has not been undertaken. An understanding of the role of top management commitment in quality efforts is pivotal to enhancing the success rates of integrated quality management programs. The impact top management commitment has on the various dimensions (constructs) of quality management, such as customer focus, benchmarking, and employee empowerment has not been empirically studied. Pace (1989) said, employee involvement is a process designed to empower members of an organization to make decisions and to solve problems appropriate to their level in the organization. To participate effectively, employees must be given more responsibility. Refer to Ross (1994) stated at the heart of TQM is the concept of intrinsic motivation-involvement in decision making. It is becoming an increasingly popular maxim of good management that human resources are the most important dimension in quality and productivity improvement.
In the implementation of 5S, every employee, from entry-level of workers to the CEO, requires training in 5S philosophies and techniques. This is evident in the philosophies of Deming, Juran and Crosby. Training is necessary to reach a common understanding of goals and objectives and the means to attend them. Training usually begins with awareness in quality management principles and is followed by particular skills in quality improvement. Training must be viewed as a continuous effort, not a one-time project. Many companies recognized the need to achieve cultural changes through training by focusing on
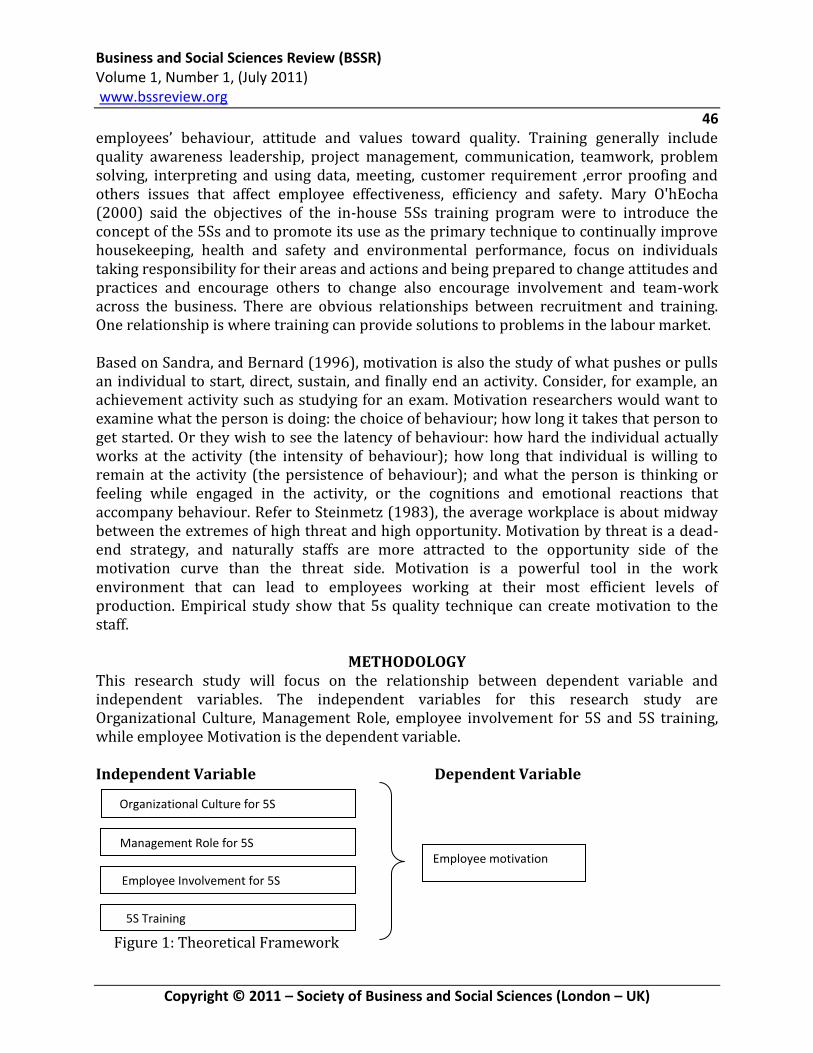
Business and Social Sciences Review (BSSR) Volume 1, Number 1, (July 2011) www.bssreview.org
46
Copyright © 2011 – Society of Business and Social Sciences (London – UK)
employees’ behaviour, attitude and values toward quality. Training generally include quality awareness leadership, project management, communication, teamwork, problem solving, interpreting and using data, meeting, customer requirement ,error proofing and others issues that affect employee effectiveness, efficiency and safety. Mary O'hEocha (2000) said the objectives of the in-house 5Ss training program were to introduce the concept of the 5Ss and to promote its use as the primary technique to continually improve housekeeping, health and safety and environmental performance, focus on individuals taking responsibility for their areas and actions and being prepared to change attitudes and practices and encourage others to change also encourage involvement and team-work across the business. There are obvious relationships between recruitment and training. One relationship is where training can provide solutions to problems in the labour market.
Based on Sandra, and Bernard (1996), motivation is also the study of what pushes or pulls an individual to start, direct, sustain, and finally end an activity. Consider, for example, an achievement activity such as studying for an exam. Motivation researchers would want to examine what the person is doing: the choice of behaviour; how long it takes that person to get started. Or they wish to see the latency of behaviour: how hard the individual actually works at the activity (the intensity of behaviour); how long that individual is willing to remain at the activity (the persistence of behaviour); and what the person is thinking or feeling while engaged in the activity, or the cognitions and emotional reactions that accompany behaviour. Refer to Steinmetz (1983), the average workplace is about midway between the extremes of high threat and high opportunity. Motivation by threat is a dead-end strategy, and naturally staffs are more attracted to the opportunity side of the motivation curve than the threat side. Motivation is a powerful tool in the work environment that can lead to employees working at their most efficient levels of production. Empirical study show that 5s quality technique can create motivation to the staff.
METHODOLOGY This research study will focus on the relationship between dependent variable and independent variables. The independent variables for this research study are Organizational Culture, Management Role, employee involvement for 5S and 5S training, while employee Motivation is the dependent variable. Independent Variable Dependent Variable
Figure 1: Theoretical Framework
Organizational Culture for 5S
Management Role for 5S
Employee Involvement for 5S
Employee motivation
5S Training

Business and Social Sciences Review (BSSR) Volume 1, Number 1, (July 2011) www.bssreview.org
47
Copyright © 2011 – Society of Business and Social Sciences (London – UK)
Population and Sampling This research study was conducted in UiTM Terengganu which is located in Dungun and Kuala Terengganu, Terengganu. A total of 154 respondents were selected as a sample from the population of 771 staffs. The sampling used was proportionate stratified random sampling. Study instrument In this research study, self-administered questionnaire was used as an instrument for data collection. All items comprise of the statement followed by five Likert scale ranging from 1 (strongly disagree) to 5 (strongly agree). There are 2 sections in the questionnaire which include; Section A - Respondent Profile, Section B – Organizational Culture for the 5S, Management role for the 5S, Employee Involvement for 5 S, 5S training and employee motivation.
The test-retest reliability method was carried out on the items of the questionnaire to ascertain the reliability of the items and also the instrument as a whole. The first run of test, which was administered on 31 respondents, yielded the cronbach alpha reading of 0.878 for the component on organizational culture, 0.897 for the component on management role, 0.833 for the component on employee involvement, 0.778 for the component on 5S training and 0.606 for the component on employee motivation. The overall cronbach alpha reliability level of the all the components were .627, thus proving a moderate reliability level.
STATISTICAL ANALYSES AND FINDING The data was entered and analyzed with the Statistical Package for Social Sciences (SPSS) software programme (version 17.0). For descriptive statistics results were expressed in terms of proportions or percentages and for analytical statistics odds ratios were used to examine the relation between variables. The Pearson correlation analysis was used to examine the relationship between the dependent and independent variables.
Table 3.1 has a listing of the demography of respondents in this study. This study has identified five factors to be concluded in this part. The first factor, job position has showed that most of the respondents are non academics which are 66.2% in percentage. The gender, which is the second factor, proves that female ratio is bigger with 53.5%. Respondents of age between 20-30 years dominate this research as it was conducted as noted in third factors with 62.3%. This table also indicates 89.0% of the respondents have been working less than 10 years. Their education is really moderate with the highest percentage, 67.5% between STPM/Diploma (50.7%) and Degree/master/PhD (16.8%).

Business and Social Sciences Review (BSSR) Volume 1, Number 1, (July 2011) www.bssreview.org
48
Copyright © 2011 – Society of Business and Social Sciences (London – UK)
Table 5.1: Demography by Frequency and Percentage
Variable Frequency Percentage (%)
Job Position Academic Non-academic
52 102
33.8 66.2
Gender Male Female
67 87
43.5 53.5
Age 20 - 30 years 31 – 50 years 51 years and above
96 52 4
62.3 35.1 2.6
Number Year of Working 1 – 3 years 4 – 6 years 7 – 10 years More than 10 years
63 40 34 17
40.9 26.0 22.1 11.0
Education MCE/SPM (Malaysian Certificate Education) STPM (Malaysian High Certificate Education)/Diploma Degree/ Master/PhD
50 78 26
32.5 50.7 16.8
In summary, respondent’s demography in this study is well collected. It will help researchers to find out the detail which will meet the objectives in this study. The following table will relate these factors to the domain analysis of the study. Table 5.2: Correlation between Dependent and Independent Variables
Organisational culture
Management role
Employee involvement
Training Employee motivation
Organisational Culture
1
Management Role
.839(**) 1
Employee Involvement
.679(**) .863(**) 1
Training .554(**) .588(**) .558(**) 1 Employee Motivation
.545(**) .320(**) .198(*) .583(**) 1
** Correlation is significant at the 0.01 level (2-tailed). * Correlation is significant at the 0.05 level (2-tailed).
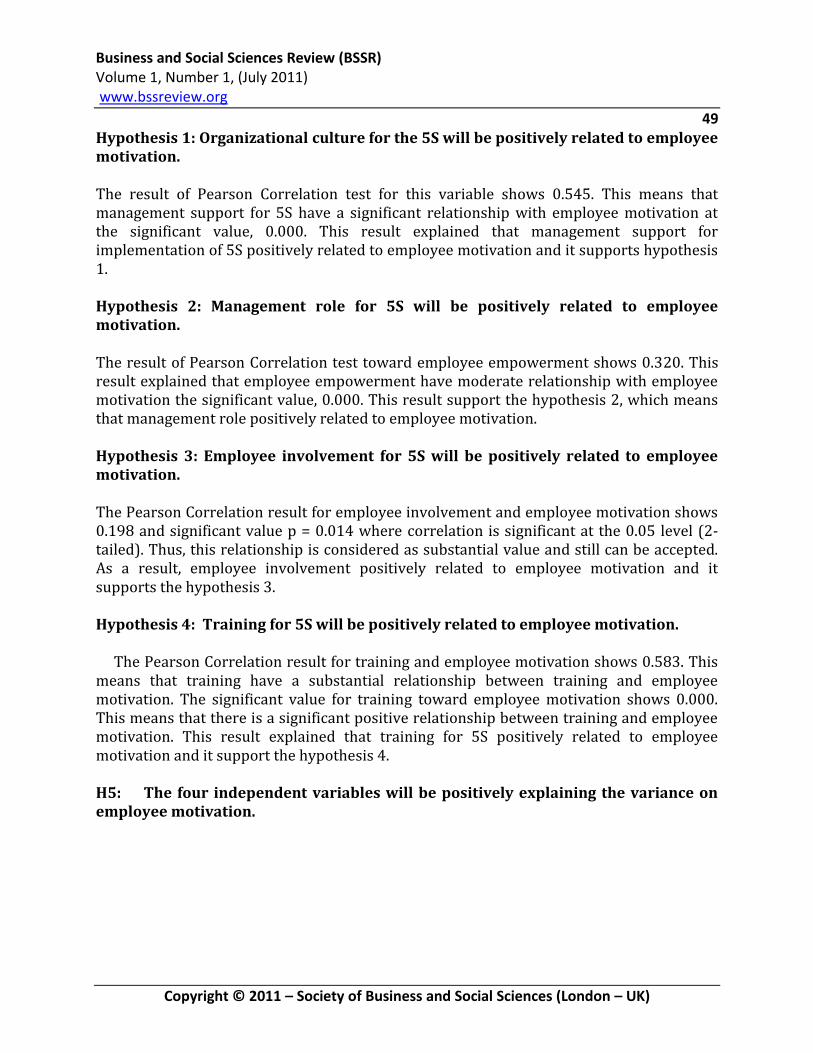
Business and Social Sciences Review (BSSR) Volume 1, Number 1, (July 2011) www.bssreview.org
49
Copyright © 2011 – Society of Business and Social Sciences (London – UK)
Hypothesis 1: Organizational culture for the 5S will be positively related to employee motivation.
The result of Pearson Correlation test for this variable shows 0.545. This means that management support for 5S have a significant relationship with employee motivation at the significant value, 0.000. This result explained that management support for implementation of 5S positively related to employee motivation and it supports hypothesis 1.
Hypothesis 2: Management role for 5S will be positively related to employee motivation.
The result of Pearson Correlation test toward employee empowerment shows 0.320. This result explained that employee empowerment have moderate relationship with employee motivation the significant value, 0.000. This result support the hypothesis 2, which means that management role positively related to employee motivation.
Hypothesis 3: Employee involvement for 5S will be positively related to employee motivation.
The Pearson Correlation result for employee involvement and employee motivation shows 0.198 and significant value p = 0.014 where correlation is significant at the 0.05 level (2-tailed). Thus, this relationship is considered as substantial value and still can be accepted. As a result, employee involvement positively related to employee motivation and it supports the hypothesis 3.
Hypothesis 4: Training for 5S will be positively related to employee motivation.
The Pearson Correlation result for training and employee motivation shows 0.583. This
means that training have a substantial relationship between training and employee motivation. The significant value for training toward employee motivation shows 0.000. This means that there is a significant positive relationship between training and employee motivation. This result explained that training for 5S positively related to employee motivation and it support the hypothesis 4.
H5: The four independent variables will be positively explaining the variance on employee motivation.
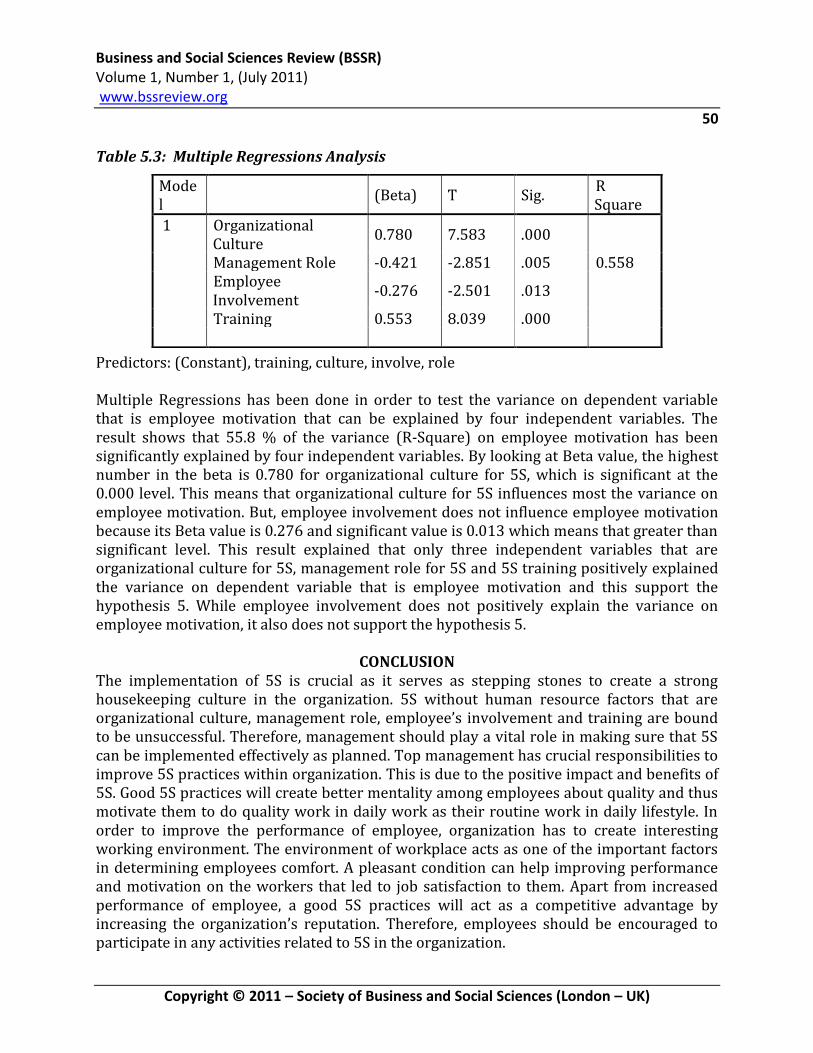
Business and Social Sciences Review (BSSR) Volume 1, Number 1, (July 2011) www.bssreview.org
50
Copyright © 2011 – Society of Business and Social Sciences (London – UK)
Table 5.3: Multiple Regressions Analysis
Predictors: (Constant), training, culture, involve, role Multiple Regressions has been done in order to test the variance on dependent variable that is employee motivation that can be explained by four independent variables. The result shows that 55.8 % of the variance (R-Square) on employee motivation has been significantly explained by four independent variables. By looking at Beta value, the highest number in the beta is 0.780 for organizational culture for 5S, which is significant at the 0.000 level. This means that organizational culture for 5S influences most the variance on employee motivation. But, employee involvement does not influence employee motivation because its Beta value is 0.276 and significant value is 0.013 which means that greater than significant level. This result explained that only three independent variables that are organizational culture for 5S, management role for 5S and 5S training positively explained the variance on dependent variable that is employee motivation and this support the hypothesis 5. While employee involvement does not positively explain the variance on employee motivation, it also does not support the hypothesis 5.
CONCLUSION The implementation of 5S is crucial as it serves as stepping stones to create a strong housekeeping culture in the organization. 5S without human resource factors that are organizational culture, management role, employee’s involvement and training are bound to be unsuccessful. Therefore, management should play a vital role in making sure that 5S can be implemented effectively as planned. Top management has crucial responsibilities to improve 5S practices within organization. This is due to the positive impact and benefits of 5S. Good 5S practices will create better mentality among employees about quality and thus motivate them to do quality work in daily work as their routine work in daily lifestyle. In order to improve the performance of employee, organization has to create interesting working environment. The environment of workplace acts as one of the important factors in determining employees comfort. A pleasant condition can help improving performance and motivation on the workers that led to job satisfaction to them. Apart from increased performance of employee, a good 5S practices will act as a competitive advantage by increasing the organization’s reputation. Therefore, employees should be encouraged to participate in any activities related to 5S in the organization.
Model
(Beta) T Sig. R Square
1 Organizational Culture
0.780 7.583 .000
Management Role -0.421 -2.851 .005 0.558 Employee
Involvement -0.276 -2.501 .013
Training 0.553 8.039 .000

Business and Social Sciences Review (BSSR) Volume 1, Number 1, (July 2011) www.bssreview.org
51
Copyright © 2011 – Society of Business and Social Sciences (London – UK)
ACKNOWLEDGMENTS We are thankful to fellow participants in this study at UiTM Terengganu 2008-2009. Special gratitude to UiTM Terengganu’s Rector, Associate Professor T. Yusof Tengku Mahmud for his encouragement to carry this study out.
REFERENCES Bamber, C.J., Sharp, J.M. and Hides, M.T. (2000). Developing management systems towards integrated manufacturing: a case study perspective. Integrated Manufacturing Systems, 11(7): 454-61. Bicheno, J. (1998). Your Lean Toolbox. Control, September: 10-11. Bourgeois, L. and Eisenhardt, K. (1988). Strategic decision processes in high velocity environments: four cases in the microcomputer industry. Management Science, 34(7): 816-35. Corbett, L. and Rastrik, K. (2000). Quality Performance and organizational culture. International Journal of Quality & Reliability Management. 7(1): 14-26. Darling, J (1992). Total quality management: The key role of leadership strategies. Leadership & Organization Development Journal. 13(4): 3-7. De Mente, B.L. (1994). Japanese Etiquette and Ethics in Business. 6th Ed. Lincolnwood: NTC Business Books. Flynn, B., Schroeder, R. and Sakakibara, S. (1995). The impact of quality management practices on performance and competitive advantage. Decision Sciences, 26(5): 659-91. Graham, Sandra, and Weiner, Bernard. (1996). Theories and Principles of Motivation. In David C. Berliner and Robert C. Calfee (eds), Handbook of Educational Psychology. New York: Macmillan. Ho, S.K. (1995). TQM: An Integrated Approach- Implementing TQ through Japanese 5-S and ISO 9000. London: Kogan Page. Hoffman, R.C. and Hagerty, H. (1994). Top management influence on innovation: effects of executive characteristics and social culture. Journal of Management, 19(3): 549-74. Johne, A. and Snelson, P. (1989). Product development approaches in established firms. Industrial Marketing Management, 18(2): 113-24. Kitazawa, S. and Sarkis, J. (2000). The relationship between ISO 14000 and continuous source reduction. International Journal of Operation and Management, 20(2): 224-45.

Business and Social Sciences Review (BSSR) Volume 1, Number 1, (July 2011) www.bssreview.org
52
Copyright © 2011 – Society of Business and Social Sciences (London – UK)
Mallak, L.A. and Kurstedt, H.A. (1996). Understanding and using empowerment to change organizational culture. Industrial Management, 38(6):8-10. Mary O'hEocha. (2000). A study of the influence of company culture, communications and employee attitudes on the use of 5Ss for environmental management at Cooke Brothers Ltd. The TQM Magazine, 12(5): 321-330. Maull, R., Brown, P. and Cliffe, R. (2001). Organizational culture and quality improvement. International journal Of Operation&Production Management, 21(3): 302-326. McDonald, J. (1998). The quality revolution in retrospect. The TQM Magazine, 10(5): 321-330. Osada, T. (1991). The 5S’s: Five Keys to a Total Quality Environment. Tokyo: Asian Productivity Organization,. Pace, L.A. (1989). Motivation towards system integration. Survey of Business, 25(1): 57-41. Ross, J.E. (1994). Total Quality Management, Text, Cases and Readings. London: Kogan Page. Sanjay, L. Ahire and K.C. O’Shaughnessy. (1998). The role of top management commitment in quality management: an empirical analysis of the auto parts industry. International Journal of Quality Science, 3(1): 5-37. Senge, P.M. (1990). The leader’s new work: building learning organizations. Sloan Management Review, 32(1): 7-23. Steinmetz, L. (1983). Nice Guys Finish Last: Management Myths and Reality. Colorado: Horizon Publications Inc. Zutshi, A. and Sohal, A.S. (2005). Integrated management system: the experiences of three Australian organizations. Journal of Manufacturing Technology Management, 16(2): 211-228.

Business and Social Sciences Review (BSSR) Volume 1, Number 1, (July 2011) www.bssreview.org
53
Copyright © 2011 – Society of Business and Social Sciences (London – UK)
Hotel Front-Desk Clerks and Their Computers:
Exploring the Phenomenological Terrain of Service Encounter Technology
Michele R. Grottola (Ph.D) The Richard Stockton College of New Jersey
Assistant Professor, School of Business, PO Box 195 Jimmie Leeds road, Pomona, New Jersey 08240
ABSTRACT
The goal of this study is to arrive at an emic understanding of the lived work
place issues surrounding hotel front-desk clerks. Work place issues under
investigation are viewed as an interplay of service organizational perspectives,
task problems, and software ergonomics. The context in which this interplay
occurs are socio-psychological events known as service encounters. Conceived
as a phenomenological and multiple method inquiry this video field study
research seeks to understand the sociotechnical requirements which hotel desk
clerks, as well as other front-of-house service workers, may use to minimize
operational stress upon themselves, the customers they serve, and the larger
organizational structure. A merged analysis is offered. The analysis reveals
that when employees are required to interact with a computer and a customer,
on a simultaneous basis, a linear interface can become overly redundant. The
technological interface design most likely to model the work flow and offer
greater service worker autonomy may be a multi-tasking format.
Key words: video field study research, socio-technical analysis
Technology Is A Place Put your eye to the kaleidoscope and hold it toward the light. There is a burst of color, tiny fragments in an intricate composition. Imagine a hand nudging the kaleidoscope's rim until hundreds of angles collapse, merge, and separate to form a new design. A fundamental change in an organization's technological infrastructure wields the power of the hand at the turning rim. Technological change defines the horizon of our material world as it shapes the limiting conditions of what is possible and what is barely imaginable. It erodes taken-for-granted assumptions about the nature of our reality, the "pattern" in which we dwell, and lays open new choices. (Zuboff, 1984, p.387.) If one accepts the elusive premise, offered by the above quote, that technology is a sense of socially constructed place (Berger & Luckman, 1966) within an organization, how do we then begin to study it as phenomena contributing its own sense of symbolically structured presence among us? How such a symbolic phenomena lays open new organizing choices

Business and Social Sciences Review (BSSR) Volume 1, Number 1, (July 2011) www.bssreview.org
54
Copyright © 2011 – Society of Business and Social Sciences (London – UK)
(Trist, Higgin, Murray, & Pollock, 1963) also requires serious, creative consideration by field researchers pertaining to the selection of methodological approaches designed to capture its lived experience. Within an organizing arena (Weick, 1979) sociotechnical manifestations reside in a terrain composed of layered meanings (Lundberg, 1989): symbolic artifacts of both a social and a technological nature; language composed of concrete slogans and sheer metaphor; stories which range from the literal to the imagined; mundane daily habits and corporate ceremonies; and a vast array of patterned norms as well as spontaneous behaviors. Inherent to this phenomenological perspective is focus intent upon seeing the actors in an emergent social process capable of constructing their world (Blumer, 1969), in this case--the world of service encounter work. This research design employs a multiple methods focus which includes the use of audio-video technology to aid in the act of directly observing a software program being used by hotel front-desk clerks as the clerks also interact with customers on a real time basis. The context in which these interactions occur is the service encounter, an example of what once purely a face-to-face human interaction was but which has subtly evolved over the last twenty years to become sociotechnical in essence.
ARRANGEMENT OF THE STUDY In any field study, there are multiple levels of interactions taking place which are composed of small, subtle behaviors: The glances, gestures, positioning, and verbal statements that people (and computers [Italics added.]) feed into the situation, whether intentional or not (Goffman, 1967, p.1). To capture these behaviors as holistically as possible within their naturally organized setting, a four camera, closed-circuit audio-visual system was used to act as an observational nerve center in an emergent qualitative research design (Patton, 1990; Becker, 1981, 1979). Additional data gathering methods, added as they appeared necessary, included the use of semi-structured interviews with selected desk clerks; and, casual interviews with hotel departmental managers, hospitality software experts, and two members of the software
company1 whose program is in operation at the field site. Secondary data text consulted included the vendor’s operations handbook, training materials used on site in the field study, and multi-disciplinary literatures from the fields of visual sociology and anthropology, human relations, service management, socio-technical systems analysis, and human-computer interactions. This article discusses the theoretical implication of this study; describes briefly the literatures related to it; explains the technologies of interest; presents a merged analysis; and concludes with a discussion centered upon substantive insights generated by an initial, exploratory field study research.

Business and Social Sciences Review (BSSR) Volume 1, Number 1, (July 2011) www.bssreview.org
55
Copyright © 2011 – Society of Business and Social Sciences (London – UK)
A merged analysis is presented to express how a variety of data collection methods produce an emic understanding of the socio-technical work issues surrounding the desk clerks, the computers, and the customers. Conceptually, the technological issues embrace the employee’s tacit knowledge as well the software and the hardware in use. Likewise, workplace issues under investigation is viewed as interplay of service-specific organizational perspectives, task problems, and software ergonomics. Theoretical Implications of the Study Theoretically, this study wishes to draw deserved attention to the computerized work area concerns of front-line service workers and, in so doing, envisions an evolved collaborative organizational behavior model for the service industry at large. Such a purpose is not solely theoretical but possesses strategic and utilitarian applications whereby the goals of services marketing and administration departments can mesh with the goals of human resource departments, particularly in terms of training and development programs. Additional theoretical implications of research designed to study sociotechnical phenomena include: advancing our knowledge of how organizational culture affects, and is affected by, information systems; creating new techniques for eliciting organizational information requirements; paving the way for introducing humanely sensible information technology into organizations; increasing our knowledge of contemporary sociotechnical approaches to analysis and design; beginning to design computerized workstations for human factor considerations; advancing towards measuring end-user satisfaction; and, growing in our ability to understand the applied researcher’s role as potential change agent.
MULTI-DISCIPLINARY LITERATURES Sociotechnical design is based on principles from two different worlds between which a fundamental schism exists. The technical world is organized around rational principles of efficiency, while the phenomenal world within which humans live their daily lives is organized around psychological principles based on cognition and emotion. The principles by which one world is organized are not necessarily or even likely to be the same as those by which the other world is organized. (Susman, 1976, p.146) From a theoretical perspective, this study recognizes and draws nurturance from the following multi-disciplinary schools of thought: human relations, socio-technical systems analysis, and human-computer interactions. The exploratory nature of this study derives from the fact that there exists only scattered knowledge about the constructed sense of place technology already occupies at the ground level in service organizations. Related contemporary research regarding hospitality software ergonomics is either the proprietary property of privately owned vendor companies or speaks to administrative concerns about large scale system selection, implementation, and financial cost analysis (Marco &Moore, 1980; Alvarez, Ferguson, & Dunn, 1983; Chandekar, 1988). Micro-related research, especially in the field of services marketing (Czepiel, Solomon, & Surprenant, 1985; Klaus, 1985; Bowen & Schneider, 1985; Tansik, 1985; Groves & Fisk, 1983) has
Business and Social Sciences Review (BSSR) Volume 1, Number 1, (July 2011) www.bssreview.org
56
Copyright © 2011 – Society of Business and Social Sciences (London – UK)
evolved considerably and paves the way for further in depth phenomenological inquiry into how the nature of employee satisfaction may ultimately be viewed as a correlate with customer satisfaction. Human Relations Past research desiring an emic and ethnographic understanding of hotel and restaurant employees in the 1930’s prior to the ubiquitous entry of computerized technology on the service organization scene was conducted by William Foote Whyte (1948; 1949; 1973). Emanating from the human relation’s school, Whyte’s work described the organizational positions of front-line service employees who lack both the formal organizational recognition and the informal power structures capable of promoting innovative work designs. Low mechanization characterized the state of technology in hotels and restaurants at the time Whyte was conducting his two major field studies. With respect to how these mechanical technologies effected human relations, he advised that along with our consideration of layout and equipment in the flow of work, we should give attention to the communication system (1949,p.307). He also wrote how “I am concerned here with pointing out a new area for sociological investigation: the effects on human relations of various mechanical systems of communication. It is difficult enough to coordinate an organization in which the key people in the supervisory hierarchy are in face-to-face relations. It is a much more difficult problem (and one as yet little understood) when the co-ordination must be achieved in large measure through mechanical systems” (1949, p.308). Sophisticated technology, at that time, referred to rotary-styled house phones, public address systems and the teleautograph. These have vanished to be replaced by pervasive computerized Property Management Systems (PMS). Begun in the early 1930’s, the field research associated with Harvard University’s Hawthorne Studies set the stage for research designs focused upon the world of the worker. Workers’ personal descriptions of their various jobs and work sites began to be viewed as important indicators of organizational social structures which did not have to be viewed as deterministic (Roethlishberger & Dickson, 1939). Socio-technical Systems Analysis While Whyte was conducting field studies in Chicago and Roethlishberger and Dickson were conducting the Hawthorne field studies, researchers at The Tavistock Institute of Human Relations, in London, also were concerned with the interactional, organizational themes of social structure, culture, and personality. To these they added another latent variable: technology. Trist and Bamforth (1951) conducted a classic sociotechnical field study with the Haighmoor miners of England. The focus of the study lay in evaluating the effects of a new mining technology (mechanical drills) upon the miners’ social structure in the natural work setting. The researchers concluded that a production system could not be viewed as just a
Business and Social Sciences Review (BSSR) Volume 1, Number 1, (July 2011) www.bssreview.org
57
Copyright © 2011 – Society of Business and Social Sciences (London – UK)
technological system or just a social system but had to be viewed in terms of both dimensions. As Susman (1976) suggests, the former revolves around rationale principles while the latter is phenomenological. From both a socio-psychological as well as a technological perspective, the work system became a unit of analysis rather than the solitary job roles which comprise it (Jaques, 1951). Top down management perspectives were viewed in conjunction with the perceived ability of the workers themselves to contribute to the internal regulation of the work system. The concept of worker autonomy, defined as a scale of opportunities dependent on the particular type of organization in question, continues to challenge prevailing deterministic values (Cummings, 1978). The Technology The Observed Technology: Property Management Systems In the last several decades, computerization has changed the way data is processed in hotels. The manually driven technology of the 50's and the semi-automated, service
bureau agencies2 data of the 60's were replaced, in the majority of hotel properties with mini-computer networks which can more than equal the output of their larger mainframe computer predecessors. The technology with which desk clerks work in this study is used to support a series of accounting transactions commonly called the hotel guest cycle. This cycle identifies and distinguishes the stages in the financial contacts which a guest has with the hotel from the time he or she makes a reservation, throughout the intended period of guest occupancy, to the time of departure. A computerized Property Management System (PMS) refers to an organizationally linked software program capable of acting as a data base storage, processing, and retrieval system. It possesses the capacity to link and interact with both the front and the back of house accounting operations taking place 24 hours a day in medium to large scale hotels. In addition to generating detailed departmental records, it is capable of providing overall management reports on a timely basis. With respect to the specific parameters of this study, the subsystems of the PMS observed fall into the major areas of reservations, rooms management, guest accounting, and general management. The following definitions, found in Kasavanna & Cahill (1987, p.) are provided for the reader unfamiliar with the functions of these systems:
Reservations Module:
Reservation requests are processed and stored in the form of reports which the hotel can use to predict revenues and forecasting. Also, the information is used for creating any pre-registration materials which need to be mailed to the guest such as a computer generated letter of confirmation.

Business and Social Sciences Review (BSSR) Volume 1, Number 1, (July 2011) www.bssreview.org
58
Copyright © 2011 – Society of Business and Social Sciences (London – UK)
Rooms Management Module: Forms a communications linkage between the housekeeping department and
the front-desk clerks. Room status is obtained by the clerk through this subsystem. The manual equivalent would have been the room rack where color coded cards would have alerted the guest to room status.
Guest Accounting Module: Supplies information about hotel purchases charged by the guest which are
recorded by point-of-sale systems located throughout the commercial outlets (e.g. restaurants) in the hotel. Guest charges are automatically categorized and placed in the appropriate guest account files.
General Management Module:
Stores and categorizes information in the above three modules. The data is generated in various types of reports by this subsystem component. Reports may include such facts as a daily list of arrivals and departures; a division of marketing segments to be used by the Sales Department; and accounting information.
Originally designed as back-of-house accounting systems, today’s property management systems are now highly visible throughout the hospitality organization’s front-of-house areas. But, the socio-technical implications of how computers alter both organizational work flow and the ephemeral service encounter between employee and customer is not well understood. The Observing Technology: The IBM Portable Lab The audio-visual system used in this field study represents the state of the art in modular, electronic observational technology. In addition to the audio and visual components, the system features a synchronized micro-computer with five separate communication tracks. See Appendix A for a detailed list of the equipment comprising this technology. Designed by IBM Corporation’s Usability Laboratory, the equipment is intended for in-house organizational evaluations. Its use in this field study marked the first of such evaluations. It deserves to be pointed out that the system is an obtrusive observational tool. However, the visible cameras also resemble standard security system equipment found in many public places such as banks or hotels. Attempts to control for the use of such an observational tool in terms of reactivity are discussed in a later section.
AN EMERGENT RESEARCH DESIGN Initial Exploratory Questions How do desk clerks talk simultaneously to computers and customers? How can an organization understand and evaluate worker-software interactions once the technology is already in place and being used? How well does this software program meet the work flow needs of workers and customers within the ephemeral context of service encounters? Can

Business and Social Sciences Review (BSSR) Volume 1, Number 1, (July 2011) www.bssreview.org
59
Copyright © 2011 – Society of Business and Social Sciences (London – UK)
information learned about desk clerk needs be extrapolated to other front-line service workers within the context of service encounters? Goals The goals of this emergent research design were also emergent. Such a predominantly qualitative goal requires that the field researcher remain open and flexible to permit exploration of whatever the phenomenon under study offers for inquiry (Patton, 1990, p.198). Such a design must also remain flexible even after data collection begins: the blueprint of studying lived experience unfolds as you decipher it. Design Strategy Using the IBM Portable Lab system offered several advantages. Video produces and preserves field data captured in sequential order which is more reliably retrievable than fleeting perceptions, memories, or written field notes (Collier & Collier, 1986; Harper, 1988). Such systematic data gathering process, in turn, facilitates the researcher’s ability to conduct an incredibly rich and on-going analysis of field study occurrences-- an essential ingredient of emergent, exploratory designs. Attempts to curtail the obvious disadvantages of such a pervasive observational method are discussed in detail later in the design section of this article. Subsequent research methods selected as a result of repeatedly viewing the videotaped observations were used for further in-depth probing and potential development of both emic and analyst constructed typologies. Secondary data sources were used in a similar fashion. Procedure Two sets of taped observations were conducted: a pre-test and a final taping, each lasting one week in duration. The purpose of the pre-test taping was twofold: to ascertain how well the equipment was running and to allow the desk clerks to become familiar with the experience of being taped. The second round of video tapes was broken into morning and afternoon periods of four hours each. Access Permission to enter the work setting was granted by management. A letter of explanation regarding the research venture was mailed to the desk clerks by the researcher. They did not participate in the decision to conduct the study. During the taping, customers were informed of the dates and the times of the study when they checked in to the hotel. They were invited to notify us if they did not wish to be video-taped. In such an event, the equipment would have been turned off.

Business and Social Sciences Review (BSSR) Volume 1, Number 1, (July 2011) www.bssreview.org
60
Copyright © 2011 – Society of Business and Social Sciences (London – UK)
Subjects and Work Area The nineteen desk clerks in this study consisted of six males and thirteen females working in the Front Office Department of a hotel consisting of 150 rooms, two restaurants, and a medium sized conference center. The title of senior desk clerk referred to full-time members of the group who shared a varied range of front desk experience. The members in this group, for the most part, perceived their jobs as being their major occupation at the time. The title of junior desk clerk referred to a working crew of part-time employees. Full time employment amounted to a minimum of forty hours per week. While part-time employment ranged from eight to twenty hours per week depending upon hotel occupancy. The ages of the employees ranged from 20 to 28 years. Work schedules, written on a weekly basis, were designed to provide twenty-four hour a day, seven days a week coverage of the front desk work area, a standard front desk schedule in full service hotels. The number of clerks working at any one time ranged from one to three persons dependent upon the degree of business. Although the hotel lobby and its centerpiece, the front desk--or, at least that portion of the front desk facing the guest, tend to receive detailed architectural attention bordering on the dramatic with huge, fresh flower arrangements, polished pillars, imported marble surfaces, comfortable contemporary furnishings, and original artworks, the actual working area behind the front desk, an area which only the clerks see, is utilitarian in essence. Standing space (no stools were allowed) designed to accommodate a maximum of three employees measured approximately 7 feet by 3.5 feet. Three computer terminals, two printers, phones, charge card machines, and various equipment were arranged in linear fashion and set into the interior counter at a stationary height of 29 inches for desk clerks whose heights ranged from 5 to over 6 feet. Taped to the terminal monitors were small yellow notes with handwriting on them which gave the following declarative directives: Smile! Use the customer’s name as much as possible, and Make eye contact. The location of this work area is strategically positioned so that desk clerks have clear visual access to all entrances and exits, including the elevator area to aid in general security concerns of the organization. Travel patterns of customers arriving and departing are considerations in placing the front desk as near to the main entrance of the hotel as possible so that customers can enter and exit with minimal inconvenience. With the exception of meeting the doorman, the front desk area is the first interior social setting an arriving customer will have direct face-to-face contact with when checking in to the hotel; and it is also typically the last point of contact a departing guest has with the hotel. Additionally, it is the social nexus point for all other individuals who enter the hotel

Business and Social Sciences Review (BSSR) Volume 1, Number 1, (July 2011) www.bssreview.org
61
Copyright © 2011 – Society of Business and Social Sciences (London – UK)
to conduct business with organizational members, to have a meal in one of the restaurants, or to attend a day meeting. In a dramaturgical sense, the lobby can be viewed as a theater, the front desk as its center stage, and the desk clerk as the key actor engaged in boundary spanning and impression management activities (Goffman, 1959; Groves & Fisk, 1983). Managing Threats to Reliability and Validity
The application of photographic techniques combined with tape recordings of the conversation, is an excellent way to capture service agent and client behaviors, both verbal and non-verbal. Facial expressions reflect the participants experiences of quality more directly and undistorted than the analysis of verbal and written (that is, interview and questionnaire) statements. The mutual relationship of system configuration and epiphenomenon is not artificially dissected into a cause and effect aspect, and the circular interrelationships of causes and effects in service encounters are preserved. (Klaus, 1985, p. 29)
The most subtle threat to the accuracy of behavioral observations may, in fact, be a result of its directness because the method actively calls upon the direct experience of any observer. Observers are biased by the human tendency to seek facts that are akin with his or her own prior values and beliefs. In lieu of the qualitative context of video-taped observation, I tried to take appropriate steps to maintain an objective perspective by instituting the following procedures (Collier & Collier, 1986; Thorngate, 1986; Cunningham & Tharp, 1981; Fiske, 1980):
1) All measured observations entered into the video log were randomly selected. 2) All interactional events were discretely measured and defined by specific
beginning and ending points. In this study, such points were spoken greetings and farewells between a customer and a desk clerk; if these were absent, the first and the last spoken words were used as markers. Also, the events were measured with a digital stop-watch. 3) In an effort to observe natural human-computer interactions, two measures were put into effect: a pre-taping and letting the cameras run for three days prior to the final taping. 4) Cameras were maintained in stationary positions so that all events were viewed from the same perspectives. 5) None of the selected observations were edited versions.

Business and Social Sciences Review (BSSR) Volume 1, Number 1, (July 2011) www.bssreview.org
62
Copyright © 2011 – Society of Business and Social Sciences (London – UK)
The Video Log A random sample of the total population of events was selected for measurement. Only these observations were entered into the video log. I wanted to ascertain the average duration of the various category of events taking place. In addition, I wanted to know what percentage of the event time was spent by the clerk in direct customer contact compared to the percentage of the time engaged in direct computer contact. A printed form was designed to record observations and coded variables. The unit of analysis was a completed event, defined to mean an entire interaction taking place between the desk clerk and the guest. An example of one complete event, for instance, could be a guest checking into the hotel for the first time. All that transpired between the times the guest walked to the desk and then departed would be considered a completed event. The forms comprise a video field journal which clearly identifies a specific interaction as well as how to locate it from a working collection of video tapes.
A MERGED ANALYSIS From a work-design standpoint, task uncertainty in the front [desk] office is greater than in the back office since in the latter there is only one sentient component-- the worker; while in the former there are two-- the worker and the customer. Such task uncertainty suggests that skills required on the part of the worker are substantially different in high- and low-contact work and that it is therefore pertinent to consider contact as a major contingency variable in the design of jobs as well as in hiring and training. (Tansik, 1985, p.152)
Substantive Captures On-going, cumulative analysis is punctuated by substantive captures (Sanders, 1982, p.358). I would like to describe one of many such captures which occurred during the course of this field study: In one video, a clerk working alone at the front desk during a slow period of the afternoon suddenly becomes busier. The other desk clerk working that same shift has taken a work break. Three unassociated, single hotel guests approach the front desk at one time--all wishing to be checked out of their rooms and to settle their accounts. The clerk begins the usual procedure of checking out one guest by calling up on the computer monitor the guest’s folio which can consist of at least two parts, a room account and an incidental folio account. In cases where the guest’s basic hotel charges are being paid by a sponsoring business account, for instance, the folio is split because while the room rate may be paid by the sponsor, certain incidental (personal) charges such as long distance telephone calls would be paid by the guest at the time of departure.

Business and Social Sciences Review (BSSR) Volume 1, Number 1, (July 2011) www.bssreview.org
63
Copyright © 2011 – Society of Business and Social Sciences (London – UK)
After the folio is totaled, a hard copy of the bill is presented to the guest for payment. The usual procedure is for the clerk to present the bill to the guest, wait for the guest to have time to look over and approve the charges which have been tallied, and then accept payment and close out the transaction. In this video, I observe the desk clerk compute the initial stages of the transaction and then begin to wait for the computerized summary which will result in a hard copy of the bill. But then, instead of waiting for this to happen, the clerk walks over to the computerized work station next to his, and while the hard copy for the first guest is printing on one computer, he initiates another check-out process for the second customer who is in line. While that process is in motion, he completes the first customer’s transaction and returns to the other computer to render service to the last waiting customer. The result of this interaction is that three people were serviced more efficiently when the clerk used two computers instead of one. In essence, the clerk was cleverly circumventing the software capability by using the software program in a multi-tasking function. The clerk was essentially employing a self-constructed form of a multi-tasking computer mediated processes by using the linear system in a truly innovative way. This observation inspired me to think more about the inherent structural limitations of linear software programs installed in computerized work stations where front-line service workers needed to function than I had been thinking previously. This led to the formulation of the semi-structured interview form which I used with the workers. This key observation also provided further insight into questions I would begin asking myself about how desk clerks may actually need to talk to their computers in non-linear ways. Out of this a question I didn’t initially know how to ask had emerged: what shape and form does the human-computer dialogue need to assume in order to most fluidly emulate and complement the socio-technical aspects of service encounters? Weaving Observational Insight into Interview Data Webster defines an insight as the ability to see and understand clearly the inner nature of things. Genuine insights in research are often difficult to find. Based upon the knowledge gained from the videotapes, I began to interview the desk clerks. The majority of their comments regarding specific features they liked most or least about the system were revealing in that they formed naturally into an emic typology related to their perceptions of the software program pertaining to issues of speed or the lack thereof. When I analyzed the comments about features like least by the desk clerks, I tried to notice not only the feature described, but also the descriptive adjectives they each used to describe it. Comments such as slows me down, bogs me down, and awkward were all used
with respect to the interface3 dialogue box the clerks need to use in order to access all of the customer information screens they use in their computer-mediated actions at the front desk. See Appendix B for an illustration of this feature known as an update window.

Business and Social Sciences Review (BSSR) Volume 1, Number 1, (July 2011) www.bssreview.org
64
Copyright © 2011 – Society of Business and Social Sciences (London – UK)
The update window operates in a linear pattern. It controls several standard functions which the clerk engages on a repetitious basis throughout the work day and, most important, throughout the course of each interaction with a customer. These functions include such transactions as inputting a new reservation, changing a previously made reservation, checking a guest into the hotel, checking a guest out of the hotel, changing a guest record, and entering a room list for potential room assignments. It is, in short, the way in which the desk clerk talks to this particular computer system. [Later, I would come to realize that it was this particular feature which caused the desk clerk in the video to use two computers to serve the three customers.] Each time the clerk activates this dialogue box, four options are presenting and a specific number from 0, 1, 2, or 3 is keyed in to the system. If, for example, a clerk wants to check a guest into the hotel, he has to go through the interface each time he wishes to do something for the guest. [It is precisely this linear redundancy which characterizes problems for service workers in front-of-house positions] When the desk clerks described how “ this system slows me down,” they were expressing a need to move, cognitively and physically, from one screen of information to another without having to literally go through the interface dialogue box each time the need to change screens arises as it does, quite frequently, in the course of each customer transaction. Hence, the dialogue box is not only redundant, but it appears in a bold black-outlined rectangular form directly in the center of the screen. As such, it blocks both the hospitality end-user’s vision and motion to an obvious extent. Ergonomically, it is an obstacle in the psychological computerized work flow. When I asked the clerks which features of the system they liked the most, the tone of their answers quickened as they referred to those features which allow them to perform computer-mediated functions with some degree of speed and fluidity. No one mentioned liking the way individual screen changes were linked (e.g. interface system) the most.
SUMMARY: CONTINUING THE DISCUSSION Originally, when I began to conceive of writing this article I wanted to find a way to express the surprise of exploratory discovery I experienced in conducting this initial field study. At this point, however, what follows is a continued discussion of the merged analysis example--and the form of the telling, in subtle ways, does recapture a part of the thought processes experienced, in developmental ways, throughout the actual study itself. The most immediate insight gained from watching all of the videos collected during the period I taped were the awareness that not every desk clerk used their access to the PMS in the same way. The range of skill levels observed was broad. The most experienced desk clerks would open a transaction with a customer and complete the transaction up to the point where the customer was served and could leave the front desk. After the customer left the desk, they would complete the transaction, or if other customers were waiting in

Business and Social Sciences Review (BSSR) Volume 1, Number 1, (July 2011) www.bssreview.org
65
Copyright © 2011 – Society of Business and Social Sciences (London – UK)
the queue, go on with service until a slow period and complete any transactions requiring further computer input at that time. On the other hand, however, novice clerks, as is true of novice learners in general, would work through every data entry from beginning to end always in the presence of the guest. Based upon interview data, they themselves acknowledged that to emulate the sequencing which more experienced clerks were able to carry out would initially seem confusing to them. Systems of working differed among clerks according to respective experiential levels of the staff members, the number of staff members on duty, and the amount of customer business during a particular time period. These same types of patterns are rather common amongst front-line service workers in general because so much of the service providers overall work pace is contingent upon how many customers need service at a particular time. In the act of reviewing the observations, the feedback from the interviews, and the descriptive statistical findings, there was one common thread running through all of the data: the presence of a high degree of variance. One of the major principles of sociotechnical theory concerns variance. Termed the sociotechnical criterion by Albert Cherns, the principle states that variances, if they cannot be eliminated, must be controlled as near to their point of origin as possible (1976,p.785). Cherns, as well as several of his colleagues such as Trist and Bamforth, defined variance to mean any unprogrammed event which critically affected desired outcomes of an organization. One could easily say that the greater part of most service encounters consists of variant customer service requests. The desk clerks alluded to this fact when they said that the most helpful training and development component before starting their jobs as well as afterwards was role-playing because, as they explained, the problems on the job initially stemmed from service requests by customers which didn’t follow the standard formats they were otherwise taught to expect in training sessions and printed material most often oriented around surface behaviors (e.g. Smile!). Yet, it is precisely this ability of experienced front-line service provider to respond immediately to variance in service encounters which becomes crucial. Controlling this socially and now technologically, generated variance on a real time basis is how unexpected customer service needs translate into positive service encounters (e.g. when the customer is satisfied as service quality literature expresses it). The school of human-computer interaction echoes the sociotechnical criterion of controlling variance as near to its organizational source as possible to achieve balance when it researches ways which contribute to the creation and the design of mimetic interfaces (Laurel, 1986). By designing interface dialogue systems which mirror the actual

Business and Social Sciences Review (BSSR) Volume 1, Number 1, (July 2011) www.bssreview.org
66
Copyright © 2011 – Society of Business and Social Sciences (London – UK)
environment in which the end-user works, the researchers are essentially calling for usable architecture in the overall computer system. Just as the lobby of a hotel is carefully designed to create a very specific impression or image on a customer, one can conceive of a user interface design that creates a similar impression upon workers, who in turn can reflect this back in terms of self constructed interactions with a given customer. For example, if variance is a prime component in the overall service environment in which front-of-house workers must dwell when dealing with their customers, then why not create for them an interface system which allows for maximum fluidity in the deliverance of those services rendered? The subject of interface dialogue design for front-of-house service workers may actualize innovative technology within the hospitality industry in ways which complements all that that Erving Goffman’s term, impression management (Goffman, 1967), already signifies in most other respects having to do with externally conceived environments in this specific world. The initial exploratory questions asked in the beginning of this field study have evolved. How desk clerks talk to computers has changed into wanting to know how they need to access information with respect to interface constructions. Future research should attempt to generalize the insights gathered in single field studies. Should these insights prove generalizable then attempting to design and test creative, multi-tasking interface dialogue formats across sites would provide a next phase in this research process. Such a socio-engineered artifact could produce a sociotechnical key enabling hospitality software designers, in general, to be more conscious about constructing an internal architecture for the computerized service encounter which equals the external attention to function and structure inherent in the physical environments in which such encounters literally and metaphorically take place:
An interface, like a play, must represent a comprehensible world comprehensibly. That representation must have qualities which enable a person to become engaged, rationally and emotionally, in its unique context. Naturally, there is disagreement on this point. The critics point to the all-too-common case in which computer users are willing to submit themselves to heinous interfaces and have dreadful experiences, as long as they are able to get the job done. So might drama buffs endure perfectly awful plays, to the end of being able to chat about them later? But in seeking design principles for good interfaces, we must, it seems to me, concern ourselves with the best case, and ask, not what the users are willing to endure, but what the ideal user experience might be, and what sort of interface might provide it.

Business and Social Sciences Review (BSSR) Volume 1, Number 1, (July 2011) www.bssreview.org
67
Copyright © 2011 – Society of Business and Social Sciences (London – UK)
A QUESTION OF FORM While the end cause of a thing is that which it is intended to do, the formal cause of that thing is the shape it must take in order to do it. Form provides the means whereby the end cause can be realized, through the exercise of its powers to engage, to evoke emotional and rational response, and to provide catharsis -- emotional and intellectual closure (Laurel, 1987, p.89).
There is a definite place for phenomenological inquiry in sociotechnical research, particularly when we need to understand how technology incorporates into the work flow of workers. The store of tacit knowledge which many workers bring to their sense of work flow is elusive data. Oftentimes, the workers themselves cannot articulate its components because it is a lived work experience which only manifests when researchers take the time to learn how to evoke it. Such tacit knowledge should be the building block of computerized technology created for specific work flows. In the historical development of tools such as the manual picks and chisels used by men and boys in the Haighmoor mines, for example, the primary interface between user and tool was an attribute of physical strength and manual dexterity (Dzida, 1987). The miners used the chisels and picks, but they did not converse with them. Later when mechanized tools evolved, the interface was one of greater manual preciseness perhaps, but still not a complicated cognitive interaction. The user was still manually engaged with the machine. Now with the presence of computerization, the user is required to input a symbolic language in order for output to occur. Since the nature of the service encounter is highly symbolic to begin with, the desk clerk’s tasks become quite complicated. The goal of the service organization involves the provision of services in face to face contact with the customer. An absence of strain emerges Notes 1. All attempts to maintain the anonymity of the vendor have been adopted. There are over 250 vendor companies selling a myriad of hospitality software programs--any one of them could be the focus of such a field study. 2. These agencies essentially sold computer time to hotels for the purpose of creating payroll checks and general management reports. The hotel benefited from computerized services without having to actually make capital investments into computer equipment themselves. 3. The interface is a certain set of rules which determine the interchange of data or information between user and computer. The one I studied operated through keystroke codes initiated by the clerk.

Business and Social Sciences Review (BSSR) Volume 1, Number 1, (July 2011) www.bssreview.org
68
Copyright © 2011 – Society of Business and Social Sciences (London – UK)
REFERENCES Alvarez, R., Ferguson, D. H., & Dunn, J. (1983). How not to automate your front office. The Cornell Hotel and Restaurant Administration Quarterly, 4, 56-62. Becker, H. S. (1981). Exploring Society Photographically. Illinois: Mary and Leigh Block Gallery, Northwestern University Press _________ (1979). Do Photographs Tell The Truth? In T. D. Cook & C. S. Reichardt (Eds.), Qualitative and Quantitative Methods in Evaluation Research California: Sage. _________. (1967). Whose Side Are We On? In H. S. Becker, Sociological Work: Method and Substance. New Jersey: Transaction Books. Berger, P. L. & Luck man, T. J. (1966). The Social Construction of Reality. New York: Doubleday. Blumer, H. (1969). Symbolic Interactionism. New Jersey: Prentice-Hall. Bowen, D. E., & Schneider, B. S. (1985). Boundary -Spanning-Role Employees and the Service Encounter: Some Guidelines for Management and Research. In J. A. Czepiel, M. R. Solomon, & C. F. Surprenant (Eds.), The Service Encounter. Massachusetts: Lexington. Collier, J. Jr. & Collier, M. (1986). Visual Anthropology: Photography as a Research Method. New Mexico: University of New Mexico Press. Cherns, A. (1976) The Principles of Sociotechnical design. Human Relations. 29, 783-792. Cummings, T. C. (1978). Sociotechnical Experimentation: A Review of Sixteen Studies. In W. A. Pasmore and J. J. Sherwood (Eds.), Sociotechnical Systems. California: University Associates. Cunningham, T. R., & Tharp, R. G. (1981). The Influence of Settings on Accuracy and Reliability of Behavioral Observation. Behavioral Assessment, 3, pp. 67-78. Czepiel, J. A., Solomon, M. R., & Surprenant, C. F. (1985) The Service Encounter: Managing Employee/Customer Interaction in Service Businesses. Massachusetts: Lexington. Dzida, W. (1987). On Tools and Interfaces. In M. Frese, E. Ulich, & W. Dzida (Eds.), Psychological Issues of Human-Computer Interaction in the Work Place New York: Elsevier. Fiske, D. W. (1980). When are Verbal Reports Verdical? New Directions for Methodology of Social and Behavioral Science, 4, pp. 59-66.
Business and Social Sciences Review (BSSR) Volume 1, Number 1, (July 2011) www.bssreview.org
69
Copyright © 2011 – Society of Business and Social Sciences (London – UK)
Goffman, E., (1967). Interaction Ritual. Chicago: Aldine. ________. (1959). The Presentation of Self in Everyday Life. New York: Doubleday Anchor Books. Groves, S. J., & Fisk, R. P. (1983). The Dramaturgy of Service Exchange: An Analytical Framework For Services Marketing. In L. L. Berry, G. L. Shostack, & G. D. Upah (Eds.), Emerging Perspectives on Services Marketing. American Marketing Association. Harper, D. (1988).Visual Sociology: Expanding Sociological Vision. The American Sociologist, 19, 1, pp. 33-42. Jaques, E. (1951. The Changing Culture of a Factory. London: Tavistock Publications, Kasavana, M. L. (1981). Effective Front Office Operations. New York: Van Nostrand Reinhold. Kasavana, M. L. (1987). Managing Computers in the Hospitality Industry. Michigan: The Educational Institute of the American Hotel & Motel Association. Klaus, P. G. (1985). Quality Epiphenomenon: The Conceptual Understanding of Quality in Face-to-Face Service Encounters. In J. A. Czepiel, M. R. Solomon, & C. F. Surprenant (Eds.), The Service Encounter: Managing Employee/Customer Interaction in Service Businesses. Massachusetts: Lexington. Laurel, B. K. (1986). Interface as Mimesis. In D. A. Norman & S. D. Draper (Eds.), User Centered System Design: New Perspectives on Human-Computer Interaction. New Jersey: Larwence Erlbaum. Lundberg, C. C. (1989). Working With Culture. Journal of Organizational Change Management, 1, 2, pp.38-47. Marko, J. A., & Moore, R. G. (1980). How To Select A Computing System. The Cornell Quarterly, May. Patton, M. Q. (1990). Qualitative evaluation and research methods. (2nd Ed.) California: Sage. Roberts, A. D. & Kelly, E. F. (1985). Technoservice and the Organizational Encounter. In J. A. Czepiel, M. R. Solomon, & C. F. Surprenant (Eds.), The Service Encounter: Managing Employee/Customer Interaction in Service Businesses Massachusetts: Lexington.

Business and Social Sciences Review (BSSR) Volume 1, Number 1, (July 2011) www.bssreview.org
70
Copyright © 2011 – Society of Business and Social Sciences (London – UK)
Roethlishberger, F. J. & Dickson, W. J. (1939). Management and the Worker. Massachusetts: Harvard. Rutes, W. A. & Penner, R. H. (1985). Hotel Planning and Design. New York: Watson-Guptill. Sanders, P. (1982). Phenomenology: A New Way of Viewing Organizational Research. Academy of Management Review, 7, 353-360. Susman, G. I. (1976). Autonomy at Work: A Sociotechnical Analysis of Management. New York: Praeger
Tansik, D. A. (1985). Nonverbal Communication and High-Contact Employees. In J. A.
Czepiel, M. R. Solomon, & C. F. Surprenant (Eds.), The Service Encounter. Massachusetts: Lexington. Thorngate, W. (1986). The Production, Detection, and Explanation of Behavioral Patterns. In J. Valsiner (Ed.), The Individual Subject and Scientific Psychology. New York: Plenum. Trist, E.L. (1981). The Evolution of Sociotechnical Systems. Toronto: Ontario: Ministry of Labor. Trist, E. L. & Bamforth. W. R. (1951). Some social and psychological consequences of the longwall method of coal getting. Human Relations, 4, 3-38. Trist, E. L., Higgin, G. W., Murray, H., & Pollock, A. B. (1963). Organizational Choice. London: Tavistock. Weick, K. (1979). The Social Psychology of Organizing. Massachusetts: Addison-Wesley. Wener, R. E. (1985). The Environmental Psychology of Service Encounters. In J. A. Czepiel, M. R. Solomon, & C. F. Surprenant (Eds.), The Service Encounter. Massachusetts: Lexington. Whyte, W. F. (1987). From Human Relations to Organizational Behavior: Reflections on The Changing Scene. Industrial and Labor Relations Review, 40, 4, 487-499. ________. (1984). Learning From The Field: A Guide from Experience. California: Sage ________. (1949). The Social Structure of a Restaurant. The American Journal Of Sociology. 54, 302-310. ________. (1948). Human Relations in the Restaurant Industry. New York: McGraw-Hill.

Business and Social Sciences Review (BSSR) Volume 1, Number 1, (July 2011) www.bssreview.org
71
Copyright © 2011 – Society of Business and Social Sciences (London – UK)
Whyte, W. F., & Hamilton, E. L. (1973). Action Research for Management. Ohio: Grid. Zuboff, S. (1988). In The Age of The Smart Machine. New York: Basic. Appendix A Materials Used In Videotaping Observations
1 Panasonic VCR - accepts Standard and Professional Broadcasting video cassettes
1 Sony color monitor with 14 inch diameter screen - -monitor screen capable of showing video tapes in progress, or
playbacks. 1 Panasonic VCR Remote Control
- -device for controlling the VCR. 1 Panasonic Quad Mixer Unit
- -device which directs the audio quality of the tapes, enabling the monitor to isolate tracks if such a split is warranted.
1 Panasonic Genlock Adapter - -links four camera views onto one monitor screen simultaneously so that
various perspectives of an interaction can be viewed and compared to one another.
1 Realistic Stereo Headphone Set 1 Headphone Mixer
- enabled monitor to listen to the audio components while reviewing the videotapes.
3 Panasonic Digital 5000 Video Cameras with 12X lenses Materials Used In Videotaping Observations
2 Hi-impedence microphones for use with the Digital 5000 Cameras 1 Shure 570s Dynamic Microphone 1 Shure Stereo Mixer
- composed input from all of the microphones being used at the desk. Also allows audio signals to be directed appropriately.
2 Sony Digital Stopwatches -measurement capability of 1/16 second.
Appendix B Table 1 Computer-Mediated Desk Clerk Functions Pre-Sale Phase: Processing reservations Recording advance deposits or prepayments Forecasting occupancy or revenue on a daily basis Mailing information to guests

Business and Social Sciences Review (BSSR) Volume 1, Number 1, (July 2011) www.bssreview.org
72
Copyright © 2011 – Society of Business and Social Sciences (London – UK)
Point-of-Sale Phase: Registering guests (the check-in procedure) Assigning rooms and rates. Creating guest accounts called folios Post-Sale Phase: Posting charged purchases from the gift shop, the restaurants, etc... Reconciling guest accounts Updating room status Compiling guest history records (From Kasavanna & Cahill, Check In; Check Out)
Business and Social Sciences Review (BSSR) Volume 1, Number 1, (July 2011) www.bssreview.org
73
Copyright © 2011 – Society of Business and Social Sciences (London – UK)
Successful School Improvement
Khush Funer Murtaza Professional Development Centre North Institute for Educational Development
Aga Khan University, Pakistan E.mail: [email protected]
INTRODUCTION
This paper offers information through my personal involvement, observations and reflections on school improvement efforts and changes. During the pre-intervention and intervention stages I was in the school with the support of Government stakeholders such as students, teachers, Government officials and parents which resulted in some positive changes. The paper also highlights the challenges faced and the lesson learnt in the process, and concludes with some suggestions for a possible and preferable way forward. History of the school For the academic year 2009-10 a Whole School Improvement programme (WSIP) intervention was initiated in F.G. Girls High School Oshikhandas village situated in the vicinity of the Gilgit city in north Pakistan. This school came into existence in 1975, nested in a conventional house equipped with a single male primary pass teacher with an enrolment of 8 students 3 boys and 5 girls. The situation continued for almost seven years from 1975 to 1981. In 1981 the school was shifted to Imam Bargah in the same area, with an increased number of students up to eleven (9 girls and 2 boys). After a period of five years, in 1986 the school shifted to the old block (old three rooms) of the existing building with a total enrolment of 150 girls in the whole primary section along with their two teachers. In 1996 the school raised its student enrolment up to 300 girls taught by 4 female teachers consequently upgraded to middle level. Gradually some volunteer teachers joined the school with the support of one of the ADIs of the area. After one year in 1997 class 9th and 10th were initiated with 10 students. With the passage of time the number of students increased and currently there are 446 students along with 20 teachers (14 permanent, 3 community and 3 volunteers). At present, it functions as the community high school having total six grade ones including five female and one male in its purpose built building. Pre-Intervention Phase To get an insight into the school milieu, and to know about Whole School Improvement (WSIP) processes we (my faculty colleague and myself) arranged some formal and informal observations at the classroom level, semi structured interviews with teachers and documents analysis etc. (see appendixes 1-7). The pre-intervention process was for ten days. Discussions with some students and parents took place to know their perceptions about the existing situation of the school.

Business and Social Sciences Review (BSSR) Volume 1, Number 1, (July 2011) www.bssreview.org
74
Copyright © 2011 – Society of Business and Social Sciences (London – UK)
Being a faculty member of The Aga Khan University-Professional Development Centre North (AKU- PDCN) to implement the model of whole school improvement program I internalized the conceptual frame work of WSIP and made it a guideline during the intervention phase. According to the conceptual framework which underpins The WSIP the following six major areas were focused during pre-intervention and intervention stages. Quality of teaching and learning The assemblage of teaching staff was a combination of both experience and young blood. There were teachers equipped with decades and more than a decade long teaching experience at different schools within the government educational framework. The young generation of teachers was a pleasant addition, who had been inducted in the flock as a contingent paid and volunteers. The induction of this young generation of teachers has considerably contributed in raising the level of enthusiasm and updating and enhancing the content knowledge pool of the teaching staff.
Overall, our classroom observations and focused group interviews revealed that with few exceptions, the young generation of teachers was better equipped with content knowledge but there was enough room to bring about an improvement in their pedagogical skills. The comparatively more experienced segment of teachers could be helped in raising their motivational level towards teaching and learning as life-long learners.
Based on the above finding we have planned to intervene in the areas of: Lesson Planning Introducing and practicing subject related teaching strategies and techniques Initiating and practicing resource based teaching and learning
Leadership and management The head teacher in the school was a generally accepted leader because of her contributions in the physical and infrastructural development of the school. Apart from the physical resource development in the school she has managed to establish a structure of school management committees (SMCs) to cultivate a channel of working relationships with the community. In the light of the observations and interviews it appeared that the head teacher can be helped in introducing the concepts and structures of shared, distributed and teacher leadership in the school. There was enough room to strengthen her hands in the area of community participation and involvement in the affairs of the school.
Based on the above finding it was to intervene in the areas of: Vision building Team building and task delegation Teacher leadership Student leadership

Business and Social Sciences Review (BSSR) Volume 1, Number 1, (July 2011) www.bssreview.org
75
Copyright © 2011 – Society of Business and Social Sciences (London – UK)
Staff development and curriculum enrichment The majority of the more experienced teachers were trained through professional development courses like B.Ed, P.T.C and C.T. The younger team of teachers was untrained through any form of professional development channel. There was no kind of in house professional development program for the teachers consequently the existing scenario did not represent a culture of in house collective professional development among the teachers. Hence we felt that the school could be helped in initiating and sustaining variety of in house professional development programme for its teachers such as:
Professional sessions Professional Portfolio Peer coaching Mentoring
Community participation The school accommodated to the children of comparatively low socio income status families consequently such economic and other social constraints minimized the level of community participation. The teachers along with their leader faced peculiar contextualized problems in cultivating a pro active relationship with the parent community. Therefore, the head teacher and the teachers undertook acquiring community participation and their active involvement in school affairs as the challenge for the year. In this regard we planned to enhance the community involvement through;
Meetings with SMCs Parents day Mother’s day Parents participation on festivals
Building accommodation and resource development The school had a purpose-built and well maintained building with good facilities wash rooms, and a large ground with compound wall. There were computers in a school room but because of some administrative and technical problems they were not being used in the school. In spite of possessing enough rooms the school was lacking the facilities of a resource centre and a library. Therefore, on the one hand the school management could be assisted in establishing a resource room, and on the other hand they could further be facilitated to resolve the technical and administrative issues in order to make the computers functional. Based on our findings we as a team planned to intervene in the areas of:
Provision of filtered drinking water Overall cleanliness of the physical environment of the school Establishment of resource centre Functionalizing the computer centre Art and painting

Business and Social Sciences Review (BSSR) Volume 1, Number 1, (July 2011) www.bssreview.org
76
Copyright © 2011 – Society of Business and Social Sciences (London – UK)
Social/moral development of students and health education Our observations and focused interviews revealed that the head teacher, along with the other teachers, were very sensitive and had extended their full priority to the social and moral development of the students. The head and other teachers tried to deliver lectures in the morning assembly about social and moral issues and tried to be role models for desirable, social and moral human beings. We found soap in the wash rooms for the children to wash their hands which could be taken as an indicator for their consciousness towards the health education.
But still there was a lot more room for improvement in the area of social, moral and health education of the children. More awareness was needed to be created among the school community about the social, moral development and health education of the children and the school teachers could be assisted in initiating and sustaining such practical initiatives as leaders for change. We planned to intervene in this aspect through:
Health awareness lectures by guest speakers Initiating student behavior management program Workshops on professional ethics for teacher
Intervention phase Before putting any action to implement my understanding of school improvement we felt it extremely important to develop a shared understanding with the head teacher, teachers, SMC and the system representative Assistant District Officer (ADI). As Mooney et al (1997) suggested, “….the stakeholders of the institution share in the development of the vision that will lead the organization into the future” (p.4). In order to develop a shared understanding of WSIP among all stakeholders (head teacher, teachers, SMC and ADI) various discussions were held and as a result school vision, School Development Plan (SDP) and time table were formed. Since then some of the positive changes, which have occurred through joint efforts of the
school community, SMC, AKU- PDCN and the Government Education Department, are now
mentioned.
Physical environment The dusty and filthy classrooms, corridor, and the rough walls and the roofs created a dull and a gloomy environment inside of the school building which needed immediate attention to create a lively and comfortable environment for the students and staff. Summarizing the qualities of a good school Stone et al. (1992) suggests, “good schools maintain a repaired and decorated building to provide pleasant conditions for students” (p. 106). To achieve this target we had various meetings with SMC, staff and administration to develop a common understanding of WSIP and it was decided to focus on six areas of the program. Initially we all strongly felt the need to create a safe and comfortable environment in the school. According to Stone, et al. (1992), the building’s physical condition , level of
Business and Social Sciences Review (BSSR) Volume 1, Number 1, (July 2011) www.bssreview.org
77
Copyright © 2011 – Society of Business and Social Sciences (London – UK)
violence, the attitude of students …..on powerful first impressions made on school visitors …… people demand and deserve safe and orderly schools” (p. 97). To fulfill this desire the first step was to shift some classrooms according to the strengths of students. To achieve this purpose various formal and informal meetings with SMC were held to solve the issues. Most of the SMC members were astonished, initially because first time they had such meetings to improve students’ learning. However, the chairman of the committee was ready to donate some money to provide daries for the ECED, infant and 1classes. Though it took time and continuous follow up and struggle but we got six daries. We also observed that staffroom and resource room was without any carpet and particularly in the resource room students faced difficulty sitting on the ground in the cold winter. We discussed the issue with the head teacher and teachers and they generously contributed Rs. 300 per head. By this money we had bought two carpets, one for the resource room and another for the staffroom. Now we were in a position to claim that the resource room and staffroom were the best ones in the School in terms of its well developed physical environment. To develop the ECED, infant and 1classes, I worked with the teachers in setting classroom environment, introducing one teacher one class concept and generating resources. As a result the respective teachers who left the school at 12:00 p.m. remained planning and preparing resources until the school closed at 2:00 p.m. after our intervention. Through all the efforts, gradually, we saw a big change and after our intervention I was deeply touched by the attractive classroom environment of those classes. Moreover, we (Early class teachers and myself) took some other initiatives to reshuffle the classrooms according to the level and strength of the students. The previous ECED classroom was very small where we had 32 students who faced difficulty in moving and working in learning areas. On the other side the rooms where the infant class and grade one students worked with a strength of 11 and 16 girls. Therefore, with the consultation of the head teacher and class teachers I shifted ECED class to the large room. However, the infant class was shifted to the ECED room and grade 1 remained in another room. The rooms were without any carpet or chatai. Only two small broken pieces of chatai were there which was a critical issue particularly in chilly weather. Thus, we discussed the issue with SMC members who assured us some chatais for those rooms would be provided. With kind collaboration of SMC chairman we succeeded in receiving and using the daries in the classrooms. Re-functional Information Technology (IT) Centre One more significant step which required careful consideration was how to make functional the IT Center. There were fourteen computers in the computer lab without having any IT teacher who could assist the other teachers and students to learn computing skills. To achieve our target the issue was shared with SMC to arrange for an IT teacher. The committee assured us it would provide a teacher very soon to teach the computer classes for teachers and students. It was our understanding, once the teachers get exposure to computers, they would facilitate helping their students on daily basis and gradually all students would avail themselves of the opportunity to learn computing skills. SMCs strong

Business and Social Sciences Review (BSSR) Volume 1, Number 1, (July 2011) www.bssreview.org
78
Copyright © 2011 – Society of Business and Social Sciences (London – UK)
efforts succeeded to finding a competent IT teacher who taught computer classes for students and teachers. They all took interest and learnt. With support of the Government Education Department and active SMC members we took some other initiatives, for example:
Proper plantation in the school premises, students were also involved in plantation Construction of high boundary wall for safe and safety Arrangement of clean water system in the school
Teachers’ attitude towards students and colleague teachers During our pre intervention period we observed that mostly the school administration and the teachers were harsh, unfriendly and even threatening towards the students. The students who were not able to come to morning assembly on time were sent back home. Most of the teachers were seen carrying a long and a thick stick to the classrooms. Some of the teachers were also heard using harsh words inside and outside the classrooms. Some students said: “previously, we were punished by the teachers for getting low marks in tests.” But after the intervention, gradually, we saw a huge change in teachers’ attitudes towards students. They appreciated students’ work and displayed it in classrooms. They also provided support to students if they did not participate in classroom activities. Similarly teachers had harsh attitude with each other. I never found any discussion related to students’ improvement in the initial stage. They just discussed personal problems (about children and families) in the staffroom. But after the intervention we saw a numerous changes in teachers’ attitudes. The teachers observed each others’ lessons, gave feedback and shared resources with each other. Provided support for teachers at classrooms Another important action was providing support for teachers in classroom teaching. Initially teachers taught in classes without any plan. For this purpose we identified teachers’ interest and expertise in different subjects and worked with them in planning to improve their practices, for instance, Science, Mathematics, Language (English and Urdu), Social Studies and Islamiat. We demonstrated lessons in classrooms, co planned, co taught and gave feedback to teachers to enhance their conceptual understanding. In addition, teachers made a routine of observing each others’ classrooms. They wrote reflections, prepared lesson plans, developed teaching materials, utilized them in classrooms and discussed classroom issues with each other as well as with faculty members without any fear or hesitation. As a result, we saw continuous improvement in teachers and students day by day. Conducted professional development sessions In-house professional development activities were carried as a mandatory component of school activities. Halai (2002) suggests initiating professional development activities in schools. She argues that providing teachers with school-based professional development liberates and empowers schools that were neglected. She believes that close and intense relationship between educators and teachers help the school leaders to identify the real

Business and Social Sciences Review (BSSR) Volume 1, Number 1, (July 2011) www.bssreview.org
79
Copyright © 2011 – Society of Business and Social Sciences (London – UK)
needs of teachers, provide timely support and develop a follow up structure to ensure the new learning in the classroom that is the ultimate objective of the professional development initiative. Hence, school based professional development support seems more accessible as it involves all the professional staff in the learning activity as compared to outdoor professional development opportunities and is practical as it meets the contextual realities of the school. Keeping in mind the importance of professional development sessions in the WSIP program we were supposed to conduct twenty five sessions for teachers. Frequently sessions were held on generic areas such as school development plan, team building, reflective practice, professional portfolios, unit planning, lesson planning and team building etc. Further we also had sessions on content enhancement in subjects like Language (Urdu and English), Social Studies, Science and Mathematics. To conduct these sessions effectively we two faculty members planned carefully at AKU-PDCN. On the basis of these sessions an encouraging point was that the head teacher and deputy head themselves came forward and conducted the sessions. Similarly, other teachers also showed their willingness to conduct sessions in pairs. So in future once we left the school, the program will be sustained. Displayed professional portfolios in classrooms We conducted a session on professional portfolio and its importance in schools. A teaching portfolio is a collection of physical evidence that helps documents a teacher’s performance and professional accomplishments”, (Teaching Portfolio Guided Document, 2000) because in the portfolios teachers set their professional goals. Through reflections they evaluate their performance. Shulman (1992) believes that a portfolio is a structure document where teachers record their learning as well as the students’ work samples. These documents are developed through reflective writing, thoughtfulness and serious conversations (Lyons, 1999). Portfolio process can prompt teachers to reflect on themselves and their practice on regular and continuous basis” (Winsor, 1998). Keeping in mind the importance of a port folio we encouraged teachers to make their own portfolios as well as students individually. Teachers’ portfolios were kept in head teacher’s office whereas students’ portfolios were displayed in their respective classrooms. We also created a culture to keep students ‘ work in their portfolios and, similarly, teachers’ work in their portfolios where each teacher could keep the activities which they had prepared for students’ learning. They put all the important samples of different activities e. g. lesson plan formats, samples of daily reflections, puzzle games and meeting minutes etc. Teachers shared their portfolios and learnt from each other. Use of low cost materials To make learning meaningful for the children we also considered locally available materials. Initially teachers complained of lack of resources but after having a session we

Business and Social Sciences Review (BSSR) Volume 1, Number 1, (July 2011) www.bssreview.org
80
Copyright © 2011 – Society of Business and Social Sciences (London – UK)
encouraged them to collect teaching materials from school premises and from homes such as empty boxes, bottles, buttons, sticks and stones from the village. In free periods, the faculty members accompanied teachers to develop teaching aids from the collected low cost materials. Consequently, needed resources were increased by the teachers and students in the school. In addition, the faculty members also ensured the proper utilization of the materials in classrooms. By this purpose they demonstrated lessons on need basis. Developed story books Initially teachers did not use any story in classroom teaching. Therefore, we introduced to teach various stories (English and Urdu) for all classes. Stibbs (1991) has said: “We all remember stories we have been told, or read, or probably better than we remember information.” (p.1 ). We encouraged the teachers to develop big books in early classes for various stories. These big books consisted of beautiful bright pictures along with very precise text. Children were interested to read the stories and teachers also used these books in language (Urdu and English) classes to enhance students’ learning. Apart from it we also encouraged students and teachers to develop zigzag books in classrooms. Teachers developed many books e.g. ‘my number books, animal books, four season books and colour books’ etc. All the books were displayed in the resource room and on need basis teachers utilized them in their classrooms. Teachers also showed their willingness to use library books in preparing lesson plans. For that they requested us to bring books according to their need and interest. Overall the learners in the school, including the teachers, seemed very desirous of reading the books. As a result teachers prepared books for their own children at homes. Formation of committees To enhance teachers’ leadership skills and to run the activities smoothly we formed various committees in the school during the academic year. For example, Cleanliness Committee, Science Committee, Mathematics Committee, Language Committees, Fee Collection Committee and Co curricular Activities Committee etc. In these committees teachers displayed their leadership role and performed the task smoothly. It was our observation and experience that gradually teachers improved their leadership skills. Formation of class representatives To develop students’ leadership skills we encouraged students to come forward and participate in various activities as head Girl, prefact and monitor. Each class has a monitor who took care of the whole class. By this way we provided opportunity for more students to develop their leadership roles. Arranged One Day Kingdom We planned “One Day Kingdom” in the school where students had to play active role to run the school. Students were responsible to run the school for the whole day. Students played the role of PDCN faculty members, school principal, teachers and non teaching staff. All of them performed very well. Some of them taught in the classroom. However, some of them had staff meeting and discussions in staffroom. We were fascinated to see the confidence

Business and Social Sciences Review (BSSR) Volume 1, Number 1, (July 2011) www.bssreview.org
81
Copyright © 2011 – Society of Business and Social Sciences (London – UK)
and the skills they displayed to perform the task. It seemed that if teachers encouraged the children they perform very well. Introduced Project Day in the school There is no single definition for projects. Educators use the ‘project’ to describe many different learning experiences. Some teachers believe that any activity that continuous for more than a day is a project. When students read a book and recreate the book’s setting by constructing a dialogue, that is often referred to as a language arts project. Art teachers refer to creating a paper-match mask as an art project, and Science teachers regard an experiment carried out for a school’s science fair as a science project (Diffily, 2002). We advocate project-based learning helps students introduce their work in school to work in the ‘real world’. Teachers and students both played vital role, for instance, students direct their learning instead of following the directives of the teacher. Students select their daily tasks during project work. Arends (1997) further describes it as complex tasks that involve students in design, problem solving, decision making and investigate activities. Teachers expect students to work independently, accept leadership roles, be responsible and exhibit intellectual curiosity and working with them until they are comfortable and competent in their roles. Hence, they do not pour knowledge to students as empty vessels. They believe if the teachers facilitate students properly. They can improve and become independent learners. Keeping in mind the significance of the project we had planned a three- day Project Day in the school. Initially we divided the teachers subject-wise and assigned the task to select a topic with collaboration of their students and collect the materials accordingly. Teachers came up with brilliant ideas and selected such themes as ‘Solar System, Rural and Urban Life, Transportation, Means of communication, Minar-e Pakistan and My House. For two days teachers and students contributed very well in terms of collecting materials, sharing ideas, listening to others, performing leadership roles and giving suggestions. On the third day all projects were ready in the school hall. This was really fascinating to us. The next day, soon after completion of the projects, we invited parents and neighbor school teachers (Al Asar, Vision and F G Boys High School Oshikhandas) to see their children’s work. Students presented their work with confidence. Various questions arouse from parents which were addressed by students very well. Parents and teachers appreciated their children’s work. Establishment of resource room The next initiative which we took at the school was establishment of a resource room. The school did not have any concept of resource room. UNICEF provided books along with the school’s own books which were full of dust and were not in a proper place. Thus, we thought to initiate a resource room where we could keep the mobile library books (from PDCN) as well as books, magazines and newspapers from the school. On the other side

Business and Social Sciences Review (BSSR) Volume 1, Number 1, (July 2011) www.bssreview.org
82
Copyright © 2011 – Society of Business and Social Sciences (London – UK)
there was a room which was full of broken furniture. With the help of grade ones we had shifted all the furniture to the store room and that room was prepared as a resource room. Initially the room was full of dust and mud. Hence, we (the head teacher and myself) thought to white wash in the room. The room was cleaned and we shifted all resources to the resource room. We also shifted the resources of our Three Day Project which total led ten projects and plenty of charts. After giving all the efforts now we confidently say that the resource room in the school is full of colourful charts, beautiful story books of children and teachers, flash cards and attractive models. Without utilization of resource centre we were not able to achieve our objectives. Thus, we carefully reflected and reviewed the timetable with consultation of the head teacher and other teachers. Finally we arranged library periods for students. In that particular period students went to the resource room and read books. To strengthen the resource room we also requested all the teachers and students to donate a book if they had some at their homes. They all agreed and donated very good books for the resource room. Now we have more than seven hundred books in our resource room. In addition, we (the PDCN faculty) had introduced Gilgit-Baltistan’s first mobile library scheme under Whole School Improvement Program. In this scheme, one hundred books are delivered to participating schools every two weeks. In order to enrich and broaden the students’ conceptual understanding, teachers have free accessibility to use and issue books for further study to improve their content and pedagogical knowledge. The faculty and teachers used the library books in classroom teaching and conducted workshops to show the teachers how to enrich the curriculum, which helps teachers to identify relevant activities from the textbooks. They also took storybooks to their homes to teach stories to their own children. The children loved to listen stories from the mothers. Moreover, we also encouraged students to read different books from library. For that the school encouraged to arrange library periods. Experience showed that at the end of two weeks in the school teachers and students utilized the books in their classroom teaching. Some of the teachers and the school head said: “The books from PDCN have motivated us to read the books in the school which were locked in the cupboard for a long time.” We also spent time to instruct the school librarians how to retrieve, issue and catalogue books to facilitate the teachers and students in an effective manner which made our resource room attractive and provided expectation for further support in the period ahead. The mobile library scheme seems to have helped to develop a reading culture in WSIP schools where both students and teachers use books for various purposes. They seemed very keen and desirous of reading the books. It also encouraged the head teachers and

Business and Social Sciences Review (BSSR) Volume 1, Number 1, (July 2011) www.bssreview.org
83
Copyright © 2011 – Society of Business and Social Sciences (London – UK)
teachers to collect materials and use them in the classrooms to enhance teaching and learning process. Parental involvement A huge number of research studies favor parental involvement and its importance. Stern (2003, p. 78) said, “Parents are the children’s first and most enduring educators. When parents and educators work together from early years, the results have a positive impact on children’s development and learning.” Further Barth and Levin support parental involvement; a good school is one in which teachers and principals want to work and that parents want their children to attend. In addition, school is an integral part of the community (Barth, 1990; Levin, 1992). A good school is a place where everyone is learning and teaching and where everyone receives the supports necessary to develop. Similarly, AKU-PDCN believes that without involvement of communities and parents in the school teaching and learning process, the school improvements initiatives taken from the outside do not impact effectively in the change processes. We aim to cooperate and work very closely with all members of the communities. For this purpose we initiated a session for SMC to play a vital role in school improvement. A total of 14 male and female members, ADI, PDCN faculty members, head teacher and deputy head joined the session. The meeting was quite productive in terms of discussing various issues and finding solutions. After the meeting the committee members played a significant role in day to day school activities, for instance, minimizing students’ absenteeism from school, providing clean drinking water and arranging stationary shop in the school compus to save students time. Apart from it we had involved mothers in the teaching and learning process by celebrating ‘Mothers’ Day’, and sometimes mothers’ meeting in the school during the academic year. For this purpose we invited mothers class-wise from ECED and infant to the high classes. Initially the mothers showed reluctance to come to school because of the cultural sensitivities in this context. Most of them were visiting productively for the first time, although they had visits earlier but not in such a context. Some of them commented: “For the first time we had a productive session about our children’s education. We are very thankful to PDCN for working our children’s education. In future we will come to school regularly and will try to minimize the issues.” (meeting with mothers on 10th November, 2009). The conducive environment in the project school and friendly interaction of the faculty members encouraged mothers to visit the school frequently in order to share their feelings and ideas about how mothers can contribute to the school and to students’ performance. Some mothers shared that they had never thought about how they could help the school and their children in learning process. Through frequent meetings of faculty PDCN with SMC and some mothers who were working in different schools as teachers, the attendance and participation of mothers in meetings increased gradually. PDCN faculty encouraged mothers who were SMC members to play an active role in school activities, to become more

Business and Social Sciences Review (BSSR) Volume 1, Number 1, (July 2011) www.bssreview.org
84
Copyright © 2011 – Society of Business and Social Sciences (London – UK)
informed about what happens in the school, and to contribute knowledge about their children and having an equal voice with teachers. The significant features of mothers meetings were to:
Discuss with them about creating a home environment that encourages the children’s learning
Become more involved in their children’s education at home. Communicate high, yet reasonable expectations for their children’s achievement and
future guidance. Develop procedures that enable mothers to monitor and help homework. Provide frequent, timely communication on student progress so mothers can
respond to student’s individual interests and difficulties. Discuss issues related to students leaving the school premises during school hours. Discuss cleanliness and basic health problems. Use mothers as resource persons in teaching and learning process i.e. some
mother’s were very good in sewing and cooking, while some were working as health workers. We tried to invite and arrange sessions where these mothers shared their skills and experiences.
Share mobile library resources so that literate mothers might read aloud to their children at home, and illiterate mothers could tell indigenous stories to their children.
Identify how mothers can manage and prepare low cost cushions/seats to their children who were expected to sit on the ground in winter.
There were clear benefits in creating an effective involvement of mothers in the school process. It helped in minimizing the students’ absenteeism from the classes. It was observed that in schools where mothers have participated, students no longer left the premises during school hours and attendance had increased. Cleanliness of student’s and quality of their uniform had improved. Students brought basic resources i.e. pen, pencil, sharpener and writing and reading resources in their bags. Mothers prepared low cost cushions for their children who have to sit on the floor, particularly in winter. Also mothers started visiting the schools where they discussed the performance of their children and asked the teachers how they could assist their children more meaningfully at home. Health visitors and health workers were being used as resources persons in mothers’ meetings, where they shared, conducted sessions on basic health education and suggested activities to mothers about prevention of disease which were caused by germs. All the above results indicated that mothers can be involved in forming effective partnership with home and communities to improve the schools. Michael Fullan (2000, pp. 42-43) says it best: “Nothing motivates a child more than when learning is valued by schools and families/communities working together in partnership. These forms of (mothers) involvement do not happen by accident or even by invitation. They happen by explicit strategic intervention.”
Business and Social Sciences Review (BSSR) Volume 1, Number 1, (July 2011) www.bssreview.org
85
Copyright © 2011 – Society of Business and Social Sciences (London – UK)
Accessibility of running water in the school premises Another significant issue was the proper arrangements of running water in the school premises, particularly in washrooms. Some buckets of water were kept at washrooms which was not enough for all students. Students went outside for washroom purpose which was a burning issue in girls’ school. We discussed the issue with SMC members and ADI very seriously. They realized it and took action well in time. Now the school has clean running water facility for drinking as well as for washrooms. Teaching outcomes Almost all the teachers have started to maintain their reflective journal on a daily basis. They have prepared a scheme of work for the whole academic year for the subject they teach. Most of them now strongly believe in a variety of teaching strategies to address students’ individual needs. They use pair work, group work, brain storming, presentations, whole class discussions, quiz competitions, debates, speech competitions and role plays followed by teacher’s input. Most of the teachers’ practices are guided by Armstrong (1994) who says: “because of individual differences among students, teachers are best advised to use a broad range of teaching strategies with their students” (p. 65). Most of the teachers highly appreciated students’ creativity. They started to decorate classroom displays with students’ work. The students were free to ask questions and to criticize each other. The positive relationship teacher to teacher, teacher to student and student to students increases day by day. As Smith, S.G. et al. (2003) further supported this by saying that caring teachers work hard to know students by using multiple sources of knowledge and by structuring their classes to encourage oral and written dialogue that reveals students’ thinking. They consciously work to create a classroom atmosphere conducive to questioning, self assessment and helpful critique. They also take great care to establish three kinds of relationships -i.e. teacher-student relationships, student-student relationships and student-teacher relationships. In addition, the school community has also strongly discouraged physical punishment or threatening attitude towards students. In ECED, Infant, and 1st classes there is one teacher one class concept. A single teacher is involved in each class. She remains in the class for the whole day. To give additional support another teacher also participates in these classes but the responsible teacher’s presence in the classroom is essential to ensure a caring and friendly atmosphere for the students. As an impact of the weekly sessions, subject wise teachers have been involved with carrying out pair coaching in the classrooms. Teachers have been involved in developing teaching materials, joint lesson planning and sharing their classroom experiences with each other. The sessions also had impact in the staffroom culture. Mostly, teachers in the staffroom discussed students’ performance in tests, their creativity and the challenges they face etc. Some of the teachers studied and prepared resources instead of wasting their time in irrelevant discussions.

Business and Social Sciences Review (BSSR) Volume 1, Number 1, (July 2011) www.bssreview.org
86
Copyright © 2011 – Society of Business and Social Sciences (London – UK)
The school community also arranged different programs for the students such as drawing competition, painting (potato and leave painting), debates, quiz competitions, project day, hand washing day and celebrating international women day which enhance students’ confidence and creativity.
LEARNING OUTCOMES As a result of positive change in teachers’ instructional strategies and instructional skills an incremental change of students’ performance has been noticed. Most of the students actively contributed in classroom activities. They were highly confident in asking questions, listening to each other and sharing their learning. Students also shared their personal problems with teachers without any hesitation and fear. In addition, we have seen a positive attitudinal change among students. They take care of each other and share their things (lunch, pencils, colours etc.) if somebody does not have them. They are also very punctual in saying greetings and thank you etc. which is a fascinating change for school community as well as for us. Lesson learnt Up till now some of the significant lessons I learnt during the process of school improvement are as follows:
Government Education Department and SMCs’ support encouragement and proper guidance make things to go smoothly.
Visible changes need to be given priority as they help to build trust. Head teacher and teachers have to be a role model to give extra time, financial
contributions and physical work.
REFERENCES Armstrong (1994). Multiple intelligences in the classroom. Virginia: ASCD. Butt, G. (2006). Lesson planning (2nd Edition). London: continnum Diffily, D. (2002) Social Studies and the Young Learner vol. 15 no2 pp. 17-19 Falvey, M. A. (1995). Inclusive and Heterogeneous Schooling Assessment, Curriculum and Instruction. USA: Paul H. Brookes Publishing Co. Fullan, M. (2000). Change forces: The sequel . UK: Falmer Press Halai, A. (2002). On becoming a professional development teacher : A case from Pakistan. Mathematics Education Review, 14 (1), 31-48 Mooney et al. (1997). The learning school. California: Corwin Press, Inc.
Business and Social Sciences Review (BSSR) Volume 1, Number 1, (July 2011) www.bssreview.org
87
Copyright © 2011 – Society of Business and Social Sciences (London – UK)
Smith, S.G. et al. (2003). Teaching challenges and dilemmas (second edition). Australia Pty Limited. Stibbs. A. (1991). Reading narrative as literature, sign of life. Ballmoor Buckingham Stone et al. (1992). Making schools work. California: Corwin Press, Inc Winsor, P. J. (1998). A guide to developing professional portfolio in the faculty of Education. Retrieved January 3, 2004 from http: //www.edu-
uleth.calfe/pdf/potfolio_ guide.pdf Wolfendale, S. (1992) (Second Edition. Primary Schools and Special Needs: POLICY.
PLANNING. PROVISION. London: Cassell Educational Limited

Business and Social Sciences Review (BSSR) Volume 1, Number 1, (July 2011) www.bssreview.org
88
Copyright © 2011 – Society of Business and Social Sciences (London – UK)
Energy Consumption and Output Growth in Nigeria A Generalized Method of Moments Approach
Ernest Simeon O. Odior (PhD)
Department of Economics, Faculty of Social Sciences University of Lagos, Akoka, Lagos, Nigeria
Phone: 08062088200; 08188593366 Email: [email protected]
ABSTRACT
This study determines the functional relationship between energy consumption
and output growth in Nigeria. Methodologically, the Generalized Method of
Moments (GMM) model was modeled to analysis the nature of the impacts, where
output growth is presumed to depend upon changes in various indicators of
energy consumption and a list of instrumental variables (IV) which include the
output growth, electricity consumption, gas utilization, petroleum consumption,
population, government recurrent expenditures on economic services,
government capital expenditures on economic services, estimated over the period
1979-2008. The model ascertained the extent in which energy consumption does
lead to changes in output growth. The results show that changes in electricity
consumption does not bring about output growth significance levels. These results
indicate that electricity consumption is not a good explanatory variable and that
past values of electricity consumption does not improve forecasts of movements in
economic growth.
INTRODUCTION
On a global perspective, economic development, within the particular conception of socio- economic processes which underscore every economic system, revolves around the issue of the character, structure, pattern and evolution of desirable inter-personal relation of production, allocation and utilization of available resources in any county. In order to optimally develop and efficiently allocate and effectively utilize them and subsequently put economic growth and development firmly on course, modern operational technologies with respect to production, allocation and utilization are designed and tied strictly to the use of energy in one form or the other (Ayodele, 2001). In this regards, adequate supply and distribution of electricity constitute a central growth and development issue which cannot be over-emphasized. Apart from serving as the pillar of wealth creation in any country, it is also the nucleus of operations and subsequently the ‘e engine of growth’ for all sectors of the economy. In recognition of the consolidating linkage between the energy sector and other sectors of the economy, electricity

Business and Social Sciences Review (BSSR) Volume 1, Number 1, (July 2011) www.bssreview.org
89
Copyright © 2011 – Society of Business and Social Sciences (London – UK)
development and utilization therefore have pervasive impacts on a range of socio-economic activities. Thus, the quest to rapidly and firmly put the Nigerian economy on the course of economic growth and hence development is technically, a function of adequate supply and distribution of energy, particular electricity (Ayodele, 1998, 2001). The foregoing assertion subsequently explains why one of the most frustrating and disturbing economic growth and development issue in the Nigerian economy and society particularly since the 1990s, is that of the inadequacy of electivity supply and distribution. In all, the situation of electricity supply inadequacy shows the emergence of a crisis situation in which electricity supply could not catch up with demand requirements, creating an imbalance or disequilibrium (Iwayemi, 1991 and Adgoke, 1991). The paper is motivated by the findings on the problem of epileptic power supply and hence inadequate power consumption which is prevalent in the Nigerian society, resulting in the dwindling of the tempo of productive activities and consequently a lowering of the wheel of growth. Hence, the main objective of this paper is to measure the magnitude or the degree of relationship between energy consumption and output growth in Nigeria between 1980 and 2009, which is explained by variations in electricity consumption, gas consumption and fuel consumption and some sets of instrumental variables. Thus, the structure of the paper is as follows. After the introduction part, section 2 provides a brief review of the literature on energy consumption and output growth while, section 3 explain the electricity situation in Nigeria, while estimation strategy and model specification are describe in section 4. Section 5 discusses the empirical results in the study and section 6 is the conclusions and policy implication.
ENERGY CONSUMPTION AND OUTPUT GROWTH Although economic theories do not explicitly state a relationship between energy consumption and economic growth, empirical investigation of it has been one of the must attractive areas of energy economic literature for the recent two decades. Since the seminal work of Kraft and Kraft (1978), many studies have investigated the relationship between energy consumption and economic growth. Mahadevan and Asafu-Adjaye (2007) investigate the relationship between energy consumption and GDP using annual data from 1971-2002 for twenty countries, including Australia. The finding indicates that a 1% increase in GDP growth is associated with an increase in energy consumption of 0.51% in the long-run. Overall, other develop countries that export energy has a similar relationship, with the incoming elasticity for these countries found to be 0.44%. The study does not report sufficient to computer confidence intervals around these point estimates. The authors note that the income elasticity for the development economies that export energy is less than unitary because “efficiency in energy management (due to stringent environmental regulation) may restrain energy consumption from increasing fully in response to an increase in GDP.”

Business and Social Sciences Review (BSSR) Volume 1, Number 1, (July 2011) www.bssreview.org
90
Copyright © 2011 – Society of Business and Social Sciences (London – UK)
Narayan and Smyth (2005) examine the determinants of residential demand for electricity in Australia for the period 1969–2000. The paper investigates two models for residential demand for electricity. Both models examine the relationship between per capita incomes. It is unclear whether the author uses real GDP as the measure of income or an alternative such as gross national income. However, the relationship is likely to be similar for various economy wide income measures; Real residential electricity price. Charges in the price of electricity may impact demand; real price of national gas. Since electricity and national gas are substitutes, higher natural gas may increase residential demand for electricity. The first model consider electricity and gas prices separately, while the second model examines only one relative price variable ; Temperature variable, represented by the sum of heating degree and cooling degree days. Increase in this temperature variable may lead to higher electricity consumption as more electricity is use as conditional on hot days and heater on the cold days; Electricity consumption is the previous year. There is some persistence in electricity consumption, such that current demand will demand in part on previous demand. This variable is used to estimate the rate at which predicted electricity consumption retune to it long run trend level based on the other variables. The result of the study indicate that at 1% increase in GDP is associated with a long-run increase in residential energy consumption of either 0.41% or 0.32%, depending upon the model used for analysis. The 90% confidence intervals surrounding these point estimates are 0.04-0.06% and 0.17-0.65%, respectively. Hickling (2006), using data for the period 1976–2000, examines the determinants of electricity demand in New South Wales. The fundamental model investigates the relationship between monthly per capita electricity consumption and the real price of electricity; the real price of the gas; and the real income per capita of NSW, with the income proxies by Gross State Product (the state equivalent of GDP); the real standard variable mortgage interest rate; Temperature variables. The model included a variable for heating degree days, weighted by a wealth index representing stocks of heating appliances. A variable for cooling degree days is also included, weighted by a wealth index and an index of air conditional stocks; and other additional timing variables. This are included to account for different number of working days in each month and the impact of leap years. The paper uses the alternative techniques to examine the long-run trend relationship between these variables. The paper estimate that a 1% increases in GSP per capita is associated with a long-run in NSW electricity consumption per capita of 0.37%, 0.26% or 0.22%, depending on the model use for analysis. The study does not report sufficient detail in order to compute confidence intervals around these point estimates. Akmal and Stern (2001) investigate the long-run elasticity of residential demand for electricity, natural gas and other fuels bin Australia using quarterly data over the period 1967/70-1998/99. The authors examine the relationship between real consumption on electricity per capita and: the real price of electricity; real household consumption expenditure per capita; and variable relating to each quarter to proxy for temperature effect. Within this study, the income electricity of electricity is found to be 0.52, within a 90% confidence interval of 0.45-0.60. This indicates that a one increase in real household

Business and Social Sciences Review (BSSR) Volume 1, Number 1, (July 2011) www.bssreview.org
91
Copyright © 2011 – Society of Business and Social Sciences (London – UK)
associated with an increase in residential electricity consumption within a range of 0.45-060%. A slightly different study from those discussed above is Hannesson (2002). He takes a more general view when he looks at increase energy use and economic growth in the letter part of the 20th century. He divides the time span into five sub periods based on the development of oil prices, and he find that the relationship between energy-use growth and GDP growth become weaker after the first energy crisis but later regain strength after 1986,espcialy in rich countries. He also finds out that the energy use tends to grow more slowly then GDP in rich countries, while the opposite is true for poor countries. This study does not apply any of this methodologies presented above but is based on descriptive statistics and simple regression. A study in the same avenue as Hannesson (2002) is one by Ferguson, Wilkinson and Hill (2000). They study the relationship between electricity and economic development in over 100 countries, constituting over 99% of the global economy. Their methodological approaches are calculation of simple correlations between electricity consumption per capita and GDP per capita, and between total energy consumption per capita and GDP per capita. Their general conclusions are that wealthy countries have a stronger correlation electricity use and wealth creation then do poor countries and that, for the global economy as a whole, there is a stronger correlation between electricity use and wealth creation than there is between total energy use and wealth. This survey clearly stated that a relationship exists between energy use and economic growth. Anything else would have been surprising. However, when it comes to whether energy use is a result of, or a prerequisite for, economic growth, there are no clear trends in the literature. Depending on the methodology used, and country and time period studied, different results are available.
ELECTRICITY SITUATION IN NIGERIA Nigeria is endowed with sufficient energy resources to meet its present and future development requirements. The country possesses the world’s sixth largest reserve of crude oil. It is increasingly an important gas province with proven reserves of nearly 5000 billion cubic meters. Coal and lignite reserves are estimated to be 2.7billion tons, while tar sand reserves have an estimated capacity of about 14,250MW. Nigeria has significant biomass resources to meet both traditional and modern energy uses, including electricity generation. The country is exposed to a high solar radiation level with an annual average of 3.5-7.0KWH/M2/day. Wind resources in Nigeria are however poor-moderate, and efforts are yet to be made to test their commercial competitiveness. The current installed capacity of grid electricity is about 6000MW, of which about 67 percent is thermal and the balance is hydro-based. Between 1990 and 1999, there was no new power plant built and the same period witnessed substantial government under funding of the utility for both capital project and routine maintenance operations. Generating plant availability is low and the demand- supply gap is crippling. Poor service have forced most industrial customer to install their own power generators, at high costs to

Business and Social Sciences Review (BSSR) Volume 1, Number 1, (July 2011) www.bssreview.org
92
Copyright © 2011 – Society of Business and Social Sciences (London – UK)
themselves and the Nigerian economy. By 2005, the transmission network consisted of 5000KM of 330 KV lines, and 6000KM of 132KV lines. The 330 KV lines fed 23 substations 330/132KV rating with a combined capacity of 6,000 MVA or 4,600 MVA at a utilization factor of 80%. In turn, the 132KV lines fed 91 substations of 132/33 KV rating with a combined capacity of 7,800 MVA or 5,800 MVA at a utilization factor of 75 % (Federal Minister of Power Steel, 2006) The distribution grid consisted of 23,753 km of 33KV line and 19,226KM of 11 KV lines. In turn, these fed 679 substations of 33/11KV rating and 20,543 substations of 33/0.415 and 11/0.415 KV ratings. In addition, there were 1,790 distribution transformers and 680 injection transformers. The transmission network is overloaded with a wheeling capacity less than 4,000 MW, It has a poor voltage profile in most part of the network, especially in the North, inadequate dispatch and control infrastructure, radial and fragile grid network, frequent system collapse, exceedingly high transmission losses. Power Holding Company of Nigeria’s (PHCN) business operations is inefficient. The system suffers chronic under investment, poor maintenance, un-recoded connections and under-billing arising from a preponderance of un-metered connections. The utility’s financial performance, as well as it has to serve customers satisfactorily has been consistently poor. Access to electricity services is low. About 60 percent of the population–over 80 million people are not served with electricity. The Rural Electricity Program began in 1981 focuses exclusively on grid extension; cost per connection remains high and annual rate of connection is low. With the chronic shortage of available generating capacity and low tariffs for rural areas, there is little incentive for PHCN to champion an expansion program. In all, rural electricity capital assets continue to deteriorate through neglect, vandalism and theft. The chronic shortage of available generating capacity has negatively affected the industrial and manufacturing sector. With self-generation prevalent in the industrial, commercial and domestic sub-sectors, the electrical energy demand in Nigeria currently at 10,000MW is actually not know. The Federal Government is undertaking comprehensive reform to address the electricity situation in the country. The enactment of the Electricity Power Sector Reform Act (2005), establishment of the Nigerian Electricity Regulatory Commission and the unbundling of PHCN are concrete legal, regulatory and institutional steps that will begin to address the challenges of the sector. Presently, a new wave of investments in the power generation championed both by the government and the private sector has commenced. The government has invested in generation expansion targeting a cumulative capacity of over 10,000 MW by the end of 2007. Expansion of transmission lines with the target period will increase to over 15,000km from about 11,000km. The capacity of available transformers will double (10,444MVA -22,414MVA) Adenikinju (2005) and Iwayemi (2008). Adequate and reliable electricity is a major input for achieving socio-economic development. Inadequate supply restricts socio-economic activities to basic human needs, limits economic growth and adversely affects quality of life. From the foregoing analysis of the electrical situation in Nigeria, the following can be deduced:

Business and Social Sciences Review (BSSR) Volume 1, Number 1, (July 2011) www.bssreview.org
93
Copyright © 2011 – Society of Business and Social Sciences (London – UK)
i. Electricity supply in Nigeria is grossly inadequate ii. Total installed capacity is far less than demand
iii. Available capacity is barely above half of installed capacity iv. Per capita electricity consumption is too low for meaningful economic and social
development v. The current supply system relies on essentially 2 resources – natural gas and hydro
(70:30) which are vulnerable to sabotage and adverse weather condition vi. Inadequate gas supply due to high cost or crises in oil producing zone of the county.
vii. Maintenance is often neglected and so the resulting association costs as percentage of the total operational cost keep rising.
viii. There is strong need to expand the energy mix for nation generation, in accordance with National
ix. Energy Policy (2003), to enhance energy security. Despite not being able to meet the current demand, the nation’s electricity demand continues to grow in response to: ever increasing population, urbanization, improved living standard and economic development. Addressing all the challenges is critical to meeting the need of a growing population, expanding our economy, and raising the standard of living of the people. Step being taken by Nigeria to address the Challenges of electricity supply, among other
include: Continuous analysis of electricity demand and supply projections, Promotion energy conservation and efficiency; Increasing renewable energy contribution; Renovating and providing infrastructure for electricity supply; Adopting environmentally friendly technologies; Promoting bilateral, regional and international cooperation.
ESTIMATION STRATEGY AND MODEL SPECIFICATION
What energy consumption variables are considered as potential determinants of output growth? The included variables are as follows: electricity Consumption, Gas Utilization, and Petroleum Consumption. To obtain some rough estimates of the magnitude of the effects of energy consumption on output level in Nigeria, we regress, measure of economic activity on the potential determinants of energy consumption. We empirically modeled the relationship between energy consumption and output growth using the Generalized Method of Moments (GMM). The GMM is a robust estimator in that, unlike maximum likelihood estimation, it does not require information of the exact distribution of the disturbances. This is to avoid the short comings of exact distribution of the disturbances in the variables. The theoretical relations that the parameters should satisfy are usually orthogonality conditions between some (possibly nonlinear) function of
the parameters f and a set of instrumental variables Zt:
Business and Social Sciences Review (BSSR) Volume 1, Number 1, (July 2011) www.bssreview.org
94
Copyright © 2011 – Society of Business and Social Sciences (London – UK)
0f Z , (1)
where are the parameters to be estimated. The GMM estimator selects parameter estimates so that the sample correlations between the instruments and the function f are
as close to zero as possible, as defined by the criterion function:
J m Am , (2)
where m f Z and is a weighting matrix. Any symmetric positive definite matrix
will yield a consistent estimate of q. However, it can be shown that a necessary (but not sufficient) condition to obtain an (asymptotically) efficient estimate of q is to set A equal to the inverse of the covariance matrix of the sample moments m. For the GMM estimator to be identified, there must be at least as many instrumental variables as there are parameters to estimate. The instrumental variables in the model included are as follows: population (pop), government expenditures on energy (gee). To estimate the hybrid model, we specified the model in the GMM form and list of instrumental variables as follow: Equation specification: y c x (3) Loggdpn1t= β1+ β2logelec2t + β3loggasu3t + β4logpetc4t +Ut (4) Instrument list: c z w; loggovc5t, loggovk6t, logpopu7t, logoimt8t (5) where (variable list), Loggdpn1t represents log of output growth Logelec2t represents log of electricity consumption β3loggasu3t represents log of gas utilisation β4logpetc4t represents log of petroleum consumption loggovc5t represents log of government recurrent expenditures on economic services loggovk6t represents log of government capital expenditures on economic services logpopu7t represents log of the population loggoimt8t represents log of oil import The orthogonality conditions given by
1 2 0t ty c c x (6)
1 2 0t t ty c c x z (7)
1 2 0t t ty c c x w (8) In testing the relationship between energy consumption and output growth, the J-statistic is used to carry out hypothesis tests from GMM estimation; see Newey and West (1987a). A simple application of the J-statistic is to test the validity of overidentifying restrictions when you have more instruments than parameters to estimate. In this paper, we have four instruments to estimate three parameters and so there are four overidentifying restrictions. Under the null hypothesis that the overidentifying restrictions are satisfied,

Business and Social Sciences Review (BSSR) Volume 1, Number 1, (July 2011) www.bssreview.org
95
Copyright © 2011 – Society of Business and Social Sciences (London – UK)
the J-statistic times the number of regression observations is asymptotically with degrees of freedom equal to the number of overidentifying restrictions. In estimating the model we used the Time series (HAC) of Weighting Matrix and 2SLS Coefficients with GMM estimates. These estimates are used to compute a coefficient covariance matrix that is robust to cross-section heteroskedasticity and autocorrelation of unknown form. For the HAC option, we specify the kernel type and bandwidth. The Kernel Options determine the functional form of the kernel used to weight the autocovariances in computing the weighting matrix. The overall relationship between the output growth and its explanatory variables are expected to be positive. We use annually data from the CBN bulletins (CBN, 2009), Annual Statistical Bulletin (CBN, 2008) and Nigeria Energy Profile (Energy Commission of Nigeria, 2006)
ESTIMATION OF RESULTS Our estimation technique consists of three steps procedure. First we test for variables stationarity this is in order to ensure stationarity of the data and all the variables are in terms of first differences of logarithms (growth rates) and none at level. Second, a GMM estimate, with a list of instrumental variables is run over the sample period 1979-2008. This is done once the stationarity test was determined. The third part of the estimation provides the co-integrating relations among the variables under consideration (see Table 1-3). The results in the Table 1 showed that there is an existence of unit root. This implies that all the series are non stationary at levels except. Therefore the null hypothesis ( = 1) is
accepted at levels. From the results, the ADF - Choi Z- test statistic (-12.4818) and various probabilities values show that GDPN, ELEC, GASU, PETC, POPU, OIMT, GOVC and GOVK were all integrated at order one, that is I(1). This implies that all the variables were statistically significant at 1%, 5% and 10% critical values at first difference. In other words, they were stationary at first difference. The results for unit root test also show that the model residual is integrated of order of zero I(0). This is in conformity with the postulated theory, which stated that residuals of the estimated model must be significant at level. These are MacKinnon critical values for the rejection of hypothesis of a unit root. Next we look for the possible existence of a cointegrating relationship among the variables.
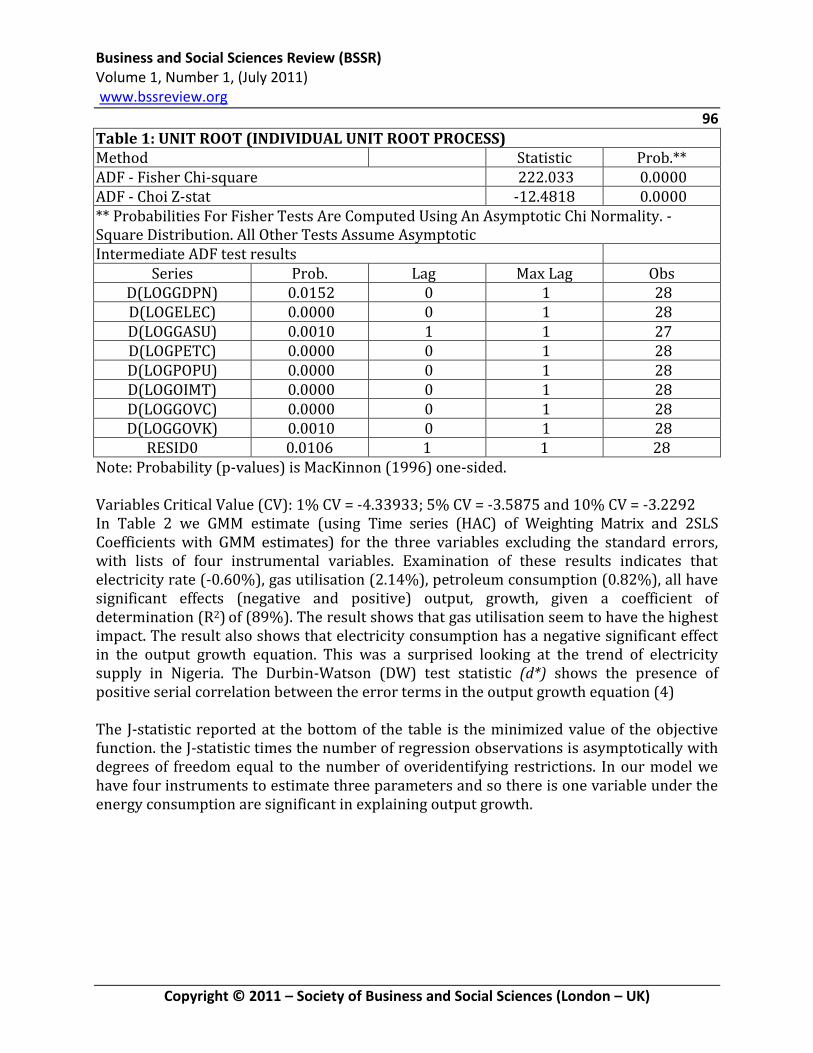
Business and Social Sciences Review (BSSR) Volume 1, Number 1, (July 2011) www.bssreview.org
96
Copyright © 2011 – Society of Business and Social Sciences (London – UK)
Table 1: UNIT ROOT (INDIVIDUAL UNIT ROOT PROCESS) Method Statistic Prob.** ADF - Fisher Chi-square 222.033 0.0000 ADF - Choi Z-stat -12.4818 0.0000 ** Probabilities For Fisher Tests Are Computed Using An Asymptotic Chi Normality. - Square Distribution. All Other Tests Assume Asymptotic Intermediate ADF test results
Series Prob. Lag Max Lag Obs D(LOGGDPN) 0.0152 0 1 28 D(LOGELEC) 0.0000 0 1 28 D(LOGGASU) 0.0010 1 1 27 D(LOGPETC) 0.0000 0 1 28 D(LOGPOPU) 0.0000 0 1 28 D(LOGOIMT) 0.0000 0 1 28 D(LOGGOVC) 0.0000 0 1 28 D(LOGGOVK) 0.0010 0 1 28
RESID0 0.0106 1 1 28 Note: Probability (p-values) is MacKinnon (1996) one-sided. Variables Critical Value (CV): 1% CV = -4.33933; 5% CV = -3.5875 and 10% CV = -3.2292 In Table 2 we GMM estimate (using Time series (HAC) of Weighting Matrix and 2SLS Coefficients with GMM estimates) for the three variables excluding the standard errors, with lists of four instrumental variables. Examination of these results indicates that electricity rate (-0.60%), gas utilisation (2.14%), petroleum consumption (0.82%), all have significant effects (negative and positive) output, growth, given a coefficient of determination (R2) of (89%). The result shows that gas utilisation seem to have the highest impact. The result also shows that electricity consumption has a negative significant effect in the output growth equation. This was a surprised looking at the trend of electricity supply in Nigeria. The Durbin-Watson (DW) test statistic (d*) shows the presence of positive serial correlation between the error terms in the output growth equation (4) The J-statistic reported at the bottom of the table is the minimized value of the objective function. the J-statistic times the number of regression observations is asymptotically with degrees of freedom equal to the number of overidentifying restrictions. In our model we have four instruments to estimate three parameters and so there is one variable under the energy consumption are significant in explaining output growth.
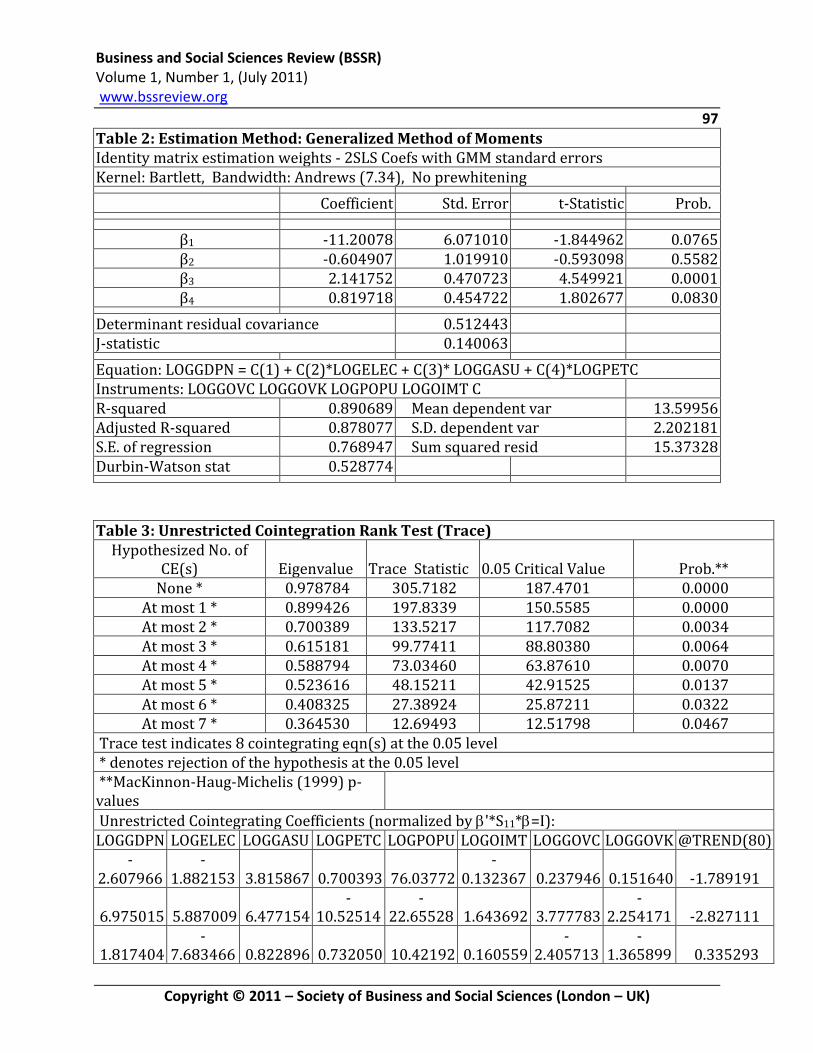
Business and Social Sciences Review (BSSR) Volume 1, Number 1, (July 2011) www.bssreview.org
97
Copyright © 2011 – Society of Business and Social Sciences (London – UK)
Table 2: Estimation Method: Generalized Method of Moments Identity matrix estimation weights - 2SLS Coefs with GMM standard errors Kernel: Bartlett, Bandwidth: Andrews (7.34), No prewhitening
Coefficient Std. Error t-Statistic Prob.
β1 -11.20078 6.071010 -1.844962 0.0765 β2 -0.604907 1.019910 -0.593098 0.5582 β3 2.141752 0.470723 4.549921 0.0001 β4 0.819718 0.454722 1.802677 0.0830
Determinant residual covariance 0.512443 J-statistic 0.140063
Equation: LOGGDPN = C(1) + C(2)*LOGELEC + C(3)* LOGGASU + C(4)*LOGPETC Instruments: LOGGOVC LOGGOVK LOGPOPU LOGOIMT C R-squared 0.890689 Mean dependent var 13.59956 Adjusted R-squared 0.878077 S.D. dependent var 2.202181 S.E. of regression 0.768947 Sum squared resid 15.37328 Durbin-Watson stat 0.528774
Table 3: Unrestricted Cointegration Rank Test (Trace)
Hypothesized No. of CE(s) Eigenvalue Trace Statistic 0.05 Critical Value Prob.**
None * 0.978784 305.7182 187.4701 0.0000 At most 1 * 0.899426 197.8339 150.5585 0.0000 At most 2 * 0.700389 133.5217 117.7082 0.0034 At most 3 * 0.615181 99.77411 88.80380 0.0064 At most 4 * 0.588794 73.03460 63.87610 0.0070 At most 5 * 0.523616 48.15211 42.91525 0.0137 At most 6 * 0.408325 27.38924 25.87211 0.0322 At most 7 * 0.364530 12.69493 12.51798 0.0467
Trace test indicates 8 cointegrating eqn(s) at the 0.05 level * denotes rejection of the hypothesis at the 0.05 level **MacKinnon-Haug-Michelis (1999) p-values
Unrestricted Cointegrating Coefficients (normalized by '*S11*=I): LOGGDPN LOGELEC LOGGASU LOGPETC LOGPOPU LOGOIMT LOGGOVC LOGGOVK @TREND(80)
-2.607966
-1.882153 3.815867 0.700393 76.03772
-0.132367 0.237946 0.151640 -1.789191
6.975015 5.887009 6.477154 -
10.52514 -
22.65528 1.643692 3.777783 -
2.254171 -2.827111
1.817404 -
7.683466 0.822896 0.732050 10.42192 0.160559 -
2.405713 -
1.365899 0.335293
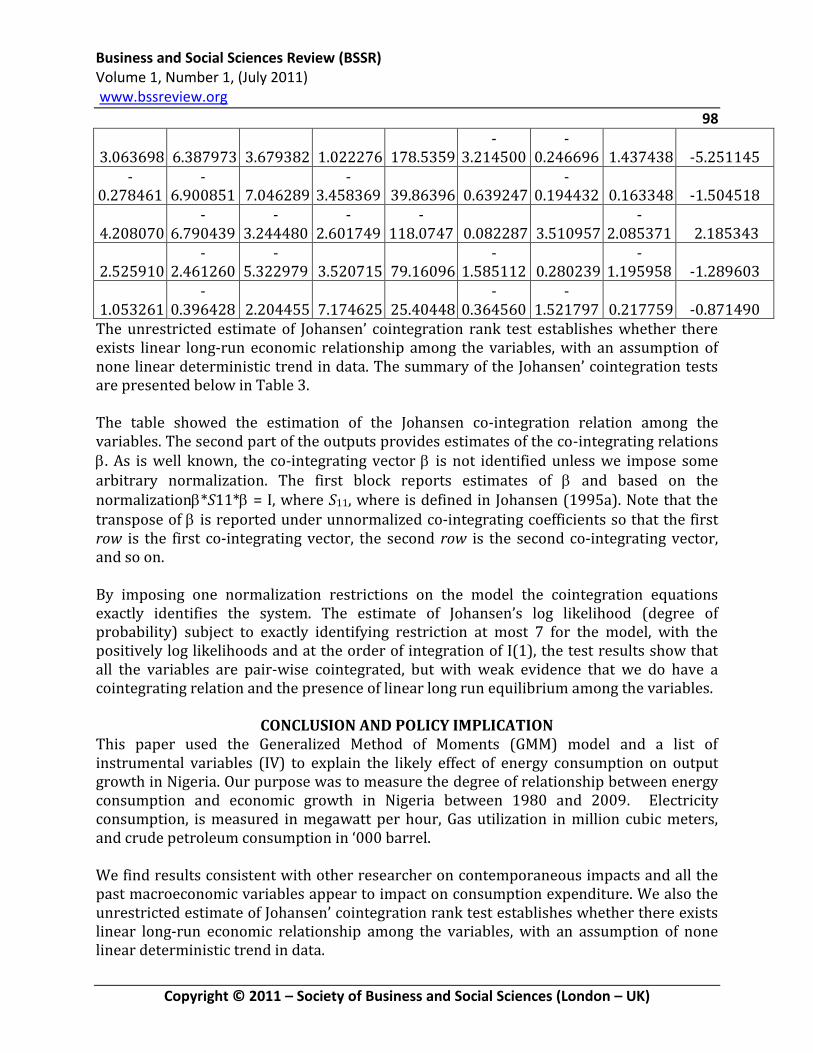
Business and Social Sciences Review (BSSR) Volume 1, Number 1, (July 2011) www.bssreview.org
98
Copyright © 2011 – Society of Business and Social Sciences (London – UK)
3.063698 6.387973 3.679382 1.022276 178.5359 -
3.214500 -
0.246696 1.437438 -5.251145 -
0.278461 -
6.900851 7.046289 -
3.458369 39.86396 0.639247 -
0.194432 0.163348 -1.504518
4.208070 -
6.790439 -
3.244480 -
2.601749 -
118.0747 0.082287 3.510957 -
2.085371 2.185343
2.525910 -
2.461260 -
5.322979 3.520715 79.16096 -
1.585112 0.280239 -
1.195958 -1.289603
1.053261 -
0.396428 2.204455 7.174625 25.40448 -
0.364560 -
1.521797 0.217759 -0.871490 The unrestricted estimate of Johansen’ cointegration rank test establishes whether there exists linear long-run economic relationship among the variables, with an assumption of none linear deterministic trend in data. The summary of the Johansen’ cointegration tests are presented below in Table 3. The table showed the estimation of the Johansen co-integration relation among the variables. The second part of the outputs provides estimates of the co-integrating relations . As is well known, the co-integrating vector is not identified unless we impose some arbitrary normalization. The first block reports estimates of and based on the normalization*S11* = I, where S11, where is defined in Johansen (1995a). Note that the transpose of is reported under unnormalized co-integrating coefficients so that the first row is the first co-integrating vector, the second row is the second co-integrating vector, and so on. By imposing one normalization restrictions on the model the cointegration equations exactly identifies the system. The estimate of Johansen’s log likelihood (degree of probability) subject to exactly identifying restriction at most 7 for the model, with the positively log likelihoods and at the order of integration of I(1), the test results show that all the variables are pair-wise cointegrated, but with weak evidence that we do have a cointegrating relation and the presence of linear long run equilibrium among the variables.
CONCLUSION AND POLICY IMPLICATION This paper used the Generalized Method of Moments (GMM) model and a list of instrumental variables (IV) to explain the likely effect of energy consumption on output growth in Nigeria. Our purpose was to measure the degree of relationship between energy consumption and economic growth in Nigeria between 1980 and 2009. Electricity consumption, is measured in megawatt per hour, Gas utilization in million cubic meters, and crude petroleum consumption in ‘000 barrel. We find results consistent with other researcher on contemporaneous impacts and all the past macroeconomic variables appear to impact on consumption expenditure. We also the unrestricted estimate of Johansen’ cointegration rank test establishes whether there exists linear long-run economic relationship among the variables, with an assumption of none linear deterministic trend in data.

Business and Social Sciences Review (BSSR) Volume 1, Number 1, (July 2011) www.bssreview.org
99
Copyright © 2011 – Society of Business and Social Sciences (London – UK)
The principal findings of this paper is that, electricity consumption appear to be less sensitive to one innovation or shock of unemployment and debt service obligations than inflation. This is because, the magnitude of it coefficients is negative. Gas utilization and crude petroleum consumption appears to have stronger impact on output growth. What we can certainly assert is that electricity consumption cannot be used as an indicator of output growth in Nigeria. As revealed by this paper, variations in electricity consumption have a negative impact on the tempo of economic activity and that it does not bring about economic growth. ‘The implication is that the continuation of the existing state of power supply no doubt continue to have a negative impact on the attempt by the government to diversify the production and export base of the economy away from oil. A situation where firms spend as much as 20% to 30% of initial investment on the acquisition of facilities to enhance electricity supply reliability has a significant negative impact on the cost competitiveness of the manufacturing sector. Furthermore, it has been evidenced over and again that, small—scale operators are mote heavily affected by infrastructure failures. In many instances they are unable to finance the cost of backup necessary to mitigate the negative impact of frequent outages. Hence they have to bear the full burden of electricity failures. Small—scale operators that could afford to back up their operations have to spend a significant proportion of their investment outlay on this. Finally, building on an analysis of the major shortcomings of the current electric power company, this study presents the central issues that should form the key objectives of the proposed reform. This include corporatization of the electric power industry, increasing access and power delivery capacity, constraining the costs of the power industry and increasing efficiency and share of renewable in energy generation, as well as minimizing environmental damage. The US Department of Energy requested a report in 1988 on the relation between economic growth and electricity to design development programs and proper incentives fur the private sector. We believe this is also necessary in Nigeria to attend to the challenges in the near future: the use of more efficient technologies of generation that will also enhance the target of’ sustained economic growth.
REFERENCES Adegoke, O.S. (1991), “Conventional Energy Resources in Nigeria’’, In Adegbulugbe & Seriki Ed Energy Issues in Nigeria, Today and Tomorrow Akmal, M. and D. Stern, (2001), “Residential Energy Demand in Australia: An Application of Dynamic OLS, Working Papers In Ecological Economics, Centre For Resource and Environmental studies, ANU, No. 0104, 1-26. Ayodele, A. ‘Sesan (1998), “Energy Crisis in Nigeria: The Case of Electric Energy Market:’ Bullion, Publication of CBN, Vol. 22 No. 4
Business and Social Sciences Review (BSSR) Volume 1, Number 1, (July 2011) www.bssreview.org
100
Copyright © 2011 – Society of Business and Social Sciences (London – UK)
Ayodete, A. Sesan (2001), “Improving and Sustaining Power (Electricity) Supply for Socioe-Eonomic Development in Nigeria.” Central Bank of Nigeria (2008), Annual Statistical Bulletin, Garki, Abuja Central Bank of Nigeria (2009), Statistical Bulletin, Volume 20, Garki, Abuja Energy Commission of Nigeria (2003), Natiotial Energy Policy. Energy Commission of Nigeria (2006), Renewable Energy Master Plan (Draft) Federal Ministry of Power and Steel (2006), Renewable Electricity Policy Guidelines, December 2006, Abuja Ferguson, R., W. Wilkinson and R. Hill R (2000), “Electricity Use and Economic Development, Energy Policy 28, 923-934. Hanneson, R. (2002), “Energy use and GDP growth, I950—97, OPEC Review, 215— 233 Hickling, R. (2006), “Electricity Consumption In New South Wales: An Application Of’ Cointcgration Techniques To Energy Modelling And Forecasting, Transgrid Economics Information Paper, 1—31. Iwayemi A. (1991), “Deregulation of Public Utilities in Nigeria: An Econometric Analysis” In CEAR Published Analysis of’ Key Public Sector Utilities in Nigeria: U.I. Ibadan, Nigeria Iwayemi, A. (2008), “Investment in Electricity Generation and Transmission In Nigeria: Johansen, S. (1995a), “Likelihood-based Inference in Cointegrated Vector Autoregressive Models,” Oxford University Press Kraft, J. and A. Kraft (1978) “On The Relationship Between Energy and GDP”, Journal of Energy Development 3, 401-403. Mahadevan, R. and J. Asafu—Adjaye (2007), “Energy Consumption, Economic Growth and Prices: A Reassessment using panel VECM for Developed and Developing Countries, Energy Policy, 35, 2481-2490. Narayan, P.K. and R. Smyth (2005), The Residential Demand For Electricity In Australia” An Application of The Bounds Testing Approach To Cointegration. Energy Policy, 33, 467-474.
Business and Social Sciences Review (BSSR) Volume 1, Number 1, (July 2011) www.bssreview.org
101
Copyright © 2011 – Society of Business and Social Sciences (London – UK)
Newey, W. and K. West (1987a)., “Hypothesis Testing With Efficient Method Of Moments Estimation,” International Economic Review, 28, 777–787 Nigerian Electricity Regulatory Commission (2006), Licence and Operating Fees Regulation, NERC, Abuja