Costs and global impacts of black carbon abatement strategies
Upload
independentCategory
view
2download
0
ARTICLE IN PRESS
0301-4215/$ - se
doi:10.1016/j.en
�CorrespondE-mail addr
Please cite thi
Policy (2007),
Energy Policy ] (]]]]) ]]]–]]]
www.elsevier.com/locate/enpol
Energy balance and GHG-abatement cost of cassava utilizationfor fuel ethanol in Thailand
Thu Lan Thi Nguyen, Shabbir H. Gheewala�, Savitri Garivait
The Joint Graduate School of Energy and Environment, King Mongkut’s University of Technology Thonburi, Bangkok, Thailand
Received 29 August 2006; accepted 7 March 2007
Abstract
Since 2001, in order to enhance ethanol’s cost competitiveness with gasoline, the Thai government has approved the exemption of
excise tax imposed on ethanol, controlling the retail price of gasohol (a mixture of ethanol and gasoline at a ratio of 1:9) to be less than
that of octane 95 gasoline, within a range not exceeding 1.5 baht a litre. The policy to promote ethanol for transport is being supported
by its positive effects on energy security and climate change mitigation. An analysis of energy, greenhouse gas (GHG) balances and GHG
abatement cost was done to evaluate fuel ethanol produced from cassava in Thailand. Positive energy balance of 22.4MJ/L and net
avoided GHG emission of 1.6 kgCO2 eq./L found for cassava-based ethanol (CE) proved that it would be a good substitute for gasoline,
effective in fossil energy saving and GHG reduction. With a GHG abatement cost of US$99 per tonne of CO2, CE is rather less cost
effective than the many other climate strategies relevant to Thailand in the short term. Opportunities for improvements are discussed to
make CE a reasonable option for national climate policy.
r 2007 Elsevier Ltd. All rights reserved.
Keywords: Cassava ethanol (CE); GHG abatement cost; Life cycle assessment (LCA)
1. Introduction
The Thai economic recovery after the Asian financialcrisis has brought with it rising concerns about thecountry’s environment. In the same context as othercountries in the region, Thailand’s fossil-based energyconsumption and, consequently, carbon emissions per unitof GDP have been on the rise since 1990. Estimated fromfossil fuel consumption, CO2 emissions from the Thaitransport sector in 1999 accounted for 33% of the totalnational annual CO2 emissions (Earth trends, 2003).
In fact, as a non-Annex I country under the KyotoProtocol, Thailand does not have binding obligations tolimit or reduce GHG emissions. However, concerned withthe event of rising sea level in low-lying coastal regions ofthe country most likely associated with greenhouse effect,the Thai government ratified the agreement in August2002.
e front matter r 2007 Elsevier Ltd. All rights reserved.
pol.2007.03.012
ing author. Tel.: +662 4708309/10; fax: +66 2 8729805.
ess: [email protected] (S.H. Gheewala).
s article as: Nguyen, T.L.T., et al., Energy balance and GHG-a
doi:10.1016/j.enpol.2007.03.012
Since the basic goal of climate policy is to reduce CO2
emissions from the extensive use of fossil-based energy,there exists a close link between climate policy and energypolicy. As for Thailand, the Asia Least-cost Greenhouse
Gas Abatement Strategy study conducted by Asian Devel-opment Bank (ADB) has identified the mitigation optionsin the energy sectors that contribute significantly to GHGreduction. These mitigation options are categorized intothree items, improving efficiency of energy-related pro-cesses, adopting more energy-efficient techniques andsubstituting renewable energy for fossil-based energyresources (ADB, 1998). In the short term, the followingoptions were found to provide not only mitigationpotential but also economic benefits, indicated by theirnegative GHG abatement costs, ranging from US$8.3 toUS$323.1/tonne CO2 eq.: (1) cogeneration, increase in oil-fired boiler efficiency, and application of efficient motors inindustrial sector; (2) refrigerator program in residentialsector; (3) lighting and air conditioner efficiency programin residential and commercial sectors, and (4) increase infuel economy of automobiles. Utilizing or switching to
batement cost of cassava utilization for fuel ethanol in Thailand, Energy

ARTICLE IN PRESST.L.T. Nguyen et al. / Energy Policy ] (]]]]) ]]]–]]]2
cleaner fuels, i.e., from coal to natural gas, from naturalgas to nuclear, and more electricity generation fromnuclear is also attractive at positive abatement costs ofUS$1.2 to US$69.6/tonne CO2 eq. As a whole, there are 13options making a list of cost-effective GHG mitigationoptions for Thailand, starting from US$323.1/t CO2 at thetop to US$69.6/t CO2 at the bottom. Though renewableenergy resources did not appear in the list, their highpotentials in reducing CO2 emissions were highlighted. InThailand, several renewable energy projects that are strongCDM (Clean Development Mechanism) candidates aregoing on. The strongest are clean Independent PowerProducer (IPP) projects which are designed to use biomassto produce electricity (Todoc, 2004).
Apart from the direct combustion of biomass for energyproduction, extensive studies have been carried out inrecent years to investigate the potential to convert biomassto liquid fuels, substituting for gasoline and diesel intransportation. One of the most important biomass-derived liquid fuels is ethanol. The first trials to useethanol for fuel in Thailand actually commenced in theearly 1977s, but its high cost over that of gasoline haltedcommercial production. However, at present, given thecontinually increasing oil prices and increasing publicconcern about climate change due to vast amount of CO2
emitted from various transport facilities, ethanol is beingreconsidered as a potential alternative to gasoline.
In Thailand, three types of raw materials regarded ashaving high potential for ethanol production are sugarcane, cane molasses and cassava. However, the mostsuitable one is cassava (Sriroth et al., 2003). The majoradvantages of cassava over molasses and sugar cane can belisted as follows:
(1)
Ple
Po
Cassava is well known as a hardy crop having theability to adapt well to a wide range of growingconditions with minimal inputs. In Thailand, cassavaranks the third most important cash crop after rice andsugar cane. Various institutions/research centers haveconducted cassava improvement research and made theresearch results relevant to farmers’ real conditions,ensuring adaptation as well as adoption by farmers.Due to the introduction of high-yield varieties andimproved production practices, an increase in nationalcassava yield from 13 t/ha in 1995 to 20 t/ha in 2004 wasrecorded (OAE, 2004).
(2)
Unlike sugar-based distilleries that are operated sea-sonally, cassava-based ethanol industry can be put inoperation continuously, thanks to the crop’s unboundtime window for growing and harvesting, plus itscapability to be stored as dried chips.(3)
The inadequate Thai cane productivity (60Mt/yr)compared to sugar mill capacity (75Mt/yr) impliesthat very limited surplus stock of sugar cane is availablefor ethanol production (DEDE, 2004c). The complica-tion of sugar cane and sugar legislation on profitsharing between farmers and millers adds one morease cite this article as: Nguyen, T.L.T., et al., Energy balance and GHG-abate
licy (2007), doi:10.1016/j.enpol.2007.03.012
disadvantage of sugar cane utilization for ethanolproduction. With molasses, high demands in bothdomestic and international market have resulted insupply shortage and, consequently, strong fluctuationin price. In contrast, there is frequently an oversupplyof cassava leading to falling prices and incomes forfarmers. The ethanol industry once developed wouldprovide a partial solution to the problem. Regardingsupply potentials, of the total 20Mt of the annualproduction of cassava in Thailand, approximately 40%is absorbed by starch industry and another 40% isprocessed to chips and pellets, mainly for export. Thesurplus 20% is utilized mainly for low-end applicationssuch as domestic animal feed (CSTRU, 2004). It isreasonable to convert this surplus to 2million litres(ML) of ethanol per day, ensuring a stable source offeedstock and a neutral impact on starch and chip/pellet industries.
(4)
Technical development in ethanol conversion fromgrains available elsewhere in the world can be readilyapplied to cassava. This would help to boost inputenergy efficiency and reduce production cost.According to the government plan, by 2007 and 2008,the number of cassava-based ethanol (CE) plants inThailand would amount to 12 with the total output ofabout 3.4ML per day (Sukphisal, 2005). The strategic planfor cassava needs to be revised and reformulated to meetadditional demand for ethanol fuel. A decrease in theexport of cassava products is mostly a short-term solution.Long-term strategy set up by national cassava policy isimproved crop productivity from an unchanged plantedarea of 1.06 million hectares. It can be achieved by thedissemination of good stake of new varieties and bettercultivation/harvest practice. From a current yield of about19 t/ha, by 2007, the root yield is projected to reach 31 t/hafor a promoted area of about 192,000 ha and 21 t/ha for therest. The promotion of contract farming is anothermeasure to support ethanol project (Sriroth et al., 2006).Whilst studies carried out in a diverse group of countries
around the world, e.g., Brazil, the US, Canada, show thatethanol produced from sugar cane and corn can helpreduce oil import and GHG emissions (Macedo et al.,2004; Wang et al., 1997; Levelton, 2000), there remains anuncertainty whether ethanol from cassava could providethe same benefits in Thailand. A satisfying conclusioncannot be reached unless an analysis of energy and GHGimpacts of the use of CE as a substitute for conventionalgasoline (CG) in the country is conducted.To assess the contribution of CE to energy security and
climate change mitigation, it is necessary to determine itsenergy balance (EnB), GHG balance and cost effectivenessin terms of GHG reduction. EnB compares the energyinputs in the production of CG that are avoided whenethanol is used instead of CG to the total fossil energyinputs in the production of ethanol. A positive EnB can betranslated into net fossil energy savings whereas a negative
ment cost of cassava utilization for fuel ethanol in Thailand, Energy

ARTICLE IN PRESS
Cassava chip processing
Cassava
Cassava chips
Agrochemical manufacturing
Cassava farming
Ethanol conversion
Crude oil extraction
Crude oil refining
Fertilizers Herbicides
Blending
Diesel
Ethanol
Gasoline
Distribution Gasohol
Fig. 1. Life cycle scheme for the studied system.
T.L.T. Nguyen et al. / Energy Policy ] (]]]]) ]]]–]]] 3
value reflects an overall energy drain. GHG balancecomputes net avoided GHG emissions when CG isdisplaced by ethanol. The cost effectiveness of a biofuelfor reducing GHG emissions is defined as the excess cost ofthe biofuel over that of the conventional fuel it replaces,divided by the GHG reduction that is achieved with thereplacement. Since ethanol is not the only measure forreducing GHG emissions, this cost should be comparedwith that of other alternative climate change mitigationstrategies to see whether it is an economically viable optionfor climate policy.
Thailand has embarked on an ambitious program topromote the use of ethanol (in the form of gasohol) as atransportation fuel. Government’s ethanol policies includeexcise tax exemption for the fuel and income tax waiver forinterested investors. However, a shortage of ethanol supplycurrently has resulted in unpredicted high prices. Ever sincegasohol was announced to replace 95 octane gasoline(ULG 95) by 2007, the price of molasses-based ethanol hasrisen drastically, from Bt19 in January 2006 to Bt25.3 inJune 2006 (Thongrung, 2006). Looking for a cheaper andpossibly more stable source of such a gasoline substitute,Thai oil companies expect they can get ethanol producedfrom cassava at a lower cost of about Bt22 a litre(Thongrung, 2006). In comparison, the average ex-refineryprice of ULG 95 posted at www.eppo.go.th/info/T12.htmlin the first seven months of 2006 is Bt18.98 a litre. Thus, inthe short term, it seems that CE still cannot compete withCG without government subsidies. The subsidies would,however, be advocated with some economic rationales, ofwhich reasonable GHG-abatement costs of ethanol hasbeen widely addressed. Practically, to be a reasonablesubstitute for CG, ethanol must meet two criteria. First,the production and use of ethanol should result in apositive EnB and, consequently, a not reduction in GHGemissions. Second, if substituting ethanol for CG doesprovide GHG emission reduction, the cost of suchreduction should be preferably not exceeding the range ofcost-effective GHG mitigation options for Thailand (ADB,1998), i.e., not more than US$69.6/t CO2 equivalent.
2. Methodology
2.1. Goal and scope definition
The goals of this paper are (1) to estimate energy andGHG balances of CE in Thailand, based on an LCAapproach, and (2) to evaluate whether a substitution of CGby CE in Thailand would be a good GHG reductionstrategy from an economic perspective.
2.2. Cassava ethanol life cycle: system boundary and data
sources
An assessment of life cycle energy and GHG emissionimplications of CE produced in Thailand, in comparisonwith CG, was conducted. As shown in Fig. 1, this cycle
Please cite this article as: Nguyen, T.L.T., et al., Energy balance and GHG-a
Policy (2007), doi:10.1016/j.enpol.2007.03.012
includes feedstock recovery, transport to the conversion site,conversion to fuel, transport to refueling stations and finalcombustion in vehicles. The major segments included withinthe system boundary are cassava farming/processing, ethanolconversion, transportation, and ethanol combustion.
a.
bate
Cassava farming/processing: This segment represents allactivities related to the production of ethanol’s rawmaterials, i.e., in this case, cassava chips. It starts withcassava farming and ends with chip processing.� Cassava farming: Steps involved at this stage include
land preparation, planting, crop maintenance (ferti-lization, weed control), and harvesting. Backgroundinformation on this sub-segment was obtained fromample sources of the country’s cassava research(Howeler, 2000; Sriroth et al., 2000; Tongglum etal., 2000; Hershey and Howeler, 2000). Detailedinformation on fuel, labor and material inputs wasreviewed from available references and verified basedon on-site data collection.� Chip processing: After harvest, roots are transported
to drying floors which are equipped with simplefacilities. Though roots are dried naturally by sun-light, some fuel is consumed for tractor loading rootsinto chopping machine, for chopping machine itselfand for tractor turning over chips during dryingperiod. Also human labor is consumed for chippacking once drying process is completed. Relevantdata on fuel consumption and human labor intensitywere collected through personal interview with themanager of a typical cassava-drying floor in Thailand(Witriyatornpan, 2006).
me
b.
Ethanol conversion: About 20–30 years ago, the produc-tion of ethanol from cassava on an industrial scale inThailand seemed impractical but now, thanks toadvanced techniques in biochemical and chemicalengineering, the potential is bright. To demonstratethe feasibility of feedstock conversion to ethanol on acommercial scale, a research team in Cassava and StarchTechnology Research Unit (CSTRU), Bangkok, Thai-land has conducted research on pilot-scale productionof ethanol from cassava. The detailed energy use ratesfor pilot plant were recorded by the research team. Theteam also made an estimate for commercial productionof 100,000L ethanol a day. The information obtainedfrom the team’s research report (Ronjnaridpiched et al.,2003) was used in the study.nt cost of cassava utilization for fuel ethanol in Thailand, Energy

ARTICLE IN PRESST.L.T. Nguyen et al. / Energy Policy ] (]]]]) ]]]–]]]4
P
P
The process of making ethanol from cassava, a starch-based feedstock, consists of three main sub-processes:milling and liquefaction, fermentation, and distillation.After distillation, the non-fermentable solids remainingin distilled mash, termed stillage, are digested to producebiogas. This biogas supports energy in the form of steamused in CE conversion process, substituting a portion ofbunker oil, which is the major energy supply for theprocess. Electricity obtained from the grid is anotherform of energy supply. In fact, there are potentials ofutilization of various by-products associated withethanol production, e.g., CO2, fodder yeast, anddistillers dried grains with solubles. However, since theCE conversion stage examined was at the pilot scale,and sufficient markets for such products in Thailandhave not yet been developed, this study counted theseby-products as valueless by allocating all energy inputsand emissions to the CE fuel product itself.
c.
Transportation: All materials and products involved inthe system are hauled by different transport facilitiesthrough different distances. Data were collected in oneof two ways: (1) information exchange via personalinterviews, and (2) educated assumptions/estimations.d.
Ethanol combustion: Data related to gasohol E10 wereobtained from Tantithumpoosit (2004).3. Cassava-based ethanol case study
Of the 12 CE plants approved for construction by theThai government, three are to be located in the EasternRegion of the country with a total daily capacity of 1.6ML.There are at least three reasons why the region is set up tocontribute nearly 50% of the national CE productiontarget. First, it is the country’s second-largest cassavaproducer after the Northeast (OAE, 2004). Followingethanol conversion in the fuel production process isblending ethanol with CG to make gasohol; in Thailand,this is carried out in oil refineries. There are six oil refinerieslocated in the region; fuel saving in transportation ofethanol to oil refineries is the second reason of site selection.Last but not least, good transportation infrastructure pluspublic utilities due to the presence of major industrialestates here are important criteria supporting the approvalof a commercial ethanol industry.
3.1. Direct energy and material inputs
Direct energy and material inputs in the CE fuel systeminclude diesel, bunker oil, chemicals (herbicide, fertilizers),labor work and solar energy.
�
Diesel: Diesel fuel is used for land preparation, cropmaintenance, harvesting and chip processing. It is alsothe sole fuel used for transportation. � Bunker oil: An inexpensive and fairly available source ofenergy, bunker oil is burnt in boilers to generate steamutilized for ethanol conversion process.
lease cite this article as: Nguyen, T.L.T., et al., Energy balance and GHG-a
olicy (2007), doi:10.1016/j.enpol.2007.03.012
�
bat
Fertilizers: Commercial NPK fertilizers and chickenmanure are the two types of materials cassava farmersuse to enrich soil nutrients. In fact, chicken manurehelps to improve the soil’s physical condition ratherthan to supply nutrient elements. As documented inreference (Howeler, 2000), animal manures containquite low and variable amounts of N, P, K, comparedto commercial fertilizers. High application rates neces-sary to compensate for manures’ low macronutrientcontents have limited their use in those areas where localsupplies are not available.
� Herbicide: Herbicide application to control weeds incassava cultivation is considered simpler than any othermethod, e.g., hand weeding or mechanical control.Common herbicides used by Thai cassava farmers tosuppress weeds are paraquat and glyphosate.
� Labor work: Human labor is used in almost every step incassava farming and processing, e.g., planting, weeding,fertilizer and herbicide application, harvesting andloading, and chip packing.
� Solar energy: This energy is absorbed by cassava plantsthrough photosynthesis process and fresh cassava chipsduring drying process. However, considered free, it wasnot taken into account in the analysis.
3.2. Energy balance
3.2.1. Primary energy consumption estimation
To assess energy balance of ethanol, it is of importancefor primary energy values to be accounted for in thecalculation. By definition, primary energy is an aggregationof fuel energy content plus the energy embodied in theprocess of fuel extraction, refining, production anddelivery.
(a)
em
For diesel and bunker oil used in the CE fuel system,fuel energy content values were obtained from the LCIstudy of oil refineries in Thailand (TEI, 2001). Inputefficiency coefficients of fossil energy sources, derivedfrom Institute of Food and Agricultural Sciences,University of Florida (IFAS, 1991), were then used toestimate fuel primary energy values.
(b)
For electricity used in ethanol conversion, the factor of10 was used to convert one kWh electrical energyconsumption to MJ thermal energy consumptionequivalent. The conversion took into account the Thaiaverage MJ losses during electricity generation ofabout 64%, estimated based on available reference(DEDE, 2004a) documenting the relative share of fuelsources for electricity generation in Thailand. Theinformation contained in the reference was also usefulin estimating the contributions of non-renewable andrenewable energy sources to this energy input.(c)
In Thailand, a large portion of chemical fertilizers isimported from abroad. Data on energy use and fuelshares for NPK fertilizer and herbicide manufacturing,packaging, marketing and distribution were adaptedent cost of cassava utilization for fuel ethanol in Thailand, Energy

ARTICLE IN PRESST.L.T. Nguyen et al. / Energy Policy ] (]]]]) ]]]–]]] 5
Ple
Po
from well-known models and databases (Wang, 2006;Helsel, 1992).
(d)
Evaluating the energy equivalent of agricultural laborwhich was further included as an energy input incassava farming energy analysis was based on the Life-Style Support Energy (LSSE) method recommended byOdum (Odum,1983). According to Odum, humanlabor’s energy content can be estimated by multiplyingits cost by the average energy to monetary unit ratio orenergy intensity of the economy. Using available dataon (1) total primary energy supply (DEDE, 2004b), (2)GNP of the Thai economy (National Economic andSocial Development Board (NESDB), 2005) and (3) theminimum wage in Thailand (FAS-USDA, 2005), theenergy value of agricultural labor in Thailand wasderived as 12.1MJ/h. The value is compatible withFluck’s (1992) estimate of about 100MJ/day or12.5MJ/h (assuming 8 h per working day) for semi-industrialized economies, adjusted from 594MJ/dayfor agricultural labor in the US. A developing country,Thailand has been in a transition period, moving froma traditional agricultural-based economy into a semi-industrialized economy (JICA, 2003). Another refer-ence value is 13MJ/h, which was derived by Freedman(1982) for rice production in the developing world.The energy input in this category was then segregatedinto fossil and non-fossil energy items, based on Thailand’sprimary energy consumption by fuel sources. Data wereobtained from International Energy Agency energy statis-tics (IEA, 2005).
3.2.2. Energy balance (EnB)
One of the most important instruments to assessethanol’s fuel value is the ‘‘net energy balance’’. Con-ventionally, it is a comparison between the heat content ofethanol and the total fossil energy inputs in the fuelproduction cycle (Levelton, 2000; Shapouri et al., 2004;Macedo et al., 2004; Dai et al., 2006). The key implicationaddressed is whether ethanol production and use results ina gain loss of energy. However, it cannot answer thequestion whether a substitution of ethanol for gasoline intransportation can contribute to fossil energy savings. Toevaluate this potential, a better instrument is a comparativeenergy balance (EnB) as defined by Henke et al. (2005). Ina comparative EnB analysis, first, a substitution ratiobetween ethanol and CG needs to be identified. Based onthis ratio, the next step is to compare the amount of fossilenergy inputs in the ethanol production cycle with the fossilenergy used to manufacture CG (including feedstock)which is avoided if ethanol is used to substitute for CG. Inestimating the energy balance of bio-ethanol produced inGermany, Henke et al. (2005) derived the substitution ratiobetween ethanol and CG as 0.65 which is the ratio of thetwo fuels’ energy content.
Although ethanol has fewer megajoules per litre thanCG, its higher octane value allows higher compression
ase cite this article as: Nguyen, T.L.T., et al., Energy balance and GHG-a
licy (2007), doi:10.1016/j.enpol.2007.03.012
ratios and more efficient thermodynamic operation ininternal combustion engines. In other words, the heatingvalue of ethanol is not a straightforward indicator of itsperformance in a motor vehicle. PTT Research andTechnology Institute, Thailand has conducted tests forvarious car models running on CG (ULG95) and gasoholE10 (Toyota 1.3 L/1993, Toyota 1.5 L/1996, Toyota 1.6 L/2000, Nissan 2.0 L/1994, Mitsubishi 1.5 L/1994, Volvo2.3 L/1995, Honda 1.6 L/1996). The fuel economy testresults show a difference between ULG95 and gasohol inthe range of �1.1% for Toyota 1.6 L/2000 to +1.7% forToyota 1.3 L/1993 (Tantithumpoosit, 2004). For a con-servative estimate assigned to ethanol, this study selectedthe test results based on Toyota 1.6 L/2000, the newest carmodel in the test group. The average fuel economy of thiscar model running on CG and gasohol is 13.46 km per litreand 13.31 km per litre, respectively. Fuel economy com-parison reveals that 1 L of gasohol is equal to 0.989L ofCG. The difference of 0.011L is due to 10% of ethanol inCG. The substitution ratio between ethanol (in E10 form)and CG in a motor vehicle engine was thus derived by thisstudy as 1:0.89 based on fuel economy, instead of 1:0.65based on energy content.The energy expended once CG is consumed includes the
energy consumed in the production process and the energycontained in crude oil feedstock. The first CG energycomponent as per definition above was obtained bysubtracting the energy content of CG (31.5MJ/L) fromits primary energy value estimated by the proceduredescribed in Section 3.2.1a (38.5MJ/L). Given a basicmass balance performed for oil refining in Thailand (TEI,2001), the energy contained in crude oil that is transformedto energy content of CG was estimated as 31.7MJ/L. Theresulting fossil energy sequestered in CG, 38.7MJ/L,multiplied by the substitution ratio between ethanol andCG, 0.89, yields the reference value of 34.4MJ/L. Thisfigure was used to compare with the amount of fossilenergy inputs in the CE production cycle.
3.3. GHG balance
3.3.1. GHG emissions due to the use of fossil fuels (direct
and indirect)
(a)
batem
For diesel and bunker oil used in the CE system, bothdirect GHG emissions, i.e., emissions from fuel combus-tion, and indirect emissions, i.e., emissions from oilextraction, transportation to oil refinery, refining andtransportation to gas station, were taken into account inthe analysis. Emission data for petroleum-based fuelcycles were obtained from GREET 1.7 (Wang, 2006).
(b)
For electricity used in ethanol conversion segment,GHG emissions were estimated using LCI data forThailand’s electricity grid mix (Lohsomboon andJirajariyavech, 2003).(c)
Commercial fertilizers and herbicides used in cassavacrop maintenance are important sources of GHGent cost of cassava utilization for fuel ethanol in Thailand, Energy

ARTICLE IN PRESST.L.T. Nguyen et al. / Energy Policy ] (]]]]) ]]]–]]]6
Ple
Po
emissions via fossil fuel consumption in their manu-facturing. To estimate GHG emissions in this category,emission factors (EFs) for their production were takenfrom GREET 1.7 (Wang, 2006).
(d)
Assessing human labor based on ‘‘LSSE’’ method leadsto a GHG balance analysis considering emissionsassociated with fossil fuel consumed to support laborenergy. This category emissions were estimated bymultiplying the value of fossil energy consumed tosupport human labor (described in Section 3.2.1d) bythe ratio of total national GHG emissions (ONEP-MONRE, 2005) to total national fossil energy con-sumption (DEDE, 2004b).3.3.2. Other GHG emissions
This category includes (a) N2O soil emissions from N-fertilizers applied in cassava farming, (b) CH4 and N2Oemissions from biogas burning, and (c) CH4 and N2Oemissions from ethanol combustion in vehicles.
(a)
N2O soil emissions depend on a number of factors: (1)environmental factors, e.g., climate, soil organic Ccontent, soil texture, drainage, soil pH and types ofreceiving water body; (2) management-related factors,e.g., N application rate per fertilizer type, types of crop,and (3) factors related to the measurements, e.g., lengthof measurement period, frequency of measurements(Bouwman et al., 2002). Based on results of numerousstudies investigating fertilizer-induced N2O emissionsfrom cornfields, Wang (1999) derived an emission rateof 1.5% (in weight N/N).(b)
CO2 emissions from biogas combustion are net zero.CH4 and N2O emissions were estimated using EFsfrom the National Environmental Research Institute,Denmark (DMU-NERI, 2006).(c)
Also, bio-based CO2 emissions from ethanol combustionare net zero. For CH4 and N2O, emission informationwas obtained from GREET 1.7 (Wang, 2006).Table 1
Energy balance of cassava-based fuel ethanol
Items Fossil energy inputs
(MJ/L ethanol)
Non-fossil energy
inputs (MJ/L ethanol)
Feedstock production 3.91 0.32
Fertilizers,
herbicide
1.68 0.08
Diesel fuel 1.09 0
Labor 1.14 0.24
Ethanol conversion 6.69 0.01
Thermal energy
(steam)
6.36 3.45
Electricity 0.33 0.01
Biogas
cogeneration
�3.45
Transport (diesel
fuel)
1.46 0
Total 12.06 0.33
EnB 34.4�12.06 ¼ 22.38
3.3.3. Avoided emissions
GHG emissions are avoided by the use of ethanol as agasoline substitute in transportation. To calculate grossavoided emissions when ethanol substitutes for CG at a ratioof 0.89 (see Section 3.2.2), fuel-cycle CO2 emissions from CGcars were estimated from GREET 1.7 (Wang, 2006).According to the model, there is no difference in CH4 andN2O emissions between cars fueled with gasohol E10 and thosewith CG. As a result, only CH4 and N2O emissions fromfeedstock production and fuel conversion stages were con-sidered in avoided emissions accounting. Net avoided emis-sions were then identified by subtracting total CE life cycleGHG emissions from the resulting gross avoided emissions.
3.4. GHG abatement costs
Ethanol ex-distillery price or gate price representsproduction cost plus distillery profit margin. Before being
ase cite this article as: Nguyen, T.L.T., et al., Energy balance and GHG-a
licy (2007), doi:10.1016/j.enpol.2007.03.012
distributed to gas stations, ethanol is transported to oilrefineries for blending with CG. At gas stations, the retailprice of ethanol in the form of gasohol is formulated as:retail price ¼ ex-refinery price+oil fund+taxes+market-ing margin+VAT (EPPO, 2006), in which ex-refinery priceis a sum of gate price and transportation/distribution cost.As mentioned earlier, to encourage consumers to usegasohol, the Thai government provides fuel subsidies andtax incentives that make gasohol 1.5 baht-a-litre cheaperthan ULG 95. A fair comparison between ethanol andCG should be based on their ex-refinery prices ratherthan retail prices. To derive the price per gasoline-equivalent litre, ethanol ex-refinery price per litre is dividedby 0.89 which is the substitution ratio of the performancebetween ethanol (in the form of E10) and CG in anexplosion motor.
4. Results
4.1. Energy balance
Table 1 shows that the production of 1 L of CEsubstituting for 0.89 litre of CG would result in energysavings of 22.38MJ which corresponds to about 0.58 L ofCG. The estimate shows that, with a daily productioncapacity of 3.4ML of CE substituting for CG intransportation, Thailand could save totally about 720MLof CG per year. Looking further at energy consumption bysegments, one can see that among all segments involved inthe CE system, the ethanol conversion is the most energy-consuming one, dominating at 55.5% of the total fossilenergy inputs. Following are the cassava cultivation/processing and transportation contributing 32.4% and12.1%, respectively (Fig. 2). Human labor energy accountsfor almost 29% of fossil energy requirement in feedstock
batement cost of cassava utilization for fuel ethanol in Thailand, Energy

ARTICLE IN PRESS
transportation12.11%
cassava farming32.42%
ethanolconversion , 55.47%
energy savings,
22.38 MJ/L
Fossil energy inputs, 12.06 MJ/L
reference value: 34.44 MJ/L
Fig. 2. Net energy balance and fossil energy inputs by segments.
Table 2
Segregation of fossil fuel inputs in cassava ethanol system
Fossil fuels Amount (MJ/L ethanol) %
Coal 0.35 2.88
Natural gas 1.65 13.69
Diesel 2.91 24.12
Fuel Oil 7.15 59.31
Total 12.06 100
Table 3
Energy performance comparison between ethanol from cassava in
Thailand and ethanol from other feedstocks
Feedstock/
country
Net fossil
inputsa
(MJ/L)
SREtOH�CG Ref. value
(MJ/L)
EnB
(MJ/L)
Sugar beet
and wheat in
Germany
14–35 0.65b 23.3 �11.7–9.3
Cassava in
China
13.30 0.71c 28.44 15.14
Corn in the
US
12.76 1.00d 40.2 27.44
Cassava in
Thailand
12.06 0.89 34.44 22.38
Herbaceous
biomass in
the US
2.01 1.00d 40.2 38.2
Sugar cane in
Brazil
0.96 1.00e 42.3 41.34
aNet fossil inputs ¼ gross fossil inputs�co-product energy credits.bBased on fuel energy content (Henke et al., 2005).cBased on fuel economy Feg (L/100 km): Feg CG car ¼ 7.0 (Hu et al.,
2004b), Feg E10 car ¼ 6.8 (Lamb, 2006).dBased on GREET’s assumption (Wang, 2006): no difference in fuel
economy between CG and E10.e1L of anhydrous ethanol (E-25 engine) produces the same performance
as 1L of CG (Macedo et al., 2004)
T.L.T. Nguyen et al. / Energy Policy ] (]]]]) ]]]–]]] 7
production. However, its contribution to the whole systemis relatively small, only 9.5% of the total fossil energyinputs.
As far as depletion rates of fossil energy resources are ofconcern, fossil energy inputs in CE system were segregatedby fuel types, e.g., coal, natural gas, diesel and fuel oil. Asshown in Table 2, 83.4% of fossil-based energy consumedin CE system is derived from fuel oil and diesel. It shows
Please cite this article as: Nguyen, T.L.T., et al., Energy balance and GHG-a
Policy (2007), doi:10.1016/j.enpol.2007.03.012
that in this case study, CE still needs to rely on a largeportion of oil-derived liquid fuels, the reserves of which arerapidly being used up whereas for natural gas or coal, theoutlook seems brighter.As mentioned by Henke et al. (2005), the substitution
ratio between ethanol and gasoline (SREtOH�CG) derivedby studies on ethanol’s performance varies in the range0.65–1.00. It leads to difficulty in an EnB comparisonbetween CE in Thailand and ethanol from other feedstocksin other countries, though simple calculations can be doneto get approximate values. For comparison purposes, acloser look at the intensity of net fossil energy inputs forthe production of 1L of ethanol from different feedstockswould be more relevant. All information in this regard ispresented in Table 3. Feedstocks selected to be comparedwith cassava in Thailand (this study) for ethanol produc-tion are cassava in China (Dai et al., 2006), corn in the US(Shapouri et al., 2004), wheat and sugar beet in Germany(Henke et al., 2005), herbaceous biomass in the US (Wang,2006), and sugar cane in Brazil (Macedo et al., 2004).As a whole, the result is most favorable for sugar cane as
a feedstock for ethanol production in Brazil, followed byherbaceous biomass in the US. Energy balances for wheatand sugar beet in Germany were found to be negative insome cases. The production of CE in Thailand consumesabout 10% and 5.5% less fossil energy than the productionof CE in China and corn ethanol in the US, respectively. Itis worth noticing that though the EnB estimate in thisstudy was based on large-scale plant projections from pilot-scale ethanol plant, the results obtained are quite compar-able with those of commercial-scale ethanol plants. Thisserves as an indirect confirmation of the validity of theprojections of this study to large-scale production plant.
4.2. GHG balance and GHG abatement cost
4.2.1. GHG balance
As indicated by the results shown in Table 4, CE systemin Thailand can provide reduction in GHG emissionscompared to CG as a base case; the production and use ofone litre of CE can avoid 1.6 kg CO2 eq. which correspondsto a 62.9% GHG reduction. Taking into account theproduction target of 3.4ML of CE per day, a roughestimation can be made that the use of this biofuel would
batement cost of cassava utilization for fuel ethanol in Thailand, Energy
ARTICLE IN PRESST.L.T. Nguyen et al. / Energy Policy ] (]]]]) ]]]–]]]8
reduce GHG emissions by 2 million tonnes CO2 eq./year or0.5 million tonnes carbon eq./year.
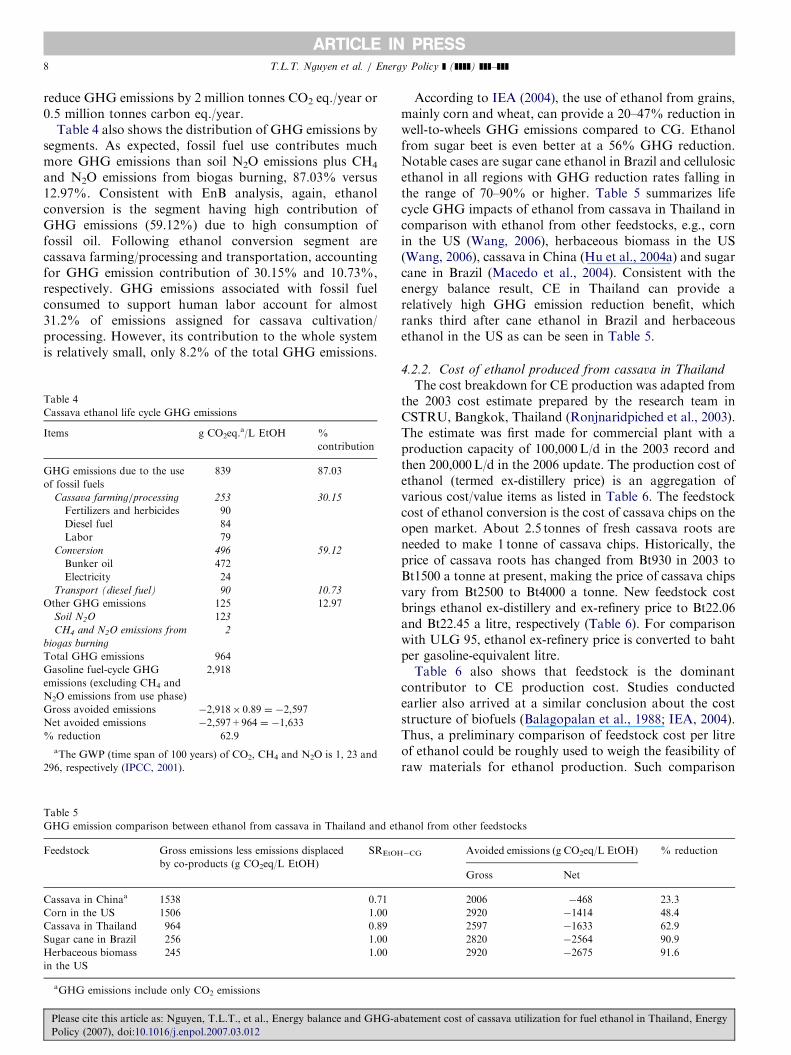
Table 4 also shows the distribution of GHG emissions bysegments. As expected, fossil fuel use contributes muchmore GHG emissions than soil N2O emissions plus CH4
and N2O emissions from biogas burning, 87.03% versus12.97%. Consistent with EnB analysis, again, ethanolconversion is the segment having high contribution ofGHG emissions (59.12%) due to high consumption offossil oil. Following ethanol conversion segment arecassava farming/processing and transportation, accountingfor GHG emission contribution of 30.15% and 10.73%,respectively. GHG emissions associated with fossil fuelconsumed to support human labor account for almost31.2% of emissions assigned for cassava cultivation/processing. However, its contribution to the whole systemis relatively small, only 8.2% of the total GHG emissions.
Table 5
GHG emission comparison between ethanol from cassava in Thailand and et
Feedstock Gross emissions less emissions displaced
by co-products (g CO2eq/L EtOH)
SREtOH
Cassava in Chinaa 1538 0.71
Corn in the US 1506 1.00
Cassava in Thailand 964 0.89
Sugar cane in Brazil 256 1.00
Herbaceous biomass
in the US
245 1.00
aGHG emissions include only CO2 emissions
Table 4
Cassava ethanol life cycle GHG emissions
Items g CO2eq.a/L EtOH %
contribution
GHG emissions due to the use
of fossil fuels
839 87.03
Cassava farming/processing 253 30.15
Fertilizers and herbicides 90
Diesel fuel 84
Labor 79
Conversion 496 59.12
Bunker oil 472
Electricity 24
Transport (diesel fuel) 90 10.73
Other GHG emissions 125 12.97
Soil N2O 123
CH4 and N2O emissions from
biogas burning
2
Total GHG emissions 964
Gasoline fuel-cycle GHG
emissions (excluding CH4 and
N2O emissions from use phase)
2,918
Gross avoided emissions �2,918� 0.89 ¼ �2,597
Net avoided emissions �2,597+964 ¼ �1,633
% reduction 62.9
aThe GWP (time span of 100 years) of CO2, CH4 and N2O is 1, 23 and
296, respectively (IPCC, 2001).
Please cite this article as: Nguyen, T.L.T., et al., Energy balance and GHG-a
Policy (2007), doi:10.1016/j.enpol.2007.03.012
According to IEA (2004), the use of ethanol from grains,mainly corn and wheat, can provide a 20–47% reduction inwell-to-wheels GHG emissions compared to CG. Ethanolfrom sugar beet is even better at a 56% GHG reduction.Notable cases are sugar cane ethanol in Brazil and cellulosicethanol in all regions with GHG reduction rates falling inthe range of 70–90% or higher. Table 5 summarizes lifecycle GHG impacts of ethanol from cassava in Thailand incomparison with ethanol from other feedstocks, e.g., cornin the US (Wang, 2006), herbaceous biomass in the US(Wang, 2006), cassava in China (Hu et al., 2004a) and sugarcane in Brazil (Macedo et al., 2004). Consistent with theenergy balance result, CE in Thailand can provide arelatively high GHG emission reduction benefit, whichranks third after cane ethanol in Brazil and herbaceousethanol in the US as can be seen in Table 5.
4.2.2. Cost of ethanol produced from cassava in Thailand
The cost breakdown for CE production was adapted fromthe 2003 cost estimate prepared by the research team inCSTRU, Bangkok, Thailand (Ronjnaridpiched et al., 2003).The estimate was first made for commercial plant with aproduction capacity of 100,000L/d in the 2003 record andthen 200,000L/d in the 2006 update. The production cost ofethanol (termed ex-distillery price) is an aggregation ofvarious cost/value items as listed in Table 6. The feedstockcost of ethanol conversion is the cost of cassava chips on theopen market. About 2.5 tonnes of fresh cassava roots areneeded to make 1 tonne of cassava chips. Historically, theprice of cassava roots has changed from Bt930 in 2003 toBt1500 a tonne at present, making the price of cassava chipsvary from Bt2500 to Bt4000 a tonne. New feedstock costbrings ethanol ex-distillery and ex-refinery price to Bt22.06and Bt22.45 a litre, respectively (Table 6). For comparisonwith ULG 95, ethanol ex-refinery price is converted to bahtper gasoline-equivalent litre.Table 6 also shows that feedstock is the dominant
contributor to CE production cost. Studies conductedearlier also arrived at a similar conclusion about the coststructure of biofuels (Balagopalan et al., 1988; IEA, 2004).Thus, a preliminary comparison of feedstock cost per litreof ethanol could be roughly used to weigh the feasibility ofraw materials for ethanol production. Such comparison
hanol from other feedstocks
�CG Avoided emissions (g CO2eq/L EtOH) % reduction
Gross Net
2006 �468 23.3
2920 �1414 48.4
2597 �1633 62.9
2820 �2564 90.9
2920 �2675 91.6
batement cost of cassava utilization for fuel ethanol in Thailand, Energy

ARTICLE IN PRESS
Table 6
Detailed cost of ethanol production from cassava chips
Items THB (Thai
Baht)/litre
%
contribution
Feedstock (cassava chips) 12.01 65.34
Ethanol conversion 6.37 34.66
Chemicals 1.43
Utilities (bunker oil, electricity) 2.42
Repair and maintenance 0.21
Insurance 0.14
Wage and salary 1.34
Depreciation 0.83
Total production cost (ex-distillery
price)
18.38
Profit margin 3.68
Ex-distillery price 22.06
Ethanol transportation/distribution 0.39
Ex-refinery price 22.45
Ex-refinery price per gasoline-
equivalent litre
25.22
0
0.04
0.08
0.12
0.16
0.2
0.24
0.28
0
Percentage GHG reduction
Incr
emen
tal c
ost
(US$
per
gas
olin
e-eq
uiva
lent
litr
e)
base case: US$99/t CO2
2
eq. US$69.6/t CO2 eq.
US$43.4/t CO eq. US$9.1/t CO2 eq.
A B
CD
E
F
10080604020
Fig. 3. Potentials of improvement in GHG abatement cost of cassava
ethanol in Thailand.
Table 7
Comparison of current feedstock cost per litre of ethanol produced
THB/tonne L ethanol/
tonne
Feedstock cost
(THB/L ethanol)
Cassava chip 3900–4000a 333d 11.71–12.01
Sugar cane 1100–1200b 70e 15.71–17.14
Molasses 5270c 260e 20.27
aAFET (2006).bPrasertsri (2006)—USDA Foreign Agricultural Service.cNation Internet (2006).dEstimated from Ronjnaridpiched et al. (2003).eDEDE (2004c).
T.L.T. Nguyen et al. / Energy Policy ] (]]]]) ]]]–]]] 9
made for ethanol production in Thailand concerned withthe three potential feedstock types (Table 7) partly showsthat ethanol produced from cassava should be cheaperthan from molasses or sugar cane.
4.2.3. GHG abatement cost
The event of escalating oil prices recently has narrowedthe gap in price between ethanol and CG. In Thailand, ex-refinery price per gasoline-equivalent litre of CE is 6.24THB higher than the refinery gate price of ULG 95. Takinginto account net avoided emissions per litre (1633� 10�6 tCO2 eq.) and incremental cost per litre (Bt6.24 or US$0.161,given the average exchange rate for the first seven months of2006: 1USD ¼ 38.72 THB), one can calculate the GHGabatement cost of CE in Thailand as US$99 per tonne ofCO2-equivalent. It is about 1.4 times the reference cost,US$69.6/t CO2 eq., at which ethanol would be a reasonableoption for climate change mitigation.
In fact, even US$69.6 is not a first-best option forclimate policy in Thailand; there are other GHG mitigationoptions which are more attractive at the costs ranging fromUS$43.4 to US$-323.1/t CO2 eq. Fig. 3 shows thepotentials of improvement in GHG abatement cost
Please cite this article as: Nguyen, T.L.T., et al., Energy balance and GHG-a
Policy (2007), doi:10.1016/j.enpol.2007.03.012
expected for CE in Thailand. The incremental cost of CE(US$ per gasoline-equivalent litre) over CG is plottedagainst a range of percentage GHG reduction. The first linefrom the top in the figure is a series of differentcombinations of incremental cost and GHG reductionresulting in an abatement cost of US$99/t CO2 eq., whichcorresponds to CE case study in Thailand (point A inFig. 3). The lower lines (US$69.6, US$43.4, and US$9.1/tCO2eq.) represent the most likely cases in which ethanolstrategy would be attractive to policy makers as itapproaches the three options appearing at the bottom ofthe list of least cost GHG mitigation strategies forThailand.Hypothetically, Fig. 3 shows that if CE could cut GHG
emissions by 89.2%, the abatement cost would approachUS$69.6/t CO2 eq., even if the incremental cost remainsunchanged (point B in Fig. 3). Point C in the figureindicates that if CE can provide very high rate in GHGreduction, say 100%, the abatement cost would drop toUS$62/t CO2 eq.Since GHG abatement cost depends not only on GHG
reduction but also on the incremental cost of CE (pergasoline-equivalent litre), either a decrease in ethanolproduction cost or an increase in gasoline price wouldfavor ethanol’s strategy for climate policy. A drop inincremental cost of ethanol to $US0.114 or Bt4.40 wouldbe as efficient as a GHG reduction of 89.2% to bringabatement cost close to $US69.6/t CO2 eq. (point D).Further decreases in the incremental cost of ethanolover gasoline to $US0.071 and $US0.015, or Bt2.74and Bt0.58 per litre respectively, make ethanol a betteroption for climate policy with GHG abatement costscorresponding to points E and F on the two bottom lines inFig. 3.In fact, rising oil prices would make the production cost
of ethanol increase accordingly, since ethanol is still aproduct of an oil-based economy (83.4% of energyconsumption in ethanol production is derived from oil).The gap could effectively get narrower with a decrease inthe costs expended in producing ethanol. It is the case of a
batement cost of cassava utilization for fuel ethanol in Thailand, Energy

ARTICLE IN PRESST.L.T. Nguyen et al. / Energy Policy ] (]]]]) ]]]–]]]10
modest rate of fossil energy inputs in the CE productioncycle brought about by appropriate farming practices andadvanced ethanol conversion technologies. Cogenerationof electricity and steam is another option for modernethanol plants to cut down energy costs. In addition,utilization of ethanol by-products would help offsetethanol production cost and avoid GHG emissions fromother sectors producing the compatible products that areassumed to be displaced. For instance, biogas is a by-product of ethanol production being used as an energysupply, helping reduce production cost and avoid GHGemissions associated with bunker oil use. In this CEsystem, biogas recovery can reduce a cost of up to Bt1.25and avoid 256 g CO2 eq. per litre of ethanol produced.Without this energy supply, GHG abatement cost wouldbe as high as US$144/t CO2 eq. Other potential by-products are cassava residues which can be used as processfuel substituting for fossil oil in ethanol conversion. Onetonne of fresh cassava can produce about 400 kg ofpeelings and slurry (NEPO, 2000). High moisture content(67–83%) of these waste materials implies extra drying costbefore use and overall efficiency loss. As limited informa-tion is available on such a scheme, more research is in needto assess whether it is technically and economically feasible.
5. Conclusions
The results of the study show the positive impacts ofusing CE on fossil energy use and GHG emissions. Theenergy balance for the production of ethanol from cassavahas been found to be positive, i.e., less amount of fossil fuelis consumed to produce ethanol than the gasoline beingreplaced. Consistent with a positive energy balance, well-to-wheel GHG emissions of CE in Thailand are relativelylow, about 0.96 kg per litre of CE used versus 2.6 kg CO2
eq. for CG that is substituted.GHG abatement cost found for CE in Thailand of
US$99/t CO2 eq. exceeds the many other climate changemitigation strategies, which are classified as least-costoptions for Thailand. In the short term, the less favorablecost effectiveness of most biofuels has mainly resulted fromthe excess fossil fuel costs expended in the many processingsteps required to upgrade biomass to a high-qualitytransport fuel. In the long run, trends of cost reductionas well as GHG emission reduction going on with ethanolproduction development would bring the cost per tonne ofCO2 avoided to lower values. With Thailand, ethanolindustry is still young compared to Brazil, the largestethanol producer in the world. Brazil has over 30 yearsexperience with ethanol, having gone through step-by-stepand well-planned expansion program. As of January 2006,it was reported that Brazil could produce ethanol with aprice of about US$0.26 a litre, lower than the internationalprice of gasoline of US$0.4 a litre. Despite a lowervolumetric energy density compared to gasoline, in Brazil,ethanol is still cheaper per kilometer driven (Luhnow andSamor, 2006). Not only effective in cost, sugar cane ethanol
Please cite this article as: Nguyen, T.L.T., et al., Energy balance and GHG-a
Policy (2007), doi:10.1016/j.enpol.2007.03.012
in Brazil also provides very high GHG reduction, about91% as estimated by Macedo et al. (2004). Its GHGabatement cost must be a negative value most expected tobe more attractive by the moment. Much can be learnedfrom the Brazilian fuel ethanol program, of which, itsexcellent use of energy salvaged from bagasse to powerethanol plant and other industrial sectors, is remarkable.It is noteworthy to emphasize that many benefits of
biofuels cannot be captured adequately through a conven-tional cost analysis. Briefly, they are (1) Reducing oilimports and saving foreign exchanges, (2) Strengtheningself-reliance through reducing foreign debt and debtservicing burdens, (3) Reducing GHG emissions andcertain air pollutant emissions, (4) Enhancing technologicaldevelopment, (5) Stimulating domestic agricultural pro-duction and expanding the markets for domestic agricul-tural commodities, (6) Generating rural employment andimproving farmers’ income (Goldemberg et al., 1988). Ifthese benefits are taken into account in a GHG abatementcost analysis, the cost would be more favorable for CE.
Acknowledgments
This research project is financially supported by the JointGraduate School of Energy and Environment, KingMongkut’s University of Technology Thonburi. Theauthors would like to thank all officers of the Departmentof Agricultural Extension in the eastern region of Thailandfor their help in cassava farming data collection. Thanksare also extended to the research team in Cassava andStarch Technology Research Unit, Bangkok, Thailand, asethanol conversion data provider.
References
ADB (Asian Development Bank), 1998. Asia Least-cost Greenhouse Gas
Abatement Strategy: Thailand. Asian Development Bank, Manila.
AFET (the Agricultural Futures Exchange of Thailand), 2006. Trading
summary—Physical Market /www.afet.or.th/downloadnow.php?
file=download/dailyreport/20060621.pdfS.
Balagopalan, C., Padmaja, G., Nanda, S.K., Moorthy, S.N., 1988.
Cassava in Food, Feed, and Industry. CRC Press, Boca Raton, FL,
USA, pp. 178–183.
Bouwman, A.F., Boumans, L.J.M., Batjes, N.H., 2002. Emissions of N2O
and NO from fertilized fields: Summary of available measurement
data. Global Biogeochemical Cycles 16(4), 1058, doi:10.1029/
2001GB001811.
CSTRU (Cassava and Starch Technology Research Unit), 2004. Outlook
of raw materials for ethanol industry in Thailand /www.cassava.org/
News/biofuel2004/Poster_ethanol2.pdfS.
Dai, D., Hu, Z., Pu, G., Li, H., Wang, C.T., 2006. Energy efficiency and
potentials of cassava fuel ethanol in Guangxi region of China. Energy
Conversion and Management 47, 1686–1699.
DEDE (The Department of Alternative Energy Development and
Efficiency), 2004a. Thailand Energy Statistics 2004 /www2.dede.
go.th/dede/report/TES2004.pdfS.
DEDE (The Department of Alternative Energy Development and
Efficiency), 2004b. Thailand energy situation year 2004 /http://www.
dede.go.th/dede/fileadmin/usr/wpd/static/energy47/10_ENT3.pdfS.DEDE (The Department of Alternative Energy Development and
Efficiency), 2004c. Renewable energy in Thailand: ethanol and
batement cost of cassava utilization for fuel ethanol in Thailand, Energy

ARTICLE IN PRESST.L.T. Nguyen et al. / Energy Policy ] (]]]]) ]]]–]]] 11
biodiesel. The Department of Alternative Energy Development and
Efficiency, Ministry of Energy.
DMU, NERI (National Environmental Research Institute, Denmark),
2006. Emissions Factors.
Earth trends, 2003. Climate and Atmosphere—Thailand, Country Profiles
/http://earthtrends.wri.org/pdf_library/country_profiles/cli_cou_764.
pdfS.
EPPO (Energy Policy and Planning Office, Ministry of Energy, Thailand),
2006. Retail Oil Prices /www.eppo.go.th/retail_prices.htmlS.
FAS-USDA (Foreign Agricultural Service, United States Department
of Agriculture), 2005. Thailand HRI Food Service Sector 2005.
GAIN Report No. TH5019 /www.fas.usda.gov/gainfiles/200502/
146118902.docS.
Fluck, R.C., 1992. Energy of human labor. In: Fluck, R.C. (Ed.), Energy
in Farm Production (Vol. 6 of Energy in World Agriculture). Elsevier,
Amsterdam, pp. 31–37.
Freedman, S.M., 1982. Human labor as an energy sources for rice
production in the development world. Agro-Ecosystems 8, 125–136.
Goldemberg, J., Johansson, T., Reddy, A., Williams, R., 1988. Energy for
a Sustainable World. Wiley Eastern Limited, pp. 250–251.
Helsel, Z.R., 1992. Energy and alternatives for and pesticide use. In:
Fluck, R.C. (Ed.), Energy in Farm Production (Vol. 6 of Energy in
World Agriculture). Elsevier, Amsterdam, pp. 177–201.
Henke, J.M., Klepper, G., Schmitz, N., 2005. Tax exemption for biofuels
in Germany: is bio-ethanol really an option for climate policy? Energy
30 (14), 2617–2635.
Hershey, C.H., Howeler, R.H., 2000. Cassava in Asia: Designing crop
research for competitive markets. Cassava’s potential in Asia in the
21st Century: Present situation and future research and development
needs. In: Proceedings of the Sixth Regional WorkshopHo Chi Minh
City, Vietnam. Feb. 21–25.
Howeler, R.H., 2000. Cassava agronomy research in Asia: Has it benefited
cassava farmers? Cassava’s potential in Asia in the 21st Century:
present situation and future research and development needs. In:
Proceedings of the Sixth Regional Workshop. Ho Chi Minh City,
Vietnam. Feb. 21–25.
Hu, Z., Fang, F., Ben, D., Pu, G., Wang, C., 2004a. Net energy,
CO2 emission, and life cycle cost assessment of cassava-based ethanol
as an alternative automotive fuel in China. Applied Energy 78,
247–256.
Hu, Z., Pu, G., Fang, F., Wang, C., 2004b. Economics, environment, and
energy life cycle assessment of automobiles fueled by bio-ethanol
blends in China. Renewable Energy 29 (14), 2183–2192.
IEA (International Energy Agency), 2004. Biofuels for Transport: An
International Perspective. International Energy Agency, Paris.
IEA (International Energy Agency), 2005. Share of Total Primary Energy
Supply in 2003-Thailand -International Energy Agency Energy
Statistics /http://iea.org/textbase/stats/pdf_graphs/THTPESPl-pdfS.
IFAS (Institute of Food and Agricultural Sciences), 1991. The Energy
Information Handbook. Florida Cooperative Extension Service.
University of Florida.
IPCC (Intergovernmental Panel on Climate Change), 2001. IPCC Third
Assessment Report—Climate Change 2001.
JICA (Japan International Cooperation Agency), 2003. Country Study for
Japan’s Official Development Assistance to the Kingdom of Thailand-
From ‘‘Development Assistance’’ to a ‘‘New Cooperation’’. Institute
for International Cooperation, Japan international cooperation agency
/www.jica.go.jp/english/resources/publications/study/country/pdf/
thailand.pdfS.
Lamb, D., 2006. Inquiry into Australia’s future oil supply and alternative
transport fuels. Submission to the Senate Rural and Regional Affairs
and Transport Committee.
Levelton, R., 2000–2001, Assessment of net emissions of greenhouse gases
from ethanol-gasoline blends in Southern Ontario, Cross-Sectoral
Policy Development Division.
Lohsomboon, P., Jirajariyavech, A., 2003. Thailand—Final Report for the
Project on Life Cycle Assessment for Asian Countries—Phase III,
Business and Environment Program. Thailand Environment Institute.
Please cite this article as: Nguyen, T.L.T., et al., Energy balance and GHG-a
Policy (2007), doi:10.1016/j.enpol.2007.03.012
Luhnow, D., Samor, G., 2006. As Brazil fills up on ethanol, it weans off
energy imports, The Wall Street Journal, 16 January 2006 /http://
yaleglobal.yale.edu/display.article?id=6817S.
Macedo, I.C., Leal, M.R.L.V., Silva, J.E.A.R., 2004. Assessment of
Greenhouse Gas Emissions in the Production and Use of Fuel Ethanol
in Brazil. Secretariat of the Environment, Government of the State of
Sao Paulo.
Nation Internet, 2006. Late news—Likelihood of July ethanol shortage as
molasses price surges /www.nationmultimedia.com/option/print.php?
newsid=30003055S.
NEPO (National Energy Policy Office), 2000. Biomass-Based Power
Generation and Cogeneration Within Small Rural Industries: Final
Report. Bangkok, Thailand.
NESDB (National Economic and Social Development Board), 2005.
National Income of Thailand 2004 edition—Summary Tables.
/www.nesdb.go.th/econSocial/macro/gdp_data/mainaccount.htmS.
OAE (Office of Agriculture Economics), 2004. Agricultural Statistics of
Thailand. Center for agricultural information, Office of agricultural
economics, Ministry of Agriculture and Cooperatives, Agricultural
Statistics No. 411.
Odum, H.T., 1983. Systems Ecology. Wiley, New York, pp. 476–507.
ONEP-MONRE (Office of Natural Resources & Environmental
Policy and Planning—Ministry of Natural Resources and Environ-
ment), 2005. CDM Development in Thailand /http://cd4cdm.org/
countries%20and%20regions/Asia/Fifth%20Regional%20Workshop/
CDM-Thailand.pptS.
Prasertsri, P., 2006. Thailand sugar annual 2006. USDA Foreign
Agricultural Service—Gain Report—Global Agriculture Information
Network /www.fas.usda.gov/gainfiles/200604/146187503.docS.
Ronjnaridpiched, C., Kosintarasaenee, S., Sriroth, K., Piyachomkwan,
K., Tia, S., Kaewsompong, S., Nitivararat, M., 2003. Development of
Ethanol Production Technology from Cassava Chip at a Pilot Plant
Scale, National Research Council of Thailand.
Shapouri, H., Duffield, J.A., McAloon, A., Wang, M., 2004. The 2001 Net
Energy Balance of Corn Ethanol. US Department of Agriculture.
Sriroth, K, Piyachomkwan, K, Veerathaworn P, Sarobol, V, Vichukit, V.,
Ronjnaridpiched, C., 2003. Bioethanol from cassava.In: Proceedings
of the Second Regional Conference on Energy Technology Towards a
Clean Environment, Phuket, Thailand, February 12–14.
Sriroth, K., Ronjnaridpiched, C., Vichukit, V., Suriyapan, P., Oates, C.G.,
2000. Present situation and future potential of cassava in Thailand.
Cassava’s potential in Asia in the 21st Century: Present Situation and
Future Research and Development Needs. In: Proceedings of the Sixth
Regional WorkshopHo Chi Minh City, Vietnam. Feb. 21–25.
Sriroth, K., Lamchaiyaphum, B., Piyachomkwan, K., 2006. Present
situation and future potential of cassava in Thailand. Cassava and
Starch Technology Research Unit, Cassava Information Network
/www.cassava.org/doc/presentsituation2.pdfS.
Sukphisal, B., 2005. Market development of biofuels in Thailand. Asia
Biomass Conference on December 15.
Tantithumpoosit, W., 2004. History, roadmap and success of using
ethanol blended gasoline in Thailand. PTT Research and Technology
Institute. In: Second Asian Petroleum Technology Symposium
Program.
TEI (Thailand Environment Institute), 2001. Fossil fuel production and
refinery LCI (2001)
Thongrung, W., 2006. Gasohol price hinges on three new plants, Thailand
Investor Service Center, June 14 /www.thailandoutlook.com/thailan-
doutlook1/top+menu/investor+news/2006S.
Todoc, J.L., 2004. CDM in Thailand: Status and Policy Issues. Centre for
Energy Environment Resources Development, Foundation for Inter-
national Human Resource Development.
Tongglum, A., Suriyapan, P., Howeler, R.H., 2000. Cassava Agronomy
Research and Adoption of Improved Practices in Thailand-Major
Achievements during the past 35 years. Cassava’s potential in Asia in
the 21st Century: Present Situation and Future Research and
Development Needs. In: Proc. 6th Regional Workshop, Ho Chi Minh
City, Vietnam. February 21–25.
batement cost of cassava utilization for fuel ethanol in Thailand, Energy

ARTICLE IN PRESST.L.T. Nguyen et al. / Energy Policy ] (]]]]) ]]]–]]]12
Wang, M., 1999. GREET 1.5—Transportation Fuel-cycle Model. Volume
1: Methodology, Development, Use, and Results. Center for Trans-
portation Research, Argonne National Laboratory, Argonne, IL.
Wang, M., 2006. GREET 1.7 Beta—Transportation Fuel Cycle Model. US
Department of Energy, Argonne National Laboratory, Argonne, IL.
Wang, M., Saricks, C., Wu, M., 1997. Fuel Cycle Fossil Energy Use and
Greenhouse Gas Emissions of Fuel Ethanol Produced from US
Please cite this article as: Nguyen, T.L.T., et al., Energy balance and GHG-a
Policy (2007), doi:10.1016/j.enpol.2007.03.012
Midwest Corn. Center for Transportation Research, Argonne
National Laboratory; Prepared for Illinois Department of Commerce
and Community Affairs.
Witriyatornpan, W., 2006. Cassava chip processing manager of
Lanmanchairuangkit factory located at 65/1 Moo 2, T. Nonpredoo,
A. Laokwan, Kanchanaburi province, Personal interview, 13 March
2006.
batement cost of cassava utilization for fuel ethanol in Thailand, Energy
Copyright © 2022 FDOKUMEN