M ATLAS OF CASSAVA M AL
102
M ATLAS OF CASSAVA M AL Historical, agroecologlcal and demographic aspects :,-.- . ' .:. ?.:-:. _;..r£ ; /à .• t. 3
-
Upload
khangminh22 -
Category
Documents
-
view
0 -
download
0
Transcript of M ATLAS OF CASSAVA M AL
M ATLAS OF CASSAVA M AL Historical, agroecologlcal and demographic aspects
:,-.- . '
.:. ?.:-:. _ ; . . r £ ;
/ à . • t . 3


ISBN 958-9183-38-7
Historical, agroecological and demographic aspects of crop distribution
S.E. Carter, L.O. Fresco and P.G. Jones, with J.N. Fairbairn
<X8/Ä Centra Internacional de Agricultura Tropical

UliiUUlHLLK. LANDßüUWUNIVERSOEÜi
SEAGENINCEM
Centro Internacional de Agricultura Tropical Apartado Aéreo 6713 Cali, Colombia
CIAT Publication No. 206 ISBN 958-9183-38-7 Press run: 1000 copies Printed in Colombia June 1992
An Atlas of cassava in Africa: historical, agroecological and demographic aspects of crop distribution/S. E. Carter, L. O. Fresco and P. G. Jones, with J. N. Fairbairn. — Cali, Colombia: Centro Internacional de Agricultura Tropical, 1992.
86 p., illus., maps.
Summaries in English, Portuguese and French.
1. Cassava — Plant distribution — Africa. 2. Cassava — Plant introduction — Africa. 3. Cassava — Soils — Africa. 4. Cassava — Climate — Africa. 5. Maps — Africa. 6. Cassava — Africa. 7. Cassava — Socioeconomic environment — Africa. 8. Africa — Population. I. Carter, Simon E. II. Fresco, Louise O. III. Jones, Peter G. IV. Fairbairn, James N. V. Centro Internacional de Agricultura Tropical.
Drs. Simon Carter and Peter Jones are Senior Research Fellow and Head, respectively, of the Agroecological Studies Unit at CIAT, Colombia. Dr. Louise Fresco is Lecturer in the Department of Tropical Crop Science of the Agricultural University, Wageningen, Netherlands. Jamie Fairbairn is a Ph.D. student at the University of Reading, England.

CONTENTS
Page
Foreword and Acknowledgments v
Chapter
1 The Dynamics of Cassava in Africa 1
2 The Introduction and Diffusion of Cassava in Africa 9
3 Current Distribution of Cassava in Africa 15
4 The Relationship of Cassava Distribution to Environment and Population 19
5 Distribution and Change in Cassava Production in Three Countries 27
6 Conclusions 41
Summary 45
Resumo 49
Résumé 53
Bibliography 57
Appendix
I Sources of Data for the Map of Cassava Distribution in Africa 63
II Techniques and Methods Used for Environmental and Demographic Mapping
and Construction of the Cassava Distribution Model 67
III Population Data Used to Build the Model of Cassava Distribution 71
List of Acronyms Used in Text 79
Index 81


FOREWORD AND ACKNOWLEDGMENTS
The lack of adequate data on cassava production in Africa has for decades hampered development efforts. Scientists, concerned with understanding cassava's role in agricultural systems and nutrition, and policy makers concerned with declining per capita food production have had to contend with very limited information on a crop whose significance is increasing markedly. One of the authors of the Atlas in particular has had first-hand experience of the frustrations and challenges of conducting fieldwork in an African country on a crop whose patterns of distribution and change are so little understood.
The three authors of the Atlas were brought together by planning meetings of the Collaborative Study of Cassava in Africa (COSCA), an interdisciplinary and interinstitutional effort to provide basic information on the crop in Africa, and to increase the impact and relevance of research related to the crop. COSCA was undertaken by the International Institute for Tropical Agriculture (UTA), the Centro Internacional de Agricultura Tropical (CIAT), and national agricultural research institutions of several African countries. While this study was still under way, we felt it important to produce a document which illustrated current understanding of the distribution of the crop, as a reference for further research and data analysis. The COSCA project was wholly funded by the Rockefeller Foundation. As part of the project, CIAT received funds to develop a sampling frame for the first phase, and to assist in the design, personnel training and initial data analysis for this phase. This Atlas is an additional output from CIAT's portion of the project funds.
The Foundation also provided a personal grant to Louise Fresco for a desk study on cassava. The authors are very grateful to the Rockefeller Foundation, especially to Dr. Robert Herdt, for supporting the production of the Atlas.
The attempt to construct an Atlas of Cassava in Africa has been encouraged by many individuals and events. But if we are to single out one person whose work has provided us with special inspiration, it must be Professor William O. Jones, emeritus professor of the Stanford Food Research Institute. His seminal work, Manioc in Africa, published in 1959, remains unsurpassed as a source of knowledge on the crop, at least until the COSCA study is complete. One of us had the opportunity to travel to Stanford in the spring of 1989, to discuss various aspects of the theoretical framework and consult the SFRI's library.
The contributions of many other individuals have been most valuable, and we would like to thank the following especially: John Lynam, of the Rockefeller Foundation in Nairobi, who not only took a major initiative in formulating the COSCA study, but
also encouraged us to develop a sound theoretical framework for the work presented here. Whilst still at CIAT, as economist in the Cassava Program, he collected most of the contemporary distribution data. Anne Warren also provided much valuable information. Jamie Fairbairn undertook the laborious task of collating all this distribution data to produce as consistent a distribution map as possible, given the many limitations of the data. Our thanks also go to Steve Romanoff who acquired population data from the U.S. Census Bureau, and provided the original idea of an Atlas as an appropriate format to present some of the work we had undertaken for COSCA.
The Netherlands Institute of Advanced Science of the Royal Academy of Sciences provided Louise Fresco an opportunity to spend a six-month sabbatical at their facility in Wassenaar. The UTA and national programme staff involved in the COSCA project and the members of the project's steering committee have provided a sounding board for our ideas.
The authors are grateful to J. Wigboldus, Department of Agrarian History of the Wageningen Agricultural University, for his advice on various historical issues. Several graduates of the Department of Tropical Crop Science, Wageningen Agricultural University, have been involved in some way or other as research assistants and during their M.Sc. thesis work. The contributions of S. Chin a Tarn on Nigeria, B. Meertens and S. Duiker on Tanzania, L. Kater on Zaire, H. Langeveld on country studies in general, and J. Stoorvogel have been most valuable. We also wish to thank CIAT's library staff for assistance with computerised cassava abstracts, especially Nora Rizo.
Mauricio Rincón, of CIAT's Agroecological Studies Unit, laboured long and hard over the production of the colour maps, to develop them from their original computer format to that presented here, via the laborious process of preparing them for printing. We are grateful to the Royal Tropical Institute, Amsterdam, S.A. Agboola and Oxford University Press for permission to reproduce Figures 8,9 and 12, respectively. Ligia Garcia prepared the keys to the colour maps and most of the black and white illustrations. P. Versteeg drew some of the country maps; and Martha Gomez typed most of the manuscript. Finally, we would like to thank James Cock, Mabrouk El-Sharkawy, Clair Hershey and Marcio Porto for reading the manuscript and providing much helpful comment and criticism, and Elizabeth McAdam de Pâez for her speedy and efficient editing of the final manuscript. Responsibility for errors and omissions, needless to say, lies entirely with us.


CHAPTER 1
THE DYNAMICS OF CASSAVA IN AFRICA
Scope and Objectives of the Atlas
Since its introduction into the African continent in the course of the 16th century, cassava has gradually become one of the dominant starchy staples, particularly in the humid lowlands where it may provide over 50% of the local diet. The successful integration of cassava in African cropping and dietary patterns takes on special importance as Africa is the only region where per capita food production has apparently been declining in the last two decades. During that period, overall cassava production in Africa has nearly doubled, even if, according to official statistics, this has not allowed it to keep pace with population increase (De Bruijn and Fresco, 1989 ). At the same time, there are various, often unchecked and contradictory, indications of rapidly changing patterns of agricultural production, accompanied by shifts in the relative importance of food crops, particularly of cassava.
Since the seminal work of W. O. Jones, Manioc in Africa, which appeared in 1959, no comprehensive overview of cassava in Africa has been published. Our understanding of long-term changes in the relative importance of cassava in different agroecological regions is extremely limited and often based on arbitrary speculation rather than on fact. Aggregated food crop statistics in Africa are noted for their poor quality, and cassava's special nature as a food reserve crop is likely to increase statistical inaccuracy. Although numerous studies by social scientists may contain important information on the crop, little effort has been undertaken so far to view these in a comparative and historical context. Even fewer attempts have been made to relate their findings to crop science research which, in turn, has rarely been linked to the changing role of cassava in sub-Saharan Africa.
This Atlas of Cassava in Africa aims to provide a review of the geographic distribution and importance of the crop based on existing statistical data on climate, soils, population and production, combined with selected case studies. It goes without saying that this effort is severely limited by the paucity and poor quality of the available information. Nevertheless, the Atlas is the first attempt to present a comprehensive framework for the interpretation of agroecological and socio-economic data on cassava and to describe the crop's spatial patterns for Africa. Not only do we hope that it will encourage other researchers to add to this framework, we also feel that the Atlas will help focus research on cassava and cassava-based cropping systems more accurately.
After a brief introduction to the theoretical issues involved in the study of the dynamics of cassava in Africa, the Atlas starts with a chapter on the introduction of the crop on the continent. This is followed by a description of the current distribution of the crop. The next chapter describes and maps the agroecological environment in the light of cassava's requirements. Patterns of human population are described, and related to the distribution of the crop by using a spatial regression model and taking into account identified environmental differences. Subsequently, three country studies, on Nigeria, Tanzania and Zaire, allow a discussion of the integration of agroecological, socio-economic and, to a lesser extent, recent historical data as a means of validating the model and the theoretical framework on which it is based. The final chapter reviews the main findings in the light of the theoretical framework on agricultural dynamics in Africa and draws conclusions with respect to the validity and significance of the results.
1. For this and further citations, see Bibliography, p. 57-61.
Theoretical Framework: The Dynamics of Cassava in Africa
The concept of 'niches' for cassava
The question of cassava's relevance to the African food crisis, and, more broadly, to African development, forms the background to the theoretical framework. This section attempts to develop a series of hypotheses that will allow analysis of the distribution of cassava in Africa as a function of agroecological and socio-economic parameters and so provide the basis for a model that explains the spatial distribution of cassava.
Two ideas are central in this approach. Firstly, that the distribution of a crop is not just a matter of chance or coincidence, but reflects a combination of factors that explain the logic behind the crop's role. Secondly, that cassava, because of its versatility and special characteristics, occupies very different niches or roles in African farming systems. These roles seem to vary according to the dynamics of the farming system, in particular, to the degree of intensification and pressure on resources, especially land. In other words, for a given agroecological zone, the presence of cassava and the manner in which it is grown may be an extremely useful indicator to characterise changes in African agriculture. This means that we should inevitably take a long-term view, not only to correct information for seasonal and interannual variations, but, more importantly, to allow an investigation of the role of cassava under changing agroecological, demographic and socio-economic conditions.
What makes cassava so special and different from African staples, such as maize and sorghum, and even other moisture-rich starchy staples such as yam and plantain? Its most important feature is the width of its ecological amplitude, that is, its adaptability to a wide variety of ecological and agronomic conditions. In contrast to other staples, it grows well under marginal, as well favourable, conditions of soil fertility and rainfall. It has no critical growth stage after establishment, during which a short stress period might decrease yield (for details of cassava's requirements see Chapter 4). The implication is not only that the crop is found in a wide range of environments across the continent, but also that within the same agroecological zone, it can adapt to microvariations in relief, soils and cropping systems. Apart from this ecological versatility, cassava also displays certain characteristics that make it adaptable to a variety of socio-economic conditions. Its tolerance of low field labour inputs and variability in planting and harvesting dates make it much less tightly constrained by seasonality than other staples, while it remains a high producer of dry matter (and protein, if aerial parts are included) per unit of land and labour. Although fresh cassava starts to deteriorate within 24 hours and processing is rather labour intensive, its products can be relatively easily stored and transported. Finally, its economically valuable parts are not required for reproduction (de Vries, 1978; Fresco, 1986; Jones, 1959). These features not only explain the successful introduction of cassava in Africa (see Chapter 2), but allow us also to understand how the crop fits into a great variety of African farming systems, i.e., why it occupies certain 'niches', and to gauge its overall importance in Africa.
African agricultural systems are highly variable. Variations in crop species and varieties and cultural practices occur over short distances. The interaction of a wide range of agroecological and socio-economic factors has resulted in a variety of conditions
under which cassava is grown, processed, marketed and consumed. Moreover, these conditions are not static, but are subject to constant change, for example, as a result of population growth and urbanisation. The key issues which this Atlas tries to address are What factors determine the relative importance of cassava, as expressed by the area planted to the crop? and What future scenarios of cassava production in Africa can be envisaged? In order to do this, we must take a continent-wide view of the crop, as well as try to take into account the diversity of socio-economic and agroecological niches in which it is grown.
Land use and cassava in Africa
African agriculture has been subject to considerable change, at a more rapid pace, and over longer periods than one would be led to believe from some 'snapshot' studies of 'traditional' farming. Intense agricultural transformation has characterised many parts of Africa over the last few centuries. Within the constraints of climate and soils, the two major, interrelated elements contributing to agricultural change are population growth and incorporation into the global political economy (Hayami and Ruttan, 1971; Ruthenberg, 1980). As a result of incorporation, infrastructural and technical change have taken place, bringing strong external pressures to bear upon agriculture, through government price controls, fiscal demands, the vagaries of international markets and, last but not least, the encouragement of cash crop production, promoting, in turn, the production of low-cost food crops. The introduction of cassava, maize and groundnuts, now major African staples, was an essential feature of the process of incorporation and had a profound effect on African agriculture well before the demographic changes occurring after World War II.
Ruthenberg (1980) has analysed in detail the types of farming and cropping systems that occur in various agroecological zones, as well as their evolutionary tendencies. Although hunting and gathering have remained important throughout man's history in Africa, there seems little doubt that shifting cultivation developed as the predominant form of land use, once people began to domesticate crops (possible exceptions may be the arid and semi-arid areas). Depending on the agroecological zone, patterns of land use diverge from shifting cultivation to permanent or mixed systems, largely in response to population growth. African farming systems demonstrate three basic forms of land use:
1. Shifting or, when fallows shorten, fallow cultivation, with land use closely mimicking natural climax vegetation through the limited removal of trees and the restoration of natural vegetation during fallow. These systems have probably been widespread throughout Africa, but are now mainly found in the humid and subhumid lowland zones. Labour productivity is high as long as fallows are sufficiently long to restore fertility (Greenland and Okigbo, 1983). Reduced fertility, as well as weed infestation, are reasons for abandonment of land.
2. Permanent perennial and/or annual cultivation. In humid zones, shifting cultivation will be replaced gradually by systems with perennial crops or wet rice cultivation, while permanent cultivation of non-irrigated crops or regulated leys are only found in semi-arid regions. Permanent cultivation in Africa is found in traditionally densely populated areas, either because of confined space (islands, steep hillsides) or in fertile highland areas where, for ecological reasons, population has been concentrated (e.g., Kikuyuland, the Great Lakes in Central Africa and the Jos Plateau).
3. Pastoral or mixed crop-livestock systems, with varying degrees of integration between crops and livestock,
mainly occurring in semi-arid zones. Mixed crop-livestock systems are found in the semi-arid regions of Africa, particularly in the west and south. If livestock is used for land preparation, this can lead to higher yields (timely planting, better seedbed preparation), but it has been concluded that, in Africa, animal traction per se generally affects output through increases in land brought under cultivation rather than through yield increases (Pingali et al., 1987).
The niches of cassava in each of these farming systems are described briefly below:
Shifting and/or fallow cultivation. Since its introduction, the 'classical' niche of cassava has been as a last crop before fallow, i.e., following a soil fertility demanding staple (e.g., upland rice) or cash crop (e.g., cotton, tobacco). The crop was left to merge with the surrounding bush or forest vegetation, and harvested according to need. As long-fallow, shifting cultivation is being (although gradually) replaced by short-fallow cultivation in nearly all areas of Africa, soil fertility is not adequately restored and cassava moves forward in the crop sequence and/or becomes the dominant intercrop. On many savanna fields of the Bandundu region of Zaire, for example, cassava is now the first crop after fallow, grown immediately after clearing. There is ample evidence, from such distinct places as Mozambique, Cameroon, Tanzania, Zaire, Central African Republic, that cassava becomes the dominant intercrop (Fresco, 1986; Guyer, 1984; B. Meertens, 1990, personal communication; Newbury and Ebutumwa-Bw'emiogo, 1984; Rosling, 1987; see also Chapter 5). Although cassava is considered a woman's crop in many regions, it appears to be grown also by single men, widowers or men whose wives are ill. In other words, cassava's comparative advantage in short-fallow shifting cultivation is as a low external input crop that still produces an acceptable yield on unfertilised fields with low labour inputs.
Permanent cultivation. In permanent systems with perennials, cassava is usually not a major feature of the system. It is intercropped temporarily while the perennial crop is being established, or it may be found on extensively cultivated fields that are destined as food reserves and are irregularly harvested. Occasionally, it is included in permanent gardens situated near or on the compound (Lagemann, 1977). Continuous cultivation of cassava (i.e., without fallow) takes place exceptionally in commercial plantations (Nigeria, Congo). In areas with wet rice cultivation in West Africa, cassava may be grown on residual moisture during the dry season, provided soils are not waterlogged.
In areas of relatively high soil fertility and high population densities, permanent cropping may have evolved even in precolonial times (Gleave and White, 1969). Subsequent introduction of perennial cash or plantation crops, such as coffee and cocoa, created a need for an 'easy' staple with few demands on labour, high productivity per unit of land area, and which could be grown between the young trees as the plantation was established. Under these conditions, cassava today still holds a comparative advantage over other staples.
Pastoral and mixed systems. Even where the livestock component is fully integrated in crop production, the animals are left to forage for themselves. During the rainy season, the animals must therefore be kept away from the fields. Cassava seems to present problems in mixed systems because it is often the only crop that provides foliage during the dry season. The difficulty in protecting it from livestock explains why it is rarely found under these systems. It may occur on residual moisture during the dry season near river beds that are sufficiently removed from the village or can be fenced in or watched. However, as soil fertility constrains the traditional cereal crops, cassava may be increasing
(J. H. Cock, 1989, personal communication). Although cassava represents great potential as a livestock feed, its use for this purpose is still negligible in Africa.
The dynamics of land use intensity
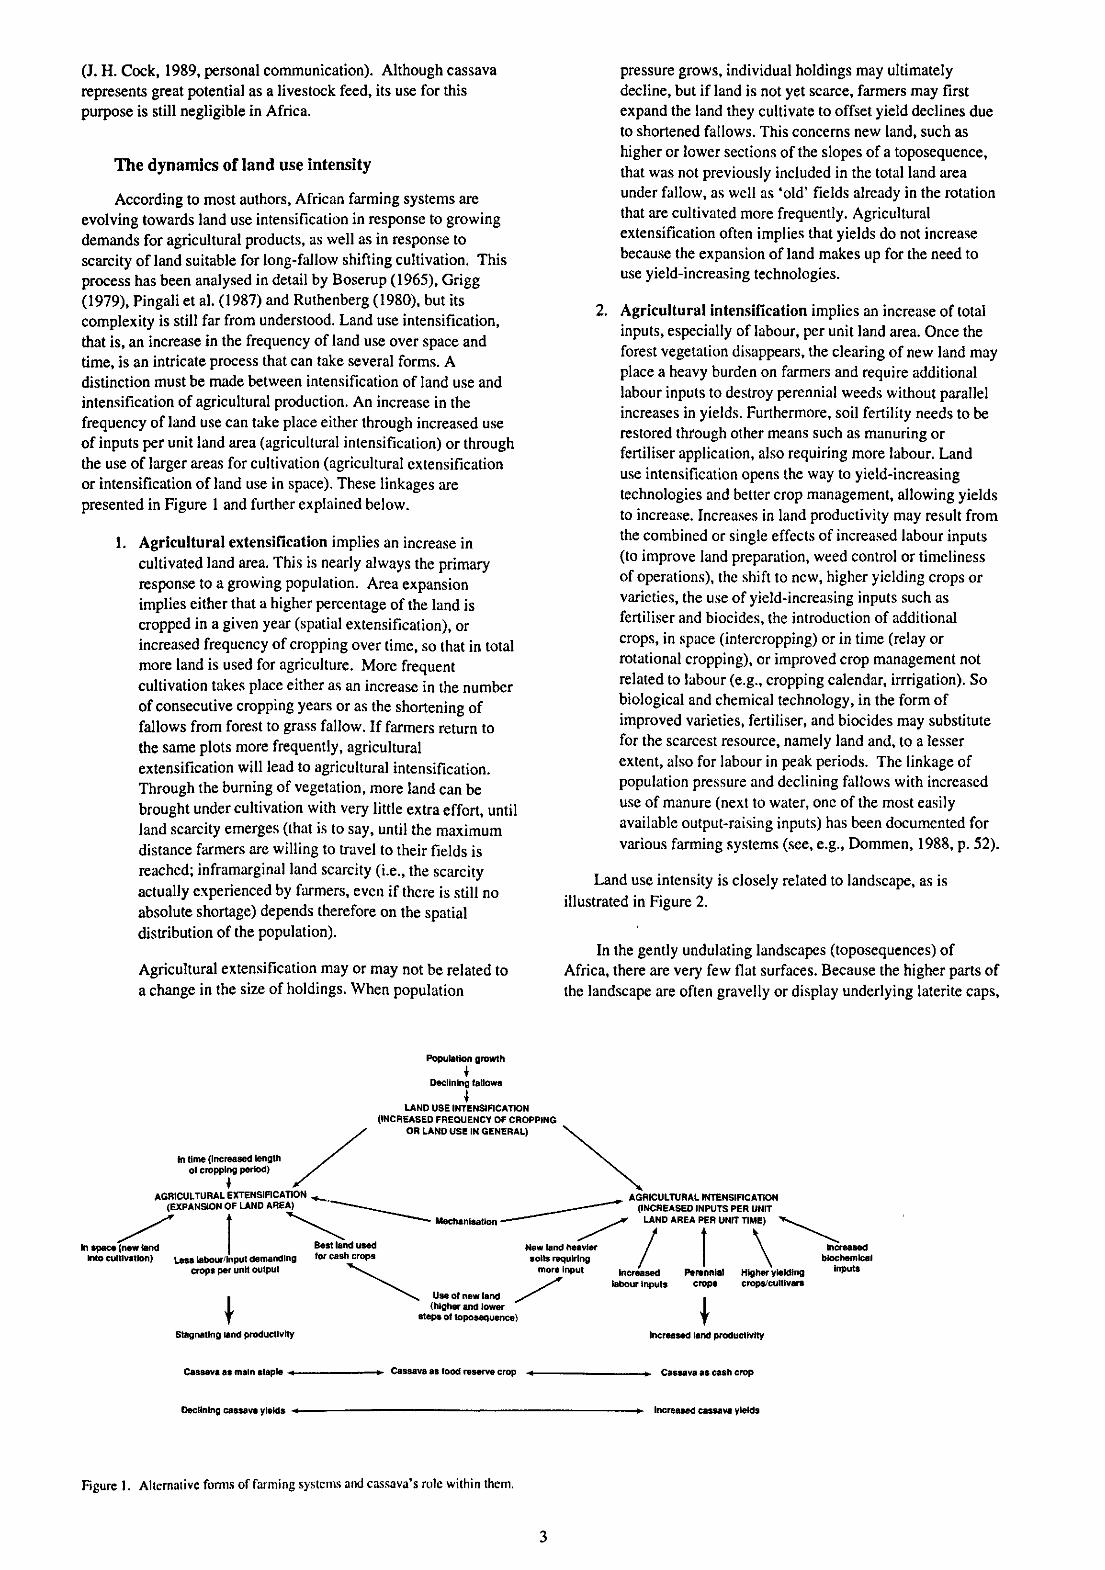
According to most authors, African farming systems are evolving towards land use intensification in response to growing demands for agricultural products, as well as in response to scarcity of land suitable for long-fallow shifting cultivation. This process has been analysed in detail by Boserup (1965), Grigg (1979), Pingali et al. (1987) and Ruthenberg (1980), but its complexity is still far from understood. Land use intensification, that is, an increase in the frequency of land use over space and time, is an intricate process that can take several forms. A distinction must be made between intensification of land use and intensification of agricultural production. An increase in the frequency of land use can take place either through increased use of inputs per unit land area (agricultural intensification) or through the use of larger areas for cultivation (agricultural extensification or intensification of land use in space). These linkages are presented in Figure 1 and further explained below.
1. Agricultural extensification implies an increase in cultivated land area. This is nearly always the primary response to a growing population. Area expansion implies either that a higher percentage of the land is cropped in a given year (spatial extensification), or increased frequency of cropping over time, so that in total more land is used for agriculture. More frequent cultivation takes place either as an increase in the number of consecutive cropping years or as the shortening of fallows from forest to grass fallow. If farmers return to the same plots more frequently, agricultural extensification will lead to agricultural intensification. Through the burning of vegetation, more land can be brought under cultivation with very little extra effort, until land scarcity emerges (that is to say, until the maximum distance farmers are willing to travel to their fields is reached; inframarginal land scarcity (i.e., the scarcity actually experienced by farmers, even if there is still no absolute shortage) depends therefore on the spatial distribution of the population).
Agricultural extensification may or may not be related to a change in the size of holdings. When population
pressure grows, individual holdings may ultimately decline, but if land is not yet scarce, farmers may first expand the land they cultivate to offset yield declines due to shortened fallows. This concerns new land, such as higher or lower sections of the slopes of a toposequence, that was not previously included in the total land area under fallow, as well as 'old' fields already in the rotation that are cultivated more frequently. Agricultural extensification often implies that yields do not increase because the expansion of land makes up for the need to use yield-increasing technologies.
2. Agricultural intensification implies an increase of total inputs, especially of labour, per unit land area. Once the forest vegetation disappears, the clearing of new land may place a heavy burden on farmers and require additional labour inputs to destroy perennial weeds without parallel increases in yields. Furthermore, soil fertility needs to be restored through other means such as manuring or fertiliser application, also requiring more labour. Land use intensification opens the way to yield-increasing technologies and better crop management, allowing yields to increase. Increases in land productivity may result from the combined or single effects of increased labour inputs (to improve land preparation, weed control or timeliness of operations), the shift to new, higher yielding crops or varieties, the use of yield-increasing inputs such as fertiliser and biocides, the introduction of additional crops, in space (intercropping) or in time (relay or rotational cropping), or improved crop management not related to labour (e.g., cropping calendar, irrrigation). So biological and chemical technology, in the form of improved varieties, fertiliser, and biocides may substitute for the scarcest resource, namely land and, to a lesser extent, also for labour in peak periods. The linkage of population pressure and declining fallows with increased use of manure (next to water, one of the most easily available output-raising inputs) has been documented for various farming systems (see, e.g., Dommen, 1988, p. 52).
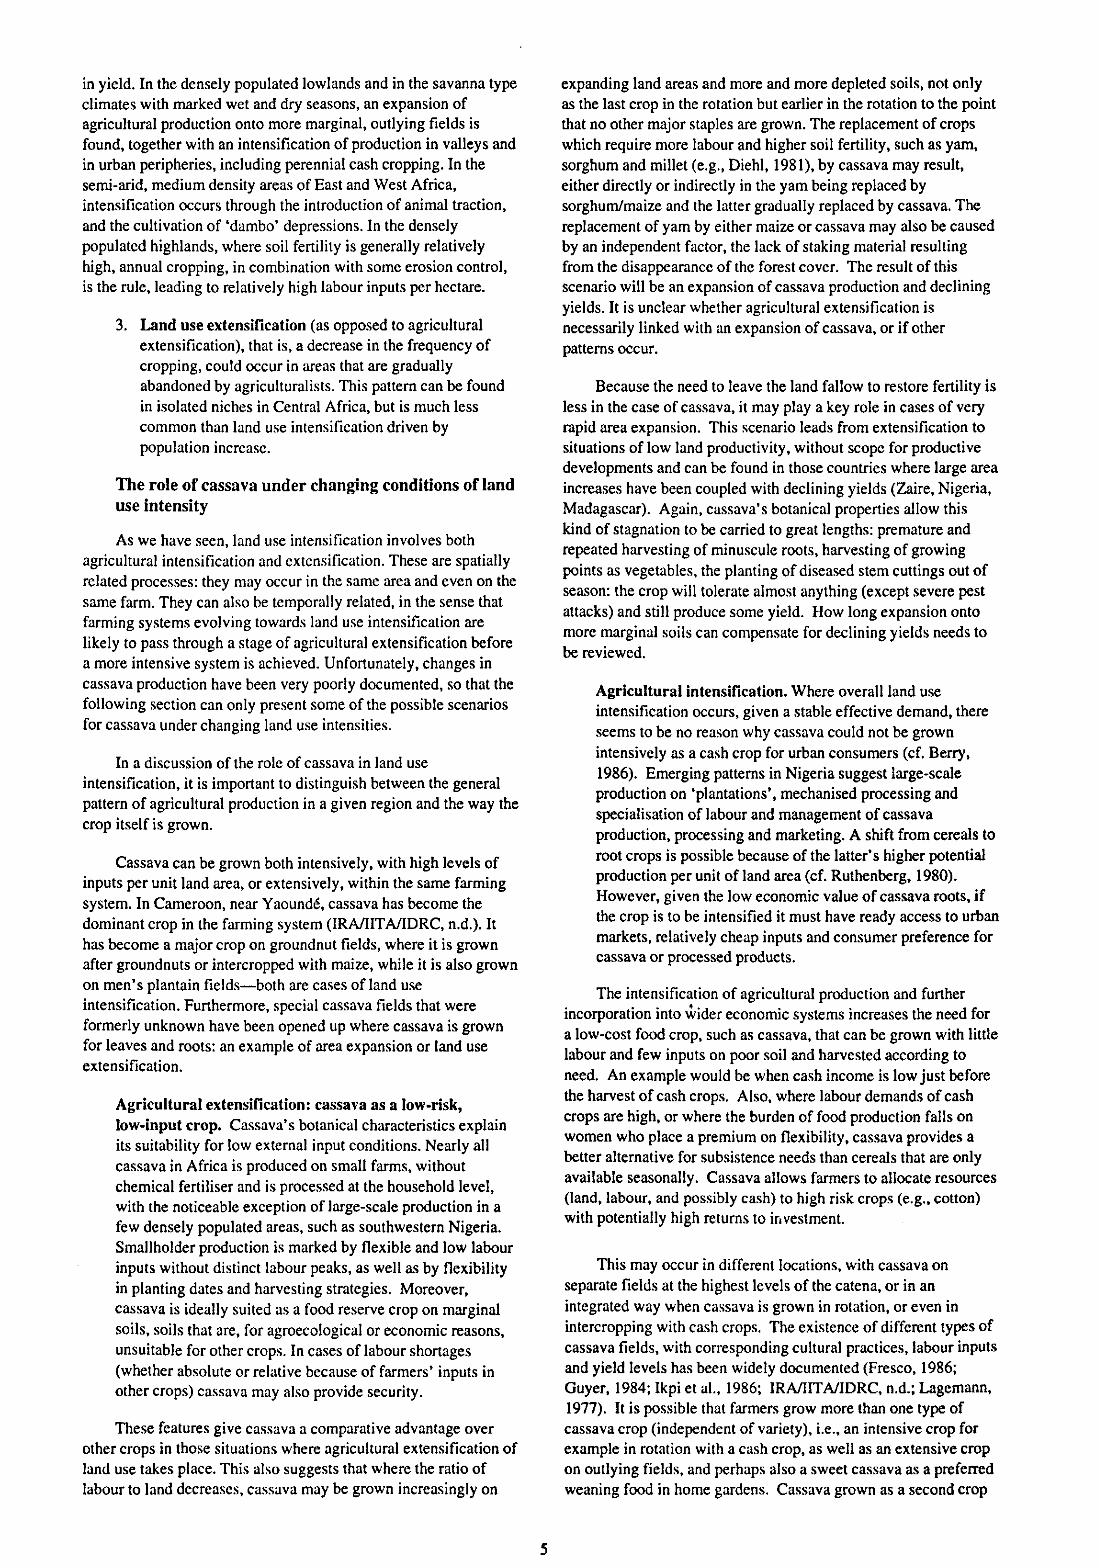
Land use intensity is closely related to landscape, as is illustrated in Figure 2.
In the gently undulating landscapes (toposequences) of Africa, there are very few flat surfaces. Because the higher parts of the landscape are often gravelly or display underlying laterite caps,
Population growth
Declining fallows
T LAND USE INTENSIFICATION
(INCREASED FREQUENCY OF CROPPING OR LAND USE IN GENERAL)
in time (increased length of cropping period)
• AGRICULTURAL EXTENSIFICATION ^
(EXPANSION OF LAND AREA)
In space (new land B e s t l a n d U 8 ed Into cultivation) L e M labour/input demanding 'or cashcrops
crops per unit output
\ Stagnating land productivity
Mechanisation
AGRICULTURAL INTENSIFICATION (INCREASED INPUTS PER UNIT
LAND AREA PER UNIT TIME)
New land heavier soils requiring
more input
Use of new land (higher and lower
steps of toposequence)
Increased labour Inputs
Perennial crops
Increased \ biochemical
Higher yielding , n P u , s
crops, cultivare
I Increased land productivity
Cassava as main staple -«- -». Cassava as food reserve crop -«- -+. Cassava as cash crop
Declining cassava yields -*- -*• Increased cassava yields
Figure 1. Alternative forms of farming systems and cassava's role within them.

A Low population densities
Unused or grazing land, hunting, timber
Long fallow Shifting cultivation
Upland rice Cassava
Maize Yam
Ground water level
Crests and upper slopes
B High population densities
Agricultural extensification (area expansion)
Cassava Grazing
Tree crops
Middle and low slopes village
Unused or dry season gardening
Fishing Hunting
Valley bottoms and flood plains
Ground water level
Crests and upper slopes
Short fallow Shifting cultivation
Permanent cultivation
Tree crops Cotton
Cassava Maize
Permanent cultivation
Agricultural extensification
(area expansion)
^ _ Agricultural intensification __̂ (increased inputs/ha)
Wet rice, gardens
Middle and lower slopes Villages, scattered farmsteads Valley bottoms and flood
plains
Figure 2. Stylised relationship between land use intensity and landscape in African farming systems.
and the lowest parts are too wet, at low population densities, shifting cultivation generally takes place on the gentle middle slopes of the toposequence, although dry-season gardening may be found in the valley bottoms. Increased pressure on land leads first to an expansion of area, i.e., into the valley bottoms and onto the plateaux or crests. The cultivation of the heavier soils on the lower slopes and in the depressions requires a higher labour input for clearing and water management, and often even animal traction. Productivity per unit of land area tends to increase while labour productivity gradually declines. A further consequence is a change in the preference for certain crops to hydromorphic (and ultimately irrigated) rice, possibly in association with vegetables. The use of the valley bottoms, while it constitutes a form of expansion (agricultural extensification), leads to intensification because of the characteristics of the land units involved. On the crests, land will be taken into production either for cattle, or extensively managed food crops (because the fields are far removed from the homesteads). Tree crops will be grown preferably on the middle and lower parts of the toposequence, allowing permanent cultivation and agricultural intensification.
Often, these two processes—agricultural extensification and agricultural intensification—are combined and interact. Area under cultivation expands at the same time that farmers return to their old, shifting plots more frequently than before. This is especially the case when fallows are reduced and fallow systems are replaced by perennials.
If agricultural intensification does not take place, that is, if no higher inputs are used per unit land area (as may be the case with subsistence crops), stagnation of overall land productivity may be the result, independently of the trend in area cultivated. If shorter fallows and declining soil fertility are not accompanied by increased inputs, production will decline sooner or later. Even a change in the spatial distribution of agricultural land could lead to stagnating food crop yields. For instance, a shift of food crops to more marginal soils while the best soils are used by cash crops, or a shift to lighter, less fertile soils that demand less labour for clearing and allow labour inputs per hectare to remain low.
It is therefore possible to distinguish farming systems according to their degree of land use intensification and the degree to which agricultural intensification and extensification occur simultaneously in a given area or village. Farmers may cultivate both the lower and upper ends of the toposequence at varying degrees of intensity, or some farmers may have access to lower lying fields, while others are limited to the hillsides; in other cases, entire villages may be considered 'plateau' villages situated on the crests that have no fields in the lower parts of the toposequence.
In the different agroecological zones these processes have so far led to divergent patterns. In the sparsely populated, Central African, humid lowlands, extensification prevails: the production growth is nearly exclusively explained through an increase in cultivated area, that is sometimes accompanied by a sharp decline
in yield. In the densely populated lowlands and in the savanna type climates with marked wet and dry seasons, an expansion of agricultural production onto more marginal, outlying fields is found, together with an intensification of production in valleys and in urban peripheries, including perennial cash cropping. In the semi-arid, medium density areas of East and West Africa, intensification occurs through the introduction of animal traction, and the cultivation of 'dambo' depressions. In the densely populated highlands, where soil fertility is generally relatively high, annual cropping, in combination with some erosion control, is the rule, leading to relatively high labour inputs per hectare.
3. Land use extensification (as opposed to agricultural extensification), that is, a decrease in the frequency of cropping, could occur in areas that are gradually abandoned by agriculturalists. This pattern can be found in isolated niches in Central Africa, but is much less common than land use intensification driven by population increase.
The role of cassava under changing conditions of land use intensity
As we have seen, land use intensification involves both agricultural intensification and extensification. These are spatially related processes: they may occur in the same area and even on the same farm. They can also be temporally related, in the sense that farming systems evolving towards land use intensification are likely to pass through a stage of agricultural extensification before a more intensive system is achieved. Unfortunately, changes in cassava production have been very poorly documented, so that the following section can only present some of the possible scenarios for cassava under changing land use intensities.
In a discussion of the role of cassava in land use intensification, it is important to distinguish between the general pattern of agricultural production in a given region and the way the crop itself is grown.
Cassava can be grown both intensively, with high levels of inputs per unit land area, or extensively, within the same farming system. In Cameroon, near Yaoundé, cassava has become the dominant crop in the farming system (IRA/IITA/IDRC, n.d.). It has become a major crop on groundnut fields, where it is grown after groundnuts or intercropped with maize, while it is also grown on men's plantain fields—both are cases of land use intensification. Furthermore, special cassava fields that were formerly unknown have been opened up where cassava is grown for leaves and roots: an example of area expansion or land use extensification.
Agricultural extensification: cassava as a low-risk, low-input crop. Cassava's botanical characteristics explain its suitability for low external input conditions. Nearly all cassava in Africa is produced on small farms, without chemical fertiliser and is processed at the household level, with the noticeable exception of large-scale production in a few densely populated areas, such as southwestern Nigeria. Smallholder production is marked by flexible and low labour inputs without distinct labour peaks, as well as by flexibility in planting dates and harvesting strategies. Moreover, cassava is ideally suited as a food reserve crop on marginal soils, soils that are, for agroecological or economic reasons, unsuitable for other crops. In cases of labour shortages (whether absolute or relative because of farmers' inputs in other crops) cassava may also provide security.
These features give cassava a comparative advantage over other crops in those situations where agricultural extensification of land use takes place. This also suggests that where the ratio of labour to land decreases, cassava may be grown increasingly on
expanding land areas and more and more depleted soils, not only as the last crop in the rotation but earlier in the rotation to the point that no other major staples are grown. The replacement of crops which require more labour and higher soil fertility, such as yam, sorghum and millet (e.g., Diehl, 1981), by cassava may result, either directly or indirectly in the yam being replaced by sorghum/maize and the latter gradually replaced by cassava. The replacement of yam by either maize or cassava may also be caused by an independent factor, the lack of staking material resulting from the disappearance of the forest cover. The result of this scenario will be an expansion of cassava production and declining yields. It is unclear whether agricultural extensification is necessarily linked with an expansion of cassava, or if other patterns occur.
Because the need to leave the land fallow to restore fertility is less in the case of cassava, it may play a key role in cases of very rapid area expansion. This scenario leads from extensification to situations of low land productivity, without scope for productive developments and can be found in those countries where large area increases have been coupled with declining yields (Zaire, Nigeria, Madagascar). Again, cassava's botanical properties allow this kind of stagnation to be carried to great lengths: premature and repeated harvesting of minuscule roots, harvesting of growing points as vegetables, the planting of diseased stem cuttings out of season: the crop will tolerate almost anything (except severe pest attacks) and still produce some yield. How long expansion onto more marginal soils can compensate for declining yields needs to be reviewed.
Agricultural intensification. Where overall land use intensification occurs, given a stable effective demand, there seems to be no reason why cassava could not be grown intensively as a cash crop for urban consumers (cf. Berry, 1986). Emerging patterns in Nigeria suggest large-scale production on 'plantations', mechanised processing and specialisation of labour and management of cassava production, processing and marketing. A shift from cereals to root crops is possible because of the latter's higher potential production per unit of land area (cf. Ruthenberg, 1980). However, given the low economic value of cassava roots, if the crop is to be intensified it must have ready access to urban markets, relatively cheap inputs and consumer preference for cassava or processed products.
The intensification of agricultural production and further incorporation into wider economic systems increases the need for a low-cost food crop, such as cassava, that can be grown with little labour and few inputs on poor soil and harvested according to need. An example would be when cash income is low just before the harvest of cash crops. Also, where labour demands of cash crops are high, or where the burden of food production falls on women who place a premium on flexibility, cassava provides a better alternative for subsistence needs than cereals that are only available seasonally. Cassava allows farmers to allocate resources (land, labour, and possibly cash) to high risk crops (e.g., cotton) with potentially high returns to investment.
This may occur in different locations, with cassava on separate fields at the highest levels of the catena, or in an integrated way when cassava is grown in rotation, or even in intercropping with cash crops. The existence of different types of cassava fields, with corresponding cultural practices, labour inputs and yield levels has been widely documented (Fresco, 1986; Guyer, 1984; Ikpi et al., 1986; IRA/IITA/IDRC, n.d.; Lagemann, 1977). It is possible that farmers grow more than one type of cassava crop (independent of variety), i.e., an intensive crop for example in rotation with a cash crop, as well as an extensive crop on outlying fields, and perhaps also a sweet cassava as a preferred weaning food in home gardens. Cassava grown as a second crop

during the minor rainy season, after or in relay with the main cash crop, can be a very important way to intensify farming systems. Cassava then either replaces a less productive minor crop, such as beans or vegetables, or is simply added to the rotation which previously consisted of only one crop annually.
These different scenarios for cassava emphasise very strongly the crop's extremely diverse adaptability to different land use intensities. Although cassava's role may vary considerably according to the niche it occupies in different farming systems, within its climatic limits cassava is nearly always a feature of the system.
Other factors explaining the role and distribution of cassava
So far, only factors that directly affect land use and crop production have been considered. Whether farmers will actually make a choice for cassava will also depend on the demand for cassava products, and thus on its relative profitability. Urbanisation, the growth of a specialised trader class and the development of a road network are strong factors determining demand for cassava, as indicate the recent developments around urban centers such as Abidjan, Lagos, Kinshasa and Yaoundé.
Cassava processing. Paradoxically, cassava's relatively low field labour requirements are not matched by those for processing. Both require about the same amount of labour under traditional techniques; however processing requires a unique concentration of labour in time. Processing is essential because of the crop's perishability; very little cassava is consumed as a fresh product. Traditional processing is nearly always a woman's job. The opportunity costs of labour, certainly for women, are often a function of timing. The processing costs of large quantities of cassava may therefore become prohibitive if it places greater demands on female labour. Specialisation in cassava production, processing and marketing by different rural and urban groups could then emerge.
New technology to raise labour productivities emerges where cassava as a market crop forms the key to agricultural growth (Ikpi et al., 1986). However, the introduction of appropriate technology may be delayed, particularly if price fluctuations and economic instability induce farmers to produce a marketable crop at short notice, and may endanger consumers' health through insufficient processing, as shown by Rosling (1987). Similarly, in cases of rapidly growing urban demand or sudden shortages, mechanisms to replace or supplement household labour may not yet be in place, and this could seriously affect the quality of processing (Tylleskär et al., 1991). If cassava is grown as a food reserve crop, and in particular if women are burdened with various other activities, inadequate processing seems less frequent, though it is of course not excluded.
The demand for cassava. The determinants of the urban and rural demand for processed cassava are related to marketing mechanisms, income elasticity, alternative (non-food) markets and relative prices. Phillips (1983) has suggested that income elasticity for cassava is low but positive and higher in urban areas than in rural centres. Whether consumers always prefer cereals to root crops is questionable, but the demand for products that can be easily transported, processed and stored influence the comparative advantage of cassava as a cash crop. The rate of African urbanisation is creating considerable scope for cassava products that can meet this requirement: products such as 'gari' or 'lafun' in Nigeria are easily transported, stored and prepared.
Apart from its promotion as an anti-locust crop in East Africa in the 1930s, few government policies seem to have singled out cassava vis-à-vis other food crops, an exception being the Nigerian
accelerated food policy of the 1980s. In contrast, maize has benefited from active government interventions in many countries (e.g., Kenya, Zimbabwe, Nigeria) in the area of marketing, prices, supply of (subsidised) fertiliser and improved (hybrid) seeds and agricultural research. Even in the preindependence period, maize was favoured by white settlers and colonial authorities and this may have had a positive effect on its acceptance among small farmers.
Explaining the Distribution of Cassava in Africa
We have attempted to show here, by way of introduction, the breadth of situations within which cassava is produced in Africa. Our goal has been to provide a framework to interpret the descriptive information at our disposal. The general hypothesis put forward here is that cassava plays different roles, depending on the evolutionary trends of those farming systems in which it is found. However, under all scenarios of land use intensification, cassava can, at least theoretically, play a role.
To try to explain the observed distribution of cassava, we have to take into account differences in scale, because the processes which determine cassava's distribution are manifest at different scales. We have noted, for example, that differences in cassava's role can occur within the farm, within villages and along catenas. However, it is not clear at first if and how such patterns would be reflected in the continental distribution of the crop.
To explain cassava's distribution then, we are faced with a problem which is best disaggregated into different scales of analysis. We treat the continental scale, to try to explain the overall distribution of the crop, and then focus on specific regions as case studies, to gain a deeper understanding of the factors governing cassava's distribution within regions and locally.
At the continental level, we hypothesise that the distribution of cassava is independent of specific land use intensities, and merely a function of population density. This is because we are as unable to map land use intensity at this scale as we are to hypothesise the likely role of cassava in specific situations, given the incomplete nature of our theories. Places where our hypothesis does not fit may cast light on regional determinants of cassava's role. From this analysis, we attempt to extrapolate cassava distribution to the year 2000.
A second hypothesis, which we test at a larger scale, is that the importance of cassava will vary in accordance with the stage of intensification reached by local farming systems, by accessibility and proximity to urban areas, as well as by local preferences, cultural factors, and labour availability.
These hypotheses reflect processes of change over time. In most cases, long-time series of population, area and production data are non-existent. Testing the hypotheses will therefore mainly take place through a synchronic comparison of areas with similar agroecological conditions and differential population densities. For the second hypothesis, we rely on circumstantial evidence from a limited number of areas, where sufficient information is available for it to be tested.
Population density is of course the dynamic factor that accounts for rapid change in the short term. Population density itself is a proxy for a complex set of dynamic variables, including urbanisation, market integration, infrastructure, and price relations. None of these, however, could be mapped adequately (even the most recent information on road infrastructure appeared to be untrustworthy as a measure of accessibility). We have used absolute population densities in combination with agroecological zones to account for the fact that inherent production potential differs according to differences in biophysical conditions. Our
goal, then, is to examine the strength of this relationship, and from there look at other factors we have indicated above to try to explain anomalies which we identify.
As well as modelling the crop's distribution, our intention is to collate information about cassava which throws light on the processes which determine its present-day distribution. The following chapter therefore treats the crop's diffusion in Africa from the 16th century when it was first introduced. This brings to the fore the complex combinations of circumstances which could
be considered in explaining cassava's distribution. The third and fourth chapters describe and try to explain the crop's current distribution at a continental scale in relatively simplistic terms. However, in the fifth chapter we return to this issue of complexity in more detailed studies of cassava production for three of the major producing countries. That chapter also aims to throw more light on specific areas where cassava's importance is clearly not adequately explained by the distribution of the human population. Our final objective is to orientate further research on this crop whose significance in African development is so great.


CHAPTER 2
THE INTRODUCTION AND DIFFUSION OF CASSAVA IN AFRICA
From the 15th to the 17th centuries, Portuguese explorers established forts, trading stations and settlements on the African coasts and nearby islands. Prior to 1600 they began to introduce cassava at these points. From there it was diffused by Africans, to reach many parts of the interior over the space of two to three hundred years. Cassava is now found in almost all parts of tropical Africa where conditions are suitable for its cultivation. In the course of its spread across the continent, cassava has replaced traditional staples in diverse parts of tropical Africa, and its social and environmental impact is considerable, although still not fully understood. It is therefore of vital importance to our understanding of contemporary African agricultural transformations to explain the reasons for its rapid adoption.
Information about the process and rate of diffusion of cassava comes from historical documents and travelogues. We have tried to summarise our findings in Figure 3. We know, or can speculate, how it was diffused in West and Central Africa, but East Africa is more problematic. This chapter synthétises the available information on diffusion, before describing the crop's present-day distribution in the following sections of the Atlas.
Central Africa
When the Portuguese introduced the crop into the Kingdom of Kongo, near the mouth of the Congo River, it was adopted as part of a process of cultural assimilation, consciously promoted by the King. Portuguese settlers and Africans both began to grow cassava.
One of the first accounts of cassava cultivation in Central Africa comes from Samuel Brun in 1611 (Rössel, 1987). He described flour preparation from bitter cassava roots at Loango. It is probable that cassava had already been cultivated for some years in Loango before this date. In 1620, Bras Correa witnessed cassava cultivation 'in the Brasilian manner' by Portuguese settlers at Mpinda at the mouth of the Congo River (Rössel, 1987).
In 1640, the Dutch explorer Dapper mentioned Luanda (Angola) as the primary production area of cassava, giving as reasons for its cultivation, (1) the infertility of the soil (which was unsuited to other crops), (2) the vicinity of the town as a market and (3) the Portuguese pressure on 'inlanders' (natives) to produce cassava to safeguard food provisions for the town (Rössel, 1987).
Initial Introduction
The Portuguese first brought cassava to Africa in the form of flour, or 'farinha'. The Tupinamba Indians of eastern Brazil had taught them techniques of manioc preparation and production, and they had developed a liking for the various processed forms (Ross, 1975). Cassava flour was used as a provision for ships plying between Africa, Europe and Brazil (ibid.). The first mention of cassava cultivation in Africa dates back to 1558 (Mauny, 1953; Pasch, 1980; Silvestre and Arraudeau, 1983). At first, it was cultivated with the sole purpose of provisioning slave ships, until about 1600. Ross (1975) and Jones (1959) posit that multiple, and more-or-less simultaneous introductions took place at Portuguese trading stations: Fernando Po (Bioko in Equatorial Guinea), the islands of Sâo Tomé and Principe, Sierra Leone, and on the Angolan coast between Luanda and the mouth of the Congo River.
Our knowledge of the diffusion of cassava in the interior during the next 250 years is extremely sparse. From the writings of European explorers who penetrated Central Africa in the late 19th century we see that cassava had by then been successfully incorporated into many farming systems (Jones, 1959).
Cassava spread through Africa by a number of mechanisms. The most important appear to have been initial contacts with the Portuguese-Brazilian culture, through which the crop gained a foothold, by river and possibly overland trade, and by mass migration. In the late 19th and 20th centuries, colonial administrators encouraged its diffusion and increased cultivation. Cassava's botanical characteristics, such as its capacity to survive and merge in the surrounding bush vegetation and the viability of its cuttings, must have greatly facilitated this spread, as must its tolerance of long periods of neglect that arise through civil unrest. It is also interesting to note that the consumption of cassava leaves, in frequent rather than sporadic form, was probably an African invention (Jones, 1957).
In 1687, Cavazzi mentions cassava as the food for both poor and rich in the Kongo Kingdom (although formerly millets and sorghum were preferred to cassava). In 1704, Lucques notes that maize had been replaced by cassava as the primary staple crop. By the middle of the 18th century, cassava was the principal food crop among the Kakongo living north of the mouth of the Congo River, and, in 1787, in the Kongo Kingdom and in Loango (Rössel, 1987).
Early dissemination of cassava to inland areas, at least in precolonial Congo, was carried out solely by Africans. Europeans entered the interior only a long period afterwards (the first was Stanley, in 1877), since the Congo River could not be entered from the sea (Harms, 1981).
It is assumed that cassava initially expanded throughout the territories of the western groups of the central Bantu through trade (Murdoch, 1959, p. 259). It is likely that cassava was transported from the mouth of the Congo in a south-eastern direction, following long-distance trade routes. Its spread was probably very slow. The Lamba, living in what is now the extreme south-east of Zaire, at the end of the trade route from Bié and Silva Porto (Nova Lisboa, Angola), knew cassava in 1852 (Pasch, 1980). Wood (1985) notes that cassava was introduced to the upper Zambezi only in the 1830s by Mbunda migrants from north-east Angola, where it was already known in the early 17th century.
Pasch (1980) concludes, from linguistic studies based on the similarity of local names for cassava on the trade routes, that several of these routes accounted for the spread of the crop. The first route extended from Angola to Mozambique, while another route led probably from central Zaire to northern Zimbabwe. A third route connected the Lozi (on the borders of present-day Zimbabwe) to the Tonga in Zambia, as is indicated for example by the fact that the term 'mwanja' (cassava) has been adapted from Lozi in Tonga. Dates of diffusion are hard to ascertain by using linguistic evidence such as this.

> 'y. ."3
O
•o c BS
w
E
M)
E
10

In contrast, the spread of cassava towards the north-east, along the Congo and its tributaries, seems to have been much faster. Riverine trade has been an obvious mechanism, but what were the reasons for its adoption? Jones (1957) hypothesises that cassava was able to fill an important niche in humid forest agriculture, where few crops were properly adapted to the environment. He attributed this situation to the recency of occupation of much of the forest by Bantu peoples, who originated in savanna areas, and who lacked a well-adapted staple for the rain-forest. In addition, he noted that many of the peoples of the Congo Basin were accustomed to the cultivation of bananas, a crop which required similar cultural practices, had similar harvest periods and required similar processing techniques to cassava. However, this only holds for those ethnic groups that had already developed some form of semi-sedentary shifting cultivation, and not for hunters and gatherers.
Cassava seems to have replaced millet, yam and plantain as the principal staple in most areas along the Congo River, resulting in a boost of trade in agricultural products. In 1698, cassava was already the staple food at the Stanley (Malebo) Pool, near Kinshasa. From there, it spread upriver and inland. Harms (1981) quotes as reasons for its introduction, (1) high caloric production per unit area and (2) resistance to spoilage once processed. Cassava consumption was widespread amongst the river people. Cassava was especially suited to take along on trips, presumably in processed form such as 'chikwangue', and constituted a balanced diet in combination with fish (Harms, 1979).
The trade in cassava rapidly took on huge proportions, since the river people did not produce sufficient cassava for their own consumption. At the end of the 19th century, one observer measured a daily shipment of 40 tons/day along the Alima River in the present-day Congo republic. Others measured 150 tons/week and 14-17 tons/day. Some tribes specialised in the trade of cassava and founded markets along the rivers. Malebo Pool was a regional centre for the trade, cassava being transported from a radius of 250 km (and sometimes more) around this area (Harms, 1979 and 1981).
Evidence from 19th century Francophone explorers in Central African supports the hypothesis of riverine diffusion. Prioul (1957), in a review of the literature on the Central African Republic, cites the riverine relations of the Oubangui as hastening the spread of cassava. By the end of the 19th century, it was well established amongst the Oubangui, Oudda, N'dris and Gbaya (Nana Membere). There are indications that, in the 19th century, north of Bangui and in the savannas, cassava may have been temporarily superseded as the principal contemporary staple by bananas and, in the savanna, by cereals. However, during the present century, both cassava and maize have come to dominate agriculture in northern Congo (republic) and Central African Republic, replacing both bananas and traditional cereals such as bullrush millet (Fresco, 1984; Miracle, 1967).
Cassava was also introduced in Francophone Africa along coastal Cameroon, Equatorial Guinea and Gabon. Here, too, it spread along fluvial arteries, particularly along the Ogooué River to the interior of Gabon (Mouton, 1949). From the Congo, it diffused to the eastern parts of these territories along the Sangha River, as far as Yokadouma in Cameroon during the 19th century.
Jones suggests that the diffusion of cassava in the interior of Cameroon, Gabon and Equatorial Guinea has occurred only during the 20th century (Jones, 1959, p. 68-69). More recent evidence allows us to modify this picture. It is true that, in early sources of 1640, cassava was not mentioned as a food crop in the Estuaire (hinterland of Libreville) and, in 1682, it is not referred to as being in Cap Lopez, but it is very probable that cassava became more important after 1760 in Gabon, when the slave trade began to
flourish. Eventually, it became the principal food crop in the Estuaire in 1865, in Moyen-Ogooué (south of Libreville) and among the Fang. It had certainly become a widely cultivated crop in the region of Franceville in 1875. However, in some inland areas, such as Ogooué-Maritime and N'Gounié, it was seldom found (Rössel, 1987).
In 1850, cassava was noted by Barth (a German traveller) in north Cameroon among the Fulani, who were probably responsible for the spread of the crop in that area. Most names for cassava in surrounding languages are related to the Fulani or Fulfulde name 'mbai' (Rössel, 1987).
We may conclude that cassava must have spread by river throughout much of Central Africa during the 18th and 19th centuries. It was present on the western shores of Lakes Nyasa and Tanganyika in the second half of the 19th century when Europeans first explored the area. In some areas, more widespread diffusion to the interfluves appears to have been a slower process, being dependent upon trade and hindered by political relations and possibly warfare. Prior to the imposition of European administrations, migration was probably the main means of diffusion of cassava across watersheds. Both Wood (1985) and Prioul (1957) mention its introduction to new areas through migration. Prioul also underlines cassava's importance in areas subject to belligerent incursions in the Central African Republic: marauders could do far less damage to cassava tubers than they could to cereal crops. More recent recurrences of this situation are the civil wars of Zaire in the early 1960s (Fresco, 1986) and Mozambique in the 1980s, where cassava often became the sole food source as a result of the disruption of farming activities by war.
West Africa
Cassava was introduced at a number of points along the West African coast during the 17th century, from the Gambia River to present-day Nigeria. Portuguese forts, trading posts and settlements were founded on the mainland and, by the end of the 17th century, cassava was present at most of these places.
Unlike Central Africa, the diffusion of cassava in West Africa was universally slow, and most of the crop's spread took place during the late 19th and 20th centuries. The principal reason was the human geography and political organisation of the West African kingdoms which differed markedly from those of Central Africa. The humid coastal belt was essentially uninhabited, and formed a peripheral zone about inland capitals (Jones, 1959). Whilst cassava may have spread inland along the Gambia River, it did not penetrate northwards along the Niger from the Portuguese station at Warri until very late. Jones notes that innovations tended to spread from the northern capitals to their southern peripheries rather than vice versa, and most West African peoples had no crops similar to cassava nor knowledge of the necessary processing techniques (ibid., p. 77-78).
Notwithstanding this, we find occasional references to the adoption of cassava in various parts of West Africa prior to the 19th century. Although cassava seems to have been absent along the Gold Coast (Ghana) at the beginning of the 18th century (ibid., citing Bosman), it was widely cultivated around Accra in 1785 (Wigboldus, 1984). We have insufficient information about the Guineas, Liberia and Sierra Leone to piece together the crop's diffusion in the westernmost part of the continent.
More information is available about the spread of cassava in Nigeria and Benin. The growth of cassava production and its diffusion in these countries are attributed to the catalytic effect of freed Brazilian slaves who began to return to the area around 1800 (Agboola, 1968; Jones, 1959). In some areas, however, cassava
11

was already cultivated before returned slaves had visited the area. Agboola (1968) hypothesised the introduction of cassava in Benin and Nigeria in either the 17th or 18th century. At Ouidah, in present-day Benin, the Portuguese maintained a factory staffed by Brazilians. This was the most likely source of cassava introduced to south-west Nigeria, probably with the original intention of supplying slave ships with farinha. Igbo migration was an important diffusion mechanism in the eastern states of Nigeria. The Igbo must have been in contact with cassava since the 17th century after its introduction at Owerri (Agboola, 1979; Jones, 1959).
The spread of cassava from coastal to inland areas remains obscure. Cassava was at first used as a medicine in Benin, as a cure for tuberculosis (Wigboldus, 1984). Pasch (1980) found that from Ivory Coast (Côte d'Ivoire) to the Niger River, the names for cassava resembled each other closely, pointing to a common origin. She attributed great importance to the Mande peoples' diffusion of cassava in West Africa. The Bambara were probably very influential in cassava diffusion under the Mande. One hypothesis is that the Mande took cassava from the coast to the east. In northerly areas of West Africa (among the Hausa, for example), Arabic names for cassava are more common, suggesting a route through these tribes (Pasch, 1980).
Slaves who returned from Brazil from the late 18th century onwards were certainly also instrumental in the spread of cassava. They became an urban class, at first controlling the slave trade, who created a local demand for cassava. Jones (1959, p. 77-78) thought that, at the same time, they introduced the necessary processing techniques to detoxify bitter roots, although further investigation is required to determine whether processing techniques were totally unknown before the slaves' arrival. The cassava product 'gari' was most likely introduced by slaves. At first, Africans would not have been able to distinguish the bitter from sweet varieties of the new crop. Without the means to process bitter roots, it is easy to understand their unwillingness to adopt a potentially lethal new crop (ibid.).
The consumption habits and preferences of Brazilians and freed slaves and their knowledge of cultivation and processing, led to the spread of cassava production through a neighbourhood effect. Urban lifestyles and the growth of a working class in the Lagos area increased demand, and local peoples emulated the habits of the Afro-Brazilians. By mid-19th century, Badagry, Abeokuta, Lagos and Ijebu were centres of production. By 1860, the crop had reached Ibadan, and the area of production slowly coalesced. Nevertheless, expansion was slow, because of fear of poisoning, and cassava remained a cash crop for the urban markets of Lagos in most areas where it was grown (Agboola, 1968).
Early travel accounts have shown that cassava was known in northern Nigeria in 1850. In 1825, it had not been recorded by early European travellers, suggesting the entrance of cassava in about 1830-1840 (J. S. Wigboldus, 1990, personal communication). It may well be that cassava reached northern Nigeria via Central Africa, through the migrations of the Fulani, rather than from coastal West Africa. In any case, cassava was unimportant north of the Niger-Benue confluence until after World War I, and was still only of limited importance in Oyo State in 1951-1952 (Jones, 1959).
As in many countries outside Central Africa, in Nigeria, cassava spread most rapidly during the 20th century. To a large extent, this was a result of governmental encouragement, because of the crop's resistance to locust attacks and drought and its consequent value as a famine reserve. In Nigeria, the construction of north-to-south railway arteries and labour migration to the coast accelerated diffusion and increased the inland peoples' exposure to the crop (Agboola, 1979). The easy incorporation of cassava into
Nigerian farming systems can be attributed to its low labour requirements during growth and the flexibility of its harvest period. Although Jones thought soil degradation to be a reason favouring cassava's adoption, Agboola maintains that there are no sources pointing to depletion of soil resources as a historical reason for cassava's diffusion in Nigeria. Where cassava's increasing importance was associated with declining fallow lengths, the latter were a result of the expansion of tree crops from the 1920s onwards (Agboola, 1979; Jones, 1959, p. 79). The way in which cassava replaced and became more important than yam (Diehl, 1981) confirms that labour constraints and, to a lesser extent, market demand have been more important contemporary factors in the diffusion of cassava in Nigeria.
In West Africa as a whole, colonial governments played a major role in encouraging cassava cultivation during the 20th century, particularly in the savanna areas (Jones, 1959).
East Africa
Information on East Africa is the most speculative, and there are no concrete details on the date of cassava's introduction. We must assume that, as in West and Central Africa, it was introduced at the Portuguese trading stations: Moçambique Island, Benguela, Sofala, Kilwa, Zanzibar, Pemba and Mombasa, during the 17th or 18th centuries. In Figure 3 we have assumed the latter period. Pasch (1980) reports that cassava was brought to the country of South Africa as early as the 16th century, probably from Mozambique, suggesting a long presence in the area, but this is not commonly accepted by inlanders. Alpers (1975) claims that the first introduction in Mozambique was from Moçambique Island in 1768, although the crop could have been introduced from other areas in mainland Mozambique. Cassava was probably introduced to Madagascar during the 18th century, prior to 1750, according to Kent (1969). This author even proposed a 16th-century introduction to the island (ibid.). It appears to have spread inland rapidly, being reported at Imerina near Fianarantsoa in 1785 (Raison, 1972).
In Mozambique, Portuguese colonists and their African descendants were probably responsible for diffusion in the lower Zambezi Valley, but we know from Wood (1985) that cassava reached the upper Zambezi from Angola rather than Mozambique. Similarly, cassava reached Lake Tanganyika from the west, rather than the east (see above, and Morgan, 1973).
Jones (1959, p. 83) underlines the importance of the environmental and cultural barriers presented by the East African plains and their warlike and nomadic peoples in preventing cassava's diffusion. In view of the successful introduction in Central Africa it seems therefore less likely that cassava diffused along the eastern shores of Lakes Malawi and Tanganyika to the highlands of Rwanda and Burundi. Rather, the crop may have come from the west or may, simultaneously, have spread to the highlands after being introduced in the Lake Victoria region by Arab traders, as Jones (1959) and Langlands (1966) believe. In any case, cassava was reported widely throughout the Great Lakes Region by numerous travellers in the mid-19th century (Jones, 1959; Langlands, 1966). In 1883, it was introduced to southern Sudan by the Iddis peoples (Langlands, 1966).
The most detailed information on diffusion in East Africa is that of Langlands for Uganda (ibid.). It was first recorded in Buganda, north of Lake Victoria, in 1862. After its initial introduction, cassava spread only slowly. It seems that bananas were preferred as a staple. In the first half of the 20th century, the role of the colonial administrators was central to the spread of cassava in western and northern Uganda, particularly as a famine reserve crop (ibid.).
12

In Rwanda, Kamanzi (1983) attributes the introduction of cassava in the 1930s to the colonial administration. However, it is difficult to believe that it did not arrive from the west, if not the south, during the 19th century. Meyer (1984, p. 75) described cassava cultivation in Burundi in his journeys around 1911. He noted that sweet varieties were important, and that it was consumed in a number of different forms. This suggests considerable familiarity—inconsistent with Kamanzi's hypothesis of more recent introduction.
Similarly, we cannot exclude the possibility that cassava was already known in some parts of East Africa prior to the 20th century, without becoming an important staple crop. The reasons have to be explored, but the need for another staple may have been less pressing, or processing techniques may have been unknown. One example is among the southern Kikuyu in Kenya. Cassava was present before 1903, but was only used for medicinal or magical purposes. In coastal Kenya, in 1911, it was reported that the primary local diet consisted of 'palm wine, cassava and mangoes, either alone or in combination', during a drought (Herlehy, 1984). In this latter case, whilst it is not clear whether cassava was a staple under normal conditions, its usefulness as a famine reserve was clearly recognised by local people.
From Mozambique, cassava was taken southward to its climatic limit along the eastern coast of southern Africa, also during the 19th century. Whilst relatively unimportant, it is today found in north-east Transvaal and northern Zululand.
Colonial and Post-Independence Diffusion
Colonial governments played an essential role in prolonging and intensifying the diffusion of the crop throughout West and East Africa and many parts of Central Africa during the first half of this century. This period was probably the most important in extending the area of the crop's cultivation beyond the humid tropics. This encouragement of cassava cultivation by colonial governments may often have taken place in a manner insensitive to the applicability of cassava to local farming systems and food habits. Moreover, many colonial governments displayed an ambivalent attitude towards cassava. Whilst it was introduced as an anti-famine and anti-locust crop, cassava was also thought to promote laziness, soil depletion and malnutrition (cf. Jones, 1957 and 1959).
Post-independence diffusion of the crop in Africa has primarily been the result of local processes of migration and agricultural change. There is ample evidence of the willingness of African farmers to experiment with and search for new crops and varieties. Cassava's special characteristics make it well adapted to farmers' risk aversion strategies and allow it to be grown under a great diversity of circumstances and changing economic conditions. For example, in central Zaire, a comparison of data from colonial reports with present varieties (as acknowledged by farmers) suggests that an increasing number of varieties is grown and that the names of many of these point to recent introductions from neighbouring areas or beyond (Fresco, 1986, p. 153).
Conclusion and Discussion
Cassava's diffusion in Africa can be considered a fortuitous success story that highlights the flexibility and adaptability of African farming systems. Whilst the introduction of the crop at numerous points along the coast by the Portuguese formed the starting point, its acceptance, which governed the rate of diffusion, depended on cassava's particular characteristics, on ecological conditions, socio-cultural factors and regional political economies. Riverine trade and mass migration were probably the most
important diffusion mechanisms, prior to the 20th century. Its diffusion was very uneven in space.
Prior to European intervention, cassava was adopted voluntarily by Africans (Jones, 1957) for its particular characteristics, which are:
1. ease of cultivation in shifting systems;
2. flexible harvest;
3. resistance to locust attacks; and
4. resistance to drought.
Adoption was also dependent upon factors related to post-harvest processing and marketing, that is:
1. adopters possessed similar knowledge or received knowledge of the necessary processing techniques (a limiting factor in West and East Africa for a long time);
2. the existence of a market for the crop, amongst urban populations of Brazilian or Portuguese origin; and
3. increased exposure to cassava as a cheap food source amongst migrant labourers, and amongst those living near points of introduction and markets.
Our understanding of many of the details of the introduction of cassava in Africa remains limited. Intriguing questions relate to the emergence of the numerous cassava varieties that are found in farmers' fields today and to the way the crop was gradually incorporated into existing farming systems. With respect to the latter, we have no information on cultivation practices such as planting densities and intercropping (it is most likely that most cassava was intercropped). Some of the evidence for Central and West Africa suggests that the crop may have been destined for the urban market at a very early stage. This could modify the classical image, held in many quarters, of cassava as a traditional food staple of Africa, and even the assertion that cassava is a 'female crop'. Unfortunately, it is not possible to relate the spread of cassava to changes in population density or to historic changes in gender roles across the continent.
Cassava's Significance for the Future
The increased spread of cassava during and after the colonial period has been accompanied by profound social, economic and political changes. As a result, and because of the crop's tolerance of stresses and flexible management and harvest characteristics, cassava is now intimately bound up in the complex human and environmental systems of tropical Africa.
Table 1 summarises trends in population growth, production, area and yield in the main cassava-producing countries. The source for these data are the FAO production yearbooks, and it should be noted that the most recent data are not always consistent with local census statistics. The latter have been used elsewhere in the Atlas (see Chapters 3 and 4, and Appendices I and III), to describe the spatial distribution of cassava and population within countries. The FAO data, by contrast, are the best source of information we have on trends in cassava for Africa as a whole.
In the light of current rates of population growth, the situation is far from static. In the period between 1963 and 1986, cassava production in sub-Saharan Africa increased by an estimated 77%, as compared with a 96% population increase, while cassava area grew by 36% (De Bruijn and Fresco, 1989). In other words, yield and area increase have kept more or less the same pace, but there
13

has been a slight relative decline in cassava production relative to population increase.
Overall trends mask marked regional differences, both between and within countries. What follows is an attempt to
examine cassava's distribution within countries. The following chapter describes the first stage in this process, the production of a detailed contemporary map of cassava distribution in Africa.
Table 1. Area (x 1000 ha), yield (kg/ha) and production (x 1000 MT) of cassava and population growth, for selected African countries, for the periods 1961/65,1974/76 and 1984/86. CAR = Central African Republic; — = unknown.
Croup/ Countries
Group 1
CAR
Congo
Mozambique
Zaire
Group 2
Angola
Benin
Burundi
Cameroon
Comoros
Area
204
134
430
614
111
83
75
78
20
Equatorial Guinea 13
Gabon
Ghana
Ivory Coast
Nigeria
Rwanda
Tanzania
Togo
Uganda
Group 3
Burkina Faso
Cape Verde
Chad
Gambia
Guinea
Kenya
Liberia
Madagascar
Malawi
Mali
Mauritius
Niger
Réunion
53
150
197
832
24
1.559
95
267
6
—
10
1
60
90
63
165
8
11
—
17
—
Säo Tomé e Principe —
Senegal
Seychelles
Sierra Leone
Somalia
Sudan
Zambia
Zimbabwe
36
—
20
2
240
46
—
SOURCES: De Bruijn and Fn
1961/65
Yield
5,098
5,597
4,953
12,510
11,528
5,888
11,798
5,659
2,929
3,000
2,316
7,750
2.454
9,377
6,884
1,983
6,027
3,930
5.500
5,000
4,327
5,376
7,233
6,696
4,006
6,091
18,447
14,815
9,047
7,454
9,583
10,000
4,244
5,987
2,920
9,943
5,000
3,152
—
esco, 1989;
Production
1,040
750
2,130
'7,676
1,324
490
887
441
58
40
122
1,165
484
7,800
164
3,090
571
1,051
31
1
42
6
434
600
252
1,005
140
160
—
126
5
2
152
—
59
17
1,200
145
—
Area
293
96
533
1,687
121
82
71
194
26
20
44
253
173
1,043
32
877
21
353
6
—
46
3
87
71
73
204
10
5
—
29
—
—
32
—
17
3
38
53
16
Period
1974/76
Yield
2,959
5,657
4,594
6,956
14,093
6,630
12,689
4,348
3,124
2,425
2,585
6,999
3,734
10,032
12,255
4,802
20,641
3,019
5.882
17,165
3,331
3,274
7,000
8,090
3,541
6,490
5,807
7,741
16,467
6,508
9,756
10,506
3,101
6,250
4,992
10,897
2,804
3,132
3,020
Production
866
540
2,450
11,734
1,710
544
897
842
80
48
115
1,773
648
10,467
390
4.210
440
1,067
33
3
154
9
610
572
257
1,321
60
40
—
191
4
3
99
—
83
28
107
166
49
Area
180
94
563
2,167
130
103
45
410
31
25
42
359
257
1,250
42
450
52
462
5
0.3
67
2
71
49
87
358
36
8
—
21
—
—
5
—
31
3
46
61
20
FAO Production Yearbooks 1972, 1982 and 1986.
1984/86
Yield
3,898
6,478
5,739
7,093
15,051
6,855
11,489
1,634
2,918
2,164
5,928
10,174
5,487
10,666
7,747
12,296
14,711
8,108
6,571
8,220
4,348
3,000
6.998
8,000
3,683
6,145
5,957
9,043
14,667
9,081
10,012
11,482
2,641
5,000
3,477
10,883
2.756
3,478
4,165
Production
702
610
3,233
15,369
1,957
706
517
670
92
55
250
3,617
1,410
13,333
327
5.533
453
3,891
32
3
292
6
499
393
322
2,203
217
75
—
190
5
4
14
—
108
37
123
213
82
Pen
(1
Area
-12
-30
31
253
17
24
-40
426
55
92
-21
139
30
50
75
-71
-45
73
-17
—
570
100
18
-46
38
117
350
-27
—
24
—
—
-86
—
55
50
-81
33
—
rentage of change 961/65-1984/86)
Yield
-24
16
16
-43
31
16
-3
-71
-0.4
-28
156
31
124
14
13
520
144
106
19
64
0.5
-44
-3
19
-8
1
-68
-39
62
22
4
15
-38
-17
19
10
-45
10
—
Production
-33
-19
52
100
48
44
-42
52
59
38
105
210
191
71
99
79
-21
270
3
200
595
0
15
-35
28
119
55
-53
—
51
0
100
-91
—
83
118
-89
47
—
Population growth
1963-1985 (%)
95
116
108
100
76
79
53
%
111
50
151
85
168
106
106
102
89
115
49
50
58
102
80
133
111
74
86
86
46
94
43
59
94
69
59
95
69
90
120
Ratio of production
change/ population
growth (%)
-35
-16
48
100
63
56
-79
54
53
76
70
247
114
67
93
78
-24
235
6
400
1,026
0
19
-26
15
161
64
-62
54
0
170
-97
^_
141
124
-129
52
—
14

CHAPTER 3
CURRENT DISTRIBUTION OF CASSAVA IN AFRICA
Data Sources
Agricultural statistics and production data for the cassava crop in Africa were available from two main sources: the FAO statistics library at the FAO headquarters, Rome, and the Economics Section of the Cassava Program in the Centro Internacional de Agricultura Tropical (CIAT), Colombia. Information from the former was collected in a single trip. CIAT had collected data for a number of years, by way of visits to African countries by CIAT Cassava Program scientists. These two main sources were supplemented with additional information held by CIAT's Agroecological Studies Unit. Together, they provided data for all the cassava-growing countries in Africa. Appendix I lists the source or sources used for each country.
For the country studies (Chapter 5), an extensive literature search of pre-independence data was carried out at the Agricultural University of Wageningen, the African Library of Brussels, the African Studies Centre in Leiden, the British Museum and the Food Policy Research Institute at Stanford University. The following sections concentrate on the contemporary statistical data used to create the cassava map.
Data Quality
Despite the wide coverage of the data, content and quality varied enormously. Figure 4 indicates aspects of data quality for each country. The data were collected between 1961 and 1987, and the level of aggregation went from small administrative areas (e.g., districts) to national totals.
To a certain extent, the pattern of distribution of cassava within each country in the distribution map (Map 1) may be a reflection of the nature of the level of detail of available data. Countries showing definite concentrations of cassava production, such as Tanzania and Madagascar, reflect detailed data for small administrative units, whereas in countries with poorly detailed information for large areas, especially Angola and Zaire, dots were dispersed more evenly.
Reliability of the data itself could not be assessed without details of collection methods and sampling frameworks. The most recent are not necessarily the most reliable.
The following guidelines were used in data selection and map construction:
Least detailed
Intermediate
Pre Post 1980 1980
t
i
i
• V.V.'
Most detailed teSl
Figure 4. Quality of information, by country, used in the construction of the cassava distribution map (Map 1 ).
15

1. Degree of consistency was checked with other sources.
2. The most recent consistent data were used.
3. The most disaggregated data were used.
4. Where the most recent data were not disaggregated, they were used as the total figure and proportioned according to the most recent consistent disaggregated data, assuming that there were no major changes in production trends since publication of the disaggregated data.
5. Sources and assumptions were documented (Appendix I).
6. The most recent available administrative division maps were obtained, to map the most detailed data accurately. Because of administrative changes in many African countries, it was necessary to check that administrative regions were the same as those associated with the cassava data.
7. The common nomenclature for cassava in different countries had to be checked to avoid misinterpretation of data.
8. Data for total area in cassava were used where available, rather than production data. Such data are generally more reliable than those for tons harvested, and permit direct comparisons of the relative importance of a crop as a form of land use amongst different places. In one or two cases, area had to be estimated from yield and production figures (see Appendix I). Only a small number of sources differentiated between monocropped and intercropped cassava, and all the data have been treated by us as intercropped in the analysis presented in the following chapters.
Map Construction
As the map was to be at a generalised continental scale and indicating the cassava-growing regions in Africa, a scale of 1: 5,000,000 was chosen. The data could not be mapped more accurately at any larger scale. The value chosen to be represented by each dot was 1000 ha. This was the optimum for displaying neatly both concentrated and dispersed cassava production, and was also convenient for data handling.
Using the Physical and Political Map of Africa (American Geographical Society of New York, 1969) as a topographical base, points were allocated within the smallest political division, according to the level of organisation of the data, by examining topography and the distribution of human settlements. Climatic and soils information was not used in the dot placement stage, in order to avoid bias for the subsequent soils and climatic interpretations described in the chapter which follows. The distribution map was digitised and replotted at 1: 5,000,000 to verify placement of dots. Geographic coordinates were stored for each 1000 ha cassava dot. These were later used to generate a raster image of the map in the IDRISI package (Eastman, 1989).
Table 2 gives country totals for cassava-growing areas as derived from the IDRISI computer map. Map 1 presents the distribution of cassava. Here dots, which are closely spaced together, have been agglomerated to enable the reader to interpret the map more easily.
Cassava Distribution
A visual inspection of Map 1 provides some striking information about cassava's distribution in Africa. It is not a random
Table 2. Cassava-growing areas (ha) in Africa.
Country
Angola
Benin
Burundi
Burkina Faso
Cameroon
Central African Republic
Chad
Comores
Congo
Equatorial Guinea
Gabon
Gambia
Ghana
Guinea
Guinea-Bissau
Ivory Coast
Kenya
Liberia
Madagascar
Malawi
Mozambique
Niger
Nigeria
Rwanda
Senegal
Sierra Leone
Sudan
Tanzania
Togo
Uganda
Zaire
Zambia
Area (000 ha)
626
113
302
1
383
152
23
5
160
25
42
2
380
79
6
230
68
43
240
50
440
34
415
132
11
30
46
1306
49
422
2101
161
Percentage of total cassava area
7.84
1.42
3.79
0.01
4.80
1.91
0.29
0.06
2.00
0.31
0.53
0.03
4.76
0.99
0.08
2.88
0.85
0.54
3.01
0.62
5.52
0.43
5.20
1.65
0.14
0.38
0.58
16.37
0.61
5.29
26.33
2.02
Date of census
1964/6
1979
1981
1984
1983
1985
1982
1983
1972/3
1984
1983
1984
1980
1975
1960/1
1984
1979
1984
1979
1981
1970
1982
1975
1984
1984
1984
1985
1986
1985
1984
1985
1970
SOURCES: See Appendix I.
distribution, nor is it truly continental. It is sharply bounded, both north and south of the equator. In the northern hemisphere, cassava is grown as far north as Dakar on the west coast, and 15° N is the approximate limit across the Sahel. However, inland from the coast, there is a notable break in the distribution. The crop disappears somewhat abruptly between 8° and 10° north, only to reappear in central Mali, southern Niger, and southern Chad. The same discontinuity can be noted in southern Sudan. In the north-east, the limits of the crop's range are sharply defined in eastern Uganda, western Kenya and, passing south of the equator, northern Tanzania. (There is also cassava in south-west Ethiopia, although we had no data to assess how much. Probably it forms a continuation of the southern Sudanian belt shown on the map). Along the Kenyan coast, cassava spreads northwards again to southern Somalia. Its northern limit on the east coast is about 5° S of the equator.
The southern limit of cassava is similar to the northern one in the west of the continent, approximately 15° S. No data were available for Namibia, Botswana or Zimbabwe, hence it was not possible to accurately fix the southern limit in these countries. Cassava is not thought to be important in any of them, and the distribution of the crop in Angola, and Zambia supports this view. In the east, cassava reaches its farthest poleward limit on the continent, being grown as far south as the Mozambique-South Africa border. Indeed, cassava is known to be grown in the north-east of South Africa (Cassava Today, 1984); however, no data were available to suggest the extent of cultivation.
16

Across the area in which cassava is found, production of the crop is not evenly spread. It is strongly clustered, although in some areas a more even distribution is apparent. Amongst the most notable concentrations are the following:
1. The coastal belt of West Africa, particularly from the Ivory Coast to Cameroon.
2. Central Zaire, from the mouth of the Congo River to Lake Tanganyika.
3. The Great Lakes Region, with very strong concentrations in Rwanda and Burundi, eastern Kivu in Zaire, southern Uganda and northern Tanzania.
4. Morogoro, Dar es Salaam and Mtwara in eastern Tanzania and north-east Mozambique.
Other important, but less concentrated, regions are the Central African Republic, southern Zaire, southern Mozambique and central Madagascar.
The aim of the following chapters is to examine the two factors which have the strongest influence in creating the pattern of distribution which we have described here and which can be seen in greater detail in Map 1. These factors are the natural environment and the human population. In the following chapter, we describe them individually, and then in combination to identify the nature of the influence they exert on cassava's contemporary distribution in Africa.
17


CHAPTER 4
THE RELATIONSHIP OF CASSAVA DISTRIBUTION TO ENVIRONMENT AND POPULATION
Cassava's Environmental Requirements
The importance of cassava in Africa is partly a result of the crop's adaptation to diverse environmental conditions. We outline this adaptation here, as an introduction to the relationship between cassava's geographic distribution and the environment. We then introduce a functional classification of cassava environments used by scientists at CIAT. This classification serves as the basis for our examination of cassava distribution.
Cassava is adapted to a broad range of climatic conditions in the tropics. It will grow where average annual temperatures exceed approximately 20 °C. Where water is not limiting, this defines latitudinal limits of about 30° north or south of the equator. In the equatorial Andes, the altitudinal limit for cassava is approximately 2300 m (Cock, 1985).
Cassava is grown where mean annual rainfall ranges from 500 mm to over 3000 mm (ibid.). It is tolerant of six or more months of drought. This is because, as a root crop, it does not experience a critical growth stage and reacts to drought stress by shedding its leaves. These qualities give it its importance where rainfall is sporadic or unpredictable (ibid.). Adaptations to drought and to high rainfall conditions are manifest in varietal differences. Length of dry season governs the presence and severity of incidence of major pests.
Cassava grows under a wide range of edaphic conditions and is notably tolerant of soil acidity and high levels of aluminium saturation. However, it does not tolerate high concentrations of salts or pH levels above 8.0 (ibid.). Cassava is also intolerant of excess soil moisture. Flooding or poor drainage cause root rot, usually by encouraging pathogenic infection. Good root development requires fairly deep, light-textured soils, which also facilitate harvesting the roots. High clay content or the presence of montmorillonite, plinthite or calcite horizons and stony soils all prevent good root development.
The Distribution of Cassava in Relation to Climatic and Edaphic Conditions
Climatic conditions
A cassava-specific climate map for Africa was generated in two stages. Firstly, an all-Africa climate data file was compiled from CIAT's mean monthly climatic database (see CIAT, 1989). This data file had then to be simplified, that is, classified for cassava, to identify the distribution of areas where the climatic conditions defined above are found. The methods used to do this are described in Appendix II.
A cassava-specific climatic classification was designed for Latin America, based on knowledge of cassava's adaptation to environmental conditions, and of factors governing biological stresses, for Latin America (Carter, 1986 and 1987). We used the same classification to examine African cassava, as there were no reasons to suggest that adaptation of African cassava differed from that of Latin American cassava. The classification schema is shown in Figure 5. Climates are subdivided, in a hierarchical fashion, according to:
1. mean growing season temperatures ( > or < 22 °C);
2. length of dry season (months with < 60 mm precipitation, grouped in threes);
3. mean daily temperature ranges during the growing season ( < or > 10 °C); and
4. seasonality (mean monthly range of temperatures < or > 5 °C).
Map 2 represents the geographic distribution of the climatic classes described in Figure 5.
Edaphic conditions
The FAO Soil Map for Africa (FAO/UNESCO, 1977; UNEP/GEMS/GRID, 1988) was used as a base map to characterise soils. The FAO/UNESCO soils classes were reclassified to simplify the map and allow it to be specifically interpreted for cassava. The new classes represent the types of restrictions presented by each soil, as follows (modified from Carter, 1986 and 1987):
1. Texture finer than silty clay loam (restricted root growth and potential drainage problems).
2. Permanent depth constraints (A and B horizons combined at less than 50 cm deep).
3. Potential depth problems (presence of plinthite).
4. Seasonal flooding or potential drainage problems.
5. Permanent waterlogging and/or salinity.
6. High acidity/low fertility (pH less than 5.5 and CEC less than 10.0 meq/100 g).
7. No restrictions.
8. Presence of calcium carbonate in B or C horizons.
The classes to which FAO soils were assigned are illustrated in Table 3. Only the principal restriction was noted for soils presenting two or more problems, in order to simplify the final soils map, Map 3, which shows the distribution of the eight classes of soil restrictions.
Findings
The cassava, climate and soil restrictions maps (Maps 1-3) were used to assess the distribution of cassava in relation to environmental factors. Possible combinations of climatic and edaphic conditions are shown in Table 4, with the corresponding areas in cassava.
19

Mean grow- Dry season Daily tempe- Seasonality ing season (months with rature range (Koppen) temperature P < 60 mm)
— b —
•*
r— 1
H I
*» o c .
— 2 —
*
i 1 I f> 1 «L
1 I I
' - ^ 2 - ^
3 1 r1 — I— 2
A H 4 1 — 1
r— 1 — £.-•• -
i — 1
*» «_
— 2 —
1 •f
o
1 I
I—2
— 3 2 — I 1
I — 2
— 4 2 1
A
B
C
D
E
F
G
H • 1 • J
K
L
W
M
N
0
P
Q
Lowland humid
Lowland humid (subtropical)
Lowland semi-hot
Lowland semi-hot (subtropical)
Lowland continental
Lowland continental (subtropical)
Lowland semi-arid
Lowland semi-arid (subtropical)
Lowland arid
Highland humid
Highland humid (subtropical)
Highland semi-hot
Highland semi-hot (subtropical)
Highland continental
Highland continental (subtropical)
Highland semi-arid
Highland semi-arid (subtropical)
Highland arid
a > 22 °c b < 22 °c
1 0-3 2 4-6 3 7-9 4 10-12
1 = > 10 °C 1 = Isothermic 2 = < 10 CC 2 = Nonisothermic
Figure 5. Qimatic classification for cassava (adapted from Carter, 1987).
Five climates account for over 82% of the area in cassava: 34% of cassava by area is found in the lowland humid tropical climates, with less than four dry months and low diurnal and seasonal temperature ranges (A in Table 4). Eighteen percent is found in the lowland semi-hot climate, similar to the above but with a four to six-month dry season (C in Table 4). Fourteen percent is found in the lowland continental climate, where the dry season is four to six months but where daily temperature ranges are greater than 10 °C (E in Table 4). About 8% is found in the lowland semi-arid climate, where the dry season is seven to nine months (S in Table 4). About another 8% is found in the humid highland climate, with less than four dry months and mean growing season temperatures below 22 °C (J in Table 4).
Cassava is not evenly distributed amongst the classes at different levels of the classification. Eighty percent of the crop is grown in lowland climates (Table 5) and almost 90% of the total in tropical as opposed to subtropical areas. Over 40% is grown in each of humid and seasonally dry climates, with only 12% in semi-arid regions. We must be careful in making such comparisons, since the total areas of the different climates are dissimilar. Table 5 shows that cassava is clearly not evenly distributed, even when the area of the different climates is taken into account. If we divide the total area of cassava climates (17,506,100 km2) by the total area in cassava (79,920 km2) we arrive at the average proportion of land in the crop: 0.46%. Table 5 shows that in highland climates land use in cassava is 0.62%, almost 50% greater than the average. In humid climates
this figure is even higher, 0.96%. In semi-arid and subtropical climates the proportion of land in cassava is much lower than the overall average (0.12% and 0.2%, respectively).
Table 6 shows the total area covered by combined soil restrictions: depth, drainage, acidity and without restrictions.
Over half (54.4%) the cassava by area is grown where acid soils are the dominant type (Table 6). Ten percent is grown where shallow soils and clays which restrict root development predominate. Just over 4% is grown in areas where poor drainage is likely to be a problem. Only 31 % of the cassava area is found where soils are predominantly free of restrictions.
In areas with depth and drainage problems, cassava is uncommon. It occupies only 0.25% of land compared with the overall average of 0.46%. This is understandable, given the problems for the crop in areas where these soils predominate. In fact, cassava is probably even less common under such conditions. When we assessed soil restrictions from the FAO map we only examined the major soil in each mapping unit, since we could not deal with associated soils and inclusions in our analysis. For those mapping units which present the aforementioned restrictions for cassava, the crop is likely to be preferentially grown on associated soils, inclusions, or areas where the microrelief is more favourable to cassava (Fresco, 1986; Richards, 1985). Where drainage is generally poor, farmers may adapt their cultural practices by mounding or ridging.
20

FAO code
2
5 6
8
9
10
11
12
13
14
15
Restriction class (See text, p. 19)
6
6
3
6
6
7
6
5
7
8
1
Table 3. Major FAO soil units and restriction classes for cassava.
Soil type (FAO)
Ferric Acrisols Orthic Acrisols Plinthic Acrisols
Chromic Cambisols Dystric Cambisols Eutric Cambisols Ferrai ic Cambisols Cleyic Cambisols Humic Cambisols Calcic Cambisols Vertic Cambisols
Podzoluvisols
Rendzinas
Humic Ferralsols Orthic Ferralsols Plinthic Ferralsols Rhodic Ferralsols Xanthic Ferralsols
Gleysols Dystric Gleysols Eutric Gleysols Humic Gleysols Mollic Gleysols Plinthic Gleysols
Haplic Phaeozems
Lithosols
Fluvisols Calcaric Fluvisols Dystric Fluvisols Eutric Fluvisols Thionic Fluvisols
Luvisols Chromic Luvisols Ferric Luvisols Gleyic Luvisols Calcic Luvisols Orthic Luvisols Plinthic Luvisols
22
26
29 30 31 32 33
34 36 37 38 39 40
45
47
48 49 50 51 52
57 59 60 61 62 63 64
7 6 3 7 6
5 5 5 5 5 5
Soil type (FAO)
Dystric Nitosols Eutric Nitosols Humic Nitosols
Dystric Histosols Eutric Histosols
Humic Podzols
Albic Arenosols Cambic Arenosols Ferralic Arenosols Luvic Arenosols
Calcaric Regosols Dystric Regosols Eutric Regosols
Orthic Solonetz
Humic Andosols Mollic Andosols Ochric Andosols Vitric Andosols
Vertisols Chromic Vertisols Pellic Vertisols
Planosols Eutric Planosols Solodic Planosols
Xerosols Haplic Xerosols Calcic Xerosols Luvic Xerosols Gypsic Xerosols
Yermosols Haplic Yermosols Calcic Yermosols Gypsic Yermosols
Solonchaks Gleyic Solonchaks Orthic Solonchaks
FAO code
70 71 72
74 75
80
85 86 87 88
90 91 92
97
99 100 101 102
104 105 106
107 109 112
114 115 116 117 118
119 120 121 124
125 126 128
Restriction class (See text, p. 19)
7 7 7
5 5
6
6 7 6 7
8 7 7
5
7 7 7 7
1 1 1
4 4 5
7 7 8 7 8
7 7 8 8
5 5 5
Table 4. Cassava distribution by environment (climate and soil).
Climate* Soil restrictions Distribution
A
B
C
D
E
F
S
H
J
K
L
W
M
N
Z
P
1
16
—
147
0
57
0
17
0
17
0
—
5
0
1
0
(000 ha) 260
(%) 3.25
2
90
—
99
6
44
2
70
4
36
2
12
3
3
4
8
383
4.79
3
13
—
71
0
54
1
0
2
5
—
0
1
0
0
3
150
1.88
4
16
—
23
0
23
3
13
3
0
0
1
5
3
0
4
94
1.18
5
81
1
65
0
35
3
19
18
5
8
0
12
7
0
6
260
3.25
6
1879
39
680
12
510
92
284
93
172
34
55
49
157
138
13
43
4350
54.43
7
656
0
379
n 421
55
222
62
393
4
78
9
111
32
0
55
2488
31.13
8
1
—
2
—
3
0
1
0
0
—
0
—
0
0
0
0
7
0.09
(000 ha
2752
40
1466
29
1147
156
626
182
628
38
143
71
394
183
18
119
7992
100
) (%)
34.43
0.50
18.34
0.36
14.35
1.95
7.83
2.28
7.86
0.48
1.79
0.89
4.93
2.29
0.23
1.49
100.00
Table 5. Total areas covered by cassava climates compared with relative distribution of the crop.
Climate Area of climate Percentage Area in Percentage Percentage of class of total cassava of total land in
(000 km2) (000 ha) cassava
Lowland Highland
Humid Seasonally
dry Semi-arid
Tropical Subtropical
14,928.9 2,577.2
3,607.5
6,260.2 7,638.5
13,335.8 4,170.3
85.3 14.7
20.6
35.8 43.6
76.2 23.8
6398 1594
3458
3589 945
7174 818
80.1 19.9
43.3
44.9 11.8
89.9 10.1
0.43 0.62
0.96
0.57 0.12
0.54 0.20
a. Sec Figure 5 for explanations of letters. b. See text, p. 19, for description of each restriction category.
Cassava is mostly grown on acid soils or those free of restrictions. Table 6 shows clearly that cassava occupies a greater than average proportion of land where soils are acid, whereas the opposite is the case for soils free of restrictions.
Discussion
Tables 7 and 8 show the distribution of cassava on acid and restriction-free soils in relation to climatic conditions.
21

Table 6. Total areas of soils by restriction types compared with relative distribution of cassava.
Restriction Area Percentage Cassava (000 km"') of total (000 ha)
Percentage Percentage of of total land in
cassava
Depth/
texture
Drainage
Acidity
No restrictions
3204.0
1434.0
5718.9
7149.2
18.3
8.2
32.7
40.8
800
354
4350
2488
10.0
4.4
54.4
31.1
0.25
0.25
0.76
0.35
Table 7. Distribution of cassava in relation to acid soils and dry-season length.
Climate Area Percentage Cassava Percentage Percentage of (000 knT) of total (000 ha) of total land in
cassava
Humid
Seasonally
dry
Semi-arid
2568.9
2242.8
907.2
14.67
12.81
5.18
2124
1513
433
26.58
18.93
5.42
0.83
0.67
0.48
Table 8. Distribution of cassava in relation to soils without restrictions and dry-season length.
Climate
Humid
Seasonally
dry
Semi-arid
Area (000 km2)
639.4
2121.1
4388.7
Percentage of total
3.65
12.11
25.07
Cassava (000 ha)
1053
1096
339
Percentage of total
13.18
13.71
4.24
Percentage of land in cassava
1.65
0.52
0.08
In the humid climates of Africa, the area of acid soils is four times that of the non-acid soils (compare Tables 7 and 8). The proportion of land in cassava where soils are acid and climate is humid is almost double the overall average of 0.46% (Table 7). However, on soils without restrictions, in humid climates, the area in cassava is four times the overall average (Table 8). In Table 5 we showed that, on average, cassava occupied 0.96% of land in humid climates. For these climates cassava is slightly underrepresented on acid soils, whilst a much greater proportion than expected is grown on soils free of restrictions, indicating a preference expressed at a continental level. (This preference is more likely to be expressed through settlement patterns rather than the behaviour of individual farmers. The latter, given a choice of soil type, would probably grow cash crops on the better soils).
In seasonally dry climates, the areas of acid and restriction-free soils are similar. The proportion of land in cassava is above average in both cases, although the acid soils have significantly more cassava. In the semi-arid climates, the area of land with acid soils under cassava approximates the overall average. On soils without restrictions, however, the proportion is very low.
Because climate-soil homologues may be misleading at larger scales, the intention here has been to show the general relationships between the physical environment and cassava distribution. Table 5 shows that the homologues in which most cassava is grown are:
1. Lowland humid climates (A), with acid and non-restricting soils.
2. Lowland semi-hot climates (C), with acid and non-restricting soils.
3. Lowland continental climates (E), with acid and non-restricting soils.
4. Lowland semi-arid climates (S), with acid and non-restricting soils.
5. Highland humid climates (J), with acid and non-restricting soils.
These homologues together account for 70% of the area in cassava. The distribution of cassava in relation to soils and climate strongly suggests that the crop must play different roles in different environments. It is far more important in humid climates than semi-arid climates, where cereals replace it as a staple. To begin examining the human influence upon the relative distribution of cassava, we next look at the distribution of the human population, and the nature of the relationship between the two distributions.
Distribution of the Human Population
Our desire to compare cassava's distribution with that of the human population in the areas where the crop was grown necessitated the production of a population map from recent sources. For consultation only, we could have used published maps, however, to examine the relationship between two spatial variables it was necessary to add population to our geographic database. This facilitated automated comparison and overlay of crop, population, environmental and other data, as necessary. No digital population map was available at the time. In addition, we were required to produce such a map for the six countries of the COSCA study (Ghana, Ivory Coast, Nigeria, Tanzania, Uganda and Zaire) to provide a sampling frame for the first phase of the project (Carter and Jones, 1989). Recent data from the U.S. Bureau of the Census (compilations of recent African censuses) had already been gathered for the project, making it feasible to produce a reasonably up-to-date map, even if already ten years out of date.
Compilation of the population density map: Data
We attempted to produce a population map which synthetised available data at the level of secondary administrative units. In the cases of Tanzania and Zaire, tertiary administrative units were used because the secondary units were very large and because data were available at the tertiary level.
Population data came from unpublished country census reports compiled by the U.S. Bureau of the Census. For Tanzania and Zaire, the sources were the Atlas of Tanzania (1976) and the preliminary results of the 1984 Zaire population census (INS, 1985). Mapped administrative units did not always correspond to those reported in the census data. Discrepancies were resolved by checking older maps. Where the population data were more detailed, that is, where a mapped unit should have been subdivided, the data were aggregated to give a single figure. If the map was more detailed, mapping units were aggregated to correspond to the census administrative units. The result is that, for some countries, the final map of administrative units differs slightly from the present situation, the situation at the last census, or occasionally both. For most countries, maps and census units corresponded perfectly. Maps of secondary administrative units for Botswana, Equatorial Guinea, Gabon, Gambia and Swaziland were unavailable. By using national growth rates, the population of each administrative unit was extrapolated to 1980. Appendix II gives further details of the methods used to do this and create a population map.
22

Population density
Map 4 presents the population density data, divided into nine classes. Population density varies from less than one person per square kilometer in parts of the Congo basin, Angola and Namibia, to over 500 persons in the Lagos area of south-west Nigeria. Note that urban populations are generally included within those of their parent administrative units. The most densely populated areas are:
1. Nigeria;
2. the West African coastal belt, west of Nigeria;
3. Burkina Faso;
4. the central highlands of Ethiopia; and
5. the Great Lakes Region, including eastern Kivu in Zaire, Rwanda, Burundi, western Kenya, southern Uganda and northern Tanzania.
Localised areas of high population density are Bas-Zaïre and Kananga in Zaire, southern Malawi, the east coast of Tanzania and adjacent islands, central Madagascar and the area around Maputo in Mozambique.
There is a marked correspondence between these areas of population concentration and the foci of cassava production (Map 1). Particularly notable is the concentration of cassava in West Africa and the Great Lakes Region, and localised concentrations in eastern Tanzania, central Madagascar, Bas-Zaïre and around Maputo in Mozambique. However, there are areas with high population density where cassava is relatively unimportant. Highland Ethiopia, in those areas which are not too cool for cassava production, has very little cassava, despite its population density. In Burkina Faso, and in northern Nigeria, cassava is also relatively unimportant. Significant anomalies exist in the opposite sense too, such as the Morogoro and Mtwara areas of east and south-east Tanzania where population density is moderate but where there are marked concentrations of cassava. In Mozambique, cassava is more important in the north and east than in the south-east where population is concentrated.
Table 9 shows cassava's distribution in relation to population density classes obtained from Map 4. Almost 74% of the crop is grown in areas with 50 or fewer persons per square kilometer, with almost half being grown in areas with between 10 and 50 persons per square kilometer. Table 9 tells us nothing about the fo'rm of the relationship between the two variables, however, since it does not give us any indication of the relative area in which these densities prevail. In the following sections we investigate this relationship in greater detail.
Table 9. Distribution of cassava in relation to population density. 1980 (unclassified cassava results from minor discrepancies in the form of the digital cassava and administrative maps).
Population density
(persons/km )
<1
l-<5
5-<10
10-C25
25-<50
50-<100
100-<250
250-<500
500 +
Unclassified
Total
Cassava distribution
(000 ha)
33
948
1404
1921
1621
1209
586
234
4
32
7992
(%)
0.4
11.8
17.6
24.0
20.1
15.1
7.3
2.9
0.1
0.4
99.7
The Relationship Between Environment, Population and Cassava Distributions
Our goal in this section is to unravel the interaction of population and environment in an attempt to understand their relative significance as controls on the geographic distribution of cassava.
On pages 19-22 we noted that the percentage of land devoted to cassava varies according to environmental conditions. In particular, the crop seems to be relatively more important in areas of favourable climate and soils. We have acknowledged the importance of the distribution of human population here, but the nature of this relationship is unclear.
We cannot hope to specify a complete explanatory model of cassava distribution a priori. The factors which we quantify are the proportion of land area devoted to the crop, length of dry season (as an index of climatic stress), soil restrictions, and the density of the human population. This is an incomplete list of the variables which must influence the crop's distribution. Others would include biological stresses, cultural preferences, and demand from processed-product markets. The generalised nature of our analysis does not permit an examination of labour and capital availability, nor would it be currently feasible to obtain and organise the necessary data at this scale of analysis. Similarly, we leave aside the issue of physical accessibility because of the apparent inadequacy of available mapped information to describe reality, let alone serve as a proxy for market access in most countries (personal communications from the COSCA project staff, 1990, and Professor E. Tollens, 1990). Population-to-cassava ratios may provide the best means of identifying areas where the process of diffusion of cassava is still incomplete, if it were possible to identify a general relationship between the two variables.
Analysis of cassava distribution
By overlaying the climate, soil and population density maps (maps 2-4), we defined a set of homogeneous polygons. Area, population and hectares of cassava were then determined for each polygon (methods are described in detail in Appendix II). We then simplified the environmental information somewhat (Maps 2 and 3), to give just three environmental variables:
1. Altitude (above or below 1000 m.a.s.1.), as two classes.
2. Length of dry season (number of months with less than 60 mm precipitation), as three classes: 0-3 months; 4-6 months; and 7-9 months.
3. Soil restrictions as three classes: restrictions of depth, drainage or texture; acid; and unrestricted.
The combinations of these environmental conditions are shown in Map 5. We excluded areas where climatic conditions did not permit cassava cultivation (mean growing season temperatures less than 18 °C, or with more than 9 dry months). Those countries for which we had no cassava data at all were also excluded from the analysis: Botswana, Ethiopia, Mauritania, Namibia, South Africa and Swaziland.
We then constructed a step-wise regression model of cassava as a percentage of land area, with population density as the independent variable and the environmental conditions as factors, or classes of population. The methodology and form of the model are explained in detail in Carter and Jones (n.d.), and described in Appendix II. The modelling process was conducted in two stages.
Firstly, a number of small areas which did not fit well, and Nigeria, for which data were considered to be very unreliable.
23

were replaced by factors. The former areas included parts of the Mtwara and Mwanza regions of Tanzania, and Burundi. These three zones represented small areas whose cassava could not be adequately described by population. Over the rest of the continent, population seemed to be a good predictor, and the model accounted for 67.9% of variance in cassava area.
The model was then used to predict the expected distribution of cassava (fitted values), and to identify areas where it did not explain cassava distribution well. These exercises are now examined in more detail.
Fitted values
Map 6 shows the classed, fitted values of cassava as a proportion of land use predicted by the model. This was produced by substituting the corresponding coefficients calculated from the model for the population-environment polygons (See Table 17, Appendix II).
Map 6 differs somewhat from the original cassava distribution map (Map 1). The latter is of the traditional dot kind, whereas the fitted values map is continuous, showing the proportion of land under cassava. The data values are therefore more evenly spread. (Note that the compression of the data into classes for Map 6 adds to this impression somewhat). The most notable difference is the way the data are spread out more evenly where cassava occupies less than 0.5% of land area. This is particularly the case in the Congo Basin, where the precision of available secondary data was lowest. The spatial concentrations of the crop in Map 6 correspond well with those of Map 1. Although Map 1 is more precise, given the nature of much of the original statistical data used to map cassava in Africa, the fitted values map is a more accurate representation of the crop's distribution (within the limitations set by the model's fit).
Values of cassava area for the normal model, modified by season and soil type, are plotted against population density in Figures 6 and 7. These values were calculated by using the model coefficients (see Appendix II). Figure 6 shows fitted values of cassava as a percentage of land area by soil class with season held constant (for season class 2, that is, four to six dry months). Area in cassava increases in curvilinear fashion as population increases. The lowest curve corresponds to the poorest soils, but the difference between this and the other soil types is only about 0.5% of land area. Area of cassava for the other two soils is very similar.
Figure 7 shows cassava as a percentage of land area by season class (holding soil constant at class 2, that is, acid soils). Area is highest for the humid climates, with its maximum at about 4.5% of area. For the seasonal climates, the curve is about 1% less
a>
TJ
c o Q) D) •2 C
g & V) 03 « > P3
Ü
20 40 60 80 100 120 140 160 180 190
Population (persons/km2)
Figure 6. Relationship between area in cassava on three different soil types and population density in season class 2 (4 to 6 dry months).
C3 •D C
re o O)
re *-< c y CD Q. W 00
re > 03 W Cfl
ra Ü
Figure
100 120 140 160 180 190
Population (persons/km )
7. Relationship between area in cassava for three different season types and population density on soil class 2 (acid soils).
than that of the humid climates at its highest point. The curve for the dry climates is the lowest and turns down quickest. Its maximum value is about 0.3%.
Residuals from the model
Residuals represent that part of total covariance in a regression which the model does not explain. In a spatial regression model, the value of the residual can be mapped for each observation. We have done this for the cassava model in Map 7. This is a commonly used technique in spatial analysis. A map of these residuals identifies places where the model fits least well. By identifying patterns in the residuals, it provides the researcher with clues as to which other variables need to be specified in the model, or where to begin looking for them (Taylor, 1977, p. 217). High positive residuals on Map 7 indicate areas which had more cassava (Map 1) than predicted by the model. These are listed below:
1. A band around the south and south-east of Lake Victoria.
2. The areas to the west of Mtwara in south-east Tanzania. Categories 1 and 2 can be considered geographic extensions of the Burundi/Mwanza and Mtwara areas which were included in the model as separate factors.
3. Bendel state in Nigeria.
4. North-west Tanzania.
5. Parts of coastal Mozambique, both north and south.
6. Central Bas-Zaïre.
(Note that Mtwara and Burundi have low residuals since they were described by separate factors.)
Areas of high negative residuals, where the amount of cassava was considerably less than that predicted, were:
1. western Kenya;
2. the area around Arusha in northern Tanzania; and
3. northern Ghana and northern Togo.
At present we can attempt only a cautious explanation of the observed patterns of residuals. In the case of Lake Victoria's southern and eastern rims, there is an imbalance between the distribution of cassava and the human population cither side of the Kenya/Tanzania border. Cultural factors may explain the prevalence of cassava on the Tanzanian side. Cassava is taken across the border to Kenya (H. Rosling, personal communication, April 1989) and, therefore, the observed difference is felt locally.
24

We do not know to what extent demand in Kenya is encouraging production in Mwanza. Nor can we be sure about why Kenyan farmers do not grow more of the crop. One reason may be that Kenyans cultivate more non-edible cash crops, relying on cheap Tanzanian cassava as a staple, as a means to maximise cash in-flows.
When we take into account the three areas which were replaced by factors in the model, that is Burundi, and parts of Mtwara and Mwanza, we see that there is a general concentration of high residuals in the area south-west of Lake Victoria, and in south-east Tanzania. This suggests either a cultural preference for the crop perhaps linked to the particular characteristics of local farming systems, or ecological and/or environmental reasons for which our model is too crude a tool to measure. Degradation of the environment may be one reason, with cassava being grown because of its adaptability to just such a situation.
In Mozambique, the high residuals may be a result of increased cultivation of cassava as people rely on it as a staple which is not so prone to destruction from war. Given our doubts about the accuracy of the Nigerian data, we cannot comment here on the high residuals in Bendel state, although they are reconsidered briefly in Chapter 5. In Bas-Zaïre, demand from Kinshasa and preferences for cassava may be responsible for the high residual value.
The notable areas of negative residuals are Arusha and northern Ghana and Togo. In the first case, the relatively minor importance of subsistence production in this part of Tanzania may explain the anomaly. In the second case, people may prefer other staples, or it may be that cassava has yet to be fully incorporated into local farming systems as the crop moves northwards in West Africa.
Extrapolation from the model
We have used the model to predict the likely area in cassava for the year 2000, by substituting population projections based on national growth rates (acquired from the U.S. Bureau of the Census). An implicit assumption was that the relationship
between cassava and the human population over space circa 1980 could be used to predict change over time. Our intention was simply to get an impression of the likely spatial changes in the crop's importance solely as a result of population change. In reality of course, many other factors will influence changes in the crop's distribution over the next decade or so.
Map 8 shows the estimated percentage of land in cassava for the year 2000. The estimates for Nigeria and other areas which were accounted for separately are modified accordingly. In the case of Nigeria and the other areas of very low residuals, Map 8 reflects likely proportions more accurately. Estimates for Rwanda, Burundi and Mtwara in Tanzania are lower than we would expect as explained above. In addition, the countries for which no cassava data were originally available were excluded.
Map 8 shows that cassava's importance as a form of land use is likely to increase considerably in the following areas:
1. the Great Lakes Region, and adjacent parts of the East African highlands;
2. the east coast, particularly in Kenya, Tanzania and southern Mozambique;
3. eastern Madagascar;
4. central Zaire, between the mouth of the Congo River and Kikwit;
5. Central African Republic; and
6. most of West Africa, with a significant increase northwards into the savannas.
These findings and the pattern of residuals warrant careful attention from researchers dealing with cassava, agricultural change and rural development in sub-Saharan Africa. In the following chapter, three of the major cassava-producing countries are examined in greater detail. The implications and limitations of the model are discussed in our concluding chapter.
25


CHAPTER 5
DISTRIBUTION AND CHANGE IN CASSAVA PRODUCTION IN THREE COUNTRIES
Background and Methods
This chapter aims to validate the theoretical framework and the cassava distribution model by presenting data on three important cassava-producing countries. Nigeria, Tanzania and Zaire were chosen because they represent approximately 60% of the total cassava production and more than half of the cassava area in Africa (De Bruijn and Fresco, 1989). Furthermore, these countries cover all the relevant agroecological zones for cassava and display a wide variety of population densities. Most importantly, they also include the major areas of high positive residuals where the frequency of occurrence of the cassava is higher than would be expected from the model as discussed in Chapter 6. Each case study attempts to discuss the relationships between crop choice and agroecological conditions (climate, soils), population densities, types of farming systems and socio-economic and technical factors such as labour and consumer demand.
Each of the country studies is based on a diverse set of secondary data of varying quality. An attempt has been made to develop production data series to cover several decades in order to capture the dynamics of cassava. This was relatively easy in Nigeria where an extensive agricultural census was carried out in the early 1950s. But there, as well as in other countries, analysis was severely hampered by subsequent changes in administrative boundaries and discrepancies between pre- and post-independence figures. Official government statistics are therefore complemented with field reports from various sources, such as anthropological studies. The area under cassava was derived from available statistics and related to population density figures. Farming systems were characterised in as much detail as possible. In each case, selected localities have been studied in depth to obtain a more complete picture of the factors affecting the role of cassava in the farming systems. There has been a deliberate attempt to include studies covering the entire period from the 1950s onwards in order to provide an insight into the longer term processes of change. It is unavoidable that the data from such diverse sources do not always display clear trends. Although, undoubtedly, there are many more studies than we have been able to trace, we feel that the available evidence does provide a better insight into the dynamics of African agriculture and of cassava in particular.
Nigeria
The physical, human and agricultural environment
Nigeria is situated in West Africa, between 4° and 14° N, with an area of about 924 thousand km . The major part of the country lies below 600 m, except for the Jos Plateau and the mountainous areas in the north-east. The Benue and Niger Valleys and the coastal zone are situated well below 150 m (see Figure 8). Soils are relatively fertile in the southern and middle parts of the country (Nitosols and Luvisols) and fragile and poor in the north (Regosols and Arenosols). Minor soil types are Fluvisols and Gleysols (Agboola, 1979; FAO/UNESCO, 1985).
Climate is tropical with prolonged seasons. The length of the rainy season varies from less than 3 months in the extreme north-east to 8 months in the south. It runs from April-July to September-November. Rainfall is highest in the south and decreases northwards. It varies from over 4000 mm in the Niger
Delta to around 1000 mm in the middle and western areas and less than 500 mm in the extreme north-east. The Jos Plateau forms a more humid island in the north with a rainfall of 1500 to 2000 mm. Temperatures vary between 25 and 35 °C with high humidity in the south. Relative humidity is low in the north. Highest temperatures occur between March and June in the north and February and April in the south (Agboola, 1979; Zuidervliet, 1982). Vegetation consists mainly of forest and mangroves in the south and savanna in the north (Figure 9).
Administrative divisions have changed frequently since independence. In 1967, four regions were divided into 12 states, which were further subdivided into 19 states in 1976 (Table 10 and Figure 10). Nigeria has the largest population of the African continent, and a high average population density, reported at 110 persons per km2 in 1979 (Nigerian National Population Bureau, 1984). Population distribution is very uneven, with a sparsely populated Northern Region (except for the Jos Plateau) and highly populated Eastern, Western and Mid-Western Regions. Highest concentrations are found in urbanised Lagos and in Oyo, Imo and Anambra states (see Map 4).
The economy is dominated by the oil-producing sector. Due to urbanisation, increasing incomes and stagnant production, agricultural production has lagged behind the demand for agricultural products. The importance of agriculture is, however, still considerable. Agriculture provides half of the employment and produces 20% of the Gross Domestic Product (Adamu, 1989; Zuidervliet, 1982). Nigeria is the second largest producer of cassava in Africa after Zaire, and cassava is one of the four major food crops.
Agricultural régionalisations of Nigeria reflect the north-south rainfall gradient, with some modification for elevation. For the purpose of this study aggregated regions are used: the Northern Sudan Zone, the Middle Belt (together forming the Northern Region), and the Southern Forest Zone (Mabogunje et al., 1976). For each zone, farming systems characteristics and factors affecting the dynamics of cassava are discussed briefly.
Table 10. Nigerian political divisions.
Regions until 1967
West
Mid-West
East
North
SOURCE: Adamu. 1989.
12-Stäte structure 1967-1976
Lagos, Western
Mid-Westem
Rivers,
South-east, East-central
Kwara, Benue Plateau. North-east, Kano, North-central, North-west
Abuja (Federal Capital Territory)
19-State structure since 1976
Lagos, Ogun, Oyo, Ondo
Bendel
Rivers, Cross River, Imo, Anambra
Kwara, Benue Plateau, Gongola, Borno, Bauchi, Kano, Kaduna, Sokoto, Niger
Abuja (Federal Capital Territory)
27

Figure 8. Relief map of Nigeria (reproduced, by permission, from Royal Tropical Institute, Amsterdam).
- . . - . , - • ' . « • , - " - ••••"•
. Sokoto •-'";;; * ^"•;, .*<• .><
••>"•• •' ->v% Kano .**• ,«!?>•••;
...•„ u • * '*i»J'Nauru">'/..Ai,,..«.^,'-w
..«'• • ,«,.. ..»''. ..>»«..j»•"•.•>""•• J»* >i.. ,.\.„. ,,,„.•*>•• *«•, .Maiaugun
Mangrove Freshwater swamps Forest regrowth Derived savanna Southern Guinea savanna Northern Guinea savanna Sudan savanna Sahel savanna
Figure 9. Vegetation zones in Nigeria (reproduced, by permission, from Agboola, 1979).
28

D 1 V A
North
West
Mid-West
East
Figure 10. Post-1976 administrative divisions (states) and regions cited in text.
Farming systems with cassava
Northern Sudan Zone. Population density is low, except around the city of Kano. Two types of arable land can be distinguished: upland and lowland. Upland soils are better drained, whereas lowland soils are wetter and more fertile. Often the two types are found on one household farm. Fields are grazed by cattle from nomadic pastoralists in the dry season. Large towns, such as Kano, are surrounded by an area of intensive production. The farming system is based on groundnut, with sorghum and millet as important food crops. Cassava is of very little importance. Its production is restricted to the wetter parts or to soils with residual dry-season moisture.
Middle Belt Rural population density is very low, but food production is high. Large amounts of food are exported to other zones. In the Middle Belt, all the major crops of Nigeria are found, the most important of which are yam, maize, rice, sorghum and cassava.
Only a few studies are available that trace the effects of population pressure on crop choice and land use in general. In southern Benue state, increasing population has led to reductions in farm size since the 1950s. A new farming system called 'Bugh Bu' was developed in this belt. Yam, traditionally the first crop to be planted after clearance in the Middle Belt, was replaced by earlier maturing crops such as Irish potatoes and cereals. Although yam is still planted during the second year of rotation, its status has been lowered and farmers have adjusted to lower yields. The adjustment of the farming system is a response to diminishing yields, depletion of soils and increasing food shortage, all reportedly caused by increasing population pressure.
Southern Forest Zone. The Southern Forest Zone covers three administrative regions: the Western, Mid-Western and
Eastern Regions. Cassava is one of the main staple food crops, and an important cash crop around towns.
In the Western Region, population density is generally high, especially in Lagos and Oyo states. Perennials, such as fruit trees, and cash crops, such as cocoa and kola, are increasingly replacing food crops (mainly maize and cassava). The role of maize is important in the north, but decreases towards the south, where cassava predominates. The impact of population density on soils and crop choice was discussed as early as 1902. Population around Abeokuta (Ogun state) increased dramatically, leading to a collapse of the rotation system. Yam could no longer be grown profitably and was gradually replaced by cassava (Mabogunje and Gleave, 1964). The impact of demand and urbanisation on cassava production has been documented (Agboola, 1979). The number of farmers that grow cassava decreases with distance from towns such as Lagos, Abeokuta and Ijebu. The demand for labour and the pattern of labour distribution can also steer crop choice. Mabogunje and Gleave (1964) have also reported that yam may lose its dominant role where its labour demands are not compatible with those of certain cash crops. Large-scale cultivation of cash crops has led to increasing pressure on land and labour resources. The cultivation of cassava in the cocoa districts was stimulated by the competition between cocoa and food crops. Increasing land shortage and consequent shortening of fallows on land used for food crop production caused a decrease in soil fertility, which was the reason for farmers' increased cassava cultivation.
In the Mid-Western Region (Bendel state), population density is low. Most of the main food crops are grown: yam, sorghum, cassava, millets, maize, plantain, aroids or cowpea. An important yam-producing area is found in the north. The south is known for its forest products, particularly timber, rubber, and raffia. Cassava production has grown markedly in the last twenty years, possibly to the detriment of yam (Okorji and Aghimien, 1986).
29

In the Eastern Region, population density is high, especially in the Anambra and Imo states. Agriculture is dominated by oil palm. The main food crops grown are yam, maize and cassava. Farming systems in the Eastern Region are relatively well documented and comprise the following:
1. shifting cultivation with forest fallow;
2. shifting cultivation with bush fallow;
3. elementary sedentary cultivation;
4. intensive sedentary cultivation; and
5. intensive sedentary cultivation with terracing.
Shifting cultivation with forest fallow is found in small spots in the east and north-east. Shifting cultivation with bush fallow is found throughout the region, except for a small belt running from Onitsha to Calabar in a south-east direction, where sedentary cultivation is found. Most intensive farming systems are found in areas with highest population density (Floyd, 1969). Bush fallowing is the most important farming system in the Eastern Region (Unamma et al., 1985). In a basic rotation of bush fallowing, two years of cultivation are followed by a seven-year bush fallow. Yam is the first crop to be planted after bush clearance, intercropped with maize and vegetables. Cassava is planted at the end of the first year.
Shifting cultivation is in the process of being replaced by more intensive farming systems. Several field types can be distinguished (Floyd, 1969; Lagemann, 1976; Nweke et al., 1988; Uzozie, 1971):
1. Distant plots; land shortage can force farmers to open fields at an increasing distance from the village. At a certain point, the distance becomes too far and the cultivation of vegetables becomes impractical as frequent visits to the field become too time consuming. In distant plots therefore only yam and cassava are grown.
2. Compound plots; in compound plots, essential crops, such as vegetables, are grown in the vicinity of the household. Fertilisation with domestic refuse and mulch increases yields and allows shortening the fallow. Two or three years' cultivation is followed by one or two years of bush fallow. Cassava is planted at the end of the first year.
3. High-altitude plots; in the mountainous areas of the east, rainfall is high and population density is low. Plantain and cassava are the main crops, growing admixed during the entire field period (two or three years) and harvested when required.
4. Flooded plots; land surrounding the basins of the Niger, Anambra and Cross River is flooded annually. The deposition of alluvial clays enhances fertility. Permanent cultivation can be practised without apparent declines in fertility. Three field types can be distinguished, depending on the dominant crop (rice, groundnut or yam). Cassava is grown as the last crop before fallow on rice and groundnut plots.
5. Cereal plots; rainfall in the north is lower than in other parts of the region, where cereals and grain legumes are important crops. A two-year cropping period is followed by a two-year bush fallow. Cassava is planted in the second year.
These field types appear to be continuous adaptions to changing conditions of rainfall, soil fertility and population
density. The role of cassava seems to be dualistic: the crop is found both in intensive (cereal, yam and cash crops) and extensive cropping (distant fields) patterns. In both cases it is grown at the end of the cropping period and left as the sole crop when fallow begins. It is sometimes found in compound plots, but yam is more frequently found there because of market preference and higher prices for yam. However, in the densely populated belt between Onitsha and Calabar, population pressure seems to have tipped the balance in favour of cassava. Yam is still dominant in the northern part of the region, where fertile alluvial and hydromorphic soils in the Anambra and Cross River basin guarantee good yields (Uzozie, 1971).
Although cassava is gaining ground over yam, it has not entirely replaced yam as it did in the Western Region. The reason for this must be sought in the character of other dominant crops in the farming system (a combination of kola, cocoa, rubber and oil palm in the Western Region in contrast to oil palm alone in the Eastern Region). Kola, cocoa and rubber leave very little space for intercropping. Food crops have to be grown on separate plots. This increases land pressure and shortens fallow, and eventually leads to a decline in soil fertility. Yam is more affected by this than cassava, causing a shift to cassava cultivation. This shift is enforced by the fact that labour requirements for kola, cocoa and rubber coincide with those of yam but not with those of cassava. In contrast, oil palm (dominant in the Eastern Region) leaves enough space for intercropping with food crops. No special fields for food crops are needed, reducing the pressure on the land in comparison with the Western Region. Yam can still be grown. As labour requirements for oil palm do not coincide with those for yam, the need to grow cassava is less urgent.
It can be concluded in general that declining soil fertility and land shortage, both resulting from increasing population density and the introduction of cash crops are dealt with in two ways, by expansion of the cultivation of cassava at the expense of yam, and through an intensification of cropping on compound plots (with heavy application of manure and animal waste). The intensification is more pronounced where pressure on the land is higher.
Trends in cassava production
Per capita production of the major food crops in Nigeria (maize, cassava, yam, millets and sorghum, in descending order of importance) has been decreasing since 1960. During this time, food imports have risen enormously, and a large number of people have moved into towns and out of agriculture. Employment in agriculture decreased from 71% in 1960 to 54% in 1980 (Adamu, 1989; Zuidervliet, 1982). Cassava production data are contradictory: international data, given by FAO and USDA, are considerably higher than the local data provided by the Federal Office of Statistics (FOS). FAO and USDA data may be closer to actual production figures, but do not properly reflect annual variations nor provide information on regional differences (Ikpi et al., 1986). FOS data tend to underestimate production because of insufficient corrections for intercropping and incorrect measurements of the production area. Crops that are planted after the start of the rainy season are not considered. FOS data concerning the period before 1963 are probably less reliable and can be used only as indication. FOS data have been adjusted by Adamu (Figure 11) to correct for difficulties in the measurement of cassava production and the changes in methods (Adamu, 1989). As a result, it is extremely difficult to determine trends in cassava production (Table 11). With the exception of FAO, all sources show a decline in cassava production. Although FAO figures are useful in the determination of long-term trends, it seems justified to treat them with great care. Cassava's share in total food production has fluctuated around 14%.
30

W c o c o
c g
'T3
Q.
Table 12. Population density and cassava yields in southern Nigeria (12-state structure).
1970 71 72 73 74 75 76 77 78 79 80 81 82 83
Year
o FOS Û CBN FAO • USDA «ADAMU
Figure 11. Comparison of cassava production figures for Nigeria, using different sources (see Table 11 for sources).
Cassava production is concentrated in the Southern Forest Zone, where over 75% of the production area is found. Bendel state is the largest producer, followed by the Oyo and Imo states. The largest producer in the Middle Belt is Benue state. Production in the Northern Sudan Zone is very limited. Production figures are given in Table 12.
The relative importance of cassava is given by the production per square kilometer of total area. When relative and not absolute production is taken into account, Imo has the highest production and surpasses Bendel as the most important cassava state. Also, if this relative measure is used, then the production in Anambra and River states is more important than what the total production figures suggest. Cassava covers more than half of the arable land in parts of Ondo, Ogun, Rivers and Cross River states. In other parts of the Southern Forest Zone, 10% to 50% of cropping land is occupied by cassava. In the Middle Belt and Northern Sudan Zone this is less than 10%. Figure 12 shows the proportion of cultivated area in cassava for the country as a whole.
Table 11. Comparative cassava production figures (000 MT), Nigeria.
Year
1970
1971
1972
1973
1974
1975
1976
1977
1978
1979
1980
1981
1982
1983
FOS
5213
4508
2571
2901
3882
2321
1875
2900
1578
1506
874
582
909
1171
CBN
5180
4719
3156
2729
3206
3352
3237
1935
2009
1976
1988
2159
2308
—
FAO
9084
9719
9570
9600
10000
10000
10800
10600
10500
10500
11000
11000
11700
—
USDA
11871
12396
12700
13000
13300
13600
13900
14150
14150
14600
13100
11800
11700
—
Adamu adjusted
series
10426.0
9016.0
5142.0
5802.0
7764.0
4642.0
5625.0
8700.0
4734.0
4518.0
5243.1
3492.0
5454.0
7074.0
SOURCES: For FOS, see FOS, 1980-81 onwards;
For CBN and USDA, see ldachaba, 1985;
For FAO, see FAO, various years; and
For Adamu, see Adamu, 1989.
State or
region
Mid-Western
Rivers
South-east
Western
East-central
Lagos
Code
M-W
Ri
S-E
W
E-C
La
Population
1950
49
73
95
97
187
311
density (people/km")
1970
66
85
119
126
250
403
1979
95
143
183
191
363
709
Cassava yields
1950
12,639
11,128
9,276
8,315
11,044
9,615
1970
10,745
9,289
15,364
17,091
11,737
14,390
(kgTha)
1979
16,909
10,750
8,429
10,514
10,450
8,333
SOURCE: FOS, 1952.
Explaining patterns of cassava distribution
Residuals of the model: Bendel. The model presented in Chapter 4 appears generally adequate to explain the distribution of cassava in Nigeria. Most cassava is found in semi-humid or humid climates. Cultivation on soils which offer no restrictions for cassava is limited to some areas in the south (Cross River state, parts of Bendel state and Ondo state). The dominance of marginal and non-suitable soils is noticeable. Here cassava is most likely cultivated on associated soils or inclusions, or farmers must make microenvironmental modifications to allow cassava cultivation.
Population density is high in the Western and Eastern Regions of the Southern Forest Zone and in Kano state in the Northern Sudan Zone. When population density is compared with cassava production, it is clear that a high population density coincides with a high cassava production area in the Western and Eastern Regions. In the Mid-Western Region, high levels of cassava production coincide with a moderate to low population density, while a high population density in Kano state coincides with low cassava production, as expected on climatic grounds.
The high residuals observed in the Mid-Western Region and, more specifically, Bendel state, probably reflect the fact that this region has become an important exporter of agricultural products. Okorji and Aghimien (1986) have shown how area under cash crops, rubber in particular, per household has decreased from 6.77 ha in 1979-1980 to 3.44 ha in 1983-1984, whereas the area under food crops has increased from 1.39 to 2.56 ha in the same period. This change was mainly a result of the low profitability of rubber in comparison with yam and cassava. The decrease in area under rubber, however, was not completely absorbed by food crops, and on the whole, the area per household declined from 8.66 to 5.99 ha, a decrease resulting from urbanisation. The authors predict that, by 1991, rubber plantations may be eliminated completely because no replanting is being carried out. Yam roots for cash and seed yams are far more profitable enterprises than cassava (together yielding nearly six times the per-hectare return of cassava, and accounting for about three-quarters of the household income from food crops). Cassava, however, is the second most important cash crop, and far more important than any alternative such as cocoyam, maize, or vegetables. In other words, if yam cannot be grown because of low soil fertility, cash inputs or labour, cassava is the only alternative cash crop. Since the pressure on the land is increasing, the likehood that cassava will be grown instead of yam will increase in the future.
A study of migrant farmers may throw more light on the residuals identified in the previous chapter in Bendel state. Osemeobo (1987) concludes that shifting cultivation by migrant Igbira accounts for a significant proportion of commercialised food production in the state. They use the land for 1 to 2 years, leaving it fallow for 2 to 3 years without fertiliser application. Although yam is currently the most profitable staple, its production is constrained by the high cost of seed yams,
31

CD WA fill 1 1
>
>
> 50%
10-50%
0-10 %
0%
Figure 12. Proportion of cultivated area devoted to cassava in Nigeria (reproduced, by permission, from Agboola, 1979).
inadequate labour supply and unstable prices. Such a situation, coupled with a deteriorating system of shifting cultivation, seems to give cassava a comparative advantage.
Unfortunately, there are no detailed studies explaining specific changes in cassava production in this area. Some inferences may be drawn, however, from similar areas (of a smaller scale) in the Eastern Region. In the Calabar area, in Cross River state, population density is low, but cassava is intensively cultivated. Half of the farmers, in a study on the Eastern Region, apply fertilisers on cassava (Unamma et al., 1985). The popularity of cassava in this area can be explained by three mutually reinforcing factors. Firstly, significant numbers of farmers in this area have migrated from other, more populated, areas where they probably have grown cassava before. Secondly, the high demand for cassava products (gari) in regions close to the area boosts cassava production. Finally, farmers regard the low external input levels needed for cassava, relative to other crops, as highly advantageous (Udo, 1976).
Population density and yield. It has been suggested in the theoretical framework that cassava becomes an attractive crop at increasing population densities when few external inputs are available. Such a process of agricultural extensification would lead to declining yields. Even within a single broad climatic region, the relation between cassava yield and population density is weak, as shown for south Nigeria in Table 12 for a 30-year period. Figure 13, however, appears to confirm an inverse relation between population density and yield. Oyo state, where high urbanisation is masked by low average population density, provides the exception that proves the rule: here high urban demand has led to intensive commercialised cassava production. This is not the case in densely populated greater Lagos where cassava has to compete with cheap imported staples. Data at state level are not very accurate, and larger scale data are not available.
Regional trends. Regional trends in production, yield and area are given in Table 13. Since the early 1960s, total production
in the Eastern Region has increased, while it was constant in the Northern Sudan Zone and declined in the Middle Belt and Western Region. Cassava production seems to be shifting to central and eastern Nigeria. There is no clear relation between this shift and climate, but production is increasing in the wetter parts of the south and the drier parts of the north, moving to extreme climatic areas. There is no immediate relation to population density, as both the Western and Eastern Regions are similary densely populated. The shift of cassava towards arid areas is remarkable and can possibly be explained by the search for food security, as drought-tolerant cassava varieties can be used to guarantee food availability when other crops fail. The fact that cassava can be continuously harvested could play a special role here. The shift towards very humid areas may reflect the expansion of the crop towards generally less favourable areas that are too humid for cereals, as a result of population increases in these areas.
Between 1960 and 1983 cassava area increased in the Rivers state and in the central part of the Northern Sudan Zone (Kaduna state). A strong decrease occurred in the Western Region, the
CO
32
co > CO </> co CO O
18
17
16
15
14
13
12
11
10
9
8
Oyo
. Rivers • Bendel
• Ogun
•Ondo
• Cross Imo Lagos
•
J_ Anambra
1 i i 100 300 500 700 900
Population density (persons/km )
Figure 13. Cassava yields plotted against population density for the nine southernmost states of Nigeria (from FOS, 1980/81 ; Statistik des Auslandes, 1985).
32
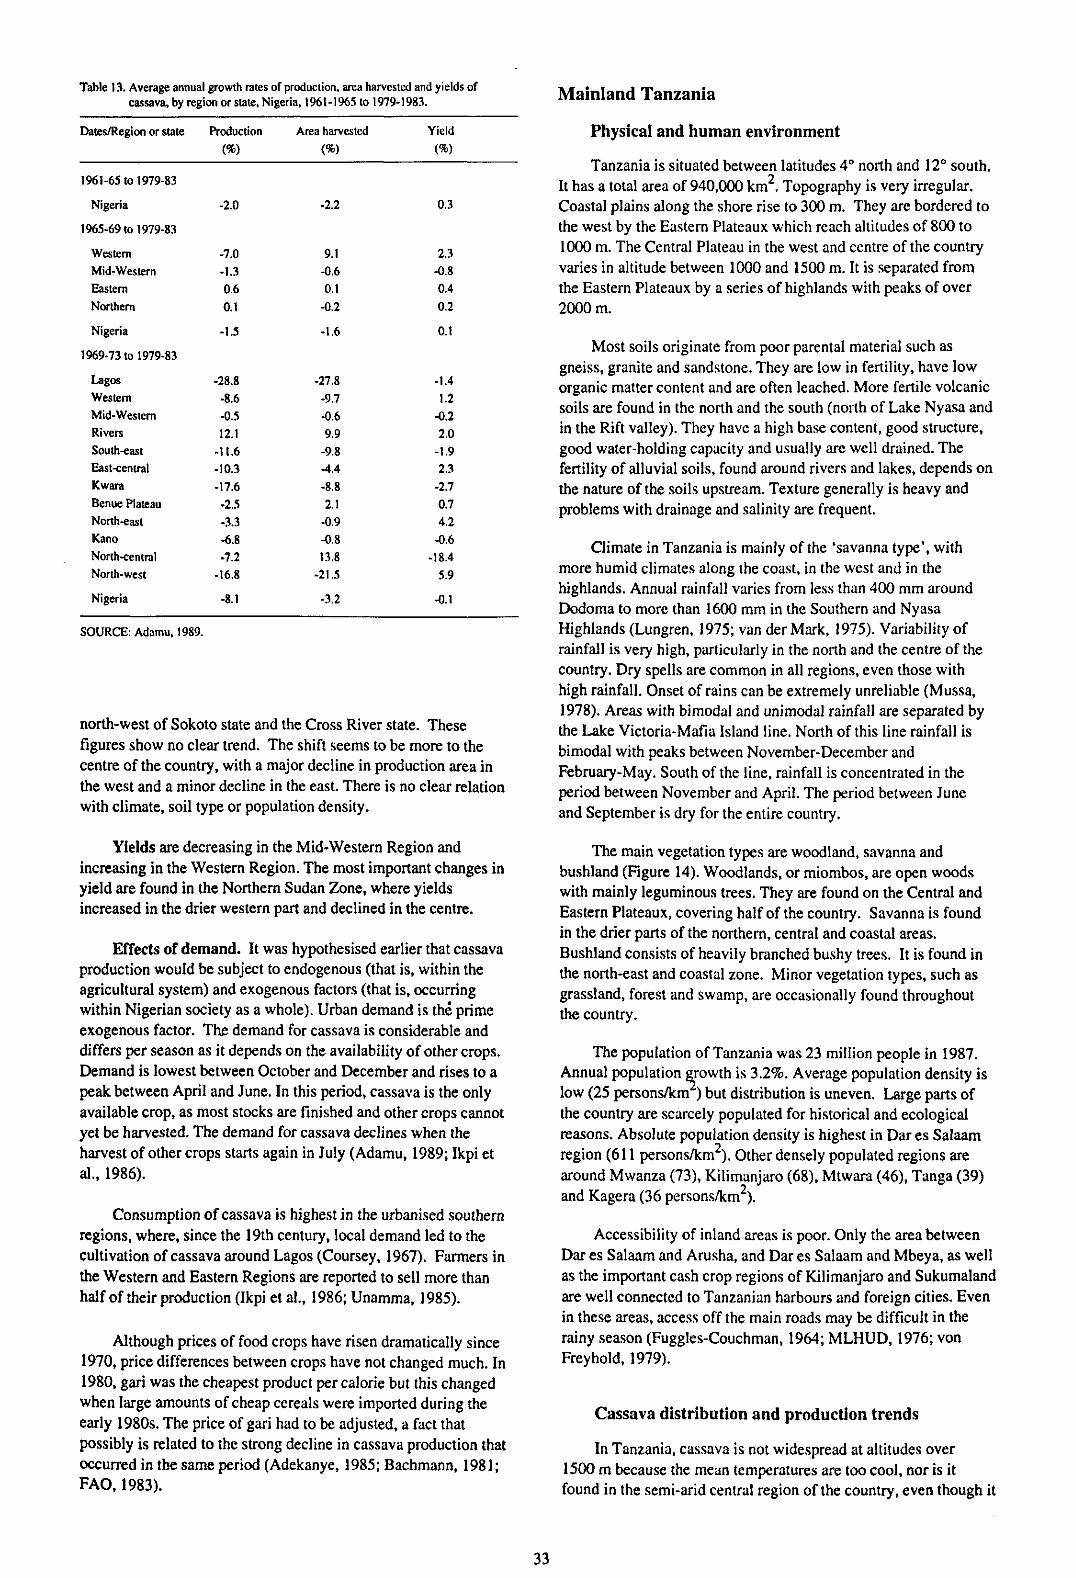
Table 13. Average annual growth rates of production, area harvested and yields of cassava, by region or state, Nigeria, 1961-1965 to 1979-1983.
Dates/Region or state
1961-65 to 1979-83
Nigeria
1965-69 to 1979-83
Western Mid-Western Eastern Northern
Nigeria
1969-73 to 1979-83
Lagos Western Mid-Western Rivers South-east EasKentral Kwara Benue Plateau North-east Kano North-central North-west
Nigeria
Production (%)
-2.0
-7.0 -1.3 0.6 0.1
-1.5
-28.8 -8.6 -0.5 12.1
-11.6 -10.3 -17.6 -2.5 -3.3 -6.8 -7.2
-16.8
-8.1
Area harvested (%)
-2.2
9.1 -0.6 0.1 -0.2
-1.6
-27.8 -9.7 -0.6 9.9
-9.8 -4.4 -8.8 2.1
-0.9 -0.8 13.8
-21.5
-3.2
Yield (%)
0.3
2.3 -0.8 0.4 0.2
0.1
-1.4 1.2
-0.2 2.0
-1.9 2.3
-2.7 0.7 4.2 -0.6
-18.4 5.9
-0.1
SOURCE: Adamu, 1989.
north-west of Sokoto state and the Cross River state. These figures show no clear trend. The shift seems to be more to the centre of the country, with a major decline in production area in the west and a minor decline in the east. There is no clear relation with climate, soil type or population density.
Yields are decreasing in the Mid-Western Region and increasing in the Western Region. The most important changes in yield are found in the Northern Sudan Zone, where yields increased in the drier western part and declined in the centre.
Effects of demand. It was hypothesised earlier that cassava production would be subject to endogenous (that is, within the agricultural system) and exogenous factors (that is, occurring within Nigerian society as a whole). Urban demand is the prime exogenous factor. The demand for cassava is considerable and differs per season as it depends on the availability of other crops. Demand is lowest between October and December and rises to a peak between April and June. In this period, cassava is the only available crop, as most stocks are finished and other crops cannot yet be harvested. The demand for cassava declines when the harvest of other crops starts again in July (Adamu, 1989; Ikpi et al., 1986).
Consumption of cassava is highest in the urbanised southern regions, where, since the 19th century, local demand led to the cultivation of cassava around Lagos (Coursey, 1967). Farmers in the Western and Eastern Regions are reported to sell more than half of their production (Ikpi et al., 1986; Unamma, 1985).
Although prices of food crops have risen dramatically since 1970, price differences between crops have not changed much. In 1980, gari was the cheapest product per calorie but this changed when large amounts of cheap cereals were imported during the early 1980s. The price of gari had to be adjusted, a fact that possibly is related to the strong decline in cassava production that occurred in the same period (Adekanye, 1985; Bachmann, 1981; FAO, 1983).
Mainland Tanzania
Physical and human environment
Tanzania is situated between latitudes 4° north and 12° south. It has a total area of 940,000 km . Topography is very irregular. Coastal plains along the shore rise to 300 m. They are bordered to the west by the Eastern Plateaux which reach altitudes of 800 to 1000 m. The Central Plateau in the west and centre of the country varies in altitude between 1000 and 1500 m. It is separated from the Eastern Plateaux by a series of highlands with peaks of over 2000 m.
Most soils originate from poor parental material such as gneiss, granite and sandstone. They are low in fertility, have low organic matter content and are often leached. More fertile volcanic soils are found in the north and the south (north of Lake Nyasa and in the Rift valley). They have a high base content, good structure, good water-holding capacity and usually are well drained. The fertility of alluvial soils, found around rivers and lakes, depends on the nature of the soils upstream. Texture generally is heavy and problems with drainage and salinity are frequent.
Climate in Tanzania is mainly of the 'savanna type', with more humid climates along the coast, in the west and in the highlands. Annual rainfall varies from less than 400 mm around Dodoma to more than 1600 mm in the Southern and Nyasa Highlands (Lungren, 1975; van der Mark, 1975). Variability of rainfall is very high, particularly in the north and the centre of the country. Dry spells are common in all regions, even those with high rainfall. Onset of rains can be extremely unreliable (Mussa, 1978). Areas with bimodal and unimodal rainfall are separated by the Lake Victoria-Mafia Island line. North of this line rainfall is bimodal with peaks between November-December and February-May. South of the line, rainfall is concentrated in the period between November and April. The period between June and September is dry for the entire country.
The main vegetation types are woodland, savanna and bushland (Figure 14). Woodlands, or miombos, are open woods with mainly leguminous trees. They are found on the Central and Eastern Plateaux, covering half of the country. Savanna is found in the drier parts of the northern, central and coastal areas. Bushland consists of heavily branched bushy trees. It is found in the north-east and coastal zone. Minor vegetation types, such as grassland, forest and swamp, are occasionally found throughout the country.
The population of Tanzania was 23 million people in 1987. Annual population growth is 3.2%. Average population density is low (25 persons/km ) but distribution is uneven. Large parts of the country are scarcely populated for historical and ecological reasons. Absolute population density is highest in Dar es Salaam region (611 persons/km ). Other densely populated regions are around Mwanza (73), Kilimanjaro (68), Mtwara (46), Tanga (39) and Kagera (36 persons/km ).
Accessibility of inland areas is poor. Only the area between Dar es Salaam and Arusha, and Dar es Salaam and Mbeya, as well as the important cash crop regions of Kilimanjaro and Sukumaland are well connected to Tanzanian harbours and foreign cities. Even in these areas, access off the main roads may be difficult in the rainy season (Fuggles-Couchman, 1964; MLHUD, 1976; von Freyhold, 1979).
Cassava distribution and production trends
In Tanzania, cassava is not widespread at altitudes over 1500 m because the mean temperatures are too cool, nor is it found in the semi-arid central region of the country, even though it
33

Figure 14. Vegetation types in Tanzania (from Lungren, 1975).
is grown on all the main soil types found in the country. The main cassava areas are found on Acrisols, Luvisols and Nitosols. Less important cassava areas are mainly situated on Acrisols. Some are found on Cambisols or Ferralsols. Cultivation on Vertisols and Gleysols is found around Lake Victoria and on the coast.
Cassava was introduced to Tanzania by European traders on the coast and by Congolese farmers around Lake Tanganyika. This dual introduction led to the spread of two main types of cassava that differ in size and ecological properties (Morgan, 1973). The role of cassava was very limited before the British started to promote cassava as a famine crop around 1920. Production rose to a peak in the 1970s, after which it became more or less stabilised (Figure 15). Cassava production figures are unreliable, especially the figures from the 1950s (unchanged during six years) and 1960s (when ministries were confronted with enormous staffing problems). Comparison of FAO data with local data compiled by the Tanzanian Ministry of Agriculture suggests that they are interdependent, preventing a cross-check. Comparison with a national survey (Verheij, 1982) suggests that the FAO figures are too high. However, FAO data are often the only available source of information on cassava production.
A comparison of production and area (Figures 15 and 16) suggests that yields may have tripled over one decade, but such an
c o
c o '•B
TJ O
7r-
6
5
4
3
2
/V}K\
r -v/ v
J I I I I 1 L _ l I I I I I I I J 1 1 I I 1 1950 54 58 62 66 70 74 78 82 86 90
Year
— FAO — i — TMA
Figure 15.Cassava production trends in Tanzania (from FAO, 1986; Tanzanian Ministry of Agriculture, 1988).
increase is improbable and unprecedented. Average cassava yields by district show little variation (7.5-10 t/ha), except for Arusha. The sharp rise in production figures between 1974 and 1976 and the enormous decline afterwards demands special attention. The
34

900
jf 800 o o o
^ 700h
< 600
500 400
- ...
-*-•*•••-•.•
I l I I I I ' I I I I I I I 1 I I L _ J
1950 54 58 62 66 70 74 78 82 86
Year
Figure 16. Cassava area trends in Tanzania (from FAO, 1986).
rise could possibly be explained by droughts and the effects of 'Ujamaa' (village resettlement), when land in some areas became extremely scarce. Also, growing demand and increased cassava prices may have played a role. Increased production of other crops due to improved rainfall and crop prices may explain the decline in cassava production after 1976. Cassava purchases by the National Milling Corporation are now increasing. Cassava is the third traded item, after maize and sorghum/millet. However, recent trade figures are unavailable (Bryceson, 1982).
The regional importance of cassava has not changed much during the last three decades. Production of cassava is
concentrated along the shores of Lakes Victoria and Tanganyika, along the coastline and in Rungwa district. Cultivation of cassava in areas with a short growing season is very restricted (parts of Mara, Morogoro, Tanga, Kilimanjaro and Singida regions). Cultivation in areas with an intermediate growing season is rather common. Most cassava is found in areas with a growing season of 150 days or more (as defined by FAO, 1978).
Farming systems with cassava
The importance of cassava in the farming system is characterised by the share of crop area that is occupied. As most food production is consumed at home this also gives an indication of the importance of cassava in the diet. Cassava occupies more than half of the food crop area in the districts of Mtwara in the south-east, Kigoma in the west, Kisaware in the east, and on the islands of Lake Victoria. It occupies one-third to half of the food crop area around Lake Victoria, in the districts of Tanga and Morogoro in the east, and in the south-west of the country. It is of minor importance in other districts (see Figures 17 and 18).
Selected studies of farming systems are presented here with a view to highlighting the factors influencing the importance of cassava.
Mbozi district. Mbozi district is found north of Lake Nyasa in southern Tanzania. Its highland areas (Mbozi Plateau) reach altitudes of 1400 to 1700 m. Rainfall is 1270 mm and
NORTH MARA \ ^ BUKOBA KAGERA ƒ / MUSOMA-
> (^ .UKEREWE pj ^ ^ J > \ L Ä^r^MUGUMU / 4>VxS*-rx.~f' MWANZA. )
( \BIHARAMULO
NGARA/l Ä f c A ^ M ^ MASWA K ARUSHA-f^MANJAR0
KIBONDO
KASULÙ.
KAHAMA ^ S H j N ^ G A ,
NZEGA MBULU
TABORA
IRAMBA
,6INGIDA XKmool
MASAI
KOROGVTE*
rLUSHOTO
fTANGA
f UPEMBA
MPANDA
\
[MANYONI JDODOMA
(MPWAPWA
/KILOSA
HANDENI } pANGANI
^ZANZIBAR
BAGAMOYO^l . DAR ES SALAAM
MOROGORO • KISARAWÉ
\
CHUNYA IRINGA RUFIJI
SUMBAWANGA
V r MBOZI
MBEYA MAFIA
(MUFINDI ULANGA
RUNGWE. I NACHINGWEA K LINDI L*
SONEA / > ^ y *^^S(M"n|\ /ARA
TUNDURUYM A S A5l ' NEWALA
Figure 17. Administrative districts in Tanzania, 1976.
35

200 km — i
t;;:;:3 > 30 %
KHHH 15-30%
[ I H 7"15% I l <7% - . - — district boundary
Proportion of food crop area planted in cassava
••••••••••• • • • • • • • • • • 4 k • • • • • • • » • • , » w
*••*!• • • •
«•••••••••rs...... •••••••••...«•••••••• ..lïïîïîîlîJ-" ••••••••••••3....;.Z;;;jI!SJIi • • • • • • • • • • • •a . > . . . . . . i i ;? ÎJ Î>r ••••»•••••»•s •••«•« «»*'•** • • • • • • • • « ^ ' * * ^
Figure 18. Proportion of food crop area planted in cassava, Tanzania (from FAO, 1986).
temperatures are moderate (a maximum of 27 °C). Soils are fertile, deep, well-drained, brown loams of volcanic origin. The lowland areas (Rukwa Plains and Msangavo Trough) lie in the west of the district. Altitudes range from 900 to 1500 m, rainfall is 800 mm and temperatures are higher than in the adjacent highlands. Soils are dark heavy clays, with lighter soils on higher parts. Inundation during the rainy season is common.
Population density is low. The highest densities are found on Mbozi Plateau, whereas density on the Rukwa Plains (lowland) is very low. Seasonal migration of young men was common in the past but opportunities have declined. Off-farm employment and involvement in cash crop production put a heavy pressure on labour availability.
Major food crops are finger millet, sorghum and maize. Pearl millet is found in the north where temperatures are higher and rainfall is low. Important root crops are potato, sweet potato and cassava. Four cassava varieties are found, three of which are sweet. Arabica coffee is the most important cash crop. Other cash crops are pyrethrum, tobacco and sesame. Coffee is grown on the Mbozi Plateau. Compared with other crops, cassava is more productive per unit of labour and land. Sweet potato has high yields as well, but its cultivation is hindered by a higher demand for labour.
Cattle-raising is found in the dry northern part of the district. East Coast Fever is the major constraint to cattle production on the Mbozi Plateau.
Knight (1974) has given a detailed description of the shifting cultivation systems based on bush or grass fallow. 'Nkomanjila' is
a bush fallow system which is found mainly in drier areas. Important crops grown within this system are finger millet, sorghum, pulses and cucurbits. A typical field is planted with finger millet and sorghum in the first year, followed by a sorghum ratoon in the second year. Land scarcity forces farmers to extend the cropping period and shorten the fallow. The consequent decline in yields is tackled with an increase of field area. Cassava is introduced as the last crop before fallow. The importance of nkomanjila is declining, possibly as a result of labour shortages that limit finger millet production.
'Nkule' is a system based on grass fallow, whereby grass is mounded and burned. Maize and cucurbits are planted on the mounds during the first rains, and later intercropped with finger millet. Cassava can be grown at the end of the cropping cycle or as the sole crop in rotation with a fallow. The cropping period is one year on clay soils and two to three years on lighter soils. Grassland is the natural vegetation of clay soils, but can also result from over-exploitation of more fertile soils. Nkule is becoming increasingly popular, especially in humid areas.
'Mandi' consists of pure root crop cultivation, where cassava is increasingly grown as the first crop in the rotation. The replacement of bush fallow systems by grass fallow systems, the extension of cropping periods and the shortening of fallow are the result of pressure on the existing systems. Especially on the fertile Mbozi Plateau, population pressure and intensive cash crop production are decreasing the availability of labour (because labour is diverted to cash crops) and land. The consequent shortened fallows and declining yields cause a shift to cassava, even though temperatures are not favourable.
36

Southern highlands. Altitude varies between 1700 and 2200 m. Most of the area has an altitude of well above 2000 m, which makes it unsuitable for cassava production. Soils are mostly Regosols with limited fertility. Population density is very low.
According to Friis-Hansen (1987), there are three field types: (1) valley bottoms and river banks are found below 1900 m, and are steeply sloped at higher altitudes. River banks are cultivated throughout the year, forming the only source of food during the dry season. Important crops are maize, wheat, sorghum, Irish potato, legumes and vegetables. Cassava is not commonly found.
(2) In the highland areas (1700-2100 m), with good rainfall (exceeding 1270 mm in four out of five years), the main constraints to agriculture are steep slopes and low soil fertility. Because of village resettlement (since 1974), land pressure and walking distances have increased, especially for resettled farmers. The number of outlying fields has doubled in ten years. Resettled farmers increasingly have to rely on rented land. Cultivation of river banks has been intensified. Fallow has been shortened or omitted and damage from pests and diseases has increased. Maize has replaced sorghum and wheat, because of its higher yields, high resistance to pests and diseases and the possibility of premature consumption. Low yields and land shortage cause a search for off-farm employment. When men leave, women face an increased workload.
(3) In another village study also described by Friis-Hansen (1987), where rainfall was lower (800 mm), topography flat, and soils stony, with low to medium fertility, and access reasonable, drought-resistant crops (sorghum, sweet potato, cassava) are grown during the dry season. Most fields are cropped continuously. Yield decline has been forestalled by increased use of inputs such as fertilisers, pesticides and hybrid maize. The importance of maize has increased. Introduction of draught animals and ploughs has facilitated an increase in cultivated area. Walking distances and labour shortages have increased, especially during weeding (which cannot be mechanised).
Generally in this area, the concentration of people has led to land shortages around the new centres. Fallow has shortened or disappeared and soil fertility has declined unless fertilisers were applied. Temperatures are not favourable for cassava, which is therefore grown only to bridge the dry season, rather than in response to declining soil fertility or labour shortage.
Kagera district. Kagera district is situated west of Lake Victoria. Altitude varies between 1000 and 2500 m. Rainfall ranges from 800 to over 2000 mm. Soils are Ferralsols, Ferralitic soils or Vertisols. Population density is high (from 20 to over 200 persons/km ). Banana is the major crop in the diet, and is supplemented in slack periods with root crops. Beans provide important proteins, especially for poor families that have no livestock. Common field types are banana fields ('kibanje'), gardens ('kishambas') and grassland areas ('rweyas').
Banana fields cover 70% of the area. Arabica coffee, cassava, sweet potato and beans are also grown. Fertility is maintained by use of mulch, household wastes and manure that is collected from corrals. Gardens are cultivated with annual crops and trees for firewood. The main crops are cassava, sweet potato, yam, sorghum and maize. Grassland areas are used for grazing cattle and some food crops (pulses, cassava, finger millet). Fallows of gardens and grasslands are gradually shortened, resulting in yield decline and erosion. Banana cultivation is limited by pest incidence. Although conditions are not optimal for cassava (altitudes are well above 1000 m), it is an important food crop. Production of cassava is stimulated by increasing population pressure, shortening fallow and increasing pest damage on the main cash crop (Kajamulo-Tibaijuka, 1984).
Sukumaland, Maswa and Meatu districts, Shinyanga Region. Rainfall ranges from 700 mm in the south-east to 950 mm in the north-west. The rainy season lasts from December-January to April (5 to 6 months). Dry spells are common in the period January-March. Altitudes vary from 1000 m in the south-east to 1500 m in the east, but most of the area has altitudes ranging from 1200 to 1300 m.
Undulating plains intercepted by large valleys characterise the landscape. There are two types of catenas: (1) a granite catena consisting of deep, well-watered, sandy soils on top and thin soils with higher clay and loam content further down the slope, often with a hard pan; and (2) a lacustrine catena with fertile, well-drained, dark brown, calcareous and loamy soils on the higher parts.
Valley bottoms in both catena types consist of very heavy, often inundated, clay soils. Population density ranges from 27 to 72 persons/km . Accessibility of the area is rather poor, while possibilities for off-farm employment are limited (KIT, 1989).
The existence of different soil types offers the possibility of diversification. Farmers have fields on all soil types to spread the risks. Soils on slopes are preferred to the heavy soils in valley bottoms that are difficult to cultivate. Cotton has been the most important cash crop for decades, but its profitability has decreased. Recently, favourable prices for maize and rice have made them important cash crops. Rice is restricted to the valley bottoms where it is a major crop. Maize is more important in the wetter parts (north-east) where it is replacing sorghum and pearl millet. It is cultivated in monoculture with a short or omitted fallow. Yields are high and damage from birds (a major pest) has not become a major problem. Manure is often not applied, but sometimes maize fields are opened on former corral plots. Pearl millet still is important in the dry south-east, and sorghum is cultivated on inundated fields of the valley bottoms or in dry areas. Sweet potato is an important food crop for bridging the dry season. Cattle is grazed on higher land. Although growing conditions are favourable for cassava, its importance is limited to the highly populated west, possibly because farmers still have ample room for diversification.
Explaining patterns of cassava distribution
Cassava cultivation is important in all the densely populated regions, except for Kilimanjaro and Kagera Regions. While the reasons for the absence of cassava in Kagera are uncertain, in Kilimanjaro the growing season in the lower parts of Kilimanjaro is too short, and the soils on the slopes of Kilimanjaro are sufficiently fertile to allow perennial cash cropping. In several regions, with a relatively low population density (Mara, Shinyanga, Singida, Dodoma and Arusha), low and unreliable rainfall and a short growing season restrict plant growth. These regions are all found in the dry part of the country. Cultivation of cassava is virtually absent, except in the wetter part of Mara.
Furthermore, the matching of cassava distribution with population density (see the model presented in Chapter 4) reveals that cassava is also prominent in densely populated areas considered unsuitable for their heavy soils, particularly around Lake Victoria and in Kigoma district. In the high population density zones west of Lake Victoria, banana and not cassava is the main staple, possibly as a result of elaborate soil fertility preservation techniques. Although cassava is dominant around Dar es Salaam, there is no clear relation between cassava production and distance to main roads or railroads, or accessibility of villages.
The main area of positive residuals in the model, where more cassava is found than would be expected on the basis of demographic and agroecological factors, is Mtwara in the extreme
37

south-east. Thus far, no detailed studies explaining changes in cassava production in that area have been traced.
The post-independence government promoted self-reliance in the production of food crops. As a result, state intervention in agriculture increased, culminating in large-scale resettlement. At the local level, a particular feature of the Tanzanian situation is therefore village resettlement (or the 'Ujamaa' movement), which has had considerable consequences for rural land use. Goldschmidt and Jones (1988) suggest that Ujamaa has resulted in a transformation of physical settlement patterns without prior assessment of land suitability. In the three villages studied by the authors in the Dodoma area, only 1% of the land was highly suitable for cropping and there was a high degree of spatial variation in resource availability. The overall impact of village resettlement on cassava is not documented, but it is not unthinkable that it may in fact have promoted the spread of the crop in two ways: through an increase in the distance to fields, resulting in lower labour inputs (which would favour cassava) and through the allocation of poor soils to farmers. Village resettlement has led to intensification of land use on fields close to the villages while the opposite occurred on distant fields. Around the new villages, land pressure and depletion of soil fertility increased, while farmers' time constraints grew because of the long distances to their old fields.
Zaire
Physical, human and agricultural environment
Zaire, in Central Africa, is situated between latitudes 5° N and 13° S and longitudes 12° and 31° E. It has a total area of more than 2.3 million km . Topography is dominated by its position on the Congo Basin. The centre of this basin is surrounded by a series of ridges in the north (Asande Ridge), east (Great Rift Valley) and south (Luanda Ridge). A narrow gap in the west gives passage to the Congo River on its way to the ocean. Altitudes vary from 200 m in the centre of the Congo Basin to more than 2000 m in the Great Rift Valley.
Three geological layers can be identified: the Congo Basin and the surrounding ridges consist of pre-Cambrian material. They are covered with more recent formations of sand and flintstone in the east and sand and calcareous material in the north, south and west. Soils are Ferralsols or Ferralic Arenosols with some Nitosols in the east and some Gleysols in the north-west and south-east. Vertisols are found around Lake Albert in the north-east (FAO/UNESCO, 1977).
Climate in the north is equatorial with a rainfall of 1600 mm or more and a constant high relative humidity and temperature. Rainfall extends over 10 months and is divided into two seasons. The centre, south and extreme north have a tropical climate with 1500-2200 mm of rainfall, lower temperatures and humidity, and a dry season of 2 to 8 months (KIT, 1984b; Miracle, 1967). Vegetation is tropical forest in the equatorial zone and open forest, savanna or grassland in the tropical zone. Mountainous areas are covered with open woods and grasslands at lower altitudes and alpine vegetation at higher altitudes.
The country is divided into nine administrative regions (known as provinces), including Kinshasa, the capital city (Figure 19). The total population of 32 million is characterised by an annual growth rate of 3%. The distribution of population is rather uneven, with very high densities in Bas-Zaïre and along the borders of Rwanda and Burundi, and a very low density in other parts of the country.
Smallholders represent over 90% of the agricultural labour force. They use simple tools and very few capital inputs. The cultivated area per family rarely exceeds 1 ha in the forest and 2 ha in the savanna zone. Smallholders produce the bulk of the food crops and a considerable proportion of many cash crops (Tshibaka and Lumpungu, 1989). The main crops are cassava, maize, rice and plantains. Cassava is the most important crop in the 'southern belt' which extends from the coast into Shaba. Maize is common in the savanna, and rice is grown near rivers in the north and east. Less important food crops are groundnut, oil palm, sorghum, millets and beans. Principal cash crops are cotton, coffee, tea and pyrethrum.
Distribution and production trends of cassava
Except for some mountainous areas in the east, the whole country is climatically suitable for cassava cultivation. The majority of soils are Ferralsols, Nitosols and Arenosols, and the most important cassava areas are found in provinces where these soils predominate. Soils which offer some restrictions for cassava, mostly Gleysols and some Vertisols, are found in the east and north-west; nevertheless, cassava is commonly grown, even here (see Map 3).
About 65% of the cultivated area in the country is devoted to cassava. It is often grown in association with maize, rice and plantains in the equatorial zone and with beans in the tropical zone (Tshibaka and Lumpungu, 1989). Most cassava cultivation is done by women. The regional distribution of cassava is very uneven. Much land in the Kinshasa and Bas-Zaïre Provinces is devoted to cassava, but cassava plays a much more important role in the diet in other provinces, especially Bandundu and the two Kasai Provinces (Tables 14 and 15).
High population density and intensive production are found in Kinshasa, Bas-Zaïre and the two Kasai Provinces. In Bandundu, Haut-Zaïre and Equateur Provinces, a low population density is combined with intensive cultivation of cassava. In Kivu Province, however, as pointed out many reports, cassava is an important cash crop because of high urban demand (Fresco, 1986; Tollens, n.d.; Tshibaka and Lumpungu, 1989). The area devoted to cassava is increasing steadily. In 1984, the total production area was more than 2.3 million hectares. Average yields (6.8 t/ha), however, are lower than in any other major cassava-producing country. A most striking feature of cassava production is the steady increase in production and area, coupled with a stagnating or declining average yield (Figure 20). At a macroscale, this is a clear indication of the trend towards agricultural extensification.
The relative advantages and disadvantages of cassava compared with other popular staples are highlighted in several studies from Haut-Zaïre (Tshibaka and Kalala, 1983; Tshibaka, 1988). Production of cassava roots and leaves takes 2.6 times the labour input per ha of plantains, whereas rice and maize require 2.9 times and 1.8 times that amount. Again, on a per hectare basis, capital inputs for cassava and maize are about the same, but these are higher than for plantain. However, cassava is the most productive alternative per unit of labour and capital and twice as high as plantain. Cultivated area per household is negatively correlated with labour intensity, possibly as a result of the fact that labour availability in the household does not increase proportionally (and sometimes not at all) with cultivated area. Average farm size in most studies is about 1 ha. At the household level, area increase is also positively correlated with the proportion of cash crops (maize and rice). For all crops, the most important factor explaining output is labour.
38

Kinshasa / Kinshasa f r ^ "
\ Bas-Zaïre / J • Matadi L
O i Bangui " *"-«-»-^ ^ v
] \^ Haut-Zaïre )
j Equateur ) X
\ \ ©Kisangani ^ f
fyS^ \ /""\ J Kivu *S
f^~\ is I Bukabu # \ Bandundu / J * a s a i / )
C Oriental (̂ ( ^ Y Kasai^^ ( [ f • k.kw.i I occidental C / I -v ) Kananga» (""BMbuji - May j / <f
Shaba
Lubumbashi
Figure 19. Provincial boundaries and capitals of Zaire.
Table 14. Relative distribution of cassava by province, Zaire, 1981-1983. Table 15. The importance of cassava in different provinces of Zaire.
Province
Kinshasa
Bas-Zaïre
Bandundu
Equateur
Haut-Zaïre
Kivu
Shaba
Kasai-
Distribution of area
under cassava (%)
4.00
6.00
15.99
10.20
11.10
16.70
13.53
Occidental 12.40
Kasai-Oriental
Zaire
10.10
100.00
Contribution to cassava root output
(%)
3.10
4.60
16.80
10.30
11.50
17.10
13.00
13.00
10.60
100.00
Area allocated to cassava (ha/km2)
7.94
2.20
1.07
0.50
0.44
1.29
0.54
1.56
1.19
0.85
Per capita cassava
root output in cereal
equivalents (kg)
57.12
121.72
203.42
150.52
128.25
161.05
153.04
289.96
236.43
162.99
Province
Kinshasa
Bas-Zaïre
Bandundu
Equateur
Haut-Zaïre
Kivu
Shaba
Kasai-Occidental
Kasai-Oriental
Zaire
Total area
(km2)
9,965
53,920
295,658
402,293
503,239
256,662
496,965
156,967
168,216
2,343,885
Average annual
population (millions)
2.3
1.6
3.5
2.9
3.8
4.5
3.6
1.9
1.9
26.0
Average annual
cassava root output
(000 MT)
433.5
642.7
2.349.5
1,440.5
1,608.3
2,391.5
1,818.1
1,818.1
1,482.4
13.984.6
Average annual
area under cassava
(ha)
79.2
118.8
316.8
201.9
219.8
330.7
268.0
245.5
200.0
1980 6
Average yield
(000MT/ha)
5.48
5.41
7.42
7.13
7.32
7.23
6.78
7.40
7.41
7.06
SOURCE: Tshibaka and Lumpungu, 1989. SOURCE: Tshibaka and Lumpungu, 1989.
The Great Lakes Region. The Great Lakes Region presents an interesting opportunity to study the role of cassava in intensive agriculture in the absence of strong urban demand. Eastern Zaire and the adjacent parts of neighbouring countries are examined together here.
Most of the area lies between 1400 and 1800 m, with some parts at over 2800 m. The topography is rugged, with deep valleys and steep slopes. Rainfall increases with altitude, averaging 1000
to 1500 mm at 1550 to 1800 m, respectively. Vegetation is savanna below 1550 m, open forest at 1550 to 1800 m and dense forest above 1800 m. Soils are Nitosols (in Zaire, West Rwanda and Burundi), Ferralsols (Burundi and central Rwanda), Luvisols (East Rwanda) and Andosols (between Lake Kivu and Lake Edward). Some Vertisols and Gleysols are found at lower altitudes between the lakes, and some Cambisols are found in Burundi (FAO/UNESCO, 1977).
39

15.5
15
14.5
^ 1 4 </> c £ 13.5 o w
— 12.5 c o 8 12
o- 11.5
11
10
10.5
co
C O
co CU
o 7.1 n
7 -
6.9-
6.8-
6.7-
6.6-
6.5-
6.4-I
co
w o o
o
>-
1971 72 73 74 75 76 77 78
Year
-a Yield -A Production •o Area
Figure 20. Trends in production, area and yield of cassava, Zaire, 1971-1984 (data fromTshibaka and Lumpungu, 1989).
Population density is very high (75 to 400 people/km with an average of 130 persons/km ). Density in Zaire is remarkably lower than that of comparable areas in Burundi or Rwanda. Population growth has forced people to open fields on areas least suitable for agriculture (steep slopes, pastures or fallow areas), or to migrate. No important urban centres or seaports are found within 1000 km, and agriculture is mainly oriented towards rural self-sufficiency (Jones and Egli, 1984).
Crop choice is determined by altitude and related factors such as temperature, rainfall, relative humidity and length of growing season. The main staple food crops above 1800 m are potato, wheat, finger millet and peas. Cassava is only found at altitudes under 1800 m, along with plantains, sweet potato, sorghum, maize and beans. Jones and Egli (1984) show, in their analysis of food consumption, that the role of cassava is dominant in the agroecological zones with medium population density (Kagera Valley, mainly in Rwanda and Burundi, 115 persons/km2) and on the low density (60 persons/km ) Maniema slopes (Zaire). In both zones, land is plentiful and fallowing is still practised. On the high plateau, population densities are highest, and sweet potato and plantain are the main staples, because temperatures prohibit extensive cassava production. On the densely populated (235 persons/km ) Zairian side of Lake Kivu, cassava contributes roughly the same amount of calories as plantains and beans, but less than sweet potato and cereals. Although fallows have nearly been abandoned and urban demand is increasing, it is unlikely that the role of cassava will expand because low-altitude land is in short supply.
Explaining cassava residuals: Bas-Zaïre
The importance of Bas-Zaïre in supplying the capital city, Kinshasa, with cassava has been extensively documented (Tollens,
n.d.). The residuals derived from an application of the model, that is, a greater cassava area than expected on the basis on population and climate, can be explained primarily by surplus production for Kinshasa and other urban centres in the region. Roads and marketing infrastructure are excellent by Zairian standards, and distances are relatively small. The question is whether cassava, as opposed to its ecological alternative, maize, has a comparative advantage in the region, on the basis of its tolerance of low soil fertility and low capital inputs, or whether the preference for cassava is purely consumer driven.
It can be hypothesised that both aspects (supply and demand preferences) play a role. When, as a result of the 1980 drought, cassava production was substantially reduced in Bas-Zaïre, massive amounts of cassava were exported from the Bandundu Province. According to Tables 14 and 15, per capita outputs and per hectare yields in Bas-Zaïre and Kinshasa are well below those in Bandundu and several other provinces. Although data on regional trends in cassava area and production are not available, it could be hypothesised that the difference between Bas-Zaïre and Bandundu reflects the differential land use intensification pathways of the regions: in Bas-Zaïre, inframarginal land scarcities emerge and agricultural intensification through the higher use of inputs, such as fertiliser, becomes necessary, whereas in most of Bandundu, area expansion is still feasible, although it inevitably leads to declining yields (cf. Fresco, 1986).
The Bandundu Province itself does not appear as a 'residual' in the model, notwithstanding the dominance of cassava in the region and the farmers' excessive dependence on the crop for food and cash (ibid.; Shapiro, 1988; Tylleskiir et al., 1991). The role of cassava as cash crop is increasing. Farmers in Bas-Zaïre and Bandundu derive most of their farm cash income from cassava (Tshibaka and Lumpungu, 1989).
40

CHAPTER 6
CONCLUSIONS
In this final chapter we attempt to synthétise the information presented in the substantive chapters above, with a view to offering conclusions of value for researchers working on cassava. We look first at the continental level material, then at the case studies, before making an assessment of their combined implications.
In some semi-arid areas, livestock rearing is more important than sedentary agriculture; in others, traditional grains, such as sorghum and millet and increasingly maize, are the main staples. Cassava's importance in humid and subhumid zones can be attributed to its specific adaptability to these environments and the farming systems which typify them.
Summary of Findings from the Continental Analysis of Cassava Distribution
Climate and soils
To recap the findings from Chapter 4, Table 5 showed that 70% of cassava is grown in the following edapho-climatic zones:
1. lowland humid climates, with acid and non-restricting soils;
2. lowland semi-hot climates, with acid and non-restricting soils;
3. lowland continental climates, with acid and non-restricting soils;
4. lowland semi-arid climates, with acid and non-restricting soils; and
5. highland humid climates, with acid and non-restricting soils.
By using available secondary data, we quantified the relationship between cassava and human population distribution in tropical Africa. We found that the percentage area of land in cassava increased with population density, and we described the relationship with a quadratic curve. Our model accounts for 67.9% of the variance in cassava area, (although areas of geographically limited extent in which cassava is heavily concentrated are excluded as separate factors).
The model suggests significant differences in the amount of cassava grown according to climatic and edaphic conditions (Table 4, and Figures 6 and 7). Cassava as a percentage of land area is significantly greater in seasonal than in dry climates, and significantly greater in humid compared with seasonal and dry climates. The area in cassava is similar for soils with no restrictions and acid soils, and significantly greater for those two than for restricted soils (in terms of depth, texture or drainage). Altitude was found to have no significant effect on the spatial distribution of cassava.
It is important to note that our analysis showed no particular preference between unrestricted or acid soils for cassava, once the effect of population was taken into account, although this is qualified by the fact that the area of acid soils is much more extensive than that of unrestricted soils. The relative effect of soils in the model was much less than that of climate, as was shown by the much smaller percentage of the variance explained (Table 4).
Cassava's greater importance in humid areas compared with seasonally moist and especially dry areas is, in large, part a function of the distribution of population. In turn, this depends on the agricultural systems of these areas, their land use intensity, and the populations which they are capable of supporting in the absence of other economic activities or large migratory patterns.
Limitations of the continental analysis
Implicit in the approach used here is the assumption that a cassava-specific climatic classification developed for use in Latin America is also valid for Africa. There is insufficient information available to assess the extent to which cassava varieties in Africa are adapted to climatic conditions. Since it is likely that most of the original importations of cassava came from the humid coastal zones of Brazil, this material may not have been appropriate for semi-arid and cool conditions. The degree to which cassava varieties are locally adapted to soil restrictions in Africa is also largely unknown at present.
The uneven relative distribution of cassava amongst climate and soil regions may therefore be partly attributable to a lack of adapted genetic material. Over 75% of the subtropical areas considered here are in fact semi-arid. In many of the semi-arid areas discussed, pastoralism is more important than sedentary agriculture. Cassava simply may not have had any relevance for people's livelihoods in these areas. Therefore, any assessment of its future potential in such areas requires a far more careful treatment than we could hope to offer here.
The generalised nature of our analysis and, in particular, the small scale do not permit an examination of labour and capital availability as explanatory factors for the distribution of cassava. The model is biased towards supply-side factors, those related to production. There are, however, a number of other, more or less independent factors that may affect the distribution of cassava, but that are difficult, if not impossible, to map. Firstly, there are many historical reasons why cassava is or is not grown in certain areas. In north-western Tanzania, the predominance of banana over cassava is one such example. The mechanisation of processing may make cassava attractive in areas where labour for processing is expensive. Taste or tradition is often mentioned as a reason why cassava is not a preferred food, but it may also be a very strong factor influencing demand. In Zaire, even 'marginal' female farmers sell considerable proportions of their crop to traders supplying cities located hundreds of kilometers away. This fact, incidentally, suggests how careful one must be in a definition of subsistence growers.
One source of inaccuracy specific to the projections made from the model can be attributed to the uncertainty surrounding agricultural policy in Africa. Whilst cassava may be less affected by pricing policies than grains, for example, changes in favour of export or food crops could have a significant influence on the relative importance of cassava.
Secondly, we have not distinguished between rural and urban areas here, except to discount three small and very densely populated urban centres. Cassava is grown widely throughout many African suburban and urban areas, therefore this does not invalidate the model. We were unable to separate most large cities from their surrounding administrative units, either spatially or in the population data. Nor were data available for urban cassava production.
41

Summary of Findings from the Case Studies and Related Material
Findings with respect to our original hypotheses
In Chapter 1 we presented two hypotheses: the first of these was that the distribution of cassava was independent of land-use intensity, and merely a function of population density. We have shown that for most of the area in which cassava is grown this hypothesis is correct. However, some major cassava-producing areas, the Great Lakes Region and south-east Tanzania, for example, do not fit this pattern.
The second hypothesis presented in Chapter 1 was that changes in the distribution of cassava and in the way it is grown at a subregional level reflect the dynamics of African land use. Land-use intensification, or the increased frequency of cropping on a given area, takes on two forms, depending on the degree of inframarginal land scarcity and labour availability. Agricultural intensification implies a move towards higher inputs of biochemicals, particularly fertilisers, and labour per unit area, and usually a shift towards more input-responsive crops such as maize. Agricultural extensification, on the other hand, is found where cropping areas are expanding, because it is easier with existing technology and labour to clear new areas than to intensify.
Cassava plays a role in both intensification and extensification. In extensification, cassava is probably the only crop which tolerates limited labour inputs and has no critical period after establishment, and, above all, tolerates very low soil fertility levels. In these situations, it replaces crops such as yam or millet, because of their higher fertility and labour requirements. Under agricultural intensification, cassava may either be grown as a cash crop for urban markets, or as a food reserve crop on outlying, extensively cultivated fields while other food and cash crops dominate the farming system (see Figure 1). The examples of Kinshasa and Lagos/Ibadan demonstrate that urban demand can be the driving force behind an intensification of cassava production.
Both scenarios may occur at varying scales, within a country, a region, a village, or even within the same farm. The material reviewed in Chapter 5 confirms a strong regional pattern in Nigeria and (tentatively) in Zaire. A number of factors, in addition to population growth, were identified as influencing regional patterns of intensification. These included the expansion of cash crops that do not permit intercropping, in western Nigeria, and commercialisation of cassava, in Bas-Zaïre. Commercialisation of cassava was also cited as a contributory factor towards extensification, in areas on the edge of market hinterlands, such as Bandundu in Zaire. In Tanzania, the scale of variation may be larger, due to microenvironmental differences and perhaps social or cultural differences as well. In general, however, even here cassava is increasing in importance as fallows shorten. In Shinyanga, Tanzania, cassava's low overall importance coincided with a low population density.
Changes in the way cassava is cultivated are difficult to trace. Neither agricultural census reports nor field studies reveal them, unless the studies in question are specifically focused on cassava. The expansion of cassava can also be hidden because it is planted at higher densities while area does not increase (Fresco, 1986; B. T. Kang, 1989, personal communication). There are, as yet, very few reports on the use of chemical inputs in cassava production.
Evidence from other countries, as well as from Nigeria, Tanzania and Zaire, suggests similar trends in land use and in cassava production, that is:
1. Land-use intensification occurs, irrespective of the role of cassava. In Zambia, in Mambwe villages, shortening fallows and a shortage of male labour due to male outmigration led successively to a replacement of the millet-legume rotation, common until the 1950s, by millet monocropping. This resulted in increased weed incidence, and hence maize replaced millet, because of its lower labour requirements. However, before hybrid maize was introduced in the 1980s, many Mambwe cultivators had adjusted to land shortage by adopting cassava (Pottier, 1988). This raises the issue of the extent to which replacement of cassava by maize during system intensification depends on the availability of new technology for either crop. New varieties or hybrids of maize have been far more common in Africa than similar technology for cassava. The cases of Burundi and other high residual areas in the model may represent areas where cassava has not been replaced by maize as land use intensified.
2. In Malawi, cassava is planted 5 weeks before the end of the wet season. Yields are poor but the crop survives the dry season and helps to avoid delays in land preparation at the beginning of the rainy season (ICRA, 1989; H. Binswanger, 1989, personal communication).
3. In southern Cameroon, a trend towards cash crop production is being reversed because of declining prices. The planting of coffee led initially to land shortage, and opened a niche for cassava. Continuing population growth and unfavourable terms of trade for coffee have resulted in an increased production of food crops. The final effects on cassava are still unclear.
4. In another study of Yoruba farms, it was confirmed that all farms in south-west Nigeria had a larger area in cassava than they had twenty years ago (J. Guyer, 1989, personal communication).
5. Agricultural intensification leads to a dramatic increase in multistorey compound gardens. Watson showed that in Nigeria, where population density may reach peaks of 1000 persons/km , compound gardens may occupy as much as 30% of cultivated area, producing 59% of crop output. Per unit area and in monetary terms this output is 5 to 10 times higher than output from outlying fields, while returns to labour are 4-8 times greater (Watson, 1990). Cassava is grown as one of the crops in these intricate compound garden patterns.
Some notable exceptions, however, to these general trends were also reported in Chapter 5, particularly for Zaire. There, cassava's importance in diet is related to its importance as a form of land use. It is also intensively cultivated in some areas of relatively low population density such as Bandundu, and extensively cultivated in others of relatively high population density such as Kivu. One factor which may not have been taken into account in the studies in question is the degree of concentration of population in low density areas such as Bandundu causing relative land shortages at a subregional scale. Putting arguments about the necessary resolution of population data aside, it is clear that commercialisation of cassava and the impact of new cash crops on land pressure will both be significant in any later or more detailed analysis of cassava distribution, at whatever spatial scale.
Conclusions with respect to residual areas identified in the model
From the case study analysis in Chapter 5 we can go some way towards explaining the residuals in the model of cassava
42
distribution. Hence, in Nigeria's Bendel state, we see that cassava has become an important cash crop, as part of a broader process of commercialisation of food crops for export to other regions. Similarly, high residuals in Bas-Zaïre have been explained by surplus production for sale to urban areas, and relatively good infrastructure. Unfortunately, no data were available for the areas identified in Tanzania. Further investigation into possible social or cultural preferences, both in Mtwara and in areas around and including Burundi, merits the attention of social scientists.
The findings with respect to commercialisation of the crop and competition for land from cash crops could be expected to increase the explanatory power of the model, although the nature and availability of such data will probably limit an analysis of this sort to selected regions. Lastly, cassava's role as a source of food security in war-torn areas, such as Angola and Mozambique, merits far more attention than we have been able to give it here. Mozambique, in particular, shows important areas of high positive residuals, but the population and cassava data used for the model may have been made largely redundant by recent events.
Implications for Research
As nearly all agricultural research and, in particular, varietal improvement, entomology and agronomy, is based on crop environmental interactions, the findings on the relative distribution of cassava amongst environment types provide a first important criterion for the stratification of resource allocations in research. Five major climatic regions have been identified as primarily important in terms of the current distribution of the crop. All but one are lowland; the highland climate has a very short total dry season, whilst the lowland climates, all tropical, range from the humid to the semi-arid.
The spatial trends which the study identifies have broad implications for the selection of locations for both biological and socio-economic research on cassava. They point to a continued growth in the importance of cassava throughout most of the present growing areas, but with notable increases in certain ones, particularly the West African Sahel, the Great Lakes Region and west-central Zaire. A distinction must be made between those areas of already high population density, where cassava's importance will grow less slowly, and perhaps eventually decline (see Figure 6), and those of lower density. In the latter, in humid climates in the Zaire basin and in the semi-arid areas where cassava is grown, the expansion is likely to be much more spatially extensive. In the areas of high population density, greater attention to cassava's role in intensive systems is warranted, to develop technology for input-intensive cassava production. The focus of research will need to be different in the less densely populated areas of the humid tropics, and particularly in the semi-arid areas.
With respect to these latter areas, we noted above that in semi-arid areas, cassava is less important than we would expect, given the extent and population of these zones. We also noted the possibility that germplasm adapted to semi-arid climates may have a limited distribution, although the effect of cultural factors as limits to the geographic distribution of cassava must also be taken into consideration. Technical research on cassava in semi-arid areas is warranted primarily by the importance of the crop in East Africa, notably Tanzania and Mozambique. For West Africa, a much broader approach would seem to be necessary, to collect quantitative information on trends in production. From our model, it would seem that the current distribution of cassava in the Sahel is adequately explained by population. However, it will also be important to look at the spread of knowledge about cultivation and processing, for example via circular migratory labour movements (returning migrants) to the coastal belt.
By specifically identifying the areas which do not fit our model, it can tell researchers where to look in more detail for other variables which have an important influence on the distribution of cassava. Burundi and adjacent areas around Lake Victoria, Mtwara and northern Mozambique, Bas-Zaïre, and northern Ghana and Togo merit close examination by agricultural and social scientists interested in understanding more fully the crop's importance.
Table 1 (De Bruijn and Fresco, 1989) summarised trends in population growth, production, area and yield in the main cassava-producing countries. Although cassava production overall is increasing, in several countries, however, the trend is much more unfavourable than the continental average suggests. In Zaire and the Congo republic, even absolute production growth seems to have decreased, and production has resulted nearly entirely from area increases. Declining or stagnating yields in many parts of Central Africa indicate that deterioration of soil fertility under unfertilised shifting and fallow systems is becoming a central issue. It may be a reflection of the dominance of the 'extensification' phase of the evolutionary process outlined in Chapter 1. What is crucial here, if this is the case, is the rate at which systems intensify in the future, and the impact and implications of intensification's not compensating for increased pressure on land resources. The development of sustainable systems to meet growing demands for food and feed, while at the same time safeguarding the natural resource base, remains a major challenge for the 21st century.
The simultaneous existence of patterns of agricultural intensification and extensification suggests that the same diversity will also be apparent in the next decades. Until well into the 21st century, population will increase and so will the need for high land productivity. Agricultural intensification may not continue everywhere, nor at the same rate. Pingali et al. (1987) found that the most intensive systems were in areas with 750-1200 mm mean annual rainfall, while opportunities seem much more limited, even under population pressure, in the superhumid and semi-arid zones. This suggests that in the humid zone in particular, where there are few alternative crops and mechanisation is unlikely because of the absence of animal traction, cassava will remain important.
The extent to which chemical fertiliser will be available at affordable prices to farmers will have a critical influence on the future direction of African agriculture as a whole, in view of the alarming rates of nutrient depletion (Stoorvogel and Smaling, 1990). Although the data presented in Chapter 5 must be interpreted with caution, they seem to suggest that, if fertiliser is available, farmers tend to prefer (hybrid) maize, unless there is strong urban demand for cassava (e.g., in Bas-Zaïre), possibly because maize seed and fertiliser are offered as a package deal. On soils with low inherent fertility, shorter fallows seem to lead to an expansion of cassava if no fertiliser is available. An important, location-specific question is: When does it pay to use fertilisers in cassava?
In the meantime, a number of factors may have a more immediate effect on cassava. The area under cassava has expanded by nearly 40% in the last thirty years (FAO data in De Bruijn and Fresco, 1989), a figure which is bound to considerably underestimate the real total increase as a result of shorter fallows, reduced rotations, a greater proportion of cassava in intercropping and larger fields. Simultaneously, there is a growing incidence of pests and diseases. While the introduction of the cassava mealybug, the green spider mite and cassava bacterial blight occurred independently of this, their spread is undoubtedly related to the increased cropping of cassava. Notwithstanding the success of the biological control programmes initiated by UTA and CIAT, it remains to be seen whether the risk of pests and diseases will reduce cassava's versatility.
43

Unfortunately, it was impossible to trace the distribution of cassava varieties here, let alone changes in varieties. Occasional evidence suggests, however, that farmers themselves experiment with new varieties and that there have been significant shifts in the types and number of varieties grown (e.g., Fresco, 1986). The introduction of improved varieties, bred at UTA or in national programs, is in all likelihood very limited, except for south-west Nigeria (UTA). This is an important matter because there are bound to be clear differences in varietal response to changes in production methods such as fertilisation, weed control and increasing planting densities. In the latter case, some varieties are known to show flat response curves (Cock et al., 1977). The major issue concerning varieties, namely the glucoside content of 'sweet' and 'bitter' varieties, remains unresolved. On a continental scale, the distribution of 'sweet' and 'bitter' varieties is still unknown, as are changes in their relative importance.
Cassava's Role in Development
In the long term, of course, one may question the appropriateness of cassava for African development. Will there be a niche for an extensively grown crop such as cassava; will cassava ultimately be grown as an intensive cash crop or will it be replaced by more input-responsive, more favoured starchy staples? The direction that research on cassava takes can potentially have a very strong influence in deciding the outcome. The nature of that research will in large part be decided by the validity and timeliness of information provided to orient it. The availability of hybrid maize, in combination with well-developed input supply and marketing structures, has greatly boosted that crop's popularity. Similar technology, i.e., input-responsive, pathogen-and-pest-resistant varieties and processing technology, could alter cassava's role towards that of an attractive cash crop.
The importance of cassava as a source of relative food security cannot be emphasised too strongly. It still plays a vital role as a famine reserve crop in risky environments. It provides off-season cash. It imparts a flexibility to farm and household management which, because it largely benefits women, has repercussions which go beyond the merely agricultural. It facilitates the process of adaptation to the rapid cultural and economic changes which are sweeping Africa. A prime challenge facing agricultural research and development is to build on this flexibility, rather than remove or dampen it.
A second point is the question of the future for an intensively grown commercial cassava crop in Africa. The question is valid in
places where system evolution has reached its most intensive, and no doubt will have increasing validity elsewhere. The hinterlands of Lagos, Ibadan and Kinshasa provide evidence suggesting that urbanisation elsewhere in tropical Africa may have a major impact on cassava distribution, if the crop continues to be a cheap staple for urban populations. Experience in Brazil and Thailand suggest that cassava can be successfully marketed as animal feed, but that transportation and market restrictions make this an unlikely alternative for Africa. Can cassava be a motor for development if its image is reversed from a poor man's staple to a cheap source of good quality starch that can be converted into a variety of products? Increased efficiency and profitability of cassava production will then be essential, as well as a clearly targeted agricultural policy and appropriate agricultural and biochemical research in order to influence price elasticities and substitution effects between alternative starches. An adequate assessment of cassava's theoretical production potential could be obtained through the use of crop growth models at a continental scale. The results of such a study, however, are only meaningful for directing agriculture research if they are combined with an understanding of the dynamics of agricultural production in Africa as is presented here.
Improvements in processing, through mechanical and chemical (or biotechnological) methods at different scales may solve one of the main bottlenecks in the crop's utilisation, namely labour shortages. Already, mobile graters that allow immediate peeling at harvest and reduce bulk during transportation seem to be spreading in semi-urban areas in Nigeria.
In the final analysis, there is a very strong case to support further research and development work on cassava, now and in the future, that is clearly oriented towards the different land use intensities. Cassava can bridge the food gap because it can be grown off-season to be harvested at the beginning of the rains. It allows the use of land types that cannot be productive in other ways, even if in the longer term the expansion of agricultural land area should be halted to preserve Africa's precious natural resources. In an intensive agricultural system, cassava can be a highly efficient producer of dry matter per unit area and time. All of these advantages are exploited by African farmers, and can be developed further by research. But central to research and development efforts will be an understanding of the processes of change at work in the systems of which cassava is an integral part, as we hope to have shown here.
44

SUMMARY
Chapter 1: The Dynamics of Cassava in Africa
Cassava (Manihot esculenta Crantz) has become one of Africa's major starchy staples since its introduction in the 16th century. This atlas reviews the geographic distribution of cassava by examining historical and contemporary sources, and attempts to explain this distribution in terms of environmental and socio-economic factors.
The introductory chapter presents a theoretical framework for the analysis of cassava's distribution. The authors argue, firstly, that the crop's geographic distribution must be a function of the role that cassava plays in agrarian societies in Africa. Secondly, that cassava's ecological adaptability and characteristics, such as resistance to drought, allow it to play many different roles, which, in turn, depend on the particular dynamics and intensity of specific farming systems. The atlas is an attempt to discover which factors determine this role, and hence the crop's distribution.
Three basic land-use systems typify African farming. These are shifting/fallow cultivation, permanent cultivation and pastoral/mixed crop-livestock systems. Cassava is an important component of the first two, and its place within these systems is briefly discussed, as are also the reasons for its absence in mixed systems. The chapter then discusses in detail the process of land-use intensification, and cassava's role in the changing systems as this process unfolds. Two main paths of intensification are distinguished: agricultural intensification and agricultural extensification. In the former, where increasing amounts of inputs are applied to farming systems, cassava may be replaced by more responsive crops. However, where there is urban demand for the crop or its subproducts, it can play an important part in system intensification, or as a cheap low-input food which frees labour for other activities. In the latter path, where the agricultural frontier is expanded, cassava becomes important because of its inherent low riskiness and low input requirements.
The introduction postulates some general hypotheses about cassava's distribution. The processes which determine its distribution are manifested at different geographic scales; farm, catena, region and continent. Hence, the analysis must encompass different scales. The introduction so far makes it clear that the overall importance of cassava can increase under different paths of intensification. Our first hypothesis, then, is that the distribution of cassava at the continental scale is independent of specific land-use intensities, and merely a function of population density. The second hypothesis we test is at the regional scale. This is that the importance of cassava will vary in accordance with the stage of intensification reached by local farming systems.
Chapter 2: The Introduction and Diffusion of Cassava in Africa
The second chapter describes cassava's introduction and diffusion in Africa, from the 16th to the 20th centuries. It was introduced by the Portuguese, most likely at multiple points along the coast of tropical Africa. Through contact with the Portuguese, by trade and by overland migration, the crop was diffused by Africans throughout the interior of the continent, in the space of three hundred years.
In Central Africa, it was spread by long-distance trade routes from present-day Angola to Zambia and the Great Lakes Region. It spread even more rapidly by riverine trade along the Congo and its tributaries, moving north and eastwards into Central African Republic, Uganda and southern Sudan. Cassava was also
introduced along the coast of West Africa by the Portuguese; however, here, it diffused much more slowly, because the humid coastal belt was essentially uninhabited. Slaves returning from Brazil and the Mande peoples were instrumental in cassava's spread in West Africa from 1800 onwards. Least is known about the diffusion of cassava in East Africa. There, too, it must have been introduced at Portuguese trading stations, particularly in Mozambique, to spread along the coastal lowlands, up the Zambezi Valley and eventually to the east of the Great Lakes Region. In the 20th century, cassava spread most rapidly in West Africa, particularly outside the humid tropics, as a result of governmental promotion of the crop and of infrastructural developments that encouraged migration. Figure 3 synthétises available information about the process of diffusion of cassava. Area, yield and production have increased continuously in recent times, although the last has not kept pace with population growth.
Chapter 3: Current Distribution of Cassava in Africa
This chapter explains the production of a map showing the contemporary distribution of cassava. Data came from published census statistics and ad hoc reports and documents (sources are listed in Appendix I). Content, quality and collection dates vary enormously amongst these sources. Map construction follows a detailed set of guidelines to try to overcome some of the problems inherent in the data, and to avoid introducing further bias. The map utilises dots to represent specific areas of cassava. Map 1 presents the finished distribution map. Individual country totals are listed in Table 2.
The distribution of cassava in Africa is sharply bounded, both north and south of the equator. Within its range, it displays a non-random pattern of distribution, and is strongly concentrated along the coast of West Africa, in western Zaire, along the east coast of Tanzania and Mozambique and, especially, in the Great Lakes Region.
Chapter 4: The Relationship of Cassava Distribution to Environment and Population
This chapter begins by examining the distribution of cassava in relation to climatic and edaphic conditions. First, it discusses the environmental requirements of cassava. It then develops a cassava-specific climatic and edaphic classification to identify the environments in which cassava is most commonly found. Climate and soils are mapped on computer (Maps 2 and 3), and the area of cassava in each climate and soil class, and in combinations of these, is then calculated, using Map 1. Cassava is grown mostly in the lowland tropics, under a range of climatic regimes, primarily on acid and secondly on unrestricted soils. Ten climatic homologues, eight of which are lowland, contain 70% of cassava.
The analysis then turns to the relationship between the distribution of cassava and human population. It describes the production of a population map (Map 4), using recent census data, at the level of secondary administrative units and standardised for the year 1980. There is a marked correspondence between the areas where population is concentrated and the foci of cassava production (Maps 1 and 4). Particularly notable is the concentration of cassava in West Africa and the Great Lakes Region, and localised concentrations in eastern Tanzania, central Madagascar, Bas-Zaïre and around Maputo in Mozambique. However, there are areas with high population density where cassava is relatively unimportant, such as the mid-altitude highlands of Ethiopia, Burkina Faso, and northern Nigeria, and
45

areas with low to moderate population density with marked concentrations of cassava, such as Mtwara and Morogoro in Tanzania.
The remainder of Chapter 4 is devoted to the construction of a model of how cassava and population distributions are related, and how this relationship is modified by environmental conditions (length of dry season, altitude and generalised soil restrictions). The simplified environmental classes are shown in Map 5. There follows a description of the construction of a stepwise regression model. This estimates cassava as a percentage of land area, with population density as the independent variable and the environmental conditions as factors, or classes of population. The final model explains 67.9% of the variance of cassava area. Nigeria and three small areas are excluded from the analysis, after the construction of an initial model to identify areas of poor data or highly atypical conditions.
Map 6 shows the estimated distribution of cassava from the model. The model shows how cassava increases with population density. Estimated values of land area in cassava are highest in humid climates, followed by seasonally dry climates. Semi-arid climates have least cassava per head of population. Areas where the model does not explain the distribution of cassava well are shown in Map 7. More detailed research is necessary in these areas to identify other factors which influence the quantity of
\ cassava grown. Finally, the model is used to extrapolate the distribution of cassava for the year 2000, using projected population data.
Chapter 5: Distribution and Change in Cassava Production in Three Countries
This chapter aims to validate the theoretical framework and the cassava distribution model through case studies of three important cassava-producing countries: Nigeria, Tanzania and Zaire. For each country, a brief description of the physical and human environments is given, followed by an analysis of the role of cassava in the different farming systems and an assessment of trends in cassava. Finally, characteristics of the local farming systems that may influence the distribution of cassava are considered, and some tentative explanations are offered for the high residuals from the model developed in Chapter 4.
In Nigeria, cassava is grown in many farming systems, as a food crop and, particularly in the south-west where urban demand is high, as a cash crop. Hence, it plays all the different roles hypothesised in the introduction, in accordance with the nature of farming-system dynamics. Data on production trends are poor and inconclusive, although most agree on a significant decline in cassava production between 1963 and the mid-1980s. Within Nigeria, the focus of production has shifted somewhat, from south-west to the central-east, and production is also increasing in the wetter south and drier north. Changes in the distribution of population as it increases, and the search by rural people for greater food security, particularly in drier areas, are important reasons for this change.
In Tanzania, cassava is absent from much of the dry interior. Unlike Nigeria, the relative distribution has not changed much over the last three decades. As grass fallows shorten, cassava's role as last crop in a rotation is changing somewhat, and cassava is becoming the first crop where moisture availability is favourable and where there are few sources of cash. The impact of 'Ujamaa' (village resettlement) on cassava's distribution is not well understood. However, the new spatial arrangements in the allocation of land that were brought about have probably favoured increases in cassava cultivation.
In Zaire, cassava occupies about 65% of cultivated land. Available data at the national level show steady increases in production and area, coupled with declining yields. Cassava is an extremely important component of the diet, particularly in Bandundu and the two Kasai provinces. Around Kinshasa, cassava area was found to be much higher than expected (Chapter 4). This is largely explained by demand from the capital and adjacent urban areas. However, in Bandundu Province, cassava is even more significant, and cassava is exported to Kinshasa from this province in times of crisis. This area does not appear as a residual, probably because the scale of the analysis in Chapter 4 does not permit an accurate portrayal of the spatial pattern of population concentration in the region.
Chapter 6: Conclusions
The first four chapters of the atlas culminate in a model of the crop's distribution which shows that cassava area increases with population. The analysis has a number of limitations. The uneven relative distribution of cassava amongst climate and soil regions may partly be attributable to a lack of adapted genetic material. The generalised nature and small scale do not permit an examination of labour and capital availability as explanatory factors for the distribution of cassava.
The original hypothesis at the continental scale, that the distribution of cassava is mostly a function of population density, is upheld for most areas where the crop is grown. Important exceptions are identified, around the largest urban areas and in the area of highest concentration of the crop. The case study material demonstrates the importance of commercialisation as an explanation for the residuals in West Africa and Zaire. However, in Burundi and Tanzania, no satisfactory explanation for the very large areas in cassava has been found. At the subregional scale, the case study material has shown how cassava plays a role in both intensification and extensification. Both scenarios may occur at varying scales, within a country, a region, a village, or even within the same farm.
The findings on the relative distribution of cassava amongst environment types provide a first important criterion for the stratification of resource allocations in research. Five major climatic regions have been identified as primarily important in terms of the current distribution of the crop. These are:
1. Lowland humid climates, with acid and non-restricting soils.
2. Lowland semi-hot climates, with acid and non-restricting soils.
3. Lowland continental climates, with acid and non-restricting soils.
4. Lowland semi-arid climates, with acid and non-restricting soils.
5. Highland humid climates, with acid and non-restricting soils.
The spatial trends which the study identifies have broad implications for the selection of locations for both biological and socio-economic research on cassava. They point to a continued growth in the importance of cassava throughout most growing areas, but with notable increases in certain ones, particularly the West African Sahel, the Great Lakes Region and west-central Zaire.
The spatial residuals identified in the model tell researchers where to look in more detail for other variables which have an
46

important influence on the distribution of cassava. Of special relevance are Burundi and adjacent areas around Lake Victoria, Mtwara and northern Mozambique, Bas-Zaïre, and northern Ghana and Togo.
In the future, decreasing land productivity, itself reflected in declining cassava yields in many areas, will be a major issue in African agriculture. The response of governments and farmers, whether through policies to encourage intensification or through expansion onto more marginal soils, will have a large say in determining cassava's future role in different places. Meanwhile, the increase in cassava area is likely to lead to greater biological
pressures on the crop. The extent to which these will reduce the crop's versatility remains to be seen.
The direction that research on cassava takes has, potentially, a very strong influence in deciding the crop's role. Information about the dynamic changes to which African farming systems are subject is vital if research is to be well oriented. We have attempted to show here that change is manifested in different ways, at different scales and in different places. These differences must be explicitly recognised in agricultural research. We hope that this atlas helps researchers in cassava to do this.
47


RESUMO
Capîtulo 1: A Dinâmica da Mandioca na Africa
Desde sua introduçâo ocorrida no século 16, a mandioca (Manihot esculenta Crantz) tem-se transformado em um dos principais alimentas a base de almidâo. O Atlas que apresentamos fornece uma revisäo da distribuiçâo geogrâfica da mandioca, e examina para o efeito, as fontes históricas e contemporâneas. Tenta além explicar essa distribuiçâo em termos dos factores ambientais e socio-econômicos.
O capîtulo introdutório apresenta o marco teórico a partir do quai se efetua a anâlise da distribuiçâo da mandioca. Na primeira instância.os autores arguem que a distribuiçâo geogrâfica da cultura tem de ser uma funçâo do papel da mandioca nas sociedades agrîcolas da Africa, e que a adaptabilidade ecológica e as caracterîsticas da mandioca, como por exemplo a resistência à seca, lhe permitem desenvolver papeis diferentes os quais, por sua vez, dependem das dinâmicas particulares e da intensidade dos sistemas especîficos da cultura. Entâo, o Atlas tenta descobrir quais sâo os factores que determinam esse papel bem como a distribuiçâo da cultura.
A agricultura da Africa inclue très sistemas bâsicos de uso da terra: parcela de barbeito, permanente e silvopastoril consorciada. Sendo que a mandioca é um constituinte importante nos dois primeiros sistemas, o capîtulo apresenta uma breve discussäo respeito à posiçâo que ela ocupa dentro deles, e explica as razôes da sua ausência nas culturas consorciadas. Detalha também o processo de intensificaçâo do uso da terra e o papel da mandioca no câmbio dos sistemas à medida que esse proceso evoluciona. No que tange à intensificaçâo, duas rotas podem se distinguir, a da intensificaçâo agrîcola e a da extensificaçâo agrîcola. Na primeira, que aplica cantidades de insumos cada vez maiores aos sistemas agrîcolas, a mandioca pode se remplazar por culturas de maior resposta. No entanto, naqueles sitios onde a demanda urbana pela cultura ou seus sub-productos é notâvel, a mandioca pode representar um papel importante no sistema de intensificaçâo, ou pode se considerar como urn alimento barato e de baixos insumos que deixa libre a mâo de obra para ocupâ-la em outras atividades. Na segunda, que tem que ver com a expansâo da fronteira agrîcola, a mandioca torna-se importante toda vez que é uma cultura que implica baixos requerimentos e os riscos nos que se incorrem sâo menores.
A introduçâo postula algumas hipóteses gérais enquanto à distribuiçâo da mandioca; o processo que a détermina manifesta-se em diferentes escalas como sâo propriedade, vila, regiâo e o continente. Assim sendo, a anâlise abränge diferentes escalas e a introduçâo do capîtulo esclarece que a importância gérai da cassava pode acrescentar-se seguindo as diferentes rotas de intensificaçâo. Nossa primeira hipótese indica que a distribuiçâo da mandioca a escala continental é independente das intensidades especîficas do uso da terra, sendo, portanto, somente uma funçâo da densidade de populaçâo. A segunda hipotêse refere-se à escala continental e indica que a importância da mandioca poderâ variar no futuro, de acordo com a etapa de intensificaçâo atingida pelos sistemas de cultura praticados localmente.
Capîtulo 2: A Introduçâo e Difusâo da Mandioca na Africa
O segundo capîtulo refere-se à distribuiçâo e difusâo da mandioca na Africa, desde o século 16 até o 20. Essa cultura foi introduzida pelos Portugueses, muito provâvelmente em varias localidades ao longo da costa da Africa tropical. Através do contato com os
Portugueses, graças ao comércio ou à migraçâo de outros sitios afastados, a cultura foi espalhada até o interior do Continente pelos africanos, num espaço de trescentos anos.
Na Africa Central, a cultura espalhou-se através do comércio efetuado pelas rotas de longa distância desde o que hoje é Angola até Zambia e a Regiâo dos Grandes Lagos. Esse processo de difusâo foi mais râpido graças ao comércio ribeirinho praticado ao longo do Congo e seus tributârios, indo desde o norte e o leste até a Repûblica Centro-Africana, Uganda e o sul do Sudam. A mandioca foi também introduzida pelos Portugueses ao longo da costa da Africa Oriental; no entanto, o espalhamento nesta area foi muito mais devagar toda vez que a faixa costeira nâo estava completamente habitada. A partir de 1800 os escravos que voltaban do Brazil e os intégrantes das tribos Mandes foram instrumentos importantes na difusâo da mandioca na Africa Oriental. No que diz à extensäo da mandioca na Africa do Leste, o que se conhece é muito pouco. Também, nesta zona ela poderia ter sido introduzida nas localidades de comércio portuguesas, particularmente em Moçambique, e espalhou-se ao longo das terras baixas costeiras até o Vale do Zambesi, e eventualmente até o leste da Regiâo dos Grandes Lagos. No século 20 a mandioca extendeu-se mais râpidamente na Africa Occidental, especialmente nas areas localizadas fora dos trópicos ümidos, como resultado da promoçâo da cultura por parte do governo e dos desenvolvimentos de infraestrutura que favoreceram a migraçâo. A Figura 3 apresenta um resumo das informaçôes disponîveis quanto ao processo de difusâo da mandioca. Recentemente, a ârea o rendimento e a produçâo têm-se incrementado de maneira continua embora a ultima nâo tenha igualado o crescimento da populaçâo.
Capîtulo 3: Distribuiçâo A tuai da Mandioca na Africa
Neste capîtulo apresenta-se a explanaçâo da forma como foi produzido o mapa que mostra a distribuiçâo contemporânea da mandioca. Os dados foram tornados de censamentos estatîsticos publicados anteriormente, bem como de informaçôes e documentos cujas fontes apresentam-se no Apéndice I. O conteûdo, a qualidade e as datas de recoleçâo variam amplamente dentro destas fontes. A construçâo aplica um conjunto detalhado de guias a fim de tentar solucionar alguns dos problemas própios das datas, além de evitar a introduçâo de um sesgo posterior. O mapa utiliza os pontos para representar âreas especîficas de mandioca; o mapa No. 1 apresenta distribuiçâo finalizada e a Tabela 2 mostra o total de paîses ao nîvel individual.
A distribuiçâo da mandioca na Africa mostra uma delimitaçâo marcante tanto no norte quanto no sul do Equador; dentro de seu rango, ela apresenta um patrâo de distribuiçâo aleatório e se concentra principalmente ao longo da costa da Africa Occidental, no occidente de Zaire, ao longo da costa oriental da Tanzania e Moçambique e, especialmente, na Regiâo dos Grandes Lagos.
Capîtulo 4: Relaçâo da Distribuiçâo da Mandioca com o Meio Ambiente e a Populaçâo
O capîtulo começa examinando a distribuiçâo da mandioca corn relaçâo as condiçôes do clima e do solo. Preliminarmente, refere-se aos requerimentos ambientais da mandioca; desenvolve logo uma classificaçâo climâtica e edâïica especîfica à mandioca, e que permite identificar os ambientes nos quais é comunmente achada essa cultura. Os mapas de climas e solos (mapas No. 2 e No. 3) sâo desenhados no computador; a area da mandioca em
49

cada clima e classe de solo, e a combinaçâo deles é calculada utilizando o mapa No. 1. A mandioca é cultivada maiormente nos trópicos das terras baixas sob um amplo rango de regimes climâticos, principalmente de solos âcidos e nâo restringidos. Isto quer dizer que aqueles lugares que têm climas similares, oito dos quais sâo terras baixas, comtém o 70% da mandioca cultivada.
A anâlise volta entâo para a relaçâo entre a distribuiçâo da mandioca e a populaçâo humana. Descreve, portanto, o desenho e produçâo do mapa de populaçâo (mapa No. 4), usando dados tornados de censamentos récentes, ao nivel de unidades administrativas secundârias que foram normalizadas para o ano de 1980. Evidência-se uma notória correspondéncia entre as areas de concentraçâo de populaçâo e o centro de produçâo da mandioca (mapas No. 1 e No. 4). É particulamente notório que a produçâo da mandioca centraliza-se na Africa Occidental e nos Grandes Lagos; observam-se concentraçôes localizadas no leste de Tanzania, no centro de Madagascar, no Baixo Zaire e ao redor de Maputo, em Moçambique. Contudo, existem areas com uma alta densidade de populaçâo onde a mandioca nâo é relativamente importante; dentro dessas areas encontram-se as terras altas de altitude média de Etiopia, Burkina Faso e norte de Nigeria, e aquelas com densidades de populaçâo baixa a moderadas com concentraçôes marcantes de mandioca, como Mtwara e Morogoro em Tanzania.
O que resta do capitulo 4 é dedicado a explicar a forma como foi construido o modelo que indica a relaçâo entre a mandioca e as distribuiçôes de populaçâo, bem como a maneira em que essa relaçâo é modificada pelas condiçôes ambientales, como por exemplo, duraçâo da época seca, altitude, e restriçôes generalizadas do solo. As classes de ambiente simplificadas sâo mostradas no mapa No. 5; segue uma descriçâo da construçâo de um modelo escalonado de regressâo. Esse modelo faz uma estimativa da mandioca em termos de porcentagem de ârea de terra, considéra a densidade de populaçâo como a variâvel independente, sendo as condiçôes ambientais os factures ou classes de populaçâo. O modelo final explica o 67.9% da variaçâo na ârea da mandioca. Após a construçâo de um modelo inicial, efetuado com o intuitu de identificar areas com uma disponibilidade déficiente de dados ou de condiçôes altamente atipicas, a Nigeria e mais outras très areas pequenas sâo excluidas da anâlise.
O mapa No. 6 ilustra a distribuiçâo estimada da mandioca partindo do modelo existente. Esse, mostra o incremento da cultura da mandioca, que ocorre à par que a densidade de populaçâo. Os valores estimados de ârea de terra dedicada à cultura de mandioca sâo os mais altos nos climas ûmidos, seguem logo os climas estacionais sêcos; os climas semi-ândos têm o menor valor em mandioca per capita. As areas onde o modelo nâo explica acuradamente a distribuiçâo de mandioca apresentam-se no mapa No. 7. Salienta-se que é preciso efetuar mais trabalhos de pesquisa em estas âreas para identificar outros factures que influenciam a quantidade de mandioca cultivada. No final, o modelo é utilizado para extrapolar a distribuiçâo de mandioca para o ano 2000, usando dados projetados de populaçâo.
Capitulo 5: Distribuiçâo e Câmbio na Produçâo de Mandioca en Très Paîses
O capitulo tem o intuito de legitimar o marco teórico e o modelo de distribuiçâo de mandioca através do estudo de casos de très importantes paîses produtores de mandioca: Nigeria, Tanzania e Zaire. Para cada um deles, apresenta-se uma breve descriçâo dos ambientes fîsicos e humanos, uma anâlise do papel da mandioca nos diferentes sistemas de cultura, e uma valoraçâo das tendências enquanto à cultura. No final, consideram-se também as caracterîsticas que podem influenciar na distribuiçâo de mandioca,
e se fornecem algumas explicaçôes de tipo tentativo para os altos residuais que ficaram do modelo desenvolvido no Capitulo 4.
Em Nigeria a mandioca é cultivada em muitos sistemas de cultura; é plantada como cultura alimentâria —particularmente no sul-occidente onde a demanda urbana é muito alta— e como cultura para obter ganhos econômicos. Entâo, ela joga todos os diferentes papeis que foram hipotetizados na parte introdutória desta publicaçâo, segundo a natureza das dinâmicas dos sistemas de cultura. Os dados tangentes as tendências de produçâo sâo insuficientes e nâo estâo concluidos embora a maior parte deles concordam em uma reduçâo significativa na produçâo de mandioca entre o ano de 1963 e os meados da década de 80. Dentro da Nigeria o centro de produçâo teve um ligeiro incremento, desde o sul-occidente até a parte leste central; a produçâo também se tem incrementado na zona ùmida do sul e na zona seca do norte. Os câmbios na distribuiçâo de populaçâo à medida que a cultura da mandioca aumenta, bem como a busca de uma maior segurança alimentâria por parte da populaçâo rural, especialmente a das areas secas, sâo razôes importantes que explicam esse câmbio.
Em Tanzania a mandioca nâo é cultivada em muitas zonas sêcas do interior; a diferência da Nigeria, a distribuiçâo relativa nâo tem mudado muito nas ultimas très décadas. Na medida que a cultura migratória diminui, o papel da mandioca como cultura duradoura rotatoria também foi-se transformando, tornando-se numa cultura importante naqueles lugares onde a disponibilidade de umidade é favorâvel e naqueles onde nâo se têm muitas fontes de dinheiro. É bem conhecido o impacto da "Ujamaa" (vila de colonizaçâo) na distribuiçâo da mandioca; no entanto, os récentes arranjos de tipo espaciâl quanto à alocaçâo de terras, provâvelmente têm favorecido os acrescimos na cultura de mandioca.
No Zaire a mandioca ocupa em média um 65% da terra cultivada. Os dados disponîveis ao nivel nacional mostram incrementos fixos em ârea e produçâo, que vâo à par com as reduçôes no rendimento. A mandioca é um componente de muita relevância na dieta, especialmente em Bandundu e Kasai. Em Kinshasa, a ârea de mandioca observada foi muito mayor da esperada (Capitulo 4) o quai pode se explicar pela demanda que provêm da capital e das âreas urbanas localizadas ao redor. No entanto, na regiâo de Bandundu a mandioca é muito mais significativa, sendo mesmo exportada a Kinshasa em perîodos de crise. Essa ârea nâo parece ser uma das residuais, provâvelmente porque a escala utilizada para a anâlise, no Capitulo 4, nâo permite obter uma visâo acurada do patrâo espaciâl de concentraçâo de populaçâo na regiâo.
Capitulo 6: Conclusôes
Os primeiros quatro capîtulos do Atlas finalizam em um modelo de distribuiçâo da cultura, que indica que a ârea dedicada à cultura da mandioca aumenta à par da populaçâo. A anâlise apresenta muitas limitaçôes; a distribuiçâo de mandioca relativamente nâo uniforme entre regiôes de clima e solo pode atribuir-se, em parte, a uma falta de material genético adaptado as condiçôes locais. A natureza generalizada e a pequena escala nâo permitem efetuar uma revisâo da disponibilidade de mâo de obra e capital como factures que ajudem a explicar a distribuiçâo da mandioca.
A hipótese original à escala continental, que postula que a distribuiçâo de mandioca é principalmente uma funçâo da densidade de populaçâo, é aceitada para a maioria das âreas onde a cultura é produzida. Embora, identificam-se exceçôes importantes ao redor das âreas urbanas mais grandes e naquelas onde foi observada a mais alta concentraçâo da cultura. O material para o estudo do caso demonstra a importância da comercializaçâo, fato
50
que explica os residuais na Africa Occidental e no Zaire. Näo entanto, em Burundi e Tanzania näo foi achada nenhuma explicaçâo satisfatória para as muitas areas de mandioca cujo tamanho é considerâvel. Ao nîvel sub-regional, o material do estudo mostrou que a mandioca joga urn papel saliente tanto na intensificaçâo quanto na extensificaçâo. Ambos os cenârios podem apresentar-se em diferentes escalas dentro de um pais, uma regiâo, uma vila, ou mesmo dentro da mesma propriedade.
As observaçôes tangentes à distribuiçâo relativa da mandioca entre os diferentes tipos de ambientes fornecem um critério importante para a estratificaçâo da alocaçâo de recursos destinados à pesquisa. Em primeira instância, cinco regiôes climâticas principais foram identificadas como importantes, em termos da distribuiçâo atual da cultura, e sâo:
1. Climas de terras baixas ûmidas, com solos âcidos e näo restringidos.
2. Climas de terras baixas semi-câlidas, com solos âcidos e näo restringidos.
3. Climas de terras baixas continentals, com solos âcidos e näo restringidos.
4. Climas de terras baixas semi-âridas, com solos âcidos e näo restringidos.
5. Climas de terras altas ûmidas, com solos âcidos e näo restringidos.
As tendências espaciais, que identifica o levantamento, têm amplas implicaçôes para a seleçâo de lugares para a pesquisa biológica e socio-econômica da mandioca. Essas tendências indicam um crescimento continuado da relevância da mandioca na maior parte das areas, mas mostram um aumento notâvel em algumas, particularmente no Sahel Afro-occidental, a Regiâo dos Grandes Lagos e o centro-occidente do Zaire.
Os espacios residuais identificados no modelo indicam aos pesquisadores quais sâo os lugares onde devem procurar com mais esforço outras variâveis que têm influência importante na distribuiçâo da mandioca. Burundi e as âreas que ficam perto do Lago Victoria, Mtwara e o norte de Moçambique, Baixo Zaire, norte de Ghana e Togo deveriam se examinar mais minuciosamente por parte dos cientistas agrîcolas e sociais interessados em conhecer de forma mais compléta a importância da cultura.
No futuro, a reduçâo da produtividade da terra, mesmo reflexada na diminuiçâo dos rendimentos de mandioca em muitas âreas, sera uma experiência importante na agricultura Africana. A resposta dos governantes e produtores, seja através de polîticas que estimulem a intensificaçâo ou da expansâo a outras solos mais marginais, terâ uma grande conseqüência na determinaçâo do futuro papel da mandioca em diferentes localidades. Entretanto, o incremento na ârea de mandioca levarâ provâvelmente a experimentar maiores pressöes biológicas na cultura. Até que ponto essas pressôes reducirâo a versatilidade da cultura, é algo ainda por ver.
A direçâo dos trabalhos de pesquisa em mandioca représenta, potencialmente, uma influência muito forte para decidir o papel da cultura. As informaçôes tangentes aos câmbios na dinâmica da cultura, aos quis estâo sujeitos os sistemas de cultura Africanos, é de vital importância para orientar a pesquisa de uma maneira certa.
Nossa intençâo tem sido a de mostrar nesta publicaçâo o fato de o câmbio manifestar-se em diferentes formas, diferentes escalas e diferentes localidades. Essas diferências têm de ser reconhecidas explicitamente nos trabalhos de pesquisa agrïcola. É nosso desejo que o Atlas que apresentamos empreste ajuda aos pesquisadores em mandioca para atingir esse objetivo.
51


RESUME
Chapitre 1: La Dynamique du Manioc en Afrique
Le manioc (Manihot esculenta Crantz) est devenu l'un des principaux produits alimentaires à base d'amidon de l'Afrique depuis son introduction au seizième siècle. Cet ouvrage passe en revue la distribution géographique du manioc sur des bases historiques et contemporaines et tente d'expliquer cette distribution en fonction de l'environnement et de facteurs socio-économiques.
Ce premier chapitre présente un cadre théorique de l'analyse de la distribution du manioc. Tout d'abord, les auteurs montrent que la distribution géographique de cette culture est fonction du rôle que joue le manioc dans les sociétés africaines. Deuxièmement, que l'adaptabilité écologique du manioc et ses caractéristiques, telle que la résistance à la sécheresse, lui permettent de jouer des rôles différents, lesquels, à leur tour, dépendent de la dynamique et du degré d'intensité des systèmes agraires. Cet ouvrage est un essai pour découvrir quels sont les facteurs que déterminent ce rôle et quelle est la distribution de la culture.
Trois systèmes agraires de base caractérisent l'agriculture africaine: (1) la culture sur défriche, (2) la culture permanente, et (3) les systèmes mixtes agriculture/élevage. Le manioc est un élément très important dans les deux premiers systèmes décrits ci-dessus et sa place dans ces systèmes est brièvement discutée ainsi que son absence dans les systèmes mixtes. Dans ce chapitre, sont examinés ensuite, dans le détail, le processus d'intensification d'utilisation de la terre et le rôle du manioc dans les changements des systèmes comme cela est observé dans ce processus. Deux principales voies d'intensification ont été distinguées: le système d'agriculture intensif et le système extensif. Dans le premier cas, lorsque les intrants augmentent dans les systèmes agraires, le manioc peut être remplacé par des cultures plus productives. Cependant, là où il y a une demande urbaine de ce produit et de ses sous-produits, il peut jouer un rôle très important dans le système d'intensification ou devenir un aliment bon marché à faibles intrants en libérant ainsi du travail pour d'autres activités. Dans le deuxième cas, le manioc est très important à cause de son faible risque et des faibles besoins en intrants.
L'introduction de cet ouvrage préconise quelques hypothèses à propos de la distribution du manioc. Le processus qui détermine sa distribution se manifeste à différents niveaux: la ferme, la catena, la région et le continent. Ainsi, l'analyse doit considérer les différents niveaux. Dans l'introduction, nous montrons clairement que l'importance du manioc augmente avec les différentes voies d'intensification. Notre première hypothèse est donc que la distribution du manioc à l'échelle continentale est indépendante de l'intensité spécifique de l'utilisation de la terre mais est fonction de la densité de la population. La seconde hypothèse est à l'échelle régionale. L'importance du manioc change selon le degré d'intensification atteint par les systèmes agraires locaux.
Chapitre 2: L'introduction et la diffusion du manioc en Afrique
Ce chapitre fait une description de l'introduction et de la diffusion du manioc en Afrique depuis le seizième siècle jusqu'à aujourd'hui. Il fut introduit par les Portugais le long de la côte de l'Afrique tropicale dans de nombreux ports par le commerce et par les migrations. La culture a été répandue par les Africains à l'intérieur des terres depuis trois cents ans.
En Afrique Centrale, il a été diffusé grâce aux routes de commerce sur de longues distances, c'est-à-dire d'Angola en Zambie et jusque dans la Région des Grands Lacs. Mais plus rapidemment encore la culture a été diffusée le long du fleuve Congo depuis le nord jusqu'à l'est, à travers la République Centrafricaine, l'Ouganda et le sud du Soudan. Le manioc a aussi été introduit par les Portugais le long des côtes de l'Afrique de l'Ouest mais plus lentement parce que la grande pluviosité de la ceinture côtière rendait cette région presque inhabitée. Le retour des esclaves du Brésil et les peuples Mande à contribué à répandre le manioc depuis 1800 jusqu'à aujourd'hui. On ne sait presque rien sur la diffusion du manioc en l'Afrique de l'Est. Là aussi le manioc aurait été introduit par les Portugais à travers leurs ports de commerce, spécialement au Mozambique, et cette culture s'est répandue dans terres basses et le long de la vallée du Zambèze et peut-être jusqu'à l'est de la Région des Grands Lacs. Au vingtième siècle le manioc s'est répandu plus rapidemment, en Afrique de l'Ouest, hors de la zone tropicale humide, grâce à la promotion de cette culture par les gouvernements et au développement des infrastructures qui favorisent les migrations. La Figure 3 synthétise l'information du processus de diffusion du manioc.
Les superficies, les rendements et la production ont continué à augmenter récemment quoique la production n'augmente pas au même rythme que la population.
Chapitre 3: Tendance de la distribution du manioc en Afrique
Ce chapitre nous explique la carte qui montre la répartition de la production actuelle du manioc en Afrique. Les données ont été collectées dans des documents récents (cf. Annexe I). Ces données varient énormément selon les sources. L'établissement de la carte suit en détail un guide afin de pouvoir surmonter les problèmes innés aux renseignements et éviter d'introduire de nouvelles erreurs. La carte utilise des points pour représenter les surfaces où est produit le manioc. La Carte 1 montre la distribution actuelle. Les totaux par pays sont portés dans le Tableau 2.
La distribution du manioc en Afrique est bien délimitée au nord et au sud de l'équateur. A l'intérieure de sa zone de culture, le manioc n'est pas réparti au hazard mais est fortement concentré le long de la côte de l'Afrique de l'Ouest, à l'ouest du Zaïre, le long de la côte de l'est de la Tanzanie et du Mozambique et spécialement dans la Région des Grands Lacs.
Chapitre 4: Rapport entre la distribution du manioc, l'environnement et la population
Ce chapitre commence par examiner la distribution du manioc par rapport au climat et aux conditions édaphiques. D'abord, les conditions d'environnement pour la culture du manioc sont discutées. Ensuite, une classification des conditions climatiques et édaphiques spécifiques pour la culture du manioc est développée (Cartes 2 et 3). Les données climatiques et édaphiques traitées selon les superficies cultivées en manioc sont ensuite mesurées pour chaque classe de sol et de climat et pour la combinaision des deux. Elles sont reportées dans la Carte 1. Ainsi, on observe que le manioc est cultivé de préférence dans les zones basses des tropiques sous une série de régimes climatiques, premièrement sur sols acides et deuxièmement sur tous les sols. Parmi dix types de climats où est cultivé le manioc, huit se trouvent dans des zones basses qui produisent le 70% du manioc.
53

L'analyse se concentre ensuite sur le rapport entre la distribution du manioc et la population humaine. Elle montre la production sur une carte de population (Carte 4) en utilisant les données d'un recensement récent au niveau des unités administratives secondaires standardisée à l'année 1980. Il y a une correspondance remarquable entre les zones habitées et les zones de production du manioc (Cartes 1 et 4).
La concentration de la culture du manioc est particulièrement remarquable en Afrique de l'Ouest et des Grands Lacs. D'autres concentrations se localisent à l'est de la Tanzanie au centre de Madagascar, dans le Bas-Zaïre et autour de Maputo au Mozambique. Cependant il y des régions avec forte densité de population où le manioc est relativement peu important, comme dans les Hauts Plateaux d'Ethiopie, au Burkina Faso et au nord du Nigeria. Il y a des régions à faible ou moyenne densité de population où le manioc est bien cultivé, comme Mtware et Morogoro en Tanzanie.
La fin du quatrième chapitre est consacré à la construction d'un modèle qui montre le rapport entre la distribution du manioc et la distribution de la population et comment ce rapport est modifié par les conditions de l'environnement (longueur de la saison sèche, altitude et contraintes du sol). Des classes simplifiées d'environnement sont portées sur la Carte 5. Suit une description de l'élaboration d'un modèle selon la régression pas à pas ("STEPWISE"). Celui-ci estime la production du manioc comme un pourcentage de la surface du sol, avec la densité de la population comme variable indépendante et les conditions du milieu comme facteurs ou classes de population.
Le modèle final explique le 67.9% de la variabilité de la surface du manioc. Le Nigeria et trois petites zones ont été exclues de l'analyse après la construction d'un modèle initial qui identifie les zones qui ne contiennent que peu de données ou qui sont atypiques.
La Carte 6 montre la distribution du manioc à partir du modèle. Celui-ci montre comment le manioc augmente avec la densité de la population. Les valeurs estimées des superficies cultivées en manioc sont beaucoup plus importantes sous les climats humides que sous les climats à saisons sèches. Les climats semi-arides produisent moins de manioc par tête d'habitant. Les zones où le modèle n'explique pas la distribution du manioc sont bien montrées dans la Carte 7. Il faudra plus de recherches pour identifier d'autres facteurs qui peuvent influencer la culture du manioc. Finalement le modèle est utilisé pour extrapoler la distribution du manioc à l'horizon 2000 en projetant les données de population.
Chapitre 5: Distribution et dynamique de la production du manioc dans trois pays
L'objectif de ce chapitre est de justifier le cadre théorique et le modèle de distribution du manioc à travers les études de trois pays qui sont importants pour la production du manioc: le Nigeria, la Tanzanie et le Zaire. Chaque pays fait l'objet d'une courte description de l'environnement physique et humain, suivie d'une analyse du rôle du manioc dans les différents systèmes d'agriculture et une estimation de la tendance de la production du manioc. Finalement les caractéristiques des systèmes agraires locaux qui peuvent influencer la répartition de la culture du manioc sont étudiés et quelques tentatives d'explication sont présentées concernant les grands résidus du modèle du chapitre 4.
Au Nigeria, le manioc est cultivé dans différents systèmes, comme culture vivrière, particulièrement dans le sud-ouest. Là où la demande urbaine est importante, il est une culture de rente.
Ainsi il joue tous les rôles relevés dans l'introduction, en accord avec la nature de la dynamique des systèmes agraires.
Les données sur les tendances de la production sont peu abondantes et incertaines quoique la plupart s'accordent à constater une diminution de la production du manioc entre 1963 et les années 1980. Au Nigeria, le centre de la production a changé quelque peu du sud-ouest jusqu'au centre-est. Elle est aussi en augmentation dans le sud humide et le nord sec.
Des changements dans la répartition de la population, lorsqu'elle augmente, et la recherche de plus de sécurité dans l'alimentation, surtout dans les climats secs, constituent des raisons importantes de ces changements.
En Tanzanie, à l'intérieur du territoire sec, la production du manioc est absente. Au contraire du Nigeria, la distribution relative n'a pas changé pendant trois décades. Plus la jachère a été réduite, plus la rôle du manioc en fin de rotation a été important. Il est devenu une culture qui est favorisée par l'humidité là où il y a peu de resources monétaires. L'impact des "Ujamaa" (villages de repeuplement) dans la distribution du manioc n'a pas été bien compris. Cependant les nouveaux aménagements du terroir ont probablement favorisé la culture du manioc.
Au Zaïre la culture du manioc occupe environ 65% des terres cultivées. Les données disponibles au niveau national montrent une augmentation constante de la production et des surfaces cultivées, mais une diminution des rendements.
Le manioc est un élément très important dans l'alimentation humaine, particulièrement dans le Bandundu et le Kasai. Autour de Kinshasa, la surface cultivée en manioc est beaucoup plus importante que prévue (Chapitre 4). L'explication est donnée par la demande faite par la capitale et la banlieue. Cependant dans la région du Bandundu, le manioc est encore plus important et il est exporté à Kinshasa en temps de crise. Cette région n'apparaît pas comme marginale probablement parce que l'échelle de l'analyse du Chapitre 4 ne permet pas de connaître avec précision la répartition de la population dans la région.
Chapitre 6: Conclusions
Les quatre premiers chapitres de l'atlas se terminent par un modèle de la distribution de la culture qui montre que l'aire de la culture du manioc augmente avec la population. L'analyse a plusieurs limites. La distribution relativement irrégulière du manioc selon les régions peut être attribuée en partie à un manque de matériel génétique adapté. La généralisation et la petite échelle ne permettent pas d'affirmer que le travail et le capital sont des facteurs qui expliquent la distribution de cette culture.
La première hypothèse à l'échelle du continent qui montre que la distribution de la culture du manioc est surtout fonction de la densité de la population est vérifiée dans la plupart des zones de cette culture.
Cependant, d'importantes exceptions ont été observées autour des grandes zones urbaines et dans les plus fortes concentrations de cette culture. L'étude de cas montre l'importance de la commercialisation comme explication des erreurs du modèle en Afrique de l'Ouest et au Zaïre. Cependant au Burundi et en Tanzanie, on n'a pas trouvé une explication satisfaisante aux grandes zones de culture du manioc. A l'échelle sub-régionale, l'étude de cas a montré le rôle du manioc dans les cultures intensives et extensives. Ces deux scénarios peuvent apparaître à des échelles différentes, dans un pays, dans une région, dans un village ou aussi dans la même ferme.
54

Les résultats obtenus sur la distribution relative de la culture du manioc en relation aves les types d'environnement offrent un premier critère très important pour la répartition des ressources pour la recherche. Cinq principales régions on été identifiées comme très importantes dans la distribution de cette culture. Ce sont:
1. Terres basses (plaines) à climats humides à sols acides et non limités.
2. Plaines à climats tempérés à sols acides et non limités.
3. Plaines à climats continentaux à sols acides et non limités.
4. Plaines à climats semi-arides à sols acides et non limités.
5. Hauts plateaux à climats humides à sols acides et non limités.
Les zones identifiées par les études ont eu une grande importance dans le choix des endroits sélectionnés pour les recherches biologiques et socio-économiques du manioc. Elles supposent une augmentation continue de l'importance du manioc dans les zones en croissance mais surtout dans quelques unes, particulièrement à l'ouest du Sahel Africain, la Région des Grands Lacs et le centre-ouest du Zaire.
Les zones marginales qui ont été identifiées dans le modèle indiquent aux chercheurs des pistes de recherches pour obtenir d'autres variables qui ont une très grande influence dans la distribution du manioc.
Le Burundi et les zones adjacentes, près du Lac Victoria, de Mtwara, le nord du Mozambique, le Bas-Zaïre, le nord du Ghana et le Togo méritent d'être examinés de plus près par les agronomes et les sociologues intéressés par une meilleure compréhension de l'importance de cette culture.
Dans l'avenir, la diminution de la productivité de la terre, comme cela se reflète dans quelques endroits où est cultivé le manioc, sera l'un des plus importants problèmes de l'agriculture africaine. La réponse des gouvernements et des agriculteurs à travers l'application des politiques d'intensification ou d'expansion des terroirs marginaux sera importante pour le future rôle du manioc dans différentes zones. Cependant l'augmentation de la production du manioc dans la zone mène à une pression biologique plus forte sur la culture. La réduction de la souplesse de la culture sera une des choses à évaluer dans le futur.
L'orientation de la recherche sur le manioc va avoir une grande influence sur les décisions prises au sujet du rôle de la culture. L'information sur les changements auxquels est soumise l'agriculture africaine est vitale si on veut que la recherche soit bien orientée.
Nous avons fait l'effort de montrer ici que le changement se manifeste de différentes façons, à des échelles différentes et dans des endroits différents. Ces différences doivent être reconnues pour les recherches agricoles. Nous souhaitons que cet ouvrage pourra aider aux recherches sur le manioc.
55


BIBLIOGRAPHY
Adamu, S. O. 1987. Trends of food production and consumption in Nigeria. International Food Policy Research Institute, Washington, DC.
Adekanye, T. O. 1985. Innovation and rural women in Nigeria: Cassava processing and food production. In: Ahmed, I. (ed.). Technology and rural women: Conceptual and empirical issues. ILO, Geneva, p. 252-283.
Agboola, A. A. 1980. Effect of different cropping systems on crop, yield and soil fertility management in the humid tropics. In: FAO/SIDA. Organic recycling in Africa. Soils bulletin 43. Rome, p. 87-105.
Agboola, S. A. 1968. The introduction and spread of cassava in Western Nigeria. Economic and Social Studies 10(3):369-385.
Agboola, S. A. 1979. An agricultural atlas of Nigeria. Oxford University Press, Oxford. 248 p.
Alpers, E. A. 1975. Ivory and slaves in East Central Africa. Heinemann, London.
Amare, G.; Wilson, G. F.; Kang, B. T. 1981. Role of trees in land and soil management in humic tropical Africa. In: Proceedings of the Agroforestry Conference, UTA, Ibadan.
American Geographical Society of New York. 1969. Physical and Political Map of Africa. Series 1106. Sheets 2, 3 and 4. Edition 3 -GSGS. AGS, New York.
Atlas of Tanzania. 1976. 2nd ed. Survey and Mapping Division, Ministry of Lands, Housing and Urban Development, Dar es Salaam.
Bachmann, E. 1981. Yam holdings in southern Nigeria: Economic assessment of problems and trends. Agricultural economics discussion paper no. 2/81. UTA, Ibadan.
Bachmann, E.; Winch, F. E. 1979. Yam-based farming systems in the humid tropics of southern Nigeria. Agricultural economics discussion paper. UTA, Ibadan.
Balandier, G. 1965. La vie quotidienne au royaume de Kongo du 16me au 18me siècle. Librairie Hachette, Paris.
Bantje, H. 1986. Household differentiation and productivity: A study of smallholder agriculture in Mbozi district. Institute of Resource Assessment, University of Dar es Salaam, Dar es Salaam.
Beck, B. D. A. 1982. Historical perspectives of cassava breeding in Africa. In: Root crops in eastern Africa: Proceedings of a workshop held in Kigali. IDRC 177e. IDRC, Ottawa, p. 13-128.
Berry, L. 1971. Tanzania in maps. University of London Press, London.
Berry, S. 1986. Socio-economic aspects of cassava cultivation and use in Africa: Implications for the development of an appropriate technology. Paper presented to the Rockefeller Foundation, New York.
Boserup, E. 1965. The conditions of agricultural growth: The economics of agrarian change under population pressure. George Allen and Unwin, London.
Bothomani, I. B. 1984. The food crisis in East and Central Africa with special reference to Kenya, Malawi, Tanzania and Zambia. Journal of African Studies 11:148-155.
Brooke, C. 1967. Types of food shortages in Tanzania. Geographical Review 57:331-357.
Bryceson, D. F. 1980. Changes in peasant food production and food supply in relation to the historical development of commodity production in pre-colonial and colonial Tanganyika. Journal of Peasant Studies 7(3):281-311.
Bryceson, D. F. 1982. Peasant commodity production in post-colonial Tanzania. African Affairs 81:547-567.
Carter, S. E. 1986. Climatic and edaphic classification at a continental scale (1:5,000,000) for cassava in South America. Agroecological Studies Unit, CI AT, Cali. 16 p. (Typescript.)
Carter, S. E. 1987. Collecting and organising data on the agro-socio-economic environment of the cassava crop: Case study of a method. In: Bunting, A. H. (ed.). Agricultural environments: Characterization, classification and mapping. CABI, Wallingford. p. 11-29.
Carter, S. E.; Jones, P. G. 1989. COSCA site selection procedure. COSCA working paper no. 2. COSCA, Ibadan. 19 p.
Carter, S. E.; Jones., P. G. n.d. A model of the distribution of cassava in Africa. Economic Geography. (In press.)
Cassava Today, 1984. African Products. Johannesburg.
CIAT. 1989. Report, Agroecological Studies Unit. Cali.
Cock, J. H. 1985. Cassava: New potential for a neglected crop. Westview Press, Boulder, CO. 191 p.
Cock, J. H.; Wholey, D.; Gutierrez de las Casas, O. 1977. Effects of spacing on cassava (Manihot esculenta). Experimental Agriculture 13(3):289-299.
Coulson, A. 1981. Agricultural policies in mainland Tanzania, 1946-76. In: Heyer, J.; Roberts, P.; Williams, G. (eds.). Rural development in tropical Africa. Macmillan Press, London.
Coursey, D. G. 1967. Yams: An account of the nature, origins, cultivation and utilisation of the useful members of the Dioscoreaceae. Longman, London. 230 p.
De Bruijn, G. H.; Fresco, L. O. 1989. The importance of cassava in world food production. In: Netherlands Journal of Agricultural Science 37(l):21-34.
de Vries, C. A. 1978. New developments in the production and utilization of cassava. In: Abstracts on Tropical Agriculture. Special issue.
Diehl, L. 1981. Smallholder farming systems with yam in the southern Guinea savannah of Nigeria. GTZ, Eschborn.
Dommen, A. J. 1988. Innovation in African agriculture. Westview Press, Boulder, CO.
Eastman, J. R. 1989. IDRISI: A geographic analysis package, version 3.01. Graduate School of Geography, Clark University, Worcester, MA.
Ekandem, M. J. 1962. Cassava in Nigeria, Part I: Eastern Nigeria. Memorandum no. 42. Moor Plantation, Federal Department of Agricultural Research, Ibadan. 21 p. (Typescript.)
57

Ekandem, M. J. 1965. Cassava in Nigeria, Part II: Northern Nigeria. Memorandum no. 87. Federal Department of Agricultural Research, Ibadan. 26 p. (Typescript.)
FAO. 1978. Report on the agro-ecological zones project. World Soil Resources Report 48: Methodology and results for Africa. Rome.
FAO. 1983. Proceedings of the Workshop on Processing Technologies for Cassava and Other Tropical Roots and Tubers in Africa, 2 vols., [held at] Abidjan, Ivory Coast. Rome.
FAO. 1986. Cassava development policy in Tanzania: Policy and likely implementation. Rome.
FAO. 1988. Root and tuber crops, plantains and bananas in developing countries: Challenges and opportunities. FAO Plant Production and Protection Paper 87. Rome. 83 p.
FAO. Various years. Production yearbooks. FAO statistical Series no. 99. Rome.
FAO and UNESCO. 1977. Soil map of the world, 1:5,000,000; volume VI: Africa. UNESCO, Paris. 299 p.
FAO and UNESCO. 1985. Soil map" of the world, 1: 5,000,000; volume VI: Africa. UNESCO, Paris. Used in combination with FAO/UNESCO/ISRIC, 1985. Revised legend. FAO, Rome.
FOS. 1952. Report on the sample census of agriculture 1950-51. Lagos.
FOS. 1972. Consolidated results of crop estimation surveys 1965-1966 to 1967-1968: Rural economic survey of Nigeria. Lagos.
FOS. 1980. Rural economic survey 1978/9: Provisional report on crop estimates 1978/9. FOS Agriculture Survey Unit, Lagos. Volume l.nos. 1 and 2.
FOS. 1980/81 onwards. Rural agricultural surveys. Lagos.
FOS. (All years.) Annual abstract of statistics. Lagos.
Floyd, B. 1969. Traditional agriculture in eastern Nigeria: A geographical review. McMillan, London, p. 169-195.
Fresco, L. O. 1984. Agriculture and food production. In: World Bank, Agricultural sector assessment report of the Central African Republic. Internal memorandum. Washington, DC.
Fresco, L. O. 1986. Cassava in shifting cultivation: A systems approach to agricultural technology development in Africa. Royal Tropical Institute, Amsterdam. 240 p.
Friis-Hansen, E. 1987. Changes in land tenure and land use since villagization and their impact on peasant agricultural production in Tanzania: The case of the Southern Highlands. Centre for Development Research, Copenhagen.
Fuggles-Couchman, N. R. 1964. Agricultural change in Tanganyika: 1945-1960. Food Research Institute, Stanford University, Palo Alto, CA.
Gleave, M. B.; White, H. P. 1969. Population density and agricultural systems in West Africa. Environmental Journal 8(2):127-141.
Goldschmidt, A. P.; Jones, J. A. 1988. A land evaluation of three Ujamaa villages in Dodoma region, Tanzania. Soil Survey and Land Evaluation 8(3): 183-201.
Greenland, D. J.; Okigbo, B. N. 1983. Crop production under shifting cultivation and the maintenance of soil fertility. In: Symposium on Potential Productivity of Field Crops under Different Environments. IRRI, Los Banos. p. 505-524.
Grigg, D. 1979. Ester Boserup's theory of agrarian change: A critical review. In: Progress in Human Geography 3(l):64-84.
Grove, A. T. 1951. Land use and soil conservation in parts of Onitsha and Owerri Provinces. Bulletin no. 21. Geological Survey of Nigeria, Lagos.
Guyer, J. 1984. Family and farm in Southern Cameroun. Boston University, Boston, MA.
Hahn, S. K.; Mahungu, N. M.; Otoo, J. A.; Msabaha, M. A. M.; Lutaladio, N. B.; Dahniya, M. T. 1987. Cassava and the African food crisis. In: Terry, E. R.; Akoroda, M. O; Arène, O. B. (eds.). Tropical root crops: Root crops and the African food crisis; Proceedings of the Third Triennial Symposium of the International Society for Tropical Root Crops—Africa Branch, held in Owerri, Nigeria, 17-23 August 1986. IDRC, Ottawa, p. 24-29.
Harms, R. W. 1979. Fish and cassava: The changing equation. African Economic History 7:113-116.
Harms, R. W. 1981. River of wealth, river of sorrow. Yale University, New Haven, CT.
Hayami, Y.; Ruttan, V. 1971. Agricultural development: An international perspective. John Hopkins Press, Baltimore, MD.
Herlehy, T. J. 1984. Historical dimensions of the food crisis in Africa: Surviving famines along the Kenya coast, 1880-1980. African Studies Center, Boston, MA.
Hilton, A. 1985. The kingdom of Kongo. Clarendon Press, Oxford.
Hyden, G. 1980. Beyond Ujamaa in Tanzania: Underdevelopment and an uncaptured peasantry. Heinemann, London.
ICRA. 1989. Report on Malawi. IAC, Wageningen.
Idachaba, F. S. 1985. Priorities for Nigerian agriculture in the Fifth National Development Plan, 1986-90. Federal Agricultural Coordinating Unit, Ibadan.
UTA. 1989. Annual report 1988/89. Ibadan. 79 p.
UTA. 1990. Report of the External Program Review. UTA, Ibadan.
Ikpi, A. E.; Gebremeskel, T.; Hahn, N. D.; Ezumah, H.; Ekpere, J. A. 1986. Cassava: A crop for household food security; A 1986 situation analysis for Oyo Local Government Area—Nigeria. IITA-UNICEF Collaborative Program on Promotion of Household Food Production and Nutrition. Socio-Economic Unit, UTA, Ibadan. 113 p.
INS. 1985. Recensement scientifique de la population 1984. Kinshasa.
IRA/IITA/IDRC. n.d. Report on exploratory survey and establishment of IRA/IITA/IDRC on-farm research work in villages of Yaoundé and Bikok areas. Nkolbisson.
Irenaeus Chidy, Ch. Ugwu. 1985. Entwicklung and Entwicklungspotential in Anambra State Von Nigeria. Working document. Lagos. (Typescript.)
Johnston, B. F. 1956. Staple food crops in West Africa and the Congo. Tropical Agriculture (Trinidad) 33(3):214-220.
58

Jones, W. I.; Egli, R. 1984. Systèmes de culture en Afrique: Les hautes terres du Zaïre, Rwanda et Burundi. Technical Documents, N27F. World Bank, Washington, DC.
Jones, W. O. 1957. Manioc: An example of innovation in African economies. Economie Development and Cultural Change 5(2):97-117.
Jones, W. O. 1959. Manioc in Africa. Stanford University Press, Stanford, CA. 315 p.
Kajamulo-Tibaijuka, A. 1984. An economic analysis of smallholder banana-coffee farms in the Kagera Region, Tanzania. Department of Economics, Swedish University of Agricultural Sciences, Uppsala.
Kamanzi, F. 1983. Situation de la culture du manioc en milieu rural. In: Ndamage, G.; Gatarasi, Th.; Mulindangabo, J. (eds.). Culture et sélection du manioc et de la patate douce au Rwanda. Compte-rendu des journées d'études ISAR Rubona, 8-10 juin 1983. ISAR, Rubona. p. 37-42. (Typescript.)
Kassam, A. H. 1976. Crops of the West African semi-arid tropics; Root and tubers, part III: Cassava (Manihot esculenta); Proceedings of a symposium held at ICRISAT, Begumpet, Hyderabad, India. ICRISAT, Hyderabad, p. 53-57.
Keating, B. A.; Evenson, J. P.; Fukai, S. 1982. Environmental effects on growth and development of cassava (Manihot esculenta Crantz), III: Assimilate distribution and storage organ yield. Field Crops Research 5:293-303.
Kent, R. 1969. Note sur l'introduction et la propagation du manioc a Madagascar. Terre Malgache 5:177-183.
KIT. 1984a. Tanzania. Landendocumentatie No. 2. Amsterdam.
KIT. 1984b. Zaïre. Landendocumentatie No. 4. Amsterdam.
KIT. 1989. A review of literature on agriculture and land use in Sukumaland, Tanzania. Amsterdam.
Knight, C. G. 1974. Ecology and change: Rural modernization in an African community. Academic Press, New York.
Lagemann, J. 1976. Traditional African farming systems under the condition of increasing population pressure: The case of eastern Nigeria. Ph.D. dissertation. Fachbereich Agrarökonomie und Agrartechnik, Universität Hohenheim, Hohenheim.
Lagemann, J. 1977. Traditional African farming systems in Eastern Nigeria. Weltforum Verlag, Munich.
Langlands, B. W. 1966. Cassava in Uganda 1860-1920. Uganda Journal 30(2):211-218.
Lawes Agricultural Trust. 1987. General statistical package GENSTAT, version 5.0. NAG, Oxford.
Lungren, B. (ed.). 1975. Land use in Kenya and Tanzania: The physical background and present situation and an analysis of the needs for its national planning. Royal College of Forestry, International Rural Development Division, Stockholm. 354 p.
Luning, H. A. 1963. An agro-economic survey of Katsina Province. Government Printer, Kaduna.
Mabogunje, A. L.; Gleave, M. B. 1964. Changing agricultural landscape in Southern Nigeria: The example of Egba Division, 1850-1960. Nigerian Geographical Journal 7(1): 1-15.
Mabogunje, A. L.; Mortimore, M. J.; Udo, R. K.; Agboola, S. A. 1976. Nigeria. In: World atlas of agriculture, volume 4: Africa. Istituto Geografico De Agostini, Novara. p. 409-444.
Maletnlema, T. M.; Mhombolage, R.; Ngowi, G. E. 1974. Family food consumption surveys in rural Tanzania. Tanzania Notes and Records 73:43-54.
Martin, P. M. 1972. External trade of the Loanga coast 1576-1870. Clarendon Press, Oxford.
Mauny, R. 1953. Notes historiques autour des principales plantes cultivées d'Afrique occidentale. Bulletin IFAN B 15(2):684-731.
Meyer, H. 1984. Les Barundi: Une étude ethnologique en Afrique orientale. Société Française d'Histoire d'Outre-Mer, Paris.
Miracle, M. P. 1967. Agriculture in the Congo Basin: Tradition and change in African rural economics. University of Wisconsin Press, Madison, WI. 355 p.
MLHUD (Ministry of Lands, Housing and Urban Development). 1976. Atlas of Tanzania. 2nd ed. Survey and Mapping Division, MLHUD, Dar es Salaam.
Morgan, W. T. W. 1973. East Africa. Longman, London.
Mouton, M. J. 1949. Le manioc en Afrique Equatoriale Française. In: Congrès du manioc et du plantes féculentes tropicales, Marseille 1949. Colonial, Marseille, p. 107-110.
Mujwahuzi, M. R. 1985. The impact of population growth on food production in Tanzania: Problems and prospects. In: Kiros, F. G. (ed.). Challenging rural poverty. Africa World Press, Trenton, NJ.
Murdoch, G. P. 1959. Africa: Its peoples and their culture history. McGraw Hill, New York.
Mussa, D. T. 1978. Our climate: Light, rainfall and temperature patterns. In: The Tanzania Society: The human environment in Tanzania. Tanzania Notes and Records, special number 83.
NAFPP. 1977. A new dimension for Nigerian agriculture. Lagos. 80 p.
Newbury, C; Ebutumwa-Bw'emiogo. 1984. The tyranny of cassava: A women's tax revolt in Eastern Zaire. Canadian Journal of African Studies 18(l):35-54.
Nigerian National Population Bureau. 1984. Mid-year population projections by state, 1963-2000. Lagos.
Norman, D. W. 1972. An economic study of three villages in Zaria Province, 2: Input-output study, vol. 1. (Text.) Samaru miscellaneous paper 37. Institute for Agricultural Research (Samaru), Ahmadu Bello University, Zaria.
Notes on peasant agriculture in mid-western Nigeria (with particular reference to arable farming). 1966. Occasional paper no. 7. Research Branch, Ministry of Agriculture and Natural Resources, Mid-Western Region, Benin City. 28 p.
Nweke, F.; Ezumah, H. C; Spencer, D. 1988. Cropping systems and agro-economic performance of improved cassava in a humid forest ecosystem. RCMP monograph no. 2. UTA, Ibadan.
Nwosu, N. A. 1977. Some indigenous cropping systems of Eastern Nigeria. In: Leakey, C. L. A. (ed.). Proceedings of the Third Symposium of the International Society for Tropical Root Crops, held at UTA, Ibadan, Nigeria, 2-9 December, 1973. ISTRC and UTA, Ibadan. p. 393-398.
Okigbo, B. N. 1980. A review of cropping systems in relation to residual management in the humid tropics of Africa. In: FAO/SIDA. Organic recycling in Africa. Soils Bulletin 43. FAO, Rome. p. 13-71.
59

Okigbo, B. N.; Greenland, D. J. 1976. Intercropping systems in tropical Africa. In: ASA, CSSA and SSSA. Multiple cropping: Proceedings of a symposium... [held at] Knoxville, Tennessee, August 1975. ASA special publication number 27. Madison, WI. p. 63-101.
Okorji, E. Ch.; Aghimien, C. I. 1986. Cost-return analysis of the substitution of food crops for rubber in the smallholder cropping system of southern Nigeria: A case study of Bendel State. Quarterly Journal of International Agriculture 25(3):244-257.
Onwueme, I. C. 1978. Section B: Cassava. In: The tropical tuber crops: Yams, cassava, sweet potato, and cocoyams. Wiley, Chichester, p. 109-163.
Osemeobo, G. J. 1987. The migrant Igbira farmers and food crop production in Bendel State, Nigeria. Agricultural Systems 25(2): 105-124.
Oyenuga, V. A. 1967. Agriculture in Nigeria: An introduction. FAO, Rome. 308 p.
Papadakis, J. 1966. Crop ecologie survey in West Africa: Liberia, Ivory Coast, Ghana, Togo, Dahomey, Nigeria, volume 1 (text). FAO, Rome. 103 p.
Pasch, H. 1980. Liguistische Aspekte der Verbreitung Lateinamerikanischer Nutzpflanzen in Afrika. Unpublished thesis, University of Cologne, Cologne.
Phillips, T. 1983. Overview of cassava consumption and production. In: Delange, F.; Ahluwalia, R. (eds.). 1983. Cassava toxicity and thyroid: Research and public health issues; Workshop proceedings. IDRC (208e). IDRC, Ottawa.
Pingali, P.; Bigot, Y.; Binswanger, H. 1987. Agricultural mechanization and the evolution of farming systems in sub-Saharan Africa. John Hopkins University Press, Baltimore, MD.
Pottier, J. 1988. Migrants no more: Settlement and survival in Mambwe villages, Zambia. Indiana University Press, Bloomington, IN.
Prioul, C. 1957. Notes sur la diffusion du manioc dans la partie centrale du territoire Centrafricain. Ministère du Plan, Bangui. 9 p. (Typescript.)
Pritchard, J. M. 1979. Africa, a study geography for advanced students. Longman Group, Harlow, ND. 84 p.
Raison, P. 1972. L'introduction du manioc a Madagascar: Un problème non résolu. Terre Malagache 13:223-228.
Richards, P. 1985. Indigenous agricultural revolution: Ecology and food production in west Africa. Hutchinson, London.
Riehl, H. 1979. Climate and weather in the tropics. Academic Press, London. 611 p.
Rosling, H. 1987. Cassava toxicity and food security. Uppsala University Hospital and UNICEF, Uppsala.
Ross, H. B. [1975]. The diffusion of the manioc plant from South America to Africa: An essay in ethnobotanical culture history. Ph.D. dissertation. Faculty of Political Science, Columbia University, New York. 135 p.
Rössel, G. 1987. Gewas innovaties in Gabon van prehistorie tot koloniale tijd. Unpublished M.Sc. thesis. Department of Agricultural History, Wageningen Agricultural University, Wageningen.
Royal Statistical Society. 1977. General Linear Model (GLIM), Version 3.12. London.
Ruthenberg, H. 1980. Farming systems in the tropics. 3rd ed. Clarendon Press, Oxford. 424 p.
Shapiro, D. 1988. Farm size, household size and composition, and women's contribution to agricultural production: Evidence from Zaire. Pennsylvania State University, University Park, PA.
Silvestre, P.; Arraudeau, M. 1983. Le manioc. Techniques Agricoles et Productions Tropicales Collection. Maisonneuve & Larose and Agence de Coopération Culturelle et Technique, Paris. 262 p.
SLP (Strategic Locations Planning). 1987. Atlas*Draw. San Jose, CA.
Statistik des Auslandes. 1985. Landerbericht Nigeria. Statistiches Bundesamt, Wiesbaden.
Stoorvogel, J. J.; Fresco, L. O. 1990. The identification of agro-ecological zones for cassava in Africa with particular emphasis on soils. Working document. Department of Tropical Crop Science, Wageningen Agricultural University, Wageningen.
Stoorvogel, J. J.; Smaling, E. 1990. Assessment of soil nutrient depletion in sub-Saharan Africa: 1983-2000, vols. 1-3. Report 28. WSC/FAO, Wageningen.
Tanzania/Netherlands Farming Systems Research Project, 1989. Diagnostic survey of Maswa and Meatu District (Phase 1: informal survey). KIT, Amsterdam.
Tanzanian Ministry of Agriculture. 1988. Cassava production in Tanzania. Paper presented at the meeting of the COSCA, UTA, Ibadan.
Taylor, P. J. 1977. Quantitative methods in geography. Houghton Mifflin, Boston, MA.
Terry, E. R.; Odira, K. A.; Caveness, F. (eds.). 1981. Tropical root crops: Research strategies for the 1980s. IDRC 163e. IDRC, Ottawa.
Thornton, J. K. 1977. Demography and history in the kingdom of Kongo 1550-1750. Journal of African History 18:507-530.
Thornton, J. K. 1983. Civil war and transition 1641-1718. University of Wisconsin Press, Madison, WI.
Tollens, E. (ed.). n.d. Nourrir Kinshasa: Une analyse du système d'approvisionnement en produits vivriers. Louvain University, Leuven. (In press.)
Tshibaka, T. 1988. Food production in a land surplus, low labour productivity economy; The Zairean Basin. IFPRI, Washington, DC.
Tshibaka, T.; Kalala, M. 1983. Exploitation rationelle d'un champs de manioc. Institut Facultaire des Sciences Agronomiques, Yangambi.
Tshibaka, T.; Lumpungu, K. 1989. Trends and prospects for cassava in Zaire. In: Sarma, J. S. (ed.). Summary proceedings of a Workshop on Trends and Prospects of Cassava in the Third World, August 10-12, 1987. IFPRI, Washington, DC.
Tylleskär, T.; Banea, M.; Bikangi, N.; Fresco, L.; Persson, L. A.; Rosling, H. 1991. Epidemiological evidence from Zaire for a dietary etiology of konzo, an upper motor neuron disease. In: Bulletin of the World Health Organization 69(5):581-589.
60

Udo, R. K. 1964. The migrant tenant farmer of Eastern Nigeria. Africa 34(4):326-335.
Udo, R. K. 1975. Migrant tenant farmers of Nigeria. African University Press, Lagos.
Unamma, R. P. A.; Odurukwe, S. O.; Okereke, H. E.; Ene, L. S. O.; Okoli, O. O. (comps. and eds.). 1985. Farming systems in Nigeria: Report of the bench-mark survey of the farming systems of the eastern agricultural zone of Nigeria. National Root Crops Research Institute, Umudike. 141 p.
UNEP/GEMS/GRID. 1988. FAO soils map of the world at 30 seconds resolution. Computer compatible data tape. United Nations Environment Programme, Global Resource Information Database, Geneva.
Uzozie, L. C. 1971. Patterns of crop combination in the three Eastern States of Nigeria. Journal of Tropical Geography 33:62-72.
van der Mark, D. F. W. 1975. Tanzania. Landenreeks no. 196. KIT, Amsterdam. 78 p.
Vansina, J. 1983. The peoples of the forest. In: Birmingham, D.; Martin, Ph. M. (eds.). History of Central Africa, vol. I. Longman Group, New York.
Verheij, E. W. M. 1982. Horticulture in Tanzania: Position and perspective. Department of Agricultural Research, Royal Tropical Institute, Amsterdam.
von Freyhold, M. 1979. Ujamaa villages in Tanzania: Analysis of social experiment. Heinemann, London.
Waterworth, J. V. 1966. An agricultural survey of a selected savannah area of western Nigeria, Benin City: [s.n.], 1966. Special report no. 6. Research branch, Midwestern group of provinces, Ministry of Agriculture and Natural Resources. Benin City. 37 p.
Watson, G. A. 1990. Tree crops and farming systems development in the humid tropics. Experimental Agriculture 26(2): 143-159.
Wigboldus, J. S. 1984. Prekoloniale maiscultuur in westelijk Afrika c. 1500-1850. Department of Agricultural History, Wageningen Agricultural University, Wageningen. (Unpublished typescript.)
Wood, A. P. 1985. A century of development measures and population redistribution along the Upper Zambezi. In: Clarke, J. I.; Khogali, M.; Kosinski, L. A. (eds.). Population and development projects in Africa. Cambridge University Press, Cambridge, p. 163-175.
World atlas of agriculture, volume 4: Africa. 1976. Istituto Geografico De Agostini, Novara. 761 p.
Zuidervliet, A. C. 1982. Nigeria. Landendocumentatie no. 1. KIT, Amsterdam.
61


Appendix I
SOURCES OF DATA FOR THE MAP OF CASSAVA DISTRIBUTION IN AFRICA
Angola
Source:
Data:
Comments:
World Atlas of Agriculture (1976), volume 4: Africa Italy.
Istituto Geografico De Agostini, Novara,
Benin
Source:
Data:
Comments:
1964-1966. 90,000 ha.
These data replaced more recent data from the Anuàrio Estadistico 1973 (Instituto Nacional de Estadistica, Delegaçâo de Angola, Luanda, 1973). The latter were inconsistent, and it was likely that they were inaccurate because of contemporary civil disturbances.
Annuaire 1969-1979. Ministère du Développement Rural et de l'Action Coopérative. Cotonou.
1979. 113,000 ha (1.3%). Department level.
FAO information was for 1976-1977 and was not used. Departments are very small at 1:5,000,000, enhancing accuracy of point location at this scale. WAA (1976) was used as a guide to population distribution. A 1967 cassava distribution map was used as a consistency check.
Burkina Faso
Source:
Data:
Burundi
Source:
Data:
Comments:
Cape Verde
Source:
Data:
Bulletin de Statistiques Agricoles Campagnes 1982-84 (1984). Service des Statistiques Agricoles, Ministère de l'Agriculture et de l'Elevage, Ouagadougou.
1984. 1000 ha (0.01%). ORD (Organisme Régional de Développement).
Annuaire Statistique, 1981. Ministère du Plan National des Etudes et Statistiques. Bujumbura.
1981. 394,000 ha (4.7%). District.
The FAO data were slightly more recent but for production in tons. There was no indication of yields, so hectarage could not be accurately deduced. The choice of scale (1:5,000,000) and dot size results in an impression of great concentration of cassava in all parts of the country apart from the escarpment of the Congo-Nile divide to the west of the country. This may give an exaggerated view, although it is consistent with the rest of the map.
Rapport de la Mission d'Étude Sectorielle Agricole. Missions de Programmation Intéressant le Secteur Alimentaire et Agricole (1969).
1969. 1000 ha (0.01%). Province.
Comments:
Cameroon
Source:
Data:
Comments:
1000 ha, being the basic unit for mapping, could only be represented by one dot. It was placed in the most populated area.
Annuaire de Statistiques Agricoles 1982-1983; Yearbook of Agricultural Statistics. Ministère de l'Agriculture. Yaoundé.
1983. 383,000 ha (4.7%). Province.
Within Provinces, apart from settlement locations, the names of 34 known locations of cassava concentrations were extracted from the WAA (1976) and used to aid in dot placement.
Central African Republic
Source:
Data:
Comments:
Chad
Source:
Data:
Comments:
Comores
Source:
Data:
Congo
Source:
Recensement Agricole de la Republique Centrafricaine (1985): Résultats Définitifs. 1987. FAO Proj. PNUD/FAO/CAF/84/002. Bangui.
1985. 152,000 ha (1.8%). Prefecture level.
This was some of the most detailed information encountered. The WAA (1976) was also consulted to verify dot placement against its maps of population density, and percentage of total farms cultivating manioc.
(1) Statistik des Auslandes (1984). Statistisches Bundesamt, Wiesbaden, Germany.
(2) Résultats du Recensement Agricole 1972/3 pour le Tchad. FAO, Rome, Italy. 1977.
(3) Recensement Agricole du Mali de 1984. Résultats préliminaires. Ministère du Plan Nov. N'Djamena. 1985.
(1) 1982. 23,000 ha (0.03%). Country total.
Total production for the country in 1982 from (1) was converted to hectares by using the typical yields from Mali (3). For distribution amongst prefectures, older information (2) was used.
Statistik des Auslandes (1983). Statistisches Bundesamt, Wiesbaden, Germany.
1983. 5000 ha (0.06%). Country total.
Annuaire Statistique 1982. Ministère du Plan, Centre National de la Statistique et des Études Économiques. BP 2031. Brazzaville.
1. Hereafter referred to as 'WAA, 1976'.
63

Data: 1972-1973. 160,000 ha (1.9%). Province. Guinea-Bissau
Comments: WAA (1976) was used as a guide to locate points within provinces.
Equatorial Guinea
Source:
Data:
Comments:
Gabon
Source:
Data:
Comments:
Gambia
Source:
Data:
Comments:
Ghana
Source:
Data:
Comments:
Guinea
Source:
Data:
Comments:
Statistik des Auslandes (1986). Statistisches Bundesamt, Wiesbaden, Germany.
1984. 25,000 ha (0.3%). Country total.
Production was divided by average yield to get a hectarage figure for the whole of Equatorial Guinea. Between Rio Muni and Fernando Po, hectarages were divided by the proportions of area of land available for arable production (WAA, 1976). Cassava was quoted as being important in both these areas.
Statistik des Auslandes (1985). Statistisches Bundesamt, Wiesbaden, Germany.
1983. 42,000 ha (0.5%). Country total.
The total hectarage of 42,000 ha was calculated from production, and a yield estimate from typical yields. Within provinces, a 1964 distribution map (WAA, 1976) was used as a guideline for dot placement.
Statistik des Auslandes (1987). Statistisches Bundesamt, Wiesbaden, Germany.
1984. 2000 ha (0.02%). Country total.
Total production was divided by yield to give a total hectare figure. The 2 dots were placed near the most populated areas. Note that the production and yield figures quoted did not change from 1981 to 1984, remaining at 6.0 MT/ha throughout the 4 years! The reliability of the data set was thus questioned.
Agricultural Statistics (Food Crops). (1986). The Statistics Section, Ministry of Agriculture. Accra.
1980. 380,000 ha (4.6%). Region.
A distribution map by A. Warren (personal communication) based on impressions of Ghanaian research staff was also available as a detailed guide to distribution of cassava.
United Nations 1981. Mémoire de la Guinée (Rome?).
1975. 79,000 ha (1.0%). Administrative region.
Accuracy of dot placement was facilitated by the small size of political divisions.
Source: (1) Agricultural Census 1960/61. Guinea-Bissau.
(2) Recenseamento Geral da Populaçâo 1960. Resumo Geral. Serviços de Administraçâo Cf vel, Secçâo de Estadîstica. Lisbon, Portugal, 1978.
Data: 1960-1966. 6000 ha (proportion unknown). Regions.
Comments: There were no more recent data than (1). A map of administrative divisions in (2) was used. Dots were not placed in tidal mangrove areas.
Ivory Coast (Côte d'Ivoire)
Source:
Data:
Kenya
Source:
Data:
Comments:
Liberia
Source:
Data:
Comments:
Madagascar
Source:
Data:
Comments:
Malawi
Source:
Data:
Sous-direction des statistiques agricoles et forestières (1984). Ministère de l'Agriculture et des Faux et Forêts. Abidjan.
1984. 230,000 ha (2.8%). Département.
(1) Ministry of Agriculture, Kenya (1979).
(2) Integrated Rural Survey 1974-5. Basic Report of the Central Bureau of Statistics. Ministry of Finance and Planning. Nairobi. March 1977.
1977. 69,000 ha (0.6%). Province and district.
Basic data from (1) were used because they were organised by smaller political divisions. However, (2) showed consistently larger areas of cassava production (69,000 versus 52,000). While using (1) to indicate distribution among districts, the total cassava area was taken from (2).
Production estimates of major crops 1984 (1985). Ministry of Agriculture, Monrovia.
1984. 43,000 ha (0.5%). County.
A distribution map by A. Warren (personal communication), based on impressions of Liberian research staff, was also available.
Statistiques Agricoles. Annuaire 1978/9 (1980). Ministère du Développement Rural et de la Réforme Agraire, Antananarivo.
1979. 238,000 ha (2.9%). Faritanin/Fivondronona.
The detailed nature of the information makes Madagascar the most accurately mapped.
National Sample Survey of Agriculture 1980/1 (1984). National Statistical Office, Xomba.
1981. 50,000 ha (0.6%). ADD (Agricultural Development Division).
64

Mozambique
Source: Programa de Investigaçâo Agronómica en Moçambique. Propostas. Perîodo 1977-80 (1977). Maputo.
Data: 1970. 449,000 ha (5.4%). Provfncia.
Comments: WAA (1976) distribution map was used as a guide.
Niger
Source: Annuaire Statistique, édition 1985. (1985) Direction de la statistique et de l'informatique. Ministère du Plan.
Data:
Nigeria
Source:
Data:
Comments:
Rwanda
Source:
Data:
Senegal
Source:
1982. 34,000 ha (0.6%). Département.
National Agricultural Sample Census of Nigeria, 1974-5.
1975. 415,000 ha. State.
For the case study (Chapter 7), the agricultural census data of 1951/52 were consulted, as well as various detailed reports. For a discussion of discrepancies between data sources, see Chapter 7.
Résultats de l'enquête nationale agricole, 1984, vol. 1. Ministère de l'Agriculture de l'Élevage et des Forêts. Kigali. Septembre, 1985.
1984. 141,000 ha (1.7%). Préfecture.
Situation économique du Sénégal 1985. Direction de la Statistique, Ministère de l'Économique et des Finances. Dakar.
Data: 1984. 6000 ha (0.09%). Région.
Sierra Leone
Source: (1) Statistik des Auslandes, 1986; Sierra Leone. Statistisches Bundesamt, Wiesbaden, Germany.
(2) Agricultural Statistical Survey of Sierra 1970/71. Central Statistics Office. Freetown.
Data: 1984. 30,000 ha (0.4%). Country total.
Comments: The recent total in (1) was distributed to provinces according to proportions in 1970-1971, in (2).
Sudan
Source:
Data:
Comments:
(1) Statistik des Auslandes, 1987; Sudan. Statistisches Bundesamt, Wiesbaden, Germany.
(2) Current Agricultural Statistics. Khartoum. June 1979.
1985. 46,000 (0.6%). Country total.
Recent total figure from (1) was used, and proportional distribution by region (iqtim) was taken from (2).
Tanzania
Source:
Data:
Comments:
Togo
Source:
Data:
Comments:
Uganda
Source:
Data:
Comments:
Zaire
Source:
Data:
Comments:
Zambia
Source:
Data:
Regional and District Cassava Production in Tanzania 1985/6 (1986). Early Warning and Crop Monitoring Unit. Dar es Salaam.
1986. 1,286,000 ha (15.6%). Region.
Also available was 1:2,500,000 scale map of cassava distribution by A. Warren (personal communication). For the detailed case study (Chapter 7), pre-independence reports were consulted. National statistics presented marked inconsistencies (see Chapter 7).
Enquête Agricole: Rendements des principales cultures vivrières campagne agricole 1985/6. (1986) Direction des enquêtes et statistiques agricoles. Ministère du Développement Rural. Lomé.
1985. 49,000 ha (0.6%). Circonscription.
Data for Togo were separated as monocrop cassava, cassava as the principal crop and as the secondary crop. So not to over-estimate the area of actual cassava, the area quoted for cassava as the secondary crop was not used. Hectarages were calculated from production figures and the yields of cassava as the main crop, for each political division.
A printout had been extracted from a database, with no source quoted. Most probably from the Ministry of Agriculture and Forestry, Uganda.
1984. 401,000 ha (4.9%). District level.
Data available for relatively small political divisions (36 Districts) and thus (spatially) accurately mapped, although the type of survey used to obtain the data was unknown.
Annuaire des Statistiques Agricoles 1979/85. (1986). Service d'Études et de Planification Agricole. Division de la Statistique Agricole, Kinshasa.
1985. 2,150,000 ha (26.1%). Région.
Regions in Zaire are enormous. Within regions dots were placed largely according to settlement patterns. The WAA (1976) provided a distribution map (albeit old, 1960) and an indication of those areas in which more than half of the cropped land was planted with cassava. For the case study, reports from the Ministère des Colonies, as well as from the Institut National d'Études Agronomiques au Congo Beige, were consulted.
Agricultural and Pastoral Production 1970 (1973). Central Statistics Office, Lusaka.
1970. 161,000 ha. Province.
65


Appendix II
TECHNIQUES AND METHODS USED FOR ENVIRONMENTAL AND DEMOGRAPHIC MAPPING
AND CONSTRUCTION OF THE CASSAVA DISTRIBUTION MODEL
Generation of Climate and Soil Data Files in Raster Format
Mean monthly precipitation, and minimum and maximum temperature data were extracted from CIAT's climate database. This source provided information for over 5000 stations in Africa. However, the stations were unevenly distributed, and the data had to be interpolated to a spatial data file for mapping and spatial analysis.
A digital version of the FAO's Soil Map of the World served as a convenient framework for the construction of the climate data files (UNEP/GEMS/GRID, 1988). These data were stored in the form of a 10' grid, and included modal elevations for each cell. For each grid cell the five nearest meteorological stations were identified from CIAT's database. All temperatures were reduced to sea level by using a lapse rate model representative for tropical climates (the model was constructed by using data from Riehl, 1979; Table 1, p. 14). Interpolated values were calculated for mean monthly rainfall, and for maximum and minimum temperatures, using an inverse squared distance weighting factor. Temperature values were then recalculated according to the modal elevation of each grid cell.
Map 2 represents the distribution of the climatic classes described in Figure 5. A Fortran programme was written to classify the grid squares of the climate data file in accordance with the above decision rules. A minimum mean monthly growing season temperature of 13 °C was used to exclude high altitude and high latitude areas that are too cold for cassava. [This value was taken as a suitable minimum based on advice from CIAT Cassava Program scientists, after Keating et al. (1982)]. Grid squares identified with arid climates (i.e., more than 9 dry months) were excluded, since the distribution map showed that cassava was not found in them.
The classified grid cells were then reformatted as a two-bit binary file suitable for use as an image in the IDRISI geographical analysis package (Eastman, 1989). The image's geographic limits were 38° N, 36° S, 20° W and 52° E. Its dimensions were 444 rows by 432 columns (each cell being 10' on a side). Climate classes were represented by integer values for each pixel of the image, corresponding to a 10' grid cell.
The digital rasterised version of the FAO's Soil Map of the World (UNEP/GEMS/GRID, 1988) was used to create a 10' grid image for use in IDRISI. The major soil type at the centre of each grid cell was recorded as an integer value, using the codes provided by FAO. Soils are shown in Map 3.
Construction of the Population Density Map
Sources of geographical boundaries, from which to map the census data, were the Bartholemew's travel maps (3 sheets for Africa, at a scale of 1:5,000,000) and individual country maps produced by the U.S. Central Intelligence Agency (at various scales).
The maps were digitised by using the Atlas*Draw package (SLP, 1987). Table coordinates had then to be converted to geographic coordinates (because of Atlas*Draw's inability to recognise the maps' projections) by fitting regression equations to the table coordinates for known lines of latitude and longitude. This was done by using the stepwise regression procedure in the GENSTAT package (Lawes Agricultural Trust, 1987). Once transformed in this manner the boundary data were plotted for checking.
The accuracy of the polygon vectors was checked by plotting them over coastlines and national frontier polygons from the CIA world digital database (World Database II). Errors from the transformation equations were in some cases found to be unacceptably large. A further transformation was therefore necessary. This was done by fitting an inverse weighted mean correction surface to a grid of digitised correction vectors and then applying the smoothed corrections to the polygon vectors. This operation was repeated until correspondence between coastlines and frontiers in the two data sets was good.
Administrative unit polygons were left in three formats:
1. For plotting on a calcomp plotter.
2. For calculation of areas and population densities in Atlas*Draw and Atlas*Graphics.
3. For overlay and analysis in IDRISI (Eastman, 1989).
Administrative unit polygons were re-imported to Atlas*Draw in geographic coordinates. Atlas*Draw calculates areas and other basic descriptive information for polygons. This information could then be used in Atlas*Graphics as a spreadsheet. The administrative polygons were then imported to Atlas*Graphics.
Population data at the last census, and national mean population growth rates were both added to the spreadsheet. Data for rates of growth were only available at the national level. Since the censuses were conducted at different dates, these growth rates were used to standardise population figures. The formula used was as follows:
Pop. 1980 = Pop. (last census) * Rate"
Where, Pop. 1980 = Standardised 1980 population Pop. (last census) = Population recorded at last census Rate = (Growth rate/100) + 1 n = 1980-year of last census
The cassava distribution data were spread around 1980, and this date was chosen as the standard. Densities were then calculated by using the standardised populations and the areas we had calculated when using Atlas*Draw.
Finally, each administrative unit was given a unique code number consisting of primary (country) and secondary level identifiers. Islands which were not autonomous administrative
67

units were given the same identifiers as their parent units, and were given the same population density values based on the total area of the unit.
To produce a raster population map, administrative unit coordinate files for West, north-east and southern central Africa, were rasterised in IDRISI, on an initial image whose dimensions and window coordinates were equal to the cassava, climate and soil images described in Chapter 3. Each administrative unit was identified by its unique code. IDRISI's ASSIGN function uses this code to create thematic maps based on data for each administrative unit. The common element in a geographic definition image, and an attribute values file containing the new data, is this code. ASCII files with identifier codes and population density values were exported from the Atlas*Graphics spreadsheet and assigned to the administrative map to create a new image of population density for 1980. Initially, this consisted of the whole of Africa. However, we were only concerned with areas where climatic conditions permit cassava to be grown. Using a binary mask of the cassava climates map, we excluded all other areas. Finally the population data was converted from a continuous, unsealed image to a number of classes to produce Map 4.
Construction of the Cassava Model
Climate, soil and population maps consisted of discrete spatial units, or polygons. In the case of the population map, the polygon boundaries were those of the administrative units to which the population data pertained. We superimposed these three maps to create a new set of smaller polygons, each defined by a single climate, soil and population density. We considered each polygon to be a separate homogeneous observation for our analysis.
We used IDRISI to superimpose the maps, attach unique identifiers to each polygon, and identify its climate and soil characteristics and population density. Since each of these polygons had a real area, we were able to calculate its exact population. The computer map of cassava dots was then overlaid onto the polygon map, so that the number of dots falling into each polygon could be calculated. The number of 1000 ha 'dots' of cassava in each polygon was then transformed into a percentage of the total polygon area. The exact populations and percentage area in cassava were then recorded for each polygon, using IDRISI's EXTRACT routine.
To fit the model we used a stepwise regression method to estimate the effect of population (as the independent variable) on cassava as a percentage of land area (as the dependent variable). Environmental conditions, as specified above, were included as factors of population, since we did not discount the possibility of interaction between them.
Initial attempts to model cassava area were made with the general linear model (GLIM) package (Royal Statistical Society, 1977). This served to isolate three areas of extreme high and low residuals: Nigeria, parts of the Mtwara and Mwanza regions in Tanzania, and Burundi.
Residuals represent that portion of covariances not explained by the regression model. The aforementioned areas comprised of polygons with particularly high residual values, that is, they were not well explained by the model. In Appendix I (and in Chapter 5) we noted the significant variation in cassava data for Nigeria. We did not use alternative sources because they either lacked detail or were not sufficiently different to warrant their adoption. A number of sources have cast doubt on the area in cassava recorded for Nigeria, in favor of higher figures (K. Dvorak and A. Goldman, 1988, personal communications). Our initial estimates concurred, giving Nigeria very high negative residuals. To discount likely inaccuracy, we introduced into the model a factor for all Nigerian homologues.
Very high positive residuals coincided with areas of extreme concentration of cassava (Map 1), that is, Burundi, an adjacent area south of Lake Victoria in Tanzania, and a portion of the Mtwara region in the south-east of the country, along the Mozambique border. We had no reason to doubt the accuracy of any of the cassava data for these areas relative to the rest of Africa. For both Tanzania and Burundi, recent, detailed statistics had been used for the cassava map (See Appendix I). Therefore we separated both these regions as significantly atypical, on the grounds that there must be strong cultural or economic reasons for such an effect. Each region was assigned a separate factor in the model. Our justification for doing this, rather than rejecting the validity of the model, is purely geographic. These areas of residuals were very localised. In other words, the model seemed to fit over most of the area in which cassava was grown. This suggested that we would more likely find explanations for the residual pattern by looking at the particular characteristics of these small areas rather than seeking to identify an unknown number of variables that would be difficult to quantify for the whole of tropical Africa.
Two types of data elements were discounted from the analysis. Firstly, three urban areas of small spatial extent: Nairobi, Dar es Salaam and Lagos. These comprised small independent administrative units with very high population densities. This distinction was not made for urban areas included in larger administrative units, such as Kinshasa. Secondly, two areas were found which comprised mismatched pixels, in central Kenya and on the border of Mtwara and Lindi regions in Tanzania. These occurred during the process of defining the observation homologues by overlay in IDRISI. Areas which were factored out are shown in Figure 21.
The final model was fitted in GLIM and then in GENSTAT 5 (Lawes Agricultural Trust, 1987) as a check. The form of the model is as follows:
Ci = (AjiWPi + BkPi)2
Where,
Ci = percentage of land area under cassava for
the ith polygon
Ajk, Bk = Coefficients forjth soil, kth season
Pi = Population density for the ith polygon
The model accounts for 67.9% of the variance of land area in cassava. Table 16 shows the analysis of variance.
In the stepwise regression process, the interaction between population and soil was insignificant. Altitude was completely insignificant by itself and in all possible interactions. These terms were therefore dropped from the model.
Confidence limits:
± 1.96[V(Ajk)Pi + V(Bk)Pi2 + 2PiVPicov(AjBk)]
Upper and lower confidence limits were calculated on the square root term before squaring the values for plotting.
Table 17 gives the coefficients for the normal model, and for the three factored areas, Nigeria, Mtwara and Burundi/Mwanza. Fitted and residual values, and then fitted values, using projected population densities, were substituted into the equation for each unique polygon, along with the appropriate climate, soil and, where appropriate, regional factors (ODDS). IDRISI's assign function then allowed these new values to be substituted on the polygon identifier image.
68

Areas factored out of the model
Areas included in the final model
Figure 21. Areas of very high residuals (Hi) , which were factored out in the second run of the model.
Table 16. Analysis of variance from the model.
Source" df
Total
Mean
Total after mean
SPOP. SEAS
POP. SEAS
SPOP. SOIL
SPOP SEAS/ODDS
POP. SEAS/ODDS
Residual
a. R2 = .679.
Where,
1450
1
1449
3
3
2
8
7
1427
SS MS
2089.7
1102.6
987.1
302.5
69.6
6.6
263.2
28.6
316.6
VR
100.83
23.2
3.3
29.24
4.086
0.2216
455.0
104.7
14.9
131.9
18.4
30.60
7.05
0.67
26.66
2.90
32.07
Table 17. Coefficients for the normal model, and for the areas factored out, that is, for Ci = (AjkVPi + BkPi)2; Soilj =1,3; Season* = 1,3.
Model/factor Factor
Normal
POP = Polygon population, 1980 SPOP = VPOP SEAS = Dry season SOIL = Soil ODDS = Separate factors for Nigeria, Burundi, Mwanza and Mtwara
Seas i Seas2 Seas;»
Nigeria Seasi Seas2 Seasj
Mtwara Seasj
Seas2
Seasj
Burundi Seas i
Seas2
Seas}
Soi it Soi h Soib
.0954
.1601
.2165
.0283
.0657
.0037
.6963
.5751 NA
NA .5738 .4827
.1072
.1719
.2283
-.0165 .0775 .0081
.7081
.5869 NA
NA .5856 .4945
.1088
.1735
.2229
-.0149
.0791
.0097
.7097
.5885
NA
NA .5872
.4961
B All soils
-.00639
-.00348
-.00583
.00334
.00011
.00368
-.02889
-.01988
NA
NA -.02638
-.01763
69


Appendix III
POPULATION DATA USED TO BUILD THE MODEL OF CASSAVA DISTRIBUTION
Variables
1. NAME
2.POP(1000) :
3. DATE :
4. RATE :
5. POP 1.980 :
6. KM/AREA :
7. POPDEN80 :
Name of Administrative Unit
Population Recorded at Census
Census Date
Annual National Population Growth Rate (Average of U.S. Census Bureau and FAO estimates)
Estimated Population, 1980
Area of Administrative Unit
Estimated Population Density, 1980
NAME POP(IOOO) DATE RATE POP 1.980 KM/AREA POPDEN80
TIARET 568 1977 1.0308 622116.3 21499.5 28.9363
TTZIOUZO 823 1977 1.0308 901411.4 3734.764 241.3569
TLEMCEN 542 1977 1.0308 593639.1 10142.4 58.53043
Africa
NAME POP(1000) DATE
ADRAR 133 1977
ALGER 1691 1977
ANNABA 468 1977
BATNA 1570 1977
BECHAR 123 1977
BEJAIA 522 1977
BISKRA 457 1977
BUDA 829 1977
BOUIRA 361 1977
DJELFA 227 1977
ELASNAM 833 1977
GUELMA 520 1977
JIJEL 476 1977
LAGHOUAT 243 1977
M'SILA 378 1977
MASCARA 406 1977
MEDEA 453 1977
MOSTAGANE 715 1977
ORAN 654 1977
OUARGLA 171 1977
SAIDA 256 1977
SET1F 933 1977
SIDI BEL- 466 1977
SKIKDA 461 1977
TAMANRASS 37 1977
TEBESSA 328 1977
RATE POP 1.980 KM/AREA POPDEN80
ALGERIA
1.0308 145671.6 222221.1 0.655525
1.0308 1852110 1249.929 1481.772
1.0308 512588.8 3421.376 149.8194
1.0308 1719582 26417.89 65.09157
1.0308 134718.8 340842.6 0.395252
1.0308 571733.6 3985.993 143.4356
1.0308 500540.8 48484.6 10.32370
1.0308 907983.1 3651.885 248.6340
1.0308 395394.3 4317.512 91.57920
1.0308 248627.5 34161.96 7.277905
1.0308 912364.2 8435.595 108.1564
1.0308 569543.1 9331.731 61.03295
1.0308 521351 3193.457 163.2559
1.0308 266151.9 101579.4 2.620136
1.0308 414014 19515.57 21.21454
1.0308 444681.7 5003.859 88.86775
1.0308 496159.7 9601.09 51.67743
1.0308 783121.8 7876.157 99.42942
1.0308 716309.9 2066.553 346.6206
1.0308 187292 425017.2 0.440669
1.0308 280390.4 79797.57 3.513771
1.0308 1021892 10885.72 93.87454
1.0308 510398.2 10414.35 49.00912
1.0308 504921.8 4946.879 102.0687
1.0308 40525.18 596215.5 0.067970
1.0308 359250.3 20429.84 17.58458
BENGUELA
BIE
CABINDA
CONGO
CUANDO CU
CUANZA-NO
CUANZA-SU
CUNENE
HUAMBO
HUILA
LUANDA
LUNDA
MALANGE
MOCAMEDES
MOXICO
UIGE
ATAKORA
ATLANTIQU
BORGOU
MONO
OUEME
ZOU
CENTRE
CENTRE-ES
CENTRE-OU
EST
HAUTS BAS
PLAT. NORD
SAHEL
SUD-OUEST
VOLTA NOI
YATENGA
488 1960
453 1960
59 1960
104 1960
112 1960
263 1960
405 I960
294 1960
597 1960
301 1960
347 1960
247 1960
452 I960
43 1960
266 1960
399 1960
ANGOLA
1.0193 715254.1
1.0193 663955.1
1.0193 86475.39
1.0193 152431.2
1.0193 164156.7
1.0193 385475
1.0193 593602.3
1.0193 430911.3
1.0193 875013.7
1.0193 441171
1.0193 508592.5
1.0193 362024.1
1.0193 662489.4
1.0193 63024.43
1.0193 389872.1
1.0193 584808.1
39082.94
72131.2
7073.261
40844.13
201397.6
23970.35
55503.47
78347.17
34809.46
80108.37
36208.05
165992.4
95622.41
58922.25
203391.9
58715.06
18.30092
9.204825
12.22567
3.732022
0.815087
16.08132
10.69486
5.500023
25.13723
5.507177
14.04639
2.180967
6.928181
1.069620
1.916851
9.960103
BENIN
480 1979 1.0313 495024 31649.67 15.64073
686 1979 1.0313 707471.8 3224.537 219.4025
491 1979 1.0313 506368.3 53923.57 9.390481
477 1979 1.0313 491930.1 3157.197 155.8122
627 1979 1.0313 646625.1 5560.707 116.2846
570 1979 1.0313 587841 19849.68 29.61463
BURKINA FASO
1565 1985 1.0217 1405715
560 1985 1.0217 503003.5
1054 1985 1.0217 946724.5
692 1985 1.0217 621568.6
1165 1985 1.0217 1046427
731 1985 1.0217 656599.3
526 1985 1.0217 472464
457 1985 1.0217 410486.8
698 1985 1.0217 626958
537 1985 1.0217 482344.5
24936.42
8927.693
24571.23
108028.5
50427.09
24288.92
38072.84
12255.83
30199.28
13115.71
56.37196
56.34193
38.52979
5.753746
20.75128
27.03287
12.40947
33.49318
20.76069
36.77608
71

NAME POP(IOOO) DATE RATE POP 1.980 KM/AREA POPDEN80
BURUNDI
BUBANZA 330 1979 1.0152 335016 3620.805 92.52528
BUJUMBURA 461 1979 1.0152 468007.2 284.1218 1647.206
BURURI 458 1979 1.0152 464961.6 5208.468 89.27031
GITEGA 682 1979 1.0152 692366.4 3322.956 208.3585
MURAMVYA 381 1979 1.0152 386791.2 1529.648 252.8628
MUYINGA 546 1979 1.0152 554299.2 3631.165 152.6505
NGOZI 777 1979 1.0152 788810.4 2639.199 298.8825
RUYIGI 393 1979 1.0152 398973.6 5335.378 74.77888
BOTSWANA
BOTSWANA 941 1981 1.0351 909090.9 581452.6 1.563482
CENTRE-SU
EST
LITTORAL
NORD
NORD-OUES
OUEST
SUD-OUEST
BAMINGUI
BASSE KOT
GRIBINGUI
HAUTE KOT
HAUTE MBO
HAUTE SAN
LOBAYE
MBAOUMOU
NANA-MAMB
OMBELLA M
OUAKA
OUHAM
OUHAM-PEN
SANGHA
SIBUTTOW
VAKAGA
BOUENZA
CUVETTE
KOUILOU
LEKOUMOU
LIKOUALA
CAMEROON
1394 1976 1.0261 1545331 118051.7 13.09029
343 1976 1.0261 380235.7 49106.2 7.743130
841 1976 1.0261 932298 19593.01 47.58319
2090 1976 1.0261 2316888 165526.2 13.99710
915 1976 1.0261 1014331 15956.92 63.56684
969 1976 1.0261 1074194 13550.82 79.27151
580 1976 1.0261 642964.2 24427.9 26.32089
CENTRAL AFRICAN REPUBLIC
25 1961
113 1961
50 1961
16 1961
23 1961
52 1961
72 1961
72 1961
93 1961
130 1961
128 1961
182 1961
144 1961
31 1961
42 1961
18 1961
1.022
1.022
1.022
1.022
1.022
1.022
1.022
1.022
1.022
1.022
1.022
1.022
1.022
1.022
1.022
1.022
37801.3
170861.9
75602.59
24192.83
34777.2
78626.7
108867.7
108867.7
140620.8
196566.8
193542.6
275193.4
217735.5
46873.61
63506.18
27216.94
60968.35
18065.18
21256.04
82698.36
55814.27
31416.57
18274.96
64179.93
27091.29
32038.17
49287.5
50090.39
30561.87
18650.51
17510.92
43822.62
0.620015
9.458079
3.556757
0.292543
0.623087
2.502714
5.957205
1.696288
5.190627
6.135394
3.926809
5.493936
7.124416
2.513261
3.626661
0.621070
CONGO
185 1984 1.0366 160223.8 11833.66 13.53966
135 1984 1.0366 116920 78735.67 1.484968
372 1984 1.0366 322179.7 13939.32 23.11301
68 1984 1.0366 58893.06 22797.09 2.583358
49 1984 1.0366 42437.65 57083.36 0.743432
NAME POP(IOOO) DATE RATE POP 1.980 KM/AREA POPDEN80
NIARI 173 1984 1.0366 149830.9 26521.49 5.649414
PLATEAUX 109 1984 1.0366 94402.12 38280.04 2.466092
POOL 775 1984 1.0366 671207.7 35401.29 18.95997
SANGHA 46 1984 1.0366 39839.43 60579.85 0.657635
CHAD
CHAD 2524 1964 1.0139 3147834 1278160 2.462785
DJIBOUTI
DJIBOUTI 260 1979 1.0507 273182 22242.83 12.28180
EGYPT
EGYPT 36626 1976 1.0344 41931800 973058.9 43.09276
EQUATORIAL GUINEA
EQ. GUINEA 246 1960 1.0206 369867.5 25925.79 14.26639
ETHIOPIA
ARSI
BAGEMDER
BALE
ERITREA
GAMO-GOFA
GOJAM
HARERGE
ILUBABOR
KEFA
SHOA
SIDAMO
TIGRAY
WELEGA
WELO
1662
2905
1006
2615
1248
3245
4152
963
2450
9504
3791
2410
2370
3610
1984
1984
1984
1984
1984
1984
1984
1984
1984
1984
1984
1984
1984
1984
1.0244
1.0244
1.0244
1.0244
1.0244
1.0244
1.0244
1.0244
1.0244
1.0244
1.0244
1.0244
1.0244
1.0244
1509221
2637958
913523.6
2374616
1133278
2946704
3770328
874476.3
2224784
8630346
3442513
2188461
2152138
3278151
27065.39
75290.98
128929.7
119398.5
38616.74
65915.23
265991.9
47448.6
57083.36
84122.85
121030.2
63687.84
74850.69
81040.77
55.76202
35.03683
7.085439
19.88815
29.34680
44.70444
14.17459
18.42997
38.97430
102.5921
28.44342
34.36230
28.75241
40.45063
ESTUAIRE
HAUT-OGOO
MOYEN OGO
N'GOUNIE
NYANGA
OGOOUE MA
OGOOUE-IV
OGOOUE-LO
WOLEU-N T
GABON
61 1961 1.0383 124584.6 19771.98 6.301068
42 1961 1.0383 85779.56 33125.96 2.589496
34 1961 1.0383 69440.59 19145.2 3.627049
79 1961 1.0383 161347.3 38513.14 4.189409
37 1961 1.0383 75567.7 20960.78 3.605195
42 1961 1.0383 85779.56 22253.19 3.854708
35 1961 1.0383 71482.96 44677.31 1.599983
37 1961 1.0383 75567.7 29733.08 2.541536
78 1961 1.0383 159304.9 35793.65 4.450646
GAMBIA
GAMBIA 688 1983 1.035 620536.6 10012.9 61.97371
72

NAME POP(IOOO)
ACCRA
ASHANTI
BRONG-AHA
CENTRAL
EASTERN
NORTHERN
UPPER
VOLTA
WESTERN
BEYLA
BOKE
CONAKRY
DABOLA
KANKAN
KINDIA
LABE
1420
2090
1179
1146
1679
1163
1211
1201
1117
751
225
1025
763
818
783
1041
DATE
1984
1984
1984
1984
1984
1984
1984
1984
1984
1983
1983
1983
1983
1983
1983
1983
RATE POP 1.980
G H A N A
1.0317
1.0317
1.0317
1.0317
1.0317
1.0317
1.0317
1.0317
1.0317
1253356
1844729
1040639
1011512
1481962
1026517
1068884
1060057
985914.8
GUINEA
1.025
1.025
1.025
1.025
1.025
1.025
1.025
697378.2
208934.9
951814.4
708521.4
759594.3
727093.3
966672
GUINEA-BISSAU
KM/AREA
3111.768
24345.9
34897
9119.353
16825.17
70889.3
25899.89
17962.71
26495.59
34291.46
30328.77
11235.37
45765.11
67780.02
27997.78
26340.19
POPDEN80
402.7793
75.77164
29.82029
110.9192
88.08006
14.48056
41.26982
59.01431
37.21052
20.33678
6.889000
84.71589
15.48169
11.20675
25.96967
36.69950
NAME POP(IOOO)
LAKOTA
MAN
MANKONO
ODIENNE
OUME
SASSANDRA
SEGUELA
SOUBRE
TINGRELA
TOUBA
ZUENOULA
CENTRAL
COAST
EASTERN
NAIROBI
NORTHEAST
NYANZA
RIFT VALL
WESTERN
40
230
100
130
110
150
110
50
30
120
100
2346
1343
2720
828
374
2644
3240
1833
DATE
1975
1975
1975
1975
1975
1975
1975
1975
1975
1975
1975
1979
1979
1979
1979
1979
1979
1979
1979
RATE
1.0383
1.0383
1.0383
1.0383
1.0383
1.0383
1.0383
1.0383
1.0383
1.0383
1.0383
POP 1.980
48269.67
277550.6
120674.2
156876.4
132741.6
181011.3
132741.6
60337.09
36202.25
144809
120674.2
KENYA
1.041
1.041
1.041
1.041
1.041
1.041
1.041
1.041
2442186
1398063
2831520
861948
389334
2752404
3372840
1908153
KM/AREA
2592.579
6899.731
10616.37
18106.62
2519.801
19437.87
12652.1
7218.3
2326.587
9658.07
3688.145
13491.25
82750.16
162832.6
674.1742
127194.4
12934.41
173089
7622.338
POPDEN80
18.61839
40.22629
11.36680
8.664035
52.67939
9.312301
10.49166
8.358905
15.56023
14.99357
32.71948
181.0199
16.89498
17.38914
1278.524
3.060936
212.7970
19.48616
250.3369
GUINEA-BI 777 1979 1.0229 794793.3 31307.58 25.38660
IVORY COAST (CÔTE D'IVOIRE)
ABENGOURO 220 1975 1.0383 265483.2 6438.713
ABIDJAN 1450 1975 1.0383 1749776 14690.42
ABOISSO 180 1975 1.0383 217213.5 7936.763
ADZOPE 190 1975 1.0383 229280.9 5291.348
AGBOVILLE 110 1975 1.0383 132741.6 4283.842
BIANKOUMA 80 1975 1.0383 96539.34 3162.377
BONDOUKOU 280 1975 1.0383 337887.7 17233.79
BOUAFLE 160 1975 1.0383 193078.7 5485.597
BOUAKE 750 1975 1.0383 905056.3 20142.35
BOUNA 50 1975 1.0383 60337.09 23009.46
BOUNDIALI 110 1975 1.0383 132741.6 10580.11
DABAKALA 60 1975 1.0383 72404.5 9474.181
DALOA 300 1975 1.0383 362022.5 12675.41
DANANE 160 1975 1.0383 193078.7 5071.199
DIMBOKRO 500 1975 1.0383 603370.9 14592
DIVO 140 1975 1.0383 168943.8 8062.637
FERKESSED 70 1975 1.0383 84471.92 15195.47
GAGNOA 160 1975 1.0383 193078.7 3429.146
GUIGLO 120 1975 1.0383 144809 15716.05
ISSIA 70 1975 1.0383 84471.92 2794.598
KATIOLA 150 1975 1.0383 181011.3 7842.487
KORHOCO 230 1975 1.0383 277550.6 11996.83
41.23233
119.1100
27.36802
43.33128
30.98657
30.52746
19.60611
35.19739
44.93300
2.622273
12.54633
7.642296
28.56100
38.07357
41.34943
20.95391
5.559019
56.30518
9.214083
30.22685
23.08085
23.13532
LESOTHO
BONG
GRAND BAS
GRAND CAP
GRAND JID
LOFA
MARYLAND
MONTSERRA
NIMBA
SINO
AWBARI
BENGHAZI
DARNAH
JABAL AL 1
JABAL AL 2
KHUMS
MISRATAH
SAB HA
TRIPOLI
LESOTHO
1217 1976 1.0256 1346488 32892.86 40.93557
LIBERIA
194 1974 1.0313 233405.8 9181.512 25.42128
151 1974 1.0313 181671.5 12874.84 14.11058
57 1974 1.0313 68578 6112.375 11.21953
72 1974 1.0313 86624.84 16249.59 5.330893
181 1974 1.0313 217765.2 17816.54 12.22264
91 1974 1.0313 109484.2 4428.881 24.72051
440 1974 1.0313 529374.1 6599.293 80.21678
250 1974 1.0313 300780.7 11390.77 26.40565
68 1974 1.0313 81812.35 11833.66 6.913528
LIBYA
99 1973 1.0464 135993.8
278 1973 1.0464 381881.6
110 1973 1.0464 151104.2
121 1973 1.0464 166214.7
150 1973 1.0464 206051.2
156 1973 1.0464 214293.3
171 1973 1.0464 234898.4
104 1973 1.0464 142862.2
630 1973 1.0464 865415.2
376584.4
738664.9
66459.13
16863.42
146204.9
33721.66
72053.5
155684.3
3701.095
0.361124
0.51698-8
2.273640
9.856523
1.409331
6.354767
3.260055
0.917640
233.8267
73

NAME POP(IOOO) DATE RATE POP 1.980 KM/AREA POPDEN80
ZUWARAH 234 1973 1.0464 321439.9 8754.164 36.71851
DIEGO-SUA
HANARANT
MAJUNGA
TAMATAVE
TANANARIV
TULEAR1
CENTRAL
NORTHERN
SOUTHERN
GAO
KAYES
KOULIKORO
MOPTI
SEGOU
SIKASSO
ADRAR
ASSABA
BRAKNA
DAKHLET N
GORGOL
GUIDIMAKA
HODH ECH
HODH EL G
INCHIRI
TAGANT
TIRIS ZEM
TRARZA
AGADIR
AL HOCEIM
AZILAL
AZROU
BEN SLIMA
BENI MELL
CHAOUEN
EL J ADI DA
MADAGASCAR
598 1975 1.0269 682876.3 44081.62 15.49117
1804 1975 1.0269 2060048 102641.3 20.07036
820 1975 1.0269 936385.6 153379.2 6.105036
1180 1975 1.0269 1347482 72131.2 18.68098
2168 1975 1.0269 2475712 58222.96 42.52123
1034 1975 1.0269 1180759 161718.9 7.301304
MALAWI
2144 1977 1.0297 2340761 34679.96 67.49606
649 1977 1.0297 708560.4 27635.19 25.63978
2755 1977 1.0297 3007834 35146.15 85.58075
MALI
861 1976 1.0255 952238.9 813515.6 1.170523
873 1976 1.0255 965510.6 122040.3 7.911407
1351 1976 1.0255 1494164 92125.91 16.21871
1129 1976 1.0255 1248639 91167.62 13.69607
1082 1976 '1.0255 1196658 58015.76 20.62642
1098 1976 1.0255 1214354 72934.09 16.65001
MAURITANIA
55 1977
129 1977
151 1977
24 1977
150 1977
83 1977
156 1977
124 1977
18 1977
77 1977
22 1977
350 1977
1.0243
1.0243
1.0243
1.0243
1.0243
1.0143
1.0243
1.0243
1.0243
1.0243
1.0243
1.0243
59107.72
138634.5
162277.5
25792.46
161202.9
86611.85
167651
133261
19344.34
82750.8
23643.09
376140
487954
36907.35
33384.96
17806.18
11983.88
11180.98
182438.8
49753.69
39082.94
98911.69
263142.9
76922.68
0.121133
3.756284
4.860796
1.448511
13.45164
7.746355
0.918943
2.678414
0.494956
0.836612
0.089848
4.889845
MOROCCO
580 1982 1.0238 553347.2 6531.953 84.71389
311 1982 1.0238 296708.6 3820.234 77.66765
387 1982 1.0238 369216.2 10510.18 35.12938
131 1982 1.0238 124980.1 14211.27 8.794435
174 1982 1.0238 166004.2 1727.523 96.09377
669 1982 1.0238 638257.4 5433.797 117.4606
309 1982 1.0238 294800.5 4094.773 71.99434
763 1982 1.0238 727937.8 4835.51 150.5400
NAME POP(IOOO)
ELKELAA
ER RACHID
ESSAOUIRA
FES
FIGUIG
GUELMIN
IFRANE
KENITRA
KHEMISSET
KHENIFRA
MARRAKECH
MEKNÈS
NADOR
OUARZAZAT
OUJAD
SAH
SETTAT
SIDI KACE
TANGER
TAN-TAN
TAOUNATE
TARFAYA T
TAROUDANT
TATA
TAZA
TETOUAN
TIZNIT
578
421
394
805
101
129
100
716
406
364
1267
627
593
534
781
707
1129
514
436
47
536
113
559
100
613
704
313
DATE
1982
1982
1982
1982
1982
1982
1982
1982
1982
1982
1982
1982
1982
1982
1982
1982
1982
1982
1982
1982
1982
1982
1982
1982
1982
1982
1982
RATE POP 1.980
1.0238
1.0238
1.0238
1.0238
1.0238
1.0238
1.0238
1.0238
1.0238
1.0238
1.0238
1.0238
1.0238
1.0238
1.0238
1.0238
1.0238
1.0238
1.0238
1.0238
1.0238
1.0238
1.0238
1.0238
1.0238
1.0238
1.0238
551439.1
401653.8
375894.5
768007.8
96358.73
123072
95404.69
683097.6
387343
347273.1
1208777
598187.4
565749.8
509461.1
745110.6
674511.2
1077119
490380.1
415964.4
44840.2
511369.2
107807.3
533312.3
95404.69
584830.8
671649
298616.7
KM/AREA
10264.13
36441.15
5371.638
5441.567
36389.35
28075.48
3268.566
4252.762
8370.845
11913.95
13809.82
3877.214
4177.653
34964.86
17847.62
8585.815
12986.21
4908.03
532.7608
13579.31
6847.932
5363.868
17653.37
24931.24
14794.02
5565.887
9658.07
POPDENJ
53.72487
11.02198
69.97763
141.1372
2.647992
4.383611
29.18854
160.6244
46.27286
29.14844
87.53025
154.2827
135.4228
14.57066
41.74845
78.56111
82.94329
99.91383
780.7714
3.302097
74.67498
20.09879
30.21022
3.826712
39.53156
120.6724
30.91887
CABO DELG
GAZA
INHAMBANE
MANICA
MAPUTO PR
NAMPULA
NIASSA
SOFALA
TETE
ZAMBEZIA
BETHANIE N
BOESMANLA
CAPRIVIE
DAMARALAN
GOBABIS
MOZAMBIQUE
940 1980 1.0266 940000 82905.56 11.33820
991 1980 1.0266 991000 75964.38 13.04558
998 1980 1.0266 998000 67495.12 14.78625
641 1980 1.0266 641000 61693.54 10.39006
1247 1980 1.0266 1247000 22838.53 54.60071
2403 1980 1.0266 2403000 75601.79 31.78496
514 1980 1.0266 514000 117896.3 4.359763
1065 1980 1.0266 1065000 68919.62 15.45278
831 1980 1.0266 831000 101838.4 8.159986
2500 1980 1.0266 2500000 100906 24.77553
NAMIBIA
4 1970 1.0186 4809.463 19813.42 0.242737
0.5 1970 1.0186 601.1829 17389.19 0.034572
26 1970 1.0186 31261.51 17513.51 1.784993
13 1970 1.0186 15630.75 47785.3 0.327103
23 1970 1.0186 27654.41 46749.31 0.591546
74

RATE POP 1.980 KM/AREA POPDEN80
1.0186 26452.05 25796.29 1.025420
1.0186 13226.02 43097.42 0.306886
1.0186 10821.29 15055.61 0.718754
1.0186 15630.75 47888.9 0.326396
1.0186 10821.29 39575.04 0.273437
1.0186 12023.66 15972.46 0.752774
1.0186 66130.12 45247.11 1.461532
1.0186 26452.05 51178.19 0.516861
1.0186 20440.22 52576.78 0.388768
1.0186 6011.829 26443.79 0.227343
1.0186 25249.68 55244.47 0.457053
1.0186 13226.02 17653.37 0.749206
1.0186 6011.829 7788.098 0.771925
1.0186 19237.85 21297.48 0.903292
1.0186 15630.75 39885.84 0.391887
1.0186 367923.9 50331.65 7.309990
1.0186 28856.78 15040.07 1.918659
1.0186 9618.926 20062.06 0.479458
1.0186 22844.95 15221.37 1.500847
1.0186 28856.78 27324.39 1.056081
1.0186 91379.8 33281.36 2.745675
NIGER
AGADEZ 125 1977 1.0316 146038.3 634806.4 0.230051
DIFFA 167 1977 1.0316 183337.2 144029.3 1.272915
DOSSO 693 1977 1.0316 760794.3 30794.97 24.70514
MARADI 944 1977 1.0316 1036349 34783.56 29.79421
NIAMEY 1172 1977 1.0316 1286654 96632.5 13.31491
TAHOUA 994 1977 1.0316 1091240 99533.29 10.96356
NAME POP(1000)
GROOTFONT
HEREROLAN 1
HEREROLAN 2
KAOKOLAND
KARASBURG
KARIBIB
KAVANGO
KEETMANSH
LÜDERITZ
MALTAHÖHE
MARIENTAL
OKAHANDJA
OMARURU
OTJIWARON
OUTJO
OWAMBO
REHOBOTH
SWAKOPMUN
TSUMEB
WALVIS BAY
WINDHOEK
22
11
9
13
9
10
55
22
17
5
21
11
5
16
13
306
24
8
19
24
76
DATE
1970
1970
1970
1970
1970
1970
1970
1970
1970
1970
1970
1970
1970
1970
1970
1970
1970
1970
1970
1970
1970
NAME POP(IOOO) DATE RATE POP 1.980 KM/AREA POPDEN80
OGUN
ONDO
OYO
PLATEAU
RIVERS
SOKOTO
1551 1963 1.0291 2525750 15345.69 164.5901
2730 1963 1.0291 4445711 21320.79 208.5153
5209 1963 1.0291 8482678 35275.65 240.4683
2027 1963 1.0291 3300900 55788.37 59.16824
1720 1963 1.0291 2800961 15719.34 178.1856
4539 1963 1.0291 7391606 101786.6 72.61865
RWANDA
BUTARE
BYUMBA
CYANGUGU
GIKONGORO
GISENYI
GITARAMA
KIBUNGO
KIBUYE
KIGALI
RUHENGERI
580 1978
503 1978
323 1978
358 1978
452 1978
585 1978
346 1978
326 1978
673 1978
507 1978
1.0364
1.0364
1.0364
1.0364
1.0364
1.0364
1.0364
1.0364
1.0364
1.0364
622992.4
540284.8
346942.3
384536.7
485504.5
628363.1
371647.2
350164.7
722886.1
544581.3
1799.266
4716.371
1729.595
2041.17
1601.908
2177.145
3501.666
1362.852
3107.987
1687.896
346.2480
114.5551
200.5916
188.3903
303.0788
288.6179
106.1343
256.9352
232.5898
322.6391
CASAMANCE
DIOURBEL
FLEUVE
LOUGA
ORIENTAL
SINE-SALO
THIES
SENEGAL
731 1976 1.0289 819238 29474.08 27.79520
423 1976 1.0289 474059.7 4175.063 113.5455
515 1976 1.0289 577164.9 41957.82 13.75583
420 1976 1.0289 470697.6 30665.47 15.34943
287 1976 1.0289 321643.4 57135.16 5.629517
1006 1976 1.0289 1127433 24843.18 45.38199
1616 1976 1.0289 1811065 8873.303 204.1026
SIERRA LEONE
ZINDER
ANAMBRA
BAUCHI
BENDEL
BENUE
BORNO
CROSS
F.C.T.
GONGOLA
IMO
KADUNA
KANO
KW ARA
LAGOS
NIGER
1004
3597
2431
2461
2427
2997
3478
129
2605
3673
4098
5775
1714
1444
1066
1977
1963
1963
1963
1963
1963
1963
1963
1963
1963
1963
1963
1963
1963
1963
1.0316 1102219
NIGERIA
1.0291
1.0291
1.0291
1.0291
1.0291
1.0291
1.0291
1.0291
1.0291
1.0291
1.0291
1.0291
1.0291
1.0291
5857591
3958800
4007654
3952286
4880512
5663804
210072.1
4242153
5981355
6673452
9404389
2791190
2351505
1735944
144158.8
16987.74
66070.63
40170.73
48795.4
111706.2
25114.22
7052.541
99222.48
13056.14
70499.51
42424.02
56979.76
3952.324
58326.56
7.645866
344.8128
59.91769
99.76552
80.99710
43.69060
225.5217
29.78672
42.75395
458.1258
94.65955
221.6760
48.98563
594.9676
29.76249
EASTERN
NORTHERN
SOUTHERN
BAKOOL
BARA
BAY
GALGUDUUD
GEDO
HIIRAAN
JUBBADA H
MOGADISHU
MUDUG
NUGAAL
SANAAG
SHABEELLA D
776
1362
598
100
155
302
182
212
147
246
371
215
85
146
237
1974
1974
1974
1975
1975
1975
1975
1975
1975
1975
1975
1975
1975
1975
.1975
1.0186
1.0186
1.0186
866729.8
1521245
667918
SOMALIA
1.0718
1.0718
1.0718
1.0718
1.0718
1.0718
1.0718
1.0718
1.0718
1.0718
1.0718
1.0718
141438.9
219230.2
427145.3
257418.7
299850.4
207915.1
347939.6
524738.1
304093.5
120223
206500.7
335210.1
17852.79
35068.45
19808.24
25306.79
67987.22
39082.94
44910.41
53923.57
36104.45
51929.29
862.9844
68323.91
50634.29
57238.76
20163.07
48.54870
43.37930
33.71919
5.588970
3.224579
10.92920
5.731826
5.560655
5.758711
6.700257
608.0505
4.450762
2.374339
3.607707
16.62495
75

NAME POP(IOOO)
SHABEELLA H
TOGDHEER
WOQOOYIG
CAPE PROV
NATAL
ORANGE FR
TRANSVAAL
BAHR EL G
BLUE NILE
DONGOLAT
EASTERN E
EL BUHEYR
ELGEZIRA
JONGLEI
KASSALA
KHARTOUM
NILE
NORTHERN
NORTHERN
RED SEA
SOBAT
SOUTHERN
SOUTHERN
WESTERN E
WHITE NIL
SWAZILAND
ARUSHA
BAGAMOYO
BIHARAMUL
BUKOBA
CHUNYA
DAR ES SA
DODOMA
GEITA
HANDENI
IRAMBA
IRINGA
KAHAMA
! 398
258
440
5044
2148
1776
7580
871
2016
918
455
451
658
377
494
1096
566
1376
1310
437
384
701
788
267
949
495
214.2
117.5
81.9
383.1
53.6
348.4
321
371.4
133.3
183.9
252.6
m7.7
DATE
1975
1975
1975
RATE
1.0718
1.0718
1.0718
POP 1.980
562926.6
364912.3
622330.9
SOUTH AFRICA
1985
1985
1985
1985
1973
1973
1973
1973
1973
1973
1973
1973
1973
1973
1973
1973
1973
1973
1973
1973
1973
1973
1.0417
1.0417
1.0417
1.0417
4112082
1751140
1447870
6179536
SUDAN
1.0314
1.0314
1.0314
1.0314
1.0314
1.0314
1.0314
1.0314
1.0314
1.0314
1.0314
1.0314
1.0314
1.0314
1.0314
1.0314
1.0314
1.0314
1081454
2503112
1139810
564938.6
559972.1
816988.1
468091.9
613361.8
1360819
702758.7
1708474
1626526
542589.3
476783.3
870377.8
978399.1
331513.4
1178300
SWAZILAND
1976
t
1976
1976
1976
1976
1976
1976
1976
1976
1976
1976
1976
1976
1.0288 554535.1
TANZANIA
1.0323
1.0323
1.0323
1.0323
1.0323
1.0323
1.0323
1.0323
1.0323
1.0323
1.0323
1.0323
241084
132247.3
92179.17
431182.4
60327.27
392127.3
361288.3
418013.9
150030.3
206981.1
284303.5
166237.6
KM/AREA
24244.89
42165.02
44314.72
639727.3
96036.81
132270.8
278164.8
131804.5
77440.68
368555.5
125562.7
68298.02
25260.16
117197
113830
21325.97
130354.2
335144.6
242992.8
201604.8
119320.8
170783.9
146023.6
73866.49
36467.05
16697.66
2939.653
9393.94
11357.16
8135.198
27454.03
1222.222
17140.64
9367.6
13392.9
7850.298
28412.33
19422.43
POPDEN80
23.21836
8.654384
14.04343
6.427866
18.23405
10.94625
22.21537
8.204985
32.32295
3.092641
4.499254
8.198950
32.34295
3.994060
5.388402
63.81041
5.391147
5.097721
6.693720
2.691351
3.995810
5.096369
6.700280
4.488008
32.31136
33.21034
82.01103
14.07794
8.116392
53.00208
2.197393
320.8314
21.07788
44.62338
11.20222
26.36601
10.00634
8.559054
NAME POP(IOOO)
KARAGWE
KASULU
KIBONDO
KIGOMA
KILIMANJA
KILOSA
KILWA
KISARAGWE
KONDOA
KOROGWE
KWIMBA
LINDI
LUSHOTO
MAFIA
MAFIA
MANYONI
MASAI
MASASI
MASWA
MBEYA
MBINGA
MBOZI
MBULU
MOROGORO
MPANDA
MPWAPWA
MTWARA
MUFINDI
MUGUMU
MUSOMA
MWANZA
NACHINGWE
NEW ALA
NGARA
NJOMBE
NORTMARA
NZEGA
PANGANI
PARE
PEMBA
RUFIJI
RUNGWE
SHINYANGA
SINGIDA
SOGEA
97.4
207.6
136.9
128.9
503.1
193.8
98
80.5
212.2
140.3
305.5
241.4
210.5
289.4
16.7
80.2
106.9
213.7
430.3
192.7
144
147.5
289.4
316.4
60.8
176.2
134.8
118.5
94.5
256.6
269.7
80.5
272.9
96.3
318.8
193.5
302.1
28.4
149.6
164.3
121
360
320.9
193.8
151.4
DATE
1976
1976
1976
1976
1976
1976
1976
1976
1976
1976
1976
1976
1976
1976
1976
1976
1976
1976
1976
1976
1976
1976
1976
1976
1976
1976
1976
1976
1976
1976
1976
1976
1976
1976
1976
1976
1976
1976
1976
1976
1976
1976
1976
1976
1976
RATE POP 1.980
1.0323
1.0323
1.0323
1.0323
1.0323
1.0323
1.0323
1.0323
1.0323
1.0323
1.0323
1.0323
1.0323
1.0323
1.0323
1.0323
1.0323
1.0323
1.0323
1.0323
1.0323
1.0323
1.0323
1.0323
1.0323
1.0323
1.0323
1.0323
1.0323
1.0323
1.0323
1.0323
1.0323
1.0323
1.0323
1.0323
1.0323
1.0323
1.0323
1.0323
1.0323
1.0323
1.0323
1.0323
1.0323
109624.6
233655.6
154082.2
145078.1
566243.5
218123.6
110299.9
203154.3
238833
157908.9
343842.9
271697.8
236919.6
325722.2
18796
90265.8
120316.9
240521.2
484306.4
216885.5
162073.3
166012.5
325722.2
356111
68430.93
198314.7
151718.6
133372.8
106360.6
288805.6
303549.8
90603.45
307151.3
108386.5
358812.2
217786
340016.2
31964.45
168376.1
184921.1
136186.6
405183.2
361175.8
218123.6
170402
KM/AREA
6661.487
9305.88
15793.84
13781.4
5405.335
13804.71
13706.29
9712.51
13537.94
3879.824
5537.426
9730.64
3765.864
16607.1
355.8663
28671.33
63273.77
9826.47
21989.12
19028.75
7645.688
9458.69
16607.1
19355.09
46283.35
11564.36
4087.024
7161.357
12551.15
5503.755
3918.674
42709.15
3742.554
2771.303
21028.23
4092.204
13926.44
1576.794
8487.44
843.0458
12893.03
4641.285
9494.949
13097.64
35405.34
POPDEN80
16.45647
25.10839
9.755841
10.52709
104.7564
15.80066
8.047387
20.91677
17.64175
40.70002
62.09436
27.92189
62.91242
19.61343
52.81758
3.148295
1.901529
24.47687
22.02482
11.39778
21.198
17.55133
19.61343
18.39883
1.478522
17.14878
37.12202
18.62395
8.474169
52.47427
77.46236
2.121406
82.06999
39.11031
17.06336
53.21972
24.41515
20.2718
19.83827
219.3488
10.5628
87.29978
38.03872
16.65365
4.812891
76

NAME POP(IOOO) DATE RATE POP 1.980 KM/AREA POPDEN80
SUMBAWANG 215.3 1976 1.0323 242322 22494.17 10.77266
TABORA 200.1 1976 1.0323 225214.3 60916.86 3.697077
TANGA 258.6 1976 1.0323 291056.6 4467.754 65.14606
TUNDURU 97.6 1976 1.0323 109849.7 16840.2 6.523062
UKEREWE 109.3 1976 1.0323 123018.1 635.4908 193.5797
ULANGA 174.9 1976 1.0323 196851.5 39911.94 4.932145
ZANZIBAR 290.5 1976 1.0323 326960.3 1596.172 204.8403
CENTRE
KARA
MARITIME
PLATEAUX
SAVANES
BEJA
BIZERTE
GABES
GAFSA
JENDOUBA
KAIROUAN
KASSERINE
KEF
MAHDIA
MEDENINE
MONASTIR
SFAX
SIDIBOUZ
SILIANA
SOUSSE
ZAGHOUAN
BUSOGA
CENTRAL
EASTERN
KARAMOJA
NILE
NORTH BUG
NORTHERN
SOUTH BUG
SOUTHERN
WESTERN
TOGO
299 1970 1.0289 397560.2 19380.89 20.51300
237 1970 1.0289 315123 4485.861 70.24805
703 1970 1.0289 934731.9 6920.451 135.0680
470 1970 1.0289 624927.4 18746.34 33.33596
241 1970 1.0289 320441.5 8847.403 36.21870
275
395
335
304
359
422
298
248
270
396
278
578
289
222
322
1974
1984
1984
1984
1984
1984
1984
1984
1984
1984
1984
1984
1984
1984
1984
1984
1984
TUNISIA
1.022 252074.7
1.022 362070.9
1.022 307072.8
1.022 278657.1
1.022 329072
1.022 386820
1.022 273157.3
1.022 227325.5
1.022 247491.5
1.022 362987.5
1.022 254824.6
1.022 529815.1
1.022 264907.5
1.222 99556.16
1.022 295156.5
1.022 1809438
3577.008
3605.265
28360.38
14457.32
3095.037
7158.731
7650.828
5560.707
3048.417
46749.31
846.1495
6822.032
6345.474
5286.168
2623.659
8298.325
70.47082
100.4283
10.82752
19.27446
106.3224
54.03471
35.70297
40.88068
81.18689
7.764553
301.1578
77.66235
41.74747
18.83333
112.4980
218.0485
UGANDA
1223
1118
2016
350
811
1554
1261
906
1963
1427
1980
1980
1980
1980
1980
1980
1980
1980
1980
1980
1.0231
1.0231
1.0231
1.0231
1.0231
1.0231
1.0231
1.0231
1.0231
1.0231
1223000
1118000
2016000
350000
811000
1554000
1261000
906000
1963000
1427000
10248.59
5319.838
21859.51
27194.89
17500.56
24760.3
40274.33
10764
21253.45
30095.68
119.3334
210.1567
92.22530
12.87006
46.34137
62.76175
31.31026
84.16945
92.36147
47.41544
NAME POP(IOOO) DATE
BAS-FLEUV 675283 1984
BAS-UELE 579701 1984
BOMA 179455 1984
CATARACTE 747781 1984
HAUT-LOMA 881046 1984
HAUT-SHAB 1328316 1984
HAUT-UELE 889882 1984
KABINDA 791047 1984
KAS AI 976731 1984
KINSHASA 2653558 1984
KOLWEZI 383974 1984
KWANGO 847876 1984
KWILU 2146057 1984
LALUKAYA 369001 1984
LALULUA 1310685 1984
LAMONGAL 672097 1984
LATSHOPO 1053022 1984
LATSHUAP 575200 1984
LUALABA 350054 1984
L'EQUATEU 620565 1984
L'lTURI 1683464 1984
MAI-NDOMB 688912 1984
MANIEMA 806496 1984
NORD-KIVU 2379471 1984
NORD-UBAN 527687 1984
SANKURU 658556 1984
SUD-KIVU 2001898 1984
SUD-UBANG 1009863 1984
TANGANYIKA 930629 1984
TSHILENGE 953000 1984
RATE POP 1.980 KM/AREA POPDEN80
ZAIRE
1.0292 601847.9 10704.48 56.22393
1.0292 516660.1 141025.6 3.663591
1.0292 159939.9 4377.105 36.5401
1.0292 666462.1 25685.06 25.94746
1.0292 785234.9 111914 7.016413
1.0292 1183865 120202 9.848966
1.0292 793110.1 92799.8 8.546463
1.0292 705022.8 54882.16 12.84612
1.0292 870514.4 100932.4 8.624727
1.0292 2364992 11069.67 213.6461
1.0292 342218 44884.75 7.624372
1.0292 755672.1 86454.29 8.740712
1.0292 1912680 79823.88 23.96125
1.0292 328873.1 13988.6 23.51008
1.0292 1168152 53405.86 21.87311
1.0292 599008.6 55866.36 10.72217
1.0292 938509 200647.5 4.677402
1.0292 512648.6 128697.2 3.98337
1.0292 311986.7 80523.18 3.874495
1.0292 553080.4 100103.6 5.52508
1.0292 1500392 66796.16 22.46225
1.0292 613994.8 129810.9 4.729917
1.0292 718791.9 131986.5 5.44595
1.0292 2120711 58689.46 36.13444
1.0292 470302.6 60062.16 7.830265
1.0292 586940 106190.1 5.527257
1.0292 1784198 57860.66 30.83611
1.0292 900043.5 57135.46 15.7528
1.0292 829425.8 124553.2 6.659209
1.0292 849364.1 9930.07 85.53455
CENTRAL
COPPER BEL
EASTERN
LUAPULA
NORTHERN
NORTH-WES
SOUTHERN
WESTERN
ZAMBIA
208 1980 1.0329 1208000 116834.4 10.33942
1249 1980 1.0329 1249000 30380.57 41.11180
656000 67003.02 9.790603
413000 51747.98 7.980987
678000 143537.2 4.723514
302000 124837.5 2.419144
686000 84718.55 8.097400
488000 128903.8 3.785768
656 1980 1.0329
413 1980 1.0329
678 1980 1.0329
302 1980 1.0329
686 1980 1.0329
488 1980 1.0329
WESTERN S
WESTERN SAHARA
76 1970 1.0746 156056.5 266509.9 0.585556
ZIMBABWE
MANIÇALAN 1052 1982 1.0344 983192.9 36259.85 27.11519
MASHONALA1 678 1982 1.0344 633654.7 29059.68 21.80528
MASHONALA2 1336' 1982 1.0344 1248618 27039.49 46.17757
77

NAME POP(IOOO) DATE RATE POP 1.980 KM/AREA POPDEN80 NAME POP(IOOO) DATE RATE POP 1.980 KM/AREA POPDEN80
MASHONALA 824 1982 1.0344 770105.4 55503.47 13.87490 MIDLANDS 1079 1982 1.0344 1008427 55555.27 18.15177
MATABELEL1 841 1982 1.0344 785993.6 76767.28 10.23865 VICTORIA 973 1982 1.0344 909359.9 55477.57 16.39148
MATABELEL2 538 1982 1.0344 502811.6 54545.17 9.218260
78

LIST OF ACRONYMS USED IN TEXT
AGS American Geographical Society of New York UTA International Institute of Tropical Agriculture
ASA American Society of Agronomy ILO International Labor Organization
CBN Central Bank of Nigeria INS L'Institut National de la Statistique (Zaire)
CIAT Centro Internacional de Agricultura Tropical IRA L'Institut de Recherche Agronomique du Cameroun
COSCA Collaborative Study of Cassava in Africa ISAR L'Institut des Sciences Agronomiques du Rwanda
CSS A Crop Science Society of America ISRIC International Soils Reference and Information Centre
FAO Food and Agriculture Organization of the United Nations
ISTRC International Society for Tropical Root Crops
FOS Federal Office of Statistics (Nigeria) KIT Koninklijk Instituut voor de Tropen (In English, Dutch
Royal Tropical Institute)
GEMS Global Environment Monitoring System (database system)
NAFPP National Accelerated Food Production Program (Nigeria)
GRID Global Resource Information Database NAG Numerical Algorithms Group (England)
GTZ Deutsche Gesellschaft fuer Technische Zusammenarbeit SIDA Swedish International Development Agency (In English: German Agency for Technical Cooperation)
IAC International Agriculture Centre, Germany SSS A Soil Science Society of America
IADS International Agricultural Development Service UNEP United Nations Environmental Programme
ICRISAT International Crops Research Institute for the Semi-Arid Tropics
UNESCO United Nations Educational, Scientific, and Cultural Organization
IDRC International Development Research Centre UNICEF United Nations International Children's Emergency Fund
IFPRI International Food Policy Research Institute USDA United States Department of Agriculture
79


INDEX
African Library of Brussels (Belgium), 15
African farming systems, cassava, role of, 1, 2-3, 6, 11, Figures 1, 2 cassava varieties in, 5 land use intensity in, 3-4, Figure 2 types of, 2, 29-30, 31-32, 36,37, Figure 1 variability of, 1-2
African Studies Centre (Leiden, Netherlands), 15
Agricultural extensification and intensification, see also Land use intensification, 3-6, 32,40,42,43,44, Figures 1, 2
Agricultural production, intensification of, 3, 5
Agricultural University of Wageningen, 15
Algeria, 71
Alima (river), 11
Anambra (river), 30
Angola, cassava, introduction of, 9, 12 cassava, role in war, 43 cassava distribution, 15,16, 63 cassava production, 14,16 population, 14,23,71
Arabs (people), 12
ASCII, 68
Atlas*Draw digitization program, 67
Atlas*Graphics package, 67, 68
Bambara (people), 12
Bantu (people), 9, 11
Bas-Zaïre, see Zaire, Bas-Zaïre
Benin (country), 11-12, 14, 16, 63, 71
Benue (river), 12,27
Botswana, 16, 22,23,72
Brazilians (people), 9,11,12,13
British Museum, 15
Burkina Faso, 14, 16,23, 63,71
Burundi, see also Great Lakes Region cassava, introduction of, 12,13 cassava distribution, 17 cassava distribution model, 24,25,43,63,68, Figure 21 cassava production, 14,16 land intensification in, 42 population, 14,23, 38,40,72 soils, 39
Cameroon, African farming systems in, 2,5
cassava, demand for, 6 cassava, introduction of, 11 cassava as cash crop, 42 cassava distribution, 17, 63 cassava production, 14,16 population, 14,72
Cap Lopez, 11
Cape Verde, 14, 63
Cassava, adaptability,
to African farming systems, 1, 11, 12,13,41 agronomic versatility, 1, 5-6 ecological versatility, 1,9, 19,41 economic flexibility, 5
agroecological data, 1, 67 case studies, see also Cassava distribution model, 27
Nigeria, 27-33 Tanzania, 27, 33-38 Zaire, 27, 38-40
consumption of leaves, 5, 9, 38 consumption patterns, 1,6, 11, 13, 33 fear of poisoning, 6, 12 history, see below, introduction of interrelationships with other crops, see African farming
systems; see above, case studies introduction of, 1,9-13, 34, Figure 3 linguistic studies on, 9 magical uses of, 13 medicinal uses of, 12,13 'niche', see below, role in ... role in African farming systems, 1, 2-3, 5-6 role in commercial cropping, 5 role in development, 1,44 role in war, 11,25,43 socio-economic data, 1 statistical data, 1, 15-16, 27, 30, Figure 4 yields, 14,43, Figure 1
Cassava agroecology, 1, 19-22,23,27,41,67, Figures 5, 6, 7, Maps 2, 3, 5
Cassava as animal feed, 2, 3,44
Cassava as anti-drought crop, 12,13, 19, 37
Cassava as anti-famine crop, 12,13, 34,44
Cassava as anti-locust crop, 6, 12, 13
Cassava as cash crop, 5, 6, 13, 31,42,43,44, Figure 1
Cassava as women's crop, 2, 13, 38,41,44
Cassava distribution in Africa, see also Nigeria, cassava distribution; Tanzania, cassava distribution; Zaire, cassava distribution, 1,6-7,14,16-17, 19-24, 67, Figure 5, Maps 1, 6, 8
Cassava distribution model, see also Cassava, case studies, 1, 6-7, 23-25,68,69
extrapolation, 25, Map 8 factors unaccounted by, 41 fitted values, 24, Figures 6, 7, Map 6 generation of, 23, 68-69 hypotheses for, 6,42
81

implications for research, 43-44 match with environment, 19-22,23-25,41,43, Figures 6, 7 match with population density, 23, 32,41,43, Figures 6, 7 quality of data, 15-16, 27, Figure 4 residuals, 24-25, 27, 31-32,40,42-43,68, 69, Figure 21,
Map 7
Cassava processing, 11, 12, 13 new technology in, 5, 6,44 products, see 'Chikwangue'; 'Farinha'; 'Gari'; 'Lafun' traditional processing by women, 6
Cassava production, 1, 6, 9, 14, 30-31,41,43, Figure 11,
Maps 6, 8
Cassava production area, see Cassava distribution
Cassava varieties, 5,9, 13,41,44
Cassava yields, 14
Central Africa, African farming systems in, 2 agricultural extensification in, 4 cassava, introduction of, 9, 11, 12, 13 cassava yields, 43 land use extensification in, 5 population, 68
Central African Republic, African farming systems in, 2 cassava, introduction of, 11 cassava distribution, 14, 16, 17,63 cassava distribution model, 25 population, 14, 63,72
Central Bank of Nigeria (CBN), 31, Figure 11
Centra Internacional de Agricultura Tropical (CIAT), 15, 19,
43,67
Chad, 14, 16, 63, 72, Figure 4
'Chikwangue' (cassava product), 11
Climate, see Cassava agroecology
Collaborative Study of Cassava in Africa (COSCA), 22,23
Comores, 14, 16, 63
Congo (basin), 11,23,24,38
Congo (country), African farming systems in, 2 cassava, introduction of, 9, 11 cassava distribution, 63-64 cassava production, 14, 16,43 population, 14, 72
Congo (river), 9, 11, 17,25,38
Côte d'Ivoire, see Ivory Coast
Cross River (river), 30
Cultivation systems, see African farming systems
Diffusion, see Cassava, introduction of
Djibouti, 72
East Africa, 5, 12-13,25,43,68
Egypt, 72
Equatorial Guinea, see also Guineas, cassava, introduction of, 9, 11 cassava production, 14,16, 64 political divisions, 22 population, 14,72
Ethiopia, 16,23,72
Fang (people), 11
'Farinha' (cassava product), 9, 12
Farming systems, see African farming systems
Federal Office of Statistics (FOS, Nigeria), 30, 31, Figure 11
Food and Agriculture Organization of the United Nations (FAO), cassava production, data on, 15, 30-31, 34, Figures 11,15 cassava trends in Africa, data on, 13 population in Africa, data on, 71 soils, classification of, 19,20-21,67
Food Policy Research Institute, see Stanford University Food
Policy Research Institute
Fortran programme, 67
Fulani (people), 11, 12
Gabon, 11, 14, 16,22,64,72
Gambia (country), 14,16, 22, 64,72
Gambia (river), 11
'Gari' (cassava product), 6, 12,32, 33
Gbaya (people), 11
General Statistical Program (GENSTAT), 67, 68
General Linear Model package (GLIM), 68
Ghana (Gold Coast), cassava, introduction of, 11 cassava distribution, 16, 64 cassava distribution model, 24,25,43 cassava production, 14 population, 14,22,73
Great Lakes Region, see also Burundi; Rwanda; Zaire cassava, introduction of, 12 cassava distribution, 17 cassava distribution model, extrapolation from, 25 cassava production, 40,42,43 physical environment, 39 population, 2,23,40
Great Rift Valley, 33, 38
Guinea, see also Guineas, 14, 16,64,73
Guinea-Bissau, see also Guineas, 16, 64,73
Guineas, see also Equatorial Guinea; Guinea; Guinea-Bissau, 11
Hausa (people), 12
82
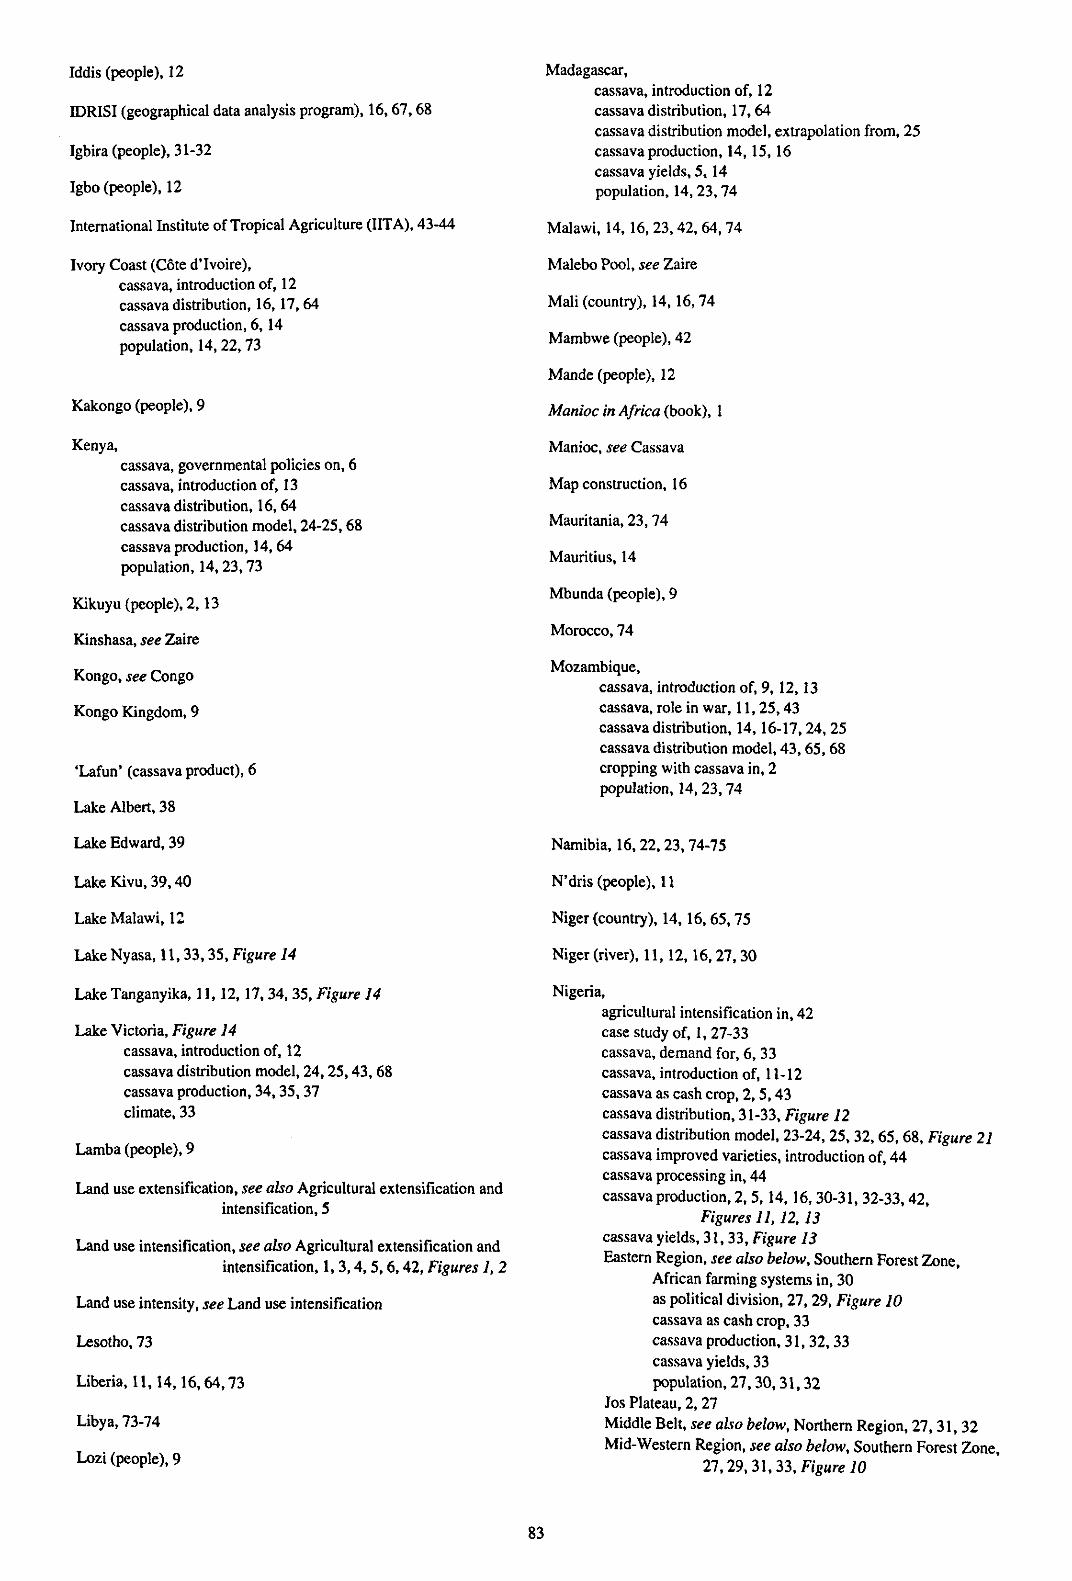
Iddis (people), 12
IDRISI (geographical data analysis program), 16,67,68
Igbira (people), 31-32
Igbo (people), 12
International Institute of Tropical Agriculture (UTA), 43-44
Ivory Coast (Côte d'Ivoire), cassava, introduction of, 12 cassava distribution, 16,17,64 cassava production, 6, 14 population, 14,22,73
Kakongo (people), 9
Kenya, cassava, governmental policies on, 6 cassava, introduction of, 13 cassava distribution, 16,64 cassava distribution model, 24-25,68 cassava production, 14, 64 population, 14,23,73
Kikuyu (people), 2,13
Kinshasa, see Zaire
Kongo, see Congo
Kongo Kingdom, 9
'Lafun' (cassava product), 6
Lake Albert, 38
Lake Edward, 39
Lake Kivu, 39,40
Lake Malawi, 12
Lake Nyasa, 11,33,35, Figure 14
Lake Tanganyika, 11,12, 17, 34, 35, Figure 14
Lake Victoria, Figure 14 cassava, introduction of, 12 cassava distribution model, 24,25,43,68 cassava production, 34,35,37 climate, 33
Lamba (people), 9
Land use extensification, see also Agricultural extensification and intensification, 5
Land use intensification, see also Agricultural extensification and
intensification, 1, 3,4,5,6,42, Figures 1, 2
Land use intensity, see Land use intensification
Lesotho, 73
Liberia, 11,14,16,64,73
Libya, 73-74
Lozi (people), 9
Madagascar, cassava, introduction of, 12 cassava distribution, 17,64 cassava distribution model, extrapolation from, 25 cassava production, 14,15, 16 cassava yields, 5, 14 population, 14,23,74
Malawi, 14, 16,23,42,64,74
Malebo Pool, see Zaire
Mali (country), 14, 16,74
Mambwe (people), 42
Mande (people), 12
Manioc in Africa (book), 1
Manioc, see Cassava
Map construction, 16
Mauritania, 23,74
Mauritius, 14
Mbunda (people), 9
Morocco, 74
Mozambique, cassava, introduction of, 9, 12,13 cassava, role in war, 11,25,43 cassava distribution, 14, 16-17,24, 25 cassava distribution model, 43,65,68 cropping with cassava in, 2 population, 14,23, 74
Namibia, 16,22, 23,74-75
N'dris (people), 11
Niger (country), 14,16, 65,75
Niger (river), 11,12, 16,27,30
Nigeria, agricultural intensification in, 42 case study of, 1,27-33 cassava, demand for, 6, 33 cassava, introduction of, 11-12 cassava as cash crop, 2, 5,43 cassava distribution, 31-33, Figure 12 cassava distribution model, 23-24, 25, 32,65, 68, Figure 21 cassava improved varieties, introduction of, 44 cassava processing in, 44 cassava production, 2, 5, 14,16, 30-31, 32-33,42,
Figures 11,12, 13 cassava yields, 31, 33, Figure 13 Eastern Region, see also below, Southern Forest Zone,
African farming systems in, 30 as political division, 27, 29, Figure 10 cassava as cash crop, 33 cassava production, 31,32, 33 cassava yields, 33 population, 27,30,31,32
Jos Plateau, 2,27 Middle Belt, see also below, Northern Region, 27, 31, 32 Mid-Western Region, see also below, Southern Forest Zone,
27,29, 31,33, Figure 10
83

Northern Region, see also above and below, Middle Belt; Northern Sudan Zone, 27, 33, Figure 10
Northern Sudan Zone, see also above, Northern Region, 27, 29,31,32,33
physical environment, 27, Figure 8 political divisions, 27, Figure 10 population, 14,22,23,27, 31,75, Figure 13 Southern Forest Zone, see also above and below, Eastern
Region; Mid-Western Region; Western Region, 27, 29, 31
urbanisation, 27, 32,44 vegetation, 27, Figure 9 Western Region, see also above, Southern Forest Zone,
African farming systems in, 29, 30 as political division, 29, Figure 10 cassava as cash crop, 33 cassava production, 30, 31, 32, 33 cassava yields, 31,33 population, 27, 29, 31,32
Ogooué (river), 11
Oubangui (people), 11
Oudda (people), 11
Physical and Political Map of Africa, 16
Population, and agricultural extensification and intensification, 3,
4-5, Figure 1 and cassava distribution, 14,22, 23-24, Figures 6, 7 density, 6, 23, 32, 33, 67-68, Figure 2, Map 4 distribution, 13, 22, 23 growth, 13-14, Figure 1 map construction, 22, 67-68 patterns, 1 urban versus rural, 41,43
Portuguese (people), 9, 11, 12, 13
Réunion, 14
Rwanda, see also Great Lakes Region, cassava, introduction of, 12, 13 cassava distribution, 16, 17,65 cassava distribution model, extrapolation from, 25 cassava production, 14 population, 14, 38,40,75 soils, 39
Sahel (region), 16,43
Sangha (river), 11
Sâo Tomé and Principe, 9, 14
Senegal, 14, 16,65,75
Seychelles, 14
Sierra Leone, 9, 11, 14, 16, 65,75
Slaves, 9, 11,12
Soil Map for Africa, 19
Soil Map of the World, 67
Soils, see Cassava agroecology
Somalia, 14, 16,75-76
South Africa (country), 13, 16,23,76
Southern Africa (region), 13
Stanford University Food Policy Research Institute, 15
Stanley Pool, see Zaire
Sub-Saharan Africa, 1, 13,25
Sudan (country), 12,14, 16,65,76
Swaziland, 22,23,76
Tanzania, African farming systems in, 35-37 case study of, 1,27,33-38 cassava, demand for, 43 cassava, introduction of, 1,2, 3,4 cassava as cash crop, 43 cassava distribution, 16,17,23, 33-34, 37-38,41,
Figures 4,18 cassava distribution model, 23,24-25,42,43,65,68-69,
Figure 21 cassava production, 14,15, 16,34-35,42,43, Figures 15,16 cropping with cassava, 2, 35-37 Kagera District, 37, Figure 17 Mbozi District, 35-36, Figure 17 physical environment, 33 political divisions, Figure 17 population, 14,22,23,33,76-77 Shinyanga Region, 37,42, Figure 17 Southern Highlands, 33,37 vegetation, 33, Figure 14
Togo, cassava distribution, 16, 65 cassava distribution model, 24,25,43 cassava production, 14 population, 14,77
Tonga (people), 9
Tunisia, 77
Tupinamba Indians (people of Brazil), 9
Uganda, cassava, introduction of, 12 cassava distribution, 16,17 cassava production, 14 political divisions, 65 population, 14,22,23,77
'Ujamaa' (village resettlement), 35, 38
United States Bureau of the Census, 22, 25,71
United States Central Intelligence Agency (CIA), 67
United States Department of Agriculture (USDA), 30, 31, Figure 11
West Africa, African farming systems in, 2 cassava, introduction of, 9, 12, 13
84

cassava distribution, 17 cassava distribution model, extrapolation from, 25 cassava production, 43 countries of, 27 population, 5,23, 68
Western Sahara (country), 77
Yoruba (people), 42
Zaire, see also Great Lakes Region, agricultural intensification in, 42 Bas-Zaïre, 23, 24, 25, 39,40,42,43, Figure 19 case study of, 1,27,38-40 cassava, demand for, 6,43 cassava, introduction of, 9, 11
cassava as cash crop, 38,41,42 cassava distribution, 16, 17, 39,43 cassava distribution model, 15,24, 25,43, 65, 68 cassava production, 14,27, 38, 39,42,43, Figure 20 cassava varieties, 13 cassava yields, 5, 39, Figure 20 cropping with cassava, 2 physical environment, 38 political divisions, 38, Figure 19 population, 14, 22,23, 38, 39,40,77 vegetation, 38
Zambezi (river), 9, 12
Zambia, 9, 14,16,42,65,77
Zimbabwe, 6,9, 14, 16,77-78
85


•Sx» 20° W
o ^°
100 o BEK
Projection
Standard Parallel
Central Meridian
CE8ZÄ Centro Internacional de Agricultura Tropical
Scale: 1:15'000.000
Lowland Humid
Lowland Humid (subtropical)
Lowland Semihot
Lowland Semihot (subtropical)
Lowland Continental
Lowland Continental (subtropical)
Lowland Semiarid
Lowland Semiarid (subtropical)
Highland Humid
Highland Humid (subtropical)
Highland Semihot
Highland Semihot (subtropical)
Highland Continental
Highland Continental (subtropical)
Highland Semiarid
Highland Semiarid (subtropical)
SCALE 1:15'000.000
500
Miller's Oblique Conformai
02° 30' 00" S.
20° 00' 00" E.
Map. N° 2 of 8
An Atlas of Cassava in AFRICA
Climatic Classification for Cassava
Compiled and Drawn by: Agroecological Studies
Date: Feb. 1992

> ü « 20° W o
o ^c
Heavy Texture Shallow Plinthite Present
1 ] Flood - Prone Poorly Drained
I I Acid Unrestricted Calcium Carbonate Present
100
SCALE 1:15000.000
500 1000 km. H H H
Projection
Standard Parallel
Central Meridian
Miller's Oblique Conformai
02° 30' 00 " S.
20° 00' 00" E.
CC8M Centro Internacional de Agricultura Tropical
Map. N° 3 of 8
An Atlas of Cassava in AFRICA
Soil Restrictions for Cassava
Scale: 1:15'000.000
Compiled and Drawn by: Agroecological Studies
Date: Feb. 1992
<r>
o°s
O 20° S â
40° E

,1
<r>
(EöZÄ Centro Internacional de Agricultura Tropical
An Atlas of Cassava in AFRICA
Population Density (Persons/km2) 1980
Scale: 1:15'000.000
Compiled and Drawn by: Agroecological Studies
Date: Feb. 1992
0°S
O 20° S Z
J

>> ç 20° W o
fc
KEY
100 o HH H
(E fi/ATT Centro Internacional de Agricultura Tropical
Scale: 1:15'000.000
Humid, Restricted Soils
M ^ Humid, Acid Soils
Humid, Unrestricted Soils
Seasonally Dry, Restricted Soils
Seasonally Dry, Acid Soils - • • . • _ 1
szsBq Seasonally Dry, Unrestricted Soils
'j Semiarid, Restricted Soils
i Semiarid, Acid Soils
ffffffffl Semiarid, Unrestricted Soils
SCALE 1:15'000.000
500 -i >——i >•
Projection
Standard Parallel
Central Meridian
Mi l ler 's Oblique Conformai
02° 30 ' 0 0 " S.
20° 00 ' 0 0 " E.
Map. N° 5 of 8
An Atlas of Cassava in AFRICA
Dry Season Length and Generalized Soil Constraints
Compiled and Drawn by:
Agroecological Studies Date: Feb. 1992

>» I o
20° W
o V
100
(EfiZÄ Centro Internacional de Agricultura Tropical
Scale: 1 :15 '000 .000
M M U I 1
0 - <: 0.5%
0.5 - < 1.5% 1.5 - -c 2.5%
I—^j 2.5 - «c 3.5% W f f l l 3.5 - «c 4.5%
4.5 - -c 5.5% E ^ 5.5 - «e 10.5% 1 ^ 1 0 . 5 - 16%
SCALE 1:15'000.000
500 H I 1 F
1000 km I I
Projection
Standard Parallel
Central Meridian
Miller's Oblique Conforma
02° 30' 00" S
20° 00' 00" E
Map. N° 6 of 8
An Atlas of Cassava in AFRICA
Percentage of Land Area in Cassava 1980 Fitted Values
Compiled and Drawn by: Agroecological Studies
Date: Feb. 1992

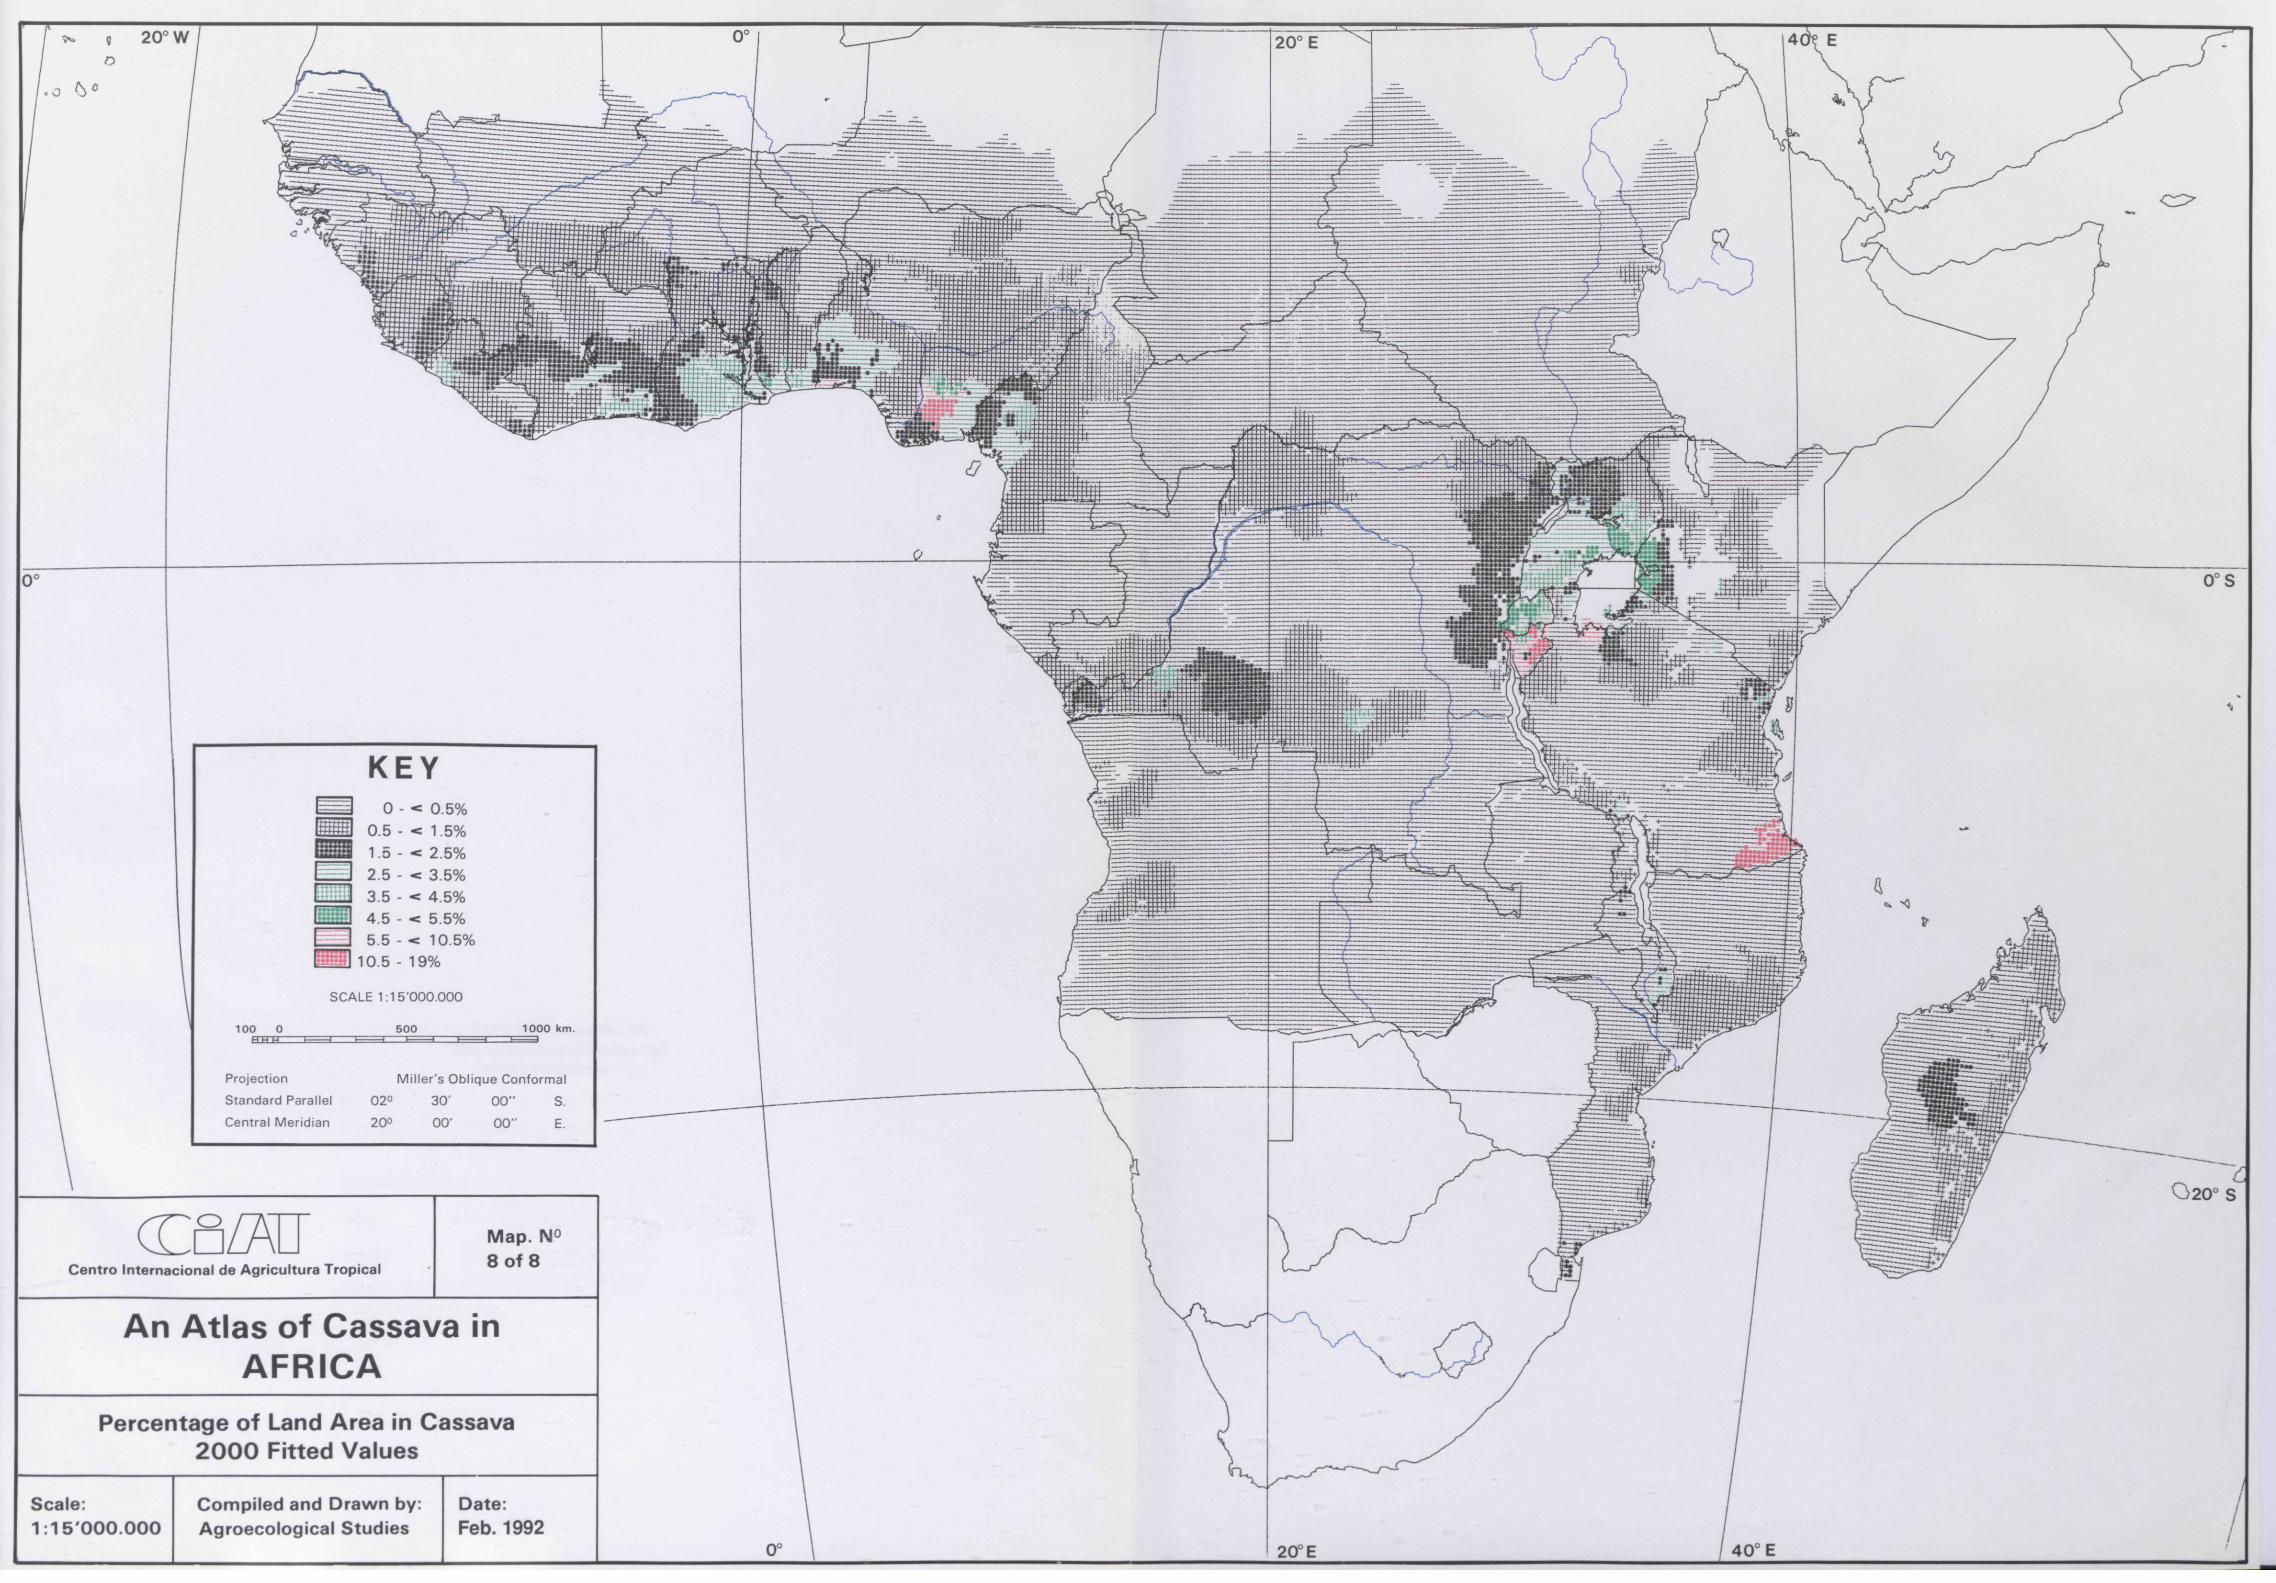

CIAT Publication No. 206 The Agroecological Studies Unit
and the Publication Unit
Editing: Elizabeth de Pâez
Gladys R. de Ramos (editorial assistant)
Figure drawings: Ligia Garcia (Agroecological Studies Unit)
Maps: Mauricio Rincón (Agroecological Studies Unit) Production: Graphic Arts Unit, CIAT
Alcira Arias (cover design)