Endocytosis Optimizes the Dynamic Localization of Membrane ...
12
Theory Endocytosis Optimizes the Dynamic Localization of Membrane Proteins that Regulate Cortical Polarity Eugenio Marco, 1,6,7 Roland Wedlich-Soldner, 2,3,7 Rong Li, 2,4 Steven J. Altschuler, 5, * and Lani F. Wu 5, * 1 Department of Biology, Massachusetts Institute of Technology, Cambridge, MA 02139, USA 2 Department of Cell Biology, Harvard Medical School, Boston, MA 02115, USA 3 Max Planck Institute of Biochemistry, 82152 Martinsried, Germany 4 The Stowers Institute for Medical Research, Kansas City, MO 64112, USA 5 Department of Pharmacology and Green Center Division for Systems Biology, University of Texas Southwestern Medical Center, Dallas, TX 75390, USA 6 Present address: Department of Systems Biology, Harvard Medical School, Boston, MA 02115, USA. 7 These authors contributed equally to this work. *Correspondence: [email protected] (S.J.A.), [email protected] (L.F.W.) DOI 10.1016/j.cell.2007.02.043 SUMMARY Diverse cell types require the ability to maintain dynamically polarized membrane-protein dis- tributions through balancing transport and dif- fusion. However, design principles underlying dynamically maintained cortical polarity are not well understood. Here we constructed a mathematical model for characterizing the mor- phology of dynamically polarized protein distri- butions. We developed analytical approaches for measuring all model parameters from sin- gle-cell experiments. We applied our methods to a well-characterized system for studying po- larized membrane proteins: budding yeast cells expressing activated Cdc42. We found that a balance of diffusion, directed transport, and endocytosis was sufficient for accurately de- scribing polarization morphologies. Surpris- ingly, the model predicts that polarized regions are defined with a precision that is nearly opti- mal for measured endocytosis rates and that polarity can be dynamically stabilized through positive feedback with directed transport. Our approach provides a step toward understand- ing how biological systems shape spatially pre- cise, unambiguous cortical polarity domains using dynamic processes. INTRODUCTION Many cellular processes such as cell polarization, cellular morphogenesis, and cell division depend critically on the stable maintenance of polarized, i.e., spatially asymmet- ric, distributions of molecules that regulate or execute po- larized cell functions. Polarized distributions of molecules can be maintained in principle through two mutually non- exclusive mechanisms: statically, through immobilization via scaffolds, or dynamically, through constant recycling. A state in which cortical polarity is dynamically maintained has the advantage of enabling flexible and rapid cellular responses to an often wide range of input signals. The dynamic maintenance of cortical polarity plays a central role in the development of many organisms. Mem- brane-associated polarity markers, including PH-domain- containing proteins in Dictyostelium and neutrophils (Affolter and Weijer, 2005), PAR-2 and PAR-6 in C. elegans zygotes (Cheeks et al., 2004), Pon and Numb in Drosophila sensory-organ precursor cells (Mayer et al., 2005), and Cdc42 and Bem1 in budding yeast (Wedlich-Soldner et al., 2004), are maintained in dynamically polarized states. Transport processes, such as cytoskeleton-mediated exo- cytosis and endocytosis, are critical for regulating the mem- brane concentrations of polarity proteins in a variety of sys- tems. For example, the maintenance of polarity has been shown to require microtubule-based transport in fission yeast (Snaith and Sawin, 2003) and actin-based transport in Drosophila neuroblasts (Petritsch et al., 2003) and bud- ding yeast (Pruyne and Bretscher, 2000; Wedlich-Soldner et al., 2003). Endocytosis is required for the maintenance of polarization in budding yeast (Pruyne and Bretscher, 2000; Valdez-Taubas and Pelham, 2003) and HeLa cells (Bretscher and Thomson, 1983). Disruption of the actin cy- toskeleton, which can affect both secretion and endocyto- sis, leads to the loss of polarity of Numb in Drosophila (Kno- blich et al., 1997), PAR-2 and PAR-3 in C. elegans zygotes (Severson and Bowerman, 2003), and Rho GTPases in yeast (Pruyne et al., 2004; Wedlich-Soldner et al., 2004). Fi- nally, lateral diffusion within the membrane strongly influ- ences the distribution of polarized proteins (Greenberg and Axelrod, 1993; Valdez-Taubas and Pelham, 2003). Cell 129, 411–422, April 20, 2007 ª2007 Elsevier Inc. 411 brought to you by CORE View metadata, citation and similar papers at core.ac.uk provided by Elsevier - Publisher Connector
-
Upload
khangminh22 -
Category
Documents
-
view
4 -
download
0
Transcript of Endocytosis Optimizes the Dynamic Localization of Membrane ...

Theory
brought to you by COREView metadata, citation and similar papers at core.ac.uk
provided by Elsevier - Publisher Connector
Endocytosis Optimizes the DynamicLocalization of Membrane Proteinsthat Regulate Cortical PolarityEugenio Marco,1,6,7 Roland Wedlich-Soldner,2,3,7 Rong Li,2,4 Steven J. Altschuler,5,* and Lani F. Wu5,*1Department of Biology, Massachusetts Institute of Technology, Cambridge, MA 02139, USA2Department of Cell Biology, Harvard Medical School, Boston, MA 02115, USA3Max Planck Institute of Biochemistry, 82152 Martinsried, Germany4The Stowers Institute for Medical Research, Kansas City, MO 64112, USA5Department of Pharmacology and Green Center Division for Systems Biology, University of Texas Southwestern Medical Center,
Dallas, TX 75390, USA6Present address: Department of Systems Biology, Harvard Medical School, Boston, MA 02115, USA.7These authors contributed equally to this work.
*Correspondence: [email protected] (S.J.A.), [email protected] (L.F.W.)
DOI 10.1016/j.cell.2007.02.043
SUMMARY
Diverse cell types require the ability to maintaindynamically polarized membrane-protein dis-tributions through balancing transport and dif-fusion. However, design principles underlyingdynamically maintained cortical polarity arenot well understood. Here we constructed amathematical model for characterizing the mor-phology of dynamically polarized protein distri-butions. We developed analytical approachesfor measuring all model parameters from sin-gle-cell experiments. We applied our methodsto a well-characterized system for studying po-larized membrane proteins: budding yeast cellsexpressing activated Cdc42. We found thata balance of diffusion, directed transport, andendocytosis was sufficient for accurately de-scribing polarization morphologies. Surpris-ingly, the model predicts that polarized regionsare defined with a precision that is nearly opti-mal for measured endocytosis rates and thatpolarity can be dynamically stabilized throughpositive feedback with directed transport. Ourapproach provides a step toward understand-ing how biological systems shape spatially pre-cise, unambiguous cortical polarity domainsusing dynamic processes.
INTRODUCTION
Many cellular processes such as cell polarization, cellular
morphogenesis, and cell division depend critically on the
stable maintenance of polarized, i.e., spatially asymmet-
ric, distributions of molecules that regulate or execute po-
larized cell functions. Polarized distributions of molecules
can be maintained in principle through two mutually non-
exclusive mechanisms: statically, through immobilization
via scaffolds, or dynamically, through constant recycling.
A state in which cortical polarity is dynamically maintained
has the advantage of enabling flexible and rapid cellular
responses to an often wide range of input signals.
The dynamic maintenance of cortical polarity plays a
central role in the development of many organisms. Mem-
brane-associated polarity markers, including PH-domain-
containing proteins in Dictyostelium and neutrophils
(Affolter and Weijer, 2005), PAR-2 and PAR-6 in C. elegans
zygotes (Cheeks et al., 2004), Pon and Numb in Drosophila
sensory-organ precursor cells (Mayer et al., 2005), and
Cdc42 and Bem1 in budding yeast (Wedlich-Soldner
et al., 2004), are maintained in dynamically polarized states.
Transport processes, such as cytoskeleton-mediated exo-
cytosisandendocytosis, arecritical for regulating the mem-
brane concentrations of polarity proteins in a variety of sys-
tems. For example, the maintenance of polarity has been
shown to require microtubule-based transport in fission
yeast (Snaith and Sawin, 2003) and actin-based transport
in Drosophila neuroblasts (Petritsch et al., 2003) and bud-
ding yeast (Pruyne and Bretscher, 2000; Wedlich-Soldner
et al., 2003). Endocytosis is required for the maintenance
of polarization in budding yeast (Pruyne and Bretscher,
2000; Valdez-Taubas and Pelham, 2003) and HeLa cells
(Bretscher and Thomson, 1983). Disruption of the actin cy-
toskeleton, which can affect both secretion and endocyto-
sis, leads to the loss of polarity of Numb in Drosophila (Kno-
blich et al., 1997), PAR-2 and PAR-3 in C. elegans zygotes
(Severson and Bowerman, 2003), and Rho GTPases in
yeast (Pruyne et al., 2004; Wedlich-Soldner et al., 2004). Fi-
nally, lateral diffusion within the membrane strongly influ-
ences the distribution of polarized proteins (Greenberg
and Axelrod, 1993; Valdez-Taubas and Pelham, 2003).
Cell 129, 411–422, April 20, 2007 ª2007 Elsevier Inc. 411

Based on the results mentioned above, we hypothesize
that dynamic polarization of membrane proteins can be
achieved by balancing three redistribution mechanisms.
First, proteins are redistributed from the cytoplasm to the
plasma membrane via vesicle transport along actin or micro-
tubule tracks and through the subsequent vesicle fusion to
the plasma membrane. We will refer to this mechanism as
‘‘directed transport.’’ Second, the deposited proteins are
spread within the plasma membrane via two-dimensional dif-
fusion. Third, the proteins are redistributed from the plasma
membrane back to the cytoplasm via endocytic uptake
and, subsequently, by intracellular membrane recycling. For
simplicity we will refer to this mechanism as ‘‘endocytosis.’’
The necessity of these three mechanisms for the
formation of dynamically polarized steady states is well
established. However, it remains unclear whether these
mechanisms are sufficient to maintain steady-state distri-
butions of polarized membrane proteins. If they are, what
is the relationship between the respective rates of redistri-
bution and polarization morphology? Are there ‘‘special’’
or ‘‘optimal’’ rates selected by cellular systems? And,
what is the role of positive feedback in maintaining the
polarized state for polarity regulators (such as Cdc42)
that interact with mechanisms of establishing directed
transport? Here we develop mathematical models to
quantitatively explore the impact of changes in transport
rates and feedback strengths on polarization morphology.
To experimentally validate predictions of our model in a
biological system, accurate estimates of parameters are
needed. In most studies, model parameters are separately
estimated from experiments that rely on intrusive biochem-
ical or genetic approaches to disentangle parameters from
each other (Chen et al., 2000; Lee et al., 2003). Here, we es-
timated all parameters except diffusion on each individual
cell using a single, nonintrusive photobleaching experi-
ment designed to tie closely with the model. We tested
our approach in a prototypical system for polarized mem-
brane proteins: polarized yeast cells expressing a constitu-
tively activated form of Cdc42. This Rho-type GTPase is
anchored in the membrane through a C-terminal geranyl-
geranyl group (Johnson, 1999; Wedlich-Soldner et al.,
2003; Ziman et al., 1993), and its constitutively activated
form Cdc42Q61L has been shown to localize exclusively to
membranes (Wedlich-Soldner et al., 2003). We previously
showed that the activated Cdc42, when overexpressed,
is capable of inducing spontaneous polarization in other-
wise nonpolarized G1 yeast cells. The ability of Cdc42Q61L
in regulating the polarized state, its broad polarization mor-
phology, and its lack of membrane dissociation make it
a desirable marker for understanding dynamic polarization
of membrane-bound proteins that define cortical polarity.
RESULTS
Model for the Dynamic Redistribution of Polarized
Membrane Proteins
We developed a mathematical model combining the ef-
fects of three redistribution mechanisms needed to main-
412 Cell 129, 411–422, April 20, 2007 ª2007 Elsevier Inc.
tain a distribution of cortically polarized proteins at steady
state (Figure 1). First, our model incorporated directed
transport of the protein from a homogeneous cytoplasmic
pool to a small region of the plasma membrane. Second,
we incorporated lateral diffusion of the protein on the
plasma membrane using a uniform diffusion constant. Fi-
nally, we incorporated endocytosis at and away from the
region of directed transport, with rates proportional to the
amount of the protein at each membrane position.
In total, the model used six physically interpretable pa-
rameters to determine the density distribution, f, of a polar-
ized protein at the plasma membrane (Figure 1A; Table S1;
Experimental Procedures): (1) the plasma membrane dif-
fusion constant, df ; (2) the directed transport window
function c, defining the region of the plasma membrane
to which cytoskeletal tracks are attached; (3) the total cel-
lular amount of the protein, FT ; (4) the directed transport
rate along cytoskeletal tracks, h; (5) the endocytosis rate
within the directed transport window, ea ; and (6) the ratio
of the endocytosis rates within and away from the directed
transport region, a. In the model we assumed that the total
protein pool FT is constant and that the cell is rotationally
symmetric. We further assumed that the cytoplasmic pool
FCyto is homogeneous due to the fast dispersion of vesi-
cles in the cytosol (Ozbudak et al., 2005; Wedlich-Soldner
et al., 2003). For simplicity, we assumed that c is a rectan-
gular window, though a Gaussian window may also be
used (Figure S1). Finally, we reasoned that spontaneous
Figure 1. Mathematical Model for the Dynamic Redistribution
of Polarized Membrane Proteins
(A) Schematic model of dynamically polarized membrane proteins
(blue circles) incorporating diffusion (4), directed transport ([), and
endocytosis (Y; see Results). Model parameters are shown in red; po-
larized protein density at the membrane is shown schematically as
a histogram.
(B and C) Example of polarized membrane protein, GFP-Cdc42Q61L
cap (B) and its membrane intensity (C) in arbitrary units (a.u.).

Figure 2. Relationship of Cap Morphology to Model Parameters
(A–D) Cap height is monotone with diffusion constant df (A), transport rate h (B), the directed transport window c width (C), and total protein amount
FT (D).
(E–G) Nonmonotone relationship of ea to relative cap height (E) and relative cap sharpness (G). Monotone relationship of ea to cap width (F).
(H) Nonmonotone relationship of endocytosis ratio a to cap height.
Nonvarying parameters were fixed at estimated population means obtained from our analysis of polarized Cdc42Q61L (Figure 3). Free parameters
were varied by factors as indicated on the horizontal axes. Insets show predicted solutions and are color coded within each panel to indicate selected
parameter values. Note that the blue curves in each inset use the same estimated population-mean parameter values.
association of the proteins from the cytoplasm to the
plasma membrane is a negligible effect for the mainte-
nance of polarity in comparison with active transport
and therefore did not model this effect.
Polarization Morphologies for Different
Parameter Values
Morphologically distinct distributions of cortically polar-
ized proteins can arise from variations to the redistribution
mechanisms, potentially leading to different morphoge-
netic responses. In order to explore the relationship be-
tween polarization morphology and each redistribution
mechanism, we used the model to find steady-state
solutions over a wide range of values for each of our six
parameters (Figure 2). We solved the equation numerically
for initial conditions in which the protein distribution was
entirely cytoplasmic and let the system evolve to its
unique steady-state solution (Supplemental Experimental
Procedures).
Polarity regulators, such as Cdc42, need to provide pre-
cise, unambiguous signals in time and space in order to in-
duce subsequent polarity processes and may require that
the polarity regulator itself is concentrated in a sharply de-
fined region of the plasma membrane. Referring to a polar-
ized distribution as a ‘‘cap,’’ we selected three intuitive
measurements to quantitatively assess the strength of
the polarization signal, namely: cap height, cap width,
and cap sharpness. Cap height measures the peak den-
sity (or peak fluorescence intensity) of the polarity-marker
distribution f above background (i.e., maxðfÞ �minðfÞ) and
reflects the degree to which signal and noise can be un-
ambiguously separated. Cap width measures the width
of the cap region, defined as the smallest region in which
the background subtracted density of f is at least 25% of
the cap height (i.e., width of the smallest connected region
{x j f(x) �min(f) > 0.25 cap height}). Finally, cap sharpness
estimates the signal gradient within the cap (i.e., cap
height/cap width) and reflects the spatial precision with
which the polarity signal is defined.
The model predicts that cap height changes monotoni-
cally with respect to diffusion, directed transport rate, the
width of the directed transport window, and total protein
amount (Figures 2A–2D). Interestingly, only parameters
related to endocytosis have a more complex relationship
to the cap morphology (Figures 2E–2H). Both very large
and very small endocytosis rates lead to distributions
with low ‘‘signal’’ above background: large endocytosis
rates remove most membrane proteins, whereas small en-
docytosis rates and lateral diffusion lead to homogeneous
steady-state distributions (Figure 2E). Importantly, cap
height and cap sharpness (Figures 2E and 2G) achieve
their theoretical maxima at single, optimal endocytosis
rates. Cap height also reaches a maximum at a single op-
timal endocytosis ratio a (Figure 2H). These observations
suggest that endocytosis can be a useful evolutionary
and regulatory target for fine tuning the spatial distribution
of polarity proteins.
Methods for Estimating Parameter Values
We developed a general analytical approach to estimate
actual parameter values from data. The methods require
two sets of timelapse microscopy images. These data
sets captured the fluorescence recovery after photo-
bleaching (FRAP) of (1) drug-treated unpolarized cells
Cell 129, 411–422, April 20, 2007 ª2007 Elsevier Inc. 413

Figure 3. Estimation of Model Parameters from GFP-Cdc42Q61L Intensity
Shown is the process used to extract the diffusion constant (A–E), directed transport window (F–J), and endocytosis and transport rates (G; K–M).
(A, F, and K) Schemas for parameter extraction (notation as in Figure 1A). (�) indicates photobleached Cdc42Q61L.
(B and G) Kymographs of Cdc42Q61L intensity along membrane (y-axis) in time (x-axis). (;) indicates time of photobleaching. Time steps in (B) are
�1.65 s and are indicated below for (G); color bar is indicated at right.
(C and D) Estimation of df. Membrane intensity after initial photobleaching (C) and subsequent recovery fraction over time (D). Experimental data
(blue), regressed curves (red), and window in which recovery fraction is calculated (magenta).
(H and I) Estimation of c. (H) Kymograph of Cdc42Q61L temporal deviations from the mean along membrane (y-axis) in time (x-axis) derived from data in
(G) before photobleaching. High fluctuations persist �50 s (Figure 4). Red-green color bar is given at right.
(I) Mean temporal fluctuations from (H) with estimated transport window (red segment, threshold; s = 65). Inset shows the estimated transport win-
dows for s = 65 (red), s = 70 (black), and s = 75 (magenta).
(L) Estimation of ea and h. Observed recovery of total membrane intensity (blue) and regressed curve (red) from right half of data in (G).
(E, J, and M) Quartile box plots of estimated parameter values. Whiskers show the data within a length of 1.5 times the interquartile region; dots rep-
resent outliers. n = 32 for (E); n = 25 for (J) and (M).
(used to estimate df; Figures 3A and 3B) and (2) polarized
cells (preFRAP segment used to estimate c and FT,
Figure 3F and 3G; FRAP segment used to estimate ea, a,
and h, Figures 3G and 3K). The methods for analyzing
Data Sets I and II are described in detail below using the
example of Cdc42 polarization in budding yeast. The
need to acquire rapid time points required us to capture
414 Cell 129, 411–422, April 20, 2007 ª2007 Elsevier Inc.
images on a fixed focal plane and to infer protein intensity
from 2D images by assuming rotational symmetry.
Testing the Model on a Prototypical Polarized
Membrane Protein
To test our model and approach for measuring parame-
ters, we investigated the dynamic maintenance of the
polarized distribution for the constitutively activated
Cdc42, Cdc42Q61L, in budding yeast (Johnson, 1999;
Ziman et al., 1993). Upon expression of GFP-labeled
Cdc42Q61L (hereafter referred to as Cdc42Q61L), G1-
arrested budding yeast cells spontaneously establish
morphologically stable Cdc42Q61L caps on the plasma
membrane (Wedlich-Soldner et al., 2003; Figures 1 and 3G).
All three of the previously mentioned redistribution
mechanisms have been found to be required for the main-
tenance of polarity in this system: (1) actin cable-depen-
dent transport, bringing Cdc42Q61L to the membrane
(Wedlich-Soldner et al., 2003, 2004), (2) lateral diffusion,
spreading Cdc42Q61L along the membrane (Wedlich-
Soldner et al., 2004), and (3) endocytosis (Irazoqui et al.,
2005; Valdez-Taubas and Pelham, 2003) concentrated in
the center of the cap region (Huckaba et al., 2004;
Newpher et al., 2005; Toshima et al., 2006), returning
Cdc42Q61L to the cytoplasm. This cytoskeletal-dependent
system is independent of complicating interactions with
spatial cues, signaling feedback, and nucleotide-ex-
change mechanisms (Ozbudak et al., 2005; Wedlich-Sold-
ner et al., 2004) and is thus an ideal starting point for quan-
titative studies of the dynamic maintenance of polarity.
The polarization process is nonlinear since there is
a positive feedback between Cdc42Q61L and actin cable
nucleation (Wedlich-Soldner et al., 2003). However, once
Cdc42 has achieved a steady-state polarized distribution,
the region of actin cable nucleation appears to be stably
maintained (Pruyne et al., 1998). In this case, Cdc42Q61L
behaves like a prototypical polarized membrane protein
whose maintenance requires continuous transport and
endocytosis. Below, we first investigate principles for the
maintenance of cortical polarity assuming the region of di-
rected transport is determined independently of the polar-
ized protein, and we conclude by investigating the role of
positive feedback in stabilizing the region of directed
transport.
Estimation of the Diffusion Constant
To estimate the membrane diffusion constant df, we used
the actin-depolymerizing drug Latrunculin A (LatA) to dis-
rupt endocytosis and directed transport (Ayscough et al.,
1997) and generated Data Set I. We analyzed the fluores-
cence recovery of Cdc42Q61L in membrane regions
bleached with a laser pulse (Figures 3A–3D and S2). In or-
der to recover diffusion constants from FRAP data, we
modified the existing planar formulation (Axelrod et al.,
1976) to account for the influence of spherical geometry
due to the small diameter of yeast; numerical simulation
showed that diffusion constants that assume planar ge-
ometry can underestimate the true value by as much as
20% on yeast-sized spheres (Figure S3). Analysis of
Data Set I using these methods showed close agreement
between the model-predicted intensity recovery profiles
and the experimental data, indicating high accuracy and
robustness despite the presence of noise (Figure S4).
We estimated df = (0.036 ± 0.017) mm2/s (mean ± SD, n =
32; Figure 3E). This value is around ten times smaller than
typical diffusion constants for prenylated proteins in mam-
malian cells (Pyenta et al., 2003) but is consistent with find-
ings indicating that proteins in the yeast plasma membrane
exhibit unusually slow diffusion constants (Valdez-Taubas
and Pelham, 2003). Additionally, we found no statistically
significant differences in estimates of df for (1) GFP-
Cdc42D57Y, a mostly GDP-bound form of Cdc42 that
should not bind effectors, (2) prenylated GFP, with and
without LatA, and (3) Cdc42Q61L in a myo2-66 strain defec-
tive in actin-dependent transport (Govindan et al., 1995;
Johnston et al., 1991; Pruyne et al., 1998; Table S2;
Figure S5), suggesting that binding or scaffolding effects
are not significantly interfering with Cdc42Q61L diffusion.
Estimation of the Directed Transport Window c
Next, using the initial preFRAP movie segments from Data
Set II, we estimated the directed transport window c,
which in our yeast system is due to delivery along actin
cables. Current direct visualization techniques of actin
cables, such as rhodamine-phalloidin staining (Karpova
et al., 1998) or GFP-tagged Abp140 (Yang and Pon,
2002), do not provide the resolution required to estimate
accurately the extent of this region. As an alternative ap-
proach, we reasoned that membrane regions with a high
density of actin cables would be detectable as regions
of relatively high temporal fluctuations of Cdc42Q61L, pos-
sibly due to detachments and reattachments of the actin
cables (Martin and Chang, 2006) or to the stochastic
nature of vesicle delivery (Figures 3F–3H).
We measured temporal fluctuations using the standard
deviation sðxÞ of the intensities in time for each membrane
position x. For threshold value s, cs is the window function
defining the smallest connected region on the membrane
containing xjsðxÞ> s$maxðsÞ=100gf . Our analysis showed
that regions of high temporal fluctuations (s z 70) strongly
overlapped with cap regions (Figures 3G–3I), consistent
with our expectations for actin cable localization. A
‘‘best-fit’’ transport window, with s in the narrow range
of 65–75, was selected as explained below. We also esti-
mated total Cdc42Q61L in each cell by summing estimated
total plasma membrane and cytoplasmic intensities (Sup-
plemental Experimental Procedures).
We tested whether the observed intensity fluctuations
were due to photon-counting statistics at the detector
by rescaling s by the square root of the mean intensity
in time: sðxÞffi�IpðxÞ
. This function should be uniform along the
membrane if the fluctuations are due to shot noise of the
camera detector. Figure 4A shows that the noise signal
within the cap is bigger than expected due to shot noise,
indicating that the observed intensity fluctuations are not
dominated by detector noise.
Finally, we tested whether the fluctuations were due to
random noise or diffusion effects by measuring the auto-
covariance of the intensity gkðxÞfor positions x along the
membrane and time shift k (Experimental Procedures). In-
tuitively, the autocovariance measures the correlation of
the intensity signal at a point with a time-shifted version
Cell 129, 411–422, April 20, 2007 ª2007 Elsevier Inc. 415

of itself. Figure 4B shows that the noise at the cap region is
correlated and is not random noise. The autocorrelation,
given by gkðxÞ=g0ðxÞ, has a characteristic time of �50 s
at the cap center (Figure 4C), which is significantly longer
than expected from diffusion alone (assuming a spot ra-
dius of two pixels, r0 = 0.13 mm, and our measured diffu-
sion constant df = 0.036 mm2/s, the characteristic time
for diffusion is tD =r20
4df� 0:12 seconds; Elson and Magde,
1974). Thus, it is unlikely that our observed fluctuations are
predominately due to diffusion effects.
Estimation of the Endocytosis and Transport Rates
Next, we used the FRAP movie segments of Data Set II to
estimate endocytosis and transport rates. It is experimen-
tally difficult to independently measure ea, a, and h since
blocking endocytosis affects exocytosis and vice versa.
However, our model allows simultaneous estimation of
these values. Integration of the model equation over the
membrane removes the effect of diffusion, yielding an or-
dinary differential equation (Experimental Procedures).
Unconstrained regression of the resulting equation occa-
sionally gave nonphysiological parameter values, so in
practice, with a manually estimated to be �50, we
scanned a within the range 1–80 (Figures 5A and 5C)
and used regression to estimate only ea and h per cell
(Figure 3L). We selected a best-fit value for a in this range
(a = 40) as explained next.
Figure 4. Analysis of the Temporal Fluctuations of Cdc42 on
the Membrane
(A) Plots of the standard deviation of the intensity divided by the square
root of the intensity along the membrane for three representative cells.
The plots show that the noise signal is not due to shot noise from pho-
ton detection statistics.
(B) Autocovariance along the membrane (Position) as a function of lag
time for the cells in (A).
(C) Autocorrelation as a function of time for a point at the center of the
cap (blue) or at a point away from the cap (red). In (A), (B), and (C) each
column corresponds to a representative cell. The first column corre-
sponds to the cell in Figures 1 and 3.
416 Cell 129, 411–422, April 20, 2007 ª2007 Elsevier Inc.
To choose the best values for a and the window thresh-
old value s, we developed methods to compare predicted
and observed Cdc42Q61L membrane intensities. For each
cell, cap-similarity scores (CSSs) were computed using
a normalized, mean squared difference between pre-
dicted and observed Cdc42Q61L membrane intensities
(Experimental Procedures). The large mean CSS value at
a = 1 (Figure 5A and 5C) strongly suggested that a single
global endocytosis rate was insufficient for accurate cap
morphology prediction. The minimum of the mean of
CSS, over all cells, was found at a = 40 and s = 70 (Figures
5A–5C). The value found of a = 40 implies that endocytosis
rates in the directed transport window c are much bigger
than in the rest of the plasma membrane. This is consistent
with previous findings that endocytosis is mainly occurring
through actin patches (Kaksonen et al., 2006) that are con-
centrated in the area around the polar Cdc42Q61L cap
(Wedlich-Soldner et al., 2003). The mean CSS was fairly
insensitive to the choice of a around its minimum, and
a universal value of 40 was selected for all cells (Figure 5C).
In contrast, the mean CSS showed more variability in s
around its minimum (Figure 5B), so a best-fit value for
each cell was selected from among {65, 70, 75}. This final
choice of parameters gave a mean value for the width of
the directed transport window c as (1.6 ± 0.6) mm (mean ±
SD, n = 25; Figure 3J). Our estimated rates for endocytosis
ea = (0.14 ± 0.09) s-1 and transport h = (1.6 ± 1.1) 3 10�3 s-1
(mean ± SD, n = 25; Figures 3M and S6), imply that on av-
erage 13% of the Cdc42 molecules are on the membrane
at steady state and reside there �90 s before being re-
cycled (see Supplemental Experimental Methods).
Evaluation of Model Predictions
As a test of the model, we used the measured parameters
to predict cap morphologies in single cells. Despite the
separate techniques used to obtain different model pa-
rameters, our approach produced good results for the ma-
jority of the cells (Figures 5D and S7). Though experimen-
tal difficulties (including cell movement, dim fluorescence,
or imperfect centering of caps within focal planes) contrib-
uted to several poor predictions (Figure 5E), overall our
results were significantly better than predictions using
randomized values generated from the distributions of
the estimated parameter values (Figure 5F).
Large values of a, such as a = 40, dramatically improved
the morphological agreement between our prediction and
the observed data away from the cap region. Thus, local-
ized endocytosis around the site of directed transport
dominates the effects of global endocytosis and is essen-
tial to accurately describe polarized Cdc42Q61L. The width
of the cap can be predicted using our measured diffusion
constant and endocytosis rates. As previously mentioned,
protein delivered at the center of the cap remains on the
plasma membrane for �90 s. The average displacement
due to diffusion is estimated byffiffiffiffiffiffiffiffiffi4df tp
(see for example
Berg, 1993), resulting in a cap width of �7 mm, which is
in close agreement with the observations (Figures S7
and 6B). Taken together, the above results demonstrate
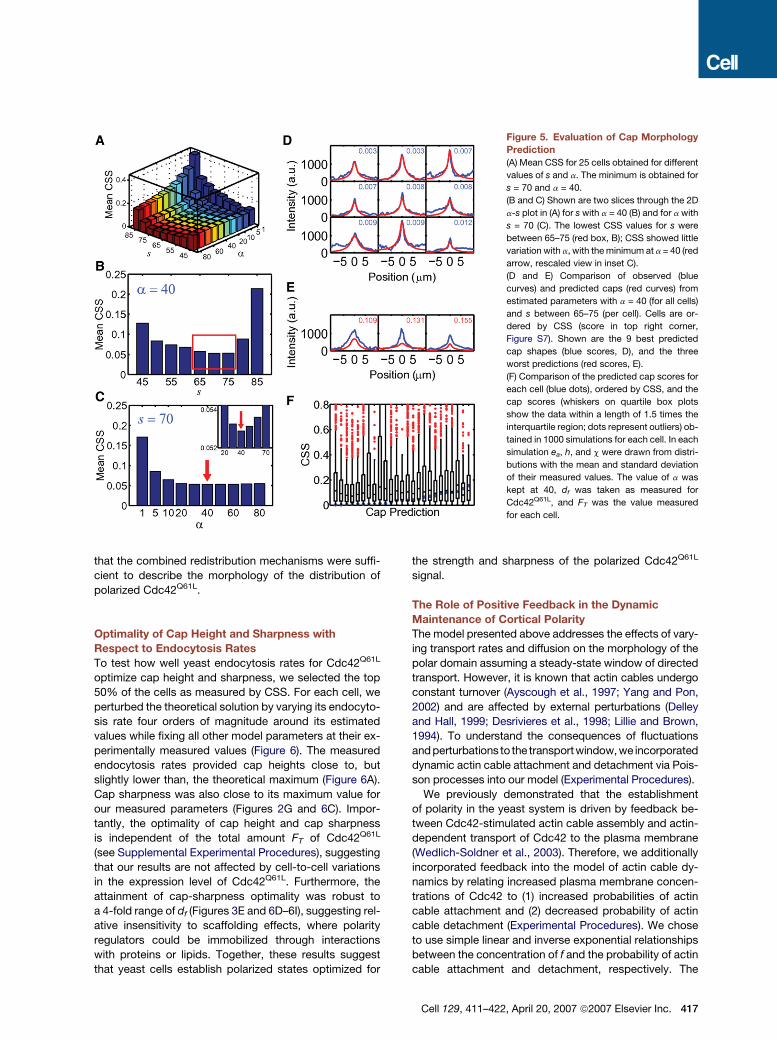
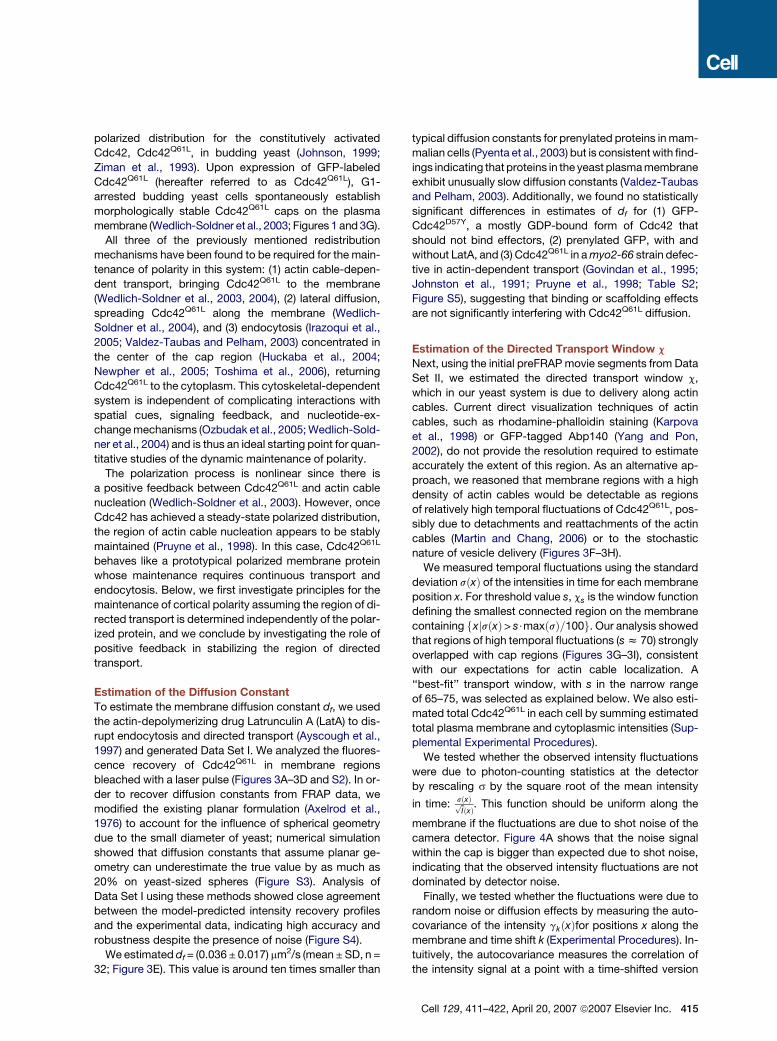
Figure 5. Evaluation of Cap Morphology
Prediction
(A) Mean CSS for 25 cells obtained for different
values of s and a. The minimum is obtained for
s = 70 and a = 40.
(B and C) Shown are two slices through the 2D
a-s plot in (A) for s with a = 40 (B) and for a with
s = 70 (C). The lowest CSS values for s were
between 65–75 (red box, B); CSS showed little
variation with a, with the minimum at a = 40 (red
arrow, rescaled view in inset C).
(D and E) Comparison of observed (blue
curves) and predicted caps (red curves) from
estimated parameters with a = 40 (for all cells)
and s between 65–75 (per cell). Cells are or-
dered by CSS (score in top right corner,
Figure S7). Shown are the 9 best predicted
cap shapes (blue scores, D), and the three
worst predictions (red scores, E).
(F) Comparison of the predicted cap scores for
each cell (blue dots), ordered by CSS, and the
cap scores (whiskers on quartile box plots
show the data within a length of 1.5 times the
interquartile region; dots represent outliers) ob-
tained in 1000 simulations for each cell. In each
simulation ea, h, and c were drawn from distri-
butions with the mean and standard deviation
of their measured values. The value of a was
kept at 40, df was taken as measured for
Cdc42Q61L, and FT was the value measured
for each cell.
that the combined redistribution mechanisms were suffi-
cient to describe the morphology of the distribution of
polarized Cdc42Q61L.
Optimality of Cap Height and Sharpness with
Respect to Endocytosis Rates
To test how well yeast endocytosis rates for Cdc42Q61L
optimize cap height and sharpness, we selected the top
50% of the cells as measured by CSS. For each cell, we
perturbed the theoretical solution by varying its endocyto-
sis rate four orders of magnitude around its estimated
values while fixing all other model parameters at their ex-
perimentally measured values (Figure 6). The measured
endocytosis rates provided cap heights close to, but
slightly lower than, the theoretical maximum (Figure 6A).
Cap sharpness was also close to its maximum value for
our measured parameters (Figures 2G and 6C). Impor-
tantly, the optimality of cap height and cap sharpness
is independent of the total amount FT of Cdc42Q61L
(see Supplemental Experimental Procedures), suggesting
that our results are not affected by cell-to-cell variations
in the expression level of Cdc42Q61L. Furthermore, the
attainment of cap-sharpness optimality was robust to
a 4-fold range of df (Figures 3E and 6D–6I), suggesting rel-
ative insensitivity to scaffolding effects, where polarity
regulators could be immobilized through interactions
with proteins or lipids. Together, these results suggest
that yeast cells establish polarized states optimized for
the strength and sharpness of the polarized Cdc42Q61L
signal.
The Role of Positive Feedback in the Dynamic
Maintenance of Cortical Polarity
The model presented above addresses the effects of vary-
ing transport rates and diffusion on the morphology of the
polar domain assuming a steady-state window of directed
transport. However, it is known that actin cables undergo
constant turnover (Ayscough et al., 1997; Yang and Pon,
2002) and are affected by external perturbations (Delley
and Hall, 1999; Desrivieres et al., 1998; Lillie and Brown,
1994). To understand the consequences of fluctuations
and perturbations to the transportwindow, we incorporated
dynamic actin cable attachment and detachment via Pois-
son processes into our model (Experimental Procedures).
We previously demonstrated that the establishment
of polarity in the yeast system is driven by feedback be-
tween Cdc42-stimulated actin cable assembly and actin-
dependent transport of Cdc42 to the plasma membrane
(Wedlich-Soldner et al., 2003). Therefore, we additionally
incorporated feedback into the model of actin cable dy-
namics by relating increased plasma membrane concen-
trations of Cdc42 to (1) increased probabilities of actin
cable attachment and (2) decreased probability of actin
cable detachment (Experimental Procedures). We chose
to use simple linear and inverse exponential relationships
between the concentration of f and the probability of actin
cable attachment and detachment, respectively. The
Cell 129, 411–422, April 20, 2007 ª2007 Elsevier Inc. 417

Figure 6. Relationship of Cap Morphol-
ogy to Endocytosis Rates and Diffusion
Constants
(A–C) Relationship between measured single-
cell ea values and cap height, width, and sharp-
ness. For each of the best 12 cap predictions,
individual endocytosis rates were varied as in
Figures 2E–2G, while the remaining parameters
stayed at their measured, single-cell values.
The distribution of cap height (A) and sharpness
(C) show that the experimental values are very
close to their theoretical maximum values.
(D–F) Results as in (A)–(C) but obtained by de-
creasing df by a factor of two. df = 0.018 mm2/s.
(G–I) Results as in (A)–(C) but obtained by in-
creasing df by a factor of two. df = 0.072 mm2/s.
(A), (D), and (G) show the distribution of cap
heights relative to the maximum cap height
when using the measured ea values or when
varying by two orders of magnitude. (B), (E),
and (H) show the distribution of cap widths.
(C), (F), and (I) show the distribution of cap
sharpness relative to the maximum cap sharp-
ness when using the measured ea values or
when varying by two orders of magnitude.
Whiskers on quartile box plots show the data
within a length of 1.5 times the interquartile
region; dots represent outliers.
directed transport window c, previously used in the evolu-
tion of f, was then replaced by the collection of actin cable
attachment sites.
Starting from initial steady-state solutions, we explored
the ability of the Cdc42 and actin cable distributions to re-
main highly polarized for varying detachment feedback
strengths (Figure 7, first 500 s). We found that small de-
tachment feedback strengths resulted in rapid depolariza-
tion while large detachment feedback strengths resulted
in dynamically maintained stable polarization morphol-
ogies. Alternative heuristic models yielded analogous re-
sults (data not shown; see author website, http://www.
utsouthwestern.edu/altschulerwulab/). These results sug-
gest that as long as actin cables undergo stochastic turn-
over, positive feedback is critical for the dynamic mainte-
nance of a stable transport window. Next, we simulated
the response of the system to a catastrophic loss of actin
cables by randomly detaching 50% of the nucleated actin
cables at one time (Figure 7, last 100 s). Remarkably,
strong feedback was sufficient for a rapid and precise re-
covery to nearly identically polarized Cdc42 and actin ca-
ble distributions (Figure 7, right column). Relatively high
rates of actin attachment in regions of high Cdc42 con-
centration and detachment in regions of low Cdc42
concentration were essential for this robust response, al-
lowing rapid correction of misplaced nucleation sites be-
fore the polarization morphology of Cdc42 was affected.
DISCUSSION
Diffusion, transport, and endocytosis have been shown in-
dividually, in different model organisms and different sys-
418 Cell 129, 411–422, April 20, 2007 ª2007 Elsevier Inc.
tems, to be necessary for the dynamic maintenance of
polarized membrane proteins. We took a systems-level
approach to study these three mechanisms for mem-
brane-protein redistribution within the framework of a sin-
gle mathematical model. We were able to determine the
influence of each mechanism on the polarization morphol-
ogy of a polarity marker. The ability to vary parameters
outside of physiological regimes allowed us to investigate
whether biological systems that dynamically maintain po-
larized states exhibit nonobvious design principles. Our
combined approach using nonintrusive experimental
methods with mathematical modeling is particularly useful
when (1) it is experimentally difficult to simultaneously la-
bel the polarized protein and markers related to mecha-
nisms of transport in live cells and (2) transport mecha-
nisms cannot easily be experimentally decoupled.
Dynamically polarized Cdc42Q61L in budding yeast is an
ideal system on which to evaluate our general model and
parameter-estimation approaches. From a biological per-
spective, Cdc42 is a highly conserved, essential regulator
of cell polarity whose localized accumulation controls
most of the downstream events of polarization. It is there-
fore particularly meaningful, in the context of understand-
ing polarized morphogenesis, to examine how individual
dynamic processes influence the distribution of active
Cdc42. From a model-system perspective, polarization
of Cdc42Q61L is dependent on cytoskeleton-based trans-
port but independent of complicating interactions with
spatial cues, nucleotide exchange mechanisms, and
cell-cycle regulation. Furthermore, Cdc42Q61L is ideal for
studying cortical polarization as it has been shown to be
stably associated with membranes (Wedlich-Soldner
Figure 7. The Role of Positive Feedback
in Dynamically Maintaining Cortical Po-
larity
Solutions for the distributions of Cdc42 (first
column) and actin cable attachment sites (mid-
dle column) for the positive-feedback model
are computed for a range of detachment feed-
back parameter b (rows; see Equation 9). At
500 s (arrowhead), half of the actin cables
were randomly detached (right column: zoom
of middle column around 500 s). Results are
computed in 1D for simplicity. Model parame-
ter values are the mean for those previously es-
timated in Equation 1, and the steady-state so-
lution was used as initial condition for
Equations 8–10. aon was fixed at 10�4 (a.u.)
for all simulations; for each b, aoff was chosen
so that at t = 0 cables had the same probability
of detachment at the cap center. The allowable
number of actin attachment sites was limited to
�7% (=20/300) of the total membrane, in rough
agreement with experimental observations.
et al., 2003). Finally, from an experimental perspective, the
resulting polarized state is stable for a longer period than
that achieved under the normal physiological condition,
allowing greater success in capturing sufficient data for
analysis. These properties provide advantages for exam-
ining a relatively simple polarity system in isolation as a first
step toward understanding the dynamic processes gov-
erning cell polarization.
We note that a more complex model is required to ad-
ditionally account for the consequences of the rapid
GTPase cycle in wild-type Cdc42 (Brandman et al.,
2005). Under physiological conditions Cdc42 polarization
has been shown to be much faster than spontaneous po-
larization of Cdc42Q61L and to involve rapid cycling of
Cdc42 on and off the membrane (Wedlich-Soldner et al.,
2004). However, the biological processes described in
this study have all been shown to contribute to the dy-
namic maintenance of polarized wild-type Cdc42 (Wed-
lich-Soldner et al., 2004; Irazoqui et al., 2005) and are likely
strong determinants of the spatial precision and persis-
tence of wild-type polarity.
The model allowed us to uncover a central role of endo-
cytosis in defining the spatial precision and morphology of
the polarized state. Our results corroborate the assump-
tion that colocalization of endocytosis with actin patches
in the polarized region is important for cell polarity. Of
particular significance is the theoretical result that endo-
cytosis rates can regulate dynamically balanced systems
to optimize the asymmetric localization of membrane-
protein distributions. Increasing cap height has the conse-
quence of increasing ‘‘signal above noise’’ for down-
stream effectors, while increasing cap sharpness has the
additional consequence of concentrating the signal in
a smaller region. Surprisingly, we found that the endocyto-
sis rate of the model yeast system we studied was nearly
at the optima of these two morphological properties.
Since enzymes and regulators required for polarized
growth are concentrated in the polar cap, optimality in
the localized concentration of these proteins could be im-
portant for achieving high rates in bud growth (Slaughter
and Li, 2006), potentially giving yeast cells a selective ad-
vantage. Interestingly, several endocytosis mutants in
Drosophila lead to loss of polarization accompanied
by overproliferation of mutant cells (Lu and Bilder, 2005;
Moberg et al., 2005; Thompson et al., 2005; Vaccari and
Bilder, 2005), consistent with our finding that the endocy-
tosis rates can profoundly regulate the morphogenesis
and function of polarized cell types.
Finally, the maintenance of a steady-state distribution
of polarized proteins requires a stable directed trans-
port window that is robust to perturbations. Our model
demonstrates that the feedback loop between polarity
Cell 129, 411–422, April 20, 2007 ª2007 Elsevier Inc. 419

regulators, such as Cdc42, and the formation of actin ca-
bles play an important role in the maintenance of the trans-
port window. The model predicts that feedback, leading to
relatively high rates of actin cable attachment in regions of
high Cdc42 concentration and detachment in regions of
low Cdc42, can stabilize the transport window. As long
as the transport window is stabilized through such mech-
anisms, other membrane proteins that are recruited
passively to the polar cortical domain (i.e., those that do
not play any regulatory role) can maintain their distribution
through balanced directed transport, endocytosis, and
diffusion. This property is likely to be important for the
sustained maintenance of a stable and unique axis of
polarity—a defining property of polarity in many cell
types.
In conclusion, our approach involving tightly coupled
mathematical models and live-cell measurements pro-
vides a basis for future quantitative studies of cell-polarity
systems, including understanding the molecular basis of
the model parameters and describing the contributions
of additional dynamic mechanisms in polarity, such as nu-
cleotide exchange and signaling feedback. The model and
parameter-estimation methods can also potentially be ex-
tended to include effects such as general membrane on-
rate terms, partial membrane scaffolding, nonuniform dif-
fusion rates, nonconstant total pools of proteins, cytosolic
diffusion, and interacting systems of polarized proteins.
These advances should provide a framework for investi-
gating more complex systems with multiple, and partially
redundant, polarization pathways.
EXPERIMENTAL PROCEDURES
Yeast Strains and Growth Conditions
Yeast strains are described in Table S3. For imaging of G1 cells, loga-
rithmically growing cells (in SC-Met and 2% glucose medium) were
arrested in G1 by growth for 3 hr in YP and 2% raffinose medium sup-
plemented with 2 mM methionine. To induce expression of Cdc42 con-
structs under the Gal1/10 promoter, galactose was added to 2% and
cells grown for another 2–3 hr. LatA was added at 100 mM for 30 min
before imaging. To assay for effects of the temperature-sensitive
myo2-66 allele, cells were grown and arrested at the permissive tem-
perature and then shifted to the restrictive temperature (35�C) for 1 hr
before imaging.
Microscopy
Imaging was performed in the Nikon-Harvard imaging facility on a spin-
ning-disk confocal laser (PerkinElmer, UltraView) and an inverted mi-
croscope (Nikon, TE2000U). Z-resolution obtained was around 0.5 mm.
Photobleaching experiments were carried out with the MicroPoint
Laser system from Photonic Instruments. Pulse frequency and laser in-
tensity were set manually or in Metamorph and were set at 10 pulses
and 3%–10% output, respectively. Bleaching was performed for
0.4–2 s per spot.
Imaging
The methods used for parameter extraction require two sets of time-
lapse microscopy images. For Data Set I, LatA-treated cells were im-
aged at 1.7–2.0 s time steps and 1000 ms exposure times. After three
initial frames, cells were photobleached with a laser and subsequently
imaged for (at least) an additional 60 s. With Data Set II for each of the
420 Cell 129, 411–422, April 20, 2007 ª2007 Elsevier Inc.
polarized cells, a single movie was taken with 500 ms exposure time
consisting of several consecutive portions: 100 frames (3 s apart), 3
frames (15 s apart), photobleaching at the cap region, 9 frames (3 s
apart), and an additional �14 frames (20 s apart).
Mathematical Model for the Dynamic Redistribution
of Polarized Membrane Proteins
The steady-state distribution of a cortically polarized protein, f, is mod-
eled using a balance of three redistribution mechanisms: (1) lateral dif-
fusion of f along the plasma membrane ðdf DMembfÞ, (2) endocytosis of
f off the membrane at and away from the actin cables (eacf and
ea�cf=a), and (3) direct transport from cytoplasmic pool of protein,
FCyto, to the membrane ðhFCytoc=Ð
cÞ. Here, df, ea, h, a, and c are
described as in Table S1, main text, and Figure 1A, and DMemb refers
to the 2D diffusion operator acting on the plasma membrane. Then,
the equation describing the distribution of f may be expressed mathe-
matically as
vf
vt= df DMembf �
heac +
ea
a�cif + hFCyto
cÐc
(1)
where �c = 1� c. In equilibrium, Equation 1 is identical to zero.
Estimation of df
If FWindowðtÞ is the integral of the membrane intensity of Cdc42Q61L in
a window, then the recovery fraction of FWindowðtÞ after photobleaching
(t > 0) is given by
RWindowðtÞ=FWindowðtÞ � FWindowð0Þ
FWindowðNÞ � FWindowð0Þ(2)
The relationship between the diffusion constant and FWindowðtÞis given by the heat kernel on the membrane of a round 2D cell with
radius R
FWindowðtÞ � FWindowð0Þ= �ð
window
XNl = 0
B0
R2
2l + 1
4pPl
�cos
s
R
�e�lðl + 1Þ
R2ðK + df tÞds
(3)
where Plgf are Legendre polynomials and K and B0 are related to the
width and depth of the initial bleached profile. Then df is estimated
from the experimentally determined recovery curve (Equation 2) using
regression (Figures 3C and 3D).
Estimation of Autocovariance
The autocovariance of the fluorescent intensity Iðx; tÞ (Supplemental
Experimental Procedures) for time lag k, membrane positions x, and
times ti is computed by
gkðxÞ=1
Nt � k
Xj = Nt�k
j = 1
½Iðx; tjÞ � �IðxÞ�½Iðx; tj + kÞ � �IðxÞ� (4)
Here, �I is the temporal mean of Iðx; tiÞ over the Nt time points.
Estimation of ea, a, and h
Integration of Equation 1 along the membrane gives
dFMemb
dt= � eaFMemb;cs
� ea
aFMemb;�cs
+ hFCyto; (5)
where FMemb;csand FMemb;�cs
(respectively) are the total membrane
intensities of Cdc42Q61L in the nonzero regions of cs and �cs (respec-
tively). Equation 5 was then integrated numerically between time
points using experimentally estimated values for FMemb and FCyto, giv-
ing the vector equation

0B@
«
FMembðtjÞ � FMembð0Þ«
1CA= � ea
0BBB@
«
Ðtj0
FMemb;csdt
«
1CCCA
� ea
a
0B@
«
Ðtj0
FMemb;�csdt
«
1CA+ h
0BBB@
«
Ðtj0
FCytodt
«
1CCCA ð6Þ
Given a and cs, regression of the numerically integrated model de-
termined the rates for ea and h.
Computation of CSS
To compare the difference between steady-state predicted, ImodelðxÞ,and time-averaged observed, �IobsðxÞ, Cdc42Q61L membrane intensi-
ties, we define the score
CSS =1
maxy˛R½�IobsðyÞ�21
N
Xx˛R
½�IobsðxÞ � ImodelðxÞ�2; (7)
where R is a membrane region centered around the cap covering 20%
of the total contour of the membrane (�4 mm wide, compared with typ-
ical actin window widths of �2 mm; Figure 3J) and N is the number of
points in R. The restriction of comparison to the region R is to avoid
overweighting of the cap ‘‘tails’’ when comparing peaks.
Positive Feedback Model of Dynamically Polarized Membrane
Proteins
This model couples directed transport with the evolution of f. The prob-
ability of nucleating an actin cable at a membrane location x within
a time interval dt is proportional to a rate constant aon, the number of
potential actin cables that can be nucleated AC (reflecting a postulated
limiting pool of actin monomers; Karpova et al., 1995), and the density
of the polarized protein f
Ponðx; t;dtÞ= aon ACfðx; tÞdt (8)
The probability for detachment of an actin cable is assumed to be
Poff ðx; t;dtÞ= aoff e�bf dt (9)
for rate constant aoff and feedback parameter b . The evolution for f
is given by
vf
vt= df DMembf �
heac +
ea
a�cif + hcFCytoc; (10)
where c is the collection of actin-attachment sites, updated continu-
ously with the processes described by Equations 8 and 9, and hc is
the transport rate for a single cable.
Supplemental Data
Supplemental Data include Experimental Procedures, References,
seven figures, and three tables and can be found with this article online
at http://www.cell.com/cgi/content/full/129/2/411/DC1/.
ACKNOWLEDGMENTS
We would like to thank Sigurd Angenent and Guocheng Yuan for help-
ful mathematical discussions; Rama Ranganathan, Michael Rosen,
Orion Weiner, and Zena Werb for helpful comments on the manuscript;
The Nikon Imaging Center at Harvard Medical School for assistance
with microscopy and FRAP; and P. Crews for LatA. E.M. gratefully ac-
knowledges Peter Sorger for his encouragement. This research was
supported by an NIH grant (RO1 GM071794-03), the Bauer Center
for Genomics Research at Harvard (E.M., S.J.A., and L.F.W.), the
Endowed Scholars program at UT Southwestern Medical Center, the
Welch Foundation (I-1619, S.J.A.; I-1644, L.F.W.), and a long-term
fellowship from the Human Frontier Science Program (E.M.).
Received: August 18, 2006
Revised: December 15, 2006
Accepted: February 9, 2007
Published: April 19, 2007
REFERENCES
Affolter, M., and Weijer, C.J. (2005). Signaling to cytoskeletal dynamics
during chemotaxis. Dev. Cell 9, 19–34.
Axelrod, D., Koppel, D.E., Schlessinger, J., Elson, E., and Webb, W.W.
(1976). Mobility measurement by analysis of fluorescence photo-
bleaching recovery kinetics. Biophys. J. 16, 1055–1069.
Ayscough, K.R., Stryker, J., Pokala, N., Sanders, M., Crews, P., and
Drubin, D.G. (1997). High rates of actin filament turnover in budding
yeast and roles for actin in establishment and maintenance of cell po-
larity revealed using the actin inhibitor latrunculin-A. J. Cell Biol. 137,
399–416.
Berg, H.C. (1993). Random Walks in Biology, Expanded Edition
(Princeton, N.J.: Princeton University Press).
Brandman, O., Ferrell, J.E., Jr., Li, R., and Meyer, T. (2005). Interlinked
fast and slow positive feedback loops drive reliable cell decisions.
Science 310, 496–498.
Bretscher, M.S., and Thomson, J.N. (1983). Distribution of ferritin
receptors and coated pits on giant HeLa cells. EMBO J. 2, 599–603.
Cheeks, R.J., Canman, J.C., Gabriel, W.N., Meyer, N., Strome, S., and
Goldstein, B. (2004). C. elegans PAR proteins function by mobilizing
and stabilizing asymmetrically localized protein complexes. Curr.
Biol. 14, 851–862.
Chen, K., Csikasz-Nagy, A., Gyorffy, B., Val, J., Novak, B., and Tyson,
J. (2000). Kinetic analysis of a molecular model of the budding yeast
cell cycle. Mol. Biol. Cell 11, 369–391.
Delley, P.A., and Hall, M.N. (1999). Cell wall stress depolarizes cell
growth via hyperactivation of RHO1. J. Cell Biol. 147, 163–174.
Desrivieres, S., Cooke, F.T., Parker, P.J., and Hall, M.N. (1998). MSS4,
a phosphatidylinositol-4-phosphate 5-kinase required for organization
of the actin cytoskeleton in Saccharomyces cerevisiae. J. Biol. Chem.
273, 15787–15793.
Elson, E.L., and Magde, D. (1974). Fluorescence correlation spectros-
copy. I. Conceptual basis and theory. Biopolymers 13, 1–27.
Govindan, B., Bowser, R., and Novick, P. (1995). The role of Myo2,
a yeast class V myosin, in vesicular transport. J. Cell Biol. 128,
1055–1068.
Greenberg, M.L., and Axelrod, D. (1993). Anomalously slow mobility of
fluorescent lipid probes in the plasma membrane of the yeast Saccha-
romyces cerevisiae. J. Membr. Biol. 131, 115–127.
Huckaba, T.M., Gay, A.C., Pantalena, L.F., Yang, H.C., and Pon, L.A.
(2004). Live cell imaging of the assembly, disassembly, and actin
cable-dependent movement of endosomes and actin patches in the
budding yeast, Saccharomyces cerevisiae. J. Cell Biol. 167, 519–530.
Irazoqui, J.E., Howell, A.S., Theesfeld, C.L., and Lew, D.J. (2005).
Opposing roles for actin in Cdc42p polarization. Mol. Biol. Cell 16,
1296–1304.
Johnson, D.I. (1999). Cdc42: An essential Rho-type GTPase control-
ling eukaryotic cell polarity. Microbiol. Mol. Biol. Rev. 63, 54–105.
Johnston, G.C., Prendergast, J.A., and Singer, R.A. (1991). The Sac-
charomyces cerevisiae MYO2 gene encodes an essential myosin for
vectorial transport of vesicles. J. Cell Biol. 113, 539–551.
Kaksonen, M., Toret, C.P., and Drubin, D.G. (2006). Harnessing actin
dynamics for clathrin-mediated endocytosis. Nat. Rev. Mol. Cell Biol.
7, 404–414.
Karpova, T.S., Tatchell, K., and Cooper, J.A. (1995). Actin filaments in
yeast are unstable in the absence of capping protein or fimbrin. J. Cell
Biol. 131, 1483–1493.
Cell 129, 411–422, April 20, 2007 ª2007 Elsevier Inc. 421

Karpova, T.S., McNally, J.G., Moltz, S.L., and Cooper, J.A. (1998).
Assembly and function of the actin cytoskeleton of yeast: relationships
between cables and patches. J. Cell Biol. 142, 1501–1517.
Knoblich, J.A., Jan, L.Y., and Jan, Y.N. (1997). The N terminus of the
Drosophila Numb protein directs membrane association and actin-de-
pendent asymmetric localization. Proc. Natl. Acad. Sci. USA 94,
13005–13010.
Lee, E., Salic, A., Kruger, R., Heinrich, R., and Kirschner, M. (2003). The
roles of APC and axin derived from experimental and theoretical anal-
ysis of the Wnt pathway. PLoS Biol. 1, e10. 10.1371/journal.pbio.
0000010.
Lillie, S.H., and Brown, S.S. (1994). Immunofluorescence localization
of the unconventional myosin, Myo2p, and the putative kinesin-related
protein, Smy1p, to the same regions of polarized growth in Saccharo-
myces cerevisiae. J. Cell Biol. 125, 825–842.
Lu, H., and Bilder, D. (2005). Endocytic control of epithelial polarity and
proliferation in Drosophila. Nat. Cell Biol. 7, 1232–1239.
Martin, S.G., and Chang, F. (2006). Dynamics of the formin for3p in
actin cable assembly. Curr. Biol. 16, 1161–1170.
Mayer, B., Emery, G., Berdnik, D., Wirtz-Peitz, F., and Knoblich, J.A.
(2005). Quantitative analysis of protein dynamics during asymmetric
cell division. Curr. Biol. 15, 1847–1854.
Moberg, K.H., Schelble, S., Burdick, S.K., and Hariharan, I.K. (2005).
Mutations in erupted, the Drosophila ortholog of mammalian tumor
susceptibility gene 101, elicit non-cell-autonomous overgrowth. Dev.
Cell 9, 699–710.
Newpher, T.M., Smith, R.P., Lemmon, V., and Lemmon, S.K. (2005). In
vivo dynamics of clathrin and its adaptor-dependent recruitment to the
actin-based endocytic machinery in yeast. Dev. Cell 9, 87–98.
Ozbudak, E.M., Becskei, A., and van Oudenaarden, A. (2005). A sys-
tem of counteracting feedback loops regulates Cdc42p activity during
spontaneous cell polarization. Dev. Cell 9, 565–571.
Petritsch, C., Tavosanis, G., Turck, C.W., Jan, L.Y., and Jan, Y.N.
(2003). The Drosophila myosin VI Jaguar is required for basal protein
targeting and correct spindle orientation in mitotic neuroblasts. Dev.
Cell 4, 273–281.
Pruyne, D., and Bretscher, A. (2000). Polarization of cell growth in
yeast. J. Cell Sci. 113, 571–585.
Pruyne, D., Gao, L., Bi, E., and Bretscher, A. (2004). Stable and dy-
namic axes of polarity use distinct formin isoforms in budding yeast.
Mol. Biol. Cell 15, 4971–4989.
422 Cell 129, 411–422, April 20, 2007 ª2007 Elsevier Inc.
Pruyne, D.W., Schott, D.H., and Bretscher, A. (1998). Tropomyosin-
containing actin cables direct the Myo2p-dependent polarized delivery
of secretory vesicles in budding yeast. J. Cell Biol. 143, 1931–1945.
Pyenta, P.S., Schwille, P., Webb, W.W., Holowka, D., and Baird, B.
(2003). Lateral diffusion of membrane lipid-anchored probes before
and after aggregation of cell surface IgE-receptors. J. Phys. Chem. A
107, 8310–8318.
Severson, A.F., and Bowerman, B. (2003). Myosin and the PAR pro-
teins polarize microfilament-dependent forces that shape and position
mitotic spindles in Caenorhabditis elegans. J. Cell Biol. 161, 21–26.
Slaughter, B., and Li, R. (2006). Toward a molecular interpretation of
the surface stress theory for yeast morphogenesis. Curr. Opin. Cell
Biol. 18, 47–53.
Snaith, H.A., and Sawin, K.E. (2003). Fission yeast mod5p regulates
polarized growth through anchoring of tea1p at cell tips. Nature 423,
647–651.
Thompson, B.J., Mathieu, J., Sung, H.H., Loeser, E., Rorth, P., and
Cohen, S.M. (2005). Tumor suppressor properties of the ESCRT-II
complex component Vps25 in Drosophila. Dev. Cell 9, 711–720.
Toshima, J.Y., Toshima, J., Kaksonen, M., Martin, A.C., King, D.S., and
Drubin, D.G. (2006). Spatial dynamics of receptor-mediated endocytic
trafficking in budding yeast revealed by using fluorescent alpha-factor
derivatives. Proc. Natl. Acad. Sci. USA 103, 5793–5798.
Vaccari, T., and Bilder, D. (2005). The Drosophila tumor suppressor
vps25 prevents nonautonomous overproliferation by regulating notch
trafficking. Dev. Cell 9, 687–698.
Valdez-Taubas, J., and Pelham, H.R. (2003). Slow diffusion of proteins
in the yeast plasma membrane allows polarity to be maintained by
endocytic cycling. Curr. Biol. 13, 1636–1640.
Wedlich-Soldner, R., Altschuler, S., Wu, L., and Li, R. (2003). Sponta-
neous cell polarization through actomyosin-based delivery of the
Cdc42 GTPase. Science 299, 1231–1235.
Wedlich-Soldner, R., Wai, S.C., Schmidt, T., and Li, R. (2004). Robust
cell polarity is a dynamic state established by coupling transport and
GTPase signaling. J. Cell Biol. 166, 889–900.
Yang, H.C., and Pon, L.A. (2002). Actin cable dynamics in budding
yeast. Proc. Natl. Acad. Sci. USA 99, 751–756.
Ziman, M., Preuss, D., Mulholland, J., O’Brien, J.M., Botstein, D., and
Johnson, D.I. (1993). Subcellular localization of Cdc42p, a Saccharo-
myces cerevisiae GTP-binding protein involved in the control of cell
polarity. Mol. Biol. Cell 4, 1307–1316.