Empower Through Maps - DiVA Portal
97
IN DEGREE PROJECT THE BUILT ENVIRONMENT, SECOND CYCLE, 15 CREDITS , STOCKHOLM SWEDEN 2017 Empower Through Maps Reclaiming the Power of Information through Participation ANDREA GONZALEZ PALOS KTH ROYAL INSTITUTE OF TECHNOLOGY SCHOOL OF ARCHITECTURE AND THE BUILT ENVIRONMENT
-
Upload
khangminh22 -
Category
Documents
-
view
2 -
download
0
Transcript of Empower Through Maps - DiVA Portal

IN DEGREE PROJECT THE BUILT ENVIRONMENT,SECOND CYCLE, 15 CREDITS
, STOCKHOLM SWEDEN 2017
Empower Through MapsReclaiming the Power of Information through Participation
ANDREA GONZALEZ PALOS
KTH ROYAL INSTITUTE OF TECHNOLOGYSCHOOL OF ARCHITECTURE AND THE BUILT ENVIRONMENT

TRITA SoM EX 2017-29
www.kth.se

throughEMPO ER
MAPS
M
Reclaiming the Power of Information through
ParticipationAndrea González Palos

Empowering Through Maps: Reclaiming the Power of Information through Participation
Andrea Gonzalez Palos 2017
Keywords: maps, participation, urbanism, empowerment, community, Mexico City, GIS
AG218X Degree Project in Urban Studies, Second Cycle 15.0 creditsMasters Programme in Urbanism Studies, 60.0 creditsSchool of Architecture and the Built EnvironmentKTH Royal Institute of TechnologyStockholm, Sweden
Mapping Toolkit 53
II
Empowerment and Participation
Reclaiming the Power of Maps
New Forms of Mapping
Technology’s role in participation
Criticism and Challenges
Sources and Cited Works
Acknowledgments
13
31
34
42
48
182
189
I
/
Abstract
Introduction
Participatory Mapping: Best Practices
Mapping Mexico City
Re-imagining Mexico City
Mapping Practices: What’s Next?
4
7
169
99
101
148
/
IV
III
TABLE OF CONTENTS

54
ABSTRACT
It is widely claimed that geographic information and maps are highly political. Many researchers have detailed the source of the power of maps and their ability to serve specific interests, represent certain ideologies and perpetuate systems of exclusion (Harley, 1988; Harvey, 1998; Wood, 1992). Maps can be both the products and the generators of power, thus assigning the mapmaker a great responsibility in the information that they choose or not to represent and how they decide to do it. Representing the same information in different ways, or choosing to omit certain parts of it and heighten others can reveal very different conclusions and lead to multiple interpretations.
In the urbanism field, information often comes in extensive policy documents, development plans and land use maps. It is relevant to expand the sources of information that urbanists use when performing their job. Interest in mapping is high, made more accessible through tools like Google Earth and GIS software and with new forms of participatory mapping practices.
Mapping has evolved from being done by and for figures of power and authority, to representing the issues, needs and conditions of everyday users. When mapping is reclaimed by the people, they can be used to propose alternatives to the image and language of power and become a medium for conversation or protest.
By participating in the process, citizens can engage in dialogue with different stakeholders and government officials, acquire new skills and knowledge, be more informed and generate judgments about issues that concern them and exercise their political power.
In the end, it is important to remember that making the map is not the end of the process, but the beginning, as information has to be processed, analyzed and discussed in a transparent and democratic manner as well. Cities are in constant growth and evolution and so the process of updating the information is ongoing. Maps should be kept updated and accessible in order for them to remain as a relevant tool for empowerment.
Participatory Mapping in Practice: Re-Imagining Mexico City through Maps.
The way a city is portrayed, through images, pictures, texts or maps, has a great influence on how people perceive and understand it. In the case of Mexico City, a metropolis of more than 20 million inhabitants, creating visualizations of its complex dynamics can be challenging. A city as complex and populated, generates a huge amount of information every day, information useful for planners, who need to understand how the city works at a ground level. However, planning is still very much based on 1980’s zoning maps, without a deeper understanding of social, ecological and political issues (Leal 2013). In recent years grassroots organizations, bottom-up projects and researchers have taken to the task of registering new types of information. Mapping workshops, on-line databases, GIS maps, VGI, all provide a different perspective on the city to the formal and institutionalized one that planners have today. How does the city look like under this new light? What can we learn?

7
INTRODUCTION
Background
Cartography constructs representations of space. Through its symbols, format and graphic conventions, it anchors space to ideologies, subjective appreciations and objective measurements and observations. Through maps, ideas and agendas are presented as concrete, and form the base of our knowledge about the spaces we inhabit. Throughout history, cartography has been led by the ones in power. To map a place was to establish dominance over it, a sense of ownership and knowledge. The map was founded upon the interest of organizing and visualizing territories, borders and
empires. “As the map affirms the state, the state affirms the map” (Wood 2010, 33).
Once we acknowledge that maps are propositions and not unbiased representations, we can see the potential of them as instruments for participation. Those with the ability to generate their own cartographies, will be able to represent their point of view.
In order to understand the importance of maps in establishing information that we deem true and reliable, we must

98
understand the dynamics of power that are at play in the cartographic process. Who gathers or produces the data to be used, what information is shown in the map and how it is represented, are all elements that will influence in the final result, and therefore, in the display of information that we will consider to be true. Maps are anything but objective.
The truths expressed in maps, have changed through the years. When we look at different representations of the earth, its continents, its territories, even its shape, they have all been consequences of the era’s knowledge and ideologies. Even one of the most known images of the world today, that one we observe in any satellite view on airplanes, computers or our phones, is not 100% true. Composed of over 10,000 images taken by NASA over a course of 100 days, it shows an image of earth where it is day everywhere, there are no clouds and the forests are at its greenest. This image is a perfect reconstruction of what Earth is, however it doesn’t represent reality. It can never be the same season and hour across the whole planet at the same time. The map doesn’t show the truth, but creates its own image or reality, by carefully choosing what and what not display and how to do it.
NASA/Reto Stöckli

1110
In recent years, cartography has evolved into a more inclusive path. The introduction of Internet map services, along with the possibility to create custom maps has allowed for a diversification of the cartographic profession.Maps are a part of our lives now more than ever; we use them to navigate through cities, guide us as tourists and locals, represent information and even to play games. It is the ubiquitous presence of maps that opens up the opportunity for new perspectives being represented in them.
MAPS!
MAPS!
MAPS!
MAPS!
Objective and Methodology
The topic of cartography has been studied by many and on different perspectives, from historical (Harley 1987) to socio-political (Wood 1992; Kosek 1998). The role of maps in relation to power has also been the subject of discussion amongst scholars of geography and urbanism (Gaventa 1993; Ramasubramanian 2001).
With this research, I aspire to create a comprehensive overview of mapping practices today, with focus on participatory methods. I aim to understand the intersection between the process of generating a map and through it generating empowerment.
With a focus on urbanism, I will first make a review on theories regarding the power of maps, specifically in cities and their inhabitants. I will explore the changes in the role of the cartographer, the new tools and possibilities, and the need for generating a common language between professionals and citizens. I will discuss the democratization of maps and how to generate a more inclusive mapping practice. Afterwards, I will mention the different types of empowerment and discuss how collecting and visualizing information
can lead to it. I will then describe current trends in mapping and the role that technology plays in redefining how we think of maps and map making. In a second section, I propose a mapping toolkit that summarizes the key points for implementing new participatory mapping methods in practice. The aim is to create a readily accessible document with examples of good practices, pros and cons for different methodologies, and concrete techniques and steps to take to move the cartographic conversation forward. In the third section, I will evaluate participatory mapping practices in Mexico City, analyzing the methodology used and the types of participation and resulting empowerment in each case. I will then use the information gathered through these mappings to generate my own cartographies, cross referencing and overlapping information to generate a new perspective on the city’s conditions. I hope to display the importance that these alternatives forms of mapping have had in generating new knowledge about the city, and the relevance of the data gathered in generating debates and supporting different perspectives. The document concludes with a series of examples from the across the globe, where mapping has been used in creative and empowering ways.
Both Wood (2010) and Peluso (1995), have made a comparison between maps and literacy. Once an activity reserved for an elite, reading and writing became widely available for everyone with the spread of print, creating a huge impact in the availability of knowledge and the ability of a wider audience to participate in its consumption and production. When mapping is reclaimed by the people, they can be used to propose alternatives to the image and language of power and become a medium for conversation or protest.

1312
EMPOWERMENT AND
PARTICIPATION
In the traditional practices of cartography, the power has always been held by the same actors, thus producing information from a limited point of view. Participatory practices aim to shift the power relations to benefit those who have not had the opportunity to represent their visions in an official way. The ability to be able to analyze, register and represent the experiences from various sources will lead to the democratization of maps. I think that participation and collaboration leads to empowerment, and that in the development of our cities, maps can be a tool that enables these practices. What new information
can we get about the way people use, perceive and interact with their physical environments? What are the stories that have not been included in traditional city narratives? How can the process of mapping, from data collection to publication and analysis, aid in generating new discussions? If the practice of urbanism and planning wants to move into a more inclusive direction, it must do so starting with the voices it includes in its initial discussions. Participatory practices promote collaboration between bottom-up and top-down, but also gives citizens the tools to generate their own knowledge, therefore empowering them.

1514
The Power and Democratization of Maps Throughout time, maps have been used as an authoritative resource that represents and consolidates power and dominance over a territory (Giddens, 1984). However, in the past decades there has been a change of paradigm in the map making field. Interest in mapping is high, made more accessible through tools like Google Earth and GIS software and with new forms of mapping such as Parish Maps and indigenous mapmaking being used as professional tools for analysis and proposals as those maps created by cartographers (Wood, 2010). Mapping has evolved from being done by and for figures of power and authority, to representing the issues, needs and conditions of everyday users. Both Wood (2010) and Peluso (1995), have made a comparison between maps and literacy. Once an activity reserved for an elite, reading and writing became widely available for everyone with the spread of print, creating a huge impact in the availability of knowledge and the ability of a wider audience to participate in knowledge consumption and production.
The vernacularisation of maps places the power of cartography on the
people’s hands, counterbalancing the monopoly of the state in the definition of territories. It is important to understand the social and political context in which maps are created, and having multiple perspectives participating in the map making process can give new insights to often ignored or unknown information about the places we inhabit. On his research of the politics of mapping, Harley (1989) concludes that they are inherently hegemonic tools. However, when mapping is reclaimed by the people, they can be used to propose alternatives to the image and language of power and become a medium for conversation or protest. As Peluso (1995), calls them, these ‘counter-maps’ increase the ability of the people being represented in them to be recognized and represented, to be informed about their own territory and to claim the right to resources and land. There are multiple examples across the world where communities are using mapping as a tool for empowerment, as will be addressed later on. This top-down to bottom-up shift presents exciting opportunities to rethink how we analyze, propose and evaluate plans for cities.
Local groups can help collaborate in the planning process, by identifying their own needs, problems and perceptions of their environments. It is possible to create empowerment through mapping; By representing patterns of inclusion and exclusion, resource allocation, territory delimitation or cultural and social issues, certain groups can claim their right to have a say in how the planning process takes place, what issues are being addressed and who are plans benefiting. Before going into detail about new forms of mapping that can promote new understandings of information and work
as a tool for participatory practices, it is important to understand the importance of creating a more inclusive conversation in the mapping practice. Concepts of empowerment and participation are closely linked to urbanism and city making, and therefore, will be a main part of my discussion. I will mention the different types of participation and level of empowerment and further discuss the role that the map play in the issue.
Mapeo Colectivo www.iconoclasistas.net

1716
Shifting The Paradigm: Map-users/Map-makers The ability to generate and understand maps using various kinds of information is no longer reserved to planners, geographers and cartographers. There are examples across the globe of individuals and groups being increasingly involved in the planning practices of their environments. There has been an ongoing discussion in academia examining the implications of maps and GIS systems in social and political contexts, especially regarding how their use can empower or dis empower different actors involved in the planning process. Though it may seem that this democratization of the field logically empowers previously marginalized groups, there has been debates on whether it could actually reinforce the power of the current dominant actors (Sieber, 1997 ; Ramasubramanian, 1998). In order to really achieve active participation and the Right to the City ideals, as planners, we need to make sure that the plans we produce and the systems we use to produce them, benefit and are informed by everyone. Understanding the multifaceted impact that mapping can have on the planning process is key to identifying its strengths and potentials.
The Right To The City = The Right To Maps? The Right to the City is an idea that has been discussed by various urban theorists before. The term was first coined by French philosopher, geographer and sociologist Henri Lefebvre in the 1960’s. According to his theory, the Right to the City is a right that implicates the democratizing of urban life by not only by being able to access what already exists, but also by the possibility of transforming and renewing the environment. Lefebvre later added to that “the right to information, the rights to the use of multiple services, the right of users to make known their ideas on the space and time of their activities in urban areas; it would also cover the right to the use of the center.” (Lefebvre 1991, 34) David Harvey, agrees that this Right implies the ability to change ourselves by changing our environment and adds that it is “a common, rather than an individual right since this transformation inevitably depends upon the exercise of a collective power to reshape the processes of urbanization” (Harvey 2008). In a more global context, the World Charter on the Right to the City, signed in 2004 defines the Right to the City as “equitable usufruct of cities
with the principles of sustainability, democracy, equity and social justice” (UN Habitat 2004). It focuses in particular in the rights of vulnerable and marginalized groups and confers them the ability to act and exercise their rights based on their uses and customs and with an adequate standard of living.Planners and government officials must clarify which actions will be taken and who will these actions be targeted to in order to achieve inclusive urbanization. As Marcuse says, “it is the right to the city of those who do not know they have it with which we are concerned” (Marcuse, et. al. 2012, 33).
The concept of the Right to the City is still very relevant today. The 2016 New Urban Agenda, recognizes the importance of achieving cities for all, ensuring that all inhabitants are able to inhabit in safe, accessible, resilient and sustainable human settlements (UN Habitat 2016). Part of the vision is to “achieve cities and human settlements where all persons are able to enjoy equal rights and opportunities, as well as their fundamental freedoms” (UN Habitat 2016, 2). It is stated in the New Urban Agenda’s commitments that “the spatial organization, accessibility, and design of urban space, as well as infrastructure and basic service provision, together
with development policies, can promote or hinder social cohesion, equality, and inclusion” (UN Habitat 2016, 5).
It is clear that the discussion about cities is focused in the principles that Lefebvre and Harvey mentioned, where citizens have the right and responsibility to actively participate in the transformation of their environment. There are many ways this right is being reclaimed, mostly through bottom-up initiatives and grassroots organizations that focus on reclaiming spaces for people. Maps become very relevant in this discourse because they are a medium of representation. If citizens can partake in the collection of information but also in the discussion and implementation of this information for real projects, it brings them one step closer to their rights as inhabitants of the city. Especially when talking about vulnerable communities, having access to a platform from which to voice their concerns and needs, will create more opportunities of creating projects that serve them. The challenge is finding a common language between the professionals and the citizens, in which both hold can interact on equal grounds. Mapping can be the medium for that conversation, bridging the gap between professions and between users.

1918
The Need for a Common Language There are many examples as to how there has been attempts at describing the city through the perspective of those who experience it. One is the Situationist movement, led by Guy Debord, where the act of derive was a way to navigate the city, led by feelings and personal images.
Another example is the work of David Lynch in the 1960’s Image of the City. He claimed that the city was formed out of the experiences of its inhabitants and re-imagined the planning practice as being done through observation and analysis. Lynch developed the idea of cognitive mapping, in which the city is represented through certain icons and symbols, based on the memory of the map-maker. This mapping technique led to discoveries of the nuances of urban life and the particular knowledge of the environment that each person holds. Subsequently, each individual result could be aggregated and compared with others, generating an general map of the features and character of a city. Lynch’s theories led to a new emphasis on contextual, bottom-up citizen science, putting value in subjective observations but creating a common language through graphic representation.
In his studies, Lynch made analysis of Boston, Jersey City and Los Angeles, and through interviews with local people and on-site observations, could draw certain conclusions on the characteristics of each city. He then abstracted the key elements that make up cities: paths, landmarks, edges, nodes and districts. These elements are related between each other and together weave the pattern that makes each place unique. Lynch created a method that allowed the objective analysis of subjective perceptions, and made planning concepts approachable by a common audience. The connection between the citizens and the urban professionals can be bridged when both can speak at the same level about the issues that concern them.
Participatory planning practices hold the same principles: the citizen is the expert, and by creating tools that translate their knowledge into planning language, it is possible to create urbanism that speaks to and includes everyone. Today, after more than 50 years, Lynch’s ideas are still relevant, and can be taken to new limits through the use of technology, social media and bottom-up urbanism.
Diagrams of Boston. Kevin Lynch, “The Image of the City” (1960)

20
Defining Citizen Participation In a democratic planning process, decision making should be collective and decentralized, so that all individuals can participate effectively. In this context, citizens are not only spectators or participants of urban life, but experts on it, worthy of standing on the same stage as other stakeholders involved in city making.
Participation has a lot of different beneficial qualities as it leads to what Carson (2003) calls deliberative governance. By having the opportunity to engage in dialogue with different stakeholders and government officials, citizens can acquire new skills and knowledge, be more informed and generate judgments and opinions about issues that concern them and get a sense of greater political power thus motivating action. That is why generating opportunities for participation is of such importance in the urbanism field; not only can urbanists benefit from getting the opinions and experiences of the people who inhabit the places that they are planning for, but the people themselves can take a more active role in the construction of their own environment.
The collective intelligence generated by interaction between individuals of different perspectives can generate new insights and surprising outcomes.
Whyte (1991) mentions the term Participatory Action Research, as a practice that empowers citizens by generating local knowledge through collaborative problem solving and that may lead to social change. Community participation needs commitment from all parts involved and both government and citizens must be willing to generate dialogue, accepting and discussing different opinions.
(Creighton, 1994)
Improving the quality of decisions
Minimizing cost and delays in projects
Consensus building between actors
Increasing the ease of implementation
Avoiding serious confrontations
Maintaining credibility through transparency
Supporting the legitimacy of decisions
Anticipating concerns and possible obstacles
Developing skills and expertise
Supporting creative thinking
BENEFITS OF A PARTICIPATORY PROCESS

2322
Levels of Participation
When speaking about participation, in particular in the context of city planning, Sherry Arnstein (1969) defined eight different levels that determine the citizen’s power. This is called the Ladder of Citizen Participation.
Citizen Power8. Citizen control
7. Delegated Power
6. Partnership
5. Placation
4. Consultation
3. Informing
2. Therapy
1. Manipulation
Tokenism
Non Participation
Experiencias Cartográficas en México www.iconoclasistas.net

2524
At the bottom of the ladder, are the levels where citizens are not included in the participation process, and in fact, are just fed information to shape their opinions or replace actual dialogue with the power-holders. In previous practices of mapping and planning, this was the only level in which citizens could be involved, as mere observers of decisions that had already been taken and in the last chain of the process. The next levels, “informing, consultation and placation”, are classified as mere tokenism. According to the Oxford Dictionary, tokenism is the practice of making a symbolic effort to create an image of inclusion. For example, when minority groups are invited in small numbers, just to fit the requirement of diversity, but not actually giving them any power of representation. When citizens inform about their concerns (level 3) or when they are consulted by the decision makers about their opinions (level 4), they have no power to control the outcome for the information they provided, it is a one way flow of information. Even though they are being included, it is not ensured that in the end their voice will be considered for further steps in the process. In level 5, the power-holders allow certain representatives to participate
in the process. Even though here the under-represented groups are being included more, it is still the decision makers who hold the power of choosing who to include as well as the legitimacy of the opinions provided by the representatives. In the last levels, there starts to be a more inclusive concept of participation. Partnerships (level 6) allow for discussions and negotiations to get to a desired outcome. There is a shared responsibility for the outcome and process between all stakeholders.In level 7, citizens are mainly responsible for the process, decisions and results, giving them responsibility and accountability, but also allowing them to create plans that would fit their needs. In this step initiatives still may come from a top-down perspective, or require the help from the power-holders but are mostly led by citizens. In the top level in the ladder, citizen control, they are the ones that initiate projects and create their own agendas. Citizens have the power and responsibility to create the changes they want with no intermediaries. This is often seen in grassroots initiatives that take control over their neighborhoods to transform them without waiting for more formal higher-power solutions.
Although the ladder diagram represents a simplification of power dynamics, their characteristics and the necessary steps to shift them, it is useful in order to understand how certain practices are achieving actual participation. There is a great difference between just being the receivers of information, to being the initiators of their own projects. The actions that have to take place between one level and another are those which lead to empowerment. But, what exactly does empowerment imply, and why is it important?
Neil Cummings. Installing, visualizing evaluative networksThe Anthropocentric Atlas: London. (2015)

2726
Defining Empowerment Empowerment can be defined as the “authority or power given to someone to do something” (Oxford Dictionary) or “the process of becoming stronger and more confident, especially in controlling one’s life and claiming one’s rights” (Oxford Dictionary). Empowerment is both a quality (adjective) and a process (verb), to be empowered and to become
5. Political Empowerment
4. Socio-political Empowerment
3. Mediated Empowerment
2. Embedded Individual
Empowerment
1. Atomistic individual
Empowerment
empowered. There are definitions of empowerment that divide the level of interaction and outcome as well as whether empowerment is an individual or collective experience. Rocha (1997) for example, redefines the ladder of participation previously mentioned, and re-frames it in terms of experiences of power.
On the first level, atomistic individual empowerment, the individual as a unit feels empowered. In the second one, embedded individual empowerment, the person feels power in relation to the context and larger structures that surrounds him. In mediated empowerment, step 3, the individual engages with the higher level decision makers in actions that generate power, such as exchange of knowledge and information. In the last two levels, empowerment is considered to shift from individual to a community perspective. At the socio-political empowerment level, the community creates collective social action, challenging the views and norms established by higher-power and having the ability to voice their concerns in a public way and with the possibility of further engagement. In the last level political empowerment, change is achieved in the form of public policy modification, allocation of resources or other forms of support for the empowered community. It is possible that empowerment can happen in a linear way, as proposed by Rocha, in which individual empowerment can motive actions that
would lead to political empowerment. In a step-by-step manner power is gained through different actions that would require to involve different actors at each level. However, it is also possible that a single activity would create empowerment in different levels, or change one but hinder another. The involvement of diverse stakeholders and the multi-scalar character of planning makes it difficult to clearly evaluate empowerment as a linear and scalar process.

2928
Empowerment
As an alternative, Elwood (2002) proposes an approach that consists of three perspectives: distributive change, procedural change and capacity building. When employed together, it is possible to assess the social, political and psychological effects empowerment certain practices create.
Distributive Change Procedural Change Capacity Building
Distributive ChangeThis kind of empowerment can consist of changes in the access and distribution of goods and services (Jacobs, 1992), or an increase of opportunities for participation political and social processes. In this case, empowerment can be seen as a tangible change that can be achieved. Procedural ChangeIn this case, empowerment occurs when there is change in the social and political dynamics, that allows citizens to contribute in a legitimate and inclusive manner. Individuals can partake in the decision making process with different
levels of engagement and ideally at every stage of a project. True empowerment occurs when not only multiple views and ideas are considered as part of the dialogue, but when the process actually involves and assigns value, authority and legitimacy to others. Capacity BuildingEmpowerment occurs when citizen can expand their skills and are able to take action and make decisions on their own (Rappaport, 1984) The gain of power may refer to the mere acquisition of new abilities, but is most impactful when it also involves the generation of local knowledge. Gathering, analyzing and
discussing information about their own communities and enriched with their experiences can make citizens more prepared and informed about the issues that involve them and how to address them. The production of such knowledge can be the base for community strengthening and eventually increase the capability to generate change (Gaventa, 1993). In terms of resilience and governance, capacity building is one of the most important aspects of empowerment, “new skills and knowledge, if they can be maintained and retained by a community or organization, hold the greatest potential for long-term empowerment” (Elwood, 2002, p. 912) The tools developed can be applied not only to a particular case, but are transferable to new issues and circumstances.
Why maps?
Mapping involves going out to the field to observe and gather information, data processing and discussion and displaying conclusions in a simple and clear way. Therefore, it is an essential tool in any participatory project. Designers and planners working with community groups can generate maps that will be
product of the exchange of expert and experiential knowledge. However, the way we usually think about maps has to change to fit the new information that is displayed on it, that goes well beyond the standardized codes and conventions of geographic institutes. How can we show experiential information, subjective appreciations, memories, feelings, etc. in combination with hard data and physical conditions?As we mentioned before, Kevin Lynch pioneered into the topic by generating symbols and definitions for what he considered to be the main components of cities. Many methods of mapping still build on those concepts, but others have used different tools to achieve more accurate, inclusive or updated results. In the next section, different categories of participatory mapping will be explained, each with a particular focus or method.In the end, it is not only the means by which information is obtained or in which it is represented in the end. The most important thing is that our mapping practices lead to the inclusion of voices that have not been considered before and the consecuential empowerment of these groups. Once a community is able to analyze and understand itself, it can better represent itself in the future.

3130
RECLAIMING THE POWER OF
MAPS“Instead of simply planning on behalf of the public, there is an
increasing effort to involve the public from the beginning of the planning process. This “engaging” approach to planning
has been referred to as “Planning 2.0” and makes extensive use of collaborative technologies like participatory Geographic
Information System (GIS) and crowdsourcing platforms” (We are Future Gov, 2011)
Wood (2010) questions the real impact that participatory mapping practices have had on the planning profession, as sometimes it is not clear whether these methods are being wrongly used to satisfy the requirement of public consultation in planning projects, while in reality they don’t always imply active participation from the community. Wood states that “passive participation is oxymoronic” (2010, p. 160), and while being able to access information and gain knowledge is valuable, the right to know should not really be considered a participatory practice.
As mentioned before in the participation
ladder, in order to achieve true democratic involvement, citizens must be able to achieve the highest levels of involvement and participation. Going back to LeFebvre’s ideas on the Right to the City then, mapping practice shouldn’t be limited to providing information and being able to later of visualize it, but should be a process of continuous involvement in the acquisition, interpretation and utilization of the information. When studying the literature on PPGIS Sieber (2006) noticed two possible approaches: top-down and bottom-up. In the top-down approach PPGIS serves

3332
the public, mapping socio economic demographic factors and analyzing spatial conditions, access to resources and services and locating deficiencies in certain areas. Information can be acquired through census and national or local databases, however, there is no direct involvement of the inhabitants of the analyzed area.
As in the bottom-up approach, Sieber claims that it calls for a redefinition of the PPGIS terms, as the word “participatory” implies the need of an intermediary between those in power and those collaborating, and does not truly reflect the democratic process that bottom-up should imply. In other words, bottom-up approaches should be seen more as a collaborative process than a participatory one. It is not those in power allowing those under represented to participate in an already established activity, but a process where the views and information generated by the groups of individuals are as equally important as those of professionals, and the gathering and analysis of information is done by collaboration of both perspectives. How can we broaden the definitions used in the cartographic realm to include more than just the geographical
representation of the physical world? Denis Wood (2010), for example, proposes an expansion on what GIS can mean. To “geographic” he adds the concept of the work of William Bunge, radical cartographer of the inner cities social issues and founder of the Society of Human exploration. Bunge’s work on mapping of the particular issues and problems of the city with information gathered by locals’ explorations, says much more than the mere location of objects, people and spaces. “Information” can be gathered in different ways and be qualitative or quantitative, as the maps created by the situationist movement demonstrate, linking subjective experiences and social constructs to what is considered traditional data y practitioners. Lastly, mentioning the work of Jake Barton, a narrative map of New York consisting of stories linked together through different criteria, Wood shows that “Systems” can also be redefined and reinterpreted into different materials, media and dynamics. With the spread and popularization of mapping, the increasingly open dialogue between policy makers and the public, along with the widespread availability of Internet, data, smart phones and
other technological devices; there are many ways in which, “geographic”, “information” and “systems” can be redefined and result in creative mapping practices. This opens up new possibilities of reflecting what we think about people and places, and most importantly, create the opportunity of new collaborative dynamics to re envision and create these places with and for everyone. There are many different ways to define maps created by others than the traditional representatives of power, with certain variations on methodology, tools employed, and overall objective, all these maps differ from traditional cartography in the sense that they try to represent new perspectives, subjective appreciations or data that is not necessarily physical or geographical. The process of making the map is undertaken by non-professionals who share a common interest or goal and represents social, cultural, economical, historical and subjective associations between the land and the locals in cartographic language.
Some of the concepts that have emerged as part of the new forms of mapping are: cognitive mapping, counter-mapping, community mapping, PPGIS, VGI, etc. These new forms of maps are classified
in terms of the technology they use and the data acquisition processes, and differ as well in the levels of engagement that the individuals have in the planning and decision making dynamics.
As the field has evolved in the past decades, so have the ethical considerations that guide the practice (Rambaldi et al. 2006), that seek to ensure that people can develop and communicate their own data, deal with the confidentiality and ownership of the information and try to ensure a just and democratic process. Some of the different types of maps, their pros and cons, and their implementation, will be discussed in the following section.

3534
NEW FORMS OF MAPPING
New Forms of Mapping
Urban data or urban information, describes social, economic political and ecological patterns in cities. It is information of different types linked to a geographical location. The use of this type of information has the potential to increase the opportunities for generating new types of analysis, understanding different perspectives, creating thematic maps that explain in detail certain aspects of the city, identify areas that are particularly problematic, and create a new form of interaction between the users and the professionals.
How the data gets collected and who gets to have access and make use of it is a very important part in determining democratic practices. There are many different concepts that have emerged as part of the new forms of mapping. This new forms of maps are classified in terms of the technology they use and the data acquisition processes, and differ as well in the levels of engagement that the individuals have in the planning and decision making dynamics.
Cognitive Mapping
Cognitive mapping was first introduced by Kevin Lynch. It refers to a way of mapping based on the memories and experiences of the person in charge of the map. It is a subjective representation of a space through the senses, and physical or psychological perceptions. A person can represent the smells or the feeling of safety that they have in a place. Landmarks and iconic places can be drawn, and can be connected by what Lynch called paths. While a single cognitive map can tell a lot about a person’s image of a city, aggregating
Counter Mapping
Counter mapping consists on the creation of maps that go against dominant power structures and propose alternative information. The term was coined by Nancy Peluso in 1995, as a way to generate a representation of the overlooked indigenous interests. These anti-hegemonic practices are also known as ethnocartography, alternative cartography or remapping. It has been particularly linked to indigenous cartographic practice but has also been used for other mapping activities to defend traditional territories, manage
resources, formalize land tenure and advocate bottom-up policy change (Bryan, 2011). The concept of counter mapping is closely linked to the Parish Maps Project, a 1985 initiative, where locals were encouraged to map their community and create a typically artistic representation of their communities as a conclusion. “Making a parish map is about creating a community expression of values, and about beginning to assert ideas for involvement. It is about taking the place in your own hands” (Clifford, 1996).
different maps of the same place can lead to interesting results. The repetition of certain streets, neighborhood names, iconic buildings or monuments, etc., can reveal the main structure of the city and the strength of the connections or sense of proximity between certain areas.
This type of map can inform planners of how the city is perceived and can be a tool that helps in designing new areas of the city to contain elements that will be attractive and memorable for the future users.

3736
Crowd- Sourced Maps
The term “crowdsourcing” is used to describe the acquisition of large amounts of information provided by people who use some kind of web-based technology. In a lot of cases, the information is generated by common users, not trained in cartography or in data generation. Crowdsourced maps are created using information of social media, apps and other geo-location services. (Heipke 2010). This Counter-mapping deals with the possibility to create cartographies alternative to formal and official ones. Especially
in contests of informality, this means revealing the complexity of stories and practices taking place in the “blanks” of the map. It is a political discourse because spatial omission of informal settlements is still an instrument to avoid debates on public policies and resources’ distribution (and to confirm slums’ illegality), a powerful signal of the non-integration and recognition of some inhabitants (De Carli 2012).
Participatory or Community Mapping
According to the Mapping for Rights organization, participatory mapping is a term that defines a series of techniques that combine modern cartography with participatory methods in order to represent the knowledge of the locals. The main concept is that local people possess a deep knowledge and understanding of their environment, and by providing the tools to represent this knowledge, the professionals can acquire new and valuable information and have informed and productive
discussions with the locals involved.Participation can happen in a number of different ways and can be towards a targeted group or the general public.
International Land Coalition (2008)
A tool for advocacy and community cohesion
A way to identify rights to land and tenure
A tool for conflict resolution through the visualization of land, natural resources and territory
A tool for collaborative resource management and territorial planning.
PARTICIPATORY MAPPING IS...

JAW JAW SURINAME. Public Participation GIS Blogspot. (2014)
3938
The method of production of the map itself is what most clearly defines participatory mapping, as the process is as important as the result itself. In a publication by the Technical Centre for Agricultural and Rural Cooperation
IIED (2006)
Represents the agenda of the community. It is generated by the particular interests, demand for information and
agenda of the people participating in the map-making activity.
Generates maps that represent local knowledge and information.
It is possible to notice the communities most important places, locations and particular characteristics and features of places and
systems.
Is not necessarily in compliance with the formal cartographic conventions.
A community map can be done in many ways ranging from sketches to formal computer drawings, in 2D or in 3D, with texts and pictures or in many other formats. The diversity of content represented in the maps
can also accept a diversity in representation techniques.
A PARTICIPATORY PROCESS...
and the International Institute for Environment and Development (2006), there are certain criteria mentioned in order to define a participatory mapping process.
PPGIS
The approaches done with employing geographic information systems (GIS) to collect data generated by certain communities and stakeholders usually with the objective to broaden public involvement in plan and policy-making are often referred to as Public Participation GIS (PPGIS). The term was first used in 1996 at the meetings of the National Center for Geographic Information and Analysis. As summarized by Corbet et al. (2006) in these meetings, it was defined that PPGIS: enhanced the
capacity of generating, managing and communicating spatial information, stimulated innovation and encouraged positive social change PPGIS aims to produce local knowledge and give a voice to often marginalized and ignored actors, while at the same time, linking it to geographically accurate representations, that makes it easy to visualize and use as a tool for discussion with planning professionals.

Safe City India www.safecity.in
4140
User-Generated Collaborative Mapping
Collaborative mapping is a form of map generated by the aggregation of web base maps and user generated information. This type of mapping can be divided into active and passive, regarding the method for the acquisition of information.
Active collaborative mapping uses Volunteered Geographical Information (VGI) to generate new maps. In recent years, tools such as OpenStreetMap and Google Map Maker have made it simple for users to generate their own content in a precise geographic representation (Goodchild, 2007). The collaborative term implies that the maps can be modified by different users, adding, changing and removing information from them. This calls for external revision controls that could ensure the veracity and quality of the information displayed, the accountability of each user’s changes and the control of data overlap. (Flanagin, 2008). These kind of maps have the potential of aggregating individual data inputs into a general map, creating a broader overview of certain issues. This can be seen for example, in maps services that allow users to mark places where crime has
occurred (Safe City India) or where the city infrastructure needs maintenance (Water SMS project).
Passive user-generated mapping utilizes “big data”, publicly available information gathered through the use of GPS-enabled applications, cellphone signals, location tagged images, etc. Information taken from sites such as TripAdvisor, Flickr, Twitter or Uber have been used to create maps that reveal hidden patterns in space.
VGI
The term Volunteered Geographical Information (VGI) was coined by Goodchild (2007) and refers to a wide array of data such as photographs, routes or reports, generated by non-professionals. The information gathered through this methods can help update national geographical databases and acquire new information through different sources. Mobile phones are often the devices used for capturing information about the environment. With tools such as a mobile network and WiFi, GPS reception, cameras,
accelerometers, compass and microphones, they become powerful tools to register a variety of factors. Some projects that have used this kind of technology include ones where users could report their sense of well being in certain locations, or even others where air quality or noise levels were assessed (NoiseTube). Personal perceptions and descriptions add an extra layer of information to geographic location that can be valuable in the understanding of a place (Haklay, 2013).

4342
TECHNOLOGY’S ROLE IN PARTICIPATION
MVRDV, a Dutch architecture and urbanism office, used the term “Metacity” to describe a city that was composed by data. It was a futuristic reinterpretation of a city where relationships amongst its inhabitants, interactions and environments where the results of flows and accumulation of information. In their visualization, the city was a pristine transparent cube that contained all the information of its inhabitants (Grahame, 2014).
While our cities do not really look like MVRDV’s vision, it is true that they contain infinite amount of information
about us. In the digital age, information is being generated and shared all the time. What if we could visualize this information, what new patterns could we detect? How can planners take advantage of the information age to generate new visualizations and understanding of the cities, using the infinite amount of available data out there to inform what we know about our cities?
Technology can help bridge the gap between citizens and professionals through new methods of interaction. Some of these new technologies
“We are most interested in the fact that, with new technologies, we can produce maps consisting of new signs – irrespective of the language and conventions of the picturesque characteristic of landscape – which are
a huge resource in multi-language and multi-cultural contemporary societies”
(Ferraris, 2009)
available for the are classified by Antonella Contin (2014) in 5 different categories: Mapping and displays Placing displays where people can interact with the plans or visualize the new projects that are being developed in their city. This makes information more available and approachable to everyone, engaging the citizen with their environment. These tools can be available on site or on-line.
Interaction toolsCreating possibilities for people to interact with space and with each other. These tools range from urban art to participation platforms, digital simulations and virtual renderings.
Mobile or fixed technologies This refers to elements that modify the inhabitants’ experience of public space. For example mobile device applications which collect and return information between context and inhabitant, or among users.
Augmented realityThe possibility to visualize and interact with a project works as an identity-image intensifier of the built environment and helps create an easier understanding of
new proposals. An example is the Block by Block initiative, in which people of all ages can participate in creating and visualizing proposals for their city, using the computer game Minecraft as a platform.
Big-dataThe availability of information through virtual platforms such as applications or Internet portals generates a unique connection between users and space not only in the individual level but in the territorial and global one as well. This generates new opportunities for analysis and gathering of information that could not have been possible in other ways. An example of this is the analysis of trends in applications such as Twitter, Instragram or Uber, which add a level of information to our knowledge about how the users interact with each other and their surroundings.
Technology is changing the world around us, and it is important to take advantage of its strengths as a tool to reach new people and process information in a new way. Already GIS analysis or virtual simulations of proposals have advanced the way planners work and design. Now these tools have to reach out to the users themselves.

Minecraft Model for Saltillo, Mexico. Block by Block and UN Habitat
Minecraft Workshop in Mexico City. Block by Block and UN Habitat
4544
With the use of new technologies, the mapping of dynamic urban systems can be done in new unconventional ways. Tools such as Space Syntax analysis, simulations using GIS, 3d modeling, mobile data collection etc. open up the opportunity for planners and urbanists to observe, register and analyze information that was unseen before. Contin (2014) mentions different ways in which new technologies have an effect in the kind of information that planners can obtain and generate:
Mapping and displaying of information
With new technologies such as GIS and spatial analysis, new representations of street connectivity, location of spaces and infrastructure, flow and use simulations can lead to discoveries of new issues and the ability to recreate and evaluate future scenarios.
Creating tools for interaction
Using digital or physical 3D models, generating simulated walkthroughs of proposed projects or even using video game platforms (such as Minecraft) during the planning process, can make it easier for the general public to understand and propose ideas regarding
their environment. This helps bridge the communication between the planners and the public, which is no longer constrained to a plan view of the city or to static 2d representations of a project.
Using citizens as censors
The use of mobile devices as a tool for interacting with public space but also for collecting information, has the potential of generating site specific knowledge by the users of space. Whether it is VGI (volunteered geographical information) where the users actively participate in the logging of certain observations, image registration or comments on places they frequent; or its information generated by the accumulation of individual activity that generates big data patterns (traffic information of ride sharing apps, location of images uploaded to public social media platforms, location of posts regarding certain topics).
Visualizing and experiencing proposals
Enhancing the experience of public realm through technology, generating new forms of interaction between the users and the space.

4746
Identifying spatial relations. Cross referencing different types of information and visualizing it in an image can help identify certain relationships between information and
compare it to the knowledge provided by experts and locals.
The possibility of engaging with a more diverse group. As it is not necessary to be physically present in a consultation
meeting, other groups of people are free to participate on their own time and location, making it easier for a wider public to voice their
opinions.
Speeding up the process. Technology can make the sharing of data almost instantaneously,
allowing for real time visualizations, better communication and overall an ease of access to the results of observations and discussions.
The ease of visualizing relevant data. Real-time and interactive platforms can display important geographical data while asking to perform evaluations, locate places or understand
the context of a proposal.
The use of technology and Internet access in the planning process can also benefit the engagement level of the community. According to Lodigiani (2014) when participatory planning extend beyond direct interaction into the use of digital platforms, it can be called e-planning, and this form of participation can have multiple benefits in democratizing the participatory process. The following box shows some of these benefits.
(Lodigiani, 2014; Ramasubramanian, 2010)
The collection of local knowledge. Creating a database of not only geographical data but pictures, voice
notes, texts and videos, can help form a better understanding of a place.
Creation of different scenarios. Tools such as 3d modelling, simulations and analysis allow to evaluate
and compare different proposals.
Feedback. Suggestions and comments can be updated at any time and by anyone and not limited to meetings or sessions done in a more formal context.
Real-time evaluations are possible and can help monitor projects at every stage of their process.

4948
Even though participatory mapping, counter mapping, collaborative mapping and all other alternatives to the conventional production of maps, aim to empower usually overlooked people and represent information that otherwise would remain unseen, there have been several critiques made against it.
First of all, as these kinds of maps usually reflect the perspective of a particular group of people, there is a possibility of excluding others in the mapping process. Setting the boundaries of who does or does not belong to a particular community and what information is to
CRITICISM AND CHALLENGES
be represented, is a difficult task. Many mapping processes fail to acknowledge that communities are not fixed and can vary in interests and needs (Kosek, 1998). The term community itself can be problematic, as it delimits certain common characteristics that individuals have to have to belong to it, limiting the Perhaps the way to best create a democratic mapping process is by ensuring the transparency and availability of information in different media and generate multiple opportunities to engage in the participatory process at different levels.
Another issue is the imbalance of power and skills between actors. Clark (1998) links marginalization and empowerment to the use of GIS, arguing that this tool can promote the manipulation, control and management of information, with the potential of being both empowering and oppressing. Adding to that, the dominant mapping systems utilizes formal codes and technological tools that legitimizes the information that they create. When creating a map in a bottom-up approach that can be used to compare or compete with those made by professionals there can be an initial disadvantage. The need for specialized skills, knowledge and technology is a barrier in many cases, and even when it is achieved, the process of utilizing a set of defined tools to represent alternative ideas can sometimes result in the loss of certain information (Rundstrom, 2009). This is especially true in situations when maps represent more than mere physical characteristics, when they contain information about subjective experiences, emotions, affects or history. How can a simple cadastral or land use map represent the beauty of historical centers, the energy of a busy market, or the abandonment of blighted neighborhoods?
“Crumpled buildings, burned out abandoned cars, trash strewn lots and streets, broken glass and graffiti are in evidence everywhere but not on the maps” (Casey 1995) There is a need for a system of mapping that legitimizes subjective information acquired through PPGIS or mapping workshops, which can enrich fact-based information with personal appreciations of space and better inform planners and policy makers of the overall conditions and values of a space. Abbot et al (1998) debated the benefits and problems with participatory forms of mapping, due to the lack of skills in GIS by the local people or to the possible alienation of those who couldn’t have access to the information or technology necessary for these kind of processes. Apart from that, the question of who gets to engage in map-mapping and who else that decision excludes, is also present in current mapping debates. As the field has evolved in the past decades, so have the ethical considerations that guide the practice (Rambaldi et al. 2006), that seek to ensure that people can develop and communicate their own data, deal with the confidentiality and ownership of the information and try to ensure a just and democratic process.

Community Mapping. www.mappingfutures.org
5150
Corbett et al. (2006) define three guidelines for good practice in map-making that ensure an ethical and inclusive process during and after the practice.
In the end, it is important to remember that making the map is not the end of the process, but the beginning, as information has to be processed, analyzed and discussed in a transparent
Corbett et al. (2006)
Transparency. Good communication during all stages of the process, clarity,
accountability and the use of a common vocabulary.
Time. It is important to build meaningful connections and relationships between the different actors involved in the map-making process. Also, a clear recognition of the investment of time required for
understanding and learning the tools needed for an effective collection and representation of information.
Trust. Relationships between groups and individuals based on cooperation
and understanding are key to a successful process. Creating a sense of community benefits the work process.
KEY ELEMENTS FOR SUCCESS
and democratic manner as well. Cities are in constant growth and evolution and so the process of updating the information is ongoing. Maps should be kept updated and accessible in order for them to remain as a relevant tool for empowerment.

5352
MAPPING TOOLKIT
Maps define borders, limit territories and represent human presence on the land. They have the ability to show us in a simple and clear manner different types of information. Who? Where? What? The information we see displayed on maps is an interpretation of a particular map-maker’s view of the world. The map-maker becomes a curator, deciding what to display and how to display it. It is this manipulable quality that makes maps so powerful. Maps represent ideologies, proposals and systems of power linked to a physical location. Until recently, map-making was in the hand of geographers, cartographers and planners. However, the emergence of
“Maps are knowledge and knowledge is power, and it’s not about people versus government, it’s about creating visibility”
Jessica Pfund, Google
technologies like Google Maps, GPS, GIS and mobile devices has created the opportunity for maps to reach new audiences. Urban planners have started to take advantage of these technologies to create increasingly inclusive planning practices, with the inclusion of local’s knowledge in a formalized way. Maps are now not only a tool for representation, but a tool for learning, discovering and interacting.
In this toolkit, mapping is explored as a tool with many benefits and possibilities and suggestions on how to use mapping for empowerment are made. I hope you enjoy your mapping experiences!

5554
everyday life and experiences in a place Planning Practices and professionals
MAPS
Mapping is a practice, an act of reflection in which the map allows us to approach social, geographical and subjective territories. The graphical representation of information opens up a space for debate and socialization and increases the knowledge and connection the studied place.Maps can be a step in the broader participatory process, a very important one, where problems are conceptualized, discussed and challenged and which leads to further empowerment of its users. It is part of a larger strategy to create a structure for inclusion and democracy, especially when it involves
the spaces we all inhabit. Mapping doesn’t generate transformations on its own, but is connected to a bigger mentality where everyone can take part on the discussion at different levels, from giving an opinion, to taking action on their own hands. Maps are a place where local day-to-day knowledge and other types of information hold the same weight. Maps can be the bridge between these two areas, becoming an instrument of power, no longer just reserved to professionals, but to bring different ideas together, create mutual understanding and work for a common goal.
Identifying problems
Participatory city
Mapping: People/Places/Resources
Brainstorming/Discussing
Acting!
Promoting new practices in mapping can achieve a city with more active participation from its users. Different forms of mapping make it more accessible for a new public to approach the discussion, therefore making the city more democratic. Citizen involvement can give a fresh perspective and inspire new proposals!
Britton, Tessy. “An illustrated guide to the participatory city”
commitment & responsibility
Decision-makers
Citizens
MappingWorkshops
InterventionsParticipation

5756
Moving from informality to formalityGathering and registering information can help formalize and
legitimize certain conditions that higher institutions may be unaware of. Maps can help get recognition of land use, divisions of territories
or locations of communities because it makes them visible and understandable by all.
Evidence based advocacyTransforming qualitative information into quantitative accumulative
data will have more weigh in discussions with decision makers. Having the necessary information to be able to understand the
challenges and opportunities of a places with evidence rather than opinions becomes a very valuable tool.
Generating alternative proposalsCounter mapping can stop projects that don’t align with the
community’s priorities, and shed a light on real issues or concerns from the perspective of the day to day users. Maps can be used as a tool of
analysis and also for presenting a new proposal.
Creating community cohesion and confidenceThe mapping process can generate interaction between different
members of a community united through a common interest. Being able to gather information about their own environment empowers
citizens and gives them confidence to demand their needs and challenge the decision-makers views.
WHY IS MAPPING USEFUL ?
Building relationshipsSpeaking a common language between governmental institutions, developers, investors and citizens is key for productive discussions
that can lead to a consensus. Participatory mapping practices brings all sides of the discussion together to gather information and knowledge
about a place.
Filling the information gapsNew perspectives can be obtained when more people are included in the gathering of information. Mobile surveys, web based services and workshops target different groups of people, adding to the database of
information used for planning decisions.
Record and archive local knowledgeCities are always changing and so information is modified and
increased every day. Creating maps and databases on different themes generates a record on the evolution of the city. It is important to update
the information as constantly as possible; partnering with locals can help make this task easier.
SpatialPrecise
Comprehensive
SOCIALACCURATE
REPRESENTATIVE

5958
Map made by children showing their perception of the Slum they live in. Humara Bachpan, India.Shelter Associates Slum Mapping Project in Pune, India.
Using different kinds of information acquisition methods and representation techniques can result in different kinds of maps, each of which can display facts in a unique way.For example, to the left, two very different ways of mapping the same area. In the top image, children represent their spaces as they can recall from memories and what they wish was present in their neighborhoods. This can inform planners of the children’s concerns and wishes and direct planning efforts in directions that would achieve those goals.In the bottom image, a map of Pune,
India can be seen, with the additions made by the Shelter Associates Slum Mapping Project. Before satellite imagery was available, slums were often dismissed and hidden in official papers, making it hard to generate a comprehensive understanding of the conditions and needs of the people living in them. With the help of new technology, it has been possible for institutions and volunteers to map slum areas accurately, determining their size, structure and location within the city. This has made it easier to create discussions about the conditions and needs of this communities.

6160
Mapping is a wide concept, as everything can be mapped: population, density, pollution levels, streets, buildings, green areas, location of tweets, location of photographs uploaded to social media, natural disasters, risk areas, perception of safety, memories and histories, etc. However, the information is not the only important thing in maps. The actual process in which information was acquired plays a big role too. Was it done by professionals? Was it done by the community? Who was invited to participate? Is the information accurate? All of this questions can influence the output of information.
Equally important, is what happens to the information after it is gathered. How is it being displayed? Who is going to process it? Who will have access to it in the future? How is it going to be used by others?
The mapping process is constituted then, by three main steps: data acquisition, data processing and data analysis and discussion. Ideally, every step of the mapping process should be done with active participation of different actors, to create a dialogue and an analysis from every perspective possible.
Before
Maps as end products maps as part of a process
Now
As a process, mapping cannot be linear, but done multiple times as a way of ensuring the gathering of as much accurate, inclusive and diverse information as possible. Once the first round of mapping is done, the group must ask themselves: Is the information we gathered enough to understand the task at hand? Is the dataset reflecting reality or a biased view? Do we need to gather different types of data to complement what we have?The feedback session will decide whether to go back to the field, or try to use the information gathered in different
DATA COLLECTION NEGOTIATION
ways, to try to discover new trends or linkages. This is all part of the process and will generate a higher level of understanding for all parts involved, at the time that discussions are generated and ideas are nurtured. In a participatory mapping process citizens, institutions, investors and planners all have access to the tools and platforms that will allow them to voice their concerns, but most importantly, have contact with each other while they do it! Citizens benefit from professionals by acquiring new tools and abilities, while professionals benefit from citizens by having access to specific information.


6564
INFORMATION types & sourcesCensus
VGI
Remote Sensing
Government Sources
Local Observers
Google Maps
Open Street View
QGIS
Google Sketchup
Traditional Urban Data
Open Urban Data
Online Infrastructure
Open Source Software
Adapted from The logic-model. Chakraborty, A.(2015)
Visualization Capacityinformationengagement
factsnew perspectives
Discoveriesnew abilities
linksparticipationinspiration
counter-mapsproposals
new actors
Analysis
Discussions

6766
Why do we want a map?
What do we want to show in the map?
What is the most relevant information?
What additional information do we need to gather?
What will be its short and long term use?
Who should be involved in the creation of the map?
How will the map be displayed or published in the end?
DEFINING THE OBJECTIVE OF A MAP
Is the map displaying all relevant information?
Should there be more information included?
Is everything accurate?
Where the sources of information trustworthy?
What is the most important information represented?
Would results vary if we show the information in a different way?
What conclusions can we draw from the map?
EVALUATING THE MAP
Adapted from Good Practices in Participatory Mapping. International Fund for Agricultural
Development. (2009)

6968
-Ground work research-Gathering existing maps
-Advertising the event-Gathering materials
needed for work (markers, flue, tape, etc.)
-Introducing the people present and their role
-Presenting the methodology
-Explaining the issue to discuss
-Answering any questions
-Gather in small multidisciplinary groups-Provide a good working environment and tools
-Go outside and explore if needed
Mapping Workshop
-Each group presents their conclusions
-Everyone comments on good ideas or things to
reconsider-Conclusion
A mapping workshop is an activity that takes places on one day as part of a participatory mapping exercise. It can happen in the offices of the municipality or the planning department, or in a public gathering place where it is accessible to the inhabitants of the place. It must include participation of different stakeholders such as the developers, the government, local shop owners, residents and any other interested parties. The objective of the mapping exercise is to evaluate the conditions of a place and propose ideas on how to change or improve it. Dialogue is key!

Images from a participatory mapping session at KTH University and Skärholmen Centrum, Stockholm.

Best Places Map
A best places map is useful to quickly identify what people perceive in the area of analysis. The easiest method is to use colors, for example: green dots for the areas that are good, where people like to hang out or are iconic in the neighborhood. Yellow is used for places that have potential for
--Place a map of the area in a large board in a public
place or office-Provide markers or stickers for people to
intervene the maps
-Create a platform on the city’s website to comment
over a map of an area-Ask for extra information
such as gender, age, occupation to gather even more information about
the users
improvement and red is used for places that are problematic or dangerous. In the end, the map shows the accumulation of all individual entries, making it easy to locate problematic clusters or the best areas in the neighborhood according to the participants. The next step would be to use this information for action!
Students locating the best and worst places at KTH Campus during an mapping workshop.

7574
-Provide a drawing surface and different materials
(colors, stickers)-Give out instructions
(draw the route from home to work; draw your favorite places in the neighborhood)
Cognitive Maps
-Each participant creates their own map
-Encourage the use of memories, perceptions and
landmarks-Notes that describe
particular situations help gather more information
A mapping workshop is an activity that takes places on one day as part of a participatory mapping exercise. It can happen in the offices of the municipality or the planning department, or in a public gathering place where it is accessible to the inhabitants of the place. It must include participation of different stakeholders such as the developers, the government, local shop owners, residents and any other interested parties. The objective of the mapping exercise is to evaluate the conditions of a place and propose ideas on how to change or improve it. Dialogue is key!
-Find trends comparing everyone’s maps: particular
locations that everyone finds iconic, routes most
taken, etc.-Discuss about perceptions and opinions each person
has of certain places

A series of Cognitive Maps of routes around KTH Campus done by the participants of KTH Placemaking Week.

7978
-Locate nodes & landmarks
-Notice changes in scale & size
-Note presence of green spaces
-Get an idea of land use & activities
Transect mapping
A transect mapping is done with a different kind of perspective than usual maps. By utilizing a cross section as a method of representation, new information can be shown: heights, streets, level differences, transitions. The first step is to determine what is going to be mapped, perhaps it would
-Analyze transitions between parts of the city
-Visualize height differences
-Include geographic features, land use and
zoning-Combine with maps and
plans
be interesting to notice the change in density or vegetation from the inner city to the outer suburbs, for example. Once determined, the group goes out and takes notes, photographs and sketches. Later, the information is gathered to create a comprehensive section of the place. Compare the section to the map!

Cross section analysis of Ahmadabad, India presented during Archiprix 2017.

8382
-Note the presence of trees, places to sit, outdoor
covered areas, etc.-Map the entrances to businesses and their
typology and opening hours
-Map where people sit, stand, eat, meet, talk, etc.
-Note gender & age of people at the space
-Make observations on curious uses of the space
Public space map
A public space map aims to understand the relationship between the physical characteristics of the place, with the activities that take place in it, its liveliness and the overall spatial quality.Making observations of the entrances to buildings, the amount of shops and their opening hours, the facades (transparent or covered), we can start making conclusions of the overall amount of activities and life that occurs on a public space. Then, by adding observations of what people do, where they choose to sit, etc. we can complement the information. Try observing at different times and notice the differences!
-Transfer all the information into one map
and if possible to a GIS table to be able to use the information in different
ways-Create correlations
between what people do and how the space is

A series of maps analyzing Skärholmen Square, Stockholm. Spacescape (2017)

8786
-Create a model with topographical details and
context buildings-Provide Pins (for points)
strings (for lines) and paint (for areas) to let participants
modify the model-Provide scale models of
proposals to move around the model & visualize different
scenarios.
Physical 3D-Modelling
Building a 3D model of the site can be very useful, especially when trying out different scenarios of a project. Participants can move around and place the pieces in different places, while discussing the effects of their decisions and visualizing them in real time. It is especially useful when dealing with
3D-Model workshop in Kiruna with KTH and Luleå University.
people who don’t have experience with plans. Seeing the model in all dimensions can also help in viewing different perspectives. It is a very interactive tool that allows to play around with different alternatives. Be sure to take pictures of the process and to register the changes made and the final product!

Workshop with inhabitants of Khayelitsha, South Africa by Urban Think Tank 2014. Design Indaba


Commitment to communityExperts should act as guides through the participatory process,
answering any questions and transferring the necessary knowledge to the community. Allow the citizens to make their own decisions and
support their findings.
TransparencyDefine the roles of each stakeholder clearly and determine their tasks to avoid power inequalities. Display all information gathered during the workshops in a place accessible to all and keep information up to date. Record all the decisions and steps taken during the participatory
process for evaluation and feedback.
Respect for Community’s NeedsBe respectful of people’s opinions and always trust on their judgment.
Many times professionals can be unaware of issues that affect the locals in a different way. Build consensus between the goals of
different stakeholders through productive discussions.
InclusivenessMake sure to extend the opportunity for participation to as many people as possible. Consider groups such as women, children and
elderly and create activities specialized for them to get all the perspectives. Hold events in the community, create surveys on-line, create a suggestion box or an email address. The more ways people
have to join the conversation the better.
RecommendationsAwareness of Limitations
Be aware of the limitations of the information gathered through a workshop or a mapping activity. There are certain things that could have escaped the observers and may call for a different type of analysis. Remember that this tools should be a complement to traditional information and more formal
techniques of analysis.
Be ready to start againThere city is always growing and changing, new projects will call for a new set of observations, the inclusion of new partners and the need for new data. Learn from past experiences, create a network of contacts and have fun on
your new project!

data gathering and mappingcreate short and long term plans
new abi
lities
and co
nnect
ions
setting a framework
knowledge sources
awareness campaigns
visualize development
capacity building
establish links
participatory practicesmultiple actors
From the definition of a problem, to the evaluation and feedback of a proposal, the participatory process relies on accurate information, active involvement of different actors, transparency and publication of information It is important to create linkages between the people involve, to strengthen the relationships outside of the project and create possibilities for new ideas in the future. The projects that are product of this process should also reflect the ideas of participation and community involvement. On the next page, some ideas are illustrated.

Bike repair stations
Urban Farming
?WHAT’S NEXT
Public tool sharing
Renewable energy systems
Tree Planting
Connectivity plans between city areas
Recycling Stations
Green Houses
Lange use change (variety)

9998
MAPPING MEXICO CITY

101
RE-IMAGINING MEXICO CITY
The way a city is portrayed, through images, pictures, texts or maps, has a great influence on how people perceive and understand it. In the case of Mexico City, a metropolis of more than 20 million inhabitants, creating visualizations of its complex dynamics can be challenging. Especially when dealing with urban problems, it is more relevant than ever to have updated and comprehensive information and to make it available for everyone to study. A city with so many inhabitants, generates a huge amount of information every day, information useful for planners, who need to understand how the city works at a ground level. However, planning is
still very much based on 1980’s zoning maps, without a deeper understanding of social, ecological and political issues (Leal 2013). Development plans are published as long documents and rigid plans, hard to interpret and hard to use as a tool for knowledge and exploration.However, in recent years grassroots organizations, bottom-up projects and researchers have taken to the task of registering new types of information. Mapping workshops, on-line databases, GIS maps, VGI, all provide a different perspective on the city to the formal and institutionalized one that planners have today. How does the city look like under this new light? What can we learn?

103102
Mexico City was founded on an image: the image of an eagle devouring a snake while standing on a cactus. Early representations of the City have a central point on this symbolic location. Ever since, the image of the city has been shaped by religious, social and political ideologies. I will present the history of the city through the maps that shaped it, from the indigenous capital to the modern city: with its highways, skyscrapers, ruins, markets, chaos and beauty. Studying the cartographic material that has been used to define territories can tell a lot about the way the city has evolved, and how it is now.
Even though in older maps there were representations of power hierarchies, culture and social visions, modern representations of the city tend to be limited to the purely physical realm. City plans show the streets, buildings, topography, and those used by planners and architects, land use divisions. But what about all the other factors that make up this very complex city? A city cannot be reduced merely to its material form, but must be understood through all aspects of life that take place in it. How can social, environmental, political and economical issues be part of the representation of the city?
MAPS AND THE CITY
In this section, I will present those kind of alternative maps. Maps that portray themes as diverse as crime, environmental risk, gentrification biking infrastructure, public transport and individual experiences and perceptions of the city. They are only a section of the multiple mapping efforts that are taking place about the city, but with them we can understand the potential of gathering information in innovative ways and through different means and participants.
The projects will be presented with a short description on their objective and methodology. Then, they will be classified in terms of participation level (did they involve the active participation of the population or were they done using information that was already available?). The maps will also be judge on whether they served as a tool for empowerment in their making or as a result of them. Empowerment will be defined in three categories: capacity building, procedural change and distributive change. I will make comments and conclusions as of how the information acquired could be useful for different types of analysis or what further steps could be taken with each project.
Last, a series of maps will be presented utilizing information from the projects analyzed and data available publicly through different official sites in order to give an example of how we can use the different sources of information, overlap and intersect them in order to generate a new understanding of Mexico City.
The future of cartography for Mexico City is an exciting one, information is widely available and the city’s politics on transparency makes it easy to access new data. However, it will always be the inhabitants who will know exactly how a place works, and that is why participatory practices must continue to take place at all levels of planning. Could it be possible that all 22 million inhabitants of the city became a source of information? How many new facts would be uncovered!
I see maps as the start of a conversation, in them you can identify trends, understand processes and imagine multiple possibilities. Mexico City will continue to grow, and its complex culture, history, geographical conditions and social dynamics will generate new linkages that make it work. It is an exciting process to discover the patterns of our life in the city, and I believe maps are a crucial element in this adventure!

105104

107106
COGNITIVE MAPS
A cognitive map represents the images that a person associates with information and places. In the case of the Mental Maps study developed by de Alba, citizens of Mexico City drew what in their mind, were the key elements to recognize the city. The objective of the study was to understand which elements and spaces of the city play an important role in its citizens imaginary. The study confirmed that spaces of the city are linked to history, tradition and memories of people, and this gives them importance as constitutive elements. Neighborhoods, monuments, historical sites, all form a city’s identity.
Mental Maps: Psychosocial study of spatial representations.Martha de Alba 2004.
60 participants between the ages of 25 and 50 living in different parts of the city and with diverse socio-economic status, were asked to draw on a blank sheet of paper the image of Mexico City as they remembered it. The participants’ experiences and relationships to certain places each of their maps. However, when comparing the maps certain trends where noticeable: infrastructures such as highways and main streets were predominant in the participant’s images. Important elements like parks, squares, monuments, and institutions such as universities and museums were the main landmarks identified by the users.
Participation Level:
8. Citizen control7. Delegated power6. Partnership5. Placation4. Consultation3. Informing2. Therapy1. Manipulation
Empowerment:
1. Distributive change2. Procedural change3. Capacity Building
It could be interesting to use these kind of maps to identify places that are important as cultural and social landmarks, but also areas of the city that are forgotten about and not represented. Especially in Mexico City, rapid urbanization has created monotonous development in the outskirts of the city, with no significant public spaces, cultural and social infrastructures. If we can identify areas that hold high value in the population’s minds, we can identify as well the elements that cause this. Then we can think of how to create these kind of attachments and values in relegated neighborhoods too.
Most mentioned places in the cognitive maps

109108
Mental Maps: Psychosocial study of spatial representations.Martha de Alba 2004.
Mental Maps: Psychosocial study of spatial representations.Martha de Alba 2004.

111110
COLLECTIVE MAPPING
Iconoclasistas, a mapping collective with work in Latin America, collaborated with Casa Gallina, a community organization in Santa María La Ribera, Mexico City to create maps of the neighborhood. During the workshop, there were several different approximations to the territory from observations to interviews, in order to understand the context from every angle. The workshop had the objective of involving the neighbors from the area in discovering their places and generating bonds between them. After the workshop, a publication of results was made and distributed in the neighborhood to share the information.
Iconoclasistas Workshop in Santa María La Ribera (2015).
The information was gathered by the participants of the workshop using different methodologies. Some maps were generated individually, noting perceptions of smells, sounds, safety and other individual notes and then comparing them to the group to create a collective imaginary of the area. A second set of maps were done through observations regarding specific themes, mostly focused on the informal use of public space: markets, social spaces, shelters, religion, etc. A final set of maps was done through interviews of the users of public space, locating nodes, landmarks and problematic areas.
Participation Level:
8. Citizen control7. Delegated power6. Partnership5. Placation4. Consultation3. Informing2. Therapy1. Manipulation
Empowerment:
1. Distributive change2. Procedural change3. Capacity Building
This kind of exercise empowers the citizens, as they take active part on gathering information of their surroundings, building their capacities and improving the knowledge on the needs and potentials of their neighborhood. An interesting map done was the informal of uses of public space, showing that there are activities that can’t be defined by formal rules or documents displaying land use. In Mexico City, informal commerce makes up an important part of the activities that happen in public space, and a mapping of its location and distribution in the city gives a new perspective on it.

113112

115114
CO-MAPP
The project aims to understand the conditions of informal settlements around Mexico City, located in areas of risk. The information gathered in the mapping process aims to be used as input for a resilience and empowerment strategy. Members of the targeted communities, together with volunteers from NGO’s and governmental officials, create maps that show services, streets, threats and risks in their environment. The communities often are formed by low income families, with little possibility to generate change. The partnerships and data gathered aim to raise their voices and create change.
Participatory Mapping and Risk Analysis.TECHO, Codeando, Observatorio del Derecho a la Vivienda (2016).
The mapping is done in two different stages and are complemented with a series of workshops and interview sessions with the communities in order to get a deeper understanding of the conditions they live in. Part of the map is made using drones, which take photographs of the territory, making it easy to visualize the location of settlements, hazards and other characteristics. On the ground, the citizens use Co-mapp on a mobile device, to gather information in walks and workshops mapping businesses, access, services, streets, vulnerable areas and community spaces. Afterwards the information is gathered and compared.
Participation Level:
8. Citizen control7. Delegated power6. Partnership5. Placation4. Consultation3. Informing2. Therapy1. Manipulation
Empowerment:
1. Distributive change2. Procedural change3. Capacity Building
The key strategy this project used for its success was the alliance generated with different groups that had the power to target the communities in need and make the results available to decision-makers. The information gathered about informal settlements can be used for programs of formalization, infrastructure and development plans. During the workshops, the inhabitants also gain knowledge about their own community and are made aware about its problems and potentials, empowering them to use this information to demand change or generate their own projects. Them and their needs, are made visible.

117116
PLAN CDMXParticipatory Process
The Urban Development Office of Mexico City presented a new plan for the city, and as part of their principles, included the importance of participatory practices. The office states that as a goal, the city must become a territory of equality where everyone has access to services and public space, and everyone has the right to participate on the policy making process. The participants would be able to interact with the officials in different platforms and at different levels, from consultation via surveys or access to information in public conferences, to active participation in workshops or online mapping.
Urban Development Office of Mexico City, SEDUVI(2016-2017).
The plan had support from 2,226 volunteers in the planning and architecture field, 878 different organization and 13 government institutions. Through 101 workshops, 4 conferences, 17 mobile bus information sessions, an interactive on-line map and 50 interviews with stakeholders, the city aimed to reach as many participants as possible. Issues such as connectivity, neighborhood identity, public spaces, culture, economy and sustainability were the main topics. There were workshops targeted to children, woman, and people with disabilities, to bring those voices to the discussion.
Participation Level:
8. Citizen control7. Delegated power6. Partnership5. Placation4. Consultation3. Informing2. Therapy1. Manipulation
Empowerment:
1. Distributive change2. Procedural change3. Capacity Building
The project was successful in attracting people to participate The various contact points between the city and the citizens were crucial in making the process inclusive and diverse. The development plan that resulted of this participatory process is published on-line, along with maps that show the areas of action and the projects that will be developed. The policy documents and official maps are too technical for the general public to understand, limiting the participation of the public to the process but not to feedback or future interaction. It is also not clear how the citizen’s opinions impacted the plan.

119118
ESTADO DE MORELOS
ESTADO DE MÉXICO
Áreas con Potencial de Mejoramiento
Mercados Público
Espacios Públicos
Área de Valor Ambiental (AVA)
Estaciones de Transporte Público
MEJORAMIENTO
Suelo Urbano
Suelo de Conservación
Límite Suelo de Conservación
Son zonas con usos del suelo predominantemente habitacionales, con carencias de infraestructura de agua potable, drenaje y acantarillado, una inadecuada integración de servicios y equipamientos. En su mayoría presentan problemas de movilidad, debido a que no cuentan o están alejadas del sistema de transporte público estructurado, prevalecen actividades económicas de bajo valor agregado y algunas presentan vulnerabilidad ante riesgos y un deterioro del medio ambiente.
Su objetivo es reforzar la habitabilidad de pueblosy barrios originarios,colonias populares, unidades y conjuntoshabitacionales.
0 52.5 10 Km
N

121120
#CALLES VIOLENTAS
The project has as an objective to understand the experience of the city in terms of safety from a female perspective. It is based on the concerns that women in Mexico City face different levels of violence every day, and it is important to detect the places and conditions that generate fear or promote a dangerous environment. The discoveries made in the study are then uploaded to a public platform for free consultation, with the objective that planners, researchers and others could use this information to generate strategies to prevent crime and increase security in the city. The project also is continuously updated.
OpenStreetMap Mexico & Repubikla2017.
The mapping exercise consists on individual or group walks through public spaces, tagging places that are perceived as insecure along the way. Participants could also upload Geo-tagged pictures and audio files to describe more accurately their environment and their perceptions of it. The data is recorded using mobile phones (with the app Mapillary) and then linked to a web platform were the results are accumulated. The project itself involved a collaboration between the local government, security forces, UN Women and grass-roots organizations.
Participation Level:
8. Citizen control7. Delegated power6. Partnership5. Placation4. Consultation3. Informing2. Therapy1. Manipulation
Empowerment:
1. Distributive change2. Procedural change3. Capacity Building
The fact that the project was done as a collaboration of various actors is a huge success, as it demonstrates interest by decision makers in the type of information that individuals can collect. The information is also available to consult on a web platform, where it is easy to follow the routes mapped along with pictures and any other descriptions. However, next steps would be to create thematic maps out of the routes. Which were the routes that felt most unsafe or reported more incidents? Doing those kind of analysis would take this exercise from being a tool of analysis to being a tool for proposals.

123122
MAPEATON
The objective of this map series done by NGO Repubikla, was to evaluate the accessibility of Mexico City’s street. It is a dynamic and permanent activity that is continuously updating in order to generate a larger database. Mapeaton, from the Spanish, “mapa” (map) and “peatón” (pedestrian), registers anything in the streets that could make them dangerous or prevent the ease of access. The concept is that everyone should be able to use the street, no matter the age, whether you have some kind of physical disability or are a mother pushing a pram. The resulting data is published on an on-line map for open consultation.
OpenStreetMap Mexico & Repubikla2016.
The mapping can be done by anyone who wishes to participate by using the app Mapillary linked with OpenStreetMap. Using a mobile device the users must take pictures of the problems they find along their way, which will be geo-referenced and uploaded into the collective map. The images create evidence of lack of maintenance and accessibility, and are a tool that can be used to claim renovation projects or other solutions from the local authorities. The project started with workshops and activities for volunteers to start with the mapping process. 8500 images and 60km have been covered to date and more are uploaded every day.
Participation Level:
8. Citizen control7. Delegated power6. Partnership5. Placation4. Consultation3. Informing2. Therapy1. Manipulation
Empowerment:
1. Distributive change2. Procedural change3. Capacity Building
The project started in Mexico City, and has expanded to other cities around the country, as a way for citizens to show the issues that are often ignored by the local authorities, but that users have to deal with every day. During the workshops, people in wheelchairs, crutches and other impediments, were invited to participate. The project gives a voice to members of the city for whom a good quality for mobility and accessibility are the most important, and therefore they are the most affected by problems. The next step would be to follow through with collaborative plans for restoration and maintenance with those in charge.

125124

127126

129128
BIKE & PEDESTRIAN MORTALITY
Repubikla generated a set of maps that displayed the locations of pedestrian and bicycle accidents. The maps are made out of citizen reports or accidents registered in the local police reports. These maps aim to give visibility to the issues that concern certain users of the city who are often not considered, since the City places a larger concern on motorized transportation. The lack of a proper street safety culture and the limited biking infrastructure lead to hundreds of accidents every year, which with the right actions, could be prevented. The maps also contain information about routes and users.
Repubikla 2015.
The information is acquired in two ways. The first, are reports by volunteers, done with a mobile app, where they can register accidents they witness and geo-tag them. The users are also encouraged to share their own cycling route in order to generate a database on the most used streets in the city. Another set of information is gathered from police reports or news that registered an incident, and placed in the common map by the administrators. The map then shows a classification of pedestrian accidents, bike accidents and also those accidents that resulted in death. The goal is to use the data to create safer streets.
Participation Level:
8. Citizen control7. Delegated power6. Partnership5. Placation4. Consultation3. Informing2. Therapy1. Manipulation
Empowerment:
1. Distributive change2. Procedural change3. Capacity Building
The project has now generated partnerships with different groups that could help solve the problem of safety in the streets. For example, with Cenfes A.C. they are working on workshops that make public transport drivers aware about safe driving. With CONAPRA the information is being standardized and published in official documents. There are also mapping workshops done with community groups and universities, that help gather more data about citizens’ mobility through the city and its risks. The project is an example of how to go from mapping to generating action in the City by involving multiple actors.

131130

133132
CRIMEN POR TU RUMBO
Crimen por tu Rumbo is an individual initiative to make information more accessible and understandable by the wider public. It is a map of Mexico City, where you can see all the reports of crime of different types (murder, assault to pedestrians, car theft, crime in a public transport, rape, etc.) in a unified map, making it easy to locate the areas of the city that are more affected by this issues. Users of the map can explore places in the city they know, and be more aware of the areas that are potentially dangerous. The maps could also be used by authorities and professionals concerned with safety in the city.
Diego Valle Jones.
The information displayed was obtained by a private request for information from the safety department of the city (SSPDF) and were last updated in 2013. Other statistical data was obtained through the publicly available information from the 2010 census. Each point in the map represents a crime and is located in the exact place it took place. The maps are complemented by a series of graphs and tables that analyze the data by type, incidence, presence of violence and can be compared by neighborhood. In the website all information can be downloaded and shared. This way the data can get to as many as possible.
Participation Level:
8. Citizen control7. Delegated power6. Partnership5. Placation4. Consultation3. Informing2. Therapy1. Manipulation
Empowerment:
1. Distributive change2. Procedural change3. Capacity Building
The first objective of the map was to display the problematic areas of the city in order to aid citizens in certain decisions concerning their safety. Where are the places I should avoid at night? Where is it not safe to park my car, because there is a possibility it gets stolen? Where is it best to open a business? However, it is important that the authorities also take into account this information, in order to identify criminal groups and to generate strategies to improve the safety in the city. Even though informed citizens can take actions for their own safety, the authorities are the ones responsible of generating a good city life quality.

135134

137136
MAPATÓN CDMX
Public transportation in Mexico City occurs in its majority, in informal vehicles, operating around the city and metropolitan area through different routes and schedules. The size and complexity of the transport network makes it difficult to manage, use and understand. Mapatón was an initiative to let the users of public transport map the routes they frequented, in order to generate a database of all the routes that existed in the city. The information would benefit the users of the transport, who would have a clearer understanding of how it works, but also city officials in terms of planning, safety and mobility.
CTS Embarq, ITDP Mexico, Laboratorio para la Ciudad (2016).
The mapping process worked as a game. Users could map on their own or create teams, and every route they successfully mapped would generate points. At the end of the period of mapping (1 month), those people with the most points would receive different prizes. The users had to register the start and end point of their journey, take a picture of the route name on the bus and if possible, also point out the stops made. The information gathered was then processed by volunteers from universities and professionals, and published for open consultation on a web map and as downloadable data.
Participation Level:
8. Citizen control7. Delegated power6. Partnership5. Placation4. Consultation3. Informing2. Therapy1. Manipulation
Empowerment:
1. Distributive change2. Procedural change3. Capacity Building
The information gathered through the crowdsourced methodology resulted in deeper knowledge of the complex network of informal public transport. After analyzing the information, many of the routes were not valid and not always accurate, which limited the fidelity of the exercise. However, more than 600 valid routes were mapped, from which interesting information such as travel time, travel distance, travel cost and most popular routes, could be discovered. It was an important example on how the government can partner with the citizens in order to generate a database that could benefit everyone.

139138

141140
TOWARDS A WATER SENSITIVE MEXICO CITY
This mapping and analysis project was done as a collaboration between the urban development office in Mexico City and Dutch firm De Urbanisten. The objective was to bring professionals in urbanism and architecture to rethink how Mexico City could deal with its water infrastructure. Having been built on top of a lake and with a population of over 20 million, the city faces multiple issues of water distribution, storage and flood and sinking risks. It is very important for the City to generate a strategy for the environmental issues of the city, but also ensure water quality for its citizens.
De Urbanisten, Autoridad del Espacio Público, 100 Resilient Cities, Netherlands Embassy Mexico City, (2016).
The project was developed in a series of steps, each with different actors involved. The first step was the gathering and presentation of information on Mexico City and its hydrological conditions, both natural and man made. This was done using data collected by various governmental institutions and displayed in maps of the city. The second part of the project was a series of workshops between the urbanists from Mexico and the Netherlands, brainstorming about problems and solutions. Lastly, De Urbanisten delivered a report with suggested projects and strategies to implement in future development plans.
Participation Level:
8. Citizen control7. Delegated power6. Partnership5. Placation4. Consultation3. Informing2. Therapy1. Manipulation
Empowerment:
1. Distributive change2. Procedural change3. Capacity Building
This mapping exercise didn’t include the active participation of the citizens, but was nonetheless a participatory experience. Teams of different professionals joined forces to gather information, map and discuss ideas, using each of their experiences and strengths to create a comprehensive hydrological plan. The resulting report was published and is available on-line. It contains all the information and research used during the discussions as well as the proposed projects and the overall suggestions done by the urbanism teams. Other professionals could use it for their own projects too!

143142

145144
VGI MAPS
Another kind of maps are those generated by mapping the accumulation of points registered in a specific activity. With social media and mobile devices with geo-tagging apps, it is possible to visualize different kinds of information and detect new trends. For example, the maps generated by analyzing tweets can let us know about internet use and where it concentrates in the city.The maps generated by Uber show the routes used by their users. This could tell something about the kind of user that uses uber: with access to a credit card and a smartphone, and what areas of the city do they occupy.
Uber, Twitter, GNIP, MapBox
The information for this kind of maps is classified as Volunteered Geographic Information VGI, and even though it is not a form of active participation, it does rely on information generated by users, and thus reflects a precise and unique perspective of the city. VGI has the potential of generating large amounts of information that can help identify larger urban trends. Who is doing what and where? This question becomes easy to answer where users are constantly registering their location on places, uploading and tagging pictures and commenting and rating places online.
Participation Level:
8. Citizen control7. Delegated power6. Partnership5. Placation4. Consultation3. Informing2. Therapy1. Manipulation
Empowerment:
1. Distributive change2. Procedural change3. Capacity Building
This kind of maps have a huge potential, I think it is important to rethink how urban professionals could use VGI to generate useful information for their projects. What about using information of the best rated locations on a tourism webpage to understand which places in the city are the most visited and iconic? Or perhaps generating a 3D model of the city by gathering the pictures uploaded to social media? (such as the VarCity project developed by ETH Zürich). With the development of technology and the huge amount of data found online, it will be interesting to see how we can rethink our cities.

147146

149148
MAPPING PRACTICES: WHAT’S NEXT?
A city so big and so diverse was bound to produce a great amount of people interested in mapping information about it. The projects mentioned in this document are only few of many mapping initiatives around the city. From those done by individuals, those organized by NGO’s to the participatory practices promoted by the city, all of them are a step into creating a more inclusive and democratic city. Most of the projects generated empowerment through capacity building, generally by developing people’s skills and knowledge about their communities. Some of the projects generated empowerment through procedural
change. For example, the efforts from the planning office to include the citizens’ feedback for generating a new plan is a way of working unprecedented in the city. However, in most of the projects, once the mapping was over, even when it unveiled interesting discoveries, there was no distributive change. There is a lack of connection between bottom-up events and the actors that can make change possible. However, data created by citizens is evolving and becoming more available for everyone. This hopefully will encourage planners, architects and decision-makers to use consult it and use it as a tool that is as important as other types of data.
The following maps will present the potential of utilizing the information acquired in participatory mapping exercises in combination with information already available through GIS data from governmental sites. They are examples of how we can use the data generated in one project, to understand another. I will overlap the information from some of the examples of mapping previously presented with other information which I consider would be relevant to portray an issue or start a conversation about the dynamics of the city. In the future it would be interesting to keep making maps with overlapping layers and rediscover the city each time.

151150
LOW
VERY HIGH
MARGINALIZATION LEVEL
WORKSHOP FOR CHILDREN
WORKSHOP
URBAN DEVELOPMENT OFFICEPUBLIC CONFERENCE
WHO IS INVITED TO
PARTICIPATE?
This maps represents the locations where workshops and conferences organized by the public development office took place, regarding the development of the new urban plan. In the background are the neighborhoods classified by marginalization level from low to high. Marginalized means places without access to basic infrastructure,education, income sources, health services and culture and public spaces. We can see participation was targeted to areas of the city in the higher spectrum, however, many areas were still under-served.

153152
CITIZENS
CULTURAL/SOCIALORGANIZATION
GOVERNMENT
INITIATIVES BY:
LOW
VERY HIGH
MARGINALIZATION LEVEL
WHO IS INNOVATING
THE CITY?
This maps portrays the location of governmental, NGO or citizen initiatives that are working on projects and proposals for a more inclusive, green, safe and fun city. The proposals were mapped in 2015 by VIC (Vivero de Iniciativas Ciudadanas). The themes of the projects are microurbanism, health, gender safety, education, culture, governance and collaborative economy. They are overlapped over the level of marginalization of neighborhoods to see if there are initiatives happening in the areas that need it the most!

155154
THEATERPARKS
COGNITIVE MAPSMOST MENTIONEDLOCATIONS
CULTURAL CENTREMUSEUMMAIN CITY SQUARESPORT CENTREAMUESEMENT PARKSQUAREUNIVERSITYAIRPORTMAIN MARKET
Basílica de Guadalupe
Chapultepec
Xochimilco
UNAM
City Center
Coyoacán
Zócalo
Bellas Artes
Alameda
Airport
Torre Latino
Cathedral
National Palace
Iztapalapa
Reforma
Periférico
WHICH ARE THE MOST ICONIC
SPACES OF THE CITY?
Results of the cognitive map study overlapped with public spaces and infrastructure in Mexico City. A cluster of spaces is located in the city center, showing the strong influence this area has on the inhabitant’s image of the city. Large green spaces and main streets are also iconic elements. Which areas of the city have not created any attachment with their inhabitants? The areas that have expanded to the north and east of the city, mostly residential, have nothing that identifies them, or any relevant infrastructure.

157156
FLOOD RISK AREAS
AREAS WITHCONSERVATION VALUE
Basílica de Guadalupe
Chapultepec
Xochimilco
UNAMCoyoacán
Zócalo
Bellas Artes
Alameda
Airport
Torre Latino
Cathedral
National Palace
Iztapalapa
ICONIC PLACES OFTHE CITY
ICONIC PLACES ATRISK
THE BIG FLOOD: WHO WILL BE
AFFECTED?
This map is made up of information from three different sources: the areas of flood risk defined by De Urbanisten, the areas with conservation value determined by the urban planning office of the city through participation workshops, and the places identified as icons of the city through a cognitive mapping study. The map shows which areas that are considered valuable as part of the culture and history of the city, by the government and the people, are located in risk areas. This information can inspire people to look for solutions to the City’s water issues.

159158
HIGH
LOW
ENVIORNMENTALEVALUATION POINT
COMMUNITY URBAN FARMS
GREEN AREAS
POLLUTION LEVELS
WHERE CAN WE ESCAPE SMOG
AND BREATH FRESH AIR?
This map displays the measurements of pollution levels registered on June 5th, 2017, showing which areas of the city present high levels on a summer day. On the other hand, we can see all the green public spaces that exist in the city, as well as the location of community urban farms (mapped by Cultiva Ciudad in 2014). The idea is that you can understand which areas of the city are green, and even better, productive as well, and could be an oasis in the middle of a city constantly affected by high levels of smog.

161160
SUBWAY AND RAIL LINES
OFFICIAL BUS ROUTES
MAPPED INFORMALTRANSPORT ROUTES
WHERE DOES PUBLIC
TRANSPORT GO?
This two maps show the public transport available in the city. The first one, is a map that portrays the subway, light rail trains and bus systems managed and mapped by the city government. The second map shows the routes mapped during Mapatón, the participatory VGI event that wished to create a more complete map of what public transport in Mexico City looks like. There a clear distinction between the routes portrayed in one map and the other. The next step would be to create a formalized map of the informal routes, to make them as easy to navigate as the formal options!

163162
0
221
SUBWAY LINES
REPORTED CRIMESWITHIN 200 MJANUARY-MARCH 2016
IS MY COMMUTE IN PUBLIC
TRANSPORT SAFE?
This maps show all the stations of the subway system in Mexico City ranked according to their safety. The information used for ranking was taken from a public database updated both by users and official sources, with all the reports of crimes in the city. I chose to represent specifically crimes that happened within 200 meters of each station and which were classified as: assault in the subway, assault in a bus, assault in a taxi and assault to a public transport driver. The data used for this map represents only the crime reported, which is much less than the actual figured, in the period of 2 months. One can start to locate clusters of stations that present more crime than others.

165164
URBAN AREA
NEIGHBORHOODS WITH HIGHEST INCOME AND LEAST MARGINALIZATION
REGISTEREDUBER ROUTES
WHERE DO UBER USERS
MOVE?
This map overlaps a map of routes registered with the UBER application in Mexico City, with the location of neighborhoods with the highest income and best access to services and public infrastructure. The two source of information are completely independents, one comes from the 2010 National Census and another from VGI gathered by a private organization. It is interesting to see how they overlap with each other almost exactly. The routes done by UBER users fall in their majority within the area of wealthier areas of the city. It is incredible how much the routes concentrate around a certain area of the city, while the rest is almost blank.
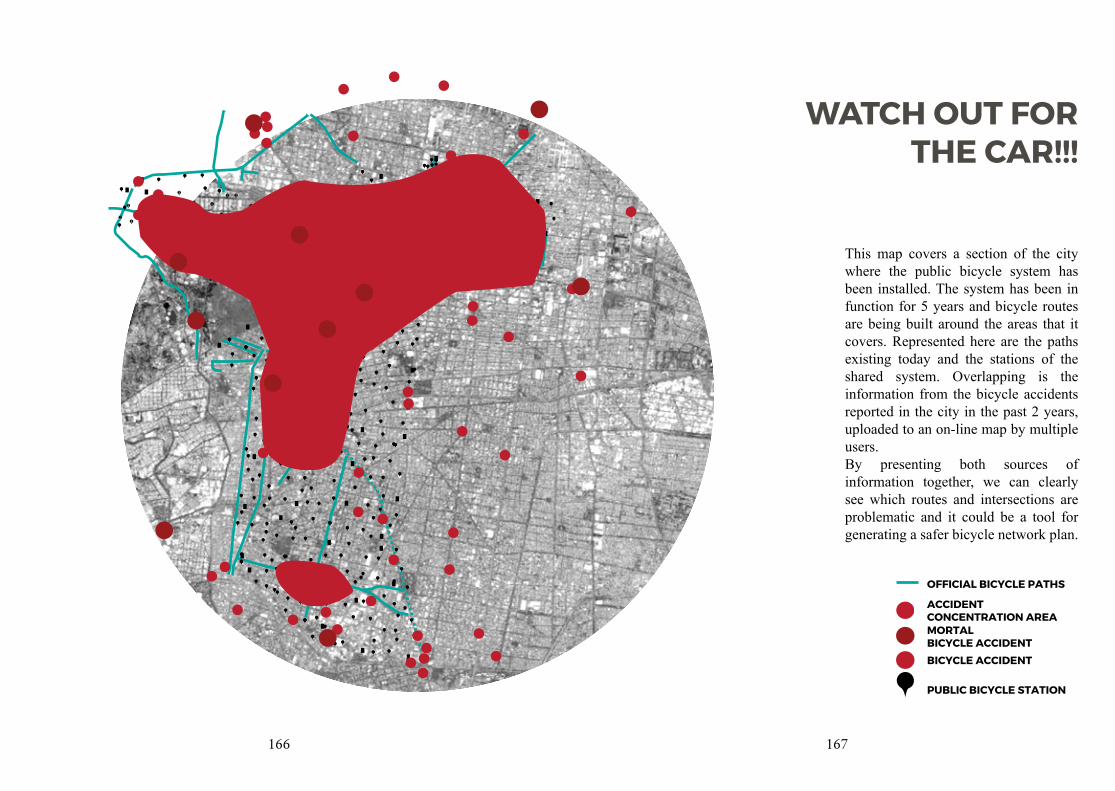
167166
PUBLIC BICYCLE STATION
ACCIDENT CONCENTRATION AREA
BICYCLE ACCIDENT
OFFICIAL BICYCLE PATHS
MORTALBICYCLE ACCIDENT
WATCH OUT FOR THE CAR!!!
This map covers a section of the city where the public bicycle system has been installed. The system has been in function for 5 years and bicycle routes are being built around the areas that it covers. Represented here are the paths existing today and the stations of the shared system. Overlapping is the information from the bicycle accidents reported in the city in the past 2 years, uploaded to an on-line map by multiple users.By presenting both sources of information together, we can clearly see which routes and intersections are problematic and it could be a tool for generating a safer bicycle network plan.

169
PARTICIPATORY MAPPING:
BEST PRACTICES
As an additional reference, I include different projects from around the world in which I believe, mapping and participation played an important role. From a way to organize a community to locating resources or gathering new data from unexpected places; all of these projects ventured out of the conventional planning practices to include new perspectives into the city-building process. The projects serve as example of the value of participation and the role mapping has in it. There are many more initiatives that are doing similar projects across the globe. This paints a very encouraging picture for the future of urbanism everywhere.

Stephen James Kennedy. Dhaka Bus Map.Helsinki Design Lab
171170
Brickstarter
Dan Hill and the Sitra group generated a website based on the Kickstarter concept (people can propose ideas and projects and then collect donations from interested people to make them possible), but focused on bottom-up suggestions for the improvement of the built environment. Using the website, groups can post their concerns and proposals, create fund-raising projects for their community and share their knowledge about a place. The website acts as an intermediary between the citizens and the institutions responsible for the
development of projects and encourages cooperation between them. Citizens can easily share their ideas through an app or social media and a groups of experts provide aid on the concrete design process (getting permits, generating a time-line, contacting relevant actors).
Dhaka’s Bus Map. Dhaka, Indonesia
In the City of Dhaka, public transportation is dominated by routes of informal buses, which made it very difficult for citizens to get around. Without a clear visualization and knowledge of the bus network, mobility was challenging, confusing and inaccessible for many. Urban Launchpad led the project and was joined by local volunteers and urban planners. Using mobile devices enabled with GPS, the volunteers mapped the route of each of the buses. When the mapping was complete, a bus route map, designed with the style of subway
maps across the world, was generated using the information provided by the volunteers. With the creation of a map of the entire bus network, commuters could discover new routes and have more freedom when navigating through the city.

173172
Green My Favela. Rio de Janeiro, Brazil
Green My Favela is a project created in 2013 that created a map of the garbage that was affecting the Rocinha favela. The project was led by Social Assistance and Human Rights Department of Rio de Janeiro. Using geo-tagged photographs, GMF, located garbage accumulation sites along Estrada da Gávea, the favela’s main street, and Rua Um. Along with the photographs, information was also gathered in the form of interviews with residents and trash collectors to inform on how to create a system of recycling in the area. The information gathered in the mapping exercise through the geo-located photographs, was used to establish potential sites for the location of recycling stations. The pictures and maps were also used as evidence with the government, in order to communicate accurately the problem with trash and to demand solutions. After the initial mapping process, some changes started to occur slowly. For example, Rocinha Cultural House, one of the points of garbage accumulation, was cleared and restored. Another case that was not so successful, was a playground, which had a problem of trash accumulation, although it gained attention and there were promises for a trash compactor in
the site, the playground was later paved over and converted into a designated garbage dump. However, the project did show a different understanding of a seemingly ubiquitous problem, giving information that had the potential of being used for a comprehensive waste management plan for the area.
Map Kibera. Nairobi, Kenya.
The Map Kibera project aims to generate a map and database of Africa’s largest slum. It is a map done collectively and composed by observations of spatial conditions but also subjective appreciations and opinions about space. It aims to represent the issues and opportunities of Kibera, and to help generate informed decisions about possible improvements. People from the community came together to gather information and are constantly updating and maintaining the website, creating a participatory process that not only
allows them to gain political power, but strengthens the links between members of the place.
Community Garden. Green my Favela.
Community Mapping. Map Kibera.

175174
Memory Traces. Boston, USA.
Memory Traces, a collaboration project between the MIT Mobile Experience Lab and the Italian Consulate using the LOCAST software, is a collection of stories specifically by the Italian community in Boston. Members of this community were invited to participate in the collection of memories of different categories such as education, family, work, food, etc. and linked the memories to a map of the city of Boston. The premise of the project was that smart cities are more than just big data and hard facts, but are also the knowledge and preservation of the rich historical and personal accounts of their inhabitants. The possibility of being able to learn more about the city through the generation of a collective memory, gives a new perspective on the spaces that conform it. The web-based map, allowed the participants to write their stories and link them to real places, but also connect them with additional media such as videos, music or photographs. The collected memories can be visualized in map or chronological form and divided by historical period, theme or location, allowing for different understandings of the same information. The entries could be made from a website or through a
mobile application, making it easy and accessible to anyone that wanted to take part on the exercise.The maps generated by this project show the potential of technology to reinforce the personal relationships and connection to a place, linking identity, culture and history to a geographical location, and being able to explore it through the eyes of different people.
MULTIMAP. Reginal W Park, Biosphere Reserve of W, Benin, Burkina Faso, Niger.
The MULTIMAP project aims to generate a data collection system about the territorial aspects of the Biosphere Reserve of W, shared by Benin, Burkina Faso and Niger. The project combined technological and technical perspectives using GIS generated maps with participative actions with the communities in the area through local thematic map generation. Between 2001 and 2004 a group of geographers conducted on-site research with the local population in order to collect information and produce maps that reflected the main findings. Surveys were conducted with the overall objective of understanding the social relations of villages in the area of the natural reserve and the way they used the resources in the area. Additionally to the physical characteristics and territorial boundaries of the reserve, the maps were complemented with local knowledge about the area and information of exploitation practices, and the local values assigned to nature by the inhabitants. Later on, the maps were translated into GIS format and published on a web platform, for public accessibility. The information
gathered through this mapping activity can be used in the future for evaluating management projects regarding the reserve, or to understand better the dynamics that take place between the villagers and their environment.
Memory Traces Website. Map of the Biosphere Reserve of W

177176
ScoreZe. Rotterdam, The Netherlands
ScoreZe is an app used by the citizens of the city of Rotterdam, that allows them to measure the quality of the city in location-based reports. It is a project by the Rotterdam Open Data Initiative that aims to give a voice to the citizens, and connect them directly to the officials responsible for the public spaces in the city. The users log problems they detect in public space such as lack of maintenance, and then the local municipality uses these reports to target the areas of the city where they need to allocate more resources and work
efforts. All of the information by the municipality remains open and available to all, in order to ensure transparency and to create an opportunity for the public sector to access the information and propose new ideas.
SoftGIS. Jarvenpaa, Finland. SoftGIS is a program launched in Jarvenpaa, Finland in 2004 based on questionnaires that captured the perceived quality of the environment in the city. It studied the local quality factors of the environment, socially important locations, used services and the perceived well-being of the users. It consisted on answering a series of questions in a web application related to certain locations, with aerial photos where one could highlight points of importance. All inhabitants could access the web-questionnaire. Later
on thematic SoftGIS surveys were conducted, focusing specific themes. The information gathered in this surveys is later processed and compared with other types of information, to get a better idea of everyday life and concerns from the perspective of the community. SoftGISchildren was later developed in the shape of an internet-based game, where children aged 9-15 could locate places that were meaningful to them, the routes they frequented and their perception on their well-being (Kahila 2009).
ScoreZe application screenshots. Local Knowledge Map.

179178
Water SMS. Malang and Makassar, Indonesia.
Water SMS is a project that uses a crowdsourcing platform that receives SMS from users of the municipal water delivery service and registers them online for public view. Using this technique, users could report issues with the water supply and the map would report the status of it in real time. The text messages could contain reports on leakages, breakages and lack of water. The project allowed the municipality to respond more effectively to claims of leaks and to keep a constant monitoring
of their systems through their users. This knowledge increased the efficiency of the private company and also increased the satisfaction of the users.
Youth mappers . Rio de Janeiro, Brazil
The United Nations Children’s Fund is leading a digital mapping project in the favelas of Rio de Janeiro, Brazil called “Visualizing Risk and Resilience” using the LOCAST software for map generation. The objective was to gather local information and location-specific knowledge about the targeted areas using mobile phones in the hands of members of the local community. Selected “youth mappers” are trained to generate geo-tagged commentaries about specific issues they consider important in their urban environment. The reports are then compiled in a website, where then it is easy to visualize the creation of “hot spots” in the area. This can be sites that contain services and public spaces, or sites detected as risk areas or places that lack maintenance. The resulting maps can help generate plans that prioritize neglected areas and help have a better understanding of the overall conditions of the favelas, all through the eyes of its inhabitants. UNICEF has engaged in observations with five different favelas and has received thousands of reports. During these activities, UNICEF mostly noted the tagging of points that were considered risky for children, such as collapsed roads, deteriorated buildings,
the accumulation of trash, or unsafe infrastructure elements such as open sewage, broken pedestrian bridges or downed power lines. Some of this observations have led to actions from the government to renovate infrastructure and beautify neighborhoods. On the other hand, some communities have also taken action on their own, increasing the efforts of maintaining their spaces clean and safe.
Youth Mapping Urban Risks.
Water SMS Process.

181180
Zappata Romana. Rome, Italy
Studio UAP, based in Rome generated a map of community gardens, flower fields, urban farms and other types of green public spaces, as well as clubs and community activities and events in relation to gardening generating a visual overview of the productive urban spaces in Rome and the institutions and centers that were involved with it.
Zappata Romana Website.

183182
SOURCES AND CITED WORKS
Arnstein, Sherry R. (1969) A Ladder of Citizen Participation. JAIP, Vol. 35, No. 4, pp. 216-224. Brynskov, Martin. Carvajal, Juan Carlos. Fernández, Manu. et.al. (2014) Urban Interaction Design, Towards City Making. Amsterdam. Bryan, J (2011). Walking the Line: Participatory Mapping Indigenous Rights, and Neoliberalism. Geoforum. Calles Violentas o el mapeo sensible del espacio público por mujeres. (2017) OpenStreetMap México. Available at: http://www.openstreetmap.mx/2017/03/callesvioletas/
Casey, L.; Pederson, T.W. (1995) Urbanizing GIS: Philadelphia's Strategy to Bring GIS to Neighborhood Planning. Proceedings of the Enviornmental Systems Research Institute User Conference, www.esri.com/library/proc95/to150/p107.html Clark M, (1998) GIS- democracy or delusion?. Environment and Planning A 30 303-316
Clifford, S (1996). "Places, People, and Parish Maps". In Clifford, S.; King, A. From Place to Place: Maps and Parish Maps. London: Common Ground. pp. 3–7. Contin, Antonella; Paolini, Paolo; Salerno, Rossella. (2014) Innovative Technologies in Urban Mapping. Built Space and Mental Space. Springer International Publicist, Switzerland. Corbett Jon, et al. (2006) Overview: Mapping for Change-the emergence of a new practice. Participatory Learning and Action 54 p.13–19 Creighton, J. L. (1994). Involving Citizens in Community Decisions Making: A Guidebook. Washington, DC: Program for Community Problem Solving. CTA IIED. (2006) : Mapping for Change: practice, technologies and communication. Participatory Learning and Action 54. De Alba, M. (2004). Mapas Mentales de la Ciudad de México: una aproximación psicosocial al estudio de las representaciones espaciales. Universidad Autónoma Metropolitana Iztapalapa. Mexico.
De Urbanisten, Autoridad del Espacio Público. (2016) Towards a Water Sensitive Mexico City. Available at: http://www.urbanisten.nl/wp/?portfolio=towards-a-water-sensitive-mexico-city
Di Gessa, Stefano (2008). Participatory Mapping as Tool for Empowerment. Experiences and Lessons Learned from the ILC Network. International Land Coalition. Rome, Italy.
Elwood, Sarah. (2002) GIS use in Community Planning: A Multidimensional Analysis of Empowerment. DePaul University, Chicago. IL. Flanagin, A. J.; Metzger, M. J. (2008). "The credibility of volunteered geographic information". GeoJournal. 72: 137–148. Gaventa J, 1993, ``The powerful, the powerless, and the experts: knowledge struggles in an information age'', in Voices of change: Participatory Research in the United States and Canada, Eds P Park, M Brydon-Miller, B Hall, T Jackson (Bergin & Garvey,Westport, CT) pp 21-40

185184
Giddens, A. (1984) The Constitution of Society, University of California Press, Berkeley, CA. Goodchild, M.F. (2007). "Citizens as sensors: the world of volunteered geography". GeoJournal. 69 (4): 211–221. Grahame, David. (2014) Meta City: Origins and Implications. In Innovative Technologies in Urban Mapping Springer International Publicist, Switzerland. P.59-72. Haklay, M. (2013) Citizen Science and Volunteered Geographic Information: Overview and Typology of Participation. In Crowdsourcing Geographic Knowledge: Volunteered Geographic Information in Theory and Practice. Springer Science+Business Media. Dordrecht, The Netherlands. P. 105-122.
Harley, J.B. ; Woodward, David. (1987). The History of Cartography: Cartography in Prehistoric, Ancient and Medieval Europe and the Mediterranean
Harley, J.B. (1988) Maps, knowledge, and power, in The Iconography of Landscape (eds D. Cosgrove and S. Daniels), Cambridge University Press, New York, pp. 277–312.
Heipke, Christian (2010). Crowdsourcing geospatial data. ISPRS Journal of Photogrammetry and Remote Sensing, Volume 65, Issue 6. Hannover, Germany. p.550-557
Hodgson, D.L; Schroeder, R.A. (2002). "Dilemmas of Counter-Mapping: Community Resources in Tanzania". Development and Change. 33: 79–100.
Iconoclasistas (2015). Mapeo Colectivo de Santa María La Ribera. Casa Gallina. México. Available at: http://www.iconoclasistas.net/ciudad-de-mexico/
Kahila, Maarit; Kyttä, Marketta. (2009) SoftGIS as a Bridge-Builder in Collaborative Urban Planning In Geertman, S.; Stillwell, J.C.H. Planning Support Sytems Best Practice and New Methodology. Springer Sicence+Business Media. P. 389-412.
Kosek, J (1998). "Mapping Politics". Quarterly Publication of the International Association for the Study of Common Property. 45: 4–6.
Lodigiani, Annalisa (2014). E-planning: the digital toolbox in participatory urban
planning. In Innovative Technologies in Urban Mapping Springer International Publicist, Switzerland. P.135-144.
Lynch, Kevin. The Image of The City. (1960) Harvard University Press, Massachusetts, USA.
Meo, Michael; Hernández-Téllez, Carlos. (2017) EN BICI: Hyperlocalized explorations of biking as a tool of urban resilience in Mexico City. Harvard Graduate School of Design. http://www.en-bici.com/
Observatorio de Vivienda. (2016) ¿Qué es Co-Mapp? México. Available at: http://www.observatoriodevivienda.org/news/co-mapp/
Peluso, Nancy L. (2011) Whose woods are these? Counter mapping forest territories in Kalimantan Indonesia. The Map Reader: Theories of Mapping Practice and Cartographic Representation (eds M. Dodge, R. Kitchin and C. Perkins), Chichester, UK.
Ramasubramanian, L. (1998) Knowledge Production and Use in Community-based Organizations: Examining the Impacts and Influence of Information Technologies PhD dissertation, School of Architecture and Urban Planning, University of Wisconsin. Ramasubramanian, L. (2010) PPGIS as Critical Reflective Practice. In Geographic Information Science and Public Participation, Advances in Geographic Information Science. Springer-Verlag, Heidelberg. P. 135-149 Rambaldi, Giacomo. (2006) Practical ethics for PGIS practitioners, facilitators, technology intermediaries and researchers. Participatory Learning and Action 54 p. 106-113.
Rappaport, J. (1984) Studies in empowerment: introduction to the issue. Prevention in Human Services 3(2/3) 1- 7
Rocha, Elizabeth M. (1997) A Ladder of Empowerment. Journal of Planning Education and Research. Association of Collegiate Schools of Planning. SAGE Publication. P. 31-44.
Repubikla. (2016) Mapeatón, la vigilancia ciudadana a pié. OpenStreetMap México. Available at: http://www.openstreetmap.mx/2016/06/mapeaton-vigilancia-ciudadana-a-pie/

186
Repubikla. (2016) Repubikla, crowdsourcing y movilidad activa. OpenStreetMap México. Available at: http://www.openstreetmap.mx/2016/08/crowdsourcing-movilidad-activa/
Repubikla. (2017) Cartografías Repubikla. Available at: https://repubikla.carto.com/me
Rundstrom, R (2009). Counter-Mapping. International Encyclopaedia of Human Geography: 314–318.
Salerno, Rosella. (2014) Rethinking Kevin Lynch’s Lesson in Mapping Today’s City. In Innovative Technologies in Urban Mapping Springer International Publicist, Switzerland. P.25-33. Sanoff, Henry. (2011) "Multiple Views of Participatory Design," Focus: Vol. 8: Iss. 1, Article 7.Available at: http://digitalcommons.calpoly.edu/focus/vol8/iss1/7
Sieber R .(1997) Computers in the Grassroots: Environmentalists, Geographic Information Systems, and Public Policy PhD dissertation, Department of Urban Planning and Policy Development, Rutgers University, New Brunswick, NJ Sieber, R.. (2006) Public Participation and Geographic Information Systems: A Literature Review and Framework. Annals of the American Association of Geographers, 96/3:491-507
UN Habitat (2016) The City Prosperity Initiative. United Nations Human Settlements Programme. Valle, Diego. (2015) Crimen por tu Rumbo. Hoyo de Crimen. México. Available at: https://hoyodecrimen.com/
White, S. A., Nair, K. S. and Ascroft, J. (1994). Participatory Communications: Working for Change and Development. Thousand Oaks, CA: Sage. Williams, Sarah; Marcello, Elizabeth; Klopp, Jacqueline (2013) Toward Open Source Kenya: Creating and Sharing a GIS Database of Nairobi, Annals of the Association of American Geographers, 104:1, 114-130 Wood, D; Fels, J.; Krygier, J. (2010) Rethinking the Power of Maps. London: Guilford Press.

189188
AKNOWLEDGEMENTS
First of all, I will like to thank Tigran Haas, who provided me the opportunity to join the fantastic adventure that the Urbanism Studies Masters was. Although we didn’t get to watch all the movies he wanted, I learnt more than I had ever expected and had an amazing year. The work of Future of Places at KTH inspires me to think about space from different perspectives, and makes me excited about working with placemaking and bottom-up urbanism later on in my life.
To my colleagues at Spacescape, who opened their workspace for me and let me gain some insight of how I can develop my interests in practice. During my time there, I have learnt how to use information as a tool for analysis, discussion and design. I have been very lucky to experience and work first hand on projects around Sweden, using observation, interviews and spatial analysis to inform our design desicions.
Every day at the office I come in contact with many interesting proposals and I will be forever grateful for the opportunity to work on such diverse and exciting projects.
A big thank you to my fellow Musers, who were my family during my studies in Sweden. Not only will I cherish the interest discussions we had during our lectures, but the lifelong knowledge and memories gained from being part of such a diverse, unique and driven group.
Lastly, I will always be eternally grateful to my family who have supported my decision to move halfway across the world for my personal development, and to whom I hopefully have transmited my passion for cities, especially for Mexico City, our home. And, to Ruben Grandia, who was always happy to hear my endless speeches about my latest passions, and with whom I hope to trace our own map of the world.