Empirical validations of solar gain models for a glazing unit with exterior and interior blind...
25
Submitted for Publication to Energy and Buildings on January 30, 2007 Empirical validations of solar gain models for a glazing unit with exterior and interior blind assemblies Peter G. Loutzenhiser 1 , Heinrich Manz 1 , Stephan Carl 1 , Hans Simmler 1 , Gregory M. Maxwell 2 1 Swiss Federal Laboratories for Materials Testing and Research (EMPA), Laboratory for Building Technologies, CH-8600 Duebendorf, Switzerland 2 Iowa State University, Department of Mechanical Engineering, Ames, Iowa 50011 USA ABSTRACT Experiments performed at the Swiss Federal Laboratories for Materials Testing and Research (EMPA) test cell located in Duebendorf, Switzerland were used for empirical validations of building energy simulation programs. Four solar gain experiments were run with either an exterior Venetian blind or an interior mini-blind mounted over a glazing unit with the blind slats in the horizontal position and with the outer slat edge toward the ground tilted downward 45°. Models of the test cell setup were constructed in two distinctive building energy simulation programs, EnergyPlus and HELIOS, and the measured cooling power in the test cell was compared with the simulated cooling powers. For these experiments, the mean percentage of the absolute mean differences for EnergyPlus and HELIOS were all within 6.1% and 7.1%, respectively. 1. Introduction Modern commercial buildings are being designed to link occupants to their environments and provide daylight on the work planes by using highly glazed façades. Shading devices enable control to office dwellers to manage the extent of their interactions with the outside world. Blinds are very popular shading devices that are used in office spaces around the world and play an integral role in reducing solar gains in the summer and transmitting solar energy to the space in the winter through windows to offset of heating requirements. They also provide flexibility to the occupants for eliminating beam radiation into the space and prevent glare while still allowing diffuse natural light to enter. When exterior blinds are installed over the windows, the energy absorbed by the blind, for the most part, remains outside of the office space, which is highly advantageous in order to reduce overheating of the building. Quantifying the impact of both interior and exterior blinds has been the focus of prior research. A great deal of experimental work has been undertaken to examine various permutations of blind assemblies and windows in order to better understand and model the solar optical behavior and different heat transfer mechanisms (longwave radiation, air flow patterns and convective heat transfer) [1-8]. Using some of these experiments, validated models have been constructed for simulating the impact of blinds outside of the laboratory for practical analysis of actual window/blind assemblies for construction buildings [9-17]. Implementing models like these into building energy simulation programs increases the potency of the software—making them powerful tools for designing modern buildings optimized for energy efficiency and user comfort. Building energy simulation programs can be employed to evaluate different window/shading combinations prior to constructing a building and provide valuable information for assessing annual energy performance and sizing heating, ventilation, and air-conditioning equipment. There are different levels of
Transcript of Empirical validations of solar gain models for a glazing unit with exterior and interior blind...
Submitted for Publication to Energy and Buildings on January 30, 2007
Empirical validations of solar gain models for a glazing unit with exterior and interior blind assemblies
Peter G. Loutzenhiser1, Heinrich Manz1, Stephan Carl1, Hans Simmler1, Gregory M. Maxwell2
1 Swiss Federal Laboratories for Materials Testing and Research (EMPA), Laboratory for Building Technologies, CH-8600 Duebendorf, Switzerland
2 Iowa State University, Department of Mechanical Engineering, Ames, Iowa 50011 USA
ABSTRACT Experiments performed at the Swiss Federal Laboratories for Materials Testing and
Research (EMPA) test cell located in Duebendorf, Switzerland were used for empirical validations of building energy simulation programs. Four solar gain experiments were run with either an exterior Venetian blind or an interior mini-blind mounted over a glazing unit with the blind slats in the horizontal position and with the outer slat edge toward the ground tilted downward 45°. Models of the test cell setup were constructed in two distinctive building energy simulation programs, EnergyPlus and HELIOS, and the measured cooling power in the test cell was compared with the simulated cooling powers. For these experiments, the mean percentage of the absolute mean differences for EnergyPlus and HELIOS were all within 6.1% and 7.1%, respectively. 1. Introduction
Modern commercial buildings are being designed to link occupants to their environments and provide daylight on the work planes by using highly glazed façades. Shading devices enable control to office dwellers to manage the extent of their interactions with the outside world. Blinds are very popular shading devices that are used in office spaces around the world and play an integral role in reducing solar gains in the summer and transmitting solar energy to the space in the winter through windows to offset of heating requirements. They also provide flexibility to the occupants for eliminating beam radiation into the space and prevent glare while still allowing diffuse natural light to enter. When exterior blinds are installed over the windows, the energy absorbed by the blind, for the most part, remains outside of the office space, which is highly advantageous in order to reduce overheating of the building.
Quantifying the impact of both interior and exterior blinds has been the focus of prior research. A great deal of experimental work has been undertaken to examine various permutations of blind assemblies and windows in order to better understand and model the solar optical behavior and different heat transfer mechanisms (longwave radiation, air flow patterns and convective heat transfer) [1-8]. Using some of these experiments, validated models have been constructed for simulating the impact of blinds outside of the laboratory for practical analysis of actual window/blind assemblies for construction buildings [9-17].
Implementing models like these into building energy simulation programs increases the potency of the software—making them powerful tools for designing modern buildings optimized for energy efficiency and user comfort. Building energy simulation programs can be employed to evaluate different window/shading combinations prior to constructing a building and provide valuable information for assessing annual energy performance and sizing heating, ventilation, and air-conditioning equipment. There are different levels of

complexities for blind simulations that are currently used in building energy simulation programs and subsidiary software. Various standards and handbooks provide guidance for estimating the impact of blind assemblies as a function of slat angle and properties that range from very simple to very complicated in their method and application.
The simplest methods rely on estimating an unshaded fraction where direct irradiance can penetrate the space and, for simplicity sake, assume the rest of the irradiation is diffuse. General guidelines for approximating the impact of blinds, especially solar heat gain coefficients, are provided by [18].
More robust methods outlined in several standards use viewfactor approaches for estimating radiative transfer through blind assemblies. The calculation procedures given in prEN 13363-2 [19] assume the blinds are adjusted to eliminate direct irradiance as well as flat diffuse reflecting and transmitting slats. For each blind slat, a two-dimensional view factor is computed for the entire slat for estimating diffuse transmittance and a second blind slat view factor is determined to account for direct-diffuse transmissions and reflections. The standard does not consider the wavelength-dependence of optical properties of glazing and blind properties. Additional calculations for longwave radiation transmittance are also provided.
A similar strategy is employed in ISO/FDIS 15099:2003 [20]. Here the blind slats are divided up in five equal segments and diffuse two-dimensional view factors are calculated for all surfaces, including the glazing unit. The curvature of the blind slat is neglected and direct-direct, direct-diffuse, and diffuse-diffuse transmissions and reflections are computed as a function of wavelength. Integral solar and visible properties can then be calculated.
Programs are also available for evaluating glazing units with blind assemblies. WIS [21] can compute angular dependent overall transmittance and reflectance using spectral glazing and blind slat properties. The software also accounts for curvature in the blind slats and uses both view factor and ray tracing methods. Comparison of blind assemblies models were undertaken by [22, 23].
Before using building energy simulation programs in actual practice, an intense regiment of validations should be pursued to ensure that the programs are performing as intended. Judkoff [24] identifies three different types of validations, namely: 1) analytical, 2) comparative, and 3) empirical validations and describes the advantages and disadvantages, applications, and the importance of each type of validation approach. Because empirical validations are relatively expensive to perform, only a few studies using building energy simulation programs have been undertaken.
Test cells provide a unique environment for empirical validations and lie between a carefully controlled laboratory environment and an actual building. They have the advantage that the inside test cell boundary conditions can be well-controlled while also maintaining an environment that is similar to an actual office space envelope (i.e. dimensions, optical and thermophysical properties, and air flow patterns). The PASSYS project [25-27] used test cells situated throughout Europe to evaluate ESP-r. The International Energy Agency’s (IEA) Annex 21/ Task 8 [28] also used test cells to assess the performances of programs. Further investigations were performed in IEA Task 22 in different facilities around the world [29-31].
This research focuses on empirical validation of solar gain algorithms for a solar selective glazing unit with exterior mounted Venetian blind and interior mini-blinds at two different slat positions. The experiments were performed in a test cell located on the Swiss Federal Laboratories for Material Testing and Research (EMPA) on the campus in Duebendorf, Switzerland. The series of experiments was conducted in conjunction with
IEA Task 34/Annex 43 Project C. Prior work was completed that characterized the test cell [32], examined radiation models on tilted surfaces [33], and evaluated solar gain models in building energy simulation programs through a glazing unit without [34] and with [35] shading screens. In addition to the information described in these previous studies, thorough documentation of optical properties, construction, and mounting of the blind assemblies are described in this paper.
The building energy simulation programs EnergyPlus [36] and HELIOS [37] were evaluated using experimental data to predict the cooling power required to maintain a fixed temperature in the test cell. These results were accompanied by sensitivity analyses designed to evaluate the impact of experimental uncertainties and their propagation through a building energy simulation program. 2. Experiments
The EMPA test cells are located on the institution’s Duebendorf campus in Switzerland. The longitude, latitude, and altitude above sea level are 8.6°E, 47.4°N and 430 m, respectively. The interior building construction elements (floor, ceiling, and interior walls) are all adjacent to a temperature controlled guarded zone for better definition of boundary conditions, and the exterior wall faces 29° West of South. The facility meets all nine criteria for a high-quality data set for empirical validation [28]. Additional information about the test cell (i.e. dimensions, thermophysical properties, thermal bridges etc.) is described by [32]. General descriptions of the both the exterior Venetian blind and interior mini-blind experiments are provided in this section. Other information pertaining to the test cell glazing unit is given by [34]. 2.1. Exterior Venetian Blind Experiments
Two experiments were run for 20 day periods in the test cell with an exterior Venetian blind. Experiment with the slats in the horizontal position and tilted 45° downward experiments were performed from July 24 to August 12, 2005 and August 17 to September 5, 2005, respectively. The test cell was configured to maintain a near-constant temperature by adjusting the cooling power. Figure 1 contains a photograph taken from outside of the test cell that shows the blind with slats in the horizontal position.
2.2. Interior Mini-Blinds
Two additional experiments were run for 20 day periods in the test cell with an interior mini-blind. A drawing of the mini-blind assembly is provided in Figure 2. In the first experiment, the slats were horizontally positioned from October 16 to November 4, 2005, and, for the second experiment, the slat edges closest to the window were tilted 45° downward from April 1 to April 20, 2006. 2.3. Blind Slat Properties
The properties of the blind slats were measured for effective simulation of the blind assemblies. Wavelength dependent reflectances were measured at near-normal incident angles from 250 nm to 2500 nm, shown in Figure 3, for both Venetian blind and mini-blind slats. The solar reflectance was computed using GLAD Software [38] according to EN 410 [39]. The hemispherical emittance of the blind slats was measured using an

emissometer based on a calorimetric method. The optical measurements for blind slats of the mini-blind and Venetian blind assemblies are provided in Table 1. Detailed drawings of the Venetian and mini-blind slats that represent the slat geometry, orientation are provided in Figure 4. The slats were rotated around the center when 45° tilted and, thus, the distance between slat edge and the glazing increased. 2.3. Boundary Conditions
The outer surface temperatures for the construction elements adjacent to the guarded zone were measured during the experiment for use as boundary conditions. During the experiment, the air temperatures inside the test cell were measured by 18 double-shielded thermocouples and the volume averaged temperatures averaged over each hour were used as inputs for the programs. The mean test cell air temperatures, also averaged in time for these experiments, are provided in Table 2. The conditioned air entered the test cell through two textile ducts on the floors and exited through metal ducts hanging slightly below the ceiling. This configuration was used to reduce temperature stratification in the test cell. The maximum, average and minimum absolute temperature differences for the 18 thermocouples were computed over each experiment and are also given in Table 2. The temperature-dependent thermal conductivities of the construction elements given by [30] were fixed using the mean temperature of the construction elements. The internal loads in the test cells due to fans constantly running were also inputs into the building energy simulation programs. The values, averaged in time, are also provided in Table 2. 3. Modeling
The experiments were modeled in EnergyPlus and HELIOS. The same test cell modeling procedures employed by [32, 34] were also used here with the addition of an exterior Venetian blind and interior mini-blind assemblies. For these experiments, the hourly outer surface temperatures for the construction elements adjacent to the guarded zones were used as boundary conditions for programs. 3.1. EnergyPlus
For the EnergyPlus model, direct-normal and diffuse horizontal solar irradiances were weather file inputs for computing the transmitted solar power along with other parameters used in 10 minute increments. The Perez 1990 model [40] was employed to compute the diffuse solar irradiance on the southwest wall. EnergyPlus contains a two-dimensional blind model that assumes flat diffuse slats [41] similar to the model proposed in prEN 13363-2. The slat’s normal solar reflectance, hemispherical emittance, width, thickness, distance from the outer pane of glass (measured from the center of the blind slats), and distance between individual slats were entered into the program. The heat transfer between the window and the shading devices was calculated using ISO 15099 assuming natural buoyancy; this was performed as an iterative procedure in the program. A detailed algorithm that factored in surface orientation and temperatures was used to compute dynamic convective heat transfer coefficients for the interior surfaces. 3.2. HELIOS
In HELIOS model, global and diffuse horizontal solar irradiances in one hour time intervals were inputs for computing the transmitted solar power. HELIOS uses a Perez
1987 [42] model for computing tilted façade diffuse solar irradiances. The external thermal bridge was then included with the linear thermal transmittance from the spacer. The solar normal transmittances and reflectances for each pane of glass and emittance were inputs into the program and an angular-dependent model described in the Window 4.1 manual [43] was employed to calculate optical properties of the glazing unit. The emittance of glazing unit was then adjusted to match the measured center-pane thermal transmittance. Constant combined internal heat transfer coefficients as a function of surface orientation were specified according to EN/ISO 6946 [44].
The impacts of external and internal blind assemblies were accounted for using a model recently added to HELIOS. The underlying theory behind the model is given by [22-23,45]. The blind model in HELIOS calculates two-dimensional diffuse geometric view factors that account for curvature in the blind slat. The optical properties were normal solar reflectance and hemispherical emittance, which were used in combination with the geometry of the blind slats with respect to each other and the glazing unit. The airgap calculations between the blind assembly and the glazing unit were made according to an algorithm developed by [46]. 4. Sensitivity Analyses
Monte Carlo Analysis (MCA) and fitted effects for an n-way factorial analysis were used to assess the propagation of input uncertainties through the building energy simulation programs on the predicted cooling power. The theory and implementation of these analyses are discussed by [33]. The input uncertainties were taken from [33-35] for the test cell and instrumentation and from Table 1 for the optical properties of the blind slats.
One and two-way factorial analyses were performed for all of experiments. The results for the overall uncertainty and the 10 most influential parameters for the exterior Venetian blind and interior mini-blind experiments averaged over the experiments are contained in Tables 3 and 4, respectively. To verify the assumption of localized linearity, both forward and backward differencing were performed, which was used to confirm a normal distribution by the Central Limit Theorem. This was later verified by a Lillefore’s Test for at a 1% significance level for the MCA output; all output uncertainties were found to be normally distributed.
For the exterior Venetian blind experiments, the factorial analyses reveals that the output is much more sensitive to the uncertainty associated with the ground reflectance when the blind slats are tilted 45° downward.
The interior mini-blind experiments were much more sensitive to the front reflectance than the Venetian blind experiments. The impact of the surface and air temperature uncertainties affected the overall uncertainty more in the mini-blind experiments compared with the Venetian blind experiments. The impact of the direct-normal and diffuse horizontal solar irradiance inputs were somewhat diminished in the overall factorial analyses because, during the night, they had no impact on the cooling power.
A MCA was used to quantify the overall hourly uncertainties for the experiments and generate 95% credible limits used for comparisons in the statistical analyses. The average overall cooling power uncertainties for experiments with the Venetian blind assembly in horizontal position and tilted 45° downward were 2.17 W and 2.28 W, respectively, and 3.88 W for both mini-blind experiments. These results corresponded well with the results from the factorial analyses (Tables 3 and 4).
5. Results
The empirical validation focused on the required cooling power needed to maintain the test cell at a constant temperature. Plots were generated to compare the results from the experiments. Each hour represents the average cooling power for that hour of the day averaged over all 20 days of the experiment. Averaged 95% credible limits for the experiment were fixed to the measured results, and the averaged 95% credible limits from the MCA were fixed to the simulation results. For any given hour, the maximum, minimum, and mean absolute differences of the experiment were also plotted. For comparisons, the transmitted solar powers were also displayed. The results for both EnergyPlus and HELIOS are contained in subsequent sections. 5.1. Venetian Blind Assembly
For the Venetian blind experiment where the slats were horizontally positioned, cooling power and absolute difference cooling power differences for a given hour of the day for EnergyPlus and HELIOS are contained in Figures 5 and 6, respectively. To assist in identifying differences in solar gain models, the transmitted solar powers through the glazing unit and the Venetian blind assembly were also compared for both programs and are shown in Figure 7.
Similar comparisons were also made for the experiment when the Venetian blind slats were tilted 45° downward. Plots for cooling power and absolute differences for EnergyPlus are given in Figure 8 and for HELIOS are provided in Figure 9. Transmitted solar power predictions for both programs are shown in Figure 10.
Statistical analyses were performed using the methodology proposed by [30]. An important parameter for assessing the overall performance of the program is the uncertainty ratio given in Equation 1. This relationship relates the hourly uncertainties to measurements and predictions. If the uncertainty ratio is less than or equal to unity, then the program is considered validated within the 95% credible limits.
++=
EExp OUOUD
UR (1)
The statistical analyses for both Venetian blind experiments are given in Table 5.
5.2. Mini-Blind Assembly For the mini-blind assembly experiment when the slats were horizontally positioned,
cooling power comparisons for EnergyPlus and HELIOS are given in Figures 11 and 12, respectively. The transmitted solar power predictions for each program are given in Figure 13.
The same comparisons were made when the mini-blind slats were tilted 45° downward. Plots for the cooling powers are given in Figure 14 for EnergyPlus and Figure 15 for HELIOS. Transmitted solar power predictions are provided in Figure 16.
Statistical analyses were performed for both experiments and are given in Table 6. 6. Discussion
The section is divided into two parts to reflect the two shading assemblies.
6.1. Exterior Venetian Blind Assembly
When the Venetian blind slats were horizontally positioned, it was possible for beam radiation to penetrate directly through the glazing unit into test cell when the solar position led to a shading angle smaller than the cut-off angle of 33°. However, this situation only occurred during the experiment for the last two hours before sunset, and, for when the blinds slats were positioned 45° downward, no solar beam radiation was transmitted into the room. Therefore, the additional modeling challenges required for accounting for solar beam radiation entering the space and the associated reflections off interior construction element surfaces were not relevant. The blind models were required to account for beam radiation reflected off the blind slats into the space. For both models, reflections from the blind slats were considered non-specular or diffuse.
Using the average uncertainty ratios from the experiments, EnergyPlus was validated within 95% credible limits for the 45° tilted downward experiment over the entire experiment and was just outside credible limits for the horizontally positioned blind slat experiment. The HELIOS models were just outside 95% credible for both experiments.
A parameter that can directly be linked to the cooling power predictions is the absolute average difference. When horizontally positioned, the average absolute differences for EnergyPlus and HELIOS were 9.2 W and 10.5 W, respectively, and, when tilted downward 45°, were 7.3 W and 9.5 W, respectively.
An assessment of the overall cooling energy predictions can be made by using the average differences over the experiments. For the horizontally positioned slats, the average differences for EnergyPlus and HELIOS were 8.3 W and 9.4 W, respectively. When considering the overall performance, the average differences were not within the sum of the average 95% credible limits from the experiment and the MCA (3.9 W + 4.3 W = 8.2 W). The average differences for the tilted 45° downward experiment for EnergyPlus and HELIOS were 7.0 W and 4.8 W. respectively. Both of these results were within the sum of the 95% credible limits from the experiment and MCA (3.7 W + 4.4 W = 8.1 W).
Because both programs use the nearly the same optical window model, assumption made in the blind model appears to result in higher EnergyPlus transmitted solar power predictions when the blind slats were horizontally positioned and lower predictions when the blind slats are tilted 45° downward. However, the amount of solar power entering the test cell through the blind assembly and the glazing unit was quite low for both experiments, and the average differences at a given hour of the day were less than 15 W between models.
On average, there were systematic under-predictions of the cooling power from both programs during both experiments.
6.2. Interior Mini-Blind Assembly
When considering the geometry of the mini-blind slat blades in the horizontal position, the cutoff angle was calculated to be 44°. Hence, it was possible for beam radiation to penetrate directly into the space after 13:00 (GMT+1h). The programs were therefore required to account for beam radiation into the space and the associated interior reflections as well as diffuse radiation. When the slat blade was tilted 45° downward, only diffuse radiation and reflected beam radiation from the blind slats was allowed to penetrate into the space.
Again, applying the uncertainty ratio as a measure of overall performance, both programs for both experiments were within 95% credible limits. This was reinforced by results for absolute and average difference, which also reveal accurate predictions for both cooling power and energy for both experiments.
Careful inspection of the transmitted solar power predictions reveals higher solar power predictions for HELIOS for both slat positions. For the transmitted solar horizontally and 45° tilted downward experiments were, averaged for any given hour, within 20 W and 7 W, respectively. The magnitude of the transmitted solar power during the horizontally position blind slats was significantly higher than for the 45° downward tilted experiment. The differences between the transmitted solar powers seem to be correlated, although not proportional, to the magnitude of the transmitted solar powers. 7. Conclusions
Considering the complexities associated with modeling blind assemblies, the assumptions employed for the algorithms contained in both program yield good results. The different blind assembly models in each program produce different results for the transmitted solar power; the EnergyPlus model assumed the blind slats were flat, while the HELIOS model accounted for blind slat curvature. Other differences in the results can be attributed to assumptions made when simulating the airgap and heat transfer convective and radiative heat transfer mechanisms outside and inside the test cell. From these experiments, the predictions for cooling power with a glazing unit and blind assembly using EnergyPlus and HELIOS were within 6.1% and 7.1%, respectively. Both program performed better when modeling the interior mini-blinds despite additional modeling challenges associated with beam solar irradiance entering the space.
The experiments performed for this study were designed for empirical validations of building energy simulation programs. All relevant inputs into the programs were well-described and methods used to evaluate the programs accounted for uncertainties in the experiment and program inputs. Note: The data from these experiments can be downloaded from our website, www.empa.ch/ieatask34, and used for use in validating other building energy simulation programs. Acknowledgements
We acknowledge with thanks the financial support of the Swiss Federal Office of Energy (BFE) for building and testing the experimental facility (Project 17’166) as well as the funding of EMPA participation in IEA Task 34/43 (Project 100’765). Numerous IEA Task 34/Annex 43 participants provided valuable input for this project. We thank also our colleagues at EMPA: B. Binder, R. Blessing, M. Camenzind, T. Frank, K. Meyer, and R. Vonbank for their valuable contributions.
Nomenclature D = difference between experiment and predicted values for a given hour, W

D = mean difference, W
D = mean absolute difference, W
Dmax = maximum difference between experimental and predicted values for a given array, W
Dmin = minimum difference between experimental and predicted values for a given array, W
Drms = root mean squared difference between experimental and predicted values for a given array, W
D95% = ninety-fifth percentile of the differences between experimental and predicted values for a given array, W
OUExp = 95% credible limits or overall uncertainty from experiment for a given hour, W
OUE+ = 95% credible limits or overall uncertainty from MCA for a given hour, W
OU = average overall uncertainty calculated for 95% credible limits, W UR = uncertainty ratio for a given hour, no units
UR = arithmetic mean of the uncertainty ratio, no unit URmax = maximum uncertainty ratio, no units URmin = minimum uncertainty ratio, no units x = arithmetic mean for a given array of data, W xmin = minimum quantity for a given array of data, W xmax = maximum quantity for a given array of data, W
References [1] MR Collins and SJ Harrison. Calorimetric Analysis of the Solar and Thermal
Performance of Windows with Interior Louvered Blinds. ASHRAE Transaction 110(1) (2004) 474-485
[2] XD Fang. A study of the U-factor of the window with a high-reflectivity Venetian blind. Solar Energy 68 (2000) 207-217
[3] MR Collins and SJ Harrison. Test of Measured Solar Heat Gain Variation in a Fenestration and Shade Combination with Respect to Test Specimen Tilt. ASHRAE Transactions 107(1) (2001) 691-699
[4] JH Klems and JL Warner. Solar Heat Gain Coefficient of Complex Fenestrations with a Venetian Blind for differing Slat Angles. ASHRAE Transactions 103(1) (1997) 1026-1034
[5] JH Klems and JL Warner. Measurements of Bidirectional Optical Properties of Complex Shading Devices. ASHRAE Transactions 101(1) (1995) 791-801
[6] JH Klems and GO Kelly. Calorimetric Measurements of Inward-Flowing Fraction for Complex Glazing and Shading Systems. ASHRAE Transactions 102(1) (1996) 947-954
[7] MR Collins and SJ Harrison. Calorimetric Measurements of the Inward-Flowing Fraction of Absorbed Solar Radiation in Venetian Blinds. ASHRAE Transactions 105(2) (1999) 1022-1030
[8] MR Collins and SJ Harrison. Calorimetric Analysis of the Solar and Thermal Performance of Windows with Interior Louvered Blinds. ASHRAE Transactions 110(1) (2004) 474-485
[9] SJ Harrison and SJ van Wonderen. Evaluation of Solar Heat Gain Coefficient for Solar-Control Glazings and Shading Devices. ASHRAE Transactions 104(1) (1998) 1051-1062
[10] DS Yahoda and JL Wright. Method for Calculating the Effective Longwave Radiation Properties of a Venetian Blind Layer. ASHRAE Transactions 110(1) (2004) 463-473
[11] DS Yahoda and JL Wright. Heat Transfer Analysis of a Between-Panes Venetian Blind Using Effective Longwave Radiative Properties. ASHRAE Transactions 110(1) )2004) 455-462
[12] MR Collins, SJ Harrison, PH Oosthuizen, and D Naylor. Sensitivity Analysis of Heat Transfer from an Irradiated Window and Horizontal Louvered Blind Assembly. ASHRAE Transactions 108(1) (2002) 503-511
[13] MR Collins and SJ Harrison, Estimating the Solar Heat and Thermal Gain from a Window with and Interior Venetian Blind. ASHREA Transactions 110(1) (2004) 486-500
[14] H Shahid and D Naylor. Energy performance assessment of a window with a horizontal Venetian blind. Energy and Buildings 37 (2005) 836-843
[15] P Pfrommer, KJ Lomas, and C Kupke. Solar radiation transport through slat-type blinds: A new model and its application for the thermal simulation of buildings. Solar Energy 57 (1996) 77-91
[16] M Andersen, M Rubin, R Powles, and JL Scartezzini. Bi-directional transmission properties of Venetian blinds: experiments assessment compared to ray-tracing calculation. Solar Energy 78 (2005) 187-198
[17] J Breitenbach, S Lart, I Längle, and JLJ Rosenfeld. Optical and thermal performance of glazing with integral Venetian blinds. Energy and Buildings 33 (2001) 433-442
[18] ASHRAE. ASHRAE Fundamentals 2001 SI Edition, American Society of Heating, Refrigeration and Air-Condition Engineers, Inc, Atlanta, GA, 2001
[19] prEN 13363-2 (Final Draft), Solar protection devices combined with glazing - Calculation of total solar energy transmittance and light transmittance - Part 2: Detailed calculation method (English Version), October 2004
[20] ISO/FDIS 15099: 2003(E). Thermal performances of windows, doors, and shading devices—Detailed calculations, 2003
[21] WIS. Window Information System. http://windat.ucd.ie/wis/html/index.html, retrieved January 24, 2007
[22] H Simmler. Project A3 Solar Building components and integrated assemblies Case Study 1: Solar shading devices. Final Project Report. IEA Task 27 Building Envelope Components: Performance, durability and sustainability of advanced windows and solar components for building envelopes, February 2006

[23] H. Simmler. Messung and Simulation von transparenten Bauteilen mit Sonnenschutz, A report for the Bundesamtes für Energie (BFE), December 2004 (In German)
[24] RD Judkoff. Validation of Building Energy Analysis Simulation Programs at the Solar Energy Research Institute, Energy and Buildings 10 (1998) 221-239
[25] P Strachan. Model Validation using the PASSYS Test Cells, Building and Environment 28 (1993) 153-165
[26] P Wouters. L Vandaele, P Voit, and N Fisch, The use of outdoor test cells for thermal and solar building research within the PASSYS project, Building and Environment 28 (1993) 107-113
[27] SØ Jensen. Validation of building energy simulation programs: a methodology, Energy and Buildings 22 (1995) 133-144
[28] KJ Lomas, H Eppel, CJ Martin, DP Bloomfield, Empirical validation of building energy simulation programs, Energy and Buildings 26 (1997) 253-275
[29] S Moinard, G Guyon, Empirical Validation of EDF ETNA and GENEC Test-Cell Models, A Report of Task 22, Project A.3 Empirical Validation, International Energy Agency, 1999
[30] PG Loutzenhiser and GM Maxwell, A Comparison of DOE-2.1E Daylighting and HVAC System Interactions to Actual Building Performance, ASHRAE Transactions, Vol. 112(2) (2006) 409-417
[31] GM Maxwell, PG Loutzenhiser, and CJ Klaassen, Daylighting – HVAC Interaction Tests for the Empirical Validation of Building Energy Analysis Tools, A Report of Task 22 Subtask D. Building Energy Analysis Tools Project D Empirical Validation. http://www.iea-shc.org/task22/reports/IEA Daylighting Report Final.pdf (2003: retrieved January 24, 2007)
[32] H Manz, P Loutzenhiser, T Frank, PA Strachan, R Bundi, and G Maxwell. Series of experiments for empirical validation of solar gain modeling in building energy simulation codes – Experimental setup, test cell characterization, specifications and uncertainty analysis. Building and environment, 41 (2004) 1784-1797
[33] PG Loutzenhiser, H Manz, C Felsmann, PA Strachan, T Frank, and GM Maxwell, Empirical validation of models to compute solar irradiance on inclined surfaces for building energy simulation. Solar Energy 18 (2007) 254-267
[34] PG Loutzenhiser, H Manz, PA Strachan, C Felsmann, T Frank, GM Maxwell, and P Oelhafen, An Empirical Validation of Solar Gain Models Found in Building Energy Simulation Programs, HVAC&R Research, 12 (2006) 1097-1116
[35] PG Loutzenhiser, H Manz, C Felsmann, PA Strachan, and GM Maxwell, An empirical validation of modeling solar gain through a glazing unit with external and internal shading screens, (Accepted for publication in Applied Thermal Engineering on June 9, 2006)
[36] EnergyPlus 1.2.3.023. A building energy simulation program, www.energyplus.gov, 2005
[37] HELIOS XP. Building energy simulation program. Swiss Federal Laboratories for Materials Testing and Research (EMPA), Duebendorf, Switzerland (November 2006)

[38] GLAD Software. Swiss Federal Laboratories for Materials Testing and Research (EMPA), Duebendorf, Switzerland (2002)
[39] European Standard EN 410. Glass in building – Determination of luminous and solar characteristics of glazing. European Committee for Standardization, Brussels, Belgium, 1998
[40] R Perez, P Ineichen, R Seals, J Michalsky, and R Stewart. Modeling daylight availability and irradiance components from direct and global irradiance. Solar Energy Vol. 44 (1990) 271-289
[41] EnergyPlus. Input Output Reference, Board of Trustees of University of Illinois and the University of California through Orlando Lawrence Berkley Laboratories, (October 11, 2005)
[42] R Perez, R Seals, P Ineichen, R Stewart, D Menicucci. A new simplified version of the Perez diffuse irradiance model for tilted surfaces. Solar Energy 39 (1987) 221–232
[43] EU Finelayson, DK Arasteh, C Huizenga, MD Rubin, and MS Reilly. Window 4.0: Documentation of Calculation Procedures, Lawrence Berkley Laboratory Report LBL-33946 University of California Report UC-350 (July 1993)
[44] EN ISO 6945, Building components and building elements—Thermal resistance and thermal transmittance—Calculation methods, Draft Revision, ISO (2004)
[45] H Simmler and B Binder. Testing and modelling of angular-dependent solar heat gain of glazing with venetian shading DYNASTEE Conference 2005, 12-14 (October 2005) Athens
[46] P Chauvel and J Millet. L’appreciation des caracteristiques des pretections solaires des bais, Centre Scientifique et Technique du Batiment, Department de l’Energetique et de
la Productique GEC/DAC-90.115R, October 1991
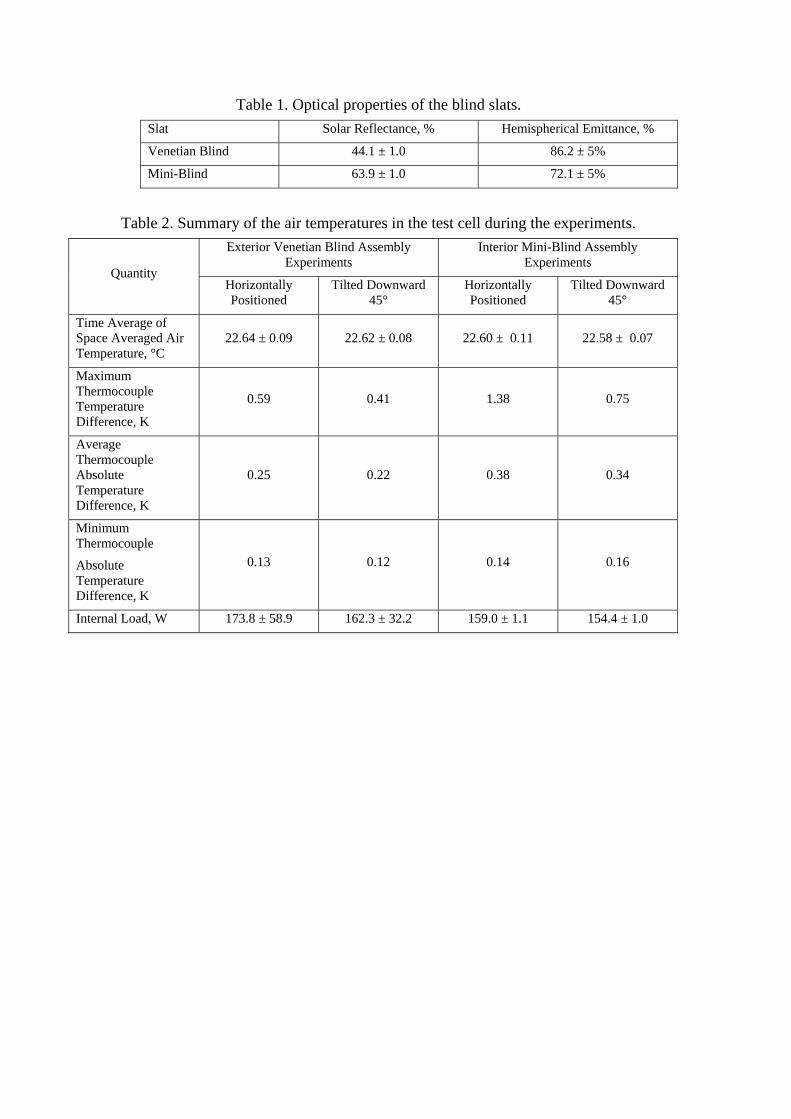
Table 1. Optical properties of the blind slats. Slat Solar Reflectance, % Hemispherical Emittance, %
Venetian Blind 44.1 ± 1.0 86.2 ± 5%
Mini-Blind 63.9 ± 1.0 72.1 ± 5%
Table 2. Summary of the air temperatures in the test cell during the experiments.
Exterior Venetian Blind Assembly Experiments
Interior Mini-Blind Assembly Experiments
Quantity Horizontally Positioned
Tilted Downward 45°
Horizontally Positioned
Tilted Downward 45°
Time Average of Space Averaged Air Temperature, °C
22.64 ± 0.09 22.62 ± 0.08 22.60 ± 0.11 22.58 ± 0.07
Maximum Thermocouple Temperature Difference, K
0.59 0.41 1.38 0.75
Average Thermocouple Absolute Temperature Difference, K
0.25 0.22 0.38 0.34
Minimum Thermocouple
Absolute Temperature Difference, K
0.13 0.12 0.14 0.16
Internal Load, W 173.8 ± 58.9 162.3 ± 32.2 159.0 ± 1.1 154.4 ± 1.0
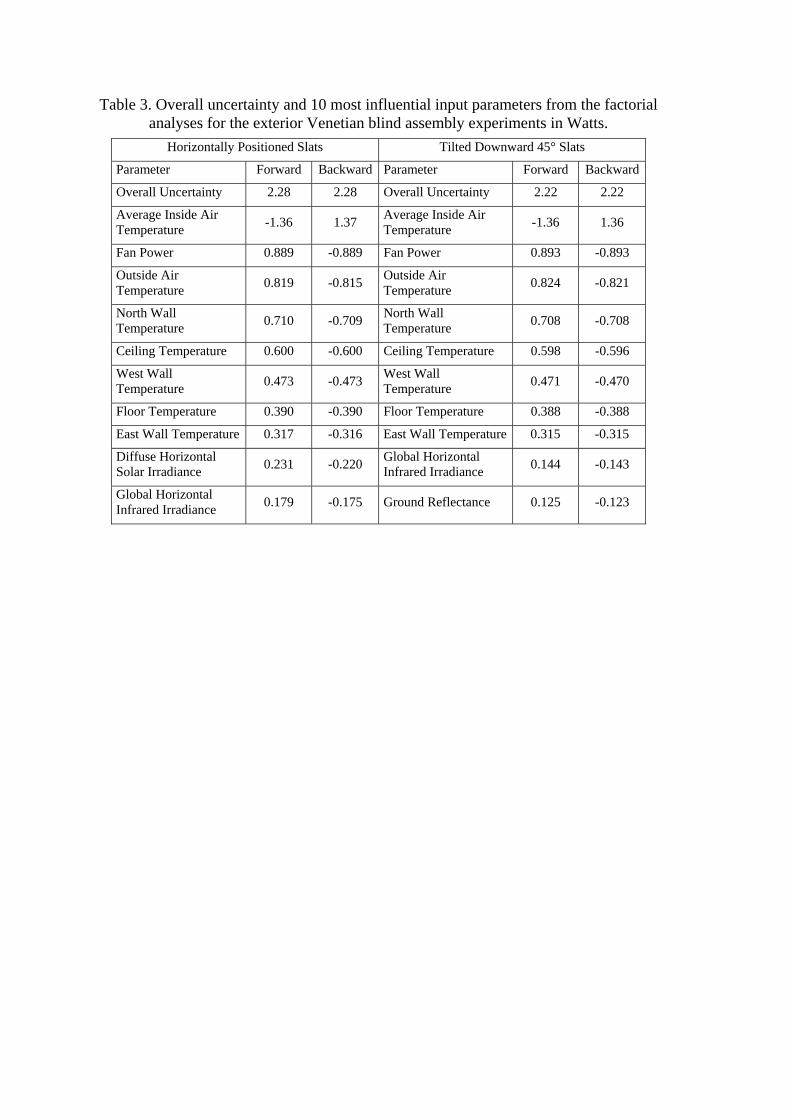
Table 3. Overall uncertainty and 10 most influential input parameters from the factorial analyses for the exterior Venetian blind assembly experiments in Watts.
Horizontally Positioned Slats Tilted Downward 45° Slats
Parameter Forward Backward Parameter Forward Backward
Overall Uncertainty 2.28 2.28 Overall Uncertainty 2.22 2.22
Average Inside Air Temperature -1.36 1.37 Average Inside Air
Temperature -1.36 1.36
Fan Power 0.889 -0.889 Fan Power 0.893 -0.893
Outside Air Temperature 0.819 -0.815 Outside Air
Temperature 0.824 -0.821
North Wall Temperature 0.710 -0.709 North Wall
Temperature 0.708 -0.708
Ceiling Temperature 0.600 -0.600 Ceiling Temperature 0.598 -0.596
West Wall Temperature 0.473 -0.473 West Wall
Temperature 0.471 -0.470
Floor Temperature 0.390 -0.390 Floor Temperature 0.388 -0.388
East Wall Temperature 0.317 -0.316 East Wall Temperature 0.315 -0.315
Diffuse Horizontal Solar Irradiance 0.231 -0.220 Global Horizontal
Infrared Irradiance 0.144 -0.143
Global Horizontal Infrared Irradiance 0.179 -0.175 Ground Reflectance 0.125 -0.123
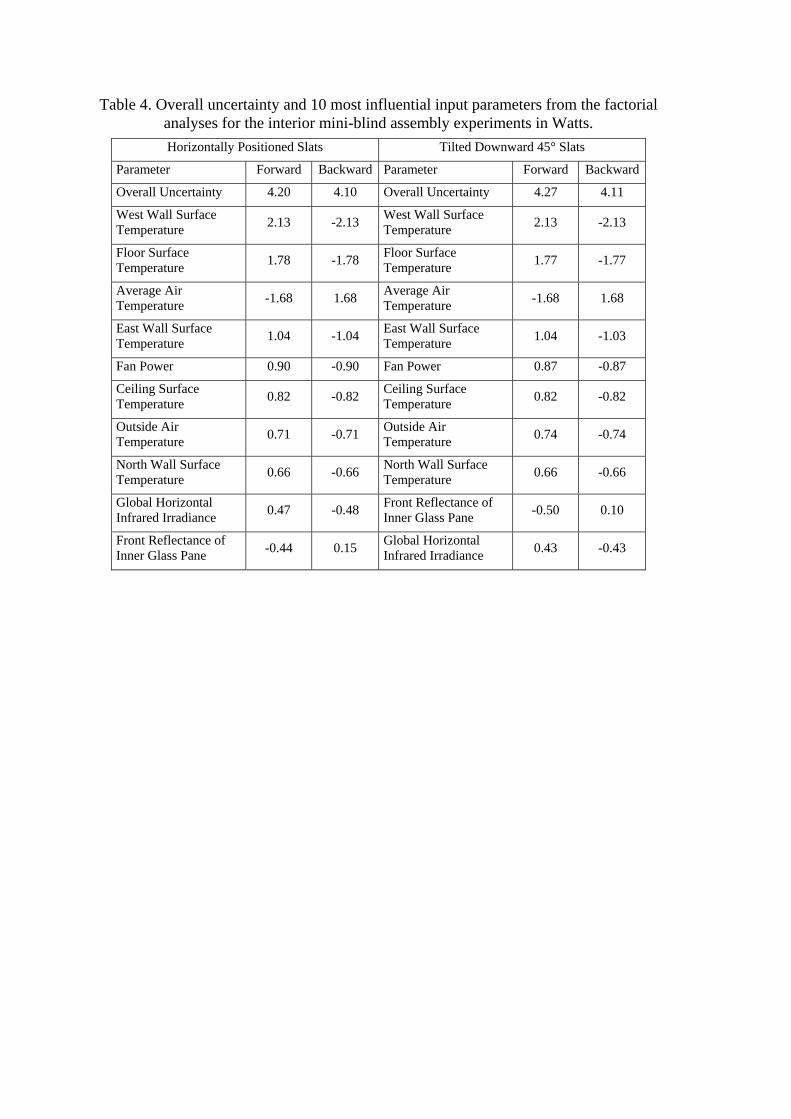
Table 4. Overall uncertainty and 10 most influential input parameters from the factorial analyses for the interior mini-blind assembly experiments in Watts. Horizontally Positioned Slats Tilted Downward 45° Slats
Parameter Forward Backward Parameter Forward Backward
Overall Uncertainty 4.20 4.10 Overall Uncertainty 4.27 4.11
West Wall Surface Temperature 2.13 -2.13 West Wall Surface
Temperature 2.13 -2.13
Floor Surface Temperature 1.78 -1.78 Floor Surface
Temperature 1.77 -1.77
Average Air Temperature -1.68 1.68 Average Air
Temperature -1.68 1.68
East Wall Surface Temperature 1.04 -1.04 East Wall Surface
Temperature 1.04 -1.03
Fan Power 0.90 -0.90 Fan Power 0.87 -0.87
Ceiling Surface Temperature 0.82 -0.82 Ceiling Surface
Temperature 0.82 -0.82
Outside Air Temperature 0.71 -0.71 Outside Air
Temperature 0.74 -0.74
North Wall Surface Temperature 0.66 -0.66 North Wall Surface
Temperature 0.66 -0.66
Global Horizontal Infrared Irradiance 0.47 -0.48 Front Reflectance of
Inner Glass Pane -0.50 0.10
Front Reflectance of Inner Glass Pane -0.44 0.15 Global Horizontal
Infrared Irradiance 0.43 -0.43
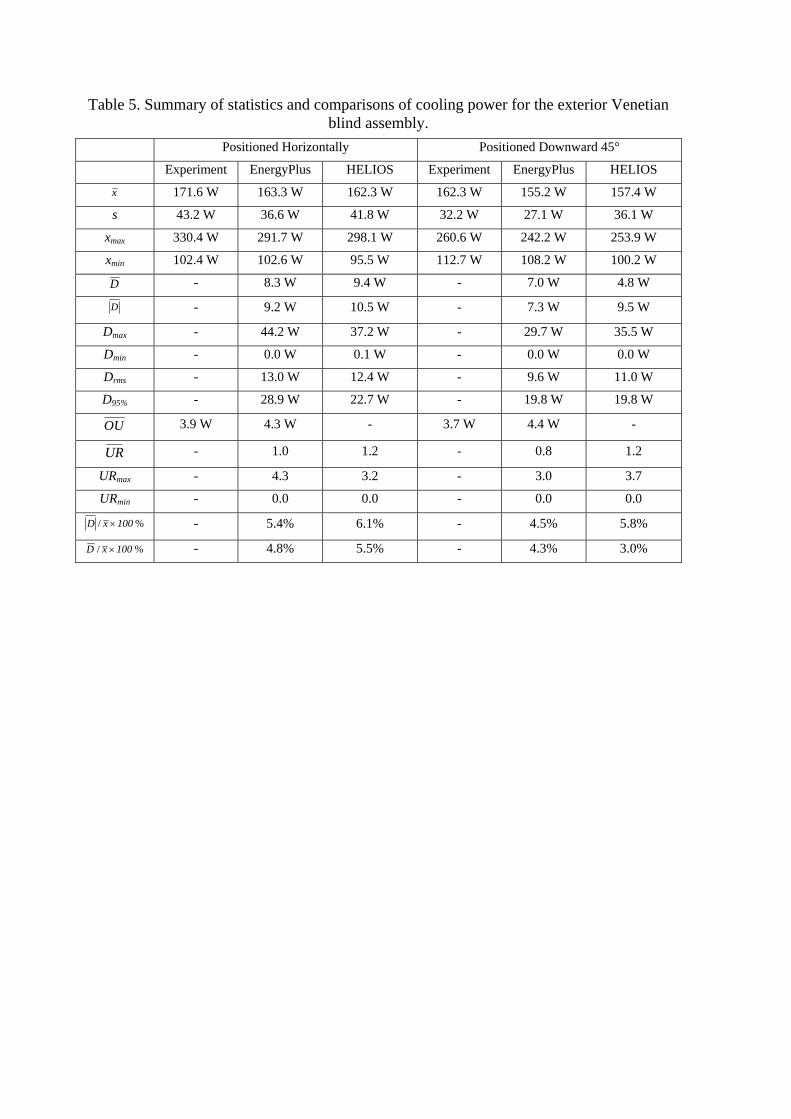
Table 5. Summary of statistics and comparisons of cooling power for the exterior Venetian blind assembly.
Positioned Horizontally Positioned Downward 45°
Experiment EnergyPlus HELIOS Experiment EnergyPlus HELIOS
x 171.6 W 163.3 W 162.3 W 162.3 W 155.2 W 157.4 W
s 43.2 W 36.6 W 41.8 W 32.2 W 27.1 W 36.1 W
xmax 330.4 W 291.7 W 298.1 W 260.6 W 242.2 W 253.9 W
xmin 102.4 W 102.6 W 95.5 W 112.7 W 108.2 W 100.2 W
D - 8.3 W 9.4 W - 7.0 W 4.8 W
D - 9.2 W 10.5 W - 7.3 W 9.5 W
Dmax - 44.2 W 37.2 W - 29.7 W 35.5 W
Dmin - 0.0 W 0.1 W - 0.0 W 0.0 W
Drms - 13.0 W 12.4 W - 9.6 W 11.0 W
D95% - 28.9 W 22.7 W - 19.8 W 19.8 W
OU 3.9 W 4.3 W - 3.7 W 4.4 W -
UR - 1.0 1.2 - 0.8 1.2
URmax - 4.3 3.2 - 3.0 3.7
URmin - 0.0 0.0 - 0.0 0.0
%/ 100xD × - 5.4% 6.1% - 4.5% 5.8%
%/ 100xD × - 4.8% 5.5% - 4.3% 3.0%
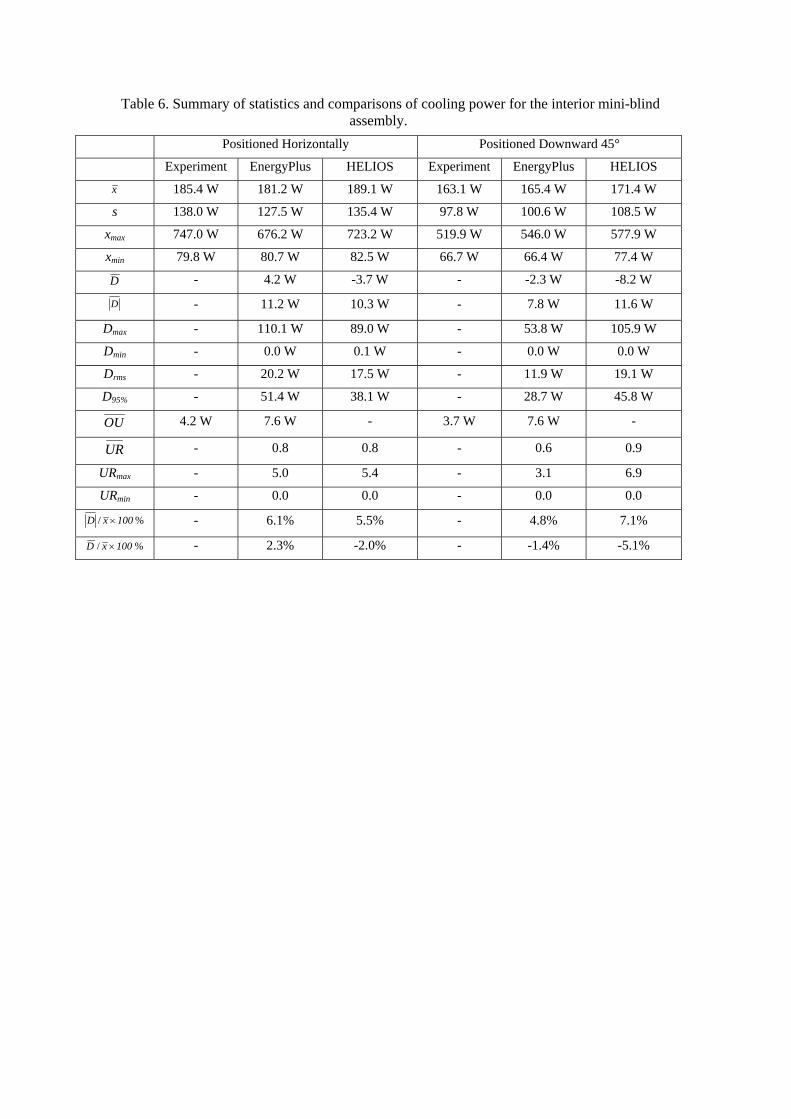
Table 6. Summary of statistics and comparisons of cooling power for the interior mini-blind assembly.
Positioned Horizontally Positioned Downward 45°
Experiment EnergyPlus HELIOS Experiment EnergyPlus HELIOS
x 185.4 W 181.2 W 189.1 W 163.1 W 165.4 W 171.4 W
s 138.0 W 127.5 W 135.4 W 97.8 W 100.6 W 108.5 W
xmax 747.0 W 676.2 W 723.2 W 519.9 W 546.0 W 577.9 W
xmin 79.8 W 80.7 W 82.5 W 66.7 W 66.4 W 77.4 W
D - 4.2 W -3.7 W - -2.3 W -8.2 W
D - 11.2 W 10.3 W - 7.8 W 11.6 W
Dmax - 110.1 W 89.0 W - 53.8 W 105.9 W
Dmin - 0.0 W 0.1 W - 0.0 W 0.0 W
Drms - 20.2 W 17.5 W - 11.9 W 19.1 W
D95% - 51.4 W 38.1 W - 28.7 W 45.8 W
OU 4.2 W 7.6 W - 3.7 W 7.6 W -
UR - 0.8 0.8 - 0.6 0.9
URmax - 5.0 5.4 - 3.1 6.9
URmin - 0.0 0.0 - 0.0 0.0
%/ 100xD × - 6.1% 5.5% - 4.8% 7.1%
%/ 100xD × - 2.3% -2.0% - -1.4% -5.1%

Figure 1. Venetian blind assembly mounted over the test cell glazing unit.
Figure 2. A front and side view of the interior mini-blind assembly mounted over the
glazing unit from inside the test cell.

0
10
20
30
40
50
60
70
80
500 1000 1500 2000 2500
Venetian Blind SlatsMini-Blind Slats
Ref
lect
anec
, %
Wavelength, nm Figure 3. Blind slat reflectance as a function of wavelength.
93.1
62.0 23.0
24.1
Figure 4. Blind slats in the exterior Venetian blind assembly (left) and the interior mini-blind assembly (right) dimensioned in mm.
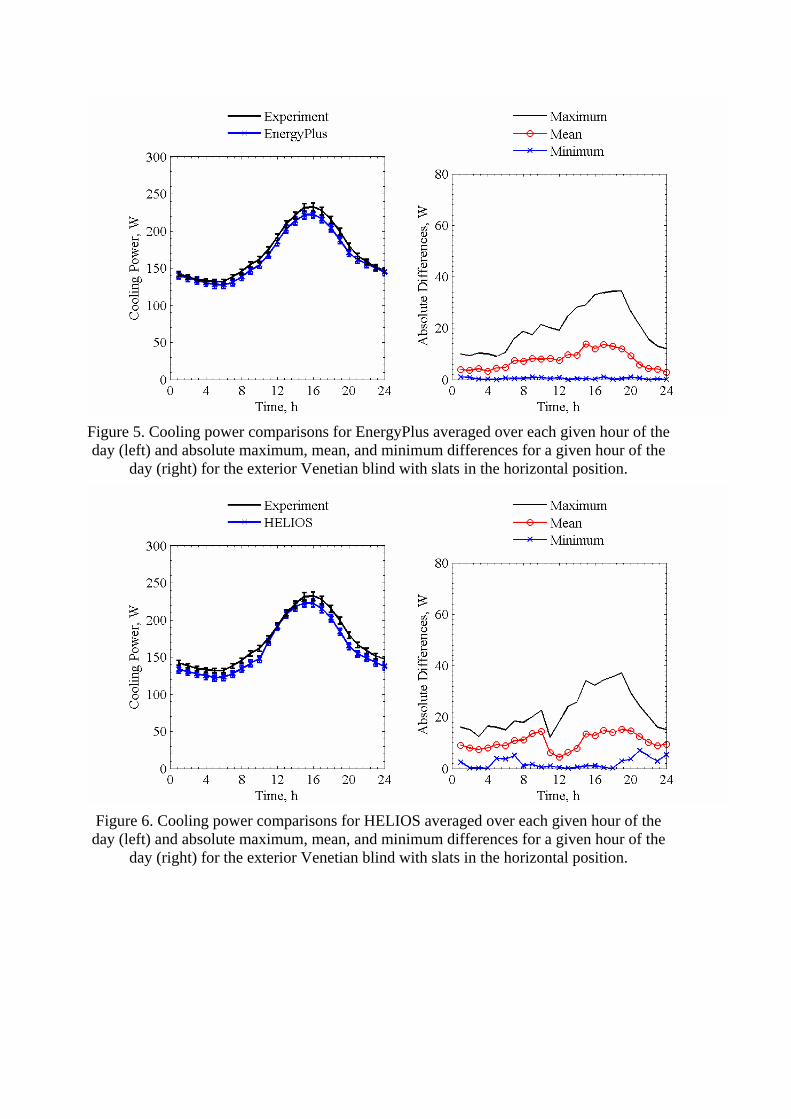
Figure 5. Cooling power comparisons for EnergyPlus averaged over each given hour of the day (left) and absolute maximum, mean, and minimum differences for a given hour of the
day (right) for the exterior Venetian blind with slats in the horizontal position.
Figure 6. Cooling power comparisons for HELIOS averaged over each given hour of the day (left) and absolute maximum, mean, and minimum differences for a given hour of the
day (right) for the exterior Venetian blind with slats in the horizontal position.
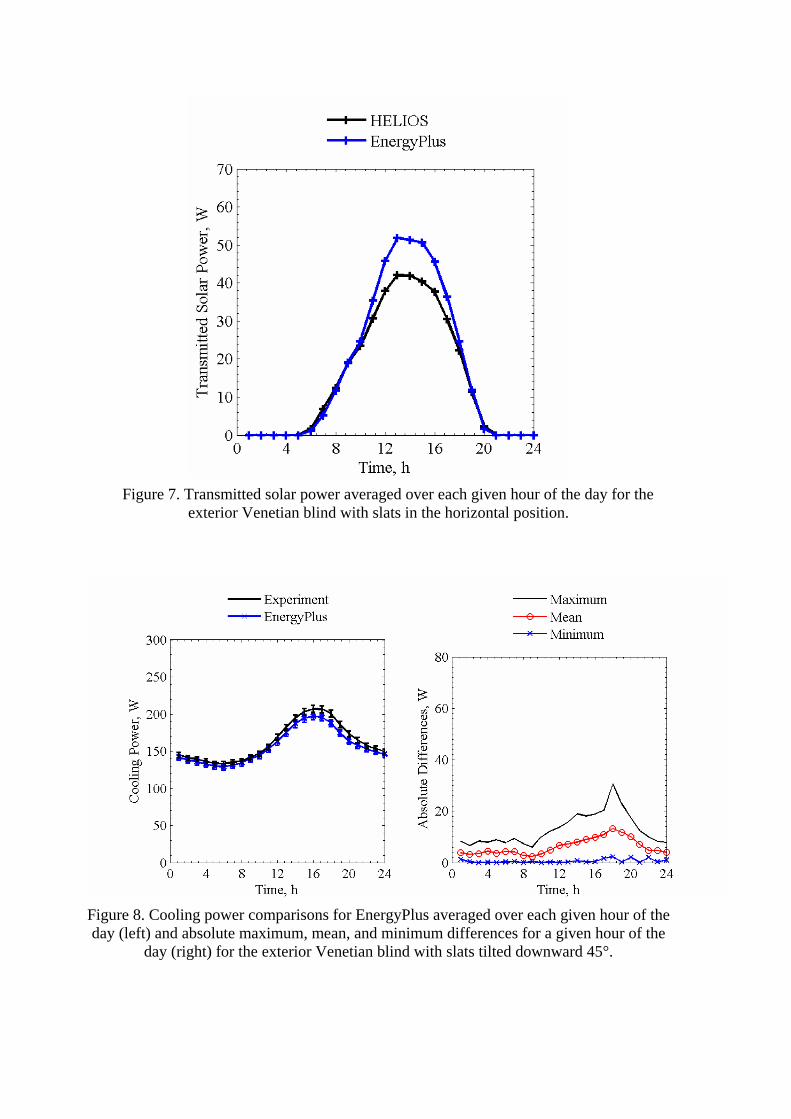
Figure 7. Transmitted solar power averaged over each given hour of the day for the
exterior Venetian blind with slats in the horizontal position.
Figure 8. Cooling power comparisons for EnergyPlus averaged over each given hour of the day (left) and absolute maximum, mean, and minimum differences for a given hour of the
day (right) for the exterior Venetian blind with slats tilted downward 45°.
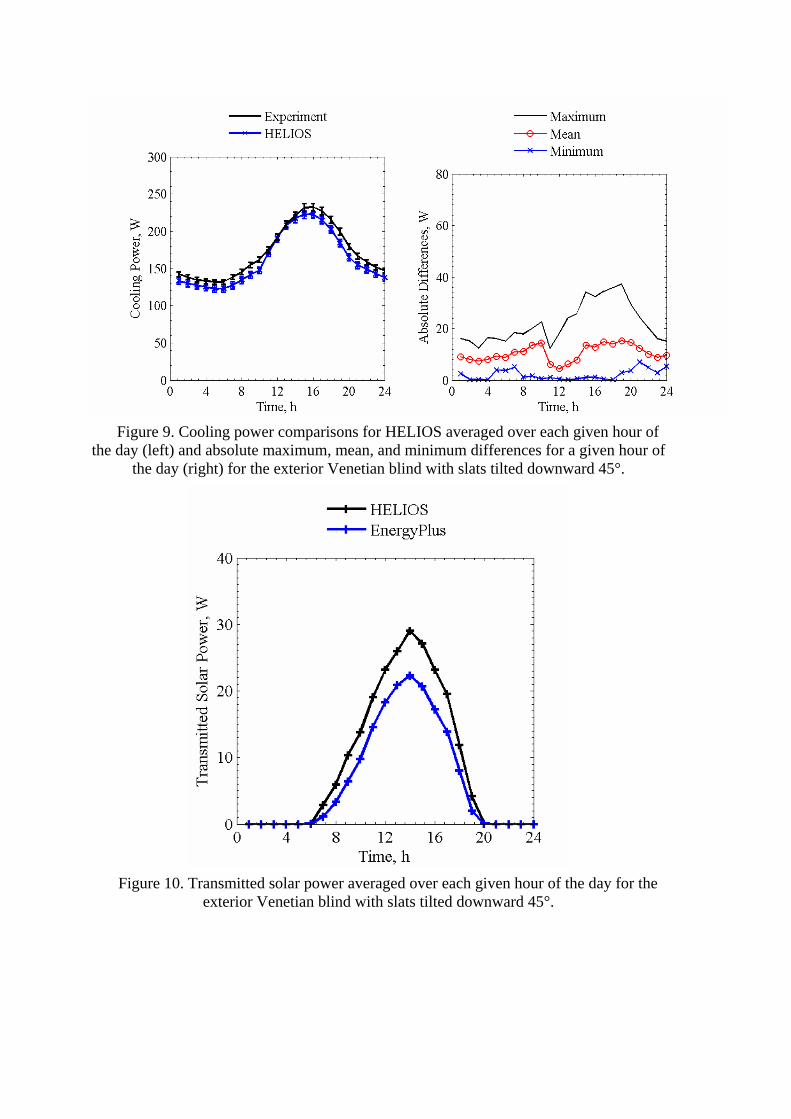
Figure 9. Cooling power comparisons for HELIOS averaged over each given hour of
the day (left) and absolute maximum, mean, and minimum differences for a given hour of the day (right) for the exterior Venetian blind with slats tilted downward 45°.
Figure 10. Transmitted solar power averaged over each given hour of the day for the
exterior Venetian blind with slats tilted downward 45°.

Figure 11. Cooling power comparisons for EnergyPlus averaged over each given hour of the day (left) and absolute maximum, mean, and minimum differences for a given hour of
the day (right) for the interior mini-blind with slats in the horizontal position.
Figure 12. Cooling power comparisons for HELIOS averaged over each given hour of the day (left) and absolute maximum, mean, and minimum differences for a given hour of the
day (right) for the interior mini-blind with slats in the horizontal position.

Figure 13. Transmitted solar power averaged over each given hour of the day for the
interior mini-blind with slats in the horizontal position.
Figure 14. Cooling power comparisons for EnergyPlus averaged over each given hour of the day (left) and absolute maximum, mean, and minimum differences for a given hour of
the day (right) for the interior mini-blind with slats tilted downward 45°.
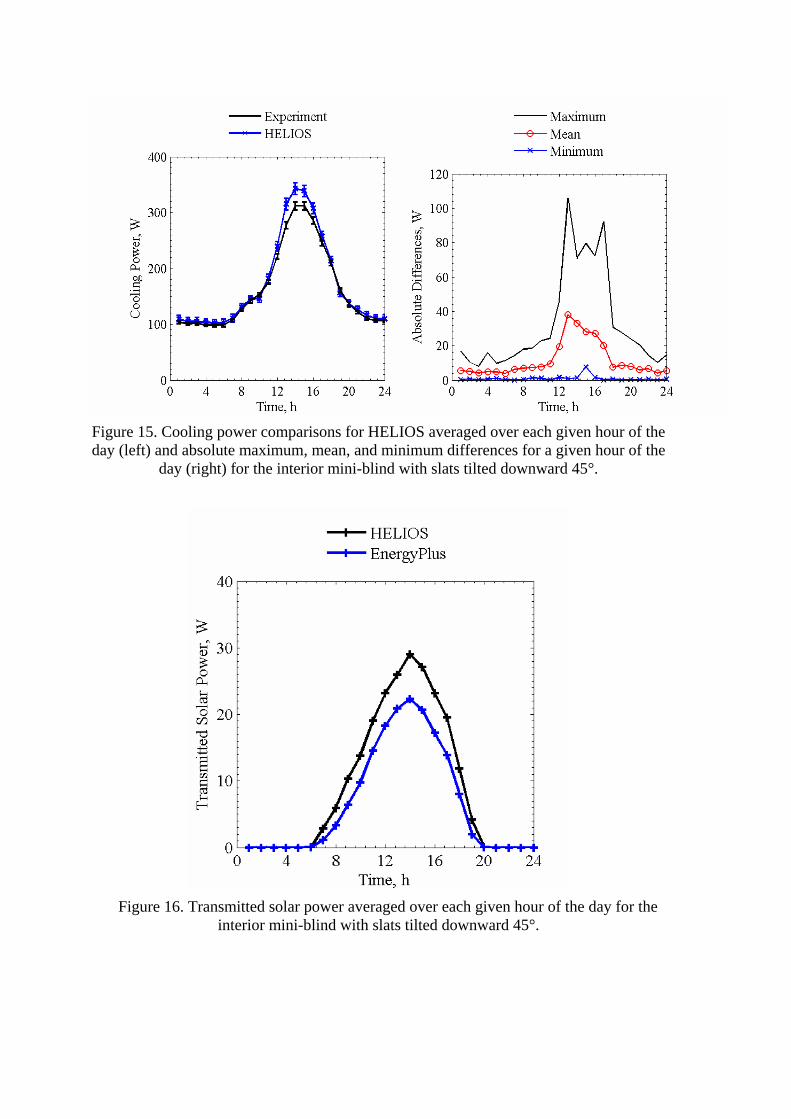
Figure 15. Cooling power comparisons for HELIOS averaged over each given hour of the day (left) and absolute maximum, mean, and minimum differences for a given hour of the
day (right) for the interior mini-blind with slats tilted downward 45°.
Figure 16. Transmitted solar power averaged over each given hour of the day for the
interior mini-blind with slats tilted downward 45°.