Study report SR039 The behaviour of external glazing ...
66
CUSfB (21.4) 1 Ro 1 (54) Date February 1991 STUDY REPORT NO. 39 (1 991) THE BEHAVIOUR OF EXTERNAL GLAZING SYSTEMS UNDER SEISMIC IN-PLANE RACKING K.Y.S. Lim A.B. King
-
Upload
khangminh22 -
Category
Documents
-
view
3 -
download
0
Transcript of Study report SR039 The behaviour of external glazing ...
CUSfB (21.4) 1 Ro 1 (54)
Date February 1991
STUDY REPORT NO. 39 (1 991)
THE BEHAVIOUR OF EXTERNAL GLAZING SYSTEMS UNDER SEISMIC
IN-PLANE RACKING
K.Y.S. Lim A.B. King
PREFACE
This study forms the second part of a research programme undertaken by BRANZ on the behaviour of glazing systems under seismic induced in-plane racking. The first part resulted in the BRANZ Study Report SR17 entitled "The development of a procedure and rig for testing the racking resistance of curtain wall glazing".
ACKNOWLEDGEMENTS
The authors acknowledge the grant from the Earthquake and War Damage Commission for this project. The authors also wish to thank Adlite (1988) Limited; New Zealand Aluminium Franchising; Thermosash Commercial Limited; Winstone Architectural Cladding; Winstone Glass, and Upton and Shearer (Nebulite) for supporting this project.
NOTE
The mention of trade names in this report does not imply exclusion of other products or practices for these applications, nor specific endorsement by the Association.
This report is intended for structural engineers, architects, designers, manufacturers and other workers in the field of glazing and engineering research.
THE BEHAVIOUR OF EXTERNAL GLAZING SYSTEMS UNDER SEISMIC IN-PLANE RACKING
BRANZ Study Report SR 39
REFERENCE
K.Y.S. Lim A.B. King
Lim, K.Y.S. and King, A.B. 1990. The behaviour of external glazing systems under seismic in-plane racking. Building Research Association of New Zealand. Study Report SR 39. Judgeford.
KEYWORDS
From Construction Industry Thesaurus - Branz Edition: Curtain Walling; Drift; Earthquake; Full-size; Glass; Glazing Systems; In-plane Behaviour; Method of Test; Nonstructural Elements; Racking Tests; Seismic ; Separation; Structural Elements; Sealants; Structural Silicone.
ABSTRACT
The in-plane behaviour of external curtain wall glazing systems when buildings respond to seismic loading is not understood. This is a cause of great concern for the safety of pedestrians and occupants of buildings during earthquake attacks. This work forms the second phase of a research programme undertaken by BRANZ to determine the performance of external glazing systems used in multi- storey buildings when subj ected to seismic induced racking. The objective of this study was to verify that the performance of curtain wall glazing systems can be adequately modelled within a laboratory environment. Another objective was to identify the parameters which affect the performance of curtain wall glazing systems when subjected to seismic in-plane racking, thereby enabling a suitable test method to be developed.
This report describes the experimental racking tests carried out on five full-size generic glazing systems. The parameters studied included displacement rates (period); boundary conditions (building deformation characteristics and two specimen configurations); number of cycles at each amplitude, and different incremental cyclic displacement. To investigate the effect resulting from torsion, a 30 mm out-of-plane skewness was also introduced to three systems. The effects at corners of buildings and the bidirectional deformation of glazing systems were not studied.
The results indicated that the displacement rate is the main parameter affecting the behaviour of the systems tested. Multiple cycles at each amplitude increased the amount of gasket slipping out of framing members, thus affecting its serviceability. No significant difference in behaviour of the glazing systems was obsewed under different incremental displacements. The effect of the 30 mm skewness, different boundary conditions, and different specimen configuration affected different glazing systems in different ways. The results of the glazing systems tested indicated that in general, they would perform we11 under an earthquake attack when installed upon buildings designed to current code requirements. In addition, the stiffness and damping of the systems were calculated. Unless glazing systems are actively separated from the structure, their stiffness contribution to the total storey stiffness may be significant, particularly in the initial stage.

CONTENTS
1.0 INTRODUCTION
1.1 Previous Racking Tests on Glazing Elements
2.0 TEST PROGRAMME
2.1 Test Procedure 2.2 Test Rig 2.3 Test Instrumentation 2.3.1 Servoactuator and Data Acquisition 2.3.2 Deflection Measurements 2.4 Description of Test Specimens 2.4.1 Gasket Glazed System 2.4.2 Patch Fitting System 2.4.3 Two-sided Silicone System 2.4.4 Unitised Four-sided Silicone System - 2.4.5 Window Panels
3.0 OBSERVATIONS AND RESULTS
3.1 Gasket Glazed System 3.2 Patch Fitting System 3.3 Two-sided Silicone System 3.4 Unitised Four-Sided Silicone System - 3.5 Window Panels
4.0 DISCUSSION
4.1 Effect of Displacement Rate 4.2 Effect of Skewness 4.3 Boundary Conditions 4.4 Different Incremental Displacem ents 4.5 Failure Modes and Performance of the 4.6 Miscellaneous Considerations 4.6.1 Stiffness 4.6.2 Damping
and Multiple Cycles Generic Systems
4.7 issues for Consideration in the Proposed Test Method
5.0 FUTURE WORK
6.0 CONCLUSIONS
REFERENCES
APPENDIX A : Example Showing Proportion of Glazing Stiffness to Total Storey Stiffness
Page
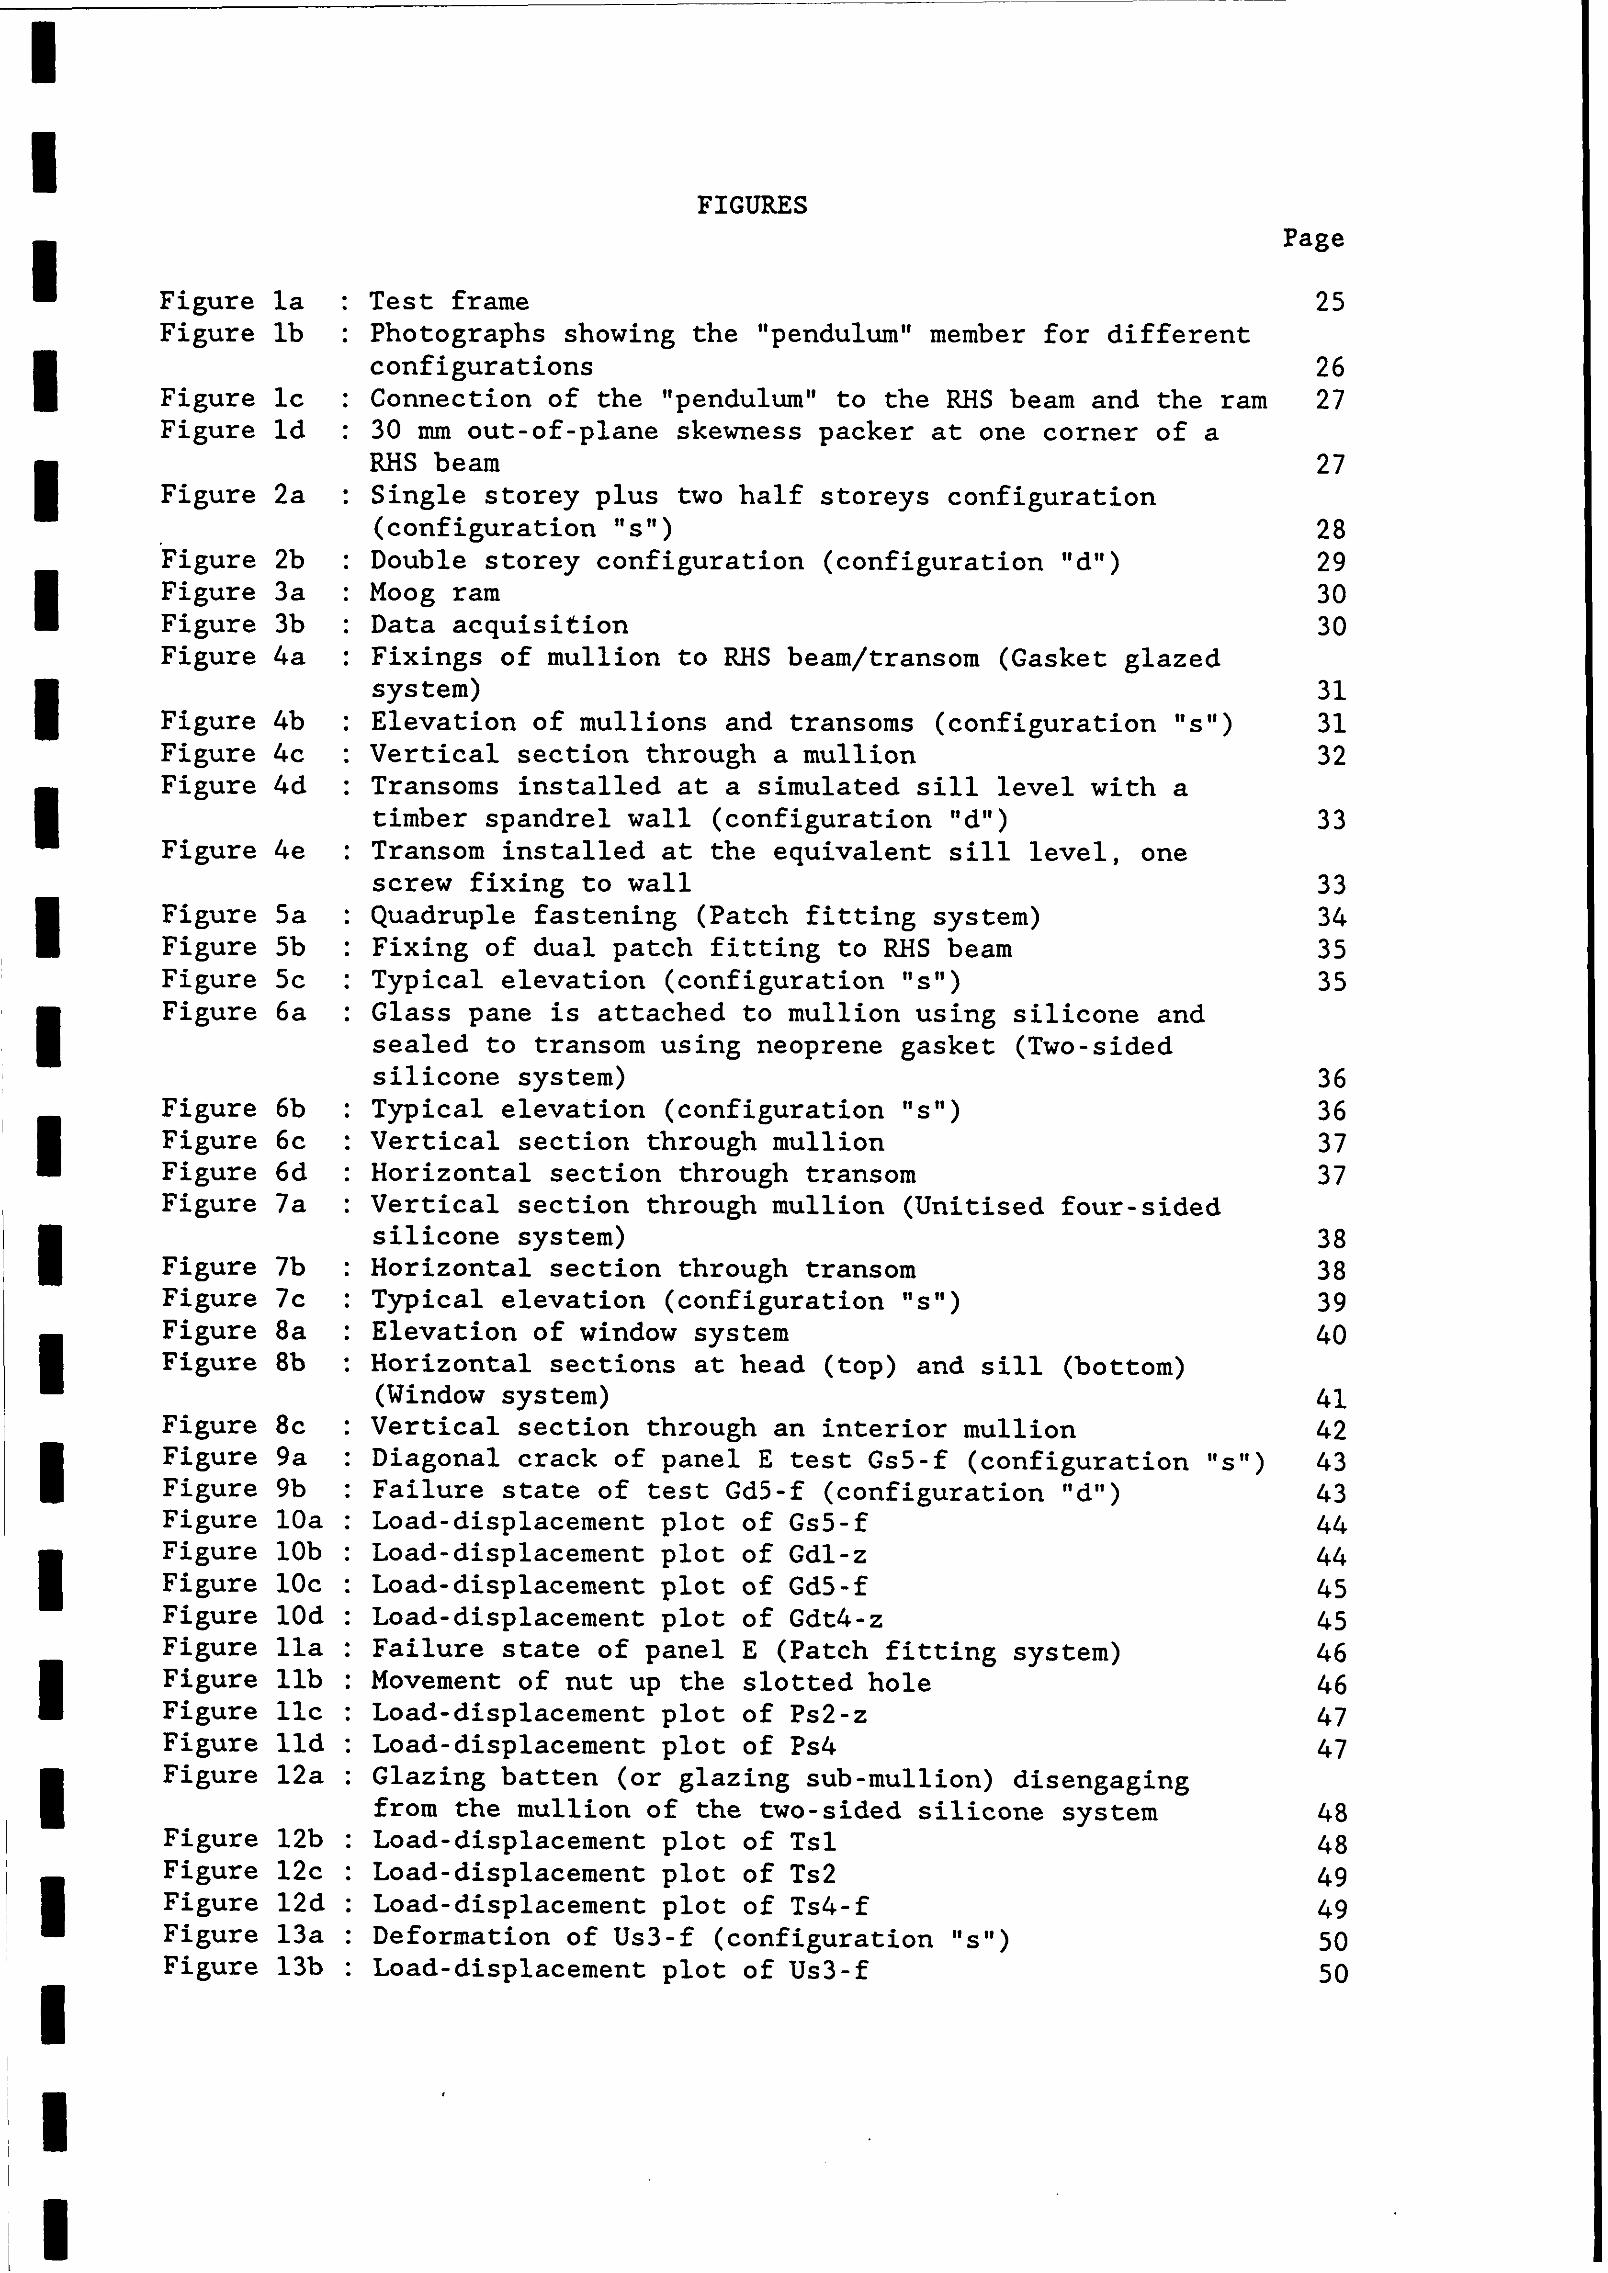
FIGURES Page
Figure la : Figure lb :
Figure lc : Figure id :
Figure 2a :
Figure 2b : Figure 3a : Figure 3b : Figure 4a :
Figure 4b : Figure 4c : Figure 4d :
Figure 4e :
Figure 5a : Figure 5b : Figure 5c : Figure 6a :
Figure 6b : Figure 6c : Figure 6d : Figure 7a :
Figure 7b : Figure 7c : Figure 8a : Figure 8b :
Figure 8c : Figure 9a : Figure 9b : Figure 10a : Figure lob : Figure 10c : Figure 10d : Figure lla : Figure llb : Figure llc : Figure lld : Figure 12a :
Figure 12b : Figure 12c : Figure 12d : Figure 13a : Figure 13b :
Test frame Photographs showing the "pendulum" member for different configurations Connection of the "pendulum" to the RHS beam and the ram 30 mm out-of-plane skewness packer at one corner of a RHS beam Single storey plus two half storeys configuration (configuration "s") Double storey configuration (configuration "d") Moog ram Data acquisition Fixings of mullion to RHS beam/transom (Gasket glazed sys tern) Elevation of mullions and transoms (configuration "s") Vertical section through a mullion Transoms installed at a simulated sill level with a timber spandrel wall (configuration "d") Transom installed at the equivalent sill level, one screw fixing to wall Quadruple fastening (Patch fitting system) Fixing of dual patch fitting to RHS beam Typical elevation (configuration "s") Glass pane is attached to mullion using silicone and sealed to transom using neoprene gasket (Two-sided silicone system) Typical elevation (configuration "s") Vertical section through mullion Horizontal section through transom Vertical section through mullion (Unitised four-sided silicone system) Horizontal section through transom Typical elevation (configuration "s") Elevation of window system Horizontal sections at head (top) and sill (bottom) (Window system) Vertical section through an interior mullion Diagonal crack of panel E test Gs5-f (configuration "s") Failure state of test Gd5-f (configuration "d") Load-displacement plot of Gs5-f Load-displacement plot of Gdl-z Load-displacement plot of Gd5-f Load-displacement plot of Gdt4-z Failure state of panel E (Patch fitting system) Movement of nut up the slotted hole Load-displacement plot of Ps2-z Load-displacement plot of Ps4 Glazing batten (or glazing sub-mullion) disengaging from the mullion of the two-sided silicone system Load-displacement plot of Tsl Load-displacement plot of Ts2 Load-displacement plot of Ts4-f Deformation of Us3-f (configuration "su) Load-displacement plot of Us3-f

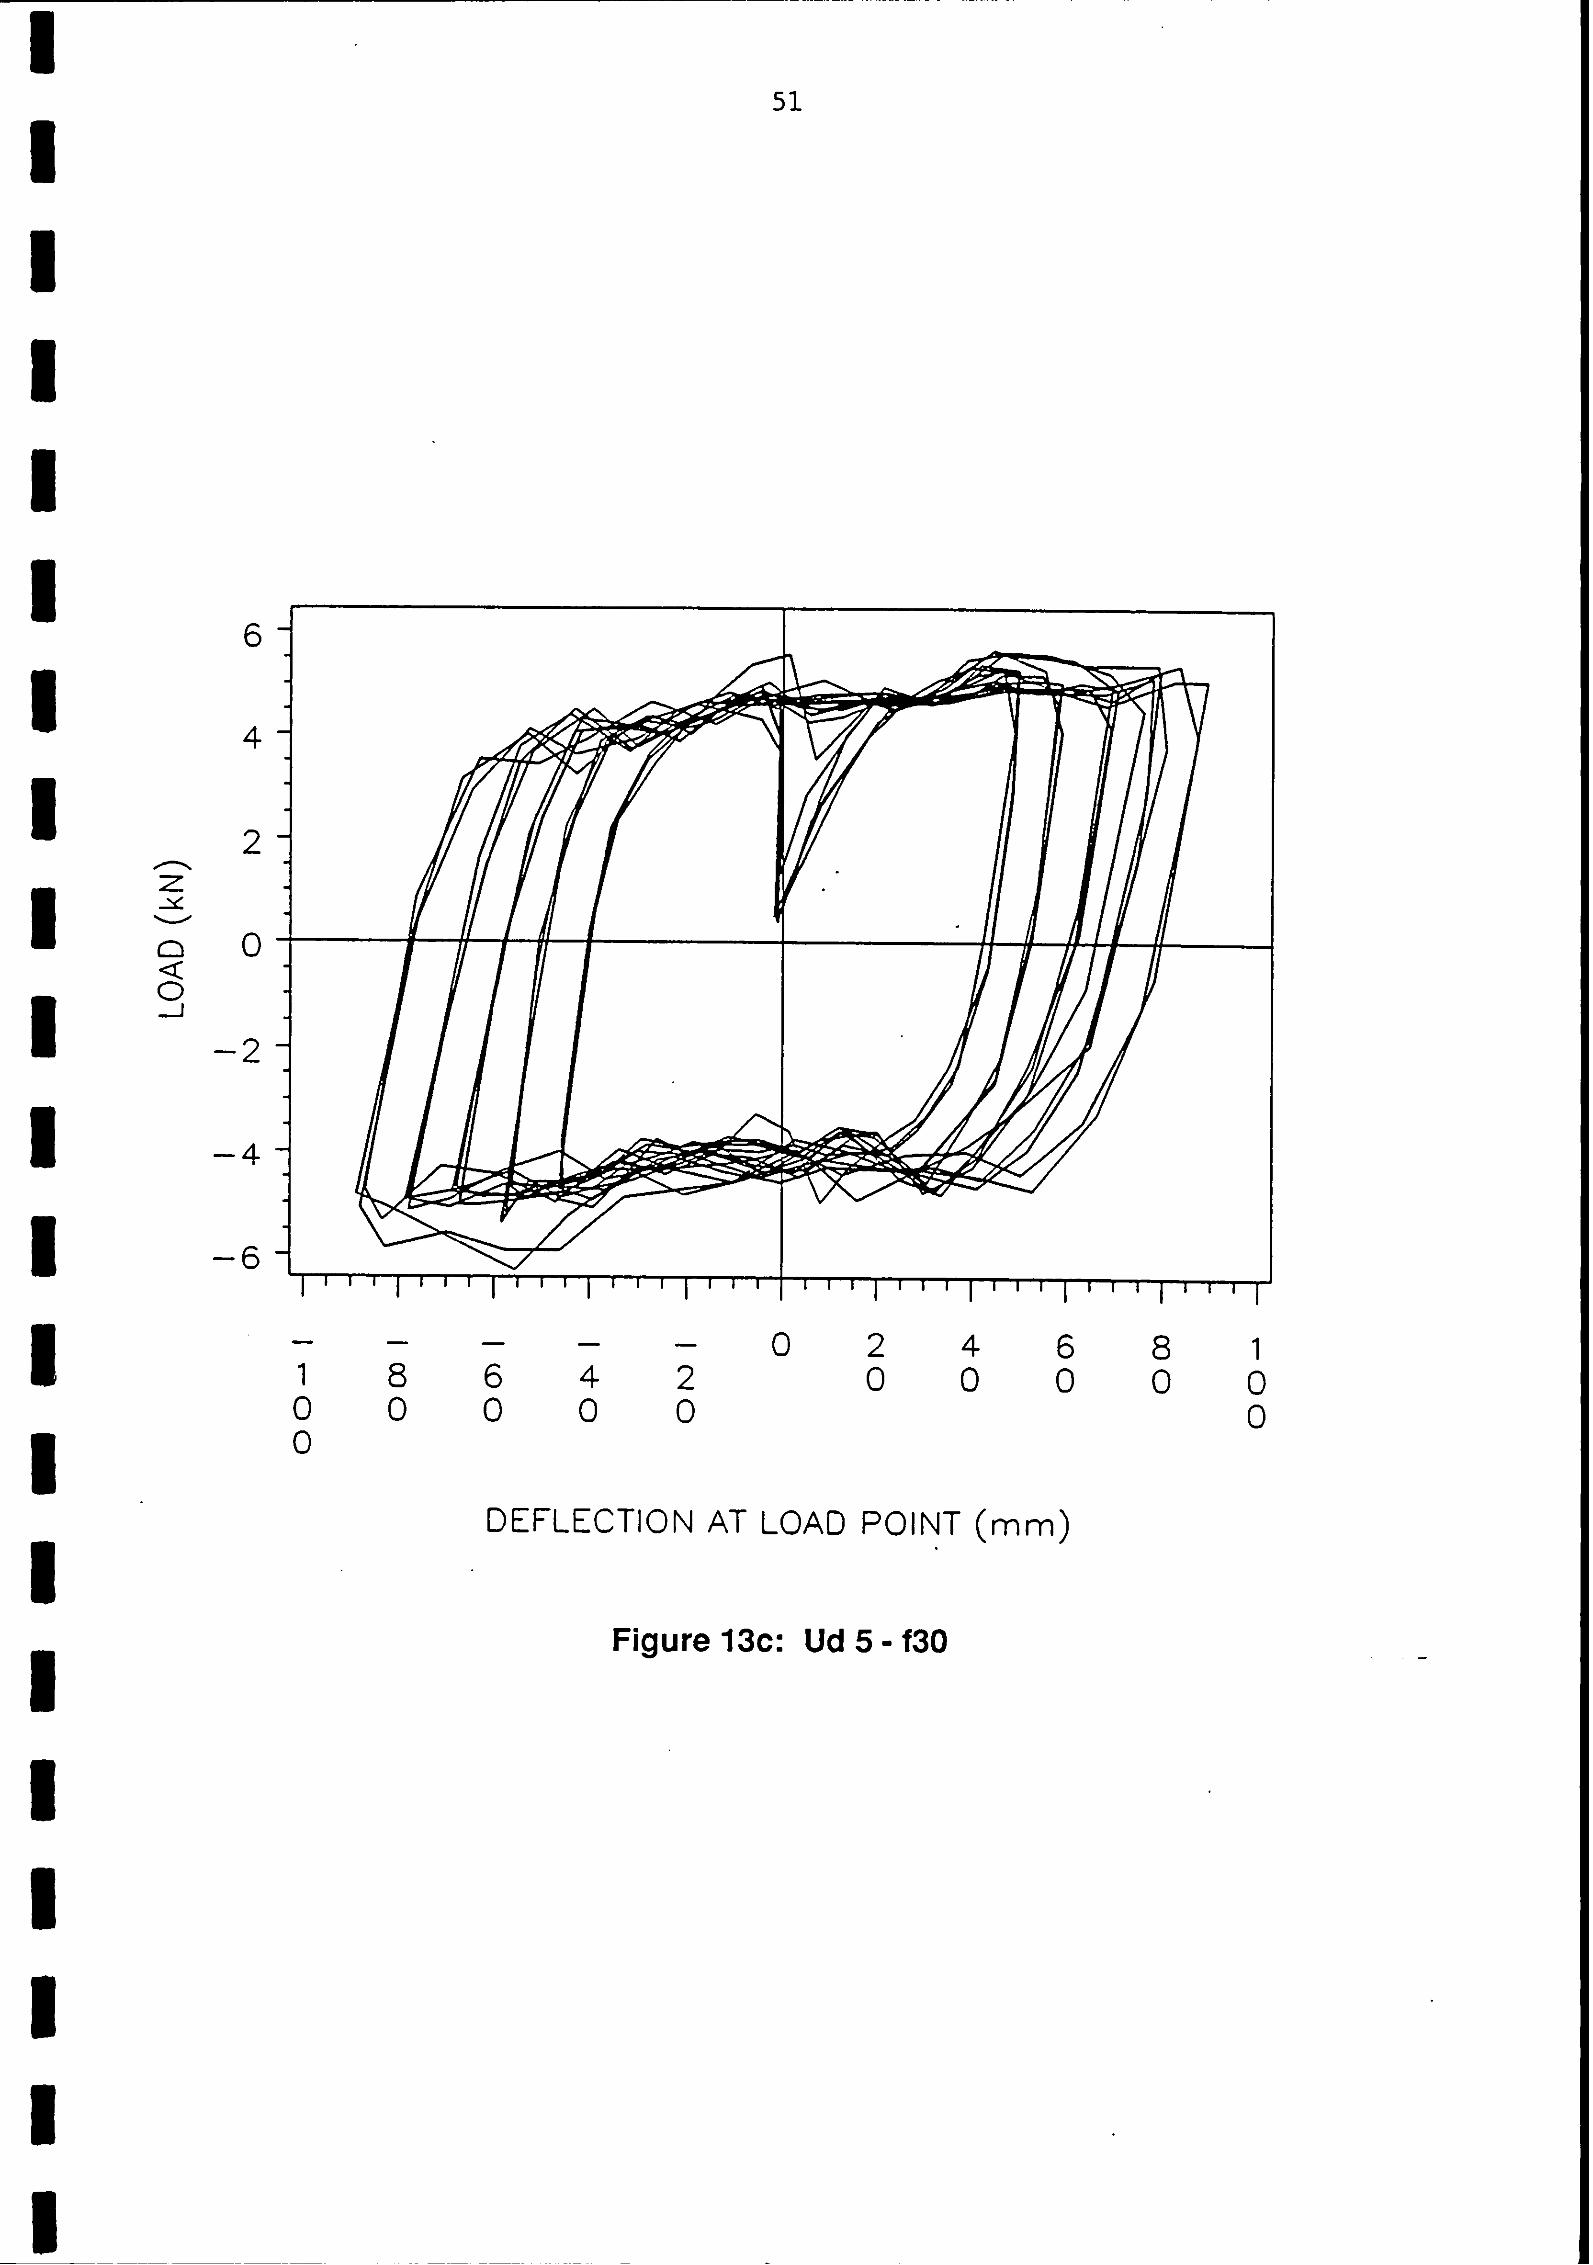
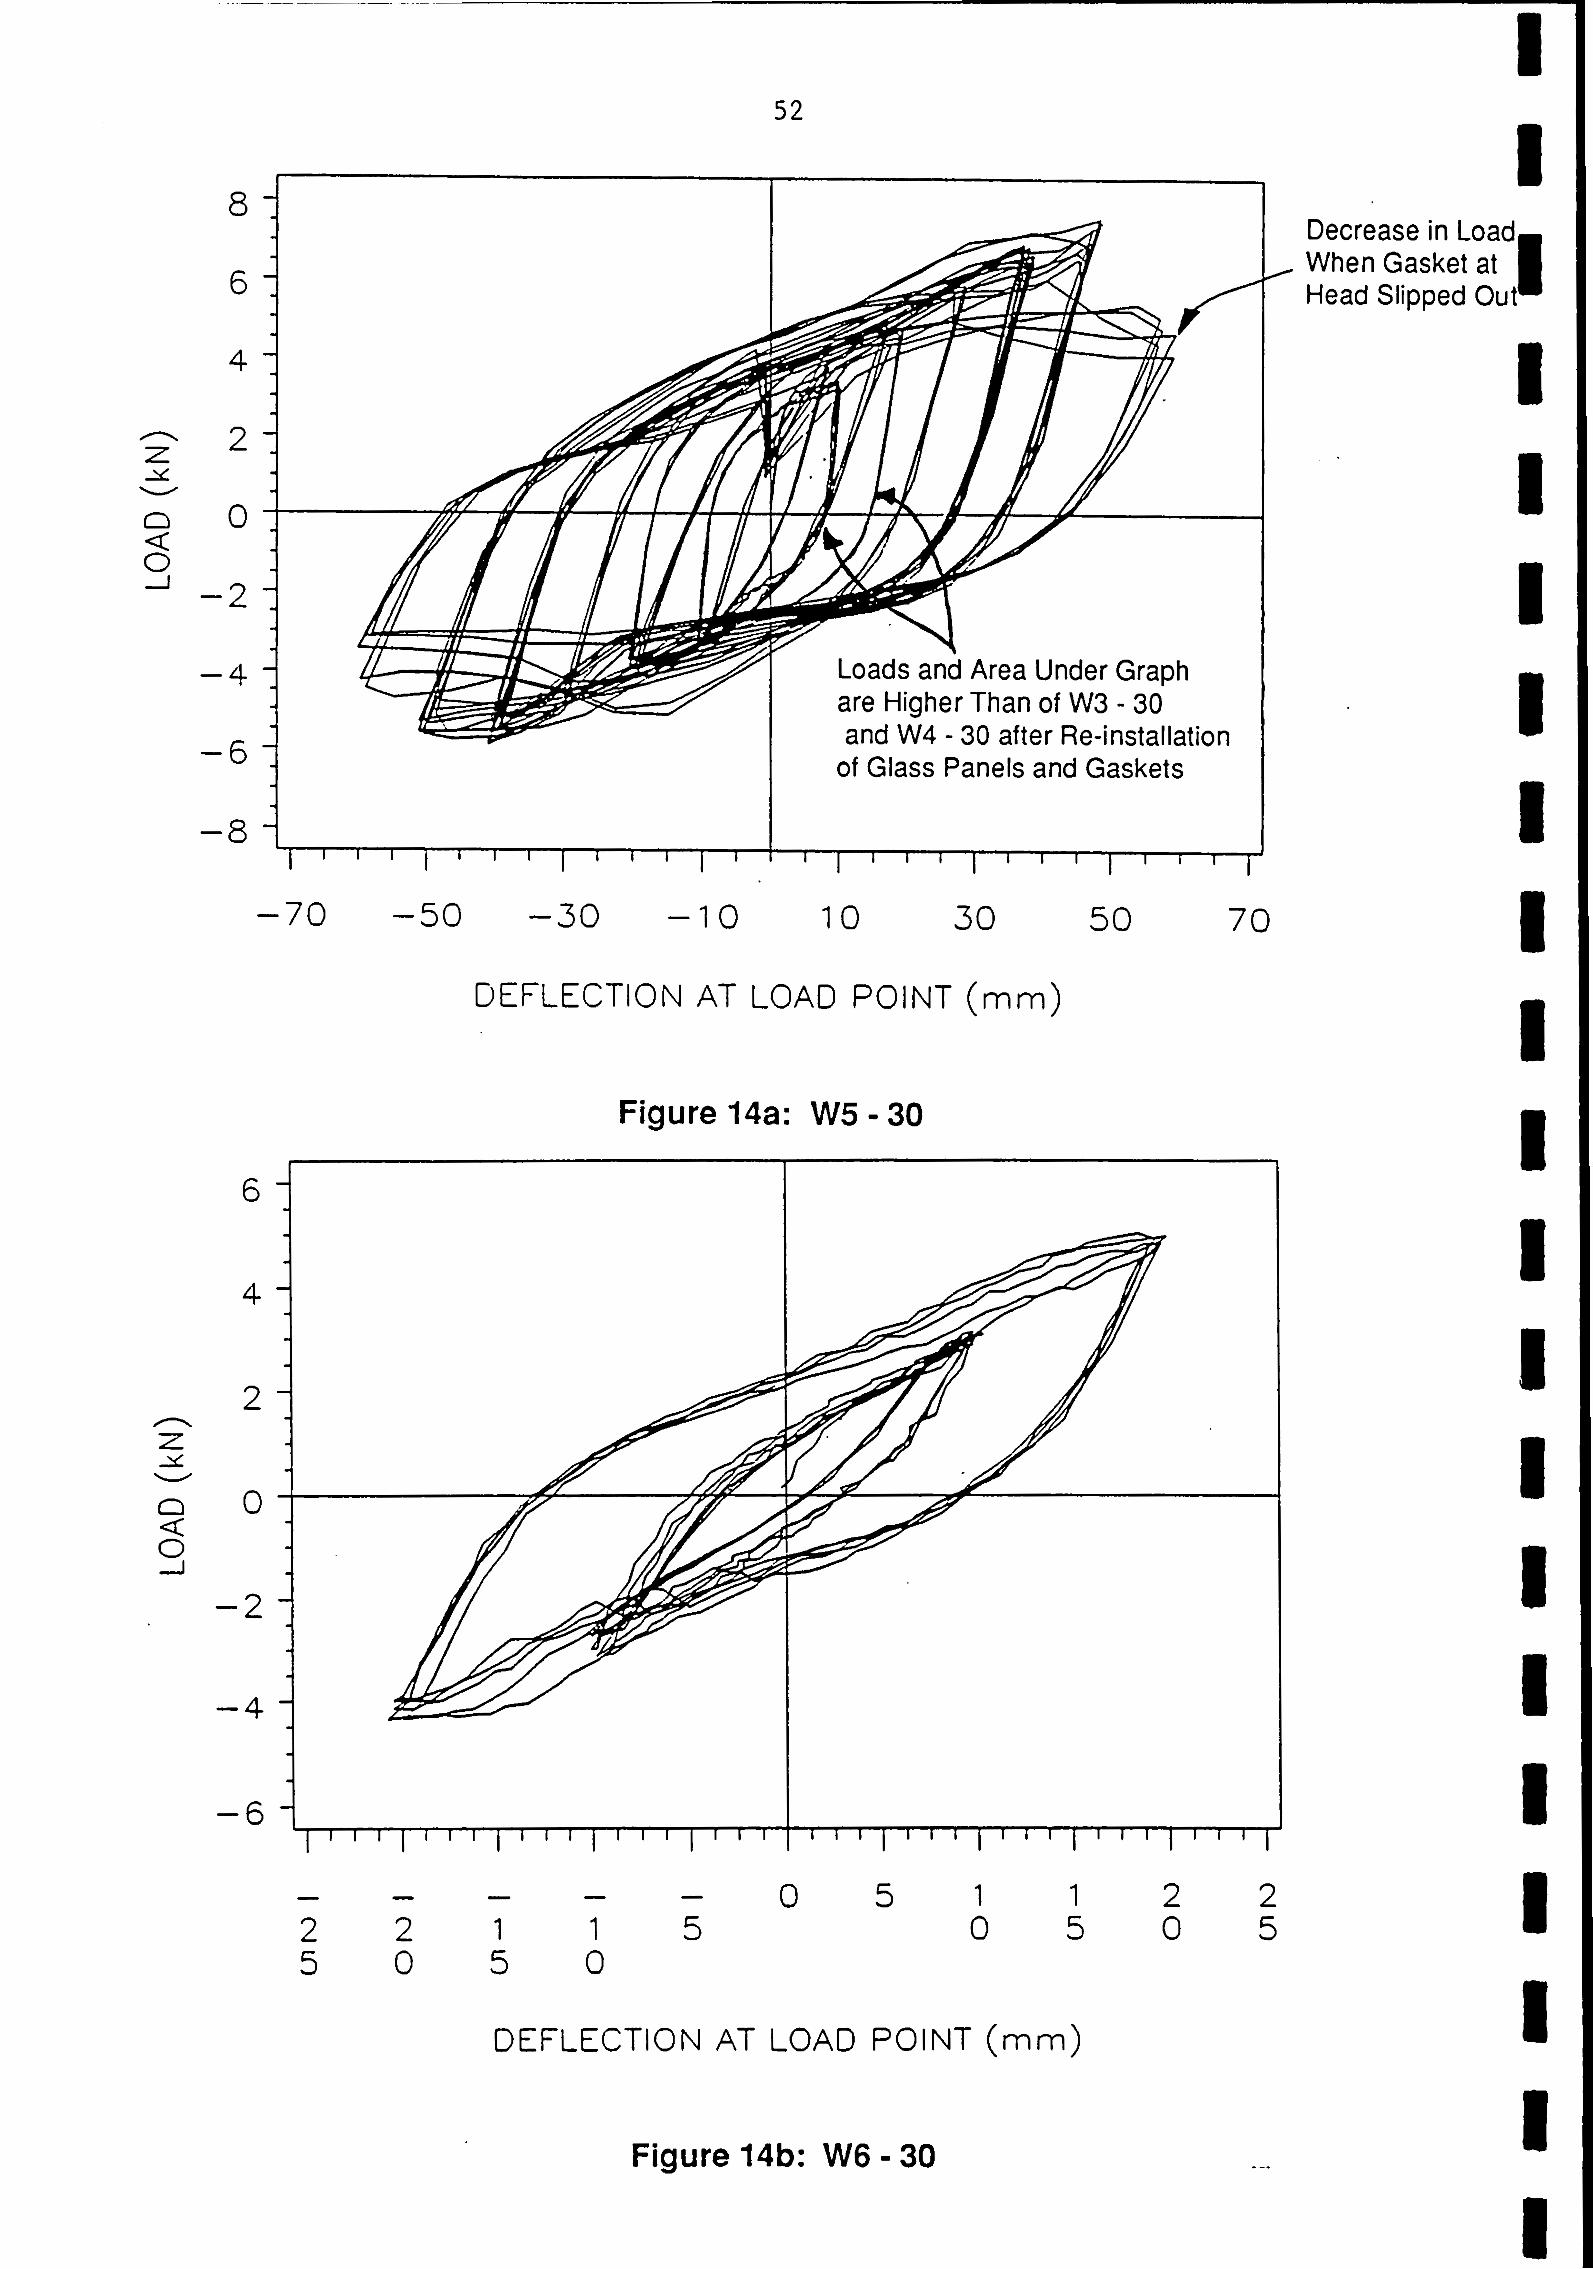
Figure 13c : Load-displacement plot of Ud5-f30 51 Figure 14a : Load-displacement plot of W5-30 52 Figure 14b : Load-displacement plot of W6-30 52 Figure 15 : Initial stiffness of the specimens 53 Figure 16a : Use of flexible seals at corners from Lapish (1989) 54 Figure 16b : Use of a ductile bracket for curved glazing from Lapish
(1989) 54

TABLES
Table 1 : Systems and Test d e t a i l s Table 2 : Summary of Results Table 3 : Predicted St i f fness Table 4 : Calculated Damping
Page
THE BEHAVIOUR OF EXTERNAL GLAZING SYSTEMS UNDER SEISMIC IN-PLANE RACKING
1.0 INTRODUCTION
As a result of substantial research efforts in the last several decades, designers now have a clearer understanding of the response of structural elements under earthquake loadings. In New Zealand, the "Capacity design procedure" of NZS 4203 (Standards Association of New Zealand (SANZ), 1984) requires designers to assign energy dissipating elements to the primary structural members, enabling the response of buildings under seismic loading to be predicted. The response of external curtain wall glazing systems is however not understood. They are considered as non-structural components and are required to be isolated from the primary structure to accommodate structural movement under seismic loading.
Recent earthquakes such as the Mexico earthquake of 198 5 have indicated that there is widespread damage to glazing system causing glass to fall down the building (New Zealand Reconnaissance Team, 1985). After the San Francisco Earthquake (1989), local press interviews and reports indicated that there exists grave concern about the behaviour of glass curtain wall systems during an earthquake. The concern is both for the safety of pedestrians in the vicinity of buildings, and of occupants trying to escape from buildings.
NZSS 1900 Chapter 10 of the New Zealand Standard Model Building Bylaw (New Zealand Standards Institute, 1964), stipulates that external walls and panels are required to have a strength capable of safely withstanding stresses induced by their own weight and by wind and seismic loadings. NZS 4203 (SANZ, 1984) seeks to address the performance of curtain wall glazing under seismic in-plane action-by separating it from the structure. Without separation, the in-plane rigidity of curtain wall glazing may affect the chosen energy dissipating mechanism of a structure. Separation of curtain wall glazing systems is deemed to have been achieved when they are separated from the primary structure by the computed elastic interstorey drift (limited to 1% of each storey height). This limitation is arbitrary and attempts to control the P-delta effect which need not be considered in the design. The draft revision currently being prepared, DZ 4203 (SANZ, 1990) states that "parts and components" of buildings shall be detailed to accommodate building deflections without impact where collapse or damage would endanger people, or where the impact would alter the seismic response of the structure, or damage its load carrying elements. This draft code specifies an interstorey drift limitation of 1.5% of the storey height when the P-delta effects have not been considered, and a maximum of 2.0% of the storey height when P-delta effects have been specifically included in the analysis.
Conventional glazing systems incorporate framed mullions and transoms. Glass panes are embedded into the framing members and sealed using neoprene gaskets or sealants. During an earthquake, some of the interstorey drift of the building may be taken up by the clearance between the glass pane and the framing members, or alternatively by the use of a "sliding head" joint. Bennett (1987) acknowledged that structural silicone glazing systems would have some movement capability due to the elasticity of the silicone, but the ability of such a bead of silicone (usually between 8 to 12 mm) to withstand the interstorey drift (of 30 mm) under an earthquake attack was doubtful. Most structural silicone glazing systems
these days come in units. The seismic movement is normally taken up by the sliding transoms at each horizontal joint. It is to be noted that none of the methods described utilise active separation of the glazing system from the structure.
The first phase of BRANZ's work produced the BRANZ Study Report SR17 "The development of a procedure and rig for testing the racking resistance of curtain wall glazing" (Wright, 1989) . Wright recommended the use of , the "sliding beam" test rig. He stated that, while buildings can be subjected to a large range of deformations during an earthquake, the predominant deformation affecting curtain wall systems is in-plane racking, which is simulated by the sliding beam rig. The objective of this second phase of work was to verify that the performance of curtain wall glazing systems can be modelled by undertaking full-size racking tests within a laboratory environment. Another obj ective was to identify suitable parameters to enable a test method to be developed for assessing the performance of a glazing system when subjected to seismic-induced racking.
1.1 Previous Racking Tests on Glazing Elements
Bowkamp and Meehan (1960) performed a number of tests on window glazing panels up to 1.2x2.4 m. The parameters studied included sash type, glass type, sealant type, clearance of glass, location of fixings, size of sash, and loading type. The specimens were loaded unidirectionally to failure. Two load reversal (cyclic) tests were also carried out using 6 mm deflection increments in each direction. The results indicated that where there was clearance for movement of the glass in the sash, the drift that can be tolerated was considerable and given by the expression,
drift - 2c(l + h/w - 2c/w) . . . . . . . . . . [l] where h = the panel height; w a the panel width; c - the clearance between the glass and framing members.
The results of the load-reversal tests showed that the deflection at failure for identical panels were similar to those under a unidirectional load. Three types of failures were observed : crushing o f glass in one or both loaded corners for soft-sealant metal sash windows; a more "complete failure" for wood-sash windows as a result of the higher loads due to the restraining effect of the wood at both sides of the glass; buckling failure occurred at a considerably higher failure load due to the restraining effect of the hard-sealant, and over the total glazed area.
Schoeneck (1971) reported on the racking tests of glazing panels installed with a "resilienttt glazing gasket. Glass panels of dimensions 10O0x2300x6 mrn thick were tested in a steel frame. The clearance between the glass and the steel frame was 8 mm. Two other panels, one undersize, and the other oversize were also tested. A bidirectional test procedure of progressively increasing the load up to 2 in 3 minutes was used with a deflection of up to 44 mm being attained for the undersize panel. The results indicated that a deflection of 25 mm from the vertical could be tolerated. No failure of the glass was observed. The gasket web provided the clearance between the glass and the frame, cushioned the glass and absorbed the initial loading. The threshold load before deflection began was about 0.67 kN. After a deflection of 25 nun, the slope of the load-deflection curve increased rapidly.

McCue et a1 (1978) described the seismic performance testing of a mock-up unit of a curtain wall. The curtain wall was composed of steel mullions supporting glass vision panels (6 mm thick) and aluminium opaque panels (5 mm thick). The mock-up was two full stories plus one spandrel. The structural steel frame, to which the curtain wall test unit was anchored, simulated the actual structural frame to be constructed. The members representing the "test" floor level could be moved with respect to floor levels above and below, which were fixed. The wall panel was set-up such that the static racking tests deflected the floor at the "test" level to +18 mm and then to -18 rnm out-of-plane, and also at 45 degrees to the plane of the glass. No test was performed in the plane of the glass. The results indicated that movement normal to the test wall pane1 produced no effect. Movement at 45 degrees caused displacement of the glazing frame sills by 3 mm. The design criteria of 18 mm deflection both in-plane and out-of-plane were considered to be achieved.
Sakamoto et a1 (1984) discussed racking tests that have been carried out on various nonstructural elements. One finding of relevance was that adhesive films were effective in temporarily preventing broken glass from falling. A survey carried out indicated that the horizontal distance of fallen glass from a building was estimated to be about half the height of the original position of the glass. To avoid the life threatening hazards of falling glass, it was recommended that balconies of sufficient width be provided. From the results of racking tests carried out, the neoprene gasket for a fixed aluminium sash was pushed off at a displacement of 8 mrn, and cracking on the glass commenced at a displacement of 64 mrn.
Wade (1990) reported on a series of racking tests on an aluminium-framed glazed conservatory 4x2x2.5 m wide. The mullions, which were 2 m long, were installed at 800 mm centres and the transoms were installed at the mid-height of the mullions. The glass used was 5 mm annealed below, and 4 mm above the transom. The racking test was under displacement control and consisted of pushing the top of the wall out to an initial displacement of 10 mm; and then alternately reducing the displacement by 5 mm and increasing it by 15 mm (at a slow rate), until failure. Failure occurred at a displacement of 93 mm at the top corner of a pane of glass below one transom and consisted of an arc-shaped crack. The glass however remained in the frame.
2 . 0 TEST PROGRAMME
2.1 Test Procedure
Five full-size generic systems namely : gasket glazed; patch fitting; two- sided silicone; unitised four-sided silicone, and conventional window systems were tested. The tests were conducted at the BRANZ Structural Engineering Laboratory at Judgeford. The parameters investigated included the effect of : -
(a) different displacement rates (2, 5, 10, 15, 35, 50, 60 or 70 mm/s);
(f)
(g)
The
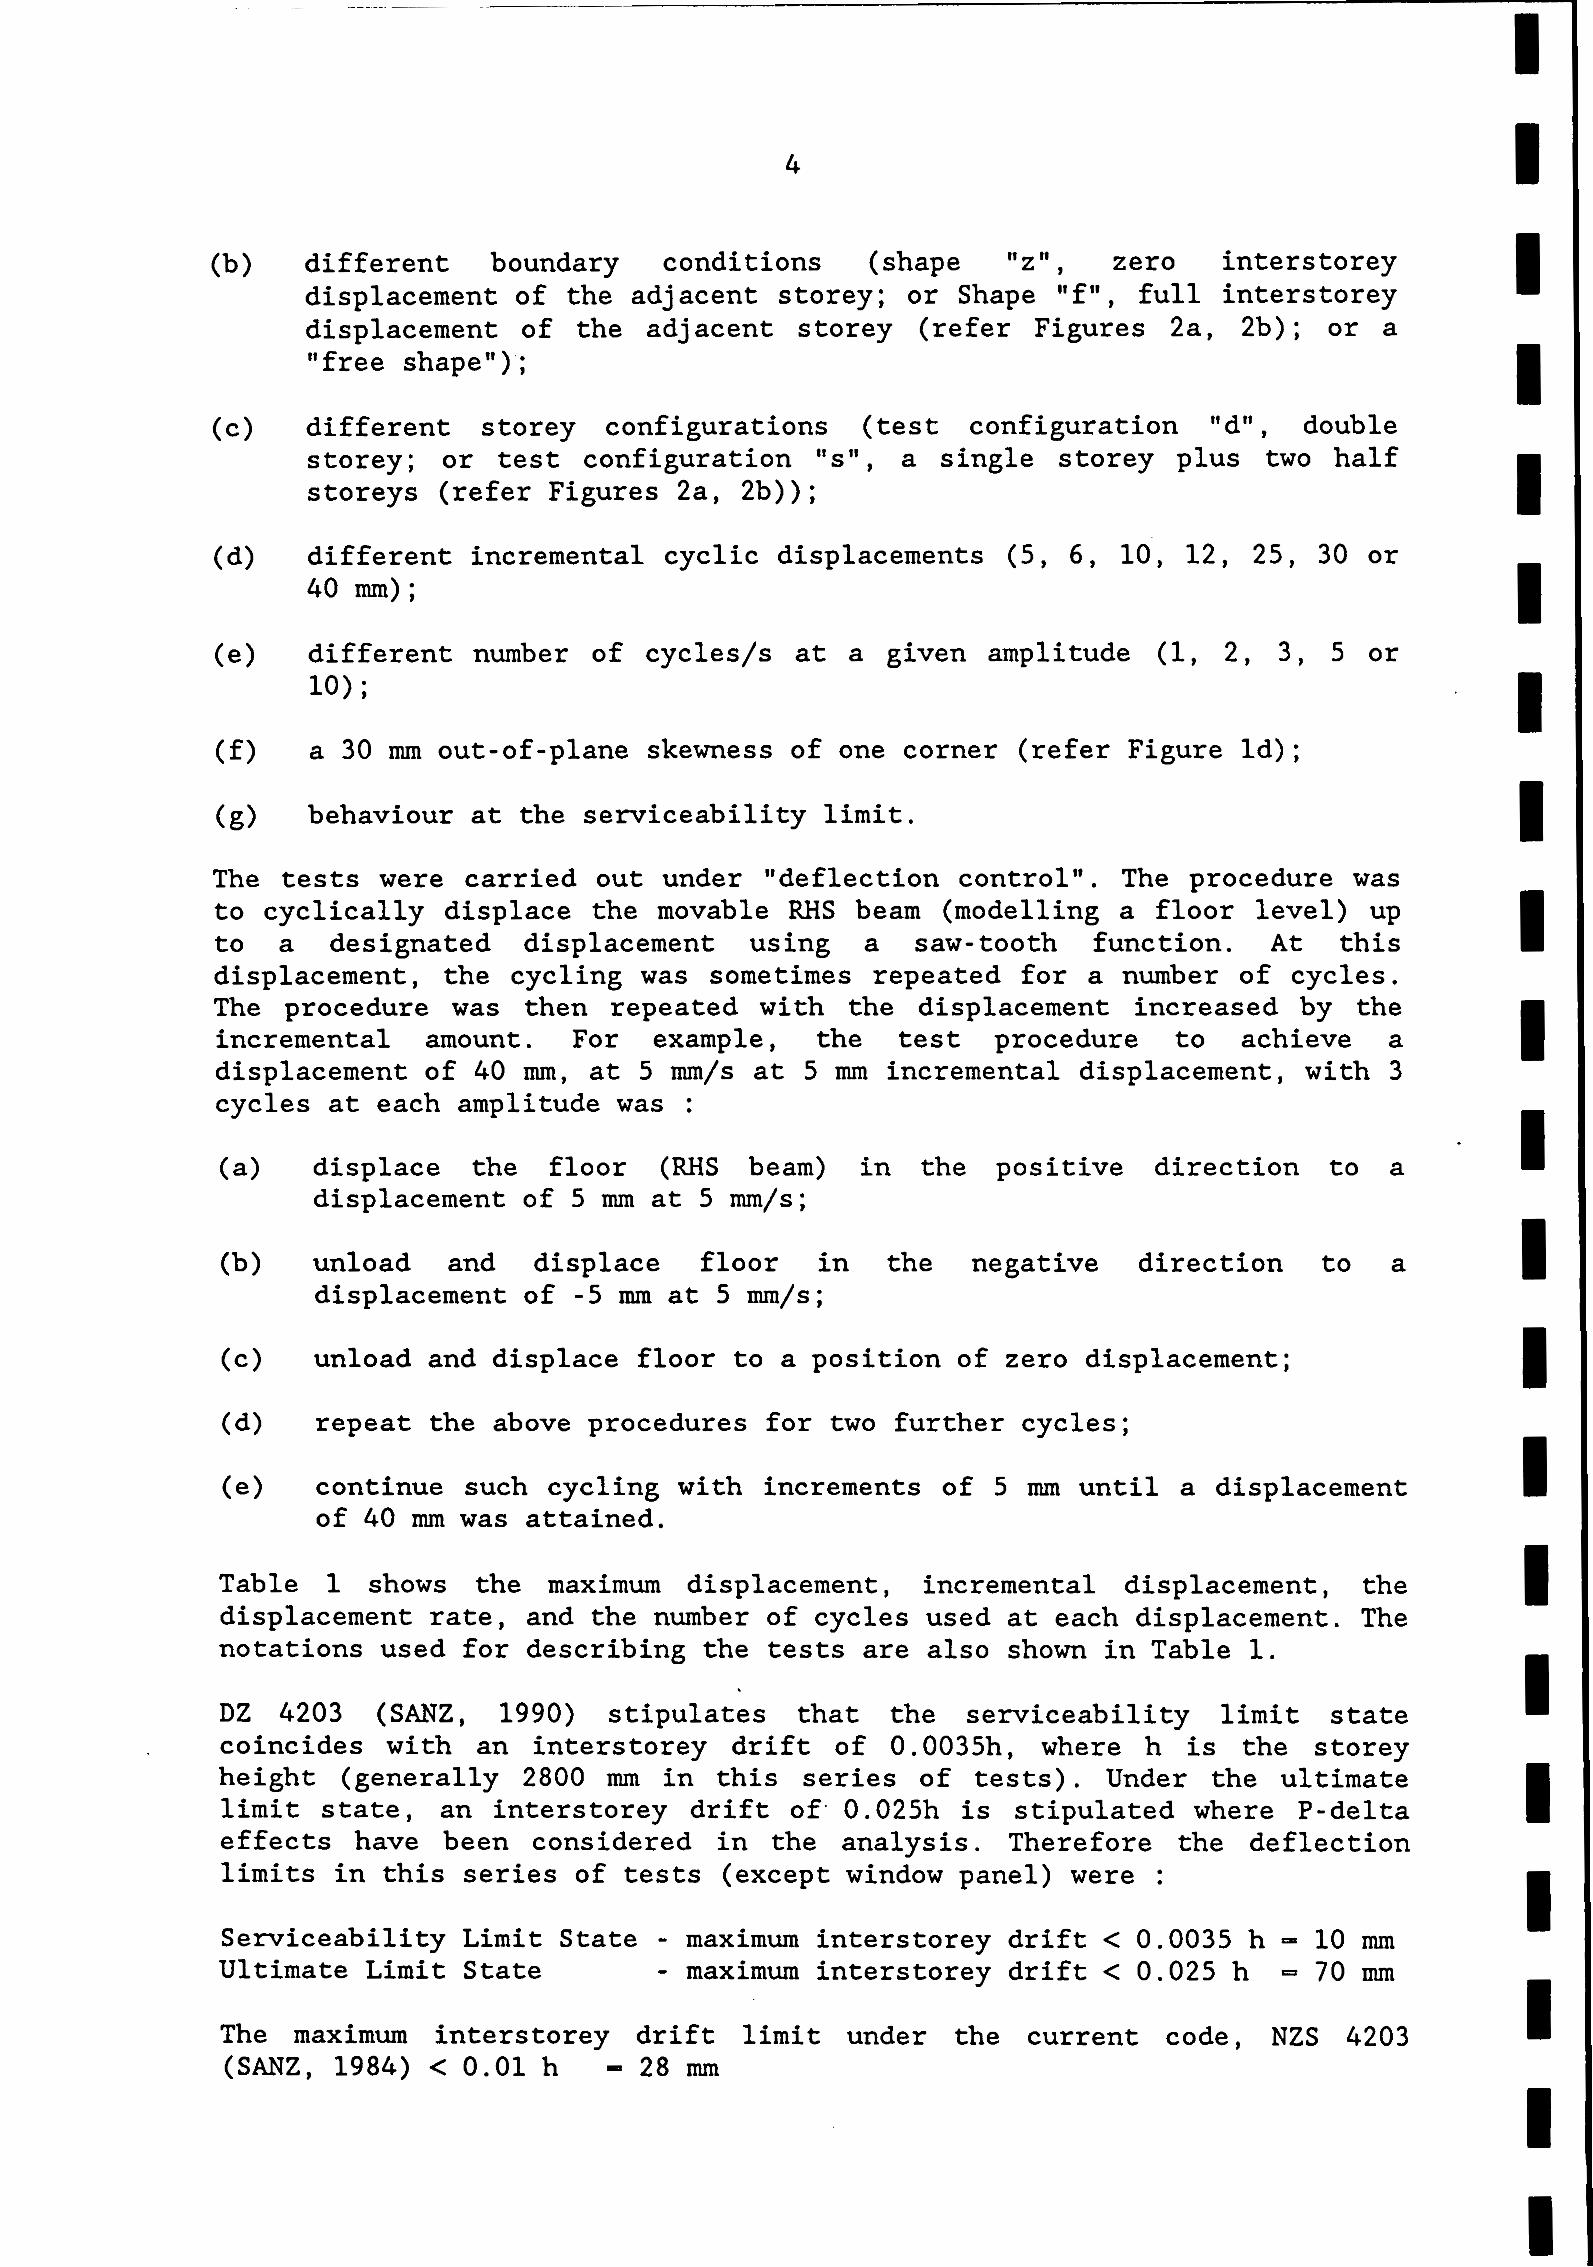
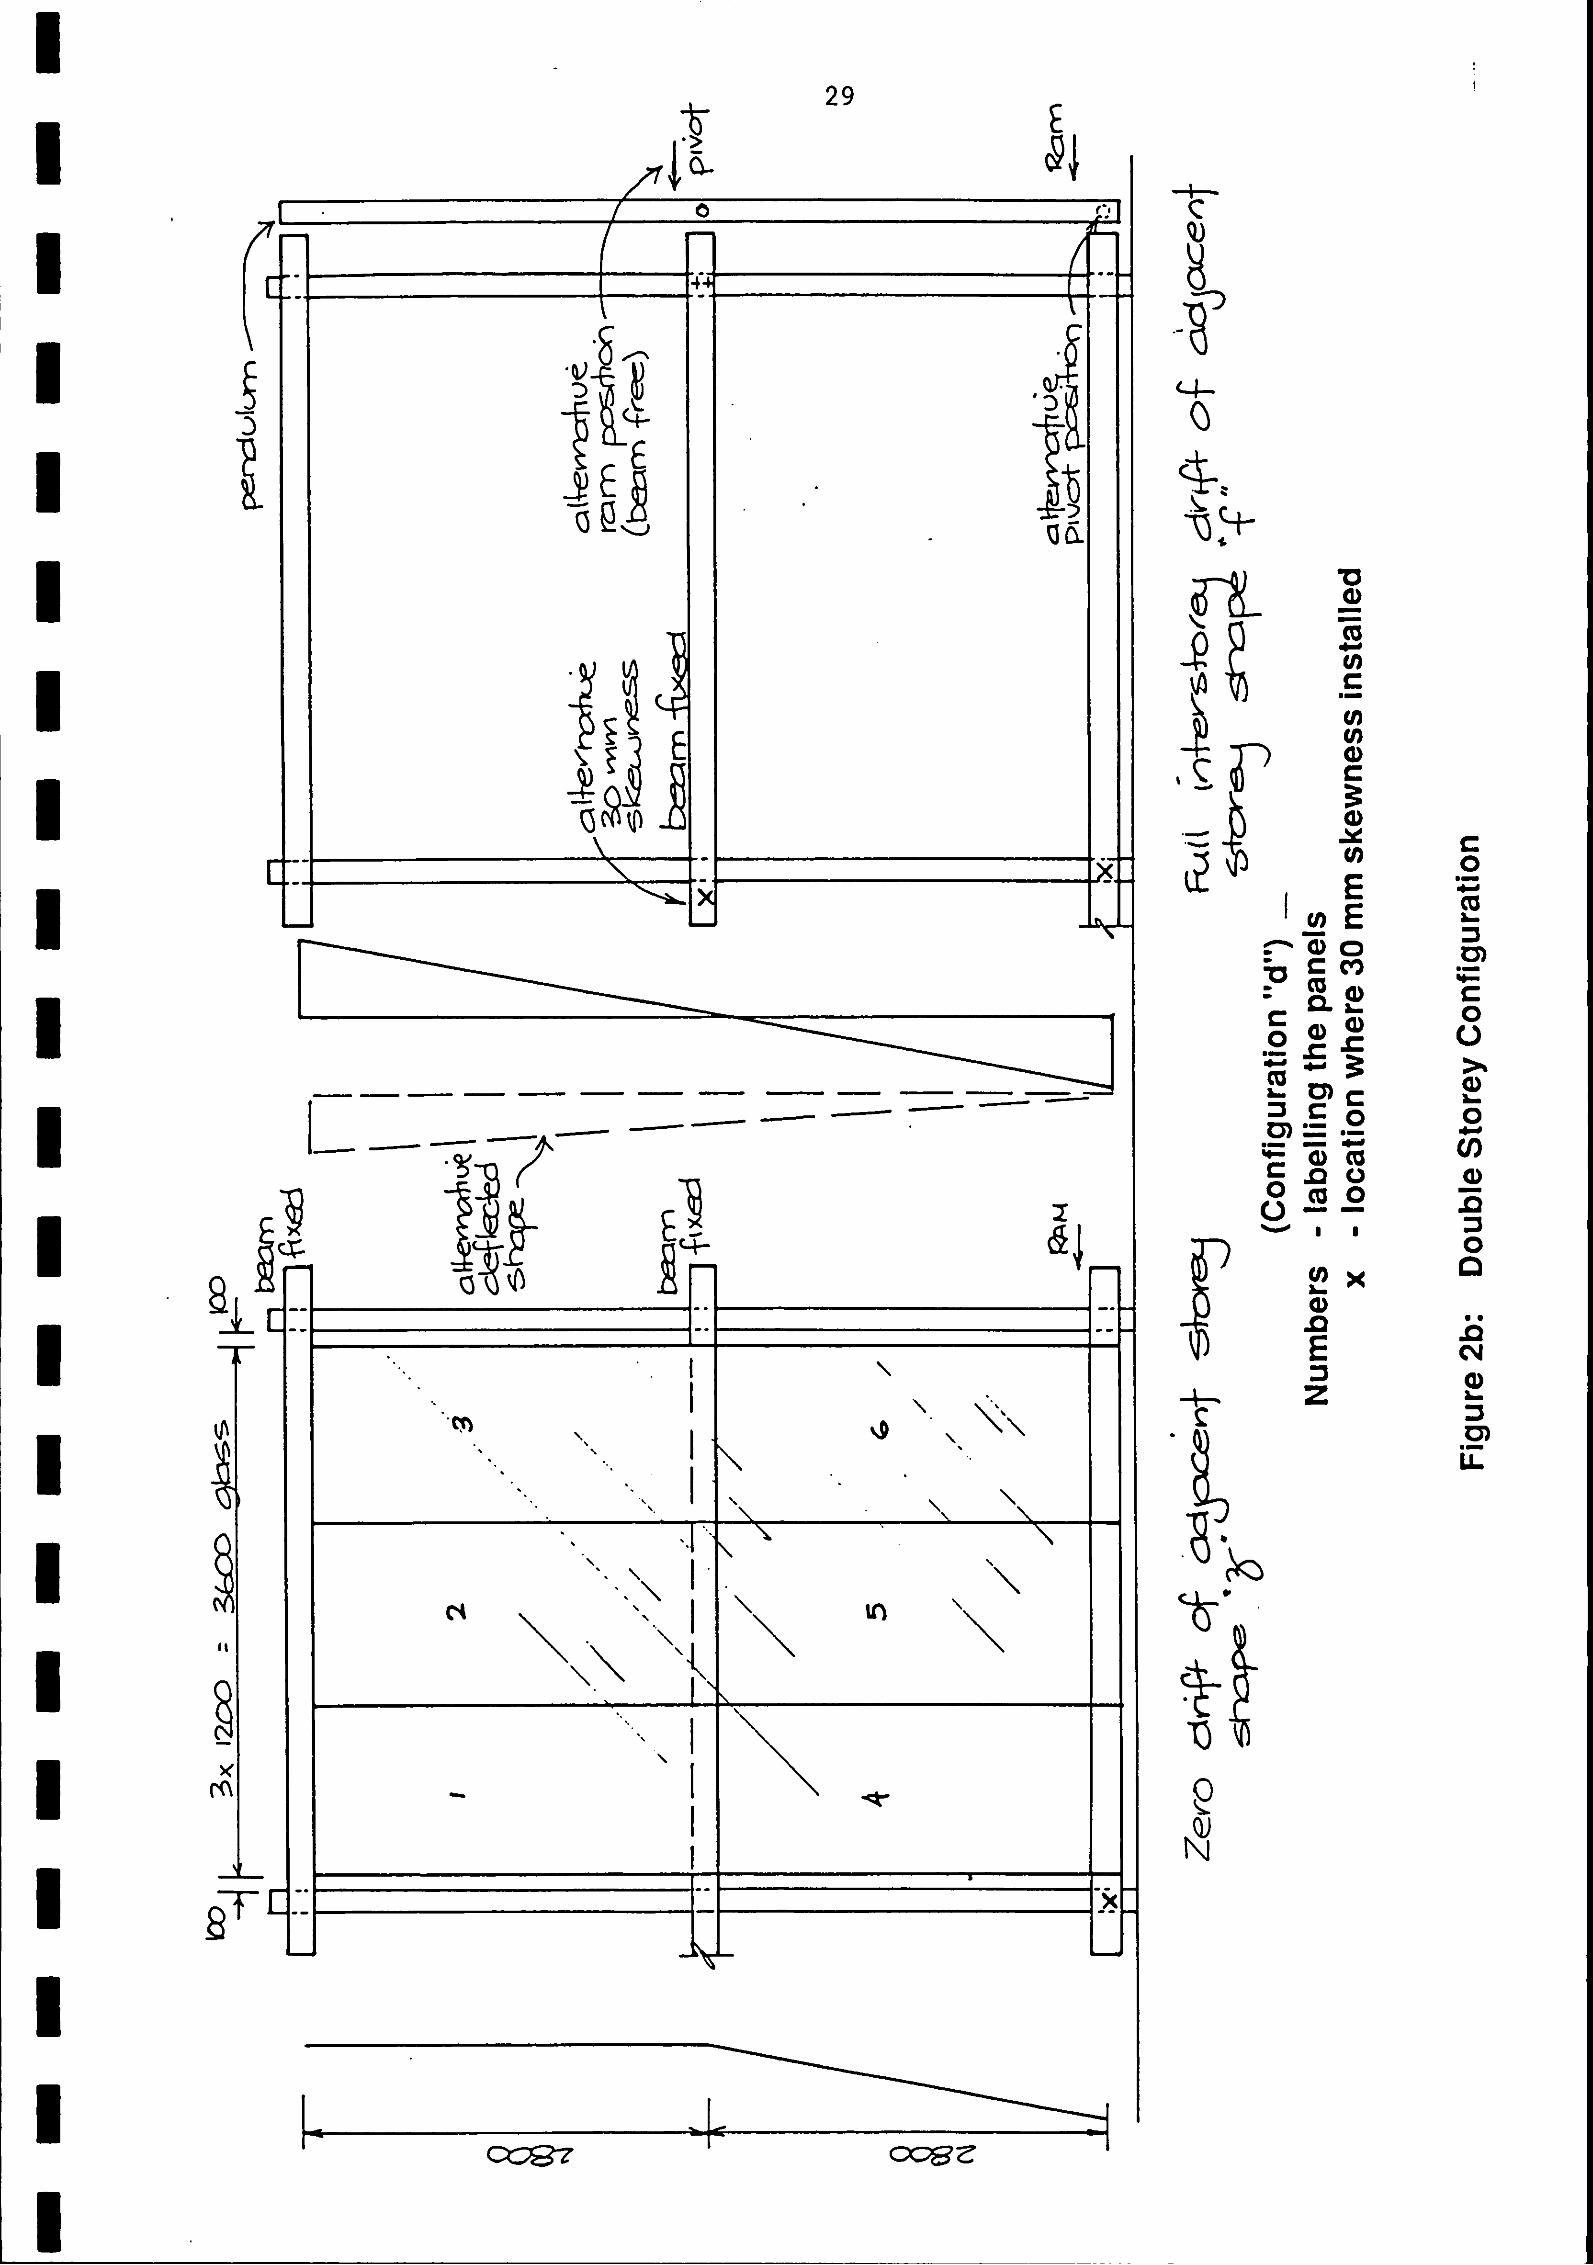
different boundary conditions (shape It It , zero interstorey displacement of the adjacent storey; or Shape Ilfn , full interstorey displacement of the adjacent storey (refer Figures 2a, 2b); or a "free shape");
different storey configurations (test configuration If dll , double storey; or test configuration "s", a single storey plus two half storeys (refer Figures 2a, 2b));
different incremental cyclic displacements (5, 6, 10, 12, 25, 30 or 40 mm) ;
different number of cycles/s at a given amplitude (1, 2, 3, 5 or 10) ;
a 30 mm out-of-plane skewness of one corner (refer Figure Id);
behaviour at the serviceability limit.
tests were carried out under "deflection controlv. The procedure was - to cyclically displace the movable RHS beam (modelling a floor level) up to a designated displacement using a saw-tooth function. At this displacement, the cycling was sometimes repeated for a number of cycles. The procedure was then repeated with the displacement increased by the incremental amount. For example, the test procedure to achieve a displacement of 40 mm, at 5 mm/s at 5 mm incremental displacement, with 3 cycles at each amplitude was :
(a) displace the floor (RHS beam) in the positive direction to a displacement of 5 nun at 5 mm/s;
(b) unload and displace floor in the negative direction to a displacement of -5 mm at 5 mm/s;
(c) unload and displace floor to a position of zero displacement;
(d) repeat the above procedures for two further cycles;
(e) continue such cycling with increments of 5 mm until a displacement of 40 mm was attained.
Table 1 shows the maximum displacement, incremental displacement, the displacement rate, and the number of cycles used at each displacement. The notations used for describing the tests are also shown in Table 1.
DZ 4203 (SANZ, 1990) stipulates that the serviceability limit state coincides with an interstorey drift of 0.0035h, where h is the storey height (generally 2800 mm in this series of tests). Under the ultimate limit state, an interstorey drift o f 0.025h is stipulated where P-delta effects have been considered in the analysis. Therefore the deflection limits in this series of tests (except window panel) were :
Serviceability Limit State - maximum interstorey drift < 0.0035 h 10 mm Ultimate Limit State - maximum interstorey drift < 0.025 h - 70 mm The maximum interstorey drift limit under the current code, NZS 4203 (SANZ, 1984) < 0.01 h 28 mm

There is considerable concern about the performance of glazing systems during earthquake attack. BRANZ is of the view that the failure of curtain wall glazing systems posed a risk similar to that of collapse of the structure. It is proposed that curtain wall glazing systems sunrive this action without collapse. Wright's (1989) Level 3 performance criteria stated that the ultimate failure of the glass or framing system should not produce a greater risk to life during the design earthquake than other .parts of the structure. In this series of tests, the failure criterion used to assess the performance of the glazing systems was that "the glass must not fall from the frame in a manner that could be life threatening".
2.2 Test Rig
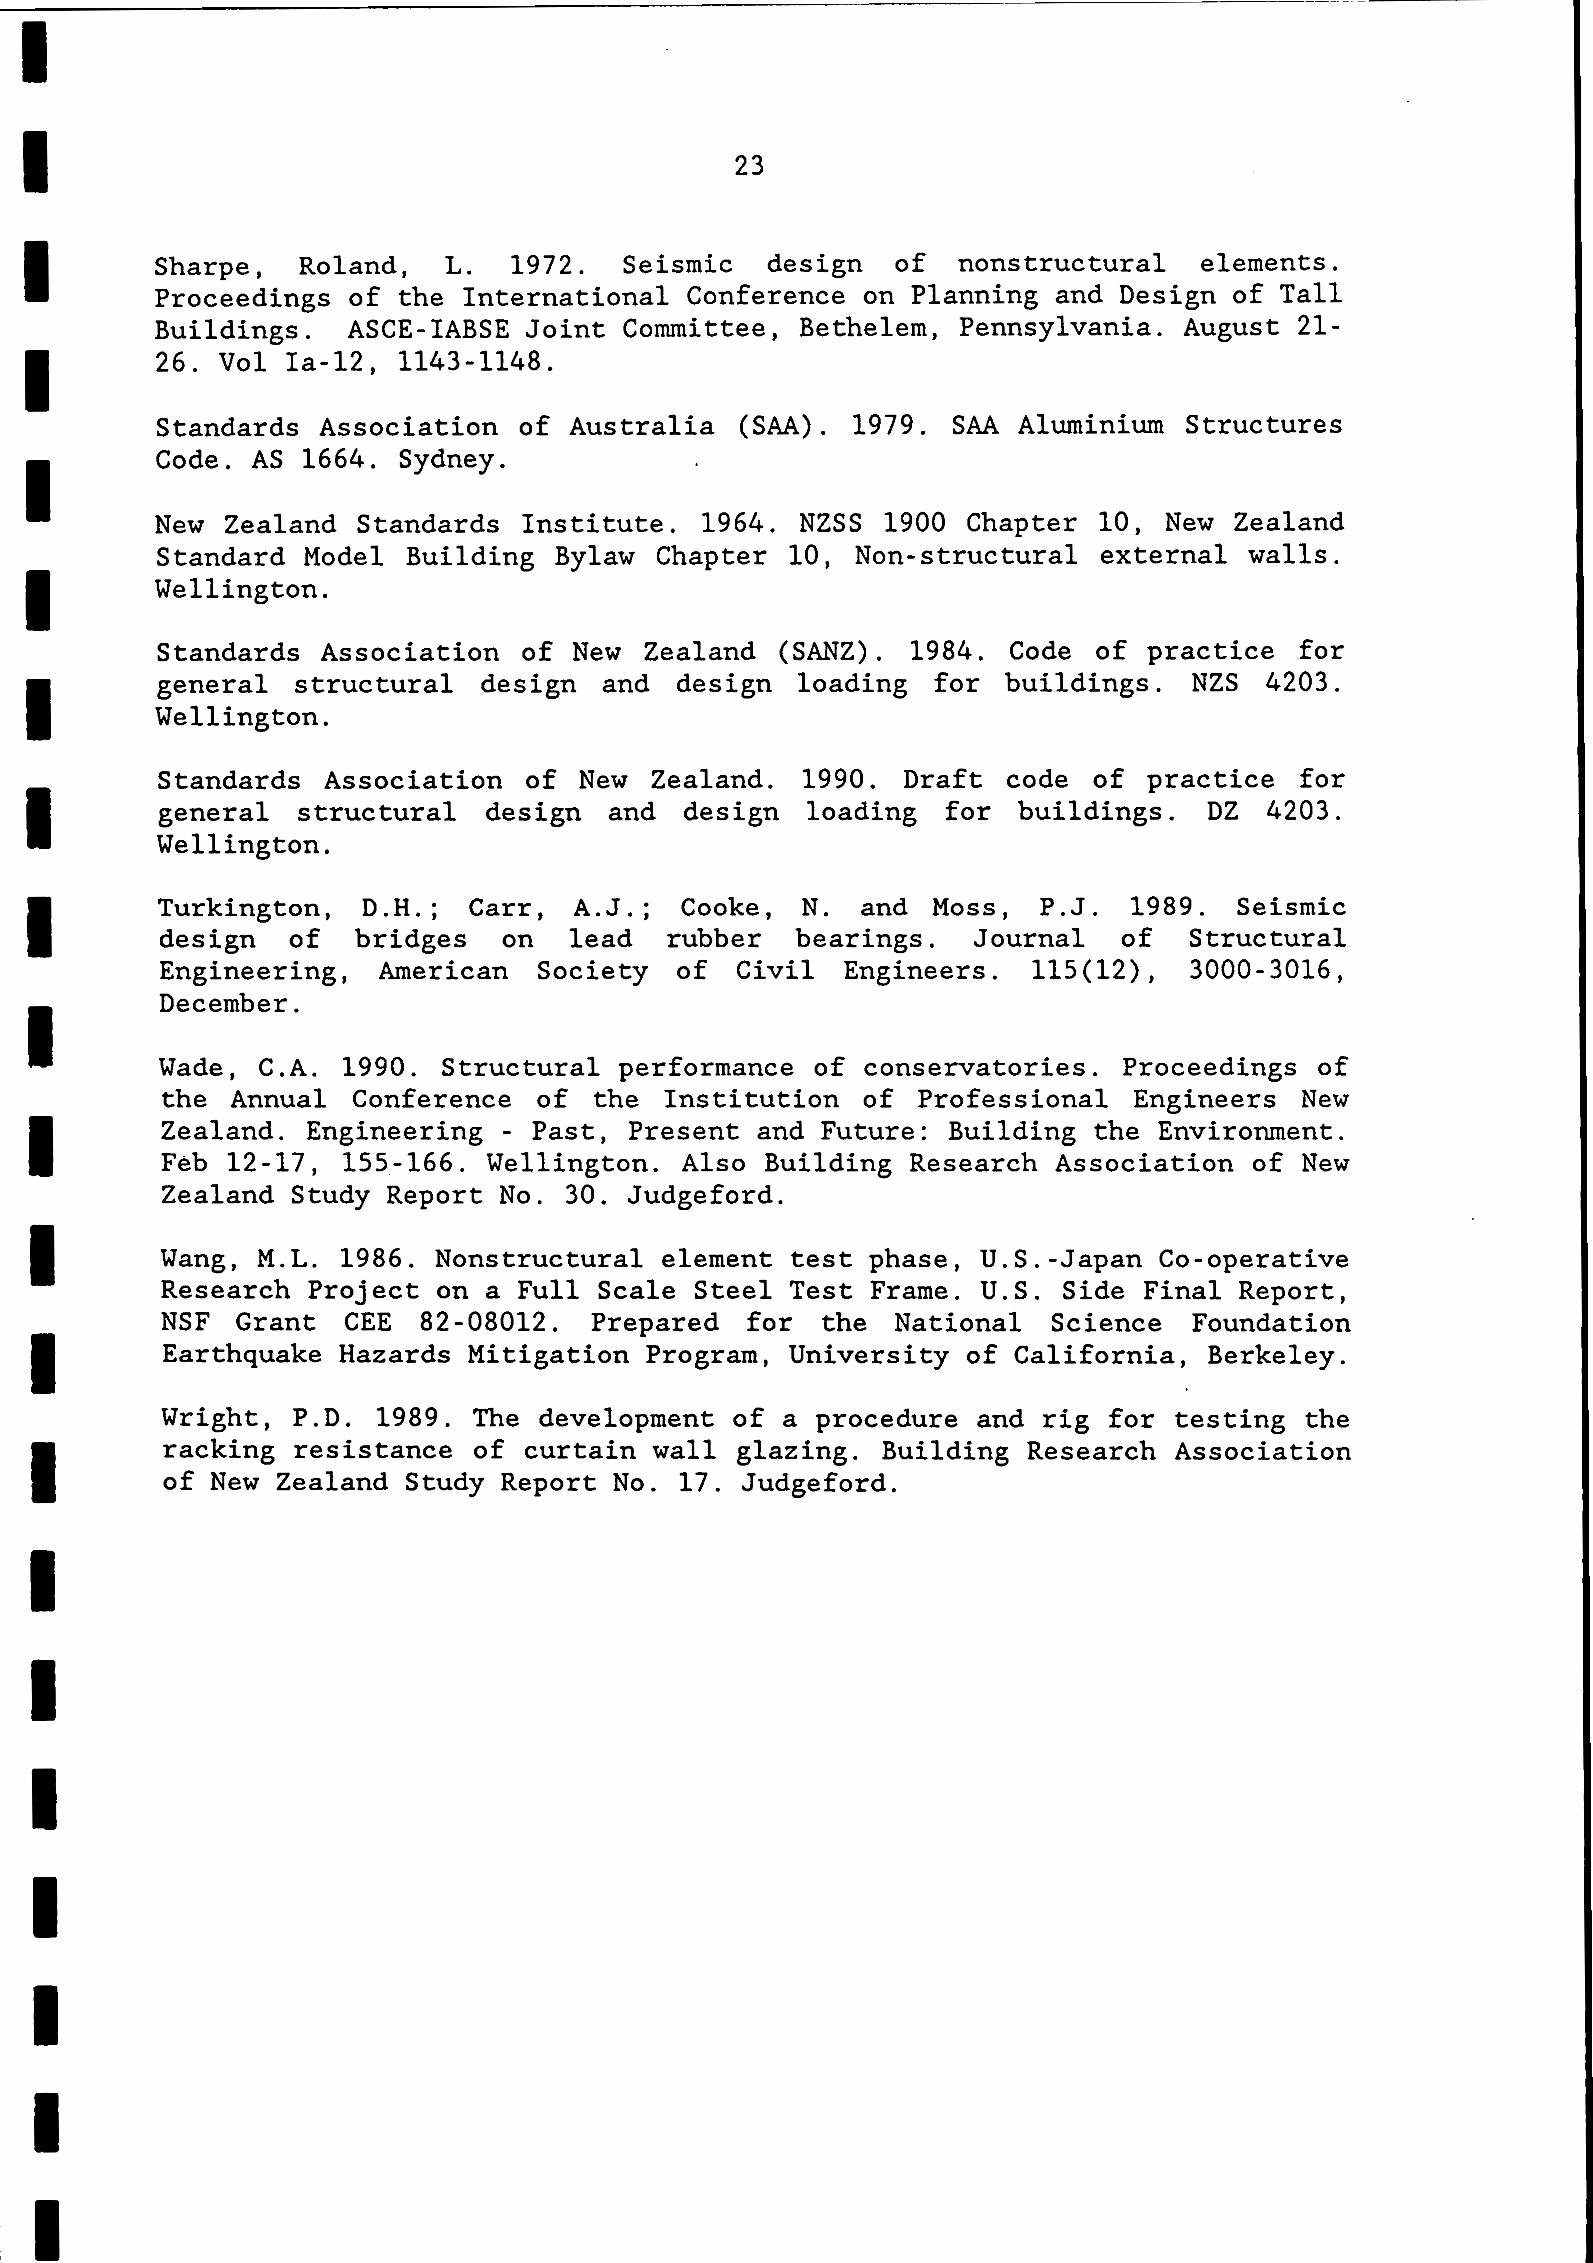
The plan and elevation of the test frame is shown in Figure la. The rig consisted of a series of horizontal rectangular hollow section beams (200x100~4.9RHS), and two vertical universal beams (2OOUB30). The UB's were bolted to the strong floor and to a horizontal beam (310UB40) at 4.2 m elevation. The horizontal RHS members were housed in mild steel sleeve brackets and could either be free to slide along their axis or restrained from sliding using two M12 bolts. The RHS beams modelled the floor beams and the test frame modelled an infinite bay of a framed structure. The sleeve brackets which had 3 mm clearance were greased to minimise friction (Section A, Figure la).
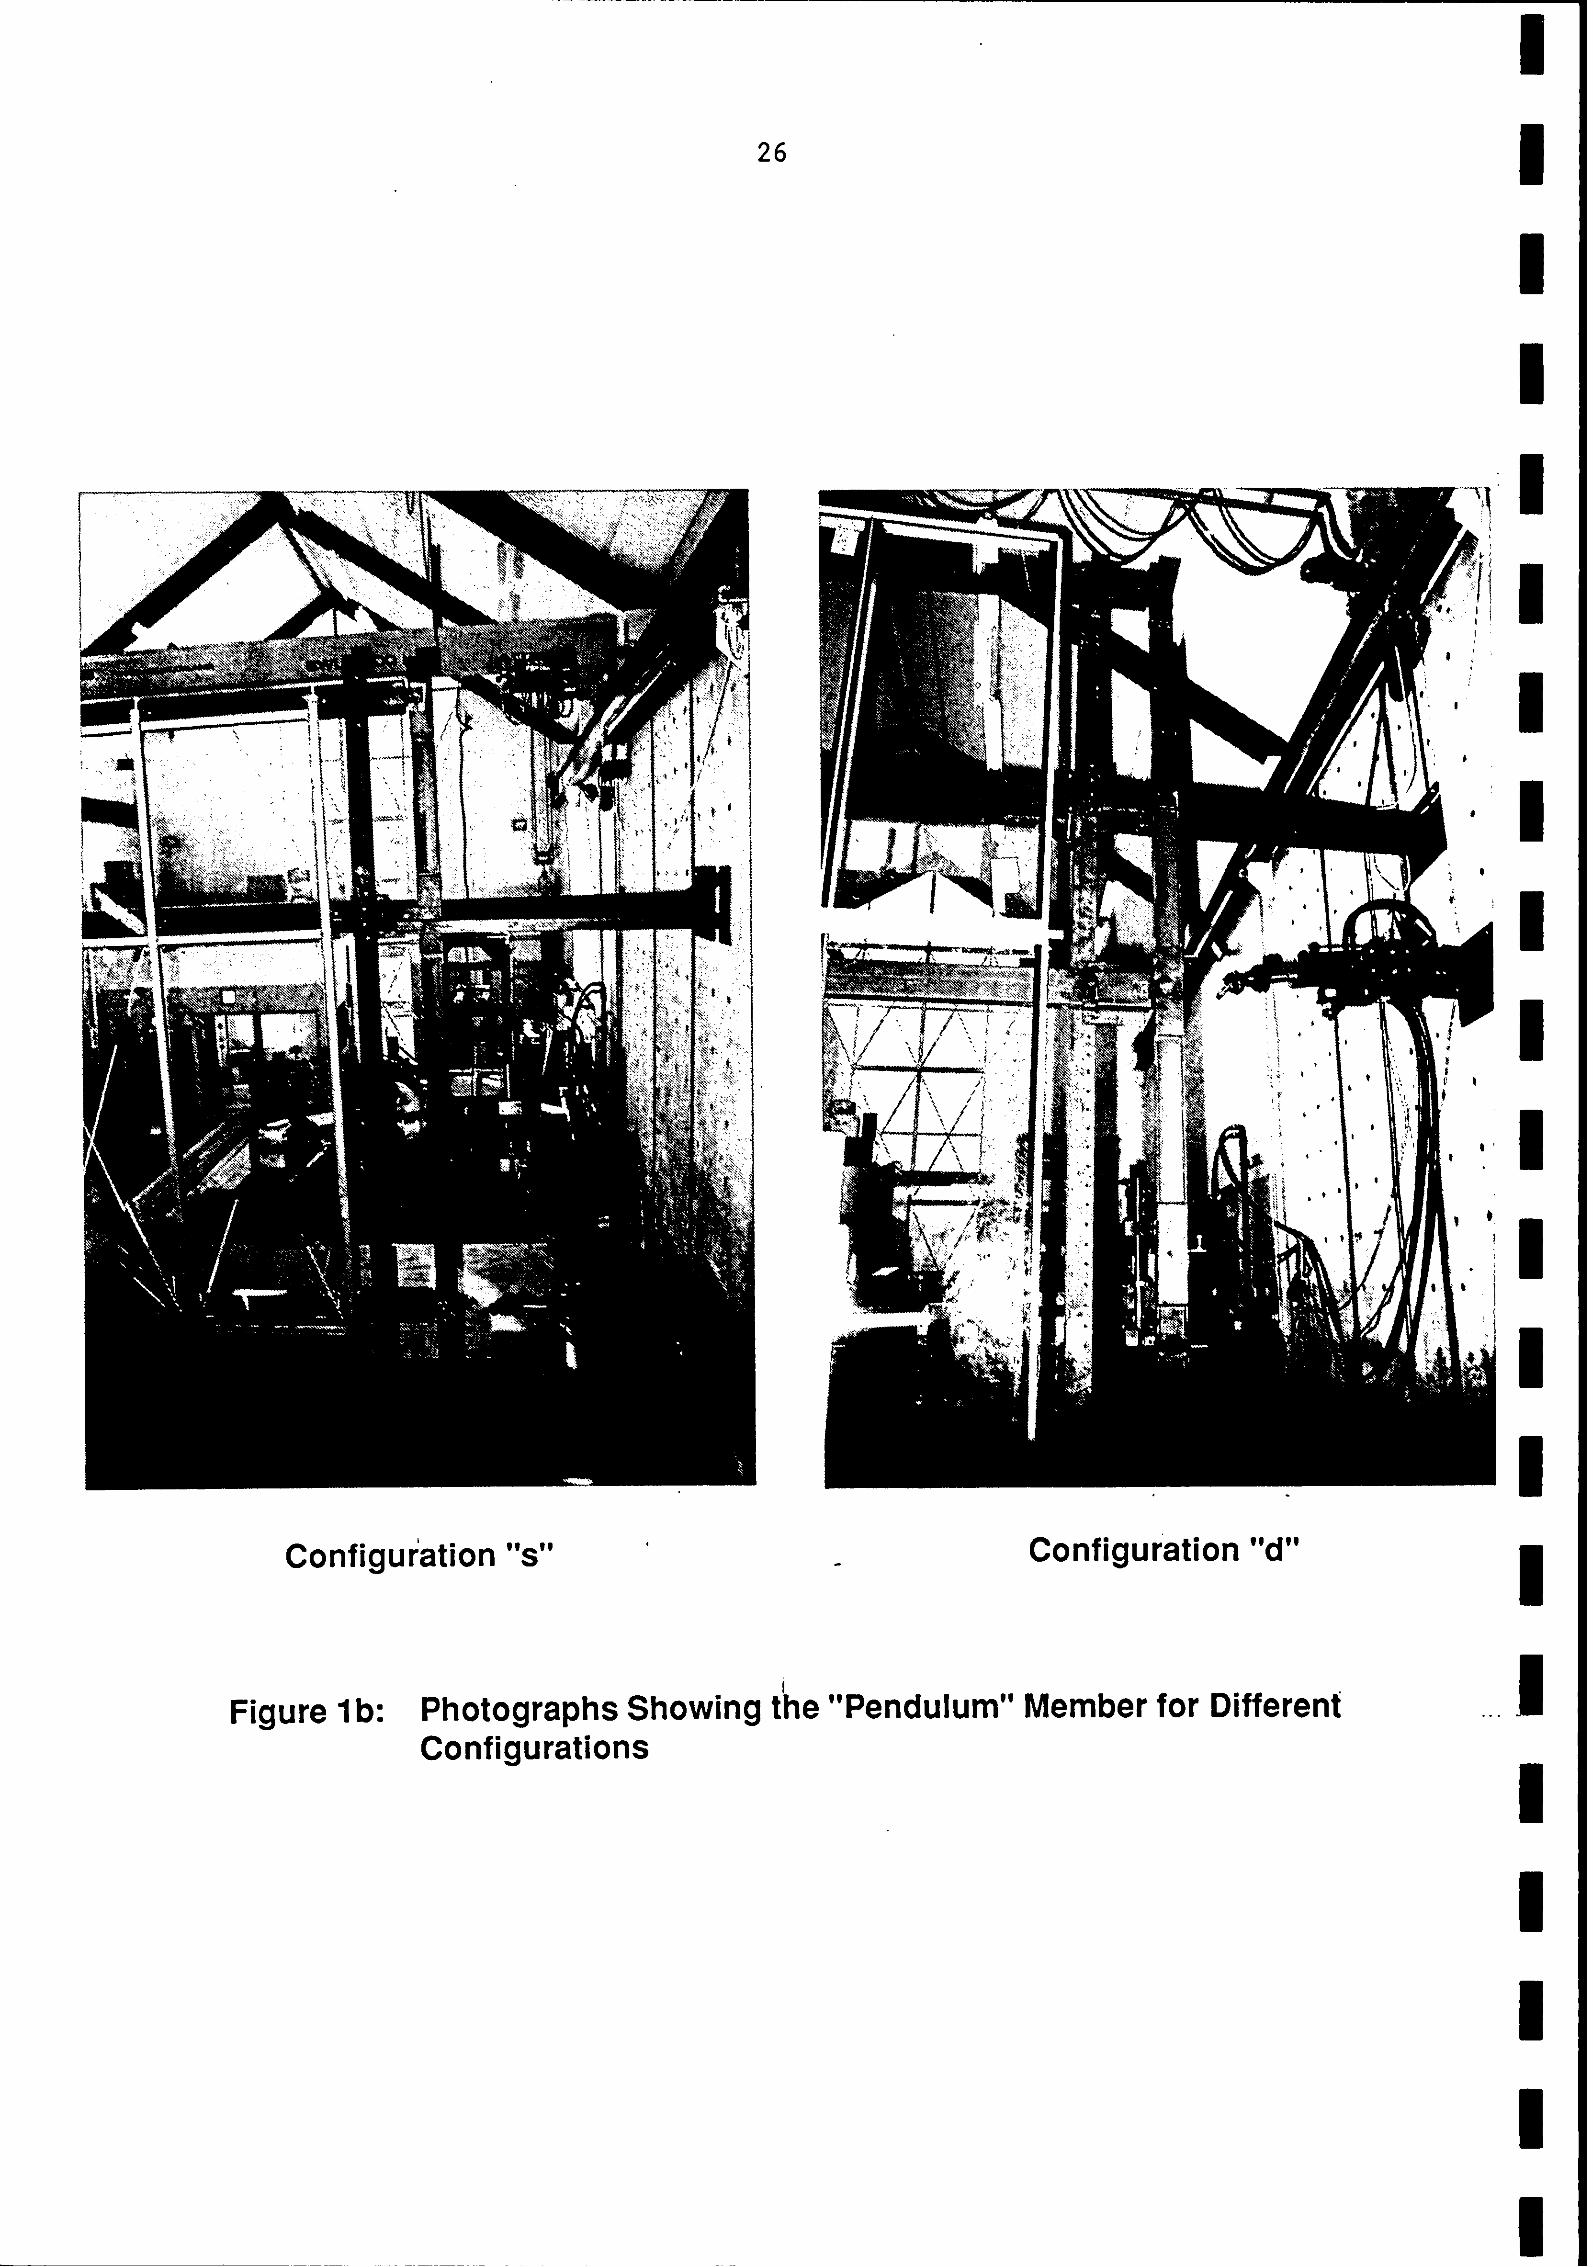
A "pendulum" member (152x76RS.J) and a pivot (100x100~8 angle) system allowed a single ram to load two storeys simultaneously, to achieve shape I( £It . Figure lb shows the photographs with the pendulum member attached to different configurations. Figure lc shows the connection of the pendulum member to the RHS beam and to the ram. Figure id shows a 30 mm timber packer introduced to model a 30 mm out-of-plane skewness at one corner of an RHS beam.
Two steel rollers were provided beneath the bottom RHS beam. This reduced frictional effects resulting from the specimen self-weight bearing on the sleeve brackets.
Figures 2a and 2b show the arrangement for testing configuration "st', and con£ iguration "dlt respectively. To achieve shape "ztt in con£ iguration "st@, the two lower sliding RHS beams were braced to each other using diagonal steel members. The panels are also identified in the figures.
2.3 Test Instrumentation
2.3.1 Servoactuator and Data Acquisition Equipment
The load was applied using a 100 kN Moog Servoactuator (ram) which was supported off a reinforced concrete reaction wall (Figure 3a). The ram has a maximum stroke of 600 mm. The initial position for the tests was set at approximately midstroke (at 300 mm extension). The load was measured by means of a 100 loadcell and digital indicator to BS 1610 (British Standards Institution (BSI), 1985) Grade 1 accuracy.

The deflection of the ram was controlled with an International Business Machine (IBM) Compatible Personal Computer (PC). Purpose-developed software allowed different displacement rates, number of cycles at each amplitude, and different displacements to be predetermined. The test data were collected at a rate of 10 Hz with a maximum of 10 channels, using an Analogue Devices RTI 815A data acquisition board. Labtech Notebook software (Laboratory Technologies Corporation, 1989) installed in a second IBM PC controlled the data acquisition (Figure 3b). A "real-time" load- displacement plot of the ram was displayed during each test. Post acquisition of the data was undertaken by downloading from the PC to a Micro Vax system, where analysis was carried out and graphs plotted using a Statistical Analysis System (SAS) software package.
2.3.2 Deflection ~easurements
Linear voltage displacement transducers (LVDT's), with an accuracy of 0.25 percent of reading, were used to measure the displacements of the specimens. The electrical output from the LVDT's was converted using appropriate scale factors to displacement values. For all tests, the equivalent interstorey displacement of the specimens at the point of load application was recorded. Horizontal and vertical relative displacements between the central glass pane and a mullion, and transom, were recorded. An LVDT was provided to measure the horizontal out-of -plane twist of the glass plane or mullion with respect to a point on the RHS beam which was at rest.
In the case of the patch fitting system, the relative vertical and horizontal displacements between two panes of glass were recorded. The equivalent rotation of the bottom right fitting of Panel E was recorded. The out-of-plane displacement of the central pane1 E was also measured.
The behaviour of the glazing systems was filmed using a video camera recorder for the duration of the tests.
2.4 Description of Test Specimens
Suppliers of each glazing system were requested to provide "typical" details of the glazing-to-structure connections used in buildings. These were replicated as closely as possible in the test configurations. Specific interstorey drift limits were not specified.
2.4.1 Gasket glazed system
The specimens were built and dry-glazed in the laboratory from individual components. The aluminium mullions (vertical members) and transoms (horizontal members) were of B6063-T5 and B6063-T6 alloy (Standards Association of Australia (SAA), 1979) respectively. The mullions were 5.8 m long and were fixed to each RHS beam using a mild steel (MS) angle bracket. Two M12 bolts were used to attach the bracket to the beam, and one M12 bolt to fix the bracket to the mullion. The transoms were approximately 1.2 m long and were interlocked to the mullions with the aid of a bolt (Figure 4a). Figure 4b shows the elevation of the mullions and some transoms while Figure 4c shows a vertical section through a mullion. A nominal 17.5 mm clearance was provided between the glass pane and each framing member. The panes were of annealed 6 rnrn clear float glass and had a nominal entrapment depth of 12.5 nun into the mullions and transoms.

Foamed neoprene gaskets on the outer face and santoprene gaskets on the inner face were used to seal the glass.
One series of tests was performed on a specimen which had transoms installed at a simulated sill level (900 mm above the bottom transom), representing a vision and opaque panel system. A timber spandrel panel was also installed for this series, which extended from the RHS beam (floor) to sill height (Figure 4d). This was fabricated from 12.5 mm plywood nailed over 100x50 mm timber framing members, and fastened to the RHS floor beam. This spandrel was installed to model buildings with a fire- rated timber spandrel. The specimen was initially tested without connecting the mullions to the spandrel panel. The mullions were subsequently fixed to the spandrel panel at the sill level (using an aluminium bracket with either one or two screws (Figure 4e)), and retested.
2.4.2 Patch fitting system
The specimens were glazed in the laboratory. The patch fitting was comprised of an aluminium backing plate housing a circular disc. The disc had a slotted hole into which a purpose-made nut was installed. This system was designed to be rigid against face load but free to slide along the slot, initiating the rotation of the disc, when subjected to in-plane load (Figure 5a). The glass was fixed to the patch plate by a stainless steel nut and tapered nylon washers installed through 20 mm diameter countersunk holes, located at 45 mm from each corner of the glass panel. The patch plate was bolted with a M20 bolt to a lOOxlOOxlO MS angle, which was welded to the top of the RHS beam (Figure 5b). The fittings supplied were suitable for single, dual and quadruple fastenings. The discs were installed such that the slot was inclined at approximately 45 degrees to the horizonta1,all with the same orientation.
Toughened 10 mm float glass was used throughout. The glass was separated from the patch fitting by a 1.5 mm thick butyl rubber gasket. Dow Corning 790 silicone 10 mm thick was used to seal the top panes of glass and Dow Corning 999-A silicone was used for the remaining panels. The silicone was allowed to cure for two weeks before testing. A typical elevation of this system is shown in Figure 5c.
2.4.3 Two-sided silicone system
This specimen had been fabricated for testing elsewhere, and was therefore of a different geometry than others used in the programme. The specimen had an equivalent storey height of 3.2 m, with a spandrel panel at 0.75 m below to 0.75 m above each floor level. It was 3.0 m wide and was transported to the laboratory fully glazed. The specimen was made up of 9 panels; 6 of these were spandrel panels of nominal dimensions 1.5xl.O m (upper and lower), while the other 3 were vision panels of nominal dimensions 1.7xl.O m. The mullions and transoms were 4.7 and 3.0 m in lengths respectively and of aluminium extrusion B6063-T5 alloy. The mullions were spliced at 850 mm above the equivalent floor level, this being the point of contraflexure as designed by the manufacturer's engineer under seismic in-plane racking. Each mullion was bolted to the RHS beam using a MS bracket, with two M12 bolts to the beam and two M12 bolts to the mullion.

The glass was toughened 6 mm clear float. A glazing batten (or sub- mullion) spanning between the transoms, was connected to each mullion with four stainless steel screws. Dow Corning 795 silicone was used to attach the two vertical sides of each glass pane to two glazing battens. The glass pane was therefore indirectly attached to the mullions (Figure 6a). Weathering sealant was installed on vertical strips, between the panes of glass. Normal neoprene gaskets sealed the glass into the transoms both on the inner and outer faces. Figure 6b shows a typical elevation of the system. Figures 6c and 6d show the vertical section through a mullion and a horizontal section through a transom respectively.
2.4.4 Unitised four-sided silicone system
The unitised panels of nominal dimensions 1164x1370 and 1164x2770 mm were fabricated and cured in the factory, and transported to the laboratory where they were installed onto the test frames. The mullions were 2770 nun long while the transoms were 1164 mm. Annealed 6 mm clear float glass was attached to the mullions and transoms using Dow Corning 983 two-part silicone. Each. panel was fixed to the RHS beam at one top corner using a 152x75~12 mm aluminium angle bracket. The sides of each pane1 were mechanically interlocked with an adjacent mullion or transom, and sealed with a santoprene gasket. Figures 7a and 7b are sections taken through the mullions and transoms respectively.
The construction sequence resulted in the end panels nearer the ram having two attachment brackets, while the other panels had, but one positive fixing . The loading arrangement of configuration It dtt used the "alternative" system as shown in Figure 2b. The ram was positioned at the middle beam with the fixed bottom beam acting as the pivot. Figure 7c shows a typical elevation.
2.4.5 Window panels
The window panels were considered to represent glazing systems spanning between the sill and head of precast (or spandrel) panels. Thus only a single storey simulation was necessary for this system.
Three panels, each nominally 1.8 m high and 1.2 m wide, were assembled and glazed in the laboratory from individual components (Figure 8a). The mullions and transoms were of B6063-T6 alloy. The sill and head framing members were fixed to the RHS beams using 5 gauge (2.74 mm diameter) posidrive stainless steel screws at 500 mm centres (Figure 8b). A sliding head was installed between the upper RHS beam (floor) and the head of the glazing frame. Annealed 6 mm clear float glass was used throughout. The glass had a nominal entrapment depth of 13 mm at the mullions and transoms. A 10 mm total clearance was provided for each pane of glass for construction tolerance in the horizontal direction (Figure 8c). Normal neoprene gaskets were used to seal the glass.
3.0 OBSERVATIONS AND RESULTS
3.1 Gasket Glazed System
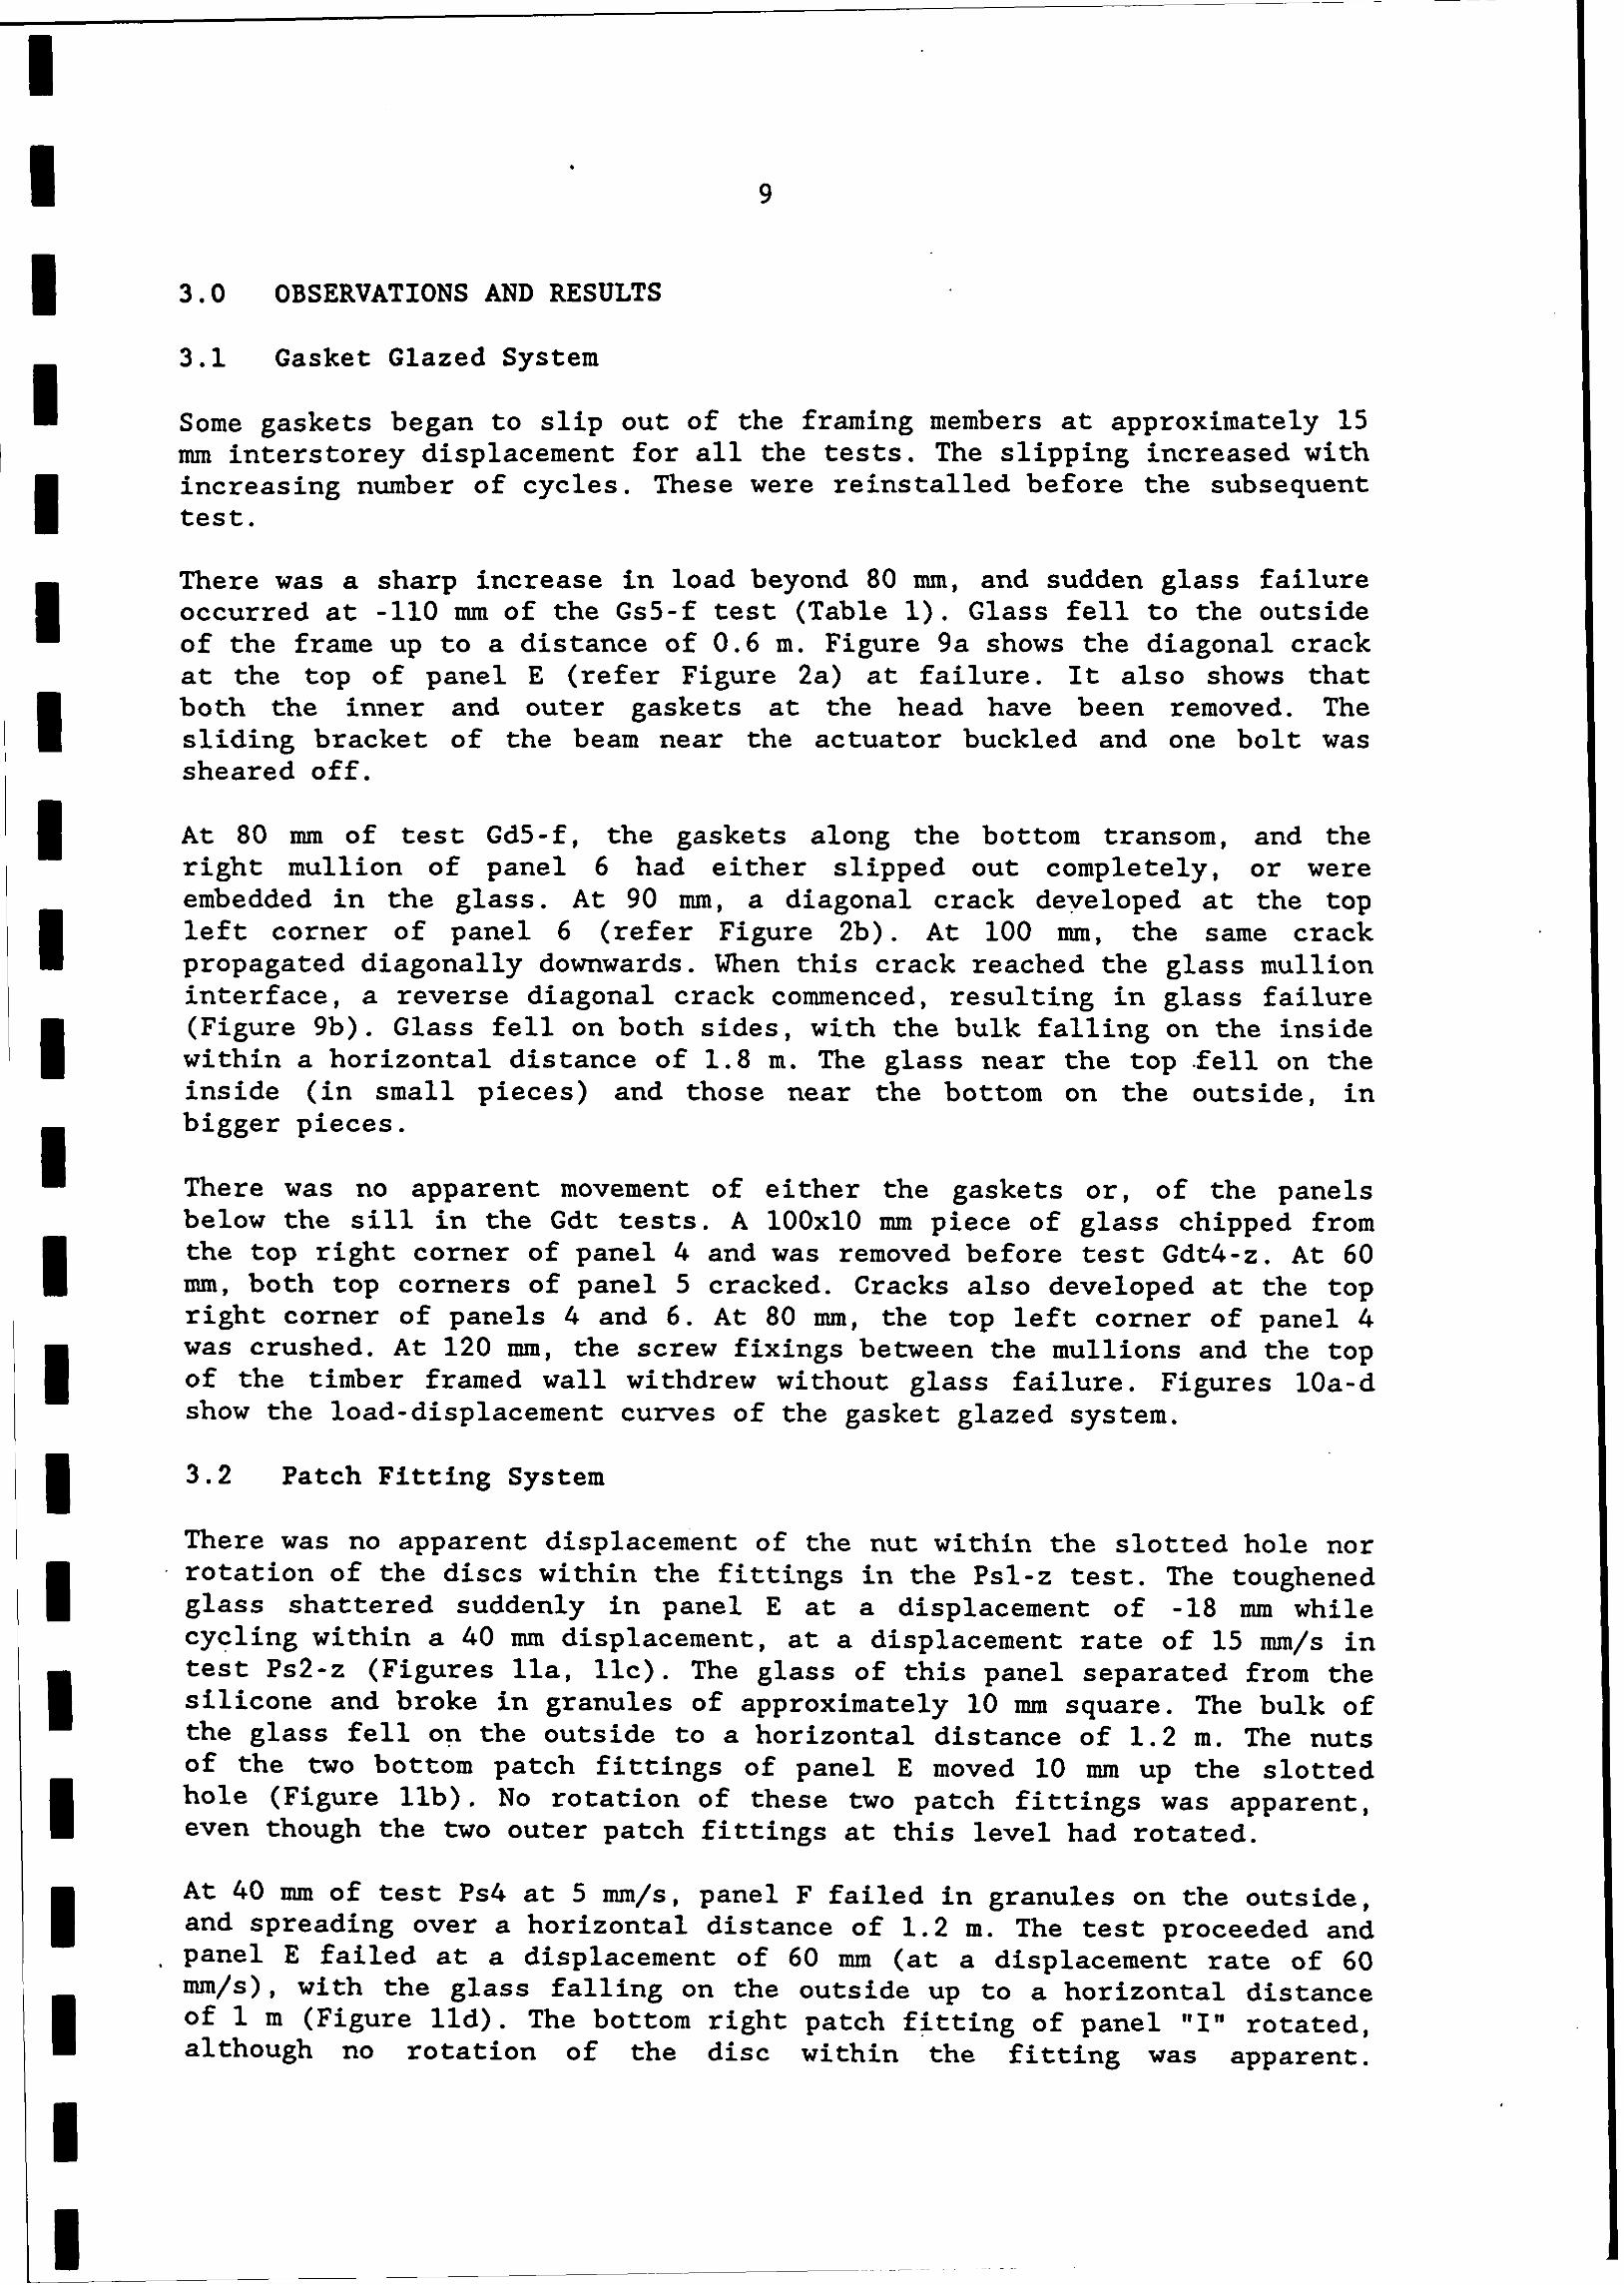
Some gaskets began to slip out of the framing members at approximately 15 mm interstorey displacement for all the tests. The slipping increased with increasing number of cycles. These were reinstalled before the subsequent test.
There was a sharp increase in load beyond 80 mm, and sudden glass failure occurred at -110 mm of the Gs5-f test (Table 1). Glass fell to the outside of the frame up to a distance of 0.6 m. Figure 9a shows the diagonal crack at the top of panel E (refer Figure 2a) at failure. It also shows that both the inner and outer gaskets at the head have been removed. The sliding bracket of the beam near the actuator buckled and one bolt was sheared off.
At 80 mm of test Gd5-f, the gaskets along the bottom transom, and the right mullion of panel 6 had either slipped out completely, or were embedded in the glass. At 90 mm, a diagonal crack developed at the top left corner of panel 6 (refer Figure 2b). At 100 mm, the same crack propagated diagonally downwards. When this crack reached the glass mullion interface, a reverse diagonal crack commenced, resulting in glass failure (Figure 9b). Glass fell on both sides, with the bulk falling on the inside within a horizontal distance of 1.8 m. The glass near the top .fell on the inside (in small pieces) and those near the bottom on the outside, in bigger pieces.
There was no apparent movement of either the gaskets or, of the panels below the sill in the Gdt tests. A 100x10 mm piece of glass chipped from the top right corner of panel 4 and was removed before test Gdt4-z. At 60 mm, both top corners of panel 5 cracked. Cracks also developed at the top right corner of panels 4 and 6. At 80 mm, the top left corner of panel 4 was crushed. At 120 mm, the screw fixings between the mullions and the top of the timber framed wall withdrew without glass failure. Figures 10a-d show the load-displacement curves of the gasket glazed system.
3.2 Patch Fitting System
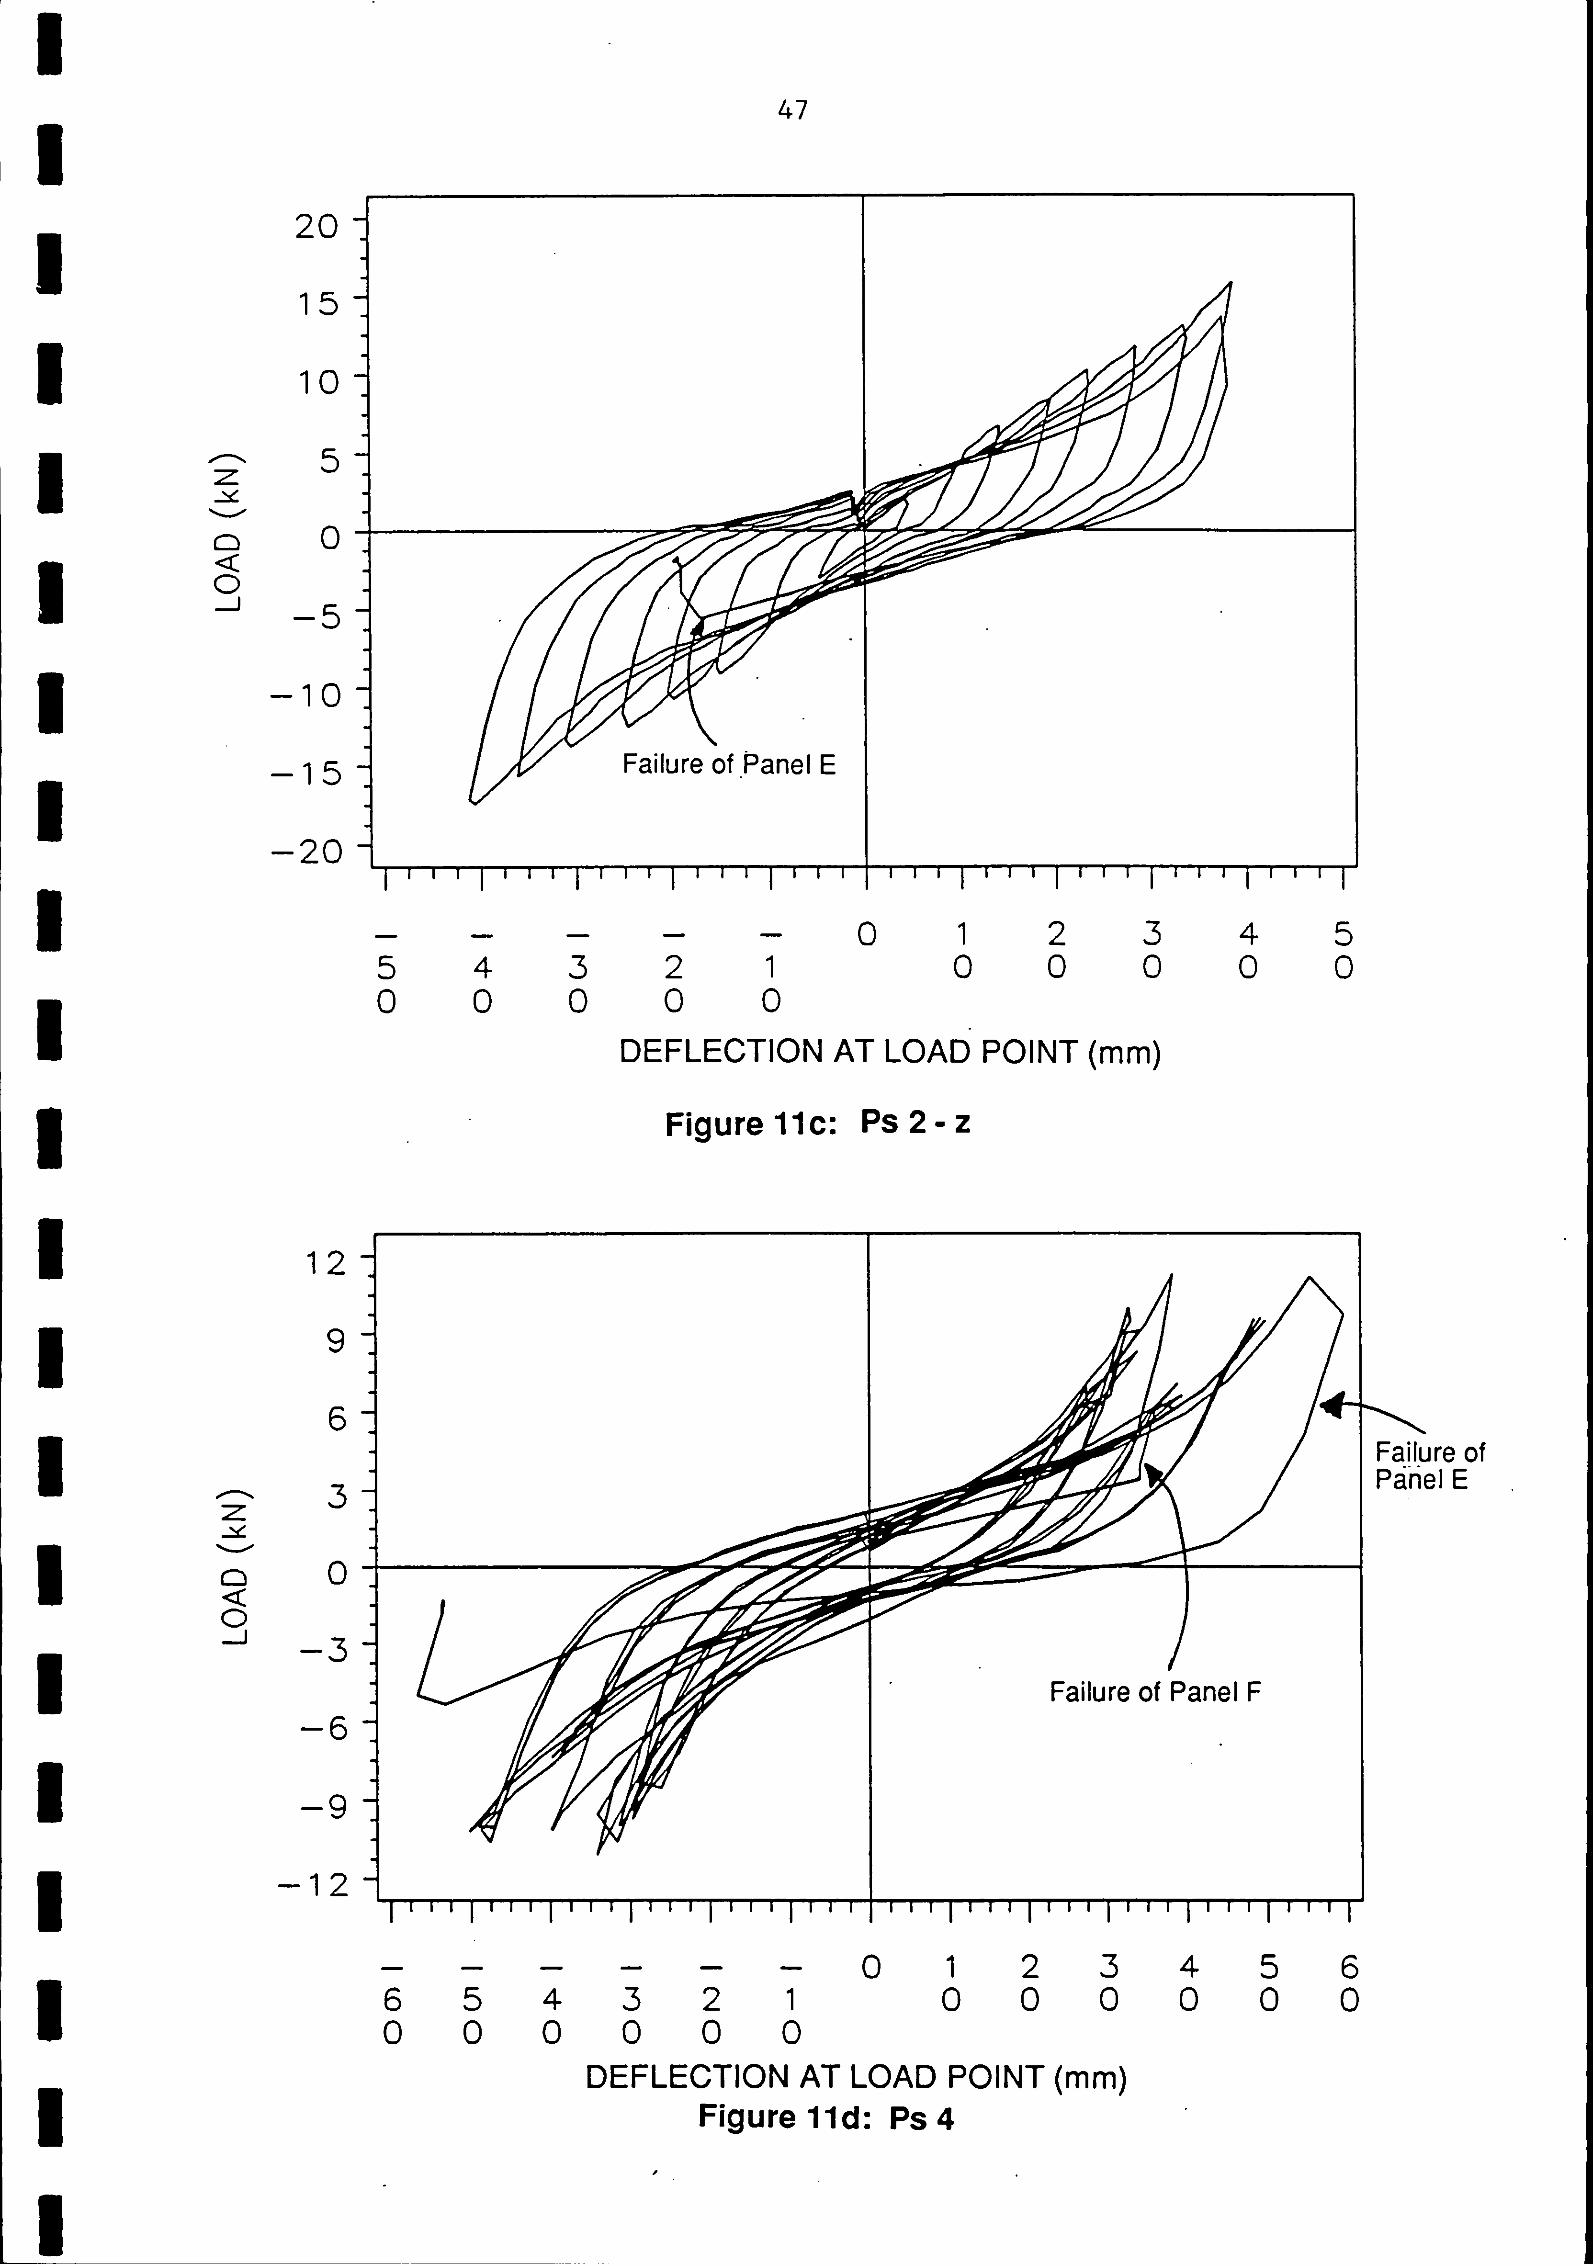
There was no apparent displacement of the nut within the slotted hole nor rotation of the discs within the fittings in the Psl-z test. The toughened glass shattered suddenly in panel E at a displacement of -18 mm while cycling within a 40 mm displacement, at a displacement rate of 15 mm/s in test Ps2-z (Figures lla, llc). The glass of this panel separated from the silicone and broke in granules of approximately 10 mm square. The bulk of the glass fell on the outside to a horizontal distance of 1.2 m. The nuts of the two bottom patch fittings of panel E moved 10 mm up the slotted hole (Figure llb). No rotation of these two patch fittings was apparent, even though the two outer patch fittings at this level had rotated.
At 40 mm of test Ps4 at 5 mm/s, panel F failed in granules on the outside, and spreading over a horizontal distance of 1.2 m. The test proceeded and panel E failed at a displacement of 60 mm (at a displacement rate of 60 mm/s) , with the glass falling on the outside up to a horizontal distance of 1 m (Figure lld). The bottom right patch fitting of panel "In rotated, although no rotation of the disc within the fitting was apparent.
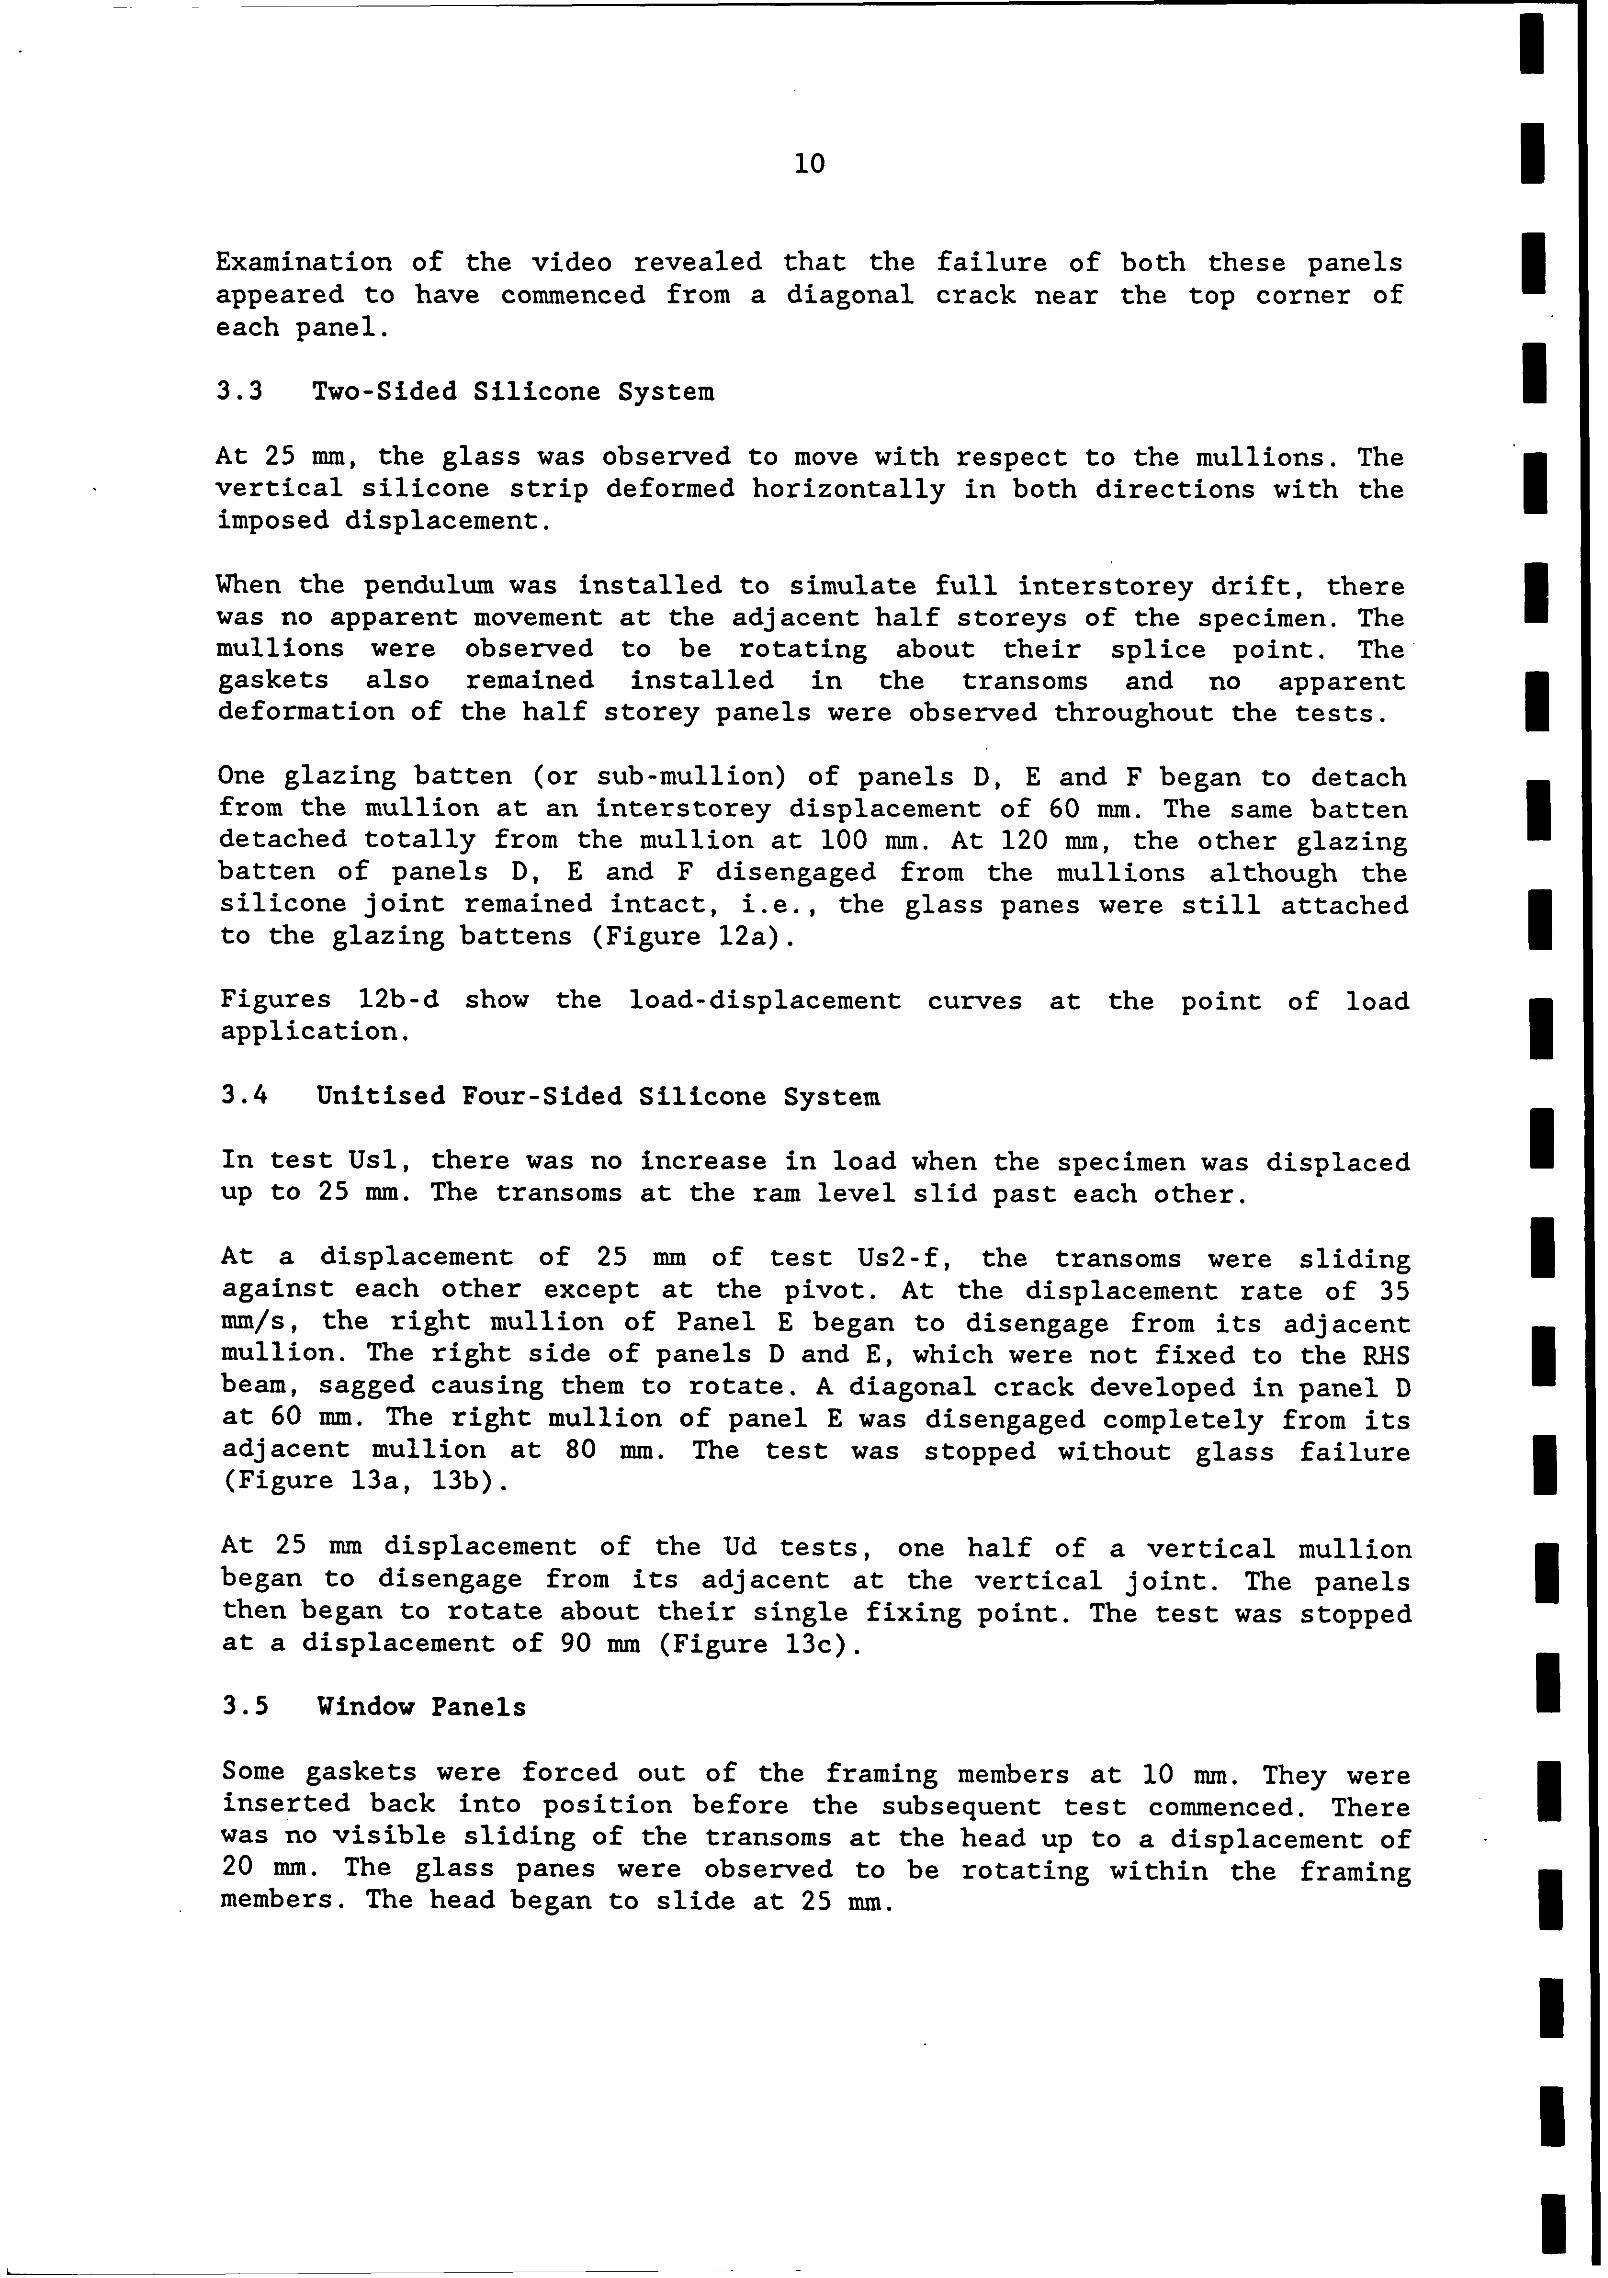
Examination of the video revealed that the failure of both these panels appeared to have commenced from a diagonal crack near the top corner of each panel.
3.3 Two-sided Silicone System
At 25 mm, the glass was observed to move with respect to the mullions. The vertical silicone strip deformed horizontally in both directions with the imposed displacement.
When the pendulum was installed to simulate full interstorey drift, there was no apparent movement at the adjacent half storeys of the specimen. The mullions were obsenred to be rotating about their splice point. The. gaskets also remained installed in the transoms and no apparent deformation of the half storey panels were observed throughout the tests.
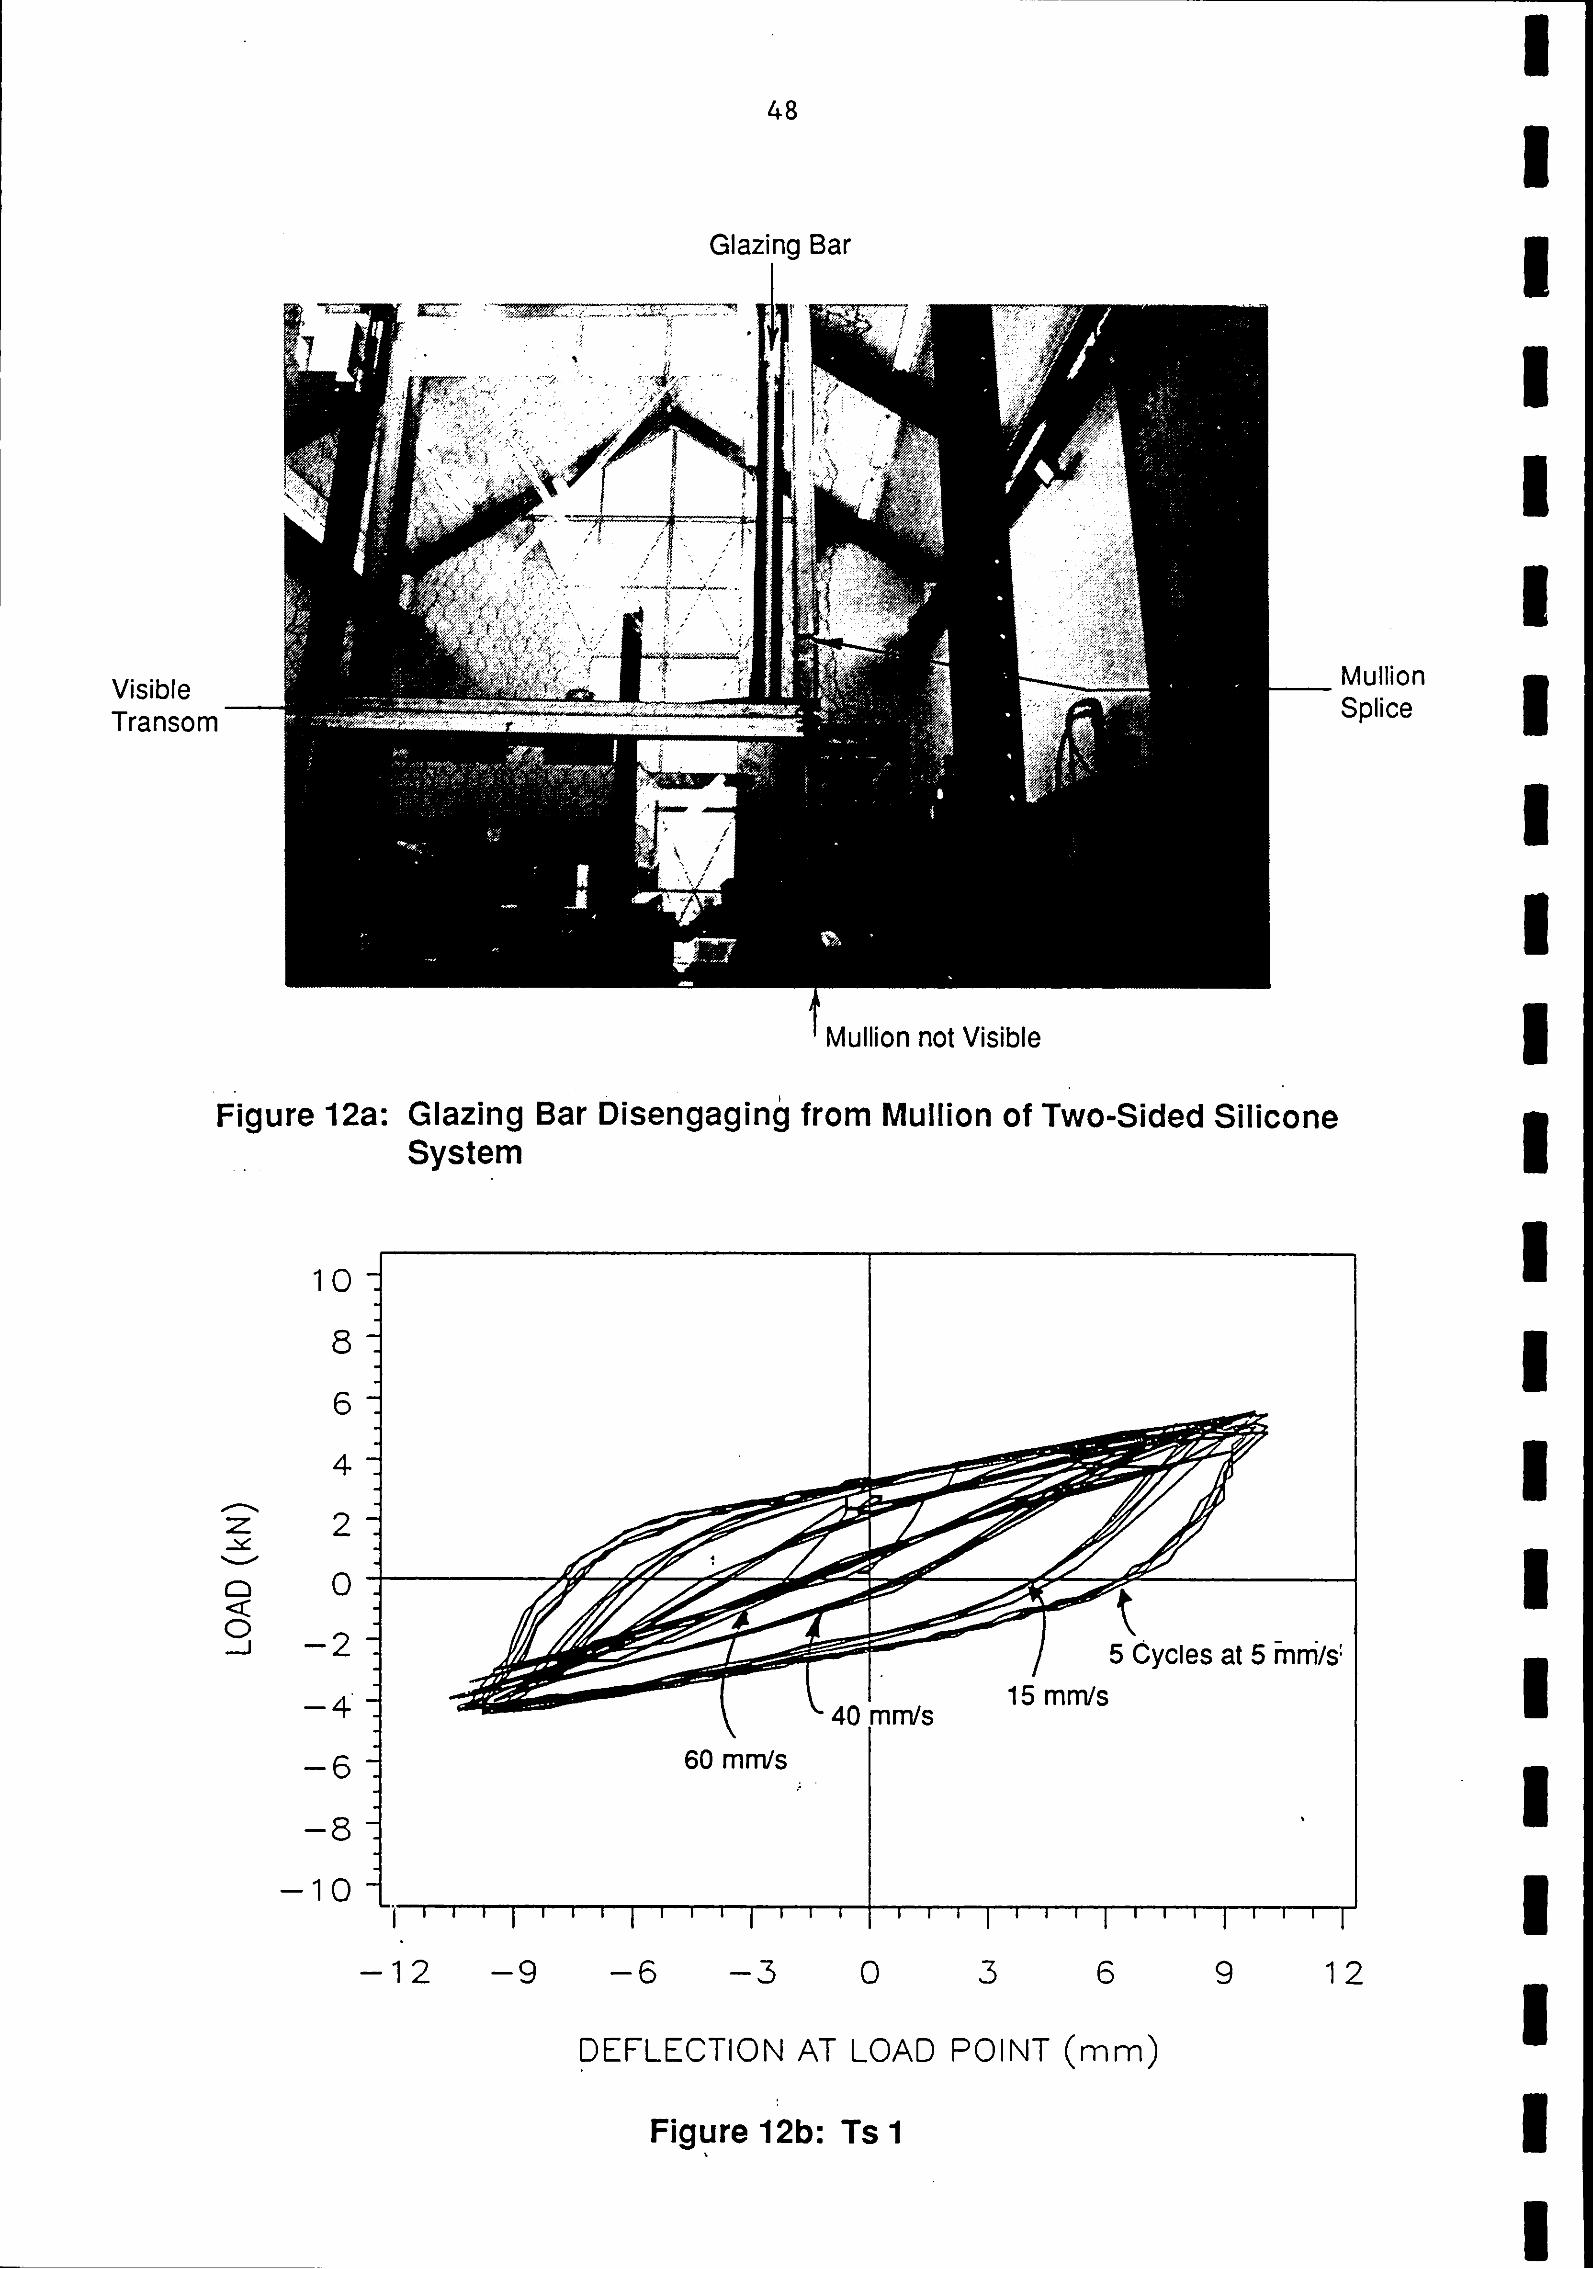
One glazing batten (or sub-mullion) of panels D, E and F began to detach from the mullion at an interstorey displacement of 60 nun. The same batten detached totally from the mullion at 100 mm. At 120 mm, the other glazing batten of panels D, E and F disengaged from the mullions although the silicone joint remained intact, i.e., the glass panes were still attached to the glazing battens (Figure 12a).
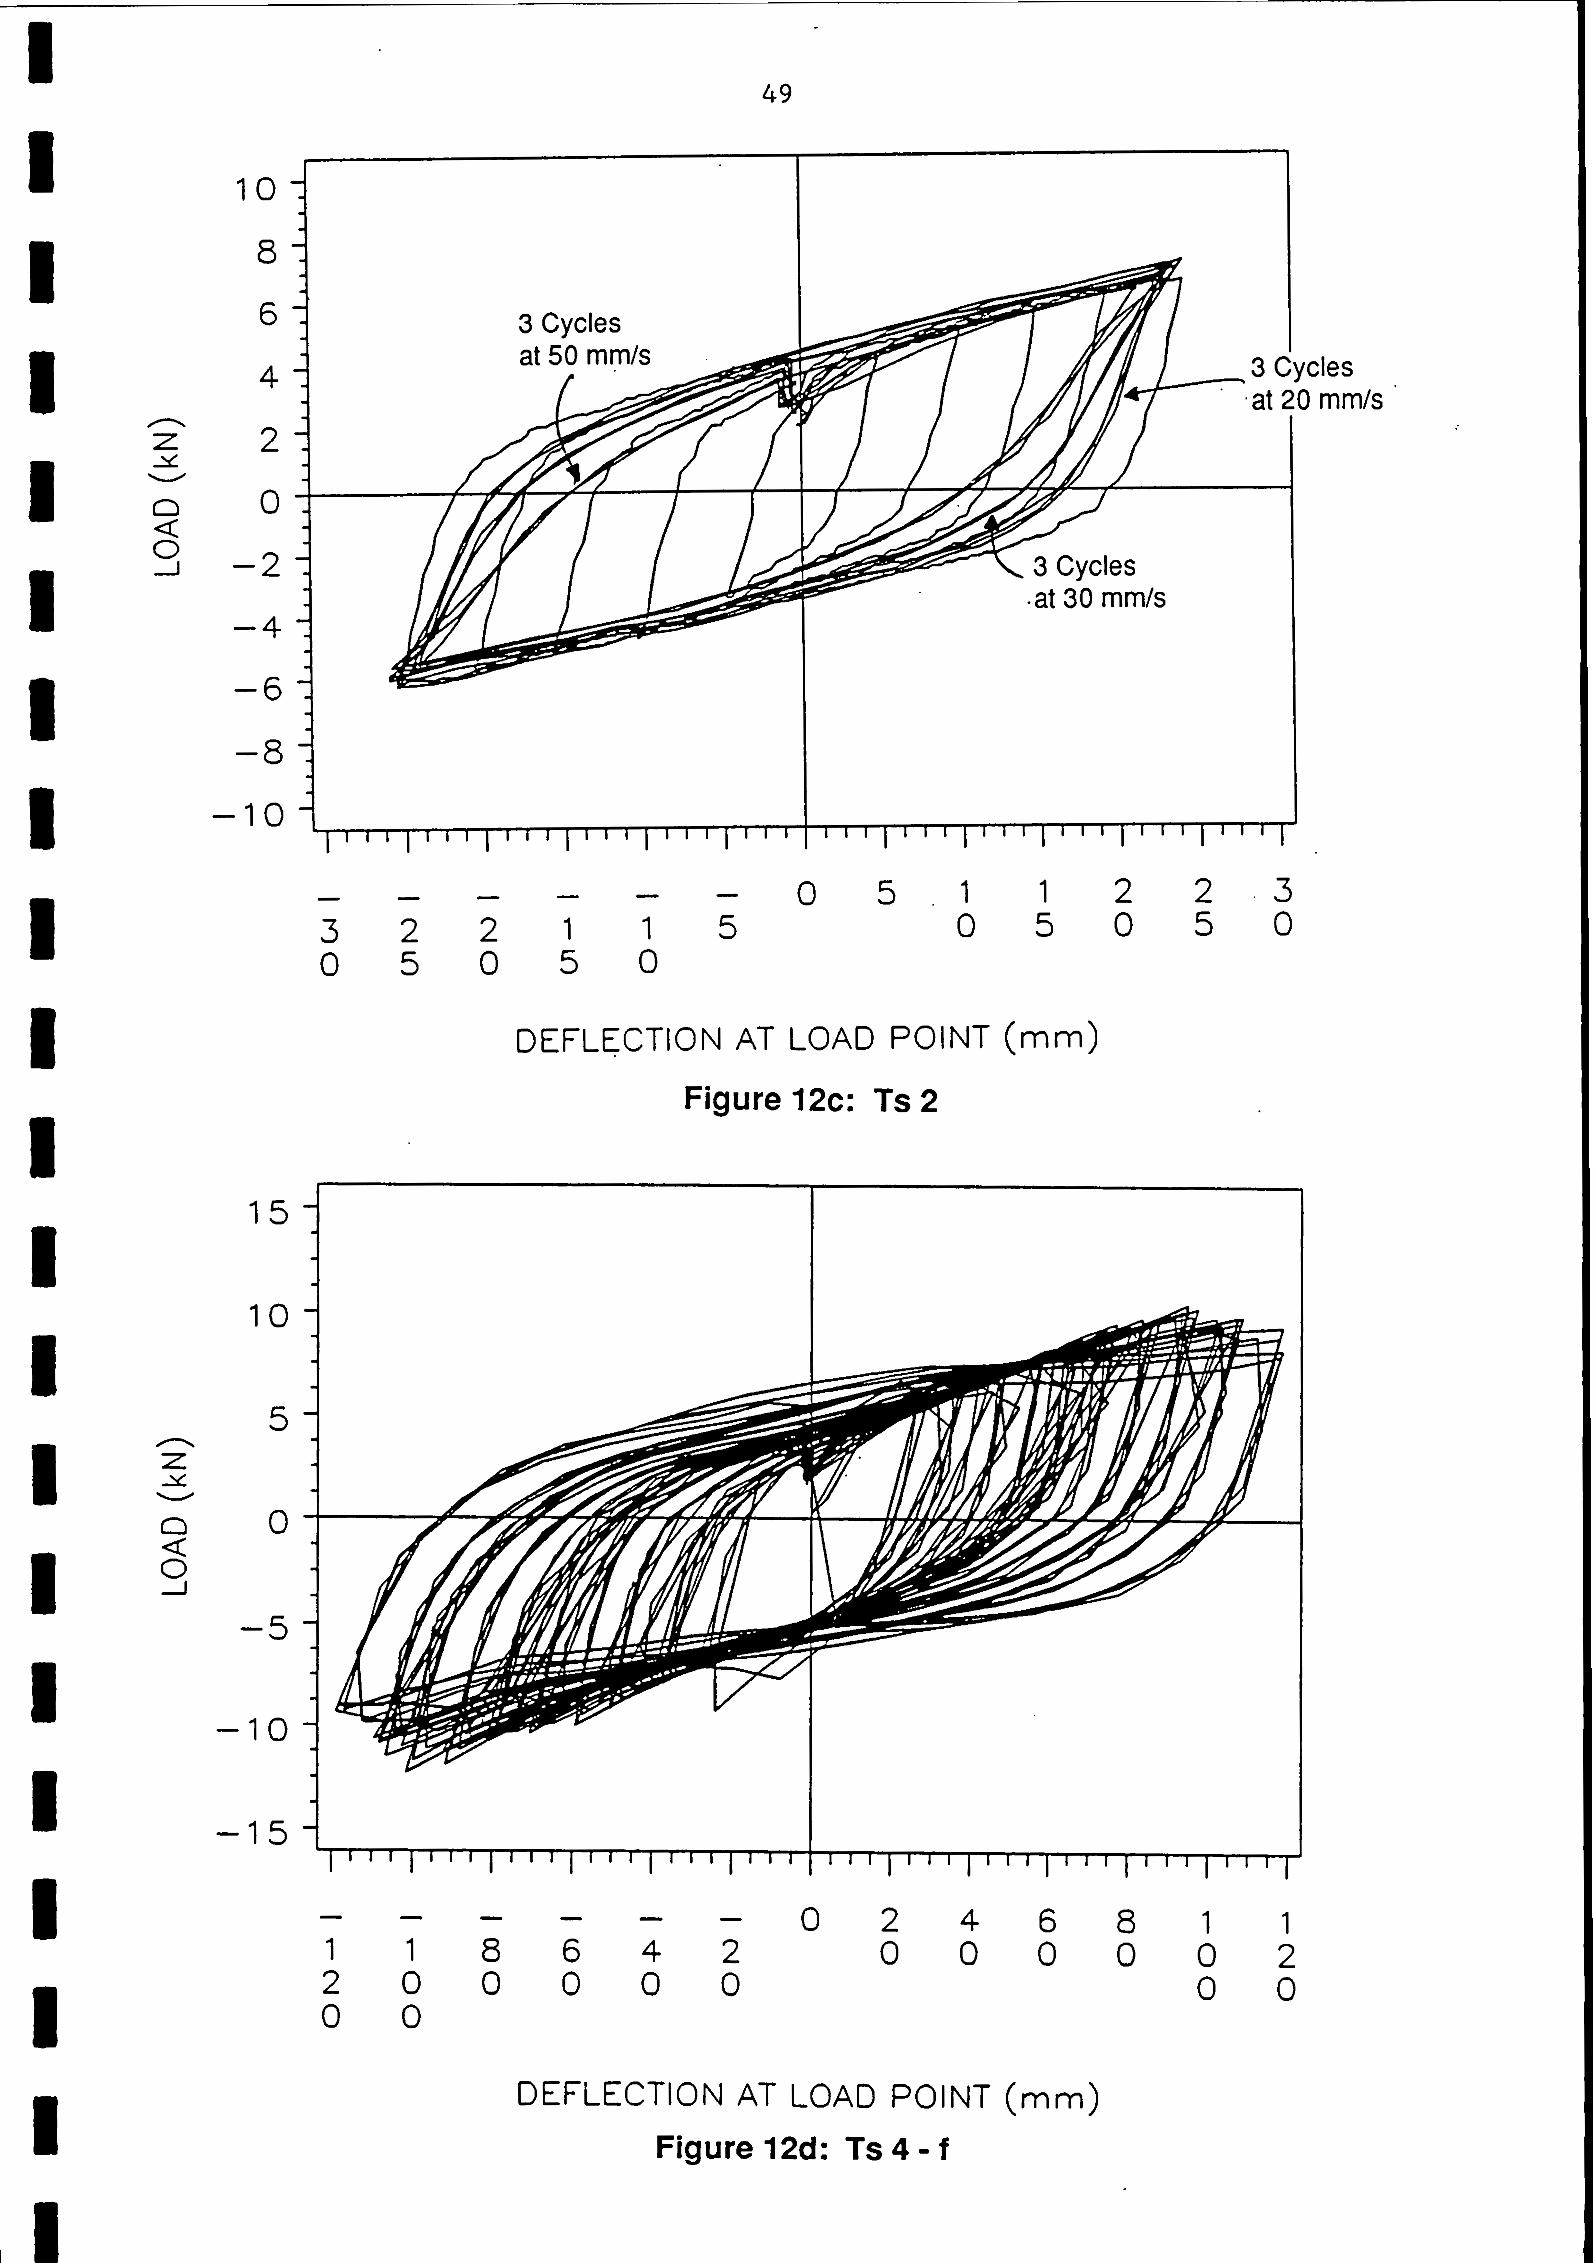
Figures 12b-d show the load-displacement curves at the point of load application.
3.4 Unitised Four-Sided Silicone System
In test Usl, there was no increase in load when the specimen was displaced up to 25 mm. The transoms at the ram level slid past each other.
At a displacement of 25 mm of test Us2-f, the transoms were sliding against each other except at the pivot. At the displacement rate of 35 mm/s, the right mullion of Panel E began to disengage from its adjacent mullion. The right side of panels D and E, which were not fixed to the RHS beam, sagged causing them to rotate. A diagonal crack developed in panel D at 60 mm. The right mullion of panel E was disengaged completely from its adjacent mullion at 80 mm. The test was stopped without glass failure (Figure 13a, 13b).
At 25 mm displacement of the Ud tests, one half of a vertical mullion began to disengage from its adjacent at the vertical joint. The panels then began to rotate about their single fixing point. The test was stopped at a displacement of 90 mm (Figure 13c).
3.5 Window Panels
Some gaskets were forced out of the framing members at 10 mm. They were inserted back into position before the subsequent test commenced. There was no visible sliding of the transoms at the head up to a displacement of 20 mm. The glass panes were observed to be rotating within the framing members. The head began to slide at 25 mm.
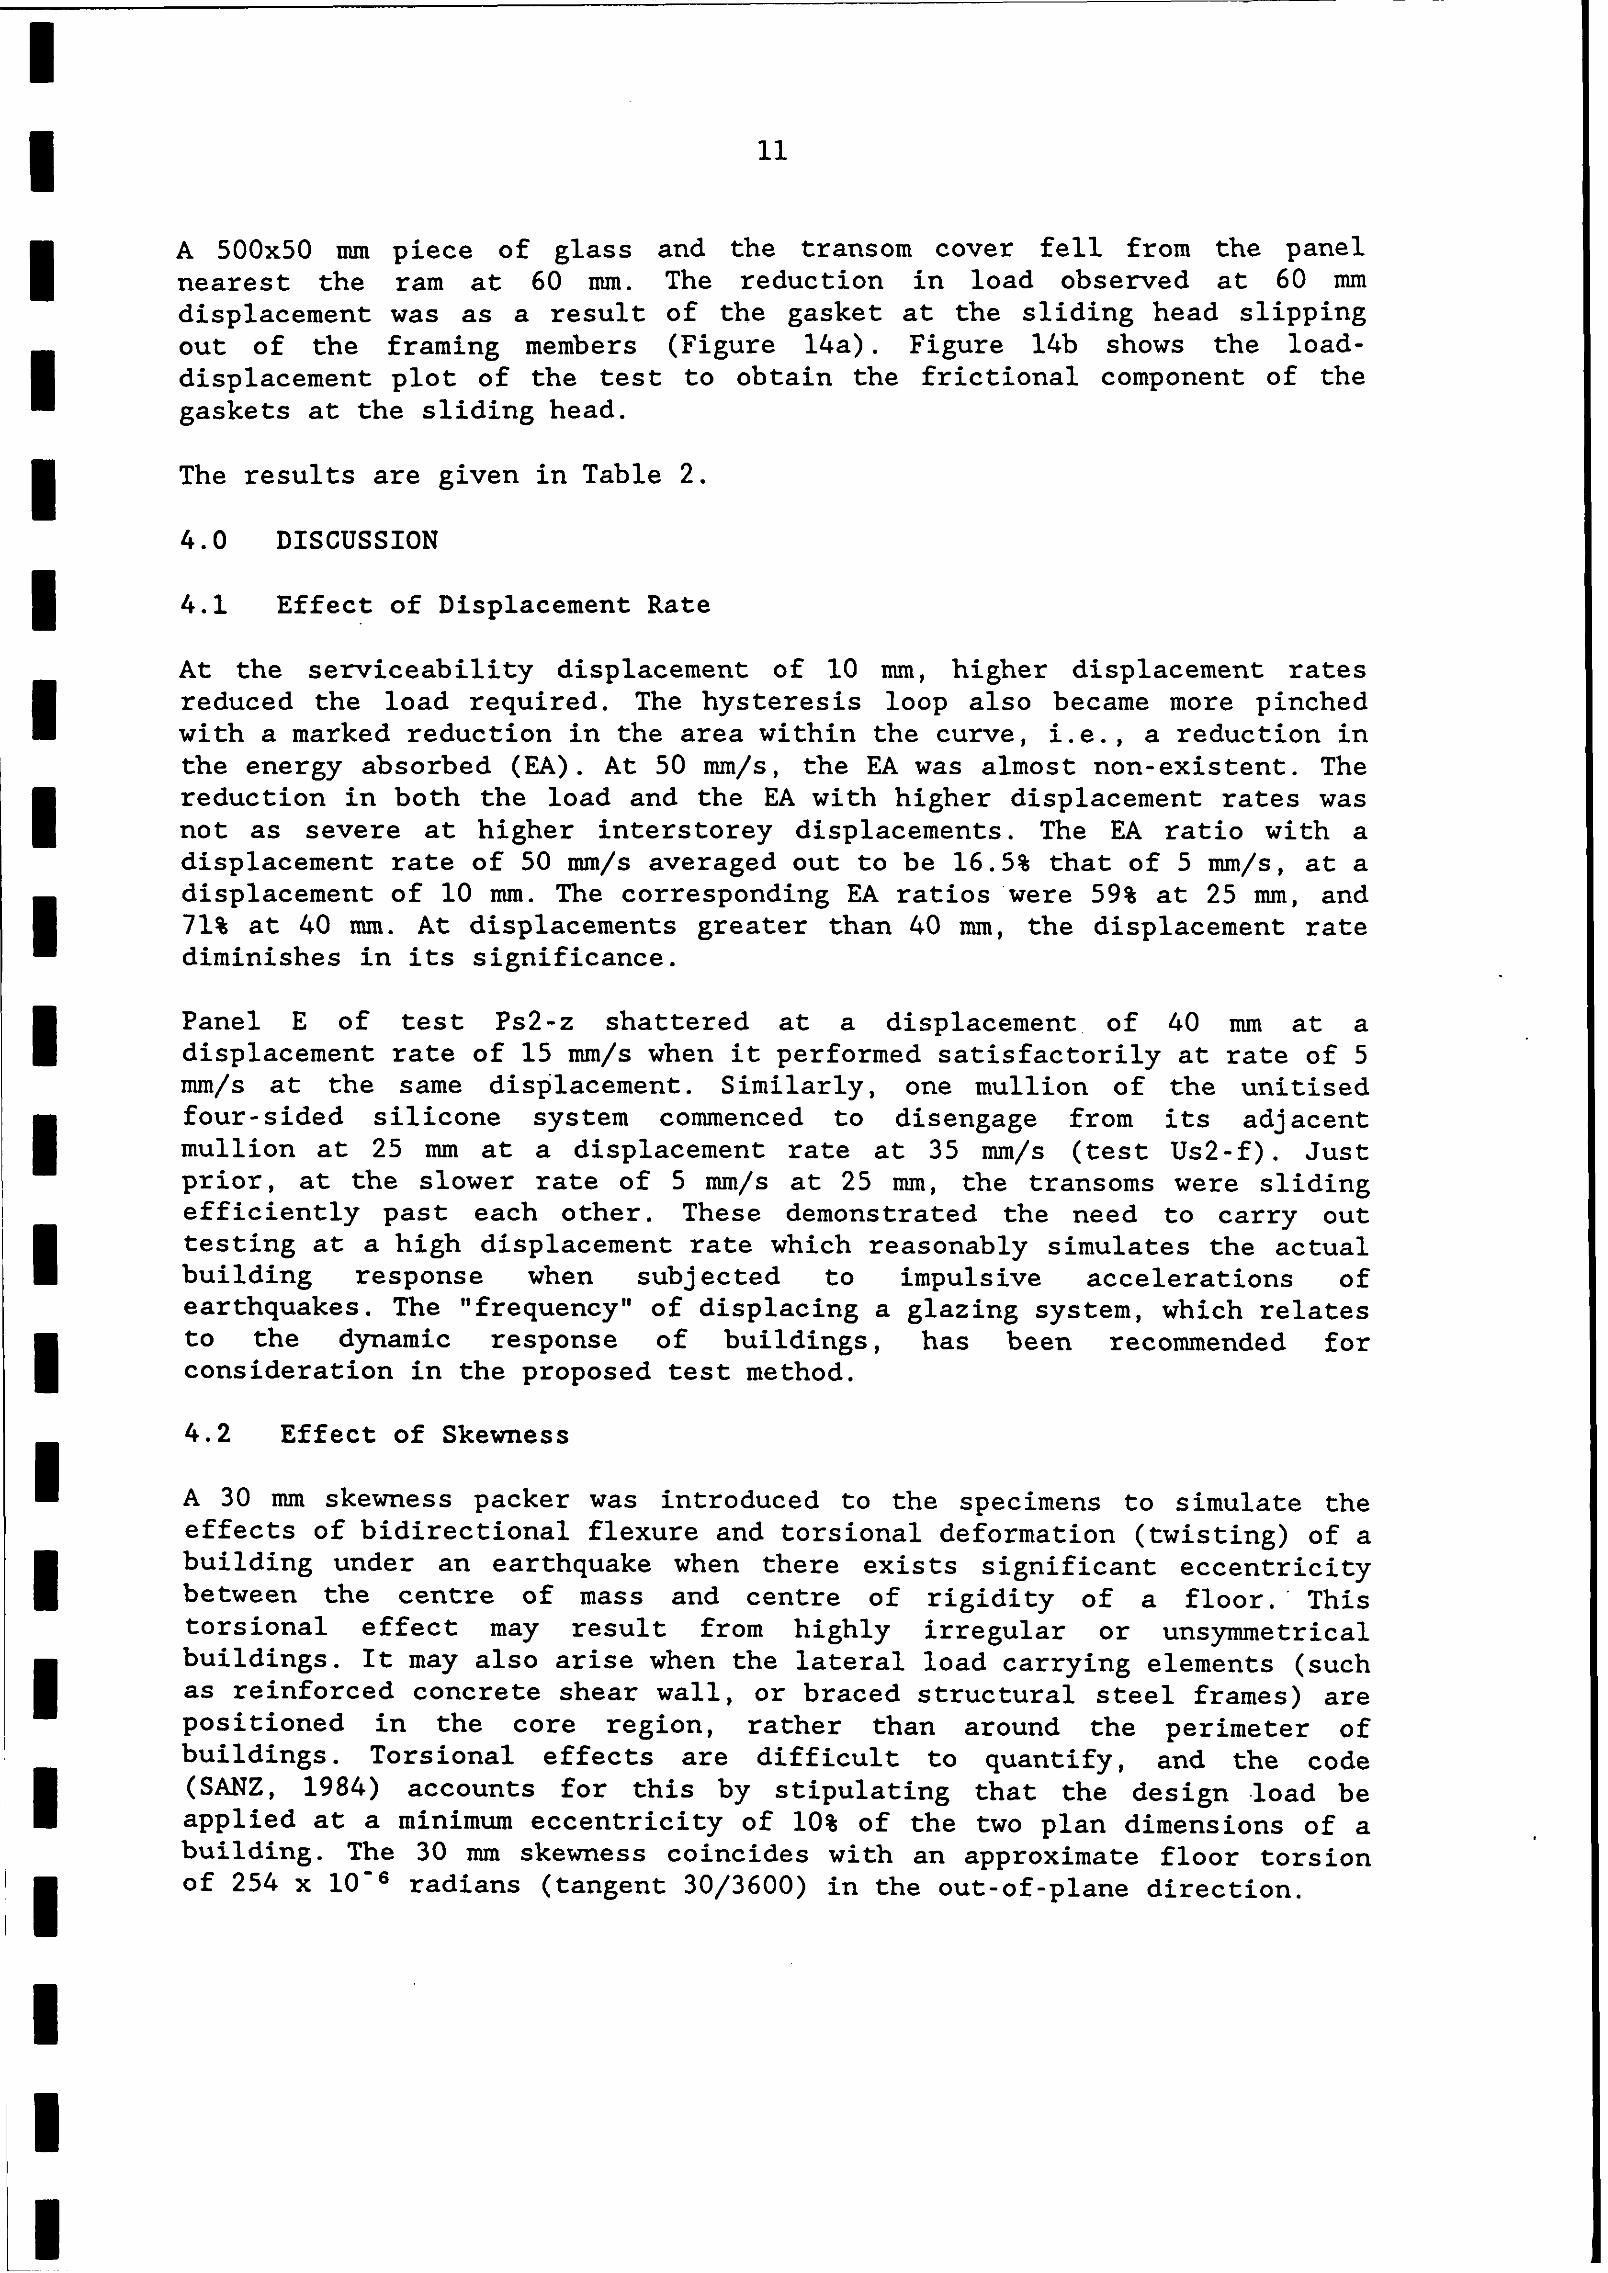
A 500x50 mm piece of glass and the transom cover fell from the panel nearest the ram at 60 mm. The reduction in load observed at 60 mm displacement was as a result of the gasket at the sliding head slipping out of the framing members (Figure 14a). Figure 14b shows the load- displacement plot of the test to obtain the frictional component of the gaskets at the sliding head.
The results are given in Table 2.
4.0 DISCUSSION
4.1 Effect of Displacement Rate
At the serviceability displacement of 10 mm, higher displacement rates reduced the load required. The hysteresis loop also became more pinched with a marked reduction in the area within the curve, i.e., a reduction in the energy absorbed (EA). At 50 mm/s, the EA was almost non-existent. The reduction in both the load and the EA with higher displacement rates was not as severe at higher interstorey displacements. The EA ratio with a displacement rate of 50 mm/s averaged out to be 16.5% that of 5 mm/s, at a displacement of 10 mm. The corresponding EA ratios 'were 59% at 25 mm, and 71% at 40 mm. At displacements greater than 40 mm, the displacement rate diminishes in its significance.
Panel E of test Ps2-z shattered at a displacement. of 40 mm at a displacement rate of 15 mm/s when it performed satisfactorily at rate of 5 mm/s at the same displacement. Similarly, one mullion of the unitised four-sided silicone system commenced to disengage from its adjacent mullion at 25 mm at a displacement rate at 35 mm/s (test Us2-f). Just prior, at the slower rate of 5 mm/s at 25 mm, the transoms were sliding efficiently past each other. These demonstrated the need to carry out testing at a high displacement rate which reasonably simulates the actual building response when subjected to impulsive accelerations of earthquakes. The "frequency" of displacing a glazing system, which relates to the dynamic response of buildings, has been recommended for consideration in the proposed test method.
4.2 Effect of Skewness
A 30 mm skewness packer was introduced to the specimens to simulate the effects of bidirectional flexure and torsional deformation (twisting) of a building under an earthquake when there exists significant eccentricity between the centre of mass and centre of rigidity of a floor.' This torsional effect may result from highly irregular or unsymmetrical buildings. It may also arise when the lateral load carrying elements (such as reinforced concrete shear wall, or braced structural steel frames) are positioned in the core region, rather than around the perimeter of buildings. Torsional effects are difficult to quantify, and the code (SANZ, 1984) accounts for this by stipulating that the design load be applied at a minimum eccentricity of 10% of the two plan dimensions of a building. The 30 mrn skewness coincides with an approximate floor torsion of 254 x 10" radians (tangent 30/3600) in the out-of-plane direction.
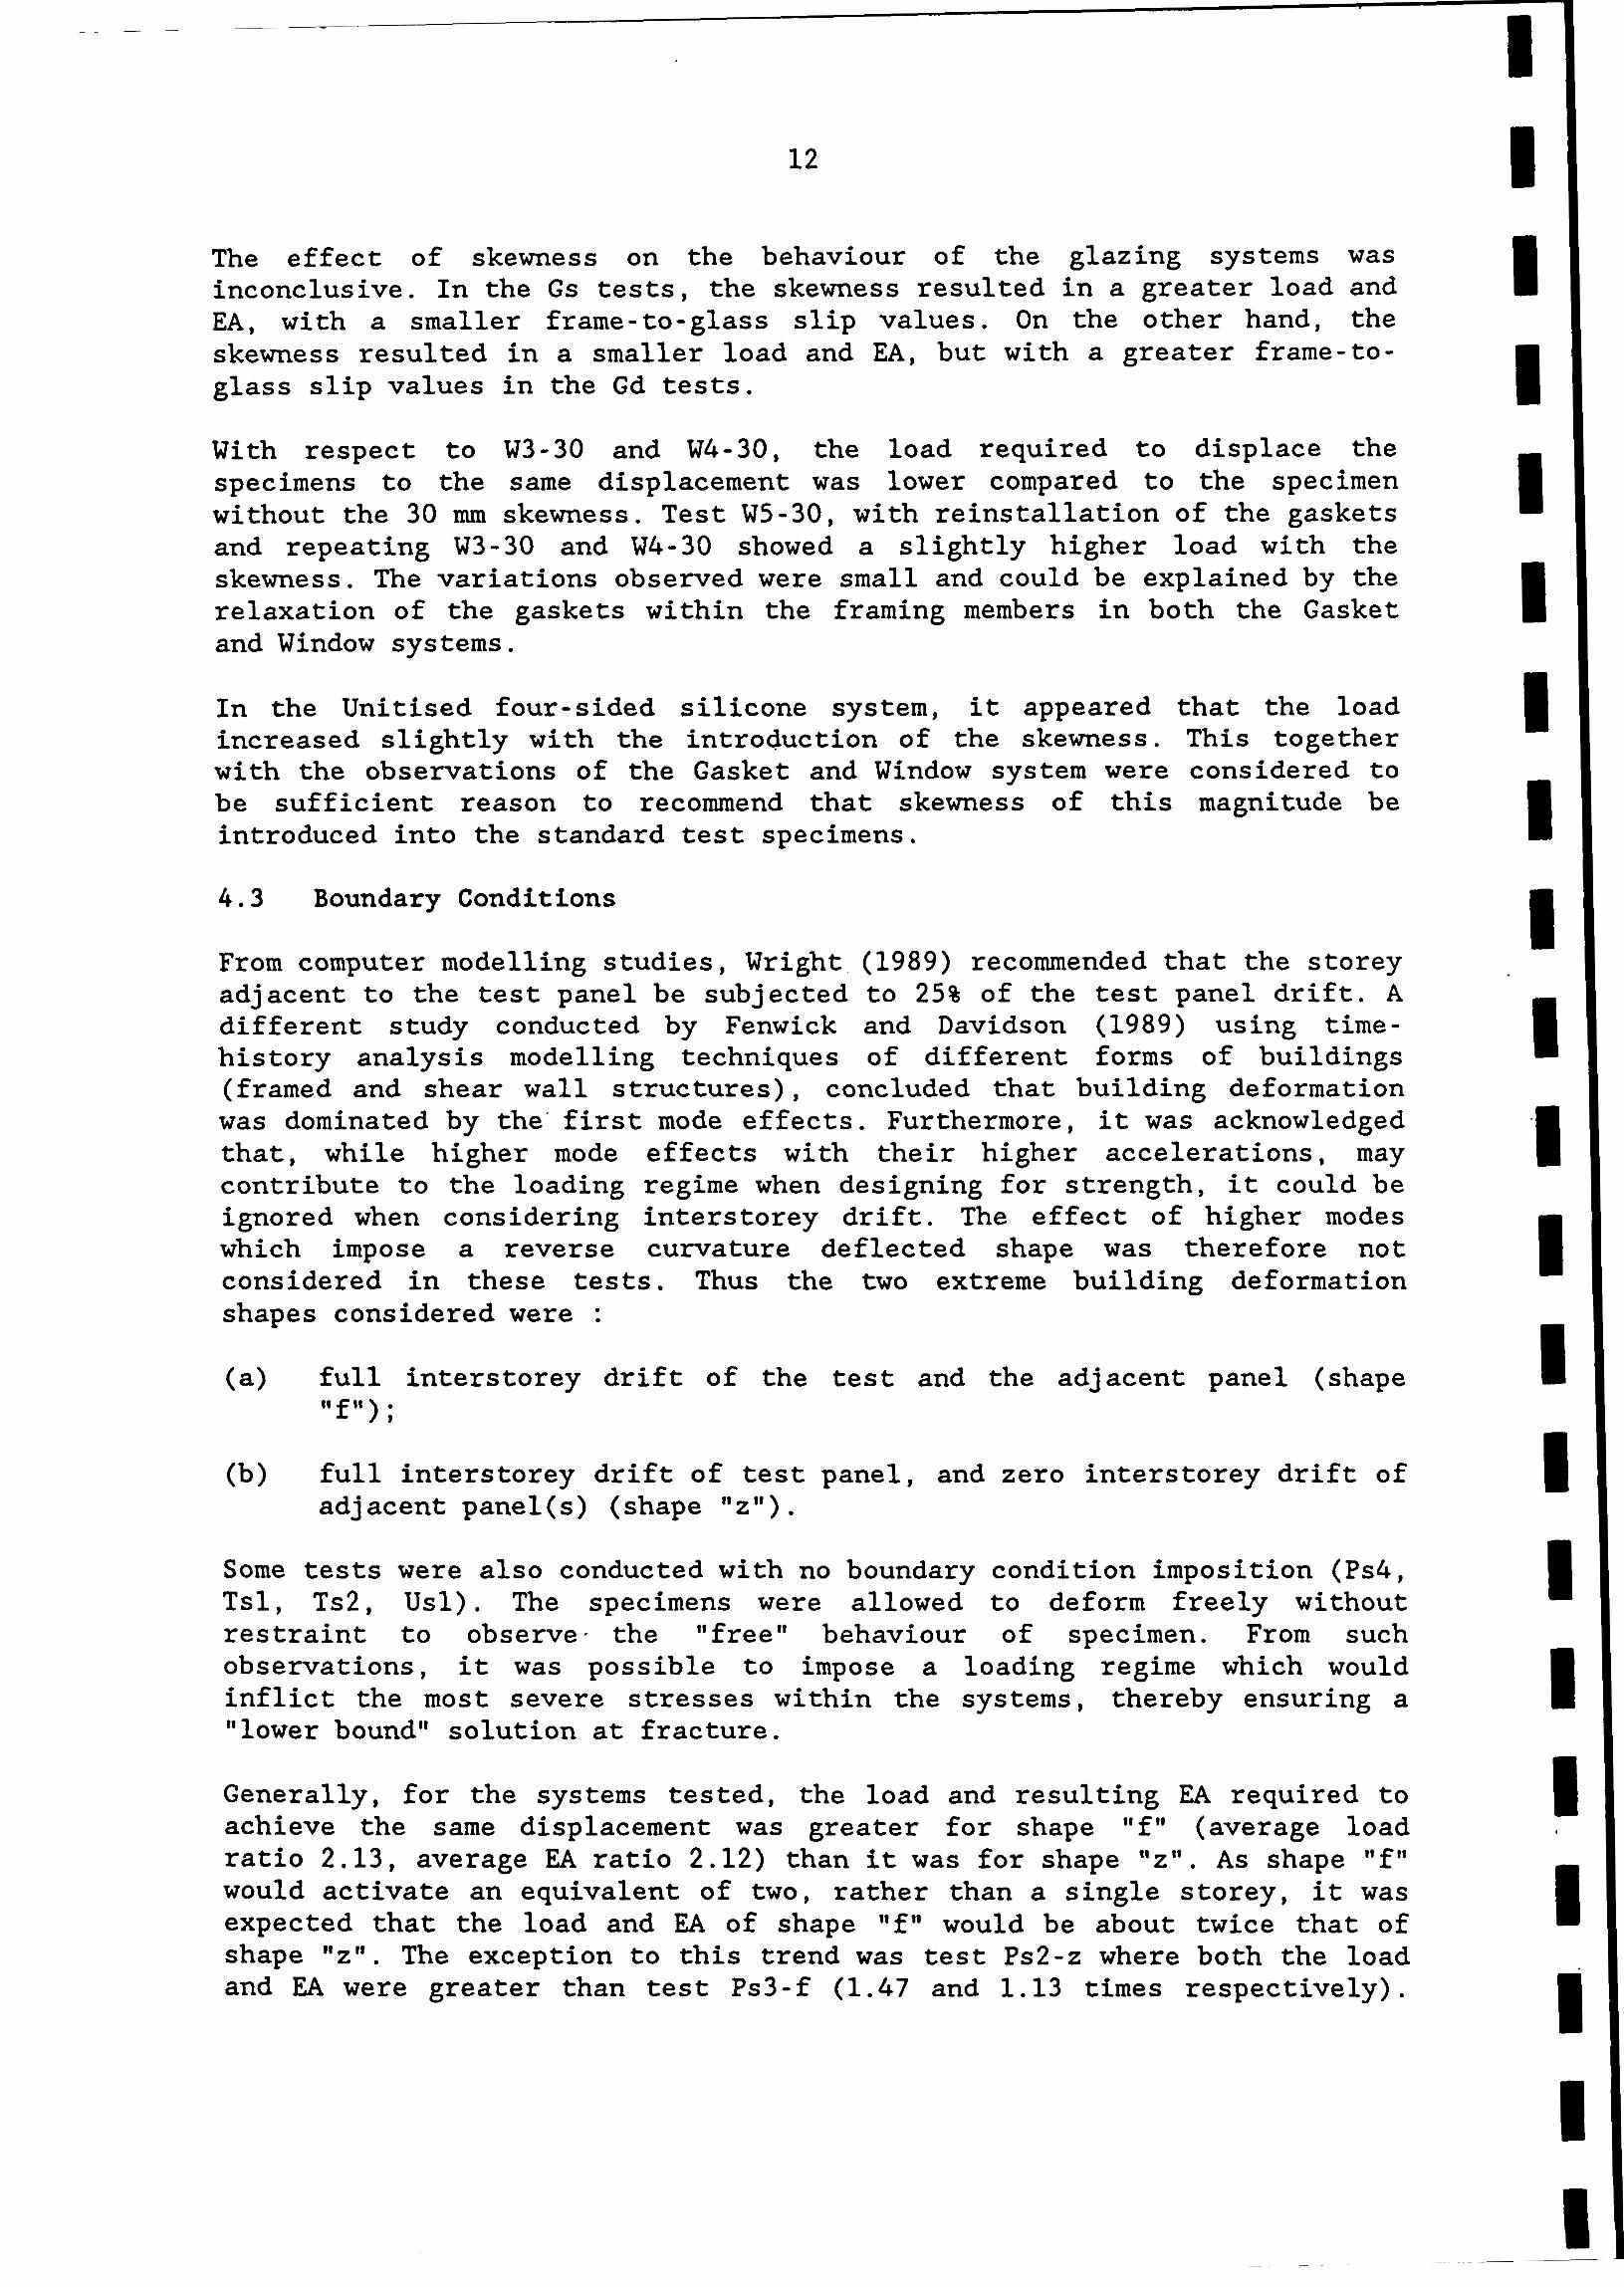
The effect of skewness on the behaviour of the glazing systems was inconclusive. In the Gs tests, the skewness resulted in a greater load and EA, with a smaller frame-to-glass slip values. On the other hand, the skewness resulted in a smaller load and EA, but with a greater frame- to- glass slip values in the Gd tests.
With respect to W3-30 and W4-30, the load required to displace the specimens to the same displacement was lower compared to the specimen without the 30 mm skewness. Test W5-30, with reinstallation of the gaskets and repeating W3-30 and W4-30 showed a slightly higher load with the skewness. The variations observed were small and could be explained by the relaxation of the gaskets within the framing members in both the Gasket and Window systems.
In the Unitised four-sided silicone system, it appeared that the load increased slightly with the introduction of the skewness. This together with the observations of the Gasket and Window system were considered to be sufficient reason to recommend that skewness of this magnitude be introduced into the standard test specimens.
4.3 Boundary Conditions
From computer modelling studies, Wright (1989) recommended that the storey adjacent to the test panel be subjected to 25% of the test panel drift. A different study conducted by Fenwick and Davidson (1989) using time- history analysis modelling techniques of different forms of buildings (framed and shear wall structures), concluded that building deformation was dominated by the first mode effects. Furthermore, it was acknowledged that, while higher mode effects with their higher accelerations, may contribute to the loading regime when designing for strength, it could be ignored when considering interstorey drift. The effect of higher modes which impose a reverse curvature deflected shape was therefore not considered in these tests. Thus the two extreme building deformation shapes considered were :
(a) full interstorey drift of the test and the adjacent panel (shape ttftt ;
(b) full interstorey drift of test panel, and zero interstorey drift of adjacent panel(s) (shape " z " ) .
Some tests were also conducted with no boundary condition imposition (Ps4, Tsl, Ts2, Usl). The specimens were allowed to deform freely without restraint to observe, the "free" behaviour of specimen. From such observations, it was possible to impose a loading regime which would inflict the most severe stresses within the systems, thereby ensuring a "lower boundw solution at fracture.
Generally, for the systems tested, the load and resulting EA required to achieve the same displacement was greater for shape "f" (average load ratio 2.13, average EA ratio 2.12) than it was for shape "2". As shape ,Ifll
would activate an equivalent of two, rather than a single storey, it was expected that the load and EA of shape "f" would be about twice that of shape "z". The exception to this trend was test Ps2-z where both the load and EA were greater than test Ps3-f (1.47 and 1.13 times respectively).
The load required and EA to achieve shape "f" compared to that with an unrestricted deformation shape was 1.36 and 1.23 times respectively.
It had been anticipated that shape "z" would induce higher stresses into the test pane1 because of the curvature demand of such shape (Wright, 1989). Ps2-z was the only test that this effect was observed. This was attributed to the behaviour of the patch fitting, which also explained why the load for shape "z" was greater than shape If t l
In an attempt to ascertain the deformed shape of the upper storey mullions in shape "z", additional LVDT's were installed at the mid-depth of these upper mullions in the Gd and Gdt tests. The measured mullion deflections were negligible in the tests. Photographic evidence confirmed that there were no lateral deflections of the mullions, even when an interstorey displacement of greater than 100 mm was applied at the bottom storey. While the effect of different building deformation shapes varied with the generic glazing systems, it was considered necessary that both the shapes ("zit and "f") be specified in the proposed test method. It will not be necessary however to test the glazing specimens using both the shapes to failure. It is proposed that both shapes be racked up to a displacement of 40 mm. The racking shall proceed using the shape that imposes the more severe condition on the glazing system, either to failure, or to a drift limit as determined by the manufacturer.
The two specimen configurations ("s" and "d") were also investigated to determine the effects of boundary conditions that occur in buildings resulting from glazing panel positioning and fixing. Configuration "s" was used to model glazimg systems which have mullions continuous over more than one floor. The two half-storey panels above and below the tested storey were installed to mode1 the boundary conditions of such mullions. It was acknowledged that fixing (i.e., precluding rotation) of the two half-storey panels did not represent the boundary conditions in actual buildings, although it resulted in a more severe boundary condition. A more accurate simulation would result when both the two half storey panels were allowed to rotate.
Configuration "dm was used to model full-height panels, although only one boundary condition of each panel was modelled. This configuration would be more suitable for modelling glazing system which has its supporting members discontinuous between floors, such as the Unitised four-sided silicone system.
No trend in the behaviour of the two configurations for the Gasket system was observed. On the one hand, there was no significant difference in the load and EA values (Gsl-z and Gd2-z; Gs2-z30 and Gd3-z30). On the other hand, the load required and the EA value of Gs3-f30 was significantly greater than Gd4- f 30 (EA value of 1.34 kNm in former cf. 0.45 kNm in the latter). This was attributed to the lower displacement rate of 2 mm/s in the former and 5 mm/s in the latter. The former test also displaced the specimen to 45 mm, while the latter only displaced the specimen to 40 mm.
The load required and resulting EA of configuration "d" was slightly greater than configuration "s" of the Unitised four-sided silicone system because of the higher displacement of 30 mm imposed compared to only 25 mm in the latter. While the effect of the two configurations could not be
quantified, it was apparent that the presence of adjacent panels above and below the test panel did affect its behaviour.
4.4 Different Incremental Displacements and Multiple Cycles
The performance of nonstructural components such as glazing systems is associated with the imposed level of displacement, the load and resistance of the structure being of secondary importance. It has been claimed that a double amplitude cyclic test method of progressively increasing amplitude approximates the in-service conditions representative of earthquake loading (Cooney and Collins, 1987). Thus displacement control was imposed throughout the testing programme.
There was no apparent difference in behaviour when using 5, 10, 25 or 40 mm incremental displacements.
The load-displacement plots at the load point of the systems showed a reduction in load with greater number of cycles at each amplitude. There was no significant reduction in the EA since the hysteresis loop paths followed closely that of the initial cycle. The load with increasing number of cycles was not less than 80% of its initial cycle, indicating that the reduction was not significant. Some glazing systems sealed with gaskets had their gaskets slip out with the increased number of cycles. This will influence their serviceability behaviour after an earthquake.
From the current test results, it must be anticipated that the gaskets of glazing systems (using gaskets) will be partially or fully dislodged from their framing members during a major earthquake. The system may then be subjected to the earthquake aftershocks. In this deteriorated condition, it will then be easier for the glass to move within the framing members. The glass may fall down the building and be life threatening, if the entrapment depth of the glass in the framing members is not sufficient. Likewise, the behaviour during a subsequent earthquake may also be affected if the gaskets are not reinstalled after a major earthquake attack.
It is recommended that not less than 5 cycles be tested at each amplitude using an incremental displacement of 5 mm initially, and 10 mm after a displacement of 50 mm.
4 . 5 Failure Modes and Performance of the Generic Systems
Failure of both the Gs and Gd Gasket glazed systems occurred through diagonal compression of glass commencing at displacements of 75 mm and 90 mm respectively. Under imposed racking displacements, the framing members were displaced laterally. OThe glass rotated with increasing racking displacement until two of its corners were in contact with two corners of the framing members, when it began to take load. The theoretical deflection calculated (using equation 1) was 117 rnm for these specimens, and it compared reasonably with the 120 mm and 100 mrn respectively observed in the Gs and Gd tests. The 80 kN failure load in test Gs5-f was due to the locking of the test rig (i. e. , bolt shear failure at a sleeve bracket) rather than the glass taking load. The gaskets sealing the glass began to slip out of the framing members at an interstorey displacement of 15 mm (just beyond the serviceability limit) cf. 8 mm from Sakamoto et a1 (1984).
The addition of transoms at the sill level in the Gdt tests resulted in the opaque panels (i.e. panels below the transoms) moving with the floor. This implied a greater curvature requirement on the vision panels because full interstorey drift was being taken up by these shortened panels. Theoretically, the maximum deflection observed should therefore be lower than for the Gd test. The theoretical failure deflection calculated (using equation 1) was 96 mm. This was however, not observed and the test was stopped at 120 mrn when screws fixing mullions to the timber framed wall at sill level withdrew without failure of the glass. The imposed loads for these tests were lower than the Gd tests, consistent with the reduced glass weight of the smaller glass panel.
Failure of the patch fitting system is postulated to have occurred when the ultimate tensile load of glass around the fixing points was reached at an interstorey displacement of 40 mm. There was minimal rotation of the discs within the slot. The racking displacement was accommodated by a combination of sliding of the fixing nuts in slotted holes, and by the 10 mm wide silicone compressing/extending between the glass panels.
The shape "2" specimen required a greater load and was thus more severely loaded than shape "f" . This was consistent with the observed behaviour of the quadruple patch fitting. While the patch fitting of the storey that was being racked attempted to slide along the slotted hole, and to rotate both the disc and the backing plate, the "zero drift" limitation imposed on the adjacent storey endeavoured to prevent plate rotation. The discs of the patch were orientated at 45 degrees to the horizontal in the same direction. This orientation allowed the nut to slide along the slotted hole under tension in one direction, but restricted movement of the pane in the reverse direction. Tensile stresses occurred adjacent to the fixing point during the reverse cycle.
No failure was observed for the Ts series. The test was stopped soon after the glazing battens disengaged from the mullion. While the two vertical sides of the glass panels were disengaged from the support, the two horizontal sides were still embedded in the transoms, and thus the failure criterion specified was not reached. The horizontal slips between the glass and framing member of the tests ranged between 1.6 to 3.4 times those of the corresponding vertical slips. This confirmed that the predominant mechanism to achieve the imposed displacement was movement of the glass along the transoms. Moreover, it also confirmed that while the silicone had been stressed, as deduced from the compressing/stretching between glass panels, the silicone retained its integrity permitting load transmission to the mullions. This consequently overloaded the mullion- batten connection, initiating the observed separation.
There were no failure of the Us and Ud series. No movement was apparent at the panel fixing points. However, for the side of the panels with no fixing to the floor (RHS beams), significant rotation of the panels occurred. The units (nearer the ram) which had two fixing points remained intact (Figure 13a). An attempt was made to induce stress in the silicone/glass joint by bolting the bottom transom to the simulated floor of test Ud6-f30. The silicone was not stressed during the test. The load required to displace the specimen was however substantially greater as a result of the bottom transom being prevented from sliding.

The sliding-head window framed system was included in this study to obtain an indication of the performance of the more traditional sill-to-head glazing systems, thereby enabling some comparison with the curtain wall systems. The window system failed at 60 mrn by glass falling from the frame. The anticipated sliding action at the head did not occur until a threshold force was reached because of the tight-fitting of the gasket at the head framing. The friction force of the gasketfiead junction had a linear relationship with displacement up to 20 mm, when the force was approximately 5 kN (Figure 14b).
The maximum applied force (at failure, or when the test was stopped) of each of the glazing systems was within the range 10 to 18.5 kN (except for test Gs5-f where bolt bearing failure of the test frame occurred). The 1.8 m high window panels required a correspondingly lower force of 5 . No attempt was made to quantify the failure stress of glass used in the different systems.
Where seismic movement is designed to be taken up by clearance between the glass and framing members, care must be taken to ensure that the specified clearance is provided, and maintained during construction. The entrapment depth of the glass must be sufficient to ensure adequate face loading restraint from extreme lateral seismic movement. On the other hand, where sliding mechanisms are detailed to accommodate seismic drift, care must be taken to ensure such movement can occur without restraint.
While the primary objective of the test programme was to identify the parameters affecting the performance of glazing systems, to enable a test method to be developed, it was reassuring that all the glazing systems tested performed well. The minimum interstorey deflection achieved at failure was 40 mm, which is equivalent to an interstorey drift of 1.4% of the height of the specimen tested. This is substantially greater than the 1% interstorey drift limit allowed by the current code, NZS 4203 (SANZ, 1984). DZ4203 (SANZ, 1990) is removing this arbitrary control limit in an attempt to facilitate innovative design and construction. Thus the maximum permissible interstorey drift limit is likely to increase to 2.0% of the storey height, where P-delta effects have been included in the analysis.
4.6 Miscellaneous Considerations
In each of the following, frame load-bearing and friction has been ignored, i.e., the full load imposed on the frame was considered to be transmitted to the specimens.
4.6.1 Stiffness
The initial stiffness of the specimens in Table 3 was obtained from the load-displacement curve of the specimens at 3 mm deflection (Figure 15). The final stiffness was obtained by dividing the maximum load by the maximum displacement. The predicted stiffness was obtained by making the following assumptions :
(a) the glazing panels acted as a single degree of freedom system;
(b) glazing panels behaved as a cantilever under in-plane action;
(c) shear action governed with negligible flexural action;
(d) no stiffness contribution from the framing members;
The shear stiffness, Ks P/y - E(As/h)/(1+2u) .......... [2] where E/(1+2u) = the shear modulus; As = shear area - Bt where B is the width of the specimen; t = the thickness of the glass; h the height of the specimen; E - the modulus of elasticity of glass - 70 Mpa; u - Poisson's ratio of glass - 0.23. Table 3 shows the comparison of the different stiffnesses of the specimens.
Apart from the Gs series, the ratio of final-to-predicted stiffness ranged from 0.19 to 0.72 with an average of 0.41. The ratio of initial-to- predicted stiffness ranged from 0.36 to 3.32. Systems relying on the clearance between the glass and framing members to accommodate the racking displacement (Gs, Gd, Gdt , Ts , W series) had initial-to-predicted stiffness ratios ranging from 1.35 to 3.32, while the others from 0.36 to 0.89 (Ps, Us, Ud series). The higher initial stiffness of the glazing system is in agreement with Sharpe's (1972) observations that buildings were much stiffer during the first few seconds of response to the 1971 San Fernando earthquake through the contributions of nonstructural elements. The building periods lengthened as the earthquake-induced motions continued.
An example of the stiffness component of glazing systems to the total storey stiffness is given in Appendix A. The example indicated that the stiffness contribution from glazing systems to total storey stiffness is not negligible, and maybe significant.
4.6.2 Damping
The amount of damping in a system is related to the area of the hysteresis loop (Mahin and Bertero, 1972; Clough and Penzein, 1975; Freeman, 1977; Turkington et al, 1989).
The equivalent viscous damping - 1/2x x(EA/LEC) ........ [3] where LEC - Linear Energy Capacity as defined by Freeman (1977).
Turkington et a1 (1989) used an alternative method to calculate damping from time history analyses. After rearranging the equations,
Damping Ratio - EA /[2~ Ks (yma~)~] ........ [4] where ymax - the maximum deflection attained.
The calculated damping of the specimens is given in Table 4.
The equivalent viscous damping obtained from equation 3 varied from 0.09 to 0.43. This variation was a reflection of the difficulty in estimating LEC. On the other hand, discounting the Gs series, the damping ratio predicted by equation 4, ranged from 0.03 to 0.10. Test Gs5-f has a damping ratio of 0.16 probably as a result of the bolt bearing on the test frame. The damping ratio of the Gasket glazed, Patch fitting and Window
systems was estimated at approximately 5%, while the Unitised four-sided and Two-sided silicone systems had estimated damping ratios of 7 and 10% respectively.
4.7 Issues for Consideration in the Proposed Test Method
The performance of a glazing system is dependent on the response of a building to an earthquake. This response is affected by the stiffness and mass distribution of the load-carrying structure, together with the stiffnesses and masses of nonstructural elements which are not adequately separated from the load carrying elements (Sharpe, 1972; Sakamoto et al, 1984). The ideal test method for curtain wall glazing systems would therefore be to displace the specimens according to the time-history interstorey displacement of a prototype building subjected to the design earthquake.
Wright (1989) pointed out that the interstorey deflection calculated by designers is highly inexact and designers have been known to adjust their member stiffness values so as to comply with the code limitations. Fenwick et a1 (1989) suggested that post-elastic deflections, calculated using the structural analysis process may well underestimate the actual building deformation by up to 30%. It would therefore be reasonable to require the curtain wall glazing system to withstand 1.25 times the computed maximum interstorey displacement to verify adequate performance.
It is recommanded that the following parameters be considered when proposing a method of test.
(a> Test rig
The test rig should be able to accept specimens of either a double storey, or a single storey plus two half storeys configuration. There should be the ability to have either "free sliding" or "locked" horizontal members which are sufficiently rigid to support the specimen without distortion, both at rest (under self-weight), and during racking. The rig should be able to impose either linear frame distortion, or zero interstorey drift of the adjacent storey to the specimen during racking. The support brackets for the horizontal members should have the ability to accept up to 50 mm of skewness at one or two corners.
(b) Specimen dimensions
Most buildings have storey heights ranging from 2.6 to 4.0 m. For convenience,a 2.8 m storey height (as the current test series) is recommended for the proposed test method. The displacement limits for other storey heights may be determined by multiplying the test displacement with the factor of actual height (in m) divided by 2.8.
It is recommended that the minimum width of specimens be 3.0 m, since the spacing of the mullions of glazing systems may be at spacings less than 1.2 m (such as 0.8 or 0.6 m).

(4 Specimen configuration
Glazing systems which incorporate a primary structural system which is supported from one floor only, and include some mechanism within the plane of the glazing system that will permit discontinuity (such as the Unitised four-sided silicone system), should be tested using configuration I # dll . Systems which have the glazing supporting members (such as mullions) continuous between adjacent floors should be tested using configuration "s". The two half storey panels should be permitted to rotate within the plane of the glazing system. Glazing systems incorporating "vision" and "opaque" panels can also be modelled using this configuration.
(d) Interstorey drift limits
The racking test may either target a predetermined drift limit, or test a glazing system to destruction to determine the upper bound of the drift limit that can be tolerated. In the former, the test drift limit shall be multiplied by 1.25 times the required drift limit. In the latter, the drift limit that can be tolerated by a particular glazing system shall be determined from dividing the achieved test drift limit by 1.25.
(4 Rate of displacement
The rate of displacement has been found to be significant in assessing the performance of different systems. For peak displacements less than 40 nun (1.25xl%x3200 m m ) , a frequency of 1.0 Hz is recommended, and a frequency of 0.5 Hz is recommended for displacements greater than 40 mm.
(f) Imposed shapes
Both shapes "z" and "f" are recommended to be considered up to an interstorey drift of 40 mm. It should then be assessed as to which shape is posing to be the most severe effect on the glazing system. The system shall then be tested to the drift limit of (d) above, using the more severe shape.
(g) Procedure
A double amplitude cyclic procedure of incrementing the displacement of the system to the required limit is recommended. A saw-tooth displacement pattern with five cycles being conducted at each displacement is recommended. An incremental displacement of 5 mm is recommended for test displacements up to and including 50 rnm, and an incremental displacment of 10 mm is recommended for test displacements greater than 50 mrn.
(h) Failure criterion
The primary issue with the test method is to prevent excessive risk to building occupants or those adjacent to structure being injured or killed by glass falling from a structure during an earthquake attack. An appropriate failure criterion is therefore likely to be related to the size (and mass) of any glass falling from the building. A value of 0.5% of the mass of glass fallen during the test is suggested.
5.0 FUTURE WORK
Corner effects and bidirectional deformation of glazing systems under racking displacements were not included in this phase of the study. Priority was given to simpler in-plane action, to be followed by the behaviour at corners. Wang (1986) recommended using connections of sufficient ductility and flexibility to control the out-of-plane behaviour of precast concrete cladding. This may also be suitable to overcome the out-of-plane deformation of glazing systems.
McCue et a1 (1978) provided special detailing to take into account the design interaction between glazing panels at 45 degree corners. The corner panels were designed to disengage from the support mullion system and anchored with pin connections, to permit rotation under severe loadings, thus allowing room for movement of the remainder of the cladding system. They noted that field inspection and testing procedures need to be fully carried out if such designswere to be undertaken.
Lapish (1989) illustrated the use of flexible seals between glazing panels at corners (Figure 16a). Figure 16b shows the example of a curved glazing system with a ductile bracket which allows panels at right angles to the earthquake direction to move with the building.
While a few methods have been used in an attempt to address the problem at corners, the detailings is usually specific for each glazing system. The behaviour of glazing systems at corners is not understood. The next phase of this project is to subject some glazing systems to bidirectional deformation at corners. Two parameters that need to be considered are the amount of displacement and the displacement rate in the orthogonal direction. It would be unusual to find structures with equal stiffness properties in each direction, therefore it is highly unlikely that the displacements and the displacement rates along the two orthogonal directions would be the same.
6.0 CONCLUSIONS
The following conclusions can be drawn from the study : -
1. All the generic types of glazing systems examined during the study demonstrated that they were capable of accepting interstorey movements in excess of the maximum drift limits defined within the current New Zealand control documents.
2. It is possible to determine the ability of full-scale curtain wall glazing systems to withstand major in-plane racking actions, by modelling these within the laboratory environment.
3. The displacement rate affects the performance of the glazing systems, particularly at the serviceability displacement limit. The significance of the displacement rate decreases with increasing displacement.
The number of cycles at each amplitude did not significantly affect the resistance of the system. The performance of glazing systems using gaskets was affected in the serviceability limit state, with the gaskets slipping out with increasing number of cycles.
The presence of the 30 mm skewness block and different boundary conditions affected the performance of the glazing systems in different ways.
Seismic movement mechanisms require careful detailing to ensure that they are activated when required. In particular, care should be taken to ensure that where systems are designed to slide, this action is not hindered by tight-fitting gaskets or other devices.
The stiffnesses of the glazing systems were evaluated. An example was worked out showing that unless a glazing system is actively separated from the structure, its stiffness in relation to the structure interstorey stiffness may be significant, particularly in the initial stage of loading.
REFERENCES
Bennett, A.F. 1987. Structural glazing in New Zealand: development and current status. Presented at National Building Technology Centre, Seminar on Glazing, Sydney; Also published as Conference Paper No 13, Building Research Association of New Zealand, Judgeford.
Bowkamp, J .G. and Meehan, J .F. 1960. Drift limitations imposed by glass. Proceedings Second World Conference on Earthquake Engineering, Tokyo, Japan.
British Standards Institution (BSI). 1985. Specification for the grading of the forces applied by materials testing machines. BS 1610 : Part 1. London.
Clough, R. and Penzein, J. 1975. Dynamics of structures. McGraw Hill Book CO. Inc. , New York, New York.
Cooney, R. C. and Collins, M. J. 1987. A wall bracing test and evaluation procedure. Building Research Association of New Zealand Technical Paper P21. Judgeford.
Fenwick, R.C. and Davidson, B.J. 1989. Dynamic behaviour of multi-storey buildings. Department of. Civil Engineering Report No. 463, School of Engineering, University of Auckland. Auckland.
Fenwick, R. ; Davidson, B.; Megget, L; King, A. 1989. Personal communication.
Freeman, S.A. 1977. Racking tests of highrise building partitions. Journal of the Structural Division, Proceedings of the American Society of Civil Engineers. 103(ST8), 1673-1685. August.
Laboratory Technologies Corporation. 1989. Labtech notebook Version 5. Wilmington, Massachusetts.
Lapish, E.B. 1989. Seminar on "Building claddings - structural glazing", by the Auckland Branch of IPENZ and NZIA. 21 February, Auckland.
McCue, G.M.; Skaft, Ann and Boyce, J.W. 1978. Architectural design of building components for earthquakes. McCue, Boone and Tomsick, San Francisco.
New Zealand Reconnaissance Team. 1985. The September 1985 Mexico Earthquake, preliminary report of the reconnaissance team. Bulletin of the NZNSEE 18(4), pg 304.
Sakamoto, I.; Itoh, H. and Ohashi, Y. 1984. Proposals for a seismic design method on nonstructural elements. Proceedings of the Eighth World Conference on Earthquake Engineering, San Francisco, California. Vol 5, 1093-1100. July 21-28.
Schoeneck, F. 1971. Evaluation of the effects of earthquake racking stresses on a Stanlock performed glazing gasket. Standard Products Co., Port Clinton, Ohio.
Sharpe , Roland, L. 1972. Seismic design of nonstructural elements. Proceedings of the International Conference on Planning and Design of Tall Buildings. ASCE-IABSE Joint Committee, Bethelem, Pennsylvania. August 21- 26. Vol Ia-12, 1143-1148.
Standards Association of Australia (SAA). 1979. SAA Aluminium Structures Code. AS 1664. Sydney.
New Zealand Standards Institute. 1964. NZSS 1900 Chapter 10, New Zealand Standard Model Building Bylaw Chapter 10, Non-structural external walls. Wellington.
Standards Association of New Zealand (SANZ). 1984. Code of practice for general structural design and design loading for buildings. NZS 4203. Wellington.
Standards Association of New Zealand. 1990. Draft code of practice for general structural design and design loading for buildings. DZ 4203. Wellington.
Turkington, D.H.; Carr, A.J.; Cooke, N. and Moss, P.J. 1989. Seismic design of bridges on lead rubber bearings. Journal of Structural Engineering, American Society of Civil Engineers. 115(12), 3000-3016, December.
Wade, C.A. 1990. Structural performance of conservatories. Proceedings of the Annual Conference of the Institution of Professional Engineers New Zealand. Engineering - Past, Present and Future: Building the Environment. Feb 12-17, 155-166. Wellington. Also Building Research Association of New Zealand Study Report No. 30. Judgeford.
Wang, M.L. 1986. Nonstructural element test phase, U.S.-Japan Co-operative Research Project on a Full Scale Steel Test Frame. U.S. Side Final Report, NSF Grant CEE 82-08012. Prepared for the National Science Foundation Earthquake Hazards Mitigation Program, University of California, Berkeley.
Wright, P.D. 1989. The development of a procedure and rig for testing the racking resistance of curtain wall glazing. Building Research Association of New Zealand Study Report No. 17. Judgeford.

APPENDIX A : Example Showing Proportion of Glazing Stiffness to Total Storey Stiffness
To obtain the contribution of glazing stiffness to total stiffness, let's use the initial stiffness of the Gdt glazing system as the example, which has a value of 1000 kN/m (Table 3). It should be noted that the value of 1000 kN/m corresponds to a specimen test height of 2.8m and width of 3.6m, i.e., a 1000 kN force is required to deflect the top of the glazing by one m. For a glazing height of 3.6m, this stiffness is equivalent to 2.8 x 1000/3.6 = 778 kN/m (refer equation 2, section 4.6.1).
Consider an example floor of 35m x 35m in an 8 storey building, 3.6m storey heights, with ductile frames at 7m centres both ways.
Considering that the storey stiffness of the glazing system under shear loading is proportional to the length of the glazing system, the glazing storey stiffness = (2 sides x 35/3.6) x 778 kN/m = 15123 kN/m.
Dead load of the floor = 3.58 kPa (200 mm depth double tees with 75 mm topping)
Dead load of columns - 0.89 kPa (600 mm square columns) Dead load of beams - 1.65 kPa (800 mm depth x 600 mm width beams) Superimpose dead load - 1.50 kPa (ceiling, carpets, glazing, etc.) Live load - 2.5 kPa Seismic Load DL + LL/3 - 8.45 kPa as required by NZS 4203 (SANZ, 1984). Seismic coefficient, Cd = CRSM = 0.1 x 1 x 0.8 x 0.8 = 0.064 assuming flexible subsoils with a period of 0.8 seconds (number of storeys/lO) in Zone A.
Assuming that the maximum interstorey deflection occurs at the first floor. The total seismic storey load applied at the first floor is equal to the seismic base shear = 8 storeys x 0.06 x 8.45 x 35 x 35 = 5300 kN. Limiting the interstorey drift to 1% storey height = 36 mm, as specified in NZS 4203.
Converting the computed deflection back to elastic deflection, 2.2y/(0.8 x 0.8) < 36 mm from NZS 4203, y = 10.5 mm.
Therefore storey stiffness required = 5300 kN/10.5 mm 504747 kN/m. and , the storey stiffness contribution of the gasket glazing system - 15123/504747 = 3.0%
If a lower interstorey drift limit was used, the storey stiffness contribution from the glazing system would be reduced' accordingly. But the contribution of the glazing to the total storey stiffness is still substantial and maybe significant.
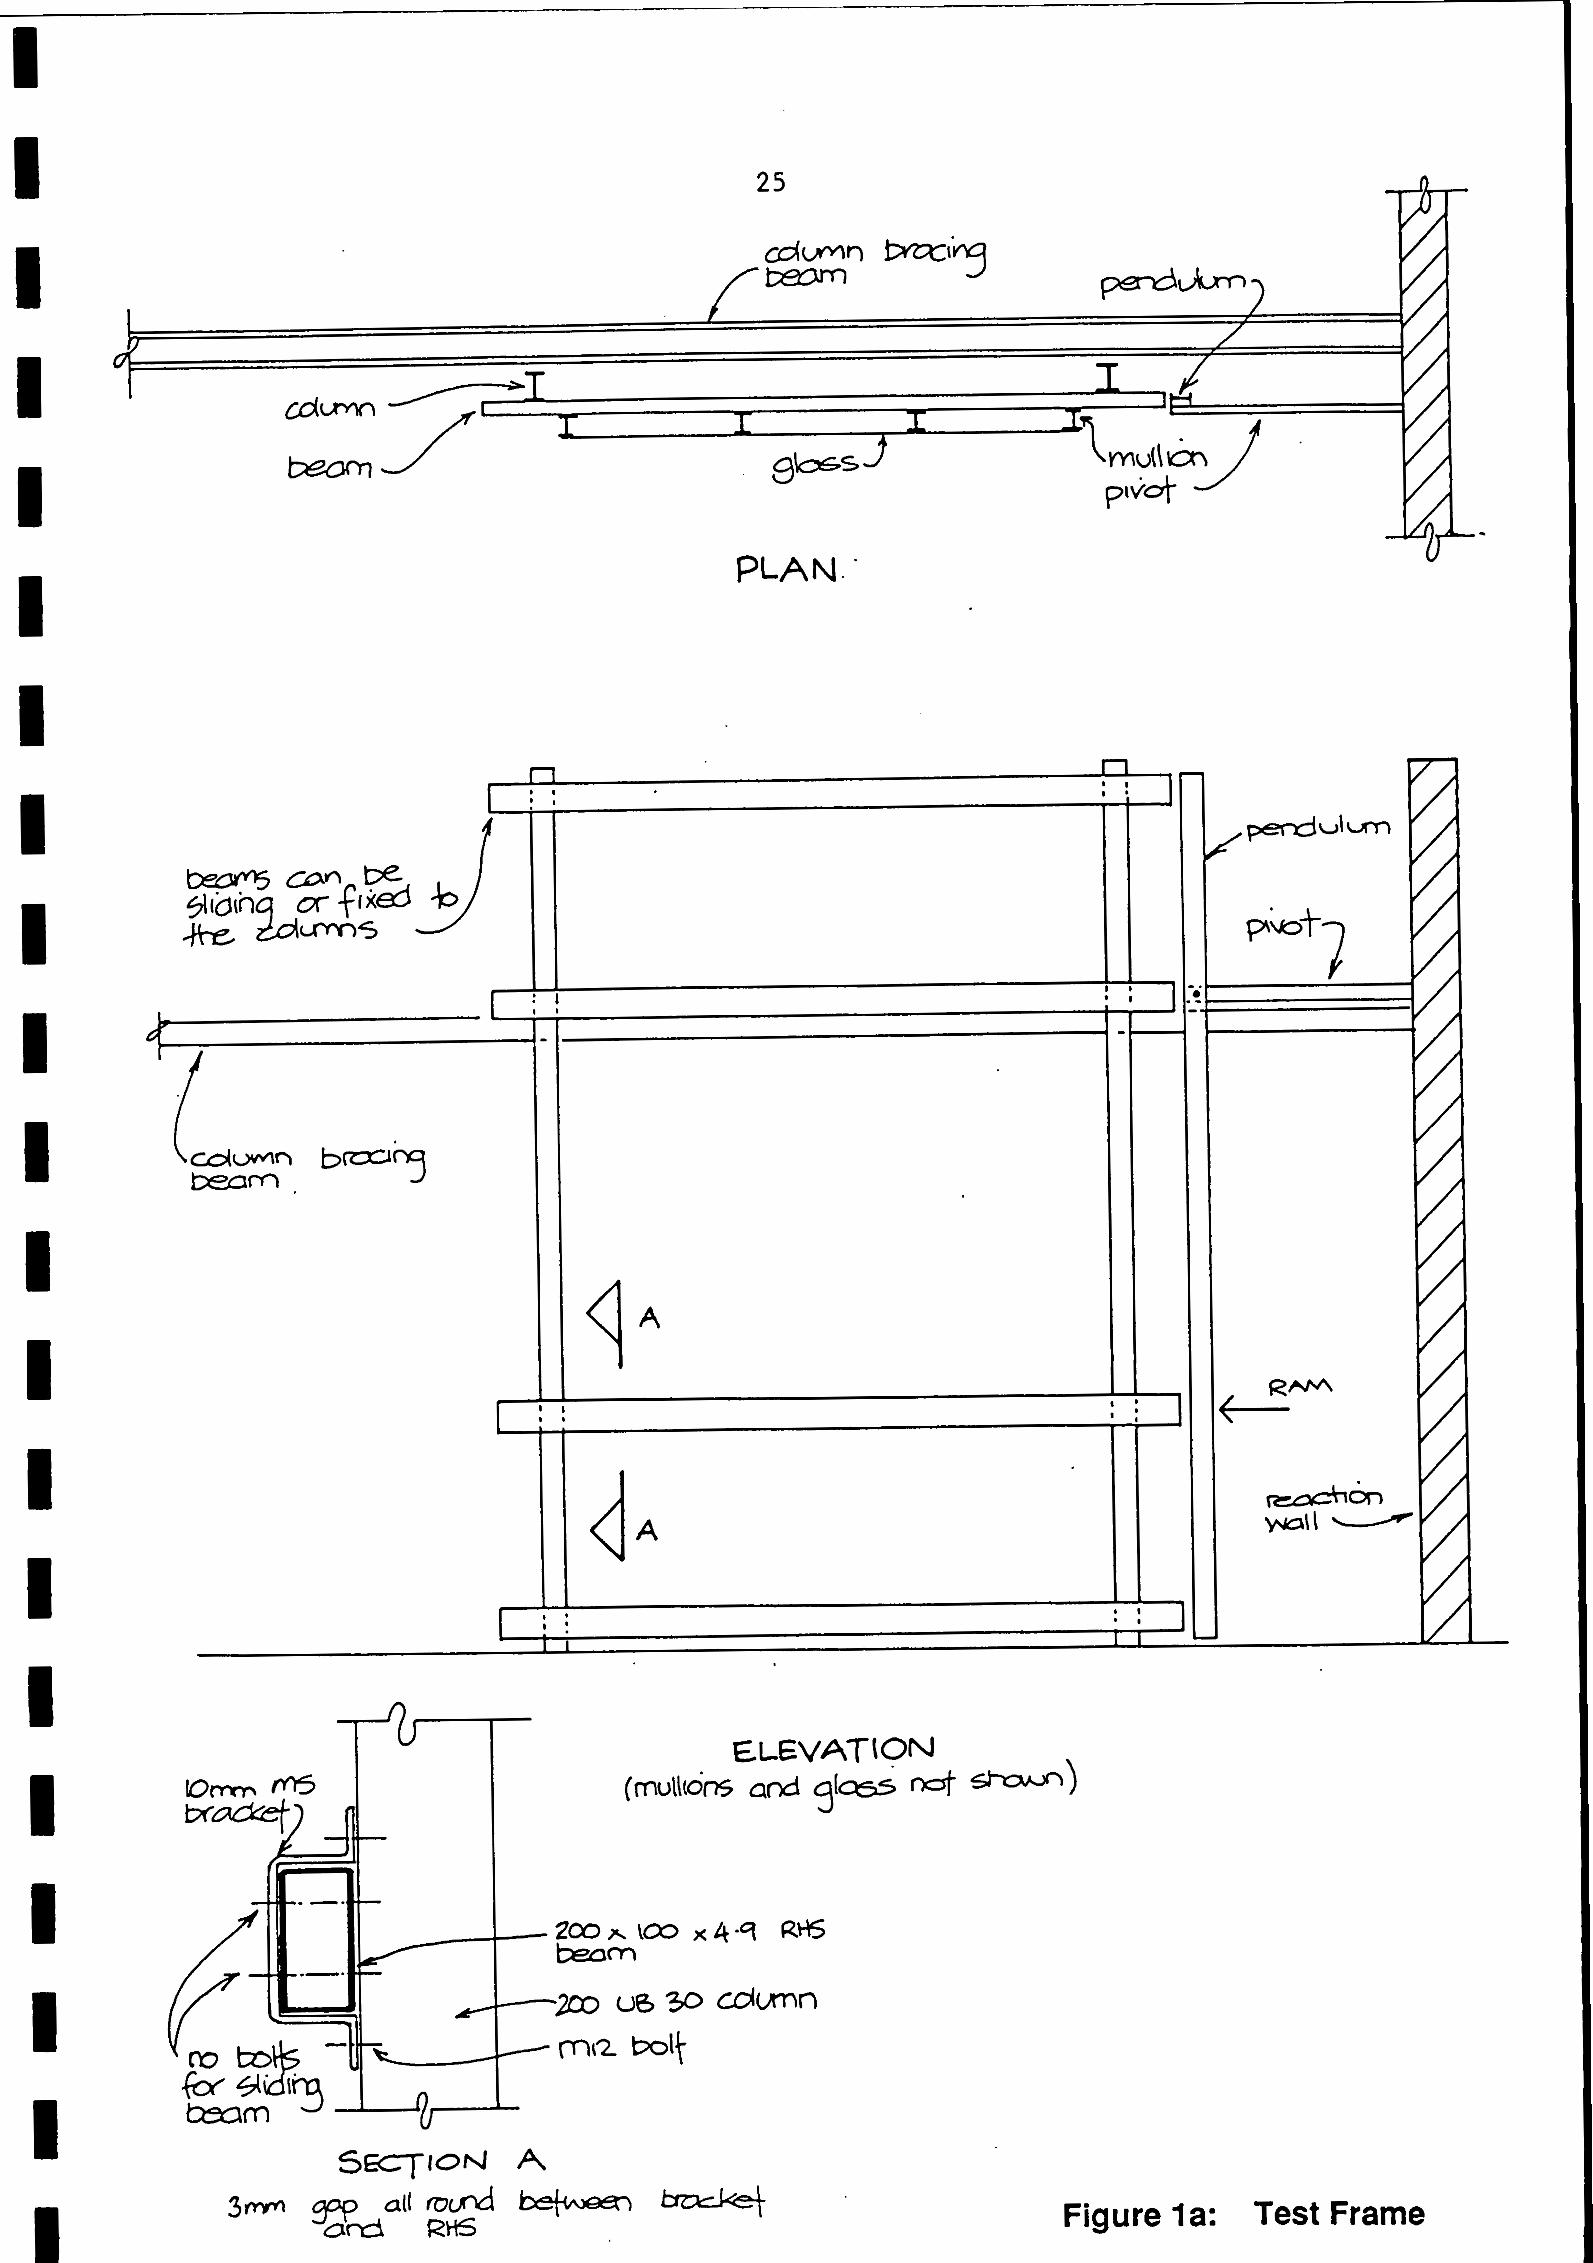
Figure 1 a: Test Frame
configuration "s" Configuration "d"
Figure I b: Photographs Showing the "Pendulum" Member for Different Configurations
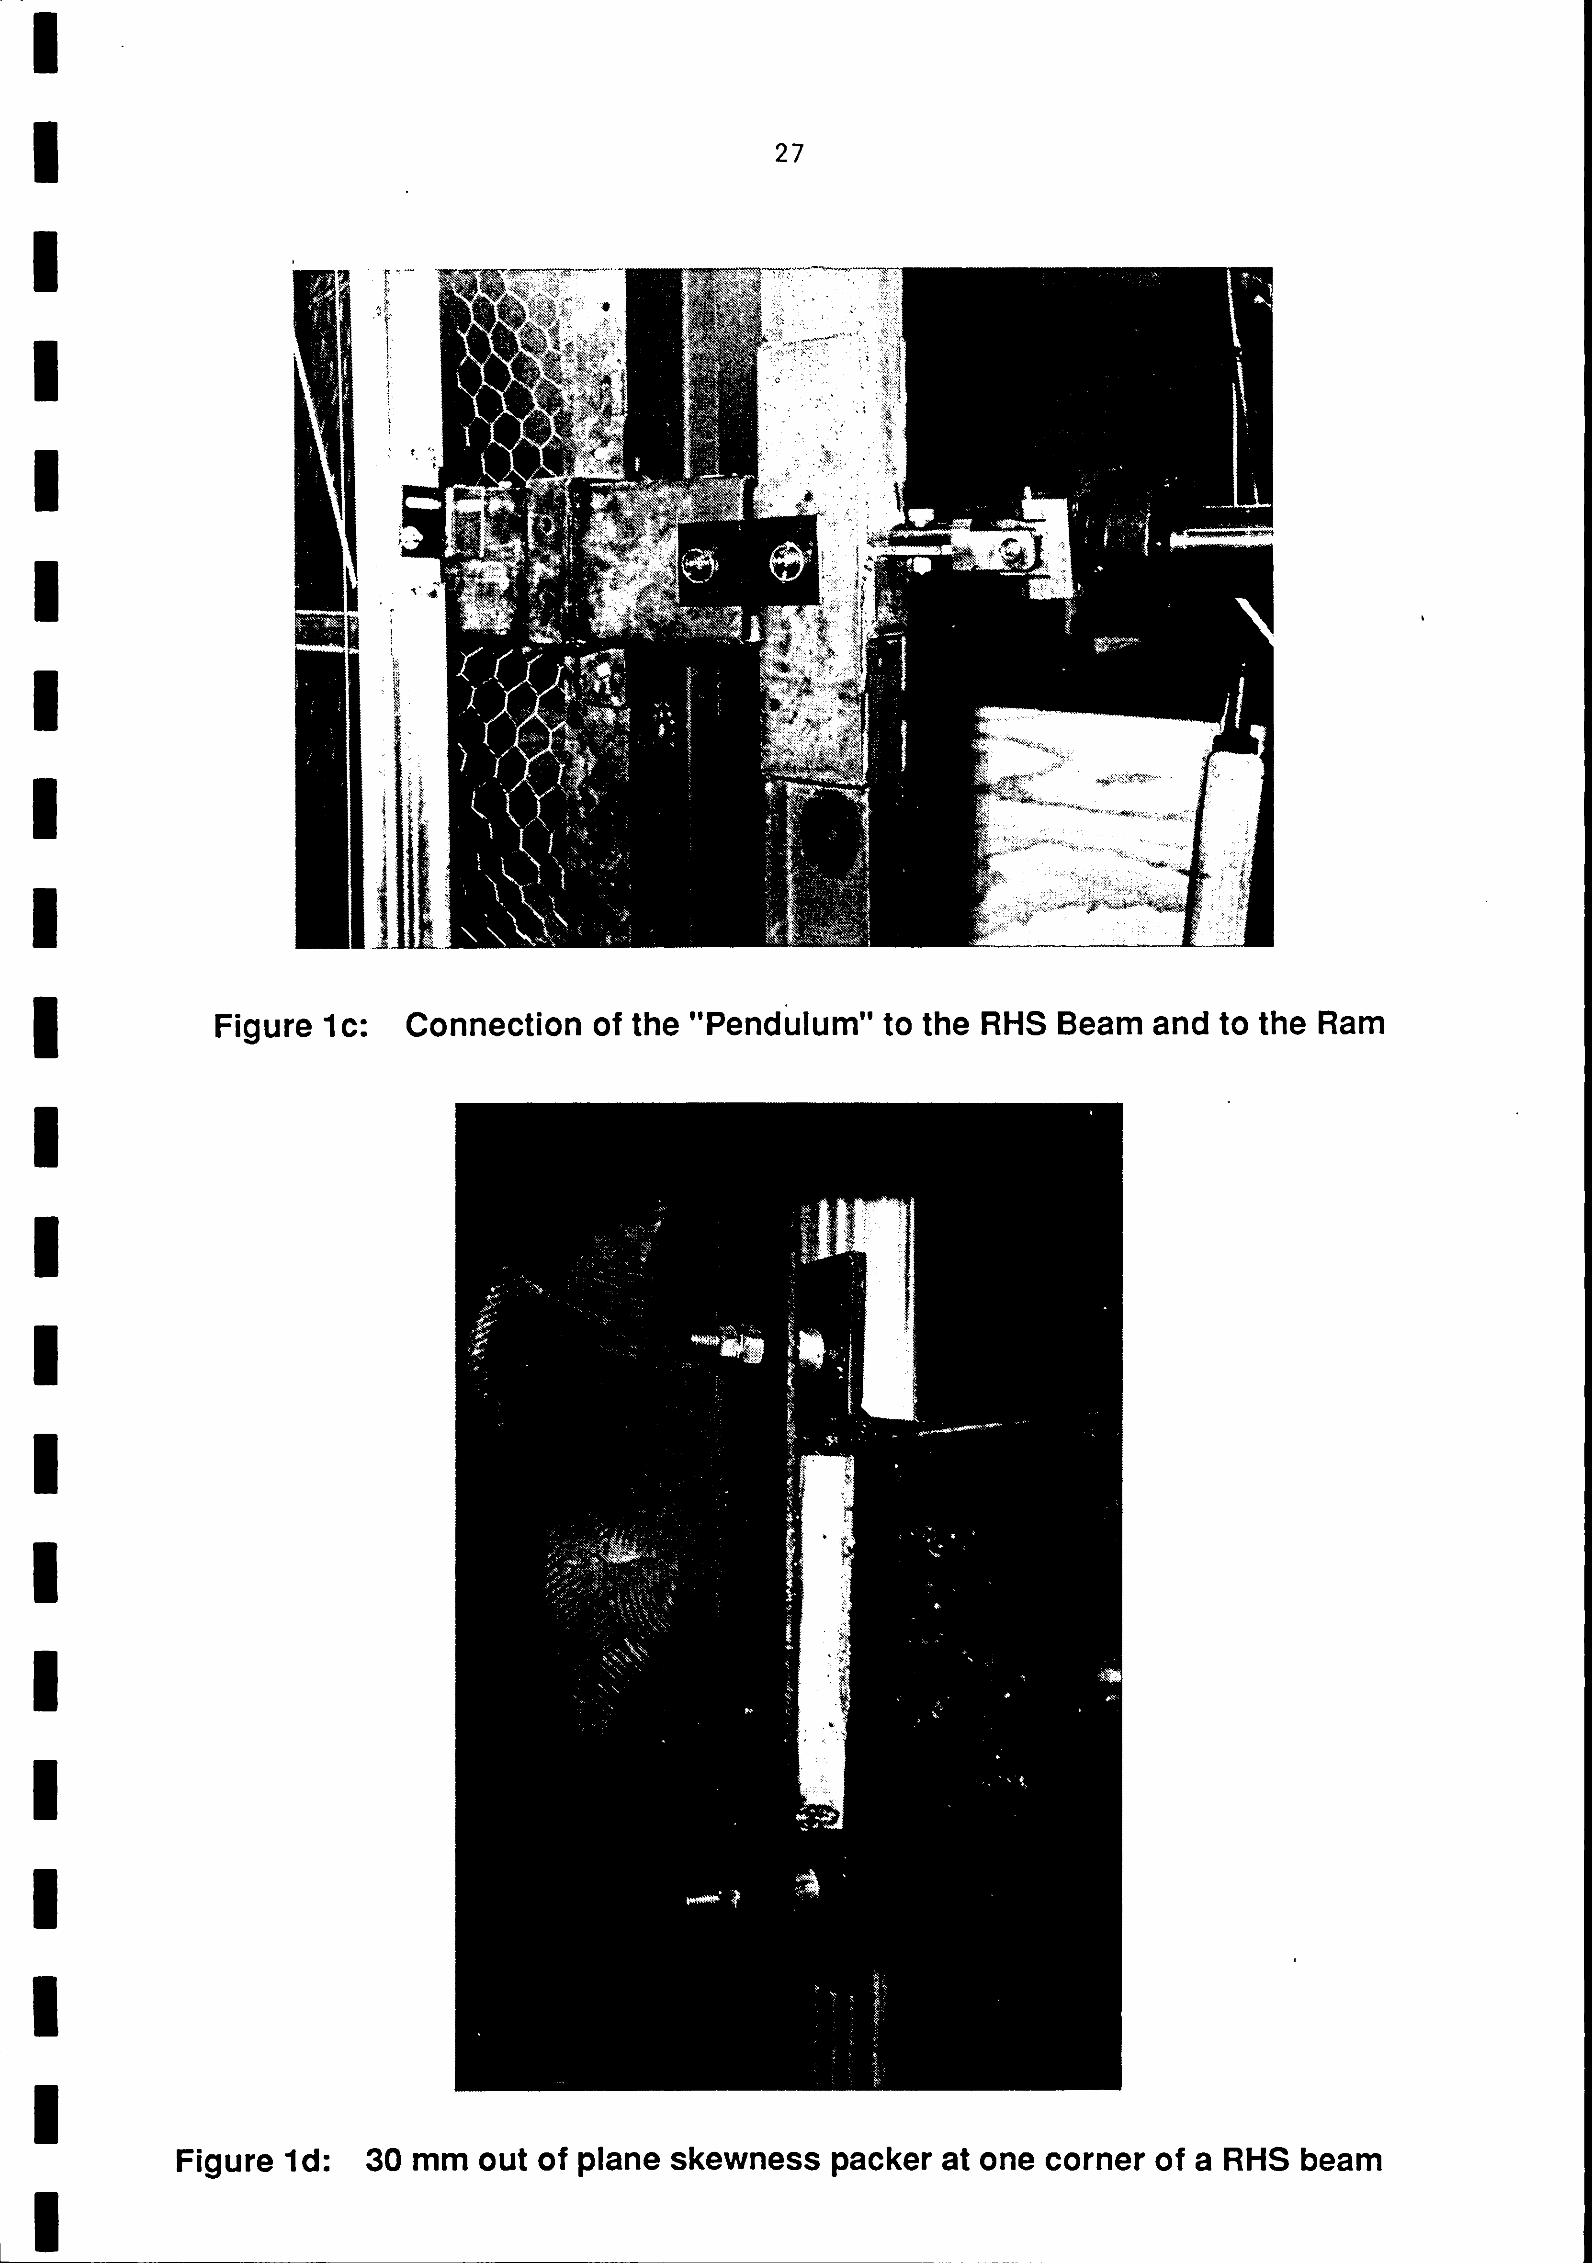
Figure Ic : Connection of the "Pendulum" to the RHS Beam and to the Ram
Figure Id: 30 mm out of plane skewness packer at one corner of a RHS beam


- I' UB Column Reaction Wall
RHS Sliding - Beam
MS Bracket
Figure 3a: Moog Ram -
. PC for Driving Ram t - -
__- -- - - -- -
Figure 3b: Data Acquisition
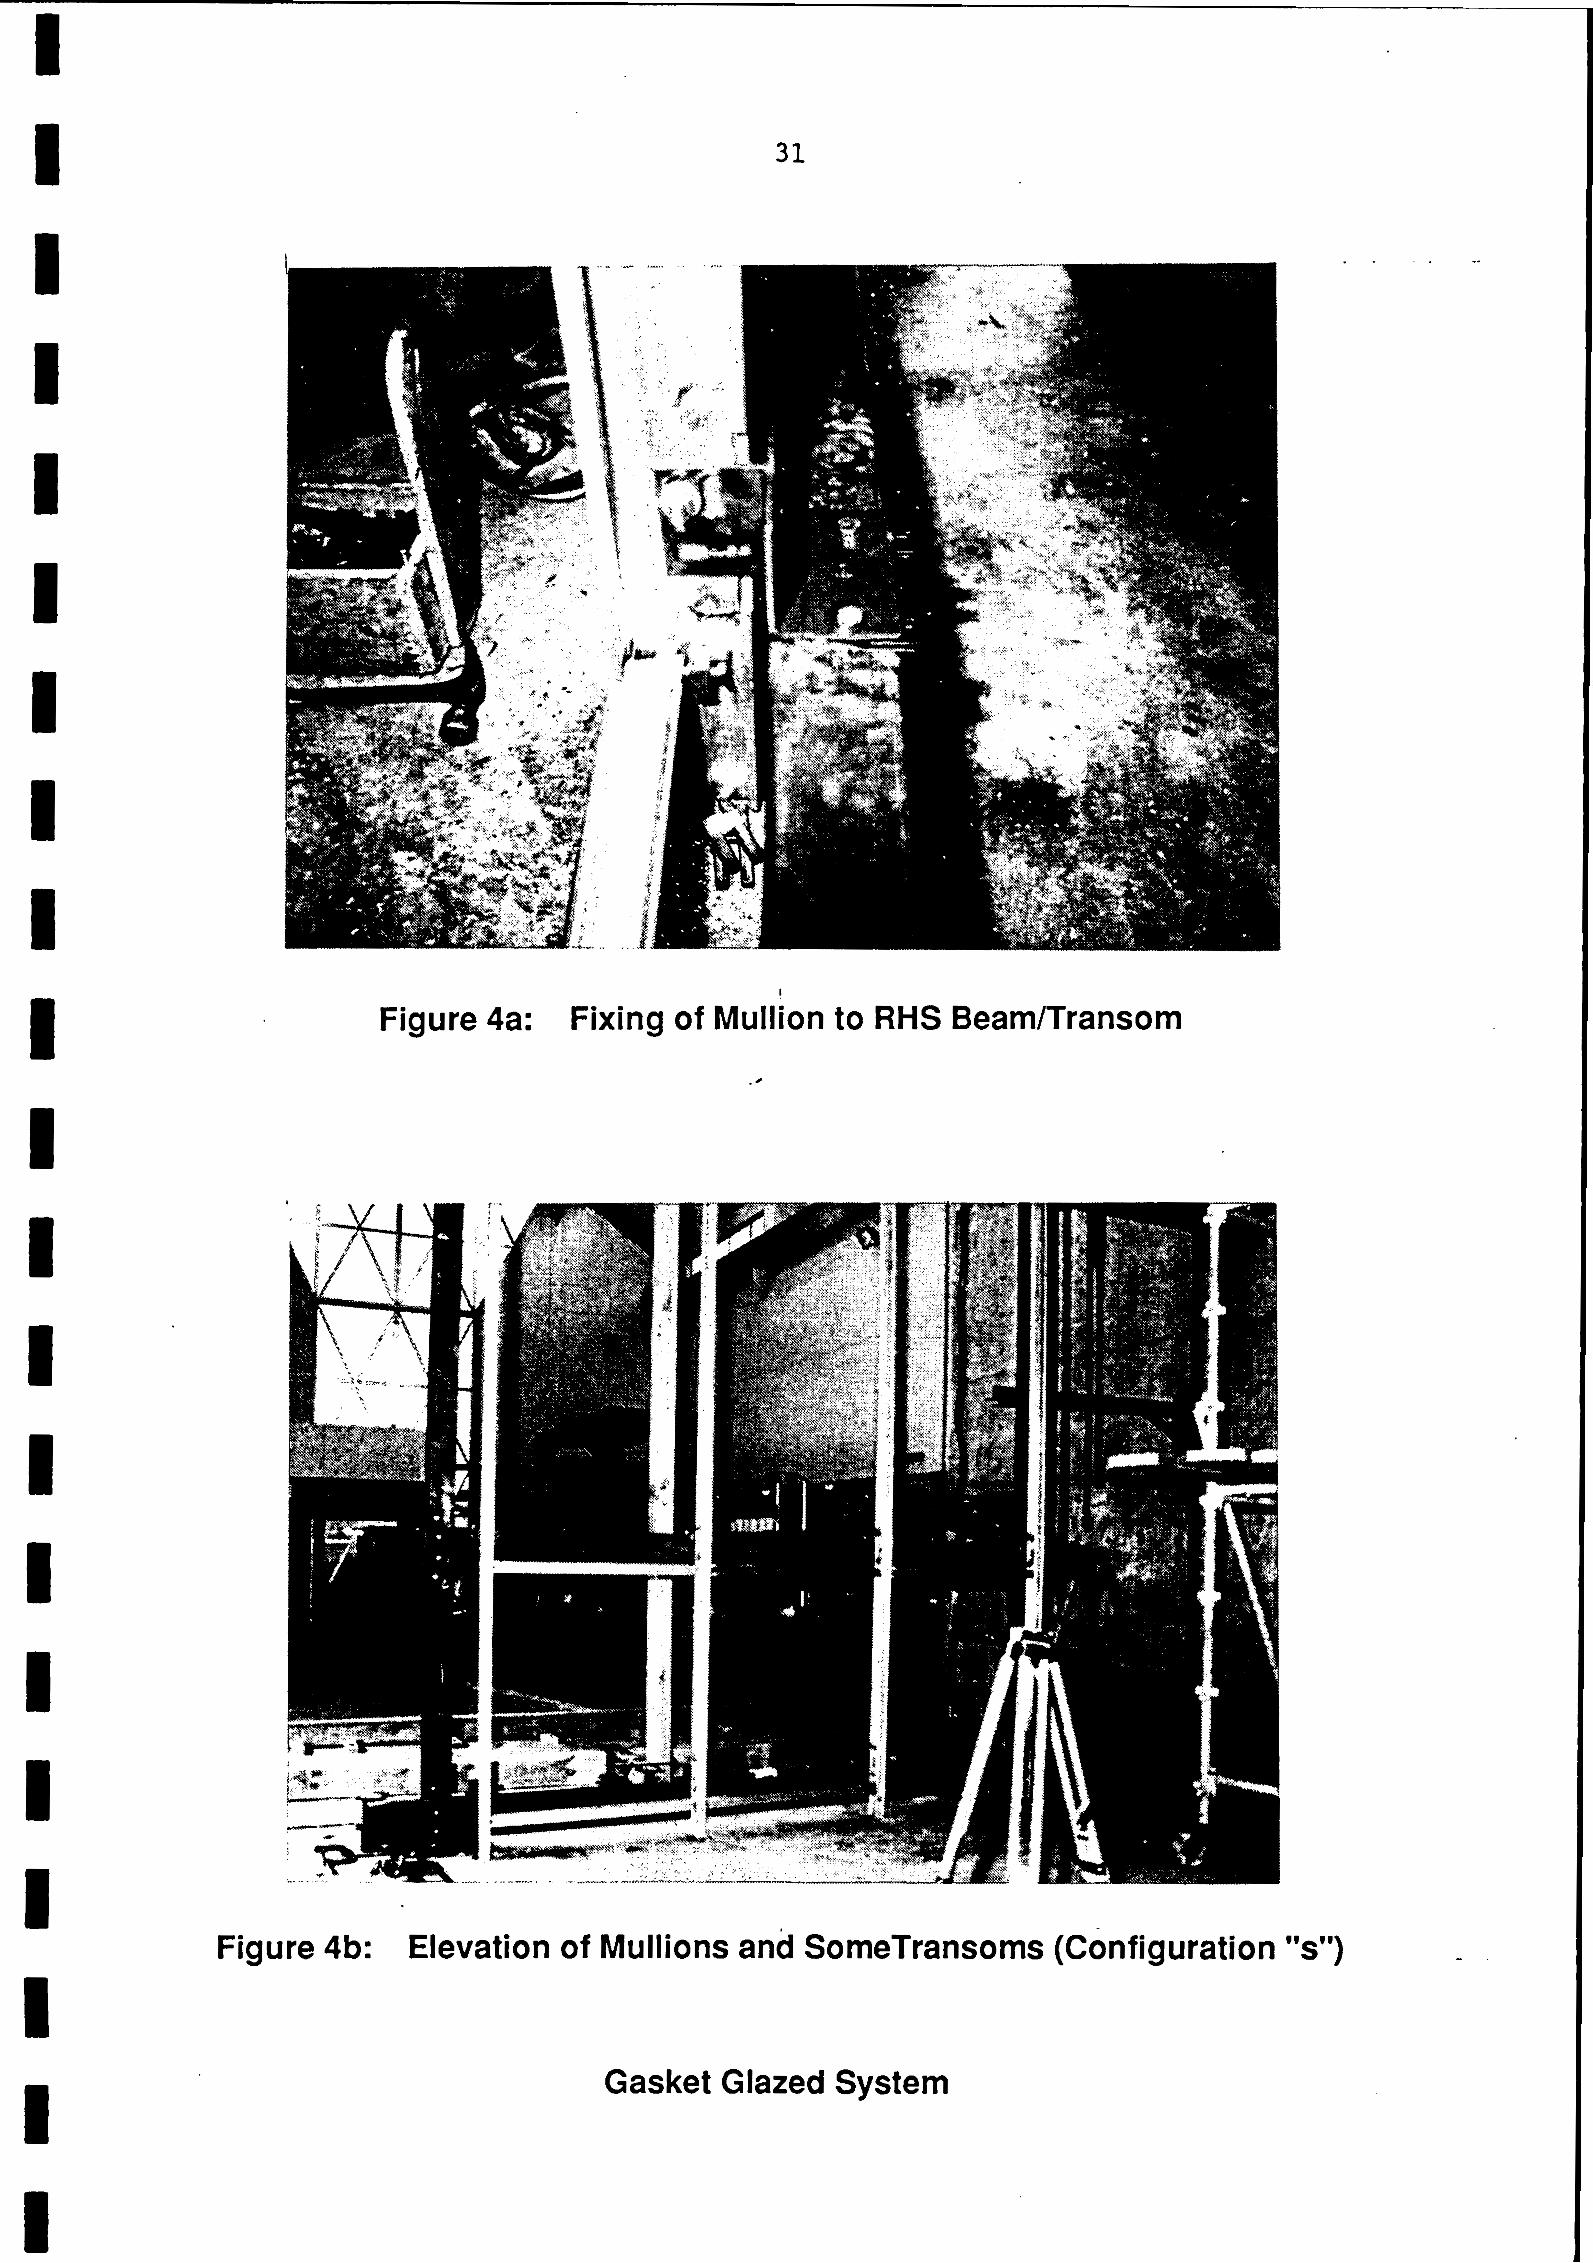
Figure 4a: Fixing of Mullion to RHS BeamITransom
Jre 4b: Elevation of Mullions and SomeTransoms (configuration
Gasket Glazed System
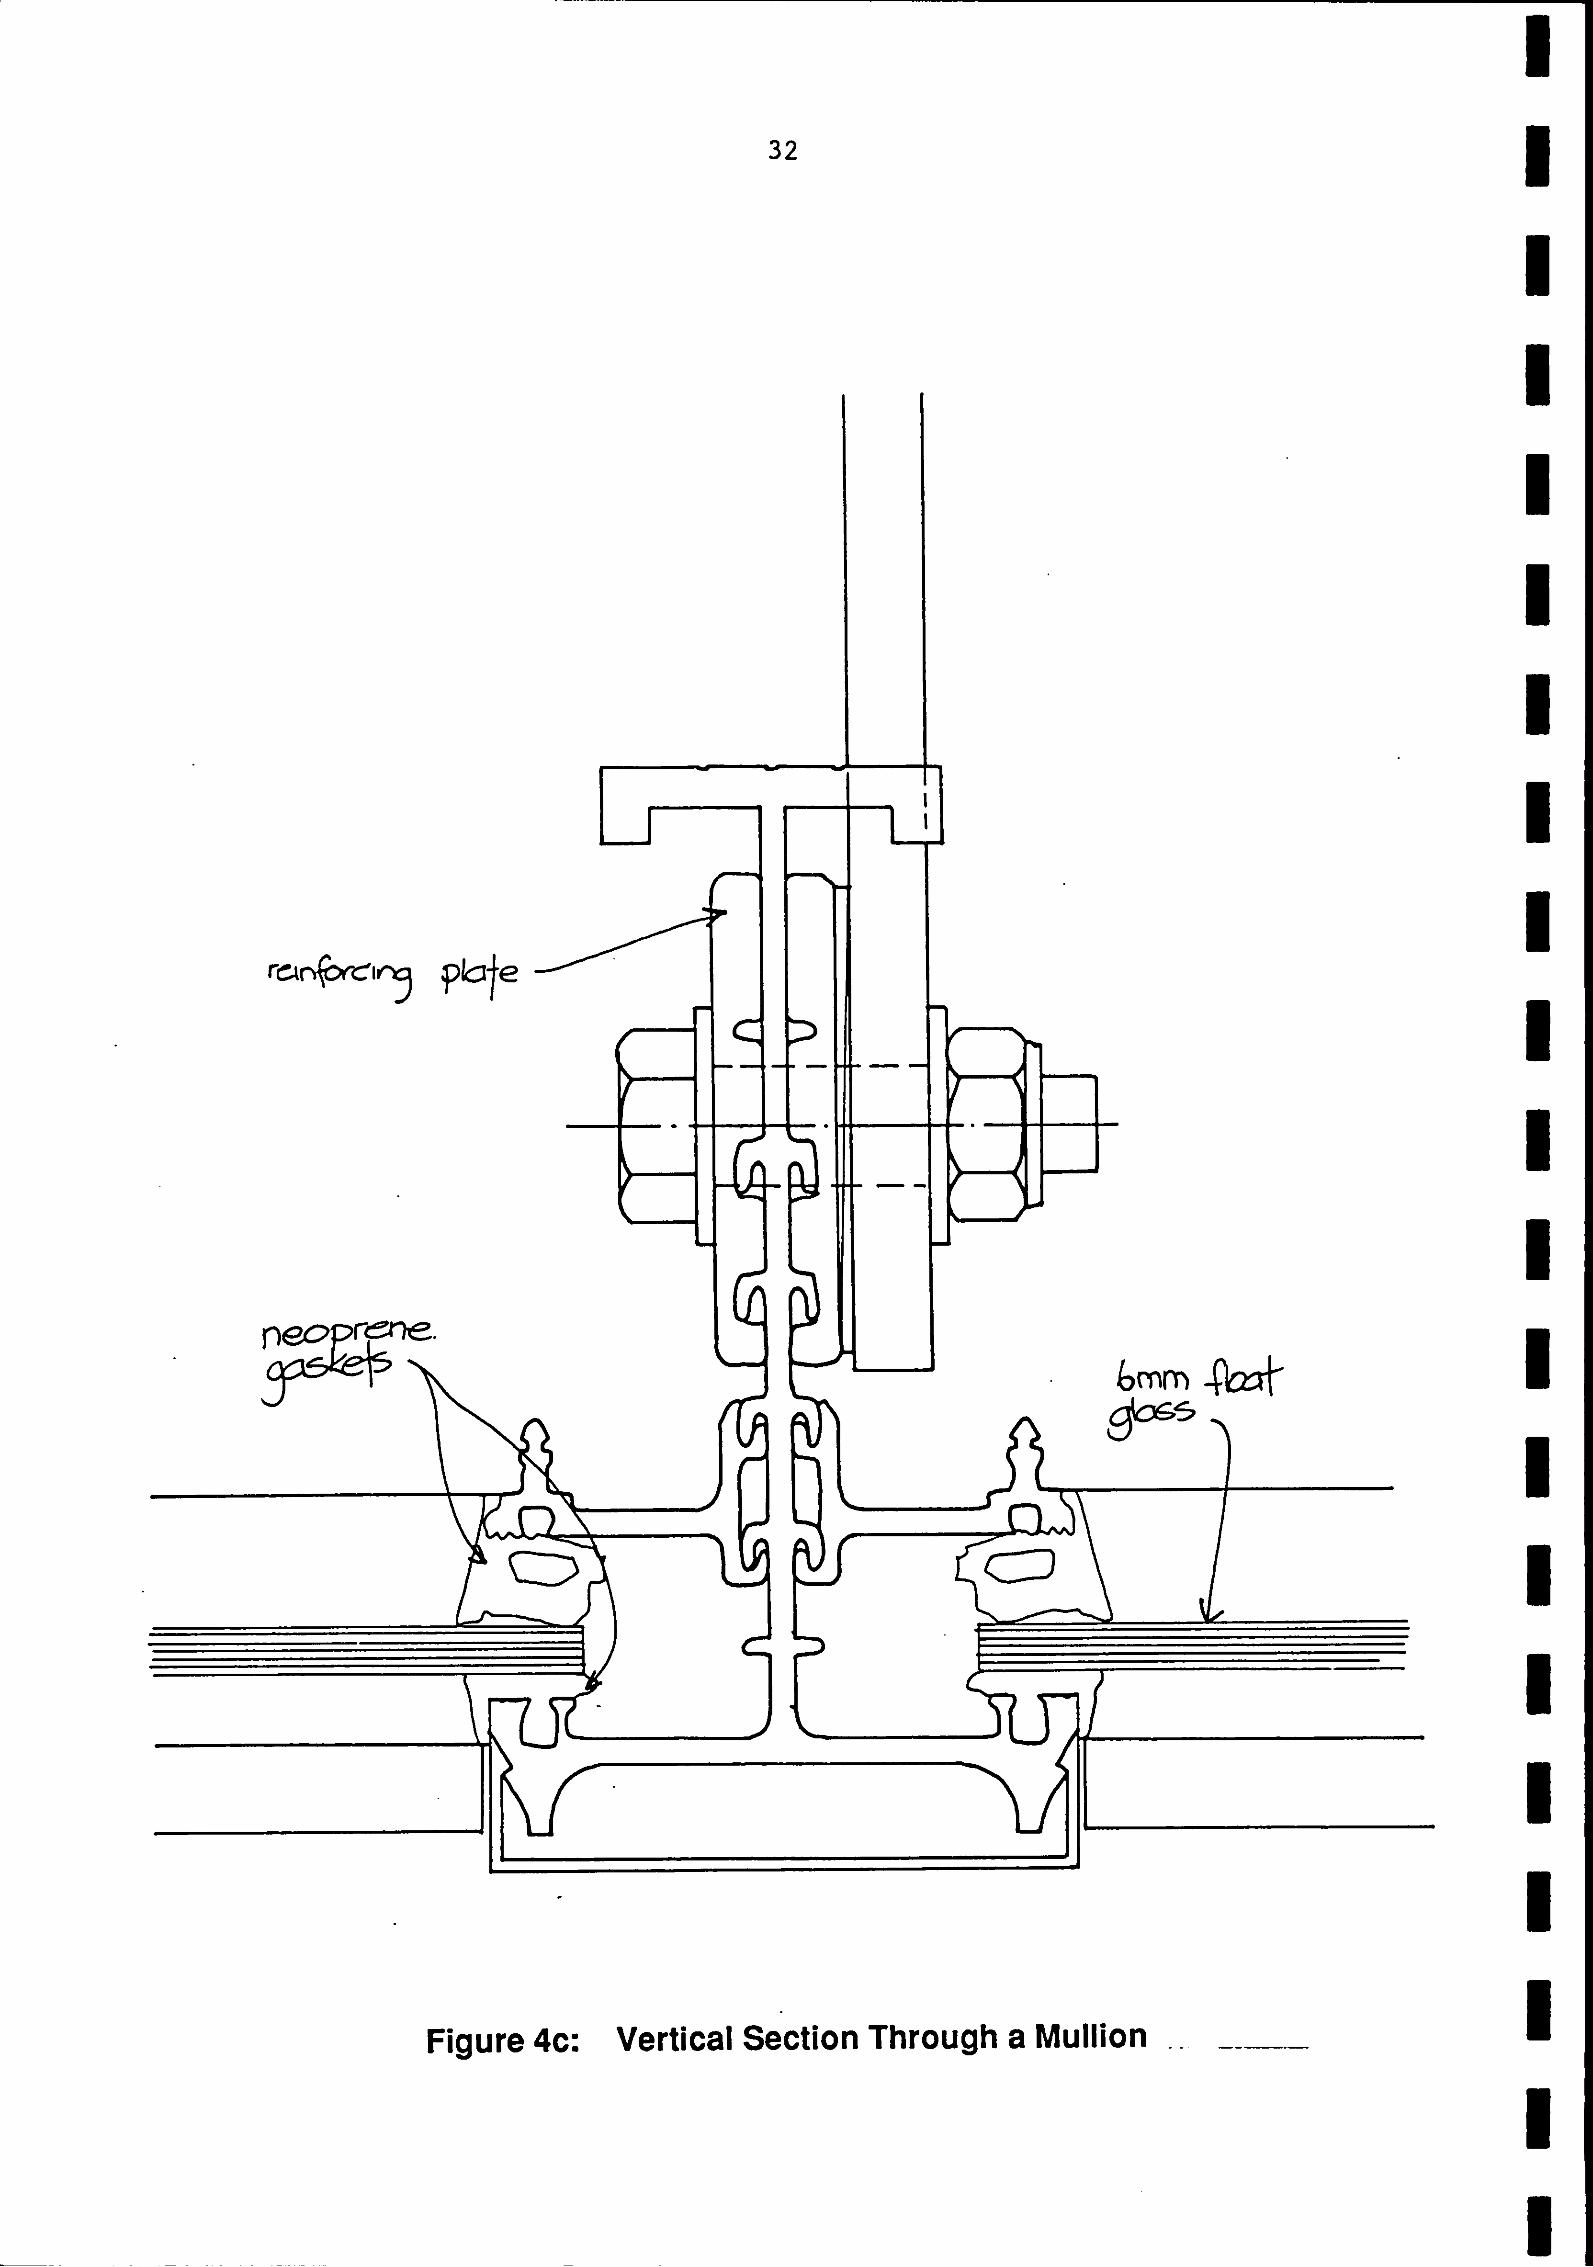
Figure 4c: Vertical Section Through a Mullion . .
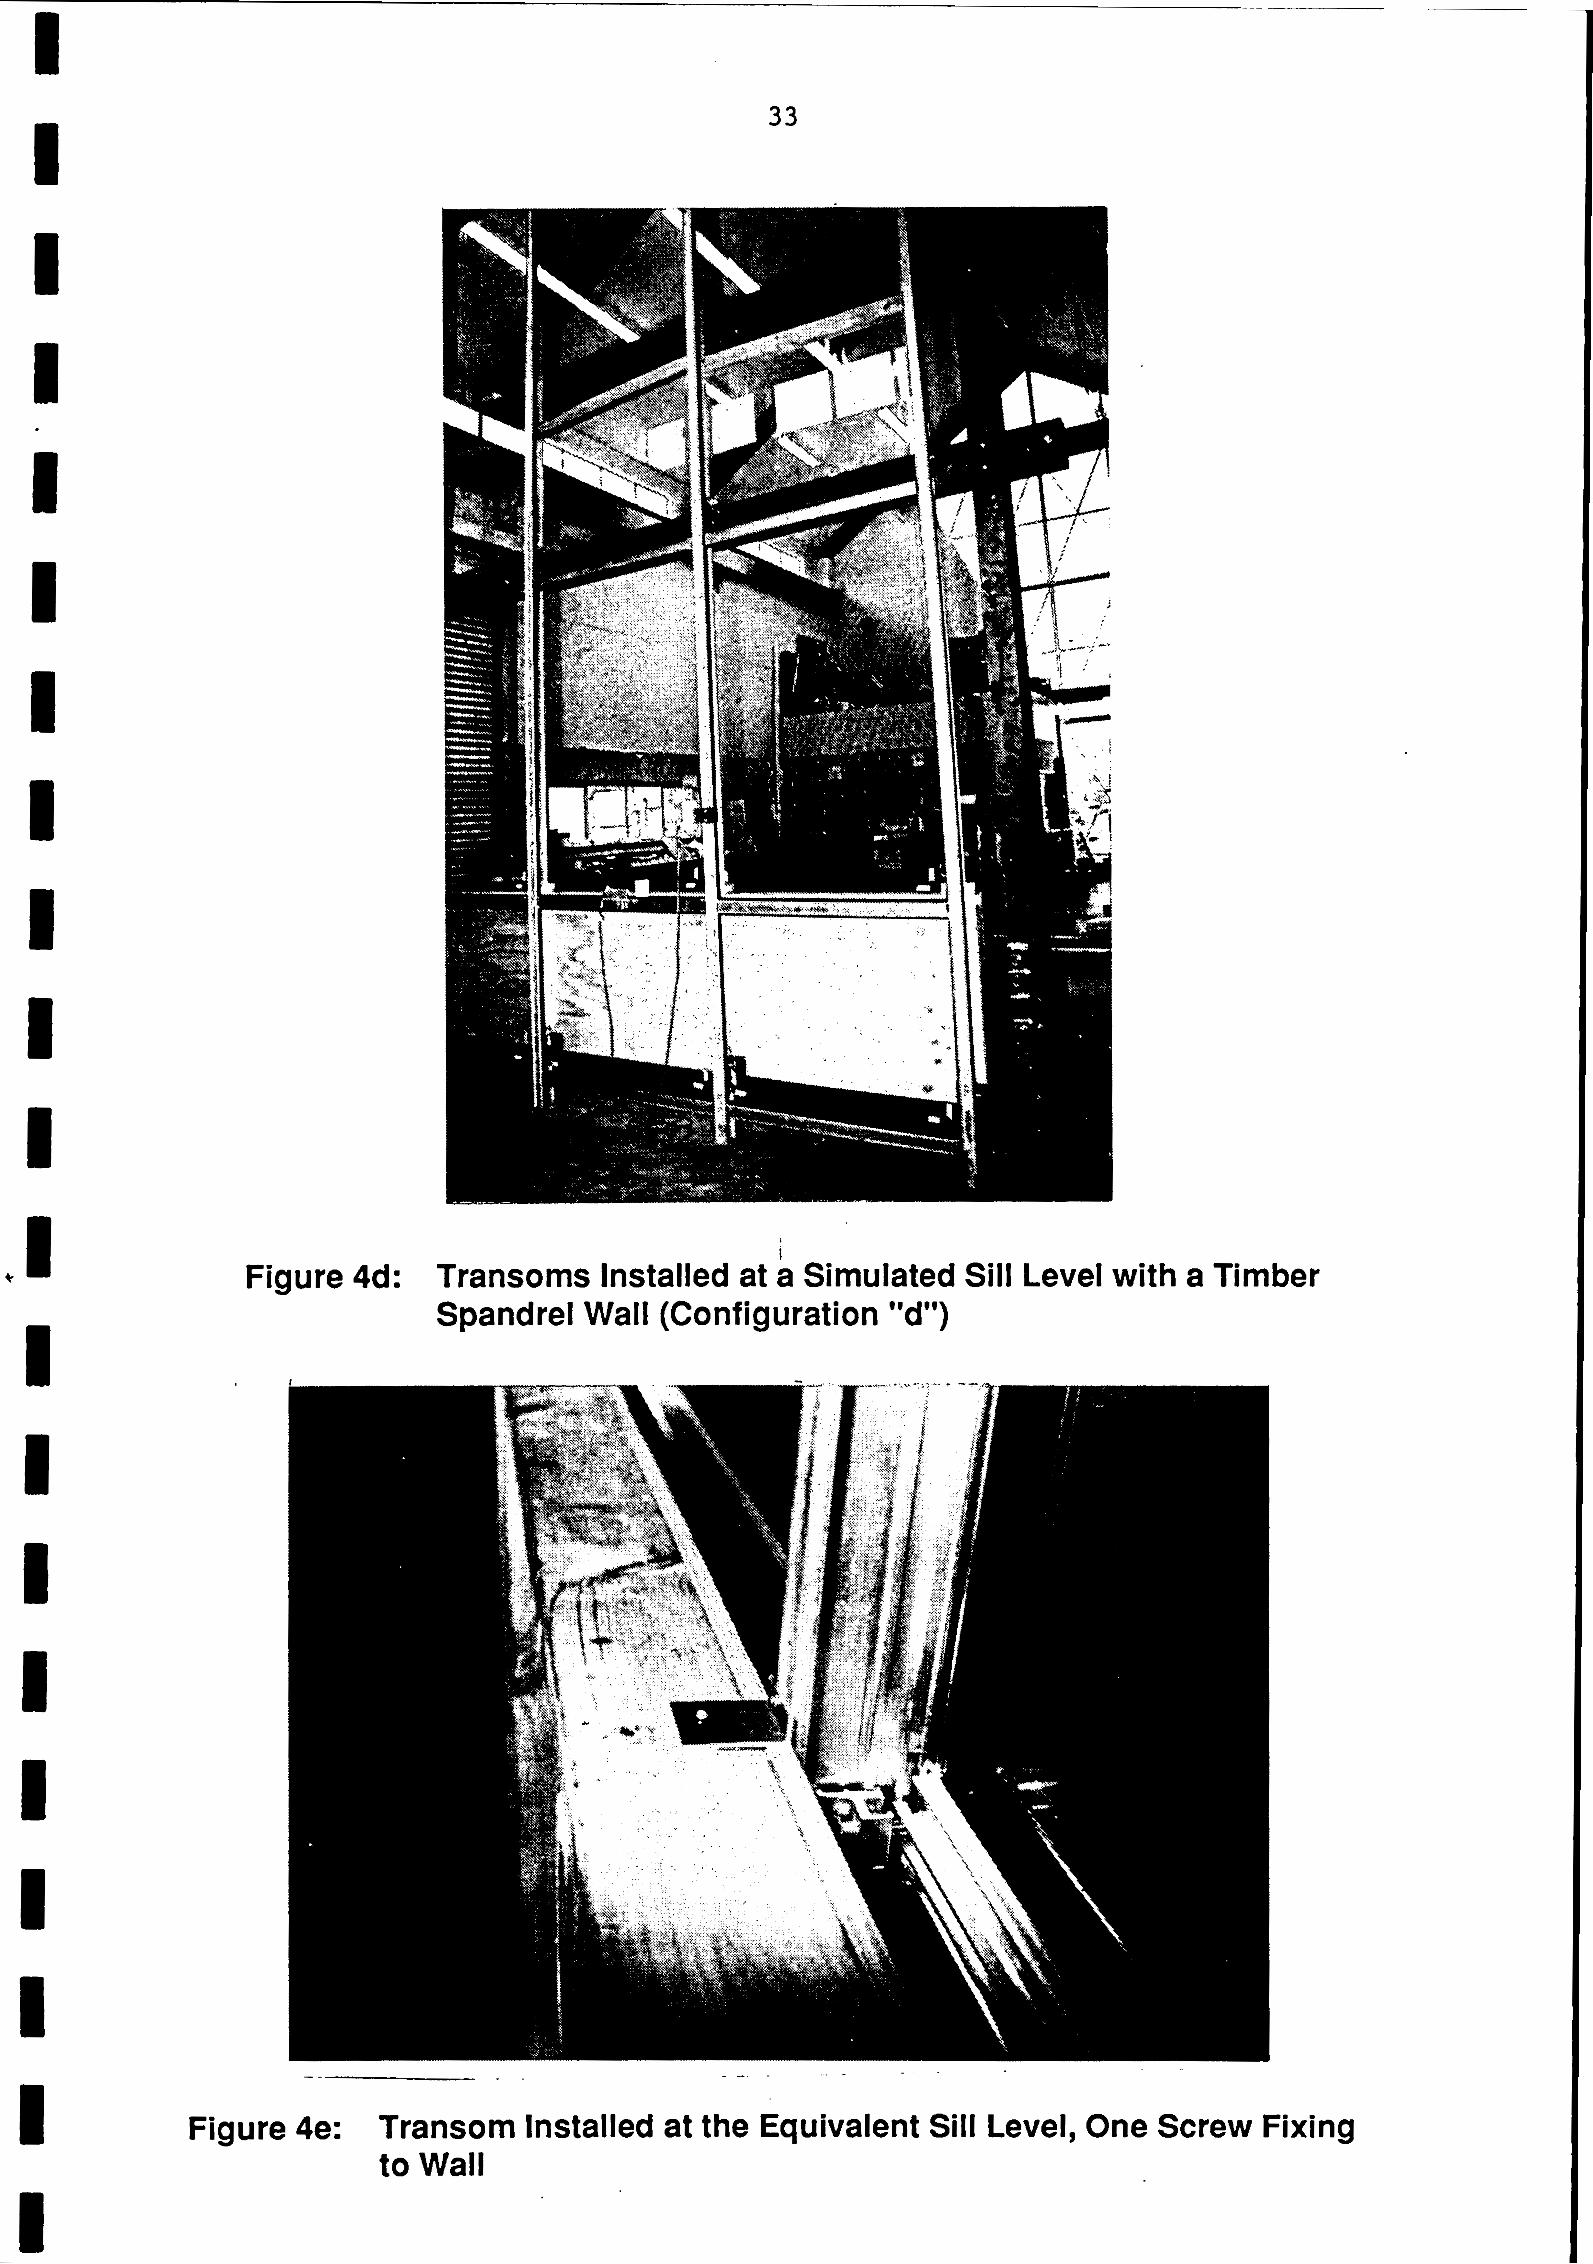
Figure 4d: Transoms Installed at Simulated Sill Level with a Timber Spandrel Wall (Configuration "d")
Figure 4e: Transom Installed at the Equivalent Sill Level, One Screw Fixing to Wall
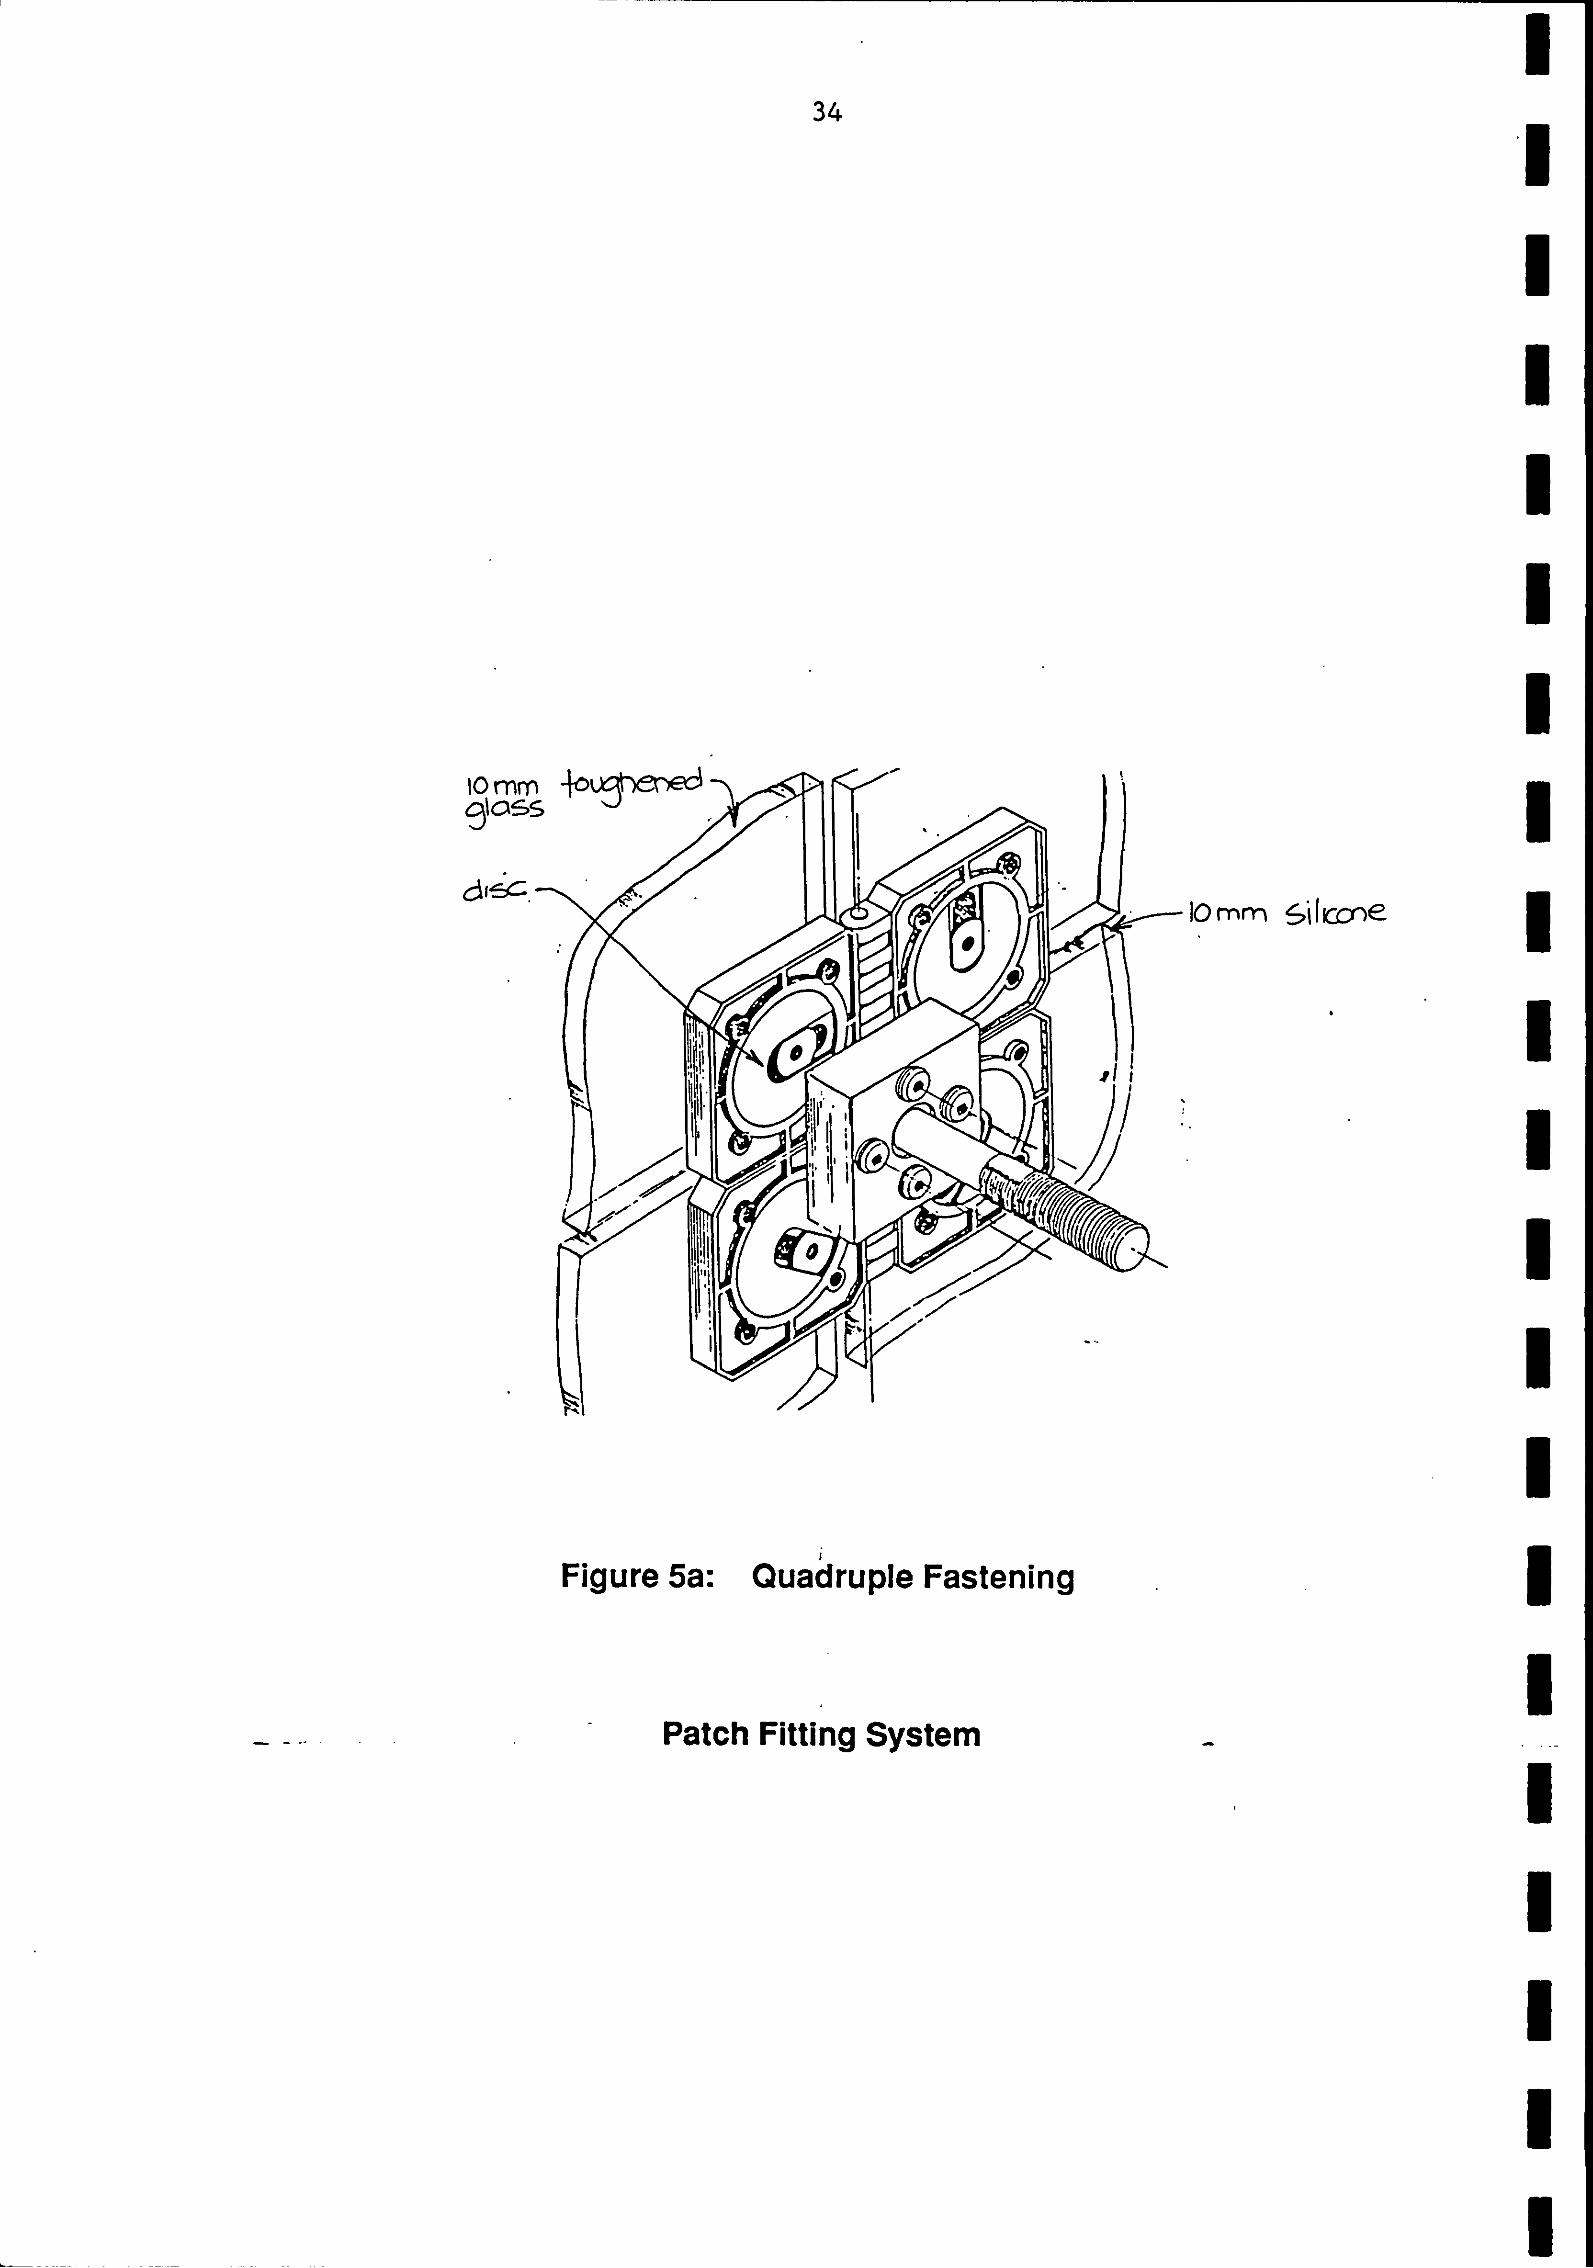
Figure 5a: ~ u a d r u ~ l e Fastening
Patch Fitting System
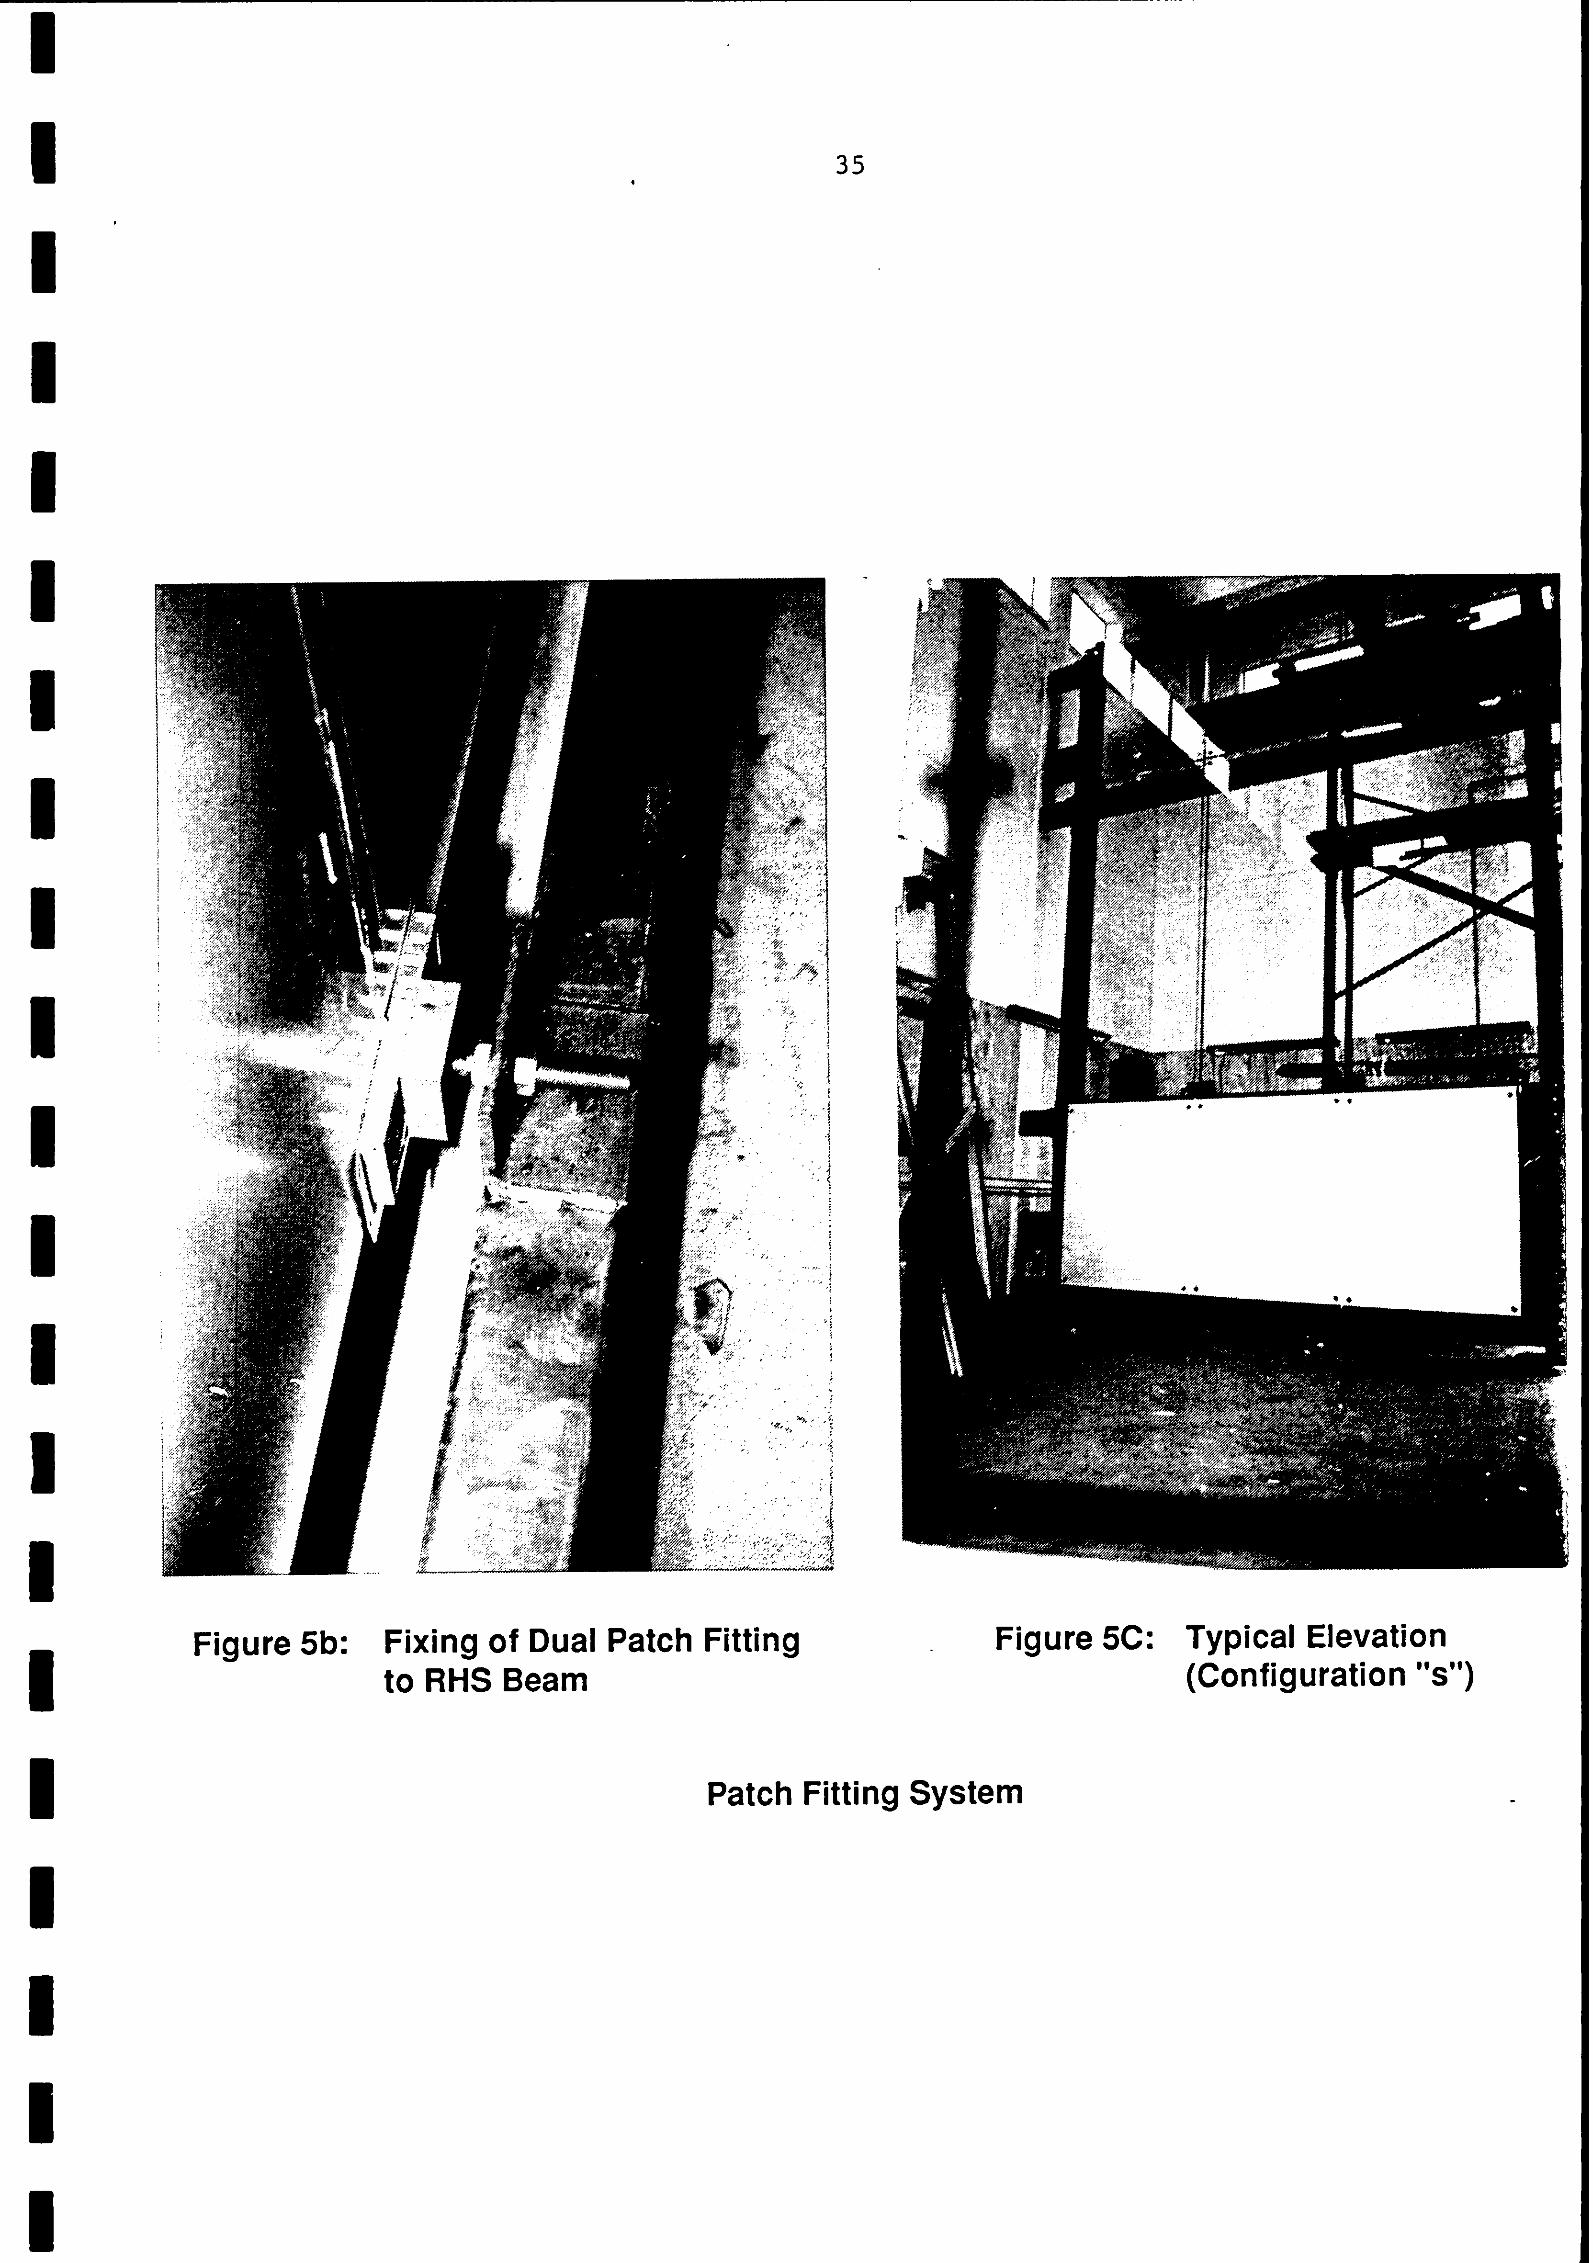
Figure 5b: Fixing of Dual Patch Fitting to RHS Beam
Figure 5C: Typical Elevation (Configuration "s")
Patch Fitting System
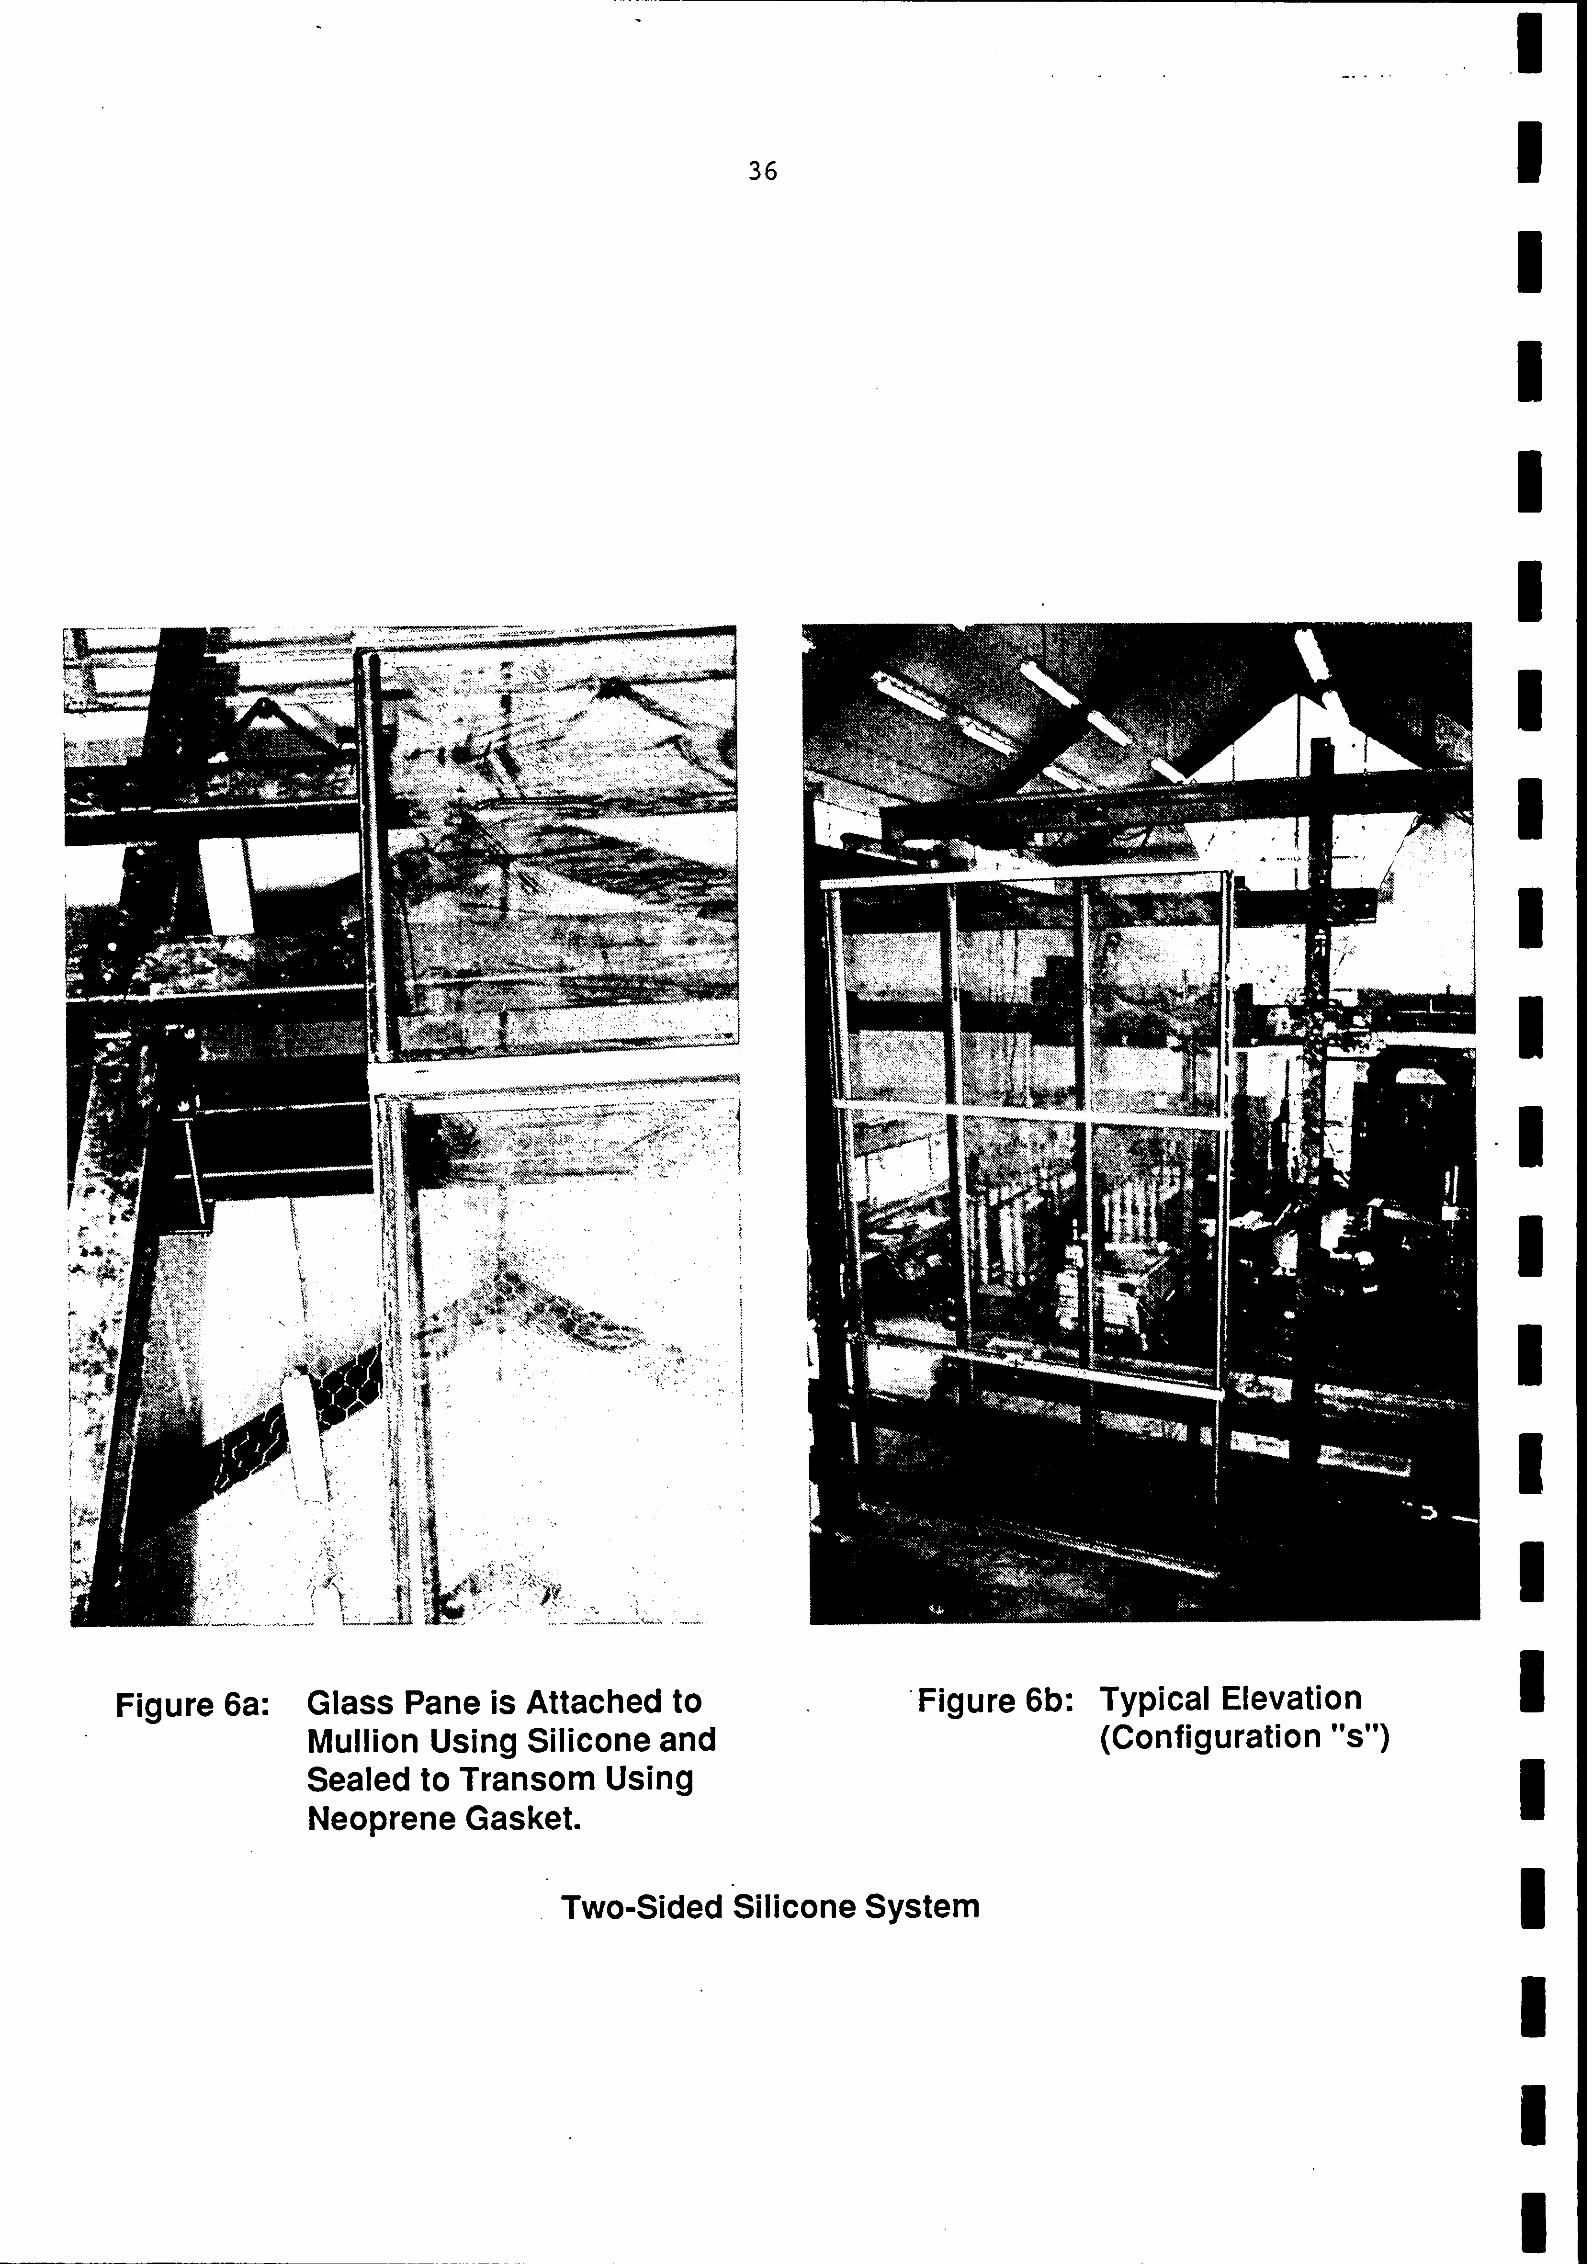
Figure 6a: Glass Pane is Attached to Mullion Using Silicone and Sealed to Transom Using Neoprene Gasket.
Figure 6b: Typical Elevation (Configuration "s")
Two-sided Silicone System

Figure 6c: Vertical Section through Corner Mullion
Figure 6d: Horizontal Section through Transom
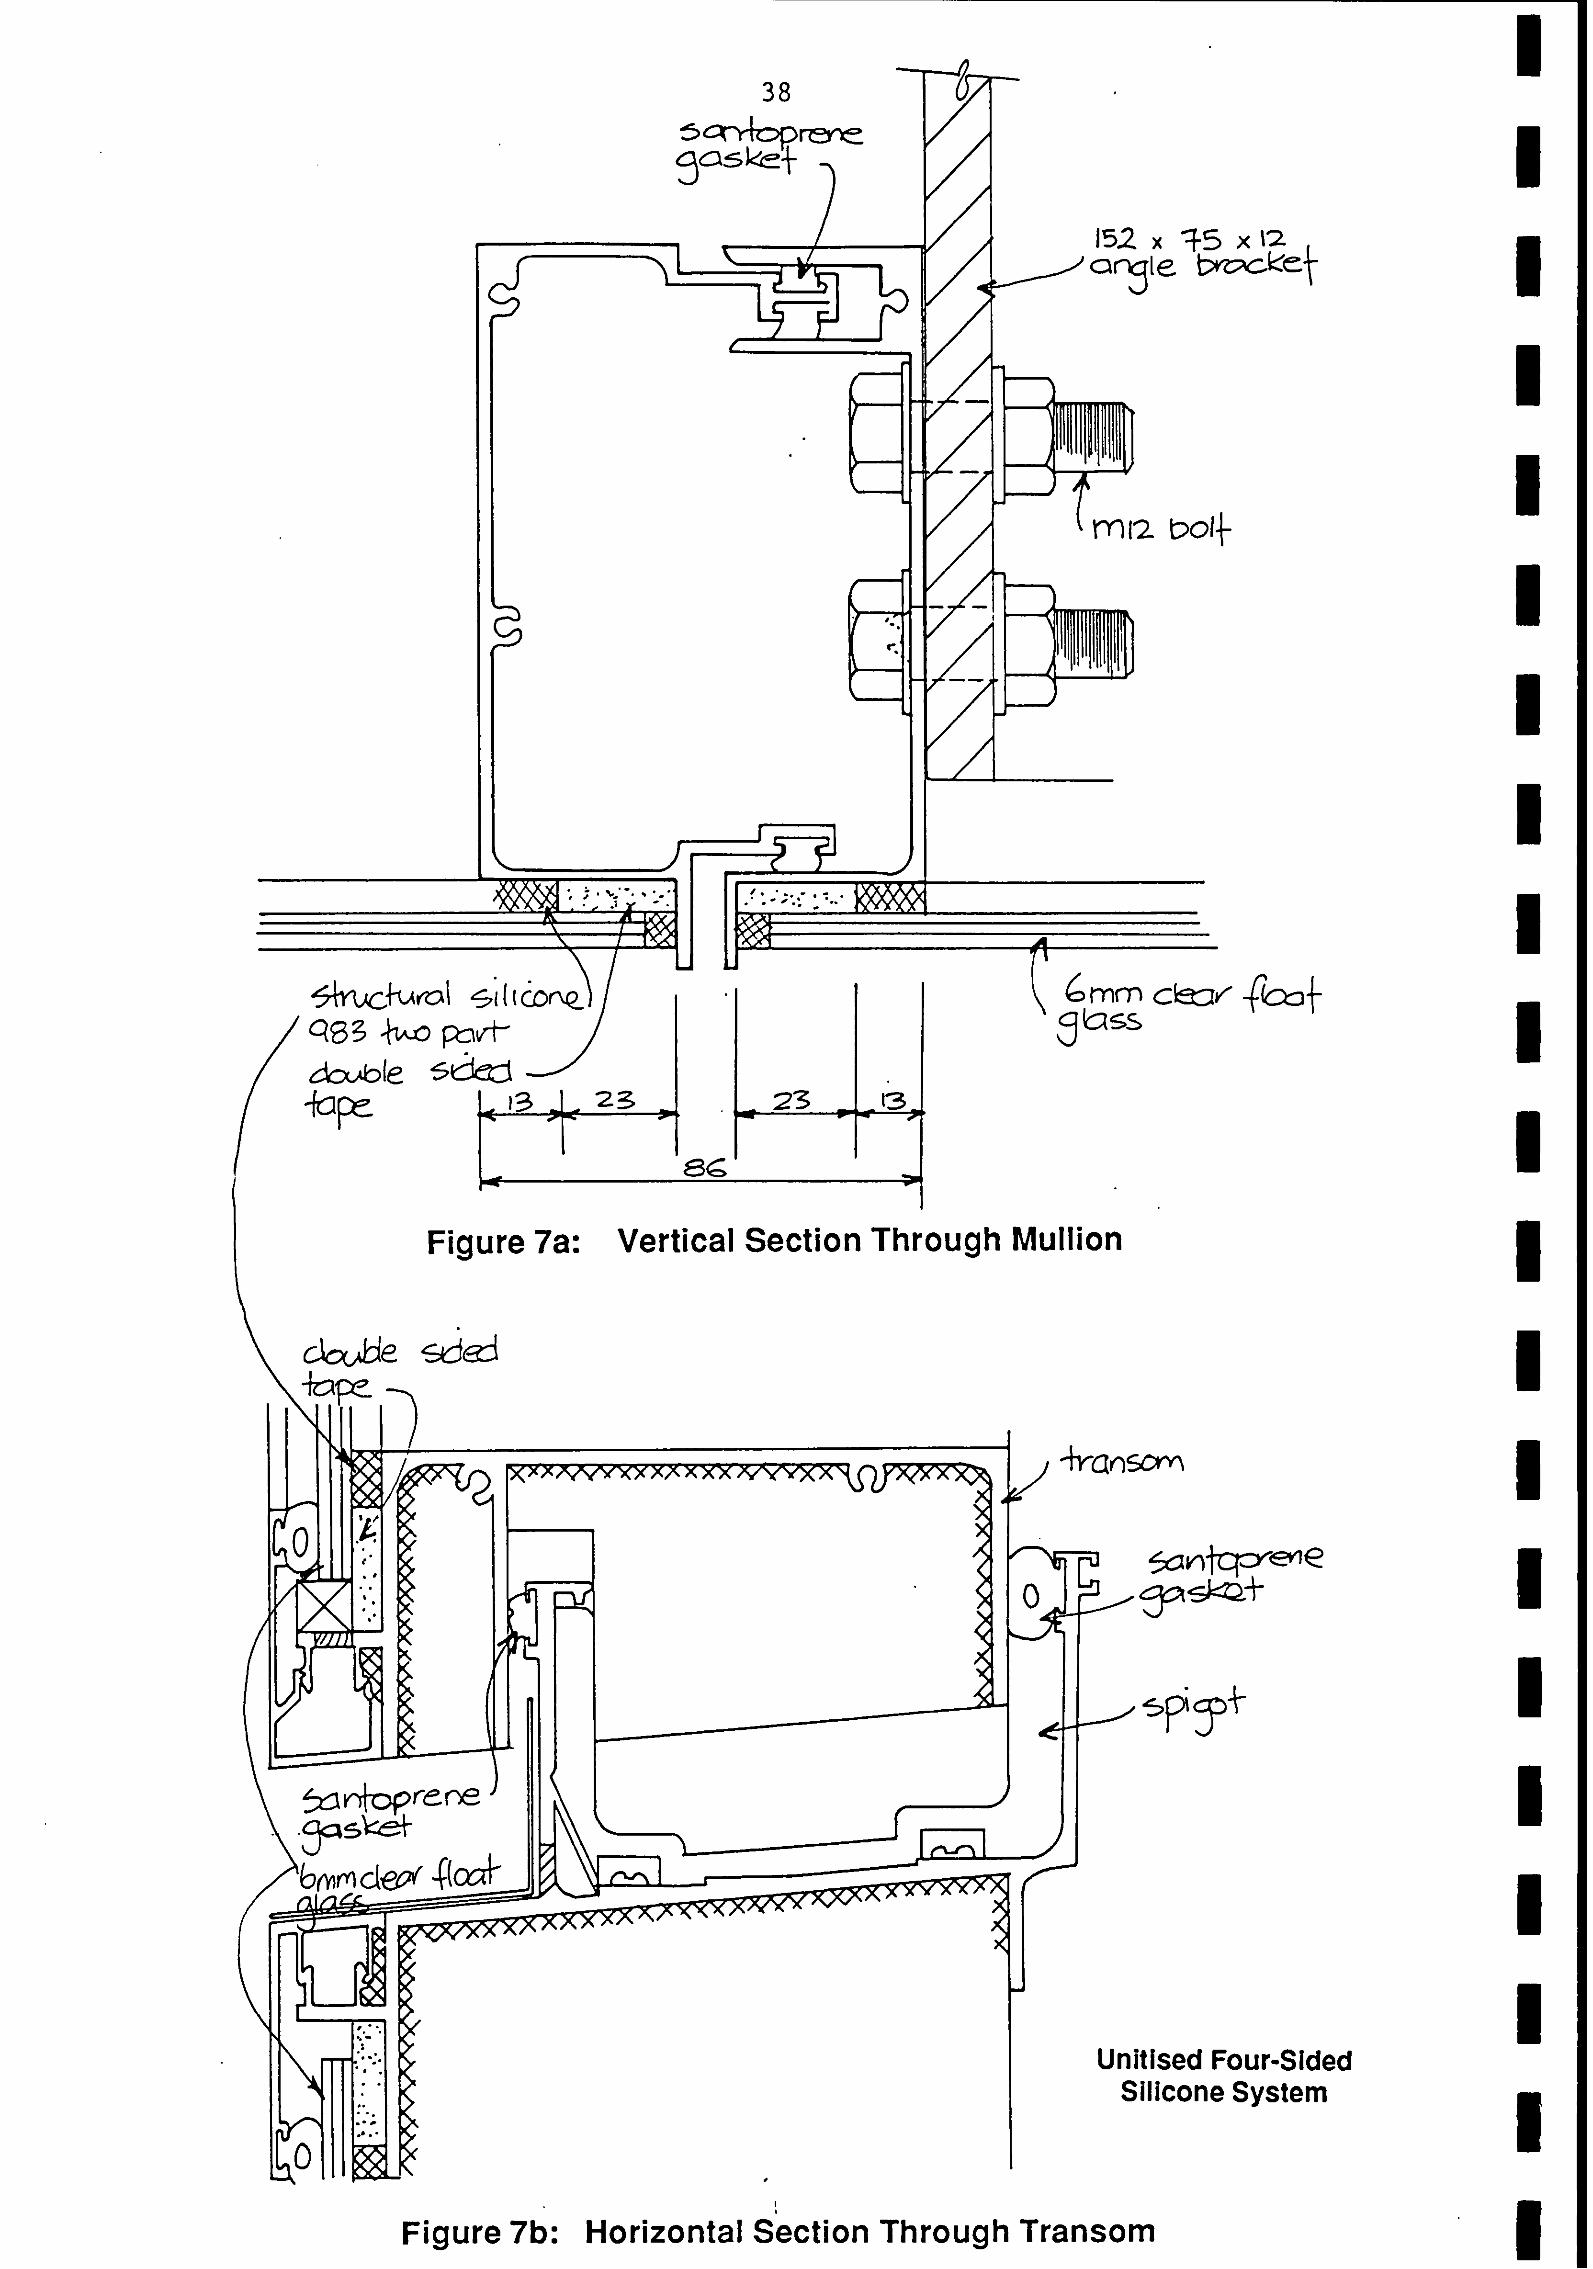
Figure 7a: Vertical Section Through Mullion
Unitised Four-Sided Silicone System
I
Figure 7b: Horizontal section Through Transom

Figure 7c: Typical Elevation
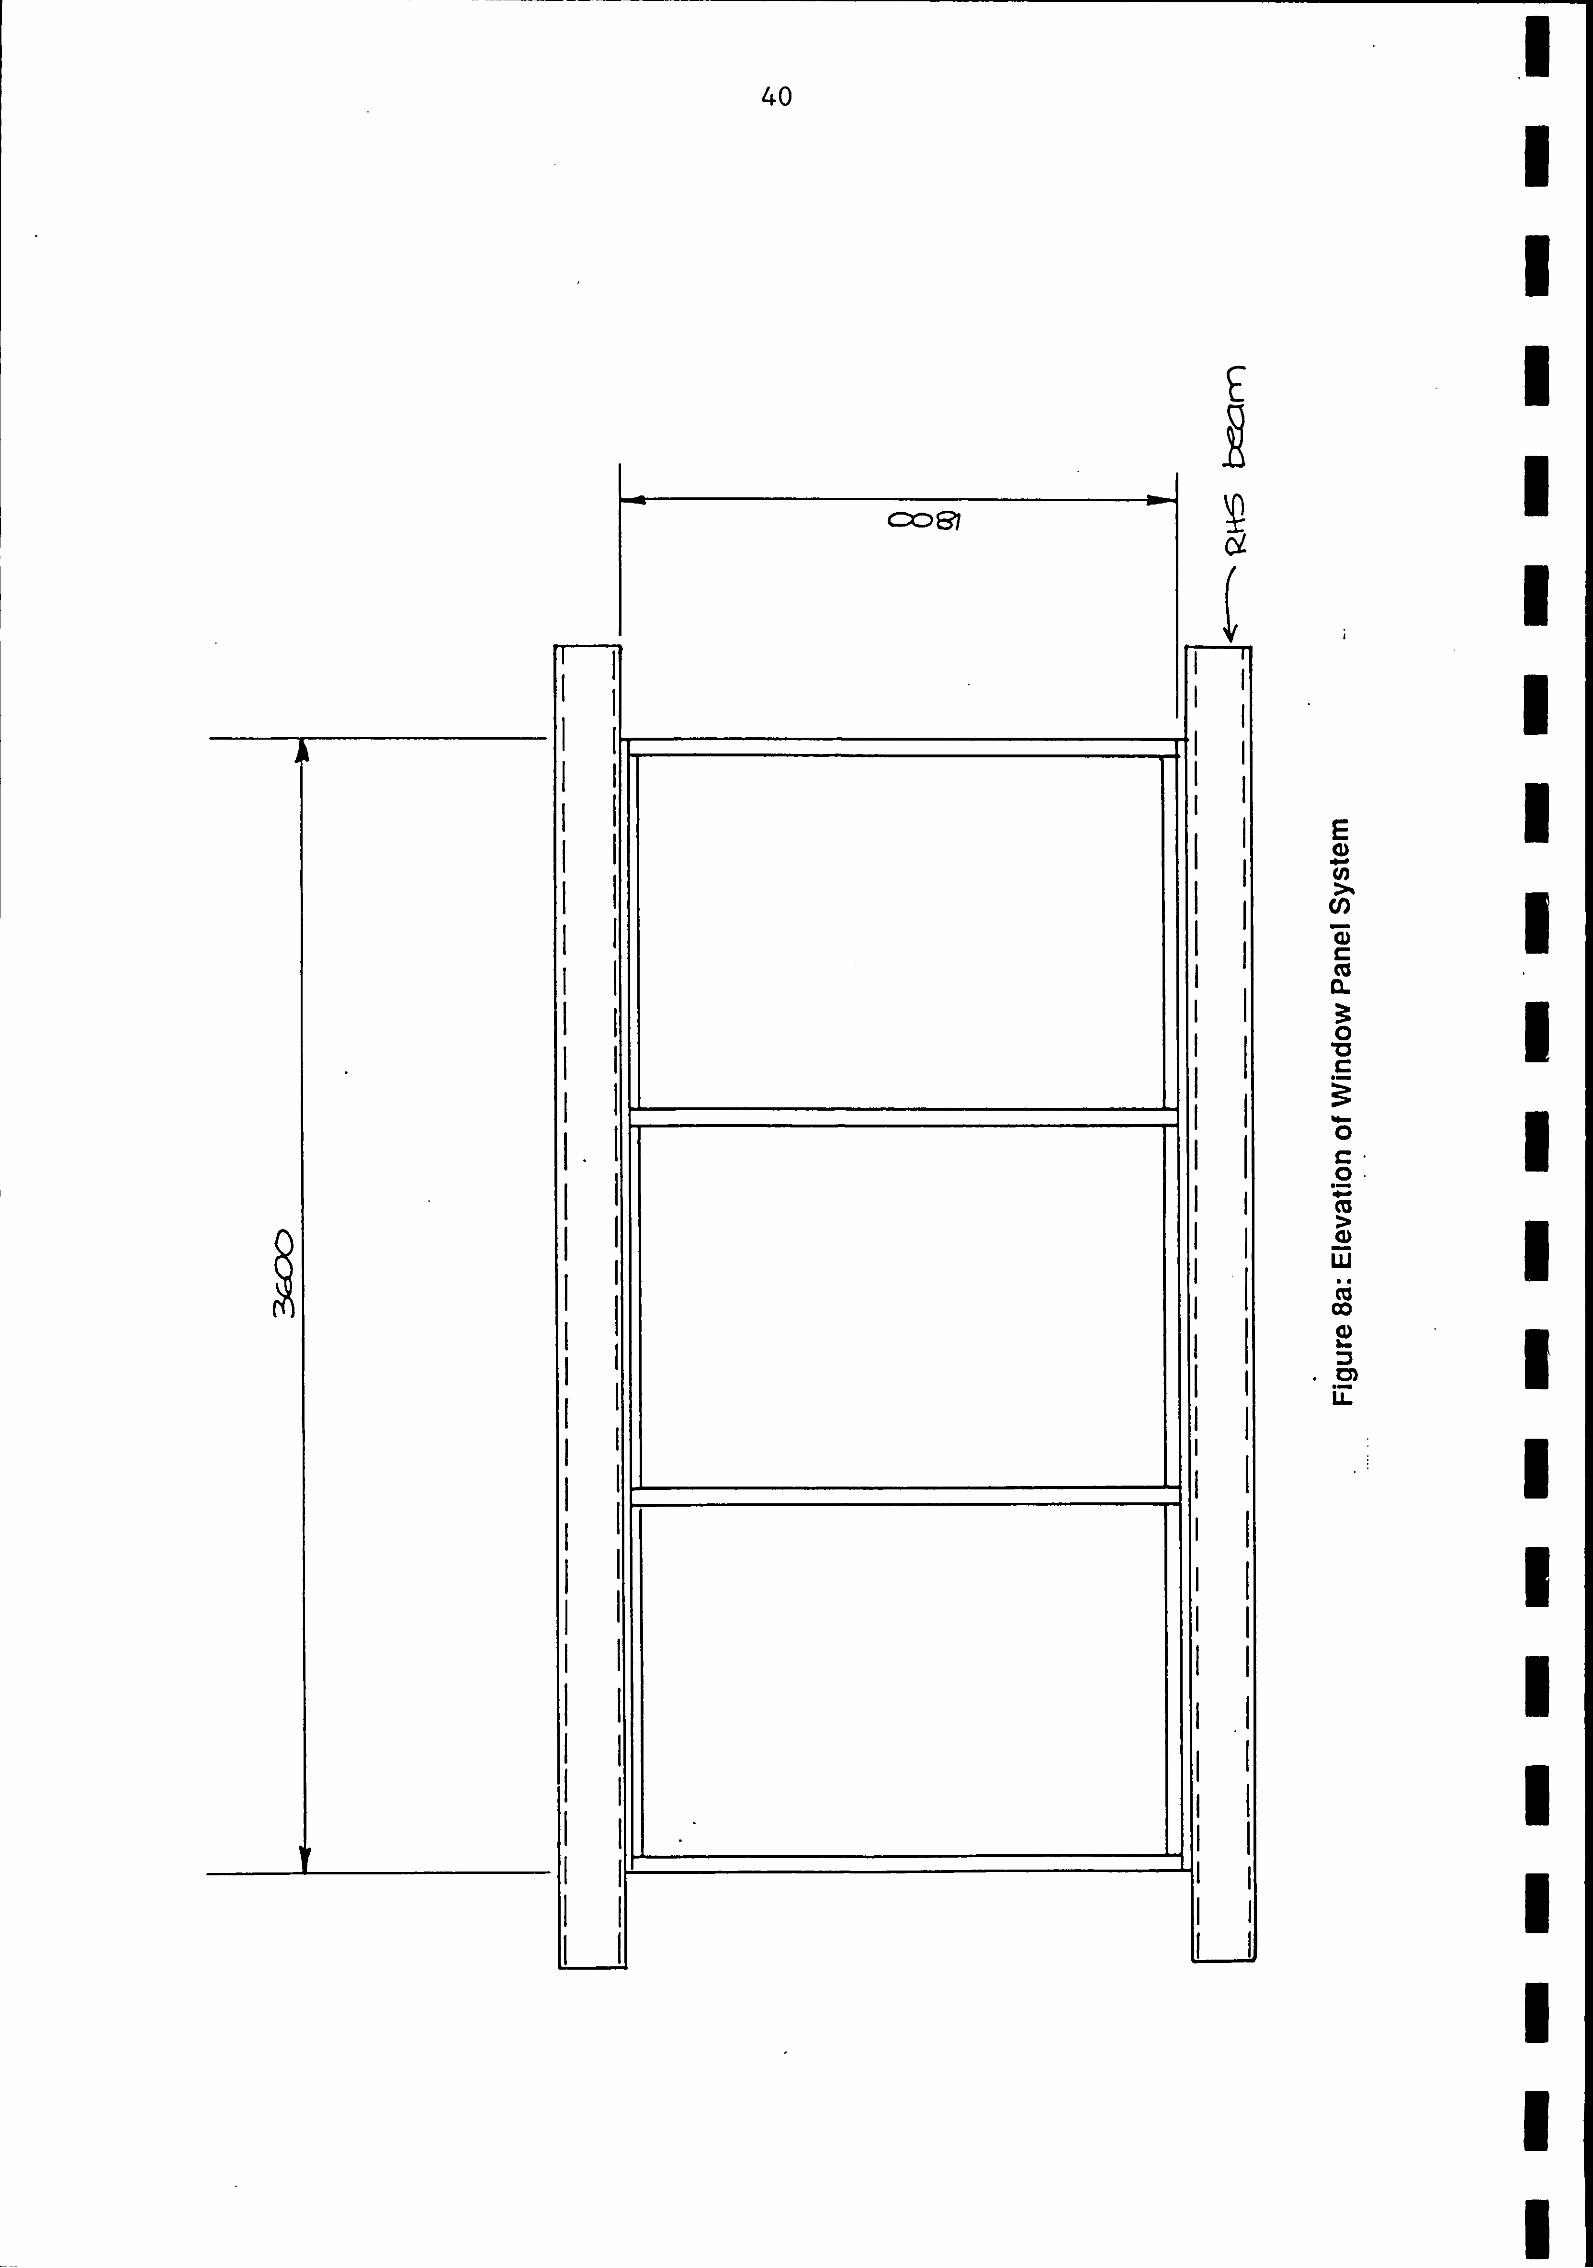
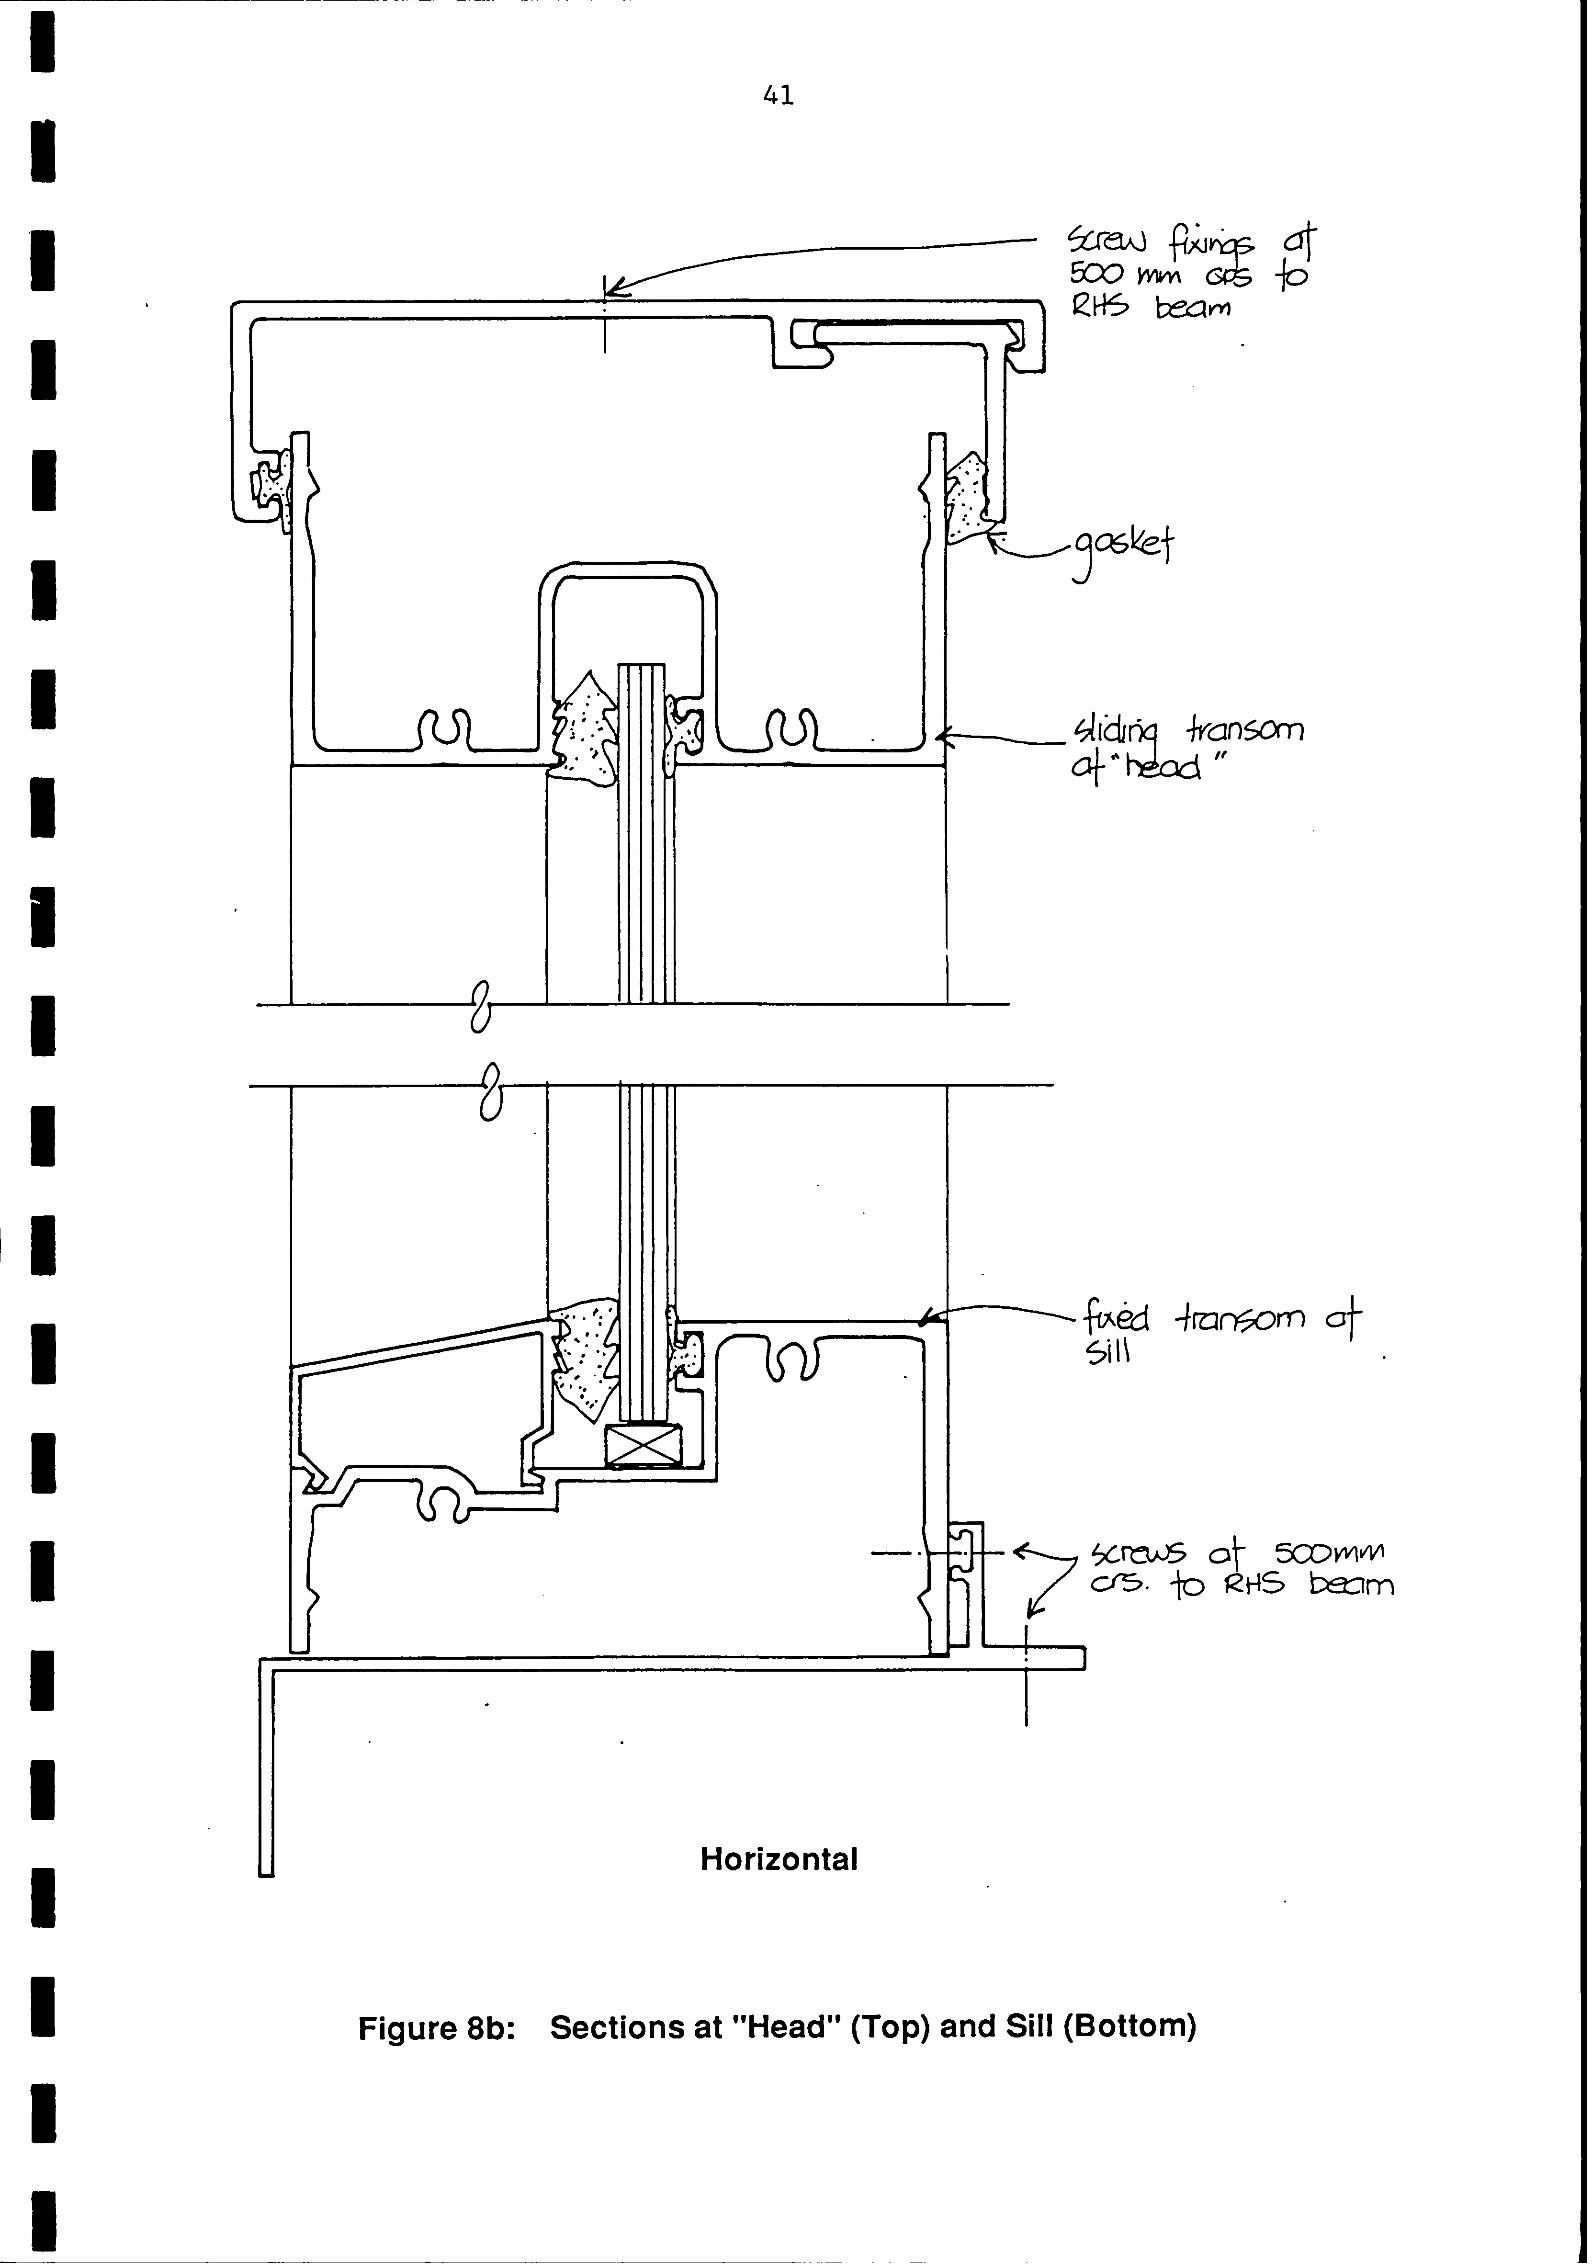
Horizontal
Figure 8b: Sections at "Head" (Top) and Sill (Bottom)

Figure 8c: Vertical Section Through an Interior Mullion
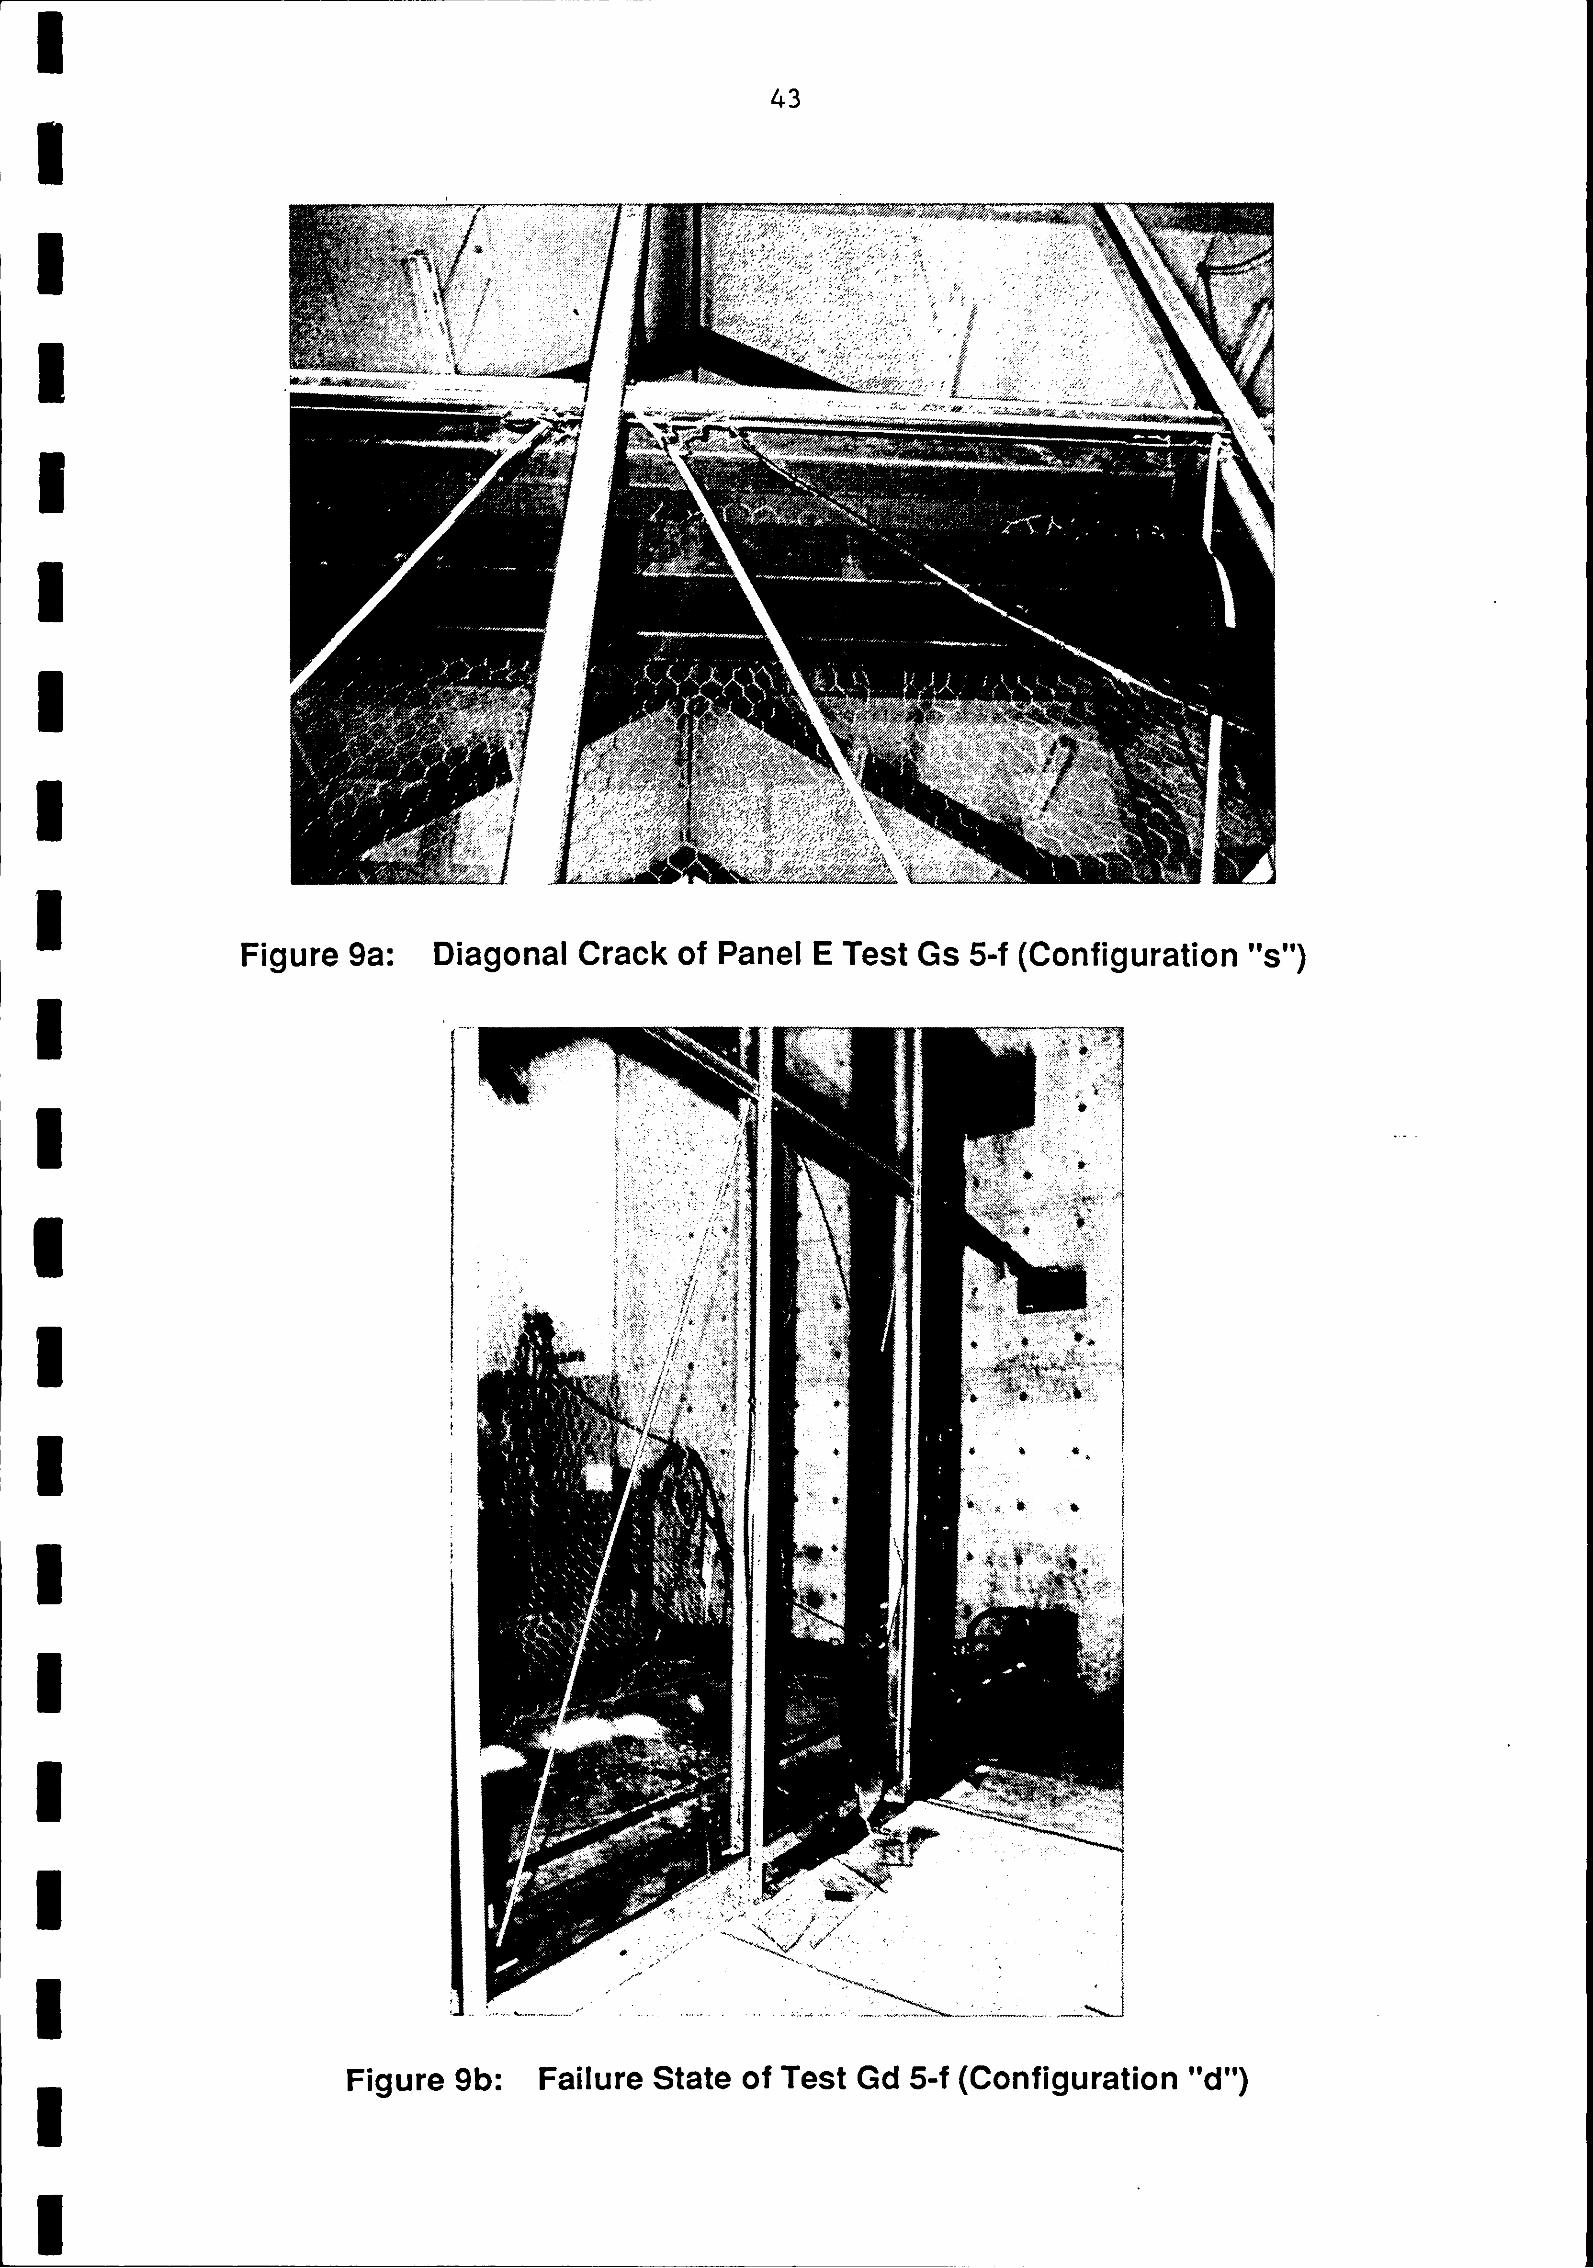
Figure 9a: Diagonal Crack of Panel E Test Gs 5-f (Configuration "s")
Figure 9b: Failure State of Test Gd 5-f (Configuration "d")

MS Bracket
C
DEFLECTION AT LOAD POINT (mm) Figure lOa: Gs 5 - f
10 cycles
10 cycles at 5 mm/s
-6 -3 0 3 6 9
DEFLECTION AT LOAD POINT (mm)
Figure lob: Gd 1 - z

DEFLECTION AT LOAD POINT (mm)
Figure lOc: Gd 5 - f
- 1 k Fixing Failure
- 120 -90 - 60 - 30 0 30 60 90
DEFLECTION AT LOAD POINT (mml
Figure 10d: Gdt 4 - z
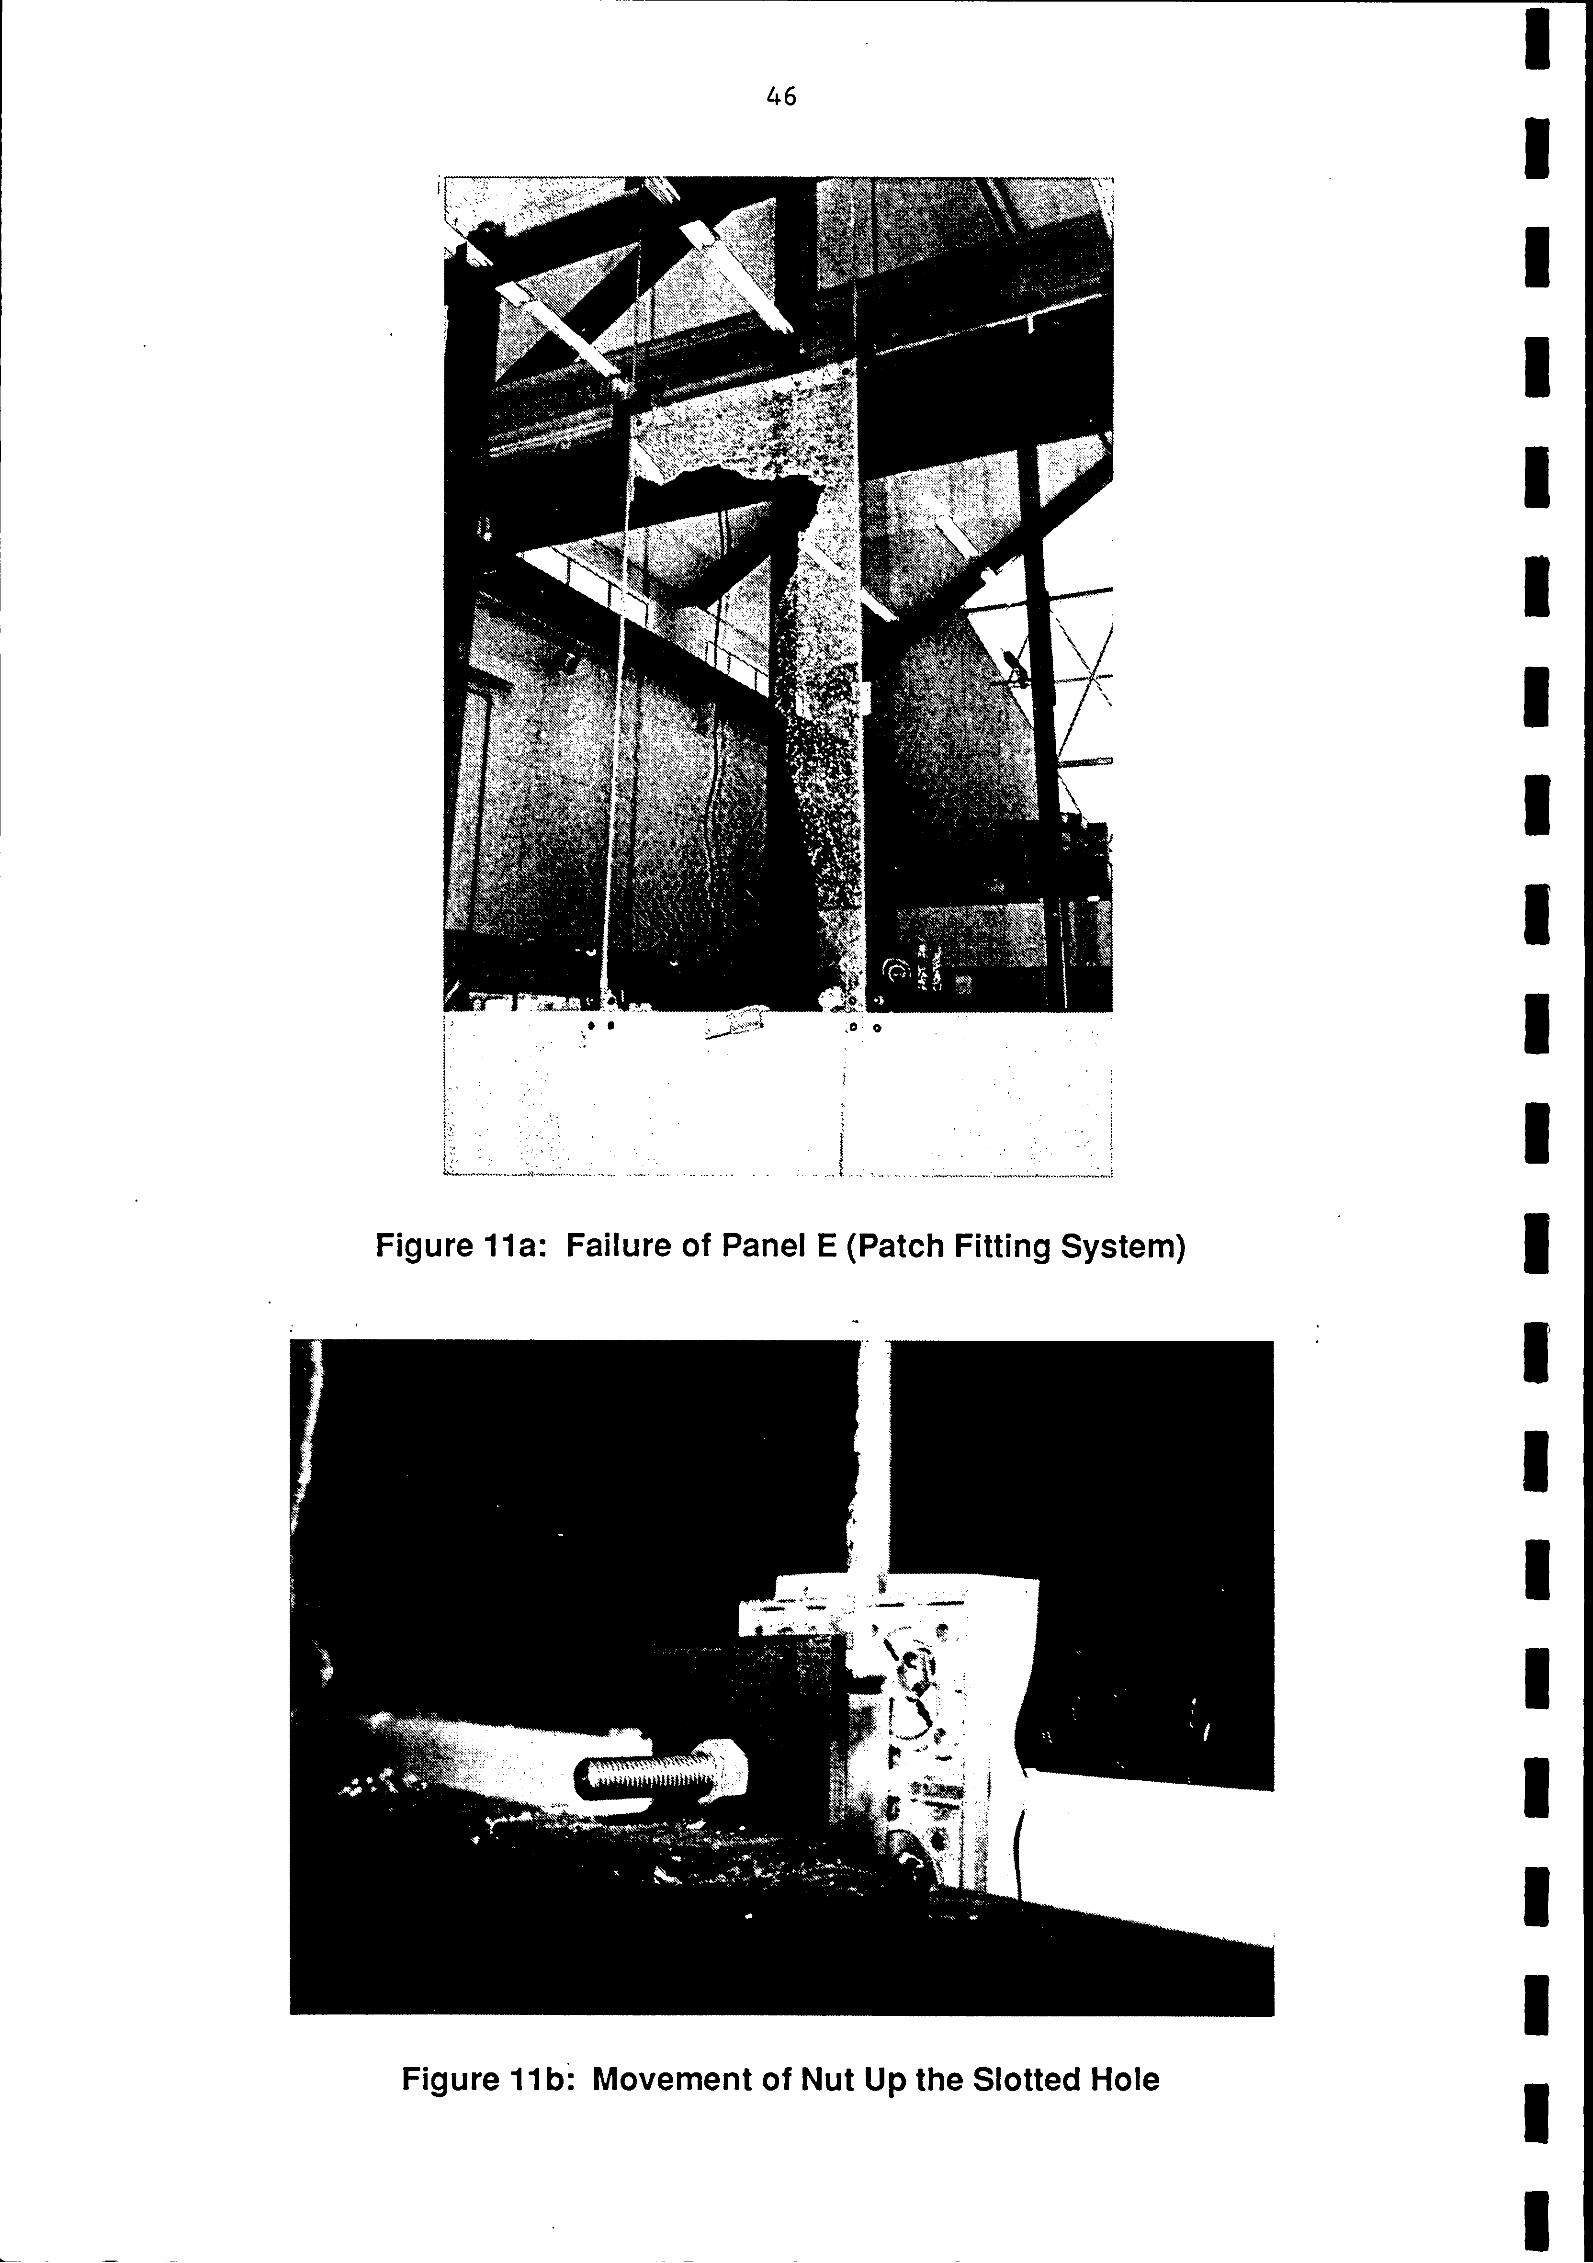
Figure I la: Failure of Panel E (Patch Fitting System)
Figure I 1 b: Movement of Nut Up the Slotted Hole
DEFLECTION AT LOAD POINT (mm)
Figure l lc: PS 2 - z
- - - - - - 0 1 2 3 4 5 6 6 5 4 3 2 1 0 0 0 0 0 0 0 0 0 0 0 0
DEFLECTION AT LOAD POINT (mm) Figure I Id: Ps 4
Glazing Bar I
Mullion not Visible
Figure 12a: Glazing Bar is engaging from Mullion of Two-sided Silicone System
-12 -9 -6 -3 0
DEFLECTION AT LOAD POINT
Figure 12b: Ts 1
DEFLECTION AT LOAD POINT (mm)
Figure 12c: TS 2
DEFLECTION AT LOAD POINT (mm) Figure 12d: Ts 4 - f
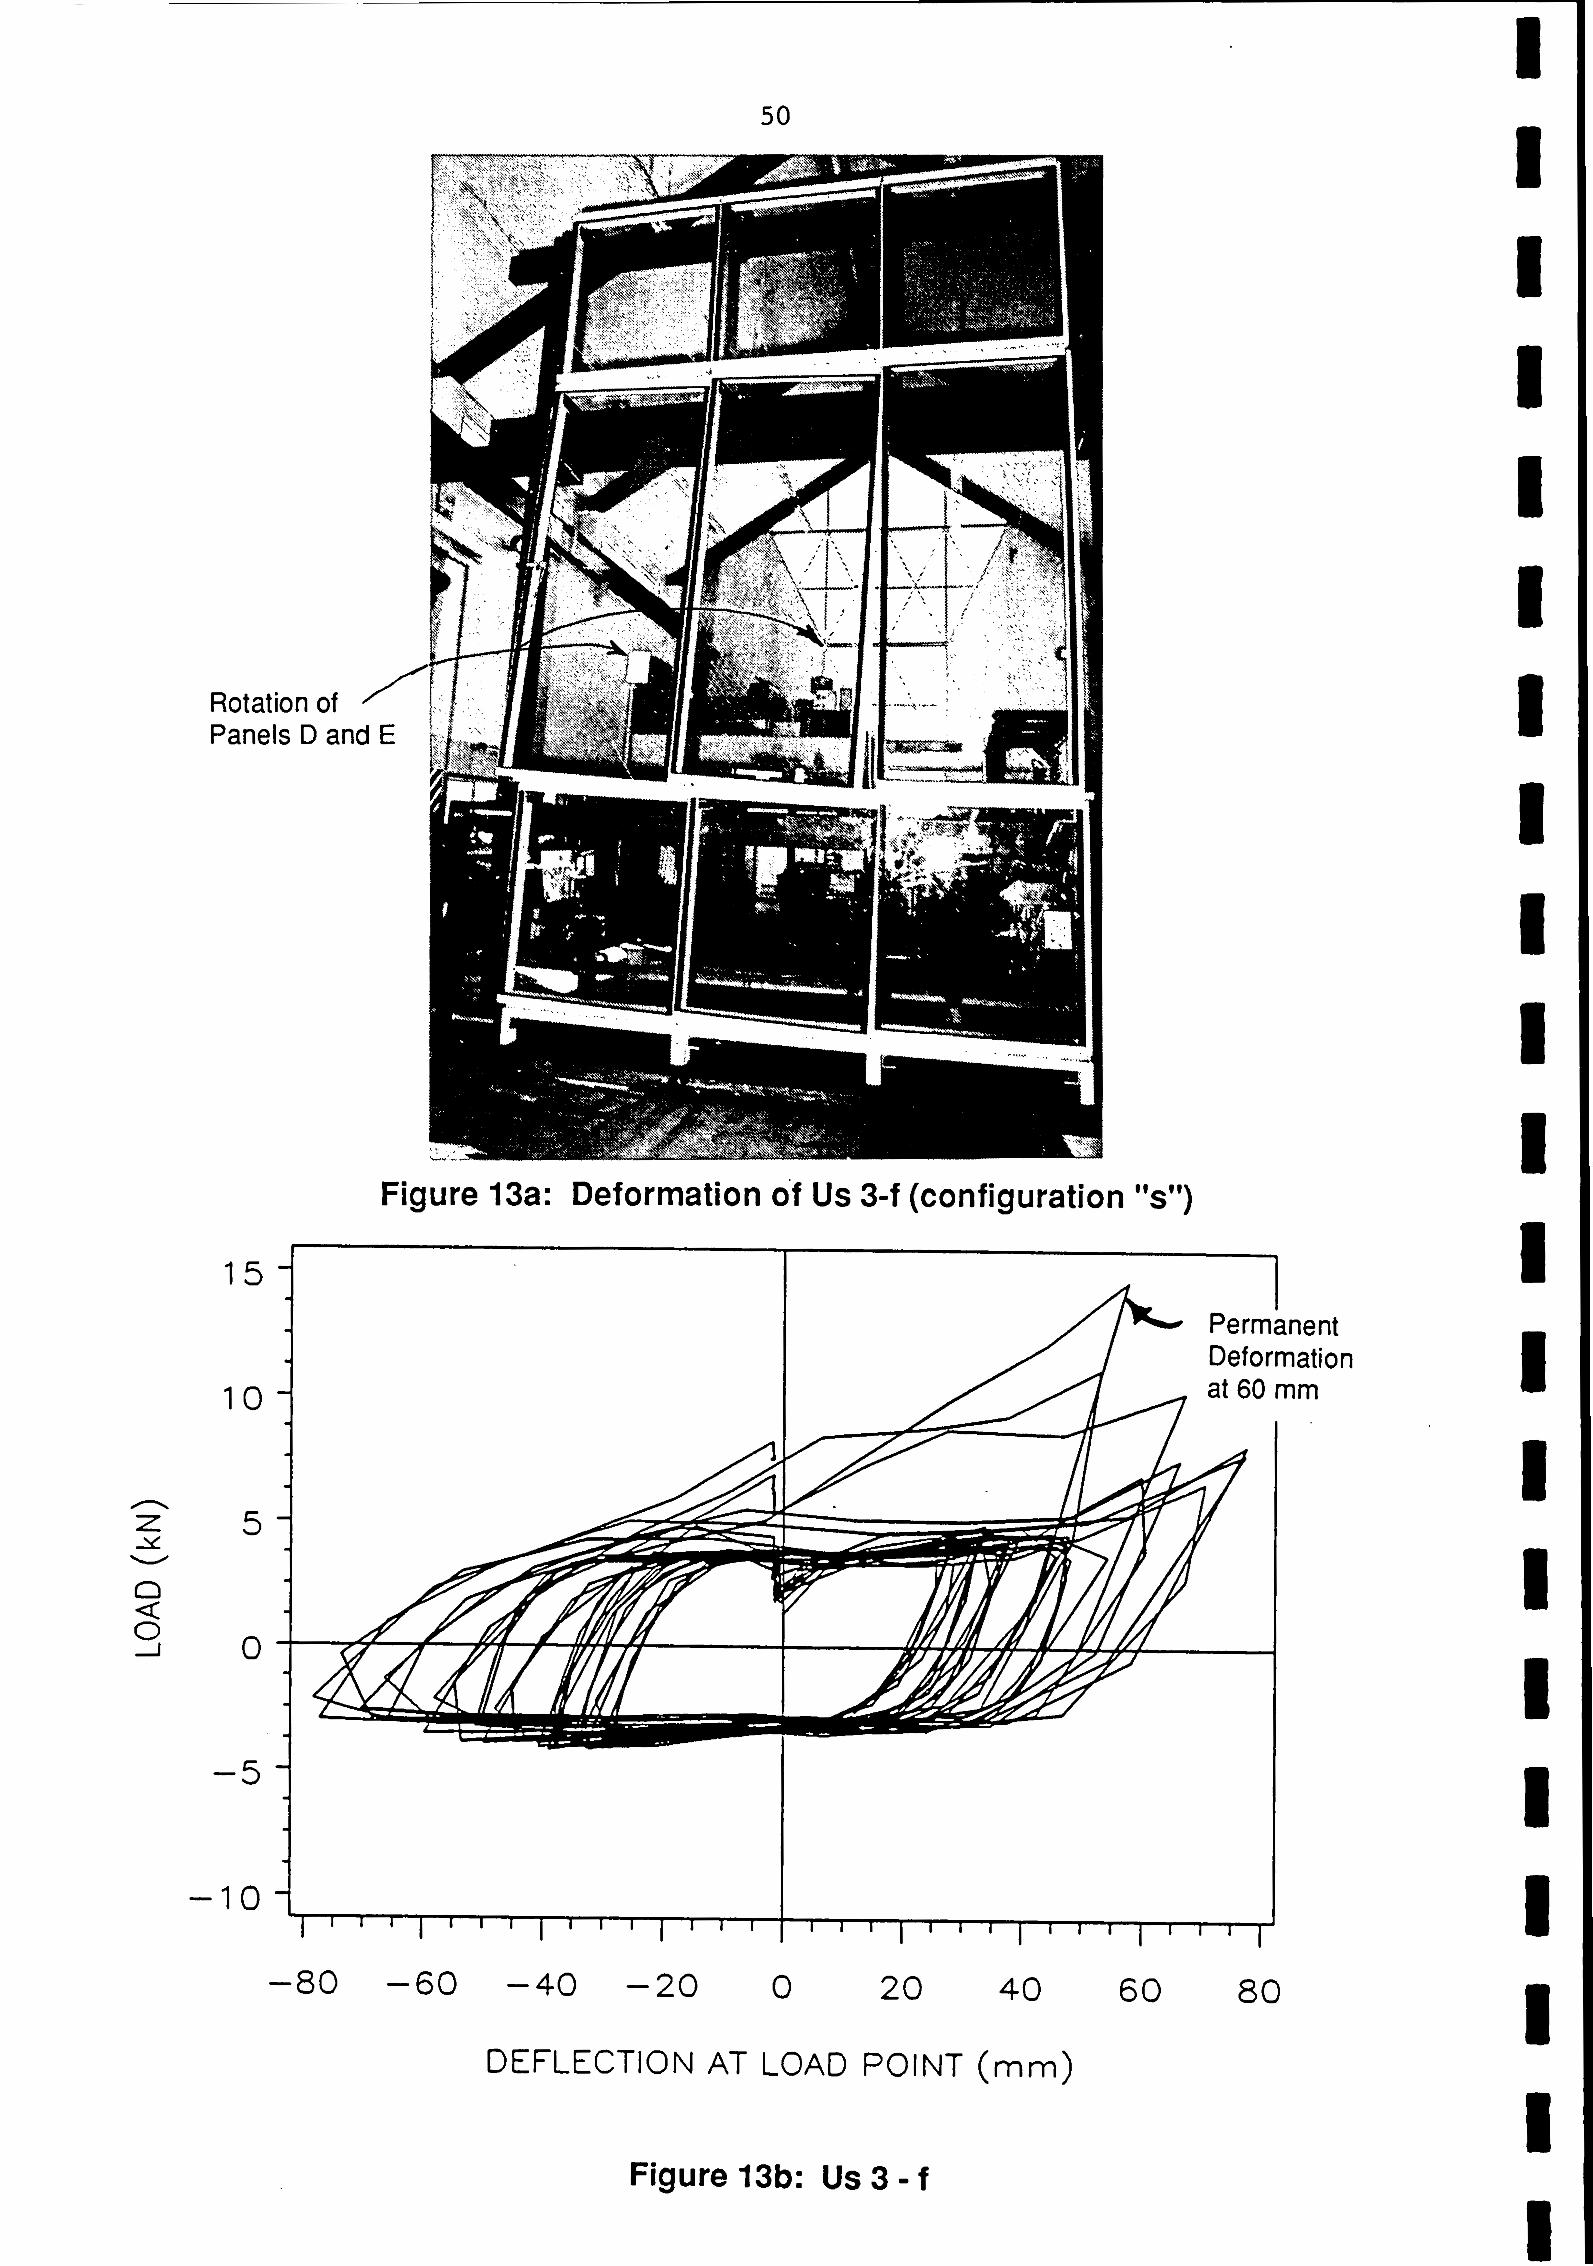
Figure 13a: Deformation o'f Us 3-f (configuration "s")
1 5 - - - - Permanent
Deformation 1 0 - at 60 mm
-80 -60 - 40 -20 0 20 40 60
DEFLECTION AT LOAD POINT (mm)
Figure 13b: Us 3 - f
DEFLECTION AT LOAD POINT (mm)
Figure 13c: Ud 5 - f30
Loads and Area Under Graph are Higher Than of W3 - 30 -
and W4 - 30 after Re-installation of Glass Panels and Gaskets
DEFLECTION AT LOAD POINT (mm)
Figure 14a: W5 - 30
Decrease in Load 4 When Gasket at
Head Slipped Out I
DEFLECTION AT LOAD POINT (mm)
Figure 14b: W6 - 30
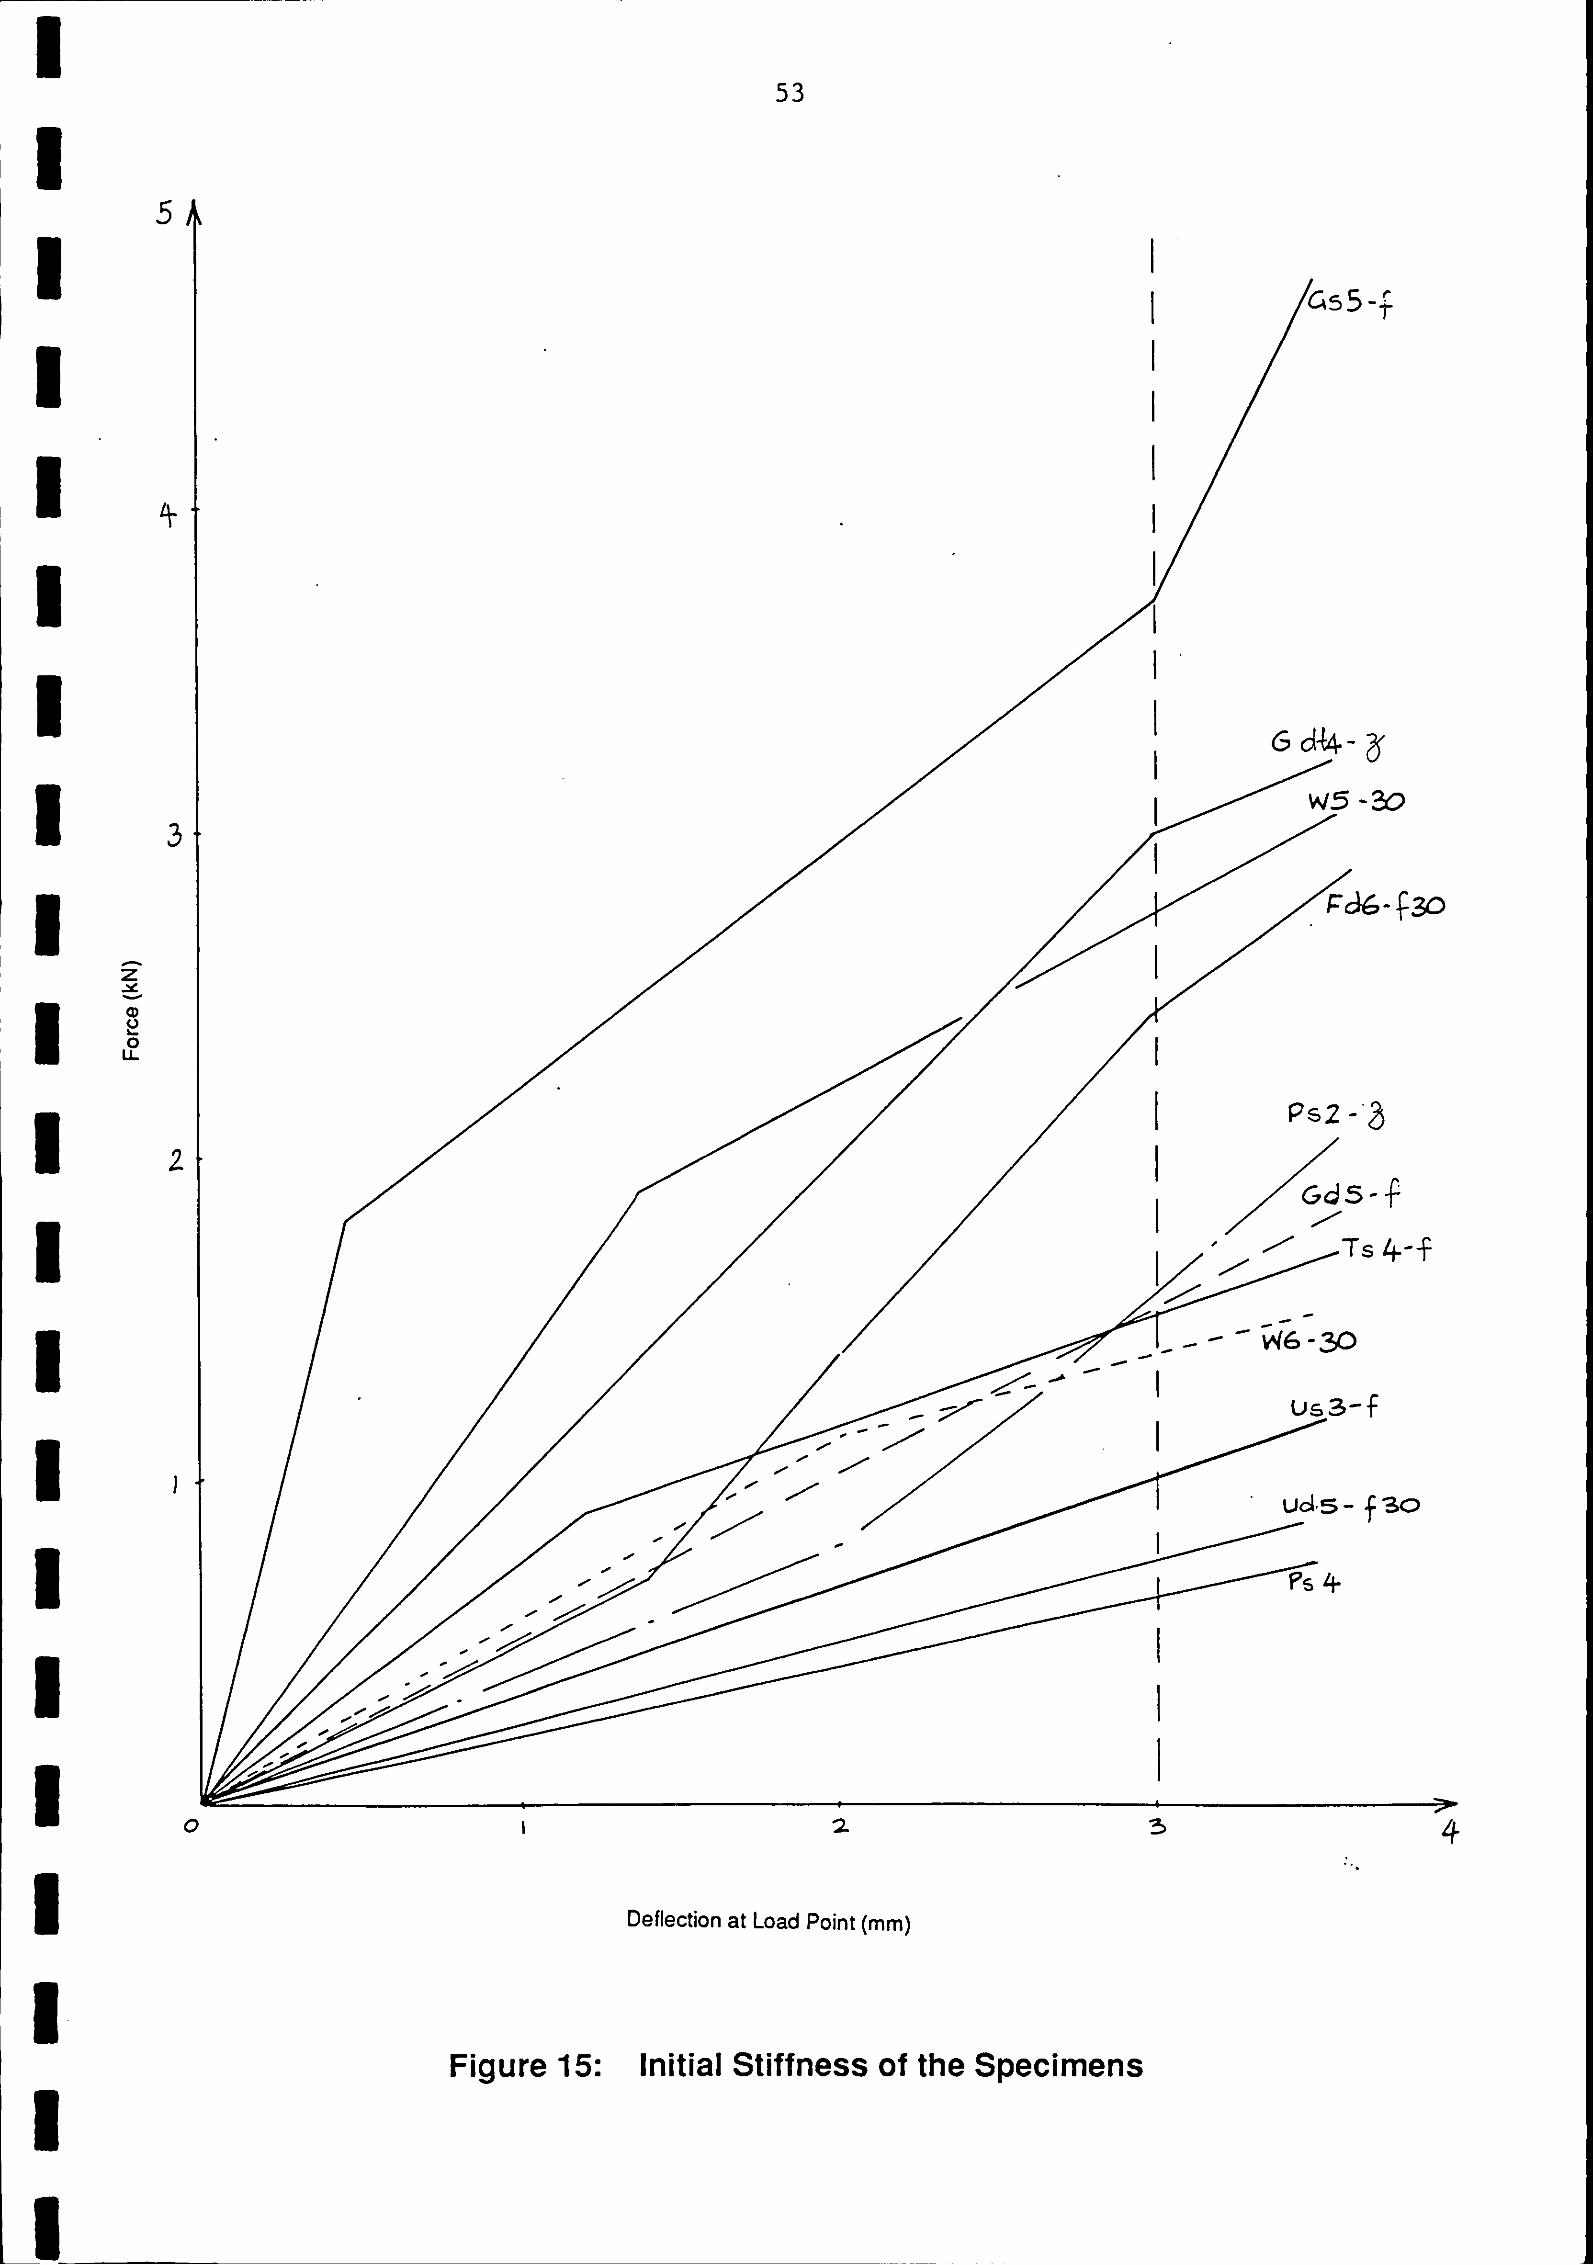
Deflection at Load Point (mm)
Figure 15: Initial Stiffness of the Specimens

Figure 16a: Use of Flexible Seal s at Corners from Lapish (1989)
Figure 16b: Use of a Ductile Bracket for Curved Glazing from Lapish (1989) --

G = Gasket glazed system s a single storey plus two half storeys configuration P a Patch fitting system d a double storey configuration U = Unitised four-sided silicone system t = transom at sill level T = Two-sided silicone system z - - zero displacement of the adjacent sotrey W = Window panels f a full interstorey displacement of the adjacent storey 30 - - 30 mm skewness at one or two corners
Remarks
-
Table 1: Systems and Test Details
axlmum a lsplacement (mm)
40 40 45 45 120
Number of cycles at each dis~lacement
1 1 1 1 1
Test
Gsl-z Gs2-230 Gs3-130 Gs4-f Gs5-f .
Dis lacement P rat (rnmls)
2 2 2 2 5
I cremental displacement (mm)
5 5 5 5 10
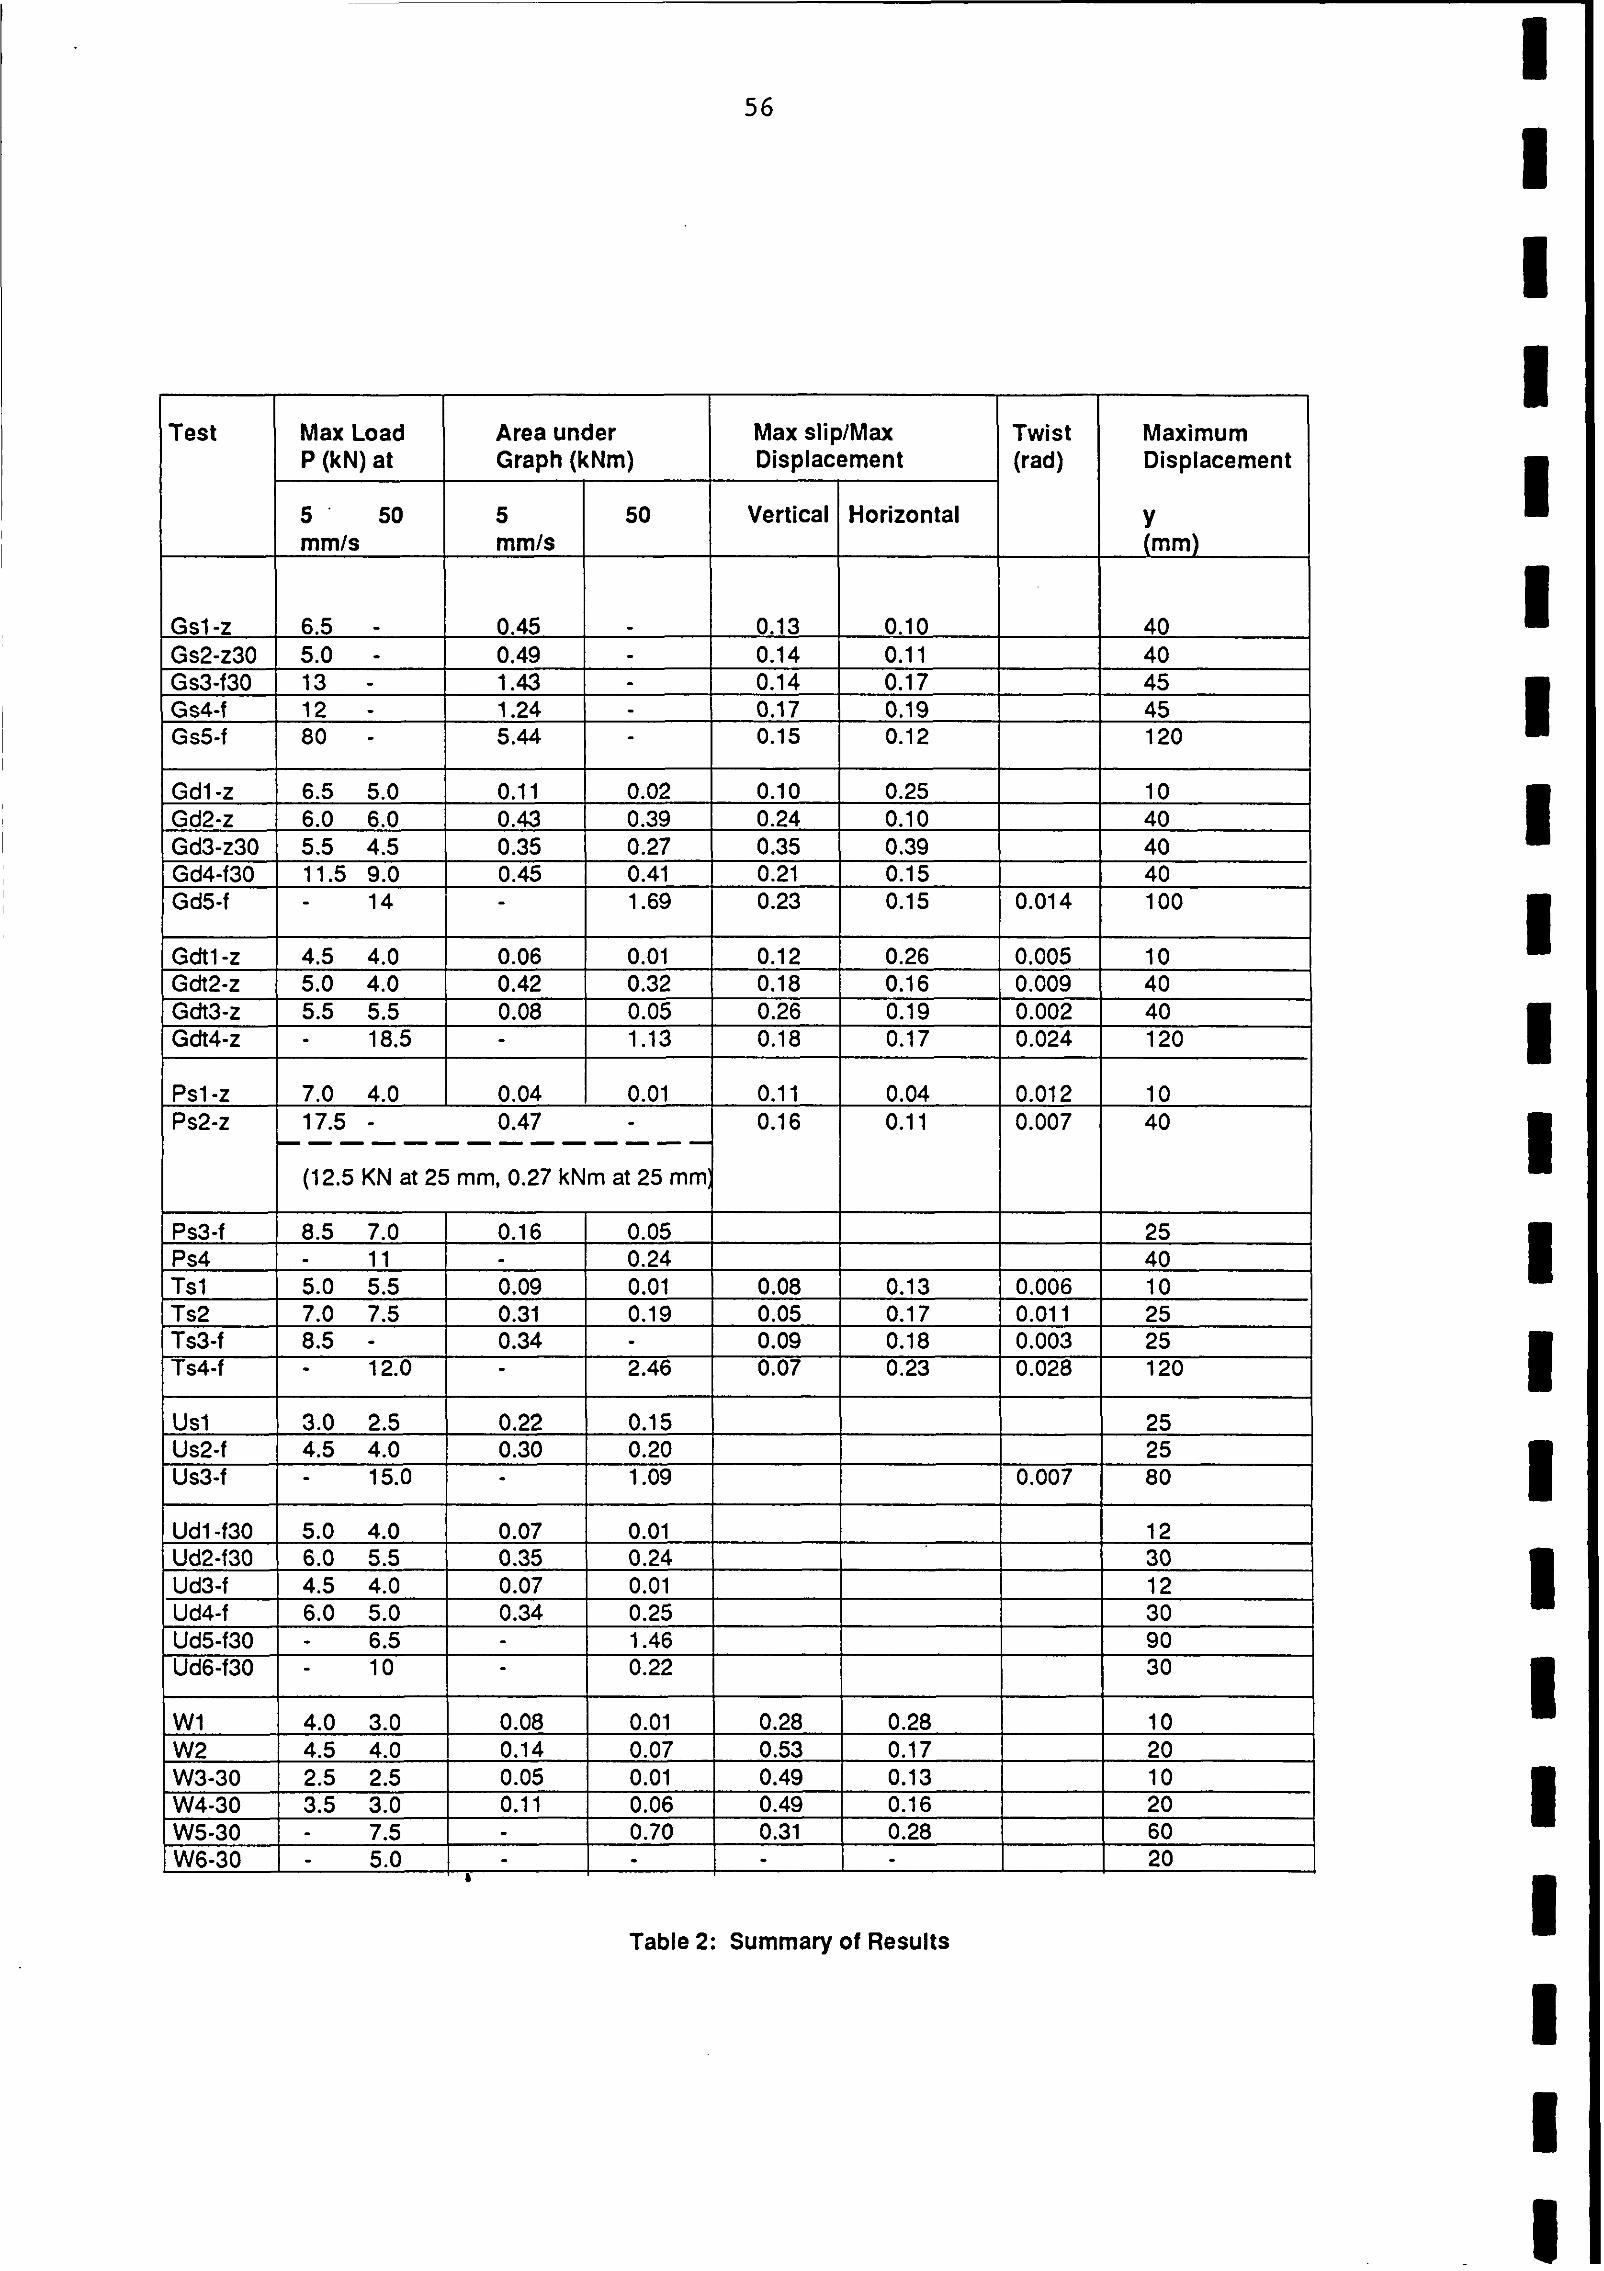
Test
Gdl -2 Gd2-z
Max Load P (kN) at
5 ' 50 mm/s
I I I I I I
1 (12.5 KN at 25 mm, 0.27 kNm at 25 mm I I
6.5 5.0 6.0 6.0
Psl -Z
Gdtl -z
Table 2: Summary of Results
Area under Graph (kNm)
0.1 1 0.43
4.5 4.0
7.0 4.0
Ps3-f Ps4 Tsl Ts2 Ts3-f
Maximum Displacement
5 mm/s
0.06
Y (mm)
Twist (rad)
50
Max slip/Max Displacement
0.02 0.39
0.1 2 0.01
0.04 1 0.01
8.5 7.0 - 11 5.0 5.5 7.0 7.5 8.5 -
Vertical
0.26 I 0.005
Horizontal
0.1 0 0.24
0.1 1
0.1 6 - 0.09 0.31 0.34
0.25 0.1 0
0.04
0.05 0.24 0.01 0.1 9 -
0.01 2
0.08 0.05 0.09
0.1 3 0.1 7 0.18
0.006 0.01 1 0.003
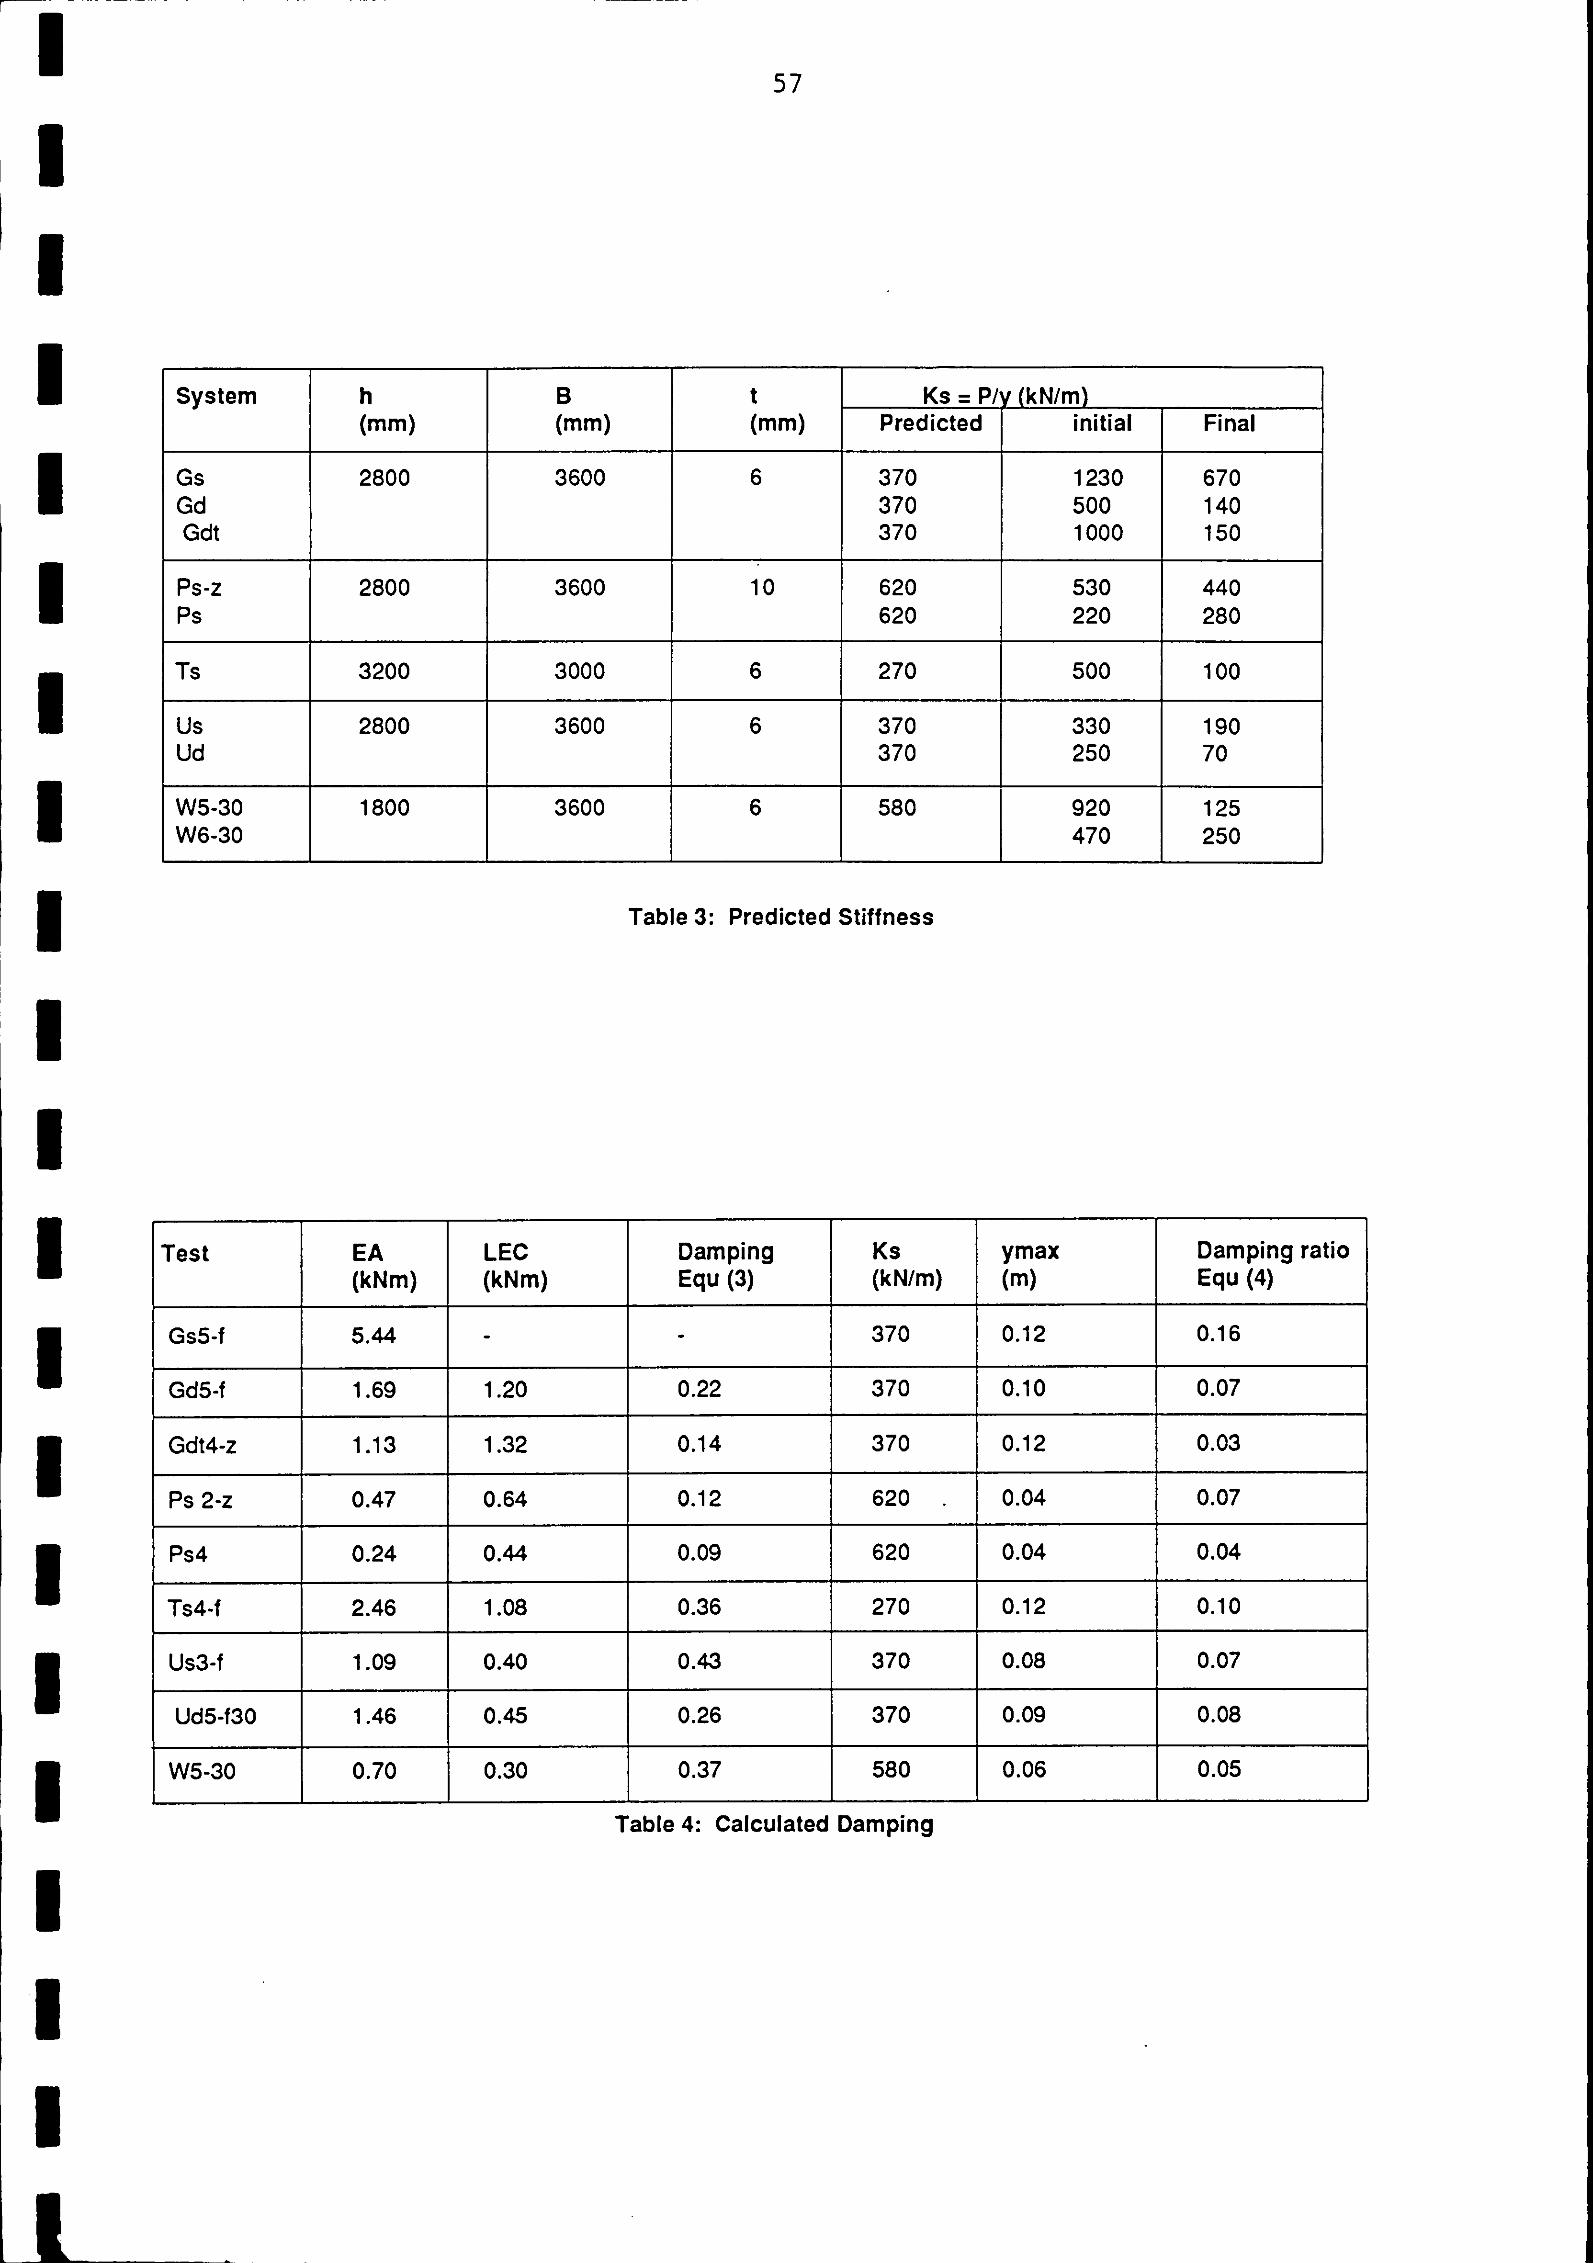
Table 3: Predicted Stiffness
System
Gs Gd Gdt
Test I EA I LEC
h (mm)
2800
I Damping I Ks I Ymax I Damping ratio
6 (mm)
3600
Table 4: Calculated Damping
t (mm)
6
Ks = Ply (kNIm) Final
670 140 1 50
Predicted
370 370 370
initial
1 230 500 1000

'I'he b e h a v i o u r o f e x t e r n a l g l a z i n g s y s t e m s u n d e r s e i
BRANZ MISSION
To promote better building through the application of acquired knowledge,
technology and expertise.
HEAD OFFICE AND RESEARCH CENTRE
Moonshine Road, Judgeford Postal Address - Private Bag, Porirua Telephone - (04) 357-600, FAX 356-070
REGIONAL ADVISORY OFFICES
AUCKLAND Telephone - (09) 5247-018
FAX - (09) 5247-069 290 Great South Road
PO Box 17-214 Greenlane
WELLINGTON Telephone - (04) 357-600
FAX 356-070 Moonshine Road, Judgeford
CHRISTCHURCH Telephone - (03) 663-435
FAX - (03) 668-552 GRE Building
79-83 Hereford Street PO Box 496
DUNEDIN Telephone - (03) 4740-454
FAX - (03) 4778-436 6 Hanover Street
PO Box 1635
THE RESOURCE CENTRE FOR BUILDING EXCELLENCE