External Trade by Enterprise Characteristics
164
EUROPEAN COMMISSION Methodologies and working papers External Trade by Enterprise Characteristics Results of the Standardisation Exercise 2006
-
Upload
khangminh22 -
Category
Documents
-
view
3 -
download
0
Transcript of External Trade by Enterprise Characteristics

EUROPEAN C OMMISSION
M e t h o d o l o g i e s a n d w o r k i n g p a p e r s
External Trade by Enterprise Characteristics Results of the Standardisation Exercise 2006

Europe Direct is a service to help you find answers to your questions about the European Union
Freephone number (*):
00 800 6 7 8 9 10 11(*) Certain mobile telephone operators do not allow access to 00 800 numbers or these calls may be billed.
More information on the European Union is available on the Internet (http://europa.eu).
Luxembourg: Office for Official Publications of the European Communities, 2007
ISBN 978-92-79-04753-4ISSN 1977-0375Catalogue number: KS-RA-07-019-EN-N Theme: External TradeCollection: Methodologies and working papers
© European Communities, 2007
How to obtain EU publicationsOur priced publications are available from EU Bookshop (http://bookshop.europa.eu), where you can place an order with the sales agent of your choice.
The Publications Office has a worldwide network of sales agents. You can obtain their contact details by sending a fax to (352) 29 29-42758.

Eurostat is the Statistical Office of the European Communities. Its mission is to provide the European Union with high-quality statistical information. For that purpose, it gathers and analyses figures from the national statistical offices across Europe and provides comparable and harmonised data for the European Union to use in the definition, implementation and analysis of Community policies. Its statistical products and services are also of great value to Europe’s business community, professional organisations, academics, librarians, NGOs, the media and citizens.
Eurostat's publications programme consists of several collections:• News releases provide recent information on the Euro-Indicators and on social,
economic, regional, agricultural or environmental topics.• Statistical books are larger A4 publications with statistical data and analysis.• Pocketbooks are free of charge publications aiming to give users a set of basic
figures on a specific topic.• Statistics in focus provides updated summaries of the main results of surveys,
studies and statistical analysis.• Data in focus present the most recent statistics with methodological notes.• Methodologies and working papers are technical publications for statistical
experts working in a particular field.Eurostat publications can be ordered via the EU Bookshop at http://bookshop.europa.eu.
All publications are also downloadable free of charge in PDF format from the Eurostat website http://ec.europa.eu/eurostat. Furthermore, Eurostat’s databases are freely available there, as are tables with the most frequently used and demanded short- and long-term indicators.
Eurostat has set up with the members of the ‘European statistical system’ (ESS) a network of user support centres which exist in nearly all Member States as well as in some EFTA countries. Their mission is to provide help and guidance to Internet users of European statistical data. Contact details for this support network can be found on Eurostat Internet site.
EUROSTATL-2920 Luxembourg — Tel. (352) 43 01-1 —website http://ec.europa.eu/eurostat


�External Trade by Enterprise Characteristics – Results of the Standardisation exercise 2006
Table of contents
page
Part I
1. Introduction. . . . . . . . . . . . . . . . . . . . . . . . . . . . . . . . . . . . . . . . . . . . . . . . . . . . . . . . . . . . . . . . . . . . . . . . . . . . . . . . . . . . . . . . . . . . . . . . . . . . . . . . . . . . . . . . . . . 9
2. Methodological notes.. . . . . . . . . . . . . . . . . . . . . . . . . . . . . . . . . . . . . . . . . . . . . . . . . . . . . . . . . . . . . . . . . . . . . . . . . . . . . . . . . . . . . . . . . . . . . . . . . . . . 10
2.1. Methodological notes - indicators.. . . . . . . . . . . . . . . . . . . . . . . . . . . . . . . . . . . . . . . . . . . . . . . . . . . . . . . . . . . . . . . . . . . . . . . . . . . . . . . . . . . . . . . 10
2.2. Methodological notes - data. . . . . . . . . . . . . . . . . . . . . . . . . . . . . . . . . . . . . . . . . . . . . . . . . . . . . . . . . . . . . . . . . . . . . . . . . . . . . . . . . . . . . . . . . . . . . . . 11
2.2.1 Data availability.. . . . . . . . . . . . . . . . . . . . . . . . . . . . . . . . . . . . . . . . . . . . . . . . . . . . . . . . . . . . . . . . . . . . . . . . . . . . . . . . . . . . . . . . . . . . . . . . . . . . . . . . . . . . . . . 112.2.2 Trade data.. . . . . . . . . . . . . . . . . . . . . . . . . . . . . . . . . . . . . . . . . . . . . . . . . . . . . . . . . . . . . . . . . . . . . . . . . . . . . . . . . . . . . . . . . . . . . . . . . . . . . . . . . . . . . . . . . . . . . . 112.2.3 Trade concept.. . . . . . . . . . . . . . . . . . . . . . . . . . . . . . . . . . . . . . . . . . . . . . . . . . . . . . . . . . . . . . . . . . . . . . . . . . . . . . . . . . . . . . . . . . . . . . . . . . . . . . . . . . . . . . . . . . 112.2.4 Economic activity.. . . . . . . . . . . . . . . . . . . . . . . . . . . . . . . . . . . . . . . . . . . . . . . . . . . . . . . . . . . . . . . . . . . . . . . . . . . . . . . . . . . . . . . . . . . . . . . . . . . . . . . . . . . . . . 112.2.5 Classification of products.. . . . . . . . . . . . . . . . . . . . . . . . . . . . . . . . . . . . . . . . . . . . . . . . . . . . . . . . . . . . . . . . . . . . . . . . . . . . . . . . . . . . . . . . . . . . . . . . . . . . . 112.2.6 Number of employeess. . . . . . . . . . . . . . . . . . . . . . . . . . . . . . . . . . . . . . . . . . . . . . . . . . . . . . . . . . . . . . . . . . . . . . . . . . . . . . . . . . . . . . . . . . . . . . . . . . . . . . . . 122.2.7 Geographical breakdown.. . . . . . . . . . . . . . . . . . . . . . . . . . . . . . . . . . . . . . . . . . . . . . . . . . . . . . . . . . . . . . . . . . . . . . . . . . . . . . . . . . . . . . . . . . . . . . . . . . . . 122.2.8 Confidentiality.. . . . . . . . . . . . . . . . . . . . . . . . . . . . . . . . . . . . . . . . . . . . . . . . . . . . . . . . . . . . . . . . . . . . . . . . . . . . . . . . . . . . . . . . . . . . . . . . . . . . . . . . . . . . . . . . 122.2.9 Data presentation. . . . . . . . . . . . . . . . . . . . . . . . . . . . . . . . . . . . . . . . . . . . . . . . . . . . . . . . . . . . . . . . . . . . . . . . . . . . . . . . . . . . . . . . . . . . . . . . . . . . . . . . . . . . . 122.2.10 Country notes.. . . . . . . . . . . . . . . . . . . . . . . . . . . . . . . . . . . . . . . . . . . . . . . . . . . . . . . . . . . . . . . . . . . . . . . . . . . . . . . . . . . . . . . . . . . . . . . . . . . . . . . . . . . . . . . . . 12
2.3. Methodological notes – registers.. . . . . . . . . . . . . . . . . . . . . . . . . . . . . . . . . . . . . . . . . . . . . . . . . . . . . . . . . . . . . . . . . . . . . . . . . . . . . . . . . . . . . . . . 13
2.3.1 Business Registers. . . . . . . . . . . . . . . . . . . . . . . . . . . . . . . . . . . . . . . . . . . . . . . . . . . . . . . . . . . . . . . . . . . . . . . . . . . . . . . . . . . . . . . . . . . . . . . . . . . . . . . . . . . . . 132.3.2 Trade Registers.. . . . . . . . . . . . . . . . . . . . . . . . . . . . . . . . . . . . . . . . . . . . . . . . . . . . . . . . . . . . . . . . . . . . . . . . . . . . . . . . . . . . . . . . . . . . . . . . . . . . . . . . . . . . . . . . 132.3.3 Linking trade and business registers.. . . . . . . . . . . . . . . . . . . . . . . . . . . . . . . . . . . . . . . . . . . . . . . . . . . . . . . . . . . . . . . . . . . . . . . . . . . . . . . . . . . . . . . . 132.3.4 Statistical unit. . . . . . . . . . . . . . . . . . . . . . . . . . . . . . . . . . . . . . . . . . . . . . . . . . . . . . . . . . . . . . . . . . . . . . . . . . . . . . . . . . . . . . . . . . . . . . . . . . . . . . . . . . . . . . . . . 132.3.5 Matching rates.. . . . . . . . . . . . . . . . . . . . . . . . . . . . . . . . . . . . . . . . . . . . . . . . . . . . . . . . . . . . . . . . . . . . . . . . . . . . . . . . . . . . . . . . . . . . . . . . . . . . . . . . . . . . . . . . 13
ANNEXES
Geonomenclature. . . . . . . . . . . . . . . . . . . . . . . . . . . . . . . . . . . . . . . . . . . . . . . . . . . . . . . . . . . . . . . . . . . . . . . . . . . . . . . . . . . . . . . . . . . . . . . . . . . . . . . . . . . . . . . . . . 17
Activity sectors.. . . . . . . . . . . . . . . . . . . . . . . . . . . . . . . . . . . . . . . . . . . . . . . . . . . . . . . . . . . . . . . . . . . . . . . . . . . . . . . . . . . . . . . . . . . . . . . . . . . . . . . . . . . . . . . . . . . . . 21
Products.. . . . . . . . . . . . . . . . . . . . . . . . . . . . . . . . . . . . . . . . . . . . . . . . . . . . . . . . . . . . . . . . . . . . . . . . . . . . . . . . . . . . . . . . . . . . . . . . . . . . . . . . . . . . . . . . . . . . . . . . . . . . . . 23
Part II
Tables.. . . . . . . . . . . . . . . . . . . . . . . . . . . . . . . . . . . . . . . . . . . . . . . . . . . . . . . . . . . . . . . . . . . . . . . . . . . . . . . . . . . . . . . . . . . . . . . . . . . . . . . . . . . . . . . . . . . . . . . . . . . . . . . . . 27


NACE: Introduction and background
chapter 1part I


�External Trade by Enterprise Characteristics – Results of the Standardisation exercise 2006
1. Introduction
International.trade.statistics.are.among.the.most.consulted.statistics.by.public.and.private.users..Throughout.their.long.history,.their.basic.character.has.remained.unchanged..Their.purpose.is.to.answer.questions.like.“which.products.coun-tries.are.importing.from.or.exporting.to.other.countries?”.From.this.perspective.it.is.obvious.that.the.key.dimensions.in.trade.statistics.are.thus.partner.country.and.product..This.can.be.seen.also.in.the.methodology.of.trade.statistics:.interna-tional.concepts.and.classifications.to.define.these.data.elements.are.largely.harmonised.
However,.it.has.been.more.difficult.to.reply.a.question.“what.kind.of.businesses.are.behind.these.trade.flows?”.Trade.sta-tistics.do.not.present.by.nature.any.explicit.information.on.the.characteristics.of.traders..On.the.other.hand,.vast.amount.of.data.on.the.structure.and.evolution.of.businesses. is.available. in.the.frame.of.business.statistics,.but.their.variables,.concepts.and.classifications.differ.from.those.applied.in.trade.statistics..
From.the.analytical.viewpoint,.trade.statistics.by.enterprise.characteristics.offer.many.attractive.features..They.link.trade.statistics.closer.to.business.statistics.and.allow.to.answer.questions.like.“what.is.the.contribution.of.different.economic.sectors.to.trade.or.the.share.of.total.trade.that.small-.and.medium-sized.enterprises.account.for?”.Users.of.trade.statistics.would.benefit.from.new.information.on.the.profiles.of.traders.while.statistics.on.businesses.could.be.complemented.with.import.and.export.data..
Coherent.compilation.of.trade.statistics.by.enterprise.characteristics.requires.micro.level.data.linkage..This.can.be.done.by.establishing.a.linkage.between.trade.registers.and.business.registers..When.key.enterprise.characteristics.from.the.busi-ness.registers.–.most.notably.activity.sector.and.number.of.employees.–.are.combined.with.typical.trade.variables.such.as.product.code.and.partner.country,.a.more.complete.and.diversified.overview.on.the.structure.of.trade.can.be.made.available..
This.report.presents.main.findings.of.the.third.“Standardisation.exercise”,.a.pilot.study.co-ordinated.by.Eurostat..The.first.two.studies.were.launched.in.2002.and.20051..The.main.objective.of.the.study.was.to.obtain.information.on.profiles.of.European.traders.by.using.harmonised.methodology,.classifications.and.breakdowns..In.this.third.study.some.changes.to.methodology.were.introduced..Breakdowns.were.harmonised.and.indicators.on.trade.concentration.and.geographical.allocation.were.revised..Thanks.to.these.revisions,.it.is.now.possible.to.achieve.more.consistency.between.indicators.and.better.comparability.between.participating.countries.
� These reports can be downloaded from Eurostat website: �st report and 2nd report
I

I
10 External Trade by Enterprise Characteristics – Results of the Standardisation exercise 2006
2. Methodological notes
2.1. Methodological notes - indicators
Standardisation.exercise.consists.of.six.indicators..All.indicators.are.calculated.for.total.trade.and.for.three.main.activity.sections:.Industry.(NACE.sections.C.to.E,.divisions.10-41),.Trade.(NACE.section.G,.divisions.50-52).and.Others.(NACE.divisions.01-05,.45,.55-99)2..The.indicators.and.their.further.breakdowns.are.described.below:.
Indicator 1: Trade by activity sectors (tables 1.1 - 1.4)Trade.by.activity.sectors.shows.the.involvement.of.true.economic.sectors:.how.many.enterprises.were.trading.and.the.value.they.accounted.for..The.activities.are.available.at.2-digit.level.of.NACE..A.breakdown.into.two.size-classes.(under.250.and.over.250.employees).is.also.presented..
Indicator 2: Trade by size-classes (tables 2.1 - 2.4)Trade.by.size-classes.describes.the.contribution.of.different.sized.enterprises.to.total.trade..Enterprises.have.been.allo-cated.to.four.size-classes.(0-9,.10-49,.50-249.and.250+).according.to.their.number.of.employees..This.allows.to.analyze.the.impact.of.trade.on.employment.and.to.estimate.the.importance.of.small-and.medium-sized.enterprises..
Indicator 3: Concentration of trade (tables 3.1 - 3.4)Concentration.of.trade.is.measured.by.calculating.top.5,.10,.20,.etc..enterprises’.share.of.trade..
Indicator 4: Trade by partner countries (tables 4.1 – 4.2)Trade.by.partner.countries.shows.how.many.enterprises.were.trading.with.certain.partner.countries.or.zones.and.the.value.they.accounted.for..
Indicator 5: Trade by number of partner countries (tables 5.1 – 5.2)Trade.by.number.of.partner.countries.measures.the.geographical.diversification.of.external.markets..
Indicator 6: Trade by products (tables 6.1 – 6.4)Trade.by.products.(CPA.at.2-digit.level).allocates.the.trade.of.each.commodity.to.the.economic.activity.of.the.trading.enterprise..This.shows.which.sector.was.involved.in.trading.of.each.product..NACE.section.C-E.has.been.split. in.two.groups:.manufacturing.industry.and.other.industries..Manufacturing.industry.is.defined.here.as.the.industry.which.typi-cally.produces.goods.classified.under.given.product.class..For.instance,.for.CPA.product.division.27.(basic.metals),.the.manufacturing.industry.refers.to.NACE.division.27.(manufacture.of.basic.metals).....
For.each.indicator.except.for.table.6,.the.results.are.reported.in.terms.of.number.of.enterprises.(tables.designated.as.“a”).and.in.terms.of.trade.value.(tables.designated.as.“b”)..Intra-EU.(arrivals.and.dispatches).and.extra-EU.(imports.and.ex-ports).trade.flows.are.reported.separately3.
2 For details on activity, see chapter 2.2.4.
� Number of enterprises in intra-and extra-EU trade are not comparable to each other. See chapter 2.2.2 for details.

11External Trade by Enterprise Characteristics – Results of the Standardisation exercise 2006
2.2. Methodological notes - data
2.2.1 Data availability
The.following.countries.have.been.involved.in.this.project:.Belgium,.Czech.Republic,.Denmark,.Germany,.Estonia,.France,.Italy,.Cyprus,.Latvia,.Lithuania,.Luxembourg,.Hungary,.Austria,.Poland,.Slovenia,.Slovakia,.Finland,.Sweden,.Norway.and.Iceland4...
2.2.2 Trade data
The.reference.year.is.2003.
Data. on. intra-EU. and. extra-EU. trade. are. treated. separately,. due. to. different. data. collection. systems. and. thresholds5..Extra-EU.trade.statistics.are.collected.on.the.basis.of. the.statistical.part.of. the.single.administrative.document.(SAD).provided.by.the.Customs.authorities.
Intra-EU.trade.statistics.are.collected.on.the.basis.of.the.Intrastat.declarations.provided.by.the.trade.operators.not.ex-empted.from.the.statistical.obligation..Intra-EU.trade.data.does.not.include.data.of.enterprises.whose.annual.value.of.trade.remains.below.exemption.threshold..These.enterprises.are.mostly.small.and.medium-sized.ones..Therefore.results.for.intra-.and.extra-EU.trade,.in.particular.in.terms.of.number.of.enterprises,.are.not.fully.comparable.to.each.other.and.should.be.interpreted.with.caution.
Because.the.data.refers.to.year.before.the.recent.EU.enlargement,.intra-EU.trade.covers.the.trade.between.EU15.Member.States..The.trade.flows.of.EU15.Member.States.(BE,.DK,.DE,.FR,.IT,.LU,.AT,.FI,.SE).with.10.new.Member.States.and.with.third.countries.are.treated.as.extra-EU.trade6..Total.trade.of.these.countries,.in.terms.of.value,.can.be.compiled.by.adding.intra-.and.extra-EU.trade..Total.figures.in.terms.of.number.of.enterprises.cannot.be.calculated.by.adding.intra-.and.extra-EU.trade.as.the.target.populations.are.not.mutually.exclusive.(i.e..the.same.enterprise.can.be.a.trader.in.both.intra-.and.extra-EU.trade).
The.data.of.new.Member.States.(CZ,.EE,.LV,.LT,.HU,.PL,.SI,.SK).and.Efta.Countries.(NO.and.IS).with.all.trading.partners.are.reported.under.extra-EU.trade..These.figures.correspond.to.total.trade.of.those.countries..
2.2.3 Trade concept
Trade.data.is.compiled.according.to.the.EU.harmonised.concept.(special.trade),.including.processing..
2.2.4 Economic activity
The.classification.of.activities. is.NACE.Rev..1.1,.which.is.designed.to.categorise.data.related.to.statistical.units.. In.the.frame.of.external.trade.statistics,.the.NACE.Rev..1.1.classification.refers.to.the.economic.activity.of.the.trade.operators7.
2.2.5 Classification of products
CPA.(classification.of.products.by.activity).distinguishes.each.type.of.goods.and.services.in.such.a.way.that.it.is.normally.produced.by.only.one.activity.as.defined.in.NACE.Rev.1.1..The.link.between.the.CPA.and.NACE.Rev..1.1.can.be.seen.in.the.coding..At.all.levels.of.the.CPA,.the.coding.of.the.first.4.digits.is.identical.with.that.used.in.NACE.Rev..1.1�..
External.trade.statistics.by.CPA.can.be.derived.by.using.the.correspondence.table.between.the.product.classification.used.in.external.trade.statistics,.the.Combined.Nomenclature,.and.the.CPA..
4 See chapter 2.2.�0 for details on data availability for each country.
� More information on the methodology of external trade statistics is available on Eurostat website
� See chapter 2.2.�0 for special treatment of Cyprus data.
� See Annex 2 for the list of activities.
� See Annex � for the list of products.
I

I
12 External Trade by Enterprise Characteristics – Results of the Standardisation exercise 2006
2.2.6 Number of employees
The.number.of.employees.is.defined.as.those.persons.who.work.for.an.employer.and.who.have.a.contract.of.employment.and.receive.compensation.in.the.form.of.wages,.salaries,.fees,.gratuities,.piecework.pay.or.remuneration.in.kind..The.an-nual.average.should.be.considered,.and.not.employment.on.a.particular.date..The.number.of.employees.must.be.measured.in.head.counts.and.not.in.full-time.equivalents....
2.2.7 Geographical breakdown
The.Geonomenclature.2003.is.used.as.a.reference.for.all.geographical.breakdowns9.
2.2.8 Confidentiality
The.disclosure.of.confidential.data.has.been.done.by.aggregating.two.or.more.cells.into.one.cell..In.some.cases.additional.disclosure.has.been.done.by.hiding.cells.where.the.number.of.traders.was.less.than.three..In.addition,.secondary.confi-dentiality.has.been.applied...
2.2.9 Data presentation
There.may.be.inconsistencies.in.certain.indicators..For.instance,.the.sum.of.components.may.differ.from.the.total.or.there.may.be.differences.between.tables..These.are.caused.by.rounding.or.inclusion/exclusion.of.unknown.activities.or.size-classes.in.the.aggregate.
2.2.10 Country notes
Belgium:.. Indicators.3.and.5.are.not.available..Only.trade.value. is.available. for. indicators.1.and.2..No.data. for.NACE.sectors.A,.B.and.L.10
Czech Republic:..No.data.for.NACE.sectors.A,.B.and.L.
Denmark:.. Intra-EU.indicators.include.adjustment.for.non-response.that.is.allocated.to.unknown.activity.sector.and.size-class..
Germany:.. All.indicators.are.available.only.for.intra-EU.trade.
France:.. Data.are.calculated.according.to.the.national.concept,.i.e..arrivals.and.imports.are.compiled.according.to.the.country.of.origin..Therefore.the.trade.value.and.the.number.of.enterprises.trading.with.intra-EU.trading.partners.are.underestimated.in.tables.4.1a.and.4.1b..Also,.the.figures.presented.in.tables.5.1a.and.5.1b.are.not.comparable.with.the.respective.figures.of.other.Member.States..
Italy:.. No.data.for.NACE.sectors.A,.B.and.L.
Cyprus:.. Reference.year.is.2004..Due.to.the.change.of.data.collection.system.in.the.middle.of.the.reference.year,.part.of.the.data.allocated.to.intra-EU.trade.is.collected.via.customs.declarations..Therefore.the.number.of.enterprises.active.in.intra-EU.trade.is.overestimated.
No.data.for.NACE.sectors.A,.B.and.L.
Poland:.No.data.for.NACE.sectors.A,.B.and.L.
Slovenia:.No.data.for.NACE.sectors.A,.B.and.L.
Iceland:.Indicators.3,.4,.5.and.6.are.not.available.
� See Annex � for the list of codes and contents of aggregated zones.
�0 Belgium data are affected by indirect trade, i.e. trade declared in Belgium by fiscal representatives which are representing foreign companies.

I
13External Trade by Enterprise Characteristics – Results of the Standardisation exercise 2006
2.3. Methodological notes – registers
2.3.1 Business Registers
EEC.Council.Regulation.No.21�6/93.on.business.registers.for.statistical.purposes.requires.Member.States.to.set.up.busi-ness.registers.of.all.enterprises.carrying.out.economic.activities.contributing.to. the.gross.domestic.product.as.well.as.their.dependent.local.units.and.the.legal.units.responsible.for.those.enterprises..Business.registers.contain.essential.iden-tification.information,.such.as.name.and.address,.and.stratification.information,.such.as.number.of.employees.and.main.economic.activity.of.businesses..All.statistical.units.should.be.recorded,.with.the.exception.of.NACE.Rev..1.1.sectors.A.(01.agriculture.and.hunting,.02.forestry),.B.(05.fishing).and.L.(75.public.administration.and.defence;.compulsory.social.security),.whose.inclusion.is.optional.................
2.3.2 Trade Registers
EC.Regulation.No.63�/2004,.the.Basic.Regulation.for.the.statistics.between.Member.States,.together.with.various.Imple-menting.Regulations,.requires.Member.States.to.set.up.a.register.of.intra-Community.trade.operators..The.unit.of.refer-ence,.i.e..trade.operator,.is.generally.the.legal.unit,.although.the.regulations.do.not.define.it.explicitly..The.register.of.extra-Community.trade.operators.is.not.mandatory.according.to.the.Basic.Regulation.for.the.statistics.on.the.European.Union’s.trade.with.non-member.countries.(Council.Regulation.No.1172/95)..However,.many.Member.States.have.established.a.special.register.of.extra-.Community.traders..The.reference.unit.for.extra-Community.traders.is.likewise.the.legal.unit.
2.3.3 Linking trade and business registers
The.regulation.concerning.business.registers.defines. the. link.between.the.business.registers.and. the. intra-.and.extra-Community.trade.operators..The.business.registers.regulation.includes.a.requirement.for.specific.variables.to.be.kept.at.legal.unit.level.referring.to.“intra-Community.operators”.and.to.“other.associated.files,.including.customs.files”.(variables.1k.and.1j,.respectively)..Thus.the.possible.link.between.registers.can.be.obtained.through.a.common.unit.of.reference:.the.legal.unit..The.same.regulation.also.defines.the.link.between.the.legal.unit.and.the.enterprise.
2.3.4 Statistical unit
The.statistical.unit.is.the.enterprise..The.Council.Regulation.(EEC).No.696/93.–.statistical.units.for.the.observation.and.analysis.of.the.production.system.in.the.Community.–.defines.it.as.“the.smallest.combination.of.legal.units.that.is.an.organisational.unit.producing.goods.or.services,.which.benefits.form.a.certain.degree.of.autonomy.in.decision-making,.especially.for.the.allocation.of.its.current.resources..An.enterprise.carries.out.one.or.more.activities.at.one.or.more.loca-tions..An.enterprise.may.be.a.sole.legal.unit”.
2.3.5 Matching rates
The.matching.rate.indicates.how.big.share.of.trade.operators.recorded.in.trade.registers.can.be.successfully.linked.with.enterprises.in.business.register..Matching.may.be.impaired.by.various.reasons..The.most.common.ones.are.differences.in.coverage.of.registers.or.missing.common.identifier.

I
14 External Trade by Enterprise Characteristics – Results of the Standardisation exercise 2006
Arrivals Dispatches Imports ExportsReporting country Value Number of
tradersValue Number of
tradersValue Number of
tradersValue Number of
tradersBE 97.0% 100.0% 98.0% 99.9% 100.0% 100.0% 98.0% 100.0%CZ - - - - : 87.5% : 92.6%DK 96.0% 100.0% 96.7% 100.0% 97.7% 100.0% 95.4% 100.0%DE 71.0% 88.8% 78.5% 89.5% : : : :EE - - - - 100.0% 100.0% 100.0% 100.0%FR : : : : : : : :IT 95.3% 95.9% 96.1% 97.5% 98.7% 95.5% 96.7% 94.1%CY 82.0% 66.9% 60.8% 71.3% 77.3% 66.6% 39.8% 57.4%LV - - - - 98.3% 90.6% 99.6% 95.8%LT - - - - 96.6% 100.0% 98.5% 100.0%LU 97.2% 100.0% 97.2% 99.9% 100.0% 99.9% 100.0% 100.0%HU - - - - 100.0% 100.0% 100.0% 100.0%AT 94.4% 99.4% 98.2% 99.8% 83.2% 94.1% 84.6% 94.8%PL - - - - 99.6% 100.0% 99.7% 100.0%SI - - - - 99.6% 75.9% 99.9% 93.9%SK - - - - 99.9% 99.3% 100.0% 99.7%FI 96.0% 99.2% 98.7% 99.8% 99.2% 98.0% 98.7% 98.4%SE 96.8% 98.4% 97.6% 98.2% 92.5% 83.3% 97.0% 88.1%NO - - - - 92.4% 97.6% 69.2% 98.6%IS - - - - 97.6% 37.9% 98.5% 79.3%
Notes:: = Data not available- = Data not applicable

NACE: Introduction and background
chapter 1
ANNEXES


External trade by Enterprise Characteristics – Results of Standardisation exercise 2006 17
Annex 1
Geonomenclature
5110 European UnionAT 038 Austria GR 009 GreeceBE 017 Belgium IE 007 IrelandDE 004 Germany IT 005 ItalyDK 008 Denmark LU 018 LuxembourgES 011 Spain NL 003 NetherlandsFI 032 Finland PT 010 PortugalFR 001 France SE 030 SwedenGB 006 United Kingdom
5190 Other European countriesAD 043 Andorra LV 054 LatviaAL 070 Albania MD 074 Moldova, Republic ofBA 093 Bosnia and Herzegovina MK 096 Former Yugoslav Republic of MacedoniaBG 068 Bulgaria MT 046 MaltaBY 073 Belarus NO 028 NorwayCH 039 Switzerland PL 060 PolandCY 600 Cyprus RO 066 RomaniaCZ 061 Czech Republic RU 075 Russian FederationEE 053 Estonia SI 091 SloveniaFO 041 Faroe Islands SK 063 SlovakiaGI 044 Gibraltar SM 047 San MarinoHR 092 Croatia TR 052 TurkeyHU 064 Hungary UA 072 UkraineIS 024 Iceland VA 045 Holy See (Vatican City State)LI 037 Liechtenstein YU 094 YugoslaviaLT 055 Lithuania
5210 North AfricaDZ 208 Algeria TN 212 TunisiaEG 220 Egypt XC 021 CeutaLY 216 Libyan Arab Jamahiriya XL 023 MelillaMA 204 Morocco
5290 Other African countriesAO 330 Angola GQ 310 Equatorial GuineaBF 236 Burkina Faso GW 257 Guinea-BissauBI 328 Burundi IO 357 British Indian Ocean TerritoryBJ 284 Benin KE 346 KenyaBW 391 Botswana KM 375 ComorosCD 322 Congo, Democratic Republic of LR 268 LiberiaCF 306 Central African Republic LS 395 LesothoCG 318 Congo MG 370 MadagascarCI 272 Côte d’Ivoire ML 232 MaliCM 302 Cameroon MR 228 MauritaniaCV 247 Cape Verde MU 373 MauritiusDJ 338 Djibouti MW 386 MalawiER 336 Eritrea MZ 366 MozambiqueET 334 Ethiopia NA 389 NamibiaGA 314 Gabon NE 240 NigerGH 276 Ghana NG 288 NigeriaGM 252 Gambia RW 324 RwandaGN 260 Guinea SC 355 Seychelles

18
Annex 1
5290 SD 224 Sudan TG 280 TogoSH 329 Saint Helena TZ 352 Tanzania, United Republic ofSL 264 Sierra Leone UG 350 UgandaSN 248 Senegal YT 377 MayotteSO 342 Somalia ZA 388 South AfricaST 311 Sao Tome and Principe ZM 378 ZambiaSZ 393 Swaziland ZW 382 ZimbabweTD 244 Chad
5310 North AmericaCA 404 Canada PM 408 Saint Pierre and MiquelonGL 406 Greenland US 400 United States
5320 Central America and CaribbeanAG 459 Antigua and Barbuda HT 452 HaitiAI 446 Anguilla JM 464 JamaicaAN 478 Netherlands Antilles KN 449 St Kitts and NevisAW 474 Aruba KY 463 Cayman IslandsBB 469 Barbados LC 465 St LuciaBM 413 Bermuda MS 470 MontserratBS 453 Bahamas MX 412 MexicoBZ 421 Belize NI 432 NicaraguaCR 436 Costa Rica PA 442 PanamaCU 448 Cuba SV 428 El SalvadorDM 460 Dominica TC 454 Turks and Caicos IslandsDO 456 Dominican Republic TT 472 Trinidad and TobagoGD 473 Grenada VC 467 St Vincent and the GrenadinesGT 416 Guatemala VG 468 Virgin Islands, BritishHN 424 Honduras VI 457 Virgin Islands (US)
5330 South AmericaAR 528 Argentina GY 488 GuyanaBO 516 Bolivia PE 504 PeruBR 508 Brazil PY 520 ParaguayCL 512 Chile SR 492 SurinameCO 480 Colombia UY 524 UruguayEC 500 Ecuador VE 484 VenezuelaFK 529 Falkland Islands
5410 Near and Middle Eastern countriesAE 647 United Arab Emirates KW 636 KuwaitAM 077 Armenia LB 604 LebanonAZ 078 Azerbaijan OM 649 OmanBH 640 Bahrain PS 625 Occupied Palestinian TerritoryGE 076 Georgia QA 644 QatarIL 624 Israel SA 632 Saudi ArabiaIQ 612 Iraq SY 608 Syrian Arab RepublicIR 616 Iran, Islamic Republic of YE 653 YemenJO 628 Jordan
5490 Other Asian countriesAF 660 Afghanistan ID 700 IndonesiaBD 666 Bangladesh IN 664 IndiaBN 703 Brunei Darussalam JP 732 JapanBT 675 Bhutan KG 083 KyrgyzstanCN 720 China, People’s Republic of KH 696 CambodiaHK 740 Hong Kong KP 724 Korea, Democratic People’s Republic of

External trade by Enterprise Characteristics – Results of Standardisation exercise 2006 1�
Annex 1
5490 KR 728 Korea, Republic of PH 708 PhilippinesKZ 079 Kazakhstan PK 662 PakistanLA 684 Lao People’s Democratic Republic SG 706 SingaporeLK 669 Sri Lanka TH 680 ThailandMM 676 Myanmar TJ 082 TajikistanMN 716 Mongolia TL 626 East Timor
MO 743 Macao TM 080 TurkmenistanMV 667 Maldives TW 736 TaiwanMY 701 Malaysia UZ 081 UzbekistanNP 672 Nepal VN 690 Viet-Nam
5500 Oceania and Polar regionsAU 800 Australia NF 836 Norfolk IslandCC 833 Cocos Islands (or Keeling Islands) NU 838 Niue
CK 837 Cook Islands NZ 804 New ZealandCX 834 Christmas Island TK 839 TokelauHM 835 Heard Island and McDonald Islands PF 822 French Polynesia
AQ 891 Antarctica PG 801 Papua New GuineaAS 830 American Samoa PN 813 PitcairnBV 892 Bouvet Island PW 825 PalauFJ 815 Fiji SB 806 Solomon IslandsFM 823 Micronesia, Federated States of TF 894 French Southern Territories
GS 893 South Georgia and South Sandwich Islands TO 817 Tonga
GU 831 Guam TV 807 TuvaluKI 812 Kiribati UM 832 United States Minor Outlying IslandsMH 824 Marshall Islands VU 816 VanuatuMP 820 Northern Mariana Islands WF 811 Wallis and FutunaNC 809 New Caledonia WS 819 SamoaNR 803 Nauru
5900 Miscellaneous - countries not specified and countries not determined
QR 951 Stores and provisions within the framework of intra-Community trade
QU 958 Countries and territories not specified
QV 959 Countries and territories not specified in the framework of intra-Community trade
QY 978 Countries and territories not specified for commercial or military reasons in the framework of intra-Commu-nity trade
QS 952 Stores and provisions within the framework of trade with third countries
QZ 979 Countries and territories not specified for commercial or military reasons in the framework of trade with third countries
QW 960 Countries and territories not specified within the framework of trade with third countries
QX 977 Countries and territories not specified for commercial or military reasons
QQ 950 Stores and provisions
1330 MERCOSUR (South American Common Market)
AR 528 Argentina PY 520 ParaguayBR 508 Brazil UY 524 Uruguay
1415 DAEs (Dynamic Asian economies)HK 740 Hong Kong SG 706 SingaporeKR 728 Korea, Republic of TH 680 ThailandMY 701 Malaysia TW 736 Taiwan


External trade by Enterprise Characteristics – Results of Standardisation exercise 2006 21
Annex 2
Activity sectors
Activity Label NoteTotal All activities Aggregate of all activities (01-99)C-E Industry Aggregate of activities 10-41G Trade Aggregate of activities 50-52Others Other activities Aggregate of activities 01-05, 45, 55-9901-05 Agriculture, forestry and fishing Aggregate of activities 01 (agriculture), 02 (forestry), 05 (fishing)10-14 Mining and quarrying Aggregate of activities 10 (Mining of coal and lignite), 11 (Extraction of
crude petroleum and natural gas), 12 (Mining of uranium and thorium ores), 13 (Mining of metal ores), 14 (Other mining and quarrying)
15-16 Manufacture of food products, beverages and tobacco Aggregate of activities 15 (Manufacture of food products and bevera-ges), 16 (Manufacture of tobacco products)
17 Manufacture of textiles18 Manufacture of wearing apparel19 Manufacture of leather and leather products20 Manufacture of wood and wood products21 Manufacture of pulp, paper and paper products22 Publishing, printing and reproduction of recorded media23 Manufacture of coke, refined petroleum products and nuclear
fuel24 Manufacture of chemicals, chemical products and man-made
fibres25 Manufacture of rubber and plastic products26 Manufacture of other non-metallic mineral products27 Manufacture of basic metals28 Manufacture of fabricated metal products29 Manufacture of machinery and equipment30 Manufacture of office machinery and computers31 Manufacture of electrical machinery and apparatus32 Manufacture of radio, television and communication equipment
and apparatus33 Manufacture of medical, precision and optical instruments,
watches and clocks34 Manufacture of motor vehicles, trailers and semi-trailers35 Manufacture of other transport equipment36-37 Manufacturing n.e.c. Aggregate of activities 36 (Manufacture of furniture; manufacturing
n.e.c.), 37 (Recycling)40-41 Manufacture and supply of energy products Aggregate of activities 40(Electricity, gas, steam and hot water supply),
41(Collection, purification and distribution of water) 45 Construction50 Sale, maintenance and repair of motor vehicles and motorcycles51 Wholesale trade and commission trade52 Retail trade60-64 Transport, storage and communication Aggregate of activities 60 (Land transport), 61 (Water transport), 62 (Air
transport), 63 (Supporting and auxiliary transport activities), 64 (Post and telecommunications)
65-67 Financial intermediation Aggregate of activities 65 (Financial intermediation), 66 (Insurance and pension funding), 67 (Activities auxiliary to financial intermediation)

22
Annex 2
Activity Label Note70-74 Real estate, renting and business activities Aggregate of activities 70 (Real estate activities), 71 (Renting of machi-
nery and equipment), 72 (Computer and related activities), 73 (Research and development), 74 (Other business activities)
Others Other services Aggregate of activities 55 (Hotels and restaurants), 75 (Public admi-nistration and defence), 80 (Education), 85 (Health and social work), 90 (Sewage and refuse disposal, sanitation and similar activities ), 91 (Activities of membership organizations), 92 (Recreational, cultural and sporting activities), 93 (Other service activities)
Unknown Unknown Activity 99 (Unknown) or any other reported activity

External trade by Enterprise Characteristics – Results of Standardisation exercise 2006 23
Annex 3
Products
CPA Label Notes01-05 Products of agriculture, hunting and forestry; fish and other
fishing productsAggregate of products 01 (Products of agriculture, hunting , 02 (Pro-ducts of forestry, logging) and 05 (Fish and other fishing products)
10-14 Products from mining and quarrying Aggregate of products 10 (Coal and lignite; peat), 11 (Crude petroleum and natural gas), 12 (Uranium and thorium ores) , 13 (Metal ores) and 14 (Other mining and quarrying products)
15-16 Food products, beverages and tobacco Aggregate of products 15 (Food products and beverages) and 16 (Tobacco products)
17 Textiles18 Wearing apparel19 Leather and leather products20 Wood and products of wood21 Pulp, paper and paper products22 Printed matter and recorded media23 Coke, refined petroleum products and nuclear fuel24 Chemicals, chemical products25 Rubber and plastic products26 Other non metallic mineral products27 Basic metals28 Fabricated metal products29 Machinery and equipment30 Office machinery and computers31 Electrical machinery and apparatus32 Radio, television and communication equipment and apparatus33 Medical, precision and optical instruments; watches and clocks34 Motor vehicles, trailers and semi-trailers35 Other transport equipment36 Furniture; other manufactured goods40 Electrical energy, gas, steam and waterOthers Other productsUnknown Unknown products


NACE: Introduction and background
chapter 1
Tables
part II


27External Trade by Enterprise Characteristics – Results of the Standardisation exercise 2006
Tables II
Table 1.1a: Arrivals by activity sector and size-class (number of enterprises) – Part 1
Number of enterprises
Activity sectorReporting country and size-class
BE DK DE FR IT
Total 0-249 250+ Total 0-249 250+ Total 0-249 250+ Total 0-249 250+ Total 0-249 250+
Total 18,735 : : 8,525 8,151 367 41,148 31,631 3,037 53,898 48,871 3,224 42,128 40,169 1,959
C-E : : : 2,410 2,198 212 13,570 10,475 2,115 18,296 16,169 2,064 21,840 20,411 1,429
10-14 : : : 17 .. .. 84 72 8 100 87 13 34 31 3
15-16 : : : 247 207 40 1,180 854 221 2,173 1,866 296 2,204 2,082 122
17 : : : 110 .. .. 676 571 54 1,074 1,020 49 1,889 1,801 88
18 : : : 66 .. .. 414 349 31 839 801 33 922 875 47
19 : : : 14 .. .. 174 152 8 317 296 21 718 693 25
20 : : : 97 89 8 378 314 29 709 674 30 1,358 1,347 11
21 : : : 68 62 6 471 344 96 625 532 93 613 575 38
22 : : : 83 74 9 390 308 57 949 870 76 560 519 41
23 : : : 4 .. .. 30 18 7 45 30 15 62 49 13
24 : : : 117 101 16 880 661 154 1,312 1,059 243 1,527 1,382 145
25 : : : 211 197 14 1,044 841 134 1,468 1,316 147 1,615 1,553 62
26 : : : 87 74 13 697 550 77 627 539 87 806 722 84
27 : : : 46 40 6 389 285 87 406 307 96 671 603 68
28 : : : 237 223 14 1,477 1,156 211 2,185 2,022 158 2,102 2,016 86
29 : : : 420 390 30 2,243 1,752 369 1,899 1,706 189 2,928 2,703 225
30 : : : 15 15 0 97 73 14 60 49 11 129 124 5
31 : : : 99 87 12 688 493 159 585 470 113 902 824 78
32 : : : 59 54 5 251 178 50 370 305 65 328 279 49
33 : : : 113 102 11 645 531 71 632 567 65 563 530 33
34 : : : 41 37 4 397 241 134 515 403 110 470 374 96
35 : : : 30 27 3 137 99 29 260 197 63 261 224 37
36-37 : : : 207 197 10 767 613 82 1,125 1,042 81 1,071 1,020 51
40-41 : : : 22 17 5 61 20 33 21 11 10 107 85 22
G : : : 5,146 5,088 58 21,692 18,423 621 29,451 28,676 668 18,183 17,931 252
50 : : : 318 313 5 1,421 1,146 37 2,204 2,166 32 1,784 1,772 12
51 : : : 4,339 4,307 32 14,123 12,293 293 20,980 20,539 359 14,056 13,946 110
52 : : : 489 468 21 6,148 4,984 291 6,267 5,971 277 2,343 2,213 130
Other act. : : : 969 865 97 5,886 2,733 301 6,151 4,026 492 2,105 1,827 278
01-05 : : : 88 88 0 296 235 3 803 677 13 : : :
45 : : : 126 111 15 579 489 24 1,104 990 108 493 447 46
60-64 : : : 106 83 23 224 152 46 319 229 88 330 248 82
65-67 : : : 22 19 3 70 38 22 92 66 25 115 84 31
70-74 : : : 312 291 21 4,223 1,540 97 1,908 1,731 158 907 839 68
Others : : : 92 57 35 494 279 109 438 326 100 260 209 51
Unknown : : : 223 216 0 0 0 0 1,487 7 0 0 0 0
: = Data not available.. = Confidential data

28 External Trade by Enterprise Characteristics – Results of the Standardisation exercise 2006
TablesII
Table 1.1a: Arrivals by activity sector and size-class (number of enterprises) – Part 2
Number of enterprises
Activity sectorReporting country and size-class
CY LU AT FI SE
Total 0-249 250+ Total 0-249 250+ Total 0-249 250+ Total 0-249 250+ Total 0-249 250+
Total 10,323 5,167 52 4,294 4,190 104 17,399 16,567 832 8,283 7,627 438 12,671 11,987 684
C-E 989 979 10 386 358 28 4,321 3,884 437 2,270 2,010 233 3,693 3,306 387
10-14 18 18 0 6 6 0 36 .. .. 11 .. .. 22 .. ..
15-16 153 145 8 49 .. .. 372 334 38 169 145 24 290 254 36
17 44 44 0 9 .. .. 203 192 11 108 103 3 121 115 6
18 70 70 0 .. .. .. 91 86 5 88 85 3 50 .. ..
19 26 26 0 0 0 0 49 45 4 31 .. .. 15 .. ..
20 32 32 0 12 .. .. 327 308 19 75 66 9 126 113 13
21 29 29 0 .. .. .. 92 72 20 75 52 23 146 106 40
22 60 60 0 39 .. .. 147 137 10 116 100 12 184 170 14
23 .. .. .. 0 0 0 5 5 0 2 .. .. 12 8 4
24 42 42 0 13 .. .. 210 187 23 119 94 19 218 193 25
25 45 .. .. 21 16 5 275 250 25 187 174 13 301 291 10
26 114 114 0 25 .. .. 280 257 23 92 76 12 109 92 17
27 0 0 0 7 .. .. 96 64 32 37 28 9 100 76 24
28 122 122 0 103 .. .. 570 529 41 266 255 10 452 434 18
29 55 55 0 23 .. .. 662 585 77 350 312 34 607 544 63
30 .. .. .. 0 0 0 16 .. .. 8 .. .. 25 .. ..
31 29 29 0 12 12 0 194 170 24 106 96 10 186 171 15
32 .. .. .. .. .. .. 73 55 18 68 54 14 74 58 16
33 9 9 0 15 .. .. 128 122 6 90 79 11 160 143 17
34 15 15 0 9 9 0 109 94 15 54 47 6 155 121 34
35 6 6 0 .. .. .. 26 21 5 59 51 7 84 75 9
36-37 112 112 0 22 22 0 298 281 17 138 133 5 212 204 8
40-41 4 .. .. 12 11 .. 62 40 22 21 12 6 44 32 12
G 3,457 3,451 6 2,392 2,385 7 10,358 10,191 167 4,926 4,680 82 7,324 7,214 110
50 370 370 0 289 .. .. 674 654 20 396 377 9 480 471 9
51 1,171 1,168 3 1,077 .. .. 6,793 6,719 74 3,571 3,397 36 5,561 5,509 52
52 1,916 1,913 3 1,026 .. .. 2,891 2,818 73 959 906 37 1,283 1,234 49
Other act. 5,877 737 36 1,516 1,447 69 2,720 2,492 228 1,087 937 123 1,654 1,467 187
01-05 : : : 44 44 0 145 .. .. 104 .. .. 189 183 6
45 210 206 4 553 543 10 600 553 47 242 229 12 271 240 31
60-64 151 145 6 131 122 9 308 271 37 141 105 33 141 102 39
65-67 20 16 4 88 67 21 43 .. .. 24 .. .. 20 16 4
70-74 159 155 4 263 252 11 1,192 1,159 33 359 322 24 571 539 32
Others 233 215 18 191 173 18 432 342 90 213 160 48 194 119 75
Unknown 5,104 0 0 246 246 0 0 0 0 4 2 0 268 268 0
: = Data not available.. = Confidential data

2�External Trade by Enterprise Characteristics – Results of the Standardisation exercise 2006
Tables II
Table 1.1b: Arrivals by activity sector and size-class (€ million) – Part 1
€ million
Activity sectorReporting country and size-class
BE DK DE FR IT
Total 0-249 250+ Total 0-249 250+ Total 0-249 250+ Total 0-249 250+ Total 0-249 250+
Total 142,830 88,310 54,510 34,874 21,819 8,309 211,754 89,776 97,040 218,870 106,337 107,928 145,218 84,169 61,049
C-E 49,981 14,328 35,654 9,025 4,159 4,866 86,798 19,736 63,898 108,196 33,647 73,960 68,817 34,052 34,765
10-14 34 29 5 54 .. .. 599 94 15 142 79 62 910 67 843
15-16 5,967 2,600 3,366 1,497 600 896 7,657 3,678 3,516 12,041 4,218 7,814 8,271 5,100 3,170
17 1,403 751 652 247 .. .. 1,210 722 453 2,509 1,806 695 2,148 1,479 669
18 293 214 79 87 .. .. 1,097 435 638 1,563 1,102 431 736 454 281
19 71 42 30 81 .. .. 521 232 274 629 343 285 1,127 1,021 106
20 618 409 209 259 121 138 598 348 221 1,134 898 225 1,241 1,135 106
21 1,345 397 948 395 214 181 2,348 634 1,486 3,361 1,139 2,222 2,136 1,079 1,057
22 620 486 134 161 128 34 605 286 271 1,916 1,173 737 1,160 683 476
23 8,366 148 8,218 53 .. .. 3,549 956 2,431 4,000 284 3,716 672 179 492
24 7,522 2,112 5,410 1,077 419 658 10,717 2,333 8,131 18,079 5,653 11,980 17,151 7,548 9,604
25 1,707 870 837 574 342 232 3,624 917 2,502 4,887 2,373 2,493 3,415 2,015 1,400
26 821 462 359 178 128 51 1,020 359 585 1,839 635 1,199 1,121 599 523
27 3,528 638 2,890 242 167 75 2,949 995 1,895 4,901 1,057 3,836 4,755 2,308 2,447
28 1,786 1,343 443 467 317 150 2,486 1,181 1,188 4,353 2,722 1,619 3,238 2,669 569
29 1,818 631 1,187 1,225 572 654 5,554 1,489 3,571 7,981 2,497 5,473 5,746 2,824 2,922
30 64 64 0 19 19 0 1,023 94 901 1,614 382 1,232 566 269 297
31 1,052 233 819 709 110 599 2,363 617 1,687 4,303 1,724 2,566 2,510 934 1,576
32 783 60 723 544 70 474 3,182 360 2,782 4,002 671 3,331 2,154 500 1,654
33 206 129 78 191 124 66 3,657 2,845 756 1,637 680 957 1,082 628 454
34 9,186 934 8,252 171 115 56 21,277 386 20,820 19,359 2,521 16,830 5,084 571 4,513
35 444 64 381 156 33 123 7,838 109 7,713 5,394 335 5,059 1,464 283 1,181
36-37 975 601 375 440 217 224 1,358 595 684 2,297 1,290 1,003 856 668 188
40-41 1,373 1,111 262 197 98 99 1,567 73 1,378 256 63 194 1,274 1,038 236
G 45,878 31,231 14,646 18,650 15,982 2,667 73,740 44,288 24,011 99,541 67,025 31,790 69,948 47,577 22,370
50 9,980 4,311 5,669 2,717 2,273 444 12,388 4,416 7,705 18,509 8,073 10,420 24,363 12,375 11,988
51 29,499 24,418 5,081 14,829 13,155 1,674 51,581 36,517 10,475 69,204 54,426 14,081 41,858 33,304 8,555
52 6,398 2,502 3,896 1,104 554 550 9,771 3,355 5,831 11,828 4,525 7,289 3,726 1,898 1,828
Other act. 46,971 42,751 4,210 7,199 1,677 776 51,217 25,751 9,130 11,133 5,666 2,179 6,454 2,539 3,915
01-05 : : : 39 39 0 194 127 37 434 342 50 : : :
45 504 406 97 108 77 31 281 216 30 668 497 170 367 255 112
60-64 918 464 454 659 254 406 2,018 396 1,529 1,372 624 744 2,597 269 2,328
65-67 337 312 25 59 30 28 582 484 80 435 250 178 550 317 233
70-74 41,781 41,391 390 978 703 275 46,785 23,720 7,192 4,653 3,659 949 2,767 1,623 1,144
Others 3,420 176 3,244 149 113 36 1,358 808 262 383 273 89 174 76 98
Unknown 11 1 0 5,207 461 0 0 0 0 3,188 21 0 0 0 0
: = Data not available.. = Confidential data

30 External Trade by Enterprise Characteristics – Results of the Standardisation exercise 2006
TablesII
Table 1.1b: Arrivals by activity sector and size-class (€ million) – Part 2
€ million
Activity sectorReporting country and size-class
CY LU AT FI SE
Total 0-249 250+ Total 0-249 250+ Total 0-249 250+ Total 0-249 250+ Total 0-249 250+
Total 3,000 2,140 320 10,745 7,205 3,540 54,333 34,773 19,560 22,838 12,578 9,179 46,023 24,281 21,742
C-E 430 266 164 3,608 1,084 2,524 20,580 8,767 11,814 8,112 2,473 5,607 19,445 5,173 14,272
10-14 2 2 0 10 10 0 36 .. .. 11 .. .. 96 .. ..
15-16 122 64 58 203 .. .. 1,283 661 622 643 302 341 1,372 454 917
17 2 2 0 140 .. .. 625 303 323 143 89 54 197 132 65
18 8 8 0 .. .. .. 222 94 128 71 45 26 58 .. ..
19 4 4 0 0 0 0 301 88 214 30 .. .. 41 .. ..
20 18 18 0 65 .. .. 571 247 324 49 25 24 172 72 100
21 18 18 0 .. .. .. 735 293 442 579 70 510 845 186 659
22 11 11 0 84 .. .. 380 143 237 110 60 49 229 148 82
23 .. .. .. 0 0 0 289 289 0 614 .. .. 342 74 268
24 18 18 0 240 .. .. 2,008 1,021 987 896 468 414 2,045 767 1,278
25 21 .. .. 511 112 399 984 558 427 416 197 219 542 456 86
26 32 32 0 151 .. .. 482 294 187 247 83 154 425 188 237
27 0 0 0 1,319 .. .. 967 304 663 667 80 587 1,558 253 1,305
28 28 28 0 143 .. .. 1,055 646 409 302 227 74 623 511 112
29 10 10 0 193 .. .. 2,097 744 1,353 784 296 485 2,050 671 1,379
30 .. .. .. 0 0 0 92 .. .. 7 .. .. 39 .. ..
31 5 5 0 28 28 0 1,047 433 614 440 120 321 475 190 285
32 .. .. .. .. .. .. 1,182 120 1,061 1,196 38 1,158 767 57 710
33 2 2 0 68 .. .. 192 153 39 134 63 70 323 154 169
34 4 4 0 13 13 0 3,635 632 3,003 455 60 394 5,723 292 5,431
35 1 1 0 .. .. .. 503 248 255 83 36 46 282 96 186
36-37 18 18 0 9 9 0 399 262 137 129 94 35 446 213 234
40-41 100 .. .. 290 285 .. 1,495 1,126 369 106 39 66 795 183 612
G 1,850 1,764 86 5,662 4,878 784 29,427 22,493 6,934 13,852 9,708 3,160 23,057 17,265 5,791
50 415 415 0 1,198 .. .. 5,968 3,316 2,652 2,583 2,094 422 3,531 2,907 624
51 1,009 933 76 3,399 .. .. 18,648 16,994 1,654 10,284 7,188 2,189 17,872 13,614 4,258
52 426 416 10 1,065 .. .. 4,810 2,183 2,628 984 425 550 1,654 744 909
Other act. 721 112 70 1,475 1,242 232 4,326 3,513 812 874 397 412 3,521 1,842 1,679
01-05 : : : 14 14 0 78 .. .. 25 .. .. 128 96 32
45 33 30 3 343 322 21 286 233 53 122 94 28 213 119 95
60-64 96 34 61 133 72 61 582 230 353 276 20 244 411 151 260
65-67 25 25 0 147 128 18 48 .. .. 59 .. .. 111 58 53
70-74 12 11 1 193 135 57 3,084 2,843 242 300 213 34 1,584 509 1,075
Others 16 12 4 141 66 75 247 139 108 89 30 59 231 66 165
Unknown 540 0 0 505 505 0 0 0 0 3 3 0 843 843 0
: = Data not available.. = Confidential data

31External Trade by Enterprise Characteristics – Results of the Standardisation exercise 2006
Tables II
Table 1.2a: Imports by activity sector and size-class (number of enterprises) – Part 1
Number of enterprises
Activity sectorReporting country and size-class
BE CZ DK EE FR
Total 0-249 250+ Total 0-249 250+ Total 0-249 250+ Total 0-249 250+ Total 0-249 250+
Total 21,969 : : 57,229 37,478 1,485 17,347 16,903 435 11,120 10,937 183 73,427 65,631 3,380
C-E : : : 14,793 11,772 1,006 4,070 3,858 212 2,333 2,251 82 21,462 19,401 1,990
10-14 : : : 1,079 721 33 28 .. .. 26 23 3 143 131 12
15-16 : : : 815 657 101 262 222 40 172 156 16 1,675 1,454 216
17 : : : 552 454 56 196 .. .. 131 125 6 1,154 1,101 49
18 : : : 600 536 16 160 .. .. 248 237 11 1,415 1,373 35
19 : : : 189 163 12 33 .. .. 46 .. .. 389 367 21
20 : : : 924 726 30 138 130 8 310 304 6 844 810 28
21 : : : 171 145 20 71 65 6 33 .. .. 515 422 92
22 : : : 527 424 15 196 187 9 143 143 0 1,158 1,080 73
23 : : : 6 3 3 5 .. .. 3 .. .. 32 16 16
24 : : : 456 360 37 149 133 16 65 .. .. 1,443 1,186 245
25 : : : 906 807 45 241 228 13 126 123 3 1,257 1,115 141
26 : : : 689 544 69 121 110 11 99 .. .. 658 575 81
27 : : : 225 169 49 59 53 6 6 6 0 350 252 96
28 : : : 2,525 2,069 75 455 440 15 269 .. .. 2,618 2,464 153
29 : : : 1,622 1,374 110 717 687 30 124 121 3 2,186 1,985 193
30 : : : 82 61 6 39 39 0 12 12 0 126 113 13
31 : : : 1,044 781 84 261 249 12 54 51 3 767 649 116
32 : : : 344 230 21 127 122 5 56 53 3 659 591 68
33 : : : 423 358 20 247 236 11 68 .. .. 1,332 1,254 75
34 : : : 244 163 75 54 50 4 20 .. .. 465 355 109
35 : : : 151 106 32 88 85 3 50 .. .. 423 356 66
36-37 : : : 1,112 869 45 391 381 10 227 221 6 1,787 1,704 74
40-41 : : : 107 53 52 32 25 7 45 38 7 66 48 18
G : : : 23,692 16,704 102 9,625 9,567 58 5,283 5,268 15 33,893 33,235 530
50 : : : 2,568 1,325 9 488 483 5 566 .. .. 1,436 1,400 30
51 : : : 11,117 9,085 45 6,955 6,922 33 3,475 .. .. 22,637 22,234 314
52 : : : 10,007 6,294 48 2,182 2,162 20 1,242 1,229 13 9,820 9,601 186
Other act. : : : 18,744 9,002 377 3,652 3,478 165 3,504 3,418 86 18,072 12,995 860
01-05 : : : : : : 244 244 0 293 290 3 1,033 927 9
45 : : : 2,001 1,541 59 341 322 19 481 474 7 1,447 1,352 94
60-64 : : : 2,017 1,334 68 415 377 38 617 601 16 1,338 1,161 169
65-67 : : : 612 310 29 52 44 8 76 70 6 267 202 57
70-74 : : : 5,593 4,084 72 1,477 1,431 46 1,113 1,108 5 6,883 6,550 271
Others : : : 2,716 1,730 149 568 514 54 924 875 49 3,112 2,751 257
Unknown : : : 5,805 3 0 555 546 0 0 0 0 3,992 52 3
: = Data not available.. = Confidential data

32 External Trade by Enterprise Characteristics – Results of the Standardisation exercise 2006
TablesII
Table 1.2a: Imports by activity sector and size-class (number of enterprises) – Part 2
Number of enterprises
Activity sectorReporting country and size-class
IT CY LV LT LU
Total 0-249 250+ Total 0-249 250+ Total 0-249 250+ Total 0-249 250+ Total 0-249 250+
Total 94,154 92,152 2,002 8,034 4,048 48 13,436 13,112 324 11,689 11,330 340 1,897 1,809 88
C-E 44,442 43,012 1,430 689 679 10 2,290 2,191 99 2,385 2,217 164 171 144 27
10-14 90 87 3 8 8 0 37 .. .. 31 31 0 .. .. ..
15-16 1,945 1,841 104 103 95 8 316 287 29 277 239 38 26 .. ..
17 3,900 3,809 91 36 36 0 102 95 7 150 133 17 4 .. ..
18 3,329 3,281 48 46 46 0 181 171 10 250 218 32 0 0 0
19 2,817 2,788 29 14 14 0 30 30 0 27 24 3 0 0 0
20 2,400 2,390 10 30 30 0 386 374 12 320 313 7 .. .. ..
21 753 715 38 25 25 0 38 38 0 42 .. .. .. .. ..
22 962 927 35 35 35 0 161 .. .. 133 .. .. 15 .. ..
23 64 51 13 .. .. .. .. .. .. .. .. .. 0 0 0
24 1,819 1,675 144 37 37 0 73 70 3 64 61 3 10 .. ..
25 2,167 2,106 61 42 .. .. 108 108 0 143 .. .. 14 9 5
26 1,899 1,813 86 69 69 0 98 .. .. 159 153 4 6 .. ..
27 842 774 68 0 0 0 14 .. .. .. .. .. 6 .. ..
28 4,689 4,606 83 77 77 0 166 .. .. 180 .. .. 24 .. ..
29 6,355 6,125 230 38 38 0 102 98 4 117 109 7 16 .. ..
30 300 295 5 .. .. .. .. .. .. 10 10 0 0 0 0
31 2,090 2,011 79 21 21 0 37 33 4 47 44 3 8 8 0
32 905 852 53 .. .. .. 22 22 0 31 27 4 .. .. ..
33 1,638 1,604 34 5 5 0 46 .. .. 53 50 3 12 .. ..
34 626 532 94 10 10 0 16 16 0 11 11 0 4 4 0
35 607 572 35 5 5 0 54 49 5 43 39 4 .. .. ..
36-37 4,108 4,055 53 81 81 0 226 217 9 243 229 14 8 8 0
40-41 137 103 34 3 .. .. 65 58 7 38 21 17 7 .. ..
G 39,747 39,576 171 2,781 2,775 6 6,917 6,887 30 6,163 6,143 20 870 865 5
50 1,464 1,456 8 448 448 0 860 .. .. 1,273 1,270 3 66 .. ..
51 28,312 28,220 92 1,031 1,028 3 3,464 3,456 8 3,386 3,378 8 507 .. ..
52 9,971 9,900 71 1,302 1,299 3 2,593 .. .. 1,504 1,495 9 297 .. ..
Other act. 9,965 9,564 401 4,564 594 32 4,229 4,034 195 3,141 2,970 156 856 800 56
01-05 : : : : : : 400 394 6 230 221 9 8 .. ..
45 1,714 1,672 42 156 153 3 695 677 18 468 444 23 101 .. ..
60-64 1,328 1,223 105 138 132 6 918 892 26 864 839 25 62 55 7
65-67 238 181 57 12 9 3 55 40 15 46 38 8 160 136 24
70-74 4,769 4,646 123 143 138 5 1,038 1,020 18 678 662 9 238 228 10
Others 1,916 1,842 74 177 162 15 1,071 959 112 855 766 82 192 180 12
Unknown 0 0 0 3,938 0 0 52 52 0 0 0 0 95 95 0
: = Data not available.. = Confidential data

33External Trade by Enterprise Characteristics – Results of the Standardisation exercise 2006
Tables II
Table 1.2a: Imports by activity sector and size-class (number of enterprises) – Part 3
Number of enterprises
Activity sectorReporting country and size-class
HU AT PL SI SK
Total 0-249 250+ Total 0-249 250+ Total 0-249 250+ Total 0-249 250+ Total 0-249 250+
Total 37,158 34,078 947 23,939 23,136 803 79,931 77,433 2,498 17,004 16,626 378 29,738 26,092 587
C-E 9,621 8,781 577 5,959 5,521 438 22,639 21,190 1,449 5,183 4,962 221 7,132 6,338 338
10-14 77 .. .. 47 .. .. 156 .. .. 45 .. .. 54 46 7
15-16 867 755 87 391 356 35 1,999 1,746 253 237 214 23 584 525 34
17 433 399 23 302 291 11 1,070 1,006 64 227 211 16 308 268 16
18 609 550 47 158 153 5 1,874 1,800 74 230 222 8 543 492 18
19 212 192 18 75 71 4 499 478 21 83 77 6 187 164 13
20 574 550 11 488 471 17 1,532 1,474 58 296 286 10 566 515 6
21 159 145 11 105 83 22 394 373 21 83 76 7 94 84 6
22 559 519 13 263 252 11 961 932 29 347 341 6 365 331 8
23 5 .. .. 7 .. .. 38 28 10 3 .. .. 6 .. ..
24 335 304 22 226 203 23 911 835 76 109 98 11 168 147 13
25 755 708 25 310 285 25 1,773 1,713 60 496 484 12 450 419 12
26 441 408 22 298 274 24 1,429 1,337 92 221 211 10 334 287 25
27 120 100 18 114 80 34 246 196 50 63 55 8 72 56 14
28 1,269 1,217 16 896 855 41 2,632 2,531 101 1,116 1,102 14 1,154 1,050 20
29 1,003 928 45 883 804 79 1,893 1,785 108 456 439 17 662 594 39
30 54 46 7 28 .. .. 148 .. .. 49 .. .. 38 .. ..
31 389 325 57 251 227 24 747 688 59 260 243 17 403 338 32
32 275 228 32 101 84 17 323 307 16 121 111 10 122 105 10
33 429 410 9 231 225 6 869 840 29 201 197 4 250 222 7
34 202 157 42 121 104 17 493 419 74 59 54 5 95 79 16
35 92 80 10 58 53 5 320 272 48 37 33 4 55 48 6
36-37 644 611 16 551 534 17 2,130 2,024 106 400 384 16 549 485 11
40-41 118 71 42 55 36 19 202 127 75 44 29 15 73 48 21
G 16,830 15,718 57 12,073 11,935 138 37,112 36,931 181 6,546 6,512 34 13,920 12,201 39
50 2,299 2,121 3 582 565 17 6,621 6,607 14 608 604 4 1,035 930 3
51 10,436 9,758 22 7,571 7,503 68 22,344 22,237 107 4,463 4,453 10 7,632 7,018 16
52 4,095 3,839 33 3,920 3,867 53 8,147 8,087 60 1,475 1,455 20 5,253 4,253 20
Other act. 10,707 9,579 313 5,907 5,680 227 20,180 19,312 868 5,273 5,150 123 8,686 7,553 210
01-05 955 876 30 214 .. .. 1,356 1,329 27 : : : 646 567 10
45 1,560 1,457 25 1,251 1,209 42 3,189 3,092 97 1,003 979 24 1,630 1,475 19
60-64 1,129 1,047 42 560 520 40 5,742 5,642 100 928 908 20 1,211 1,062 28
65-67 134 109 21 89 .. .. 354 304 50 81 68 13 120 93 18
70-74 4,357 4,023 34 2,392 2,355 37 5,637 5,498 139 2,134 2,116 18 3,410 2,981 34
Others 2,489 2,054 161 1,401 1,318 83 3,838 3,385 453 1,127 1,079 48 1,645 1,355 101
Unknown 83 13 0 0 0 0 64 62 2 0 0 0 24 20 0
: = Data not available.. = Confidential data

34 External Trade by Enterprise Characteristics – Results of the Standardisation exercise 2006
TablesII
Table 1.2a: Imports by activity sector and size-class (number of enterprises) – Part 4
Number of enterprises
Activity sectorReporting country and size-class
FI SE IS NO
Total 0-249 250+ Total 0-249 250+ Total 0-249 250+ Total 0-249 250+
Total 12,826 11,702 551 38,146 37,115 1,031 4,792 4,727 65 67,066 56,465 784
C-E 3,496 3,196 238 8,588 8,175 413 895 882 13 9,336 8,461 182
10-14 17 .. .. 48 45 3 5 5 0 288 244 19
15-16 164 138 23 398 362 36 177 171 6 829 757 37
17 157 153 3 288 282 6 40 40 0 407 372 0
18 172 166 3 158 .. .. 23 23 0 235 192 0
19 64 .. .. 71 .. .. 9 9 0 47 45 0
20 259 244 13 475 456 19 36 36 0 723 673 3
21 84 61 22 195 155 40 5 5 0 94 83 7
22 231 206 14 806 784 22 95 92 3 1,035 919 13
23 4 .. .. 19 15 4 0 0 0 7 5 0
24 134 111 19 320 295 25 34 .. .. 199 163 17
25 199 185 13 449 439 10 40 40 0 328 .. ..
26 130 117 12 217 200 17 55 55 0 362 332 10
27 38 28 9 150 126 24 9 .. .. 114 99 12
28 358 341 11 1,233 1,215 18 109 109 0 918 .. ..
29 484 443 35 1,258 1,194 64 59 .. .. 1,130 1,036 10
30 15 .. .. 90 .. .. .. .. .. 21 20 0
31 157 145 10 425 410 15 26 26 0 316 298 4
32 137 121 14 217 200 17 .. .. .. 106 .. ..
33 176 162 11 482 464 18 20 20 0 320 296 4
34 69 63 6 273 237 36 7 7 0 117 106 5
35 84 76 6 253 243 10 31 31 0 526 472 23
36-37 331 323 5 668 660 8 102 102 0 998 887 5
40-41 32 19 6 95 78 17 8 .. .. 216 183 9
G 6,331 5,901 77 16,165 16,046 119 1,588 1,577 11 29,311 25,099 100
50 441 397 9 1,309 1,294 15 165 165 0 3,824 3,218 9
51 4,427 4,138 36 10,345 10,291 54 765 762 3 12,796 10,858 32
52 1,463 1,366 32 4,511 4,461 50 658 650 8 12,691 11,023 59
Other act. 2,999 2,605 236 13,393 12,894 499 2,309 2,268 41 28,419 22,905 502
01-05 92 .. .. 805 799 6 259 254 5 4,497 3,964 4
45 421 391 17 1,208 1,174 34 348 .. .. 3,963 3,497 28
60-64 366 312 42 962 895 67 179 172 7 2,806 2,441 72
65-67 83 .. .. 223 206 17 49 45 4 266 213 31
70-74 1,333 1,211 44 5,662 5,546 116 695 .. .. 8,865 6,915 76
Others 688 525 123 2,566 2,307 259 773 752 21 7,332 5,433 291
Unknown 16 11 0 1,967 1,967 0 6 6 0 690 442 0
: = Data not available.. = Confidential data

3�External Trade by Enterprise Characteristics – Results of the Standardisation exercise 2006
Tables II
Table 1.2b: Imports by activity sector and size-class (€ million) – Part 1
€ million
Activity sectorReporting country and size-class
BE CZ DK EE FR
Total 0-249 250+ Total 0-249 250+ Total 0-249 250+ Total 0-249 250+ Total 0-249 250+
Total 59,695 38,370 22,517 45,236 21,934 22,517 15,691 11,020 4,471 5,682 4,392 1,236 101,319 45,098 53,857
C-E 14,702 4,726 9,977 25,295 6,877 18,339 4,412 2,011 2,402 2,260 1,206 1,054 60,398 14,932 45,269
10-14 12 11 0 137 82 45 24 .. .. 9 3 7 55 17 38
15-16 1,033 403 630 1,088 325 761 825 450 375 203 140 63 2,432 1,320 1,110
17 410 244 166 930 424 500 138 .. .. 154 71 83 1,209 768 440
18 629 352 277 344 168 175 211 .. .. 163 113 50 2,440 1,591 848
19 119 27 92 100 71 29 82 .. .. 51 .. .. 520 273 247
20 105 91 14 284 170 112 62 33 29 96 73 23 357 269 86
21 150 43 107 464 150 314 36 17 19 31 .. .. 746 216 530
22 32 30 2 325 117 206 39 25 14 25 25 0 218 143 76
23 340 40 301 982 3 809 35 .. .. 1 .. .. 16,529 468 16,061
24 3,305 630 2,675 1,135 407 726 372 113 259 124 .. .. 7,486 1,237 6,094
25 353 194 159 1,596 826 760 136 75 60 93 84 9 1,363 364 999
26 254 92 162 646 252 393 59 29 30 57 .. .. 548 221 327
27 2,023 81 1,942 771 226 544 207 47 160 15 15 0 2,829 1,021 1,803
28 259 194 65 1,495 855 632 170 128 42 131 .. .. 928 523 405
29 1,237 341 896 1,497 772 716 515 193 322 41 37 4 2,623 953 1,663
30 31 31 0 2,190 60 2,130 30 30 0 18 18 0 1,985 1,226 759
31 472 95 378 2,459 563 1,884 179 59 119 145 91 54 2,029 545 1,463
32 392 70 322 1,723 224 1,492 187 102 85 589 49 540 4,117 628 3,489
33 167 42 125 456 123 332 204 126 77 47 .. .. 1,687 585 1,102
34 1,127 74 1,052 5,214 437 4,777 91 30 61 56 .. .. 3,227 427 2,799
35 347 29 318 468 66 402 165 49 116 38 .. .. 5,293 1,223 4,070
36-37 316 147 170 814 309 503 281 124 157 93 76 17 1,407 767 638
40-41 1,590 1,468 122 175 78 96 365 13 352 79 6 74 370 149 221
G 15,676 11,712 3,964 15,381 13,135 1,979 7,952 6,183 1,769 2,679 2,561 118 31,473 25,748 5,635
50 3,467 1,186 2,280 2,223 1,840 359 446 415 31 529 .. .. 2,665 2,161 504
51 11,686 10,213 1,474 10,839 9,501 1,224 6,918 5,530 1,388 1,874 .. .. 25,208 22,182 2,939
52 523 313 210 2,319 1,793 396 588 238 350 276 199 77 3,600 1,406 2,192
Other act. 29,316 21,932 7,140 4,560 1,922 2,199 3,327 2,826 301 690 626 64 9,448 4,417 2,953
01-05 0 0 0 : : : 12 12 0 35 28 7 100 82 14
45 78 58 20 261 201 52 49 29 20 76 69 7 126 95 31
60-64 326 242 84 1,882 208 1,662 2,134 1,917 217 193 156 37 3,348 1,351 1,981
65-67 36 35 1 137 118 8 9 6 3 232 230 2 137 115 22
70-74 21,634 21,553 81 1,715 1,260 386 412 368 44 81 80 1 3,517 2,651 832
Others 6,998 44 6,955 242 134 90 96 80 16 73 63 10 216 119 72
Unknown 244 0 0 323 0 0 614 414 0 0 0 0 2,004 4 0
: = Data not available.. = Confidential data

36 External Trade by Enterprise Characteristics – Results of the Standardisation exercise 2006
TablesII
Table 1.2b: Imports by activity sector and size-class (€ million) – Part 2
€ million
Activity sectorReporting country and size-class
IT CY LV LT LU
Total 0-249 250+ Total 0-249 250+ Total 0-249 250+ Total 0-249 250+ Total 0-249 250+
Total 109,189 53,947 55,242 1,411 987 105 4,547 3,503 1,044 8,239 4,823 3,415 1,056 489 567
C-E 70,427 24,806 45,622 189 105 84 1,320 632 689 3,854 1,038 2,816 530 58 471
10-14 10,011 58 9,953 0 0 0 7 .. .. 7 7 0 .. .. ..
15-16 3,069 1,651 1,418 27 23 4 229 122 107 334 105 229 1 .. ..
17 3,753 2,317 1,436 1 1 0 71 37 34 195 116 80 72 .. ..
18 3,934 2,695 1,239 3 3 0 141 71 70 347 154 194 0 0 0
19 3,850 3,101 749 2 2 0 2 2 0 15 7 8 0 0 0
20 1,111 994 116 4 4 0 115 46 69 74 48 26 .. .. ..
21 1,501 548 953 8 8 0 24 24 0 29 .. .. .. .. ..
22 266 183 83 4 4 0 29 .. .. 35 .. .. 1 .. ..
23 9,755 609 9,146 .. .. .. .. .. .. .. .. .. 0 0 0
24 6,745 2,178 4,567 12 12 0 60 36 24 203 27 177 84 .. ..
25 1,239 712 527 13 .. .. 42 42 0 150 .. .. 161 4 157
26 847 605 242 10 10 0 57 .. .. 38 25 13 39 .. ..
27 4,965 1,794 3,171 0 0 0 101 .. .. .. .. .. 35 .. ..
28 1,748 1,492 255 10 10 0 54 .. .. 56 .. .. 26 .. ..
29 3,701 1,517 2,184 4 4 0 31 17 14 74 34 40 84 .. ..
30 718 130 588 .. .. .. .. .. .. 15 15 0 0 0 0
31 1,471 787 685 2 2 0 51 28 23 134 26 107 1 1 0
32 1,302 416 886 .. .. .. 8 8 0 113 20 93 .. .. ..
33 965 543 423 1 1 0 15 .. .. 23 12 12 2 .. ..
34 2,710 304 2,407 1 1 0 8 8 0 17 17 0 1 1 0
35 2,040 283 1,757 0 0 0 23 8 15 457 26 432 .. .. ..
36-37 1,456 1,041 415 9 9 0 41 23 17 98 53 45 0 0 0
40-41 3,269 849 2,420 77 .. .. 209 6 204 198 135 64 2 .. ..
G 32,303 27,016 5,286 842 832 10 2,666 2,484 182 3,681 3,331 349 297 291 5
50 4,547 3,686 861 175 175 0 375 .. .. 726 712 14 20 .. ..
51 25,994 22,228 3,766 513 507 6 1,947 1,883 64 2,584 2,370 213 268 .. ..
52 1,761 1,102 659 154 150 4 344 .. .. 371 249 122 8 .. ..
Other act. 6,459 2,125 4,334 381 50 11 561 388 173 705 455 250 229 139 90
01-05 : : : : : : 40 35 5 37 25 12 0 .. ..
45 204 178 26 10 10 1 107 91 16 81 70 11 4 .. ..
60-64 1,969 936 1,033 35 26 9 218 114 104 304 105 199 90 8 82
65-67 2,662 129 2,533 5 4 0 29 26 2 132 130 2 4 4 0
70-74 1,548 819 729 6 5 0 92 80 13 72 71 0 101 94 7
Others 77 64 12 5 4 1 74 41 33 79 53 26 3 3 0
Unknown 0 0 0 320 0 0 1 1 0 0 0 0 25 25 0
: = Data not available.. = Confidential data

37External Trade by Enterprise Characteristics – Results of the Standardisation exercise 2006
Tables II
Table 1.2b: Imports by activity sector and size-class (€ million) – Part 3
€ million
Activity sectorReporting country and size-class
HU AT PL SI SK
Total 0-249 250+ Total 0-249 250+ Total 0-249 250+ Total 0-249 250+ Total 0-249 250+
Total 42,263 18,062 23,937 25,298 16,310 8,987 60,129 32,185 27,944 12,111 6,511 5,600 19,906 9,086 10,756
C-E 27,593 5,306 22,249 12,095 5,526 6,570 33,457 9,980 23,477 6,294 1,871 4,424 12,838 2,921 9,910
10-14 29 .. .. 17 .. .. 39 .. .. 14 .. .. 18 8 10
15-16 964 371 591 402 298 104 2,513 1,000 1,513 416 129 287 362 133 228
17 476 251 224 268 182 86 893 482 411 388 123 265 256 137 118
18 921 275 645 362 164 199 1,225 793 432 182 53 129 385 194 191
19 314 159 155 278 79 199 300 132 168 222 34 188 310 148 162
20 211 75 136 342 172 171 481 174 307 113 60 53 93 58 35
21 473 188 285 202 50 152 842 407 435 272 37 235 319 120 199
22 200 119 80 72 20 51 522 265 257 77 44 33 136 84 51
23 1,723 .. .. 1,578 .. .. 3,139 58 3,081 3 .. .. 1,007 .. ..
24 1,201 329 871 1,182 573 609 2,626 651 1,974 755 216 539 379 111 268
25 916 515 398 476 139 337 2,067 1,191 876 463 179 284 566 266 300
26 307 188 119 234 82 153 858 433 425 142 79 62 236 101 135
27 501 131 370 852 121 730 740 210 530 410 67 343 793 36 757
28 538 414 117 623 363 261 1,810 1,114 696 447 215 232 341 241 99
29 1,170 478 689 750 368 382 1,637 715 922 663 182 481 671 149 522
30 1,603 55 1,548 137 .. .. 413 .. .. 33 .. .. 42 .. ..
31 2,362 471 1,890 886 349 537 1,698 432 1,266 286 77 208 1,019 239 779
32 7,032 383 6,647 1,034 88 946 1,310 172 1,138 193 48 144 638 146 492
33 193 127 64 154 132 23 319 188 132 120 60 60 58 43 15
34 5,731 414 5,317 750 275 475 5,609 569 5,041 804 93 711 3,531 572 2,959
35 93 40 52 120 45 75 1,938 271 1,667 83 18 65 121 39 82
36-37 236 144 91 330 157 172 1,329 448 882 161 102 59 489 75 413
40-41 398 86 300 1,047 163 883 1,146 28 1,118 49 9 40 1,068 6 1,061
G 13,130 11,753 1,202 7,411 6,396 1,015 23,577 19,858 3,719 5,030 3,973 1,057 5,860 5,325 496
50 2,925 2,771 3 1,597 1,501 96 4,339 3,669 670 1,517 1,004 513 1,160 1,158 1
51 9,182 8,176 897 5,072 4,488 584 17,713 15,029 2,684 2,961 2,638 323 3,900 3,463 418
52 1,023 806 202 742 407 335 1,525 1,161 364 552 331 222 800 705 77
Other act. 1,540 1,002 487 5,792 4,389 1,403 3,096 2,347 748 787 667 119 1,209 839 351
01-05 89 79 9 19 .. .. 132 119 13 : : : 45 41 2
45 209 171 24 103 87 16 780 716 65 149 119 31 148 131 14
60-64 429 100 318 1,573 523 1,050 805 439 366 144 93 51 384 101 282
65-67 53 50 3 258 .. .. 151 146 5 68 65 3 35 26 9
70-74 576 504 58 3,755 3,719 36 931 768 163 377 350 28 491 471 10
Others 183 98 74 85 42 43 294 157 136 49 41 7 105 69 34
Unknown 3 0 0 0 0 0 3 2 1 0 0 0 1 1 0
: = Data not available.. = Confidential data

38 External Trade by Enterprise Characteristics – Results of the Standardisation exercise 2006
TablesII
Table 1.2b: Imports by activity sector and size-class (€ million) – Part 4
€ million
Activity sectorReporting country and size-class
FI SE IS NO
Total 0-249 250+ Total 0-249 250+ Total 0-249 250+ Total 0-249 250+
Total 12,875 5,106 7,490 23,253 10,769 12,484 2,436 1,817 620 32,723 22,487 8,615
C-E 8,570 1,702 6,747 8,778 2,552 6,227 597 376 221 8,875 4,364 4,406
10-14 4 .. .. 250 6 244 3 3 0 894 111 780
15-16 256 174 82 485 178 307 127 91 36 1,412 516 896
17 38 32 6 88 65 23 12 12 0 136 134 0
18 140 82 57 122 .. .. 6 6 0 54 54 0
19 28 .. .. 18 .. .. 0 0 0 21 21 0
20 137 72 65 213 129 83 5 5 0 362 329 30
21 411 15 394 237 63 174 15 15 0 277 157 119
22 21 16 5 96 70 26 22 15 7 188 158 20
23 2,143 .. .. 184 14 170 0 0 0 0 0 0
24 608 286 310 1,085 222 862 56 .. .. 1,025 385 626
25 123 42 81 189 142 47 25 25 0 236 .. ..
26 67 32 34 115 62 54 16 16 0 239 155 83
27 1,121 258 863 805 98 707 209 .. .. 1,196 245 948
28 102 77 22 320 226 94 22 22 0 299 .. ..
29 252 88 163 936 280 656 23 .. .. 619 417 189
30 4 .. .. 50 .. .. .. .. .. 20 20 0
31 238 96 142 404 181 223 4 4 0 269 144 124
32 1,981 35 1,946 1,086 73 1,014 .. .. .. 172 .. ..
33 106 32 74 496 129 367 10 10 0 199 133 34
34 85 11 74 642 130 512 2 2 0 183 137 47
35 95 44 45 361 120 241 15 15 0 706 317 376
36-37 68 55 13 279 165 114 7 7 0 316 250 63
40-41 541 220 227 319 66 252 19 .. .. 52 38 11
G 3,966 3,198 612 11,332 6,963 4,368 1,540 1,195 345 19,551 15,432 3,228
50 569 517 18 928 864 64 228 228 0 3,233 2,306 769
51 3,110 2,563 425 8,634 5,671 2,963 904 712 192 14,108 11,974 1,451
52 287 117 169 1,769 428 1,341 407 255 153 2,210 1,152 1,008
Other act. 340 207 131 3,143 1,255 1,888 300 246 54 4,298 2,691 981
01-05 5 .. .. 216 23 193 43 26 16 153 136 2
45 24 20 4 104 65 39 101 .. .. 569 318 203
60-64 86 31 55 1,761 348 1,412 61 39 23 1,425 511 496
65-67 65 .. .. 25 10 15 21 21 0 589 520 67
70-74 84 73 10 327 244 83 52 .. .. 1,122 891 152
Others 74 12 62 200 54 147 22 17 5 353 282 61
Unknown 3 2 0 510 510 0 0 0 0 87 31 0
: = Data not available.. = Confidential data

3�External Trade by Enterprise Characteristics – Results of the Standardisation exercise 2006
Tables II
Table 1.3a: Dispatches by activity sector and size-class (number of enterprises) – Part 1
Number of enterprises
Activity sectorReporting country and size-class
BE DK DE FR IT
Total 0-249 250+ Total 0-249 250+ Total 0-249 250+ Total 0-249 250+ Total 0-249 250+
Total 13,233 : : 5,746 5,463 280 37,507 28,621 2,737 29,537 26,317 2,359 43,095 41,501 1,594
C-E : : : 2,318 2,123 195 17,404 14,054 2,165 15,146 13,187 1,881 32,198 30,854 1,344
10-14 : : : 22 22 0 140 116 9 139 127 12 79 .. ..
15-16 : : : 241 202 39 1,078 792 206 1,907 1,614 266 2,149 2,042 107
17 : : : 89 .. .. 645 548 54 925 869 49 2,750 2,667 83
18 : : : 62 .. .. 332 273 31 739 705 30 1,665 1,619 46
19 : : : 12 .. .. 152 131 8 192 173 19 2,160 2,132 28
20 : : : 65 57 8 409 330 30 610 580 22 664 655 9
21 : : : 41 35 6 499 373 97 372 284 88 549 512 37
22 : : : 55 50 5 516 426 53 555 491 62 506 481 25
23 : : : 3 .. .. 27 19 4 29 19 10 39 29 10
24 : : : 120 104 16 1,060 835 151 1,194 959 224 1,263 1,125 138
25 : : : 175 162 13 1,404 1,182 139 1,111 977 133 1,999 1,937 62
26 : : : 63 53 10 611 469 88 414 331 83 1,313 1,231 82
27 : : : 46 40 6 536 422 93 372 279 92 777 711 66
28 : : : 220 208 12 2,277 1,891 232 1,798 1,652 142 3,743 3,660 83
29 : : : 484 454 30 3,516 2,915 401 1,653 1,472 174 5,799 5,572 227
30 : : : 19 19 0 136 107 15 56 45 11 88 83 5
31 : : : 98 86 12 972 751 170 482 372 108 1,394 1,318 76
32 : : : 59 .. .. 337 259 49 309 257 52 365 318 47
33 : : : 139 129 10 1,082 951 75 683 617 65 802 770 32
34 : : : 37 33 4 439 280 135 368 267 101 578 487 91
35 : : : 34 .. .. 138 103 27 208 147 61 427 392 35
36-37 : : : 219 209 10 1,061 864 88 1,017 941 73 3,081 3,030 51
40-41 : : : 15 11 4 37 17 10 13 9 4 8 .. ..
G : : : 2,825 2,788 37 14,458 12,195 399 10,760 10,372 322 9,809 9,661 148
50 : : : 229 225 4 1,767 1,339 51 961 932 26 817 805 12
51 : : : 2,383 2,359 24 10,848 9,422 230 9,063 8,792 210 8,143 8,056 87
52 : : : 213 204 9 1,843 1,434 118 736 648 86 849 800 49
Other act. : : : 603 552 48 5,645 2,372 173 3,631 2,758 156 1,088 986 102
01-05 : : : 67 67 0 199 149 4 1,476 1,246 11 : : :
45 : : : 44 37 7 264 214 14 142 122 20 194 181 13
60-64 : : : 81 63 18 187 133 31 175 152 22 193 155 38
65-67 : : : 10 .. .. 52 32 13 32 30 2 22 15 7
70-74 : : : 210 196 14 4,615 1,633 77 1,179 1,092 78 587 555 32
Others : : : 33 .. .. 328 211 36 133 105 23 92 80 12
Unknown : : : 158 155 0 0 0 0 494 11 0 0 0 0
: = Data not available.. = Confidential data

40 External Trade by Enterprise Characteristics – Results of the Standardisation exercise 2006
TablesII
Table 1.3a: Dispatches by activity sector and size-class (number of enterprises) – Part 2
Number of enterprises
Activity sectorReporting country and size-class
CY LU AT FI SE
Total 0-249 250+ Total 0-249 250+ Total 0-249 250+ Total 0-249 250+ Total 0-249 250+
Total 1,847 1,128 30 1,722 1,666 56 8,172 7,613 559 2,806 2,473 280 8,860 8,331 529
C-E 308 300 8 238 209 29 3,636 3,232 404 1,930 1,706 217 4,187 3,815 372
10-14 4 4 0 6 6 0 32 .. .. 19 .. .. 35 32 3
15-16 64 .. .. 31 .. .. 279 246 33 86 67 19 232 199 33
17 7 7 0 5 .. .. 194 183 11 52 49 3 104 98 6
18 19 19 0 0 0 0 68 63 5 42 39 3 41 .. ..
19 6 6 0 0 0 0 49 45 4 30 .. .. 21 .. ..
20 18 18 0 11 .. .. 379 361 18 223 213 10 348 328 20
21 11 11 0 .. .. .. 83 63 20 65 43 22 133 95 38
22 17 17 0 21 .. .. 119 111 8 78 64 12 172 158 14
23 0 0 0 0 0 0 5 .. .. 2 .. .. 10 .. ..
24 19 19 0 11 .. .. 182 159 23 78 57 19 218 194 24
25 15 .. .. 18 13 5 219 195 24 132 119 13 301 291 10
26 29 29 0 16 .. .. 140 119 21 55 43 12 87 71 16
27 0 0 0 7 .. .. 99 66 33 37 29 8 121 97 24
28 26 26 0 45 .. .. 403 368 35 190 178 11 577 559 18
29 14 14 0 20 .. .. 613 540 73 350 318 31 779 718 61
30 .. .. .. 0 0 0 17 .. .. 5 .. .. 31 .. ..
31 7 7 0 9 9 0 157 133 24 87 77 10 178 164 14
32 .. .. .. .. .. .. 64 47 17 56 42 14 72 57 15
33 4 4 0 13 .. .. 124 119 5 99 88 11 208 190 18
34 4 4 0 7 7 0 84 68 16 46 40 6 168 134 34
35 .. .. .. .. .. .. 20 15 5 40 34 6 80 72 8
36-37 39 39 0 10 10 0 286 269 17 150 147 3 267 259 8
40-41 .. .. .. 4 .. .. 20 10 10 8 .. .. 4 .. ..
G 706 703 3 1,058 1,051 7 3,639 3,542 97 636 560 37 3,536 3,452 84
50 70 70 0 196 .. .. 383 366 17 56 47 5 222 210 12
51 338 335 3 671 .. .. 2,790 2,739 51 538 478 25 2,988 2,942 46
52 298 298 0 191 .. .. 466 437 29 42 35 7 326 300 26
Other act. 833 125 19 426 406 20 897 839 58 240 207 26 1,137 1,064 73
01-05 : : : 12 12 0 58 .. .. 13 .. .. 178 .. ..
45 27 .. .. 92 87 5 131 113 18 40 36 3 99 91 8
60-64 54 50 4 55 49 6 91 76 15 24 15 7 114 85 29
65-67 8 .. .. 22 18 4 9 .. .. 2 .. .. 7 .. ..
70-74 21 .. .. 122 .. .. 531 523 8 133 123 8 479 462 17
Others 34 25 9 23 .. .. 77 68 9 27 20 5 75 60 15
Unknown 689 0 0 100 100 0 0 0 0 1 1 0 185 185 0
: = Data not available.. = Confidential data

41External Trade by Enterprise Characteristics – Results of the Standardisation exercise 2006
Tables II
Table 1.3b: Dispatches by activity sector and size-class (€ million) – Part 1
€ million
Activity sectorReporting country and size-class
BE DK DE FR IT
Total 0-249 250+ Total 0-249 250+ Total 0-249 250+ Total 0-249 250+ Total 0-249 250+
Total 164,377 104,307 60,033 38,823 20,944 15,221 290,168 93,269 169,819 200,749 90,866 106,919 139,027 77,873 61,154
C-E 72,487 22,378 50,109 23,900 10,336 13,564 186,550 37,832 144,605 145,244 45,327 99,580 121,972 63,202 58,770
10-14 214 163 51 2,106 2,106 0 451 183 120 394 197 198 784 .. ..
15-16 9,051 4,508 4,543 5,264 1,224 4,040 10,688 4,126 6,128 14,178 4,925 9,239 7,860 4,942 2,918
17 3,345 1,508 1,837 414 .. .. 2,208 1,042 1,082 3,212 2,368 830 6,812 4,869 1,943
18 926 400 526 190 .. .. 1,599 589 945 1,777 1,015 747 4,535 2,696 1,839
19 199 41 158 127 .. .. 520 261 239 524 256 268 4,661 3,860 801
20 1,081 715 366 314 116 198 1,396 690 611 1,085 937 142 907 763 144
21 2,162 584 1,578 350 186 164 4,526 986 3,387 4,157 841 3,316 2,822 1,151 1,671
22 918 827 91 140 87 53 1,230 442 752 923 540 380 1,276 800 476
23 4,463 117 4,346 133 .. .. 1,369 202 1,148 3,435 462 2,974 1,584 79 1,505
24 13,415 3,442 9,973 3,241 651 2,591 18,874 3,744 14,705 22,518 6,641 15,626 12,679 6,345 6,334
25 3,226 1,711 1,514 1,307 518 789 7,339 2,285 4,756 6,926 2,678 4,247 7,071 4,523 2,548
26 2,190 829 1,361 241 139 102 2,513 892 1,366 2,734 711 2,024 3,902 1,810 2,092
27 7,630 1,152 6,477 584 256 328 6,558 1,508 4,891 10,342 2,306 8,035 6,714 2,534 4,180
28 2,745 1,990 755 801 542 259 7,323 2,855 4,006 4,987 2,822 2,163 7,766 5,870 1,896
29 3,076 999 2,076 3,062 1,391 1,671 18,144 5,047 12,566 10,080 3,302 6,759 20,888 10,635 10,253
30 91 91 0 64 64 0 2,169 227 1,903 1,475 364 1,111 577 148 429
31 1,827 342 1,486 1,514 224 1,290 5,475 1,532 3,749 5,970 1,066 4,896 4,760 2,572 2,187
32 957 144 813 789 267 523 3,225 491 2,665 4,659 735 3,924 2,188 630 1,559
33 427 199 228 719 444 275 11,567 8,498 2,990 2,794 989 1,805 2,143 1,166 977
34 11,314 461 10,854 411 279 132 64,477 673 63,707 32,268 9,429 22,839 12,792 1,925 10,867
35 579 66 513 133 .. .. 11,336 192 10,970 6,694 1,019 5,675 3,080 996 2,084
36-37 1,446 1,029 417 1,306 629 677 3,091 1,191 1,733 2,846 1,599 1,243 6,150 4,788 1,363
40-41 1,204 1,058 146 689 638 51 474 177 185 1,266 127 1,138 22 .. ..
G 34,072 25,400 8,672 9,466 8,038 1,428 41,045 25,160 10,923 42,521 36,214 5,978 15,423 13,728 1,695
50 7,529 3,259 4,269 606 515 91 3,189 2,403 302 4,146 3,843 303 1,735 1,695 40
51 25,145 21,433 3,712 8,610 7,349 1,261 34,440 21,312 8,898 36,187 31,428 4,431 12,814 11,455 1,359
52 1,398 708 690 251 174 76 3,416 1,445 1,724 2,187 942 1,244 874 577 297
Other act. 57,818 56,528 1,253 5,457 2,570 229 62,572 30,277 14,291 12,985 9,326 1,362 1,632 943 689
01-05 : : : 75 75 0 329 194 92 1,007 800 119 : : :
45 219 178 40 24 12 12 208 131 34 127 72 54 104 84 20
60-64 552 464 88 1,228 1,097 131 1,134 411 543 3,782 3,225 550 566 138 428
65-67 144 135 8 25 .. .. 309 171 95 105 95 10 63 12 51
70-74 55,920 55,634 286 679 595 84 58,763 28,825 13,223 5,591 5,001 579 795 680 115
Others 947 116 831 33 .. .. 1,829 544 304 134 77 50 103 28 75
Unknown 37 0 0 3,393 735 0 0 0 0 2,238 54 0 0 0 0
: = Data not available.. = Confidential data

42 External Trade by Enterprise Characteristics – Results of the Standardisation exercise 2006
TablesII
Table 1.3b: Dispatches by activity sector and size-class (€ million) – Part 2
€ million
Activity sectorReporting country and size-class
CY LU AT FI SE
Total 0-249 250+ Total 0-249 250+ Total 0-249 250+ Total 0-249 250+ Total 0-249 250+
Total 494 233 67 7,212 3,023 4,188 46,294 22,942 23,351 24,282 4,367 19,308 46,510 15,168 31,341
C-E 89 79 10 5,223 1,146 4,077 35,811 13,609 22,202 23,082 3,870 18,990 37,144 8,531 28,613
10-14 1 1 0 9 9 0 164 .. .. 59 .. .. 681 49 633
15-16 30 .. .. 292 .. .. 1,654 766 888 333 65 268 914 325 590
17 3 3 0 351 .. .. 1,237 469 768 176 62 114 324 212 112
18 3 3 0 0 0 0 497 146 351 65 35 30 58 .. ..
19 0 0 0 0 0 0 431 109 321 38 .. .. 42 .. ..
20 1 1 0 130 .. .. 1,621 1,020 601 1,673 576 1,097 1,770 1,006 764
21 3 3 0 .. .. .. 1,887 302 1,585 5,905 285 5,620 5,738 443 5,295
22 2 2 0 133 .. .. 1,141 142 999 140 49 90 109 63 46
23 0 0 0 0 0 0 60 .. .. 1,107 .. .. 295 .. ..
24 6 6 0 523 .. .. 2,792 1,265 1,527 1,290 367 920 4,093 994 3,099
25 5 .. .. 956 162 793 1,476 749 727 524 187 336 778 534 243
26 7 7 0 341 .. .. 689 192 497 332 63 269 409 150 259
27 0 0 0 1,655 .. .. 3,498 876 2,622 2,527 392 2,135 3,730 511 3,219
28 1 1 0 167 .. .. 2,231 1,077 1,154 425 264 161 911 651 261
29 2 2 0 297 .. .. 4,277 1,606 2,671 1,847 657 1,188 5,152 1,552 3,601
30 .. .. .. 0 0 0 425 .. .. 6 .. .. 142 .. ..
31 1 1 0 30 30 0 1,725 776 949 847 201 646 853 254 599
32 .. .. .. .. .. .. 1,898 257 1,641 3,845 79 3,766 1,759 70 1,689
33 0 0 0 112 .. .. 490 327 163 443 129 314 1,090 523 567
34 3 3 0 19 19 0 4,518 819 3,699 578 103 475 7,107 333 6,775
35 .. .. .. .. .. .. 843 279 563 477 79 398 553 212 341
36-37 12 12 0 2 2 0 963 685 279 205 164 41 565 429 136
40-41 .. .. .. 33 .. .. 1,295 1,118 177 240 .. .. 70 .. ..
G 152 152 0 1,558 1,514 44 7,912 7,084 828 978 387 211 6,817 4,375 2,442
50 54 54 0 309 .. .. 1,597 1,411 186 74 26 4 359 330 28
51 83 83 0 1,150 .. .. 5,670 5,140 530 874 342 197 5,839 3,917 1,922
52 15 15 0 100 .. .. 645 532 112 30 20 10 620 128 492
Other act. 253 3 57 430 363 68 2,571 2,249 321 222 110 107 2,549 2,262 287
01-05 0 0 0 7 7 0 29 .. .. 9 .. .. 77 .. ..
45 1 .. .. 20 19 1 74 57 16 11 9 3 46 21 25
60-64 57 1 56 57 16 41 286 90 196 78 2 71 1,087 928 159
65-67 0 .. .. 22 22 1 15 .. .. 0 .. .. 1 .. ..
70-74 1 .. .. 108 .. .. 2,086 2,015 70 108 83 25 297 259 38
Others 1 1 0 6 .. .. 82 63 19 14 13 1 116 62 55
Unknown 194 0 0 211 211 0 0 0 0 1 1 0 924 924 0
: = Data not available.. = Confidential data

43External Trade by Enterprise Characteristics – Results of the Standardisation exercise 2006
Tables II
Table 1.4a: Exports by activity sector and size-class (number of enterprises) – Part 1
Number of enterprises
Activity sectorReporting country and size-class
BE CZ DK EE FR
Total 0-249 250+ Total 0-249 250+ Total 0-249 250+ Total 0-249 250+ Total 0-249 250+
Total 21,673 : : 36,827 27,444 1,283 14,753 14,372 376 6,220 6,091 129 96,405 86,291 3,446
C-E : : : 14,713 11,749 964 4,683 4,476 207 2,315 2,238 77 29,968 27,797 2,044
10-14 : : : 1,046 745 35 35 .. .. 30 .. .. 288 274 14
15-16 : : : 587 483 86 274 234 40 144 129 15 2,455 2,151 260
17 : : : 512 426 56 193 .. .. 134 128 6 1,478 1,421 53
18 : : : 511 459 16 135 .. .. 230 220 10 1,897 1,855 35
19 : : : 185 160 12 22 .. .. 45 .. .. 488 464 23
20 : : : 1,308 1,026 32 147 141 6 471 465 6 959 920 27
21 : : : 181 148 20 94 88 6 26 .. .. 625 533 92
22 : : : 573 468 14 281 274 7 99 99 0 2,047 1,981 62
23 : : : 7 4 3 6 .. .. 3 .. .. 40 26 14
24 : : : 393 324 37 186 170 16 63 .. .. 1,922 1,654 254
25 : : : 864 759 45 336 323 13 122 119 3 1,914 1,770 140
26 : : : 773 580 69 153 140 13 81 .. .. 1,018 928 87
27 : : : 233 177 48 63 57 6 5 5 0 478 382 94
28 : : : 2,798 2,267 72 614 599 15 275 .. .. 3,974 3,807 160
29 : : : 1,549 1,321 108 892 862 30 108 105 3 3,186 2,981 194
30 : : : 61 48 6 24 24 0 6 6 0 124 111 13
31 : : : 871 656 84 255 243 12 47 .. .. 980 862 115
32 : : : 257 178 21 105 100 5 41 38 3 687 617 70
33 : : : 374 319 20 226 215 11 52 .. .. 1,509 1,434 72
34 : : : 235 157 75 65 61 4 25 .. .. 619 509 108
35 : : : 136 98 31 82 79 3 39 .. .. 474 408 66
36-37 : : : 1,201 918 45 480 470 10 257 251 6 2,764 2,679 79
40-41 : : : 58 28 29 15 11 4 12 6 6 42 30 12
G : : : 13,809 11,068 91 7,492 7,440 52 2,550 2,543 7 39,250 38,479 607
50 : : : 806 680 9 644 639 5 226 .. .. 5,881 5,798 68
51 : : : 7,729 6,676 40 5,888 5,858 30 1,919 .. .. 25,128 24,693 324
52 : : : 5,274 3,712 42 960 943 17 405 400 5 8,241 7,988 215
Other act. : : : 8,305 4,627 228 2,578 2,456 117 1,355 1,310 45 27,187 20,015 795
01-05 : : : : : : 319 319 0 197 .. .. 5,913 5,206 11
45 : : : 884 718 39 250 231 19 199 192 7 1,897 1,793 99
60-64 : : : 834 622 60 398 371 27 271 260 11 2,801 2,593 197
65-67 : : : 200 111 9 35 31 4 31 27 4 226 174 49
70-74 : : : 3,318 2,613 48 965 931 34 472 .. .. 8,209 7,863 275
Others : : : 870 562 72 181 148 33 185 167 18 2,559 2,339 159
Unknown : : : 2,199 1 0 430 425 0 0 0 0 5,582 47 5
: = Data not available.. = Confidential data

44 External Trade by Enterprise Characteristics – Results of the Standardisation exercise 2006
TablesII
Table 1.4a: Exports by activity sector and size-class (number of enterprises) – Part 2
Number of enterprises
Activity sectorReporting country and size-class
IT CY LV LT LU
Total 0-249 250+ Total 0-249 250+ Total 0-249 250+ Total 0-249 250+ Total 0-249 250+
Total 137,677 135,729 1,948 1,567 768 21 4,914 4,732 182 7,542 7,288 249 917 859 58
C-E 77,040 75,633 1,407 232 224 8 1,696 1,602 94 2,464 2,307 157 146 119 27
10-14 283 .. .. 3 3 0 33 .. .. 27 27 0 0 0 0
15-16 4,538 4,429 109 60 54 6 159 133 26 242 206 36 16 .. ..
17 5,437 5,348 89 4 4 0 78 71 7 148 131 17 5 .. ..
18 4,868 4,819 49 14 14 0 122 112 10 215 183 32 0 0 0
19 5,521 5,492 29 7 7 0 20 20 0 25 22 3 0 0 0
20 2,340 2,329 11 3 3 0 507 495 12 619 611 8 .. .. ..
21 1,263 1,225 38 4 4 0 26 26 0 37 .. .. .. .. ..
22 2,073 2,040 33 8 8 0 87 .. .. 85 .. .. 19 .. ..
23 79 70 9 0 0 0 .. .. .. .. .. .. 0 0 0
24 2,517 2,376 141 25 25 0 59 56 3 47 44 3 9 .. ..
25 4,280 4,219 61 10 .. .. 71 71 0 134 .. .. 15 10 5
26 4,401 4,316 85 13 13 0 35 32 3 133 129 4 8 .. ..
27 1,244 1,175 69 0 0 0 13 .. .. .. .. .. 5 .. ..
28 9,795 9,710 85 19 19 0 105 .. .. 186 .. .. 14 .. ..
29 11,799 11,570 229 12 12 0 81 77 4 104 97 7 16 .. ..
30 248 243 5 .. .. .. .. .. .. 9 9 0 0 0 0
31 3,123 3,042 81 8 8 0 30 26 4 39 36 3 11 11 0
32 885 837 48 .. .. .. 18 18 0 26 22 4 0 0 0
33 1,897 1,864 33 .. .. .. 32 .. .. 43 39 4 8 .. ..
34 872 778 94 3 3 0 10 10 0 11 11 0 .. .. ..
35 766 731 35 3 3 0 36 31 5 40 36 4 .. .. ..
36-37 8,760 8,707 53 30 30 0 157 149 8 264 250 14 8 8 0
40-41 51 .. .. .. .. .. 11 6 5 14 5 9 .. .. ..
G 49,337 49,104 233 404 402 2 2,162 2,145 17 3,545 3,527 18 441 437 4
50 5,979 5,964 15 41 .. .. 182 .. .. 958 .. .. 79 .. ..
51 32,269 32,161 108 217 .. .. 1,615 1,609 6 2,044 2,036 8 289 .. ..
52 11,089 10,979 110 146 .. .. 365 .. .. 543 .. .. 73 .. ..
Other act. 11,300 10,992 308 931 142 11 1,056 985 71 1,533 1,454 74 330 303 27
01-05 : : : : : : 141 136 5 157 148 9 5 5 0
45 2,672 2,637 35 21 .. .. 158 151 7 224 209 15 26 26 0
60-64 2,066 1,962 104 78 74 4 297 280 17 669 647 21 50 44 6
65-67 186 152 34 2 .. .. 16 11 5 14 10 4 57 47 10
70-74 4,980 4,894 86 28 .. .. 296 288 8 320 312 5 125 119 6
Others 1,396 1,347 49 24 21 3 138 109 29 149 128 20 49 44 5
Unknown 0 0 0 778 0 0 10 10 0 0 0 0 18 18 0
: = Data not available.. = Confidential data

4�External Trade by Enterprise Characteristics – Results of the Standardisation exercise 2006
Tables II
Table 1.4a: Exports by activity sector and size-class (number of enterprises) – Part 3
Number of enterprises
Activity sectorReporting country and size-class
HU AT PL SI SK
Total 0-249 250+ Total 0-249 250+ Total 0-249 250+ Total 0-249 250+ Total 0-249 250+
Total 20,891 19,289 769 20,860 20,136 724 49,928 48,143 1,785 9,269 8,964 305 15,416 14,001 432
C-E 8,045 7,312 541 5,716 5,284 432 24,268 22,952 1,316 4,087 3,875 212 5,448 4,900 324
10-14 49 .. .. 44 .. .. 105 .. .. 25 .. .. 38 32 6
15-16 754 663 82 348 314 34 1,466 1,245 221 124 102 22 382 338 33
17 364 333 24 288 277 11 956 896 60 157 142 15 197 178 15
18 541 482 48 129 124 5 2,016 1,947 69 131 123 8 375 350 18
19 190 171 17 65 61 4 667 646 21 58 52 6 151 136 12
20 513 488 10 418 399 19 3,045 2,989 56 392 383 9 737 694 5
21 122 107 11 101 79 22 348 327 21 72 65 7 72 64 6
22 339 314 11 321 313 8 758 735 23 227 221 6 266 240 8
23 5 .. .. 6 .. .. 30 20 10 3 .. .. 6 .. ..
24 252 227 22 252 230 22 740 668 72 91 80 11 135 120 13
25 661 621 25 323 298 25 1,972 1,914 58 430 418 12 338 318 12
26 355 327 22 260 236 24 1,231 1,139 92 126 117 9 220 189 24
27 147 128 17 123 88 35 309 257 52 70 62 8 65 49 14
28 1,220 1,165 16 810 771 39 3,078 2,981 97 936 921 15 938 865 18
29 816 753 44 926 847 79 1,664 1,564 100 368 352 16 486 431 40
30 36 .. .. 28 .. .. 71 .. .. 22 .. .. 21 .. ..
31 312 247 55 227 203 24 677 617 60 193 176 17 264 220 32
32 207 167 32 93 75 18 228 212 16 92 82 10 83 70 10
33 302 287 9 211 205 6 592 565 27 124 120 4 110 98 7
34 202 155 42 123 106 17 550 476 74 55 50 5 83 66 16
35 73 63 9 44 39 5 359 314 45 29 25 4 47 41 6
36-37 541 513 16 545 528 17 3,358 3,253 105 341 325 16 404 366 10
40-41 44 25 17 31 15 16 48 29 19 21 10 11 30 13 15
G 8,094 7,739 49 11,020 10,884 136 17,764 17,627 137 3,247 3,219 28 6,921 6,374 30
50 749 717 2 2,212 2,192 20 1,553 1,542 11 305 301 4 397 384 3
51 5,909 5,666 22 6,667 6,596 71 13,460 13,373 87 2,544 2,536 8 4,511 4,261 15
52 1,436 1,356 25 2,141 2,096 45 2,751 2,712 39 398 382 16 2,013 1,729 12
Other act. 4,752 4,238 179 4,124 3,968 156 7,896 7,564 332 1,935 1,870 65 3,046 2,727 78
01-05 1,098 1,031 34 182 180 2 : : : : : : 436 386 10
45 513 487 12 840 807 33 1,342 1,282 60 371 358 13 555 507 11
60-64 509 463 34 752 717 35 2,197 2,139 58 441 423 18 387 344 19
65-67 36 27 8 44 30 14 100 89 11 25 20 5 28 22 3
70-74 1,727 1,613 23 1,805 1,774 31 2,386 2,305 81 875 868 7 1,282 1,166 13
Others 754 613 68 501 460 41 899 802 97 223 201 22 354 299 22
Unknown 115 4 0 0 0 0 41 39 2 0 0 0 4 3 0
: = Data not available.. = Confidential data

46 External Trade by Enterprise Characteristics – Results of the Standardisation exercise 2006
TablesII
Table 1.4a: Exports by activity sector and size-class (number of enterprises) – Part 4
Number of enterprises
Activity sectorReporting country and size-class
FI SE IS NO
Total 0-249 250+ Total 0-249 250+ Total 0-249 250+ Total 0-249 250+
Total 9,395 8,738 416 31,573 30,633 940 1,126 1,086 40 16,913 16,153 472
C-E 3,676 3,415 226 9,783 9,376 407 316 305 11 4,438 4,228 174
10-14 25 .. .. 79 76 3 4 4 0 200 177 19
15-16 135 113 22 314 278 36 104 98 6 427 391 36
17 134 130 3 300 294 6 9 9 0 172 171 0
18 146 141 3 124 .. .. 8 8 0 61 59 0
19 62 .. .. 72 .. .. 5 5 0 13 13 0
20 351 336 13 704 684 20 3 3 0 295 291 3
21 84 62 22 215 175 40 .. .. .. 74 66 7
22 177 166 9 931 911 20 22 .. .. 392 380 9
23 3 .. .. 14 10 4 0 0 0 3 3 0
24 147 120 19 357 332 25 20 .. .. 132 113 17
25 245 230 13 633 623 10 14 14 0 229 .. ..
26 128 114 13 245 227 18 7 7 0 153 142 10
27 49 40 9 182 158 24 6 .. .. 83 71 12
28 464 449 11 1,669 1,651 18 26 26 0 440 .. ..
29 612 574 33 1,435 1,371 64 30 .. .. 592 579 10
30 11 11 0 80 .. .. 0 0 0 12 12 0
31 145 135 10 421 406 15 12 12 0 197 193 4
32 105 91 14 200 183 17 3 3 0 80 .. ..
33 185 172 11 452 435 17 11 11 0 135 129 4
34 70 62 6 316 279 37 .. .. .. 75 70 5
35 78 71 6 249 240 9 7 7 0 292 267 23
36-37 312 304 5 739 731 8 19 19 0 338 330 5
40-41 8 .. .. 52 40 12 3 .. .. 43 34 6
G 4,035 3,815 73 12,313 12,198 115 501 492 9 8,139 7,941 86
50 428 393 15 1,445 1,424 21 32 32 0 669 643 6
51 3,030 2,877 36 8,686 8,632 54 347 344 3 5,344 5,248 30
52 577 545 22 2,182 2,142 40 122 116 6 2,126 2,050 50
Other act. 1,684 1,508 117 9,477 9,059 418 309 289 20 4,336 3,984 212
01-05 115 .. .. 1,128 1,120 8 81 76 3 425 421 3
45 270 249 15 810 784 26 28 .. .. 597 560 23
60-64 358 316 33 1,143 1,080 63 47 41 6 909 844 49
65-67 43 .. .. 127 111 16 4 .. .. 49 35 11
70-74 722 666 29 3,647 3,544 103 86 .. .. 1,643 1,546 48
Others 167 124 38 1,157 955 202 62 58 4 646 537 79
Unknown 9 4 0 1,465 1,465 0 1 .. .. 67 41 0
: = Data not available.. = Confidential data

47External Trade by Enterprise Characteristics – Results of the Standardisation exercise 2006
Tables II
Table 1.4b: Exports by activity sector and size-class (€ million) – Part 1
€ million
Activity sectorReporting country and size-class
BE CZ DK EE FR
Total 0-249 250+ Total 0-249 250+ Total 0-249 250+ Total 0-249 250+ Total 0-249 250+
Total 57,752 27,639 28,886 43,053 14,259 28,149 19,739 10,229 8,824 4,000 2,534 1,466 118,590 48,071 67,079
C-E 23,012 5,186 17,826 36,443 9,437 26,906 12,719 4,738 7,981 3,322 1,882 1,439 86,785 24,512 62,063
10-14 15 5 10 302 124 171 129 .. .. 31 .. .. 130 75 56
15-16 1,416 789 627 1,018 319 698 2,679 510 2,168 229 172 56 6,020 2,108 3,906
17 1,222 610 612 1,326 592 730 176 .. .. 254 93 161 1,584 973 610
18 322 226 96 494 228 265 157 .. .. 241 157 84 2,000 1,346 650
19 51 17 33 164 117 47 93 .. .. 63 .. .. 760 262 498
20 267 103 164 744 399 340 58 33 25 432 347 85 409 362 42
21 289 45 244 781 168 613 140 67 73 62 .. .. 1,263 236 1,027
22 43 37 6 261 96 164 79 61 18 13 13 0 316 205 110
23 1,516 59 1,457 229 5 224 156 .. .. 15 .. .. 2,274 379 1,895
24 6,728 1,049 5,679 1,880 480 1,398 2,707 535 2,172 169 .. .. 15,006 3,563 11,286
25 753 363 390 2,167 848 1,316 453 215 238 108 100 8 1,991 728 1,263
26 521 84 437 1,491 402 1,086 123 58 65 70 .. .. 1,490 370 1,120
27 1,924 211 1,713 1,395 315 1,080 141 58 83 17 17 0 3,126 567 2,559
28 571 351 220 2,696 1,563 1,119 363 281 83 207 .. .. 2,175 1,127 1,047
29 2,032 444 1,589 2,928 1,328 1,572 2,374 1,121 1,253 82 76 6 8,737 3,286 5,445
30 30 30 0 2,489 61 2,428 79 79 0 0 0 0 552 116 436
31 621 152 469 3,185 708 2,463 676 142 534 157 .. .. 4,145 672 3,458
32 690 99 591 2,122 333 1,782 234 160 75 660 65 595 6,973 582 6,391
33 238 89 149 554 162 392 834 461 373 75 .. .. 4,122 1,405 2,717
34 2,973 49 2,923 7,952 438 7,514 99 60 39 91 .. .. 9,990 4,551 5,439
35 302 32 270 482 109 373 191 142 49 44 .. .. 10,915 572 10,344
36-37 484 342 142 1,388 619 763 772 305 468 258 192 66 1,879 1,014 851
40-41 2 0 2 393 25 368 6 0 5 43 0 42 928 13 914
G 7,022 5,915 1,107 4,654 3,653 846 4,825 4,359 466 485 478 7 22,117 19,159 2,933
50 1,185 835 350 283 164 116 257 223 34 30 .. .. 1,418 1,239 178
51 5,630 4,920 710 3,713 2,914 711 4,411 4,035 375 416 .. .. 19,350 16,924 2,404
52 207 160 47 659 575 18 157 100 57 40 38 2 1,349 996 351
Other act. 27,718 16,538 9,952 1,956 1,169 397 2,195 1,132 377 193 174 19 9,688 4,401 2,084
01-05 0 0 0 : : : 32 32 0 92 .. .. 449 320 88
45 72 47 25 119 86 29 61 23 38 12 10 2 519 298 220
60-64 347 332 15 164 77 82 773 595 177 40 35 6 1,341 514 827
65-67 17 12 5 14 11 1 8 8 0 4 4 0 190 128 3
70-74 16,266 16,116 150 1,265 939 273 416 258 158 30 .. .. 3,933 2,982 930
Others 9,789 31 9,758 77 56 12 59 55 4 14 14 0 171 151 15
Unknown 1,227 0 0 317 0 0 847 161 0 0 0 0 3,085 7 0
: = Data not available.. = Confidential data

48 External Trade by Enterprise Characteristics – Results of the Standardisation exercise 2006
TablesII
Table 1.4b: Exports by activity sector and size-class (€ million) – Part 2
€ million
Activity sectorReporting country and size-class
IT CY LV LT LU
Total 0-249 250+ Total 0-249 250+ Total 0-249 250+ Total 0-249 250+ Total 0-249 250+
Total 116,055 67,419 48,635 265 98 7 2,547 1,663 884 6,068 2,419 3,649 1,374 243 1,132
C-E 97,717 51,405 46,311 69 64 5 1,798 972 826 4,866 1,329 3,537 1,119 102 1,017
10-14 709 .. .. 0 0 0 29 .. .. 67 67 0 0 0 0
15-16 4,274 2,726 1,548 28 24 4 159 73 86 456 85 371 4 .. ..
17 5,673 3,654 2,019 0 0 0 109 43 66 305 158 147 99 .. ..
18 5,204 3,092 2,112 1 1 0 174 90 85 521 226 295 0 0 0
19 6,114 4,865 1,249 0 0 0 3 3 0 25 14 10 0 0 0
20 618 554 64 0 0 0 545 327 218 291 190 101 .. .. ..
21 1,145 577 568 3 3 0 19 19 0 33 .. .. .. .. ..
22 428 352 77 1 1 0 14 .. .. 21 .. .. 8 .. ..
23 2,175 66 2,109 0 0 0 .. .. .. .. .. .. 0 0 0
24 9,970 4,195 5,776 14 14 0 89 46 43 315 53 262 58 .. ..
25 3,343 2,273 1,069 3 .. .. 27 27 0 144 .. .. 149 10 139
26 3,304 1,997 1,306 3 3 0 62 23 38 40 19 20 26 .. ..
27 3,137 1,094 2,043 0 0 0 213 .. .. .. .. .. 437 .. ..
28 4,789 3,821 968 1 1 0 57 .. .. 63 .. .. 58 .. ..
29 22,438 12,014 10,424 4 4 0 44 28 16 122 35 86 219 .. ..
30 895 110 785 .. .. .. .. .. .. 15 15 0 0 0 0
31 3,336 1,892 1,444 1 1 0 55 24 31 166 28 138 10 10 0
32 3,014 445 2,569 .. .. .. 23 23 0 227 21 206 0 0 0
33 2,475 1,404 1,071 .. .. .. 22 .. .. 43 23 20 30 .. ..
34 5,041 782 4,259 0 0 0 6 6 0 11 11 0 .. .. ..
35 3,619 727 2,893 1 1 0 26 5 21 509 31 478 .. .. ..
36-37 5,993 4,661 1,332 10 10 0 118 64 53 313 162 151 0 0 0
40-41 22 .. .. .. .. .. 1 0 1 89 0 89 .. .. ..
G 14,254 13,564 690 28 28 0 555 550 6 979 955 24 96 96 0
50 663 624 39 2 .. .. 8 .. .. 294 .. .. 5 .. ..
51 12,268 11,760 508 16 .. .. 530 525 4 643 630 14 87 .. ..
52 1,323 1,180 142 10 .. .. 17 .. .. 41 .. .. 4 .. ..
Other act. 4,084 2,450 1,634 168 7 2 194 142 53 223 135 88 160 45 114
01-05 : : : : : : 63 26 37 44 34 11 0 0 0
45 493 359 134 1 .. .. 9 8 1 19 18 1 1 1 0
60-64 1,315 757 558 4 2 2 70 70 1 125 50 74 78 2 76
65-67 58 55 2 0 .. .. 2 2 0 2 1 0 1 1 0
70-74 1,984 1,205 779 2 .. .. 44 31 13 24 24 0 48 10 38
Others 235 74 161 1 1 0 6 5 1 9 8 1 1 1 0
Unknown 0 0 0 159 0 0 0 0 0 0 0 0 30 30 0
: = Data not available.. = Confidential data

4�External Trade by Enterprise Characteristics – Results of the Standardisation exercise 2006
Tables II
Table 1.4b: Exports by activity sector and size-class (€ million) – Part 3
€ million
Activity sectorReporting country and size-class
HU AT PL SI SK
Total 0-249 250+ Total 0-249 250+ Total 0-249 250+ Total 0-249 250+ Total 0-249 250+
Total 38,096 8,847 29,174 32,844 18,397 14,447 47,408 18,396 29,012 11,245 3,506 7,739 19,306 5,139 14,124
C-E 35,157 6,238 28,886 20,414 7,870 12,544 39,458 11,580 27,877 10,298 2,713 7,585 17,496 3,492 13,994
10-14 9 .. .. 66 .. .. 807 .. .. 11 10 0 22 15 6
15-16 1,872 630 1,242 536 312 224 2,533 1,239 1,294 353 65 288 416 198 217
17 586 283 302 485 322 163 1,008 489 519 574 141 433 326 157 168
18 1,169 349 818 281 154 127 1,665 1,081 584 247 60 188 474 238 236
19 400 206 193 434 90 345 372 186 186 245 48 197 449 204 244
20 325 141 183 781 371 410 1,422 752 670 279 149 130 249 207 42
21 479 116 363 909 282 628 991 269 722 356 42 314 512 148 363
22 41 26 14 134 67 67 251 122 129 66 21 45 127 71 56
23 647 .. .. 336 .. .. 558 38 520 11 11 .. 1,019 .. ..
24 2,113 453 1,658 2,571 879 1,692 2,383 421 1,961 1,563 320 1,244 693 142 551
25 1,090 538 550 894 378 516 2,023 907 1,116 672 212 459 755 245 510
26 432 220 213 873 208 665 1,031 409 622 265 114 151 452 94 358
27 857 144 713 1,228 437 791 1,492 276 1,217 623 112 512 1,884 102 1,782
28 819 652 160 1,187 542 645 2,463 1,507 956 856 372 484 644 412 231
29 1,687 617 1,066 2,832 1,404 1,428 2,154 878 1,277 1,286 348 938 1,163 257 905
30 1,943 .. .. 106 .. .. 304 .. .. 10 10 .. 59 .. ..
31 3,388 478 2,909 1,293 552 741 2,565 512 2,052 587 127 460 1,177 232 945
32 8,695 345 8,350 1,357 107 1,250 1,743 127 1,616 344 81 263 729 169 560
33 300 168 127 515 334 181 319 162 157 267 102 165 73 34 39
34 7,785 447 7,337 2,210 445 1,765 6,960 495 6,465 1,125 104 1,021 5,191 348 4,842
35 127 44 83 494 45 449 2,733 404 2,329 111 34 77 174 56 118
36-37 370 239 130 688 320 368 3,308 1,160 2,148 403 231 172 743 148 595
40-41 23 4 16 204 180 24 373 9 364 45 1 44 167 1 160
G 2,265 2,112 122 6,133 5,590 543 6,736 5,881 855 591 534 56 1,213 1,156 41
50 87 81 4 860 721 139 277 198 79 79 71 7 41 41 0
51 2,046 1,905 114 4,963 4,656 307 6,231 5,463 767 480 441 40 961 914 38
52 132 126 4 310 213 96 228 219 8 32 23 9 212 202 3
Other act. 674 497 166 6,297 4,937 1,360 1,214 934 280 356 259 97 597 491 89
01-05 197 138 58 20 20 0 : : : : 0 0 57 40 16
45 44 36 8 148 106 42 182 111 71 49 42 7 45 36 8
60-64 98 56 42 1,233 289 943 207 147 60 19 12 7 112 56 56
65-67 4 1 3 132 2 130 19 14 5 2 2 0 1 1 0
70-74 286 236 45 4,682 4,450 231 493 423 70 277 199 78 350 332 7
Others 43 30 10 82 68 13 89 57 32 9 4 4 32 27 2
Unknown 3 0 0 0 0 0 2 2 0 0 0 0 0 0 0
: = Data not available.. = Confidential data
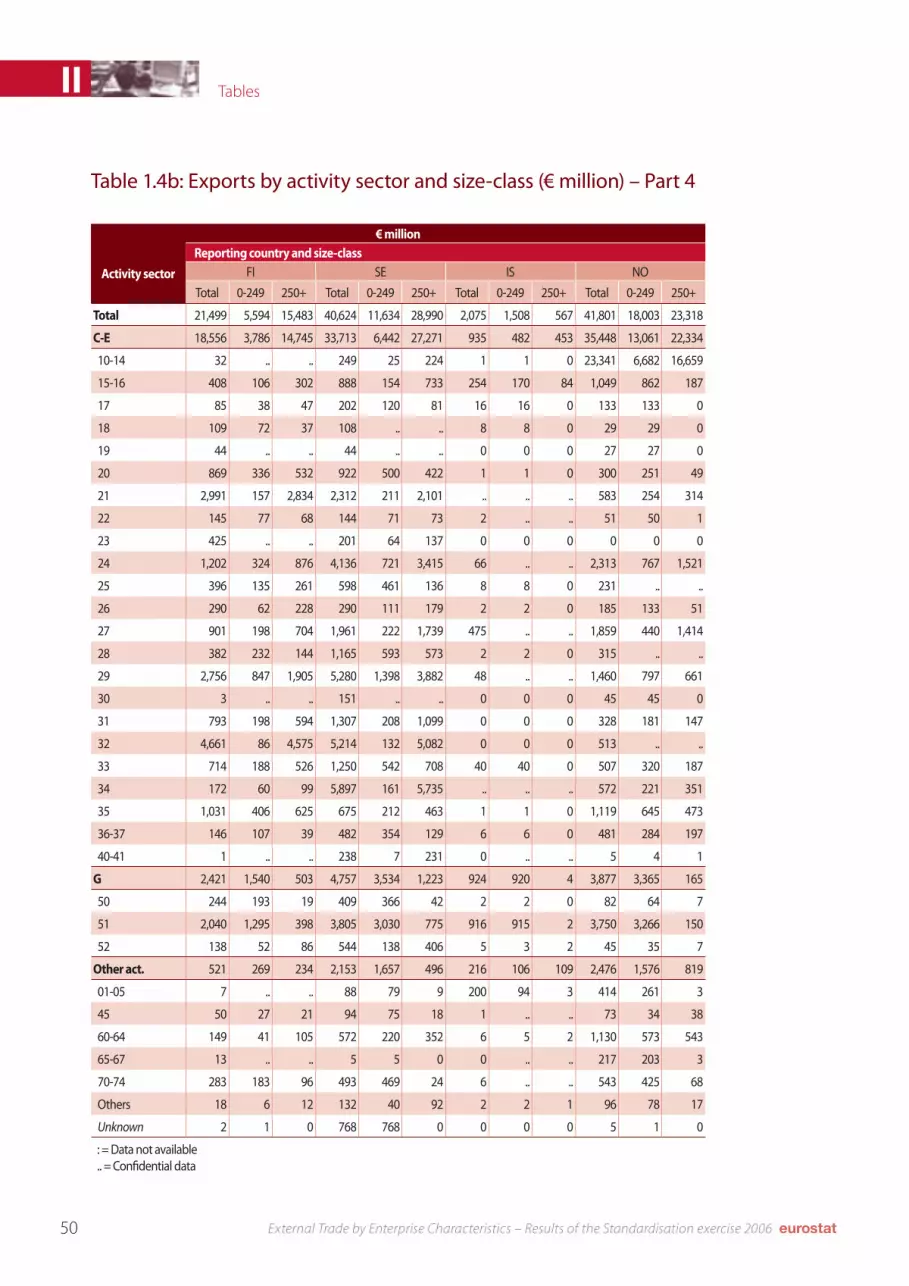
�0 External Trade by Enterprise Characteristics – Results of the Standardisation exercise 2006
TablesII
Table 1.4b: Exports by activity sector and size-class (€ million) – Part 4
€ million
Activity sectorReporting country and size-class
FI SE IS NO
Total 0-249 250+ Total 0-249 250+ Total 0-249 250+ Total 0-249 250+
Total 21,499 5,594 15,483 40,624 11,634 28,990 2,075 1,508 567 41,801 18,003 23,318
C-E 18,556 3,786 14,745 33,713 6,442 27,271 935 482 453 35,448 13,061 22,334
10-14 32 .. .. 249 25 224 1 1 0 23,341 6,682 16,659
15-16 408 106 302 888 154 733 254 170 84 1,049 862 187
17 85 38 47 202 120 81 16 16 0 133 133 0
18 109 72 37 108 .. .. 8 8 0 29 29 0
19 44 .. .. 44 .. .. 0 0 0 27 27 0
20 869 336 532 922 500 422 1 1 0 300 251 49
21 2,991 157 2,834 2,312 211 2,101 .. .. .. 583 254 314
22 145 77 68 144 71 73 2 .. .. 51 50 1
23 425 .. .. 201 64 137 0 0 0 0 0 0
24 1,202 324 876 4,136 721 3,415 66 .. .. 2,313 767 1,521
25 396 135 261 598 461 136 8 8 0 231 .. ..
26 290 62 228 290 111 179 2 2 0 185 133 51
27 901 198 704 1,961 222 1,739 475 .. .. 1,859 440 1,414
28 382 232 144 1,165 593 573 2 2 0 315 .. ..
29 2,756 847 1,905 5,280 1,398 3,882 48 .. .. 1,460 797 661
30 3 .. .. 151 .. .. 0 0 0 45 45 0
31 793 198 594 1,307 208 1,099 0 0 0 328 181 147
32 4,661 86 4,575 5,214 132 5,082 0 0 0 513 .. ..
33 714 188 526 1,250 542 708 40 40 0 507 320 187
34 172 60 99 5,897 161 5,735 .. .. .. 572 221 351
35 1,031 406 625 675 212 463 1 1 0 1,119 645 473
36-37 146 107 39 482 354 129 6 6 0 481 284 197
40-41 1 .. .. 238 7 231 0 .. .. 5 4 1
G 2,421 1,540 503 4,757 3,534 1,223 924 920 4 3,877 3,365 165
50 244 193 19 409 366 42 2 2 0 82 64 7
51 2,040 1,295 398 3,805 3,030 775 916 915 2 3,750 3,266 150
52 138 52 86 544 138 406 5 3 2 45 35 7
Other act. 521 269 234 2,153 1,657 496 216 106 109 2,476 1,576 819
01-05 7 .. .. 88 79 9 200 94 3 414 261 3
45 50 27 21 94 75 18 1 .. .. 73 34 38
60-64 149 41 105 572 220 352 6 5 2 1,130 573 543
65-67 13 .. .. 5 5 0 0 .. .. 217 203 3
70-74 283 183 96 493 469 24 6 .. .. 543 425 68
Others 18 6 12 132 40 92 2 2 1 96 78 17
Unknown 2 1 0 768 768 0 0 0 0 5 1 0
: = Data not available.. = Confidential data

�1External Trade by Enterprise Characteristics – Results of the Standardisation exercise 2006
Tables II
Table 2.1a: Arrivals by size-class and activity section (number of enterprises) – Part 1
Number of enterprises
Activity section and size-class
Reporting countryBE DK DE FR IT
Number Share of total
Share of class
Number Share of total
Share of class
Number Share of total
Share of class
Number Share of total
Share of class
Number Share of total
Share of class
All traders : 8,525 100.0 100.0 41,148 100.0 100.0 53,898 100.0 100.0 42,128 100.0 100.0
0-9 : 3,936 46.2 46.2 12,594 30.6 30.6 20,762 38.5 38.5 15,083 35.8 35.8
10-49 : 2,894 33.9 33.9 11,103 27.0 27.0 19,039 35.3 35.3 17,141 40.7 40.7
50-249 : 1,321 15.5 15.5 7,934 19.3 19.3 9,070 16.8 16.8 7,945 18.9 18.9
250 or more : 367 4.3 4.3 3,037 7.4 7.4 3,224 6.0 6.0 1,959 4.7 4.7
Unknown : 7 0.1 0.1 6,480 15.7 15.7 1,803 3.3 3.3 0 0.0 0.0
C-E : 2,410 28.3 100.0 13,570 33.0 100.0 18,296 33.9 100.0 21,840 51.8 100.0
0-9 : 403 4.7 16.7 1,644 4.0 12.1 2,930 5.4 16.0 3,376 8.0 15.5
10-49 : 1,057 12.4 43.9 3,786 9.2 27.9 7,377 13.7 40.3 10,472 24.9 47.9
50-249 : 738 8.7 30.6 5,045 12.3 37.2 5,862 10.9 32.0 6,563 15.6 30.1
250 or more : 212 2.5 8.8 2,115 5.1 15.6 2,064 3.8 11.3 1,429 3.4 6.5
Unknown : 0 0.0 0.0 980 2.4 7.2 63 0.1 0.3 0 0.0 0.0
G : 5,146 60.4 100.0 21,692 52.7 100.0 29,451 54.6 100.0 18,183 43.2 100.0
0-9 : 3,020 35.4 58.7 9,643 23.4 44.5 15,888 29.5 53.9 10,927 25.9 60.1
10-49 : 1,613 18.9 31.3 6,385 15.5 29.4 10,280 19.1 34.9 6,003 14.2 33.0
50-249 : 455 5.3 8.8 2,395 5.8 11.0 2,508 4.7 8.5 1,001 2.4 5.5
250 or more : 58 0.7 1.1 621 1.5 2.9 668 1.2 2.3 252 0.6 1.4
Unknown : 0 0.0 0.0 2,648 6.4 12.2 107 0.2 0.4 0 0.0 0.0
Others : 969 11.4 100.0 5,886 14.3 100.0 6,151 11.4 100.0 2,105 5.0 100.0
0-9 : 513 6.0 52.9 1,307 3.2 22.2 1,944 3.6 31.6 780 1.9 37.1
10-49 : 224 2.6 23.1 932 2.3 15.8 1,382 2.6 22.5 666 1.6 31.6
50-249 : 128 1.5 13.2 494 1.2 8.4 700 1.3 11.4 381 0.9 18.1
250 or more : 97 1.1 10.0 301 0.7 5.1 492 0.9 8.0 278 0.7 13.2
Unknown : 7 0.1 0.7 2,852 6.9 48.5 1,633 3.0 26.5 0 0.0 0.0
: = Data not available

�2 External Trade by Enterprise Characteristics – Results of the Standardisation exercise 2006
TablesII
Table 2.1a: Arrivals by size-class and activity section (number of enterprises) – Part 2
Number of enterprises
Activity section and size-class
Reporting countryCY LU AT FI SE
Number Share of total
Share of class
Number Share of total
Share of class
Number Share of total
Share of class
Number Share of total
Share of class
Number Share of total
Share of class
All traders 10,323 100.0 100.0 4,294 100.0 100.0 17,399 100.0 100.0 8,283 100.0 100.0 12,671 100.0 100.0
0-9 3,705 35.9 35.9 2,653 61.8 61.8 8,880 51.0 51.0 4,379 52.9 52.9 6,086 48.0 48.0
10-49 1,196 11.6 11.6 1,150 26.8 26.8 5,300 30.5 30.5 2,242 27.1 27.1 4,127 32.6 32.6
50-249 266 2.6 2.6 387 9.0 9.0 2,387 13.7 13.7 1,006 12.1 12.1 1,774 14.0 14.0
250 or more 52 0.5 0.5 104 2.4 2.4 832 4.8 4.8 438 5.3 5.3 684 5.4 5.4
Unknown 5,104 49.4 49.4 0 0.0 0.0 0 0.0 0.0 218 2.6 2.6 0 0.0 0.0
C-E 989 9.6 100.0 386 9.0 100.0 4,321 24.8 100.0 2,270 27.4 100.0 3,693 29.1 100.0
0-9 550 5.3 55.6 118 2.7 30.6 1,033 5.9 23.9 508 6.1 22.4 724 5.7 19.6
10-49 360 3.5 36.4 163 3.8 42.2 1,609 9.2 37.2 869 10.5 38.3 1,455 11.5 39.4
50-249 69 0.7 7.0 77 1.8 19.9 1,242 7.1 28.7 633 7.6 27.9 1,127 8.9 30.5
250 or more 10 0.1 1.0 28 0.7 7.3 437 2.5 10.1 233 2.8 10.3 387 3.1 10.5
Unknown 0 0.0 0.0 0 0.0 0.0 0 0.0 0.0 27 0.3 1.2 0 0.0 0.0
G 3,457 33.5 100.0 2,392 55.7 100.0 10,358 59.5 100.0 4,926 59.5 100.0 7,324 57.8 100.0
0-9 2,744 26.6 79.4 1,802 42.0 75.3 6,445 37.0 62.2 3,330 40.2 67.6 4,469 35.3 61.0
10-49 610 5.9 17.6 491 11.4 20.5 3,014 17.3 29.1 1,102 13.3 22.4 2,294 18.1 31.3
50-249 97 0.9 2.8 92 2.1 3.8 732 4.2 7.1 248 3.0 5.0 451 3.6 6.2
250 or more 6 0.1 0.2 7 0.2 0.3 167 1.0 1.6 82 1.0 1.7 110 0.9 1.5
Unknown 0 0.0 0.0 0 0.0 0.0 0 0.0 0.0 164 2.0 3.3 0 0.0 0.0
Others 5,877 56.9 100.0 1,516 35.3 100.0 2,720 15.6 100.0 1,087 13.1 100.0 1,654 13.1 100.0
0-9 411 4.0 7.0 733 17.1 48.4 1,402 8.1 51.5 541 6.5 49.8 893 7.0 54.0
10-49 226 2.2 3.8 496 11.6 32.7 677 3.9 24.9 271 3.3 24.9 378 3.0 22.9
50-249 100 1.0 1.7 218 5.1 14.4 413 2.4 15.2 125 1.5 11.5 196 1.5 11.9
250 or more 36 0.3 0.6 69 1.6 4.6 228 1.3 8.4 123 1.5 11.3 187 1.5 11.3
Unknown 5,104 49.4 86.8 0 0.0 0.0 0 0.0 0.0 27 0.3 2.5 0 0.0 0.0
: = Data not available

�3External Trade by Enterprise Characteristics – Results of the Standardisation exercise 2006
Tables II
Table 2.1b: Arrivals by size-class and activity section (€ million) – Part 1
€ million
Activity section and size-class
Reporting countryBE DK DE FR IT
Value Share of total
Share of class
Value Share of total
Share of class
Value Share of total
Share of class
Value Share of total
Share of class
Value Share of total
Share of class
All traders 142,830 100.0 100.0 34,874 100.0 100.0 211,754 100.0 100.0 218,870 100.0 100.0 145,218 100.0 100.0
0-9 51,725 36.2 36.2 6,474 18.6 18.6 19,796 9.3 9.3 35,301 16.1 16.1 19,965 13.7 13.7
10-49 18,524 13.0 13.0 7,020 20.1 20.1 34,121 16.1 16.1 32,897 15.0 15.0 26,118 18.0 18.0
50-249 18,061 12.6 12.6 8,326 23.9 23.9 35,858 16.9 16.9 38,140 17.4 17.4 38,086 26.2 26.2
250 or more 54,510 38.2 38.2 8,309 23.8 23.8 97,040 45.8 45.8 107,928 49.3 49.3 61,049 42.0 42.0
Unknown 10 0.0 0.0 4,746 13.6 13.6 24,939 11.8 11.8 4,604 2.1 2.1 0 0.0 0.0
C-E 49,981 35.0 100.0 9,025 25.9 100.0 86,798 41.0 100.0 108,196 49.4 100.0 68,817 47.4 100.0
0-9 2,181 1.5 4.4 490 1.4 5.4 1,723 0.8 2.0 7,775 3.6 7.2 5,706 3.9 8.3
10-49 4,482 3.1 9.0 1,052 3.0 11.7 6,280 3.0 7.2 8,015 3.7 7.4 9,781 6.7 14.2
50-249 7,665 5.4 15.3 2,617 7.5 29.0 11,732 5.5 13.5 17,857 8.2 16.5 18,565 12.8 27.0
250 or more 35,654 25.0 71.3 4,866 14.0 53.9 63,898 30.2 73.6 73,960 33.8 68.4 34,765 23.9 50.5
Unknown 0 0.0 0.0 0 0.0 0.0 3,163 1.5 3.6 590 0.3 0.5 0 0.0 0.0
G 45,878 32.1 100.0 18,650 53.5 100.0 73,740 34.8 100.0 99,541 45.5 100.0 69,948 48.2 100.0
0-9 9,486 6.6 20.7 4,866 14.0 26.1 9,938 4.7 13.5 24,420 11.2 24.5 13,735 9.5 19.6
10-49 12,068 8.4 26.3 5,637 16.2 30.2 15,775 7.4 21.4 23,620 10.8 23.7 15,386 10.6 22.0
50-249 9,677 6.8 21.1 5,479 15.7 29.4 18,575 8.8 25.2 18,984 8.7 19.1 18,456 12.7 26.4
250 or more 14,646 10.3 31.9 2,667 7.6 14.3 24,011 11.3 32.6 31,790 14.5 31.9 22,370 15.4 32.0
Unknown 0 0.0 0.0 0 0.0 0.0 5,440 2.6 7.4 726 0.3 0.7 0 0.0 0.0
Others 46,971 32.9 100.0 7,199 20.6 100.0 51,217 24.2 100.0 11,133 5.1 100.0 6,454 4.4 100.0
0-9 40,058 28.0 85.3 1,118 3.2 15.5 8,135 3.8 15.9 3,106 1.4 27.9 524 0.4 8.1
10-49 1,974 1.4 4.2 330 0.9 4.6 12,066 5.7 23.6 1,261 0.6 11.3 951 0.7 14.7
50-249 719 0.5 1.5 230 0.7 3.2 5,551 2.6 10.8 1,298 0.6 11.7 1,065 0.7 16.5
250 or more 4,210 2.9 9.0 776 2.2 10.8 9,130 4.3 17.8 2,179 1.0 19.6 3,915 2.7 60.7
Unknown 10 0.0 0.0 4,746 13.6 65.9 16,336 7.7 31.9 3,288 1.5 29.5 0 0.0 0.0

�4 External Trade by Enterprise Characteristics – Results of the Standardisation exercise 2006
TablesII
Table 2.1b: Arrivals by size-class and activity section (€ million) – Part 2
€ million
Activity section and size-class
Reporting countryCY LU AT FI SE
Value Share of total
Share of class
Value Share of total
Share of class
Value Share of total
Share of class
Value Share of total
Share of class
Value Share of total
Share of class
All traders 3,000 100.0 100.0 10,745 100.0 100.0 54,333 100.0 100.0 22,838 100.0 100.0 46,023 100.0 100.0
0-9 455 15.2 15.2 2,244 20.9 20.9 11,116 20.5 20.5 2,263 9.9 9.9 5,627 12.2 12.2
10-49 771 25.7 25.7 2,653 24.7 24.7 9,168 16.9 16.9 4,430 19.4 19.4 8,541 18.6 18.6
50-249 913 30.4 30.4 2,307 21.5 21.5 14,489 26.7 26.7 5,885 25.8 25.8 10,112 22.0 22.0
250 or more 320 10.7 10.7 3,540 32.9 32.9 19,560 36.0 36.0 9,179 40.2 40.2 21,742 47.2 47.2
Unknown 540 18.0 18.0 0 0.0 0.0 0 0.0 0.0 1,081 4.7 4.7 0 0.0 0.0
C-E 430 14.3 100.0 3,608 33.6 100.0 20,580 37.9 100.0 8,112 35.5 100.0 19,445 42.3 100.0
0-9 38 1.3 8.9 40 0.4 1.1 1,780 3.3 8.6 169 0.7 2.1 411 0.9 2.1
10-49 117 3.9 27.2 453 4.2 12.6 1,162 2.1 5.6 643 2.8 7.9 1,321 2.9 6.8
50-249 111 3.7 25.7 590 5.5 16.4 5,825 10.7 28.3 1,662 7.3 20.5 3,440 7.5 17.7
250 or more 164 5.5 38.2 2,524 23.5 70.0 11,814 21.7 57.4 5,607 24.6 69.1 14,272 31.0 73.4
Unknown 0 0.0 0.0 0 0.0 0.0 0 0.0 0.0 32 0.1 0.4 0 0.0 0.0
G 1,850 61.7 100.0 5,662 52.7 100.0 29,427 54.2 100.0 13,852 60.7 100.0 23,057 50.1 100.0
0-9 397 13.2 21.5 1,447 13.5 25.6 6,721 12.4 22.8 1,962 8.6 14.2 3,983 8.7 17.3
10-49 604 20.1 32.6 1,908 17.8 33.7 7,539 13.9 25.6 3,650 16.0 26.4 6,872 14.9 29.8
50-249 763 25.4 41.2 1,523 14.2 26.9 8,233 15.2 28.0 4,095 17.9 29.6 6,411 13.9 27.8
250 or more 86 2.9 4.6 784 7.3 13.8 6,934 12.8 23.6 3,160 13.8 22.8 5,791 12.6 25.1
Unknown 0 0.0 0.0 0 0.0 0.0 0 0.0 0.0 984 4.3 7.1 0 0.0 0.0
Others 721 24.1 100.0 1,475 13.7 100.0 4,326 8.0 100.0 874 3.8 100.0 3,521 7.7 100.0
0-9 20 0.7 2.8 757 7.0 51.3 2,614 4.8 60.4 132 0.6 15.1 1,234 2.7 35.0
10-49 52 1.7 7.2 292 2.7 19.8 468 0.9 10.8 137 0.6 15.6 348 0.8 9.9
50-249 40 1.3 5.5 194 1.8 13.1 431 0.8 10.0 129 0.6 14.7 261 0.6 7.4
250 or more 70 2.3 9.6 232 2.2 15.8 812 1.5 18.8 412 1.8 47.1 1,679 3.6 47.7
Unknown 540 18.0 74.9 0 0.0 0.0 0 0.0 0.0 65 0.3 7.5 0 0.0 0.0

��External Trade by Enterprise Characteristics – Results of the Standardisation exercise 2006
Tables II
Table 2.2a: Imports by size-class and activity section – Part 1
Number of enterprises (number of enterprises)
Activity section and size-class
Reporting countryBE CZ DK EE FR
Number Share of total
Share of class
Number Share of total
Share of class
Number Share of total
Share of class
Number Share of total
Share of class
Number Share of total
Share of class
All traders : 57,229 100.0 100.0 17,347 100.0 100.0 11,120 100.0 100.0 73,427 100.0 100.0
0-9 : 19,782 34.6 34.6 11,513 66.4 66.4 7,302 65.7 65.7 38,526 52.5 52.5
10-49 : 12,415 21.7 21.7 3,839 22.1 22.1 2,689 24.2 24.2 18,537 25.2 25.2
50-249 : 5,281 9.2 9.2 1,551 8.9 8.9 946 8.5 8.5 8,568 11.7 11.7
250 or more : 1,485 2.6 2.6 435 2.5 2.5 183 1.6 1.6 3,380 4.6 4.6
Unknown : 18,266 31.9 31.9 9 0.1 0.1 0 0.0 0.0 4,416 6.0 6.0
C-E : 14,793 25.8 100.0 4,070 23.5 100.0 2,333 21.0 100.0 21,462 29.2 100.0
0-9 : 3,566 6.2 24.1 1,610 9.3 39.6 898 8.1 38.5 6,127 8.3 28.5
10-49 : 4,946 8.6 33.4 1,464 8.4 36.0 913 8.2 39.1 8,005 10.9 37.3
50-249 : 3,260 5.7 22.0 784 4.5 19.3 440 4.0 18.9 5,269 7.2 24.6
250 or more : 1,006 1.8 6.8 212 1.2 5.2 82 0.7 3.5 1,990 2.7 9.3
Unknown : 2,015 3.5 13.6 0 0.0 0.0 0 0.0 0.0 71 0.1 0.3
G : 23,692 41.4 100.0 9,625 55.5 100.0 5,283 47.5 100.0 33,893 46.2 100.0
0-9 : 11,349 19.8 47.9 7,371 42.5 76.6 4,274 38.4 80.9 24,058 32.8 71.0
10-49 : 4,597 8.0 19.4 1,739 10.0 18.1 879 7.9 16.6 7,353 10.0 21.7
50-249 : 758 1.3 3.2 457 2.6 4.7 115 1.0 2.2 1,824 2.5 5.4
250 or more : 102 0.2 0.4 58 0.3 0.6 15 0.1 0.3 530 0.7 1.6
Unknown : 6,886 12.0 29.1 0 0.0 0.0 0 0.0 0.0 128 0.2 0.4
Others : 18,744 32.8 100.0 3,652 21.1 100.0 3,504 31.5 100.0 18,072 24.6 100.0
0-9 : 4,867 8.5 26.0 2,532 14.6 69.3 2,130 19.2 60.8 8,341 11.4 46.2
10-49 : 2,872 5.0 15.3 636 3.7 17.4 897 8.1 25.6 3,179 4.3 17.6
50-249 : 1,263 2.2 6.7 310 1.8 8.5 391 3.5 11.2 1,475 2.0 8.2
250 or more : 377 0.7 2.0 165 1.0 4.5 86 0.8 2.5 860 1.2 4.8
Unknown : 9,365 16.4 50.0 9 0.1 0.2 0 0.0 0.0 4,217 5.7 23.3
: = Data not available

�6 External Trade by Enterprise Characteristics – Results of the Standardisation exercise 2006
TablesII
Table 2.2a: Imports by size-class and activity section – Part 2
Number of enterprises (number of enterprises)
Activity section and size-class
Reporting countryIT CY LV LT LU
Number Share of total
Share of class
Number Share of total
Share of class
Number Share of total
Share of class
Number Share of total
Share of class
Number Share of total
Share of class
All traders 94,154 100.0 100.0 8,034 100.0 100.0 13,436 100.0 100.0 11,689 100.0 100.0 1,897 100.0 100.0
0-9 53,358 56.7 56.7 2,791 34.7 34.7 7,258 54.0 54.0 6,034 51.6 51.6 1,111 58.6 58.6
10-49 29,478 31.3 31.3 1,021 12.7 12.7 4,350 32.4 32.4 3,746 32.0 32.0 445 23.5 23.5
50-249 9,316 9.9 9.9 236 2.9 2.9 1,504 11.2 11.2 1,550 13.3 13.3 253 13.3 13.3
250 or more 2,002 2.1 2.1 48 0.6 0.6 324 2.4 2.4 340 2.9 2.9 88 4.6 4.6
Unknown 0 0.0 0.0 3,938 49.0 49.0 0 0.0 0.0 19 0.2 0.2 0 0.0 0.0
C-E 44,442 47.2 100.0 689 8.6 100.0 2,290 17.0 100.0 2,385 20.4 100.0 171 9.0 100.0
0-9 14,991 15.9 33.7 348 4.3 50.5 714 5.3 31.2 652 5.6 27.3 36 1.9 21.1
10-49 20,422 21.7 46.0 273 3.4 39.6 981 7.3 42.8 955 8.2 40.0 52 2.7 30.4
50-249 7,599 8.1 17.1 58 0.7 8.4 496 3.7 21.7 610 5.2 25.6 56 3.0 32.7
250 or more 1,430 1.5 3.2 10 0.1 1.5 99 0.7 4.3 164 1.4 6.9 27 1.4 15.8
Unknown 0 0.0 0.0 0 0.0 0.0 0 0.0 0.0 4 0.0 0.2 0 0.0 0.0
G 39,747 42.2 100.0 2,781 34.6 100.0 6,917 51.5 100.0 6,163 52.7 100.0 870 45.9 100.0
0-9 31,906 33.9 80.3 2,108 26.2 75.8 4,828 35.9 69.8 4,088 35.0 66.3 634 33.4 72.9
10-49 6,776 7.2 17.0 571 7.1 20.5 1,773 13.2 25.6 1,770 15.1 28.7 177 9.3 20.3
50-249 894 0.9 2.2 96 1.2 3.5 286 2.1 4.1 285 2.4 4.6 54 2.8 6.2
250 or more 171 0.2 0.4 6 0.1 0.2 30 0.2 0.4 20 0.2 0.3 5 0.3 0.6
Unknown 0 0.0 0.0 0 0.0 0.0 0 0.0 0.0 0 0.0 0.0 0 0.0 0.0
Others 9,965 10.6 100.0 4,564 56.8 100.0 4,229 31.5 100.0 3,141 26.9 100.0 856 45.1 100.0
0-9 6,461 6.9 64.8 335 4.2 7.3 1,716 12.8 40.6 1,294 11.1 41.2 441 23.2 51.5
10-49 2,280 2.4 22.9 177 2.2 3.9 1,596 11.9 37.7 1,021 8.7 32.5 216 11.4 25.2
50-249 823 0.9 8.3 82 1.0 1.8 722 5.4 17.1 655 5.6 20.9 143 7.5 16.7
250 or more 401 0.4 4.0 32 0.4 0.7 195 1.5 4.6 156 1.3 5.0 56 3.0 6.5
Unknown 0 0.0 0.0 3,938 49.0 86.3 0 0.0 0.0 15 0.1 0.5 0 0.0 0.0
: = Data not available

�7External Trade by Enterprise Characteristics – Results of the Standardisation exercise 2006
Tables II
Table 2.2a: Imports by size-class and activity section – Part 3
Number of enterprises (number of enterprises)
Activity section and size-class
Reporting countryHU AT PL SI SK
Number Share of total
Share of class
Number Share of total
Share of class
Number Share of total
Share of class
Number Share of total
Share of class
Number Share of total
Share of class
All traders 37,158 100.0 100.0 23,939 100.0 100.0 79,931 100.0 100.0 17,004 100.0 100.0 29,738 100.0 100.0
0-9 23,793 64.0 64.0 15,108 63.1 63.1 54,974 68.8 68.8 10,993 64.6 64.6 18,559 62.4 62.4
10-49 7,367 19.8 19.8 5,605 23.4 23.4 14,877 18.6 18.6 4,436 26.1 26.1 5,418 18.2 18.2
50-249 2,918 7.9 7.9 2,423 10.1 10.1 7,582 9.5 9.5 1,197 7.0 7.0 2,115 7.1 7.1
250 or more 947 2.5 2.5 803 3.4 3.4 2,498 3.1 3.1 378 2.2 2.2 587 2.0 2.0
Unknown 2,133 5.7 5.7 0 0.0 0.0 0 0.0 0.0 0 0.0 0.0 3,059 10.3 10.3
C-E 9,621 25.9 100.0 5,959 24.9 100.0 22,639 28.3 100.0 5,183 30.5 100.0 7,132 24.0 100.0
0-9 4,189 11.3 43.5 2,462 10.3 41.3 10,016 12.5 44.2 2,874 16.9 55.5 3,349 11.3 47.0
10-49 2,989 8.0 31.1 1,862 7.8 31.2 6,524 8.2 28.8 1,465 8.6 28.3 1,958 6.6 27.5
50-249 1,603 4.3 16.7 1,197 5.0 20.1 4,650 5.8 20.5 623 3.7 12.0 1,031 3.5 14.5
250 or more 577 1.6 6.0 438 1.8 7.4 1,449 1.8 6.4 221 1.3 4.3 338 1.1 4.7
Unknown 263 0.7 2.7 0 0.0 0.0 0 0.0 0.0 0 0.0 0.0 456 1.5 6.4
G 16,830 45.3 100.0 12,073 50.4 100.0 37,112 46.4 100.0 6,546 38.5 100.0 13,920 46.8 100.0
0-9 12,825 34.5 76.2 8,909 37.2 73.8 30,636 38.3 82.6 4,640 27.3 70.9 10,131 34.1 72.8
10-49 2,475 6.7 14.7 2,416 10.1 20.0 5,129 6.4 13.8 1,623 9.5 24.8 1,802 6.1 12.9
50-249 418 1.1 2.5 610 2.5 5.1 1,166 1.5 3.1 249 1.5 3.8 268 0.9 1.9
250 or more 57 0.2 0.3 138 0.6 1.1 181 0.2 0.5 34 0.2 0.5 39 0.1 0.3
Unknown 1,055 2.8 6.3 0 0.0 0.0 0 0.0 0.0 0 0.0 0.0 1,680 5.6 12.1
Others 10,707 28.8 100.0 5,907 24.7 100.0 20,180 25.2 100.0 5,273 31.0 100.0 8,686 29.2 100.0
0-9 6,779 18.2 63.3 3,737 15.6 63.3 14,322 17.9 71.0 3,478 20.5 66.0 5,079 17.1 58.5
10-49 1,903 5.1 17.8 1,327 5.5 22.5 3,224 4.0 16.0 1,348 7.9 25.6 1,658 5.6 19.1
50-249 897 2.4 8.4 616 2.6 10.4 1,766 2.2 8.8 324 1.9 6.1 816 2.7 9.4
250 or more 313 0.8 2.9 227 0.9 3.8 868 1.1 4.3 123 0.7 2.3 210 0.7 2.4
Unknown 815 2.2 7.6 0 0.0 0.0 0 0.0 0.0 0 0.0 0.0 923 3.1 10.6
: = Data not available

�8 External Trade by Enterprise Characteristics – Results of the Standardisation exercise 2006
TablesII
Table 2.2a: Imports by size-class and activity section – Part 4
Number of enterprises (number of enterprises)
Activity section and size-class
Reporting countryFI SE IS NO
Number Share of total
Share of class
Number Share of total
Share of class
Number Share of total
Share of class
Number Share of total
Share of class
All traders 12,826 100.0 100.0 38,146 100.0 100.0 4,792 100.0 100.0 67,066 100.0 100.0
0-9 7,854 61.2 61.2 26,769 70.2 70.2 3,560 74.3 74.3 44,673 66.6 66.6
10-49 2,681 20.9 20.9 7,617 20.0 20.0 913 19.1 19.1 9,407 14.0 14.0
50-249 1,167 9.1 9.1 2,729 7.2 7.2 254 5.3 5.3 2,385 3.6 3.6
250 or more 551 4.3 4.3 1,031 2.7 2.7 65 1.4 1.4 784 1.2 1.2
Unknown 573 4.5 4.5 0 0.0 0.0 0 0.0 0.0 9,817 14.6 14.6
C-E 3,496 27.3 100.0 8,588 22.5 100.0 895 18.7 100.0 9,336 13.9 100.0
0-9 1,431 11.2 40.9 4,052 10.6 47.2 563 11.7 62.9 5,399 8.1 57.8
10-49 1,094 8.5 31.3 2,769 7.3 32.2 243 5.1 27.2 2,303 3.4 24.7
50-249 671 5.2 19.2 1,354 3.5 15.8 76 1.6 8.5 759 1.1 8.1
250 or more 238 1.9 6.8 413 1.1 4.8 13 0.3 1.5 182 0.3 1.9
Unknown 62 0.5 1.8 0 0.0 0.0 0 0.0 0.0 693 1.0 7.4
G 6,331 49.4 100.0 16,165 42.4 100.0 1,588 33.1 100.0 29,311 43.7 100.0
0-9 4,672 36.4 73.8 12,716 33.3 78.7 1,307 27.3 82.3 21,068 31.4 71.9
10-49 998 7.8 15.8 2,841 7.4 17.6 224 4.7 14.1 3,557 5.3 12.1
50-249 231 1.8 3.6 489 1.3 3.0 46 1.0 2.9 474 0.7 1.6
250 or more 77 0.6 1.2 119 0.3 0.7 11 0.2 0.7 100 0.1 0.3
Unknown 353 2.8 5.6 0 0.0 0.0 0 0.0 0.0 4,112 6.1 14.0
Others 2,999 23.4 100.0 13,393 35.1 100.0 2,309 48.2 100.0 28,419 42.4 100.0
0-9 1,751 13.7 58.4 10,001 26.2 74.7 1,690 35.3 73.2 18,206 27.1 64.1
10-49 589 4.6 19.6 2,007 5.3 15.0 446 9.3 19.3 3,547 5.3 12.5
50-249 265 2.1 8.8 886 2.3 6.6 132 2.8 5.7 1,152 1.7 4.1
250 or more 236 1.8 7.9 499 1.3 3.7 41 0.9 1.8 502 0.7 1.8
Unknown 158 1.2 5.3 0 0.0 0.0 0 0.0 0.0 5,012 7.5 17.6
: = Data not available

��External Trade by Enterprise Characteristics – Results of the Standardisation exercise 2006
Tables II
Table 2.2b: Imports by size-class and activity section (€ million) – Part 1
€ million
Activity section and size-class
Reporting countryBE CZ DK EE FR
Value Share of total
Share of class
Value Share of total
Share of class
Value Share of total
Share of class
Value Share of total
Share of class
Value Share of total
Share of class
All traders 59,695 100.0 100.0 45,236 100.0 100.0 15,691 100.0 100.0 5,682 100.0 100.0 101,319 100.0 100.0
0-9 27,866 46.7 46.7 3,245 7.2 7.2 4,328 27.6 27.6 1,204 21.2 21.2 15,992 15.8 15.8
10-49 6,468 10.8 10.8 7,578 16.8 16.8 3,581 22.8 22.8 1,604 28.2 28.2 13,624 13.4 13.4
50-249 4,036 6.8 6.8 11,111 24.6 24.6 3,112 19.8 19.8 1,584 27.9 27.9 15,483 15.3 15.3
250 or more 21,081 35.3 35.3 22,517 49.8 49.8 4,471 28.5 28.5 1,236 21.8 21.8 53,857 53.2 53.2
Unknown 244 0.4 0.4 785 1.7 1.7 200 1.3 1.3 0 0.0 0.0 2,364 2.3 2.3
C-E 14,702 24.6 100.0 25,295 42.4 100.0 4,412 28.1 100.0 2,260 39.8 100.0 60,398 59.6 100.0
0-9 1,444 2.4 9.8 424 0.7 1.7 275 1.8 6.2 99 1.7 4.4 3,659 3.6 6.1
10-49 1,448 2.4 9.8 1,673 2.8 6.6 600 3.8 13.6 352 6.2 15.6 3,960 3.9 6.6
50-249 1,834 3.1 12.5 4,781 8.0 18.9 1,136 7.2 25.7 754 13.3 33.4 7,313 7.2 12.1
250 or more 9,977 16.7 67.9 18,339 30.7 72.5 2,402 15.3 54.4 1,054 18.5 46.6 45,269 44.7 75.0
Unknown 0 0.0 0.0 79 0.1 0.3 0 0.0 0.0 0 0.0 0.0 197 0.2 0.3
G 15,676 26.3 100.0 15,381 25.8 100.0 7,952 50.7 100.0 2,679 47.1 100.0 31,473 31.1 100.0
0-9 5,049 8.5 32.2 2,366 4.0 15.4 2,468 15.7 31.0 840 14.8 31.4 10,123 10.0 32.2
10-49 4,695 7.9 30.0 5,255 8.8 34.2 2,250 14.3 28.3 1,118 19.7 41.7 8,445 8.3 26.8
50-249 1,967 3.3 12.6 5,513 9.2 35.8 1,465 9.3 18.4 603 10.6 22.5 7,181 7.1 22.8
250 or more 3,964 6.6 25.3 1,979 3.3 12.9 1,769 11.3 22.2 118 2.1 4.4 5,635 5.6 17.9
Unknown 0 0.0 0.0 267 0.4 1.7 0 0.0 0.0 0 0.0 0.0 90 0.1 0.3
Others 29,316 49.1 100.0 4,560 7.6 100.0 3,327 21.2 100.0 690 12.1 100.0 9,448 9.3 100.0
0-9 21,373 35.8 72.9 456 0.8 10.0 1,585 10.1 47.6 265 4.7 38.5 2,211 2.2 23.4
10-49 325 0.5 1.1 649 1.1 14.2 730 4.7 22.0 133 2.3 19.3 1,219 1.2 12.9
50-249 234 0.4 0.8 817 1.4 17.9 511 3.3 15.4 227 4.0 32.9 988 1.0 10.5
250 or more 7,140 12.0 24.4 2,199 3.7 48.2 301 1.9 9.0 64 1.1 9.3 2,953 2.9 31.3
Unknown 244 0.4 0.8 440 0.7 9.6 200 1.3 6.0 0 0.0 0.0 2,077 2.1 22.0

60 External Trade by Enterprise Characteristics – Results of the Standardisation exercise 2006
TablesII
Table 2.2b: Imports by size-class and activity section (€ million) – Part 2
€ million
Activity section and size-class
Reporting countryIT CY LV LT LU
Value Share of total
Share of class
Value Share of total
Share of class
Value Share of total
Share of class
Value Share of total
Share of class
Value Share of total
Share of class
All traders 109,189 100.0 100.0 1,411 100.0 100.0 4,547 100.0 100.0 8,239 100.0 100.0 1,056 100.0 100.0
0-9 12,406 11.4 11.4 223 15.8 15.8 612 13.4 13.4 922 11.2 11.2 246 23.3 23.3
10-49 18,612 17.0 17.0 369 26.1 26.1 1,380 30.3 30.3 1,937 23.5 23.5 95 9.0 9.0
50-249 22,929 21.0 21.0 395 28.0 28.0 1,512 33.3 33.3 1,965 23.8 23.8 148 14.1 14.1
250 or more 55,242 50.6 50.6 105 7.4 7.4 1,044 23.0 23.0 3,415 41.5 41.5 567 53.7 53.7
Unknown 0 0.0 0.0 320 22.7 22.7 0 0.0 0.0 1 0.0 0.0 0 0.0 0.0
C-E 70,427 64.5 100.0 189 13.4 100.0 1,320 29.0 100.0 3,854 46.8 100.0 530 50.2 100.0
0-9 2,766 2.5 3.9 14 1.0 7.4 26 0.6 2.0 54 0.7 1.4 1 0.1 0.2
10-49 8,909 8.2 12.6 39 2.8 20.9 170 3.7 12.8 337 4.1 8.7 20 1.9 3.9
50-249 13,131 12.0 18.6 52 3.7 27.4 436 9.6 33.0 647 7.9 16.8 37 3.5 7.0
250 or more 45,622 41.8 64.8 84 5.9 44.3 689 15.1 52.1 2,816 34.2 73.1 471 44.7 89.0
Unknown 0 0.0 0.0 0 0.0 0.0 0 0.0 0.0 0 0.0 0.0 0 0.0 0.0
G 32,303 29.6 100.0 842 59.7 100.0 2,666 58.6 100.0 3,681 44.7 100.0 297 28.1 100.0
0-9 8,978 8.2 27.8 200 14.2 23.8 521 11.5 19.5 782 9.5 21.3 119 11.3 40.1
10-49 8,977 8.2 27.8 297 21.1 35.3 1,042 22.9 39.1 1,477 17.9 40.1 65 6.2 22.1
50-249 9,061 8.3 28.1 334 23.7 39.7 920 20.2 34.5 1,072 13.0 29.1 107 10.1 36.1
250 or more 5,286 4.8 16.4 10 0.7 1.2 182 4.0 6.8 349 4.2 9.5 5 0.5 1.7
Unknown 0 0.0 0.0 0 0.0 0.0 0 0.0 0.0 0 0.0 0.0 0 0.0 0.0
Others 6,459 5.9 100.0 381 27.0 100.0 561 12.3 100.0 705 8.6 100.0 229 21.7 100.0
0-9 663 0.6 10.3 9 0.6 2.3 65 1.4 11.5 86 1.0 12.1 126 11.9 54.9
10-49 726 0.7 11.2 33 2.3 8.6 168 3.7 29.9 124 1.5 17.5 9 0.9 3.9
50-249 737 0.7 11.4 9 0.6 2.3 156 3.4 27.8 245 3.0 34.8 4 0.4 1.9
250 or more 4,334 4.0 67.1 11 0.8 2.8 173 3.8 30.8 250 3.0 35.5 90 8.5 39.2
Unknown 0 0.0 0.0 320 22.7 84.1 0 0.0 0.0 0 0.0 0.0 0 0.0 0.0

61External Trade by Enterprise Characteristics – Results of the Standardisation exercise 2006
Tables II
Table 2.2b: Imports by size-class and activity section (€ million) – Part 3
€ million
Activity section and size-class
Reporting countryHU AT PL SI SK
Value Share of total
Share of class
Value Share of total
Share of class
Value Share of total
Share of class
Value Share of total
Share of class
Value Share of total
Share of class
All traders 42,263 100.0 100.0 25,298 100.0 100.0 60,129 100.0 100.0 12,111 100.0 100.0 19,906 100.0 100.0
0-9 4,161 9.8 9.8 7,033 27.8 27.8 7,045 11.7 11.7 1,314 10.9 10.9 2,726 13.7 13.7
10-49 6,248 14.8 14.8 3,621 14.3 14.3 9,438 15.7 15.7 2,434 20.1 20.1 2,353 11.8 11.8
50-249 7,653 18.1 18.1 5,656 22.4 22.4 15,702 26.1 26.1 2,763 22.8 22.8 4,006 20.1 20.1
250 or more 23,937 56.6 56.6 8,987 35.5 35.5 27,944 46.5 46.5 5,600 46.2 46.2 10,756 54.0 54.0
Unknown 264 0.6 0.6 0 0.0 0.0 0 0.0 0.0 0 0.0 0.0 64 0.3 0.3
C-E 27,593 65.3 100.0 12,095 47.8 100.0 33,457 55.6 100.0 6,294 52.0 100.0 12,838 64.5 100.0
0-9 720 1.7 2.6 1,350 5.3 11.2 1,203 2.0 3.6 187 1.5 3.0 310 1.6 2.4
10-49 1,209 2.9 4.4 577 2.3 4.8 2,136 3.6 6.4 522 4.3 8.3 463 2.3 3.6
50-249 3,378 8.0 12.2 3,599 14.2 29.8 6,641 11.0 19.9 1,162 9.6 18.5 2,148 10.8 16.7
250 or more 22,249 52.6 80.6 6,570 26.0 54.3 23,477 39.0 70.2 4,424 36.5 70.3 9,910 49.8 77.2
Unknown 38 0.1 0.1 0 0.0 0.0 0 0.0 0.0 0 0.0 0.0 7 0.0 0.1
G 13,130 31.1 100.0 7,411 29.3 100.0 23,577 39.2 100.0 5,030 41.5 100.0 5,860 29.4 100.0
0-9 2,982 7.1 22.7 2,087 8.3 28.2 5,146 8.6 21.8 944 7.8 18.8 2,029 10.2 34.6
10-49 4,699 11.1 35.8 2,591 10.2 35.0 6,650 11.1 28.2 1,610 13.3 32.0 1,679 8.4 28.7
50-249 4,072 9.6 31.0 1,717 6.8 23.2 8,063 13.4 34.2 1,419 11.7 28.2 1,618 8.1 27.6
250 or more 1,202 2.8 9.2 1,015 4.0 13.7 3,719 6.2 15.8 1,057 8.7 21.0 496 2.5 8.5
Unknown 175 0.4 1.3 0 0.0 0.0 0 0.0 0.0 0 0.0 0.0 39 0.2 0.7
Others 1,540 3.6 100.0 5,792 22.9 100.0 3,096 5.1 100.0 787 6.5 100.0 1,209 6.1 100.0
0-9 459 1.1 29.8 3,596 14.2 62.1 697 1.2 22.5 183 1.5 23.3 387 1.9 32.0
10-49 340 0.8 22.1 453 1.8 7.8 653 1.1 21.1 302 2.5 38.4 211 1.1 17.5
50-249 203 0.5 13.2 341 1.3 5.9 998 1.7 32.2 182 1.5 23.1 241 1.2 20.0
250 or more 487 1.2 31.6 1,403 5.5 24.2 748 1.2 24.2 119 1.0 15.2 351 1.8 29.0
Unknown 51 0.1 3.3 0 0.0 0.0 0 0.0 0.0 0 0.0 0.0 18 0.1 1.5

62 External Trade by Enterprise Characteristics – Results of the Standardisation exercise 2006
TablesII
Table 2.2b: Imports by size-class and activity section (€ million) – Part 4
€ million
Activity section and size-class
Reporting countryFI SE IS NO
Number Share of total
Share of class
Number Share of total
Share of class
Number Share of total
Share of class
Number Share of total
Share of class
All traders 12,875 100.0 100.0 23,253 100.0 100.0 2,436 100.0 100.0 32,723 100.0 100.0
0-9 1,207 9.4 9.4 3,539 15.2 15.2 431 17.7 17.7 6,944 21.2 21.2
10-49 1,279 9.9 9.9 3,775 16.2 16.2 573 23.5 23.5 7,563 23.1 23.1
50-249 2,620 20.4 20.4 3,456 14.9 14.9 813 33.4 33.4 7,979 24.4 24.4
250 or more 7,490 58.2 58.2 12,484 53.7 53.7 620 25.4 25.4 8,615 26.3 26.3
Unknown 279 2.2 2.2 0 0.0 0.0 0 0.0 0.0 1,621 5.0 5.0
C-E 8,570 66.6 100.0 8,778 37.8 100.0 597 24.5 100.0 8,875 27.1 100.0
0-9 190 1.5 2.2 296 1.3 3.4 38 1.6 6.4 527 1.6 5.9
10-49 354 2.7 4.1 659 2.8 7.5 124 5.1 20.7 1,215 3.7 13.7
50-249 1,158 9.0 13.5 1,596 6.9 18.2 214 8.8 35.9 2,623 8.0 29.6
250 or more 6,747 52.4 78.7 6,227 26.8 70.9 221 9.1 37.0 4,406 13.5 49.6
Unknown 121 0.9 1.4 0 0.0 0.0 0 0.0 0.0 104 0.3 1.2
G 3,966 30.8 100.0 11,332 48.7 100.0 1,540 63.2 100.0 19,551 59.7 100.0
0-9 889 6.9 22.4 2,398 10.3 21.2 325 13.4 21.1 5,226 16.0 26.7
10-49 886 6.9 22.3 2,862 12.3 25.3 377 15.5 24.5 5,916 18.1 30.3
50-249 1,423 11.1 35.9 1,703 7.3 15.0 492 20.2 32.0 4,290 13.1 21.9
250 or more 612 4.8 15.4 4,368 18.8 38.5 345 14.1 22.4 3,228 9.9 16.5
Unknown 156 1.2 3.9 0 0.0 0.0 0 0.0 0.0 891 2.7 4.6
Others 340 2.6 100.0 3,143 13.5 100.0 300 12.3 100.0 4,298 13.1 100.0
0-9 129 1.0 38.0 844 3.6 26.9 68 2.8 22.6 1,191 3.6 27.7
10-49 39 0.3 11.4 253 1.1 8.1 72 3.0 24.0 432 1.3 10.1
50-249 39 0.3 11.5 157 0.7 5.0 106 4.4 35.5 1,067 3.3 24.8
250 or more 131 1.0 38.5 1,888 8.1 60.1 54 2.2 17.9 981 3.0 22.8
Unknown 2 0.0 0.7 0 0.0 0.0 0 0.0 0.0 626 1.9 14.6

63External Trade by Enterprise Characteristics – Results of the Standardisation exercise 2006
Tables II
Table 2.3a: Dispatches by size-class and activity section (number of enterprises) – Part 1
Number of enterprises
Activity section and size-class
Reporting countryBE DK DE FR IT
Number Share of total
Share of class
Number Share of total
Share of class
Number Share of total
Share of class
Number Share of total
Share of class
Number Share of total
Share of class
All traders : 5,746 100.0 100.0 37,507 100.0 100.0 29,537 100.0 100.0 43,095 100.0 100.0
0-9 : 2,201 38.3 38.3 9,099 24.3 24.3 8,895 30.1 30.1 12,446 28.9 28.9
10-49 : 2,158 37.6 37.6 10,981 29.3 29.3 10,683 36.2 36.2 20,764 48.2 48.2
50-249 : 1,104 19.2 19.2 8,541 22.8 22.8 6,739 22.8 22.8 8,291 19.2 19.2
250 or more : 280 4.9 4.9 2,737 7.3 7.3 2,359 8.0 8.0 1,594 3.7 3.7
Unknown : 3 0.1 0.1 6,149 16.4 16.4 861 2.9 2.9 0 0.0 0.0
C-E : 2,318 40.3 100.0 17,404 46.4 100.0 15,146 51.3 100.0 32,198 74.7 100.0
0-9 : 381 6.6 16.4 2,135 5.7 12.3 2,054 7.0 13.6 6,212 14.4 19.3
10-49 : 1,044 18.2 45.0 5,573 14.9 32.0 6,046 20.5 39.9 17,196 39.9 53.4
50-249 : 698 12.1 30.1 6,346 16.9 36.5 5,087 17.2 33.6 7,446 17.3 23.1
250 or more : 195 3.4 8.4 2,165 5.8 12.4 1,881 6.4 12.4 1,344 3.1 4.2
Unknown : 0 0.0 0.0 1,185 3.2 6.8 78 0.3 0.5 0 0.0 0.0
G : 2,825 49.2 100.0 14,458 38.5 100.0 10,760 36.4 100.0 9,809 22.8 100.0
0-9 : 1,475 25.7 52.2 5,829 15.5 40.3 5,206 17.6 48.4 5,736 13.3 58.5
10-49 : 979 17.0 34.7 4,598 12.3 31.8 3,844 13.0 35.7 3,238 7.5 33.0
50-249 : 334 5.8 11.8 1,768 4.7 12.2 1,322 4.5 12.3 687 1.6 7.0
250 or more : 37 0.6 1.3 399 1.1 2.8 322 1.1 3.0 148 0.3 1.5
Unknown : 0 0.0 0.0 1,864 5.0 12.9 66 0.2 0.6 0 0.0 0.0
Others : 603 10.5 100.0 5,645 15.1 100.0 3,631 12.3 100.0 1,088 2.5 100.0
0-9 : 345 6.0 57.2 1,135 3.0 20.1 1,635 5.5 45.0 498 1.2 45.8
10-49 : 135 2.3 22.4 810 2.2 14.3 793 2.7 21.8 330 0.8 30.3
50-249 : 72 1.3 11.9 427 1.1 7.6 330 1.1 9.1 158 0.4 14.5
250 or more : 48 0.8 8.0 173 0.5 3.1 156 0.5 4.3 102 0.2 9.4
Unknown : 3 0.1 0.5 3,100 8.3 54.9 717 2.4 19.7 0 0.0 0.0
: = Data not available

64 External Trade by Enterprise Characteristics – Results of the Standardisation exercise 2006
TablesII
Table 2.3a: Dispatches by size-class and activity section (number of enterprises) – Part 2
Number of enterprises
Activity section and size-class
Reporting countryCY LU AT FI SE
Number Share of total
Share of class
Number Share of total
Share of class
Number Share of total
Share of class
Number Share of total
Share of class
Number Share of total
Share of class
All traders 1,847 100.0 100.0 1,722 100.0 100.0 8,172 100.0 100.0 2,806 100.0 100.0 8,860 100.0 100.0
0-9 560 30.3 30.3 1,029 59.8 59.8 3,441 42.1 42.1 737 26.3 26.3 3,458 39.0 39.0
10-49 427 23.1 23.1 453 26.3 26.3 2,574 31.5 31.5 1,029 36.7 36.7 3,332 37.6 37.6
50-249 141 7.6 7.6 184 10.7 10.7 1,598 19.6 19.6 707 25.2 25.2 1,541 17.4 17.4
250 or more 30 1.6 1.6 56 3.3 3.3 559 6.8 6.8 280 10.0 10.0 529 6.0 6.0
Unknown 689 37.3 37.3 0 0.0 0.0 0 0.0 0.0 53 1.9 1.9 0 0.0 0.0
C-E 308 16.7 100.0 238 13.8 100.0 3,636 44.5 100.0 1,930 68.8 100.0 4,187 47.3 100.0
0-9 113 6.1 36.7 47 2.7 19.7 851 10.4 23.4 350 12.5 18.1 921 10.4 22.0
10-49 142 7.7 46.1 98 5.7 41.2 1,309 16.0 36.0 779 27.8 40.4 1,722 19.4 41.1
50-249 45 2.4 14.6 64 3.7 26.9 1,072 13.1 29.5 577 20.6 29.9 1,172 13.2 28.0
250 or more 8 0.4 2.6 29 1.7 12.2 404 4.9 11.1 217 7.7 11.2 372 4.2 8.9
Unknown 0 0.0 0.0 0 0.0 0.0 0 0.0 0.0 7 0.2 0.4 0 0.0 0.0
G 706 38.2 100.0 1,058 61.4 100.0 3,639 44.5 100.0 636 22.7 100.0 3,536 39.9 100.0
0-9 388 21.0 55.0 741 43.0 70.0 2,079 25.4 57.1 286 10.2 45.0 1,830 20.7 51.8
10-49 243 13.2 34.4 244 14.2 23.1 1,053 12.9 28.9 179 6.4 28.1 1,340 15.1 37.9
50-249 72 3.9 10.2 66 3.8 6.2 410 5.0 11.3 95 3.4 14.9 282 3.2 8.0
250 or more 3 0.2 0.4 7 0.4 0.7 97 1.2 2.7 37 1.3 5.8 84 0.9 2.4
Unknown 0 0.0 0.0 0 0.0 0.0 0 0.0 0.0 39 1.4 6.1 0 0.0 0.0
Others 833 45.1 100.0 426 24.7 100.0 897 11.0 100.0 240 8.6 100.0 1,137 12.8 100.0
0-9 59 3.2 7.1 241 14.0 56.6 511 6.3 57.0 101 3.6 42.1 707 8.0 62.2
10-49 42 2.3 5.0 111 6.4 26.1 212 2.6 23.6 71 2.5 29.6 270 3.0 23.7
50-249 24 1.3 2.9 54 3.1 12.7 116 1.4 12.9 35 1.2 14.6 87 1.0 7.7
250 or more 19 1.0 2.3 20 1.2 4.7 58 0.7 6.5 26 0.9 10.8 73 0.8 6.4
Unknown 689 37.3 82.7 0 0.0 0.0 0 0.0 0.0 7 0.2 2.9 0 0.0 0.0
: = Data not available

6�External Trade by Enterprise Characteristics – Results of the Standardisation exercise 2006
Tables II
Table 2.3b: Dispatches by size-class and activity section (€ million) – Part 1
€ million
Activity section and size-class
Reporting countryBE DK DE FR IT
Value Share of total
Share of class
Value Share of total
Share of class
Value Share of total
Share of class
Value Share of total
Share of class
Value Share of total
Share of class
All traders 164,377 100.0 100.0 38,823 100.0 100.0 290,168 100.0 100.0 200,749 100.0 100.0 139,027 100.0 100.0
0-9 66,000 40.2 40.2 7,489 19.3 19.3 19,435 6.7 6.7 41,995 20.9 20.9 12,715 9.1 9.1
10-49 19,187 11.7 11.7 5,544 14.3 14.3 34,856 12.0 12.0 19,741 9.8 9.8 25,442 18.3 18.3
50-249 19,120 11.6 11.6 7,911 20.4 20.4 38,977 13.4 13.4 29,130 14.5 14.5 39,716 28.6 28.6
250 or more 60,033 36.5 36.5 15,221 39.2 39.2 169,819 58.5 58.5 106,919 53.3 53.3 61,154 44.0 44.0
Unknown 37 0.0 0.0 2,658 6.8 6.8 27,079 9.3 9.3 2,964 1.5 1.5 0 0.0 0.0
C-E 72,487 44.1 100.0 23,900 61.6 100.0 186,550 64.3 100.0 145,244 72.4 100.0 121,972 87.7 100.0
0-9 2,057 1.3 2.8 2,879 7.4 12.0 2,264 0.8 1.2 14,887 7.4 10.2 5,884 4.2 4.8
10-49 7,107 4.3 9.8 2,201 5.7 9.2 13,482 4.6 7.2 7,955 4.0 5.5 20,063 14.4 16.4
50-249 13,214 8.0 18.2 5,256 13.5 22.0 22,086 7.6 11.8 22,485 11.2 15.5 37,255 26.8 30.5
250 or more 50,109 30.5 69.1 13,564 34.9 56.8 144,605 49.8 77.5 99,580 49.6 68.6 58,770 42.3 48.2
Unknown 0 0.0 0.0 0 0.0 0.0 4,113 1.4 2.2 338 0.2 0.2 0 0.0 0.0
G 34,072 20.7 100.0 9,466 24.4 100.0 41,045 14.1 100.0 42,521 21.2 100.0 15,423 11.1 100.0
0-9 9,682 5.9 28.4 3,290 8.5 34.8 6,467 2.2 15.8 20,417 10.2 48.0 6,496 4.7 42.1
10-49 10,552 6.4 31.0 2,474 6.4 26.1 9,034 3.1 22.0 10,039 5.0 23.6 5,060 3.6 32.8
50-249 5,166 3.1 15.2 2,274 5.9 24.0 9,660 3.3 23.5 5,758 2.9 13.5 2,172 1.6 14.1
250 or more 8,672 5.3 25.5 1,428 3.7 15.1 10,923 3.8 26.6 5,978 3.0 14.1 1,695 1.2 11.0
Unknown 0 0.0 0.0 0 0.0 0.0 4,962 1.7 12.1 330 0.2 0.8 0 0.0 0.0
Others 57,818 35.2 100.0 5,457 14.1 100.0 62,572 21.6 100.0 12,985 6.5 100.0 1,632 1.2 100.0
0-9 54,261 33.0 93.8 1,319 3.4 24.2 10,705 3.7 17.1 6,691 3.3 51.5 335 0.2 20.5
10-49 1,528 0.9 2.6 869 2.2 15.9 12,341 4.3 19.7 1,747 0.9 13.5 318 0.2 19.5
50-249 739 0.4 1.3 381 1.0 7.0 7,231 2.5 11.6 887 0.4 6.8 290 0.2 17.8
250 or more 1,253 0.8 2.2 229 0.6 4.2 14,291 4.9 22.8 1,362 0.7 10.5 689 0.5 42.2
Unknown 37 0.0 0.1 2,658 6.8 48.7 18,004 6.2 28.8 2,296 1.1 17.7 0 0.0 0.0

66 External Trade by Enterprise Characteristics – Results of the Standardisation exercise 2006
TablesII
Table 2.3b: Dispatches by size-class and activity section (€ million) – Part 2
€ million
Activity section and size-class
Reporting countryCY LU AT FI SE
Value Share of total
Share of class
Value Share of total
Share of class
Value Share of total
Share of class
Value Share of total
Share of class
Value Share of total
Share of class
All traders 494 100.0 100.0 7,212 100.0 100.0 46,294 100.0 100.0 24,282 100.0 100.0 46,510 100.0 100.0
0-9 33 6.7 6.7 1,156 16.0 16.0 7,346 15.9 15.9 281 1.2 1.2 3,906 8.4 8.4
10-49 89 18.1 18.1 746 10.3 10.3 3,325 7.2 7.2 954 3.9 3.9 3,768 8.1 8.1
50-249 111 22.4 22.4 1,122 15.6 15.6 12,271 26.5 26.5 3,132 12.9 12.9 7,495 16.1 16.1
250 or more 67 13.5 13.5 4,188 58.1 58.1 23,351 50.4 50.4 19,308 79.5 79.5 31,341 67.4 67.4
Unknown 194 39.2 39.2 0 0.0 0.0 0 0.0 0.0 607 2.5 2.5 0 0.0 0.0
C-E 89 18.0 100.0 5,223 72.4 100.0 35,811 77.4 100.0 23,082 95.1 100.0 37,144 79.9 100.0
0-9 7 1.3 7.4 18 0.3 0.4 2,941 6.4 8.2 104 0.4 0.5 548 1.2 1.5
10-49 38 7.7 43.1 308 4.3 5.9 1,639 3.5 4.6 808 3.3 3.5 1,804 3.9 4.9
50-249 34 6.9 38.4 820 11.4 15.7 9,029 19.5 25.2 2,958 12.2 12.8 6,179 13.3 16.6
250 or more 10 2.0 11.0 4,077 56.5 78.1 22,202 48.0 62.0 18,990 78.2 82.3 28,613 61.5 77.0
Unknown 0 0.0 0.0 0 0.0 0.0 0 0.0 0.0 222 0.9 1.0 0 0.0 0.0
G 152 30.9 100.0 1,558 21.6 100.0 7,912 17.1 100.0 978 4.0 100.0 6,817 14.7 100.0
0-9 25 5.2 16.7 860 11.9 55.2 2,594 5.6 32.8 154 0.6 15.8 1,382 3.0 20.3
10-49 51 10.2 33.2 378 5.2 24.3 1,490 3.2 18.8 118 0.5 12.1 1,769 3.8 25.9
50-249 76 15.4 50.0 276 3.8 17.7 3,000 6.5 37.9 115 0.5 11.7 1,224 2.6 18.0
250 or more 0 0.0 0.1 44 0.6 2.8 828 1.8 10.5 211 0.9 21.6 2,442 5.3 35.8
Unknown 0 0.0 0.0 0 0.0 0.0 0 0.0 0.0 379 1.6 38.8 0 0.0 0.0
Others 253 51.3 100.0 430 6.0 100.0 2,571 5.6 100.0 222 0.9 100.0 2,549 5.5 100.0
0-9 1 0.2 0.4 277 3.8 64.5 1,811 3.9 70.4 22 0.1 10.0 1,975 4.2 77.5
10-49 1 0.2 0.4 60 0.8 13.9 196 0.4 7.6 29 0.1 12.9 195 0.4 7.6
50-249 1 0.1 0.2 25 0.4 5.9 243 0.5 9.4 59 0.2 26.6 92 0.2 3.6
250 or more 57 11.5 22.5 68 0.9 15.7 321 0.7 12.5 107 0.4 48.1 287 0.6 11.2
Unknown 194 39.2 76.4 0 0.0 0.0 0 0.0 0.0 5 0.0 2.5 0 0.0 0.0

67External Trade by Enterprise Characteristics – Results of the Standardisation exercise 2006
Tables II
Table 2.4a: Exports by size-class and activity section (number of enterprises) – Part 1
Number of enterprises
Activity section and size-class
Reporting countryBE CZ DK EE FR
Number Share of total
Share of class
Number Share of total
Share of class
Number Share of total
Share of class
Number Share of total
Share of class
Number Share of total
Share of class
All traders : 36,827 100.0 100.0 14,753 100.0 100.0 6,220 100.0 100.0 96,405 100.0 100.0
0-9 : 12,938 35.1 35.1 8,776 59.5 59.5 3,500 56.3 56.3 50,083 52.0 52.0
10-49 : 10,011 27.2 27.2 4,105 27.8 27.8 1,935 31.1 31.1 25,701 26.7 26.7
50-249 : 4,495 12.2 12.2 1,491 10.1 10.1 656 10.5 10.5 10,507 10.9 10.9
250 or more : 1,283 3.5 3.5 376 2.5 2.5 129 2.1 2.1 3,446 3.6 3.6
Unknown : 8,100 22.0 22.0 5 0.0 0.0 0 0.0 0.0 6,668 6.9 6.9
C-E : 14,713 40.0 100.0 4,683 31.7 100.0 2,315 37.2 100.0 29,968 31.1 100.0
0-9 : 3,544 9.6 24.1 1,892 12.8 40.4 871 14.0 37.6 9,890 10.3 33.0
10-49 : 5,006 13.6 34.0 1,766 12.0 37.7 968 15.6 41.8 11,679 12.1 39.0
50-249 : 3,199 8.7 21.7 818 5.5 17.5 399 6.4 17.2 6,228 6.5 20.8
250 or more : 964 2.6 6.6 207 1.4 4.4 77 1.2 3.3 2,044 2.1 6.8
Unknown : 2,000 5.4 13.6 0 0.0 0.0 0 0.0 0.0 127 0.1 0.4
G : 13,809 37.5 100.0 7,492 50.8 100.0 2,550 41.0 100.0 39,250 40.7 100.0
0-9 : 6,926 18.8 50.2 5,138 34.8 68.6 1,888 30.4 74.0 26,237 27.2 66.8
10-49 : 3,476 9.4 25.2 1,851 12.5 24.7 563 9.1 22.1 9,659 10.0 24.6
50-249 : 666 1.8 4.8 451 3.1 6.0 92 1.5 3.6 2,583 2.7 6.6
250 or more : 91 0.2 0.7 52 0.4 0.7 7 0.1 0.3 607 0.6 1.5
Unknown : 2,650 7.2 19.2 0 0.0 0.0 0 0.0 0.0 164 0.2 0.4
Others : 8,305 22.6 100.0 2,578 17.5 100.0 1,355 21.8 100.0 27,187 28.2 100.0
0-9 : 2,468 6.7 29.7 1,746 11.8 67.7 741 11.9 54.7 13,956 14.5 51.3
10-49 : 1,529 4.2 18.4 488 3.3 18.9 404 6.5 29.8 4,363 4.5 16.0
50-249 : 630 1.7 7.6 222 1.5 8.6 165 2.7 12.2 1,696 1.8 6.2
250 or more : 228 0.6 2.7 117 0.8 4.5 45 0.7 3.3 795 0.8 2.9
Unknown : 3,450 9.4 41.5 5 0.0 0.2 0 0.0 0.0 6,377 6.6 23.5
: = Data not available

68 External Trade by Enterprise Characteristics – Results of the Standardisation exercise 2006
TablesII
Table 2.4a: Exports by size-class and activity section (number of enterprises) – Part 2
Number of enterprises
Activity section and size-class
Reporting countryIT CY LV LT LU
Number Share of total
Share of class
Number Share of total
Share of class
Number Share of total
Share of class
Number Share of total
Share of class
Number Share of total
Share of class
All traders 137,677 100.0 100.0 1,567 100.0 100.0 4,914 100.0 100.0 7,542 100.0 100.0 917 100.0 100.0
0-9 79,113 57.5 57.5 355 22.7 22.7 2,010 40.9 40.9 3,263 43.3 43.3 478 52.1 52.1
10-49 45,969 33.4 33.4 304 19.4 19.4 1,942 39.5 39.5 2,965 39.3 39.3 223 24.3 24.3
50-249 10,647 7.7 7.7 109 7.0 7.0 780 15.9 15.9 1,060 14.1 14.1 158 17.2 17.2
250 or more 1,948 1.4 1.4 21 1.3 1.3 182 3.7 3.7 249 3.3 3.3 58 6.3 6.3
Unknown 0 0.0 0.0 778 49.6 49.6 0 0.0 0.0 5 0.1 0.1 0 0.0 0.0
C-E 77,040 56.0 100.0 232 14.8 100.0 1,696 34.5 100.0 2,464 32.7 100.0 146 15.9 100.0
0-9 33,625 24.4 43.6 89 5.7 38.4 416 8.5 24.5 597 7.9 24.2 32 3.5 21.9
10-49 33,382 24.2 43.3 99 6.3 42.7 768 15.6 45.3 1,129 15.0 45.8 41 4.5 28.1
50-249 8,626 6.3 11.2 36 2.3 15.5 418 8.5 24.6 581 7.7 23.6 46 5.0 31.5
250 or more 1,407 1.0 1.8 8 0.5 3.4 94 1.9 5.5 157 2.1 6.4 27 2.9 18.5
Unknown 0 0.0 0.0 0 0.0 0.0 0 0.0 0.0 0 0.0 0.0 0 0.0 0.0
G 49,337 35.8 100.0 404 25.8 100.0 2,162 44.0 100.0 3,545 47.0 100.0 441 48.1 100.0
0-9 37,719 27.4 76.5 206 13.1 51.0 1,201 24.4 55.6 2,047 27.1 57.7 294 32.1 66.7
10-49 10,069 7.3 20.4 146 9.3 36.1 765 15.6 35.4 1,247 16.5 35.2 106 11.6 24.0
50-249 1,316 1.0 2.7 50 3.2 12.4 179 3.6 8.3 233 3.1 6.6 37 4.0 8.4
250 or more 233 0.2 0.5 2 0.1 0.5 17 0.3 0.8 18 0.2 0.5 4 0.4 0.9
Unknown 0 0.0 0.0 0 0.0 0.0 0 0.0 0.0 0 0.0 0.0 0 0.0 0.0
Others 11,300 8.2 100.0 931 59.4 100.0 1,056 21.5 100.0 1,533 20.3 100.0 330 36.0 100.0
0-9 7,769 5.6 68.8 60 3.8 6.4 393 8.0 37.2 619 8.2 40.4 152 16.6 46.1
10-49 2,518 1.8 22.3 59 3.8 6.3 409 8.3 38.7 589 7.8 38.4 76 8.3 23.0
50-249 705 0.5 6.2 23 1.5 2.5 183 3.7 17.3 246 3.3 16.0 75 8.2 22.7
250 or more 308 0.2 2.7 11 0.7 1.2 71 1.4 6.7 74 1.0 4.8 27 2.9 8.2
Unknown 0 0.0 0.0 778 49.6 83.6 0 0.0 0.0 5 0.1 0.3 0 0.0 0.0
: = Data not available

6�External Trade by Enterprise Characteristics – Results of the Standardisation exercise 2006
Tables II
Table 2.4a: Exports by size-class and activity section (number of enterprises) – Part 3
Number of enterprises
Activity section and size-class
Reporting countryHU AT PL SI SK
Number Share of total
Share of class
Number Share of total
Share of class
Number Share of total
Share of class
Number Share of total
Share of class
Number Share of total
Share of class
All traders 20,891 100.0 100.0 20,860 100.0 100.0 49,928 100.0 100.0 9,269 100.0 100.0 15,416 100.0 100.0
0-9 11,771 56.3 56.3 12,354 59.2 59.2 30,389 60.9 60.9 5,224 56.4 56.4 8,942 58.0 58.0
10-49 5,248 25.1 25.1 5,551 26.6 26.6 11,809 23.7 23.7 2,853 30.8 30.8 3,534 22.9 22.9
50-249 2,270 10.9 10.9 2,231 10.7 10.7 5,945 11.9 11.9 887 9.6 9.6 1,525 9.9 9.9
250 or more 769 3.7 3.7 724 3.5 3.5 1,785 3.6 3.6 305 3.3 3.3 432 2.8 2.8
Unknown 833 4.0 4.0 0 0.0 0.0 0 0.0 0.0 0 0.0 0.0 982 6.4 6.4
C-E 8,045 38.5 100.0 5,716 27.4 100.0 24,268 48.6 100.0 4,087 44.1 100.0 5,448 35.3 100.0
0-9 3,134 15.0 39.0 2,243 10.8 39.2 11,803 23.6 48.6 2,069 22.3 50.6 2,304 14.9 42.3
10-49 2,674 12.8 33.2 1,860 8.9 32.5 6,920 13.9 28.5 1,236 13.3 30.2 1,651 10.7 30.3
50-249 1,504 7.2 18.7 1,181 5.7 20.7 4,229 8.5 17.4 570 6.1 13.9 945 6.1 17.3
250 or more 541 2.6 6.7 432 2.1 7.6 1,316 2.6 5.4 212 2.3 5.2 324 2.1 5.9
Unknown 192 0.9 2.4 0 0.0 0.0 0 0.0 0.0 0 0.0 0.0 224 1.5 4.1
G 8,094 38.7 100.0 11,020 52.8 100.0 17,764 35.6 100.0 3,247 35.0 100.0 6,921 44.9 100.0
0-9 5,713 27.3 70.6 7,515 36.0 68.2 13,208 26.5 74.4 2,003 21.6 61.7 4,904 31.8 70.9
10-49 1,687 8.1 20.8 2,728 13.1 24.8 3,530 7.1 19.9 1,046 11.3 32.2 1,249 8.1 18.0
50-249 339 1.6 4.2 641 3.1 5.8 889 1.8 5.0 170 1.8 5.2 221 1.4 3.2
250 or more 49 0.2 0.6 136 0.7 1.2 137 0.3 0.8 28 0.3 0.9 30 0.2 0.4
Unknown 306 1.5 3.8 0 0.0 0.0 0 0.0 0.0 0 0.0 0.0 517 3.4 7.5
Others 4,752 22.7 100.0 4,124 19.8 100.0 7,896 15.8 100.0 1,935 20.9 100.0 3,046 19.8 100.0
0-9 2,924 14.0 61.5 2,596 12.4 62.9 5,378 10.8 68.1 1,152 12.4 59.5 1,734 11.2 56.9
10-49 887 4.2 18.7 963 4.6 23.4 1,359 2.7 17.2 571 6.2 29.5 634 4.1 20.8
50-249 427 2.0 9.0 409 2.0 9.9 827 1.7 10.5 147 1.6 7.6 359 2.3 11.8
250 or more 179 0.9 3.8 156 0.7 3.8 332 0.7 4.2 65 0.7 3.4 78 0.5 2.6
Unknown 335 1.6 7.0 0 0.0 0.0 0 0.0 0.0 0 0.0 0.0 241 1.6 7.9
: = Data not available

70 External Trade by Enterprise Characteristics – Results of the Standardisation exercise 2006
TablesII
Table 2.4a: Exports by size-class and activity section (number of enterprises) – Part 4
Number of enterprises
Activity section and size-class
Reporting countryFI SE IS NO
Number Share of total
Share of class
Number Share of total
Share of class
Number Share of total
Share of class
Number Share of total
Share of class
All traders 9,395 100.0 100.0 31,573 100.0 100.0 1,126 100.0 100.0 16,913 100.0 100.0
0-9 5,176 55.1 55.1 20,630 65.3 65.3 604 53.6 53.6 10,540 62.3 62.3
10-49 2,505 26.7 26.7 7,481 23.7 23.7 358 31.8 31.8 4,237 25.1 25.1
50-249 1,057 11.3 11.3 2,522 8.0 8.0 124 11.0 11.0 1,376 8.1 8.1
250 or more 416 4.4 4.4 940 3.0 3.0 40 3.6 3.6 472 2.8 2.8
Unknown 241 2.6 2.6 0 0.0 0.0 0 0.0 0.0 288 1.7 1.7
C-E 3,676 39.1 100.0 9,783 31.0 100.0 316 28.1 100.0 4,438 26.2 100.0
0-9 1,425 15.2 38.8 4,667 14.8 47.7 123 10.9 38.9 2,021 11.9 45.5
10-49 1,301 13.8 35.4 3,334 10.6 34.1 133 11.8 42.1 1,566 9.3 35.3
50-249 689 7.3 18.7 1,375 4.4 14.1 49 4.4 15.5 641 3.8 14.4
250 or more 226 2.4 6.1 407 1.3 4.2 11 1.0 3.5 174 1.0 3.9
Unknown 35 0.4 1.0 0 0.0 0.0 0 0.0 0.0 36 0.2 0.8
G 4,035 42.9 100.0 12,313 39.0 100.0 501 44.5 100.0 8,139 48.1 100.0
0-9 2,754 29.3 68.3 9,050 28.7 73.5 327 29.0 65.3 5,779 34.2 71.0
10-49 855 9.1 21.2 2,634 8.3 21.4 132 11.7 26.3 1,811 10.7 22.3
50-249 206 2.2 5.1 514 1.6 4.2 33 2.9 6.6 351 2.1 4.3
250 or more 73 0.8 1.8 115 0.4 0.9 9 0.8 1.8 86 0.5 1.1
Unknown 147 1.6 3.6 0 0.0 0.0 0 0.0 0.0 112 0.7 1.4
Others 1,684 17.9 100.0 9,477 30.0 100.0 309 27.4 100.0 4,336 25.6 100.0
0-9 997 10.6 59.2 6,913 21.9 72.9 154 13.7 49.8 2,740 16.2 63.2
10-49 349 3.7 20.7 1,513 4.8 16.0 93 8.3 30.1 860 5.1 19.8
50-249 162 1.7 9.6 633 2.0 6.7 42 3.7 13.6 384 2.3 8.9
250 or more 117 1.2 6.9 418 1.3 4.4 20 1.8 6.5 212 1.3 4.9
Unknown 59 0.6 3.5 0 0.0 0.0 0 0.0 0.0 140 0.8 3.2
: = Data not available

71External Trade by Enterprise Characteristics – Results of the Standardisation exercise 2006
Tables II
Table 2.4b: Exports by size-class and activity section (€ million) – Part 1
€ million
Activity section and size-class
Reporting countryBE CZ DK EE FR
Value Share of total
Share of class
Value Share of total
Share of class
Value Share of total
Share of class
Value Share of total
Share of class
Value Share of total
Share of class
All traders 57,752 100.0 100.0 43,053 100.0 100.0 19,739 100.0 100.0 4,000 100.0 100.0 100.0 100.0
0-9 18,720 32.4 32.4 1,716 4.0 4.0 3,134 15.9 15.9 350 8.7 8.7 15,992 13.5 13.5
10-49 3,993 6.9 6.9 3,713 8.6 8.6 2,528 12.8 12.8 733 18.3 18.3 14,540 12.3 12.3
50-249 4,926 8.5 8.5 8,829 20.5 20.5 4,566 23.1 23.1 1,452 36.3 36.3 17,540 14.8 14.8
250 or more 28,886 50.0 50.0 28,149 65.4 65.4 8,824 44.7 44.7 1,466 36.6 36.6 67,079 56.6 56.6
Unknown 1,227 2.1 2.1 645 1.5 1.5 686 3.5 3.5 0 0.0 0.0 3,440 2.9 2.9
C-E 23,012 39.8 100.0 36,443 84.6 100.0 12,719 64.4 100.0 3,322 83.0 100.0 86,785 73.2 100.0
0-9 386 0.7 1.7 488 1.1 1.3 731 3.7 5.7 120 3.0 3.6 6,652 5.6 7.7
10-49 1,612 2.8 7.0 1,887 4.4 5.2 1,087 5.5 8.5 520 13.0 15.6 4,923 4.2 5.7
50-249 3,188 5.5 13.9 7,062 16.4 19.4 2,920 14.8 23.0 1,242 31.1 37.4 12,936 10.9 14.9
250 or more 17,826 30.9 77.5 26,906 62.5 73.8 7,981 40.4 62.7 1,439 36.0 43.3 62,063 52.3 71.5
Unknown 0 0.0 0.0 99 0.2 0.3 0 0.0 0.0 0 0.0 0.0 211 0.2 0.2
G 7,022 12.2 100.0 4,654 10.8 100.0 4,825 24.4 100.0 485 12.1 100.0 22,117 18.6 100.0
0-9 2,707 4.7 38.6 956 2.2 20.5 1,623 8.2 33.6 198 5.0 40.8 7,439 6.3 33.6
10-49 1,979 3.4 28.2 1,324 3.1 28.5 1,248 6.3 25.9 174 4.4 35.9 8,408 7.1 38.0
50-249 1,229 2.1 17.5 1,373 3.2 29.5 1,488 7.5 30.9 105 2.6 21.7 3,312 2.8 15.0
250 or more 1,107 1.9 15.8 846 2.0 18.2 466 2.4 9.7 7 0.2 1.5 2,933 2.5 13.3
Unknown 0 0.0 0.0 156 0.4 3.4 0 0.0 0.0 0 0.0 0.0 25 0.0 0.1
Others 27,718 48.0 100.0 1,956 4.5 100.0 2,195 11.1 100.0 193 4.8 100.0 9,688 8.2 100.0
0-9 15,626 27.1 56.4 272 0.6 13.9 781 4.0 35.6 32 0.8 16.4 1,900 1.6 19.6
10-49 402 0.7 1.5 502 1.2 25.6 193 1.0 8.8 38 1.0 19.9 1,209 1.0 12.5
50-249 510 0.9 1.8 395 0.9 20.2 157 0.8 7.2 104 2.6 53.8 1,292 1.1 13.3
250 or more 9,952 17.2 35.9 397 0.9 20.3 377 1.9 17.2 19 0.5 9.9 2,084 1.8 21.5
Unknown 1,227 2.1 4.4 390 0.9 19.9 686 3.5 31.3 0 0.0 0.0 3,204 2.7 33.1

72 External Trade by Enterprise Characteristics – Results of the Standardisation exercise 2006
TablesII
Table 2.4b: Exports by size-class and activity section (€ million) – Part 2
€ million
Activity section and size-class
Reporting countryIT CY LV LT LU
Value Share of total
Share of class
Value Share of total
Share of class
Value Share of total
Share of class
Value Share of total
Share of class
Value Share of total
Share of class
All traders 116,055 100.0 100.0 265 100.0 100.0 2,547 100.0 100.0 6,068 100.0 100.0 1,374 100.0 100.0
0-9 12,068 10.4 10.4 12 4.7 4.7 215 8.4 8.4 300 4.9 4.9 72 5.3 5.3
10-49 23,921 20.6 20.6 41 15.6 15.6 520 20.4 20.4 793 13.1 13.1 41 3.0 3.0
50-249 31,430 27.1 27.1 45 16.9 16.9 929 36.5 36.5 1,326 21.9 21.9 130 9.4 9.4
250 or more 48,635 41.9 41.9 7 2.6 2.6 884 34.7 34.7 3,649 60.1 60.1 1,132 82.3 82.3
Unknown 0 0.0 0.0 159 60.2 60.2 0 0.0 0.0 0 0.0 0.0 0 0.0 0.0
C-E 97,717 84.2 100.0 69 26.0 100.0 1,798 70.6 100.0 4,866 80.2 100.0 1,119 81.4 100.0
0-9 4,638 4.0 4.7 5 1.9 7.4 25 1.0 1.4 56 0.9 1.1 1 0.1 0.1
10-49 17,629 15.2 18.0 26 9.7 37.3 251 9.8 13.9 296 4.9 6.1 19 1.4 1.7
50-249 29,139 25.1 29.8 33 12.6 48.3 697 27.3 38.8 978 16.1 20.1 82 5.9 7.3
250 or more 46,311 39.9 47.4 5 1.8 7.0 826 32.4 45.9 3,537 58.3 72.7 1,017 74.0 90.9
Unknown 0 0.0 0.0 0 0.0 0.0 0 0.0 0.0 0 0.0 0.0 0 0.0 0.0
G 14,254 12.3 100.0 28 10.5 100.0 555 21.8 100.0 979 16.1 100.0 96 7.0 100.0
0-9 6,573 5.7 46.1 6 2.3 21.6 167 6.6 30.1 216 3.6 22.0 33 2.4 34.2
10-49 5,293 4.6 37.1 12 4.4 42.0 195 7.7 35.2 446 7.4 45.6 18 1.3 18.9
50-249 1,698 1.5 11.9 10 3.8 36.4 187 7.3 33.7 293 4.8 29.9 45 3.3 46.6
250 or more 690 0.6 4.8 0 0.0 0.0 6 0.2 1.1 24 0.4 2.5 0 0.0 0.2
Unknown 0 0.0 0.0 0 0.0 0.0 0 0.0 0.0 0 0.0 0.0 0 0.0 0.0
Others 4,084 3.5 100.0 168 63.7 100.0 194 7.6 100.0 223 3.7 100.0 160 11.6 100.0
0-9 858 0.7 21.0 1 0.5 0.8 23 0.9 11.8 29 0.5 12.8 38 2.8 24.1
10-49 999 0.9 24.5 4 1.6 2.5 74 2.9 38.0 51 0.8 22.9 3 0.2 2.1
50-249 594 0.5 14.5 1 0.5 0.9 45 1.8 23.1 55 0.9 24.8 3 0.2 2.1
250 or more 1,634 1.4 40.0 2 0.8 1.3 53 2.1 27.1 88 1.4 39.4 114 8.3 71.7
Unknown 0 0.0 0.0 159 60.2 94.6 0 0.0 0.0 0 0.0 0.0 0 0.0 0.0

73External Trade by Enterprise Characteristics – Results of the Standardisation exercise 2006
Tables II
Table 2.4b: Exports by size-class and activity section (€ million) – Part 3
€ million
Activity section and size-class
Reporting countryHU AT PL SI SK
Value Share of total
Share of class
Value Share of total
Share of class
Value Share of total
Share of class
Value Share of total
Share of class
Value Share of total
Share of class
All traders 38,096 100.0 100.0 32,844 100.0 100.0 47,408 100.0 100.0 11,245 100.0 100.0 19,306 100.0 100.0
0-9 1,676 4.4 4.4 8,593 26.2 26.2 3,637 7.7 7.7 423 3.8 3.8 1,135 5.9 5.9
10-49 2,003 5.3 5.3 3,178 9.7 9.7 4,602 9.7 9.7 964 8.6 8.6 1,062 5.5 5.5
50-249 5,167 13.6 13.6 6,625 20.2 20.2 10,157 21.4 21.4 2,120 18.8 18.8 2,942 15.2 15.2
250 or more 29,174 76.6 76.6 14,447 44.0 44.0 29,012 61.2 61.2 7,739 68.8 68.8 14,124 73.2 73.2
Unknown 75 0.2 0.2 0 0.0 0.0 0 0.0 0.0 0 0.0 0.0 43 0.2 0.2
C-E 35,157 92.3 100.0 20,414 62.2 100.0 39,458 83.2 100.0 10,298 91.6 100.0 17,496 90.6 100.0
0-9 642 1.7 1.8 2,545 7.7 12.5 1,272 2.7 3.2 169 1.5 1.6 307 1.6 1.8
10-49 1,179 3.1 3.4 969 3.0 4.7 2,459 5.2 6.2 661 5.9 6.4 555 2.9 3.2
50-249 4,417 11.6 12.6 4,356 13.3 21.3 7,849 16.6 19.9 1,883 16.7 18.3 2,629 13.6 15.0
250 or more 28,886 75.8 82.2 12,544 38.2 61.4 27,877 58.8 70.7 7,585 67.5 73.7 13,994 72.5 80.0
Unknown 33 0.1 0.1 0 0.0 0.0 0 0.0 0.0 0 0.0 0.0 11 0.1 0.1
G 2,265 5.9 100.0 6,133 18.7 100.0 6,736 14.2 100.0 591 5.3 100.0 1,213 6.3 100.0
0-9 873 2.3 38.6 2,059 6.3 33.6 2,057 4.3 30.5 203 1.8 34.3 603 3.1 49.7
10-49 645 1.7 28.5 1,975 6.0 32.2 1,844 3.9 27.4 234 2.1 39.6 423 2.2 34.9
50-249 594 1.6 26.2 1,555 4.7 25.4 1,979 4.2 29.4 98 0.9 16.6 130 0.7 10.7
250 or more 122 0.3 5.4 543 1.7 8.9 855 1.8 12.7 56 0.5 9.6 41 0.2 3.4
Unknown 31 0.1 1.4 0 0.0 0.0 0 0.0 0.0 0 0.0 0.0 17 0.1 1.4
Others 674 1.8 100.0 6,297 19.2 100.0 1,214 2.6 100.0 356 3.2 100.0 597 3.1 100.0
0-9 161 0.4 23.9 3,989 12.1 63.3 307 0.6 25.3 51 0.5 14.4 225 1.2 37.7
10-49 180 0.5 26.7 234 0.7 3.7 299 0.6 24.6 69 0.6 19.5 83 0.4 13.9
50-249 156 0.4 23.1 715 2.2 11.3 328 0.7 27.0 138 1.2 38.8 184 1.0 30.8
250 or more 166 0.4 24.7 1,360 4.1 21.6 280 0.6 23.0 97 0.9 27.3 89 0.5 15.0
Unknown 11 0.0 1.6 0 0.0 0.0 0 0.0 0.0 0 0.0 0.0 16 0.1 2.7

74 External Trade by Enterprise Characteristics – Results of the Standardisation exercise 2006
TablesII
Table 2.4b: Exports by size-class and activity section (€ million) – Part 4
€ million
Activity section and size-class
Reporting countryFI SE IS NO
Number Share of total
Share of class
Number Share of total
Share of class
Number Share of total
Share of class
Number Share of total
Share of class
All traders 21,499 100.0 100.0 40,624 100.0 100.0 2,075 100.0 100.0 41,801 100.0 100.0
0-9 698 3.2 3.2 2,650 6.5 6.5 376 18.1 18.1 8,459 20.2 20.2
10-49 1,416 6.6 6.6 3,032 7.5 7.5 488 23.5 23.5 3,497 8.4 8.4
50-249 3,480 16.2 16.2 5,952 14.7 14.7 644 31.0 31.0 6,047 14.5 14.5
250 or more 15,483 72.0 72.0 28,990 71.4 71.4 567 27.3 27.3 23,318 55.8 55.8
Unknown 422 2.0 2.0 0 0.0 0.0 0 0.0 0.0 480 1.1 1.1
C-E 18,556 86.3 100.0 33,713 83.0 100.0 935 45.1 100.0 35,448 84.8 100.0
0-9 211 1.0 1.1 541 1.3 1.6 19 0.9 2.0 5,987 14.3 16.9
10-49 753 3.5 4.1 1,395 3.4 4.1 108 5.2 11.5 2,015 4.8 5.7
50-249 2,822 13.1 15.2 4,506 11.1 13.4 355 17.1 38.0 5,059 12.1 14.3
250 or more 14,745 68.6 79.5 27,271 67.1 80.9 453 21.9 48.5 22,334 53.4 63.0
Unknown 26 0.1 0.1 0 0.0 0.0 0 0.0 0.0 53 0.1 0.1
G 2,421 11.3 100.0 4,757 11.7 100.0 924 44.5 100.0 3,877 9.3 100.0
0-9 388 1.8 16.0 971 2.4 20.4 334 16.1 36.2 1,682 4.0 43.4
10-49 576 2.7 23.8 1,389 3.4 29.2 336 16.2 36.4 1,103 2.6 28.5
50-249 575 2.7 23.8 1,174 2.9 24.7 249 12.0 27.0 580 1.4 15.0
250 or more 503 2.3 20.8 1,223 3.0 25.7 4 0.2 0.4 165 0.4 4.2
Unknown 378 1.8 15.6 0 0.0 0.0 0 0.0 0.0 347 0.8 8.9
Others 521 2.4 100.0 2,153 5.3 100.0 216 10.4 100.0 2,476 5.9 100.0
0-9 99 0.5 19.0 1,138 2.8 52.8 23 1.1 10.5 790 1.9 31.9
10-49 88 0.4 16.8 248 0.6 11.5 44 2.1 20.5 378 0.9 15.3
50-249 82 0.4 15.8 272 0.7 12.6 39 1.9 18.3 408 1.0 16.5
250 or more 234 1.1 45.0 496 1.2 23.0 109 5.3 50.7 819 2.0 33.1
Unknown 18 0.1 3.4 0 0.0 0.0 0 0.0 0.0 81 0.2 3.3

7�External Trade by Enterprise Characteristics – Results of the Standardisation exercise 2006
Tables II
Table 3.1: Top enterprises’ share of arrivals – Part 1
€ million
Activity section
Reporting countryDK DE FR IT CY
Value Share Value Share Value Share Value Share Value Share
All traders 30,264 100.0 211,754 100.0 218,870 100.0 145,218 100.0 3,001 100.0
Top 5 1,781 5.9 25,940 12.3 19,233 8.8 12,478 8.6 343 11.4
Top 10 2,871 9.5 40,451 19.1 27,208 12.4 19,596 13.5 554 18.5
Top 20 4,325 14.3 56,402 26.6 36,825 16.8 27,375 18.9 796 26.5
Top 50 7,028 23.2 77,318 36.5 52,573 24.0 38,597 26.6 1,161 38.7
Top 100 9,832 32.5 93,411 44.1 66,091 30.2 49,049 33.8 1,464 48.8
Top 500 18,537 61.2 134,027 63.3 108,300 49.5 77,731 53.5 2,177 72.5
Top 1000 22,542 74.5 152,318 71.9 128,642 58.8 91,320 62.9 2,490 83.0
C-E 9,025 100.0 86,798 100.0 108,196 100.0 68,817 100.0 430 100.0
Top 5 1,088 12.1 22,783 26.2 17,177 15.9 4,499 6.5 155 36.1
Top 10 1,530 17.0 32,678 37.6 22,169 20.5 7,114 10.3 188 43.8
Top 20 2,184 24.2 39,469 45.5 28,786 26.6 10,487 15.2 229 53.2
Top 50 3,436 38.1 47,292 54.5 38,430 35.5 16,865 24.5 284 66.1
Top 100 4,638 51.4 53,089 61.2 47,012 43.5 22,944 33.3 329 76.6
Top 500 7,610 84.3 68,057 78.4 70,690 65.3 39,238 57.0 422 98.2
Top 1000 8,516 94.4 74,298 85.6 80,922 74.8 46,972 68.3 430 100.0
G 18,650 100.0 73,740 100.0 99,541 100.0 69,948 100.0 1,850 100.0
Top 5 1,518 8.1 8,321 11.3 9,961 10.0 12,478 17.8 284 15.4
Top 10 2,325 12.5 12,354 16.8 14,656 14.7 19,458 27.8 438 23.7
Top 20 3,470 18.6 16,580 22.5 19,754 19.8 24,438 34.9 598 32.3
Top 50 5,485 29.4 23,331 31.6 27,262 27.4 30,394 43.5 846 45.7
Top 100 7,472 40.1 29,296 39.7 34,541 34.7 35,242 50.4 1,050 56.8
Top 500 13,041 69.9 46,010 62.4 55,154 55.4 48,163 68.9 1,531 82.8
Top 1000 15,370 82.4 53,789 72.9 64,861 65.2 53,893 77.0 1,709 92.4
Others 2,590 100.0 51,217 100.0 11,133 100.0 6,454 100.0 721 100.0
Top 5 876 33.8 15,404 30.1 1,226 11.0 2,322 36.0 173 23.9
Top 10 1,152 44.5 20,168 39.4 2,065 18.5 3,222 49.9 251 34.8
Top 20 1,470 56.8 25,126 49.1 2,871 25.8 3,977 61.6 326 45.1
Top 50 1,865 72.0 32,505 63.5 4,205 37.8 4,682 72.5 402 55.7
Top 100 2,089 80.7 38,208 74.6 5,414 48.6 5,193 80.5 460 63.8
Top 500 2,524 97.5 47,122 92.0 8,267 74.3 6,140 95.1 611 84.7
Top 1000 2,590 100.0 49,216 96.1 9,283 83.4 6,362 98.6 664 92.0

76 External Trade by Enterprise Characteristics – Results of the Standardisation exercise 2006
TablesII
Table 3.1: Top enterprises’ share of arrivals – Part 2
€ million
Activity section
Reporting countryLU AT FI SE
Value Share Value Share Value Share Value Share
All traders 10,745 100.0 54,333 100.0 22,838 100.0 46,023 100.0
Top 5 1,952 18.2 4,350 8.0 2,403 10.5 5,382 11.7
Top 10 2,631 24.5 6,271 11.5 3,563 15.6 8,462 18.4
Top 20 3,590 33.4 8,940 16.5 5,075 22.2 11,973 26.0
Top 50 5,206 48.4 13,698 25.2 7,691 33.7 16,723 36.3
Top 100 6,442 60.0 18,086 33.3 10,083 44.1 20,925 45.5
Top 500 8,910 82.9 30,848 56.8 16,433 72.0 31,289 68.0
Top 1000 9,742 90.7 37,686 69.4 18,985 83.1 35,757 77.7
C-E 3,608 100.0 20,580 100.0 8,112 100.0 19,445 100.0
Top 5 1,767 49.0 3,696 18.0 2,235 27.5 5,087 26.2
Top 10 2,215 61.4 5,142 25.0 2,813 34.7 7,314 37.6
Top 20 2,742 76.0 6,559 31.9 3,391 41.8 8,779 45.1
Top 50 3,232 89.6 8,966 43.6 4,363 53.8 11,047 56.8
Top 100 3,457 95.8 10,933 53.1 5,319 65.6 12,779 65.7
Top 500 3,608 100.0 16,774 81.5 7,380 91.0 16,883 86.8
Top 1000 3,608 100.0 18,836 91.5 7,883 97.2 18,265 93.9
G 5,662 100.0 29,427 100.0 13,852 100.0 23,057 100.0
Top 5 864 15.3 2,422 8.2 1,319 9.5 2,687 11.7
Top 10 1,364 24.1 3,764 12.8 2,163 15.6 4,051 17.6
Top 20 1,977 34.9 5,675 19.3 3,277 23.7 5,921 25.7
Top 50 2,939 51.9 8,763 29.8 5,398 39.0 8,826 38.3
Top 100 3,596 63.5 11,426 38.8 7,103 51.3 11,019 47.8
Top 500 4,976 87.9 19,172 65.2 10,966 79.2 16,541 71.7
Top 1000 5,389 95.2 22,562 76.7 12,300 88.8 18,918 82.1
Others 1,475 100.0 4,326 100.0 874 100.0 3,521 100.0
Top 5 209 14.2 610 14.1 254 29.0 1,267 36.0
Top 10 320 21.7 852 19.7 364 41.6 1,640 46.6
Top 20 452 30.7 1,192 27.6 479 54.8 2,032 57.7
Top 50 660 44.7 1,889 43.7 610 69.8 2,502 71.1
Top 100 859 58.2 2,526 58.4 696 79.6 2,814 79.9
Top 500 1,298 88.0 3,748 86.6 854 97.7 3,337 94.8
Top 1000 1,434 97.2 4,077 94.3 874 100.0 3,483 98.9

77External Trade by Enterprise Characteristics – Results of the Standardisation exercise 2006
Tables II
Table 3.2: Top enterprises’ share of imports – Part 1
€ million
Activity section
Reporting countryCZ DK EE FR IT CY
Value Share Value Share Value Share Value Share Value Share Value Share
All traders 45,236 100.0 15,547 100.0 5,628 100.0 101,319 100.0 109,189 100.0 1,411 100.0
Top 5 5,553 12.3 2,129 13.7 748 13.3 16,985 16.8 18,911 17.3 271 19.2
Top 10 7,073 15.6 2,977 19.2 941 16.7 21,840 21.6 24,002 22.0 390 27.6
Top 20 9,139 20.2 4,177 26.9 1,223 21.7 28,106 27.7 30,444 27.9 519 36.8
Top 50 13,156 29.1 6,055 38.9 1,833 32.6 38,203 37.7 40,101 36.7 677 47.9
Top 100 16,611 36.7 7,710 49.6 2,427 43.1 46,107 45.5 47,704 43.7 795 56.3
Top 500 26,944 59.6 11,458 73.7 4,034 71.7 66,383 65.5 65,907 60.4 1,106 78.4
Top 1000 31,774 70.2 12,942 83.2 4,672 83.0 75,068 74.1 74,200 68.0 1,234 87.4
C-E 25,295 100.0 4,412 100.0 2,260 100.0 60,398 100.0 70,427 100.0 189 100.0
Top 5 4,814 19.0 695 15.8 672 29.7 16,985 28.1 18,789 26.7 97 51.4
Top 10 6,151 24.3 1,048 23.7 798 35.3 21,357 35.4 22,824 32.4 109 57.6
Top 20 7,928 31.3 1,483 33.6 976 43.2 26,506 43.9 27,405 38.9 123 65.1
Top 50 10,707 42.3 2,179 49.4 1,287 57.0 33,190 55.0 33,142 47.1 146 77.3
Top 100 13,068 51.7 2,751 62.3 1,569 69.4 37,943 62.8 37,181 52.8 163 86.3
Top 500 19,463 76.9 3,942 89.3 2,127 94.1 49,307 81.6 48,615 69.0 188 99.6
Top 1000 21,990 86.9 4,245 96.2 2,233 98.8 53,297 88.2 53,980 76.6 189 100.0
G 15,381 100.0 7,952 100.0 2,679 100.0 31,473 100.0 32,303 100.0 842 100.0
Top 5 1,075 7.0 1,500 18.9 185 6.9 3,181 10.1 4,795 14.8 204 24.2
Top 10 1,712 11.1 2,037 25.6 317 11.8 4,628 14.7 6,619 20.5 271 32.1
Top 20 2,579 16.8 2,635 33.1 524 19.6 6,758 21.5 8,756 27.1 347 41.3
Top 50 4,228 27.5 3,591 45.2 886 33.1 9,999 31.8 12,146 37.6 446 53.0
Top 100 5,773 37.5 4,334 54.5 1,221 45.6 12,766 40.6 14,651 45.4 532 63.2
Top 500 9,663 62.8 6,223 78.3 2,049 76.5 20,094 63.8 20,495 63.4 735 87.3
Top 1000 11,361 73.9 6,984 87.8 2,371 88.5 23,424 74.4 23,378 72.4 805 95.6
Others 4,560 100.0 3,183 100.0 690 100.0 9,448 100.0 6,459 100.0 381 100.0
Top 5 1,791 39.3 1,391 43.7 255 37.0 2,670 28.3 2,205 34.1 128 33.7
Top 10 2,061 45.2 1,838 57.8 357 51.8 3,567 37.8 3,149 48.8 172 45.3
Top 20 2,373 52.0 2,323 73.0 419 60.8 4,592 48.6 4,045 62.6 199 52.4
Top 50 2,782 61.0 2,736 86.0 492 71.3 5,859 62.0 5,050 78.2 238 62.7
Top 100 3,082 67.6 2,883 90.6 548 79.4 6,744 71.4 5,532 85.6 265 69.7
Top 500 3,804 83.4 3,099 97.4 652 94.5 8,234 87.2 6,178 95.6 332 87.2
Top 1000 4,070 89.2 3,150 99.0 676 98.0 8,697 92.1 6,317 97.8 356 93.4

78 External Trade by Enterprise Characteristics – Results of the Standardisation exercise 2006
TablesII
Table 3.2: Top enterprises’ share of imports – Part 2
€ million
Activity section
Reporting countryLV LT LU HU AT PL
Value Share Value Share Value Share Value Share Value Share Value Share
All traders 4,547 100.0 8,239 100.0 1,056 100.0 42,263 100.0 25,298 100.0 60,129 100.0
Top 5 413 9.1 1,908 23.2 402 38.1 9,061 21.4 5,153 20.4 5,985 10.0
Top 10 596 13.1 2,332 28.3 589 55.8 12,235 28.9 7,209 28.5 8,530 14.2
Top 20 817 18.0 2,805 34.0 780 73.9 15,202 36.0 9,129 36.1 11,562 19.2
Top 50 1,244 27.4 3,525 42.8 908 86.0 19,275 45.6 12,011 47.5 16,291 27.1
Top 100 1,678 36.9 4,131 50.1 985 93.2 22,819 54.0 14,284 56.5 20,891 34.7
Top 500 3,000 66.0 5,927 71.9 1,048 99.3 30,720 72.7 19,594 77.5 33,916 56.4
Top 1000 3,563 78.4 6,778 82.3 1,055 99.9 33,878 80.2 21,678 85.7 39,865 66.3
C-E 1,320 100.0 3,854 100.0 530 100.0 27,593 100.0 12,095 100.0 33,457 100.0
Top 5 325 24.6 1,894 49.1 327 61.6 8,925 32.3 3,481 28.8 5,985 17.9
Top 10 421 31.9 2,152 55.8 439 82.8 11,650 42.2 4,582 37.9 8,444 25.2
Top 20 534 40.5 2,446 63.5 503 94.9 14,153 51.3 5,541 45.8 10,452 31.2
Top 50 742 56.2 2,792 72.5 527 99.4 17,402 63.1 7,020 58.0 13,657 40.8
Top 100 928 70.3 3,113 80.8 530 100.0 19,823 71.8 8,204 67.8 16,621 49.7
Top 500 1,252 94.8 3,719 96.5 530 100.0 24,473 88.7 10,862 89.8 24,516 73.3
Top 1000 1,306 98.9 3,826 99.3 530 100.0 26,021 94.3 11,596 95.9 27,693 82.8
G 2,666 100.0 3,681 100.0 297 100.0 13,130 100.0 7,411 100.0 23,577 100.0
Top 5 264 9.9 366 10.0 169 56.8 1,970 15.0 1,339 18.1 1,602 6.8
Top 10 373 14.0 519 14.1 194 65.3 2,640 20.1 1,963 26.5 2,767 11.7
Top 20 537 20.1 722 19.6 223 75.3 3,552 27.1 2,519 34.0 4,167 17.7
Top 50 844 31.7 1,108 30.1 264 88.9 4,986 38.0 3,312 44.7 6,796 28.8
Top 100 1,145 42.9 1,454 39.5 280 94.5 6,144 46.8 3,971 53.6 8,929 37.9
Top 500 1,955 73.3 2,525 68.6 296 99.8 8,938 68.1 5,731 77.3 14,263 60.5
Top 1000 2,288 85.8 3,033 82.4 297 100.0 10,186 77.6 6,425 86.7 16,715 70.9
Others 561 100.0 705 100.0 229 100.0 1,540 100.0 5,792 100.0 3,096 100.0
Top 5 100 17.9 273 38.8 164 71.7 255 16.5 3,158 54.5 704 22.7
Top 10 138 24.6 325 46.2 182 79.2 350 22.7 3,744 64.6 895 28.9
Top 20 191 34.0 388 55.0 201 87.5 454 29.5 4,370 75.4 1,089 35.2
Top 50 270 48.2 470 66.7 217 94.5 624 40.5 5,041 87.0 1,425 46.0
Top 100 326 58.2 532 75.4 223 97.3 782 50.8 5,325 91.9 1,712 55.3
Top 500 470 83.7 652 92.4 229 99.9 1,168 75.8 5,669 97.9 2,314 74.8
Top 1000 521 92.8 686 97.3 229 100.0 1,322 85.8 5,732 99.0 2,549 82.4

7�External Trade by Enterprise Characteristics – Results of the Standardisation exercise 2006
Tables II
Table 3.2: Top enterprises’ share of imports – Part 3
€ million
Activity section
Reporting countrySI SK FI SE NO
Value Share Value Share Value Share Value Share Value Share
All traders 12,111 100.0 19,906 100.0 12,875 100.0 23,253 100.0 32,723 100.0
Top 5 1,588 13.1 5,267 26.5 5,066 39.3 4,624 19.9 3,606 11.0
Top 10 2,292 18.9 6,147 30.9 6,060 47.1 5,862 25.2 5,439 16.6
Top 20 3,324 27.4 7,201 36.2 7,053 54.8 7,536 32.4 7,588 23.2
Top 50 4,781 39.5 9,036 45.4 8,344 64.8 10,244 44.1 10,667 32.6
Top 100 5,955 49.2 10,787 54.2 9,283 72.1 12,328 53.0 13,655 41.7
Top 500 8,889 73.4 14,886 74.8 11,283 87.6 17,181 73.9 22,310 68.2
Top 1000 10,037 82.9 16,429 82.5 11,959 92.9 19,142 82.3 26,328 80.5
C-E 6,294 100.0 12,838 100.0 8,570 100.0 8,778 100.0 8,875 100.0
Top 5 1,306 20.7 5,267 41.0 4,777 55.7 1,579 18.0 1,667 18.8
Top 10 1,862 29.6 6,027 47.0 5,585 65.2 2,439 27.8 2,099 23.7
Top 20 2,470 39.2 6,978 54.4 6,237 72.8 3,440 39.2 2,726 30.7
Top 50 3,382 53.7 8,415 65.5 7,006 81.8 4,721 53.8 3,905 44.0
Top 100 4,133 65.7 9,708 75.6 7,506 87.6 5,758 65.6 4,902 55.2
Top 500 5,698 90.5 11,936 93.0 8,334 97.3 7,694 87.7 7,427 83.7
Top 1000 6,070 96.4 12,454 97.0 8,495 99.1 8,265 94.2 8,213 92.5
G 5,030 100.0 5,860 100.0 3,966 100.0 11,332 100.0 19,551 100.0
Top 5 973 19.3 578 9.9 1,069 26.9 3,345 29.5 1,527 7.8
Top 10 1,447 28.8 907 15.5 1,378 34.7 4,010 35.4 2,355 12.0
Top 20 1,899 37.7 1,348 23.0 1,679 42.3 4,806 42.4 3,301 16.9
Top 50 2,461 48.9 1,971 33.6 2,171 54.7 5,925 52.3 5,015 25.7
Top 100 2,898 57.6 2,487 42.4 2,578 65.0 6,764 59.7 6,836 35.0
Top 500 4,007 79.7 3,930 67.1 3,423 86.3 9,034 79.7 11,967 61.2
Top 1000 4,470 88.9 4,565 77.9 3,715 93.7 9,954 87.8 14,338 73.3
Others 787 100.0 1,209 100.0 340 100.0 3,143 100.0 4,298 100.0
Top 5 145 18.5 254 21.0 146 43.0 1,664 52.9 1,224 28.5
Top 10 213 27.1 363 30.0 166 48.9 1,941 61.7 1,769 41.2
Top 20 282 35.8 488 40.4 191 56.1 2,162 68.8 2,322 54.0
Top 50 390 49.6 641 53.1 231 68.0 2,462 78.3 2,785 64.8
Top 100 481 61.1 754 62.4 260 76.6 2,635 83.8 3,096 72.0
Top 500 679 86.2 1,004 83.1 319 93.8 2,952 93.9 3,744 87.1
Top 1000 736 93.5 1,094 90.5 332 97.8 3,039 96.7 3,935 91.6

80 External Trade by Enterprise Characteristics – Results of the Standardisation exercise 2006
TablesII
Table 3.3: Top enterprises’ share of dispatches – Part 1
€ million
Activity section
Reporting countryDK DE FR IT CY
Value Share Value Share Value Share Value Share Value Share
All traders 36,186 100.0 290,168 100.0 200,749 100.0 139,027 100.0 494 100.0
Top 5 4,348 12.0 57,622 19.9 23,797 11.9 7,892 5.7 137 27.7
Top 10 6,856 18.9 81,531 28.1 30,339 15.1 10,999 7.9 197 39.8
Top 20 9,825 27.2 99,124 34.2 40,832 20.3 15,642 11.3 266 53.8
Top 50 14,262 39.4 120,019 41.4 58,263 29.0 23,075 16.6 363 73.4
Top 100 17,860 49.4 138,778 47.8 73,741 36.7 30,594 22.0 413 83.6
Top 500 27,327 75.5 186,628 64.3 118,682 59.1 55,853 40.2 477 96.4
Top 1000 31,326 86.6 210,364 72.5 140,314 69.9 70,036 50.4 491 99.3
C-E 23,900 100.0 186,550 100.0 145,244 100.0 121,972 100.0 89 100.0
Top 5 4,348 18.2 57,622 30.9 23,797 16.4 7,892 6.5 28 31.8
Top 10 6,690 28.0 77,067 41.3 29,925 20.6 10,939 9.0 43 48.7
Top 20 8,818 36.9 86,381 46.3 38,115 26.2 15,305 12.5 57 64.6
Top 50 12,190 51.0 98,344 52.7 51,439 35.4 22,244 18.2 75 84.0
Top 100 14,857 62.2 107,913 57.8 63,137 43.5 29,504 24.2 83 93.2
Top 500 20,950 87.7 137,400 73.7 98,786 68.0 53,214 43.6 89 100.0
Top 1000 22,874 95.7 151,415 81.2 114,413 78.8 66,162 54.2 89 100.0
G 9,466 100.0 41,045 100.0 42,521 100.0 15,423 100.0 152 100.0
Top 5 1,744 18.4 4,128 10.1 5,355 12.6 1,603 10.4 52 33.9
Top 10 2,355 24.9 6,817 16.6 7,799 18.3 2,109 13.7 78 51.5
Top 20 2,977 31.4 9,706 23.6 11,013 25.9 2,881 18.7 106 69.8
Top 50 4,161 44.0 14,126 34.4 15,823 37.2 4,191 27.2 128 83.8
Top 100 5,253 55.5 17,079 41.6 19,622 46.1 5,534 35.9 137 89.9
Top 500 8,067 85.2 26,040 63.4 29,525 69.4 9,353 60.6 152 99.6
Top 1000 9,002 95.1 30,334 73.9 33,670 79.2 11,231 72.8 152 100.0
Others 2,820 100.0 62,572 100.0 12,985 100.0 1,632 100.0 253 100.0
Top 5 1,021 36.2 15,745 25.2 3,997 30.8 437 26.8 137 54.0
Top 10 1,399 49.6 20,518 32.8 5,733 44.2 603 36.9 183 72.4
Top 20 1,808 64.1 26,530 42.4 6,805 52.4 817 50.0 213 84.1
Top 50 2,266 80.4 34,927 55.8 8,299 63.9 1,101 67.5 232 91.7
Top 100 2,527 89.6 41,505 66.3 9,511 73.2 1,302 79.8 241 95.2
Top 500 2,820 100.0 55,270 88.3 11,612 89.4 1,605 98.3 253 99.8
Top 1000 2,820 100.0 58,972 94.2 12,242 94.3 1,632 100.0 253 100.0

81External Trade by Enterprise Characteristics – Results of the Standardisation exercise 2006
Tables II
Table 3.3: Top enterprises’ share of dispatches – Part 2
€ million
Activity section
Reporting countryLU AT FI SE
Value Share Value Share Value Share Value Share
All traders 7,212 100.0 46,294 100.0 24,282 100.0 46,510 100.0
Top 5 2,595 36.0 5,071 11.0 8,676 35.7 7,906 17.0
Top 10 3,366 46.7 7,469 16.1 11,188 46.1 11,841 25.5
Top 20 4,263 59.1 10,478 22.6 13,670 56.3 16,155 34.7
Top 50 5,337 74.0 15,457 33.4 16,595 68.3 22,426 48.2
Top 100 6,027 83.6 20,384 44.0 18,786 77.4 26,946 57.9
Top 500 6,995 97.0 34,420 74.4 22,860 94.1 37,659 81.0
Top 1000 7,176 99.5 39,719 85.8 23,795 98.0 41,417 89.0
C-E 5,223 100.0 35,811 100.0 23,082 100.0 37,144 100.0
Top 5 2,595 49.7 4,785 13.4 8,676 37.6 7,687 20.7
Top 10 3,348 64.1 6,971 19.5 11,188 48.5 11,252 30.3
Top 20 4,115 78.8 9,578 26.7 13,670 59.2 14,901 40.1
Top 50 4,885 93.5 14,176 39.6 16,500 71.5 20,394 54.9
Top 100 5,158 98.8 18,694 52.2 18,558 80.4 24,119 64.9
Top 500 5,223 100.0 30,198 84.3 22,160 96.0 32,498 87.5
Top 1000 5,223 100.0 33,575 93.8 22,878 99.1 35,130 94.6
G 1,558 100.0 7,912 100.0 978 100.0 6,817 100.0
Top 5 378 24.3 1,811 22.9 339 34.7 1,884 27.6
Top 10 510 32.7 2,264 28.6 483 49.4 2,381 34.9
Top 20 681 43.7 2,857 36.1 597 61.1 2,909 42.7
Top 50 937 60.1 3,745 47.3 739 75.6 3,817 56.0
Top 100 1,126 72.2 4,568 57.7 831 85.0 4,481 65.7
Top 500 1,509 96.9 6,599 83.4 975 99.7 5,935 87.1
Top 1000 1,558 100.0 7,301 92.3 978 100.0 6,427 94.3
Others 430 100.0 2,571 100.0 222 100.0 2,549 100.0
Top 5 194 45.1 561 21.8 121 54.3 1,326 52.0
Top 10 244 56.8 883 34.3 147 66.4 1,587 62.3
Top 20 295 68.5 1,289 50.1 171 76.8 1,866 73.2
Top 50 362 84.3 1,836 71.4 198 89.1 2,127 83.4
Top 100 399 92.7 2,154 83.8 213 96.1 2,290 89.8
Top 500 430 100.0 2,537 98.7 222 100.0 2,526 99.1
Top 1000 430 100.0 2,571 100.0 222 100.0 2,549 100.0

82 External Trade by Enterprise Characteristics – Results of the Standardisation exercise 2006
TablesII
Table 3.4: Top enterprises’ share of exports – Part 1
€ million
Activity section
Reporting countryCZ DK EE FR IT CY
Value Share Value Share Value Share Value Share Value Share Value Share
All traders 43,053 100.0 19,362 100.0 4,000 100.0 118,590 100.0 116,055 100.0 265 100.0
Top 5 6,548 15.2 3,260 16.8 780 19.5 15,884 13.4 5,172 4.5 114 42.9
Top 10 8,507 19.8 4,406 22.8 962 24.0 21,159 17.8 8,309 7.2 142 53.7
Top 20 11,123 25.8 5,965 30.8 1,234 30.9 29,215 24.6 12,405 10.7 167 63.1
Top 50 15,500 36.0 8,339 43.1 1,787 44.7 41,771 35.2 19,575 16.9 203 76.7
Top 100 19,162 44.5 10,263 53.0 2,280 57.0 51,964 43.8 26,075 22.5 229 86.7
Top 500 29,482 68.5 15,055 77.8 3,359 84.0 76,701 64.7 45,701 39.4 259 98.0
Top 1000 33,933 78.8 16,801 86.8 3,724 93.1 87,347 73.7 56,746 48.9 264 99.8
C-E 36,443 100.0 12,719 100.0 3,322 100.0 86,785 100.0 97,717 100.0 69 100.0
Top 5 6,548 18.0 3,100 24.4 765 23.0 13,720 15.8 5,172 5.3 25 36.8
Top 10 8,401 23.1 4,053 31.9 931 28.0 18,594 21.4 8,231 8.4 36 51.7
Top 20 10,795 29.6 5,193 40.8 1,185 35.7 25,475 29.4 12,133 12.4 46 67.3
Top 50 14,661 40.2 7,015 55.2 1,700 51.2 35,949 41.4 19,009 19.5 62 90.1
Top 100 17,960 49.3 8,372 65.8 2,144 64.5 44,025 50.7 25,228 25.8 67 97.8
Top 500 27,283 74.9 11,350 89.2 3,052 91.9 63,699 73.4 43,157 44.2 69 100.0
Top 1000 31,108 85.4 12,182 95.8 3,269 98.4 71,528 82.4 53,105 54.3 69 100.0
G 4,654 100.0 4,825 100.0 485 100.0 22,117 100.0 14,254 100.0 28 100.0
Top 5 1,091 23.4 839 17.4 107 22.0 5,757 26.0 981 6.9 11 40.3
Top 10 1,399 30.1 1,113 23.1 136 27.9 6,802 30.8 1,315 9.2 16 58.8
Top 20 1,699 36.5 1,511 31.3 176 36.2 8,002 36.2 1,814 12.7 20 71.6
Top 50 2,152 46.2 2,224 46.1 254 52.3 9,837 44.5 2,651 18.6 24 86.2
Top 100 2,532 54.4 2,800 58.0 318 65.4 11,571 52.3 3,557 25.0 26 93.9
Top 500 3,483 74.8 4,000 82.9 443 91.3 15,624 70.6 6,491 45.5 28 100.0
Top 1000 3,900 83.8 4,385 90.9 473 97.4 17,365 78.5 8,097 56.8 28 100.0
Others 1,956 100.0 1,818 100.0 193 100.0 9,688 100.0 4,084 100.0 168 100.0
Top 5 601 30.7 913 50.3 92 47.7 2,764 28.5 786 19.2 114 67.4
Top 10 767 39.2 1,071 58.9 104 53.8 3,603 37.2 1,211 29.7 128 75.8
Top 20 903 46.1 1,226 67.4 117 60.5 4,377 45.2 1,778 43.5 139 82.7
Top 50 1,118 57.1 1,414 77.8 142 73.5 5,492 56.7 2,448 59.9 153 90.9
Top 100 1,301 66.5 1,540 84.7 161 83.3 6,293 65.0 2,860 70.0 159 94.7
Top 500 1,677 85.8 1,755 96.6 189 98.1 8,040 83.0 3,599 88.1 168 99.6
Top 1000 1,804 92.2 1,799 99.0 193 99.8 8,598 88.7 3,817 93.5 168 100.0

83External Trade by Enterprise Characteristics – Results of the Standardisation exercise 2006
Tables II
Table 3.4: Top enterprises’ share of exports – Part 2
€ million
Activity section
Reporting countryLV LT LU HU AT PL
Value Share Value Share Value Share Value Share Value Share Value Share
All traders 2,547 100.0 6,068 100.0 1,374 100.0 38,096 100.0 32,844 100.0 47,408 100.0
Top 5 361 14.2 1,841 30.3 730 53.1 10,705 28.1 4,108 12.5 4,634 9.8
Top 10 514 20.2 2,262 37.3 946 68.8 13,911 36.5 6,010 18.3 7,634 16.1
Top 20 743 29.2 2,720 44.8 1,144 83.2 17,318 45.5 8,577 26.1 10,609 22.4
Top 50 1,120 43.9 3,371 55.6 1,298 94.5 21,741 57.1 12,240 37.3 15,500 32.7
Top 100 1,467 57.6 3,895 64.2 1,345 97.9 25,093 65.9 15,756 48.0 19,589 41.3
Top 500 2,230 87.5 5,187 85.5 1,373 99.9 31,972 83.9 24,671 75.1 30,103 63.5
Top 1000 2,432 95.5 5,618 92.6 1,374 100.0 34,528 90.6 28,018 85.3 34,693 73.2
C-E 1,798 100.0 4,866 100.0 1,119 100.0 35,157 100.0 20,414 100.0 39,458 100.0
Top 5 357 19.9 1,841 37.8 708 63.3 10,705 30.4 2,838 13.9 4,634 11.7
Top 10 484 26.9 2,262 46.5 889 79.4 13,911 39.6 4,311 21.1 7,429 18.8
Top 20 661 36.8 2,699 55.5 1,017 90.9 17,318 49.3 6,080 29.8 10,117 25.6
Top 50 958 53.3 3,299 67.8 1,112 99.4 21,649 61.6 8,792 43.1 14,598 37.0
Top 100 1,222 68.0 3,755 77.2 1,119 100.0 24,900 70.8 11,356 55.6 18,310 46.4
Top 500 1,724 95.9 4,655 95.7 1,119 100.0 31,298 89.0 17,596 86.2 27,703 70.2
Top 1000 1,791 99.6 4,820 99.0 1,119 100.0 33,382 95.0 19,352 94.8 31,582 80.0
G 555 100.0 979 100.0 96 100.0 2,265 100.0 6,133 100.0 6,736 100.0
Top 5 133 24.0 97 9.9 59 61.1 392 17.3 951 15.5 1,416 21.0
Top 10 199 35.7 143 14.6 68 70.8 503 22.2 1,239 20.2 1,859 27.6
Top 20 270 48.7 219 22.3 76 78.8 658 29.1 1,643 26.8 2,259 33.5
Top 50 369 66.5 352 35.9 85 89.1 955 42.2 2,340 38.1 2,901 43.1
Top 100 434 78.1 479 48.9 92 95.7 1,204 53.2 2,977 48.5 3,439 51.1
Top 500 534 96.2 809 82.7 96 100.0 1,798 79.4 4,655 75.9 4,819 71.5
Top 1000 551 99.1 917 93.7 96 100.0 2,015 88.9 5,293 86.3 5,451 80.9
Others 194 100.0 223 100.0 160 100.0 674 100.0 6,297 100.0 1,214 100.0
Top 5 86 44.0 96 43.0 133 83.7 114 16.9 2,883 45.8 150 12.4
Top 10 99 50.8 117 52.6 145 90.7 168 25.0 3,619 57.5 234 19.3
Top 20 118 60.5 137 61.8 153 95.8 238 35.2 4,503 71.5 345 28.5
Top 50 147 75.6 164 73.7 157 98.3 343 50.9 5,329 84.6 515 42.4
Top 100 168 86.6 185 83.2 159 99.5 421 62.4 5,732 91.0 655 53.9
Top 500 193 99.3 218 97.8 160 100.0 590 87.4 6,176 98.1 987 81.3
Top 1000 194 100.0 222 99.7 160 100.0 639 94.8 6,250 99.3 1,100 90.6

84 External Trade by Enterprise Characteristics – Results of the Standardisation exercise 2006
TablesII
Table 3.4: Top enterprises’ share of exports – Part 3
€ million
Activity section
Reporting countrySI SK FI SE NO
Value Share Value Share Value Share Value Share Value Share
All traders 11,245 100.0 19,306 100.0 21,499 100.0 40,624 100.0 41,801 100.0
Top 5 2,313 20.6 7,254 37.6 6,799 31.6 11,867 29.2 21,113 50.5
Top 10 3,168 28.2 8,213 42.5 8,713 40.5 14,080 34.7 24,212 57.9
Top 20 4,201 37.4 9,540 49.4 10,616 49.4 17,046 42.0 26,933 64.4
Top 50 5,832 51.9 11,612 60.1 13,221 61.5 21,467 52.8 30,905 73.9
Top 100 7,140 63.5 13,308 68.9 15,207 70.7 25,214 62.1 33,986 81.3
Top 500 9,914 88.2 16,827 87.2 19,426 90.4 33,225 81.8 40,863 97.8
Top 1000 10,640 94.6 17,903 92.7 20,518 95.4 36,040 88.7 41,356 98.9
C-E 10,298 100.0 17,496 100.0 18,556 100.0 33,713 100.0 35,448 100.0
Top 5 2,313 22.5 7,254 41.5 6,799 36.6 11,867 35.2 20,165 56.9
Top 10 3,168 30.8 8,213 46.9 8,713 47.0 14,080 41.8 22,900 64.6
Top 20 4,194 40.7 9,540 54.5 10,513 56.7 16,781 49.8 25,064 70.7
Top 50 5,725 55.6 11,609 66.3 12,826 69.1 20,742 61.5 27,954 78.9
Top 100 6,997 67.9 13,213 75.5 14,528 78.3 23,993 71.2 30,109 84.9
Top 500 9,561 92.8 16,285 93.1 17,718 95.5 30,247 89.7 34,375 97.0
Top 1000 10,089 98.0 17,028 97.3 18,331 98.8 32,097 95.2 35,177 99.2
G 591 100.0 1,213 100.0 2,421 100.0 4,757 100.0 3,877 100.0
Top 5 94 15.9 138 11.4 625 25.8 790 16.6 636 16.4
Top 10 140 23.8 206 17.0 844 34.9 1,129 23.7 1,015 26.2
Top 20 195 33.0 292 24.1 1,109 45.8 1,532 32.2 1,522 39.3
Top 50 278 47.1 445 36.7 1,505 62.1 2,151 45.2 2,272 58.6
Top 100 351 59.4 585 48.2 1,769 73.0 2,651 55.7 2,775 71.6
Top 500 517 87.4 943 77.7 2,227 92.0 3,823 80.4 3,572 92.2
Top 1000 564 95.5 1,073 88.4 2,346 96.9 4,232 89.0 3,729 96.2
Others 356 100.0 597 100.0 521 100.0 2,153 100.0 2,476 100.0
Top 5 192 53.9 168 28.1 199 38.3 839 39.0 948 38.3
Top 10 211 59.3 235 39.4 246 47.1 1,031 47.9 1,311 53.0
Top 20 240 67.4 316 52.9 302 58.0 1,212 56.3 1,675 67.6
Top 50 276 77.5 393 65.8 388 74.5 1,428 66.3 1,991 80.4
Top 100 305 85.7 452 75.7 435 83.5 1,602 74.4 2,172 87.7
Top 500 346 97.3 559 93.6 506 97.1 1,969 91.5 2,407 97.2
Top 1000 353 99.3 584 97.9 519 99.5 2,064 95.8 2,450 98.9

8�External Trade by Enterprise Characteristics – Results of the Standardisation exercise 2006
Tables II
Table 4.1a: Arrivals and imports by partner countries (number of enterprises) – Part 1
Number of enterprises
Partner country or zone
Reporting country and activity sectionBE CZ DK
Total C-E G Others Total C-E G Others Total C-E G OthersTotal : : : : 57,229 14,793 23,692 18,744 19,851 4,517 11,267 4,0675110 18,735 : : : 42,526 12,392 18,393 11,741 8,524 2,410 5,146 968 BE 4,620 1,689 2,008 923 2,857 987 1,616 254 DE 13,896 : : : 29,005 9,576 12,234 7,195 6,765 2,126 3,966 673 GR 834 : : : 753 211 450 92 469 168 265 36 ES 6,199 : : : 4,834 1,462 2,599 773 2,208 727 1,330 151 FR 13,842 : : : 9,281 2,817 4,564 1,900 3,564 1,140 2,111 313 IE 1,548 : : : 1,561 504 611 446 922 310 527 85 IT 9,412 : : : 13,396 4,255 6,698 2,443 3,856 1,183 2,383 290 LU 4,549 : : : 429 185 170 74 286 110 143 33 NL 15,139 : : : 6,655 2,299 3,102 1,254 4,518 1,356 2,707 455 AT 3,232 : : : 9,344 4,043 3,504 1,797 1,724 682 916 126 PT 1,937 : : : 1,171 321 710 140 769 245 480 44 FI 1,550 : : : 1,536 656 644 236 2,125 811 1,126 188 DK 3,485 : : : 2,583 954 1,218 411 SE 2,943 : : : 2,957 1,155 1,306 496 5,620 1,874 3,185 561 UK 8,447 : : : 7,820 2,412 3,494 1,914 4,386 1,419 2,527 4405190 : : : : 25,451 8,130 11,362 5,959 11,239 3,185 5,924 2,130 CZ 1,995 : : : 1,391 493 729 169 EE : : : : 292 107 145 40 705 222 381 102 CY : : : : 78 12 51 15 61 24 29 8 LV : : : : 468 168 232 68 665 250 322 93 LT : : : : 235 83 114 38 946 336 458 152 HU 1,077 : : : 4,184 1,556 2,042 586 671 245 344 82 MT : : : : 120 43 65 12 48 11 28 9 PL 2,215 : : : 8,451 2,771 4,339 1,341 2,674 923 1,323 428 SI : : : : 1,771 696 837 238 444 155 242 47 SK : : : : 13,483 5,262 5,763 2,458 372 124 206 42 NO 835 : : : 796 314 341 141 5,596 1,828 2,710 1,058 CH 4,824 : : : 6,074 2,453 2,266 1,355 2,799 1,011 1,376 412 RO : : : : 1,377 427 753 197 257 69 159 29 BG : : : : 965 282 509 174 211 68 123 20 TR 2,024 : : : 2,223 577 1,246 400 1,141 282 742 117 RU 486 : : : 1,411 485 587 339 355 134 169 525210 : : : : 776 188 475 113 232 63 135 345290 : : : : 1,042 316 575 151 613 185 339 895310 8,314 : : : 10,282 2,791 4,094 3,397 6,245 1,620 3,158 1,467 CA 1,631 : : : 1,661 450 749 462 1,109 373 496 240 US 7,761 : : : 9,767 2,682 3,919 3,166 5,618 1,485 2,832 1,3015320 : : : : 1,219 311 705 203 371 129 186 56 MX : : : : 969 250 558 161 229 81 120 285330 1,763 : : : 1,394 418 762 214 685 208 402 75 1330 : : : : 1,112 346 632 134 486 152 285 495410 : : : : 1,519 406 743 370 950 282 508 1605490 : : : : 15,472 3,668 7,565 4,239 7,394 1,656 4,639 1,099 JP 2,124 : : : 5,612 1,601 2,790 1,221 1,511 476 822 213 CN 4,514 : : : 8,235 1,879 4,454 1,902 3,759 806 2,488 465 IN : : : : 2,149 560 1,255 334 1,312 284 888 140 1415 : : : : 8,281 2,047 4,301 1,933 4,296 1,008 2,685 6035500 803 : : : 894 273 444 177 831 271 405 1555900 : : : : 272 132 100 40 173 47 110 16
: = Data not available .. = Confidential data

86 External Trade by Enterprise Characteristics – Results of the Standardisation exercise 2006
TablesII
Table 4.1a: Arrivals and imports by partner countries (number of enterprises) – Part 2
Number of enterprises
Partner country or zone
Reporting country and activity sectionDE EE FR
Total C-E G Others Total C-E G Others Total C-E G OthersTotal : : : : 11,120 2,333 5,283 3,504 103,437 28,853 52,006 22,5785110 41,148 13,570 21,692 5,886 8,648 2,042 3,880 2,726 61,002 20,314 31,974 8,714 BE 15,652 6,322 7,001 2,329 1,172 316 689 167 31,053 12,011 15,887 3,155 DE 4,340 1,056 2,186 1,098 35,746 14,439 17,788 3,519 GR 2,578 870 1,315 393 211 30 160 21 1,869 614 1,128 127 ES 10,775 4,245 4,928 1,602 1,163 277 758 128 28,070 10,608 15,223 2,239 FR 19,722 7,585 9,203 2,934 1,753 389 1,090 274 IE 3,225 1,348 1,233 644 371 81 202 88 3,915 1,647 1,834 434 IT 23,789 8,338 12,119 3,332 2,563 643 1,540 380 36,386 13,422 19,641 3,323 LU 3,371 1,385 1,399 587 103 12 77 14 4,806 2,035 2,302 469 NL 22,479 8,353 10,761 3,365 1,704 376 984 344 21,813 8,241 11,424 2,148 AT 16,705 7,139 6,903 2,663 878 253 517 108 7,347 3,465 3,309 573 PT 3,475 1,324 1,601 550 467 96 337 34 8,224 2,644 4,919 661 FI 4,123 1,871 1,516 736 3,927 1,301 1,645 981 3,392 1,746 1,362 284 DK 10,683 3,860 5,135 1,688 1,583 446 826 311 7,373 2,602 4,115 656 SE 7,573 3,266 3,044 1,263 2,919 896 1,298 725 6,052 3,014 2,559 479 UK 13,863 5,800 5,865 2,198 2,167 532 1,153 482 21,956 9,071 10,840 2,0455190 : : : : 5,560 1,281 3,183 1,096 33,433 13,014 13,754 6,665 CZ : : : : 924 194 629 101 4,880 2,149 2,078 653 EE : : : : 506 213 254 39 CY : : : : 24 3 19 2 142 40 78 24 LV : : : : 1,802 528 989 285 437 168 216 53 LT : : : : 1,283 354 754 175 763 280 377 106 HU : : : : 639 112 454 73 2,887 1,385 1,099 403 MT : : : : 36 6 28 2 227 79 112 36 PL : : : : 1,420 299 957 164 5,425 2,187 2,492 746 SI : : : : 263 47 193 23 1,616 736 712 168 SK : : : : 340 58 266 16 1,522 738 622 162 NO : : : : 740 245 352 143 1,867 872 638 357 CH : : : : 1,085 279 633 173 16,744 7,632 5,413 3,699 RO : : : : 262 27 212 23 2,663 948 1,363 352 BG : : : : 232 37 178 17 1,164 467 584 113 TR : : : : 664 102 522 40 5,700 1,859 3,205 636 RU : : : : 1,654 383 982 289 1,194 516 533 1455210 : : : : 211 18 179 14 7,769 2,661 3,934 1,1745290 : : : : 224 28 181 15 6,397 1,874 3,423 1,1005310 : : : : 2,493 490 1,267 736 23,015 7,489 9,449 6,077 CA : : : : 403 67 240 96 4,714 1,686 1,888 1,140 US : : : : 2,386 469 1,219 698 21,116 6,942 8,701 5,4735320 : : : : 354 45 261 48 3,505 1,197 1,851 457 MX : : : : 271 34 201 36 1,909 715 933 2615330 : : : : 376 71 278 27 5,221 1,793 2,744 684 1330 : : : : 301 45 234 22 3,900 1,390 2,013 4975410 : : : : 369 51 276 42 4,968 1,600 2,580 7885490 : : : : 3,366 671 2,106 589 31,500 8,882 17,354 5,264 JP : : : : 1,325 282 788 255 7,286 2,753 3,292 1,241 CN : : : : 2,093 348 1,461 284 16,257 4,607 9,416 2,234 IN : : : : 565 72 453 40 6,061 1,824 3,614 623 1415 : : : : 1,972 393 1,274 305 14,818 4,415 8,165 2,2385500 : : : : 218 34 158 26 2,613 930 1,216 4675900 : : : : 4 0 0 4 2,009 725 1,033 251
: = Data not available .. = Confidential data

87External Trade by Enterprise Characteristics – Results of the Standardisation exercise 2006
Tables II
Table 4.1a: Arrivals and imports by partner countries (number of enterprises) – Part 3
Number of enterprises
Partner country or zone
Reporting country and activity sectionIT CY LV
Total C-E G Others Total C-E G Others Total C-E G OthersTotal 110,631 50,630 48,891 11,110 13,978 1,122 4,039 8,817 13,436 2,290 6,917 4,2295110 42,128 21,840 18,183 2,105 7,993 735 2,250 5,008 9,181 1,717 4,284 3,180 BE 11,898 7,039 4,453 406 1,047 184 533 330 1,175 248 705 222 DE 29,644 16,764 11,616 1,264 2,660 345 1,201 1,114 5,653 1,083 2,775 1,795 GR 2,913 1,657 1,199 57 5,078 628 2,068 2,382 188 31 135 22 ES 16,267 9,523 6,298 446 1,690 221 932 537 980 146 697 137 FR 23,278 13,109 9,246 923 1,668 219 852 597 1,549 267 954 328 IE 2,518 1,337 1,002 179 238 27 127 84 362 66 179 117 IT 3,940 517 1,805 1,618 2,538 475 1,617 446 LU 1,331 834 438 59 55 7 29 19 87 11 61 15 NL 13,611 7,033 6,007 571 1,392 182 695 515 1,879 329 1,083 467 AT 11,996 7,059 4,403 534 443 52 271 120 875 204 492 179 PT 3,083 2,027 998 58 227 37 121 69 252 32 195 25 FI 2,608 1,762 756 90 457 65 241 151 1,888 465 890 533 DK 4,771 2,336 2,245 190 528 72 276 180 1,424 352 689 383 SE 4,842 2,984 1,662 196 534 86 263 185 2,146 492 916 738 UK 15,299 8,721 5,822 756 3,495 315 1,408 1,772 1,961 398 1,036 5275190 50,897 29,108 17,765 4,024 824 75 252 497 8,540 1,581 5,010 1,949 CZ 6,185 3,853 2,060 272 381 54 221 106 1,028 210 667 151 EE 455 308 132 15 27 .. 15 .. 2,557 583 1,381 593 CY 298 184 99 15 27 2 18 7 LV 450 290 148 12 23 .. 12 .. LT 755 488 240 27 41 .. 27 .. 3,769 840 2,081 848 HU 4,453 2,817 1,453 183 242 23 139 80 521 87 349 85 MT 489 272 162 55 44 .. 29 .. 11 1 9 1 PL 6,110 3,508 2,355 247 353 30 224 99 2,316 447 1,557 312 SI 5,329 3,502 1,569 258 127 14 79 34 249 49 168 32 SK 2,954 1,812 1,032 110 129 11 79 39 330 62 233 35 NO 1,917 1,343 407 167 127 23 53 51 405 103 183 119 CH 21,831 13,171 6,584 2,076 700 100 335 265 872 190 521 161 RO 6,868 4,325 2,143 400 257 26 154 77 100 11 80 9 BG 2,165 1,355 710 100 305 31 126 148 151 16 118 17 TR 6,880 4,285 2,348 247 159 11 100 48 745 75 630 40 RU 2,479 1,539 810 130 228 32 81 115 1,980 411 1,287 2825210 5,385 2,982 2,088 315 223 33 40 150 73 6 65 25290 4,927 2,669 1,988 270 55 .. .. 44 74 17 45 125310 25,673 12,678 8,968 4,027 653 23 98 532 1,438 218 765 455 CA 4,162 2,336 1,359 467 334 22 162 150 227 34 126 67 US 24,200 11,897 8,501 3,802 2,171 171 840 1,160 1,336 202 707 4275320 2,929 1,705 1,057 167 20 .. .. 17 84 14 58 12 MX 1,734 1,061 575 98 134 7 83 44 47 6 36 55330 7,980 4,268 3,358 354 152 13 85 54 133 25 100 8 1330 6,099 3,345 2,501 253 137 13 80 44 102 14 82 65410 6,365 3,510 2,411 444 1,081 86 269 726 240 36 159 455490 40,246 18,753 18,831 2,662 2,776 143 971 1,662 1,550 286 1,040 224 JP 7,341 3,992 2,749 600 1,432 75 679 678 217 46 136 35 CN 20,816 9,457 10,357 1,002 2,649 213 1,332 1,104 819 114 636 69 IN 8,445 4,315 3,833 297 823 105 431 287 201 31 153 17 1415 17,813 8,762 7,962 1,089 460 16 84 360 830 168 533 1295500 2,838 1,728 926 184 191 11 60 120 92 19 52 215900 140 69 39 32 10 .. .. 7 172 31 60 81
: = Data not available .. = Confidential data

88 External Trade by Enterprise Characteristics – Results of the Standardisation exercise 2006
TablesII
Table 4.1a: Arrivals and imports by partner countries (number of enterprises) – Part 4
Number of enterprises
Partner country or zone
Reporting country and activity sectionLT LU HU
Total C-E G Others Total C-E G Others Total C-E G OthersTotal 11,689 2,385 6,163 3,141 5,212 405 2,739 2,069 37,158 9,621 16,830 10,7075110 8,792 1,790 4,562 2,440 4,294 386 2,392 1,516 28,874 8,232 12,627 8,015 BE 1,428 317 922 189 3,508 359 2,021 1,129 3,611 1,340 1,687 584 DE 5,975 1,177 3,276 1,522 3,122 352 1,711 1,059 17,824 5,717 7,755 4,352 GR 201 36 153 0 38 6 27 5 748 213 455 80 ES 1,682 260 1,255 167 537 74 369 94 4,249 1,242 2,491 516 FR 2,617 464 1,777 376 2,676 320 1,521 835 6,783 2,173 3,427 1,183 IE 344 76 199 69 119 25 60 34 1,295 406 552 337 IT 3,315 660 2,235 420 1,159 143 797 219 11,680 3,701 6,198 1,781 LU 96 15 64 17 336 149 142 45 NL 2,077 375 1,366 336 1,783 217 1,111 455 5,308 1,664 2,554 1,090 AT 1,036 260 637 139 547 77 353 117 7,987 3,171 3,204 1,612 PT 353 71 256 26 172 22 121 29 1,122 353 672 97 FI 1,227 317 686 224 110 30 52 28 1,374 550 606 218 DK 1,556 456 775 325 357 52 226 79 2,122 653 1,091 378 SE 2,188 531 1,148 509 197 46 98 53 2,793 880 1,410 503 UK 2,450 480 1,559 411 727 104 406 217 6,410 1,870 3,078 1,4625190 6,843 1,697 4,017 1,129 1,110 148 524 438 15,349 4,623 7,823 2,903 CZ 1,449 331 977 141 132 43 50 39 4,831 1,681 2,477 673 EE 889 291 452 146 10 2 6 2 211 78 105 28 CY 27 .. 21 .. 3 1 1 1 61 13 39 9 LV 1,497 507 742 248 11 1 7 3 141 42 82 17 LT 10 6 3 1 117 160 28 HU 716 119 526 71 86 26 31 29 MT 32 .. 23 .. 5 2 2 1 145 48 86 11 PL 3,153 775 1,954 424 117 30 53 34 3,839 1,229 2,146 464 SI 341 59 260 22 24 9 12 3 1,744 684 879 181 SK 485 103 350 32 36 11 17 8 3,797 1,384 1,848 565 NO 484 168 202 114 54 16 19 19 613 215 304 94 CH 1,000 253 607 140 797 121 343 333 4,283 1,734 1,861 688 RO 247 36 195 16 37 7 22 8 3,102 977 1,609 516 BG 210 38 164 8 16 5 9 2 821 261 484 76 TR 743 168 536 39 54 13 31 10 2,019 569 1,260 190 RU 1,859 517 1,099 243 31 11 14 6 864 299 450 1155210 189 27 154 8 29 9 7 13 790 204 517 695290 187 34 144 9 63 16 19 28 883 274 498 1115310 2,467 381 1,559 527 728 70 272 386 7,662 2,035 3,465 2,162 CA 387 58 259 70 136 27 43 66 1,262 321 629 312 US 2,391 369 1,510 512 667 64 251 352 7,347 1,981 3,315 2,0515320 285 39 213 33 19 7 4 8 1,195 318 666 211 MX 253 32 191 30 11 6 2 3 968 255 544 1695330 393 76 280 37 52 12 20 20 1,230 382 737 111 1330 336 65 241 30 34 11 11 12 1,041 332 630 795410 357 77 237 43 103 19 47 37 1,329 345 692 2925490 3,803 644 2,654 505 454 53 227 174 10,994 2,778 6,173 2,043 JP 1,800 246 1,314 240 69 23 17 29 4,362 1,354 2,254 754 CN 2,023 338 1,480 205 146 28 77 41 6,149 1,445 3,747 957 IN 537 93 408 36 48 16 24 8 1,831 478 1,184 169 1415 2,236 363 1,623 250 289 36 145 108 6,374 1,664 3,632 1,0785500 190 42 118 30 44 13 15 16 335 242 51 425900 220 16 164 40 76 16 38 22 0 0 0 0
: = Data not available .. = Confidential data

8�External Trade by Enterprise Characteristics – Results of the Standardisation exercise 2006
Tables II
Table 4.1a: Arrivals and imports by partner countries (number of enterprises) – Part 5
Number of enterprises
Partner country or zone
Reporting country and activity sectionAT PL SI
Total C-E G Others Total C-E G Others Total C-E G OthersTotal 31,603 7,089 16,944 7,570 79,931 22,639 37,112 20,180 17,004 5,183 6,546 5,2755110 17,462 4,327 10,388 2,747 66,125 19,732 29,617 16,776 14,770 4,724 5,612 4,434 BE 3,856 1,250 2,158 448 6,540 2,799 2,821 920 1,681 594 806 281 DE 16,095 4,245 9,419 2,431 7,045 2,888 3,023 1,134 8,373 2,949 3,142 2,282 GR 475 149 291 35 42,712 13,827 18,874 10,011 434 122 268 44 ES 2,796 851 1,704 241 1,285 442 736 107 1,821 580 969 272 FR 5,338 1,663 3,132 543 8,589 2,648 4,864 1,077 2,920 956 1,411 553 IE 856 257 470 129 16,185 4,842 8,043 3,300 684 212 289 183 IT 9,320 2,693 5,674 953 2,360 751 928 681 8,522 2,959 3,673 1,890 LU 519 181 275 63 20,429 7,201 10,501 2,727 203 84 98 21 NL 6,100 1,762 3,609 729 578 236 241 101 2,306 780 1,067 459 AT 10,575 3,662 4,554 2,359 5,001 1,973 1,814 1,214 PT 587 188 362 37 1,857 639 1,048 170 551 118 373 60 FI 1,190 515 554 121 2,613 1,223 1,027 363 598 222 285 91 DK 2,786 839 1,654 293 5,347 2,213 2,186 948 1,197 417 538 242 SE 2,392 870 1,233 289 7,277 2,699 2,817 1,761 1,421 532 642 247 UK 4,309 1,299 2,523 487 11,564 3,822 5,197 2,545 3,001 946 1,295 7605190 19,455 5,507 9,426 4,522 23,794 8,695 11,449 3,650 7,135 2,409 3,348 1,378 CZ 5,594 2,046 2,624 924 9,947 4,125 4,543 1,279 2,118 790 1,013 315 EE 166 86 61 19 563 257 249 57 111 41 61 9 CY 59 24 24 11 167 38 108 21 43 8 31 4 LV 152 62 68 22 480 231 199 50 92 37 50 5 LT 237 82 124 31 1,360 650 588 122 149 42 94 13 HU 4,564 1,609 2,150 805 3,979 1,566 1,978 435 1,686 595 857 234 MT 43 23 10 10 380 78 149 153 97 30 56 11 PL 2,298 826 1,136 336 1,460 500 791 169 SI 3,580 1,443 1,567 570 1,796 747 924 125 SK 2,753 990 1,268 495 3,838 1,713 1,755 370 1,028 410 506 112 NO 588 312 187 89 1,630 784 618 228 350 132 160 58 CH 8,860 3,044 3,864 1,952 6,055 2,541 2,622 892 2,320 943 946 431 RO 986 338 511 137 1,585 542 927 116 643 170 412 61 BG 575 190 299 86 1,224 415 733 76 431 141 250 40 TR 1,467 469 820 178 3,555 1,205 2,074 276 1,182 305 775 102 RU 403 200 164 39 2,648 842 1,424 382 342 162 143 375210 285 106 127 52 1,268 344 820 104 475 108 325 425290 509 227 206 76 2,045 690 1,158 197 548 175 304 765310 5,046 1,356 2,443 1,247 12,099 3,787 5,271 3,041 3,822 1,140 1,533 1,149 CA 932 364 379 189 2,097 653 976 468 749 195 371 183 US 4,768 1,285 2,306 1,177 11,524 3,601 5,022 2,901 3,613 1,078 1,449 1,0865320 302 140 108 54 1,872 510 1,034 328 626 176 347 103 MX 198 106 60 32 1,452 396 784 272 3,613 1,078 1,449 1,0865330 549 246 236 67 2,028 724 1,138 166 667 215 403 49 1330 399 194 160 45 1,691 602 967 122 583 190 353 405410 978 345 493 140 2,053 632 1,109 312 622 181 349 925490 5,264 1,348 3,101 815 19,992 5,741 11,153 3,098 5,282 1,511 2,749 1,022 JP 1,178 503 509 166 11,471 3,099 6,956 1,416 2,123 717 969 437 CN 2,310 608 1,443 259 3,157 1,004 1,913 240 3,326 835 1,991 500 IN 887 287 502 98 6,828 2,188 3,479 1,161 1,002 280 632 90 1415 3,142 801 1,899 442 10,155 3,033 5,554 1,568 3,029 858 1,619 5525500 .. 227 247 .. 1,145 364 618 163 412 106 212 945900 .. 0 0 .. 3,485 1,312 1,495 678 5 3 1 1
: = Data not available .. = Confidential data

�0 External Trade by Enterprise Characteristics – Results of the Standardisation exercise 2006
TablesII
Table 4.1a: Arrivals and imports by partner countries (number of enterprises) – Part 6
Number of enterprises
Partner country or zone
Reporting country and activity sectionSK FI
Total C-E G Others Total C-E G OthersTotal 29,738 7,132 13,920 8,686 16,080 4,096 8,335 3,6495110 18,868 4,757 8,784 5,327 8,283 2,270 4,926 1,087 BE 2,239 781 1,075 383 2,139 741 1,250 148 DE 11,890 3,307 5,529 3,054 5,535 1,787 3,264 484 GR 363 83 237 43 205 58 135 12 ES 2,427 691 1,382 354 1,736 566 1,086 84 FR 4,497 1,203 2,366 928 2,856 973 1,665 218 IE 857 222 385 250 510 155 306 49 IT 7,523 2,152 4,042 1,329 3,401 1,132 2,065 204 LU 210 73 104 33 177 58 99 20 NL 3,042 886 1,536 620 3,392 999 2,084 309 AT 4,651 1,600 2,013 1,038 1,356 509 752 95 PT 576 147 376 53 507 179 311 17 FI 780 279 411 90 DK 1,344 398 666 280 3,472 1,098 2,058 316 SE 1,711 530 839 342 5,855 1,843 3,284 728 UK 3,776 989 1,867 920 3,598 1,164 2,115 3195190 20,647 5,669 9,841 5,137 8,351 2,776 3,980 1,595 CZ 15,859 4,697 7,084 4,078 943 323 520 100 EE 104 32 61 11 3,436 1,304 1,525 607 CY 57 7 43 7 23 3 16 4 LV 88 34 43 11 404 162 202 40 LT 188 63 107 18 397 162 191 44 HU 3,378 1,050 1,757 571 492 202 233 57 MT 69 13 52 4 28 9 17 2 PL 4,738 1,333 2,720 685 1,125 413 584 128 SI 1,085 378 582 125 236 94 126 16 SK 250 98 131 21 NO 336 122 154 60 2,215 841 967 407 CH 2,520 887 1,190 443 2,039 773 1,000 266 RO 673 186 407 80 111 41 61 9 BG 523 151 319 53 118 35 73 10 TR 1,252 319 800 133 545 139 361 45 RU 729 240 361 128 1,064 399 463 2025210 372 79 250 43 90 23 55 125290 492 116 320 56 220 77 111 325310 4,551 1,140 2,139 1,272 4,699 1,219 2,242 1,238 CA 757 156 392 209 881 255 422 204 US 4,301 1,097 2,028 1,176 4,428 1,155 2,127 1,1465320 614 133 384 97 308 82 195 31 MX 492 107 305 80 246 65 154 275330 694 179 440 75 358 134 202 22 1330 595 162 372 61 285 108 160 175410 672 163 393 116 461 134 268 595490 8,482 1,927 5,041 1,514 4,724 1,167 2,827 730 JP 2,717 735 1,457 525 1,296 393 731 172 CN 4,431 907 2,846 678 2,415 573 1,533 309 IN 1,076 261 697 118 604 161 399 44 1415 3,912 931 2,284 697 2,691 676 1,649 3665500 399 95 231 73 358 107 179 725900 327 131 151 45 0 0 0 0
: = Data not available .. = Confidential data

�1External Trade by Enterprise Characteristics – Results of the Standardisation exercise 2006
Tables II
Table 4.1a: Arrivals and imports by partner countries (number of enterprises) – Part 7
Number of enterprises
Partner country or zone
Reporting country and activity sectionSE NO
Total C-E G Others Total C-E G OthersTotal 41,665 9,165 18,459 14,041 67,070 9,336 29,311 28,4235110 12,671 3,693 7,324 1,654 59,424 8,697 26,699 24,028 BE 3,151 1,209 1,647 295 5,002 1,047 3,091 864 DE 8,523 2,909 4,746 868 20,564 3,699 11,441 5,424 GR 380 99 247 34 823 91 661 71 ES 2,548 831 1,536 181 4,442 780 2,967 695 FR 4,287 1,500 2,399 388 7,776 1,343 5,091 1,342 IE 953 332 501 120 1,865 340 904 621 IT 5,056 1,633 3,058 365 10,234 1,763 6,744 1,727 LU 308 134 134 40 433 79 296 58 NL 5,189 1,622 2,989 578 9,668 1,770 5,713 2,185 AT 2,063 849 1,041 173 3,108 713 1,897 498 PT 886 276 563 47 2,719 240 2,269 210 FI 4,854 1,918 2,370 566 6,570 1,523 3,450 1,597 DK 7,654 2,620 4,174 860 25,446 4,273 14,075 7,098 SE 30,438 5,504 14,036 10,898 UK 5,938 2,000 3,314 624 15,175 2,669 7,759 4,7475190 24,434 6,831 10,416 7,187 9,411 1,715 5,839 1,857 CZ 2,061 794 926 341 2,529 406 1,829 294 EE 2,648 988 1,080 580 1,670 269 1,006 395 CY 85 30 38 17 79 10 66 3 LV 1,041 440 411 190 812 150 527 135 LT 1,046 377 461 208 1,443 226 945 272 HU 1,161 479 492 190 1,688 162 1,359 167 MT 73 36 26 11 62 12 41 9 PL 3,623 1,306 1,597 720 3,759 598 2,687 474 SI 601 245 289 67 835 114 675 46 SK 469 208 213 48 990 83 848 59 NO 15,933 4,880 6,365 4,688 CH 5,392 1,891 2,350 1,151 4,022 978 2,304 740 RO 393 123 215 55 1,511 96 1,334 81 BG 246 88 124 34 789 40 701 48 TR 1,331 320 823 188 2,311 172 2,010 129 RU 574 269 186 119 660 151 404 1055210 304 92 159 53 658 51 561 465290 867 306 369 192 237 59 141 375310 15,142 3,360 5,830 5,952 13,184 2,084 6,136 4,964 CA 2,419 737 1,007 675 2,154 425 1,169 560 US 14,361 3,193 5,526 5,642 12,488 1,987 5,788 4,7135320 486 182 209 95 246 32 171 43 MX 287 121 116 50 645 87 436 1225330 1,010 384 468 158 1,092 229 697 166 1330 770 310 348 112 877 177 563 1375410 1,690 473 794 423 1,463 231 987 2455490 10,761 2,509 5,890 2,362 13,691 1,646 9,498 2,547 JP 2,398 836 1,117 445 4,170 717 2,526 927 CN 4,155 963 2,554 638 9,056 882 6,866 1,308 IN 1,475 354 903 218 2,998 269 2,447 282 1415 6,974 1,675 3,855 1,444 8,491 1,066 5,971 1,4545500 1,409 490 552 367 1,108 214 638 2565900 1,313 427 709 177 0 0 0 0
: = Data not available .. = Confidential data

�2 External Trade by Enterprise Characteristics – Results of the Standardisation exercise 2006
TablesII
Table 4.1b: Arrivals and imports by partner countries (€ million) – Part 1
€ million
Partner country or zone
Reporting country and activity sectionBE CZ DK
Total C-E G Others Total C-E G Others Total C-E G OthersTotal : : : : 45,236 25,295 15,381 4,560 50,565 13,437 26,602 10,5265110 142,832 : : : 26,802 16,301 8,572 1,929 34,873 9,025 18,649 7,199 BE 924 435 432 57 1,722 471 982 269 DE 36,789 : : : 14,736 10,300 3,426 1,010 11,491 3,463 5,438 2,590 GR 197 : : : 64 23 38 3 121 20 84 18 ES 3,940 : : : 821 423 370 29 869 177 544 148 FR 26,194 : : : 2,229 1,100 923 206 2,423 489 1,502 432 IE 11,210 : : : 248 56 153 40 625 149 355 121 IT 6,573 : : : 2,402 1,164 1,075 163 2,059 489 1,098 473 LU 1,305 : : : 82 55 23 4 117 19 79 19 NL 32,275 : : : 991 414 514 62 3,463 761 1,980 723 AT 1,102 : : : 1,939 1,119 661 159 623 173 307 143 PT 1,440 : : : 114 80 32 2 289 68 160 62 FI 1,327 : : : 248 116 113 19 1,152 377 538 237 DK 957 : : : 296 117 158 20 SE 4,272 : : : 481 261 190 30 6,424 1,585 3,577 1,262 UK 15,251 : : : 1,227 638 464 125 3,495 784 2,006 7055190 : : : : 9,590 4,052 3,754 1,784 7,494 2,317 3,493 1,684 CZ 821 : : : 238 83 138 16 EE : : : : 27 15 9 3 162 89 61 12 CY : : : : 15 3 12 0 4 2 2 0 LV : : : : 29 13 15 1 152 83 63 7 LT : : : : 12 6 5 0 273 134 116 22 HU 1,058 : : : 919 531 340 48 223 112 104 7 MT : : : : 5 2 2 0 4 0 3 0 PL 1,382 : : : 1,877 821 866 189 905 482 353 69 SI : : : : 266 102 144 20 103 40 61 2 SK : : : : 2,345 870 1,280 196 101 61 37 3 NO 1,912 : : : 383 48 27 308 3,300 505 1,499 1,295 CH 1,541 : : : 726 379 296 51 564 268 251 44 RO : : : : 122 66 44 12 29 6 21 3 BG : : : : 53 25 24 4 27 16 10 1 TR 1,208 : : : 290 81 163 46 449 38 382 29 RU 2,246 : : : 2,067 903 291 873 472 242 219 115210 : : : : 105 63 36 6 22 9 12 15290 : : : : 112 82 28 2 224 154 54 175310 13,340 : : : 1,525 710 502 312 1,971 733 744 494 CA 1,066 : : : 114 42 51 21 145 43 71 31 US 12,274 : : : 1,411 668 451 292 1,559 663 474 4215320 : : : : 256 202 45 9 114 44 35 35 MX : : : : 63 38 17 8 56 36 19 15330 3,998 : : : 221 99 113 9 625 179 429 16 1330 : : : : 150 73 70 6 382 63 313 75410 : : : : 466 371 77 18 154 28 109 185490 : : : : 6,038 3,348 2,209 482 4,910 875 2,986 1,049 JP 6,692 : : : 1,029 533 423 74 449 138 277 34 CN 5,470 : : : 2,361 1,250 928 183 1,809 286 1,286 236 IN : : : : 107 46 48 13 244 41 174 29 1415 : : : : 1,965 1,130 649 186 1,923 328 898 6975500 903 : : : 68 50 12 6 178 74 91 125900 : : : : 52 17 31 4 1 0 1 0
: = Data not available .. = Confidential data

�3External Trade by Enterprise Characteristics – Results of the Standardisation exercise 2006
Tables II
Table 4.1b: Arrivals and imports by partner countries (€ million) – Part 2
€ million
Partner country or zone
Reporting country and activity sectionDE EE FR
Total C-E G Others Total C-E G Others Total C-E G OthersTotal : : : : 5,628 2,260 2,679 690 320,189 168,594 131,014 20,5805110 211,754 86,798 73,740 51,217 2,998 1,279 1,435 284 198,775 104,143 84,159 10,472 BE 29,327 8,884 9,476 10,966 100 32 63 5 21,589 11,286 8,901 1,402 DE 631 161 390 80 56,796 29,324 25,203 2,269 GR 1,104 262 626 216 7 3 4 0 508 208 286 15 ES 12,299 6,034 4,390 1,875 51 11 38 2 24,805 14,719 9,265 821 FR 36,956 17,758 12,292 6,907 162 40 111 11 IE 5,202 1,625 1,827 1,750 31 19 8 5 6,774 4,194 2,360 221 IT 24,879 9,739 10,854 4,286 180 61 104 15 30,279 14,349 14,136 1,794 LU 1,654 758 550 346 4 0 2 2 1,387 783 412 192 NL 42,817 15,531 17,772 9,514 131 48 68 15 14,651 6,814 6,758 1,078 AT 16,353 8,884 4,081 3,388 60 28 28 4 3,339 1,460 1,672 207 PT 3,835 2,676 709 450 12 4 8 0 3,664 1,991 1,475 199 FI 3,267 1,050 1,086 1,130 875 462 326 87 2,279 1,042 1,032 204 DK 6,712 2,679 3,122 911 125 48 65 11 2,591 1,222 1,173 196 SE 6,098 2,521 1,786 1,792 502 313 153 35 4,323 2,138 2,014 171 UK 21,251 8,398 5,168 7,686 128 49 68 11 21,912 12,706 7,873 1,3335190 : : : : 1,580 453 783 344 31,028 19,391 9,176 2,461 CZ : : : : 62 17 42 3 1,741 1,080 554 107 EE : : : : 92 48 41 2 CY : : : : 1 0 0 0 59 3 6 50 LV : : : : 136 57 69 10 76 46 29 2 LT : : : : 197 45 143 8 445 87 200 157 HU : : : : 55 9 38 8 2,173 1,510 543 121 MT : : : : 3 3 0 0 194 24 159 11 PL : : : : 144 28 109 8 2,744 1,680 919 145 SI : : : : 8 1 7 0 703 505 171 27 SK : : : : 19 3 15 0 711 353 339 19 NO : : : : 55 31 21 3 4,271 3,906 277 88 CH : : : : 53 22 22 9 7,108 3,133 2,844 1,131 RO : : : : 5 1 4 0 1,383 785 462 136 BG : : : : 4 0 3 0 423 245 169 9 TR : : : : 31 5 25 0 2,810 1,174 1,512 123 RU : : : : 485 209 182 93 4,844 4,325 412 1075210 : : : : 5 0 4 0 7,963 5,460 2,145 3595290 : : : : 12 8 3 0 5,595 3,721 1,451 4235310 : : : : 198 88 72 38 23,003 13,051 6,627 3,325 CA : : : : 17 3 13 1 1,791 1,210 376 206 US : : : : 180 85 58 37 21,204 11,840 6,245 3,1195320 : : : : 12 5 7 0 1,274 687 478 109 MX : : : : 3 1 2 0 610 326 244 405330 : : : : 20 5 14 1 4,477 2,417 1,829 231 1330 : : : : 12 4 8 1 2,997 1,364 1,471 1625410 : : : : 10 2 4 4 5,665 4,396 597 6725490 : : : : 784 410 356 18 40,351 14,036 23,873 2,442 JP : : : : 223 108 110 5 10,475 3,892 5,866 717 CN : : : : 257 128 123 6 13,561 4,351 8,544 665 IN : : : : 11 3 7 0 1,485 509 906 71 1415 : : : : 200 102 92 7 10,536 3,893 5,862 7815500 : : : : 10 8 2 0 1,375 793 524 585900 : : : : 0 0 0 0 682 498 155 28
: = Data not available .. = Confidential data
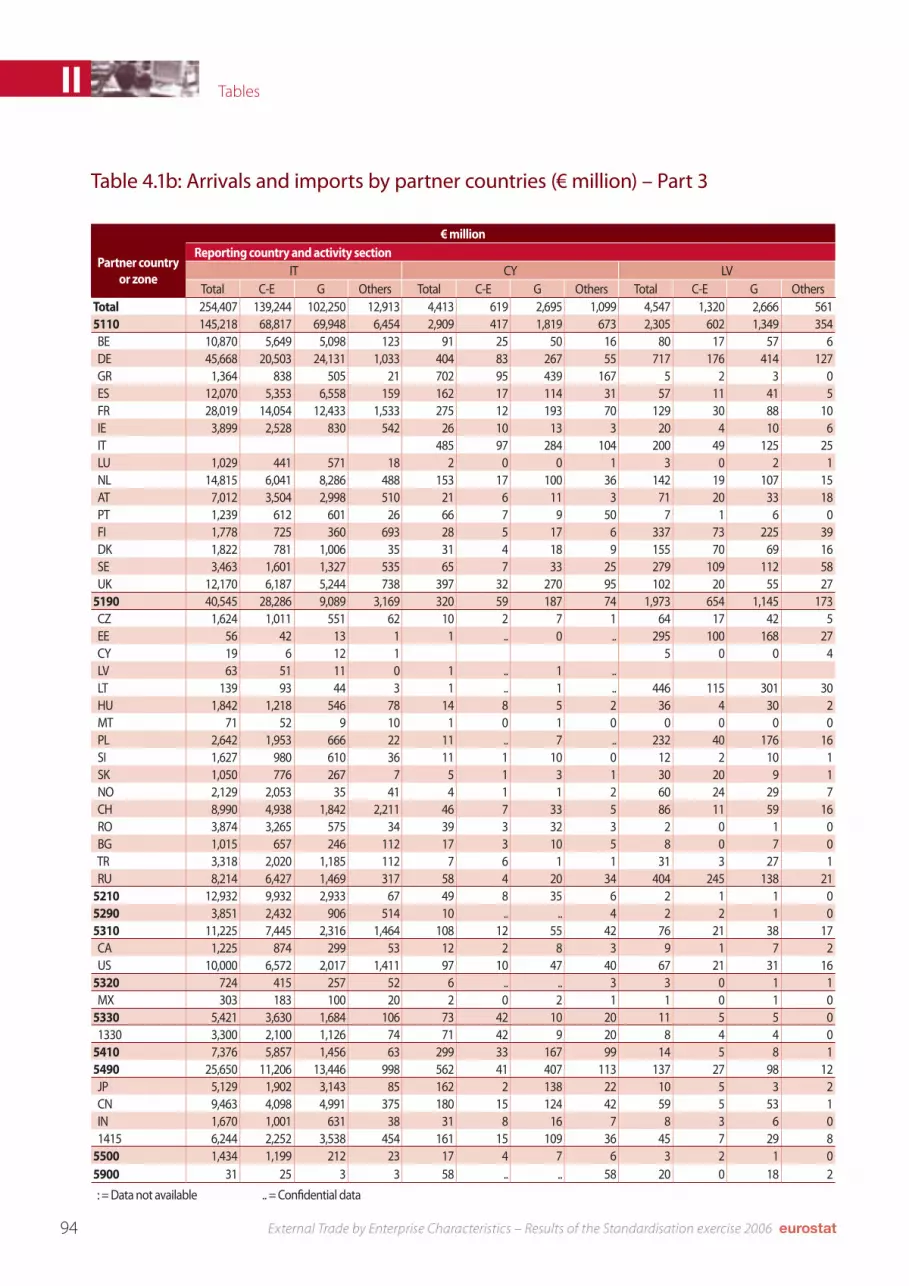
�4 External Trade by Enterprise Characteristics – Results of the Standardisation exercise 2006
TablesII
Table 4.1b: Arrivals and imports by partner countries (€ million) – Part 3
€ million
Partner country or zone
Reporting country and activity sectionIT CY LV
Total C-E G Others Total C-E G Others Total C-E G OthersTotal 254,407 139,244 102,250 12,913 4,413 619 2,695 1,099 4,547 1,320 2,666 5615110 145,218 68,817 69,948 6,454 2,909 417 1,819 673 2,305 602 1,349 354 BE 10,870 5,649 5,098 123 91 25 50 16 80 17 57 6 DE 45,668 20,503 24,131 1,033 404 83 267 55 717 176 414 127 GR 1,364 838 505 21 702 95 439 167 5 2 3 0 ES 12,070 5,353 6,558 159 162 17 114 31 57 11 41 5 FR 28,019 14,054 12,433 1,533 275 12 193 70 129 30 88 10 IE 3,899 2,528 830 542 26 10 13 3 20 4 10 6 IT 485 97 284 104 200 49 125 25 LU 1,029 441 571 18 2 0 0 1 3 0 2 1 NL 14,815 6,041 8,286 488 153 17 100 36 142 19 107 15 AT 7,012 3,504 2,998 510 21 6 11 3 71 20 33 18 PT 1,239 612 601 26 66 7 9 50 7 1 6 0 FI 1,778 725 360 693 28 5 17 6 337 73 225 39 DK 1,822 781 1,006 35 31 4 18 9 155 70 69 16 SE 3,463 1,601 1,327 535 65 7 33 25 279 109 112 58 UK 12,170 6,187 5,244 738 397 32 270 95 102 20 55 275190 40,545 28,286 9,089 3,169 320 59 187 74 1,973 654 1,145 173 CZ 1,624 1,011 551 62 10 2 7 1 64 17 42 5 EE 56 42 13 1 1 .. 0 .. 295 100 168 27 CY 19 6 12 1 5 0 0 4 LV 63 51 11 0 1 .. 1 .. LT 139 93 44 3 1 .. 1 .. 446 115 301 30 HU 1,842 1,218 546 78 14 8 5 2 36 4 30 2 MT 71 52 9 10 1 0 1 0 0 0 0 0 PL 2,642 1,953 666 22 11 .. 7 .. 232 40 176 16 SI 1,627 980 610 36 11 1 10 0 12 2 10 1 SK 1,050 776 267 7 5 1 3 1 30 20 9 1 NO 2,129 2,053 35 41 4 1 1 2 60 24 29 7 CH 8,990 4,938 1,842 2,211 46 7 33 5 86 11 59 16 RO 3,874 3,265 575 34 39 3 32 3 2 0 1 0 BG 1,015 657 246 112 17 3 10 5 8 0 7 0 TR 3,318 2,020 1,185 112 7 6 1 1 31 3 27 1 RU 8,214 6,427 1,469 317 58 4 20 34 404 245 138 215210 12,932 9,932 2,933 67 49 8 35 6 2 1 1 05290 3,851 2,432 906 514 10 .. .. 4 2 2 1 05310 11,225 7,445 2,316 1,464 108 12 55 42 76 21 38 17 CA 1,225 874 299 53 12 2 8 3 9 1 7 2 US 10,000 6,572 2,017 1,411 97 10 47 40 67 21 31 165320 724 415 257 52 6 .. .. 3 3 0 1 1 MX 303 183 100 20 2 0 2 1 1 0 1 05330 5,421 3,630 1,684 106 73 42 10 20 11 5 5 0 1330 3,300 2,100 1,126 74 71 42 9 20 8 4 4 05410 7,376 5,857 1,456 63 299 33 167 99 14 5 8 15490 25,650 11,206 13,446 998 562 41 407 113 137 27 98 12 JP 5,129 1,902 3,143 85 162 2 138 22 10 5 3 2 CN 9,463 4,098 4,991 375 180 15 124 42 59 5 53 1 IN 1,670 1,001 631 38 31 8 16 7 8 3 6 0 1415 6,244 2,252 3,538 454 161 15 109 36 45 7 29 85500 1,434 1,199 212 23 17 4 7 6 3 2 1 05900 31 25 3 3 58 .. .. 58 20 0 18 2
: = Data not available .. = Confidential data

��External Trade by Enterprise Characteristics – Results of the Standardisation exercise 2006
Tables II
Table 4.1b: Arrivals and imports by partner countries (€ million) – Part 4
€ million
Partner country or zone
Reporting country and activity sectionLT LU HU
Total C-E G Others Total C-E G Others Total C-E G OthersTotal 8,239 3,854 3,681 705 11,801 4,138 5,958 1,704 42,263 27,593 13,130 1,5405110 3,683 1,391 1,875 416 10,745 3,608 5,662 1,475 23,254 15,034 7,301 919 BE 140 58 74 8 4,147 930 2,754 463 743 329 392 22 DE 1,341 396 791 154 3,350 1,285 1,563 501 10,352 7,543 2,405 404 GR 59 54 5 0 3 1 1 0 66 23 42 1 ES 107 31 71 5 96 35 53 8 815 358 438 18 FR 346 130 193 23 1,658 813 531 315 2,030 1,132 811 87 IE 29 5 22 3 82 9 36 37 199 77 102 20 IT 354 128 201 24 287 110 156 21 2,987 1,730 1,154 103 LU 6 1 2 3 47 29 16 1 NL 212 88 95 29 641 244 326 72 910 491 371 48 AT 80 27 39 14 117 26 76 15 2,655 1,943 599 113 PT 15 8 6 1 23 4 18 2 125 82 41 1 FI 203 76 98 28 12 11 1 1 418 254 151 14 DK 215 122 73 20 26 6 12 8 265 120 128 16 SE 296 122 104 70 52 30 15 7 496 293 185 18 UK 279 144 101 34 261 110 125 26 1,146 628 465 535190 3,341 2,121 1,095 126 321 195 73 53 8,399 4,719 3,416 264 CZ 114 27 82 6 63 49 14 1 1,017 498 480 39 EE 112 52 57 3 1 0 1 0 50 45 4 0 CY 46 .. 1 .. 0 0 0 0 1 0 1 0 LV 132 46 74 12 0 0 0 0 7 3 3 1 LT 2 2 0 0 43 18 24 1 HU 75 11 53 11 21 19 1 0 MT 4 .. 0 .. 0 0 0 0 51 51 1 0 PL 414 103 291 20 44 31 5 8 1,169 676 457 36 SI 30 7 23 0 8 6 2 1 248 116 119 13 SK 30 9 21 1 28 3 3 23 823 441 350 32 NO 102 84 16 3 6 3 2 0 62 47 11 5 CH 65 15 36 14 122 68 37 18 571 345 207 19 RO 7 2 5 0 3 1 1 1 532 359 144 29 BG 15 3 12 0 1 0 0 0 61 31 26 4 TR 74 28 43 3 8 7 1 0 333 72 248 13 RU 1,860 1,614 208 38 7 3 4 0 2,629 1,472 1,120 375210 11 2 9 0 5 5 0 0 37 24 12 15290 25 19 6 0 11 5 0 5 83 64 17 25310 270 73 86 111 313 139 64 109 1,473 926 415 133 CA 16 5 6 5 69 25 2 42 114 47 25 42 US 254 68 80 106 244 114 62 67 1,360 879 390 915320 14 2 6 6 3 0 0 3 177 143 27 7 MX 5 2 2 1 3 0 0 3 113 93 14 65330 53 20 32 1 12 11 1 1 311 112 197 2 1330 31 13 17 1 12 11 1 0 271 106 163 15410 22 7 11 4 23 4 16 4 92 34 48 115490 747 190 530 28 348 166 135 48 8,397 6,508 1,689 199 JP 179 44 126 8 132 43 89 1 1,791 1,424 330 37 CN 257 41 211 5 46 31 12 3 2,914 2,206 647 61 IN 27 12 15 0 11 7 4 0 115 59 54 3 1415 240 74 153 13 119 49 27 44 3,027 2,400 537 915500 12 7 1 3 2 0 0 1 40 29 8 35900 62 23 30 8 17 5 7 5 0 0 0 0
: = Data not available .. = Confidential data

�6 External Trade by Enterprise Characteristics – Results of the Standardisation exercise 2006
TablesII
Table 4.1b: Arrivals and imports by partner countries (€ million) – Part 5
€ million
Partner country or zone
Reporting country and activity sectionAT PL SI
Total C-E G Others Total C-E G Others Total C-E G OthersTotal 79,630 32,675 36,838 10,117 60,129 33,457 23,577 3,096 12,111 6,294 5,030 7875110 54,663 20,689 29,591 4,383 36,710 20,859 13,809 2,042 8,132 4,481 3,113 538 BE 1,874 502 1,105 268 1,170 714 402 54 168 81 78 9 DE 35,596 14,659 18,337 2,600 1,578 832 703 43 2,327 1,365 773 189 GR 109 43 65 1 14,626 8,879 4,896 852 38 15 22 0 ES 1,033 351 583 99 139 62 75 3 247 89 154 4 FR 3,026 987 1,781 258 1,568 640 837 91 1,200 808 366 26 IE 385 115 233 37 4,237 1,970 2,063 204 49 12 30 7 IT 5,019 1,754 2,946 319 323 131 159 33 2,221 1,054 1,031 137 LU 170 45 101 24 5,111 3,361 1,595 155 32 28 4 0 NL 3,449 919 2,223 306 95 55 35 5 253 121 116 17 AT 2,029 1,150 753 126 1,043 678 286 80 PT 198 95 98 5 224 107 111 5 22 10 11 0 FI 636 168 432 37 909 399 284 226 75 37 11 27 DK 430 118 264 48 889 535 315 39 67 23 39 5 SE 1,002 346 484 172 1,573 929 543 101 136 61 66 9 UK 1,698 550 938 210 2,240 1,098 1,040 103 254 101 125 285190 17,975 8,548 4,638 4,789 13,382 8,519 4,455 408 2,428 1,194 1,128 107 CZ 2,552 1,522 852 178 2,062 1,007 1,006 49 307 156 137 15 EE 35 27 6 2 53 38 14 1 1 1 1 0 CY 3 1 3 0 37 37 0 0 1 0 1 0 LV 20 10 8 2 39 24 13 3 3 3 0 0 LT 23 3 18 2 269 75 136 58 2 1 1 0 HU 4,337 1,475 904 1,958 1,079 559 428 93 349 175 160 15 MT 2 1 1 0 26 22 3 0 2 2 0 0 PL 826 426 286 114 189 99 86 4 SI 973 545 307 120 334 165 165 4 SK 1,835 602 504 729 925 421 488 15 162 96 62 4 NO 49 27 12 10 1,064 902 140 23 17 13 3 1 CH 3,994 1,651 964 1,378 693 319 313 61 199 107 67 24 RO 542 279 110 153 196 103 89 4 70 29 40 1 BG 143 91 46 5 79 24 49 6 38 18 19 1 TR 456 121 283 53 774 310 449 14 128 49 77 2 RU 1,177 1,142 23 12 4,643 4,064 543 36 311 87 219 55210 394 373 9 12 124 85 38 1 75 7 68 05290 479 393 27 59 355 249 102 4 33 26 7 05310 2,055 765 853 437 1,730 727 717 285 339 148 114 77 CA 214 63 30 120 172 87 61 24 46 20 5 21 US 1,841 701 823 316 1,556 640 655 261 293 128 108 565320 80 35 15 30 331 214 105 13 17 8 7 3 MX 66 33 11 22 111 31 71 9 291 128 107 565330 166 106 27 33 569 317 233 19 182 137 45 0 1330 118 75 17 25 414 260 136 18 161 131 29 05410 578 529 34 15 226 147 71 8 45 13 29 35490 3,171 1,212 1,624 335 6,493 2,203 3,999 291 843 269 518 56 JP 825 301 447 76 2,561 549 1,893 119 179 45 116 17 CN 715 215 441 59 200 75 121 5 289 80 191 18 IN 123 55 56 13 1,117 593 491 33 39 30 9 0 1415 1,010 366 561 84 1,903 716 1,070 117 240 72 150 185500 .. 25 18 .. 100 78 18 4 17 11 4 35900 .. 0 0 .. 109 58 30 21 0 0 0 0
: = Data not available .. = Confidential data

�7External Trade by Enterprise Characteristics – Results of the Standardisation exercise 2006
Tables II
Table 4.1b: Arrivals and imports by partner countries (€ million) – Part 6
€ million
Partner country or zone
Reporting country and activity sectionSK FI
Total C-E G Others Total C-E G OthersTotal 19,906 12,838 5,860 1,209 35,713 16,682 17,817 1,2145110 9,857 6,520 2,717 620 22,838 8,112 13,852 874 BE 319 198 95 26 1,097 376 710 12 DE 4,157 3,016 919 222 5,705 2,222 3,307 176 GR 25 11 12 1 93 76 17 0 ES 577 429 128 20 490 151 326 13 FR 1,097 637 386 74 1,588 424 1,020 144 IE 87 45 30 12 320 89 215 16 IT 1,259 794 396 69 1,250 368 847 36 LU 14 8 6 0 44 10 32 2 NL 348 165 161 22 2,541 1,054 1,391 96 AT 856 522 246 89 482 239 206 37 PT 133 117 15 1 137 75 62 1 FI 114 75 27 12 DK 100 39 53 8 2,099 733 1,314 52 SE 300 186 80 34 5,102 1,683 3,254 166 UK 471 279 163 29 1,889 612 1,152 1255190 7,542 5,045 2,113 385 7,827 5,255 2,414 158 CZ 2,683 1,259 1,241 183 198 101 86 12 EE 4 1 2 0 1,025 771 223 31 CY 6 0 6 0 3 0 2 0 LV 8 5 3 0 75 43 29 4 LT 11 5 6 0 70 35 35 1 HU 796 554 173 68 223 157 64 3 MT 1 0 0 0 10 10 0 0 PL 755 456 268 31 295 170 94 31 SI 224 168 52 4 23 9 13 1 SK 51 33 17 1 NO 28 21 5 1 928 581 334 14 CH 216 112 77 27 333 129 191 13 RO 78 50 18 11 15 7 7 0 BG 18 7 9 1 7 2 5 0 TR 124 54 66 4 173 33 139 1 RU 2,160 2,053 78 29 4,325 3,132 1,148 445210 27 16 10 1 9 2 8 05290 35 26 8 1 154 136 17 15310 518 202 222 94 994 609 305 80 CA 25 8 10 7 108 67 34 7 US 493 194 212 87 886 543 271 735320 48 20 26 2 84 68 14 1 MX 15 7 6 2 22 14 8 15330 84 45 34 5 407 351 56 1 1330 65 43 18 4 227 195 32 05410 29 8 16 5 40 20 18 25490 1,722 926 705 91 3,084 1,870 1,119 95 JP 499 381 106 12 918 470 383 65 CN 479 133 316 30 1,101 735 354 12 IN 60 43 16 2 63 23 40 1 1415 547 284 222 40 605 347 241 165500 20 11 8 2 276 258 15 35900 23 19 2 3 0 0 0 0
: = Data not available .. = Confidential data

�8 External Trade by Enterprise Characteristics – Results of the Standardisation exercise 2006
TablesII
Table 4.1b: Arrivals and imports by partner countries (€ million) – Part 7
€ million
Partner country or zone
Reporting country and activity sectionSE NO
Total C-E G Others Total C-E G OthersTotal 69,276 28,041 34,185 6,434 32,723 8,875 19,551 4,2985110 46,023 19,445 23,057 3,521 22,195 6,030 13,420 2,746 BE 2,825 1,455 1,209 161 673 189 417 67 DE 12,993 5,949 6,243 801 4,321 963 2,922 435 GR 129 23 103 3 53 4 48 1 ES 1,130 358 754 18 533 100 407 26 FR 3,952 2,094 1,515 343 1,439 360 905 174 IE 1,055 394 537 125 475 121 320 34 IT 2,306 832 1,319 154 1,349 289 905 155 LU 267 37 62 167 21 6 11 4 NL 4,446 1,202 2,693 550 1,461 494 718 249 AT 887 343 421 123 286 76 181 29 PT 298 117 175 7 167 24 137 5 FI 4,075 2,120 1,687 268 1,077 297 618 163 DK 6,296 2,025 3,960 311 2,635 712 1,486 437 SE 5,409 1,502 3,178 730 UK 5,365 2,495 2,378 491 2,294 892 1,166 2365190 11,597 4,586 5,682 1,329 3,630 992 2,285 353 CZ 418 134 180 105 225 67 150 8 EE 717 412 243 62 145 38 72 35 CY 7 1 6 0 15 0 4 11 LV 416 151 144 121 96 43 49 4 LT 436 67 343 26 142 63 59 20 HU 393 201 161 32 198 21 154 24 MT 5 2 3 0 6 0 4 1 PL 1,692 933 537 222 444 183 231 30 SI 94 23 69 2 45 9 36 1 SK 117 50 60 6 42 8 32 2 NO 4,555 1,863 2,163 529 CH 936 326 484 125 383 111 247 25 RO 89 13 73 4 138 50 87 2 BG 36 14 19 3 16 4 12 0 TR 408 62 316 30 227 24 192 11 RU 1,137 260 829 48 260 141 64 555210 54 34 14 7 39 18 20 15290 162 95 50 17 165 155 9 15310 3,217 1,588 896 733 2,422 1,101 888 434 CA 287 146 83 58 704 588 86 29 US 2,929 1,441 813 675 1,717 512 801 4045320 221 75 96 50 230 7 34 188 MX 35 25 7 2 39 3 29 75330 648 473 135 41 314 221 84 8 1330 332 196 98 38 231 185 44 25410 697 46 619 33 79 16 49 155490 5,824 1,550 3,584 691 3,574 308 2,729 537 JP 1,369 568 500 301 1,252 110 863 278 CN 1,561 367 992 202 1,515 117 1,336 62 IN 237 49 184 4 117 21 92 4 1415 2,170 478 1,532 160 1,272 114 924 2345500 216 151 53 12 76 26 33 165900 615 182 203 230 0 0 0 0
: = Data not available .. = Confidential data

��External Trade by Enterprise Characteristics – Results of the Standardisation exercise 2006
Tables II
Table 4.2a: Dispatches and exports by partner countries – Part 1
Number of enterprises
Partner country or zone
Reporting country and activity sectionBE CZ DK
Total C-E G Others Total C-E G Others Total C-E G OthersTotal : : : : 36,827 14,713 13,809 8,305 15,853 4,876 8,184 2,7935110 13,233 : : : 22,716 11,061 7,740 3,915 5,746 2,318 2,825 603 BE 2,208 1,343 587 278 2,196 1,205 813 178 DE 8,654 : : : 15,511 8,433 4,729 2,349 4,460 2,063 2,012 385 GR 2,413 : : : 790 501 210 79 1,132 680 360 92 ES 5,252 : : : 1,722 1,084 464 174 2,086 1,104 787 195 FR 10,299 : : : 3,219 1,977 869 373 2,519 1,347 959 213 IE 2,413 : : : 623 383 155 85 1,347 801 444 102 IT 5,206 : : : 3,785 2,120 1,257 408 2,153 1,114 846 193 LU 6,289 : : : 257 178 50 29 492 281 171 40 NL 10,419 : : : 3,342 1,924 986 432 3,118 1,566 1,287 265 AT 3,255 : : : 6,412 3,768 1,811 833 1,818 1,078 596 144 PT 2,947 : : : 546 395 105 46 1,107 662 351 94 FI 2,354 : : : 1,084 678 301 105 2,585 1,361 1,046 178 DK 3,269 : : : 1,472 903 410 159 SE 3,108 : : : 1,663 1,073 417 173 4,148 1,965 1,826 357 UK 6,418 : : : 3,212 1,777 951 484 3,185 1,643 1,277 2655190 : : : : 23,866 9,133 9,934 4,799 12,660 4,198 6,422 2,040 CZ 2,717 : : : 1,337 738 460 139 EE : : : : 615 387 178 50 1,379 649 605 125 CY : : : : 293 175 88 30 396 239 139 18 LV : : : : 1,361 820 413 128 1,207 537 546 124 LT : : : : 772 480 233 59 1,518 649 704 165 HU 2,135 : : : 3,318 1,847 1,102 369 1,078 616 356 106 MT : : : : 135 85 39 11 320 187 104 29 PL 3,496 : : : 5,989 3,049 2,168 772 3,052 1,356 1,286 410 SI : : : : 1,452 893 439 120 563 344 172 47 SK : : : : 18,204 7,230 7,968 3,006 522 313 167 42 NO 2,228 : : : 835 541 204 90 8,549 3,212 4,128 1,209 CH 5,382 : : : 2,949 1,707 745 497 2,799 1,383 1,072 344 RO : : : : 1,283 736 377 170 589 318 198 73 BG : : : : 1,231 721 354 156 462 249 172 41 TR 2,079 : : : 687 432 165 90 835 449 274 112 RU 2,249 : : : 1,766 880 522 364 1,092 535 427 1305210 : : : : 557 312 148 97 672 362 223 875290 : : : : 723 417 179 127 1,457 692 555 2105310 5,694 : : : 3,195 1,556 878 761 5,652 2,086 2,771 795 CA 1,735 : : : 870 515 206 149 1,262 734 377 151 US 5,141 : : : 2,878 1,411 787 680 3,156 1,524 1,160 4725320 : : : : 535 319 141 75 814 440 274 100 MX : : : : 302 202 63 37 400 262 98 405330 : : : : 567 367 136 64 913 524 272 117 1330 : : : : 367 251 78 38 578 356 153 695410 : : : : 1,495 805 407 283 2,028 968 805 2555490 : : : : 2,603 1,310 776 517 3,420 1,547 1,397 476 JP 2,125 : : : 788 458 204 126 1,431 786 481 164 CN 1,455 : : : 536 325 128 83 982 532 327 123 IN : : : : 407 260 86 61 542 339 139 64 1415 : : : : 1,216 691 346 179 2,206 1,085 845 2765500 1,844 : : : 687 427 175 85 1,352 801 387 1645900 : : : : 523 259 161 103 258 95 131 32
: = Data not available .. = Confidential data

100 External Trade by Enterprise Characteristics – Results of the Standardisation exercise 2006
TablesII
Table 4.2a: Dispatches and exports by partner countries – Part 2
Number of enterprises
Partner country or zone
Reporting country and activity sectionDE EE FR
Total C-E G Others Total C-E G Others Total C-E G OthersTotal : : : : 6,220 2,315 2,550 1,355 103,990 32,671 42,505 28,8145110 37,507 17,404 14,458 5,645 4,410 1,985 1,594 831 30,301 15,330 11,067 3,904 BE 22,405 11,889 7,162 3,354 224 121 71 32 22,014 12,130 7,585 2,299 DE 998 511 327 160 20,427 11,560 6,779 2,088 GR 11,643 6,126 3,674 1,843 41 24 11 6 7,186 4,541 2,188 457 ES 19,022 10,054 6,032 2,936 140 84 40 16 18,707 10,675 6,423 1,609 FR 24,338 12,981 7,636 3,721 307 191 80 36 IE 8,443 4,822 2,196 1,425 144 91 39 14 5,835 3,532 1,736 567 IT 22,643 11,571 7,670 3,402 300 163 109 28 17,645 10,061 5,978 1,606 LU 11,500 6,023 3,639 1,838 11 7 4 0 8,754 4,790 3,142 822 NL 26,651 13,627 9,025 3,999 431 226 142 63 15,058 8,309 5,144 1,605 AT 27,505 14,064 9,273 4,168 154 99 42 13 7,946 5,068 2,288 590 PT 11,597 6,413 3,335 1,849 57 36 15 6 10,650 6,441 3,464 745 FI 12,676 7,153 3,547 1,976 2,779 1,392 928 459 5,030 3,385 1,306 339 DK 17,620 9,494 5,450 2,676 555 323 166 66 7,955 4,662 2,478 815 SE 16,043 8,967 4,555 2,521 1,477 913 377 187 7,293 4,733 2,016 544 UK 20,177 11,097 5,948 3,132 549 292 169 88 17,441 9,776 5,651 2,0145190 : : : : 3,578 1,162 1,703 713 50,253 20,310 18,068 11,875 CZ : : : : 138 85 39 14 6,413 4,024 1,687 702 EE : : : : 1,325 850 375 100 CY : : : : 36 9 22 5 2,087 1,298 611 178 LV : : : : 2,017 647 1,068 302 1,608 953 508 147 LT : : : : 1,144 389 597 158 2,280 1,218 834 228 HU : : : : 91 62 20 9 5,058 3,299 1,207 552 MT : : : : 36 9 22 5 1,513 862 498 153 PL : : : : 236 143 70 23 9,659 5,000 3,085 1,574 SI : : : : 30 21 8 1 2,369 1,646 507 216 SK : : : : 37 26 11 0 2,303 1,568 527 208 NO : : : : 774 448 215 111 5,101 2,982 1,350 769 CH : : : : 189 113 48 28 33,775 15,019 11,404 7,352 RO : : : : 22 13 7 2 4,484 2,490 1,430 564 BG : : : : 25 17 6 2 2,259 1,413 621 225 TR : : : : 46 23 19 4 5,922 3,710 1,570 642 RU : : : : 841 260 386 195 5,632 2,687 1,747 1,1985210 : : : : 40 27 7 6 26,398 9,279 12,485 4,6345290 : : : : 60 23 30 7 26,120 8,554 11,996 5,5705310 : : : : 437 233 133 71 26,180 10,685 8,782 6,713 CA : : : : 91 58 21 12 9,316 4,838 2,647 1,831 US : : : : 387 203 119 65 22,134 9,018 7,350 5,7665320 : : : : 82 37 31 14 5,997 3,400 1,740 857 MX : : : : 10 9 - 1 3,352 2,302 678 3725330 : : : : 29 23 2 4 6,418 3,891 1,599 928 1330 : : : : 16 12 2 2 4,705 2,980 1,051 6745410 : : : : 105 52 42 11 14,388 6,975 5,261 2,1525490 : : : : 299 172 91 36 21,221 9,790 7,072 4,359 JP : : : : 104 79 13 12 10,348 4,880 3,242 2,226 CN : : : : 66 40 19 7 4,791 3,050 1,151 590 IN : : : : 22 14 6 2 2,898 1,970 579 349 1415 : : : : 120 70 37 13 12,305 6,541 3,857 1,9075500 : : : : 63 32 19 12 14,546 6,741 5,764 2,0415900 : : : : 37 18 13 6 98 42 40 16
: = Data not available .. = Confidential data

101External Trade by Enterprise Characteristics – Results of the Standardisation exercise 2006
Tables II
Table 4.2a: Dispatches and exports by partner countries – Part 3
Number of enterprises
Partner country or zone
Reporting country and activity sectionIT CY LV
Total C-E G Others Total C-E G Others Total C-E G OthersTotal 143,421 80,046 51,750 11,625 2,836 406 862 1,568 4,914 1,696 2,162 1,0565110 42,564 32,016 9,543 1,005 1,543 235 599 709 2,593 1,116 946 531 BE 20,223 16,840 3,155 228 83 21 31 31 214 104 78 32 DE 31,151 24,772 5,904 475 211 40 76 95 1,096 525 374 197 GR 19,545 15,960 3,368 217 925 169 393 363 56 29 13 14 ES 26,517 21,368 4,727 422 90 24 32 34 162 91 45 26 FR 31,401 25,238 5,632 531 136 28 48 60 261 160 77 24 IE 7,911 6,783 1,042 86 50 13 18 19 117 62 41 14 IT 215 40 94 81 282 148 98 36 LU 4,097 3,382 668 47 4 .. .. .. 9 2 5 2 NL 19,361 15,874 3,217 270 120 20 45 55 426 207 151 68 AT 19,921 16,399 3,282 240 15 8 2 5 154 92 40 22 PT 16,201 13,689 2,339 173 28 9 5 14 38 23 8 7 FI 9,371 8,025 1,259 87 47 11 19 17 479 210 177 92 DK 11,903 10,003 1,774 126 49 14 19 16 512 310 129 73 SE 12,341 10,454 1,763 124 54 14 12 28 615 331 174 110 UK 23,505 19,280 3,882 343 611 140 212 259 694 375 200 1195190 100,468 60,290 33,817 6,361 280 41 77 162 3,428 1,102 1,638 688 CZ 15,235 11,723 3,091 421 39 6 20 13 151 79 54 18 EE 3,591 2,971 567 53 9 .. .. .. 1,704 586 876 242 CY 8,300 6,565 1,596 139 45 16 18 11 LV 4,357 3,524 768 65 6 .. .. .. LT 5,539 4,524 912 103 5 .. .. .. 1,807 586 929 292 HU 16,374 12,061 3,865 448 25 4 8 13 85 52 22 11 MT 10,023 7,087 2,683 253 58 19 18 21 46 15 23 8 PL 18,968 14,783 3,689 496 28 6 12 10 260 128 98 34 SI 17,384 12,407 4,571 406 15 .. .. 7 29 15 9 5 SK 8,280 6,461 1,632 187 18 .. .. 9 39 30 7 2 NO 9,665 7,829 1,570 266 31 6 8 17 322 191 77 54 CH 47,756 32,432 12,718 2,606 88 21 23 44 121 69 32 20 RO 16,799 11,679 4,322 798 73 15 23 35 23 12 6 5 BG 10,085 6,476 3,265 344 69 16 23 30 43 19 13 11 TR 15,353 12,093 2,854 406 11 .. .. 8 44 26 12 6 RU 17,023 12,376 4,160 487 87 20 17 50 727 280 232 2155210 22,055 15,293 5,838 924 70 11 14 45 38 20 11 75290 21,042 12,562 7,331 1,149 52 .. .. 44 67 31 22 145310 41,995 29,394 10,168 2,433 125 10 16 99 418 214 125 79 CA 15,305 12,091 2,731 483 38 8 6 24 62 42 11 9 US 38,329 26,800 9,286 2,243 260 41 62 157 389 198 117 745320 15,047 11,196 3,266 585 4 .. .. .. 67 28 26 13 MX 9,006 7,281 1,453 272 3 .. .. .. 9 8 - 15330 17,761 13,459 3,659 643 7 .. .. .. 28 21 1 6 1330 11,465 8,935 2,139 391 5 .. .. .. 16 11 1 45410 31,124 22,226 7,581 1,317 529 81 111 337 164 80 57 275490 39,061 26,762 10,398 1,901 145 13 32 100 314 129 108 77 JP 18,248 13,177 4,247 824 55 15 18 22 78 53 17 8 CN 9,692 7,565 1,805 322 50 14 10 26 37 17 15 5 IN 6,915 5,566 1,136 213 60 16 7 37 25 14 4 7 1415 25,317 18,408 5,951 958 57 4 19 34 107 43 42 225500 15,670 12,410 2,801 459 30 9 0 21 52 38 9 55900 7,298 4,754 2,017 527 51 1 6 44 53 11 34 8
: = Data not available .. = Confidential data

102 External Trade by Enterprise Characteristics – Results of the Standardisation exercise 2006
TablesII
Table 4.2a: Dispatches and exports by partner countries – Part 4
Number of enterprises
Partner country or zone
Reporting country and activity sectionLT LU HU
Total C-E G Others Total C-E G Others Total C-E G OthersTotal 7,542 2,464 3,545 1,533 2,226 271 1,268 687 20,891 8,045 8,094 4,7525110 3,225 1,638 1,101 486 1,720 238 1,058 424 13,514 6,093 4,555 2,866 BE 491 324 115 52 1,214 191 778 245 1,211 657 342 212 DE 1,656 916 523 217 987 190 581 216 7,287 3,856 2,168 1,263 GR 55 37 18 0 77 38 33 6 411 244 114 53 ES 243 151 73 19 241 71 131 39 890 498 222 170 FR 438 286 106 46 1,020 187 644 189 1,825 1,087 476 262 IE 142 101 34 7 79 39 33 7 277 165 71 41 IT 391 226 132 33 315 80 196 39 2,902 1,433 1,006 463 LU 14 10 .. .. 133 89 29 15 NL 540 315 140 85 497 125 293 79 1,855 941 594 320 AT 196 132 46 18 195 68 100 27 4,898 2,488 1,421 989 PT 47 39 .. .. 163 50 95 18 277 197 53 27 FI 394 210 148 36 98 46 40 12 555 351 133 71 DK 693 468 153 72 139 47 75 17 690 401 175 114 SE 690 431 191 68 126 58 52 16 983 630 233 120 UK 636 405 160 71 245 82 125 38 1,742 923 515 3045190 5,826 1,631 3,091 1,104 643 118 300 225 12,006 4,484 5,267 2,255 CZ 193 103 73 17 121 60 31 30 2,256 1,143 858 255 EE 1,761 540 1,050 171 25 11 8 6 287 194 72 21 CY 22 9 .. .. 31 13 12 6 122 67 34 21 LV 2,952 901 1,741 310 28 14 10 4 241 164 66 11 LT 45 15 21 9 402 249 124 29 HU 120 75 42 3 94 42 30 22 MT 18 11 .. .. 27 10 9 8 55 34 13 8 PL 830 344 368 118 156 56 63 37 1,642 868 563 211 SI 34 29 5 47 25 11 11 1,291 670 439 182 SK 76 49 .. .. 47 20 17 10 3,552 1,622 1,429 501 NO 460 283 122 55 97 43 32 22 325 227 63 35 CH 169 113 41 15 385 93 153 139 1,634 978 415 241 RO 43 27 .. .. 67 22 30 15 4,671 1,890 2,022 759 BG 76 43 29 4 39 20 10 9 741 382 271 88 TR 55 31 24 0 80 39 25 16 418 249 122 47 RU 2,613 532 1,505 576 74 28 29 17 816 441 263 1125210 20 15 .. .. 98 38 40 20 611 167 412 325290 52 28 19 5 136 47 52 37 818 274 498 465310 1,074 420 511 143 248 67 91 90 1,692 875 476 341 CA 81 62 14 5 80 33 19 28 325 207 62 56 US 1,049 407 504 138 223 61 84 78 1,559 810 447 3025320 49 19 23 7 60 25 19 16 266 194 52 20 MX 8 5 .. .. 40 20 11 9 143 119 12 125330 29 20 .. .. 73 32 21 20 279 214 35 30 1330 12 7 .. .. 56 26 17 13 201 168 18 155410 225 93 106 26 148 49 69 30 1,170 768 260 1425490 1,174 222 741 211 213 65 83 65 1,232 666 359 207 JP 105 68 30 7 82 34 24 24 437 280 86 71 CN 53 28 21 4 57 34 8 15 288 192 68 28 IN 35 25 .. .. 48 24 10 14 163 113 34 16 1415 135 79 45 11 150 55 55 40 601 363 155 835500 44 32 .. .. 74 39 22 13 341 242 51 485900 72 24 39 9 94 35 42 17 0 0 0 0
: = Data not available .. = Confidential data

103External Trade by Enterprise Characteristics – Results of the Standardisation exercise 2006
Tables II
Table 4.2a: Dispatches and exports by partner countries – Part 5
Number of enterprises
Partner country or zone
Reporting country and activity sectionAT PL SI
Total C-E G Others Total C-E G Others Total C-E G OthersTotal 23,082 6,405 12,125 4,552 49,928 24,268 17,764 7,896 9,269 4,087 3,247 1,9355110 8,250 3,650 3,684 916 33,346 18,181 10,138 5,027 5,486 2,834 1,644 1,008 BE 2,068 1,255 649 164 3,316 2,071 847 398 469 329 99 41 DE 7,382 3,439 3,178 765 3,240 2,100 834 306 2,840 1,633 702 505 GR 1,316 771 444 101 22,139 13,009 6,075 3,055 241 206 20 15 ES 1,981 1,173 651 157 868 577 241 50 344 280 42 22 FR 2,687 1,586 864 237 2,141 1,343 630 168 676 490 121 65 IE 856 536 258 62 4,855 3,097 1,267 491 144 101 23 20 IT 4,664 2,349 1,918 397 814 527 210 77 2,103 1,262 598 243 LU 744 471 210 63 4,545 2,707 1,469 369 52 39 8 5 NL 2,667 1,444 1,006 217 335 259 57 19 683 454 141 88 AT 5,277 3,214 1,447 616 2,427 1,541 565 321 PT 1,052 696 278 78 535 364 134 37 134 113 14 7 FI 1,249 817 345 87 1,549 1,005 423 121 200 156 28 16 DK 1,510 937 460 113 3,516 2,352 807 357 311 243 51 17 SE 1,702 1,097 482 123 3,836 2,557 895 384 398 308 60 30 UK 2,394 1,416 771 207 4,423 2,710 1,194 519 658 461 103 945190 19,268 5,385 10,209 3,674 26,253 12,384 10,465 3,404 6,790 2,984 2,548 1,258 CZ 5,776 2,011 3,190 575 8,599 5,104 2,783 712 639 463 135 41 EE 461 264 164 33 1,609 966 539 104 77 70 4 3 CY 376 213 135 28 347 215 109 23 66 52 9 5 LV 561 299 208 54 3,388 2,023 1,197 168 95 83 5 7 LT 705 360 286 59 7,064 4,082 2,543 439 128 108 10 10 HU 5,900 2,031 3,168 701 3,348 2,130 974 244 748 524 167 57 MT 268 141 101 26 150 85 54 11 43 38 3 2 PL 2,785 1,220 1,244 321 442 349 68 25 SI 4,585 1,712 2,380 493 892 601 241 50 SK 3,555 1,223 1,936 396 4,759 2,911 1,560 288 444 333 84 27 NO 1,128 719 297 112 1,888 1,284 429 175 170 138 24 8 CH 7,626 3,339 3,037 1,250 2,127 1,465 488 174 687 519 110 58 RO 2,490 800 1,370 320 1,610 960 536 114 307 239 47 21 BG 2,669 598 1,740 331 1,240 771 392 77 273 193 58 22 TR 1,274 719 416 139 676 447 183 46 194 155 27 12 RU 1,569 636 777 156 5,412 2,652 2,054 706 348 257 54 375210 813 449 258 106 619 373 192 54 146 115 18 135290 1,227 662 428 137 1,014 657 260 97 166 131 16 195310 3,029 1,469 1,076 484 4,382 2,749 1,126 507 596 405 102 89 CA 999 615 249 135 1,333 909 295 129 188 153 20 15 US 2,752 1,346 973 433 3,837 2,412 982 443 525 356 90 795320 752 .. .. .. 637 399 184 54 88 74 5 9 MX 458 325 92 41 232 179 38 15 525 356 90 795330 868 562 219 87 643 439 152 52 130 117 6 7 1330 607 423 126 58 363 256 79 28 87 76 5 65410 2,033 978 826 229 1,860 1,118 557 185 384 280 54 505490 3,041 1,488 1,168 385 2,648 1,522 851 275 479 348 80 51 JP 1,240 755 342 143 566 369 156 41 149 110 23 16 CN 902 577 240 85 302 187 80 35 120 98 11 11 IN 564 381 127 56 606 365 177 64 96 80 6 10 1415 1,816 980 620 216 1,185 717 376 92 248 187 39 225500 997 633 261 103 799 553 185 61 183 152 18 135900 4 .. .. .. 517 216 0 0 1 1 - -
: = Data not available .. = Confidential data

104 External Trade by Enterprise Characteristics – Results of the Standardisation exercise 2006
TablesII
Table 4.2a: Dispatches and exports by partner countries – Part 6
Number of enterprises
Partner country or zone
Reporting country and activity sectionSK FI
Total C-E G Others Total C-E G OthersTotal 15,416 5,449 6,921 3,046 9,872 3,919 4,171 1,7825110 6,907 3,120 2,569 1,218 2,806 1,930 636 240 BE 611 371 176 64 863 681 132 50 DE 3,473 1,801 1,152 520 1,734 1,296 317 121 GR 170 110 42 18 458 382 59 17 ES 404 255 105 44 869 693 126 50 FR 892 554 228 110 1,092 872 154 66 IE 121 75 31 15 521 420 73 28 IT 1,570 834 526 210 965 772 145 48 LU 62 38 18 6 122 93 20 9 NL 875 481 272 122 1,180 917 198 65 AT 2,780 1,375 922 483 796 653 102 41 PT 126 91 25 10 498 414 61 23 FI 257 163 63 31 DK 371 231 95 45 1,323 1,025 233 65 SE 406 266 97 43 2,337 1,655 505 177 UK 764 411 234 119 1,380 1,066 231 835190 12,152 4,238 5,667 2,247 8,410 3,282 3,729 1,399 CZ 9,649 3,520 4,421 1,708 631 482 102 47 EE 121 83 28 10 4,638 1,880 2,234 524 CY 62 37 22 3 164 130 22 12 LV 171 112 45 14 1,473 688 658 127 LT 295 174 97 24 1,060 548 429 83 HU 2,769 1,199 1,145 425 691 491 158 42 MT 27 16 8 3 75 63 7 5 PL 1,853 871 714 268 977 695 202 80 SI 548 324 164 60 205 165 31 9 SK 265 210 45 10 NO 187 130 31 26 2,506 1,551 677 278 CH 728 439 190 99 1,087 717 251 119 RO 474 264 168 42 227 168 43 16 BG 321 192 104 25 181 142 21 18 TR 152 105 33 14 355 275 59 21 RU 387 215 137 35 3,759 1,315 1,830 6145210 73 41 28 4 318 247 45 265290 154 92 44 18 530 346 133 515310 691 371 202 118 1,799 1,092 435 272 CA 188 114 40 34 640 481 99 60 US 612 333 177 102 1,610 972 385 2535320 124 79 32 13 313 242 45 26 MX 61 48 10 3 191 156 29 65330 116 81 26 9 478 346 78 54 1330 72 57 13 2 341 264 47 305410 298 161 100 37 830 554 183 935490 598 339 194 65 2,061 1,231 539 291 JP 150 98 36 16 920 637 170 113 CN 133 78 38 17 739 498 169 72 IN 88 54 30 4 299 231 48 20 1415 226 142 66 18 1,107 720 235 1525500 130 85 27 18 552 427 76 495900 0 0 0 0 0 0 0 0
: = Data not available .. = Confidential data

10�External Trade by Enterprise Characteristics – Results of the Standardisation exercise 2006
Tables II
Table 4.2a: Dispatches and exports by partner countries – Part 7
Number of enterprises
Partner country or zone
Reporting country and activity sectionSE NO
Total C-E G Others Total C-E G OthersTotal 32,941 10,174 12,908 9,859 16,914 4,438 8,139 4,3375110 8,860 4,187 3,536 1,137 14,876 4,042 7,303 3,531 BE 2,601 1,685 730 186 1,217 565 473 179 DE 4,728 2,817 1,545 366 3,818 1,382 1,851 585 GR 1,180 764 328 88 470 235 158 77 ES 2,480 1,559 709 212 1,392 633 541 218 FR 3,052 1,962 859 231 1,681 739 658 284 IE 1,247 833 323 91 542 284 170 88 IT 2,603 1,656 762 185 1,458 624 644 190 LU 303 202 80 21 87 48 28 11 NL 3,376 2,085 1,022 269 2,688 1,048 1,148 492 AT 2,109 1,397 571 141 645 350 214 81 PT 1,283 853 345 85 435 245 140 50 FI 6,697 3,158 2,806 733 2,271 972 961 338 DK 5,570 3,012 2,052 506 6,342 2,040 3,241 1,061 SE 8,086 2,682 3,665 1,739 UK 3,978 2,418 1,226 334 3,437 1,301 1,398 7385190 27,716 9,049 10,953 7,714 2,971 1,262 1,236 473 CZ 2,285 1,309 674 302 390 215 131 44 EE 4,392 1,894 1,741 757 584 296 215 73 CY 485 315 117 53 131 77 39 15 LV 2,480 1,068 948 464 424 205 170 49 LT 2,359 979 857 523 593 286 234 73 HU 1,993 1,163 540 290 222 145 55 22 MT 373 186 100 87 123 67 42 14 PL 4,987 2,322 1,522 1,143 1,096 554 377 165 SI 960 600 256 104 129 92 32 5 SK 843 536 221 86 136 83 41 12 NO 21,905 7,811 8,943 5,151 CH 5,039 2,392 1,754 893 868 427 318 123 RO 833 467 239 127 217 124 74 19 BG 615 359 180 76 117 72 33 12 TR 1,438 767 435 236 349 206 94 49 RU 1,839 830 654 355 588 250 240 985210 873 523 208 142 275 159 77 395290 1,893 871 578 444 475 168 187 1205310 7,934 3,278 2,611 2,045 2,394 988 924 482 CA 2,332 1,294 592 446 797 428 241 128 US 7,352 3,056 2,399 1,897 2,077 854 805 4185320 1,035 623 231 181 214 111 65 38 MX 663 444 124 95 147 103 25 195330 2,063 1,087 549 427 760 351 209 200 1330 1,362 867 297 198 454 270 120 645410 2,865 1,362 945 558 809 387 263 1595490 2,416 1,357 639 420 1,591 735 597 259 JP 2,613 1,346 780 487 709 389 218 102 CN 2,132 1,087 705 340 585 315 205 65 IN 1,177 661 308 208 281 180 65 36 1415 4,035 1,885 1,395 755 1,310 614 469 2275500 3,188 1,907 780 501 610 359 143 1085900 45 18 23 4 0 0 0 0
: = Data not available .. = Confidential data

106 External Trade by Enterprise Characteristics – Results of the Standardisation exercise 2006
TablesII
Table 4.2b: Dispatches and exports by partner countries (€ million) – Part 1
€ million
Partner country or zone
Reporting country and activity sectionBE CZ DK
Total C-E G Others Total C-E G Others Total C-E G OthersTotal : : : : 43,053 36,443 4,654 1,956 58,562 36,620 14,291 7,6525110 164,394 : : : 30,071 26,330 2,487 1,253 38,822 23,900 9,466 5,457 BE 965 828 102 35 1,101 695 280 126 DE 43,077 : : : 15,928 13,850 1,228 849 11,155 7,171 2,490 1,493 GR 1,409 : : : 208 183 22 4 466 288 106 73 ES 8,763 : : : 906 840 48 19 1,946 994 635 317 FR 38,058 : : : 2,038 1,825 132 81 3,209 2,133 523 554 IE 1,471 : : : 190 175 11 5 871 622 186 63 IT 11,811 : : : 1,908 1,701 176 31 2,032 1,266 487 278 LU 4,124 : : : 85 79 2 3 49 24 19 6 NL 25,737 : : : 1,782 1,609 121 51 2,807 1,731 671 404 AT 2,325 : : : 2,688 2,210 385 94 616 405 142 69 PT 1,399 : : : 126 107 18 1 295 140 69 86 FI 1,218 : : : 181 147 28 7 1,882 1,051 597 235 DK 1,766 : : : 255 212 31 12 SE 3,089 : : : 490 437 37 16 7,415 3,970 2,434 1,011 UK 20,148 : : : 2,321 2,129 147 46 4,977 3,410 826 7425190 : : : : 9,884 7,646 1,716 522 7,975 4,417 2,515 1,043 CZ 1,246 : : : 265 203 48 14 EE : : : : 49 38 10 1 145 69 56 20 CY : : : : 21 10 10 2 67 20 10 37 LV : : : : 188 142 36 9 143 88 41 13 LT : : : : 71 58 10 3 259 143 90 26 HU 1,125 : : : 982 805 139 38 238 173 50 15 MT : : : : 4 4 1 0 24 14 8 2 PL 1,947 : : : 2,062 1,697 257 108 881 614 185 82 SI : : : : 284 198 69 16 55 45 6 3 SK : : : : 3,426 2,470 776 179 90 56 17 16 NO 766 : : : 150 131 14 5 3,118 1,381 1,191 546 CH 2,603 : : : 617 546 52 19 665 417 181 67 RO : : : : 305 258 40 7 85 66 11 8 BG : : : : 127 100 20 7 63 44 15 5 TR 1,891 : : : 290 225 58 8 270 212 33 25 RU 1,270 : : : 516 420 67 30 740 477 214 485210 : : : : 127 77 40 11 215 118 56 415290 : : : : 71 52 15 4 406 177 113 1175310 16,391 : : : 1,119 909 149 61 4,264 3,248 507 509 CA 1,451 : : : 65 49 10 5 507 304 51 152 US 14,939 : : : 1,054 860 139 55 3,444 2,890 281 2735320 : : : : 95 78 15 2 380 267 62 52 MX : : : : 46 41 4 1 143 116 19 75330 2,260 : : : 83 64 13 6 351 262 68 21 1330 : : : : 62 49 7 5 213 180 22 125410 : : : : 499 406 76 17 1,043 697 293 535490 : : : : 929 747 111 71 4,381 3,071 995 314 JP 2,185 : : : 143 114 26 3 1,759 1,534 181 43 CN 2,225 : : : 213 195 13 6 633 461 97 75 IN : : : : 106 90 14 3 206 153 39 14 1415 : : : : 349 264 36 49 1,494 754 606 1335500 1,309 : : : 56 45 10 2 503 430 50 235900 : : : : 118 89 23 7 224 34 167 24
: = Data not available .. = Confidential data

107External Trade by Enterprise Characteristics – Results of the Standardisation exercise 2006
Tables II
Table 4.2b: Dispatches and exports by partner countries (€ million) – Part 2
€ million
Partner country or zone
Reporting country and activity sectionDE EE FR
Total C-E G Others Total C-E G Others Total C-E G OthersTotal : : : : 4,000 3,322 485 193 319,340 232,029 64,638 22,6735110 290,168 186,550 41,045 62,572 2,735 2,361 238 136 201,393 145,761 42,587 13,045 BE 27,013 17,155 3,242 6,617 47 41 4 1 24,847 18,945 4,785 1,118 DE 395 365 25 5 47,908 35,396 8,575 3,937 GR 4,402 2,519 777 1,106 5 5 0 0 2,844 1,936 798 110 ES 25,765 16,978 3,424 5,363 14 11 3 0 32,685 24,225 6,936 1,524 FR 55,999 39,086 6,182 10,732 69 56 4 9 IE 2,917 1,790 367 760 35 25 6 4 2,197 1,681 455 61 IT 37,964 24,990 5,164 7,810 50 40 9 0 29,592 20,772 6,941 1,879 LU 2,436 1,367 611 458 0 0 0 0 1,803 1,155 540 108 NL 31,496 18,624 6,096 6,776 121 107 12 2 12,457 8,315 3,329 813 AT 28,081 15,535 5,946 6,600 23 22 1 0 3,183 2,528 506 149 PT 4,991 3,538 526 926 6 4 1 0 4,343 2,883 1,248 212 FI 5,143 3,173 847 1,123 1,036 882 90 64 1,777 1,140 594 42 DK 9,000 5,588 1,564 1,848 160 144 12 3 2,473 1,838 518 118 SE 11,132 7,197 1,440 2,495 609 522 51 35 4,374 3,683 520 171 UK 43,830 29,011 4,860 9,959 167 136 21 10 30,911 21,265 6,843 2,8045190 : : : : 986 746 196 44 32,663 24,608 5,626 2,428 CZ : : : : 23 21 1 0 2,152 1,721 296 135 EE : : : : 189 160 21 8 CY : : : : 10 8 1 0 343 175 128 40 LV : : : : 281 186 78 17 143 106 29 8 LT : : : : 150 107 35 7 313 221 76 16 HU : : : : 51 50 1 0 1,914 1,507 279 128 MT : : : : 1 0 1 0 530 497 25 9 PL : : : : 44 43 1 0 3,944 3,152 529 263 SI : : : : 1 1 0 0 956 869 64 24 SK : : : : 2 2 0 0 652 560 64 28 NO : : : : 143 108 29 6 1,202 977 153 72 CH : : : : 23 17 5 1 10,521 7,551 1,834 1,136 RO : : : : 1 1 0 0 1,426 1,076 258 92 BG : : : : 1 1 0 0 432 353 63 16 TR : : : : 11 4 7 0 3,269 2,656 441 173 RU : : : : 156 125 24 7 2,803 1,783 889 1305210 : : : : 14 14 1 0 10,312 6,301 2,979 1,0335290 : : : : 10 9 1 1 7,429 3,993 2,349 1,0875310 : : : : 114 104 8 3 24,376 17,783 4,604 1,989 CA : : : : 15 11 2 2 2,353 1,672 451 229 US : : : : 99 93 5 1 22,002 16,104 4,144 1,7545320 : : : : 9 8 1 1 3,505 2,887 330 288 MX : : : : 1 1 0 0 1,401 1,186 107 1075330 : : : : 7 6 0 0 3,247 2,647 331 270 1330 : : : : 5 5 0 0 1,943 1,658 149 1365410 : : : : 8 7 2 0 10,526 8,331 1,491 7035490 : : : : 95 56 34 5 22,045 16,745 3,746 1,554 JP : : : : 15 12 2 1 5,290 3,584 1,409 297 CN : : : : 27 13 11 3 4,600 4,029 337 235 IN : : : : 4 3 1 0 1,003 776 96 130 1415 : : : : 40 19 20 1 8,936 6,739 1,548 6495500 : : : : 7 4 0 3 3,611 2,845 581 1855900 : : : : 14 9 5 0 233 127 15 91
: = Data not available .. = Confidential data

108 External Trade by Enterprise Characteristics – Results of the Standardisation exercise 2006
TablesII
Table 4.2b: Dispatches and exports by partner countries (€ million) – Part 3
€ million
Partner country or zone
Reporting country and activity sectionIT CY LV
Total C-E G Others Total C-E G Others Total C-E G OthersTotal 255,081 219,689 29,677 5,716 759 158 179 423 2,547 1,798 555 1945110 138,956 121,945 15,391 1,620 438 87 146 205 1,574 1,156 321 98 BE 6,920 6,292 578 51 9 1 3 6 26 21 5 0 DE 35,762 31,442 3,975 345 47 13 8 25 379 338 25 16 GR 5,470 4,475 938 56 108 29 37 42 4 3 0 0 ES 18,202 16,075 2,005 122 8 4 2 1 21 16 5 0 FR 31,875 28,293 3,015 568 23 2 3 18 56 49 5 2 IE 1,355 1,207 130 18 6 1 2 3 30 21 9 0 IT 14 3 7 4 67 49 11 7 LU 390 307 50 33 0 .. .. .. 0 0 0 0 NL 6,125 5,261 810 54 23 4 3 16 83 66 13 4 AT 5,887 4,869 956 61 2 2 0 0 13 10 2 1 PT 3,134 2,761 352 21 2 1 0 1 10 9 1 0 FI 1,280 1,049 217 14 10 1 2 6 68 35 20 14 DK 1,896 1,620 260 16 9 2 1 7 153 141 7 5 SE 2,591 2,227 241 122 7 2 2 2 269 134 95 40 UK 18,069 16,067 1,864 138 171 20 76 74 395 263 121 105190 44,209 36,754 6,290 1,166 72 10 15 47 757 474 198 85 CZ 2,471 2,224 215 32 8 0 3 5 12 10 2 1 EE 167 148 16 3 1 .. .. .. 167 104 55 8 CY 432 335 75 22 2 2 0 0 LV 264 229 32 3 1 .. .. .. LT 491 431 50 10 1 .. .. .. 209 115 81 13 HU 2,819 2,547 237 36 0 0 0 0 5 5 0 0 MT 811 651 143 17 6 1 1 5 0 0 0 0 PL 4,477 4,041 330 106 1 0 0 0 38 32 3 3 SI 2,291 1,719 534 37 1 .. .. 0 2 2 0 0 SK 1,039 917 103 18 5 .. .. 3 8 8 0 0 NO 1,088 975 100 13 3 1 2 1 50 45 3 2 CH 9,732 8,012 1,321 399 2 1 1 0 11 6 4 0 RO 3,777 3,309 414 55 11 2 1 8 2 1 1 0 BG 906 765 126 15 4 1 1 3 1 1 0 0 TR 4,599 3,926 558 116 0 .. .. 0 1 1 0 0 RU 3,613 2,792 672 149 16 2 2 12 137 73 18 465210 6,410 5,242 878 290 10 4 1 5 23 10 12 05290 3,016 2,171 638 208 16 .. .. 11 5 4 1 05310 23,533 21,121 1,837 575 14 4 2 8 85 78 4 4 CA 2,358 2,100 205 53 1 0 0 0 11 10 0 1 US 21,170 19,020 1,632 517 13 4 1 8 74 68 4 35320 3,857 3,360 405 92 2 .. .. 1 5 3 1 0 MX 1,772 1,539 202 31 0 .. .. 0 0 0 0 05330 3,202 2,831 276 95 0 .. .. 0 13 13 0 0 1330 2,087 1,870 157 60 0 .. .. 0 0 0 0 05410 9,261 7,072 1,277 911 100 34 8 58 14 10 3 15490 19,420 16,538 2,275 607 46 13 4 30 63 48 9 6 JP 4,206 3,409 671 126 18 6 0 12 23 18 5 0 CN 3,789 3,346 354 89 2 1 0 0 15 13 2 0 IN 1,080 936 80 64 4 2 1 1 1 1 0 0 1415 8,460 7,317 925 218 13 2 2 9 7 6 1 05500 2,683 2,418 199 67 1 1 0 0 2 2 0 05900 535 237 211 87 59 0 0 59 7 0 6 1
: = Data not available .. = Confidential data

10�External Trade by Enterprise Characteristics – Results of the Standardisation exercise 2006
Tables II
Table 4.2b: Dispatches and exports by partner countries (€ million) – Part 4
€ million
Partner country or zone
Reporting country and activity sectionLT LU HU
Total C-E G Others Total C-E G Others Total C-E G OthersTotal 6,068 4,866 979 223 8,586 6,342 1,654 590 38,096 35,157 2,265 6745110 2,611 2,280 221 111 7,211 5,223 1,558 430 28,063 26,645 1,036 382 BE 124 116 5 3 1,039 587 372 79 879 824 27 29 DE 614 532 59 23 2,302 1,769 383 149 12,933 12,478 339 116 GR 55 54 0 0 28 26 2 0 157 138 14 4 ES 55 47 6 1 243 177 47 19 1,040 1,012 18 10 FR 318 269 18 31 1,759 1,313 359 87 2,199 2,132 48 18 IE 32 11 2 19 25 22 2 1 133 129 3 1 IT 130 116 10 4 512 335 162 15 2,215 1,965 206 44 LU 1 1 .. .. 36 33 3 0 NL 215 178 34 3 400 301 82 16 1,566 1,423 120 22 AT 20 16 3 1 138 106 25 7 3,081 2,808 176 97 PT 10 9 .. .. 46 39 6 1 236 234 1 1 FI 94 81 9 3 57 52 4 2 311 301 9 2 DK 296 270 19 8 45 38 6 1 295 275 17 3 SE 253 217 34 3 125 85 11 30 1,237 1,212 19 7 UK 395 363 21 11 493 372 98 24 1,744 1,681 36 275190 3,063 2,295 675 93 519 439 59 22 6,845 5,521 1,083 241 CZ 23 20 3 0 75 70 4 1 783 698 70 15 EE 264 199 60 5 3 3 0 0 41 37 3 1 CY 52 51 .. .. 1 1 0 0 13 12 1 0 LV 586 398 156 32 4 4 0 0 34 31 3 0 LT 9 8 1 0 69 57 10 1 HU 39 38 1 0 41 38 2 1 MT 1 0 .. .. 1 1 0 0 4 4 0 0 PL 206 176 26 5 103 90 4 9 866 805 51 10 SI 1 1 0 0 20 18 1 0 314 237 63 14 SK 9 8 .. .. 8 7 1 0 748 656 77 15 NO 147 134 8 4 26 21 3 2 98 91 5 2 CH 746 740 5 1 116 81 31 4 481 419 50 13 RO 6 5 .. .. 7 5 2 0 987 667 266 54 BG 12 11 1 0 4 4 0 0 142 101 35 5 TR 108 102 5 0 30 28 1 0 258 239 16 2 RU 534 226 276 31 38 31 5 2 578 508 59 115210 1 1 .. .. 25 23 1 1 100 92 4 35290 21 17 3 1 52 41 8 3 139 128 5 75310 198 164 28 7 260 225 8 26 1,250 1,179 57 14 CA 26 24 0 1 32 29 0 2 58 53 3 2 US 173 140 27 6 228 196 8 24 1,192 1,126 54 125320 3 2 1 1 29 28 0 1 73 71 2 0 MX 1 1 .. .. 14 13 0 1 59 59 0 05330 3 2 .. .. 35 33 1 2 79 77 1 1 1330 0 0 .. .. 10 8 0 1 65 65 0 05410 11 9 2 1 94 76 6 12 714 670 38 65490 147 94 47 6 323 226 7 90 782 728 39 15 JP 33 30 2 1 42 37 2 2 268 254 10 4 CN 7 5 2 0 128 98 0 30 157 151 6 0 IN 5 2 .. .. 11 8 0 3 31 27 3 1 1415 43 41 1 1 117 60 3 55 181 170 6 65500 3 3 .. .. 23 20 0 3 52 46 1 65900 6 1 2 2 14 8 6 0 0 0 0 0
: = Data not available .. = Confidential data

110 External Trade by Enterprise Characteristics – Results of the Standardisation exercise 2006
TablesII
Table 4.2b: Dispatches and exports by partner countries (€ million) – Part 5
€ million
Partner country or zone
Reporting country and activity sectionAT PL SI
Total C-E G Others Total C-E G Others Total C-E G OthersTotal 79,137 56,224 14,045 8,868 47,408 39,458 6,736 1,214 11,245 10,298 591 3565110 46,314 35,832 7,918 2,564 32,642 28,449 3,451 741 6,574 6,145 221 208 BE 1,245 997 183 65 808 544 200 65 93 89 2 2 DE 24,634 19,821 3,635 1,178 1,524 1,377 133 15 2,609 2,450 75 84 GR 515 344 89 82 15,335 13,473 1,512 350 39 38 0 1 ES 1,988 1,501 400 87 141 124 16 1 164 163 1 0 FR 3,459 2,756 488 215 1,004 916 75 13 638 629 6 3 IE 213 164 38 11 2,895 2,559 294 41 17 15 1 1 IT 6,918 4,785 1,635 498 133 87 33 13 1,467 1,348 51 68 LU 122 68 39 15 2,710 2,481 193 36 26 8 18 1 NL 1,602 1,110 377 115 45 43 2 0 197 191 5 2 AT 2,134 1,762 284 88 821 738 51 32 PT 352 257 74 20 373 367 3 3 20 19 0 0 FI 441 356 69 16 315 185 121 9 26 21 2 2 DK 528 436 71 21 1,122 969 107 46 102 99 2 0 SE 857 679 135 42 1,717 1,464 228 25 104 100 3 1 UK 3,439 2,556 684 199 2,387 2,099 252 36 251 236 5 105190 21,437 11,534 4,930 4,973 11,366 8,438 2,603 325 3,785 3,306 358 121 CZ 2,336 1,429 706 201 1,917 1,442 431 43 204 192 7 5 EE 71 56 13 3 153 111 39 2 6 6 0 0 CY 45 15 28 2 51 47 2 1 2 2 0 0 LV 74 47 21 6 309 210 91 8 15 15 0 0 LT 108 82 19 7 1,157 838 295 24 31 31 0 0 HU 4,736 1,904 774 2,058 1,142 961 165 16 223 217 5 1 MT 20 12 6 2 9 6 1 2 1 1 0 0 PL 1,293 944 256 93 311 303 3 5 SI 1,536 897 522 117 161 133 26 2 SK 1,602 673 304 626 769 590 167 13 162 158 3 1 NO 251 201 31 19 1,000 924 66 10 22 20 2 0 CH 3,999 2,268 589 1,141 349 291 31 27 150 105 4 41 RO 944 472 262 209 409 306 92 11 91 88 2 1 BG 292 140 123 28 109 83 24 2 52 51 1 1 TR 650 511 59 80 1,142 961 165 16 71 71 0 0 RU 1,080 568 342 170 1,337 933 338 67 347 311 33 45210 293 221 30 42 188 100 85 3 46 44 1 25290 528 380 102 45 187 152 32 3 25 23 0 25310 4,596 3,918 311 368 1,262 1,061 154 47 432 420 2 9 CA 592 536 22 35 204 173 26 5 21 20 0 0 US 4,004 3,382 289 333 1,057 888 128 42 411 400 2 95320 246 .. .. .. 266 218 38 10 21 20 0 1 MX 183 137 15 31 67 49 17 1 410 399 2 95330 359 273 51 35 165 117 48 1 18 17 0 0 1330 240 187 36 18 115 72 43 0 9 9 0 05410 1,039 748 180 111 335 251 73 10 149 144 4 15490 3,803 2,853 366 584 869 617 226 26 167 152 2 12 JP 884 699 93 92 226 203 20 3 16 15 1 0 CN 864 648 58 158 71 22 47 2 26 26 0 0 IN 204 164 8 31 83 69 12 1 25 24 0 0 1415 1,344 1,014 170 160 281 219 61 1 57 45 1 115500 493 276 128 89 46 37 8 1 30 28 2 05900 28 .. .. .. 81 19 17 46 0 0 0 0
: = Data not available .. = Confidential data

111External Trade by Enterprise Characteristics – Results of the Standardisation exercise 2006
Tables II
Table 4.2b: Dispatches and exports by partner countries (€ million) – Part 6
€ million
Partner country or zone
Reporting country and activity sectionSK FI
Total C-E G Others Total C-E G OthersTotal 19,306 17,496 1,213 597 45,781 41,639 3,399 7435110 11,729 10,967 468 294 24,282 23,082 978 222 BE 385 369 12 4 1,282 1,244 36 2 DE 5,965 5,668 189 107 5,425 5,244 144 37 GR 59 49 8 2 382 371 10 1 ES 316 302 6 8 1,286 1,249 28 9 FR 679 640 29 11 1,707 1,662 40 5 IE 22 20 0 1 230 207 22 1 IT 1,446 1,368 57 20 1,809 1,752 47 9 LU 45 44 1 0 42 36 6 0 NL 523 477 29 16 2,151 2,037 106 7 AT 1,438 1,230 100 108 452 417 31 3 PT 39 38 0 1 266 259 7 0 FI 131 127 2 2 DK 125 116 6 4 1,020 959 56 4 SE 148 133 11 5 4,540 4,063 356 120 UK 409 387 16 6 3,692 3,582 88 215190 5,903 4,934 687 283 8,969 6,867 1,859 243 CZ 2,471 1,988 337 146 213 197 12 3 EE 10 9 1 0 1,131 675 416 40 CY 9 6 2 1 13 12 1 0 LV 30 27 2 1 317 171 140 6 LT 56 45 9 2 261 136 121 4 HU 941 805 93 43 356 335 18 3 MT 1 1 0 0 4 3 0 0 PL 921 819 72 30 857 823 24 10 SI 161 142 12 6 32 31 1 0 SK 87 77 9 1 NO 45 42 1 2 1,115 988 92 35 CH 213 201 7 5 447 425 16 6 RO 189 160 27 2 48 42 3 3 BG 55 44 10 1 25 22 1 1 TR 138 135 3 0 374 356 17 1 RU 235 181 37 17 3,335 2,280 939 1175210 26 19 5 2 308 299 5 45290 23 18 4 1 406 375 25 55310 1,092 1,064 20 8 4,266 4,075 90 101 CA 75 73 2 1 509 488 15 5 US 1,017 991 18 7 3,756 3,585 75 965320 44 42 1 0 272 237 22 13 MX 28 27 0 0 137 130 7 05330 15 13 2 0 611 548 9 54 1330 9 8 1 0 268 258 4 55410 88 81 5 2 1,974 1,870 98 65490 321 295 19 6 4,301 3,922 287 92 JP 71 71 1 0 982 934 34 14 CN 124 118 2 4 1,243 1,169 41 32 IN 22 19 3 0 205 199 2 4 1415 72 67 3 1 1,434 1,219 177 385500 47 47 0 0 392 364 26 35900 19 16 3 0 0 0 0 0
: = Data not available .. = Confidential data

112 External Trade by Enterprise Characteristics – Results of the Standardisation exercise 2006
TablesII
Table 4.2b: Dispatches and exports by partner countries (€ million) – Part 7
€ million
Partner country or zone
Reporting country and activity sectionSE NO
Total C-E G Others Total C-E G OthersTotal 87,133 70,857 11,575 4,702 41,801 35,448 3,877 2,4765110 46,510 37,144 6,817 2,549 28,969 25,332 2,538 1,100 BE 4,021 3,651 257 112 676 567 86 23 DE 8,794 7,535 821 438 3,919 3,543 251 126 GR 484 408 59 18 93 45 24 24 ES 2,459 2,078 236 145 916 774 106 36 FR 4,307 3,720 261 326 3,037 2,704 246 87 IE 453 365 50 38 406 373 9 24 IT 3,126 2,723 189 215 1,271 1,120 132 20 LU 50 43 5 2 15 10 4 0 NL 4,340 3,820 401 119 4,581 4,373 166 43 AT 900 781 74 46 83 68 7 8 PT 479 382 49 49 307 234 65 8 FI 4,820 2,858 1,656 307 914 799 90 25 DK 5,234 3,122 1,764 348 2,014 1,385 462 167 SE 4,079 3,123 553 403 UK 6,831 5,659 847 325 6,656 6,214 336 1065190 14,802 10,458 3,413 932 2,937 1,746 664 527 CZ 484 433 36 15 44 30 12 2 EE 597 417 153 27 54 28 22 3 CY 57 53 3 1 12 7 2 4 LV 296 193 69 35 87 39 25 24 LT 299 201 80 18 63 35 17 11 HU 470 413 44 13 25 21 3 1 MT 15 10 2 4 7 1 2 4 PL 1,431 1,203 183 45 287 166 97 23 SI 118 108 6 4 14 10 1 3 SK 150 130 17 3 11 9 1 1 NO 7,054 4,080 2,377 598 CH 994 829 97 69 153 126 24 3 RO 163 131 16 16 27 22 5 0 BG 66 61 4 1 5 4 1 0 TR 667 619 21 27 227 207 14 6 RU 1,168 993 145 30 325 91 190 445210 648 533 66 48 30 25 5 15290 939 858 53 28 231 174 8 485310 11,441 10,480 479 482 6,788 6,130 198 459 CA 1,129 1,052 48 29 2,165 2,104 39 22 US 10,299 9,425 421 453 4,596 4,020 159 4175320 894 828 17 50 90 74 15 2 MX 633 613 8 13 58 54 4 05330 848 716 49 83 227 162 55 10 1330 542 465 20 58 199 140 53 65410 2,118 1,860 184 73 203 137 32 345490 7,715 6,901 413 401 2,039 1,568 348 123 JP 1,739 1,432 89 218 804 546 212 47 CN 1,969 1,811 97 60 641 516 85 40 IN 778 730 28 19 46 31 6 9 1415 2,575 2,335 151 89 1,296 959 99 2385500 1,162 1,079 41 43 287 101 13 1725900 58 0 43 15 0 0 0 0
: = Data not available .. = Confidential data

113External Trade by Enterprise Characteristics – Results of the Standardisation exercise 2006
Tables II
Table 5.1a: Arrivals by number of partner countries (number of enterprises) – Part 1
Number of enterprises
Activity section and number of partner
countries
Reporting countryDK DE FR IT CY
Number Share Number Share Number Share Number Share Number Share
All traders 8,525 100.0 41,148 100.0 53,898 100.0 42,128 100.0 10,313 100.01 partner country 1,525 17.9 12,083 29.4 9,637 17.9 9,467 22.5 5,715 55.42 partner countries 972 11.4 6,107 14.8 7,565 14.0 8,709 20.7 1,669 16.23 partner countries 984 11.5 4,869 11.8 7,211 13.4 6,962 16.5 941 9.14-5 partner countries 1,861 21.8 7,612 18.5 12,887 23.9 9,567 22.7 942 9.16-7 partner countries 1,565 18.4 5,089 12.4 8,104 15.0 4,882 11.6 500 4.88-10 partner countries 1,258 14.8 3,870 9.4 4,776 8.9 2,234 5.3 350 3.411-13 partner countries 333 3.9 1,254 3.0 1,621 3.0 302 0.7 143 1.414 partner countries 25 0.3 264 0.6 2,097 3.9 5 0.0 48 0.5Unknown 2 0.0 0 0.0 0 0.0 0 0.0 5 0.0C-E 2,410 100.0 13,570 100.0 18,296 100.0 21,840 100.0 987 100.01 partner country 262 10.9 2,482 18.3 1,893 10.3 3,758 17.2 375 38.02 partner countries 221 9.2 1,813 13.4 2,047 11.2 4,229 19.4 184 18.63 partner countries 257 10.7 1,733 12.8 2,302 12.6 3,664 16.8 121 12.34-5 partner countries 549 22.8 2,972 21.9 4,816 26.3 5,452 25.0 145 14.76-7 partner countries 502 20.8 2,198 16.2 3,406 18.6 3,036 13.9 75 7.68-10 partner countries 462 19.2 1,733 12.8 2,361 12.9 1,474 6.7 51 5.211-13 partner countries 144 6.0 551 4.1 812 4.4 224 1.0 30 3.014 partner countries 13 0.5 88 0.6 659 3.6 3 0.0 6 0.6Unknown 0 0.0 0 0.0 0 0.0 0 0.0 0 0.0G 5,146 100.0 21,692 100.0 29,451 100.0 18,183 100.0 3,449 100.01 partner country 995 19.3 7,943 36.6 5,698 19.3 4,929 27.1 1,174 34.02 partner countries 601 11.7 3,428 15.8 4,372 14.8 3,999 22.0 680 19.73 partner countries 602 11.7 2,463 11.4 4,075 13.8 3,027 16.6 453 13.14-5 partner countries 1,121 21.8 3,636 16.8 6,982 23.7 3,776 20.8 490 14.26-7 partner countries 938 18.2 2,186 10.1 4,171 14.2 1,687 9.3 303 8.88-10 partner countries 714 13.9 1,513 7.0 2,131 7.2 693 3.8 222 6.411-13 partner countries 165 3.2 427 2.0 707 2.4 70 0.4 92 2.714 partner countries 8 0.2 96 0.4 1,315 4.5 2 0.0 32 0.9Unknown 2 0.0 0 0.0 0 0.0 0 0.0 3 0.1Others 969 100.0 5,886 100.0 6,151 100.0 2,105 100.0 5,877 100.01 partner country 268 27.7 1,658 28.2 2,046 33.3 780 37.1 4,166 70.92 partner countries 150 15.5 866 14.7 1,146 18.6 481 22.9 805 13.73 partner countries 125 12.9 673 11.4 834 13.6 271 12.9 367 6.24-5 partner countries 191 19.7 1,004 17.1 1,089 17.7 339 16.1 307 5.26-7 partner countries 125 12.9 705 12.0 527 8.6 159 7.6 122 2.18-10 partner countries 82 8.5 624 10.6 284 4.6 67 3.2 77 1.311-13 partner countries 24 2.5 276 4.7 102 1.7 8 0.4 21 0.414 partner countries 4 0.4 80 1.4 123 2.0 0 0.0 10 0.2Unknown 0 0.0 0 0.0 0 0.0 0 0.0 2 0.0
: = Data not available.. = Confidential data

114 External Trade by Enterprise Characteristics – Results of the Standardisation exercise 2006
TablesII
Table 5.1a: Arrivals by number of partner countries (number of enterprises) – Part 2
Number of enterprises
Activity section and number of partner
countries
Reporting countryLU AT FI SE
Number Share Number Share Number Share Number Share
All traders 4,294 100.0 17,399 100.0 8,283 100.0 12,671 100.01 partner country 1,000 23.3 5,345 30.7 1,892 22.8 2,834 22.42 partner countries 667 15.5 3,197 18.4 1,147 13.8 1,758 13.93 partner countries 703 16.4 2,468 14.2 986 11.9 1,697 13.44-5 partner countries 1,112 25.9 3,389 19.5 1,695 20.5 2,763 21.86-7 partner countries 544 12.7 1,817 10.4 1,332 16.1 1,935 15.38-10 partner countries 214 5.0 1,017 5.8 1,035 12.5 1,432 11.311-13 partner countries 29 0.7 159 0.9 189 2.3 243 1.914 partner countries 25 0.6 7 0.0 7 0.1 9 0.1Unknown 0 0.0 0 0.0 0 0.0 0 0.0C-E 386 100.0 4,321 100.0 2,270 100.0 3,693 100.01 partner country 27 7.0 936 21.7 319 14.1 507 13.72 partner countries 45 11.7 .. .. 256 11.3 431 11.73 partner countries 66 17.1 605 14.0 248 10.9 464 12.64-5 partner countries 115 29.8 936 21.7 522 23.0 859 23.36-7 partner countries 70 18.1 575 13.3 441 19.4 713 19.38-10 partner countries 42 10.9 427 9.9 406 17.9 593 16.111-13 partner countries 7 1.8 70 1.6 77 3.4 119 3.214 partner countries 14 3.6 .. .. 1 0.0 7 0.2Unknown 0 0.0 0 0.0 0 0.0 0 0.0G 2,392 100.0 10,358 100.0 4,926 100.0 7,324 100.01 partner country 488 20.4 3,156 30.5 1,065 21.6 1,715 23.42 partner countries 338 14.1 .. .. 722 14.7 1,051 14.43 partner countries 377 15.8 1,535 14.8 631 12.8 1,024 14.04-5 partner countries 690 28.8 2,117 20.4 1,022 20.7 1,606 21.96-7 partner countries 342 14.3 1,082 10.4 800 16.2 1,085 14.88-10 partner countries 132 5.5 509 4.9 578 11.7 741 10.111-13 partner countries 16 0.7 71 0.7 102 2.1 100 1.414 partner countries 9 0.4 .. .. 6 0.1 2 0.0Unknown 0 0.0 0 0.0 0 0.0 0 0.0Others 1,516 100.0 2,720 100.0 1,087 100.0 1,654 100.01 partner country 485 32.0 1,253 46.1 508 46.7 612 37.02 partner countries 284 18.7 544 20.0 169 15.5 276 16.73 partner countries 260 17.2 328 12.1 107 9.8 209 12.64-5 partner countries 307 20.3 336 12.4 151 13.9 298 18.06-7 partner countries 132 8.7 160 5.9 91 8.4 137 8.38-10 partner countries 40 2.6 81 3.0 51 4.7 98 5.911-13 partner countries 6 0.4 18 0.7 10 0.9 24 1.514 partner countries 2 0.1 0 0.0 0 0.0 0 0.0Unknown 0 0.0 0 0.0 0 0.0 0 0.0
: = Data not available.. = Confidential data

11�External Trade by Enterprise Characteristics – Results of the Standardisation exercise 2006
Tables II
Table 5.1b: Arrivals by number of partner countries (€ million) – Part 1
(€ million)
Activity section and number of partner
countries
Reporting countryDK DE FR IT CY
Value Share Value Share Value Share Value Share Value Share
All traders 34,874 100.0 211,754 100.0 218,870 100.0 145,218 100.0 3,001 100.01 partner country 2,627 7.5 15,765 7.4 15,121 6.9 11,276 7.8 229 7.62 partner countries 1,765 5.1 8,027 3.8 9,671 4.4 9,790 6.7 164 5.53 partner countries 1,690 4.8 10,512 5.0 10,475 4.8 10,218 7.0 162 5.44-5 partner countries 3,855 11.1 17,147 8.1 21,427 9.8 22,203 15.3 329 11.06-7 partner countries 5,061 14.5 21,185 10.0 22,874 10.5 32,202 22.2 374 12.58-10 partner countries 8,821 25.3 36,771 17.4 37,138 17.0 40,452 27.9 581 19.311-13 partner countries 5,823 16.7 58,026 27.4 25,985 11.9 18,946 13.0 522 17.414 partner countries 5,229 15.0 44,322 20.9 76,178 34.8 131 0.1 640 21.3Unknown 2 0.0 0 0.0 0 0.0 0 0.0 0 0.0C-E 9,025 100.0 86,798 100.0 108,196 100.0 68,817 100.0 430 100.01 partner country 222 2.5 2,418 2.8 2,737 2.5 2,007 2.9 13 3.12 partner countries 162 1.8 1,660 1.9 1,864 1.7 3,370 4.9 19 4.53 partner countries 254 2.8 1,389 1.6 2,335 2.2 4,013 5.8 19 4.44-5 partner countries 688 7.6 5,638 6.5 7,157 6.6 10,637 15.5 51 11.86-7 partner countries 1,373 15.2 7,914 9.1 10,867 10.0 14,546 21.1 50 11.78-10 partner countries 3,268 36.2 16,150 18.6 22,268 20.6 21,487 31.2 45 10.511-13 partner countries 2,753 30.5 21,691 25.0 20,068 18.5 12,656 18.4 104 24.114 partner countries 306 3.4 29,939 34.5 40,902 37.8 101 0.1 128 29.9Unknown 0 0.0 0 0.0 0 0.0 0 0.0 0 0.0G 18,650 100.0 73,740 100.0 99,541 100.0 69,948 100.0 1,853 100.01 partner country 1,947 10.4 12,154 16.5 10,174 10.2 8,812 12.6 76 4.12 partner countries 1,493 8.0 5,715 7.7 6,614 6.6 6,055 8.7 87 4.73 partner countries 1,329 7.1 8,194 11.1 7,309 7.3 5,408 7.7 102 5.54-5 partner countries 2,955 15.8 9,848 13.4 12,486 12.5 10,568 15.1 208 11.26-7 partner countries 3,123 16.7 9,962 13.5 11,119 11.2 16,269 23.3 261 14.18-10 partner countries 4,889 26.2 14,140 19.2 13,506 13.6 17,907 25.6 412 22.211-13 partner countries 2,880 15.4 10,730 14.6 5,157 5.2 4,898 7.0 350 18.914 partner countries 31 0.2 2,997 4.1 33,175 33.3 30 0.0 356 19.2Unknown 2 0.0 0 0.0 0 0.0 0 0.0 0 0.0Others 7,199 100.0 51,217 100.0 11,133 100.0 6,454 100.0 719 100.01 partner country 458 6.4 1,193 2.3 2,209 19.8 457 7.1 139 19.42 partner countries 110 1.5 653 1.3 1,194 10.7 365 5.7 58 8.13 partner countries 108 1.5 930 1.8 831 7.5 797 12.3 41 5.74-5 partner countries 212 2.9 1,662 3.2 1,784 16.0 998 15.5 70 9.86-7 partner countries 565 7.8 3,309 6.5 889 8.0 1,386 21.5 63 8.78-10 partner countries 664 9.2 6,480 12.7 1,364 12.2 1,058 16.4 124 17.211-13 partner countries 190 2.6 25,605 50.0 760 6.8 1,393 21.6 68 9.514 partner countries 4,892 68.0 11,386 22.2 2,102 18.9 0 0.0 156 21.7Unknown 0 0.0 0 0.0 0 0.0 0 0.0 0 0.0
: = Data not available.. = Confidential data

116 External Trade by Enterprise Characteristics – Results of the Standardisation exercise 2006
TablesII
Table 5.1b: Arrivals by number of partner countries (€ million) – Part 2
(€ million)
Activity section and number of partner
countries
Reporting countryLU AT FI SE
Value Share Value Share Value Share Value Share
All traders 10,745 100.0 54,333 100.0 22,838 100.0 46,023 100.01 partner country 1,043 9.7 7,077 13.0 1,531 6.7 3,590 7.82 partner countries 691 6.4 3,979 7.3 1,410 6.2 2,464 5.43 partner countries 782 7.3 3,738 6.9 1,174 5.1 2,616 5.74-5 partner countries 1,844 17.2 8,317 15.3 2,455 10.7 7,192 15.66-7 partner countries 1,713 15.9 8,902 16.4 3,507 15.4 5,470 11.98-10 partner countries 1,286 12.0 14,438 26.6 6,575 28.8 11,386 24.711-13 partner countries 741 6.9 6,992 12.9 5,737 25.1 9,744 21.214 partner countries 2,646 24.6 890 1.6 449 2.0 3,561 7.7Unknown 0 0.0 0 0.0 0 0.0 0 0.0C-E 3,608 100.0 20,580 100.0 8,112 100.0 19,445 100.01 partner country 9 0.3 523 2.5 101 1.2 215 1.12 partner countries 181 5.0 .. 98,145.5 99 1.2 388 2.03 partner countries 37 1.0 668 3.2 122 1.5 958 4.94-5 partner countries 116 3.2 2,253 10.9 461 5.7 1,160 6.06-7 partner countries 400 11.1 3,152 15.3 825 10.2 1,722 8.98-10 partner countries 500 13.9 8,966 43.6 2,828 34.9 4,634 23.811-13 partner countries 309 8.6 3,640 17.7 3,591 44.3 6,836 35.214 partner countries 2,057 57.0 .. 98,145.5 85 1.1 3,532 18.2Unknown 0 0.0 0 0.0 0 0.0 0 0.0G 5,662 100.0 29,427 100.0 13,852 100.0 23,057 100.01 partner country 535 9.5 5,426 18.4 1,304 9.4 2,820 12.22 partner countries 367 6.5 .. 98,145.5 1,148 8.3 1,895 8.23 partner countries 577 10.2 2,777 9.4 999 7.2 1,500 6.54-5 partner countries 1,443 25.5 5,373 18.3 1,902 13.7 5,605 24.36-7 partner countries 1,112 19.6 5,114 17.4 2,578 18.6 3,396 14.78-10 partner countries 651 11.5 4,766 16.2 3,541 25.6 5,108 22.211-13 partner countries 397 7.0 2,884 9.8 2,016 14.6 2,703 11.714 partner countries 579 10.2 .. 98,145.5 364 2.6 30 0.1Unknown 0 0.0 0 0.0 0 0.0 0 0.0Others 1,475 100.0 4,326 100.0 874 100.0 3,521 100.01 partner country 498 33.8 1,128 26.1 126 14.4 555 15.82 partner countries 143 9.7 404 9.3 163 18.6 181 5.13 partner countries 169 11.5 293 6.8 53 6.1 158 4.54-5 partner countries 286 19.4 692 16.0 92 10.5 426 12.16-7 partner countries 201 13.6 635 14.7 104 11.9 352 10.08-10 partner countries 134 9.1 706 16.3 207 23.7 1,644 46.711-13 partner countries 35 2.4 468 10.8 129 14.8 205 5.814 partner countries 10 0.6 0 0.0 0 0.0 0 0.0Unknown 0 0.0 0 0.0 0 0.0 0 0.0
: = Data not available.. = Confidential data

117External Trade by Enterprise Characteristics – Results of the Standardisation exercise 2006
Tables II
Table 5.2a: Imports by number of partner countries (number of enterprises) – Part 1
Number of enterprises (number of enterprises)
Activity section and number of partner
countries
Reporting countryCZ DK EE FR IT
Number Share Number Share Number Share Number Share Number Share
All traders 57,229 100.0 17,347 100.0 11,120 100.0 73,427 100.0 94,154 100.01 partner country 28,524 49.8 8,516 49.1 4,472 40.2 43,781 59.6 53,612 56.92 partner countries 8,966 15.7 3,299 19.0 1,744 15.7 12,562 17.1 16,578 17.63 partner countries 4,862 8.5 1,748 10.1 1,008 9.1 5,859 8.0 8,441 9.04-5 partner countries 5,459 9.5 1,828 10.5 1,130 10.2 5,637 7.7 7,822 8.36-7 partner countries 2,850 5.0 843 4.9 708 6.4 2,402 3.3 3,467 3.78-10 partner countries 2,571 4.5 589 3.4 692 6.2 1,608 2.2 2,311 2.511-13 partner countries 1,456 2.5 244 1.4 410 3.7 732 1.0 986 1.014 partner countries 2,535 4.4 280 1.6 956 8.6 846 1.2 937 1.0Unknown 6 0.0 0 0.0 0 0.0 0 0.0 0 0.0C-E 14,793 100.0 4,070 100.0 2,333 100.0 21,462 100.0 44,442 100.01 partner country 6,085 41.1 1,668 41.0 725 31.1 10,464 48.8 22,138 49.82 partner countries 2,290 15.5 767 18.8 354 15.2 3,981 18.5 8,352 18.83 partner countries 1,351 9.1 443 10.9 240 10.3 2,113 9.8 4,498 10.14-5 partner countries 1,648 11.1 524 12.9 291 12.5 2,235 10.4 4,493 10.16-7 partner countries 965 6.5 261 6.4 187 8.0 1,095 5.1 2,149 4.88-10 partner countries 925 6.3 202 5.0 202 8.7 767 3.6 1,477 3.311-13 partner countries 563 3.8 80 2.0 130 5.6 382 1.8 657 1.514 partner countries 966 6.5 125 3.1 204 8.7 425 2.0 678 1.5Unknown 0 0.0 0 0.0 0 0.0 0 0.0 0 0.0G 23,692 100.0 9,625 100.0 5,283 100.0 33,893 100.0 39,747 100.01 partner country 10,042 42.4 4,538 47.1 1,784 33.8 20,152 59.5 23,651 59.52 partner countries 4,028 17.0 1,883 19.6 784 14.8 6,011 17.7 7,005 17.63 partner countries 2,292 9.7 1,049 10.9 461 8.7 2,742 8.1 3,522 8.94-5 partner countries 2,699 11.4 1,071 11.1 566 10.7 2,614 7.7 3,018 7.66-7 partner countries 1,383 5.8 483 5.0 394 7.5 1,072 3.2 1,223 3.18-10 partner countries 1,240 5.2 333 3.5 384 7.3 689 2.0 778 2.011-13 partner countries 687 2.9 139 1.4 235 4.4 284 0.8 312 0.814 partner countries 1,321 5.6 129 1.3 675 12.8 329 1.0 238 0.6Unknown 0 0.0 0 0.0 0 0.0 0 0.0 0 0.0Others 18,744 100.0 3,652 100.0 3,504 100.0 18,072 100.0 9,965 100.01 partner country 12,397 66.1 2,310 63.3 1,963 56.0 13,165 72.8 7,823 78.52 partner countries 2,648 14.1 649 17.8 606 17.3 2,570 14.2 1,221 12.33 partner countries 1,219 6.5 256 7.0 307 8.8 1,004 5.6 421 4.24-5 partner countries 1,112 5.9 233 6.4 273 7.8 788 4.4 311 3.16-7 partner countries 502 2.7 99 2.7 127 3.6 235 1.3 95 1.08-10 partner countries 406 2.2 54 1.5 106 3.0 152 0.8 56 0.611-13 partner countries 206 1.1 25 0.7 45 1.3 66 0.4 17 0.214 partner countries 248 1.3 26 0.7 77 2.2 92 0.5 21 0.2Unknown 0 0.0 0 0.0 0 0.0 0 0.0 0 0.0

118 External Trade by Enterprise Characteristics – Results of the Standardisation exercise 2006
TablesII
Table 5.2a: Imports by number of partner countries (number of enterprises) – Part 2
Number of enterprises
Activity section and number of partner
countries
Reporting countryCY LV LT LU
Number Share Number Share Number Share Number Share
All traders 8,024 100.0 13,436 100.0 11,689 100.0 1,897 100.01 partner country 4,368 54.4 6,180 46.0 4,261 36.5 1,298 68.42 partner countries 1,510 18.8 2,356 17.5 1,863 15.9 327 17.23 partner countries 718 8.9 1,331 9.9 1,065 9.1 103 5.44-5 partner countries 693 8.6 1,304 9.7 1,326 11.3 87 4.66-7 partner countries 308 3.8 744 5.5 805 6.9 24 1.38-10 partner countries 227 2.8 651 4.8 854 7.3 22 1.211-13 partner countries 95 1.2 359 2.7 576 4.9 10 0.514 partner countries 102 1.3 511 3.8 939 8.0 20 1.1Unknown 3 0.0 0 0.0 0 0.0 6 0.3C-E 687 100.0 2,290 100.0 2,385 100.0 171 100.01 partner country 279 40.6 889 38.8 818 34.3 77 45.02 partner countries 172 25.0 383 16.7 394 16.5 31 18.13 partner countries 86 12.5 243 10.6 193 8.1 15 8.84-5 partner countries 69 10.0 284 12.4 323 13.5 12 7.06-7 partner countries 31 4.5 166 7.2 188 7.9 7 4.18-10 partner countries 28 4.1 126 5.5 156 6.5 10 5.811-13 partner countries 14 2.0 82 3.6 106 4.4 6 3.514 partner countries 8 1.2 117 5.1 207 8.7 13 7.6Unknown 0 0.0 0 0.0 0 0.0 0 0.0G 2,773 100.0 6,917 100.0 6,163 100.0 870 100.01 partner country 935 33.7 2,914 42.1 1,719 27.9 585 67.22 partner countries 645 23.3 1,241 17.9 916 14.9 165 19.03 partner countries 337 12.2 667 9.6 586 9.5 55 6.34-5 partner countries 392 14.1 683 9.9 760 12.3 40 4.66-7 partner countries 195 7.0 426 6.2 514 8.3 9 1.08-10 partner countries 143 5.2 404 5.8 591 9.6 9 1.011-13 partner countries 56 2.0 236 3.4 409 6.6 2 0.214 partner countries 70 2.5 346 5.0 668 10.8 2 0.2Unknown 0 0.0 0 0.0 0 0.0 3 0.3Others 4,564 100.0 4,229 100.0 3,141 100.0 856 100.01 partner country 3,154 69.1 2,377 56.2 1,724 54.9 636 74.32 partner countries 693 15.2 732 17.3 553 17.6 131 15.33 partner countries 295 6.5 421 10.0 286 9.1 33 3.94-5 partner countries 232 5.1 337 8.0 243 7.7 35 4.16-7 partner countries 82 1.8 152 3.6 103 3.3 8 0.98-10 partner countries 56 1.2 121 2.9 107 3.4 3 0.411-13 partner countries 25 0.5 41 1.0 61 1.9 2 0.214 partner countries 24 0.5 48 1.1 64 2.0 5 0.6Unknown 3 0.1 0 0.0 0 0.0 3 0.4

11�External Trade by Enterprise Characteristics – Results of the Standardisation exercise 2006
Tables II
Table 5.2a: Imports by number of partner countries (number of enterprises) – Part 3
Number of enterprises
Activity section and number of partner
countries
Reporting countryHU AT PL SI
Number Share Number Share Number Share Number Share
All traders 37,158 100.0 23,939 100.0 79,931 100.0 17,004 100.01 partner country 16,836 45.3 14,158 59.1 40,387 50.5 7,004 41.22 partner countries 5,782 15.6 4,109 17.2 13,362 16.7 2,742 16.13 partner countries 3,291 8.9 1,949 8.1 6,928 8.7 1,556 9.24-5 partner countries 3,766 10.1 1,790 7.5 7,269 9.1 1,671 9.86-7 partner countries 2,146 5.8 803 3.4 3,767 4.7 985 5.88-10 partner countries 1,902 5.1 556 2.3 3,093 3.9 943 5.511-13 partner countries 1,152 3.1 240 1.0 1,774 2.2 658 3.914 partner countries 2,283 6.1 334 1.4 3,351 4.2 1,445 8.5Unknown 0 0.0 0 0.0 0 0.0 0 0.0C-E 9,621 100.0 5,959 100.0 22,639 100.0 5,183 100.01 partner country 3,739 38.9 2,827 47.4 9,977 44.1 1,978 38.22 partner countries 1,453 15.1 1,060 17.8 3,804 16.8 818 15.83 partner countries 876 9.1 566 9.5 2,027 9.0 496 9.64-5 partner countries 1,064 11.1 578 9.7 2,242 9.9 529 10.26-7 partner countries 657 6.8 331 5.6 1,313 5.8 310 6.08-10 partner countries 568 5.9 249 4.2 1,166 5.2 292 5.611-13 partner countries 422 4.4 133 2.2 729 3.2 237 4.614 partner countries 842 8.8 215 3.6 1,381 6.1 523 10.1Unknown 0 0.0 0 0.0 0 0.0 0 0.0G 16,830 100.0 12,073 100.0 37,112 100.0 6,546 100.01 partner country 6,630 39.4 6,875 56.9 17,799 48.0 2,099 32.12 partner countries 2,615 15.5 2,242 18.6 6,177 16.6 1,078 16.53 partner countries 1,601 9.5 1,074 8.9 3,452 9.3 626 9.64-5 partner countries 1,955 11.6 1,032 8.5 3,743 10.1 718 11.06-7 partner countries 1,122 6.7 396 3.3 1,866 5.0 445 6.88-10 partner countries 1,060 6.3 272 2.3 1,544 4.2 487 7.411-13 partner countries 604 3.6 94 0.8 857 2.3 324 4.914 partner countries 1,243 7.4 88 0.7 1,674 4.5 769 11.7Unknown 0 0.0 0 0.0 0 0.0 0 0.0Others 10,707 100.0 5,907 100.0 20,180 100.0 5,275 100.01 partner country 6,467 60.4 4,456 75.4 12,611 62.5 2,927 55.52 partner countries 1,714 16.0 807 13.7 3,381 16.8 846 16.03 partner countries 814 7.6 309 5.2 1,449 7.2 434 8.24-5 partner countries 747 7.0 180 3.0 1,284 6.4 424 8.06-7 partner countries 367 3.4 76 1.3 588 2.9 230 4.48-10 partner countries 274 2.6 35 0.6 383 1.9 164 3.111-13 partner countries 126 1.2 13 0.2 188 0.9 97 1.814 partner countries 198 1.8 31 0.5 296 1.5 153 2.9Unknown 0 0.0 0 0.0 0 0.0 0 0.0

120 External Trade by Enterprise Characteristics – Results of the Standardisation exercise 2006
TablesII
Table 5.2a: Imports by number of partner countries (number of enterprises) – Part 4
Number of enterprises
Activity section and number of partner
countries
Reporting countrySK FI SE NO
Number Share Number Share Number Share Number Share
All traders 29,738 100.0 12,826 100.0 38,146 100.0 67,070 100.01 partner country 13,590 45.7 7,320 57.1 23,635 62.0 33,777 50.42 partner countries 4,851 16.3 2,213 17.3 6,124 16.1 10,673 15.93 partner countries 2,753 9.3 1,098 8.6 2,881 7.6 5,643 8.44-5 partner countries 3,110 10.5 1,100 8.6 2,683 7.0 5,897 8.86-7 partner countries 1,696 5.7 467 3.6 1,226 3.2 3,248 4.88-10 partner countries 1,511 5.1 309 2.4 786 2.1 2,949 4.411-13 partner countries 788 2.6 155 1.2 361 0.9 1,820 2.714 partner countries 1,439 4.8 164 1.3 450 1.2 3,063 4.6Unknown 0 0.0 0 0.0 0 0.0 0 0.0C-E 7,132 100.0 3,496 100.0 8,588 100.0 9,336 100.01 partner country 2,815 39.5 1,775 50.8 4,377 51.0 3,720 39.82 partner countries 1,098 15.4 647 18.5 1,529 17.8 1,548 16.63 partner countries 701 9.8 316 9.0 789 9.2 961 10.34-5 partner countries 849 11.9 338 9.7 817 9.5 1,064 11.46-7 partner countries 475 6.7 174 5.0 420 4.9 636 6.88-10 partner countries 453 6.4 120 3.4 289 3.4 575 6.211-13 partner countries 243 3.4 64 1.8 133 1.5 334 3.614 partner countries 498 7.0 62 1.8 234 2.7 498 5.3Unknown 0 0.0 0 0.0 0 0.0 0 0.0G 13,920 100.0 6,331 100.0 16,165 100.0 29,311 100.01 partner country 5,833 41.9 3,300 52.1 8,933 55.3 10,283 35.12 partner countries 2,253 16.2 1,161 18.3 2,869 17.7 4,899 16.73 partner countries 1,338 9.6 623 9.8 1,476 9.1 2,987 10.24-5 partner countries 1,548 11.1 637 10.1 1,449 9.0 3,491 11.96-7 partner countries 891 6.4 261 4.1 655 4.1 2,017 6.98-10 partner countries 819 5.9 169 2.7 418 2.6 1,993 6.811-13 partner countries 432 3.1 82 1.3 196 1.2 1,269 4.314 partner countries 806 5.8 98 1.5 169 1.0 2,372 8.1Unknown 0 0.0 0 0.0 0 0.0 0 0.0Others 8,686 100.0 2,999 100.0 13,393 100.0 28,423 100.01 partner country 4,942 56.9 2,245 74.9 10,325 77.1 19,774 69.62 partner countries 1,500 17.3 405 13.5 1,726 12.9 4,226 14.93 partner countries 714 8.2 159 5.3 616 4.6 1,695 6.04-5 partner countries 713 8.2 125 4.2 417 3.1 1,342 4.76-7 partner countries 330 3.8 32 1.1 151 1.1 595 2.18-10 partner countries 239 2.8 20 0.7 79 0.6 381 1.311-13 partner countries 113 1.3 9 0.3 32 0.2 217 0.814 partner countries 135 1.6 4 0.1 47 0.4 193 0.7Unknown 0 0.0 0 0.0 0 0.0 0 0.0

121External Trade by Enterprise Characteristics – Results of the Standardisation exercise 2006
Tables II
Table 5.2b: Imports by number of partner countries (€ million) – Part 1
€ million
Activity section and number of partner
countries
Reporting countryCZ DK EE FR IT
Value Share Value Share Value Share Value Share Value Share
All traders 45,236 100.0 15,691 100.0 5,628 100.0 101,319 100.0 109,189 100.01 partner country 1,543 3.4 790 5.0 240 4.3 5,117 5.1 6,335 5.82 partner countries 1,621 3.6 939 6.0 287 5.1 4,389 4.3 6,894 6.33 partner countries 1,180 2.6 820 5.2 146 2.6 5,827 5.8 6,880 6.34-5 partner countries 2,472 5.5 2,782 17.7 355 6.3 9,414 9.3 11,726 10.76-7 partner countries 2,405 5.3 1,441 9.2 390 6.9 7,460 7.4 10,938 10.08-10 partner countries 3,336 7.4 2,452 15.6 539 9.6 10,033 9.9 12,418 11.411-13 partner countries 4,322 9.6 1,641 10.5 373 6.6 8,422 8.3 11,981 11.014 partner countries 28,356 62.7 4,827 30.8 3,299 58.6 50,657 50.0 42,018 38.5Unknown 0 0.0 0 0.0 0 0.0 0 0.0 0 0.0C-E 25,295 100.0 4,412 100.0 2,260 100.0 60,398 100.0 70,427 100.01 partner country 557 2.2 109 2.5 44 1.9 1,213 2.0 2,405 3.42 partner countries 488 1.9 192 4.4 51 2.3 1,390 2.3 2,937 4.23 partner countries 309 1.2 287 6.5 32 1.4 1,923 3.2 2,796 4.04-5 partner countries 840 3.3 438 9.9 90 4.0 4,395 7.3 5,886 8.46-7 partner countries 1,195 4.7 390 8.8 97 4.3 3,338 5.5 6,345 9.08-10 partner countries 1,512 6.0 718 16.3 238 10.5 5,403 8.9 6,408 9.111-13 partner countries 1,732 6.8 383 8.7 177 7.8 5,692 9.4 6,950 9.914 partner countries 18,662 73.8 1,896 43.0 1,531 67.8 37,043 61.3 36,701 52.1Unknown 0 0.0 0 0.0 0 0.0 0 0.0 0 0.0G 15,381 100.0 7,952 100.0 2,679 100.0 31,473 100.0 32,303 100.01 partner country 642 4.2 504 6.3 85 3.2 2,711 8.6 3,183 9.92 partner countries 915 5.9 611 7.7 77 2.9 2,361 7.5 2,992 9.33 partner countries 682 4.4 498 6.3 90 3.4 3,095 9.8 3,506 10.94-5 partner countries 1,175 7.6 1,128 14.2 216 8.1 4,303 13.7 3,994 12.46-7 partner countries 980 6.4 866 10.9 253 9.5 3,355 10.7 3,835 11.98-10 partner countries 1,390 9.0 1,507 19.0 219 8.2 3,617 11.5 5,130 15.911-13 partner countries 1,134 7.4 812 10.2 168 6.3 2,358 7.5 4,861 15.014 partner countries 8,463 55.0 2,025 25.5 1,571 58.6 9,673 30.7 4,802 14.9Unknown 0 0.0 0 0.0 0 0.0 0 0.0 0 0.0Others 4,560 100.0 3,327 100.0 690 100.0 9,448 100.0 6,459 100.01 partner country 343 7.5 177 5.3 111 16.1 1,193 12.6 747 11.62 partner countries 218 4.8 136 4.1 159 23.1 637 6.7 965 14.93 partner countries 189 4.1 35 1.1 24 3.4 809 8.6 578 9.04-5 partner countries 457 10.0 1,216 36.5 49 7.1 716 7.6 1,846 28.66-7 partner countries 230 5.0 184 5.5 39 5.7 767 8.1 758 11.78-10 partner countries 435 9.5 226 6.8 83 12.0 1,013 10.7 880 13.611-13 partner countries 1,457 31.9 446 13.4 29 4.2 372 3.9 170 2.614 partner countries 1,231 27.0 906 27.2 197 28.5 3,941 41.7 514 8.0Unknown 0 0.0 0 0.0 0 0.0 0 0.0 0 0.0

122 External Trade by Enterprise Characteristics – Results of the Standardisation exercise 2006
TablesII
Table 5.2b: Imports by number of partner countries (€ million) – Part 2
€ million
Activity section and number of partner
countries
Reporting countryCY LV LT LU
Value Share Value Share Value Share Value Share
All traders 1,411 100.0 4,547 100.0 8,239 100.0 1,056 100.01 partner country 100 7.1 212 4.7 324 3.9 146 13.82 partner countries 214 15.1 203 4.5 242 2.9 37 3.53 partner countries 94 6.6 207 4.6 236 2.9 23 2.24-5 partner countries 185 13.1 395 8.7 374 4.5 56 5.36-7 partner countries 124 8.8 397 8.7 398 4.8 108 10.28-10 partner countries 260 18.5 534 11.7 596 7.2 93 8.811-13 partner countries 68 4.8 471 10.3 654 7.9 33 3.114 partner countries 366 25.9 2,129 46.8 5,415 65.7 543 51.4Unknown 0 0.0 0 0.0 0 0.0 17 1.6C-E 189 100.0 1,320 100.0 3,854 100.0 530 100.01 partner country 7 3.9 31 2.4 175 4.5 3 0.62 partner countries 12 6.3 24 1.8 53 1.4 3 0.63 partner countries 9 4.6 33 2.5 83 2.2 3 0.54-5 partner countries 15 8.2 67 5.1 107 2.8 18 3.36-7 partner countries 13 7.0 100 7.6 116 3.0 27 5.18-10 partner countries 19 10.1 126 9.6 178 4.6 27 5.111-13 partner countries 18 9.3 156 11.8 225 5.8 17 3.214 partner countries 96 50.7 782 59.3 2,917 75.7 427 80.6Unknown 0 0.0 0 0.0 0 0.0 5 1.0G 843 100.0 2,666 100.0 3,681 100.0 297 100.01 partner country 35 4.1 109 4.1 99 2.7 32 10.82 partner countries 106 12.6 122 4.6 146 4.0 18 6.03 partner countries 60 7.1 129 4.8 120 3.3 15 5.04-5 partner countries 141 16.8 251 9.4 218 5.9 33 11.36-7 partner countries 84 9.9 245 9.2 230 6.3 56 18.88-10 partner countries 187 22.2 339 12.7 360 9.8 17 5.811-13 partner countries 40 4.7 287 10.8 375 10.2 16 5.214 partner countries 190 22.6 1,184 44.4 2,132 57.9 103 34.6Unknown 0 0.0 0 0.0 0 0.0 7 2.5Others 380 100.0 561 100.0 705 100.0 229 100.01 partner country 58 15.3 71 12.7 50 7.1 111 48.32 partner countries 96 25.3 57 10.2 42 6.0 16 7.03 partner countries 25 6.6 46 8.2 33 4.6 6 2.54-5 partner countries 28 7.5 76 13.6 49 7.0 5 2.36-7 partner countries 27 7.1 52 9.3 52 7.4 25 10.88-10 partner countries 55 14.4 68 12.2 58 8.2 49 21.311-13 partner countries 11 2.8 28 5.0 54 7.7 0 0.114 partner countries 80 21.0 162 28.9 366 52.0 13 5.6Unknown 0 0.0 0 0.0 0 0.0 5 2.0

123External Trade by Enterprise Characteristics – Results of the Standardisation exercise 2006
Tables II
Table 5.2b: Imports by number of partner countries (€ million) – Part 3
€ million
Activity section and number of partner
countries
Reporting countryHU AT PL SI
Value Share Value Share Value Share Value Share
All traders 42,263 100.0 25,298 100.0 60,129 100.0 12,111 100.01 partner country 1,917 4.5 3,240 12.8 1,927 3.2 229 1.92 partner countries 898 2.1 2,390 9.4 2,006 3.3 332 2.73 partner countries 875 2.1 1,344 5.3 1,829 3.0 237 2.04-5 partner countries 1,475 3.5 2,169 8.6 3,543 5.9 433 3.66-7 partner countries 1,426 3.4 1,983 7.8 3,134 5.2 440 3.68-10 partner countries 2,244 5.3 1,875 7.4 3,917 6.5 620 5.111-13 partner countries 1,889 4.5 2,557 10.1 3,784 6.3 752 6.214 partner countries 31,539 74.6 9,740 38.5 39,989 66.5 9,070 74.9Unknown 0 0.0 0 0.0 0 0.0 0 0.0C-E 27,593 100.0 12,095 100.0 33,457 100.0 6,294 100.01 partner country 255 0.9 1,034 8.5 485 1.4 59 0.92 partner countries 288 1.0 320 2.6 625 1.9 59 0.93 partner countries 274 1.0 389 3.2 500 1.5 70 1.14-5 partner countries 435 1.6 619 5.1 1,243 3.7 138 2.26-7 partner countries 598 2.2 776 6.4 1,165 3.5 126 2.08-10 partner countries 821 3.0 1,057 8.7 2,014 6.0 208 3.311-13 partner countries 982 3.6 1,208 10.0 1,830 5.5 438 7.014 partner countries 23,940 86.8 6,691 55.3 25,595 76.5 5,196 82.6Unknown 0 0.0 0 0.0 0 0.0 0 0.0G 13,130 100.0 7,411 100.0 23,577 100.0 5,030 100.01 partner country 1,508 11.5 928 12.5 1,148 4.9 128 2.52 partner countries 457 3.5 629 8.5 1,104 4.7 190 3.83 partner countries 494 3.8 757 10.2 1,144 4.9 124 2.54-5 partner countries 893 6.8 1,166 15.7 1,948 8.3 249 4.96-7 partner countries 652 5.0 741 10.0 1,736 7.4 259 5.28-10 partner countries 1,278 9.7 715 9.6 1,726 7.3 292 5.811-13 partner countries 807 6.1 1,241 16.7 1,766 7.5 251 5.014 partner countries 7,042 53.6 1,234 16.7 13,005 55.2 3,538 70.3Unknown 0 0.0 0 0.0 0 0.0 0 0.0Others 1,540 100.0 5,792 100.0 3,096 100.0 787 100.01 partner country 154 10.0 1,278 22.1 294 9.5 41 5.32 partner countries 153 9.9 1,440 24.9 277 9.0 83 10.63 partner countries 107 6.9 198 3.4 185 6.0 44 5.54-5 partner countries 147 9.6 384 6.6 352 11.4 46 5.96-7 partner countries 175 11.4 466 8.0 232 7.5 54 6.98-10 partner countries 146 9.5 103 1.8 177 5.7 120 15.311-13 partner countries 100 6.5 108 1.9 188 6.1 63 8.014 partner countries 558 36.3 1,815 31.3 1,389 44.9 335 42.6Unknown 0 0.0 0 0.0 0 0.0 0 0.0

124 External Trade by Enterprise Characteristics – Results of the Standardisation exercise 2006
TablesII
Table 5.2b: Imports by number of partner countries (€ million) – Part 4
€ million
Activity section and number of partner
countries
Reporting countrySK FI SE NO
Value Share Value Share Value Share Value Share
All traders 19,906 100.0 12,875 100.0 23,253 100.0 32,723 100.01 partner country 454 2.3 757 5.9 1,077 4.6 1,530 4.72 partner countries 379 1.9 1,023 7.9 1,142 4.9 861 2.63 partner countries 485 2.4 556 4.3 989 4.3 828 2.54-5 partner countries 781 3.9 1,317 10.2 2,093 9.0 2,047 6.36-7 partner countries 915 4.6 529 4.1 2,295 9.9 2,001 6.18-10 partner countries 1,203 6.0 921 7.2 4,126 17.7 2,711 8.311-13 partner countries 1,106 5.6 1,486 11.5 1,500 6.5 2,737 8.414 partner countries 14,584 73.3 6,286 48.8 10,032 43.1 20,008 61.1Unknown 0 0.0 0 0.0 0 0.0 0 0.0C-E 12,838 100.0 8,570 100.0 8,778 100.0 8,875 100.01 partner country 82 0.6 322 3.8 206 2.3 81 0.92 partner countries 77 0.6 193 2.3 285 3.2 165 1.93 partner countries 129 1.0 180 2.1 321 3.7 131 1.54-5 partner countries 211 1.6 425 5.0 505 5.8 264 3.06-7 partner countries 259 2.0 242 2.8 953 10.9 361 4.18-10 partner countries 407 3.2 523 6.1 702 8.0 757 8.511-13 partner countries 621 4.8 1,180 13.8 607 6.9 729 8.214 partner countries 11,052 86.1 5,506 64.2 5,199 59.2 6,388 72.0Unknown 0 0.0 0 0.0 0 0.0 0 0.0G 5,860 100.0 3,966 100.0 11,332 100.0 19,551 100.01 partner country 279 4.8 316 8.0 527 4.6 547 2.82 partner countries 242 4.1 797 20.1 657 5.8 530 2.73 partner countries 292 5.0 355 9.0 531 4.7 537 2.74-5 partner countries 452 7.7 857 21.6 1,326 11.7 1,015 5.26-7 partner countries 550 9.4 267 6.7 1,206 10.6 1,465 7.58-10 partner countries 586 10.0 343 8.7 3,115 27.5 1,585 8.111-13 partner countries 391 6.7 256 6.4 744 6.6 1,813 9.314 partner countries 3,068 52.4 775 19.5 3,226 28.5 12,059 61.7Unknown 0 0.0 0 0.0 0 0.0 0 0.0Others 1,209 100.0 340 100.0 3,143 100.0 4,298 100.01 partner country 93 7.7 120 35.2 344 10.9 902 21.02 partner countries 60 4.9 33 9.8 199 6.3 166 3.93 partner countries 64 5.3 21 6.3 137 4.4 160 3.74-5 partner countries 118 9.8 35 10.3 262 8.3 769 17.96-7 partner countries 106 8.7 20 5.8 135 4.3 176 4.18-10 partner countries 209 17.3 55 16.1 309 9.8 369 8.611-13 partner countries 94 7.7 50 14.8 149 4.7 195 4.514 partner countries 464 38.4 6 1.6 1,608 51.1 1,562 36.3Unknown 0 0.0 0 0.0 0 0.0 0 0.0

12�External Trade by Enterprise Characteristics – Results of the Standardisation exercise 2006
Tables II
Table 5.3a: Dispatches by number of partner countries (number of enterprises) – Part 1
Number of enterprises
Activity section and number of partner
countries
Reporting countryDK DE FR IT CY
Number Share Number Share Number Share Number Share Number Share
All traders 5,746 100.0 37,507 100.0 29,537 100.0 43,095 100.0 1,839 100.01 partner country 1,149 20.0 5,482 14.6 3,820 12.9 7,211 16.7 1,413 76.82 partner countries 649 11.3 3,380 9.0 3,298 11.2 4,302 10.0 245 13.33 partner countries 544 9.5 2,871 7.7 2,992 10.1 3,735 8.7 69 3.84-5 partner countries 810 14.1 5,090 13.6 5,530 18.7 6,552 15.2 53 2.96-7 partner countries 681 11.9 4,609 12.3 4,671 15.8 6,098 14.2 18 1.08-10 partner countries 938 16.3 6,541 17.4 4,985 16.9 8,134 18.9 20 1.111-13 partner countries 829 14.4 6,921 18.5 3,486 11.8 6,424 14.9 10 0.514 partner countries 131 2.3 2,613 7.0 755 2.6 639 1.5 7 0.4Unknown 15 0.3 0 0.0 0 0.0 0 0.0 4 0.2C-E 2,318 100.0 17,404 100.0 15,146 100.0 32,198 100.0 308 100.01 partner country 223 9.6 1,523 8.8 1,339 8.8 3,785 11.8 198 64.32 partner countries 159 6.9 1,143 6.6 1,352 8.9 2,736 8.5 52 16.93 partner countries 178 7.7 1,087 6.2 1,366 9.0 2,677 8.3 20 6.54-5 partner countries 299 12.9 2,243 12.9 2,662 17.6 4,998 15.5 21 6.86-7 partner countries 317 13.7 2,272 13.1 2,438 16.1 4,921 15.3 9 2.98-10 partner countries 495 21.4 3,527 20.3 3,057 20.2 6,898 21.4 4 1.311-13 partner countries 554 23.9 4,066 23.4 2,383 15.7 5,619 17.5 3 1.014 partner countries 83 3.6 1,543 8.9 549 3.6 564 1.8 1 0.3Unknown 10 0.4 0 0.0 0 0.0 0 0.0 0 0.0G 2,825 100.0 14,458 100.0 10,760 100.0 9,809 100.0 698 100.01 partner country 733 25.9 3,077 21.3 1,631 15.2 2,915 29.7 519 74.42 partner countries 401 14.2 1,733 12.0 1,435 13.3 1,414 14.4 111 15.93 partner countries 313 11.1 1,376 9.5 1,197 11.1 974 9.9 29 4.24-5 partner countries 443 15.7 2,134 14.8 2,152 20.0 1,416 14.4 22 3.26-7 partner countries 310 11.0 1,707 11.8 1,689 15.7 1,103 11.2 4 0.68-10 partner countries 365 12.9 2,082 14.4 1,573 14.6 1,155 11.8 9 1.311-13 partner countries 222 7.9 1,806 12.5 916 8.5 762 7.8 3 0.414 partner countries 33 1.2 543 3.8 167 1.6 70 0.7 1 0.1Unknown 5 0.2 0 0.0 0 0.0 0 0.0 0 0.0Others 603 100.0 5,645 100.0 3,631 100.0 1,088 100.0 833 100.01 partner country 193 32.0 882 15.6 850 23.4 511 47.0 696 83.62 partner countries 89 14.8 504 8.9 511 14.1 152 14.0 82 9.83 partner countries 53 8.8 408 7.2 429 11.8 84 7.7 20 2.44-5 partner countries 68 11.3 713 12.6 716 19.7 138 12.7 10 1.26-7 partner countries 54 9.0 630 11.2 544 15.0 74 6.8 5 0.68-10 partner countries 78 12.9 932 16.5 355 9.8 81 7.4 7 0.811-13 partner countries 53 8.8 1,049 18.6 187 5.2 43 4.0 4 0.514 partner countries 15 2.5 527 9.3 39 1.1 5 0.5 5 0.6Unknown 0 0.0 0 0.0 0 0.0 0 0.0 4 0.5

126 External Trade by Enterprise Characteristics – Results of the Standardisation exercise 2006
TablesII
Table 5.3a: Dispatches by number of partner countries (number of enterprises) – Part 2
Number of enterprises
Activity section and number of partner
countries
Reporting countryLU AT FI SE
Number Share Number Share Number Share Number Share
All traders 1,720 100.0 8,172 100.0 2,806 100.0 8,860 100.01 partner country 602 35.0 2,586 31.6 662 23.6 2,679 30.22 partner countries 315 18.3 1,611 19.7 358 12.8 1,051 11.93 partner countries 295 17.2 911 11.1 280 10.0 739 8.34-5 partner countries 262 15.2 1,025 12.5 417 14.9 1,282 14.56-7 partner countries 108 6.3 637 7.8 349 12.4 934 10.58-10 partner countries 63 3.7 696 8.5 378 13.5 1,201 13.611-13 partner countries 38 2.2 594 7.3 323 11.5 896 10.114 partner countries 37 2.2 112 1.4 39 1.4 78 0.9Unknown 0 0.0 0 0.0 0 0.0 0 0.0C-E 238 100.0 3,636 100.0 1,930 100.0 4,187 100.01 partner country 40 16.8 868 23.9 348 18.0 781 18.72 partner countries 29 12.2 618 17.0 232 12.0 394 9.43 partner countries 43 18.1 385 10.6 183 9.5 344 8.24-5 partner countries 40 16.8 469 12.9 285 14.8 661 15.86-7 partner countries 26 10.9 343 9.4 252 13.1 535 12.88-10 partner countries 20 8.4 427 11.7 310 16.1 770 18.411-13 partner countries 14 5.9 434 11.9 289 15.0 640 15.314 partner countries 26 10.9 92 2.5 31 1.6 62 1.5Unknown 0 0.0 0 0.0 0 0.0 0 0.0G 1,058 100.0 3,639 100.0 636 100.0 3,536 100.01 partner country 335 31.7 1,347 37.0 212 33.3 1,309 37.02 partner countries 208 19.7 809 22.2 97 15.3 502 14.23 partner countries 207 19.6 415 11.4 71 11.2 321 9.14-5 partner countries 178 16.8 476 13.1 100 15.7 506 14.36-7 partner countries 64 6.0 220 6.0 76 11.9 332 9.48-10 partner countries 37 3.5 238 6.5 51 8.0 350 9.911-13 partner countries 21 2.0 121 3.3 24 3.8 205 5.814 partner countries 8 0.8 13 0.4 5 0.8 11 0.3Unknown 0 0.0 0 0.0 0 0.0 0 0.0Others 424 100.0 897 100.0 240 100.0 1,137 100.01 partner country 227 53.5 371 41.4 102 42.5 589 51.82 partner countries 78 18.4 184 20.5 29 12.1 155 13.63 partner countries 45 10.6 111 12.4 26 10.8 74 6.54-5 partner countries 44 10.4 80 8.9 32 13.3 115 10.16-7 partner countries 18 4.2 74 8.2 21 8.8 67 5.98-10 partner countries 6 1.4 31 3.5 17 7.1 81 7.111-13 partner countries 3 0.7 39 4.3 10 4.2 51 4.514 partner countries 3 0.7 7 0.8 3 1.3 5 0.4Unknown 0 0.0 0 0.0 0 0.0 0 0.0

127External Trade by Enterprise Characteristics – Results of the Standardisation exercise 2006
Tables II
Table 5.3b: Dispatches by number of partner countries (€ million) – Part 1
€ million
Activity section and number of partner
countries
Reporting countryDK DE FR IT CY
Value Share Value Share Value Share Value Share Value Share
All traders 38,823 100.0 290,168 100.0 200,749 100.0 139,027 100.0 494 100.01 partner country 1,416 3.6 4,391 1.5 9,438 4.7 3,083 2.2 134 27.22 partner countries 1,468 3.8 3,380 1.2 4,853 2.4 3,718 2.7 55 11.13 partner countries 1,273 3.3 2,645 0.9 5,346 2.7 4,787 3.4 45 9.24-5 partner countries 3,017 7.8 7,367 2.5 12,670 6.3 9,609 6.9 32 6.46-7 partner countries 2,685 6.9 9,738 3.4 20,044 10.0 13,455 9.7 62 12.68-10 partner countries 5,911 15.2 24,635 8.5 34,353 17.1 28,344 20.4 78 15.711-13 partner countries 15,829 40.8 63,106 21.7 57,185 28.5 58,778 42.3 40 8.014 partner countries 6,758 17.4 174,905 60.3 56,861 28.3 17,253 12.4 48 9.8Unknown 466 1.2 0 0.0 0 0.0 0 0.0 0 0.0C-E 23,900 100.0 186,550 100.0 145,244 100.0 121,972 100.0 89 100.01 partner country 424 1.8 2,144 1.1 2,198 1.5 1,339 1.1 20 22.62 partner countries 536 2.2 1,223 0.7 2,228 1.5 2,403 2.0 10 11.33 partner countries 738 3.1 1,077 0.6 3,246 2.2 3,410 2.8 8 8.54-5 partner countries 1,996 8.4 3,294 1.8 6,830 4.7 7,726 6.3 15 17.06-7 partner countries 1,743 7.3 5,136 2.8 12,289 8.5 11,145 9.1 22 25.08-10 partner countries 3,037 12.7 15,811 8.5 24,935 17.2 25,316 20.8 5 5.411-13 partner countries 12,680 53.1 38,042 20.4 42,894 29.5 54,615 44.8 7 8.414 partner countries 2,308 9.7 119,824 64.2 50,623 34.9 16,017 13.1 2 1.7Unknown 438 1.8 0 0.0 0 0.0 0 0.0 0 0.0G 9,466 100.0 41,045 100.0 42,521 100.0 15,423 100.0 152 100.01 partner country 646 6.8 1,703 4.1 3,952 9.3 1,306 8.5 49 32.32 partner countries 791 8.4 1,647 4.0 1,920 4.5 1,149 7.4 37 24.13 partner countries 446 4.7 1,199 2.9 1,710 4.0 1,183 7.7 14 9.44-5 partner countries 784 8.3 3,274 8.0 4,157 9.8 1,708 11.1 7 4.66-7 partner countries 842 8.9 3,082 7.5 6,638 15.6 2,073 13.4 5 3.58-10 partner countries 2,374 25.1 5,735 14.0 8,365 19.7 2,850 18.5 13 8.611-13 partner countries 2,418 25.5 12,163 29.6 11,835 27.8 4,001 25.9 25 16.214 partner countries 1,136 12.0 12,243 29.8 3,944 9.3 1,154 7.5 2 1.3Unknown 28 0.3 0 0.0 0 0.0 0 0.0 0 0.0Others 5,457 100.0 62,572 100.0 12,985 100.0 1,632 100.0 253 100.01 partner country 346 6.3 544 0.9 3,288 25.3 438 26.9 65 25.72 partner countries 141 2.6 510 0.8 705 5.4 166 10.1 8 3.13 partner countries 89 1.6 370 0.6 390 3.0 195 11.9 24 9.34-5 partner countries 237 4.3 799 1.3 1,683 13.0 175 10.8 10 3.86-7 partner countries 100 1.8 1,520 2.4 1,117 8.6 236 14.5 35 13.78-10 partner countries 499 9.1 3,089 4.9 1,052 8.1 177 10.9 60 23.711-13 partner countries 731 13.4 12,901 20.6 2,455 18.9 162 9.9 8 3.014 partner countries 3,313 60.7 42,838 68.5 2,294 17.7 82 5.0 45 17.7Unknown 0 0.0 0 0.0 0 0.0 0 0.0 0 0.0

128 External Trade by Enterprise Characteristics – Results of the Standardisation exercise 2006
TablesII
Table 5.3b: Dispatches by number of partner countries (€ million) – Part 2
€ million
Activity section and number of partner
countries
Reporting countryLU AT FI SE
Value Share Value Share Value Share Value Share
All traders 7,212 100.0 46,294 100.0 24,282 100.0 46,510 100.01 partner country 312 4.3 2,487 5.4 629 2.6 876 1.92 partner countries 293 4.1 2,177 4.7 262 1.1 1,559 3.43 partner countries 247 3.4 1,804 3.9 336 1.4 944 2.04-5 partner countries 386 5.4 3,218 7.0 630 2.6 2,000 4.36-7 partner countries 601 8.3 5,732 12.4 1,390 5.7 2,912 6.38-10 partner countries 588 8.2 7,837 16.9 3,453 14.2 6,291 13.511-13 partner countries 403 5.6 15,529 33.5 8,007 33.0 19,031 40.914 partner countries 4,381 60.8 7,511 16.2 9,576 39.4 12,896 27.7Unknown 0 0.0 0 0.0 0 0.0 0 0.0C-E 5,223 100.0 35,811 100.0 23,082 100.0 37,144 100.01 partner country 56 1.1 957 2.7 416 1.8 232 0.62 partner countries 52 1.0 1,276 3.6 165 0.7 760 2.03 partner countries 52 1.0 1,059 3.0 250 1.1 502 1.44-5 partner countries 109 2.1 1,913 5.3 531 2.3 1,364 3.76-7 partner countries 280 5.4 4,561 12.7 1,248 5.4 2,202 5.98-10 partner countries 306 5.9 6,567 18.3 3,083 13.4 4,498 12.111-13 partner countries 251 4.8 12,579 35.1 7,872 34.1 15,559 41.914 partner countries 4,117 78.8 6,898 19.3 9,517 41.2 12,026 32.4Unknown 0 0.0 0 0.0 0 0.0 0 0.0G 1,558 100.0 7,912 100.0 978 100.0 6,817 100.01 partner country 195 12.5 1,221 15.4 107 11.0 411 6.02 partner countries 142 9.1 714 9.0 79 8.1 608 8.93 partner countries 164 10.5 562 7.1 77 7.9 393 5.84-5 partner countries 227 14.6 819 10.3 88 9.0 551 8.16-7 partner countries 255 16.4 819 10.4 131 13.4 571 8.48-10 partner countries 256 16.4 1,092 13.8 334 34.2 1,480 21.711-13 partner countries 101 6.5 2,207 27.9 107 10.9 2,596 38.114 partner countries 217 13.9 479 6.1 54 5.5 208 3.1Unknown 0 0.0 0 0.0 0 0.0 0 0.0Others 430 100.0 2,571 100.0 222 100.0 2,549 100.01 partner country 61 14.2 309 12.0 105 47.5 233 9.12 partner countries 98 22.7 187 7.3 18 8.2 191 7.53 partner countries 31 7.2 183 7.1 9 4.0 49 1.94-5 partner countries 50 11.6 486 18.9 11 4.9 85 3.36-7 partner countries 67 15.5 351 13.7 11 4.8 139 5.58-10 partner countries 26 6.1 177 6.9 35 15.8 313 12.311-13 partner countries 51 11.8 743 28.9 28 12.7 876 34.414 partner countries 47 10.9 134 5.2 5 2.1 662 26.0Unknown 0 0.0 0 0.0 0 0.0 0 0.0

12�External Trade by Enterprise Characteristics – Results of the Standardisation exercise 2006
Tables II
Table 5.4a: Exports by number of partner countries (number of enterprises) – Part 1
Number of enterprises
Activity section and number of partner
countries
Reporting countryCZ DK EE FR IT
Number Share Number Share Number Share Number Share Number Share
All traders 36,827 100.0 14,753 100.0 6,220 100.0 96,405 100.0 137,677 100.01 partner country 20,624 56.0 6,150 41.7 3,289 52.9 52,866 54.8 64,818 47.12 partner countries 6,301 17.1 2,766 18.7 1,194 19.2 14,583 15.1 20,312 14.83 partner countries 3,010 8.2 1,572 10.7 593 9.5 7,409 7.7 10,815 7.94-5 partner countries 2,749 7.5 1,604 10.9 566 9.1 7,357 7.6 12,112 8.86-7 partner countries 1,323 3.6 763 5.2 242 3.9 3,721 3.9 6,954 5.18-10 partner countries 986 2.7 579 3.9 155 2.5 3,164 3.3 6,339 4.611-13 partner countries 508 1.4 337 2.3 80 1.3 1,916 2.0 3,956 2.914 partner countries 1,250 3.4 982 6.7 101 1.6 5,389 5.6 12,371 9.0Unknown 76 0.2 0 0.0 0 0.0 0 0.0 0 0.0C-E 14,713 100.0 4,683 100.0 2,315 100.0 29,968 100.0 77,040 100.01 partner country 7,123 48.4 1,560 33.3 964 41.6 12,280 41.0 29,453 38.22 partner countries 2,419 16.4 752 16.1 460 19.9 4,529 15.1 10,890 14.13 partner countries 1,285 8.7 467 10.0 255 11.0 2,535 8.5 6,195 8.04-5 partner countries 1,295 8.8 530 11.3 258 11.1 2,800 9.3 7,592 9.96-7 partner countries 725 4.9 317 6.8 136 5.9 1,645 5.5 4,781 6.28-10 partner countries 582 4.0 269 5.7 106 4.6 1,560 5.2 4,680 6.111-13 partner countries 325 2.2 171 3.7 59 2.5 1,034 3.5 3,056 4.014 partner countries 958 6.5 617 13.2 77 3.3 3,585 12.0 10,393 13.5Unknown 1 0.0 0 0.0 0 0.0 0 0.0 0 0.0G 13,809 100.0 7,492 100.0 2,550 100.0 39,250 100.0 49,337 100.01 partner country 7,597 55.0 3,124 41.7 1,372 53.8 20,945 53.4 27,091 54.92 partner countries 2,720 19.7 1,556 20.8 519 20.4 6,597 16.8 8,073 16.43 partner countries 1,243 9.0 922 12.3 259 10.2 3,371 8.6 4,037 8.24-5 partner countries 1,094 7.9 859 11.5 247 9.7 3,347 8.5 4,034 8.26-7 partner countries 460 3.3 370 4.9 76 3.0 1,595 4.1 1,970 4.08-10 partner countries 315 2.3 254 3.4 41 1.6 1,247 3.2 1,510 3.111-13 partner countries 135 1.0 134 1.8 17 0.7 694 1.8 837 1.714 partner countries 221 1.6 273 3.6 19 0.7 1,454 3.7 1,785 3.6Unknown 24 0.2 0 0.0 0 0.0 0 0.0 0 0.0Others 8,305 100.0 2,578 100.0 1,355 100.0 27,187 100.0 11,300 100.01 partner country 5,904 71.1 1,466 56.9 953 70.3 19,641 72.2 8,274 73.22 partner countries 1,162 14.0 458 17.8 215 15.9 3,457 12.7 1,349 11.93 partner countries 482 5.8 183 7.1 79 5.8 1,503 5.5 583 5.24-5 partner countries 360 4.3 215 8.3 61 4.5 1,210 4.5 486 4.36-7 partner countries 138 1.7 76 2.9 30 2.2 481 1.8 203 1.88-10 partner countries 89 1.1 56 2.2 8 0.6 357 1.3 149 1.311-13 partner countries 48 0.6 32 1.2 4 0.3 188 0.7 63 0.614 partner countries 71 0.9 92 3.6 5 0.4 350 1.3 193 1.7Unknown 51 0.6 0 0.0 0 0.0 0 0.0 0 0.0

130 External Trade by Enterprise Characteristics – Results of the Standardisation exercise 2006
TablesII
Table 5.4a: Exports by number of partner countries (number of enterprises) – Part 2
Number of enterprises
Activity section and number of partner
countries
Reporting countryCY LV LT LU
Number Share Number Share Number Share Number Share
All traders 1,557 100.0 4,914 100.0 7,542 100.0 917 100.01 partner country 1,121 72.0 2,524 51.4 3,404 45.1 525 57.32 partner countries 202 13.0 963 19.6 1,426 18.9 149 16.23 partner countries 74 4.8 496 10.1 798 10.6 62 6.84-5 partner countries 67 4.3 444 9.0 810 10.7 44 4.86-7 partner countries 26 1.7 219 4.5 455 6.0 27 2.98-10 partner countries 19 1.2 130 2.6 381 5.1 25 2.711-13 partner countries 13 0.8 51 1.0 137 1.8 10 1.114 partner countries 16 1.0 87 1.8 131 1.7 64 7.0Unknown 19 1.2 0 0.0 0 0.0 11 1.2C-E 230 100.0 1,696 100.0 2,464 100.0 145 100.01 partner country 114 49.6 681 40.2 992 40.3 48 33.12 partner countries 43 18.7 352 20.8 472 19.2 21 14.53 partner countries 16 7.0 200 11.8 251 10.2 13 9.04-5 partner countries 22 9.6 188 11.1 325 13.2 6 4.16-7 partner countries 5 2.2 107 6.3 152 6.2 4 2.88-10 partner countries 11 4.8 73 4.3 115 4.7 10 6.911-13 partner countries 9 3.9 31 1.8 54 2.2 6 4.114 partner countries 9 3.9 64 3.8 103 4.2 37 25.5Unknown 1 0.4 0 0.0 0 0.0 0 0.0G 396 100.0 2,162 100.0 3,545 100.0 442 100.01 partner country 275 69.4 1,171 54.2 1,420 40.1 258 58.42 partner countries 62 15.7 448 20.7 663 18.7 76 17.23 partner countries 25 6.3 210 9.7 439 12.4 30 6.84-5 partner countries 20 5.1 188 8.7 415 11.7 28 6.36-7 partner countries 7 1.8 83 3.8 263 7.4 16 3.68-10 partner countries 5 1.3 39 1.8 242 6.8 10 2.311-13 partner countries 0 0.0 12 0.6 78 2.2 2 0.514 partner countries 1 0.3 11 0.5 25 0.7 14 3.2Unknown 1 0.3 0 0.0 0 0.0 8 1.8Others 931 100.0 1,056 100.0 1,533 100.0 330 100.01 partner country 732 78.6 672 63.6 992 64.7 219 66.42 partner countries 97 10.4 163 15.4 291 19.0 52 15.83 partner countries 33 3.5 86 8.1 108 7.0 19 5.84-5 partner countries 25 2.7 68 6.4 70 4.6 10 3.06-7 partner countries 14 1.5 29 2.7 40 2.6 7 2.18-10 partner countries 3 0.3 18 1.7 24 1.6 5 1.511-13 partner countries 4 0.4 8 0.8 5 0.3 2 0.614 partner countries 6 0.6 12 1.1 3 0.2 13 3.9Unknown 17 1.8 0 0.0 0 0.0 3 0.9
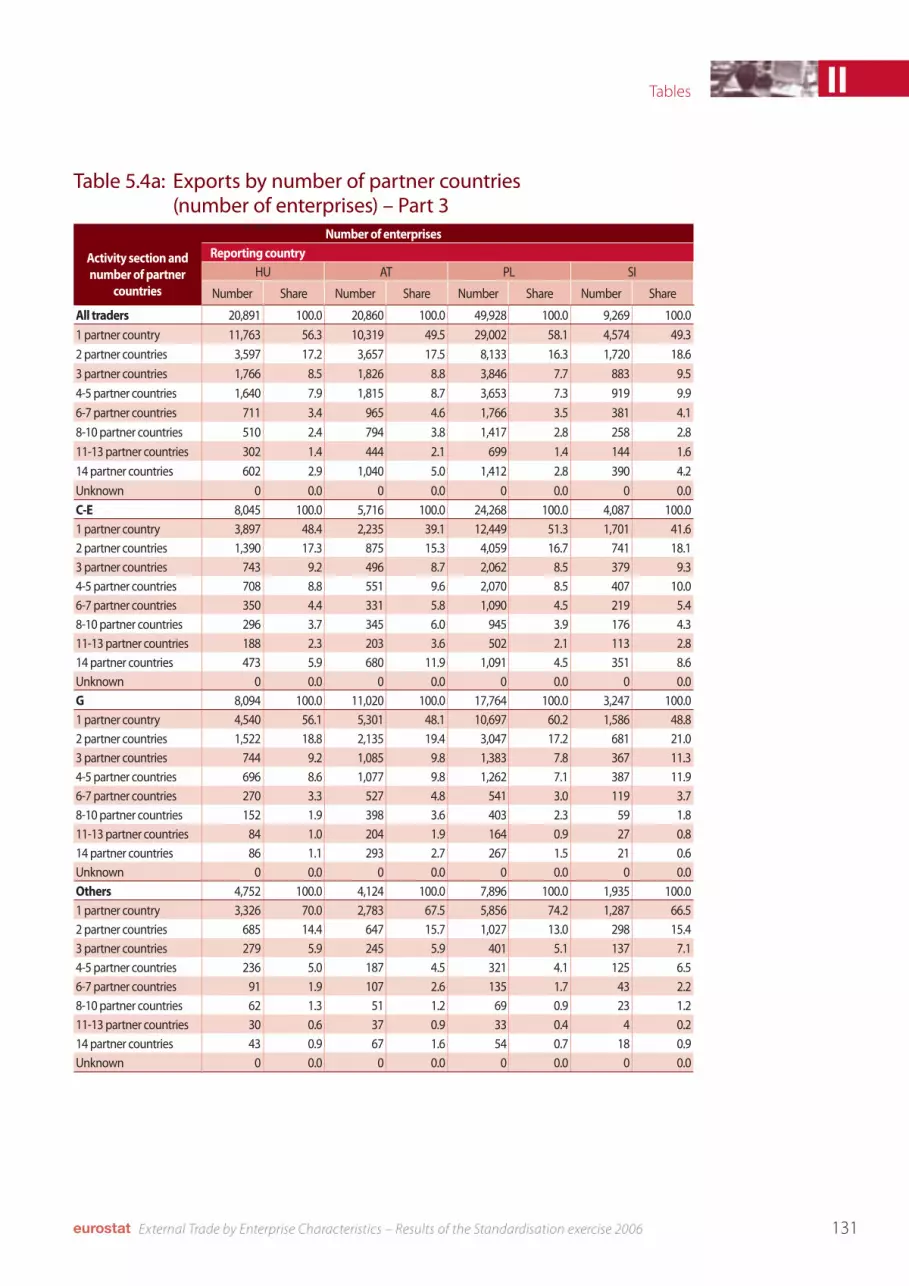
131External Trade by Enterprise Characteristics – Results of the Standardisation exercise 2006
Tables II
Table 5.4a: Exports by number of partner countries (number of enterprises) – Part 3
Number of enterprises
Activity section and number of partner
countries
Reporting countryHU AT PL SI
Number Share Number Share Number Share Number Share
All traders 20,891 100.0 20,860 100.0 49,928 100.0 9,269 100.01 partner country 11,763 56.3 10,319 49.5 29,002 58.1 4,574 49.32 partner countries 3,597 17.2 3,657 17.5 8,133 16.3 1,720 18.63 partner countries 1,766 8.5 1,826 8.8 3,846 7.7 883 9.54-5 partner countries 1,640 7.9 1,815 8.7 3,653 7.3 919 9.96-7 partner countries 711 3.4 965 4.6 1,766 3.5 381 4.18-10 partner countries 510 2.4 794 3.8 1,417 2.8 258 2.811-13 partner countries 302 1.4 444 2.1 699 1.4 144 1.614 partner countries 602 2.9 1,040 5.0 1,412 2.8 390 4.2Unknown 0 0.0 0 0.0 0 0.0 0 0.0C-E 8,045 100.0 5,716 100.0 24,268 100.0 4,087 100.01 partner country 3,897 48.4 2,235 39.1 12,449 51.3 1,701 41.62 partner countries 1,390 17.3 875 15.3 4,059 16.7 741 18.13 partner countries 743 9.2 496 8.7 2,062 8.5 379 9.34-5 partner countries 708 8.8 551 9.6 2,070 8.5 407 10.06-7 partner countries 350 4.4 331 5.8 1,090 4.5 219 5.48-10 partner countries 296 3.7 345 6.0 945 3.9 176 4.311-13 partner countries 188 2.3 203 3.6 502 2.1 113 2.814 partner countries 473 5.9 680 11.9 1,091 4.5 351 8.6Unknown 0 0.0 0 0.0 0 0.0 0 0.0G 8,094 100.0 11,020 100.0 17,764 100.0 3,247 100.01 partner country 4,540 56.1 5,301 48.1 10,697 60.2 1,586 48.82 partner countries 1,522 18.8 2,135 19.4 3,047 17.2 681 21.03 partner countries 744 9.2 1,085 9.8 1,383 7.8 367 11.34-5 partner countries 696 8.6 1,077 9.8 1,262 7.1 387 11.96-7 partner countries 270 3.3 527 4.8 541 3.0 119 3.78-10 partner countries 152 1.9 398 3.6 403 2.3 59 1.811-13 partner countries 84 1.0 204 1.9 164 0.9 27 0.814 partner countries 86 1.1 293 2.7 267 1.5 21 0.6Unknown 0 0.0 0 0.0 0 0.0 0 0.0Others 4,752 100.0 4,124 100.0 7,896 100.0 1,935 100.01 partner country 3,326 70.0 2,783 67.5 5,856 74.2 1,287 66.52 partner countries 685 14.4 647 15.7 1,027 13.0 298 15.43 partner countries 279 5.9 245 5.9 401 5.1 137 7.14-5 partner countries 236 5.0 187 4.5 321 4.1 125 6.56-7 partner countries 91 1.9 107 2.6 135 1.7 43 2.28-10 partner countries 62 1.3 51 1.2 69 0.9 23 1.211-13 partner countries 30 0.6 37 0.9 33 0.4 4 0.214 partner countries 43 0.9 67 1.6 54 0.7 18 0.9Unknown 0 0.0 0 0.0 0 0.0 0 0.0

132 External Trade by Enterprise Characteristics – Results of the Standardisation exercise 2006
TablesII
Table 5.4a: Exports by number of partner countries (number of enterprises) – Part 4
Number of enterprises
Activity section and number of partner
countries
Reporting countrySK FI SE NO
Number Share Number Share Number Share Number Share
All traders 15,416 100.0 9,395 100.0 31,573 100.0 16,914 100.01 partner country 9,492 61.6 4,938 52.6 18,149 57.5 9,101 53.82 partner countries 2,685 17.4 1,572 16.7 4,784 15.2 2,682 15.93 partner countries 1,103 7.2 859 9.1 2,319 7.3 1,375 8.14-5 partner countries 1,009 6.5 755 8.0 2,290 7.3 1,437 8.56-7 partner countries 456 3.0 361 3.8 1,178 3.7 691 4.18-10 partner countries 259 1.7 340 3.6 976 3.1 583 3.411-13 partner countries 116 0.8 140 1.5 526 1.7 312 1.814 partner countries 296 1.9 430 4.6 1,351 4.3 733 4.3Unknown 0 0.0 0 0.0 0 0.0 0 0.0C-E 5,449 100.0 3,676 100.0 9,783 100.0 4,438 100.01 partner country 2,797 51.3 1,518 41.3 4,401 45.0 1,729 39.02 partner countries 954 17.5 564 15.3 1,475 15.1 696 15.73 partner countries 469 8.6 324 8.8 824 8.4 396 8.94-5 partner countries 490 9.0 376 10.2 880 9.0 494 11.16-7 partner countries 259 4.8 198 5.4 553 5.7 267 6.08-10 partner countries 162 3.0 225 6.1 466 4.8 261 5.911-13 partner countries 85 1.6 98 2.7 273 2.8 134 3.014 partner countries 233 4.3 373 10.1 911 9.3 461 10.4Unknown 0 0.0 0 0.0 0 0.0 0 0.0G 6,921 100.0 4,035 100.0 12,313 100.0 8,139 100.01 partner country 4,472 64.6 2,251 55.8 6,874 55.8 4,434 54.52 partner countries 1,279 18.5 768 19.0 2,140 17.4 1,384 17.03 partner countries 496 7.2 435 10.8 1,026 8.3 718 8.84-5 partner countries 393 5.7 297 7.4 997 8.1 722 8.96-7 partner countries 151 2.2 121 3.0 448 3.6 314 3.98-10 partner countries 69 1.0 91 2.3 360 2.9 247 3.011-13 partner countries 21 0.3 32 0.8 187 1.5 125 1.514 partner countries 40 0.6 40 1.0 281 2.3 195 2.4Unknown 0 0.0 0 0.0 0 0.0 0 0.0Others 3,046 100.0 1,684 100.0 9,477 100.0 4,337 100.01 partner country 2,223 73.0 1,169 69.4 6,874 72.5 2,938 67.72 partner countries 452 14.8 240 14.3 1,169 12.3 602 13.93 partner countries 138 4.5 100 5.9 469 4.9 261 6.04-5 partner countries 126 4.1 82 4.9 413 4.4 221 5.16-7 partner countries 46 1.5 42 2.5 177 1.9 110 2.58-10 partner countries 28 0.9 24 1.4 150 1.6 75 1.711-13 partner countries 10 0.3 10 0.6 66 0.7 53 1.214 partner countries 23 0.8 17 1.0 159 1.7 77 1.8Unknown 0 0.0 0 0.0 0 0.0 0 0.0

133External Trade by Enterprise Characteristics – Results of the Standardisation exercise 2006
Tables II
Table 5.4b: Exports by number of partner countries (€ million) – Part 1
€ million
Activity section and number of partner
countries
Reporting countryCZ DK EE FR IT
Value Share Value Share Value Share Value Share Value Share
All traders 43,053 100.0 19,739 100.0 4,000 100.0 118,590 100.0 116,055 100.01 partner country 2,706 6.3 531 2.7 280 7.0 3,193 2.7 3,849 3.32 partner countries 1,828 4.2 669 3.4 328 8.2 2,475 2.1 3,404 2.93 partner countries 1,507 3.5 460 2.3 246 6.1 2,141 1.8 3,415 2.94-5 partner countries 2,765 6.4 1,289 6.5 461 11.5 3,393 2.9 5,300 4.66-7 partner countries 2,729 6.3 730 3.7 364 9.1 3,788 3.2 4,877 4.28-10 partner countries 3,092 7.2 1,024 5.2 424 10.6 4,596 3.9 6,457 5.611-13 partner countries 2,189 5.1 772 3.9 378 9.5 7,778 6.6 5,726 4.914 partner countries 26,232 60.9 14,264 72.3 1,520 38.0 91,226 76.9 83,027 71.5Unknown 4 0.0 0 0.0 0 0.0 0 0.0 0 0.0C-E 36,443 100.0 12,719 100.0 3,322 100.0 86,785 100.0 97,717 100.01 partner country 1,888 5.2 228 1.8 183 5.5 926 1.1 1,819 1.92 partner countries 1,147 3.1 202 1.6 161 4.8 1,156 1.3 1,873 1.93 partner countries 1,111 3.0 168 1.3 157 4.7 924 1.1 2,161 2.24-5 partner countries 2,135 5.9 441 3.5 346 10.4 1,617 1.9 3,356 3.46-7 partner countries 2,255 6.2 356 2.8 304 9.1 2,511 2.9 3,638 3.78-10 partner countries 2,574 7.1 569 4.5 354 10.7 2,986 3.4 5,098 5.211-13 partner countries 1,843 5.1 411 3.2 314 9.4 2,395 2.8 4,522 4.614 partner countries 23,489 64.5 10,345 81.3 1,505 45.3 74,268 85.6 75,249 77.0Unknown 0 0.0 0 0.0 0 0.0 0 0.0 0 0.0G 4,654 100.0 4,825 100.0 485 100.0 22,117 100.0 14,254 100.01 partner country 434 9.3 203 4.2 65 13.5 1,234 5.6 1,541 10.82 partner countries 341 7.3 381 7.9 95 19.5 902 4.1 1,109 7.83 partner countries 280 6.0 248 5.1 68 14.0 895 4.0 962 6.84-5 partner countries 398 8.6 530 11.0 90 18.6 1,297 5.9 1,540 10.86-7 partner countries 358 7.7 316 6.6 46 9.4 852 3.9 1,053 7.48-10 partner countries 432 9.3 386 8.0 45 9.3 1,167 5.3 1,232 8.611-13 partner countries 274 5.9 320 6.6 63 13.1 4,675 21.1 1,063 7.514 partner countries 2,135 45.9 2,441 50.6 13 2.7 11,094 50.2 5,754 40.4Unknown 2 0.0 0 0.0 0 0.0 0 0.0 0 0.0Others 1,956 100.0 2,195 100.0 193 100.0 9,688 100.0 4,084 100.01 partner country 384 19.6 100 4.6 32 16.4 1,032 10.7 490 12.02 partner countries 340 17.4 85 3.9 73 37.7 417 4.3 421 10.33 partner countries 116 5.9 44 2.0 21 10.8 321 3.3 292 7.14-5 partner countries 232 11.9 319 14.5 25 13.0 479 4.9 403 9.96-7 partner countries 115 5.9 59 2.7 14 7.5 425 4.4 186 4.68-10 partner countries 86 4.4 70 3.2 25 12.8 442 4.6 128 3.111-13 partner countries 72 3.7 41 1.9 1 0.7 708 7.3 141 3.514 partner countries 608 31.1 1,478 67.3 2 1.2 5,864 60.5 2,024 49.6Unknown 2 0.1 0 0.0 0 0.0 0 0.0 0 0.0

134 External Trade by Enterprise Characteristics – Results of the Standardisation exercise 2006
TablesII
Table 5.4b: Exports by number of partner countries (€ million) – Part 2
€ million
Activity section and number of partner
countries
Reporting countryCY LV LT LU
Value Share Value Share Value Share Value Share
All traders 265 100.0 2,547 100.0 6,068 100.0 1,374 100.01 partner country 73 27.7 202 7.9 260 4.3 15 1.12 partner countries 20 7.6 193 7.6 265 4.4 11 0.83 partner countries 11 4.1 229 9.0 204 3.4 6 0.54-5 partner countries 16 6.0 301 11.8 480 7.9 11 0.86-7 partner countries 12 4.4 260 10.2 544 9.0 16 1.18-10 partner countries 20 7.6 339 13.3 711 11.7 18 1.311-13 partner countries 22 8.3 224 8.8 419 6.9 21 1.614 partner countries 91 34.4 800 31.4 3,184 52.5 1,264 92.0Unknown 0 0.0 0 0.0 0 0.0 13 1.0C-E 69 100.0 1,798 100.0 4,866 100.0 1,119 100.01 partner country 10 14.1 90 5.0 186 3.8 1 0.12 partner countries 4 5.3 90 5.0 180 3.7 3 0.33 partner countries 3 4.2 139 7.7 106 2.2 2 0.24-5 partner countries 7 9.8 161 9.0 283 5.8 2 0.26-7 partner countries 2 2.7 173 9.6 354 7.3 5 0.58-10 partner countries 17 24.4 265 14.7 501 10.3 8 0.711-13 partner countries 15 21.3 158 8.8 203 4.2 20 1.814 partner countries 12 18.2 722 40.2 3,054 62.8 1,069 95.5Unknown 0 0.0 0 0.0 0 0.0 8 0.7G 27 100.0 555 100.0 979 100.0 96 100.01 partner country 4 13.8 87 15.6 52 5.3 6 6.72 partner countries 7 25.3 76 13.8 57 5.8 4 3.73 partner countries 4 14.8 45 8.1 85 8.7 4 3.94-5 partner countries 6 20.9 120 21.6 173 17.7 6 6.86-7 partner countries 4 13.4 72 12.9 154 15.7 9 9.08-10 partner countries 3 11.4 59 10.6 193 19.7 8 8.111-13 partner countries 0 0.0 58 10.4 196 20.0 1 0.814 partner countries 0 0.4 38 6.9 69 7.1 53 55.3Unknown 0 0.0 0 0.0 0 0.0 5 5.7Others 169 100.0 194 100.0 223 100.0 160 100.01 partner country 60 35.4 25 13.0 22 10.1 7 4.32 partner countries 10 5.7 27 13.9 28 12.6 4 2.33 partner countries 4 2.4 45 22.9 14 6.1 1 0.54-5 partner countries 3 2.1 20 10.1 25 11.2 2 1.26-7 partner countries 6 3.6 15 7.7 36 16.2 2 1.08-10 partner countries 0 0.1 15 7.9 16 7.4 2 1.311-13 partner countries 7 4.4 8 4.1 20 9.1 0 0.214 partner countries 78 46.3 40 20.5 61 27.4 142 89.1Unknown 0 0.0 0 0.0 0 0.0 0 0.1

13�External Trade by Enterprise Characteristics – Results of the Standardisation exercise 2006
Tables II
Table 5.4b: Exports by number of partner countries (€ million) – Part 3
€ million
Activity section and number of partner
countries
Reporting countryHU AT PL SI
Value Share Value Share Value Share Value Share
All traders 38,096 100.0 32,844 100.0 47,408 100.0 11,245 100.01 partner country 1,518 4.0 1,491 4.5 2,896 6.1 247 2.22 partner countries 1,107 2.9 2,134 6.5 2,357 5.0 253 2.33 partner countries 1,089 2.9 733 2.2 1,711 3.6 292 2.64-5 partner countries 1,711 4.5 1,427 4.3 2,737 5.8 494 4.46-7 partner countries 1,250 3.3 1,288 3.9 3,088 6.5 489 4.48-10 partner countries 2,223 5.8 2,493 7.6 3,550 7.5 715 6.411-13 partner countries 1,713 4.5 1,934 5.9 2,622 5.5 507 4.514 partner countries 27,485 72.1 21,343 65.0 28,448 60.0 8,248 73.3Unknown 0 0.0 0 0.0 0 0.0 0 0.0C-E 35,157 100.0 20,414 100.0 39,458 100.0 10,298 100.01 partner country 1,083 3.1 202 1.0 1,977 5.0 150 1.52 partner countries 804 2.3 232 1.1 1,656 4.2 168 1.63 partner countries 808 2.3 270 1.3 1,156 2.9 222 2.24-5 partner countries 1,361 3.9 500 2.4 1,987 5.0 310 3.06-7 partner countries 1,003 2.9 692 3.4 2,496 6.3 392 3.88-10 partner countries 1,964 5.6 1,719 8.4 2,853 7.2 525 5.111-13 partner countries 1,511 4.3 985 4.8 2,279 5.8 458 4.414 partner countries 26,623 75.7 15,814 77.5 25,053 63.5 8,073 78.4Unknown 0 0.0 0 0.0 0 0.0 0 0.0G 2,265 100.0 6,133 100.0 6,736 100.0 591 100.01 partner country 283 12.5 324 5.3 651 9.7 62 10.52 partner countries 235 10.4 418 6.8 514 7.6 65 11.03 partner countries 219 9.7 326 5.3 386 5.7 48 8.24-5 partner countries 244 10.8 557 9.1 599 8.9 151 25.66-7 partner countries 204 9.0 423 6.9 463 6.9 76 12.98-10 partner countries 215 9.5 653 10.6 618 9.2 79 13.311-13 partner countries 175 7.7 791 12.9 275 4.1 48 8.114 partner countries 692 30.6 2,641 43.1 3,229 47.9 61 10.4Unknown 0 0.0 0 0.0 0 0.0 0 0.0Others 674 100.0 6,297 100.0 1,214 100.0 356 100.01 partner country 153 22.6 965 15.3 267 22.0 35 9.92 partner countries 69 10.2 1,484 23.6 187 15.4 21 5.83 partner countries 62 9.2 137 2.2 168 13.9 22 6.14-5 partner countries 106 15.7 371 5.9 150 12.4 32 8.96-7 partner countries 43 6.4 173 2.8 129 10.6 21 5.88-10 partner countries 45 6.7 121 1.9 78 6.4 111 31.111-13 partner countries 28 4.1 158 2.5 67 5.5 1 0.314 partner countries 170 25.1 2,888 45.9 166 13.7 114 32.1Unknown 0 0.0 0 0.0 0 0.0 0 0.0

136 External Trade by Enterprise Characteristics – Results of the Standardisation exercise 2006
TablesII
Table 5.4b: Exports by number of partner countries (€ million) – Part 4
€ million
Activity section and number of partner
countries
Reporting countrySK FI SE NO
Value Share Value Share Value Share Value Share
All traders 19,306 100.0 21,499 100.0 40,624 100.0 41,801 100.01 partner country 627 3.2 446 2.1 1,066 2.6 1,147 2.72 partner countries 780 4.0 334 1.6 806 2.0 417 1.03 partner countries 686 3.6 455 2.1 612 1.5 663 1.64-5 partner countries 902 4.7 702 3.3 1,569 3.9 1,355 3.26-7 partner countries 865 4.5 1,011 4.7 1,189 2.9 1,302 3.18-10 partner countries 1,141 5.9 1,440 6.7 1,610 4.0 3,447 8.211-13 partner countries 1,151 6.0 949 4.4 1,654 4.1 3,612 8.614 partner countries 13,154 68.1 16,162 75.2 32,118 79.1 29,859 71.4Unknown 0 0.0 0 0.0 0 0.0 0 0.0C-E 17,496 100.0 18,556 100.0 33,713 100.0 35,448 100.01 partner country 313 1.8 177 1.0 381 1.1 332 0.92 partner countries 519 3.0 153 0.8 340 1.0 182 0.53 partner countries 486 2.8 156 0.8 311 0.9 256 0.74-5 partner countries 657 3.8 379 2.0 815 2.4 1,025 2.96-7 partner countries 734 4.2 674 3.6 676 2.0 836 2.48-10 partner countries 967 5.5 1,105 6.0 784 2.3 2,964 8.411-13 partner countries 1,071 6.1 601 3.2 1,137 3.4 3,169 8.914 partner countries 12,748 72.9 15,312 82.5 29,269 86.8 26,684 75.3Unknown 0 0.0 0 0.0 0 0.0 0 0.0G 1,213 100.0 2,421 100.0 4,757 100.0 3,877 100.01 partner country 222 18.3 167 6.9 363 7.6 143 3.72 partner countries 182 15.0 154 6.3 315 6.6 93 2.43 partner countries 136 11.2 260 10.7 216 4.5 100 2.64-5 partner countries 175 14.5 263 10.9 663 13.9 260 6.76-7 partner countries 101 8.4 305 12.6 387 8.1 367 9.58-10 partner countries 109 9.0 307 12.7 721 15.2 415 10.711-13 partner countries 28 2.3 339 14.0 425 8.9 315 8.114 partner countries 260 21.4 626 25.9 1,667 35.0 2,185 56.4Unknown 0 0.0 0 0.0 0 0.0 0 0.0Others 597 100.0 521 100.0 2,153 100.0 2,476 100.01 partner country 92 15.4 102 19.5 322 14.9 672 27.12 partner countries 80 13.3 28 5.3 151 7.0 141 5.73 partner countries 64 10.6 39 7.6 85 3.9 307 12.44-5 partner countries 69 11.6 60 11.5 91 4.2 70 2.86-7 partner countries 30 5.0 32 6.1 126 5.9 99 4.08-10 partner countries 65 10.8 28 5.4 104 4.8 68 2.811-13 partner countries 52 8.6 9 1.8 92 4.3 129 5.214 partner countries 146 24.5 223 42.8 1,182 54.9 990 40.0Unknown 0 0.0 0 0.0 0 0.0 0 0.0

137External Trade by Enterprise Characteristics – Results of the Standardisation exercise 2006
Tables II
Table 6.1: Arrivals by products (€ million) – Part 1
€ million
CPA
Reporting country and activity sectionBE DK
Total C-E total C-E manuf. C-E others G Others Total C-E total C-E
manuf. C-E others G Others
Total 142,841 49,981 : : 45,889 46,971 34,874 9,025 : : 18,650 7,199 01-05 2,990 948 : : 1,754 288 1,004 119 : : 648 237 10-14 11,647 6,938 21 6,916 164 4,544 91 35 7 28 37 19 15-16 10,575 3,900 3,720 180 5,673 1,002 3,106 876 828 48 1,606 625 17 2,197 1,110 716 393 898 189 743 286 107 179 283 174 18 1,970 124 95 28 1,713 134 750 13 11 2 525 211 19 848 91 40 50 708 49 373 64 61 3 207 103 20 902 457 354 103 399 46 687 235 149 86 307 146 21 3,399 1,677 930 747 820 901 697 291 172 120 314 92 22 1,040 261 212 49 626 153 374 52 32 20 148 174 23 4,921 2,016 1,739 278 1,647 1,257 65 28 6 22 35 2 24 37,883 9,241 5,952 3,288 6,237 22,406 4,271 1,531 810 721 2,190 549 25 4,157 2,015 658 1,357 1,503 639 1,267 412 151 261 618 236 26 1,805 832 381 450 669 304 663 208 75 133 314 141 27 7,181 4,549 2,896 1,653 1,376 1,256 1,743 655 166 489 906 182 28 3,180 1,517 489 1,027 1,133 529 1,169 431 120 312 540 198 29 9,016 3,151 1,252 1,899 3,582 2,282 3,789 1,254 823 431 1,819 716 30 3,578 217 51 167 2,227 1,133 1,942 12 3 9 1,589 342 31 3,173 1,336 483 853 1,174 663 1,554 476 302 174 690 388 32 3,488 786 430 355 1,665 1,037 2,149 286 228 59 1,193 670 33 2,505 633 94 538 1,090 782 859 184 96 88 425 251 34 22,196 7,147 6,870 277 8,602 6,448 2,804 181 102 78 2,259 364 35 1,107 322 293 29 253 533 713 69 60 9 99 545 36 2,311 411 246 165 1,627 274 828 110 91 19 434 283 40 324 273 270 3 0 51 217 172 172 0 14 31 Others 441 33 : : 340 68 132 4 : : 69 59 Unknown 0 0 : : 9 2 2,885 1,041 : : 1,382 462
.. = Confidential data: = not applicableNote: Column C-E total equals the sum of columns C-E manufacturing and C-E others

138 External Trade by Enterprise Characteristics – Results of the Standardisation exercise 2006
TablesII
Table 6.1: Arrivals by products (€ million) – Part 2
€ million
CPA
Reporting country and activity sectionDE FR
Total C-E total C-E manuf. C-E others G Others Total C-E total C-E
manuf. C-E others G Others
Total 211,754 86,798 : : 73,740 51,217 218,870 108,196 : : 99,541 11,133 01-05 8,895 1,403 : : 6,758 733 5,599 851 : : 4,222 525 10-14 6,304 2,659 531 2,128 367 3,278 2,568 2,214 66 2,147 330 25 15-16 17,046 5,525 5,295 230 9,084 2,438 18,066 8,932 8,639 294 8,524 609 17 4,694 1,999 670 1,329 1,911 784 5,320 2,617 1,151 1,466 2,500 203 18 3,102 392 313 79 2,381 329 5,035 683 576 106 4,084 268 19 2,259 659 460 199 1,319 281 3,408 756 418 338 2,565 88 20 1,529 506 349 157 813 211 1,900 882 630 252 890 128 21 6,818 2,392 1,764 628 2,115 2,311 7,271 4,204 2,358 1,847 2,734 333 22 1,101 270 211 59 240 591 1,890 848 735 113 766 276 23 6,717 3,125 2,504 621 2,064 1,528 4,085 2,350 1,981 369 1,422 313 24 32,391 12,567 9,133 3,434 6,620 13,205 32,373 20,733 15,655 5,077 10,124 1,517 25 6,421 3,252 1,771 1,481 1,952 1,216 8,271 4,776 2,018 2,758 3,006 489 26 2,992 1,096 571 525 1,223 673 4,227 1,792 822 970 2,180 256 27 12,023 5,158 2,367 2,791 3,752 3,114 12,405 8,204 3,968 4,236 3,484 717 28 4,732 2,160 777 1,384 1,390 1,181 6,500 3,453 1,175 2,278 2,677 370 29 14,695 7,004 3,857 3,147 3,963 3,729 21,244 10,674 5,481 5,194 9,494 1,075 30 9,825 1,448 390 1,057 4,664 3,713 9,593 1,598 1,287 310 7,376 620 31 7,209 3,938 1,380 2,558 1,959 1,312 7,458 4,464 2,037 2,427 2,676 317 32 10,202 4,406 1,975 2,430 4,071 1,726 8,286 3,205 2,368 837 4,323 759 33 4,841 1,761 975 786 1,851 1,228 6,018 2,636 885 1,751 3,124 259 34 30,023 13,389 12,921 468 11,154 5,480 32,912 15,540 13,827 1,714 16,784 587 35 9,233 7,953 7,067 887 493 787 6,713 4,891 4,763 128 1,280 542 36 3,446 781 490 291 2,276 389 6,004 1,522 1,071 451 4,128 354 40 240 152 150 1 0 88 537 194 173 21 186 157 Others 0 0 : : 0 0 1,158 171 : : 644 344 Unknown 5,016 2,803 : : 1,319 895 27 7 : : 17 3
.. = Confidential data: = not applicableNote: Column C-E total equals the sum of columns C-E manufacturing and C-E others

13�External Trade by Enterprise Characteristics – Results of the Standardisation exercise 2006
Tables II
Table 6.1: Arrivals by products (€ million) – Part 3
€ million
CPA
Reporting country and activity sectionIT CY
Total C-E total C-E manuf. C-E others G Others Total C-E total C-E
manuf. C-E others G Others
Total 145,218 68,817 : : 69,948 6,454 3,001 430 : : 1,853 719 01-05 4,124 1,157 : : 2,940 26 57 1 : : 31 24 10-14 1,929 1,748 645 1,102 180 2 6 2 0 2 2 2 15-16 14,533 7,148 6,365 783 7,152 233 347 68 67 1 180 99 17 2,479 1,742 942 800 714 23 59 11 2 9 36 12 18 1,532 472 298 174 1,047 13 141 5 4 1 105 31 19 1,165 516 446 70 645 4 44 3 2 1 35 6 20 1,738 1,126 966 160 573 40 59 14 10 3 38 7 21 3,693 2,620 1,470 1,149 1,046 27 78 33 11 22 32 13 22 647 239 181 59 306 101 52 2 1 0 39 12 23 1,031 486 129 357 513 32 161 34 .. .. 100 27 24 26,380 20,196 15,589 4,608 6,072 112 333 42 13 29 231 60 25 3,870 2,301 1,101 1,200 1,497 72 89 17 3 14 51 21 26 1,793 1,097 433 664 665 31 107 19 14 5 69 19 27 10,282 7,829 4,273 3,556 2,250 203 118 22 0 22 79 17 28 2,591 1,292 454 838 1,236 64 102 31 6 25 48 23 29 12,758 6,718 3,662 3,056 5,394 646 311 75 6 69 130 105 30 5,789 347 218 129 4,412 1,030 75 1 .. .. 50 24 31 4,875 2,508 1,344 1,164 2,230 137 84 26 3 23 41 16 32 7,433 2,132 1,484 647 3,865 1,436 156 5 .. .. 53 98 33 4,334 1,552 586 966 2,688 94 69 4 1 2 40 26 34 26,515 3,774 3,023 750 22,555 186 412 4 0 4 379 29 35 2,554 868 779 90 530 1,156 16 0 0 0 5 11 36 1,618 535 307 228 996 87 112 11 9 3 72 28 40 720 359 332 28 20 341 0 0 0 0 0 0 Others 833 54 : : 420 359 14 0 : : 5 9 Unknown 3 1 : : 1 1 0 0 : : 0 0
.. = Confidential data: = not applicableNote: Column C-E total equals the sum of columns C-E manufacturing and C-E others

140 External Trade by Enterprise Characteristics – Results of the Standardisation exercise 2006
TablesII
Table 6.1: Arrivals by products (€ million) – Part 4
€ million
CPA
Reporting country and activity sectionLU AT
Total C-E total C-E manuf. C-E others G Others Total C-E total C-E
manuf. C-E others G Others
Total 10,745 3,608 : : 5,662 1,475 54,333 20,580 : : 29,427 4,326 01-05 256 83 : : 158 15 1,324 328 : : 869 127 10-14 227 194 3 191 17 16 447 383 13 370 43 20 15-16 1,099 68 66 1 870 162 3,176 889 713 176 2,124 162 17 141 47 27 20 84 10 1,343 524 256 268 742 78 18 216 5 .. .. 200 11 1,701 103 89 14 1,495 102 19 73 1 0 1 68 5 733 164 136 28 520 49 20 106 22 10 12 39 44 529 228 172 56 269 33 21 274 197 .. .. 64 14 1,496 854 382 472 509 133 22 112 10 4 6 83 19 682 151 115 36 461 71 23 707 11 0 11 689 6 1,413 244 208 35 1,109 60 24 1,216 619 171 449 432 165 6,538 3,155 1,582 1,573 2,756 626 25 404 229 114 115 116 59 2,081 912 276 636 1,015 154 26 257 80 43 37 99 78 923 352 184 167 482 90 27 1,463 1,312 1,200 113 108 43 2,925 1,567 630 938 1,199 159 28 365 138 49 89 129 98 2,181 963 325 638 1,069 149 29 725 318 146 172 225 182 6,288 3,072 1,251 1,821 2,690 525 30 354 7 0 7 301 45 1,954 157 59 98 1,554 243 31 252 60 12 49 134 58 2,381 1,218 515 702 994 170 32 477 11 .. .. 380 86 2,588 716 537 179 1,630 242 33 163 31 18 13 76 56 1,514 457 92 364 921 136 34 1,272 22 3 19 1,080 169 7,883 2,334 2,054 280 5,187 362 35 97 2 .. .. 55 40 887 376 349 27 160 351 36 277 11 4 8 208 57 1,721 303 127 175 1,300 119 40 134 113 113 0 0 21 1,214 1,108 1,108 0 0 107 Others 78 15 : : 47 16 389 20 : : 315 55 Unknown 0 0 : : 0 0 23 7 : : 14 2
.. = Confidential data: = not applicableNote: Column C-E total equals the sum of columns C-E manufacturing and C-E others

141External Trade by Enterprise Characteristics – Results of the Standardisation exercise 2006
Tables II
Table 6.1: Arrivals by products (€ million) – Part 5
€ million
CPA
Reporting country and activity sectionFI SE
Total C-E total C-E manuf. C-E others G Others Total C-E total C-E
manuf. C-E others G Others
Total 22,838 8,112 : : 13,852 874 46,023 19,445 : : 23,057 3,521 01-05 554 85 : : 451 18 1,066 113 : : 852 101 10-14 847 739 2 737 107 1 1,460 275 16 259 1,180 5 15-16 1,475 451 386 66 1,009 14 3,423 1,149 992 157 2,193 80 17 477 216 63 153 248 14 683 282 80 202 376 26 18 510 20 13 6 483 7 648 16 12 4 622 10 19 184 26 15 12 156 2 305 33 23 11 264 8 20 118 27 14 13 60 30 284 136 73 63 139 10 21 505 296 166 130 205 4 954 581 456 125 328 45 22 164 36 31 6 114 14 317 115 101 14 157 44 23 407 170 83 87 236 1 1,638 423 241 182 1,194 20 24 3,298 1,351 723 628 1,904 43 5,466 2,452 1,570 882 2,610 404 25 747 290 80 210 436 21 1,813 906 185 721 827 80 26 351 186 85 101 153 11 672 375 163 212 259 37 27 1,214 742 330 412 457 14 3,272 2,209 1,314 895 918 144 28 605 238 56 182 341 27 1,329 701 130 571 550 78 29 2,953 979 407 572 1,828 147 5,288 2,777 1,406 1,370 2,216 295 30 1,202 21 5 16 1,130 52 2,337 70 13 57 1,260 1,007 31 1,023 419 202 216 580 24 2,130 968 234 734 1,062 100 32 1,855 1,084 969 115 712 59 2,550 866 663 202 1,367 317 33 637 133 62 70 458 46 1,421 529 148 381 812 80 34 2,736 461 293 168 2,216 60 6,378 3,408 3,232 177 2,878 92 35 328 16 12 4 85 227 744 186 178 8 147 411 36 446 74 36 38 355 17 981 262 199 63 672 47 40 35 35 35 0 0 0 590 590 590 0 0 0 Others 164 17 : : 127 20 276 25 : : 171 80 Unknown 1 0 : : 0 0 0 0 : : 0 0
.. = Confidential data: = not applicableNote: Column C-E total equals the sum of columns C-E manufacturing and C-E others

142 External Trade by Enterprise Characteristics – Results of the Standardisation exercise 2006
TablesII
Table 6.2: Imports by products (€ million) – Part 1
€ million
CPA
Reporting country and activity sectionBE CZ
Total C-E total C-E manuf. C-E others G Others Total C-E total C-E
manuf. C-E others G Others
Total 59,695 14,702 : : 15,677 29,316 45,236 25,295 : : 15,381 4,560 01-05 3,008 699 : : 766 1,543 870 355 : : 476 39 10-14 8,076 2,442 11 2,431 126 5,508 2,675 1,195 10 1,185 298 1,182 15-16 1,893 372 313 58 709 812 1,685 557 519 39 1,012 116 17 1,601 381 264 117 591 629 1,391 1,087 381 706 246 58 18 2,584 615 555 60 931 1,037 485 110 86 24 316 59 19 1,149 123 97 25 801 225 460 203 49 154 228 30 20 702 103 87 16 362 237 353 167 103 65 148 37 21 867 246 121 126 104 517 1,060 664 259 405 349 47 22 85 17 12 5 25 42 502 141 91 50 93 269 23 1,295 603 110 493 143 550 986 133 3 130 652 202 24 10,193 2,678 2,260 418 3,049 4,465 4,795 2,310 710 1,599 2,283 203 25 1,288 332 149 183 549 407 2,540 1,711 488 1,222 683 146 26 549 138 82 55 183 228 931 559 279 280 312 61 27 2,676 1,390 1,190 200 273 1,013 2,899 1,826 364 1,462 997 75 28 838 213 70 143 236 388 2,044 1,395 416 979 537 112 29 4,354 1,579 992 587 1,100 1,675 5,376 3,314 825 2,489 1,677 385 30 2,034 141 16 125 796 1,097 2,179 1,067 954 112 681 431 31 1,544 500 285 215 505 540 3,069 2,380 1,309 1,071 552 137 32 2,122 416 232 184 502 1,203 3,507 2,541 1,031 1,510 733 233 33 1,545 265 89 176 443 836 1,204 513 119 394 579 112 34 5,150 804 622 182 2,651 1,696 4,406 2,300 2,051 250 1,924 182 35 1,007 304 295 8 109 595 640 290 276 14 88 261 36 5,046 332 212 121 690 4,024 896 357 223 134 456 83 40 0 0 0 0 0 0 117 105 105 0 8 4 Others 91 10 : : 32 49 164 15 : : 51 97 Unknown 0 0 : : 0 0 0 0 : : 0 0
.. = Confidential data: = not applicableNote: Column C-E total equals the sum of columns C-E manufacturing and C-E others

143External Trade by Enterprise Characteristics – Results of the Standardisation exercise 2006
Tables II
Table 6.2: Imports by products (€ million) – Part 2
€ million
CPA
Reporting country and activity sectionDK EE
Total C-E total C-E manuf. C-E others G Others Total C-E total C-E
manuf. C-E others G Others
Total 15,691 4,412 : : 7,952 3,327 5,628 2,260 : : 2,679 690 01-05 873 242 : : 347 284 190 90 : : 78 22 10-14 1,070 333 7 326 727 10 90 82 1 81 7 1 15-16 1,851 448 439 9 978 425 429 108 106 2 286 34 17 481 120 81 40 310 51 275 214 82 133 53 9 18 1,253 209 173 36 932 112 103 28 25 2 69 7 19 234 83 77 6 124 27 80 34 24 10 43 2 20 418 90 47 43 282 46 117 60 44 16 50 7 21 67 24 11 13 24 19 115 50 19 31 63 2 22 54 14 10 4 25 15 27 6 4 3 14 8 23 35 30 0 30 3 1 228 6 0 6 215 7 24 921 329 213 116 366 227 483 187 84 104 261 34 25 281 100 50 50 147 34 247 116 38 78 119 12 26 179 57 18 39 86 36 112 33 24 9 73 6 27 633 321 194 127 163 149 303 165 13 152 127 11 28 470 208 52 157 197 65 224 102 18 85 102 20 29 1,082 470 283 187 410 203 528 153 20 133 278 97 30 635 34 10 25 537 63 116 17 13 4 82 16 31 440 173 75 98 192 75 395 282 89 192 99 14 32 617 137 99 38 389 90 523 398 373 25 98 27 33 459 224 113 111 164 71 106 43 24 19 51 12 34 423 47 24 23 339 36 508 44 33 11 413 51 35 1,038 46 39 7 78 914 298 14 12 2 26 258 36 852 190 169 21 470 192 104 25 16 9 68 11 40 6 6 6 0 0 0 2 2 2 0 0 0 Others 22 1 : : 12 8 26 1 : : 4 21 Unknown 1,297 476 : : 650 172 0 0 : : 0 0
.. = Confidential data: = not applicableNote: Column C-E total equals the sum of columns C-E manufacturing and C-E others

144 External Trade by Enterprise Characteristics – Results of the Standardisation exercise 2006
TablesII
Table 6.2: Imports by products (€ million) – Part 3
€ million
CPA
Reporting country and activity sectionFR IT
Total C-E total C-E manuf. C-E others G Others Total C-E total C-E
manuf. C-E others G Others
Total 101,319 60,398 : : 31,473 9,448 109,189 70,427 : : 32,303 6,459 01-05 3,104 1,132 : : 1,499 473 4,134 2,317 : : 1,793 24 10-14 15,895 15,772 45 15,727 77 45 25,476 20,786 9,394 11,391 4,601 89 15-16 4,512 1,564 1,419 145 2,593 355 3,977 1,889 1,441 448 2,005 83 17 2,613 986 526 460 1,472 155 4,348 3,052 2,163 889 1,251 45 18 5,903 2,419 2,085 334 3,133 351 5,401 3,648 3,033 615 1,648 105 19 1,838 673 437 236 977 188 4,941 3,605 3,286 318 1,297 40 20 894 289 219 70 519 87 1,620 1,028 866 162 570 22 21 1,117 769 597 172 257 91 1,773 1,601 1,371 230 154 18 22 337 98 68 30 135 104 99 44 23 21 46 10 23 4,379 2,850 2,185 665 664 865 3,702 3,269 1,199 2,070 421 12 24 10,931 7,243 6,286 957 2,964 724 9,115 6,827 5,677 1,150 2,162 126 25 2,162 1,124 582 541 830 208 1,680 957 416 541 682 41 26 923 460 253 208 409 54 1,073 594 312 282 451 29 27 2,999 2,228 1,579 649 606 164 9,452 5,281 3,686 1,595 1,531 2,640 28 1,719 890 306 584 632 197 1,568 948 422 526 531 88 29 6,680 3,596 1,910 1,685 2,392 692 6,685 4,376 2,708 1,669 1,963 345 30 4,151 2,133 1,620 513 1,815 204 1,578 471 335 136 883 225 31 4,263 2,926 1,408 1,518 884 453 2,496 1,755 874 880 606 135 32 7,031 3,352 2,676 676 3,042 637 3,572 1,220 656 564 2,215 137 33 4,542 2,047 1,216 831 1,623 872 3,062 1,369 624 744 1,614 79 34 4,695 2,313 1,963 350 2,230 152 6,056 2,279 1,888 392 3,758 18 35 6,687 4,363 4,303 60 459 1,865 3,605 1,428 1,319 108 473 1,704 36 3,511 1,092 835 257 2,127 293 2,536 904 575 329 1,541 90 40 54 39 39 0 12 3 1,065 687 573 115 51 327 Others 374 40 : : 124 211 91 22 : : 44 25 Unknown 7 0 : : 1 6 84 70 : : 12 2
.. = Confidential data: = not applicableNote: Column C-E total equals the sum of columns C-E manufacturing and C-E others

14�External Trade by Enterprise Characteristics – Results of the Standardisation exercise 2006
Tables II
Table 6.2: Imports by products (€ million) – Part 4
€ million
CPA
Reporting country and activity sectionCY LV
Total C-E total C-E manuf. C-E others G Others Total C-E total C-E
manuf. C-E others G Others
Total 1,350 185 : : 802 364 4,547 1,320 : : 2,666 561 01-05 63 4 : : 42 17 151 51 : : 91 9 10-14 77 1 0 1 0 76 145 129 0 129 10 7 15-16 87 17 16 1 27 44 446 96 93 2 342 9 17 29 4 1 3 20 5 203 151 38 113 40 13 18 42 2 1 1 30 10 87 24 23 1 59 4 19 26 2 2 1 19 4 43 5 1 4 37 1 20 26 5 3 2 15 7 87 42 34 9 39 6 21 16 8 6 3 5 3 144 65 21 45 72 7 22 4 0 0 0 3 2 34 6 5 1 16 12 23 262 69 .. .. 186 7 256 13 .. .. 221 22 24 90 22 10 12 42 26 525 130 50 79 382 14 25 37 6 2 4 25 6 183 55 13 42 112 16 26 26 5 4 2 13 7 128 37 10 26 78 13 27 90 7 0 7 61 23 263 138 81 57 108 17 28 30 6 1 4 16 8 172 43 12 31 106 23 29 102 11 2 9 55 37 482 155 13 143 230 97 30 46 0 .. .. 32 14 119 5 .. .. 102 12 31 35 10 1 9 15 10 176 66 36 30 82 28 32 50 0 .. .. 33 16 159 6 4 2 95 58 33 30 2 1 1 14 14 83 9 3 6 61 13 34 167 1 0 0 147 20 377 15 4 12 268 93 35 11 0 0 0 6 5 76 7 5 2 15 54 36 61 6 5 1 37 18 136 20 6 15 85 30 40 0 0 0 0 0 0 52 52 52 0 0 0 Others 3 0 : : 2 1 19 0 : : 15 4 Unknown 0 0 : : 0 0 0 0 : : 0 0
.. = Confidential data: = not applicableNote: Column C-E total equals the sum of columns C-E manufacturing and C-E others

146 External Trade by Enterprise Characteristics – Results of the Standardisation exercise 2006
TablesII
Table 6.2: Imports by products (€ million) – Part 5
€ million
CPA
Reporting country and activity sectionLT LU
Total C-E total C-E manuf. C-E others G Others Total C-E total C-E
manuf. C-E others G Others
Total 8,239 3,854 : : 3,681 705 1,056 530 : : 297 229 01-05 186 53 : : 124 9 66 35 : : 26 5 10-14 1,505 1,479 1 1,478 24 1 0 0 .. .. 0 0 15-16 513 171 163 8 328 14 11 0 0 0 10 0 17 514 421 125 295 87 7 13 8 8 1 5 0 18 100 34 29 5 64 3 30 29 0 29 1 0 19 62 16 5 11 46 1 1 1 0 1 1 0 20 133 66 41 25 63 4 1 0 .. .. 1 1 21 163 73 22 51 88 2 6 4 .. .. 2 0 22 40 6 3 3 14 20 7 1 0 0 5 1 23 61 12 .. .. 43 7 0 0 0 0 0 0 24 903 273 53 221 609 20 163 153 67 86 9 2 25 296 101 27 74 185 10 71 64 39 25 4 3 26 149 29 8 21 111 9 30 27 25 2 1 2 27 279 96 .. .. 160 23 44 37 29 8 7 0 28 224 63 8 55 138 22 23 14 3 11 8 1 29 716 233 33 200 373 110 155 125 74 51 24 7 30 171 5 2 2 145 21 15 4 0 4 7 5 31 313 154 93 61 136 23 121 10 0 10 102 9 32 287 63 50 13 147 77 67 4 .. .. 54 9 33 125 26 8 18 82 17 10 3 1 2 5 2 34 794 26 10 16 624 145 18 0 0 0 15 2 35 554 415 411 4 13 126 181 3 .. .. 4 174 36 123 37 15 22 73 12 16 8 0 8 6 2 40 0 0 0 0 0 0 0 0 0 0 0 0 Others 7 1 : : 5 1 6 0 : : 2 4 Unknown 21 0 : : 1 21 0 0 : : 0 0
.. = Confidential data: = not applicableNote: Column C-E total equals the sum of columns C-E manufacturing and C-E others

147External Trade by Enterprise Characteristics – Results of the Standardisation exercise 2006
Tables II
Table 6.2: Imports by products (€ million) – Part 6
€ million
CPA
Reporting country and activity sectionHU AT
Total C-E total C-E manuf. C-E others G Others Total C-E total C-E
manuf. C-E others G Others
Total 42,263 27,593 : : 13,130 1,540 25,298 12,095 : : 7,411 5,792 01-05 463 146 : : 268 49 605 320 : : 233 51 10-14 2,608 1,504 4 1,500 1,099 5 2,929 2,783 11 2,772 43 103 15-16 1,105 382 367 15 686 36 622 242 201 41 292 88 17 1,282 978 206 772 281 24 501 250 167 83 202 49 18 535 276 247 29 232 28 657 344 330 14 276 38 19 572 374 237 137 185 13 446 273 229 44 140 32 20 427 148 92 56 248 30 450 185 150 35 240 26 21 948 649 334 315 279 20 666 209 162 47 310 147 22 186 96 34 62 72 18 86 29 20 9 45 12 23 609 325 229 96 269 15 674 69 25 44 523 82 24 3,834 1,811 813 998 1,950 73 1,962 1,342 1,048 294 517 102 25 1,776 1,265 277 988 440 70 681 391 221 170 238 52 26 771 407 137 270 322 42 313 184 132 52 109 20 27 1,726 1,273 387 886 381 72 1,335 605 384 222 375 354 28 1,557 1,013 114 899 476 68 918 543 301 242 294 81 29 4,842 3,220 527 2,694 1,419 202 1,908 1,221 545 676 538 149 30 1,810 1,152 723 429 529 129 661 150 104 45 202 309 31 2,822 2,386 998 1,388 368 68 1,472 911 683 228 343 219 32 6,827 6,151 5,002 1,150 521 154 2,726 723 630 93 392 1,611 33 944 535 70 465 318 91 677 265 91 174 327 85 34 5,135 2,736 2,690 45 2,259 141 2,406 494 392 101 1,282 630 35 254 75 53 21 59 120 1,592 105 84 21 67 1,420 36 690 260 59 201 389 41 817 293 178 115 405 119 40 227 212 208 4 13 2 161 156 156 0 0 5 Others 115 30 : : 58 27 35 8 : : 18 8 Unknown 198 189 : : 7 2 0 0 : : 0 0
.. = Confidential data: = not applicableNote: Column C-E total equals the sum of columns C-E manufacturing and C-E others

148 External Trade by Enterprise Characteristics – Results of the Standardisation exercise 2006
TablesII
Table 6.2: Imports by products (€ million) – Part 7
€ million
CPA
Reporting country and activity sectionPL SI
Total C-E total C-E manuf. C-E others G Others Total C-E total C-E
manuf. C-E others G Others
Total 60,129 33,457 : : 23,577 3,096 12,111 6,294 : : 5,030 787 01-05 1,384 451 : : 857 77 279 121 : : 156 2 10-14 4,681 4,348 2 4,346 300 32 221 53 3 50 164 3 15-16 2,470 1,299 1,190 109 1,142 28 552 217 177 40 331 5 17 2,796 1,974 499 1,475 773 49 353 263 152 111 81 9 18 701 164 125 39 503 34 302 151 140 11 145 6 19 803 422 201 221 371 10 342 267 157 111 74 1 20 495 316 144 172 163 17 183 115 46 69 61 6 21 1,929 1,389 526 863 515 26 363 260 160 101 98 5 22 259 110 68 42 96 53 53 19 11 8 28 6 23 1,230 138 61 77 1,005 87 675 63 1 62 590 22 24 8,275 4,028 1,831 2,196 4,055 192 1,570 948 496 452 562 59 25 2,946 1,753 497 1,257 1,090 103 490 309 94 215 152 29 26 1,151 648 276 372 464 39 303 174 54 119 103 26 27 3,262 2,173 359 1,814 1,027 62 1,111 802 263 540 268 41 28 2,619 1,510 372 1,138 1,004 104 499 294 64 231 160 44 29 6,894 4,237 891 3,346 2,187 470 1,335 813 250 563 375 147 30 1,517 162 117 45 1,171 183 270 46 24 22 146 79 31 2,379 1,626 786 840 653 100 614 390 137 252 177 48 32 3,221 1,337 841 496 1,138 747 354 146 102 43 154 55 33 1,095 421 105 316 577 97 242 95 32 63 125 22 34 6,757 2,692 2,503 188 3,786 280 1,465 531 486 45 884 50 35 1,983 1,683 1,520 163 100 201 118 43 40 3 39 35 36 1,098 507 282 225 548 43 276 111 25 86 140 25 40 61 44 44 0 15 2 116 57 13 44 7 52 Others 82 26 : : 36 20 25 6 : : 11 8 Unknown 41 0 : : 0 41 0 0 : : 0 0
.. = Confidential data: = not applicableNote: Column C-E total equals the sum of columns C-E manufacturing and C-E others

14�External Trade by Enterprise Characteristics – Results of the Standardisation exercise 2006
Tables II
Table 6.2: Imports by products (€ million) – Part 8
€ million
CPA
Reporting country and activity sectionSK FI
Total C-E total C-E manuf. C-E others G Others Total C-E total C-E
manuf. C-E others G Others
Total 19,906 12,838 : : 5,860 1,209 12,875 8,570 : : 3,966 340 01-05 297 105 : : 150 42 715 478 : : 226 11 10-14 2,263 2,170 1 2,169 89 4 3,241 2,631 1 2,630 566 44 15-16 775 212 162 50 530 33 265 130 125 5 134 1 17 795 629 158 471 125 41 183 68 23 45 111 4 18 192 56 31 25 110 26 318 126 121 5 185 7 19 297 217 172 45 72 9 92 33 26 8 58 1 20 177 103 41 62 65 8 228 119 69 50 99 10 21 467 325 158 167 133 9 86 48 23 25 38 1 22 85 18 11 8 51 16 43 21 7 15 18 3 23 298 139 39 99 156 3 673 387 299 87 283 3 24 1,807 803 282 521 916 88 816 506 385 120 301 9 25 1,108 805 108 697 245 58 175 63 31 31 103 9 26 362 172 71 101 166 25 105 52 30 22 46 6 27 962 654 297 357 261 47 1,046 745 619 126 294 7 28 918 616 96 520 239 64 202 89 17 72 102 11 29 1,933 1,235 337 898 552 146 617 300 153 146 293 24 30 404 85 36 49 254 65 113 25 3 22 77 11 31 1,241 1,008 491 517 189 44 829 698 166 532 118 12 32 948 563 384 179 206 180 1,615 1,483 1,447 36 108 24 33 508 310 25 285 168 29 242 118 67 51 105 20 34 3,234 2,182 2,097 86 961 91 537 68 45 23 457 12 35 267 88 72 16 32 147 182 42 18 25 44 95 36 423 232 171 61 169 22 260 57 39 19 192 10 40 108 108 108 0 0 0 270 270 270 0 0 0 Others 38 4 : : 21 13 22 12 : : 6 4 Unknown 0 0 : : 0 0 0 0 : : 0 0
.. = Confidential data: = not applicableNote: Column C-E total equals the sum of columns C-E manufacturing and C-E others

1�0 External Trade by Enterprise Characteristics – Results of the Standardisation exercise 2006
TablesII
Table 6.2: Imports by products (€ million) – Part 9
€ million
CPA
Reporting country and activity sectionSE NO
Total C-E total C-E manuf. C-E others G Others Total C-E total C-E
manuf. C-E others G Others
Total 23,253 8,778 : : 11,332 3,143 32,723 8,875 : : 19,551 4,298 01-05 775 251 : : 304 221 1,013 335 : : 618 60 10-14 3,143 512 201 311 2,626 5 221 125 29 96 86 9 15-16 823 345 318 27 463 15 1,949 737 695 42 1,036 176 17 626 108 50 59 490 28 744 159 74 85 552 33 18 1,136 118 104 14 982 36 1,106 43 29 15 1,031 32 19 266 16 6 10 222 27 424 55 11 44 354 15 20 440 192 123 69 201 47 773 288 244 44 395 90 21 238 178 109 69 47 12 805 270 176 94 516 19 22 128 41 33 8 62 25 441 113 102 11 253 75 23 776 302 45 257 474 0 768 502 0 502 264 2 24 1,536 908 736 172 548 80 3,263 1,222 710 512 1,702 339 25 562 217 70 147 293 52 1,137 337 79 258 755 45 26 252 95 33 62 123 34 563 205 104 101 313 45 27 1,023 790 531 259 206 27 2,106 1,522 1,014 508 463 121 28 670 286 107 179 324 59 1,234 430 95 335 679 126 29 1,921 1,019 635 384 617 285 3,886 1,201 380 821 2,304 381 30 488 98 35 63 233 157 1,631 72 16 56 1,323 236 31 1,178 565 270 295 441 171 1,187 325 137 187 700 162 32 2,210 1,139 931 208 749 321 1,505 153 104 49 1,074 278 33 901 396 248 148 342 163 1,047 199 104 95 734 114 34 1,664 497 404 93 623 543 2,989 117 69 47 2,747 125 35 1,190 268 253 15 162 760 1,810 305 269 35 294 1,212 36 990 183 143 40 762 45 1,428 145 109 36 1,221 61 40 245 245 245 0 0 0 501 7 7 0 0 494 Others 73 8 : : 36 29 186 7 : : 132 47 Unknown 0 0 : : 0 0 6 0 : : 6 1
.. = Confidential data: = not applicableNote: Column C-E total equals the sum of columns C-E manufacturing and C-E others

1�1External Trade by Enterprise Characteristics – Results of the Standardisation exercise 2006
Tables II
Table 6.3: Dispatches by products (€ million) – Part 1
€ million
CPA
Reporting country and activity sectionBE DK
Total C-E total C-E manuf. C-E others G Others Total C-E total C-E
manuf. C-E others G Others
Total 164,394 72,487 : : 34,089 57,818 38,823 23,900 : : 9,466 5,457 01-05 3,624 158 : : 1,753 1,713 1,717 187 : : 1,014 515 10-14 4,282 1,304 199 1,105 139 2,839 2,761 2,553 2,101 451 44 164 15-16 13,686 8,720 8,634 86 3,367 1,599 6,903 4,762 4,753 10 1,155 986 17 4,787 3,088 2,859 229 889 811 722 368 306 63 278 75 18 3,810 915 848 67 1,746 1,149 1,355 203 169 34 987 166 19 2,515 305 183 122 1,727 483 210 112 109 3 75 23 20 1,582 1,016 971 45 321 245 579 303 286 17 208 68 21 3,429 2,015 1,778 237 273 1,141 430 251 232 19 129 50 22 1,184 830 786 44 164 190 246 113 97 16 43 89 23 5,746 3,086 2,823 264 893 1,766 15 3 2 1 11 1 24 40,645 14,086 11,636 2,450 5,487 21,072 3,880 2,941 2,588 353 548 391 25 5,321 3,220 2,291 929 1,125 976 1,334 1,005 922 83 181 148 26 3,006 2,107 1,928 179 397 502 498 309 205 104 85 103 27 10,484 7,584 6,586 998 786 2,114 1,148 630 442 188 308 210 28 3,205 1,966 1,386 580 514 725 1,138 729 556 173 263 145 29 11,159 5,000 2,794 2,206 2,290 3,870 3,766 2,822 2,611 211 406 538 30 3,811 360 79 281 1,558 1,892 817 67 45 22 618 132 31 3,652 1,429 1,043 386 960 1,263 1,400 918 777 141 231 251 32 4,725 1,261 620 641 1,439 2,025 1,950 782 737 45 996 171 33 2,697 581 263 318 555 1,561 1,219 944 606 338 90 185 34 25,308 11,576 10,868 708 6,222 7,511 1,183 459 391 68 464 260 35 1,571 564 505 59 137 870 351 140 120 20 61 150 36 3,675 1,049 775 274 1,197 1,430 2,005 1,238 1,170 68 409 358 40 249 217 206 11 0 32 248 241 241 0 4 2 Others 241 51 : : 151 39 73 13 : : 32 28 Unknown 0 0 : : 0 0 2,877 1,805 : : 824 248
.. = Confidential data: = not applicableNote: Column C-E total equals the sum of columns C-E manufacturing and C-E others

1�2 External Trade by Enterprise Characteristics – Results of the Standardisation exercise 2006
TablesII
Table 6.3: Dispatches by products (€ million) – Part 2
€ million
CPA
Reporting country and activity sectionDE FR
Total C-E total C-E manuf. C-E others G Others Total C-E total C-E
manuf. C-E others G Others
Total 290,168 186,550 : : 41,045 62,572 200,749 145,244 : : 42,521 12,985 01-05 2,527 214 : : 1,883 430 8,232 305 : : 6,873 1,054 10-14 1,460 725 399 326 157 579 402 355 272 83 41 6 15-16 16,777 10,489 10,288 202 3,676 2,611 20,286 13,726 13,412 314 5,485 1,075 17 4,428 2,344 1,834 510 1,088 995 3,896 2,979 2,510 468 830 88 18 4,322 1,567 1,427 141 1,988 767 3,420 1,636 1,453 183 1,521 263 19 1,363 533 468 65 570 260 1,368 650 428 222 565 153 20 2,121 1,321 1,247 74 456 344 1,350 1,068 996 72 220 62 21 6,682 4,554 4,062 492 574 1,554 4,748 4,151 3,827 324 549 49 22 2,206 954 669 285 335 916 1,182 858 698 160 208 116 23 1,832 740 622 117 388 705 3,798 2,924 2,715 209 804 69 24 36,534 20,030 17,615 2,415 2,584 13,920 32,281 23,830 21,468 2,362 6,456 1,995 25 10,810 7,478 5,594 1,884 1,168 2,164 7,418 6,527 5,320 1,207 698 192 26 4,245 2,375 1,913 462 473 1,396 3,056 2,672 2,171 501 281 103 27 14,604 6,358 4,912 1,446 2,493 5,753 12,462 11,078 9,198 1,880 1,144 241 28 9,920 6,691 4,541 2,150 1,215 2,014 4,614 4,033 2,531 1,501 384 197 29 34,045 22,533 15,284 7,249 3,604 7,907 15,570 12,940 8,880 4,061 1,907 722 30 8,272 2,650 1,936 713 4,158 1,465 4,341 1,356 1,168 188 2,830 154 31 13,638 9,483 4,267 5,216 2,195 1,960 7,685 6,713 4,605 2,108 780 192 32 11,825 6,014 2,565 3,449 4,656 1,155 7,186 4,102 3,519 584 2,810 274 33 10,254 6,120 3,346 2,774 1,662 2,472 5,232 3,558 1,960 1,599 1,134 539 34 65,630 54,188 52,161 2,026 2,476 8,967 38,063 29,936 27,877 2,060 3,884 4,243 35 13,010 11,840 9,962 1,878 454 716 8,502 6,341 6,131 211 1,569 592 36 5,926 2,986 2,297 689 1,696 1,244 3,182 2,092 1,529 563 854 236 40 343 158 158 0 0 185 1,897 1,287 1,262 25 437 174 Others 0 0 : : 0 0 557 114 : : 247 196 Unknown 7,392 4,205 : : 1,097 2,090 23 12 : : 11 1
.. = Confidential data: = not applicableNote: Column C-E total equals the sum of columns C-E manufacturing and C-E others

1�3External Trade by Enterprise Characteristics – Results of the Standardisation exercise 2006
Tables II
Table 6.3: Dispatches by products (€ million) – Part 3
€ million
CPA
Reporting country and activity sectionIT CY
Total C-E total C-E manuf. C-E others G Others Total C-E total C-E
manuf. C-E others G Others
Total 139,027 121,972 : : 15,423 1,632 417 88 : : 105 224 01-05 2,295 274 : : 2,008 12 77 1 : : 47 29 10-14 310 226 117 110 36 48 5 2 1 1 2 1 15-16 9,098 7,522 7,344 178 1,441 135 44 29 28 1 9 6 17 7,473 6,838 5,793 1,045 622 13 5 3 3 0 2 1 18 5,375 4,448 3,679 769 889 38 10 3 3 0 4 3 19 5,348 4,607 4,395 212 720 21 2 0 0 0 1 0 20 710 638 521 117 69 4 0 0 0 0 0 0 21 3,003 2,862 2,475 388 137 3 5 4 3 2 1 0 22 1,147 1,090 971 119 39 18 6 0 0 0 5 1 23 2,418 2,225 1,511 715 192 1 33 0 0 0 0 33 24 14,378 12,518 11,681 837 1,801 59 42 5 4 1 5 32 25 6,607 6,259 5,033 1,226 325 23 6 5 4 0 1 1 26 4,416 3,979 3,619 360 416 21 7 5 5 0 1 1 27 6,713 6,210 5,201 1,009 440 63 22 9 0 9 1 11 28 6,578 6,260 4,394 1,866 278 40 3 1 1 1 1 1 29 24,974 23,333 18,794 4,539 1,495 147 15 6 2 4 3 6 30 1,455 814 416 398 534 106 15 0 .. .. 2 13 31 4,979 4,668 3,560 1,108 273 38 4 1 1 1 2 1 32 2,805 1,916 1,571 345 777 112 38 7 .. .. 4 27 33 2,796 2,354 1,616 738 410 33 22 0 0 0 6 16 34 14,910 13,313 10,747 2,565 1,478 119 83 1 0 0 53 29 35 3,641 3,047 2,783 264 166 428 36 2 .. .. 0 35 36 7,323 6,457 5,381 1,075 818 49 12 4 3 1 3 5 40 13 1 0 0 1 11 0 0 .. .. 0 0 Others 178 86 : : 16 75 1 0 : : 0 1 Unknown 85 27 : : 40 18 0 0 : : 0 0
.. = Confidential data: = not applicableNote: Column C-E total equals the sum of columns C-E manufacturing and C-E others

1�4 External Trade by Enterprise Characteristics – Results of the Standardisation exercise 2006
TablesII
Table 6.3: Dispatches by products (€ million) – Part 4
€ million
CPA
Reporting country and activity sectionLU AT
Total C-E total C-E manuf. C-E others G Others Total C-E total C-E
manuf. C-E others G Others
Total 7,212 5,223 : : 1,558 430 46,294 35,811 : : 7,912 2,571 01-05 87 2 : : 76 9 491 111 : : 343 38 10-14 10 2 1 0 8 1 243 230 162 68 5 7 15-16 495 291 291 0 117 88 2,967 1,575 1,549 26 1,160 233 17 280 267 132 135 11 1 1,069 878 797 82 162 29 18 88 64 0 64 21 4 742 516 466 50 214 13 19 11 0 0 0 10 1 605 407 371 36 173 26 20 139 128 127 1 9 2 1,902 1,515 1,482 33 311 77 21 215 205 .. .. 6 4 2,426 1,907 1,819 89 480 38 22 54 43 41 2 9 2 413 305 276 29 60 48 23 5 0 0 0 4 0 40 23 13 10 13 4 24 654 528 449 78 112 14 3,613 2,970 2,672 298 474 170 25 829 786 728 58 28 15 1,569 1,372 1,007 365 118 79 26 354 324 319 4 28 2 757 680 606 74 59 19 27 1,725 1,628 1,550 77 91 6 3,710 3,330 2,871 459 302 78 28 247 211 96 116 27 9 2,088 1,739 1,302 437 211 138 29 520 351 276 74 80 88 5,430 4,542 3,795 747 544 344 30 139 5 0 5 124 10 823 457 377 80 271 96 31 226 70 30 40 118 38 2,406 1,927 1,521 406 256 223 32 351 53 .. .. 292 6 2,333 1,519 1,435 84 598 216 33 89 67 64 3 19 2 864 612 406 206 166 86 34 448 60 17 42 307 82 6,737 4,946 4,198 748 1,488 304 35 66 3 .. .. 24 39 1,096 926 795 131 20 150 36 41 23 1 23 16 2 1,749 1,254 651 602 398 96 40 32 32 32 0 0 0 1,277 1,249 1,249 0 0 29 Others 105 79 : : 20 6 939 823 : : 85 30 Unknown 0 0 : : 0 0 3 1 : : 2 0
.. = Confidential data: = not applicableNote: Column C-E total equals the sum of columns C-E manufacturing and C-E others

1��External Trade by Enterprise Characteristics – Results of the Standardisation exercise 2006
Tables II
Table 6.3: Dispatches by products (€ million) – Part 5
€ million
CPA
Reporting country and activity sectionFI SE
Total C-E total C-E manuf. C-E others G Others Total C-E total C-E
manuf. C-E others G Others
Total 24,282 23,082 : : 978 222 46,510 37,144 : : 6,782 2,532 01-05 135 6 : : 118 10 552 56 : : 172 324 10-14 67 66 55 11 1 0 394 372 361 11 17 4 15-16 387 347 324 23 40 1 1,304 866 852 14 189 248 17 189 179 162 17 10 0 490 304 266 38 173 13 18 82 63 61 2 18 1 397 59 50 10 322 16 19 40 35 34 1 5 0 133 54 41 13 66 13 20 1,709 1,677 1,663 13 30 2 2,020 1,737 1,696 41 247 36 21 5,906 5,878 5,827 51 27 0 5,981 5,718 5,650 68 97 165 22 154 139 129 10 2 13 128 72 53 19 45 10 23 1,143 1,114 1,106 8 17 11 2,037 341 283 58 1,648 48 24 1,409 1,223 1,135 88 177 8 5,174 3,958 3,832 126 598 618 25 500 454 367 87 46 1 1,186 964 629 336 169 52 26 325 316 296 19 4 5 357 309 244 65 33 15 27 2,755 2,545 2,405 140 206 4 4,012 3,744 3,163 581 179 88 28 444 429 254 176 11 3 1,501 1,300 593 707 185 16 29 1,931 1,800 1,624 176 81 50 5,997 5,324 4,558 766 540 133 30 70 32 5 27 30 8 511 163 90 73 280 68 31 915 899 764 135 13 3 1,326 938 583 355 314 74 32 3,777 3,760 3,698 62 13 4 2,390 1,733 1,594 138 551 106 33 520 489 351 139 20 11 1,459 966 770 196 374 120 34 758 684 526 158 71 3 7,235 6,994 6,609 385 183 58 35 574 493 463 30 8 73 763 472 444 28 29 261 36 231 212 177 34 18 1 939 596 455 142 322 20 40 237 237 237 0 0 0 63 63 63 0 0 0 Others 26 5 : : 11 9 111 38 : : 48 25 Unknown 0 0 : : 0 0 52 0 : : 35 17
.. = Confidential data: = not applicableNote: Column C-E total equals the sum of columns C-E manufacturing and C-E others

1�6 External Trade by Enterprise Characteristics – Results of the Standardisation exercise 2006
TablesII
Table 6.4: Exports by products (€ million) – Part 1
€ million
CPA
Reporting country and activity sectionBE CZ
Total C-E total C-E manuf. C-E others G Others Total C-E total C-E
manuf. C-E others G Others
Total 57,761 23,012 : : 7,031 27,718 43,053 36,443 : : 4,654 1,956 01-05 307 21 : : 208 78 491 154 : : 310 27 10-14 6,205 34 14 20 3 6,167 423 202 174 29 214 7 15-16 2,285 1,268 1,219 48 506 511 1,242 909 887 22 256 77 17 1,647 1,322 1,074 247 197 129 1,533 1,411 1,124 287 94 28 18 263 145 123 22 90 28 560 474 435 39 54 32 19 231 126 41 85 73 32 206 172 132 40 31 3 20 300 262 253 9 19 20 699 589 550 39 72 38 21 490 282 199 84 48 159 870 798 736 62 46 26 22 90 55 36 20 14 20 611 253 199 55 57 300 23 2,611 1,352 1,297 55 906 353 465 255 223 32 181 29 24 19,421 6,485 5,948 537 1,561 11,375 2,313 1,864 1,681 183 385 63 25 1,125 796 511 286 175 154 2,161 1,884 1,527 357 143 134 26 522 406 363 43 53 63 1,769 1,393 1,276 117 316 60 27 2,357 1,754 1,433 321 266 337 2,401 1,288 873 415 905 209 28 660 416 247 169 66 178 2,866 2,451 1,605 845 264 151 29 5,327 3,006 1,927 1,079 717 1,604 5,392 4,691 2,483 2,208 465 236 30 774 266 14 252 192 316 2,730 2,459 2,297 162 169 101 31 1,160 613 376 237 241 306 3,789 3,490 2,658 832 197 102 32 1,013 531 349 182 208 274 2,166 2,000 1,716 285 62 104 33 761 246 127 118 200 315 681 559 329 230 77 46 34 5,544 2,963 2,893 70 1,056 1,526 6,975 6,791 6,036 755 133 52 35 368 297 277 20 17 54 596 481 428 52 69 47 36 4,216 341 176 165 191 3,684 1,660 1,455 1,046 409 136 70 40 0 0 0 0 0 0 391 383 383 0 6 1 Others 86 23 : : 25 37 63 38 : : 11 13 Unknown 0 0 : : 0 0 0 0 : : 0 0
.. = Confidential data: = not applicableNote: Column C-E total equals the sum of columns C-E manufacturing and C-E others

1�7External Trade by Enterprise Characteristics – Results of the Standardisation exercise 2006
Tables II
Table 6.4: Exports by products (€ million) – Part 2
€ million
CPA
Reporting country and activity sectionDK EE
Total C-E total C-E manuf. C-E others G Others Total C-E total C-E
manuf. C-E others G Others
Total 19,739 12,719 : : 4,825 2,195 4,000 3,322 : : 485 193 01-05 609 58 : : 505 46 146 10 : : 84 52 10-14 288 122 119 2 2 164 39 30 30 1 9 1 15-16 3,383 2,292 2,285 7 972 119 281 218 217 1 41 22 17 434 286 108 178 114 34 287 266 238 28 13 8 18 322 74 60 13 194 55 254 238 221 17 11 6 19 133 79 75 4 44 11 58 51 48 3 7 0 20 135 53 44 9 74 8 547 448 411 36 69 31 21 187 121 105 16 57 10 59 47 42 5 12 1 22 122 77 63 14 22 23 27 20 11 9 5 1 23 9 2 2 0 1 6 20 11 11 0 9 0 24 3,279 2,805 2,484 320 385 89 212 163 153 10 22 27 25 473 341 280 61 96 36 101 83 59 24 15 4 26 197 116 90 26 63 18 72 65 61 4 6 1 27 278 202 98 104 55 21 187 134 16 119 50 2 28 526 320 238 82 162 44 157 136 71 65 15 6 29 3,012 2,175 1,929 247 472 365 159 129 58 70 23 7 30 352 71 45 27 228 52 12 4 0 4 5 3 31 686 448 313 135 145 93 232 216 134 82 13 3 32 548 200 151 49 279 69 605 596 557 39 8 2 33 1,093 901 712 190 85 106 84 77 48 30 6 1 34 531 219 84 135 227 86 140 107 82 24 25 8 35 506 156 128 28 36 314 34 20 14 6 8 6 36 908 644 607 37 184 79 241 211 194 17 27 2 40 110 4 4 0 0 106 41 41 41 0 0 0 Others 56 4 : : 30 22 4 1 : : 2 1 Unknown 1,560 948 : : 394 218 0 0 : : 0 0.. = Confidential data: = not applicableNote: Column C-E total equals the sum of columns C-E manufacturing and C-E others

1�8 External Trade by Enterprise Characteristics – Results of the Standardisation exercise 2006
TablesII
Table 6.4: Exports by products (€ million) – Part 3
€ million
CPA
Reporting country and activity sectionFR IT
Total C-E total C-E manuf. C-E others G Others Total C-E total C-E
manuf. C-E others G Others
Total 118,590 86,785 : : 22,117 9,688 116,055 97,717 : : 14,254 4,084 01-05 2,209 130 : : 1,337 742 730 112 : : 610 9 10-14 162 141 93 49 11 10 370 221 90 131 73 76 15-16 8,870 5,350 5,176 173 2,879 641 5,214 4,147 4,023 124 910 157 17 2,924 2,086 1,187 899 700 139 7,183 6,311 4,526 1,784 731 141 18 2,168 1,316 1,020 297 671 181 5,749 4,453 3,545 908 1,109 187 19 2,005 885 601 285 1,067 53 7,030 5,805 5,531 274 1,078 147 20 501 392 358 34 70 39 603 520 394 127 69 14 21 1,555 1,201 1,070 131 298 56 1,331 1,182 951 231 133 16 22 797 350 221 128 183 265 435 355 267 88 48 32 23 2,627 2,204 2,110 94 335 89 2,939 2,743 2,115 628 194 2 24 20,325 15,823 14,418 1,405 3,447 1,054 11,391 9,977 9,214 763 1,265 149 25 2,536 1,882 1,258 624 488 166 3,168 2,864 2,067 797 252 51 26 1,872 1,505 1,285 220 244 124 4,211 3,399 3,021 378 728 84 27 3,721 3,175 2,689 485 266 281 4,175 3,449 2,522 926 559 168 28 2,577 1,891 1,077 814 351 335 4,226 3,568 2,339 1,229 441 217 29 12,389 9,781 7,553 2,228 1,369 1,239 27,783 23,847 20,165 3,682 2,514 1,423 30 2,164 948 446 503 946 270 917 763 542 221 104 50 31 6,032 4,963 3,355 1,608 537 532 3,748 3,287 2,278 1,009 301 160 32 7,517 6,358 5,625 733 745 414 3,468 3,080 2,516 564 322 66 33 4,655 3,643 2,753 890 582 431 3,327 2,717 1,859 858 506 104 34 11,334 9,378 8,733 645 1,248 709 6,183 5,475 4,157 1,317 606 101 35 15,348 10,633 10,303 330 3,500 1,215 4,061 3,457 3,306 151 111 492 36 2,564 1,731 1,387 344 567 267 7,452 5,860 5,102 758 1,431 160 40 907 907 907 0 0 0 7 7 7 0 0 0 Others 812 111 : : 268 434 101 35 : : 33 33 Unknown 16 2 : : 11 3 250 83 : : 124 43
.. = Confidential data: = not applicableNote: Column C-E total equals the sum of columns C-E manufacturing and C-E others

1��External Trade by Enterprise Characteristics – Results of the Standardisation exercise 2006
Tables II
Table 6.4: Exports by products (€ million) – Part 4
€ million
CPA
Reporting country and activity sectionCY LV
Total C-E total C-E manuf. C-E others G Others Total C-E total C-E
manuf. C-E others G Others
Total 265 69 : : 27 169 2,547 1,798 : : 555 194 01-05 13 0 : : 7 6 166 11 : : 109 46 10-14 2 1 0 1 0 1 34 29 29 0 5 0 15-16 56 28 27 1 3 25 211 146 145 1 27 37 17 2 0 0 0 0 1 128 115 88 27 4 9 18 4 1 1 0 2 1 190 181 159 22 2 7 19 1 0 0 0 0 1 9 6 3 3 3 1 20 0 0 0 0 0 0 771 518 509 9 214 39 21 6 5 3 2 0 1 33 21 18 3 9 3 22 1 0 0 0 0 1 12 8 7 1 2 2 23 21 0 0 0 0 20 2 0 .. .. 2 0 24 67 13 13 0 1 53 162 94 88 6 62 6 25 3 2 2 0 0 1 47 35 24 11 7 4 26 2 1 1 0 0 0 45 39 39 1 4 2 27 5 5 0 5 0 0 266 228 209 18 34 4 28 2 1 0 0 0 1 61 49 39 10 9 3 29 11 5 4 2 1 5 83 52 35 17 21 10 30 4 0 .. .. 3 1 11 4 .. .. 5 2 31 2 1 0 0 0 1 65 58 46 12 4 3 32 37 0 .. .. 2 35 29 23 22 2 3 2 33 7 0 .. .. 2 5 22 15 11 5 5 2 34 4 0 0 0 1 3 20 7 4 3 8 6 35 4 1 1 0 0 3 30 25 23 2 4 1 36 7 4 4 0 1 2 144 133 101 32 7 4 40 0 0 .. .. 0 0 1 1 1 0 0 0 Others 3 0 : : 1 2 2 0 : : 1 1 Unknown 0 0 : : 0 0 6 0 : : 5 1
.. = Confidential data: = not applicableNote: Column C-E total equals the sum of columns C-E manufacturing and C-E others

160 External Trade by Enterprise Characteristics – Results of the Standardisation exercise 2006
TablesII
Table 6.4: Exports by products (€ million) – Part 5
€ million
CPA
Reporting country and activity sectionLT LU
Total C-E total C-E manuf. C-E others G Others Total C-E total C-E
manuf. C-E others G Others
Total 6,068 4,866 : : 979 223 1,374 1,119 : : 96 160 01-05 204 16 : : 163 25 2 0 : : 0 1 10-14 73 68 67 1 5 0 0 0 0 0 0 0 15-16 509 438 433 5 50 22 7 3 3 0 4 0 17 342 322 263 59 18 1 113 111 71 40 2 0 18 528 485 473 12 39 4 7 3 0 3 3 0 19 27 25 19 5 3 0 1 0 0 0 0 1 20 320 266 248 18 39 14 8 8 .. .. 0 0 21 49 38 29 9 11 0 29 28 .. .. 0 0 22 19 17 17 0 2 0 3 2 2 0 1 0 23 1,088 1,072 1,072 0 15 2 0 0 0 0 0 0 24 427 333 306 26 86 8 64 57 52 5 7 1 25 157 130 116 14 26 1 101 94 84 10 2 5 26 58 39 35 4 17 2 24 23 23 0 0 0 27 120 74 4 70 40 6 436 434 423 11 1 0 28 83 57 31 26 23 3 66 60 43 17 2 4 29 194 132 100 32 55 7 294 237 213 24 13 45 30 31 4 2 3 23 4 4 2 0 2 1 1 31 195 174 148 26 15 6 70 12 9 3 43 15 32 248 227 217 10 19 2 24 18 0 18 5 1 33 64 48 35 13 12 4 22 13 12 1 5 3 34 331 21 10 11 285 25 9 1 .. .. 4 4 35 590 504 502 1 7 80 79 2 .. .. 1 77 36 316 287 240 47 26 3 5 3 0 3 1 1 40 88 88 88 0 0 0 0 0 .. .. 0 0 Others 3 1 : : 1 1 8 6 : : 2 0 Unknown 3 0 : : 1 2 0 0 : : 0 0
.. = Confidential data: = not applicableNote: Column C-E total equals the sum of columns C-E manufacturing and C-E others

161External Trade by Enterprise Characteristics – Results of the Standardisation exercise 2006
Tables II
Table 6.4: Exports by products (€ million) – Part 6
€ million
CPA
Reporting country and activity sectionHU AT
Total C-E total C-E manuf. C-E others G Others Total C-E total C-E
manuf. C-E others G Others
Total 38,096 35,157 : : 2,265 674 32,844 20,414 : : 6,133 6,297 01-05 992 97 : : 728 167 165 18 : : 114 33 10-14 16 9 4 6 4 2 97 89 62 27 5 3 15-16 1,962 1,727 1,718 9 172 62 1,285 490 479 11 742 53 17 792 725 372 353 54 13 752 525 373 152 105 122 18 1,002 919 874 45 71 12 306 207 179 28 78 20 19 424 405 361 45 15 4 532 400 374 26 75 58 20 360 302 271 31 40 18 905 742 716 26 133 29 21 507 476 448 27 30 2 1,420 921 855 66 165 334 22 62 41 28 13 13 9 195 97 65 32 43 55 23 595 579 576 3 9 7 353 314 312 2 38 1 24 2,444 2,257 2,058 200 162 25 3,711 2,747 2,494 253 685 279 25 1,069 949 733 216 88 32 1,242 961 552 409 174 107 26 527 502 381 121 20 5 952 744 690 54 91 117 27 1,125 753 605 149 336 36 1,621 1,184 970 213 282 155 28 867 751 465 286 85 31 1,277 973 698 275 230 74 29 2,934 2,730 1,430 1,301 157 46 4,877 3,299 2,421 878 963 615 30 2,672 2,582 1,447 1,135 55 35 681 130 78 52 299 252 31 3,420 3,372 2,525 847 35 13 1,743 1,165 850 315 282 296 32 7,436 7,350 6,822 528 58 28 3,075 1,148 959 189 384 1,543 33 789 746 189 557 31 12 966 564 430 134 264 138 34 6,685 6,616 6,369 247 35 34 3,497 2,181 1,948 233 754 563 35 195 152 112 40 4 39 1,713 495 411 84 13 1,206 36 879 836 280 556 28 15 1,145 744 562 183 182 219 40 21 21 21 0 0 0 188 180 180 0 0 8 Others 43 17 : : 6 20 120 70 : : 34 16 Unknown 279 240 : : 28 11 24 24 : : 0 0
.. = Confidential data: = not applicableNote: Column C-E total equals the sum of columns C-E manufacturing and C-E others

162 External Trade by Enterprise Characteristics – Results of the Standardisation exercise 2006
TablesII
Table 6.4: Exports by products (€ million) – Part 7
€ million
CPA
Reporting country and activity sectionPL SI
Total C-E total C-E manuf. C-E others G Others Total C-E total C-E
manuf. C-E others G Others
Total 47,408 39,458 : : 6,736 1,214 11,245 10,298 : : 591 356 01-05 782 153 : : 429 200 33 10 : : 22 1 10-14 802 123 66 57 667 11 10 9 8 2 0 0 15-16 3,344 2,375 2,305 70 892 78 381 365 329 36 15 1 17 1,283 1,116 697 419 147 20 303 292 264 28 9 1 18 1,786 1,574 1,488 86 165 47 264 252 233 19 11 0 19 507 435 341 94 69 3 170 161 145 16 8 0 20 1,543 1,253 1,115 138 237 53 317 267 229 37 44 6 21 1,530 1,445 905 540 79 6 421 375 352 23 40 6 22 265 193 155 38 56 16 74 61 51 10 11 2 23 963 472 457 15 447 44 10 7 4 3 4 0 24 2,826 2,234 1,987 247 523 70 1,554 1,499 1,451 48 50 4 25 2,172 1,843 1,502 341 280 49 591 552 444 108 34 5 26 1,221 1,004 877 127 190 27 291 268 240 28 9 13 27 2,882 2,326 1,161 1,165 536 21 766 718 443 275 44 5 28 2,798 2,346 1,468 878 339 112 574 512 396 117 45 16 29 3,420 2,724 1,683 1,041 567 129 1,678 1,550 1,115 435 74 55 30 108 31 11 20 54 23 36 19 6 13 8 9 31 2,936 2,725 2,131 594 173 38 760 646 475 172 18 96 32 1,980 1,829 1,487 342 135 16 274 249 236 12 21 5 33 449 381 179 202 52 16 269 253 197 56 11 5 34 6,726 6,501 6,028 473 181 44 1,299 1,222 993 229 65 12 35 2,849 2,725 2,504 220 46 79 123 106 80 27 10 7 36 3,728 3,226 2,746 479 462 40 887 847 320 527 31 9 40 363 330 330 0 0 34 141 44 44 0 3 94 Others 141 96 : : 10 35 18 14 : : 1 4 Unknown 4 0 : : 0 4 0 0 : : 0 0
.. = Confidential data: = not applicableNote: Column C-E total equals the sum of columns C-E manufacturing and C-E others

163External Trade by Enterprise Characteristics – Results of the Standardisation exercise 2006
Tables II
Table 6.4: Exports by products (€ million) – Part 8
€ million
CPA
Reporting country and activity sectionSK FI
Total C-E total C-E manuf. C-E others G Others Total C-E total C-E
manuf. C-E others G Others
Total 19,306 17,496 : : 1,213 597 21,499 18,556 : : 2,421 521 01-05 194 19 : : 122 53 226 8 : : 212 6 10-14 77 59 18 40 17 1 42 39 29 10 4 0 15-16 486 401 388 13 62 22 477 406 394 12 62 9 17 342 293 224 69 17 32 178 127 74 53 48 3 18 507 435 374 62 52 20 125 70 64 5 51 4 19 449 434 420 14 13 2 58 38 35 4 19 0 20 332 256 229 27 55 21 902 861 852 9 31 10 21 592 510 500 10 57 25 3,077 2,998 2,945 54 78 1 22 142 117 111 6 14 10 153 136 127 10 11 6 23 819 814 801 14 3 2 433 389 386 3 44 0 24 1,038 922 645 277 95 21 1,561 1,257 1,042 214 294 10 25 793 671 554 117 45 78 454 372 276 97 71 11 26 474 408 382 26 49 17 255 212 201 11 33 10 27 1,956 1,822 1,750 72 118 16 1,109 993 823 170 94 22 28 791 625 437 188 110 56 459 362 240 123 60 37 29 1,553 1,335 1,042 293 155 63 3,083 2,352 2,149 202 550 181 30 273 243 53 190 22 8 217 55 2 52 153 9 31 1,206 1,173 993 180 25 8 1,148 1,053 674 379 76 19 32 494 458 417 41 29 7 4,736 4,520 4,441 79 186 30 33 145 108 59 49 31 6 785 703 591 112 68 14 34 5,382 5,287 5,074 213 53 42 641 413 164 249 207 21 35 251 174 155 19 12 66 1,163 1,036 1,017 20 20 107 36 838 768 663 105 53 16 191 142 118 24 45 5 40 163 163 163 0 0 0 0 0 0 0 0 0 Others 10 3 : : 5 2 25 14 : : 6 5 Unknown 0 0 : : 0 0 0 0 : : 0 0
.. = Confidential data: = not applicableNote: Column C-E total equals the sum of columns C-E manufacturing and C-E others

164 External Trade by Enterprise Characteristics – Results of the Standardisation exercise 2006
TablesII
Table 6.4: Exports by products (€ million) – Part 9
€ million
CPA
Reporting country and activity sectionSE NO
Total C-E total C-E manuf. C-E others G Others Total C-E total C-E
manuf. C-E others G Others
Total 40,624 33,713 : : 4,757 2,153 41,801 35,448 : : 3,877 2,476 01-05 132 16 : : 66 50 1,127 66 : : 827 234 10-14 242 222 216 6 14 5 19,846 19,613 19,583 30 223 10 15-16 1,066 944 859 84 91 31 2,611 1,008 968 41 1,429 173 17 450 269 172 97 159 22 170 134 105 29 32 4 18 187 44 37 6 113 31 60 23 19 4 33 4 19 103 50 43 7 49 5 44 30 25 4 14 0 20 1,151 838 799 39 230 84 320 301 289 12 15 4 21 2,536 2,349 2,249 99 121 66 706 675 565 110 20 10 22 196 112 72 40 55 29 72 53 41 13 13 6 23 712 211 187 24 475 27 3,241 3,206 0 3,206 35 1 24 4,897 3,947 3,794 153 486 464 2,622 2,400 2,100 300 166 55 25 994 778 446 331 185 31 265 227 186 41 32 5 26 362 264 191 74 78 20 176 166 138 28 7 3 27 2,079 1,860 1,669 192 176 43 2,160 1,893 1,681 212 239 27 28 1,294 1,015 634 382 234 44 424 352 196 156 49 24 29 6,450 5,606 4,725 880 600 244 2,084 1,756 1,226 529 171 158 30 445 235 124 111 146 63 292 144 44 99 116 32 31 1,932 1,594 1,041 552 241 98 562 426 275 150 67 70 32 5,355 4,905 4,651 254 346 104 619 445 405 40 121 53 33 1,501 1,120 852 268 230 152 622 485 399 86 71 67 34 6,137 5,776 5,471 306 237 124 640 512 446 66 98 30 35 1,022 600 580 20 63 358 1,121 859 790 69 15 248 36 854 516 388 129 306 32 482 415 353 62 60 7 40 229 229 229 0 0 0 202 0 0 0 0 202 Others 290 213 : : 52 25 60 11 : : 25 25 Unknown 7 0 : : 5 2 1,272 247 : : 1 1,024
.. = Confidential data: = not applicableNote: Column C-E total equals the sum of columns C-E manufacturing and C-E others