
Empirical Stylized Facts Modelling and Forecast Evaluations for Energy and Stock Markets
39
This article was downloaded by: [Kim Leng Tan] On: 20 March 2015, At: 19:32 Publisher: Taylor & Francis Informa Ltd Registered in England and Wales Registered Number: 1072954 Registered office: Mortimer House, 37-41 Mortimer Street, London W1T 3JH, UK Click for updates Journal of Statistics and Management Systems Publication details, including instructions for authors and subscription information: http://www.tandfonline.com/loi/tsms20 Empirical Stylized Facts Modelling and Forecast Evaluations for Energy and Stock Markets Kim Leng Tan a , Wen Cheong Chin b & Siow Hooi Tan a a Faculty of Management Multimedia University 63100 Cyberjaya, Selangor Malaysia. E-mail: b Faculty of Computing and Informatics Multimedia University 63100 Cyberjaya, Selangor Malaysia Published online: 13 Nov 2014. To cite this article: Kim Leng Tan, Wen Cheong Chin & Siow Hooi Tan (2014) Empirical Stylized Facts Modelling and Forecast Evaluations for Energy and Stock Markets, Journal of Statistics and Management Systems, 17:4, 311-347, DOI: 10.1080/09720510.2014.914296 To link to this article: http://dx.doi.org/10.1080/09720510.2014.914296 PLEASE SCROLL DOWN FOR ARTICLE Taylor & Francis makes every effort to ensure the accuracy of all the information (the “Content”) contained in the publications on our platform. However, Taylor & Francis, our agents, and our licensors make no representations or warranties whatsoever as to the accuracy, completeness, or suitability for any purpose of the Content. Any opinions and views expressed in this publication are the opinions and views of the authors, and are not the views of or endorsed by Taylor & Francis. The accuracy of the Content should not be relied upon and should be independently verified with primary sources of information. Taylor and Francis shall not be liable for any losses, actions, claims, proceedings, demands, costs, expenses, damages, and other liabilities whatsoever or howsoever caused arising directly or indirectly in connection with, in relation to or arising out of the use of the Content. This article may be used for research, teaching, and private study purposes. Any substantial or systematic reproduction, redistribution, reselling, loan, sub-licensing, systematic supply, or distribution in any form to anyone is expressly forbidden. Terms &
-
Upload
harmfulalgae -
Category
Documents
-
view
2 -
download
0
Transcript of Empirical Stylized Facts Modelling and Forecast Evaluations for Energy and Stock Markets
This article was downloaded by: [Kim Leng Tan]On: 20 March 2015, At: 19:32Publisher: Taylor & FrancisInforma Ltd Registered in England and Wales Registered Number: 1072954 Registeredoffice: Mortimer House, 37-41 Mortimer Street, London W1T 3JH, UK
Click for updates
Journal of Statistics and ManagementSystemsPublication details, including instructions for authors andsubscription information:http://www.tandfonline.com/loi/tsms20
Empirical Stylized Facts Modelling andForecast Evaluations for Energy andStock MarketsKim Leng Tana, Wen Cheong Chinb & Siow Hooi Tana
a Faculty of Management Multimedia University 63100 Cyberjaya,Selangor Malaysia. E-mail:b Faculty of Computing and Informatics Multimedia University 63100Cyberjaya, Selangor MalaysiaPublished online: 13 Nov 2014.
To cite this article: Kim Leng Tan, Wen Cheong Chin & Siow Hooi Tan (2014) Empirical StylizedFacts Modelling and Forecast Evaluations for Energy and Stock Markets, Journal of Statistics andManagement Systems, 17:4, 311-347, DOI: 10.1080/09720510.2014.914296
To link to this article: http://dx.doi.org/10.1080/09720510.2014.914296
PLEASE SCROLL DOWN FOR ARTICLE
Taylor & Francis makes every effort to ensure the accuracy of all the information (the“Content”) contained in the publications on our platform. However, Taylor & Francis,our agents, and our licensors make no representations or warranties whatsoever as tothe accuracy, completeness, or suitability for any purpose of the Content. Any opinionsand views expressed in this publication are the opinions and views of the authors,and are not the views of or endorsed by Taylor & Francis. The accuracy of the Contentshould not be relied upon and should be independently verified with primary sourcesof information. Taylor and Francis shall not be liable for any losses, actions, claims,proceedings, demands, costs, expenses, damages, and other liabilities whatsoever orhowsoever caused arising directly or indirectly in connection with, in relation to or arisingout of the use of the Content.
This article may be used for research, teaching, and private study purposes. Anysubstantial or systematic reproduction, redistribution, reselling, loan, sub-licensing,systematic supply, or distribution in any form to anyone is expressly forbidden. Terms &

Conditions of access and use can be found at http://www.tandfonline.com/page/terms-and-conditions
Dow
nloa
ded
by [
Kim
Len
g T
an]
at 1
9:32
20
Mar
ch 2
015

*E-mail: [email protected]
Empirical Stylized Facts Modelling and Forecast Evaluations for Energy and Stock Markets
Kim Leng Tan 1,*
Wen Cheong Chin 2
Siow Hooi Tan 1
1 Faculty of ManagementMultimedia University63100 Cyberjaya, SelangorMalaysia2 Faculty of Computing and InformaticsMultimedia University63100 Cyberjaya, SelangorMalaysia
AbstractThis paper applies autoregressive heteroscedasticity (ARCH) family models for the
purpose of comparing stylized facts such as volatility clustering, leverage eff ect, long mem-
ory volatility and risk-return tradeoff for energy and stock markets. Empirical results have
found that the presences of volatility clustering in both markets and the impact of volatility
shocks to the conditional volatility display hyperbolic rather than exponential rate of decay.
Meanwhile, only stock markets denote the leverage eff ect, which implies that ‘bad’ news
has a greater impact on volatility than ‘good’ news at the same magnitude. Additionally,
empirical results also highlighted that Kerosene and Brent crude oil are the only energy
commodities exhibit risk-return tradeoff . For forecast evaluations, the FIAPARCH model in-
dicates superior out of sample forecasts over short and long time horizon for stock markets.
Nevertheless, FIAPARCH model suits better over long term as compared to short term for
energy markets. Finally, the Superior Predictive Ability (SPA) tests suggested that overall
asymmetric long memory GARCH models display higher forecasting accuracy than the stan-
dard GARCH models.
Keywords: Stylized facts, Energy markets, Stock markets, Comparison, ARCH.
Journal of Statistics & Management SystemsVol. 17 (2014), No. 4, pp. 311–347
©
Dow
nloa
ded
by [
Kim
Len
g T
an]
at 1
9:32
20
Mar
ch 2
015
312 K. L. TAN, W. C. CHIN AND S. H. TAN
1. Introduction
In recent years, interests of researchers regarding stylized facts have
been constantly growing especially in energy markets and stock markets.
Empirical stylized facts refer to observations that are consistent and have
been made in many contexts (e.g., across a wide range of instruments,
markets and time periods). They are accepted as truths, to which theories
must fi t (Cont 2001; 2008, Mukherjee et al. 2011). The common empirical
stylized facts include fat-tail asset returns, volatility clustering, long mem-
ory volatility and leverage eff ect in global fi nancial markets. Theoretically,
stylized facts are obtained via applying a common denominator among
the properties observed in studies of diff erent markets and instruments.
However, stylized facts exhibit ineff iciency especially in distinguishing
among the various types of parametric models. In this study, we are focus-
ing on some common stylized facts such as volatility clustering, leverage
eff ects, long memory volatility and risk-return tradeoff for both the energy
and stock markets.
One of the empirical stylized facts is clustering volatility. Persistence
of volatility is a well established stylized fact and remains the salient
feature of many models (Chen and Ghysels, 2010). Volatility clustering
simply refers to the property that there are periods of high and low (con-
ditional or unconditional) variance. As noted by Mandelbrot (1963), “large
changes tend to be followed by large changes, of either sign, and small
changes tend to be followed by small changes”. Therefore, it is crucial in
predicting the price volatility while deeply understanding and managing
the risk associated with price volatility in order to allow better targeted
policy (Regnier, 2007). Commonly, volatility clustering and leptokurtosis
are observed in the fi nancial time series and magnitude for the response
of future volatility diff ers depending on whether past news are positive or
negative (Li, Hamill and Opong 2010; Black 1976 and Pagan 1996).
The relation between price movement and volatility is also an inter-
esting stylized facts that had been widely studied in fi nancial research.
Empirical research found that information arrival is positively correlated
with volatility according to Aguilar and Ringgenberg (2011). Information
may aff ect prices which are unknowable in the present and appears ran-
domly in the future (Lee and Lee, 2009; Kaufmann and Laskowski, 2005).
Hence, with only historical data for prices and returns, future prices are
best predicted using current prices. While for the return (or changes in
price), it tends to be zero and thus unpredictable. This is the essence of
weak-form Eff icient Market Hypothesis (EMH) which well related to ran-
dom walk.
Dow
nloa
ded
by [
Kim
Len
g T
an]
at 1
9:32
20
Mar
ch 2
015
EMPIRICAL STYLIZED FACTS MODELLING 313
Negative asymmetric volatility or leverage eff ect is another stylized
facts commonly found in market returns in response to fl owing of new
information. In general, it is believed that positive or negative shocks tend
to aff ect the volatility of market returns. Specifi cally, volatility tends to
respond more to negative shocks or ‘bad’ news rather than the positive
shocks or ‘good’ news under the same magnitude. According to Paytakhti
and Shamsavari (2011), asymmetric is tentatively important in fi nancial
decision making especially in selecting portfolio, managing risk, hedging
and pricing the fi nancial derivatives. In term of volatility modeling, the
existence of leverage eff ects suggest that investor’s response to shocks is
not symmetric, which is contrary with the assumptions behind autore-
gressive conditional heteroscedasticity (ARCH) model and the gener-
alized autoregressive conditional heteroscedasticity (GARCH) model
(Ismail 2011). Hence, asymmetric ARCH models such as TGARCH model
and GJR GARCH model served this purpose better than the symmetric
GARCH model.
Long memory volatility is one of the interesting stylized facts in
fi nance. In an informationally ineff iciency market, long memory has
become one of the important considerations in the modeling specifi ca-
tion. It describes the correlation structure of a series at long lags whereby
such series normally characterized by distinct but non-periodic cyclical
patterns. According to Butler, Gerken and Okada (2011), long memory is
characterized by slow hyperbolic decay in the autocovariances of squared
returns or transformations of squared returns in the conditional volatility
of a univariate fi nancial time series.
Another well-known stylized fact is known as risk-return tradeoff
or risk premium which represents a factor including in the estimation of
shareholders equity, cost of debt (by adding the credit risk spread) used
in corporate fi nance and in the valuation of the fi nancial assets. Risk pre-
mium in fi nance is defi ned as the returns over and above risk free rate of
return that an investor expects in exchange for each additional unit of risk.
Markowitz portfolio theory indicates that rational investors only accept
additional risk if they expect a greater return and hence refers this greater
return as risk-return tradeoff . Literally, it is acceptable in general that ex-
pected returns of the market is positively and proportionally related to
the conditional volatility. In other words, risk-averse investors normally
require a higher expected return (higher risk premium) as the compensa-
tion of higher expected risks.
The above discussed stylized facts are the most common identifi ed
stylized facts. However, there are other stylized facts such as heavy tails,
Dow
nloa
ded
by [
Kim
Len
g T
an]
at 1
9:32
20
Mar
ch 2
015
314 K. L. TAN, W. C. CHIN AND S. H. TAN
intermittency, aggregational Gaussianity and asymmetry in time scales
that are not discussed in this study. Empirical evidence showed that
there has an existence of fundamentally diff erent ubiquitous properties
called “stylized facts”, such as fat-tailed distribution, volatility clustering,
and scaling / multiscaling in fi nancial time series (He and Zheng, 2008).
Specifi cally the recent research on the similarities and diff erences between
the energy and stock market are such as Dellate and Lopez (2012) who
modeled the dependence between commodity and stock markets from
January 1990 to February 2012. They found that the dependence was time-
varying, symmetric and occurred most of the time. Besides that, Creti, Marc
and Valerie. (2012) studied the volatility together with the link between
stock and commodity markets and shown that correlations between com-
modity and stock markets was time-varying and highly volatile. However,
Gorton and Rouwenhorst (2005), Chong and Miff re (2010) and also Hong
and Yogo (2009) reached similar conclusions over the more recent studies.
These studies concluded that equity and commodity future contracts had
the same average returns along with a negative correlation for bonds and
equities and thus presented less volatile returns. On the other hand, study
of Chong and Miff re (2010) showed that there was weakness correlation
between commodity and conventional stock and bond returns which did
not happened in the study of Silvennoinen and Thorp (2010). Nevertheless,
Gorton and Rouwenhorst (2005) indicated also risk premium on commod-
ity futures was essentially same as equities. However, there is still lack of
consensus in the empirical papers investigating and comparing the simi-
larities and diff erences of stylized facts between energy and stock markets.
This paper attempts to model and compare some common stylized
facts between energy and stock markets using the ARCH family models.
After that, a series of forecast evaluation measurements are conducted
to select the most appropriate models which suit both the fi nancial mar-
kets. The rest of the paper is organized as follows. Part 2 literally reviews
the previous related studies and Part 3 explains the data involved and
methods used in this study. Meanwhile, Part 4 presents and discusses the
empirical results and at last but not least, Part 5 of this paper provides
conclusions and suggestions for future expansion.
2. Methodology
2.1. Data Source
The study period starts from January 1999 to December 2007 whereby
the data for last year, (i.e., January 2007 to December 2007) is reserved for
Dow
nloa
ded
by [
Kim
Len
g T
an]
at 1
9:32
20
Mar
ch 2
015
EMPIRICAL STYLIZED FACTS MODELLING 315
out-of-sample forecasting evaluation. Dataset for this study consists of the
following fi nancial markets.
Energy Commodities Stock Indices
1. Brent Crude Oil 1. FTSE 100 (UK)
2. West Texas 2. FTSE Bursa
Intermediate (WTI) Crude Oil Malaysia KLCI (Malaysia)
3. U.S. Gulf Coast Kerosene 3. Nasdaq 100 (US)
The dataset for energy market commodities are obtained from the
United States Energy Information Administration (EIA) whereas the
stock markets dataset are obtained from DataStream database. This study
focuses on oil markets as oil plays a crucial role in the world economy
and has been the driver of industrialization and modernization. Due
to that, price volatility of this commodity will signifi cantly aff ect the
stock markets. Hence, the emerging stock markets such as FTSE 100,
KLCI and Nasdaq 100 are taking into consideration for the purpose of
comparison.
2.2. Model Framework
The return series, tr that is mainly used for conditional mean is de-
fi ned as the percentage continuously compounded inter-day in terms of
close-to-close index on consecutive trading days:
In Inr P P100 , ,t close t close1= - -t ^ h (1)
where Pt,close is the daily closing index and is the return for commodities or
stocks indices for 1,2, .,…t T= .
The Generalized ARCH model is one of the most commonly used
time series models employed in the recent fi nance literature for studying
the volatility. It is an extended model by Bollerslev (1986) from ARCH
model introduced by Engle (1986) as the fi rst model providing systematic
framework for volatility modeling. The standard GARCH (p,q) model can
be expressed as
r n f= +t tt (2)
Dow
nloa
ded
by [
Kim
Len
g T
an]
at 1
9:32
20
Mar
ch 2
015
316 K. L. TAN, W. C. CHIN AND S. H. TAN
where nt denotes the conditional mean and zf v=t t t with ( , )z NID 0 1+t
or ( , )z GED 0 1+t for our study. Meanwhile, conditional variance, 2vt is
given by
2 2 2v ~ af bv= + +t t t1 1- - , (3)
with the restrictions of , ,0 0 02 2 2~ a b and .11a b+
The standard GARCH model only focuses on short-term volatility
specifi cations and forecasting. In order to include the long memory styl-
ized fact in the modeling, fractionally integrated generalized ARCH (FI-
GARCH) model has been introduced by Baillie, et al. (1996). The standard
FIGARCH (1,d,1) model is given by
( ) ( ) ( )L L L1 1 1 1 d2 2 1 2v ~ bv b { f= + + - - - --t t T1- 6 @ (4)
where , ,0 1 12 1 1~ { b and .d0 1# # L represents the lag operation
and d is the parameter for fractional integration which allows autocorre-
lations to decay at a slow hyperbolic rate, and therefore characterize the
long memory property in volatility. When 0,d 2 the main characteristic
of this model is non-stationary. The non-integer value of d can be written
in a binomial expansion as follow:
( 1) ( 1)
( )L
d kkd
L11d
k 0x x
x-
+ - +=
+3
=
k^ h /
( ) ( ) ( )dL d d L d d d L121 1 1 1 2
6f= - - - - - -2 3
k ( )c d Lk
=3
=1
k/ (5)
Fractionally Integrated Asymmetric Power ARCH (FIAPARCH)
model was developed by Tse (1998) in order to allow news impact and
long memory volatility. Specifi cations for FIAPARCH (1,d,1) model can be
represented by
( ) ( )
( )L
k d kd
L11 1
1d
k 0
vx x
x- =
+ - ++3
d
=t
k^ h / (6)
Dow
nloa
ded
by [
Kim
Len
g T
an]
at 1
9:32
20
Mar
ch 2
015
EMPIRICAL STYLIZED FACTS MODELLING 317
with the restriction of , , , ,0 1 0 1 1 12 1 2 1 1 1~ { d b c- and
.d0 1# # When 0c = and 2c = , the FIAPARCH process will be reduced
to FIGARCH. Another advantage of this specifi cation is the volatility can
be expressed by power factor of standard deviation. Hence, the volatility
representation is not restricted to variance and standard deviation.
2.3. Forecasting Evaluations
The performance of forecasts are normally based on the out-of-sam-
ple forecast evaluations whether the volatility model is able to control the
over fi tting or parameterization problems. Various forecasting criteria or
loss functions can be considered to assess the predictive accuracy of vola-
tility models. For this purpose, daily actual volatility (variance) is assessed
using the daily square returns, r2t and indicated as whereas the estimated
volatility forecast is denoted by 2vtt . Six diff erent accurate loss functions
are used to evaluate the forecast performance of the respected individual
time series :
MSE nt
n1 2 2
1
2v v= --
=t t
t^ h/ (7)
MSE nt
n1 2 2
1
2v v= --
=t t
t^ h/ (8)
/HMSE n 1t
n1 2 2 2
1
v v= --
=t t
t^ h/ (9)
/HMSE n 1t
n1 2 2 2
1
v v= --
=t t
t^ h/ (10)
In( ) /QLIKE nt
n1 2 2 2
1
v v v= -
=t t tt t^ h/ (11)
In /R LOG nt
n2 1 2 2
1
v v= -
=t t
2t6 @/ (12)
where
n – Number of forecasting data;
MSE – Mean Square Error;
MAE – Mean Absolute Error;
Dow
nloa
ded
by [
Kim
Len
g T
an]
at 1
9:32
20
Mar
ch 2
015
318 K. L. TAN, W. C. CHIN AND S. H. TAN
HMSE – Hetoroscedasticity Mean Square Error;
HMAE – Hetoroscedasticity Mean Absolute Error;
QLIKE – Quasi Likelihood; and
R2LOG – Return Square Logarithm
The Superior Predictive Ability (SPA) test can be implemented to
compare the performances of two or more forecasting models. This test
is extended from White (2000) by Hansen (2005). Besides that, SPA test
can also be applied to economic theory that places restrictions on the pre-
dictability of certain variables, such as eff icient market hypothesis (EMH)
(Sullivan, Timmermann, and White, 1999; Hansen, 2005). According to
Wei, Wang and Huang (2010), this test has been proven to be more ro-
bust and have good power properties than other approaches. Hence, it has
been applied by Koopman, Jungbacker and Hol (2005) and Hansen and
Lunde (2005) in their research.
In SPA test, a pre-specifi ed loss function is used to evaluate the fore-
casts, and model that produces the smallest expected loss is the ‘best’ fore-
cast model. The loss function relative to the benchmark model at time t,
can be expressed as:
, , 1, .., 1, ,, … ……d L Y Y Y Y m t nL k= =- =, ,k t t t k t,t0t t^ ^h h (13)
where ( , )L Y Y ,t t0t is the value of the loss function at time t for a benchmark
model and k( , )L Y Y ,t tt is the value of loss function at time t for another com-
petitive model, k. The issue here is whether any of the models, 1, ..,…k m= are outperform as compared to benchmark model. In order to analyze this
issue, testable hypothesis that the benchmark model is the best forecasting
model can be formulated as
: 0 Or : [ ] 0 for all 1, ..,…maxH H E d k m0 # #n =,k t0k (14)
One way to test this hypothesis according to Hansen (2005) is to con-
sider the test statistic of
k
T n d/k
1 2
~=n
k
maxSPA
t (15)
Dow
nloa
ded
by [
Kim
Len
g T
an]
at 1
9:32
20
Mar
ch 2
015
EMPIRICAL STYLIZED FACTS MODELLING 319
where kd n d1
t
n
1
==
,k t/ and kvar n d/2 1 2~ =kt t ^ h is a consistent estimator of the
asymptotic variance klim v r n da /2 1 2~ =k n "3 ^ h. Under the regularity condi-
tion, it holds that
k k
n T d/ k p1 2
~ ~n
=-n
k kmax max kSPA
t (16)
which is greater than zero if and only if 0>nk for some k. Therefore, we
can test H0 using the test statistics TnSPA .
3. Results and Discussions
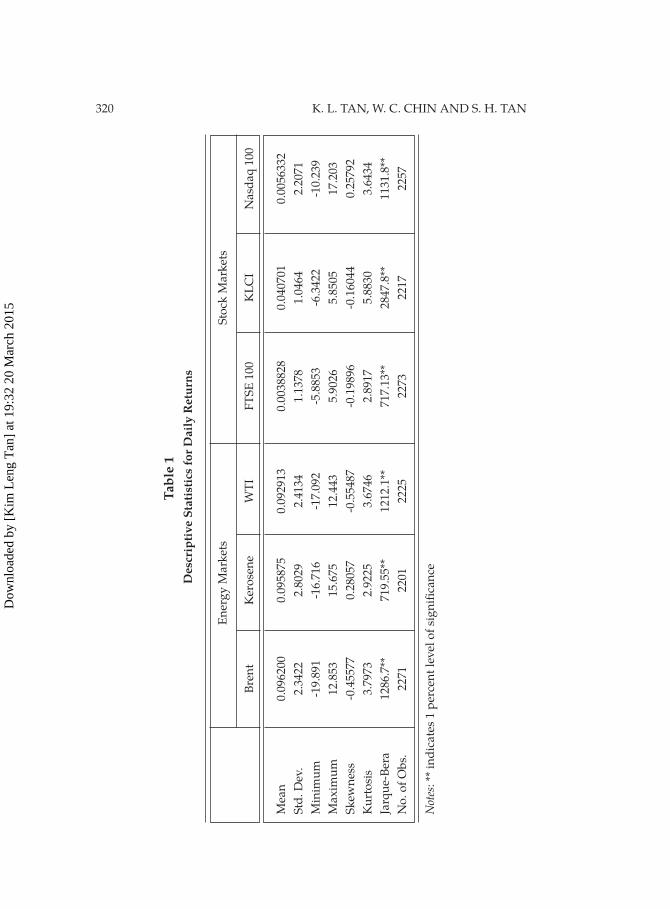
3.1. Descriptive Statistics
Table 1 represents the descriptive statistics for daily returns of en-
ergy markets and stock markets. Sample mean of the return series for
both markets are positive with the values close to zero. As a comparison,
sample mean of stock markets is relatively smaller than energy markets.
Meanwhile, standard deviation of energy markets is slightly higher as
compared to stock markets which implied that energy markets are more
volatile than stock markets for the selected studies period. Overall, energy
markets indicate higher kurtosis and heavier tails as compared to stock
markets. Finally, Jarque-Bera statistics indicate that the null hypothesis of
normality is rejected at one percent signifi cance level.
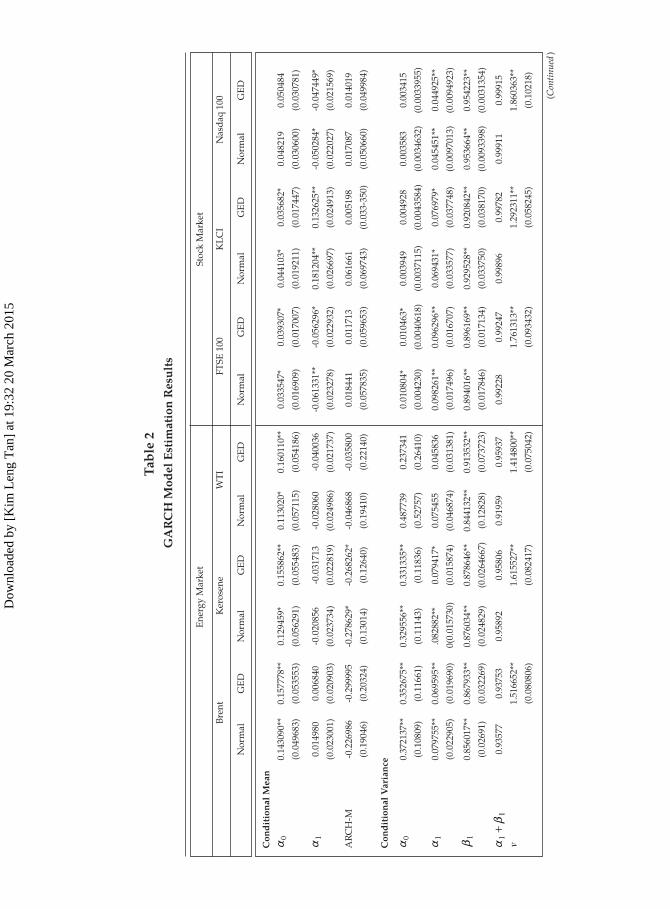
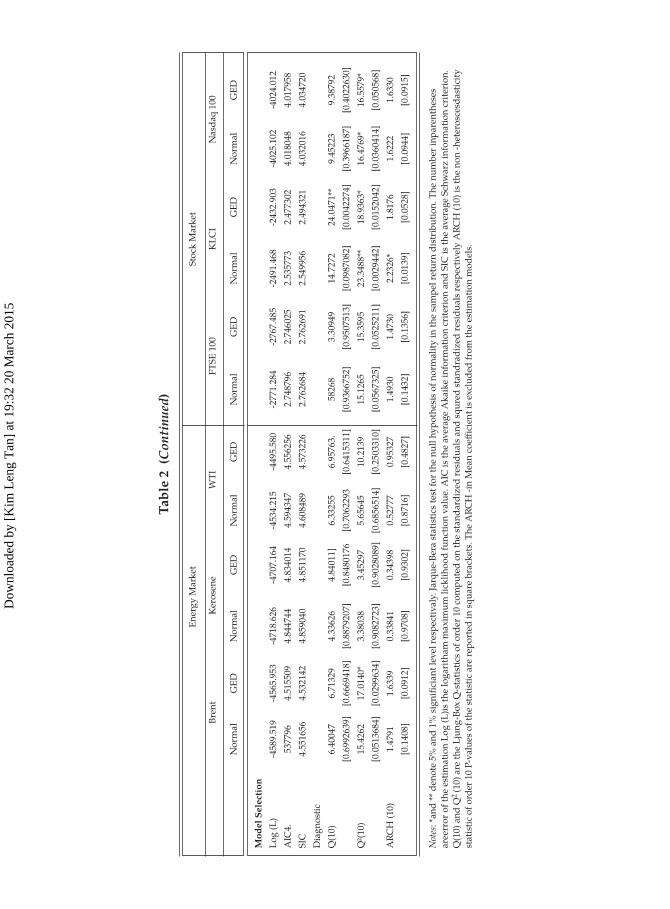
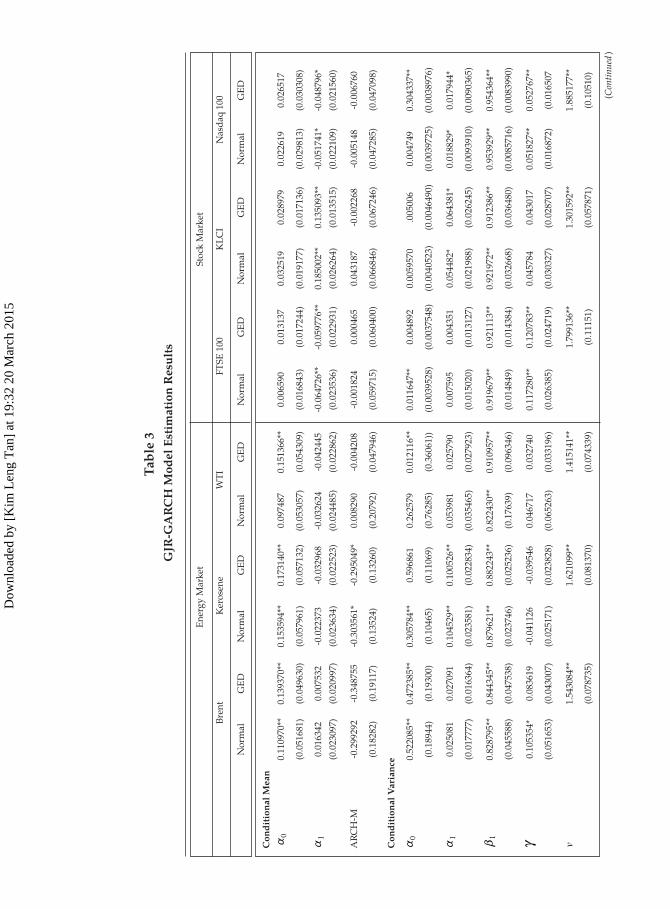
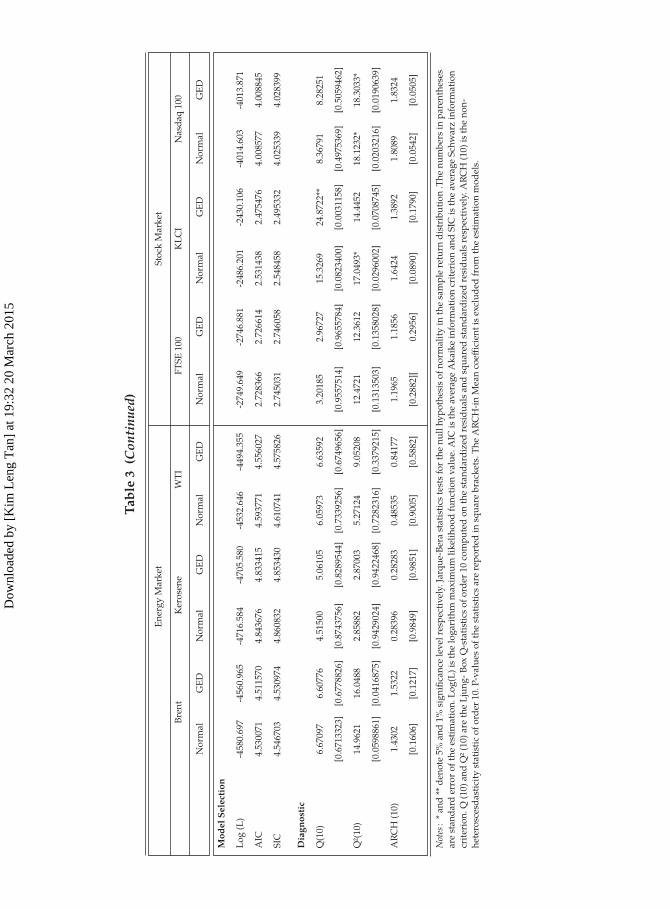
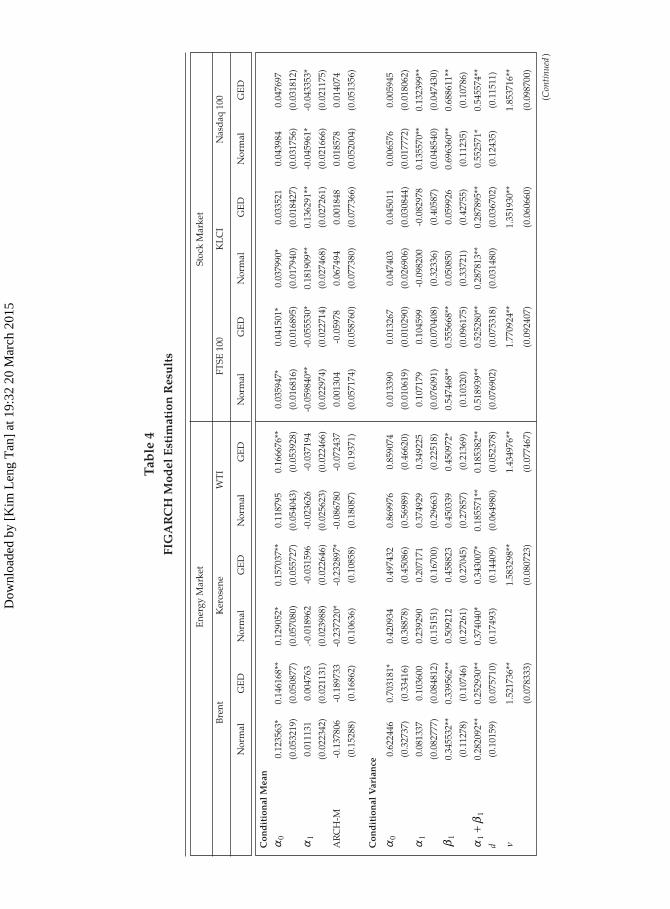
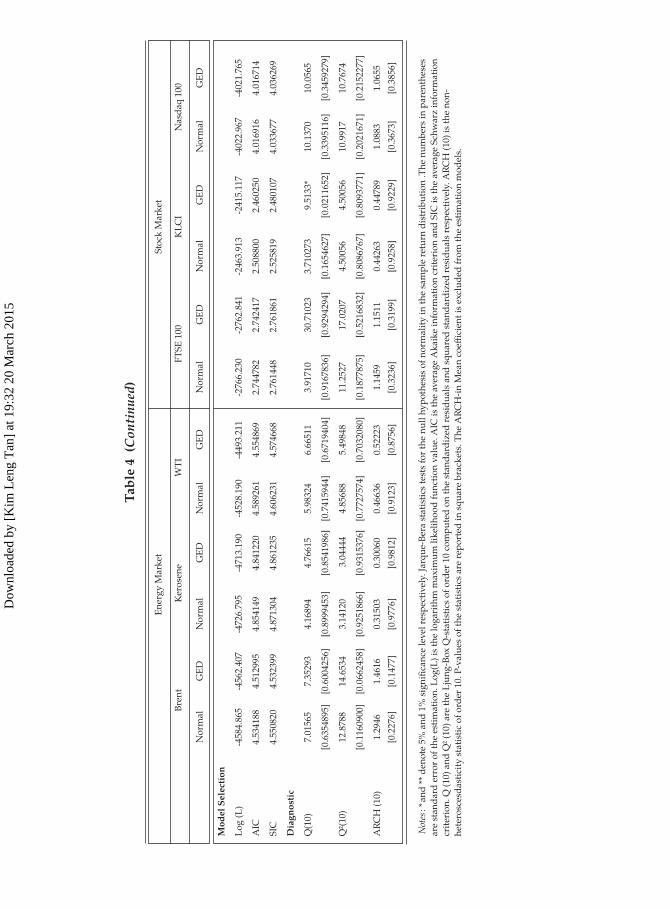
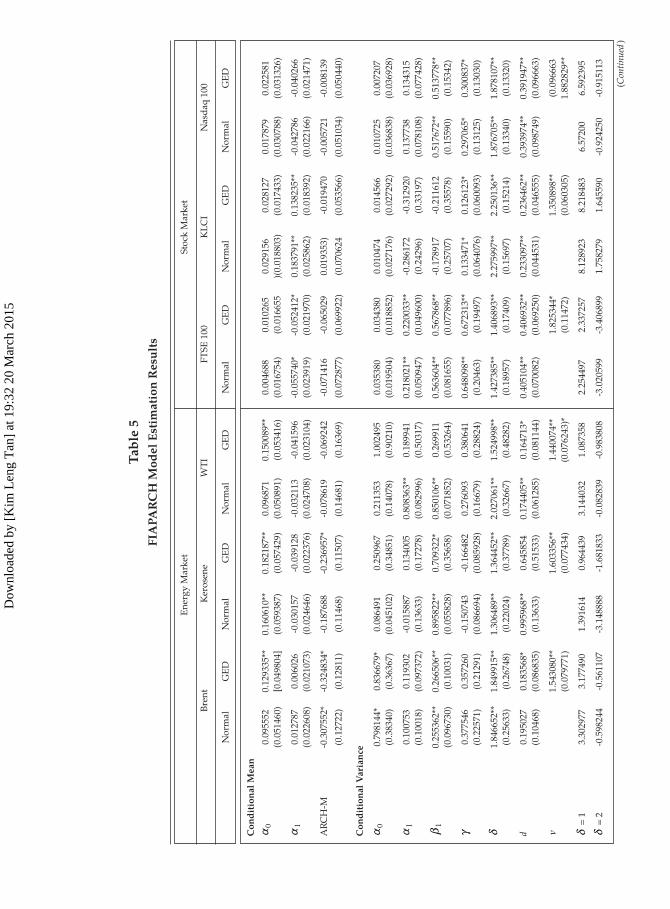
3.2. Estimation Results
Table 2 to Table 5 display the estimation results for both the markets
using normal and generalized error (GED) distributions of GARCH, GJR
GARCH, FIGARCH and FIAPARCH models. The fi rst-order autocorrela-
tion AR (1) indicates a mixture of positive and negative parameters in both
energy and stock markets. For energy markets, all the fi rst lag of returns is
insignifi cant at 5 percent level under normal and GED distribution. On the
other hand, stock markets denote signifi cance of joint estimated AR (1) co-
eff icient at 1 percent or 5 percent signifi cant level under both normal and
GED distributions. However, Nasdaq 100 displays insignifi cant coeff icient
for FIAPARCH model under normal and GED distributions.
For tail distribution analysis, GED distributions of GARCH, GJR
GARCH, FIGARCH and FIAGRACH models exhibit heavy-tails which
could be highlighted by degrees of freedom (v). All energy commodities
Dow
nloa
ded
by [
Kim
Len
g T
an]
at 1
9:32
20
Mar
ch 2
015
320 K. L. TAN, W. C. CHIN AND S. H. TAN
Tabl
e 1
Des
crip
tive
Stat
istic
s fo
r Dai
ly R
etur
ns
E
ner
gy
Mark
ets
Sto
ck M
ark
ets
B
ren
t K
ero
sen
e W
TI
FT
SE
100
KL
CI
Nasd
aq
100
Mea
n
0.0
96200
0.0
95875
0.0
92913
0.0
038828
0.0
40701
0.0
056332
Std
. D
ev.
2.3
422
2.8
029
2.4
134
1.1
378
1.0
464
2.2
071
Min
imu
m
-19.8
91
-16.7
16
-17.0
92
-5.8
853
-6.3
422
-10.2
39
Max
imu
m
12.8
53
15.6
75
12.4
43
5.9
026
5.8
505
17.2
03
Sk
ewn
ess
-0.4
5577
0.2
8057
-0.5
5487
-0.1
9896
-0.1
6044
0.2
5792
Ku
rto
sis
3.7
973
2.9
225
3.6
746
2.8
917
5.8
830
3.6
434
Jarq
ue-
Ber
a
1286.7
**
719.5
5**
1212.1
**
717.1
3**
2847.8
**
1131.8
**
No
. o
f O
bs.
2271
2201
2225
2273
2217
2257
Not
es: **
in
dic
ate
s 1 p
erce
nt
lev
el o
f si
gn
ifi c
an
ce
Dow
nloa
ded
by [
Kim
Len
g T
an]
at 1
9:32
20
Mar
ch 2
015
Tabl
e 2
GA
RC
H M
odel
Est
imat
ion
Res
ults
E
ner
gy
Mark
et
Sto
ck M
ark
et
B
ren
t K
ero
sen
e W
TI
FT
SE
100
KL
CI
Nasd
aq
100
N
orm
al
GE
D
No
rmal
GE
D
No
rmal
GE
D
No
rmal
GE
D
No
rmal
GE
D
No
rmal
GE
D
Con
ditio
nal M
ean
0a
0.1
43090**
0.1
57778**
0.1
29459*
0.1
55862**
0.1
13020*
0.1
60110**
0.0
33547*
0.0
39307*
0.0
44103*
0.0
35682*
0.0
48219
0.0
50484
(0
.049683)
(0.0
53553)
(0.0
56291)
(0.0
55483)
(0.0
57115)
(0.0
54186)
(0.0
16909)
(0.0
17007)
(0.0
19211)
(0.0
17447)
(0.0
30600)
(0.0
30781)
a1
0.0
14980
0.0
06840
-0.0
20856
-0.0
31713
-0.0
28060
-0.0
40036
-0.0
61331**
-0
.056296*
0.1
81204**
0.1
32625**
-0
.050284*
-0.0
47449*
(0
.023001)
(0.0
20903)
(0.0
23734)
(0.0
22819)
(0.0
24986)
(0.0
21737)
(0.0
23278)
(0.0
22932)
(0.0
26697)
(0.0
24913)
(0.0
22027)
(0.0
21569)
AR
CH
-M
-0.2
26986
-0.2
99995
-0.2
78629*
-0.2
68262*
-0.0
46868
-0.0
35800
0.0
18441
0.0
11713
0.0
61661
0.0
05198
0.0
17087
0.0
14019
(0
.19046)
(0.2
0324)
(0.1
3014)
(0.1
2640)
(0.1
9410)
(0.2
2140)
(0.0
57835)
(0.0
59653)
(0.0
69743)
(0.0
33-3
50)
(0.0
50660)
(0.0
49984)
Con
ditio
nal V
aria
nce
0a
0.3
72137**
0.3
52675**
0.3
29556**
0.3
31335**
0.4
87739
0.2
37341
0.0
10804*
0.0
10463*
0.0
03949
0.0
04928
0.0
03583
0.0
03415
(0
.10809)
(0.1
1661)
(0.1
1143)
(0.1
1836)
(0.5
2757)
(0.2
6410)
(0.0
04230)
(0.0
040618)
(0.0
037115)
(0.0
043584)
(0.0
034632)
(0.0
033
955)
a1
0.0
79755**
0.0
69595**
.0
82882**
0.0
79417*
0.0
75455
0.0
45836
0.0
98261**
0.0
96296**
0.0
69431*
0.0
76979*
0.0
45451**
0.0
44925**
(0
.022
905)
(0.0
19690)
0(0
.015730)
(0.0
15874)
(0.0
46874)
(0.0
31381)
(0.0
17496)
(0.0
16707)
(0.0
33577)
(0.0
37748)
(0.0
097013)
(0.0
094923)
b1
0.8
56017**
0.8
67933**
0.8
76034**
0.8
78646**
0.8
44132**
0.9
13532**
0.8
94016**
0.8
96169**
0.9
29528**
0
.920842**
0.9
53664**
0.9
54223**
(0
.02691)
(0.0
32269)
(0.0
24829)
(0.0
264667)
(0.1
2828)
(0.0
73723)
(0.0
17846)
(0.0
17134)
(0.0
33750)
(0.0
38170)
(0.0
093398)
(0.0
031354)
ab
+1
1
0.9
3577
0.9
3753
0.9
5892
0.9
5806
0.9
1959
0.9
5937
0.9
9228
0.9
9247
0.9
9896
0.9
9782
0.9
9911
0.9
9915
v
1.5
16652**
1.6
15527**
1.4
14800**
1.7
61313**
1.2
92311**
1.8
60363**
(0.0
80806)
(0
.082417)
(0
.075042)
(0
.093432)
(0
.058245)
(0
.10218)
(Con
tinue
d )
Dow
nloa
ded
by [
Kim
Len
g T
an]
at 1
9:32
20
Mar
ch 2
015
Mod
el S
elec
tion
Lo
g (
L)
-4589.5
19
-4565.9
53
-4718.6
26
-4707.1
64
-4534.2
15
-4495.5
80
-2771.2
84
-2767.4
85
-2491.4
68
-2432.9
03
-4025.1
02
-4024.0
12
AIC
4.
537796
4.5
15509
4.8
44744
4.8
34014
4.5
94347
4.5
56256
2.7
48796
2.7
46025
2.5
35773
2.4
77302
4.0
18048
4.0
17958
SIC
4.5
51656
4.5
32142
4.8
59040
4.8
51170
4.6
08489
4.5
73226
2.7
62684
2.7
62691
2.5
49956
2.4
94321
4.0
32016
4.0
34720
Dia
gn
ost
ic
Q(1
0)
6.4
0047
6.7
1329
4.3
3626
4.8
4011]
6.3
3255
6.9
5763.
58268
3.3
0949
14.7
272
24.0
471**
9.4
5223
9.3
8792
[0
.6992639]
[0.6
669418]
[0.8
879207]
[0.8
480176
[0.7
062293
[0.6
415311]
[0.9
366752]
[0.9
507513]
[0.0
987082]
[0.0
042274]
[0.3
9661
87]
[0.4
022630]
Q2(
10)
15.4
262
17.0
140*
3.3
8038
3.4
5297
5.6
5645
10.2
139
15.1
265
15.3
595
23.3
488**
18.9
363*
16.4
769*
16.5
579*
[0
.0513684]
[0.0
299634]
[0.9
082723]
[0.9
028089]
[0.6
856514]
[0.2
503310]
[0.0
567325]
[0.0
525211]
[0.0
029442]
[0.0
152042]
[0.0
36
0414]
[0.0
50568]
AR
CH
(10)
1.4
791
1.6
339
0.3
3841
0.3
4398
0.5
2777
0.9
5327
1.4
930
1.4
730
2.2
326*
1.8
176
1.6
222
1.6
330
[0
.1408]
[0.0
912]
[0.9
708]
[0.9
302]
[0.8
716]
[0.4
827]
[0.1
432]
[0.1
356]
[0.0
139]
[0.0
528]
[0.0
944]
[0.0
915]
Not
es: *a
nd
**
den
ote
5%
an
d 1
% s
ign
ifi c
ian
t le
vel
res
pec
tiv
aly
. Ja
rqu
e-B
era s
tati
stic
s te
st f
or
the
nu
ll h
yp
oth
esis
of
no
rmali
ty i
n t
he
sam
pel
ret
urn
dis
trib
uti
on
. T
he
nu
mb
er i
np
are
nth
eses
are
erro
r o
f th
e es
tim
ati
on
Lo
g (
L)i
s th
e lo
gari
tham
max
imu
m l
ick
lih
oo
d f
un
ctio
n v
alu
e. A
IC i
s th
e av
erag
e A
kaik
e in
form
ati
on
cri
teri
on
an
d S
IC i
s th
e av
erag
e S
chw
arz
in
form
ati
on
cri
teri
on
.
Q(1
0)
an
d Q
2 (
10)
are
th
e L
jun
g-B
ox
Q-s
tati
stic
s o
f o
rder
10 c
om
pu
ted
on
th
e st
an
dard
ized
res
idu
als
an
d s
qu
red
sta
nd
rad
ized
res
idu
als
res
pec
tiv
ely
AR
CH
(10)
is t
he
no
n -
het
ero
sces
dast
icit
y
stati
stic
of
ord
er 1
0 P
-valu
es o
f th
e st
ati
stic
are
rep
ort
ed i
n s
qu
are
bra
cket
s. T
he
AR
CH
-in
Mea
n c
oeff
ici
ent
is e
xclu
ded
fro
m t
he
esti
mati
on
mo
del
s.
E
ner
gy
Mark
et
Sto
ck M
ark
et
B
ren
t K
ero
sen
e W
TI
FT
SE
100
KL
CI
Nasd
aq
100
N
orm
al
GE
D
No
rmal
GE
D
No
rmal
GE
D
No
rmal
GE
D
No
rmal
GE
D
No
rmal
GE
D
Tabl
e 2
(Con
tinu
ed)
Dow
nloa
ded
by [
Kim
Len
g T
an]
at 1
9:32
20
Mar
ch 2
015
Tabl
e 3
GJR
-GA
RC
H M
odel
Est
imat
ion
Res
ults
E
ner
gy
Mark
et
Sto
ck M
ark
et
B
ren
t K
ero
sen
e W
TI
FT
SE
100
KL
CI
Nasd
aq
100
N
orm
al
GE
D
No
rmal
GE
D
No
rmal
GE
D
No
rmal
GE
D
No
rmal
GE
D
No
rmal
GE
D
Con
ditio
nal M
ean
0
a
0.1
10970**
0.1
39370**
0.1
53594**
0.1
73140**
0.0
97487
0.1
51366**
0.0
06590
0.0
13137
0.0
32519
0.0
28979
0.0
22619
0.0
26517
(0
.051681)
(0.0
49630)
(0.0
57961)
(0.0
57132)
(0.0
53057)
(0.0
54309)
(0.0
16843)
(0.0
17244)
(0.0
19177)
(0.0
17136)
(0.0
29813)
(0.0
30308)
a1
0.0
16
342
0.0
07532
-0.0
22373
-0.0
32968
-0.0
32624
-0.0
42445
-0.0
64726**
-0
.059776**
0.1
85002**
0
.135093**
-0
.051741*
-0.0
48796*
(0
.023
097)
(0.0
20997)
(0.0
23634)
(0.0
22523)
(0.0
24485)
(0.0
22862)
(0.0
23536)
(0.0
22931)
(0.0
26264)
(0.0
13515)
(0.0
22109)
(0.0
21560)
AR
CH
-M
-0.2
99292
-0.3
48755
-0.3
03561*
-0.2
95049*
0.0
08290
-0.0
04208
-0.0
01824
0.0
00465
0.0
43187
-0.0
02268
-0.0
05148
-0.0
06760
(0
.18282)
(0.1
9117)
(0.1
3524)
(0.1
3260)
(0.2
0792)
(0.0
47946)
(0.0
59715)
(0.0
60400)
(0.0
66846)
(0.0
67246)
(0.0
47285)
(0.0
47098)
Con
ditio
nal V
aria
nce
0a
0.5
220
85**
0.4
72385**
0.3
05784**
0.5
96861
0.2
62579
0.0
12116**
0.0
11647**
0.0
04892
0.0
059570
.005006
0.0
04749
0.3
04337**
(0
.18
944)
(0.1
9300)
(0.1
0465)
(0.1
1069)
(0.7
6285)
(0.3
6061))
(0
.0039528)
(0.0
037548)
(0.0
040523)
(0.0
046490)
(0.0
039725)
(0.0
038976)
a1
0.0
25
081
0.0
27091
0.1
04529**
0.1
00526**
0.0
53981
0.0
25790
0.0
07595
0.0
04351
0.0
54482*
0.0
64381*
0.0
18829*
0.0
17944*
(0
.017
777)
(0.0
16364)
(0.0
23581)
(0.0
22834)
(0.0
35465)
(0.0
27923)
(0.0
15020)
(0.0
13127)
(0.0
21988)
(0.0
26245)
(0.0
093910)
(0.0
090365)
b1
0.8
28795**
0.8
44345**
0.8
79621**
0.8
82243**
0.8
22430**
0.9
10957**
0.9
19679**
0.9
21113**
0.9
21972**
0.9
12386**
0.9
53929**
0.9
54364**
(0
.045588)
(0.0
47538)
(0.0
23746)
(0.0
25236)
(0.1
7639)
(0.0
96346)
(0.0
14849)
(0.0
14384)
(0.0
32668)
(0.0
36480)
(0.0
085716)
(0.0
083990)
c
0.1
05354*
0.0
83619
-0.0
41126
-0.0
39546
0.0
46717
0.0
32740
0.1
17280**
0.1
20783**
0.0
45784
0.0
43017
0.0
51827**
0.0
52767**
(0
.051653)
(0.0
43007)
(0.0
25171)
(0.0
23828)
(0.0
65263)
(0.0
33196)
(0.0
26385)
(0.0
24719)
(0.0
30327)
(0.0
28707)
(0.0
16872)
(0.0
16507
v
1.5
43084**
1.6
21099**
1.4
15141**
1.7
99136**
1.3
01592**
1.8
85177**
(0.0
78735)
(0
.081370)
(0
.074339)
(0
.11151)
(0
.057871)
(0
.10510)
(Con
tinue
d )
Dow
nloa
ded
by [
Kim
Len
g T
an]
at 1
9:32
20
Mar
ch 2
015
E
ner
gy
Mark
et
Sto
ck M
ark
et
B
ren
t K
ero
sen
e W
TI
FT
SE
100
KL
CI
Nasd
aq
100
N
orm
al
GE
D
No
rmal
GE
D
No
rmal
GE
D
No
rmal
GE
D
No
rmal
GE
D
No
rmal
GE
D
Tabl
e 3
(Con
tinu
ed)
Mod
el S
elec
tion
Lo
g (
L)
-4580.6
97
-4560.9
65
-4716.5
84
-4705.5
80
-4532.6
46
-4494.3
55
-2749.6
49
-2746.8
81
-2486.2
01
-2430.1
06
-4014.6
03
-4013.8
71
AIC
4.5
30071
4.5
11570
4.8
43676
4.8
33415
4.5
93771
4.5
56027
2.7
28366
2.7
26614
2.5
31438
2.4
75476
4.0
08577
4.0
08845
SIC
4.5
46703
4.5
30974
4.8
60832
4.8
53430
4.6
10741
4.5
75826
2.7
45031
2.7
46058
2.5
48458
2.4
95332
4.0
25339
4.0
28399
Dia
gnos
tic
Q(1
0)
6.6
7097
6.6
0776
4.5
1500
5.0
6105
6.0
5973
6.6
3592
3.2
0185
2.9
6727
15.3
269
24.8
722**
8.3
6791
8.2
8251
[0
.6713323]
[0.6
778826]
[0.8
743756]
[0.8
289544]
[0.7
339256]
[0.6
749656]
[0.9
557514]
[0.9
655784]
[0.0
823400]
[0.0
031158]
[0.4
97
5369]
[0.5
059462]
Q2(
10)
14.9
621
16.0
488
2.8
5882
2.8
7003
5.2
7124
9.0
5208
12.4
721
12.3
612
17.0
493*
14.4
452
18.1
232*
18.3
033*
[0
.0598861]
[0.0
416875]
[0.9
429024]
[0.9
422468]
[0.7
282316]
[0.3
379215]
[0.1
313503]
[0.1
358028]
[0.0
296002]
[0.0
708745]
[0.0
20
3216]
[0.0
190639]
AR
CH
(10)
1.4
302
1.5
322
0.2
8396
0.2
8283
0.4
8535
0.8
4177
1.1
965
1.1
856
1.6
424
1.3
892
1.8
089
1.8
324
[0
.1606]
[0.1
217]
[0.9
849]
[0.9
851]
[0.9
005]
[0.5
882]
[0.2
882][
0.2
956]
[0.0
890]
[0.1
790]
[0.0
542]
[0.0
505]
Not
es :
* an
d *
* d
eno
te 5
% a
nd
1%
sig
nifi
can
ce l
evel
res
pec
tiv
ely.
Jarq
ue-
Ber
a s
tati
stic
s te
sts
for
the
nu
ll h
yp
oth
esis
of
no
rmali
ty i
n t
he
sam
ple
ret
urn
dis
trib
uti
on
.T
he
nu
mb
ers
in p
are
nth
eses
are
sta
nd
ard
err
or
of
the
esti
mati
on
. L
og
(L)
is t
he
log
ari
thm
max
imu
m l
ikel
iho
od
fu
nct
ion
valu
e. A
IC i
s th
e av
erag
e A
kaik
e in
form
ati
on
cri
teri
on
an
d S
IC i
s th
e av
erag
e S
chw
arz
in
form
ati
on
crit
erio
n. Q
(10)
an
d Q
2 (1
0)
are
th
e L
jun
g-
Bo
x Q
-sta
tist
ics
of
ord
er 1
0 c
om
pu
ted
on
th
e st
an
dard
ized
res
idu
als
an
d s
qu
are
d s
tan
dard
ized
res
idu
als
res
pec
tiv
ely.
AR
CH
(10)
is t
he
no
n-
het
ero
sces
dast
icit
y s
tati
stic
of
ord
er 1
0. P
-valu
es o
f th
e st
ati
stic
s are
rep
ort
ed i
n s
qu
are
bra
cket
s. T
he
AR
CH
-in
Mea
n c
oeff
ici
ent
is e
xclu
ded
fro
m t
he
esti
mati
on
mo
del
s.
Dow
nloa
ded
by [
Kim
Len
g T
an]
at 1
9:32
20
Mar
ch 2
015
Tabl
e 4
FIG
AR
CH
Mod
el E
stim
atio
n R
esul
ts
E
ner
gy
Mark
et
Sto
ck M
ark
et
B
ren
t K
ero
sen
e W
TI
FT
SE
100
KL
CI
Nasd
aq
100
N
orm
al
GE
D
No
rmal
GE
D
No
rmal
GE
D
No
rmal
GE
D
No
rmal
GE
D
No
rmal
GE
D
Con
ditio
nal M
ean
0a
0.1
23563*
0.1
46168**
0.1
29052*
0.1
57
037**
0.1
18795
0.1
66676**
0.0
35947*
0.0
41501*
0.0
37990*
0.0
33521
0.0
43984
0.0
47697
(0
.053
219)
(0.0
50877)
(0.0
57080)
(0.0
55727)
(0.0
54043)
(0.0
53928)
(0.0
16816)
(0.0
16895)
(0.0
17940)
(0.0
18427)
(0.0
31756)
(0.0
31812)
a1
0.0
11131
0.0
04763
.-0.0
18962
-0.0
31596
-0.0
23626
-0.0
37194
-0.0
59840**
-0
.055530*
0.1
81909**
0
.136291**
-0
.045961*
-0.0
43353*
(0
.022
342)
(0.0
21131)
(0.0
23988)
(0.0
22646)
(0.0
25623)
(0.0
22466)
(0.0
22974)
(0.0
22714)
(0.0
27468)
(0.0
27261)
(0.0
21666)
(0.0
21175)
AR
CH
-M
-0.1
37806
-0.1
89733
-0.2
37220*
-0.2
32897*
-0.0
86780
-0.0
72437
0.0
01304
-0.0
5978
0.0
67494
0.0
01848
0.0
18578
0.0
14074
(0
.15288)
(0.1
6862)
(0.1
0636)
(0.1
0858)
(0.1
8087)
(0.1
9371)
(0.0
57174)
(0.0
58760)
(0.0
77380)
(0.0
77366)
(0.0
52004)
(0.0
51356)
Con
ditio
nal V
aria
nce
0a
0.6
22
446
0.7
03181*
0.4
20934
0.4
97432
0.8
69976
0.8
59074
0.0
13390
0.0
13267
0.0
47403
0.0
45011
0.0
06576
0.0
05945
(0
.32
737)
(0.3
3416)
(0.3
8878)
(0.4
5086)
(0.5
6989)
(0.4
6620)
(0.0
10619)
(0.0
10290)
(0.0
26906)
(0.0
30844)
(0.0
17772)
(0.0
18062)
a1
0.0
81337
0.1
03600
0.2
39290
0.2
07171
0.3
74929
0.3
49225
0.1
07179
0.1
04599
-0.0
98200
-0.0
82978
0.1
35570**
0.1
32399**
(0
.082
777)
(0.0
84812)
(0.1
5151)
(0.1
6700)
(0.2
9663)
(0.2
2518)
(0.0
76091)
(0.0
70408)
(0.3
2336)
(0.4
0587)
(0.0
48540)
(0.0
47430)
b1
0.3
45532**
0.3
39562**
0.5
09212
0.4
58823
0.4
50339
0.4
50972*
0.5
47468**
0.5
55668**
0.0
50850
0.0
59926
0.6
96360**
0.6
88611**
(0
.11278)
(0.1
0746)
(0.2
7261)
(0.2
7045)
(0.2
7857)
(0.2
1369)
(0.1
0320)
(0.0
96175)
(0.3
3721)
(0.4
2755)
(0.1
1235)
(0.1
0786)
ab
+1
1
0.2
820
92**
0.2
52930**
0.3
74040*
0.3
43007*
0.1
85571**
0.1
85382**
0.5
18939**
0.5
25280**
0.2
87813**
0.2
87895**
0.5
52571*
0.5
45574**
d (0
.10159)
(0.0
75710)
(0.1
7493)
(0.1
4409)
(0.0
64980)
(0.0
52378)
(0.0
76902)
(0.0
75318)
(0.0
31480)
(0.0
36702)
(0.1
2435)
(0.1
1511)
v
1.5
21736**
1.5
83298**
1.4
34976**
1.7
70924**
1.3
51930**
1.8
53716**
(0.0
78333)
(0
.080723)
(0
.077467)
(0
.092407)
(0
.060660)
(0
.098700)
(Con
tinue
d )
Dow
nloa
ded
by [
Kim
Len
g T
an]
at 1
9:32
20
Mar
ch 2
015
E
ner
gy
Mark
et
Sto
ck M
ark
et
B
ren
t K
ero
sen
e W
TI
FT
SE
100
KL
CI
Nasd
aq
100
N
orm
al
GE
D
No
rmal
GE
D
No
rmal
GE
D
No
rmal
GE
D
No
rmal
GE
D
No
rmal
GE
D
Tabl
e 4
(Con
tinu
ed)
Mod
el S
elec
tion
Lo
g (
L)
-4584.8
65
-4562.4
07
-4726.7
95
-4713.1
90
-4528.1
90
-4493.2
11
-2766.2
30
-2762.8
41
-2463.9
13
-2415.1
17
-4022.9
67
-4021.7
65
AIC
4.5
34188
4.5
12995
4.8
54149
4.8
41220
4.5
89261
4.5
54869
2.7
44782
2.7
42417
2.5
08800
2.4
60250
4.0
16916
4.0
16714
SIC
4.5
50820
4.5
32399
4.8
71304
4.8
61235
4.6
06231
4.5
74668
2.7
61448
2.7
61861
2.5
25819
2.4
80107
4.0
33677
4.0
36269
Dia
gnos
tic
Q(1
0)
7.0
1565
7.3
5293
4.1
6894
4.7
6615
5.9
8324
6.6
6511
3.9
1710
30.7
1023
3.7
10273
9.5
133*
10.1
370
10.0
565
[0
.6354895]
[0.6
004256]
[0.8
999453]
[0.8
541986]
[0.7
415944]
[0.6
719404]
[0.9
167836]
[0.9
294294]
[0.1
654627]
[0.0
211652]
[0.3
39
5116]
[0.3
459279]
Q2(
10)
12.8
788
14.6
534
3.1
4120
3.0
4444
4.8
5688
5.4
9848
11.2
527
17.0
207
4.5
0056
4.5
0056
10.9
917
10.7
674
[0
.1160900]
[0.0
662458]
[0.9
251866]
[0.9
315376]
[0.7
727574]
[0.7
032080]
[0.1
877875]
[0.5
216832]
[0.8
086767]
[0.8
093771]
[0.2
02
1671]
[0.2
152277]
AR
CH
(10)
1.2
946
1.4
616
0.3
1503
0.3
0060
0.4
6636
0.5
2223
1.1
459
1.1
511
0.4
4263
0.4
4789
1.0
883
1.0
655
[0
.2276]
[0.1
477]
[0.9
776]
[0.9
812]
[0.9
123]
[0.8
756]
[0.3
236]
[0.3
199]
[0.9
258]
[0.9
229]
[0.3
673]
[0.3
856]
Not
es : *
an
d *
* d
eno
te 5
% a
nd
1%
sig
nifi
can
ce l
evel
res
pec
tiv
ely.
Jarq
ue-
Ber
a s
tati
stic
s te
sts
for
the
nu
ll h
yp
oth
esis
of
no
rmali
ty i
n t
he
sam
ple
ret
urn
dis
trib
uti
on
.T
he
nu
mb
ers
in p
are
nth
eses
are
sta
nd
ard
err
or
of
the
esti
mati
on
. L
og
(L)
is t
he
log
ari
thm
max
imu
m l
ikel
iho
od
fu
nct
ion
valu
e. A
IC i
s th
e av
erag
e A
kaik
e in
form
ati
on
cri
teri
on
an
d S
IC i
s th
e av
erag
e S
chw
arz
in
form
ati
on
crit
erio
n. Q
(10)
an
d Q
2 (1
0)
are
th
e L
jun
g-B
ox
Q-s
tati
stic
s o
f o
rder
10 c
om
pu
ted
on
th
e st
an
dard
ized
res
idu
als
an
d s
qu
are
d s
tan
dard
ized
res
idu
als
res
pec
tiv
ely.
AR
CH
(10)
is t
he
no
n-
het
ero
sces
dast
icit
y s
tati
stic
of
ord
er 1
0. P
-valu
es o
f th
e st
ati
stic
s are
rep
ort
ed i
n s
qu
are
bra
cket
s. T
he
AR
CH
-in
Mea
n c
oeff
ici
ent
is e
xclu
ded
fro
m t
he
esti
mati
on
mo
del
s.
Dow
nloa
ded
by [
Kim
Len
g T
an]
at 1
9:32
20
Mar
ch 2
015
Tabl
e 5
FIA
PAR
CH
Mod
el E
stim
atio
n R
esul
ts
E
ner
gy
Mark
et
Sto
ck M
ark
et
B
ren
t K
ero
sen
e W
TI
FT
SE
100
KL
CI
Nasd
aq
100
N
orm
al
GE
D
No
rmal
GE
D
No
rmal
GE
D
No
rmal
GE
D
No
rmal
GE
D
No
rmal
GE
D
Con
ditio
nal M
ean
0a
0.0
95552
0.1
29335**
0.1
60610**
0.1
82187**
0.0
96871
0.1
50089**
0.0
04688
0.0
10265
0.0
29156
0.0
28127
0.0
17879
0.0
22581
(0
.051460)
[0.0
49804]
(0.0
59387)
(0.0
57429)
(0.0
50891)
(0.0
53416)
(0.0
16754)
(0.0
16655
)(0.0
18803)
(0.0
17433)
(0.0
30788)
(0.0
31326)
a1
0.0
12787
0.0
06026
-0.0
30157
-0.0
39128
-0.0
32113
-0.0
41596
-0.0
55740*
-0.0
52412*
0.1
83791**
0.1
38235**
-0
.042786
-0.0
40266
(0
.022608)
(0.0
21073)
(0.0
24646)
(0.0
22376)
(0.0
24708)
(0.0
23104)
(0.0
23919)
(0.0
21970)
(0.0
25862)
(0.0
18392)
(0.0
22166)
(0.0
21471)
AR
CH
-M
-0.3
07552*
-0.3
24834*
-0.1
87688
-0.2
36957*
-0.0
78619
-0.0
69242
-0.0
71416
-0.0
65029
0.0
19353)
-0.0
19470
-0.0
05721
-0.0
08139
(0
.12722)
(0.1
2811)
(0.1
1468)
(0.1
1507)
(0.1
4681)
(0.1
6369)
(0.0
72877)
(0.0
69922)
(0.0
70624
(0.0
53566)
(0.0
51034)
(0.0
50440)
Con
ditio
nal V
aria
nce
0a
0.7
98144*
0.8
36679*
0.0
86491
0.2
50967
0.2
11353
1.0
02495
0.0
35380
0.0
34380
0.0
10474
0.0
14566
0.0
10725
0.0
07207
(0
.38340)
(0.3
6367)
(0.0
45102)
(0.3
4851)
(0.1
4078)
(0.9
0210)
(0.0
19504)
(0.0
18852)
(0.0
27176)
(0.0
27292)
(0.0
36838)
(0.0
36928)
a1
0.1
00753
0.1
19302
-0.0
15887
0.1
34005
0.8
08363**
0.1
89941
0.2
18021**
0.2
20033**
-0
.286172
-0.3
12920
0.1
37738
0.1
34315
(0
.10018)
(0.0
97372)
(0.1
3633)
(0.1
7278)
(0.0
82996)
(0.5
0317)
(0.0
50947)
(0.0
49600)
(0.2
4296)
(0.3
3197)
(0.0
78108)
(0.0
77428)
b1
0.2
55362**
0.2
66506**
0.8
95822**
0.7
09322*
0.8
50106**
0.2
69911
0.5
63604**
0.5
67868**
-0
.178917
-0.2
11612
0.5
17672**
0.5
13778**
(0
.096730)
(0.1
0031)
(0.0
55828)
(0.3
5658)
(0.0
71852)
(0.5
3264)
(0.0
81655)
(0.0
77896)
(0.2
5707)
(0.3
5578)
(0.1
5590)
(0.1
5342)
c
0.3
77546
0.3
57260
-0.1
50743
-0.1
66482
0.2
76093
0.3
80641
0.6
48098**
0.6
72313**
0.1
33471*
0.1
26123*
0.2
97065*
0.3
00837*
(0
.22571)
(0.2
1291)
(0.0
86694)
(0.0
85928)
(0.1
6679)
(0.2
8824)
(0.2
0463)
(0.1
9497)
(0.0
64076)
(0.0
60093)
(0.1
3125)
(0.1
3030)
d
1.8
46652**
1.8
49915**
1.3
06489**
1.3
64452**
2.0
27061**
1.5
24998**
1.4
27385**
1.4
06893**
2.2
75997**
2.2
50136**
1.8
76705**
1.8
78107**
(0
.25633)
(0.2
6748)
(0.2
2024)
(0.3
7789)
(0.3
2667)
(0.4
8282)
(0.1
8957)
(0.1
7409)
(0.1
5697)
(0.1
5214)
(0.1
3340)
(0.1
3320)
d 0.1
95027
0.1
83568*
0.9
95968**
0.6
45854
0.1
74405**
0.1
64713*
0.4
05104**
0.4
06932**
0.2
33097**
0.2
36462**
0.3
93974**
0.3
91947**
(0
.10468)
(0.0
86835)
(0.1
3633)
(0.5
1533)
(0.0
61285)
(0.0
81144)
(0.0
70082)
(0.0
69250)
(0.0
44531)
(0.0
46555)
(0.0
98749)
(0.0
9666
3)
v
1.5
43080**
1.6
03356**
1.4
40074**
1.8
25344*
1.3
50898**
(0.0
96663
(0.0
79771)
(0
.077434)
(0
.076243)*
(0.1
1472)
(0
.060305)
1.8
82829**
d =
1
3.3
02977
3.1
77490
1.3
91614
0.9
64439
3.1
44032
1.0
87358
2.2
54497
2.3
37257
8.1
28923
8.2
18483
6.5
7200
6.5
92395
d =
2
-0.5
98244
-0.5
61107
-3.1
48888
-1.6
81833
-0.0
82839
-0.9
83808
-3.0
20599
-3.4
06899
1.7
58279
1.6
45590
-0.9
24250
-0.9
15113
(Con
tinue
d )
Dow
nloa
ded
by [
Kim
Len
g T
an]
at 1
9:32
20
Mar
ch 2
015
E
ner
gy
Mark
et
Sto
ck M
ark
et
B
ren
t K
ero
sen
e W
TI
FT
SE
100
KL
CI
Nasd
aq
100
N
orm
al
GE
D
No
rmal
GE
D
No
rmal
GE
D
No
rmal
GE
D
No
rmal
GE
D
No
rmal
GE
D
Tabl
e 5
(Con
tinu
ed)
Mod
el S
elec
tion
Lo
g (
L)
-4577.8
89
-4558.0
12
-4719.6
67
-4708.6
25
-4523.3
66
-4489.9
51
-2743.7
98
-2741.8
11
-2456.4
59
-2410.6
75
-4013.8
40
-4013.0
78
AIC
4.5
29273
4.5
10629
4.8
48890
4.8
38590
4.5
86402
4.5
53594
2.7
24553
2.7
23575
2.5
03260
2.4
57770
4.0
09811
4.0
10048
SIC
4.5
51449
4.5
35578
4.8
71764
4.8
64323
4.6
09029
4.5
79049
2.7
46774
2.7
48574
2.5
25953
2.4
83300
4.0
32159
4.0
35190
Dia
gnos
tic
Q(1
0)
7.0
6318
7.1
2535
4.8
7439]
5.1
7838
5.4
9338
6.2
6573
3.1
8132
3.1
7688
13.3
508
19.4
627*
8.8
0815
8.7
9923
[0
.6305417]
[0.6
240708]
[0.8
451174
[0.8
184898]
[0.7
893554]
[0.7
130564]
[0.9
566702]
[0.9
568672]
[0.1
473634]
[0.0
215340]
[0.4
551
690][
0.4
560102]
Q2(
10)
13.8
679
14.8
395
4.6
1440
5.6
0394
6.6
6737
5.2
9262
11.4
487
11.3
946
3.4
0134
3.4
3883
8.1
4139
8.0
5227
[0
.0852751]
[0.0
623432]
[0.7
978816]
[0.6
914994]
[0.5
729081]
[0.7
258911]
[0.1
775490]
[0.1
803253]
[0.9
067100]
[0.9
038846]
[0.4
19
7822]
[0.4
283810]
AR
CH
(10)
1.3
442
1.4
395
0.4
5644
0.5
2717
0.6
5417
0.4
8406
1.2
071
1.2
039
0.3
3791
0.3
4429
0.8
1910
0.8
0991
[0
.2009]
[0.1
567]
[0.9
181]
[0.8
720]
[0.7
677]
[0.9
013]
[0.2
811]
[0.2
833]
[0.9
709]
[0.9
689]
[0.6
102]
[0.6
192]
Not
es : *
an
d *
* d
eno
te 5
% a
nd
1%
sig
nifi
can
ce l
evel
res
pec
tiv
ely.
Jarq
ue-
Ber
a s
tati
stic
s te
sts
for
the
nu
ll h
yp
oth
esis
of
no
rmali
ty i
n t
he
sam
ple
ret
urn
dis
trib
uti
on
.T
he
nu
mb
ers
in p
are
nth
eses
are
sta
nd
ard
err
or
of
the
esti
mati
on
. L
og
(L)
is t
he
log
ari
thm
max
imu
m l
ikel
iho
od
fu
nct
ion
valu
e. A
IC i
s th
e av
erag
e A
kaik
e in
form
ati
on
cri
teri
on
an
d S
IC i
s th
e av
erag
e S
chw
arz
in
form
ati
on
crit
erio
n. Q
(10)
an
d Q
2 (1
0)
are
th
e L
jun
g -
Bo
x Q
-sta
tist
ics
of
ord
er 1
0 c
om
pu
ted
on
th
e st
an
dard
ized
res
idu
als
an
d s
qu
are
d s
tan
dard
ized
res
idu
als
res
pec
tiv
ely.
AR
CH
(10)
is t
he
no
n-
het
ero
sces
dast
icit
y s
tati
stic
of
ord
er 1
0. P
-valu
es o
f th
e st
ati
stic
s are
rep
ort
ed i
n s
qu
are
bra
cket
s. T
he
AR
CH
-in
Mea
n c
oeff
ici
ent
is e
xclu
ded
fro
m t
he
esti
mati
on
mo
del
s.
Dow
nloa
ded
by [
Kim
Len
g T
an]
at 1
9:32
20
Mar
ch 2
015
EMPIRICAL STYLIZED FACTS MODELLING 329
and stock indices show a positive degrees of freedom at 1 percent level of
signifi cant that vary from 1.414800 to 1.621099 and 1.292311 to 1.885177
for energy markets and stock markets respectively. Anyhow, as according
to Chin (2009) and Giot and Sebastian (2003), common energy markets
often exhibit heavy tails around three to six degrees of freedom. There-
fore, a normal distribution assumption will fi ts well for higher degrees of
freedom.
Reponses of market volatility to price movements are examined
by the asymmetric news impact coeff icient, γ where only GJR and FI-
APARCH are capable to capture this feature. According to Table-3 and
Table 5, energy markets show no response on ‘good’ or ‘bad’ news ex-
cept for Brent crude oil which presents a signifi cant positive coeff icient
for γ under normal distribution of GJR GARCH model. Meanwhile, stock
markets display a signifi cant positive of γ under normal and GED distri-
bution of GJR GARCH and FIAPARCH model. However, KLCI denotes
an insignifi cant positive coeff icient for both normal and GED distribution
under GJR GARCH model. Since γ is positive and signifi cant for stock
markets, this implies that there are leverage eff ects in stock market, where
negative innovation (news) has a greater impact on volatility than a posi-
tive innovation (news). From the economics perspective, the above results
are expected as events like the Asian fi nancial crisis, Sub-prime mortgage
crisis and gain tax rates will cause the stock or commodity prices to drop
and subsequently increase the volatility. However, not all events will have
similar impacts on both energy and stock markets. For example, crude
oil crisis might have a direct impact on energy markets rather than stock
markets.
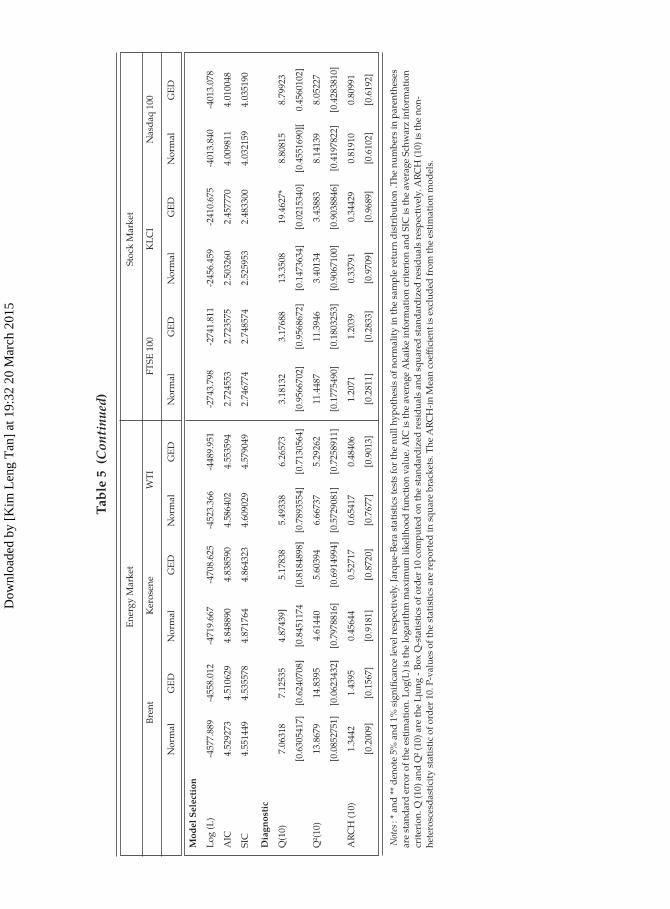
Phenomenon of volatility clustering has attracted the attention from
researchers and inspired numerous debates as to whether there is mem-
ory in volatility. This phenomenon is often attributed to traders’ switch-
ing between chartist and fundamentalist strategies (Kirchler and Huber,
2007). According to Cont (2005), although returns are uncorrelated, abso-
lute returns or their squares often display positive, signifi cant and slowly
decaying autocorrelation functions. The persistence of absolute returns
autocorrelation is a sign for volatility clustering. Both energy and stock
markets show persistence, positive, signifi cant and slowly decaying to
zero over long lags for the autocorrelation function of absolute returns
and their squares. Meanwhile, the estimated fractional diff erence param-
eter, d, as show in Table 4 and Table 5 are all statistically signifi cant dif-
ferent from zero. However, Brent crude oil under normal distribution and
Kerosene under GED distribution of FIAPARCH model are insignifi cant
Dow
nloa
ded
by [
Kim
Len
g T
an]
at 1
9:32
20
Mar
ch 2
015
330 K. L. TAN, W. C. CHIN AND S. H. TAN
in values. Value of d indicates that impact of shocks to the conditional
volatility displays a hyperbolic rather than exponential rate of decay. The
results also showing that long memory will have a direct impact on the
market informationally eff iciency with predictability component and
can pose a serious challenge to the proponents of random walk behavior
of the stock returns (Bhattacharya and Bhattacharya, 2012). In order to
improve the level of information eff iciency, sources of long memory in
volatility of returns will be the concerns of fi nancial market regulators
especially in emerging markets.
On the other hand, the coeff icients of power transformation, d in
Table 5 are all signifi cantly diff erent from unity (Taylor/Schwert model)
or two (Bollerslev GARCH) under both normal and GED distributions at
one percent level of signifi cance. Based on the statistics test of SE
1d -` j and
SE2d -
` j, we found that all stock indices are more favourable to conditional
variance. For energy commodities, Brent crude oil and WTI under normal
distribution are more favourable to conditional variance while Kerosene
under both normal and GED distribution and WTI under GED distribu-
tion, which cannot be distinguished between neither the Taylor’s nor the
Bollerslev’s representation.
For risk premium analysis, expected returns of the markets are posi-
tively and proportionately related to conditional volatility theoretically.
Positive risk-return tradeoff coeff icients indicate that risk adverse inves-
tors require higher expected returns (a higher risk premium) as the risk
increases (Henri, 2010). Our results denote that only Kerosene and Brent
crude oil display a negative and statistically signifi cant risk-return trad-
eoff . Salisu and Fasanya (2012) argued that negative and signifi cant risk-
return tradeoff implying high volatility in energy commodities prices and
risk-adverse investors will thereafter shifted to the less risky commodities.
Consequently, it reduces the prices of energy commodities. Meanwhile,
all stock indices denote positive insignifi cant results. For stock market,
positive and insignifi cant values suggest that investors are satisfi ed with
relatively lower returns as the investment has relatively lower level of ex-
pected risk (Suliman Abdalla, 2012).
The lower parts of Table 2 to Table 5 show the results of both diagnos-
tic and residuals tests. Generally, values of log likelihood, Akaike informa-
tion criteria (AIC) and Schwarz information criteria (SIC) are very close to
each other, which are similar to that reported by Wei, Wang and Huang
(2010). Besides that, models with GED distribution obtained the superior
results (smallest log-likelihood, AIC and SIC), which have some advan-
tages as compared to normally distributed models.
Dow
nloa
ded
by [
Kim
Len
g T
an]
at 1
9:32
20
Mar
ch 2
015
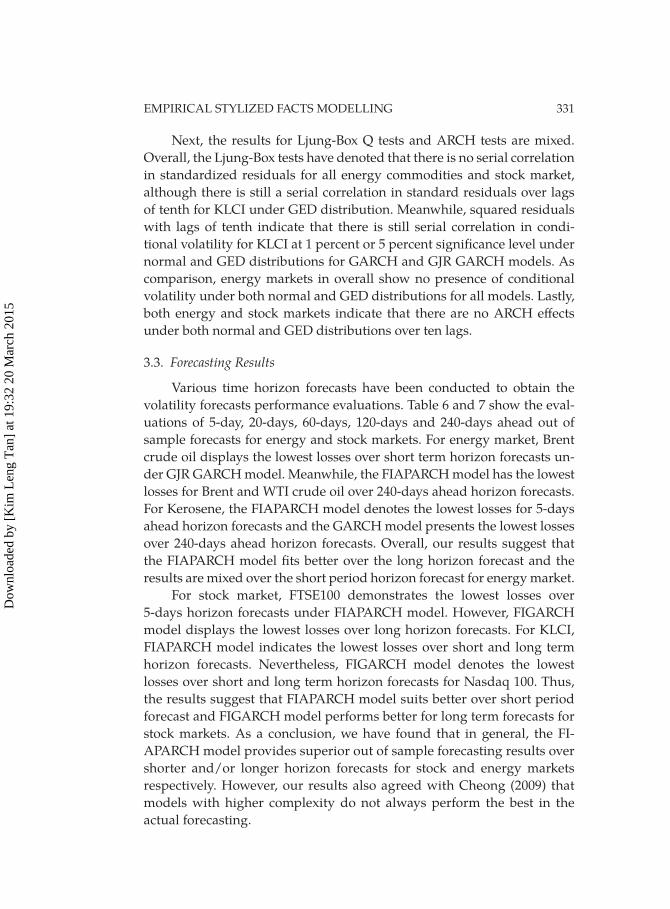
EMPIRICAL STYLIZED FACTS MODELLING 331
Next, the results for Ljung-Box Q tests and ARCH tests are mixed.
Overall, the Ljung-Box tests have denoted that there is no serial correlation
in standardized residuals for all energy commodities and stock market,
although there is still a serial correlation in standard residuals over lags
of tenth for KLCI under GED distribution. Meanwhile, squared residuals
with lags of tenth indicate that there is still serial correlation in condi-
tional volatility for KLCI at 1 percent or 5 percent signifi cance level under
normal and GED distributions for GARCH and GJR GARCH models. As
comparison, energy markets in overall show no presence of conditional
volatility under both normal and GED distributions for all models. Lastly,
both energy and stock markets indicate that there are no ARCH eff ects
under both normal and GED distributions over ten lags.
3.3. Forecasting Results
Various time horizon forecasts have been conducted to obtain the
volatility forecasts performance evaluations. Table 6 and 7 show the eval-
uations of 5-day, 20-days, 60-days, 120-days and 240-days ahead out of
sample forecasts for energy and stock markets. For energy market, Brent
crude oil displays the lowest losses over short term horizon forecasts un-
der GJR GARCH model. Meanwhile, the FIAPARCH model has the lowest
losses for Brent and WTI crude oil over 240-days ahead horizon forecasts.
For Kerosene, the FIAPARCH model denotes the lowest losses for 5-days
ahead horizon forecasts and the GARCH model presents the lowest losses
over 240-days ahead horizon forecasts. Overall, our results suggest that
the FIAPARCH model fi ts better over the long horizon forecast and the
results are mixed over the short period horizon forecast for energy market.
For stock market, FTSE100 demonstrates the lowest losses over
5-days horizon forecasts under FIAPARCH model. However, FIGARCH
model displays the lowest losses over long horizon forecasts. For KLCI,
FIAPARCH model indicates the lowest losses over short and long term
horizon forecasts. Nevertheless, FIGARCH model denotes the lowest
losses over short and long term horizon forecasts for Nasdaq 100. Thus,
the results suggest that FIAPARCH model suits better over short period
forecast and FIGARCH model performs better for long term forecasts for
stock markets. As a conclusion, we have found that in general, the FI-
APARCH model provides superior out of sample forecasting results over
shorter and/or longer horizon forecasts for stock and energy markets
respectively. However, our results also agreed with Cheong (2009) that
models with higher complexity do not always perform the best in the
actual forecasting.
Dow
nloa
ded
by [
Kim
Len
g T
an]
at 1
9:32
20
Mar
ch 2
015
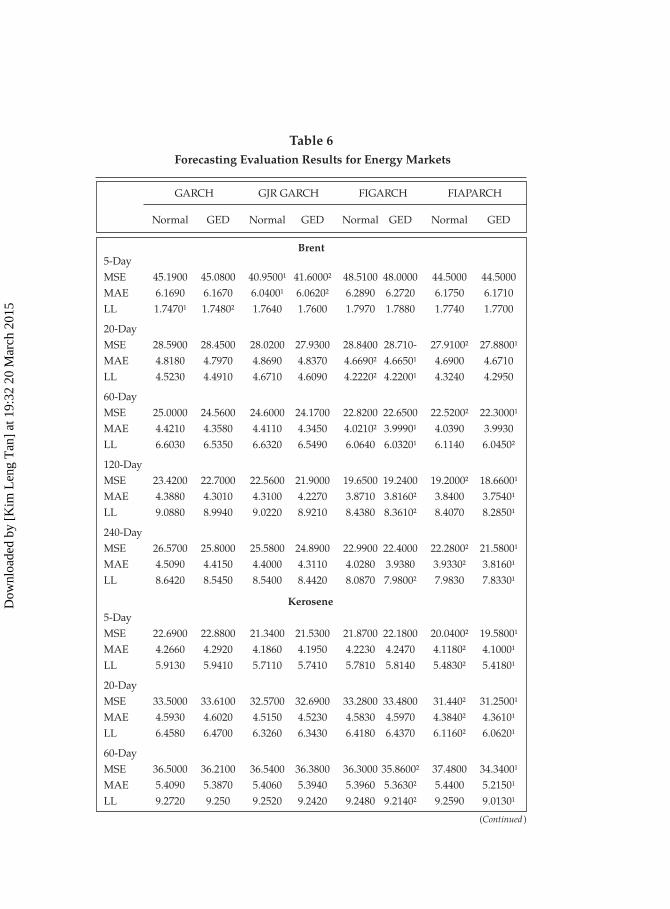
Table 6 Forecasting Evaluation Results for Energy Markets
GARCH GJR GARCH FIGARCH FIAPARCH
Normal GED Normal GED Normal GED Normal GED
Brent5-Day
MSE 45.1900 45.0800 40.95001 41.60002 48.5100 48.0000 44.5000 44.5000
MAE 6.1690 6.1670 6.04001 6.06202 6.2890 6.2720 6.1750 6.1710
LL 1.74701 1.74802 1.7640 1.7600 1.7970 1.7880 1.7740 1.7700
20-Day
MSE 28.5900 28.4500 28.0200 27.9300 28.8400 28.710- 27.91002 27.88001
MAE 4.8180 4.7970 4.8690 4.8370 4.66902 4.66501 4.6900 4.6710
LL 4.5230 4.4910 4.6710 4.6090 4.22202 4.22001 4.3240 4.2950
60-Day
MSE 25.0000 24.5600 24.6000 24.1700 22.8200 22.6500 22.52002 22.30001
MAE 4.4210 4.3580 4.4110 4.3450 4.02102 3.99901 4.0390 3.9930
LL 6.6030 6.5350 6.6320 6.5490 6.0640 6.03201 6.1140 6.04502
120-Day
MSE 23.4200 22.7000 22.5600 21.9000 19.6500 19.2400 19.20002 18.66001
MAE 4.3880 4.3010 4.3100 4.2270 3.8710 3.81602 3.8400 3.75401
LL 9.0880 8.9940 9.0220 8.9210 8.4380 8.36102 8.4070 8.28501
240-Day
MSE 26.5700 25.8000 25.5800 24.8900 22.9900 22.4000 22.28002 21.58001
MAE 4.5090 4.4150 4.4000 4.3110 4.0280 3.9380 3.93302 3.81601
LL 8.6420 8.5450 8.5400 8.4420 8.0870 7.98002 7.9830 7.83301
Kerosene5-Day
MSE 22.6900 22.8800 21.3400 21.5300 21.8700 22.1800 20.04002 19.58001
MAE 4.2660 4.2920 4.1860 4.1950 4.2230 4.2470 4.11802 4.10001
LL 5.9130 5.9410 5.7110 5.7410 5.7810 5.8140 5.48302 5.41801
20-Day
MSE 33.5000 33.6100 32.5700 32.6900 33.2800 33.4800 31.4402 31.25001
MAE 4.5930 4.6020 4.5150 4.5230 4.5830 4.5970 4.38402 4.36101
LL 6.4580 6.4700 6.3260 6.3430 6.4180 6.4370 6.11602 6.06201
60-Day
MSE 36.5000 36.2100 36.5400 36.3800 36.3000 35.86002 37.4800 34.34001
MAE 5.4090 5.3870 5.4060 5.3940 5.3960 5.36302 5.4400 5.21501
LL 9.2720 9.250 9.2520 9.2420 9.2480 9.21402 9.2590 9.01301
(Continued )
Dow
nloa
ded
by [
Kim
Len
g T
an]
at 1
9:32
20
Mar
ch 2
015
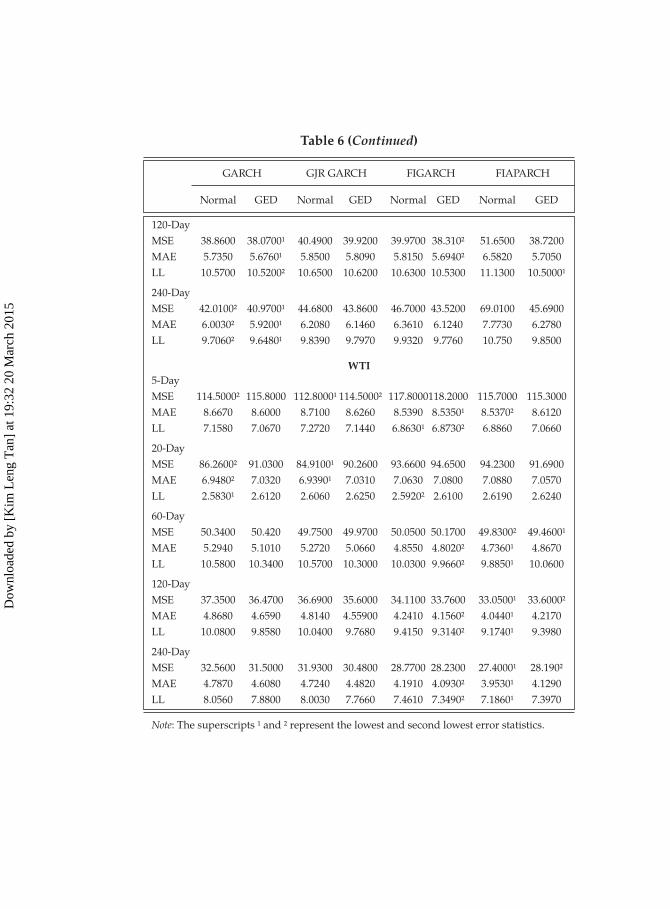
120-Day
MSE 38.8600 38.07001 40.4900 39.9200 39.9700 38.3102 51.6500 38.7200
MAE 5.7350 5.67601 5.8500 5.8090 5.8150 5.69402 6.5820 5.7050
LL 10.5700 10.52002 10.6500 10.6200 10.6300 10.5300 11.1300 10.50001
240-Day
MSE 42.01002 40.97001 44.6800 43.8600 46.7000 43.5200 69.0100 45.6900
MAE 6.00302 5.92001 6.2080 6.1460 6.3610 6.1240 7.7730 6.2780
LL 9.70602 9.64801 9.8390 9.7970 9.9320 9.7760 10.750 9.8500
WTI5-Day
MSE 114.50002 115.8000 112.80001 114.50002 117.8000 118.2000 115.7000 115.3000
MAE 8.6670 8.6000 8.7100 8.6260 8.5390 8.53501 8.53702 8.6120
LL 7.1580 7.0670 7.2720 7.1440 6.86301 6.87302 6.8860 7.0660
20-Day
MSE 86.26002 91.0300 84.91001 90.2600 93.6600 94.6500 94.2300 91.6900
MAE 6.94802 7.0320 6.93901 7.0310 7.0630 7.0800 7.0880 7.0570
LL 2.58301 2.6120 2.6060 2.6250 2.59202 2.6100 2.6190 2.6240
60-Day
MSE 50.3400 50.420 49.7500 49.9700 50.0500 50.1700 49.83002 49.46001
MAE 5.2940 5.1010 5.2720 5.0660 4.8550 4.80202 4.73601 4.8670
LL 10.5800 10.3400 10.5700 10.3000 10.0300 9.96602 9.88501 10.0600
120-Day
MSE 37.3500 36.4700 36.6900 35.6000 34.1100 33.7600 33.05001 33.60002
MAE 4.8680 4.6590 4.8140 4.55900 4.2410 4.15602 4.04401 4.2170
LL 10.0800 9.8580 10.0400 9.7680 9.4150 9.31402 9.17401 9.3980
240-Day
MSE 32.5600 31.5000 31.9300 30.4800 28.7700 28.2300 27.40001 28.1902
MAE 4.7870 4.6080 4.7240 4.4820 4.1910 4.09302 3.95301 4.1290
LL 8.0560 7.8800 8.0030 7.7660 7.4610 7.34902 7.18601 7.3970
Note: The superscripts 1 and 2 represent the lowest and second lowest error statistics.
Table 6 (Continued)
GARCH GJR GARCH FIGARCH FIAPARCH
Normal GED Normal GED Normal GED Normal GED
Dow
nloa
ded
by [
Kim
Len
g T
an]
at 1
9:32
20
Mar
ch 2
015
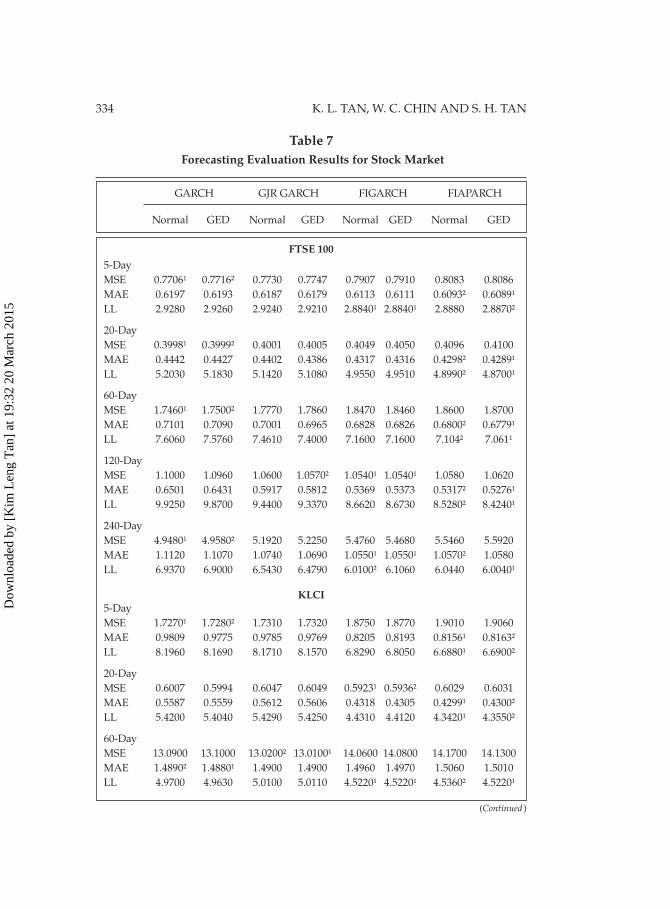
334 K. L. TAN, W. C. CHIN AND S. H. TAN
Table 7 Forecasting Evaluation Results for Stock Market
GARCH GJR GARCH FIGARCH FIAPARCH
Normal GED Normal GED Normal GED Normal GED
FTSE 1005-Day
MSE 0.77061 0.77162 0.7730 0.7747 0.7907 0.7910 0.8083 0.8086
MAE 0.6197 0.6193 0.6187 0.6179 0.6113 0.6111 0.60932 0.60891
LL 2.9280 2.9260 2.9240 2.9210 2.88401 2.88401 2.8880 2.88702
20-Day
MSE 0.39981 0.39992 0.4001 0.4005 0.4049 0.4050 0.4096 0.4100
MAE 0.4442 0.4427 0.4402 0.4386 0.4317 0.4316 0.42982 0.42891
LL 5.2030 5.1830 5.1420 5.1080 4.9550 4.9510 4.89902 4.87001
60-Day
MSE 1.74601 1.75002 1.7770 1.7860 1.8470 1.8460 1.8600 1.8700
MAE 0.7101 0.7090 0.7001 0.6965 0.6828 0.6826 0.68002 0.67791
LL 7.6060 7.5760 7.4610 7.4000 7.1600 7.1600 7.1042 7.0611
120-Day
MSE 1.1000 1.0960 1.0600 1.05702 1.05401 1.05401 1.0580 1.0620
MAE 0.6501 0.6431 0.5917 0.5812 0.5369 0.5373 0.53172 0.52761
LL 9.9250 9.8700 9.4400 9.3370 8.6620 8.6730 8.52802 8.42401
240-Day
MSE 4.94801 4.95802 5.1920 5.2250 5.4760 5.4680 5.5460 5.5920
MAE 1.1120 1.1070 1.0740 1.0690 1.05501 1.05501 1.05702 1.0580
LL 6.9370 6.9000 6.5430 6.4790 6.01002 6.1060 6.0440 6.00401
KLCI5-Day
MSE 1.72701 1.72802 1.7310 1.7320 1.8750 1.8770 1.9010 1.9060
MAE 0.9809 0.9775 0.9785 0.9769 0.8205 0.8193 0.81561 0.81632
LL 8.1960 8.1690 8.1710 8.1570 6.8290 6.8050 6.68801 6.69002
20-Day
MSE 0.6007 0.5994 0.6047 0.6049 0.59231 0.59362 0.6029 0.6031
MAE 0.5587 0.5559 0.5612 0.5606 0.4318 0.4305 0.42991 0.43002
LL 5.4200 5.4040 5.4290 5.4250 4.4310 4.4120 4.34201 4.35502
60-Day
MSE 13.0900 13.1000 13.02002 13.01001 14.0600 14.0800 14.1700 14.1300
MAE 1.48902 1.48801 1.4900 1.4900 1.4960 1.4970 1.5060 1.5010
LL 4.9700 4.9630 5.0100 5.0110 4.52201 4.52201 4.53602 4.52201
(Continued )
Dow
nloa
ded
by [
Kim
Len
g T
an]
at 1
9:32
20
Mar
ch 2
015
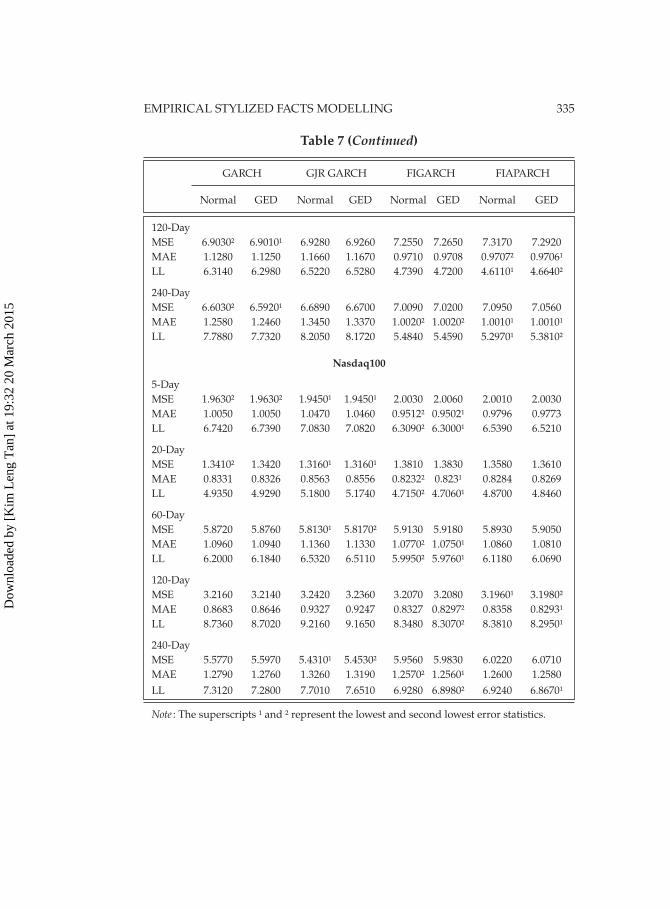
EMPIRICAL STYLIZED FACTS MODELLING 335
120-Day
MSE 6.90302 6.90101 6.9280 6.9260 7.2550 7.2650 7.3170 7.2920
MAE 1.1280 1.1250 1.1660 1.1670 0.9710 0.9708 0.97072 0.97061
LL 6.3140 6.2980 6.5220 6.5280 4.7390 4.7200 4.61101 4.66402
240-Day
MSE 6.60302 6.59201 6.6890 6.6700 7.0090 7.0200 7.0950 7.0560
MAE 1.2580 1.2460 1.3450 1.3370 1.00202 1.00202 1.00101 1.00101
LL 7.7880 7.7320 8.2050 8.1720 5.4840 5.4590 5.29701 5.38102
Nasdaq100
5-Day
MSE 1.96302 1.96302 1.94501 1.94501 2.0030 2.0060 2.0010 2.0030
MAE 1.0050 1.0050 1.0470 1.0460 0.95122 0.95021 0.9796 0.9773
LL 6.7420 6.7390 7.0830 7.0820 6.30902 6.30001 6.5390 6.5210
20-Day
MSE 1.34102 1.3420 1.31601 1.31601 1.3810 1.3830 1.3580 1.3610
MAE 0.8331 0.8326 0.8563 0.8556 0.82322 0.8231 0.8284 0.8269
LL 4.9350 4.9290 5.1800 5.1740 4.71502 4.70601 4.8700 4.8460
60-Day
MSE 5.8720 5.8760 5.81301 5.81702 5.9130 5.9180 5.8930 5.9050
MAE 1.0960 1.0940 1.1360 1.1330 1.07702 1.07501 1.0860 1.0810
LL 6.2000 6.1840 6.5320 6.5110 5.99502 5.97601 6.1180 6.0690
120-Day
MSE 3.2160 3.2140 3.2420 3.2360 3.2070 3.2080 3.19601 3.19802
MAE 0.8683 0.8646 0.9327 0.9247 0.8327 0.82972 0.8358 0.82931
LL 8.7360 8.7020 9.2160 9.1650 8.3480 8.30702 8.3810 8.29501
240-Day
MSE 5.5770 5.5970 5.43101 5.45302 5.9560 5.9830 6.0220 6.0710
MAE 1.2790 1.2760 1.3260 1.3190 1.25702 1.25601 1.2600 1.2580
LL 7.3120 7.2800 7.7010 7.6510 6.9280 6.89802 6.9240 6.86701
Note : The superscripts 1 and 2 represent the lowest and second lowest error statistics.
Table 7 (Continued)
GARCH GJR GARCH FIGARCH FIAPARCH
Normal GED Normal GED Normal GED Normal GED
Dow
nloa
ded
by [
Kim
Len
g T
an]
at 1
9:32
20
Mar
ch 2
015
336 K. L. TAN, W. C. CHIN AND S. H. TAN
After that, the SPA test has been conducted in order to confi rm the
reliability and robustness of the forecasts. Table 8 and 9 display the SPA
results for the various volatility models for short period forecasts (5-day
and 20-days) while Table 10 to 12 shows the longer horizon forecasts (60-
days, 120-days and 240-days). The fi rst column of each table is represented
by the benchmark model of SPA tests while the remaining three models
are treated as competitive models.
For energy market analysis, long memory GARCH models display su-
perior out of sample forecasts results and better forecasting accuracy over
short term forecasts. For example in Table 8, WTI and Brent for 5 days ho-
rizon forecast indicate that at least four out of six of the best model is long
memory GARCH model. However, the best model across six loss func-
tions is standard GARCH model for 240 days horizon as demonstrated in
Table 12. This result is in contrast with Wei, Wang and Huang (2010) as the
best model across six models for longer horizon is long memory GARCH
model. The main reason of this contrary is due to the consideration of 20
days as long horizon forecast while this paper extended the long horizon
forecasts to 240 days in order to study the impact of longer horizon fore-
casts. On the other hand, Kerosene denotes that standard GARCH model
displays superior out of sample forecasts results and better forecasting
accuracy over shorter horizon forecasts. For long horizon forecasts, the
result is mixed for normal and GED distributions whereby the best model
when tested under normal distribution is long memory GARCH model
while the GJR-GARCH model becomes the best model when it is tested
under GED distribution.
For stock markets, the SPA test results show that there are similarities
between short and long horizon forecasts. As indicated in Table 8 and Ta-
ble 12, four out of six among the loss functions indicate that long memory
GARCH model is the best model for 5 days and 240 days horizon forecasts
respectively. In short, p-values of long memory GARCH models which
are close to unity suggested that long memory GARCH models display
higher forecasting accuracy than standard GARCH models in this study.
However, none of the ARCH family models are absolutely outperformed
others. Therefore, researchers, economists and practitioners should be
cautious when choosing the ARCH family models for volatility forecast-
ing. They should take into consideration also the possible complexity in
model specifi cation, parsimonious principles and actual performance of
forecast evaluations.
Dow
nloa
ded
by [
Kim
Len
g T
an]
at 1
9:32
20
Mar
ch 2
015
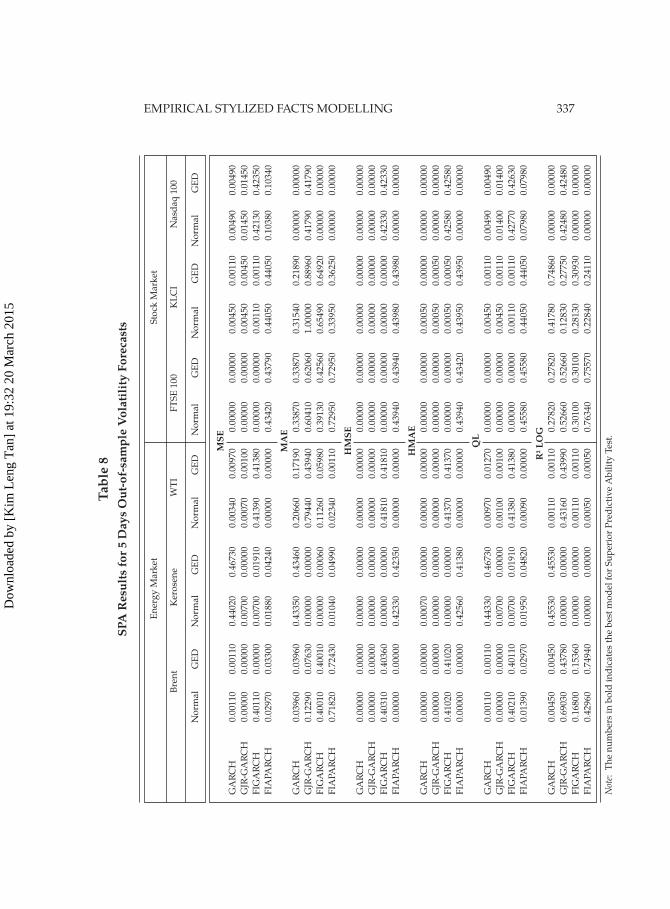
EMPIRICAL STYLIZED FACTS MODELLING 337Ta
ble
8SP
A R
esul
ts fo
r 5 D
ays
Out
-of-
sam
ple
Vol
atili
ty F
orec
asts
E
ner
gy
Mark
et
Sto
ck M
ark
et
B
ren
t K
ero
sen
e W
TI
FT
SE
100
KL
CI
Nasd
aq
100
N
orm
al
GE
D
No
rmal
GE
D
No
rmal
GE
D
No
rmal
GE
D
No
rmal
GE
D
No
rmal
GE
D
M
SEG
AR
CH
0.0
0110
0.0
0110
0.4
4020
0.4
6730
0.0
0340
0.0
0970
0.0
0000
0.0
0000
0.0
0450
0.0
0110
0.0
0490
0.0
0490
GJR
-GA
RC
H
0.0
0000
0.0
0000
0.0
0700
0.0
0000
0.0
0070
0.0
0100
0.0
0000
0.0
0000
0.0
0450
0.0
0450
0.0
1450
0.0
1450
FIG
AR
CH
0.4
0110
0.0
0000
0.0
0700
0.0
1910
0.4
1390
0.4
1380
0.0
0000
0.0
0000
0.0
0110
0.0
0110
0.4
2130
0.4
2350
FIA
PAR
CH
0.0
2970
0.0
3300
0.0
1880
0.0
4240
0.0
0000
0.0
0000
0.4
3420
0.4
3790
0.4
4050
0.4
4050
0.1
0380
0.1
0340
M
AE
GA
RC
H
0.0
3960
0.0
3960
0.4
3350
0.4
3460
0.2
0660
0.1
7190
0.3
3870
0.3
3870
0.3
1540
0.2
1890
0.0
0000
0.0
0000
GJR
-GA
RC
H
0.1
2290
0.0
7630
0.0
0000
0.0
0000
0.7
9440
0.4
3940
0.6
0410
0.6
2060
1.0
0000
0.8
8960
0.4
1790
0.4
1790
FIG
AR
CH
0.4
0010
0.4
0010
0.0
0000
0.0
0060
0.1
1260
0.0
5980
0.3
9130
0.4
2560
0.6
5490
0.6
4920
0.0
0000
0.0
0000
FIA
PAR
CH
0.7
1820
0.7
2430
0.0
1040
0.0
4990
0.0
2340
0.0
0110
0.7
2950
0.7
2950
0.3
3950
0.3
6250
0.0
0000
0.0
0000
H
MSE
GA
RC
H
0.0
0000
0.0
0000
0.0
0000
0.0
0000
0.0
0000
0.0
0000
0.0
0000
0.0
0000
0.0
0000
0.0
0000
0.0
0000
0.0
0000
GJR
-GA
RC
H
0.0
0000
0.0
0000
0.0
0000
0.0
0000
0.0
0000
0.0
0000
0.0
0000
0.0
0000
0.0
0000
0.0
0000
0.0
0000
0.0
0000
FIG
AR
CH
0.4
0310
0.4
0360
0.0
0000
0.0
0000
0.4
1810
0.4
1810
0.0
0000
0.0
0000
0.0
0000
0.0
0000
0.4
2330
0.4
2330
FIA
PAR
CH
0.0
0000
0.0
0000
0.4
2330
0.4
2350
0.0
0000
0.0
0000
0.4
3940
0.4
3940
0.4
3980
0.4
3980
0.0
0000
0.0
0000
H
MA
EG
AR
CH
0.0
0000
0.0
0000
0.0
0070
0.0
0000
0.0
0000
0.0
0000
0.0
0000
0.0
0000
0.0
0050
0.0
0000
0.0
0000
0.0
0000
GJR
-GA
RC
H
0.0
0000
0.0
0000
0.0
0000
0.0
0000
0.0
0000
0.0
0000
0.0
0000
0.0
0000
0.0
0050
0.0
0050
0.0
0000
0.0
0000
FIG
AR
CH
0.4
1020
0.4
1020
0.0
0000
0.0
0000
0.4
1370
0.4
1370
0.0
0000
0.0
0000
0.0
0050
0.0
0050
0.4
2580
0.4
2580
FIA
PAR
CH
0.0
0000
0.0
0000
0.4
2560
0.4
1380
0.0
0000
0.0
0000
0.4
3940
0.4
3420
0.4
3950
0.4
3950
0.0
0000
0.0
0000
Q
LG
AR
CH
0.0
0110
0.0
0110
0.4
4330
0.4
6730
0.0
0970
0.0
1270
0.0
0000
0.0
0000
0.0
0450
0.0
0110
0.0
0490
0.0
0490
GJR
-GA
RC
H
0.0
0000
0.0
0000
0.0
0700
0.0
0000
0.0
0100
0.0
0100
0.0
0000
0.0
0000
0.0
0450
0.0
0110
0.0
1400
0.0
1400
FIG
AR
CH
0.4
0210
0.4
0110
0.0
0700
0.0
1910
0.4
1380
0.4
1380
0.0
0000
0.0
0000
0.0
0110
0.0
0110
0.4
2770
0.4
2630
FIA
PAR
CH
0.0
1390
0.0
2970
0.0
1950
0.0
4820
0.0
0090
0.0
0000
0.4
5580
0.4
5580
0.4
4050
0.4
4050
0.0
7980
0.0
7980
R
2 LO
GG
AR
CH
0.0
0450
0.0
0450
0.4
5530
0.4
5530
0.0
0110
0.0
0110
0.2
7820
0.2
7820
0.4
1780
0.7
4860
0.0
0000
0.0
0000
GJR
-GA
RC
H
0.6
9030
0.4
3780
0.0
0000
0.0
0000
0.4
3160
0.4
3990
0.5
2660
0.5
2660
0.1
2830
0.2
7750
0.4
2480
0.4
2480
FIG
AR
CH
0.1
6800
0.1
5360
0.0
0000
0.0
0000
0.0
0110
0.0
0110
0.3
0100
0.3
0100
0.2
8130
0.3
0930
0.0
0000
0.0
0000
FIA
PAR
CH
0.4
2960
0.7
4940
0.0
0000
0.0
0000
0.0
0050
0.0
0050
0.7
6340
0.7
5570
0.2
2840
0.2
4110
0.0
0000
0.0
0000
Not
e: T
he
nu
mb
ers
in b
old
in
dic
ate
s th
e b
est
mo
del
fo
r S
up
erio
r P
red
icti
ve
Ab
ilit
y T
est.
Dow
nloa
ded
by [
Kim
Len
g T
an]
at 1
9:32
20
Mar
ch 2
015
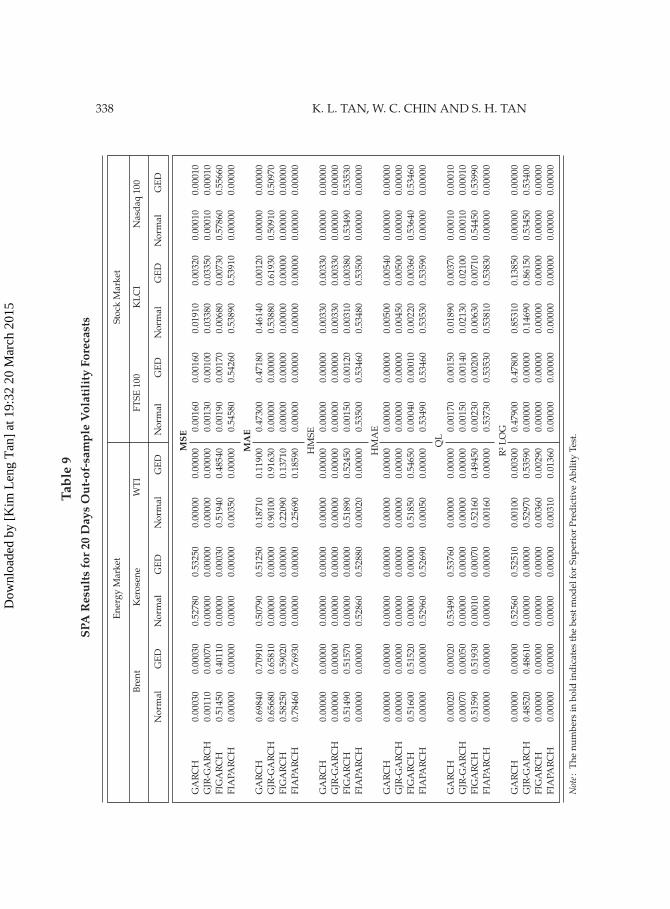
338 K. L. TAN, W. C. CHIN AND S. H. TAN
Tabl
e 9
SPA
Res
ults
for 2
0 D
ays
Out
-of-
sam
ple
Vol
atili
ty F
orec
asts
E
ner
gy
Mark
et
Sto
ck M
ark
et
B
ren
t K
ero
sen
e W
TI
FT
SE
100
KL
CI
Nasd
aq
100
N
orm
al
GE
D
No
rmal
GE
D
No
rmal
GE
D
No
rmal
GE
D
No
rmal
GE
D
No
rmal
GE
D
M
SEG
AR
CH
0.0
0030
0.0
0030
0.5
2780
0.5
3250
0.0
0000
0.0
0000
0.0
0160
0.0
0160
0.0
1910
0.0
0320
0.0
0010
0.0
0010
GJR
-GA
RC
H
0.0
0110
0.0
0070
0.0
0000
0.0
0000
0.0
0000
0.0
0000
0.0
0130
0.0
0100
0.0
3380
0.0
3350
0.0
0010
0.0
0010
FIG
AR
CH
0.5
1450
0.4
0110
0.0
0000
0.0
0030
0.5
1940
0.4
8540
0.0
0190
0.0
0170
0.0
0680
0.0
0730
0.5
7860
0.5
5660
FIA
PAR
CH
0.0
0000
0.0
0000
0.0
0000
0.0
0000
0.0
0350
0.0
0000
0.5
4580
0.5
4260
0.5
3890
0.5
3910
0.0
0000
0.0
0000
M
AE
GA
RC
H
0.6
9840
0.7
0910
0.5
0790
0.5
1250
0.1
8710
0.1
1900
0.4
7300
0.4
7180
0.4
6140
0.0
0120
0.0
0000
0.0
0000
GJR
-GA
RC
H
0.6
5680
0.6
5810
0.0
0000
0.0
0000
0.9
0100
0.9
1630
0.0
0000
0.0
0000
0.5
3880
0.6
1930
0.5
0910
0.5
0970
FIG
AR
CH
0.5
8250
0.5
9020
0.0
0000
0.0
0000
0.2
2090
0.1
3710
0.0
0000
0.0
0000
0.0
0000
0.0
0000
0.0
0000
0.0
0000
FIA
PAR
CH
0.7
8460
0.7
6930
0.0
0000
0.0
0000
0.2
5690
0.1
8590
0.0
0000
0.0
0000
0.0
0000
0.0
0000
0.0
0000
0.0
0000
H
MS
E
GA
RC
H
0.0
0000
0.0
0000
0.0
0000
0.0
0000
0.0
0000
0.0
0000
0.0
0000
0.0
0000
0.0
0330
0.0
0330
0.0
0000
0.0
0000
GJR
-GA
RC
H
0.0
0000
0.0
0000
0.0
0000
0.0
0000
0.0
0000
0.0
0000
0.0
0000
0.0
0000
0.0
0330
0.0
0330
0.0
0000
0.0
0000
FIG
AR
CH
0.5
1490
0.5
1570
0.0
0000
0.0
0000
0.5
1890
0.5
2450
0.0
0150
0.0
0120
0.0
0310
0.0
0380
0.5
3490
0.5
3530
FIA
PAR
CH
0.0
0000
0.0
0000
0.5
2860
0.5
2880
0.0
0020
0.0
0000
0.5
3500
0.5
3460
0.5
3480
0.5
3500
0.0
0000
0.0
0000
H
MA
E
GA
RC
H
0.0
0000
0.0
0000
0.0
0000
0.0
0000
0.0
0000
0.0
0000
0.0
0000
0.0
0000
0.0
0500
0.0
0540
0.0
0000
0.0
0000
GJR
-GA
RC
H
0.0
0000
0.0
0000
0.0
0000
0.0
0000
0.0
0000
0.0
0000
0.0
0000
0.0
0000
0.0
0450
0.0
0500
0.0
0000
0.0
0000
FIG
AR
CH
0.5
1600
0.5
1520
0.0
0000
0.0
0000
0.5
1850
0.5
4650
0.0
0040
0.0
0010
0.0
0220
0.0
0360
0.5
3640
0.5
3460
FIA
PAR
CH
0.0
0000
0.0
0000
0.5
2960
0.5
2690
0.0
0050
0.0
0000
0.5
3490
0.5
3460
0.5
3530
0.5
3590
0.0
0000
0.0
0000
Q
L
GA
RC
H
0.0
0020
0.0
0020
0.5
3490
0.5
3760
0.0
0000
0.0
0000
0.0
0170
0.0
0150
0.0
1890
0.0
0370
0.0
0010
0.0
0010
GJR
-GA
RC
H
0.0
0070
0.0
0050
0.0
0000
0.0
0000
0.0
0000
0.0
0000
0.0
0150
0.0
0140
0.0
2130
0.0
2100
0.0
0010
0.0
0010
FIG
AR
CH
0.5
1590
0.5
1930
0.0
0010
0.0
0070
0.5
2160
0.4
9450
0.0
0230
0.0
0200
0.0
0630
0.0
0710
0.5
4450
0.5
3990
FIA
PAR
CH
0.0
0000
0.0
0000
0.0
0000
0.0
0000
0.0
0160
0.0
0000
0.5
3730
0.5
3530
0.5
3810
0.5
3830
0.0
0000
0.0
0000
R
2 L
OG
GA
RC
H
0.0
0000
0.0
0000
0.5
2560
0.5
2510
0.0
0100
0.0
0300
0.4
7900
0.4
7800
0.8
5310
0.1
3850
0.0
0000
0.0
0000
GJR
-GA
RC
H
0.4
8520
0.4
8610
0.0
0000
0.0
0000
0.5
2970
0.5
3590
0.0
0000
0.0
0000
0.1
4690
0.8
6150
0.5
3450
0.5
3400
FIG
AR
CH
0.0
0000
0.0
0000
0.0
0000
0.0
0000
0.0
0360
0.0
0290
0.0
0000
0.0
0000
0.0
0000
0.0
0000
0.0
0000
0.0
0000
FIA
PAR
CH
0.0
0000
0.0
0000
0.0
0000
0.0
0000
0.0
0310
0.0
1360
0.0
0000
0.0
0000
0.0
0000
0.0
0000
0.0
0000
0.0
0000
Not
e : T
he
nu
mb
ers
in b
old
in
dic
ate
s th
e b
est
mo
del
fo
r S
up
erio
r P
red
icti
ve
Ab
ilit
y T
est.
Dow
nloa
ded
by [
Kim
Len
g T
an]
at 1
9:32
20
Mar
ch 2
015
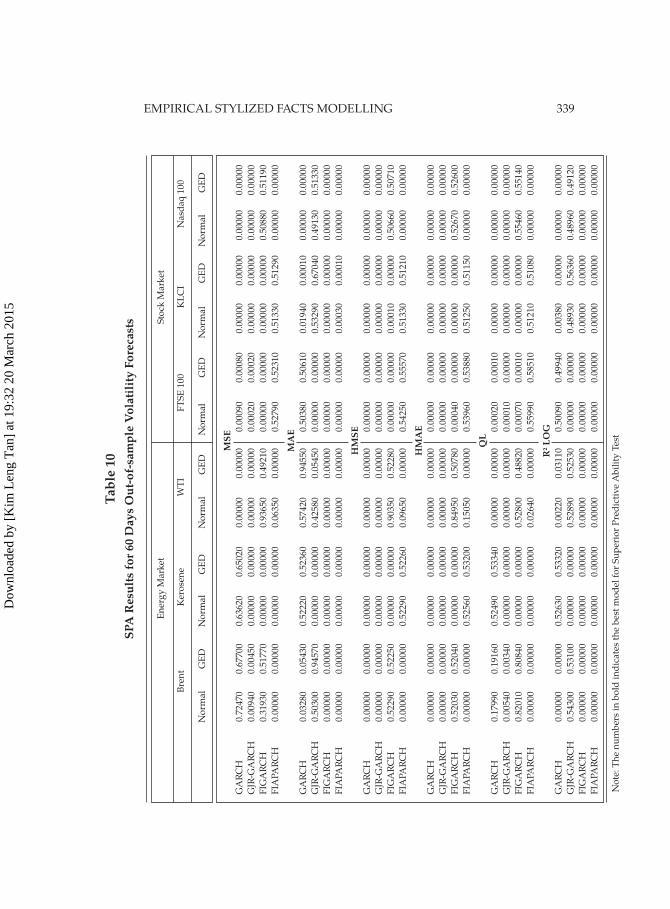
EMPIRICAL STYLIZED FACTS MODELLING 339Ta
ble
10SP
A R
esul
ts fo
r 60
Day
s O
ut-o
f-sa
mpl
e V
olat
ility
For
ecas
ts
E
ner
gy
Mark
et
Sto
ck M
ark
et
B
ren
t K
ero
sen
e W
TI
FT
SE
100
KL
CI
Nasd
aq
100
N
orm
al
GE
D
No
rmal
GE
D
No
rmal
GE
D
No
rmal
GE
D
No
rmal
GE
D
No
rmal
GE
D
M
SEG
AR
CH
0.7
2470
0.6
7700
0.6
3620
0.6
5020
0.0
0000
0.0
0000
0.0
0090
0.0
0080
0.0
0000
0.0
0000
0.0
0000
0.0
0000
GJR
-GA
RC
H
0.0
0940
0.0
0450
0.0
0000
0.0
0000
0.0
0000
0.0
0000
0.0
0020
0.0
0020
0.0
0000
0.0
0000
0.0
0000
0.0
0000
FIG
AR
CH
0.3
1930
0.5
1770
0.0
0000
0.0
0000
0.9
3650
0.4
9210
0.0
0000
0.0
0000
0.0
0000
0.0
0000
0.5
0880
0.5
1190
FIA
PAR
CH
0.0
0000
0.0
0000
0.0
0000
0.0
0000
0.0
6350
0.0
0000
0.5
2790
0.5
2310
0.5
1330
0.5
1290
0.0
0000
0.0
0000
M
AE
GA
RC
H
0.0
3280
0.0
5430
0.5
2220
0.5
2360
0.5
7420
0.9
4550
0.5
0380
0.5
0610
0.0
1940
0.0
0010
0.0
0000
0.0
0000
GJR
-GA
RC
H
0.5
0300
0.9
4570
0.0
0000
0.0
0000
0.4
2580
0.0
5450
0.0
0000
0.0
0000
0.5
3290
0.6
7040
0.4
9130
0.5
1330
FIG
AR
CH
0.0
0000
0.0
0000
0.0
0000
0.0
0000
0.0
0000
0.0
0000
0.0
0000
0.0
0000
0.0
0000
0.0
0000
0.0
0000
0.0
0000
FIA
PAR
CH
0.0
0000
0.0
0000
0.0
0000
0.0
0000
0.0
0000
0.0
0000
0.0
0000
0.0
0000
0.0
0030
0.0
0010
0.0
0000
0.0
0000
H
MSE
GA
RC
H
0.0
0000
0.0
0000
0.0
0000
0.0
0000
0.0
0000
0.0
0000
0.0
0000
0.0
0000
0.0
0000
0.0
0000
0.0
0000
0.0
0000
GJR
-GA
RC
H
0.0
0000
0.0
0000
0.0
0000
0.0
0000
0.0
0000
0.0
0000
0.0
0000
0.0
0000
0.0
0000
0.0
0000
0.0
0000
0.0
0000
FIG
AR
CH
0.5
2290
0.5
2250
0.0
0000
0.0
0000
0.9
0350
0.5
2280
0.0
0000
0.0
0000
0.0
0010
0.0
0000
0.5
0660
0.5
0710
FIA
PAR
CH
0.0
0000
0.0
0000
0.5
2290
0.5
2260
0.0
9650
0.0
0000
0.5
4250
0.5
5570
0.5
1330
0.5
1210
0.0
0000
0.0
0000
H
MA
E G
AR
CH
0.0
0000
0.0
0000
0.0
0000
0.0
0000
0.0
0000
0.0
0000
0.0
0000
0.0
0000
0.0
0000
0.0
0000
0.0
0000
0.0
0000
GJR
-GA
RC
H
0.0
0000
0.0
0000
0.0
0000
0.0
0000
0.0
0000
0.0
0000
0.0
0000
0.0
0000
0.0
0000
0.0
0000
0.0
0000
0.0
0000
FIG
AR
CH
0.5
2030
0.5
2040
0.0
0000
0.0
0000
0.8
4950
0.5
0780
0.0
0040
0.0
0000
0.0
0000
0.0
0000
0.5
2670
0.5
2600
FIA
PAR
CH
0.0
0000
0.0
0000
0.5
2560
0.5
3200
0.1
5050
0.0
0000
0.5
3960
0.5
3880
0.5
1250
0.5
1150
0.0
0000
0.0
0000
Q
L G
AR
CH
0.1
7990
0.1
9160
0.5
2490
0.5
3340
0.0
0000
0.0
0000
0.0
0020
0.0
0010
0.0
0000
0.0
0000
0.0
0000
0.0
0000
GJR
-GA
RC
H
0.0
0540
0.0
0340
0.0
0000
0.0
0000
0.0
0000
0.0
0000
0.0
0010
0.0
0000
0.0
0000
0.0
0000
0.0
0000
0.0
0000
FIG
AR
CH
0.8
2010
0.8
0840
0.0
0000
0.0
0000
0.5
2800
0.4
8820
0.0
0070
0.0
0010
0.0
0000
0.0
0000
0.5
5460
0.5
5140
FIA
PAR
CH
0.0
0000
0.0
0000
0.0
0000
0.0
0000
0.0
2640
0.0
0000
0.5
5990
0.5
8510
0.5
1210
0.5
1080
0.0
0000
0.0
0000
R
2 LO
G
GA
RC
H
0.0
0000
0.0
0000
0.5
2630
0.5
3320
0.0
0220
0.0
3110
0.5
0090
0.4
9940
0.0
0380
0.0
0000
0.0
0000
0.0
0000
GJR
-GA
RC
H
0.5
4300
0.5
3100
0.0
0000
0.0
0000
0.5
2890
0.5
2530
0.0
0000
0.0
0000
0.4
8930
0.5
6360
0.4
8960
0.4
9120
FIG
AR
CH
0.0
0000
0.0
0000
0.0
0000
0.0
0000
0.0
0000
0.0
0000
0.0
0000
0.0
0000
0.0
0000
0.0
0000
0.0
0000
0.0
0000
FIA
PAR
CH
0.0
0000
0.0
0000
0.0
0000
0.0
0000
0.0
0000
0.0
0000
0.0
0000
0.0
0000
0.0
0000
0.0
0000
0.0
0000
0.0
0000
No
te: T
he
nu
mb
ers
in b
old
in
dic
ate
s th
e b
est
mo
del
fo
r S
up
erio
r P
red
icti
ve
Ab
ilit
y T
est
Dow
nloa
ded
by [
Kim
Len
g T
an]
at 1
9:32
20
Mar
ch 2
015
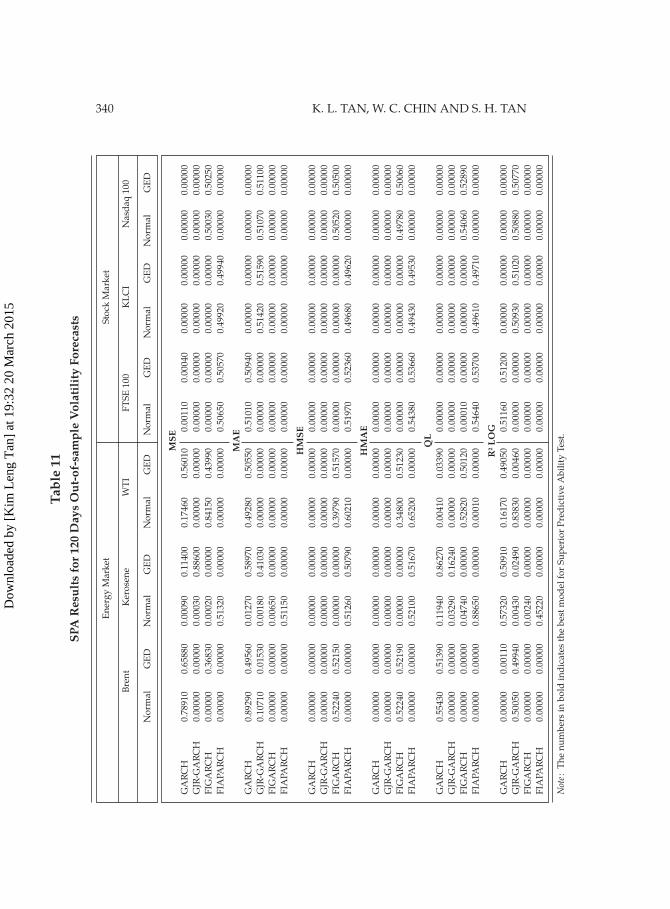
340 K. L. TAN, W. C. CHIN AND S. H. TAN
Tabl
e 11
SPA
Res
ults
for 1
20 D
ays
Out
-of-
sam
ple
Vol
atili
ty F
orec
asts
E
ner
gy
Mark
et
Sto
ck M
ark
et
B
ren
t K
ero
sen
e W
TI
FT
SE
100
KL
CI
Nasd
aq
100
N
orm
al
GE
D
No
rmal
GE
D
No
rmal
GE
D
No
rmal
GE
D
No
rmal
GE
D
No
rmal
GE
D
M
SEG
AR
CH
0.7
8910
0.6
5880
0.0
0090
0.1
1400
0.1
7460
0.5
6010
0.0
0110
0.0
0040
0.0
0000
0.0
0000
0.0
0000
0.0
0000
GJR
-GA
RC
H
0.0
0000
0.0
0000
0.0
0030
0.8
8600
0.0
0000
0.0
0000
0.0
0000
0.0
0000
0.0
0000
0.0
0000
0.0
0000
0.0
0000
FIG
AR
CH
0.0
0000
0.3
6830
0.0
0020
0.0
0000
0.8
4150
0.4
3990
0.0
0000
0.0
0000
0.0
0000
0.0
0000
0.5
0030
0.5
0250
FIA
PAR
CH
0.0
0000
0.0
0000
0.5
1320
0.0
0000
0.0
0000
0.0
0000
0.5
0650
0.5
0570
0.4
9920
0.4
9940
0.0
0000
0.0
0000
M
AE
GA
RC
H
0.8
9290
0.4
9560
0.0
1270
0.5
8970
0.4
9280
0.5
0550
0.5
1010
0.5
0940
0.0
0000
0.0
0000
0.0
0000
0.0
0000
GJR
-GA
RC
H
0.1
0710
0.0
1530
0.0
0180
0.4
1030
0.0
0000
0.0
0000
0.0
0000
0.0
0000
0.5
1420
0.5
1590
0.5
1070
0.5
1100
FIG
AR
CH
0.0
0000
0.0
0000
0.0
0650
0.0
0000
0.0
0000
0.0
0000
0.0
0000
0.0
0000
0.0
0000
0.0
0000
0.0
0000
0.0
0000
FIA
PAR
CH
0.0
0000
0.0
0000
0.5
1150
0.0
0000
0.0
0000
0.0
0000
0.0
0000
0.0
0000
0.0
0000
0.0
0000
0.0
0000
0.0
0000
H
MSE
G
AR
CH
0.0
0000
0.0
0000
0.0
0000
0.0
0000
0.0
0000
0.0
0000
0.0
0000
0.0
0000
0.0
0000
0.0
0000
0.0
0000
0.0
0000
GJR
-GA
RC
H
0.0
0000
0.0
0000
0.0
0000
0.0
0000
0.0
0000
0.0
0000
0.0
0000
0.0
0000
0.0
0000
0.0
0000
0.0
0000
0.0
0000
FIG
AR
CH
0.5
2240
0.5
2150
0.0
0000
0.0
0000
0.3
9790
0.5
1570
0.0
0000
0.0
0000
0.0
0000
0.0
0000
0.5
0520
0.5
0500
FIA
PAR
CH
0.0
0000
0.0
0000
0.5
1260
0.5
0790
0.6
0210
0.0
0000
0.5
1970
0.5
2360
0.4
9680
0.4
9620
0.0
0000
0.0
0000
H
MA
E G
AR
CH
0.0
0000
0.0
0000
0.0
0000
0.0
0000
0.0
0000
0.0
0000
0.0
0000
0.0
0000
0.0
0000
0.0
0000
0.0
0000
0.0
0000
GJR
-GA
RC
H
0.0
0000
0.0
0000
0.0
0000
0.0
0000
0.0
0000
0.0
0000
0.0
0000
0.0
0000
0.0
0000
0.0
0000
0.0
0000
0.0
0000
FIG
AR
CH
0.5
2240
0.5
2190
0.0
0000
0.0
0000
0.3
4800
0.5
1230
0.0
0000
0.0
0000
0.0
0000
0.0
0000
0.4
9780
0.5
0060
FIA
PAR
CH
0.0
0000
0.0
0000
0.5
2100
0.5
1670
0.6
5200
0.0
0000
0.5
4380
0.5
3660
0.4
9430
0.4
9530
0.0
0000
0.0
0000
Q
L G
AR
CH
0.5
5430
0.5
1390
0.1
1940
0.8
6270
0.0
0410
0.0
3390
0.0
0000
0.0
0000
0.0
0000
0.0
0000
0.0
0000
0.0
0000
GJR
-GA
RC
H
0.0
0000
0.0
0000
0.0
3290
0.1
6240
0.0
0000
0.0
0000
0.0
0000
0.0
0000
0.0
0000
0.0
0000
0.0
0000
0.0
0000
FIG
AR
CH
0.0
0000
0.0
0000
0.0
4740
0.0
0000
0.5
2820
0.5
0120
0.0
0010
0.0
0000
0.0
0000
0.0
0000
0.5
4060
0.5
2890
FIA
PAR
CH
0.0
0000
0.0
0000
0.8
8650
0.0
0000
0.0
0010
0.0
0000
0.5
4640
0.5
3700
0.4
9610
0.4
9710
0.0
0000
0.0
0000
R
2 LO
GG
AR
CH
0.0
0000
0.0
0110
0.5
7320
0.5
0910
0.1
6170
0.4
9050
0.5
1160
0.5
1200
0.0
0000
0.0
0000
0.0
0000
0.0
0000
GJR
-GA
RC
H
0.5
0050
0.4
9940
0.0
0430
0.0
2490
0.8
3830
0.0
0460
0.0
0000
0.0
0000
0.5
0930
0.5
1020
0.5
0880
0.5
0770
FIG
AR
CH
0.0
0000
0.0
0000
0.0
0240
0.0
0000
0.0
0000
0.0
0000
0.0
0000
0.0
0000
0.0
0000
0.0
0000
0.0
0000
0.0
0000
FIA
PAR
CH
0.0
0000
0.0
0000
0.4
5220
0.0
0000
0.0
0000
0.0
0000
0.0
0000
0.0
0000
0.0
0000
0.0
0000
0.0
0000
0.0
0000
Not
e : T
he
nu
mb
ers
in b
old
in
dic
ate
s th
e b
est
mo
del
fo
r S
up
erio
r P
red
icti
ve
Ab
ilit
y T
est.
Dow
nloa
ded
by [
Kim
Len
g T
an]
at 1
9:32
20
Mar
ch 2
015
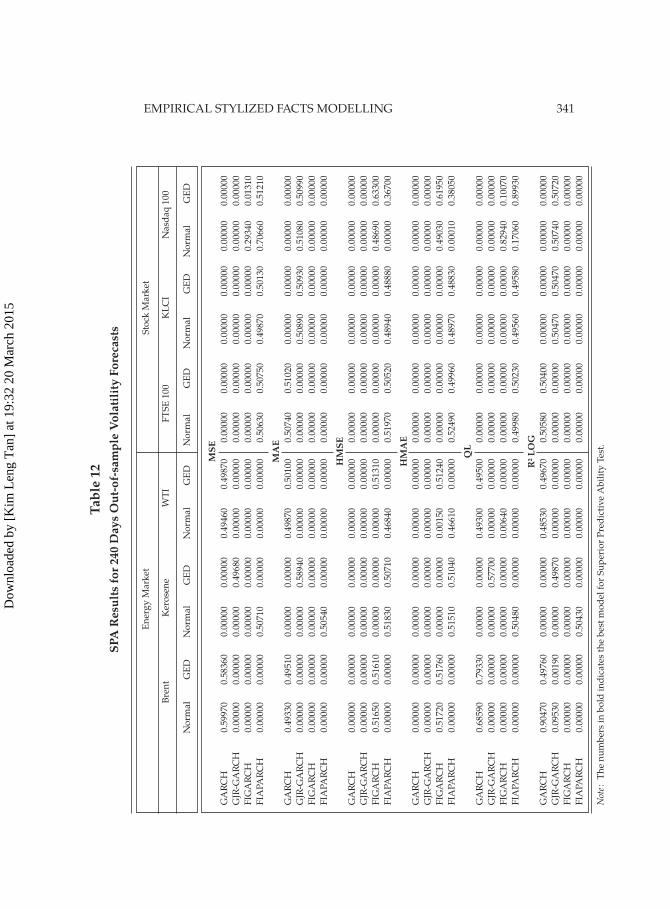
EMPIRICAL STYLIZED FACTS MODELLING 341Ta
ble
12SP
A R
esul
ts fo
r 240
Day
s O
ut-o
f-sa
mpl
e V
olat
ility
For
ecas
ts
E
ner
gy
Mark
et
Sto
ck M
ark
et
B
ren
t K
ero
sen
e W
TI
FT
SE
100
KL
CI
Nasd
aq
100
N
orm
al
GE
D
No
rmal
GE
D
No
rmal
GE
D
No
rmal
GE
D
No
rmal
GE
D
No
rmal
GE
D
M
SEG
AR
CH
0.5
9970
0.5
8360
0.0
0000
0.0
0000
0.4
9460
0.4
9870
0.0
0000
0.0
0000
0.0
0000
0.0
0000
0.0
0000
0.0
0000
GJR
-GA
RC
H
0.0
0000
0.0
0000
0.0
0000
0.4
9680
0.0
0000
0.0
0000
0.0
0000
0.0
0000
0.0
0000
0.0
0000
0.0
0000
0.0
0000
FIG
AR
CH
0.0
0000
0.0
0000
0.0
0000
0.0
0000
0.0
0000
0.0
0000
0.0
0000
0.0
0000
0.0
0000
0.0
0000
0.2
9340
0.0
1310
FIA
PAR
CH
0.0
0000
0.0
0000
0.5
0710
0.0
0000
0.0
0000
0.0
0000
0.5
0630
0.5
0750
0.4
9870
0.5
0130
0.7
0660
0.5
1210
M
AE
GA
RC
H
0.4
9330
0.4
9510
0.0
0000
0.0
0000
0.4
9870
0.5
0100
0.5
0740
0.5
1020
0.0
0000
0.0
0000
0.0
0000
0.0
0000
GJR
-GA
RC
H
0.0
0000
0.0
0000
0.0
0000
0.5
8940
0.0
0000
0.0
0000
0.0
0000
0.0
0000
0.5
0890
0.5
0930
0.5
1080
0.5
0990
FIG
AR
CH
0.0
0000
0.0
0000
0.0
0000
0.0
0000
0.0
0000
0.0
0000
0.0
0000
0.0
0000
0.0
0000
0.0
0000
0.0
0000
0.0
0000
FIA
PAR
CH
0.0
0000
0.0
0000
0.5
0540
0.0
0000
0.0
0000
0.0
0000
0.0
0000
0.0
0000
0.0
0000
0.0
0000
0.0
0000
0.0
0000
H
MSE
GA
RC
H
0.0
0000
0.0
0000
0.0
0000
0.0
0000
0.0
0000
0.0
0000
0.0
0000
0.0
0000
0.0
0000
0.0
0000
0.0
0000
0.0
0000
GJR
-GA
RC
H
0.0
0000
0.0
0000
0.0
0000
0.0
0000
0.0
0000
0.0
0000
0.0
0000
0.0
0000
0.0
0000
0.0
0000
0.0
0000
0.0
0000
FIG
AR
CH
0.5
1650
0.5
1610
0.0
0000
0.0
0000
0.0
0000
0.5
1310
0.0
0000
0.0
0000
0.0
0000
0.0
0000
0.4
8690
0.6
3300
FIA
PAR
CH
0.0
0000
0.0
0000
0.5
1830
0.5
0710
0.4
6840
0.0
0000
0.5
1970
0.5
0520
0.4
8940
0.4
8880
0.0
0000
0.3
6700
H
MA
EG
AR
CH
0.0
0000
0.0
0000
0.0
0000
0.0
0000
0.0
0000
0.0
0000
0.0
0000
0.0
0000
0.0
0000
0.0
0000
0.0
0000
0.0
0000
GJR
-GA
RC
H
0.0
0000
0.0
0000
0.0
0000
0.0
0000
0.0
0000
0.0
0000
0.0
0000
0.0
0000
0.0
0000
0.0
0000
0.0
0000
0.0
0000
FIG
AR
CH
0.5
1720
0.5
1760
0.0
0000
0.0
0000
0.0
0150
0.5
1240
0.0
0000
0.0
0000
0.0
0000
0.0
0000
0.4
9030
0.6
1950
FIA
PAR
CH
0.0
0000
0.0
0000
0.5
1510
0.5
1040
0.4
6610
0.0
0000
0.5
2490
0.4
9960
0.4
8970
0.4
8830
0.0
0010
0.3
8050
Q
LG
AR
CH
0.6
8590
0.7
9330
0.0
0000
0.0
0000
0.4
9300
0.4
9500
0.0
0000
0.0
0000
0.0
0000
0.0
0000
0.0
0000
0.0
0000
GJR
-GA
RC
H
0.0
0000
0.0
0000
0.0
0000
0.5
7700
0.0
0000
0.0
0000
0.0
0000
0.0
0000
0.0
0000
0.0
0000
0.0
0000
0.0
0000
FIG
AR
CH
0.0
0000
0.0
0000
0.0
0000
0.0
0000
0.0
0640
0.0
0000
0.0
0000
0.0
0000
0.0
0000
0.0
0000
0.8
2940
0.1
0070
FIA
PAR
CH
0.0
0000
0.0
0000
0.5
0480
0.0
0000
0.0
0000
0.0
0000
0.4
9980
0.5
0230
0.4
9560
0.4
9580
0.1
7060
0.8
9930
R
2 LO
GG
AR
CH
0.9
0470
0.4
9760
0.0
0000
0.0
0000
0.4
8530
0.4
9670
0.5
0580
0.5
0400
0.0
0000
0.0
0000
0.0
0000
0.0
0000
GJR
-GA
RC
H
0.0
9530
0.0
0190
0.0
0000
0.4
9870
0.0
0000
0.0
0000
0.0
0000
0.0
0000
0.5
0470
0.5
0470
0.5
0740
0.5
0720
FIG
AR
CH
0.0
0000
0.0
0000
0.0
0000
0.0
0000
0.0
0000
0.0
0000
0.0
0000
0.0
0000
0.0
0000
0.0
0000
0.0
0000
0.0
0000
FIA
PAR
CH
0.0
0000
0.0
0000
0.5
0430
0.0
0000
0.0
0000
0.0
0000
0.0
0000
0.0
0000
0.0
0000
0.0
0000
0.0
0000
0.0
0000
Not
e : T
he
nu
mb
ers
in b
old
in
dic
ate
s th
e b
est
mo
del
fo
r S
up
erio
r P
red
icti
ve
Ab
ilit
y T
est.
Dow
nloa
ded
by [
Kim
Len
g T
an]
at 1
9:32
20
Mar
ch 2
015
342 K. L. TAN, W. C. CHIN AND S. H. TAN
4. Conclusion
There are two important contributions in this study: fi rst is to exam-
ine and compare the similarities and diff erences of stylized facts behav-
iour between energy and stock markets; second, is to compare the perfor-
mances of two or more forecasting models and subsequently highlight the
best forecast models.
The stylized facts of energy markets and stock markets are examined
using some ARCH family models. Both energy markets and stock markets
show a persistence and positively correlated absolute returns, which is a
main sign for long memory and clustering volatility. Besides that, the two
markets also display a hyperbolic rather than exponential rate of decay
of volatility shocks. In contrary for leverage eff ect, energy markets show
no response on ‘good’ or ‘bad’ news while stock markets indicate a lever-
age eff ect. For risk and return relationship analysis, the ARCH-in-Mean
models have found that only the energy commodities exhibit a signifi cant
risk-return tradeoff while none of the stock indices indicate the eff ect on
risk-return tradeoff .
For out of sample forecasting performance, the simplest GARCH
model fi ts better over short time horizon whereas the FIAPARCH model
performs better over long time horizon in stock markets. Meanwhile for
energy markets, we found that the FIGARCH model suits better in short
horizon forecasts as compared to long term. Nevertheless, the reliability
and robustness of the forecasts are tested using SPA test. The results high-
light that long memory GARCH model is a better choice than the standard
GARCH for both energy and stock markets. However, there is no single
model displays superior results in all markets. Hence, in order to choose
the best forecast model, economists and fi nancial analysts should take into
consideration the complexity, parsimonious principles and actual perfor-
mance of out of sample forecasts.
In future, analysis can be extended to determine market risks using
Value at Risk (VaR) for a single or cross markets. This further study al-
lows us to identify market risk exposures and sensitivities to the diff er-
ent risk factors which could be the guidance for portfolio analysis and
hedging.
Dow
nloa
ded
by [
Kim
Len
g T
an]
at 1
9:32
20
Mar
ch 2
015
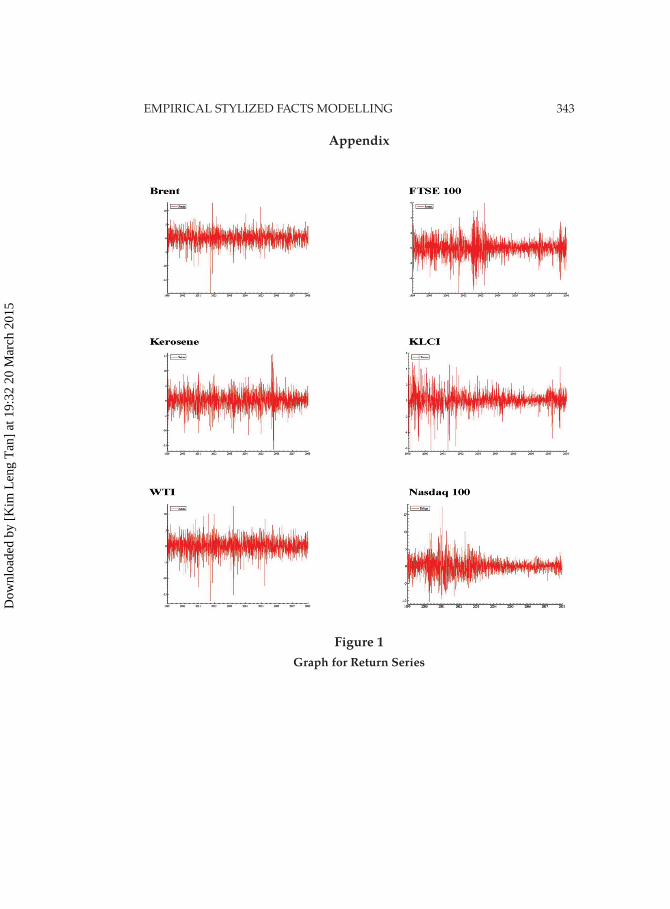
EMPIRICAL STYLIZED FACTS MODELLING 343
Appendix
Figure 1Graph for Return Series
Dow
nloa
ded
by [
Kim
Len
g T
an]
at 1
9:32
20
Mar
ch 2
015
344 K. L. TAN, W. C. CHIN AND S. H. TAN
References
[1] Aguilar, M. and Matthew, R. Information arrivals, frictions, and vol-
atility. Institute of Quantitative Research in Finance, New York, United
Sates of America, 2011.
[2] Bhattacharya, S. Nath and Bhattacharya, M. Long memory in stock
returns: A study of emerging markets. Iranian Journal of Management Studies. Vol. 5(2), 2012, pp. 67–88.
[3] Biggerstaff , B. J., Comparing diagnostic tests: A simple graphic using
likelihood ratios. Stat. Med. Vol. 19(5), 1999, pp. 649–663.
[4] Black, F. Studies in Stock Price Volatility Changes. In: Proceedings
of the Business and Economic Statistics Section, American Statistical Association. 1976, pp. 177–181.
[5] Bollerslev, T. Generalized autoregressive conditional heteroskedas-
ticity. Journal of Econometrics. Vol. 31, 1986, pp. 307–327.
[6] Baillie, T. Richard, Tim, B. Hans, O. Mikkelsen, Modeling and pricing
long-memory in stock market volatility. Journal of Econometrics. Vol.
73, 1996, pp. 151–184.
[7] Butler, K. C., William, C. Gerken., and Katsushi, O. A test for long
memory in the conditional correlation of bivariate returns to stock
and bond market index futures. Working Paper, Institute of Fraud
Prevention, United States of America, 2011.
[8] Chen, X., and Ghysels, E. News-good or bad- and its impact on
volatility predictions over multiple horizons. The Review of Financial Studies. Vol. 24, 2010, pp. 46–81.
[9] Chin, W. C. Modeling and forecasting crude oil markets using ARCH-
type Models. Energy Policy. Vol. 37, 2009, pp. 2346–2355.
[10] Chong, J. and Joëlle, M. Conditional correlation and volatility in
commodity futures and traditional asset markets. The Journal of Alter-native Investment. Vol. 12(3), 2010, pp. 61–75.
[11] Cont, R. Empirical properties of asset returns: Stylized facts and sta-
tistical Issues. Quantitative Finance. Vol. 1, 2001, pp. 223–236.
[12] Cont, R. Volatility clustering in fi nancial markets: Empirical facts and
agent–based models. A Kirman & G Teyssiere (eds.): Long memory
in economics, Springer, 2005.
[13] Cont, R. Wiley: Frontiers in Quantitative Finance, 2008.
Dow
nloa
ded
by [
Kim
Len
g T
an]
at 1
9:32
20
Mar
ch 2
015
EMPIRICAL STYLIZED FACTS MODELLING 345
[14] Creti, A., Marc, J., and Valerie, M. On the links between stock and
commodity markets’ volatility. EconomiX Working Papers, Univer-
sity of Paris West-Nanterre la Défense, EconomiX, 2012.
[15] Dellate, A. and Claude, L. Commodity and equity markets: Some
stylized facts from a Copula approach. MPRA Paper 39860, Univer-
sity Library of Munich, Germany, 2012.
[16] Ding, Z., Clive, W. J. Granger, and Robert, F. Engle. A long memory
property of stock market returns and a new model. Journal of Empiri-cal Finance. Vol. 1, 1993, pp. 83–106.
[17] Giot, P., and Sebastien, L., Modeling daily value-at-risk using real-
ized volatility and ARCH-type models. Journal of Empirical Finance.
Vol. 11(3), 2004, pp. 379–398.
[18] Glosten, R. Lawrence, Ravi, J., David, and E. Runkle. On the relation
between the expected value and the volatility of the nominal excess
return on stocks. Journal of Finance. Vol. 48(5), 1993, pp. 1779–1801.
[19] Gorton, G. and Rouwenhorst, K. G. Facts and fantasies about com-
modity Futures. Financial Analysis Journal, Vol. 62(2), 2005, pp. 47–68.
[20] Hansen, P. R. A test for superior predictive ability. Journal of Busines-sand Economic Statistics. Vol. 23, 2005, pp. 365–380.
[21] Hansen, P. R. and Lunde, A. A realized variance for the whole day
based on intermittent high-frequency data. Journal of Financial Econo-metrics. Vol. 3(4), 2005, pp. 525–554.
[22] He, L. Y., and Zheng, F. Empirical evidence of some stylized facts in
international crude oil markets. Complex Systems, Vol. 17, 2008, pp.
413–425.
[23] Henri, N. Dynamic probit Models and fi nancial variables in recession
forecasting. Journal of Forecasting. Vol. 29, 2010, pp. 215–230.
[24] Hong, H., and Motohiro, Y. Digging into commodities. Working
Paper, Princeton University, 2009.
[25] Ismail, E. A. Asymmetric volatility, leverage eff ect and fi nancial lever-
age: A stock market and fi rm-level analysis. Journal of Middle Eastern of Finance and Economics. Vol. 15, 2011, pp. 164–186.
[26] Kaufmann, R. K., and Cheryl, L. Causes for an asymmetric rela-
tion between the price of crude oil and refi ned petroleum products.
Energy Policy. Vol. 33, 2005, pp. 1587–1596.
Dow
nloa
ded
by [
Kim
Len
g T
an]
at 1
9:32
20
Mar
ch 2
015
346 K. L. TAN, W. C. CHIN AND S. H. TAN
[27] Kirchler, M., and Jurgen, H. Fat tails and volatility clustering in ex-
perimental asset markets. Journal of Economic Dynamics and Control. Vol. 31, 2007, pp. 1844–1874.
[28] Koopman, S. J., Jungbacker, B., and Hol, E. Forecasting daily variabil-
ity of the S&P 100 stock index using historical, realised and implied
volatility measurements. Journal of Empirical Finance. Vol. 12(3), 2005,
pp. 445–475.
[29] Lee, C. C., and Lee, J. D. Energy prices, multiple structural breaks,
and eff icient market hypothesis. Applied Energy. Vol. 86, 2009, pp.
466–479.
[30] Li, Y., Philip, H., and Kwaku, O. Do benchmark African equity indi-
ces exhibit the stylized facts?. Global Finance Journal. Vol. 21(1), 2010,
pp. 71–97.
[31] Mandelbrot, B. The variation of certain speculative prices. The Journal of Business. Vol. 36(4), 1963, pp. 394–419.
[32] Mukherjee, I., Sen, C., and Sarkar, A. Study of stylized facts in In-
dian fi nancial markets. International Journal of Applied Economics and Finance. Vol. 5(2), 2011, pp. 127–137.
[33] Paytakhti Oskooe, S. A., and Shamsavari, A. Asymmetric volatility in
emerging markets: A case from Iran. International Journal of Finance and Economics. Vol. 3(6), 2011, pp. 15–24.
[34] Pagan, A., The econometrics of fi nancial markets. Journal of Empirical Finance. Vol. 3, 1996, pp. 15–102.
[35] Regnier, E. D., Oil and energy price volatility. Energy Economics. Vol.
29(3), 2007, pp. 405–427.
[36] Salisu, A. A., and Fasanya, I. O. Comparative performance of volatil-
ity models for oil price. International Journal of Energy Economics and Policy. Vol. 2(3), 2012, pp. 167–183.
[37] Silvennoinen, A. and Susan, T. Financialization, crisis and commod-
ity correlation dynamics. Research paper series 267. Quantitative
Finance Research Centre, University of Technology, Sydney, 2010.
[38] Suliman Abdalla, S. Z. Modeling stock returns volatility: Empirical
evidence from Saudi stock exchange. International Research Journal of Finance and Economics. Vol. 85, 2012, pp. 166–179.
[39] Sullivan, R., Timmermann, A., and White, H. Data-snooping, techni-
cal trading rule performance, and the bootstrap. Journal of Finance.
Vol. 54(5), 1999, pp. 1647–1691.
Dow
nloa
ded
by [
Kim
Len
g T
an]
at 1
9:32
20
Mar
ch 2
015
EMPIRICAL STYLIZED FACTS MODELLING 347
[40] Tse, Y. K. The conditional heteroscedasticity of the Yen–dollar
exchange rate. Journal of Applied Economics. Vol. 13, 1998, pp. 49–55.
[41] Wei, Y., Wang, Y. D., and Huang, D. S. Forecasting crude oil market
volatility: Further evidence using GARCH-class models. Energy Policy. Vol. 32, 2010, pp. 1477–1484.
[42] White, H. A reality check for data snooping. Econometrica. Vol. 68,
2000, pp. 1097–1126.
Received September 2013
Dow
nloa
ded
by [
Kim
Len
g T
an]
at 1
9:32
20
Mar
ch 2
015