Empirical Analysis of the Bug Fixing Process in Open Source Projects
10
Empirical Analysis of the Bug Fixing Process in Open Source Projects Chiara Francalanci and Francesco Merlo Dipartimento di Elettronica ed Informazione, Politecnico di Milano via Ponzio 34/5, I-20133 Milano, Italy {francala | merlo}@elet.polimi.it Abstract. Monitoring the performance of processes is often considered critical in classic engineering fields. However, in the area of software engineering (and especially in the Open Source context) it seems that the literature has not yet taken into consideration the problem of identifying the process characteristics and performance of debugging. The aim of this paper is the identification of the performance characteristics of the bug fixing process of Open Source applications, focusing on continuity and efficiency indicators. The importance of such indicators is even more relevant today, since Open Source software is now adopted also in many business contexts. We have analyzed the debugging process of 9 active and popular Open Source projects, collecting a dataset comprising more than 65,000 closed bugs. Results have highlighted four types of bug fixing processes that can be distinguished by considering temporal continuity and efficiency dimensions. Key Words: Open Source Software debugging process quality 1 Introduction Debugging is defined in [9] as “the activity of locating and correcting errors” in software programs. It is an important part of the software development and maintenance process, since a lot of time is spent by developers in activities related to the location and resolution of bugs. As pointed out by a NIST research [21], software bugs are so prevalent and so detrimental that they cost the U.S. economy an estimated $59.5 billion annually, or about 0.6 percent of the gross domestic product. In the literature, many studies have focused on debugging. Relevant results have been achieved in the field of software testing, with the aim of detecting the presence of errors in programs. An overview of software testing can be found in [16, 2, 13, 9]. However, as noted by [9], debugging is “one of the least understood activities in software development and is practiced with the least amount of discipline; it is often approached with much hope and little planning”. In particular, one of the most difficult problems is bug localization, that is, finding where bugs are located in the Please use the following format when citing this chapter: Francalanci, C. and Merlo, F., 2008, in IFIP International Federation for Information Processing, Volume 275; Open Source Development, Communities and Quality; Barbara Russo, Ernesto Damiani, Scott Hissam, Björn Lundell, Giancarlo Succi; (Boston: Springer), pp. 187–196.
Transcript of Empirical Analysis of the Bug Fixing Process in Open Source Projects

Empirical Analysis of the Bug Fixing Process in Open Source Projects
Chiara Francalanci and Francesco Merlo Dipartimento di Elettronica ed Informazione, Politecnico di Milano
via Ponzio 34/5, I-20133 Milano, Italy {francala | merlo}@elet.polimi.it
Abstract. Monitoring the performance of processes is often considered critical in classic engineering fields. However, in the area of software engineering (and especially in the Open Source context) it seems that the literature has not yet taken into consideration the problem of identifying the process characteristics and performance of debugging. The aim of this paper is the identification of the performance characteristics of the bug fixing process of Open Source applications, focusing on continuity and efficiency indicators. The importance of such indicators is even more relevant today, since Open Source software is now adopted also in many business contexts. We have analyzed the debugging process of 9 active and popular Open Source projects, collecting a dataset comprising more than 65,000 closed bugs. Results have highlighted four types of bug fixing processes that can be distinguished by considering temporal continuity and efficiency dimensions.
Key Words: Open Source Software debugging process quality
1 Introduction
Debugging is defined in [9] as “the activity of locating and correcting errors” in software programs. It is an important part of the software development and maintenance process, since a lot of time is spent by developers in activities related to the location and resolution of bugs. As pointed out by a NIST research [21], software bugs are so prevalent and so detrimental that they cost the U.S. economy an estimated $59.5 billion annually, or about 0.6 percent of the gross domestic product.
In the literature, many studies have focused on debugging. Relevant results have been achieved in the field of software testing, with the aim of detecting the presence of errors in programs. An overview of software testing can be found in [16, 2, 13, 9]. However, as noted by [9], debugging is “one of the least understood activities in software development and is practiced with the least amount of discipline; it is often approached with much hope and little planning”. In particular, one of the most difficult problems is bug localization, that is, finding where bugs are located in the
Please use the following format when citing this chapter:
Francalanci, C. and Merlo, F., 2008, in IFIP International Federation for Information Processing, Volume 275; OpenSource Development, Communities and Quality; Barbara Russo, Ernesto Damiani, Scott Hissam, Björn Lundell, Giancarlo Succi; (Boston: Springer), pp. 187–196.

188 Chiara Francalanci and Francesco Merlo
source code (as opposed to testing, which is concerned with the identification of the presence of bugs). Consequently, bug localization is one of the most widely addressed problems. Techniques such as statistical debugging [20, 12, 25, 17, 1] try to identify bug predictors (e.g., software quality metrics like CK object-oriented metrics [5]) that may refer to the actual bug location.
Although some studies have already been published [15, 6, 19, 14, 7], it seems that the problem of identifying the process characteristics and performance of debugging has not been taken into account yet.
For other “classic” engineering processes, performance indicators are considered critical. The importance of such indicators is even more relevant today since Open Source software is now adopted also in many business contexts. As noted by Wasserman and Capra [24], Goldman [10], Goth [11] and Riehle [18], when evaluating an Open Source product for business adoption a number of variables different from those considered for the classical proprietary software should be taken into account. For example, the quality of the support provided by the community, or the quality of the bug fixing process itself are cited as new software selection variables to be taken into account in the Open Source context.
The aim of this paper is the identification of the performance characteristics of the bug fixing process of Open Source applications that can be used as indicators to assess the quality of the process itself. In particular, our goal is to focus on variables related to the continuity and efficiency of the bug fixing process, since these characteristics are among the most relevant when assessing debugging performance, especially in a business context.
The paper is structured as follows: Section 2 describes the data sample we have used for the analysis of bug fixing processes, Section 3 presents the analysis and the related empirical results, while Section 4 discusses the main findings and presents some concluding remarks on this work.
2 Data Sample
The dataset used for this study is composed by 9 active and popular Open Source projects: Table 1 shows the summary descriptive statistics of the dataset. Each application is identified by a mnemonic code.
A tool developed ad-hoc has been used to collect data. In particular, the tool has been used to parse the information provided by the bug tracker of each project. In order to guarantee the homogeneity of the collected dataset, we have used the same parameters to query each bug tracker. That is, we have focused on bugs with closed status related only to Microsoft Windows and Linux operating systems. Moreover, we have excluded all external components or additional plugins, analyzing only bugs located in the core components of each project (the project sizes reported in Table 1 are however related to the whole applications).
Empirical Analysis of the Bug Fixing Process in Open Source Projects 189
Table 1. Dataset summary statistics.
Mnemonic Code
Domain Size (KSLOC)
Collected Bugs
Time span (months)
Bug tracking Tool
A IDE 2,063 51,485 65.4 Apache’s JIRA B IDE 152 2,529 76.6 SF Tracker Tool C DBMS 713 8,478 48.5 bugs.php.net Bugs Sys D DBMS 810 997 26.2 Apache’s JIRA E DBMS 660 577 78.8 SF Tracker Tool F DBMS 159 737 65.9 SF Tracker Tool G DBMS 392 515 34.0 SF Tracker Tool H DBMS 522 270 65.8 Apache’s JIRA I DBMS 153 713 8.0 Apache’s JIRA
TotalAverage
5,624 624
66,3017,367
ns52.1
The selection of bugs related to the core components of each application has been performed by manually specifying the correct parameters when querying the bug tracking systems. After the data collection phase, a manual data preprocessing has been carried out to ensure data cleaning and normalization. For each bug, we have collected information about its status (either opened or closed), the opening and closing dates, the affected project component, the level of priority/severity, the textual description, the application version affected and the operating system.
3 Empirical Analyses and Results
This section presents the analyses that we have performed on our dataset and related empirical results. In particular, we have focused our analyses on the time required to close bugs (referred to as MTTR - Mean Time To Repair, by analogy with hardware systems), defined for a generic bug b as follows:
MTTR(b) = dateclosed(b) - dateopened(b),
where dateclosed(b) and dateopened(b) refer to the change of bug status (closed and open, respectively) registered by the project bug tracker tool. As a consequence, we have focused our analyses only on closed bugs.
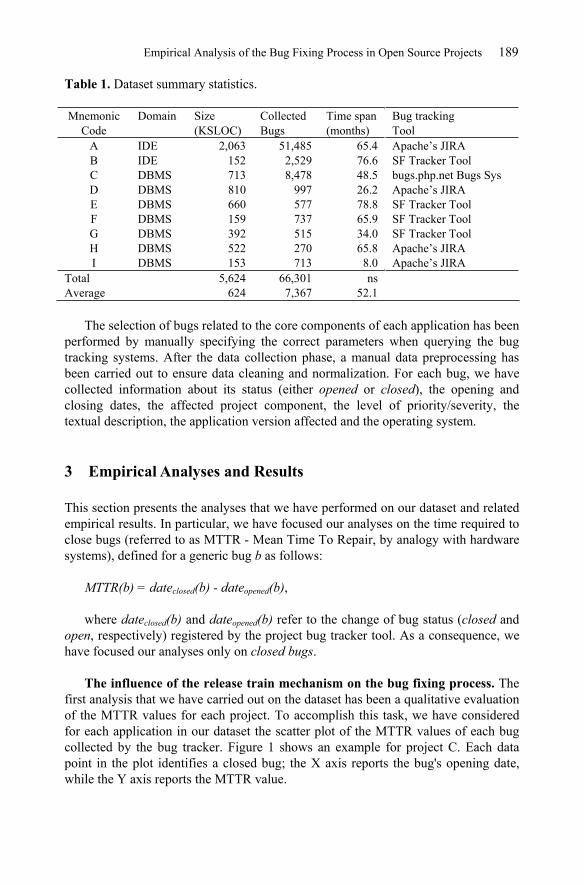
The influence of the release train mechanism on the bug fixing process. The first analysis that we have carried out on the dataset has been a qualitative evaluation of the MTTR values for each project. To accomplish this task, we have considered for each application in our dataset the scatter plot of the MTTR values of each bug collected by the bug tracker. Figure 1 shows an example for project C. Each data point in the plot identifies a closed bug; the X axis reports the bug's opening date, while the Y axis reports the MTTR value.
190 Chiara Francalanci and Francesco Merlo
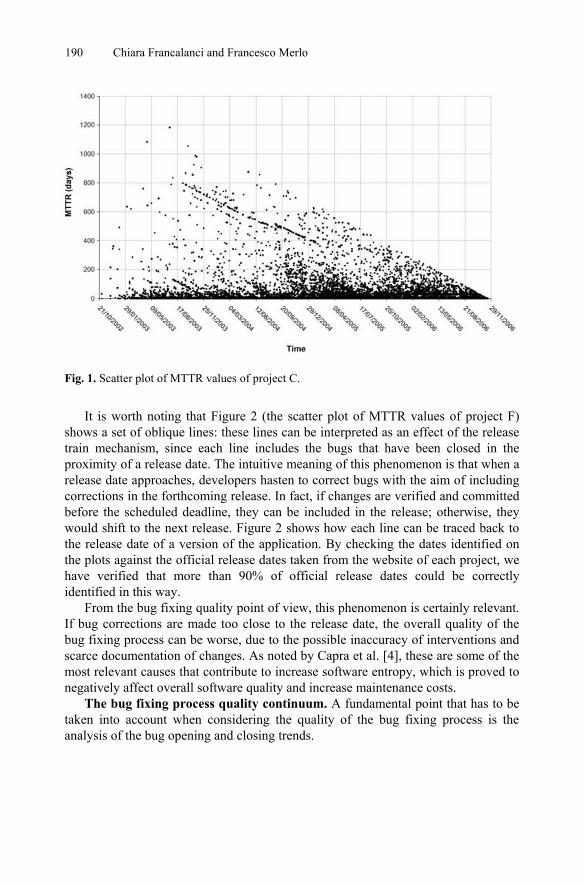
It is worth noting that Figure 2 (the scatter plot of MTTR values of project F) shows a set of oblique lines: these lines can be interpreted as an effect of the release train mechanism, since each line includes the bugs that have been closed in the proximity of a release date. The intuitive meaning of this phenomenon is that when a release date approaches, developers hasten to correct bugs with the aim of including corrections in the forthcoming release. In fact, if changes are verified and committed before the scheduled deadline, they can be included in the release; otherwise, they would shift to the next release. Figure 2 shows how each line can be traced back to the release date of a version of the application. By checking the dates identified on the plots against the official release dates taken from the website of each project, we have verified that more than 90% of official release dates could be correctly identified in this way.
From the bug fixing quality point of view, this phenomenon is certainly relevant. If bug corrections are made too close to the release date, the overall quality of the bug fixing process can be worse, due to the possible inaccuracy of interventions and scarce documentation of changes. As noted by Capra et al. [4], these are some of the most relevant causes that contribute to increase software entropy, which is proved to negatively affect overall software quality and increase maintenance costs.
The bug fixing process quality continuum. A fundamental point that has to be taken into account when considering the quality of the bug fixing process is the analysis of the bug opening and closing trends.
Fig. 1. Scatter plot of MTTR values of project C.
Empirical Analysis of the Bug Fixing Process in Open Source Projects 191
The bug opening trend is related to the process of submission and acceptance of new bugs by considering the cumulated number of opened and verified bugs over time. The bug closing trend is the cumulated number of bugs that are resolved and closed over time. Figure 3 shows an example of bug opening and closing trend curves. As it can be noted, the distance between the two curves at a given point in time represents the number of bugs simultaneously open at that time. The closing trend curve can be directly derived from the distribution of MTTR values: for each time interval (typically on a daily basis), the increment of the closing trend curve is equal to the number of closed bugs in that time interval.
A high quality debugging process is generally considered to be continuous over time [23]. That is, there should not be any discontinuity in the debugging process and the number of closed bugs should grow at least as fast as the number of opened bugs to avoid the uncontrolled growth of unresolved bugs.
The characteristics of the ideal bug fixing process can be translated into visual properties of the bug opening and closing trend curves:
Process continuity - trend smoothness: if the bug fixing process is continuous, then the closing trend curve is smooth and without peaks or steps. Process efficiency - number of open bugs: if the debugging process is efficient (i.e., bugs are closed at least at the same rate with which they are opened), the closing trend curve stays near to the opening trend curve, without increasing the overall number of open bugs.
Fig. 2. Influence of the release train mechanism on bug fixing process of project F.

192 Chiara Francalanci and Francesco Merlo
Based on these considerations, it is possible to assess different quality levels of the bug fixing process by analyzing the bug opening and closing trend curves. It is worth noting that, at this point, evaluations are qualitative. Figure 4 shows four examples of trend curves for projects in our dataset, ordered by the quality level of the bug fixing process. As it can be noted, a high variance of the quality level of the bug fixing process can be identified among the projects in our dataset.
Sample bug fixing processes: a) project E; b) project I; c) project D; d) project B.
Fig. 3. Bug opening and closing trends.
Fig. 4.
Empirical Analysis of the Bug Fixing Process in Open Source Projects 193
Case a) of Figure 4 denotes a low quality bug fixing process since the closing trend shows a step, corresponding to a mass correction of bugs. At the opposite end, case d) can be considered as a high quality bug fixing process: the closing trend curve is smooth and very close to the opening trend curve. Cases b) and c) are positioned along the quality continuum between these two extremes: case b)represents a discontinuous process since the closing curve shows numerous steps, while case c) is a more continuous but not efficient process, since the closing trend curve is quite far from the opening trend curve. Please note that these considerations are not influenced by the fact that in practice there might be some bugs that are never fixed, as noted for example by [7]: since this seems to be a very common problem [14, 7, 22], it can be considered a common bias uniformly spread across projects.
The projects in our dataset can thus be divided into four categories on the basis of the visual properties of the opening and closing curves: a) Inefficient and discontinuous; b) Inefficient and continuous; c) Efficient and discontinuous; d) Efficient and continuous.
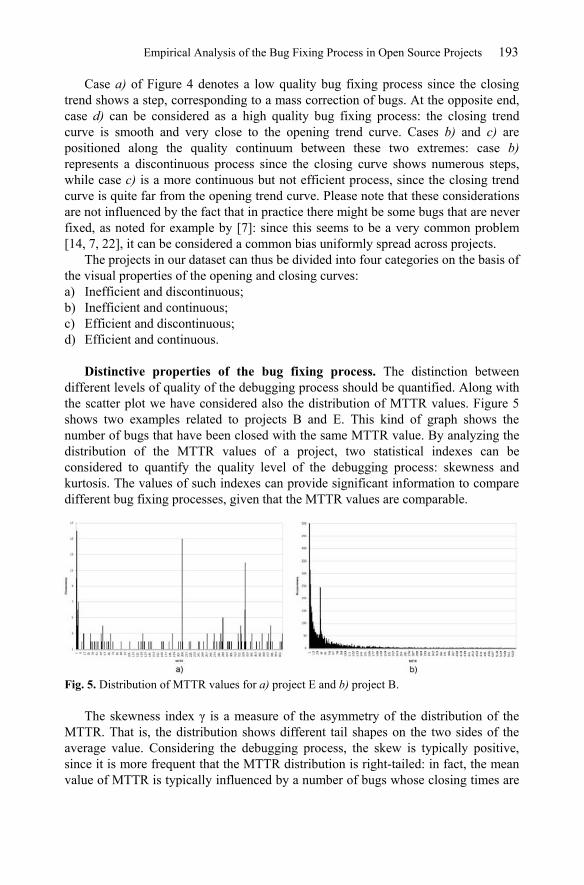
Distinctive properties of the bug fixing process. The distinction between different levels of quality of the debugging process should be quantified. Along with the scatter plot we have considered also the distribution of MTTR values. Figure 5 shows two examples related to projects B and E. This kind of graph shows the number of bugs that have been closed with the same MTTR value. By analyzing the distribution of the MTTR values of a project, two statistical indexes can be considered to quantify the quality level of the debugging process: skewness and kurtosis. The values of such indexes can provide significant information to compare different bug fixing processes, given that the MTTR values are comparable.
The skewness index is a measure of the asymmetry of the distribution of the MTTR. That is, the distribution shows different tail shapes on the two sides of the average value. Considering the debugging process, the skew is typically positive, since it is more frequent that the MTTR distribution is right-tailed: in fact, the mean value of MTTR is typically influenced by a number of bugs whose closing times are
Fig. 5. Distribution of MTTR values for a) project E and b) project B.

194 Chiara Francalanci and Francesco Merlo
much higher than the average one (i.e., a high value of skewness can be considered as indicator of the presence of “superbugs”, see [7]).
The kurtosis index is a measure of the peakedness of the distribution of the MTTR. Higher kurtosis values indicate that most of the variance is due to a few very high deviations, as opposed to frequent small deviations from the mean value of MTTR. From the bug fixing process point of view, a high kurtosis means that the variance of the MTTR distribution can be explained by a few bugs that have required extremely long closing times. As a consequence, high kurtosis values are desirable, since they can be considered as an index of efficiency. For instance, by considering case a) of Figure 5, it is clear that many bugs show a closing time much higher than the average MTTR value, while in case b) the number of bugs with very high MTTR is considerably lower and negligible with respect to case a).
4 Conclusions
Results indicate that the release train mechanism, widely adopted in the Open Source context, affects the debugging process. In particular, there is empirical evidence that a great number of bugs tends to be resolved close to scheduled releases. From a project management point of view, this phenomenon should be taken into account when scheduling releases, since if they are too frequent the quality of interventions for bug resolution could be lowered. Consequently, software entropy could be increased, leading to higher maintenance costs/effort. From the user point of view, a project with a debugging process that is too affected by the release train mechanism could be less dependable due to inaccurate bug corrections.
Another relevant empirical result is that even in the Open Source context, which is commonly addressed to as a high quality software development practice [8, 3], the quality of the bug fixing process is extremely variable. The projects in our dataset showed different quality levels, which can be positioned along a continuum depending on the performance of the bug fixing process.
The quantitative distinction between different bug fixing quality levels can be measured by means of two statistical indexes of the MTTR distribution, namely skewness and kurtosis. These indexes measure two relevant characteristics of the debugging process, temporal continuity and efficiency.
Future work is focused at extending the empirical data set of applications to provide better statistical significance and at better understanding the skewness and kurtosis indexes from a software development process point of view.
Acknowledgements
We would like to thank Marco Balzarini for his support in the data collection and analysis phases.
Empirical Analysis of the Bug Fixing Process in Open Source Projects 195
References
1. The cooperative bug isolation project. http://www.cs.wisc.edu/cbi. 2. B. Beizer. Software Testing Techniques. John Wiley and Sons, New York, 1983. 3. Boulanger. Open source versus proprietary software: is one more reliable and secure
that the other? IBM Systems Journal, vol. 44, no.2:p. 239, 2005. 4. E. Capra, C. Francalanci, and F. Merlo. The economics of open source software: An
empirical analysis of maintenance costs. In Proc. Int'l Conf. Software Maintenance, pages 395-404, 2007.
5. S. Chidamber and C. Kemerer. A metrics suite for object-oriented design. IEEE Trans. Software Eng., vol.20, no. 6:pp. 476-493, 1994.
6. K. Crowston and B. Scozzi. Coordination practices for bug fixing within FLOSS development teams. In Proceedings of CSAC, 2004.
7. J. M. Dalle and M. den Besten. Different bug fixing regimes? a preliminary case for superbugs. In Proceedings of OSS Systems Conference, pages 247-252, 2007.
8. Fitzgerald. A critical look at open source. IEEE Computer, vol. 37, no. 7:pp.92-94, 2004.
9. Ghezzi, M. Jazayeri, and D. Mandrioli. Fundamentals of Software Engineering. Prentice Hall, New Jersey, 2003.
10. R. Goldman and R. Gabriel. Innovation happens elsewhere: Open Source as business strategy. Morgan Kauffmann, 2005.
11. G. Goth. Open source business models: ready for prime time. IEEE Software, vol. 22, no. 3:pp. 99-100, 2005.
12. T. Gyimothy, R. Ferenc, and I. Siket. Empirical validation of object-oriented metrics on open source software for fault prediction. IEEE Trans. Software Eng., vol. 31, no. 10:pp. 897-910, 2005.
13. W. E. Howden. Functional program testing. McGraw Hill, New York, 1987. 14. M. Michlmayr and A. Senyard. The Economics of Open Source Software
Development, chapter A Statistical analysis of defects in Debian and strategies for improving quality in free software projects, pages 131-148. Elsevier B. V., 2006.
15. Mockus, R. T. Fielding, and J. D. Herbsleb. Two case studies of open source software development. ACM Transactions on Software Engineering Methodology, vol. 11:pp. 309-346, 2002.
16. G. J. Myers. The Art of Software Testing. John Wiley and Sons, New York, 1979. 17. P. A. Nainar, T. Chen, J. Rosin, and B. Liblit. Statistical debugging using compound
boolean predicates. In Proc. Int'l Symp. Software Testing and Analysis, 2007. 18. Riehle. The economic motivation of open source software: stakeholder perspective.
IEEE Computer, vol.40, no. 4:pp. 25-32, 2007. 19. R. J. Sandusky, L. Gasser, and G. Ripoche. Bug report networks. In Proceedings of
ICSE MSR, 2004. 20. R. Subramanyam and M. S. Krishnan. Empirical analysis of CK metrics for object-
oriented design complexity: implications for software defects. IEEE Trans. Software Eng., vol. 29, no. 4:pp. 297-310, 2003.
21. G. Tassey. The economic impacts of inadequate infrastructure for software testing. Technical Report 7007.011, National Institute of Standards and Technology, Acquisition and Assistance Division, May 2002.
22. L. Villa. Large free software projects and Bugzilla: Lessons from GNOME project QA. In Proceedings of the Linux Symposium, 2003.

196 Chiara Francalanci and Francesco Merlo
23. H. Wang and C. Wang. Open source software adoption: a status report. IEEE Software, vol. 18; no. 2:pp. 90-95, 2001.
24. I. Wasserman and E. Capra. Evaluating software engineering processes in commercial and community open source. In Int'l Workshop Emerging Trends in FLOSS Research and Development, 2007.
25. Y. Zhou and H. Leung. Empirical analysis of object-oriented design metrics for predicting high and low severity faults. IEEE Trans. Software Eng., vol. 32, no. 10:pp. 771-789, 2006.