FIXING THE BROKEN PROMISE OF EDUCATION FOR ALL
145
Findings from the Global Initiative on Out-of-School Children FIXING THE BROKEN PROMISE OF EDUCATION FOR ALL
-
Upload
khangminh22 -
Category
Documents
-
view
0 -
download
0
Transcript of FIXING THE BROKEN PROMISE OF EDUCATION FOR ALL

Findings from the Global Initiative on Out-of-School Children
FIXING THE BROKEN PROMISE OF EDUCATION FOR ALL

Findings from the Global Initiative on Out-of-School Children
FIXING THE BROKEN PROMISE OF EDUCATION FOR ALL

This publication is available in Open Access under the Attribution-ShareAlike 3.0 IGO (CC-BY-SA 3.0 IGO) license (http://creativecommons.org/licenses/by-sa/3.0/igo/). By using the content of this publication, the users accept to be bound by the terms of use of the UNESCO Open Access Repository (http://www.unesco.org/open-access/terms-use-ccbysa-en).
The designations employed and the presentation of material throughout this publication do not imply the expression of any opinion whatsoever on the part of UNESCO concerning the legal status of any country, territory, city or area or of its authorities or concerning the delimitation of its frontiers or boundaries.
The ideas and opinions expressed in this publication are those of the authors; they are not necessarily those of UNESCO and do not commit the Organization.
UNESCO Institute for Statistics
The UNESCO Institute for Statistics (UIS) is the statistical office of UNESCO and is the UN depository for global statistics in the fields of education, science and technology, culture, and communication. The Institute is the official source of data used to monitor progress towards Education for All and related targets of the Millennium Development Goals.
The UIS education database is the most comprehensive in the world covering a wide range of indicators—from girls’ enrolment in primary school to the mobility of university students. It is updated three times each year based on results of the UIS annual education survey, which is conducted in more than 200 countries and territories. Established in 1999, the Institute serves Member States and the UN system, as well as inter-governmental and non-governmental organizations, research institutes, universities and citizens interested in high-quality data. Our central goal is to improve the opportunities and living conditions of children and adults around the world by producing the data needed for effective policies and interventions.
United Nations Children’s Fund (UNICEF)
UNICEF promotes the rights and wellbeing of every child, in everything we do. Together with our partners, we work in 190 countries and territories to translate that commitment into practical action, focusing special effort on reaching the most vulnerable and excluded children, to the benefit of all children, everywhere.
UNICEF is a vital part of international efforts to achieve the Millennium Development Goal of universal primary education by 2015. UNICEF provides policy and programming expertise on the ground for the Out-of-School Children Initiative. It is involved in advancing education in countries around the world and is a global leader in advocating for equity in education and improvements in learning outcomes. Among its contributions is serving as the secretariat for the United Nations Girls’ Education Initiative (UNGEI). UNICEF is also on the forefront of promoting inclusion of Education for All goals in the post-2015 development agenda.
Published in 2015 by:
UNESCO Institute for StatisticsP.O. Box 6128, Succursale Centre-VilleMontreal, Quebec H3C 3J7Canada
Tel: +1 514 343 6880Email: [email protected]://www.uis.unesco.org
© UNESCO-UIS 2015
ISBN: 978-92-9189-161-0Ref: UIS/2015/ED/SD/7DOI: http://dx.doi.org/10.15220/978-92-9189-161-0-en
Typesetting: Em Dash Design / www.emdashdesign.ca Photo credits: Frontcover: © International Labour Organization (ILO)/Crozet M. Interior: Shutterstock (p. 6); © ILO/Ferry Latief 2012 (p. 12); © Ollivier Girard/Center for International Forestry Research (CIFOR) (p. 16); © International Labour Organization (ILO) (p. 38); © ILO/Huynh Ha (p. 88); © DVIDSHUB/flickr (p. 106); © Adam Cohn/flickr (p. 120); © ILO/Luu Van Tien (p. 130)
Download the data in this reportThis report uses DataLinks, which allow you to download Excel files with the data presented in most of the figures and statistical tables. In the electronic version of this report, click on the link beside the DataLink icon. For the print copy, type the link starting with http://dx.doi.org into your Internet browser.
This report should be cited as:UNESCO Institute for Statistics (UIS) and UNICEF (2015). Fixing the Broken Promise of Education for All: Findings from the Global Initiative on Out-of-School Children. Montreal: UIS. http://dx.doi.org/10.15220/978-92-9189-161-0-en

3Findings from the Global Initiative on Out-of-School Children
Foreword � � � � � � � � � � � � � � � � � � � � � � � � � � � � � � � � � � � � � � � � � � � � � � � � � � � � � � � � � � � � � � � � � � � � � � � � � � � � � � � � � � � � � � � � � � � � � � � � � � � � � � � � � � � � � � � � � � � � � � � 7
Acknowledgements � � � � � � � � � � � � � � � � � � � � � � � � � � � � � � � � � � � � � � � � � � � � � � � � � � � � � � � � � � � � � � � � � � � � � � � � � � � � � � � � � � � � � � � � � � � � � � � � � � � � � � � � � � 9
Abbreviations � � � � � � � � � � � � � � � � � � � � � � � � � � � � � � � � � � � � � � � � � � � � � � � � � � � � � � � � � � � � � � � � � � � � � � � � � � � � � � � � � � � � � � � � � � � � � � � � � � � � � � � � � � � � � � � � 10
Chapter 1� Introduction � � � � � � � � � � � � � � � � � � � � � � � � � � � � � � � � � � � � � � � � � � � � � � � � � � � � � � � � � � � � � � � � � � � � � � � � � � � � � � � � � � � � � � � � � � � � � � � � � � � � 13
Chapter 2� Data on out-of-school children and adolescents � � � � � � � � � � � � � � � � � � � � � � � � � � � � � � � � � � � � � � � � � � � � � � � � � � � � � � 17
Sheena Bell and Friedrich Huebler (UIS)
2.1 Introduction . . . . . . . . . . . . . . . . . . . . . . . . . . . . . . . . . . . . . . . . . . . . . . . . . . . . . . . . . . . . . . . . . . . . . . . . . . . . . . . . . . . . . . . . . . . . . . . . . . . . . . . . . 172.2 Latest data on out-of-school children and adolescents and trends since 2000 . . . . . . . . . . . . . . . . . . . . . . . . . . . . 182.3 The individual and household characteristics of out-of-school children of primary and
lower secondary school age . . . . . . . . . . . . . . . . . . . . . . . . . . . . . . . . . . . . . . . . . . . . . . . . . . . . . . . . . . . . . . . . . . . . . . . . . . . . . . . . . . . . . . 272.4 How to improve the accuracy of estimates of out-of-school children . . . . . . . . . . . . . . . . . . . . . . . . . . . . . . . . . . . . . . . 302.5 How to better identify the characteristics of children out of school . . . . . . . . . . . . . . . . . . . . . . . . . . . . . . . . . . . . . . . . . . 35
Chapter 3� Barriers and policy solutions � � � � � � � � � � � � � � � � � � � � � � � � � � � � � � � � � � � � � � � � � � � � � � � � � � � � � � � � � � � � � � � � � � � � � � � � � � � � � � � 39
Angela Hawke (Independent), Sheena Bell (UIS), Hiroyuki Hattori (UNICEF), Friedrich Huebler (UIS), Albert
Motivans (UIS) and Mark Waltham (UNICEF)
3.1 Introduction . . . . . . . . . . . . . . . . . . . . . . . . . . . . . . . . . . . . . . . . . . . . . . . . . . . . . . . . . . . . . . . . . . . . . . . . . . . . . . . . . . . . . . . . . . . . . . . . . . . . . . . . . 393.2 System-wide barriers, system-wide solutions . . . . . . . . . . . . . . . . . . . . . . . . . . . . . . . . . . . . . . . . . . . . . . . . . . . . . . . . . . . . . . . . . . 403.3 One-half of the world’s out-of-school children: Children caught up in conflict . . . . . . . . . . . . . . . . . . . . . . . . . . . . . . 453.4 Why gender matters . . . . . . . . . . . . . . . . . . . . . . . . . . . . . . . . . . . . . . . . . . . . . . . . . . . . . . . . . . . . . . . . . . . . . . . . . . . . . . . . . . . . . . . . . . . . . . . 563.5 Child labourers and school participation . . . . . . . . . . . . . . . . . . . . . . . . . . . . . . . . . . . . . . . . . . . . . . . . . . . . . . . . . . . . . . . . . . . . . . . . 653.6 The language barrier . . . . . . . . . . . . . . . . . . . . . . . . . . . . . . . . . . . . . . . . . . . . . . . . . . . . . . . . . . . . . . . . . . . . . . . . . . . . . . . . . . . . . . . . . . . . . . . 703.7 Excluded and uncounted: Children with disabilities . . . . . . . . . . . . . . . . . . . . . . . . . . . . . . . . . . . . . . . . . . . . . . . . . . . . . . . . . . . . 76
Chapter 4� Financing needs for out-of-school children � � � � � � � � � � � � � � � � � � � � � � � � � � � � � � � � � � � � � � � � � � � � � � � � � � � � � � � � � � � � � 89
Milan Thomas and Nicholas Burnett (Results for Development Institute)
4.1 Introduction . . . . . . . . . . . . . . . . . . . . . . . . . . . . . . . . . . . . . . . . . . . . . . . . . . . . . . . . . . . . . . . . . . . . . . . . . . . . . . . . . . . . . . . . . . . . . . . . . . . . . . . . . 894.2 An evolving understanding of financing needs for universal basic education . . . . . . . . . . . . . . . . . . . . . . . . . . . . . . . 90 4.3 A model for estimating financing needs focused on out-of-school children and adolescents . . . . . . . . . . . . 914.4 Illustration: An equity-based approach to assessing the cost of enrolling out-of-school children in the
Democratic Republic of the Congo . . . . . . . . . . . . . . . . . . . . . . . . . . . . . . . . . . . . . . . . . . . . . . . . . . . . . . . . . . . . . . . . . . . . . . . . . . . . . . 934.5 Innovations in costing and simulating targeted interventions for out-of-school children . . . . . . . . . . . . . . . . . . 984.6 Illustration: Comparing the impact of targeted interventions to enrol out-of-school girls in the
Balochistan province, Pakistan . . . . . . . . . . . . . . . . . . . . . . . . . . . . . . . . . . . . . . . . . . . . . . . . . . . . . . . . . . . . . . . . . . . . . . . . . . . . . . . . . . . 994.7 Reaching the marginalised may cost more, but better data and innovative tools can help
us spend smarter . . . . . . . . . . . . . . . . . . . . . . . . . . . . . . . . . . . . . . . . . . . . . . . . . . . . . . . . . . . . . . . . . . . . . . . . . . . . . . . . . . . . . . . . . . . . . . . . . . 99
Table of contents

4 Fixing the Broken Promise of Education for All
Chapter 5� Conclusions and recommendations � � � � � � � � � � � � � � � � � � � � � � � � � � � � � � � � � � � � � � � � � � � � � � � � � � � � � � � � � � � � � � � � � � � � �101
5.1 The broken promise of education . . . . . . . . . . . . . . . . . . . . . . . . . . . . . . . . . . . . . . . . . . . . . . . . . . . . . . . . . . . . . . . . . . . . . . . . . . . . . . .1015.2 Fixing the broken promise . . . . . . . . . . . . . . . . . . . . . . . . . . . . . . . . . . . . . . . . . . . . . . . . . . . . . . . . . . . . . . . . . . . . . . . . . . . . . . . . . . . . . . . .102
References � � � � � � � � � � � � � � � � � � � � � � � � � � � � � � � � � � � � � � � � � � � � � � � � � � � � � � � � � � � � � � � � � � � � � � � � � � � � � � � � � � � � � � � � � � � � � � � � � � � � � � � � � � � � � � � � � �107
Appendix I� UNICEF regional classification � � � � � � � � � � � � � � � � � � � � � � � � � � � � � � � � � � � � � � � � � � � � � � � � � � � � � � � � � � � � � � � � � � � � � � � � � � �121
Appendix II� Definitions � � � � � � � � � � � � � � � � � � � � � � � � � � � � � � � � � � � � � � � � � � � � � � � � � � � � � � � � � � � � � � � � � � � � � � � � � � � � � � � � � � � � � � � � � � � � � � � � � � �123
Appendix III� Reader’s guide � � � � � � � � � � � � � � � � � � � � � � � � � � � � � � � � � � � � � � � � � � � � � � � � � � � � � � � � � � � � � � � � � � � � � � � � � � � � � � � � � � � � � � � � � � � � �127
Appendix IV� Statistical tables � � � � � � � � � � � � � � � � � � � � � � � � � � � � � � � � � � � � � � � � � � � � � � � � � � � � � � � � � � � � � � � � � � � � � � � � � � � � � � � � � � � � � � � � � � �131
List of boxesBox 1.1 The Global Initiative on Out-of-School Children (OOSCI) . . . . . . . . . . . . . . . . . . . . . . . . . . . . . . . . . . . . . . . . . . . . . . . . . 14Box 1.2 Explore the data . . . . . . . . . . . . . . . . . . . . . . . . . . . . . . . . . . . . . . . . . . . . . . . . . . . . . . . . . . . . . . . . . . . . . . . . . . . . . . . . . . . . . . . . . . . . . . . . 15Box 2.1 When is a child considered to be ‘out of school’? . . . . . . . . . . . . . . . . . . . . . . . . . . . . . . . . . . . . . . . . . . . . . . . . . . . . . . . . . 21Box 2.2 Schooling trajectories in Pakistan . . . . . . . . . . . . . . . . . . . . . . . . . . . . . . . . . . . . . . . . . . . . . . . . . . . . . . . . . . . . . . . . . . . . . . . . . . . . 31Box 2.3 Selecting and calculating estimates on out-of-school children in India . . . . . . . . . . . . . . . . . . . . . . . . . . . . . . . . . 34Box 3.1 Follow the money: The funding gap . . . . . . . . . . . . . . . . . . . . . . . . . . . . . . . . . . . . . . . . . . . . . . . . . . . . . . . . . . . . . . . . . . . . . . . . . 48Box 3.2 A lost generation? The children of the Syrian Arab Republic . . . . . . . . . . . . . . . . . . . . . . . . . . . . . . . . . . . . . . . . . . . . . 49Box 3.3 The economic argument . . . . . . . . . . . . . . . . . . . . . . . . . . . . . . . . . . . . . . . . . . . . . . . . . . . . . . . . . . . . . . . . . . . . . . . . . . . . . . . . . . . . . . 58Box 3.4 Measuring the impact of child marriage on education . . . . . . . . . . . . . . . . . . . . . . . . . . . . . . . . . . . . . . . . . . . . . . . . . . . . 61Box 3.5 Out-of-school boys and boys who fall behind. . . . . . . . . . . . . . . . . . . . . . . . . . . . . . . . . . . . . . . . . . . . . . . . . . . . . . . . . . . . . . 62Box 3.6 Defining child labour . . . . . . . . . . . . . . . . . . . . . . . . . . . . . . . . . . . . . . . . . . . . . . . . . . . . . . . . . . . . . . . . . . . . . . . . . . . . . . . . . . . . . . . . . . . 66Box 3.7 Grade 4 Portuguese lesson for Changana speakers, Mozambique . . . . . . . . . . . . . . . . . . . . . . . . . . . . . . . . . . . . . 71Box 3.8 Education in the United Nations Convention on the Rights of Persons with Disabilities . . . . . . . . . . . . . . 75Box 3.9 Impairments and disabilities . . . . . . . . . . . . . . . . . . . . . . . . . . . . . . . . . . . . . . . . . . . . . . . . . . . . . . . . . . . . . . . . . . . . . . . . . . . . . . . . . . 78Box 3.10 Towards inclusive education in Serbia . . . . . . . . . . . . . . . . . . . . . . . . . . . . . . . . . . . . . . . . . . . . . . . . . . . . . . . . . . . . . . . . . . . . . . . 84Box 3.11 A way forward on the data . . . . . . . . . . . . . . . . . . . . . . . . . . . . . . . . . . . . . . . . . . . . . . . . . . . . . . . . . . . . . . . . . . . . . . . . . . . . . . . . . . . . 85Box 3.12 Making the invisible child visible in Cambodia . . . . . . . . . . . . . . . . . . . . . . . . . . . . . . . . . . . . . . . . . . . . . . . . . . . . . . . . . . . . . . 86Box 4.1 Formulae for estimating the cost of enrolling out-of-school children . . . . . . . . . . . . . . . . . . . . . . . . . . . . . . . . . . . . 92
List of tablesTable 2.1 Out-of-school children of primary school age, 2000 and 2012 . . . . . . . . . . . . . . . . . . . . . . . . . . . . . . . . . . . . . . . . . . 20Table 2.2 Out-of-school adolescents of lower secondary school age, 2000 and 2012 . . . . . . . . . . . . . . . . . . . . . . . . . . 25Table 2.3 Selected countries with a large difference between the male and female out-of-school rates,
latest data available, 2010-2013 . . . . . . . . . . . . . . . . . . . . . . . . . . . . . . . . . . . . . . . . . . . . . . . . . . . . . . . . . . . . . . . . . . . . . . . . . . . . . 29Table 3.1 Effective implementation of multilingual education (MLE) . . . . . . . . . . . . . . . . . . . . . . . . . . . . . . . . . . . . . . . . . . . . . . . . . 74Table 3.2 Approaches to schooling children with disabilities . . . . . . . . . . . . . . . . . . . . . . . . . . . . . . . . . . . . . . . . . . . . . . . . . . . . . . . . . 79Table 3.3 A checklist for the effective implementation of inclusive education . . . . . . . . . . . . . . . . . . . . . . . . . . . . . . . . . . . . . . 82Table 4.1 Out-of-school children and adolescents of primary and lower secondary age in the
Democratic Republic of the Congo, 2012 . . . . . . . . . . . . . . . . . . . . . . . . . . . . . . . . . . . . . . . . . . . . . . . . . . . . . . . . . . . . . . . . . . 94Table 4.2 Public Expansion cost in the Democratic Republic of the Congo . . . . . . . . . . . . . . . . . . . . . . . . . . . . . . . . . . . . . . . 95Table 4.3 Household Expansion cost in the Democratic Republic of the Congo . . . . . . . . . . . . . . . . . . . . . . . . . . . . . . . . . . 95Table 4.4 Examples of Targeted Intervention costs . . . . . . . . . . . . . . . . . . . . . . . . . . . . . . . . . . . . . . . . . . . . . . . . . . . . . . . . . . . . . . . . . . . 96

5Findings from the Global Initiative on Out-of-School Children
Table 4.5 Total estimated annual cost of enrolling 1.3 million out-of-school children and adolescents in the Democratic Republic of the Congo . . . . . . . . . . . . . . . . . . . . . . . . . . . . . . . . . . . . . . . . . . . .97
Table 4.6 Comparison of a system-wide and targeted intervention to improve the enrolment of girls, Balochistan province, Pakistan . . . . . . . . . . . . . . . . . . . . . . . . . . . . . . . . . . . . . . . . . . . . . . . . . . .99
List of figuresFigure 2.1 Global out-of-school rate for children of primary and lower secondary school age, 2000-2012 . . . . 18Figure 2.2 Out-of-school children of primary school age by region and sex, 2000-2012 . . . . . . . . . . . . . . . . . . . . . . . . . 19Figure 2.3 Out-of-school adolescents of lower secondary school age by region and sex, 2000-2012 . . . . . . . . . 20Figure 2.4 Selected countries with more than 0.5 million out-of-school children of primary school age,
by region, 2012 or most recent year available . . . . . . . . . . . . . . . . . . . . . . . . . . . . . . . . . . . . . . . . . . . . . . . . . . . . . . . . . . . . . 22 Figure 2.5 School exposure of out-of-school children of primary school age by region, 2012 . . . . . . . . . . . . . . . . . . . 23Figure 2.6 Distribution of children who leave school before completing primary education,
by age group, selected countries, 2007-2012 . . . . . . . . . . . . . . . . . . . . . . . . . . . . . . . . . . . . . . . . . . . . . . . . . . . . . . . . . . . . . 25Figure 2.7 Evolution of the primary and lower secondary school-age population from 2000 to 2012,
by region . . . . . . . . . . . . . . . . . . . . . . . . . . . . . . . . . . . . . . . . . . . . . . . . . . . . . . . . . . . . . . . . . . . . . . . . . . . . . . . . . . . . . . . . . . . . . . . . . . . . . . . . 27Figure 2.8 Out-of-school rate by region, age group and sex, 2012 . . . . . . . . . . . . . . . . . . . . . . . . . . . . . . . . . . . . . . . . . . . . . . . . . . 28Figure 2.9 Percentage of children of primary school age in school, by sex, location, household wealth
and education of the household head, various years . . . . . . . . . . . . . . . . . . . . . . . . . . . . . . . . . . . . . . . . . . . . . . . . . . . . . 30Figure 2.10 Educational attainment of adolescents of upper secondary school age (13-16 years) in
the richest and poorest household wealth quintiles of Pakistan, 2012-2013. . . . . . . . . . . . . . . . . . . . . . . . . . . 31Figure 3.1 Gaps in data, analysis and policymaking on out-of-school children . . . . . . . . . . . . . . . . . . . . . . . . . . . . . . . . . . . . . 44Figure 3.2 Percentage of primary school-age children out of school, both sexes, 2012 . . . . . . . . . . . . . . . . . . . . . . . . . . 46Figure 3.3 Consolidated appeal requests and funding for education received by conflict-affected
countries, 2013 . . . . . . . . . . . . . . . . . . . . . . . . . . . . . . . . . . . . . . . . . . . . . . . . . . . . . . . . . . . . . . . . . . . . . . . . . . . . . . . . . . . . . . . . . . . . . . . . 48Figure 3.4 Percentage of primary and lower secondary school-age children in school, by household
wealth quintile, location and sex . . . . . . . . . . . . . . . . . . . . . . . . . . . . . . . . . . . . . . . . . . . . . . . . . . . . . . . . . . . . . . . . . . . . . . . . . . . . . 57Figure 3.5 Children involved in child labour and its impact on school attendance . . . . . . . . . . . . . . . . . . . . . . . . . . . . . . . . . 67


7Findings from the Global Initiative on Out-of-School Children
Foreword
Education represents the hopes, dreams and aspirations of children, families, communities and nations around the world—the most reliable route out of poverty and a critical pathway towards healthier, more productive citizens and stronger societies. Not surprisingly, when people are asked to list their priorities, education tops survey after survey, poll after poll.
There is consensus at virtually every level, from the poorest family in the most remote village to the global policy leaders who are shaping the world’s future development goals: education matters. This consensus has been translated into concrete action, propelling millions of children once denied an education into the classroom. In the 15 years since the launch of the Millennium Development Goals—which set the target for every child to complete a full course of primary education by 2015—the latest data show that the number of primary school-age out-of-school children has dropped by 42%, and for girls by 47%, despite rapid population growth.
Why, then, are there still 58 million children, roughly between the ages of 6 and 11, out of school globally? Each and every one of these children is a stark reminder of the broken promise to achieve universal primary education by the original deadline of 2015.
Fixing the Broken Promise of Education for All, a report produced by the UNESCO Institute for Statistics and UNICEF, could not be more timely. As the international community renews its commitment to advance every child’s right to education, it explores why global progress has stalled since the early 2000s, when millions of additional children poured into the world’s classrooms, and provides the data and analysis needed to move forward and reach every child excluded from education.
With its rich combination of data and analysis, this report provides a nuanced assessment of why some children never make it into the classroom at all, why some children start going to school far later than others, and why some children are more likely than their peers to drop out before they complete their schooling. It reminds us—if any reminder were needed—of the critical need for good data to inform the educational policies that can reduce the barriers that continue to stand between children and their fundamental right to an education.
This report sets out some of those policies and strategies. They include a deeper focus on improving the quality of education so that children will be more likely to go to school and stay in school if the education on offer is fit for purpose. And, given the alarmingly high number of adolescents out of school—63 million worldwide in 2012—it advocates for universal secondary education, drawing from and building on the lessons learned since 2000 on universal primary education.
Finally, this report shows the children behind the numbers. The boy who pushes a cart each day in a Kyrgyzstan bazaar to help feed his family. The girl pulled out of school in Yemen and married off against her will when still a child. The child in Sri Lanka, humiliated at school for lacking proper shoes, who drops out altogether rather than

8 Fixing the Broken Promise of Education for All
be demoted to a lower grade. The Namibian child with an undiagnosed hearing impairment who struggles at school. The Syrian refugee child turned away from one over-burdened school after another.
As the international community renews and expands its commitments as part of the post-2015 development agenda, we must focus on these children, and the millions of others struggling to realise their right to an education—and to fulfil their dreams for a better future. By working together and promoting greater investment, we can and must dismantle the barriers that stand in their way, one by one—and in doing so, deliver on our global promise of education for every child.
Irina BokovaUNESCO Director-General
Anthony LakeUNICEF Executive Director

9Findings from the Global Initiative on Out-of-School Children
Acknowledgements
This report would not have been possible without the commitment and efforts of the countries which participated in the Global Initiative on Out-of-School Children. It draws upon numerous national studies prepared as part of the Initiative, each one of which provides much-needed information on out-of-school children at the national and sub-national levels. The report team would like to thank the governments of these countries and all research partners on the ground for their support throughout this venture, as well as colleagues in UNICEF and the UNESCO Institute for Statistics (UIS) regional and country offices worldwide, who provided vital support and encouragement.
We are grateful to the following experts for submitting invaluable background papers and other contributions used for this report: Carol Benson (Independent) on language issues; Natasha Graham (Imperial College) on the situation of children with disabilities; Lorenzo Guarcello and Furio Rosati (Understanding Children’s Work) on child labour; Hiroyuki Hattori (UNICEF) on data analysis; Patricia Justino (Institute of Development Studies) on children in conflict; Janet Lennox (UNICEF) on barriers and policies in Latin America; Robert Prouty (Independent) on system-wide policies; Shailendra Sigdel (UIS) on data in India; Nelly Stromquist (University of Maryland) on gender; Annababette Wils (Independent) on Simulations for Equity in Education; Quentin Wodon (World Bank) on data analysis; and Mari Yasunaga (UNESCO) on non-formal education.
We would also like to thank the following peer reviewers for their careful revision of the report:
External reviewers: Manos Antoninis (EFA Global Monitoring Report) and Frank van Cappelle (Independent)
UNICEF: Jo Bourne, Claudia Cappa, Joost Kooijmans, Changu Mannathoko, Sreerupa Mitra, Francesca Moneti, Nicole Petrowski, Aarti Saihjee and Morgan Strecker
UIS: Alison Kennedy, Elise Legault, Patrick Montjourides, Pascale Ratovondrahona and Shailendra Sigdel
REPORT TEAM
Research and writing: Sheena Bell, Friedrich Huebler, Albert Motivans (UIS), Hiroyuki Hattori, Mark Waltham (UNICEF) and Angela Hawke (Independent)
Editor: Angela Hawke (Independent)
Report coordinator: Sheena Bell (UIS)
Production and promotion: Katja Frostell, Amy Otchet (UIS) and Rudina Vojvoda (UNICEF)

10 Fixing the Broken Promise of Education for All
Abbreviations
AIDS Acquired immunodeficiency syndrome
BEPS Balochistan Education Sector Plan
CT Cash transfer
CEE/CIS Central and Eastern Europe and the Commonwealth of Independent States
CDD Centre for Disability in Development
CPIA Country Policy and Institutional Assessment
CULP Centre for Unfolding Learning Potentials
CRPD Convention on the Rights of Persons with Disabilities
DFID Department for International Development
DHS Demographic and Health Survey
DDR Disarmament, demobilization and reintegration
EADE-RDC L’enquête nationale sur la situation des enfants et adolescents en dehors de l’école en République Démocratique du Congo
ECD Early childhood development
EFA Education for All
EPDC Education and Policy Data Center
EMIS Education Management Information System
FGM/C Female genital mutilation/cutting
GDP Gross domestic product
GPE Global Partnership for Education
HIV Human immunodeficiency virus
ICF International Classification of Functioning, Disability and Health
ICF-CY International Classification of Functioning, Disability and Health for Children and Youth
ILO International Labour Organization
IPEC International Programme on the Elimination of Child Labour
ISCED International Standard Classification of Education
MICS Multiple Indicator Cluster Survey
MOE Ministry of Education
MOEYS Ministry of Education, Youth and Sport
MEPSP Ministry of Primary, Secondary and Professional Education
MLE Multilingual education
NGO Non-governmental organization
NSSO National Sample Survey Office
NFE Non-formal education
NFE-MIS Non-Formal Education Management Information Systems
OCHA United Nations Office for the Coordination of Humanitarian Affairs
OOSCI Global Initiative on Out-of-School Children
RALS Rapid Assessment of Learning Spaces

11Findings from the Global Initiative on Out-of-School Children
SECOPE Service de contrôle et de la paie des enseignants
SIMPOC Statistical Information and Monitoring Programme on Child Labour
SEE Simulations for Equity in Education
SRI-IMRB Social and Rural Research Institute of IMRB International
UCW Understanding Children’s Work
UIS UNESCO Institute for Statistics
UN United Nations
UNESCO United Nations Educational, Scientific and Cultural Organization
UNHCR United Nations High Commissioner for Refugees
UNICEF United Nations Children’s Fund
UNRWA United Nations Relief and Works Agency for Palestine Refugees in the Near East
WHO World Health Organization

12 Fixing the Broken Promise of Education for All
13Findings from the Global Initiative on Out-of-School Children
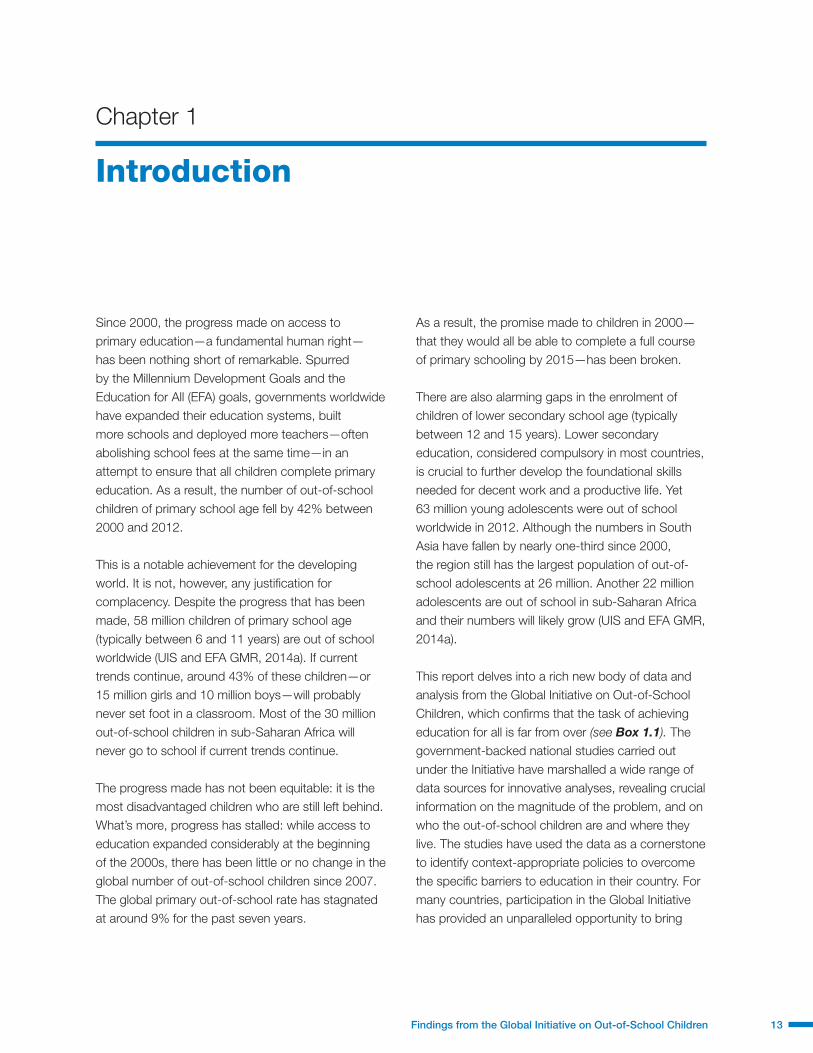
Since 2000, the progress made on access to primary education—a fundamental human right—has been nothing short of remarkable. Spurred by the Millennium Development Goals and the Education for All (EFA) goals, governments worldwide have expanded their education systems, built more schools and deployed more teachers—often abolishing school fees at the same time—in an attempt to ensure that all children complete primary education. As a result, the number of out-of-school children of primary school age fell by 42% between 2000 and 2012.
This is a notable achievement for the developing world. It is not, however, any justification for complacency. Despite the progress that has been made, 58 million children of primary school age (typically between 6 and 11 years) are out of school worldwide (UIS and EFA GMR, 2014a). If current trends continue, around 43% of these children—or 15 million girls and 10 million boys—will probably never set foot in a classroom. Most of the 30 million out-of-school children in sub-Saharan Africa will never go to school if current trends continue.
The progress made has not been equitable: it is the most disadvantaged children who are still left behind. What’s more, progress has stalled: while access to education expanded considerably at the beginning of the 2000s, there has been little or no change in the global number of out-of-school children since 2007. The global primary out-of-school rate has stagnated at around 9% for the past seven years.
As a result, the promise made to children in 2000—that they would all be able to complete a full course of primary schooling by 2015—has been broken.
There are also alarming gaps in the enrolment of children of lower secondary school age (typically between 12 and 15 years). Lower secondary education, considered compulsory in most countries, is crucial to further develop the foundational skills needed for decent work and a productive life. Yet 63 million young adolescents were out of school worldwide in 2012. Although the numbers in South Asia have fallen by nearly one-third since 2000, the region still has the largest population of out-of-school adolescents at 26 million. Another 22 million adolescents are out of school in sub-Saharan Africa and their numbers will likely grow (UIS and EFA GMR, 2014a).
This report delves into a rich new body of data and analysis from the Global Initiative on Out-of-School Children, which confirms that the task of achieving education for all is far from over (see Box 1.1). The government-backed national studies carried out under the Initiative have marshalled a wide range of data sources for innovative analyses, revealing crucial information on the magnitude of the problem, and on who the out-of-school children are and where they live. The studies have used the data as a cornerstone to identify context-appropriate policies to overcome the specific barriers to education in their country. For many countries, participation in the Global Initiative has provided an unparalleled opportunity to bring
Introduction
Chapter 1

14 Fixing the Broken Promise of Education for All
together experts in statistics and policy to shine a light on excluded children, who remain largely voiceless and invisible in government interventions.
This report draws on this experience to reveal—and attempt to fill—crucial gaps on data, analysis and policy, aiming to revitalise the momentum on reaching out-of-school children at a critical moment, as new international development goals and targets are being set.
Drawing on the data and analysis of national and regional OOSCI studies, this report provides a nuanced assessment of system-wide barriers that keep children out of the classroom. Overcoming these impediments, which relate to the availability, affordability and quality of schools, is crucial to the achievement of education for all. Time and time again, poverty and rural location have been linked to persistent obstacles to education, despite the fact that a multitude of countries have built more schools and abolished school fees. The problems arise from the way in which various barriers work
in combination, over time, with their cumulative impact delaying or curtailing children’s education, or preventing their enrolment entirely.
The report highlights five important barriers to education and the children affected. First, one-half of the world’s out-of-school children live in conflict-affected countries. Second, entrenched gender roles continue to influence whether or not a child starts and stays in school. Third, a household’s reliance on child labour often competes with that family’s hopes for education. Fourth, too many children are side-lined by education that is delivered in a language they neither speak nor understand. And finally, the considerable barriers that prevent children with disabilities from claiming their right to an education are only reinforced by a lack of data on their numbers and their needs.
The report takes us beyond ‘one size fits all’ solutions to these barriers by making a clear distinction between two types of countries: those that face an increasingly narrow set of challenges to achieve
Box 1.1 The Global Initiative on Out-of-School Children (OOSCI)
The Global Initiative on Out-of-School Children (OOSCI) was launched in 2010 by UNICEF and the UNESCO Institute for Statistics (UIS) to help participating countries develop evidence-based strategies to reduce the number of out-of-school children and adolescents. OOSCI looks beyond the goal of universal primary education and examines exclusion at the pre-primary, primary and lower secondary levels of education. The Initiative works closely with national and local governments, as well as civil society partners, to focus on three core objectives:
■ Develop detailed profiles of out-of-school children and children in school who are at risk of dropping out;
■ Assess the underlying barriers that prevent those children from completing basic education; and
■ Recommend innovative policies and strategies that can bring them into school and keep them there.
Twenty-six countries participated in OOSCI in its first phase, and many more governments have joined since. Participating countries produce in-depth studies that focus on the data, barriers and policies for children excluded from education. These studies span the pre-primary, primary and lower secondary school levels to include children who are out of school and those at risk of dropping out. The approach further distinguishes between out-of-school children who have been to school but dropped out, those whose entry to school is likely to be delayed, and those who are unlikely to ever attend.
OOSCI studies examine the data and provide concrete recommendations tailored to the barriers to education that are of most relevance to the local context. This evidence-based and equity-focused approach enables governments to make targeted changes in their policies and strategies to eliminate these barriers and increase the number of children in school. By providing much-needed evidence and recommendations on out-of-school data and policy, OOSCI aims to build political commitment and action to generate a real and sustained decrease in the number of out-of-school children and adolescents worldwide.

15Findings from the Global Initiative on Out-of-School Children
education for all and that must, therefore, focus more intensely on interventions targeted towards their ‘hard-to-reach’ children; and countries that still account for a disproportionate percentage of the world’s out-of-school children, where system-wide reforms are urgently needed. The report argues that most countries must adopt a mixture of system-wide and targeted responses if they are to guarantee universal basic education—that is completion of both primary and lower secondary education.
To put it simply, ‘build it and they will come’ optimism will not pull the world’s 121 million out-of-school children and adolescents into education without mobilising policymakers to enact the specific interventions to address the specific barriers that they face.
The report argues for a new and stronger political commitment to the education of every child, backed by the necessary resources, both human and financial. As the report shows, there is no doubt that governments and practitioners will have to find far greater resources to ensure that all children are in the classroom and learning. But it is a worthy investment, given the long-term benefits for the social and economic well-being of every nation.
ABOUT THIS REPORT
Chapter 2 of this report presents the latest global and regional data on out-of-school children and adolescents. It analyses trends over time to highlight different dimensions of this challenge for children who may never enter school at all, children who enter school later than their peers, and children who drop out. The data reveal crucial information on the profiles
of the children most likely to be excluded, which are analysed in greater detail in Chapter 3. Chapter 2 also highlights the challenge presented by the rapid growth of the school-age population in sub-Saharan Africa. Finally, this chapter describes some of the challenges in accurately measuring which children, and how many, are in and out of school. It offers recommendations to improve data, showcasing efforts by the Global Initiative participant countries, such as India and the Democratic Republic of the Congo.
Chapter 3 begins with an analysis of system-wide barriers and responses to out-of-school children, before exploring targeted responses to the obstacles to education faced by five main groups: children caught up in conflict, girls (and in some cases, boys), child labourers, children who do not speak the language of instruction, and children with disabilities. In each case, the report attempts to summarise the supply- and demand-side barriers to their education and the possible policy responses.
The costs of universal primary education—and ways to assess them in any given country—are outlined in Chapter 4. Finally, Chapter 5 provides a summary of the report’s conclusions and sets out key recommendations for policymakers.
Box 1.2 Explore the data
The hardest to reach children are still out of school. They are poor, rural and often girls. But the situation is different in every country. The UIS interactive data explorer illustrates the multiple and overlapping barriers to education in the countries that participated in the Global Initiative on Out-of-School Children. Learn more about the circumstances that unfairly exclude these invisible and voiceless children. http://on.unesco.org/oosci-global
More data are available in the UNESCO eAtlas on Out-of-School Children: http://on.unesco.org/oosc-map

16 Fixing the Broken Promise of Education for All

17Findings from the Global Initiative on Out-of-School Children
2.1 INTRODUCTION
The data are clear: despite substantial gains in school enrolment over the past 15 years, the world has missed the goal of universal primary education by 2015 and there has been virtually no progress in reducing the global rate and number of out-of-school children since 2007. It is increasingly apparent that business-as-usual approaches have failed to reach 58 million children of primary school age who continue to be denied their right to education.
While primary education has long been viewed as essential for a child’s full development, lower secondary education is also increasingly recognised as the foundation for the acquisition of the skills needed for a healthy and productive life and access to decent work. There are now 63 million adolescents of lower secondary school age who are out of school—5 million more than children of primary school age, even though there are twice as many primary school-age children worldwide.
This chapter shows that the stagnation seen in recent years is, in part, the consequence of rapid population growth in sub-Saharan Africa. In most regions, the school-age population has fallen or remained stable since 2000. In sub-Saharan Africa, however, the soaring school-age population makes it more difficult to reduce the number of out-of-school children and adolescents. Nevertheless, countries in the region have managed to enrol millions of additional children in primary and lower secondary education over the past two decades.
Children excluded from education often face multiple and overlapping disadvantages, as outlined in Chapter 3. If we are to reach them, we need a more complete picture of who they are, where they are and why they are out of school. The evidence base must draw on a wide range of data sources: gathering information about households and schools, and from parents, teachers and children themselves. This chapter presents the most recent data from the UIS on the school participation of children and adolescents of primary and lower secondary school age in order to take stock of global progress since 2000. Such comparative data are important because they alert the international community to worrying trends, reinforce calls to stop the abuse of children’s right to education, support the monitoring of development challenges and cases of exclusion, and provide the basis for requests for international aid. The chapter also describes some of the challenges in accurately measuring the number of children in and out of school and discusses how the data could be improved.
Data on out-of-school children and adolescents
Chapter 2
Progress on the rate and number of out-of-school children has stalled since 2007
9% of primary school-age children and 17% of adolescents of lower secondary school age are excluded from education

18 Fixing the Broken Promise of Education for All
2.2 LATEST DATA ON OUT-OF-SCHOOL CHILDREN AND ADOLESCENTS AND TRENDS SINCE 2000
Exclusion from education in 2012 m 58 million children of primary school age are out
of school. Of these children: > 23% attended school in the past but left; > 34% are likely to enter school in the future;
and > 43% are likely to never enter school.
m 63 million adolescents of lower secondary school age are out of school.
As well as missing the goal of universal primary education by 2015, the world is far from delivering universal lower secondary education. As shown in Figure 2.1, out-of-school rates for children of primary and lower secondary school age fell between 2000 and 2007, but this progress has stalled since
2007, with the primary out-of-school rate stuck at around 9% and the lower secondary out-of-school rate at around 17%. The gap between the out-of-school rates of girls and boys has narrowed steadily since 2000, but even this trend has slowed in recent years.
The initial decrease and subsequent stagnation of the out-of-school rate is reflected in the evolution of the number of out-of-school children between 2000 and 2012 (see Figure 2.2). The number of out-of-school children of primary school age has hovered just below the 60 million mark since 2007. There has even been a slight rise in the number of out-of-school children since 2010, but it is too early to conclude whether this is the start of a true reversal of the previous steady decline since 2000 or just a temporary increase. The number of out-of-school adolescents of lower secondary school age remains on a declining trend overall, but there were still 63 million of them in 2012 (see Figure 2.3).
30%
Lower secondary out-of-school rate
Primary out-of-school rate
FemaleTOTAL
TOTAL
Male
Female
Male
0
5
10
15
20
25
2000 2001 2002 2003 2004 2005 2006 2007 2008 2009 2010 2011 2012
Figure 2.1 Global out-of-school rate for children of primary and lower secondary school age, 2000-2012
Source: UNESCO Institute for Statistics, August 2014 DataLink: http://dx.doi.org/10.15220/2014/ed/sd/7/f2.1
19Findings from the Global Initiative on Out-of-School Children
Out
-of-
scho
ol c
hild
ren
Note: The data refer to the regional classi�cation used by UNICEF.
Rest of worldSouth AsiaSub−Saharan Africa
Figure 2.2 Out-of-school children of primary school age by region and sex, 2000-2012
0
20
40
60
80
100
Male
Female
Male
Female
Male
Female
20.0 million
23.7 million
11.1 million
21.6 million
10.5 million
12.8 million
World in 2000 99.7 million
14.5 million
18.2 million
5.1 million
4.8 million
7.7 million
7.6 million
World in 201257.8 million
2000 2001 2002 2003 2004 2005 2006 2007 2008 2009 2010 2011 2012
Source: UNESCO Institute for Statistics, August 2014 DataLink: http://dx.doi.org/10.15220/2014/ed/sd/7/f2.2
Out-of-school children of primary school age
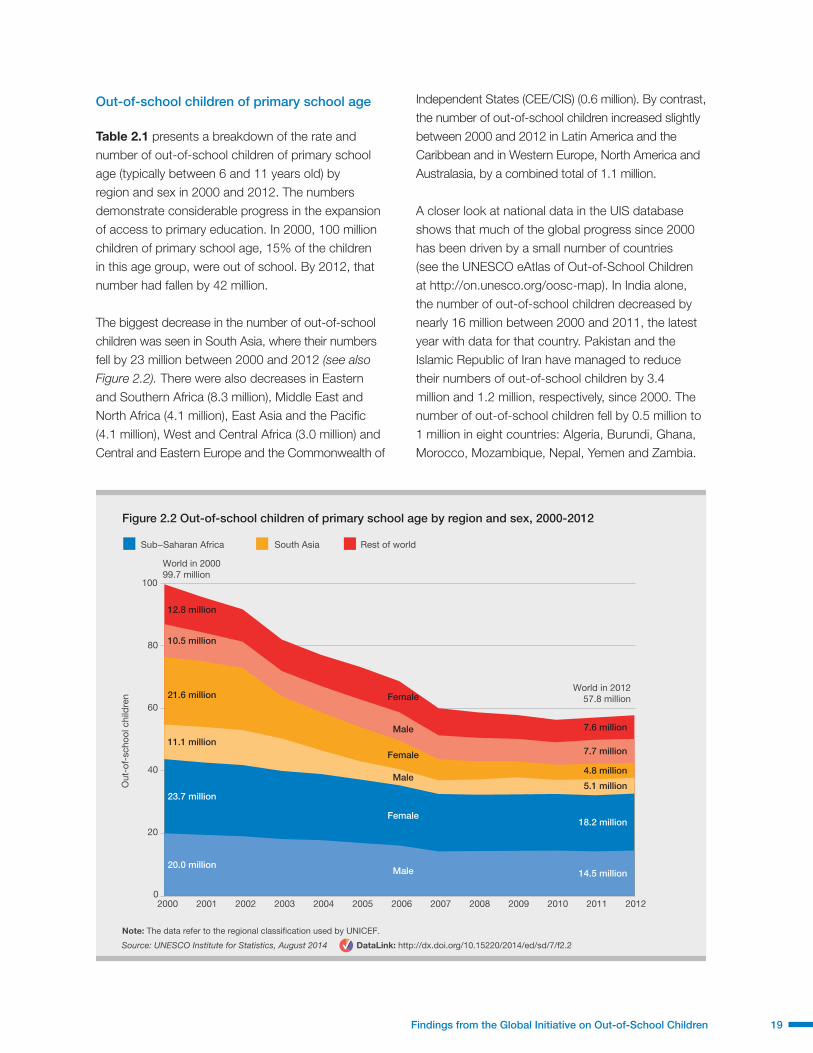
Table 2.1 presents a breakdown of the rate and number of out-of-school children of primary school age (typically between 6 and 11 years old) by region and sex in 2000 and 2012. The numbers demonstrate considerable progress in the expansion of access to primary education. In 2000, 100 million children of primary school age, 15% of the children in this age group, were out of school. By 2012, that number had fallen by 42 million.
The biggest decrease in the number of out-of-school children was seen in South Asia, where their numbers fell by 23 million between 2000 and 2012 (see also
Figure 2.2). There were also decreases in Eastern and Southern Africa (8.3 million), Middle East and North Africa (4.1 million), East Asia and the Pacific (4.1 million), West and Central Africa (3.0 million) and Central and Eastern Europe and the Commonwealth of
Independent States (CEE/CIS) (0.6 million). By contrast, the number of out-of-school children increased slightly between 2000 and 2012 in Latin America and the Caribbean and in Western Europe, North America and Australasia, by a combined total of 1.1 million.
A closer look at national data in the UIS database shows that much of the global progress since 2000 has been driven by a small number of countries (see the UNESCO eAtlas of Out-of-School Children at http://on.unesco.org/oosc-map). In India alone, the number of out-of-school children decreased by nearly 16 million between 2000 and 2011, the latest year with data for that country. Pakistan and the Islamic Republic of Iran have managed to reduce their numbers of out-of-school children by 3.4 million and 1.2 million, respectively, since 2000. The number of out-of-school children fell by 0.5 million to 1 million in eight countries: Algeria, Burundi, Ghana, Morocco, Mozambique, Nepal, Yemen and Zambia.

20 Fixing the Broken Promise of Education for All
Table 2.1 Out-of-school children of primary school age, 2000 and 2012
Region
2000 2012
% Number (in millions) % Number (in millions)
MF M F MF M F MF M F MF M F
W. EUROPE/N. AM./AUSTRALASIA 1.9 1.9 1.9 1.2 0.6 0.6 3.5 3.6 3.4 2.2 1.2 1.1
LATIN AMERICA AND CARIBBEAN 6.2 5.0 7.3 3.6 1.5 2.1 6.3 6.5 6.1 3.8 2.0 1.8
CEE/CIS 6.6 5.4 7.8 1.6 0.7 0.9 4.7 4.7 4.8 1.0 0.5 0.5
EAST ASIA AND PACIFIC 5.4 5.2 5.7 11.0 5.4 5.5 4.6 4.6 4.6 6.9 3.6 3.2
SOUTH ASIA 20.1 13.1 27.6 32.7 11.1 21.6 5.8 5.7 5.9 9.8 5.1 4.8
MIDDLE EAST AND NORTH AFRICA 18.2 14.7 21.8 8.4 3.5 4.9 9.3 7.6 11.1 4.3 1.8 2.5
EASTERN AND SOUTHERN AFRICA 35.1 33.2 37.0 19.3 9.2 10.2 15.1 13.6 16.6 11.0 5.0 6.0
WEST AND CENTRAL AFRICA 43.3 37.6 49.2 21.9 9.6 12.2 27.1 23.1 31.2 18.8 8.1 10.7
WORLD 15.0 12.1 17.9 99.7 41.6 58.1 8.9 8.1 9.7 57.8 27.3 30.5
Notes: The data refer to the regional classification used by UNICEF. The category ‘Western Europe, North America and Australasia’ is not an official UNICEF region, but it is used in this report to group all countries not belonging to other UNICEF regions. It includes countries in which UNICEF does not operate. They are primarily high- and upper-middle-income countries located in Australasia, Europe and North America. The list of countries is available in Annex I.
Source: UNESCO Institute for Statistics, August 2014
Rest of worldSouth AsiaSub−Saharan Africa
Out
-of-
scho
ol a
dol
esce
nts
Note: The data refer to the regional classi�cation used by UNICEF.
Figure 2.3 Out-of-school adolescents of lower secondary school age by region and sex, 2000-2012
0
20
40
60
80
100
World in 2000 96.9 million
World in 201262.9 million
2000 2001 2002 2003 2004 2005 2006 2007 2008 2009 2010 2011 2012
Male
Female
Male
Female
Male
Female
9.5 million
12.4 million
16.1 million
21.3 million
19.6 million
18.0 million
10.2 million
11.8 million
13.7 million
12.6 million
7.4 million
7.2 million
Source: UNESCO Institute for Statistics, August 2014 DataLink: http://dx.doi.org/10.15220/2014/ed/sd/7/f2.3

21Findings from the Global Initiative on Out-of-School Children
Box 2.1 When is a child considered to be ‘out of school’?
International statistics on out-of-school children from the UIS are used to monitor EFA and related international goals. Indicator estimates are based on enrolment data from administrative records, collected by the UIS from more than 200 countries and territories through its annual survey on education statistics. Any children of primary or lower secondary school age who are not enrolled in primary or secondary education are considered to be out of school. This includes a small number of children in pre-primary education and in non-formal education (NFE).1 Children of primary school age who are enrolled in pre-primary education are counted as out of school, because the educational content of pre-primary education and the pedagogical qualifications of its teaching staff are not equivalent to the standards required for primary education. Children in NFE programmes are also considered to be out of school, because the nature of these programmes is not, in general, equivalent to that of formal primary and lower secondary education.
Household surveys, such as the Demographic and Health Surveys (DHS) and the Multiple Indicator Cluster Surveys (MICS), collect data on school attendance rather than enrolment.2 In these surveys, children who did not attend school at any time during the reference school year are considered to be out of school. Household survey data on attendance complement administrative records on enrolment and provide important information on the characteristics of out-of-school children and their households that cannot be obtained from enrolment data in the UIS database (see Section 2.3).
National and regional studies conducted as part of the Global Initiative on Out-of-School Children by UNICEF and the UIS use data on enrolment and attendance from both administrative and household survey sources. To ensure cross-national comparability of the data, national education programmes are classified in accordance with the International Standard Classification of Education (ISCED).3
1 The International Standard Classification of Education (ISCED) 2011 defines non-formal education as “education that is institutionalised, intentional and planned by an education provider. The defining characteristic of non-formal education is that it is an addition, alternative and/or complement to formal education within the process of the lifelong learning of individuals. It is often provided to guarantee the right of access to education for all. It caters to people of all ages but does not necessarily apply a continuous pathway-structure; it may be short in duration and/or low-intensity, and it is typically provided in the form of short courses, workshops or seminars. Non-formal education mostly leads to qualifications that are not recognised as formal or equivalent to formal qualifications by the relevant national or sub-national education authorities or to no qualifications at all. Non-formal education can cover programmes contributing to education for out-of-school children and adult and youth literacy, as well as programmes on life skills, work skills, and social or cultural development” (UIS, 2012a).
2 More information on these survey programmes is available at http://dhsprogram.com and http://www.childinfo.org/mics.html3 The most recent version of ISCED was adopted in 2011 (UIS, 2012a), but the out-of-school studies published so far as part of the UNICEF-UIS
Initiative are based on data classified in accordance with ISCED 1997 (UIS, 2006).
The combined decreases from these 11 countries account for more than one-half of the global decrease in the number of out-of-school children—nearly 26 million—since 2000.
In relative terms, 42 countries with data were able to more than halve their numbers of primary school-age out-of-school children between 2000 and 2012, including Algeria, Burundi, Cambodia, El Salvador, Ghana, Guatemala, India, the Islamic Republic of Iran, Lao People’s Democratic Republic, Morocco, Mozambique, Nepal, Nicaragua, Rwanda, Viet Nam, Yemen and Zambia, all of which had more than 100,000 out-of-school children at the turn of the millennium.
However, despite such impressive progress in many countries, about 9% of all children of primary
school age worldwide—8% of all boys and 10% of all girls—were still out of school in 2012. The majority, 31 million of the 58 million out-of-school children, were girls.
One-third of all out-of-school children of primary school age lived in West and Central Africa, the region with the highest out-of-school rate. Here, more than one in four children (31% of all girls and 23% of all boys) were not in school, far more than in any other region. In Eastern and Southern Africa and in South Asia, another 11 million and 10 million
31 million of the 58 million primary school-age children out of school are girls

22 Fixing the Broken Promise of Education for All
children, respectively, were out of school. In relative terms, however, South Asia fares much better than the sub-Saharan regions because 94% of its primary school-age children are in school, compared to 85% of children in Eastern and Southern Africa and 73% in West and Central Africa. Out-of-school rates are lowest in South Asia and in Latin America and the Caribbean (6%), in CEE/CIS and East Asia and the Pacific (5%) and in Western Europe, North America and Australasia (4%).
Figure 2.4 lists selected countries with more than half a million out-of-school children of primary school age. Among them, India, Indonesia, Niger, Nigeria, Pakistan, South Sudan and Sudan had 1 million or more out-of-school children in 2012 (or the most recent year for which data are available). When reviewing these numbers, it is important to keep in mind that there are no reliable estimates available for recent years for some countries with large numbers of excluded children. For example, the most recent
estimate of the number of out-of-school children for the war-torn Democratic Republic of the Congo is 4.9 million back in 1999. For Ethiopia, the latest available estimate refers to 2006, when 3.9 million children were not in school. For Kenya, no data have been available since 2009, when the number of out-of-school children was 1.1 million. Reasons for this lack of data are described in Section 2.4.
For many countries without reliable administrative data, household surveys can give an indication of the extent of exclusion from education. In the Democratic Republic of the Congo, for example, four DHS and MICS surveys were carried out between 2001 and 2014. Drawing on these data and a national household survey on out-of-school children, the authors of the national study for the Global Initiative on Out-of-School Children estimated that 3.5 million children of primary school age were out of school in 2012, more than in all but two countries in Figure 2.4 (UNICEF and UIS, 2013d). Appendix IV provides the latest out-of-school
Notes: Data for Ghana refer to 2013; data for Angola, Chad, India, South Sudan, Sudan and Uganda refer to 2011; data for Bangladesh and Nigeria refer to 2010.
0 1 2 3 4 5 6 7 8 9
Figure 2.4 Selected countries with more than 0.5 million out-of-school children of primary school age by region, 2012 or most recent year available
8.71.00.9
0.80.6
0.5
1.00.70.70.7
0.50.5
2.80.5
5.41.4
0.6
1.3
0.6
WEST ANDCENTRAL AFRICA
EASTERN ANDSOUTHERN AFRICA
MIDDLE EAST ANDNORTH AFRICA
SOUTH ASIA
EAST ASIAAND THE PACIFIC
LATIN AMERICAAND THE CARIBBEAN
Nigeria
In millions
NigerBurkina Faso
ChadMali
Ghana
South SudanMozambique
UgandaSouth Africa
EritreaAngola
SudanYemen
PakistanIndia
Bangladesh
Indonesia
Colombia
Source: UNESCO Institute for Statistics, August 2014 DataLink: http://dx.doi.org/10.15220/2014/ed/sd/7/f2.4

23Findings from the Global Initiative on Out-of-School Children
children statistics from administrative and household survey sources for all countries.
Twenty-five million primary school-age children will probably never enter school
Children out of school can be divided into two broad groups: those who have attended school in the past but dropped out and those who have never attended school. The second group can be further sub-divided into children who will attend school at some point in the future and those who will never attend. By examining the pattern of the age at which children enter and leave school it is possible to estimate the distribution of out-of-school children across these three groups. Figure 2.5 shows that more than two-fifths, or close to 25 million, of the world’s 58 million primary school-age out-of-school children are unlikely to ever enter a classroom. Of the remaining 33 million out-of-school children, 13 million have left school and 20 million are expected to be late entrants to school in the future.
Taken as a whole, the data suggest that most of sub-Saharan Africa’s out-of-school children are unlikely to ever enter school. However, the patterns of school exposure in West and Central Africa differ markedly from those in Eastern and Southern Africa. The former region has the highest concentration of school exclusion, similar to South Asia, where three in five out-of-school children will probably never enter a classroom. By contrast, most out-of-school children in Eastern and Southern Africa are expected to start school in the future, a pattern shared with CEE/CIS and Western Europe, North America and Australasia. Similarly, most out-of-school children in the Middle East and North Africa and Latin America and the Caribbean are expected to receive formal education at some point, although around 40% of them will probably never go to school. East Asia and the Pacific is the only region where most primary school-age out-of-school children have dropped out, rather than having never attended at all.
23 34 43
10 52 38
17 64 19
20 44 36
19 37 44
59 32 9
28 15 57
17 58 25
14 26 60
0 20 40 60 80 100%
WORLD
CEE/CIS
W. EUROPE, N. AMERICAAND AUSTRALASIA
LATIN AMERICAAND THE CARIBBEAN
MIDDLE EASTAND NORTH AFRICA
EAST ASIAAND THE PACIFIC
SOUTH ASIA
EASTERN ANDSOUTHERN AFRICA
WEST AND
CENTRAL AFRICA
Left school Likely to enterschool in the future
Unlikely to everenter school
57.8
1.0
2.2
3.8
4.3
6.9
9.8
11.0
18.8
0 In millions
Million childrenout of school
Figure 2.5 School exposure of out-of-school children of primary school age by region, 2012
Notes: The data refer to the regional classi�cation used by UNICEF. The category ‘Western Europe, North America and Australasia’ is not an of�cial UNICEF region, but it is used in this report to group all countries not belonging to other UNICEF regions. It includes countries in which UNICEF does not operate. They are primarily high- and upper-middle-income countries located in Australasia, Europe and North America.
Source: UNESCO Institute for Statistics, August 2014 DataLink: http://dx.doi.org/10.15220/2014/ed/sd/7/f2.5

24 Fixing the Broken Promise of Education for All
Classifying out-of-school children by past and possible future school attendance yields important insights for policymakers. For countries like Bolivia, where most out-of-school children are likely to attend school in the future (albeit when they are older than the official age of entry into primary education), the goal is to ensure earlier, on-time entry into the education system (UNICEF and UIS, 2011).
However, it is children who are not expected to gain access to schooling—roughly 15 million girls and 10 million boys according to the latest available data—who pose the most serious challenges to policymakers. For countries with large populations of out-of-school children with a scant likelihood of going to primary school, such as Burkina Faso, Nigeria and Pakistan, accelerated learning programmes or other forms of remedial NFE can be vital to provide schooling to children who would otherwise be excluded entirely from education.
Most children who drop out of primary school early are over-age
The classification of children by their past and possible future exposure to education is only a partial indicator of early school leaving because it only covers children of primary school age. An important share of primary school pupils who drop out are over-age by several years, because they have entered school late or have had to repeat school grades.
Figure 2.6 shows that in 20 of 23 countries with recent household survey data, early primary school leavers are more likely to be significantly over-age for their level of education, often by three years or more. When these children leave school, they are counted as out-of-school adolescents, as discussed in the next section. For example, around 80% of pupils in Haiti and Madagascar who left primary school before
completion between 2007 and 2012 were, in theory, in the age group for secondary education or were even older. Primary school-age children account for the majority of early primary school leavers in only three countries in Figure 2.6: Ghana, Nigeria and Timor-Leste. However, the true scale of over-age school leaving is even greater than suggested in Figure 2.6, because the analysis only considers children who were older than primary school age at the time they left school. In fact, many children who drop out of primary school are still within the primary school age range but were too old for the grade they last attended.
Out-of-school adolescents of lower secondary school age
In 2012, 63 million adolescents of lower secondary school age (typically between 12 and 15 years) were not in primary or secondary school (see Table 2.2). The out-of-school rate in this age group was 17% for girls, 16% for boys and 17% for girls and boys combined. More than 40% of all out-of-school adolescents live in South Asia and more than one-third in sub-Saharan Africa.
The global number of out-of-school adolescents is similar to the global number of out-of-school children, even though there were 1.7 times more children of primary school age in 2012 (650 million) than lower secondary school-age adolescents (374 million). While adolescents are far fewer in number, they are nearly twice as likely to be out of school as children of primary school age (17% compared to 9%). As mentioned, children who are over-age for their level or grade are more likely to drop out of school. At the same time, the opportunity cost of education increases with age as vulnerable families weigh the benefits of keeping older children in school against the need for income, with children often left with no choice but to work instead of going to school (see
Section 3.4 on child labour).
Similar to trends for out-of-school children of primary school age, the number and rate of out-of-school adolescents have fallen significantly since 2000, when 97 million adolescents—25% of the entire age cohort—were not in primary or secondary school.
About 15 million girls and 10 million boys of primary school age are not
expected to ever attend school. This group of children poses the most
serious challenges to policymakers

25Findings from the Global Initiative on Out-of-School Children
Note: The �gure refers to children and adolescents who were in primary school in the previous year, are not in school in the current year (when the household survey was conducted), and whose highest completed grade was lower than the last grade of primary education.
%
1-2 years older 3 or more years olderPrimary school age
Figure 2.6 Distribution of children who leave school before completing primary education, by age group, selected countries, 2007-2012
0
20
40
60
Ear
ly p
rimar
y sc
hool
leav
ers
80
100
VIET
NAM
SWAZILA
ND
MADAGASCAR
BHUTAN
COLOM
BIA
MALA
WI
MAURIT
ANIAIR
AQ
NAMIB
IA
BOLIVIA
CONGO, DR
SENEGAL
ZAMBIA
CAMEROON
DOMIN
ICAN R
EPUBLIC
SIERRA L
EONE
NIGERIA
GHANA
TIM
OR-LESTE
TOGO
LIBERIA
HAITI
SAO TOM
E AND P
RINCIP
E
1
98
11
14
75
12
8
80
14
20
65
18
11
71
19
17
63
23
14
63
29
17
54
30
17
54
30
18
52
32
21
47
33
33
34
34
28
39
34
34
32
39
24
37
42
22
36
43
20
36
45
20
35
47
17
36
49
21
30
52
15
33
59
23
18
78
10
12
Source: UIS calculations based on the Demographic and Health Surveys (DHS) and Multiple Indicator Cluster Surveys (MICS), 2007-2012
DataLink: http://dx.doi.org/10.15220/2014/ed/sd/7/f2.6
Table 2.2 Out-of-school adolescents of lower secondary school age, 2000 and 2012
Region
2000 2012
% Number (million) % Number (million)
MF M F MF M F MF M F MF M F
W. EUROPE/N. AM./AUSTRALASIA 2.8 3.2 2.4 1.1 0.7 0.5 2.7 2.6 2.8 1.0 0.5 0.5
LATIN AMERICA AND CARIBBEAN 10.1 9.9 10.2 3.6 1.8 1.8 7.5 7.7 7.3 2.8 1.5 1.3
CEE/CIS 11.6 11.2 12.1 3.8 1.9 1.9 5.2 5.1 5.5 1.2 0.6 0.6
EAST ASIA AND PACIFIC 20.9 22.3 19.4 24.5 13.5 11.0 8.4 8.6 8.2 7.4 4.0 3.4
SOUTH ASIA 39.9 33.2 47.0 37.3 16.1 21.3 26.4 26.3 26.4 26.3 13.7 12.6
MIDDLE EAST AND NORTH AFRICA 11.7 9.4 14.1 2.9 1.2 1.7
EASTERN AND SOUTHERN AFRICA 42.8 36.3 49.3 10.5 4.4 6.0 26.9 24.2 29.5 8.5 3.8 4.6
WEST AND CENTRAL AFRICA 46.5 40.7 52.5 10.8 4.8 6.0 39.7 37.0 42.4 12.5 5.9 6.6
WORLD 24.7 22.5 27.0 96.9 45.2 51.6 16.8 16.2 17.5 62.9 31.3 31.6
Notes: The data refer to the regional classification used by UNICEF. The category Western Europe, North America and Australasia refers to primarily high- and high-middle-income countries in which UNICEF does not operate. Data for Eastern and Southern Africa refer to 2011. No regional figures are available for the Middle East and North Africa for 2000 because of insufficient data coverage.
Source: UNESCO Institute for Statistics, August 2014

26 Fixing the Broken Promise of Education for All
The global reduction to 63 million out-of-school adolescents is largely the result of progress in East Asia and the Pacific, where their number fell by more than two-thirds from 25 million to 7 million between 2000 and 2012, and South Asia, where their number fell by 11 million over the same period, from 37 million to 26 million.
The progress in East Asia and the Pacific is linked closely to the situation in China and its estimated reduction in the number of out-of-school children and adolescents since 2000.4 Another country in the region with a large drop in its out-of-school population is Indonesia, where the number of out-of-school adolescents fell from 3.5 million in 2000 to 1.7 million in 2012.
In addition to these success stories, 29 countries for which data are available managed to reduce the number of out-of-school adolescents by more than one-half between 2000 and 2012. Among them are eight countries that had more than 100,000 out-of-school adolescents in 2000: Ecuador, Ghana, Indonesia, South Africa, Tajikistan, Turkey, Ukraine and Venezuela.
West and Central Africa was the only region that bucked the global trend, with an increase in the number of out-of-school adolescents from 11 million to nearly 13 million between 2000 and 2012, although the lower secondary out-of-school rate fell from 47% to 40% over the same period. The increase in the number of out-of-school adolescents in the region is a direct consequence of high population growth.
This particular region also had the highest lower secondary out-of-school rate in 2012, followed by Eastern and Southern Africa (27%) and South Asia (26%). In the Middle East and North Africa, 12% of all adolescents of lower secondary school age were not in school. Similar to the primary out-of-school rate, the lowest percentages of out-of-school adolescents
4 In 1997, 17 million primary school-age children and an unknown number of lower secondary school-age adolescents were out of school in China. The UIS has no publishable data for China for recent years, mainly due to uncertainty about national population figures. However, the UIS has produced estimates that are used to calculate regional rates and numbers of out-of-school children and adolescents in East Asia and the Pacific.
were found in Western Europe, North America and Australasia (3%) and in the CEE/CIS region (5%).
The effect of population growth in sub-Saharan Africa
Enrolment rates across sub-Saharan Africa are improving but not enough to keep up with the increase in the school-age population. In 2012, sub-Saharan Africa was home to 57% of the global population of out-of-school children of primary school age, up from 44% in 2000, and its share of the global population of out-of-school adolescents increased from 23% in 2000 to 35% in 2012. Between 2000 and 2012, the primary school-age population in sub-Saharan Africa grew from 110 million to 148 million and the lower secondary school-age population from 49 million to 66 million. Sub-Saharan Africa—and this is true for both Eastern and Southern Africa and West and Central Africa—is the only region that has been confronted with such a rapidly-growing population. Countries in this region face a double challenge: not only do they have to provide educational facilities for the children who are out of school today, they must also accommodate the ever-growing numbers of children who will reach school-going age in the coming years.
Figure 2.7 displays the evolution of the region’s combined primary and lower secondary school-age population from 2000 to 2012, with the starting point for the population in 2000 set at 100. In both Eastern and Southern Africa and West and Central Africa the population of primary and lower secondary school age grew by more than one-third between 2000 and 2012. For every 100 school-age children in sub-Saharan Africa in 2000, there were 134 school-age children in 2012. Projections by the UN Population Division show no slowdown in this trend before 2050, when the primary and lower secondary school-age population in sub-Saharan Africa is estimated to be more than 2.5 times as large as it was in 2000. By contrast, in the East Asia and the Pacific and CEE/CIS regions, the school-age populations fell by more than 20% since 2000. Given these population trends, it is remarkable that the countries in sub-Saharan Africa have managed to reduce the number of primary school-age children out of school and

27Findings from the Global Initiative on Out-of-School Children
avoid an increase in the number of lower secondary school-age children out of school in recent years.
2.3 THE INDIVIDUAL AND HOUSEHOLD CHARACTERISTICS OF OUT-OF-SCHOOL CHILDREN OF PRIMARY AND LOWER SECONDARY SCHOOL AGE
The analysis so far has focused the rate and number of out-of-school children globally and how trends have evolved since 2000. However, in order to target policies and strategies to bring out-of-school children into school, robust information is needed on who they are and where they live. Chapter 3 draws on country studies carried out under the Global Initiative
on Out-of-School Children and other evidence to look more closely at the barriers that keep the most disadvantaged children out of school: children affected by armed conflict, child labourers, children whose home language differs from the language used at school, and children with disabilities. The role of gender as a determinant of exclusion from education is also discussed in greater detail in Section 3.3.
Administrative data on gender disparities
The analysis of gender disparities in out-of-school rates is crucial for the wider analysis of statistics on out-of-school children. UIS data confirm that there has been considerable progress in reducing gender
Notes: The data refer to the regional classi�cation used by UNICEF. The category Western Europe, North America and Australasia refers to primarily high- and upper-middle-income countries in which UNICEF does not operate. Regions are sorted by the school-age population in 2012 relative to 2000, from the largest decrease to the largest increase.
80
Sch
ool-
age
pop
ulat
ion
rela
tive
to 2
000
(200
0=10
0)
100
120
140
EAST ASIA AND THE PACIFIC CEE/CIS WESTERN EUROPE, NORTH AMERICA AND AUSTRALASIA
80
100
120
140
MIDDLE EAST AND NORTH AFRICA LATIN AMERICA AND THE CARIBBEAN SOUTH ASIA
80
100
120
140
EASTERN AND SOUTHERN AFRICA WEST AND CENTRAL AFRICA WORLD
2000 2002 2004 2006 2008 2010 2012 2000 2002 2004 2006 2008 2010 2012 2000 2002 2004 2006 2008 2010 2012
Figure 2.7 Evolution of the primary and lower secondary school-age population from 2000 to 2012, by region
School-age population in other regionsSchool-age population in region
Source: UNESCO Institute for Statistics, August 2014, calculated from population estimates by the UN Population Division, 2013
DataLink: http://dx.doi.org/10.15220/2014/ed/sd/7/f2.7

28 Fixing the Broken Promise of Education for All
disparities since 2000, despite persistent gender gaps in some countries and regions. Globally, the gender gap in the out-of-school rate fell from about 6 percentage points to about 2 percentage points for children of primary school age between 2000 and 2012, and from about 4 percentage points to about 1 percentage point for adolescents of lower secondary school age. South Asia began that period with the largest gap between female and male out-of-school rates (15 percentage points for primary school-age children and 14 percentage points for lower secondary school-age adolescents), but by 2012, there was hardly any difference between the rates for girls and boys.
Figure 2.8 displays regional out-of-school rates of children of primary and lower secondary school age in 2012. Among primary school-age children, 10% of girls and 8% of boys worldwide were out of school, while the rate among lower secondary school-age adolescents was 18% for girls and 16% for boys.
At the regional level, gender disparities are greatest in West and Central Africa, Eastern and Southern Africa, and the Middle East and North Africa. In these regions, the gap between the male and female out-of-school rates ranges from 3 percentage points for primary school-age children in Eastern and Southern Africa to 8 percentage points in West and Central Africa. Gender disparities tend to be greater in regions with higher out-of-school rates, but the case of South Asia—where 26% of both girls and boys of lower secondary school age are not in school—shows that high out-of-school rates are not always associated with gender disparity.
While gaps in enrolment between girls and boys have decreased over the past two decades, girls are still more likely to face persistent barriers to their education than boys in many countries. Table 2.3 presents countries with recent data where girls face the greatest disparities. At the national level, the female out-of-school rate for children of primary
Notes: The data refer to the regional classi�cation used by UNICEF. The category Western Europe, North America and Australasia refers to primarily high- and upper-middle-income countries in which UNICEF does not operate. Regions are sorted by the percentage of out-of-school children of primary school age of both sexes combined.
Figure 2.8 Out-of-school rate by region, age group and sex, 2012
WORLD
WEST ANDCENTRAL AFRICA
EASTERN ANDSOUTHERN AFRICA
MIDDLE EAST ANDNORTH AFRICA
LATIN AMERICA ANDTHE CARIBBEAN
SOUTH ASIA
CEE/CIS
EAST ASIAAND THE PACIFIC
W. EUROPE, N. AMERICA AND AUSTRALASIA
0 10 20 30 40%
Lower sec. agePrimary age
Lower sec. agePrimary age
Lower sec. agePrimary age
Lower sec. agePrimary age
Lower sec. agePrimary age
Lower sec. agePrimary age
Lower sec. agePrimary age
Lower sec. agePrimary age
Lower sec. agePrimary age
Both sexes Male Female
Source: UNESCO Institute for Statistics, August 2014 DataLink: http://dx.doi.org/10.15220/2014/ed/sd/7/f2.8

29Findings from the Global Initiative on Out-of-School Children
school age was at least 10 percentage points greater than the male out-of-school rate in ten countries, nearly all of them in sub-Saharan Africa. For adolescents of lower secondary school age, the female out-of-school rate was at least 10 percentage points greater than the male out-of-school rate in five countries. By contrast, there are only two countries (Antigua and Barbuda and Bangladesh) where the out-of-school rate for boys of lower secondary school age was 10 percentage points or more greater than that for girls.5 As with Figure 2.4, it should be noted that the list in Table 2.3 is incomplete because of a lack of reliable data for many countries.
Household survey data on exclusion from education
Administrative data in the UIS database can be disaggregated by sex but provide no information on the other individual and household characteristics of children who are excluded from education. For this, we must turn to household survey data, which also complement administrative data by providing additional information on the possible extent of exclusion from education, as discussed in Section 2.4.
Analysis of data from international household survey programmes, such as DHS and MICS, consistently demonstrates that, where disparities exist, girls, rural children and children from poor
5 The data for Antigua and Barbuda should be interpreted with caution because the country has a very small school-age population, which can exaggerate gender disparities for certain indicators. The national number of primary school-age out-of-school children was estimated to be less than 1,600 in 2012.
households are on average more likely to be out of school than boys, urban children and children from wealthier households (UIS, 2010; 2011a; 2012b).6 Furthermore, the impact of personal and household characteristics on school attendance tends to be cumulative, so that for example, girls from poor, rural households often have far lower attendance rates than boys from rich, urban households. (Explore the data for countries participating in the Global Initiative with the UIS online tool at http://on.unesco.org/oosci-global)
Figure 2.9 displays data from 63 nationally-representative household surveys carried out between 2008 and 2012. Hattori (2014) calculated average out-of-school rates across the 63 countries and found that 14% of all children of primary school age were out of school.7 There was hardly any difference between the out-of-school rates of girls and boys (14% and 13%, respectively). On the other hand, there were clear links between the out-of-school rate and the location of a household (urban or rural), household wealth and the level of education of the household head. Children from the poorest household quintile had the highest average out-of-school rate, 22%, compared to an out-of-school rate of less than 6% among children from the richest households. Higher educational attainment of the household head and living in an urban area were
6 Administrative records typically contain data on enrolment, while household surveys typically collect data on attendance.
7 Each of the 63 countries had an equal weight in the calculation of the average out-of-school rate in Figure 2.9. The relative size of each country’s population of primary school age was not considered. The focus of the analysis is, therefore, on individual countries rather than the national or combined number of children in and out of school.
Table 2.3 Selected countries with a large difference between the male and female out-of-school rates, latest data available, 2010-2013
Female out-of-school rate 10 percentage points or more greater than male out-of-school rate
Male out-of-school rate 10 percentage points or more greater than female out-of-school rate
Primary school age Lower secondary school age Primary school age Lower secondary school age
AngolaCameroonCentral African RepublicChadGuineaNigerNigeriaSouth SudanYemen
Central African RepublicGuineaMaliMozambiqueYemen
Antigua and BarbudaBangladesh
Source: UNESCO Institute for Statistics, August 2014

30 Fixing the Broken Promise of Education for All
associated with lower out-of-school rates among children of primary school age.
Hattori (2014) confirmed these findings with a regression analysis of the determinants of school attendance among children of primary and lower secondary school age.8 Among the factors that were considered, household wealth was by far the most statistically significant determinant of school attendance in 56 of the 63 countries studied. In Guinea, for example, children from the wealthiest household quintile were nearly 40 percentage points more likely to attend school than those from the poorest quintile, when other factors were held constant. In many other countries in sub-Saharan Africa and South Asia, children from the richest households were at least 20 percentage points more likely to be in school than children from the poorest households. The majority of countries where
8 Analysis of data from household surveys, such as DHS and MICS, can only consider demand-side determinants of school attendance. Supply-side factors, such as the distance to the nearest school or the quality of education on offer, cannot be examined because DHS and MICS surveys do not collect data on the supply side of the education system.
household wealth had only a weak effect on school attendance had already achieved high attendance rates (above 95%). There was a positive association between school attendance and having a household head with a high level of education (secondary education or higher) in 54 of the 63 countries analysed, evidence of the inter-generational impact of education. The link between school attendance and other factors considered in the analysis (age, sex and location of the household) was, however, mixed. Older children, boys and children from urban households were, on average, more likely to attend school, but this was not the case in every country.
2.4 HOW TO IMPROVE THE ACCURACY OF ESTIMATES OF OUT-OF-SCHOOL CHILDREN
UIS estimates of the rate and number of out-of-school children are used to monitor progress towards international education goals, acting as barometers to identify and compare key trends at the global and regional levels. At the same time, countries also
Figure 2.9 Percentage of children of primary school age in school, by sex, location, household wealth and education of the household head, various years
21
12
6
22
16
13
9
6
16
8
14
13
14
HOUSEHOLD HEAD LESS THAN PRIM. ED.
HOUSEHOLD HEAD PRIMARY ED.
HOUSEHOLD HEAD SEC. OR HIGHER ED.
POOREST QUINTILE
SECOND POOREST QUINTILE
MIDDLE QUINTILE
SECOND RICHEST QUINTILE
RICHEST QUINTILE
RURAL
URBAN
FEMALE
MALE
TOTAL
0 10 20 30 40 50 60 70%
National valuesMean values (unweighted) per group
Source: Hattori, 2014 DataLink: http://dx.doi.org/10.15220/2014/ed/sd/7/f2.9

31Findings from the Global Initiative on Out-of-School Children
Box 2.2 Schooling trajectories in Pakistan
Household survey data can be used to examine the dynamics by which children progress through all of the different levels of the education system.9
In Pakistan, for example, a country with one of the world’s largest out-of-school populations, adolescents aged 13 to 16 years (the official age for upper secondary education) who entered primary school on time and did not repeat any grades should, in theory, have completed their lower secondary education. However, data from a DHS survey carried out in 2012 and 2013 show that Pakistan’s reality is very different. Only 79% of those aged 13 to 16 had entered primary school and only 63% had completed primary education. Another 10% were still in primary education at the time of the survey and may eventually complete that level.
Most children in the sample who completed primary education continued their education at the lower secondary level (55%), but only 26% had completed lower secondary education by the time they were 13 to 16 years old. This is, in part, because 26% of this age group were still attending lower secondary education at the time of the survey. Only 3% had dropped out of lower secondary education without completing that level.
These results can be further broken down by household wealth. Figure 2.10 compares the schooling trajectories of upper secondary school-age adolescents from the richest and poorest household quintiles in Pakistan. In the richest households, nearly all of those aged 13 to 16 (96%) had entered primary education, only one-half (49%) had completed lower secondary education, and around one-third (35%) were still in lower secondary school at the time of the survey (as seen in the difference between the values for ‘attending or completed lower secondary education’ and ‘completed lower secondary education’ in Figure 2.10). In the poorest quintile, only 47% had entered primary school and only 5% had completed lower secondary education by the time they reached upper secondary school age.
9 Similar analysis was carried out by Nguyen and Wodon (2014a) and by the authors of the regional OOSCI report for West and Central Africa (UNICEF and UIS, 2014c).
%
Notes: EP = entered primary education; ACP = attending or completed primary education; CP = completed primary education; ELS = entered lower secondary education; ACLS = attending or completed lower secondary education; CLS = completed lower secondary education.
0
20
40
60
80
100
EP ACP CP ELS ACLS CLS
RICHEST QUINTILE: Both sexes Male Female
POOREST QUINTILE: Both sexes Male Female
Figure 2.10 Educational attainment of adolescents of upper secondary school age (13-16 years) in the richest and poorest household wealth quintiles of Pakistan, 2012-2013
Source: UIS calculations based on the Pakistan Demographic and Health Survey (DHS) 2012-2013
DataLink: http://dx.doi.org/10.15220/2014/ed/sd/7/f2.10

32 Fixing the Broken Promise of Education for All
produce national and sub-national out-of-school estimates to inform their own decision-making. The challenge for the calculation of more precise figures, whether for international monitoring or national policymaking, lies in improving the accuracy of data on population, enrolment and attendance, refining consistency between population and enrolment data, and developing new indicators to measure exclusion from education.
We need better population estimates to calculate the number of children in each country
The accuracy of estimates of the school-age population has a direct and major impact on estimates of out-of-school children from administrative data. When the school-age population is underestimated or overestimated, the out-of-school rate follows suit. Improving the consistency between population and enrolment data begins with ensuring that both are as accurate and complete as possible.
It is a fact that population data for many countries lack precision. Doubts about population estimates for countries with large populations, such as China and Ethiopia, are the reason for the lack of recent UIS estimates of the rate and number of out-of-school children and adolescents in these countries.
Population censuses are usually carried out every 10 years but have not been conducted in the Democratic Republic of the Congo and Somalia in a quarter of a century. Population estimates for years between censuses rely on projections based on inter-census data on births, deaths and migration, which are not always reliable. Generally speaking, the further a year is from the last full census, the more likely it is that the population estimate is inaccurate. It is important, therefore, to continue to improve the population estimates that are generated between censuses. Accuracy can also be undermined when censuses underestimate hard-to-reach marginalised groups, such as nomadic populations, undocumented residents and those in slums and refugee camps (Carr-Hill, 2013). Improving the coverage of census data collection would also improve household survey-based estimates, because the census provides the survey sampling frame.
Improvements are also needed in the consistency between data on age from population censuses and enrolment records. In most countries, the government mandates that children must enrol in school if they are of primary school age on or before a certain date. The most accurate estimates of out-of-school children would refer to the ages of children at this specific date. If age data for students and
Figure 2.10 also shows a striking gender gap in the schooling trajectories of adolescents aged 13 to 16 years from the poorest household quintile: 60% of boys had entered primary school, compared to only 30% of girls. However, once girls enter school, they are less likely to drop out—even if they are poor—and the gap between the entrance and completion rates of girls and boys shrinks at higher levels of education. By contrast, girls and boys from the richest households are equally likely to enter primary education and progress similarly through the education system, although boys are somewhat more likely to drop out along the way.
This analysis of schooling pathways yields important insights into the points within the education system where children are likely to discontinue their education.10 It also demonstrates that enrolment rates or out-of-school rates alone are not enough to obtain a full picture of exclusion from primary and secondary education. The fact that 10% of children of upper secondary school age in Pakistan were still in primary school in 2013 indicates widespread late entry into the education system. Under such circumstances, the out-of-school rate of primary school-age children on its own can give a false impression of the extent of exclusion from primary education. One way to address this problem is to examine the past and possible future school attendance of out-of-school children, as presented in Figure 2.5 on the school exposure of out-of-school children.
10 It should be noted that the experience of older cohorts will not necessarily be repeated by children who enter a country’s education system today. In Pakistan and other countries, younger cohorts are more likely to have entered and completed a given level of education than members of older cohorts, and this trend is likely to continue.
33Findings from the Global Initiative on Out-of-School Children
the population are collected at a later time, children who were too young to enter primary school by the date mandated by law but had their birthday by the time the population data are collected are incorrectly counted as part of the school-age population and, therefore, as being out of school. Given the crucial role population data play in calculating out-of-school rates and numbers, lines of communication should be established between the agencies responsible for population estimates and enrolment data to understand and resolve inconsistencies.
Household survey data face a similar issue. Household surveys can be conducted at any time and often take place more than six months after the school year has started. This discrepancy can have a substantial impact on out-of-school estimates. For example, the large gap (11 to 15 months after the start of the reference school year) in the data collection of the Kenya 2008-2009 DHS survey resulted in an inflated primary out-of-school rate of 26%, which halved to 13% after the data on age were adjusted to the start of the school year during indicator calculation. The solution is to ensure that surveys collect birth date information for all children to determine their exact age at the start of the school year. While most surveys, such as DHS, do not do so at present, recent MICS surveys have included this information, which greatly improves the accuracy of the data on age that underpin the estimates of out-of-school rates.
We need better enrolment and attendance data to know how many children are in school or out of school
Barring a few national exceptions, there is no regular data collection that targets out-of-school children specifically. The global and regional numbers presented in this report are based on administrative data captured through school censuses—official government data used for planning. Because the data are collected in schools, they do not provide information on out-of-school children. As we have seen, population data are needed to calculate out-of-school estimates, and errors can result where there is a mismatch between population and enrolment data.
Household surveys are used for multiple purposes, including demography and health planning, and education is not always a major component. Because the data are collected in households, these surveys do include information on out-of-school children and their individual and household characteristics. However, such surveys are generally sample-based and the reliability of their results, including their estimates of the percentage and number of children in and out of school, can be affected by sampling and non-sampling errors.
Both sources of data, administrative records and household surveys, are used to take a snapshot of school attendance, which is a dynamic phenomenon. Children are constantly entering and leaving school or moving from one school to another. Yet, statistical tools differ in fundamental ways: who collects the data, as well as how, when and for what purpose. As the example of India in Box 2.3 demonstrates, different sources of data can yield very different estimates of the number of children and adolescents out of school.
There is no one best data source and each has its advantages, which may make it more appropriate for a given purpose over other data sources. In order to assess the extent of exclusion from education, statistics on school attendance from all sources must be considered. A thorough examination of data quality and suitability can help countries decide which data to use for their policies. The following recommendations apply to all sources of data on enrolment or attendance to improve the accuracy of estimates of out-of-school children.
To accurately measure the number of out-of-school children, we need to improve the accuracy of data on population, enrolment and attendance; refine consistency between population and enrolment data; and develop new indicators to measure exclusion from education

34 Fixing the Broken Promise of Education for All
First, efforts should be made to ensure that school censuses collect data on all schools, public and private, to avoid the underreporting of enrolment. For example, many children identified as out of school in national statistics may, in fact, attend schools in the non-formal sector, such as community, NGO-run or unregistered schools. The large diversity of education programmes and providers, coupled with a lack of standards, pose great challenges for the collection of accurate data. Ministries of education, which manage school censuses, typically have no regulatory control
over providers of non-formal education and may not even know they exist. Household surveys, like DHS and MICS, do not collect data specifically on non-formal education because of the difficulties in identifying and classifying such forms of education. While several countries have developed Non-Formal Education Management Information Systems (NFE-MIS) in the past decade, there has been increasing effort to develop more comprehensive Education Management Information Systems (EMIS) that integrate both formal and non-formal education
Box 2.3 Selecting and calculating estimates on out-of-school children in India
Data collection and analysis are uniquely challenging tasks in India, with its large and diverse population. Although India’s primary and lower secondary school-age out-of-school rates are low compared to the rest of South Asia, a difference of one percentage point in the country’s out-of-school rate can mean a difference of more than one million in the number of out-of-school children. India’s participation in the Global Initiative on Out-of-School Children was motivated, in large part, by a need to understand the reasons for different estimates of the number of out-of-school children and to harmonise methodologies (Sigdel, 2014).
A data inventory at the outset of the national study revealed the availability of a whole range of administrative and household data sources to generate statistics and develop profiles of out-of-school children. However, the out-of-school rates calculated from these sources were not consistent. In-depth investigation by the national report team revealed two main sources of discrepancy.
First, the sample design and timing of the survey matters. With the 2011 census data not yet available at the time of the analysis, all recent data sources were sample surveys. The sampling frameworks of some surveys were designed specifically to collect data on education, while others were not. In addition, the data collection of each of the two relevant National Sample Survey Office (NSSO) surveys (2007-2008 and 2009-2010) took place during two consecutive school years. By contrast, the 2009-2010 Social and Rural Research Institute of IMRB International (SRI-IMRB) Survey of Out-of-School Children conducted by the Ministry of Human Resource Development was designed to collect data on this topic and data collection was aligned with the academic year. As a result, estimates of out-of-school children from these surveys did not match.
Second, surveys used different definitions of out-of-school children. Despite the fact that the NSSO 2007-2008 and SRI-IMRB 2009-2010 surveys used the same sampling framework, the out-of-school rates from the SRI-IMRB survey were much lower. It found that 4% of children of primary school age and 5% of children of lower secondary school age were out of school, while the NSSO reported that 11% and 8% of primary and lower secondary school-age children were out of school, respectively. The differences stemmed in part from what each survey considered as being ‘in school’. SRI-IMRB considered school-age children, even when enrolled, who had not attended any kind of formal school during the two months preceding the survey as being out of school; children in formal pre-primary education were counted as in school. By contrast, the NSSO survey counted as out-of-school children those who were enrolled but had not attended primary or secondary school at any time in the reference academic year; children in pre-primary education were considered out of school.
Overall, the report team from India concluded that there is no one perfect estimate of the rate and number of out-of-school children in the country: the data sources revealed a range of estimates of the true value. Nonetheless, by identifying the causes of discrepancies and by adopting standard definitions and methodologies, it is possible to arrive at better estimates. The Government of India is now working towards the establishment of a clear, national definition of school drop-out.

35Findings from the Global Initiative on Out-of-School Children
in a number of countries, such as Cambodia, the Democratic Republic of the Congo and Tanzania (Yasunaga, 2014).
At the same time, some countries face the challenge of inflated enrolment. This can occur when schools report children who never attend as enrolled or where children are registered at two or more schools but attend only one of them. A major cause of inflated enrolment figures is the linking of funding to the number of students. In these cases, schools have an incentive to overreport actual enrolment, and as a result, the number of out-of-school children may be underestimated. Monitoring and verification procedures of reported enrolment data can help to check overstated enrolment counts.
Second, there must be a clear and consistently applied definition of drop-out at the national level. If children who have left school remain enrolled in the school register, the number of out-of-school children will be underestimated. A first step is to establish a standard list of the authorised and unauthorised reasons for school absence. Then, clear guidelines can be established to deregister students who have been absent without an authorised reason (such as suspension or illness) for a given amount of time.
Finally, improvements are needed in the recording of data on children’s age. In countries with weak birth registration systems in particular, the age of children can be misreported by teachers, administrators or households members, who may assume the children are of primary school age when they may, in fact, be older or (less commonly) younger. This affects both administrative and household survey-based estimates. As demonstrated in a report by the UIS and UNICEF, this can result in an overestimate of enrolment rates for primary school-age children and an underestimate of enrolment rates for secondary school-age children (UIS and UNICEF, 2005).
We need better indicators to measure exclusion from education
It is also necessary to review the indicators that are used to assess progress towards international
goals. The out-of-school rate is derived from the percentage of children enrolled in or attending primary or secondary education. However, these indicators are not perfect because they measure enrolment or attendance of children at the official age for the respective level of education. Take the example of a country where all children enter and complete primary education but where some children enter primary school one year late. In this case, late entrants will be counted as out-of-school children in national statistics, even though the country has reached universal primary education. 910
Indicators of primary completion that could measure more accurately how close a country is to universal primary education, regardless of the age at which children complete that level, are more difficult to calculate because of limited data availability. Graduation is not a well-defined concept at the primary level and the UIS calculates, therefore, a proxy measure of primary school completion—the gross intake ratio to the last grade of primary education—which is not as straightforward to interpret as the out-of-school rate and related indicators.11 The advantages and disadvantages of current indicators are an important issue to consider as the international community defines new and improved indicators for post-2015 goals to succeed the EFA goals and the Millennium Development Goals.
2.5 HOW TO BETTER IDENTIFY THE CHARACTERISTICS OF CHILDREN OUT OF SCHOOL
Statistics on out-of-school children produced by the UIS are intended for international comparison, but to develop in-depth profiles of these children for targeted policies, more fine-grained, sub-national information is needed.
The most important and practical way to identify the profiles of out-of-school children is to delve further into the data sources that already exist. National-level
11 The gross intake ratio to the last grade of primary education is calculated by dividing the number of new entrants to the last grade of primary education by the number of children at the official age of entry into the last grade. The ratio can exceed 100% if many over- or under-aged children enter the last grade of primary education as a result of early or late entry into primary school and grade repetition.

36 Fixing the Broken Promise of Education for All
administrative records and household surveys are the primary sources used to identify the characteristics of children excluded from education. Administrative data, with their relatively complete coverage of all students in all schools, have great potential to zoom in on the characteristics at the district or school level, for example, to examine areas with high rates of over-age students or early school leaving.
A major finding of the Global Initiative on Out-of-School Children is that household surveys are underutilised data sources on out-of-school children, providing rich information on the profiles of these children by sex, location, household wealth, education of the parents, and other personal and household characteristics. However, such surveys are rarely managed by the ministry of education, whose staff may not be aware of or trained in using this kind of data. Cross-sector collaboration can facilitate access and analysis of this rich source of data for education policymaking. For future data collection, ministry of education staff should be consulted during household survey design to ensure that education questions are accurate and useful.
At present, crucial information is either lacking or of poor quality on many of the most marginalised out-of-school children. For these children, such as those affected by armed conflict or with disabilities, the lack of quality data is a major barrier to the development of effective, evidence-based policies.
Targeted data collection initiatives and analyses are needed to close data gaps. Out-of-school estimates from household surveys are likely to underestimate the out-of-school population because they often omit—by design—many of the most vulnerable groups of children (Carr-Hill, 2013). Homeless children, those in institutions (such as care homes, orphanages and hospitals), refugee camps, and
mobile or nomadic groups do not live in households and are, therefore, generally excluded from survey data collection. Invisible to regular data collection, these children require specific data collection, similar to a special survey on out-of-school children conducted by the Democratic Republic of the Congo in 2012. This survey showed that one-half of the children living in shelters and on the street are orphans, largely concentrated in the conflict-affected provinces of North and South Kivu and in the capital Kinshasa (UNICEF and UIS, 2013d). The survey also revealed that out-of-school rates vary between children in shelters and those on the street. Primary school-age children in shelters have lower out-of-school rates than the national average (11% versus 26%), but for lower secondary school age, the rates are the same (13%). In contrast, 96% of the 1,160 street children of primary school age studied were out of school. Among the 970 lower secondary school-age adolescents sampled, 93% were not in school. The survey also found that most street children are boys, though the girls who are on the streets face especially harsh conditions and are often victims of forced prostitution. This gender dynamic is common in many countries (Salmon and Wodon, 2014). Such targeted research brings visibility to vulnerable groups who would otherwise be overlooked in regular data collections.
In other cases, existing data can be greatly improved to enhance the information on vulnerable children. Surveys may underestimate the number of out-of-school children among groups for whom exclusion from education is particularly acute. In regions with security risks, no data may be collected at all—a challenge faced by national out-of-school studies in Pakistan and other conflict-affected countries. While it is often said that children with disabilities are likely to comprise a significant proportion of out-of-school children, precise and reliable data on their situation are rare. Until recently, only data on the most visible or severe disabilities were reported. The availability and quality of information on children with disabilities has been improved by a shift in focus towards their functioning, as well as mild and moderate disabilities and impairments, which is more useful for designing policies and interventions. Yet, these advancements
Household surveys are underutilised data sources on out-of-school
children, providing rich information on their profiles

37Findings from the Global Initiative on Out-of-School Children
have not reached all data collection systems. Similarly, surveys often report on the languages spoken at home, but information is rarely collected on the language of instruction at school—information that is crucial to understand the impact of language barriers on school attendance. The data gaps for these three vulnerable groups are discussed in more detail in Chapter 3.
Lastly, while information on the characteristics of out-of-school children comes mainly from household survey data, improvements in education data management systems mean that increasingly administrative data can be used to identify out-of-school children. In countries with relatively robust information systems, such as many countries in the CEE/CIS region and Latin America and the Caribbean, civil registry data are being linked with school census data, using unique ID numbers for each child. The development of such a national identification system in Turkey, for example, has allowed more accurate monitoring of children as they
move in and out of the education system (UNICEF and UIS, 2012h). It would, however, be a challenge to implement national ID numbers or similarly advanced systems in less-developed countries, including many of the countries with large numbers of out-of-school children and adolescents.
The increasing complexity of education management information systems requires updated procedures for data entry, processing and analysis to harness the true potential of these advancements. Such a system must also go hand in hand with a comprehensive legal framework to ensure that firstly, confidentiality of data is maintained and that, secondly, all children can easily acquire the documentation necessary to register in school.
These issues are discussed in more detail in Chapter 3 as we turn to the system-wide barriers and solutions to the global challenge of out-of-school children and look more closely at who these children are and what is keeping them out of the classroom.

38 Fixing the Broken Promise of Education for All

39Findings from the Global Initiative on Out-of-School Children
3.1 INTRODUCTION
The faltering global progress towards the EFA goals and the education-related Millennium Development Goals has varied significantly across countries. Some have managed to considerably expand education access and are now focusing specifically on the most disadvantaged children—the so-called ‘last 10%’—who have not yet been reached. Other countries, however, face persistent and widespread challenges that continue to leave large numbers of children excluded.
The chapter begins by analysing responses that span entire education systems. These system-wide responses involve changes in government policy designed to improve access to school, the quality of the education on offer or its affordability. In general, such ‘universal’ responses will have some impact on every child in the country. The chapter explores how such system-wide responses might differ in countries that still have many miles to go in their journey towards universal completion of primary education and those that are in the final mile. On the latter, the chapter describes ongoing system-level challenges and initiatives in regions such as Latin America and the Caribbean and CEE/CIS countries, which are approaching universal completion of primary education.
The chapter then describes the main causes of persistent exclusion from education and the responses that are needed to ensure the full educational inclusion of every single child. The barriers that deter children from going to school
include social barriers, such as discrimination against girls, financial barriers such as school fees, and practical barriers such as the sheer distance to the nearest school. Responses to improve access must address all barriers that keep—or push—children out of school. These responses may affect the entire education system, with the abolition of school fees being a prime example, or may be targeted towards children who face particular disadvantage, such as children with disabilities who need specific support and equipment.
This is followed by an examination of the specific barriers and targeted policies that have a particular impact on some of the most marginalised groups of out-of-school children as identified in Chapter 2: those affected by conflict, girls, child labourers, children whose first language is not the language of instruction and children with disabilities. Such barriers often work in combination to deny children an education, with severe challenges faced by, for example, a refugee girl with disabilities or a boy from an ethnic minority labouring to support his family.
In countries in the final mile, it is clear that there is an urgent need for specially-targeted efforts to overcome the particular barriers that keep the hardest-to-reach children out of school. They will not be reached simply by business-as-usual approaches that expand existing education systems still further. Instead, there needs to be a shift towards greater equity in education, moving away from systems that allocate resources uniformly and towards systems that allocate resources according to actual needs of marginalised children. In many countries, the shift to more equitable resource
Barriers and policy solutions
Chapter 3

40 Fixing the Broken Promise of Education for All
allocation should be complemented by advocacy campaigns to reduce persistent cultural and social barriers, such as a bias against educating girls or prejudice against ethnic minorities.
The Global Initiative on Out-of-School Children has shown that all countries must, to some extent, adopt both system-wide reforms and targeted responses. Countries that are approaching universal access to education need to focus, in general, on targeted responses that address the specific barriers faced by the most marginalised children. Countries that still have large populations of out-of-school children, on the other hand, usually need to balance targeted interventions with broader system-wide reforms. In these countries, targeted interventions alone cannot compensate for weak education systems, and the emphasis has to be on investment to strengthen and expand these systems, combined with a sharp focus on inclusion and the quality of education. Indeed, in many developing countries, resources are skewed in the opposite way, with more resources for the most advantaged: urban, more affluent areas receiving more funding per student than poorer, rural areas. Particularly in sub-Saharan Africa, a first crucial step toward equity in educational spending is working towards achieving equality in resource allocation, such that resources are distributed equally among different parts of the country (UNESCO 2010b).
The issue of teaching and learning quality cuts across all countries and is seen increasingly as a vital component of efforts to achieve universal primary education. Some have called for a move away from language that refers to ‘education for all’ to a language that supports more directly the concept of ‘learning for all’, given that learning is the ultimate purpose of schooling. The rapid expansion of efforts to improve learning quality is an opportunity to address learning in ways that avoid the inequitable patterns that have characterised expansions in access—urban boys first, then urban girls, then rural boys and rural girls, with the most marginalised children always the very last of all. This chapter examines policies to improve access and learning of children who are often marginalised from mainstream education.
The chapter confirms that the barriers to universal education are complex and interlinked, and that the ability to respond to them is constrained by a lack of data and coordination among stakeholders to deliver a comprehensive response. The responsibility for the information, capacity and scale-up that are needed to respond to the system-wide and specific barriers faced by children lies not only with national ministries of education but also with any ministry that implements programmes for vulnerable children or collects data on their situation. As well as examining specific policy barriers and solutions, this chapter attempts to pull together what we know about the barriers, what we do not know about them and how to bridge the gap between the two.
3.2 SYSTEM-WIDE BARRIERS, SYSTEM-WIDE SOLUTIONS12
“There are many reasons [why children are out
of school]. First and foremost, financial reasons:
most Congolese parents are poor, even those
who do work earn little and the salary is paid
when the employer decides to give it. It’s difficult
to manage; with the salary you pay the rent,
education and medical expenses, transportation
and more. Parents say: I can’t pay for it all; I
have to choose one or two children [to attend
school]… the others must wait.”
Educator, Democratic Republic of the Congo
(UNICEF and UIS, 2013d)
Countries with the greatest distance to travel
At the global level, a handful of countries account for one-half of all out-of-school children. These are the countries that have the greatest distance to travel to achieve universal primary enrolment and completion. Many are characterised by instability and conflict, as well as extreme poverty. Yet, despite needing proportionally more support, they are also the countries that have the greatest difficulty accessing external expertise and financial support, largely due to their adverse political environments. For example, the Democratic Republic of the Congo and Nigeria,
12 This section draws on “Analysis of System-Wide Issues in Latin America and the Caribbean”, written by Janet Lennox (UNICEF).
41Findings from the Global Initiative on Out-of-School Children
which are both vast countries that are home to many millions of out-of-school children, have received disproportionately little external support. The same is true for smaller countries, such as the Central African Republic and Chad.
In virtually every region, a relatively small number of countries account for a disproportionately large percentage of children out of school (see Figure 2.4
and Appendix IV). Two countries, Sudan and Yemen, account for three-quarters of the out-of-school population in the Middle East and North Africa. Burkina Faso, Chad, Ghana, Mali, Niger, Nigeria and Senegal account for the same proportion in Western and Central Africa. Household survey data indicate that Ethiopia, Kenya, Somalia, South Sudan and Tanzania account for a significant proportion of out-of-school children in Eastern and Southern Africa. In South Asia, Pakistan alone accounts for more than one-half of the out-of-school children in the region, while Afghanistan also has a large number and proportion of out-of-school children according to household survey data.
In these countries, as well as in those with smaller populations, such as the Central African Republic, Chad, Djibouti and Mali, exclusion is a broad-based phenomenon that cuts a wide swathe through the school-aged population. The principal barrier in these countries is that there simply are not enough classrooms and teachers to enable all children to go to school. For example, in the Central African Republic, Chad and the Democratic Republic of the Congo, there are on average more than 80 students in Grade 1 classes, implying a massive shortage of classrooms and teachers. Other essential materials are also in short supply: for every mathematics textbook, there are on average three primary students in Djibouti and five students in Chad (UIS Data Centre, 2014). To achieve universal primary education by 2015, 4 million teachers would be needed to staff new classrooms and replace attrition of the teaching workforce (UIS and EFA GMR, 2014b). While a shortage of schools is often felt most keenly in particular locations, such as rural areas and urban slums, the capacity of a country’s education system is clearly a system-wide issue and
can only be addressed through additional investment in classroom construction, teacher training and the production of learning materials. But even a substantial expansion in the numbers of classrooms and teachers will not be enough to reach the most disadvantaged children—those who are kept out of school by extreme poverty, discrimination or the threat of violence.
Non-formal education programmes can play a crucial role in providing second-chance education for out-of-school children and expanding educational opportunities to areas beyond the reach of the mainstream public school system. However, it is important that such educational opportunities provide a recognised pathway into the formal system. Equivalency programmes have been developed in countries with large out-of-school populations, such as Afghanistan, Burkina Faso, Ethiopia, Ghana, Mali and Zambia, as well as countries in South Asia and Southeast Asia, to bridge formal and non-formal education by linking curriculum and developing frameworks to recognise outcomes of prior learning (Yasunaga, 2014). In Ghana, for example, the Complementary Basic Education Policy targets out-of-school children aged 8 to 14 years, based on positive experiences of the flexible school model (UNICEF and UIS, 2012d).
In all of these countries, poverty plays a crucial role in keeping children out of school. Not only are children from poor families less likely to be offered an opportunity to go to school, but their parents are far less likely to take advantage of schooling opportunities when they are available. In West and Central Africa, parents have reported that household economic hardships were the main reason why their children were not attending school. Household survey data presented in Appendix IV reveal the extraordinary impacts of inequalities in household income on access to schooling, with, for example, differentials in the primary out-of-school rate of more than 40 percentage points between children in households in the top wealth quintile and those in the bottom quintile in 12 countries, all of which are in sub-Saharan Africa, with the exception of Pakistan and Yemen. In Eastern and Southern Africa,

42 Fixing the Broken Promise of Education for All
primary school-age children from the poorest families in Kenya and Malawi are over six times more likely to be out-of-school than children from the richest families. The correlation between poverty and school non-participation is also evident in East Asia and the Pacific (Hattori, 2014).
An important insight is the way that poverty interacts with other factors of exclusion, such as location and gender, to intensify disadvantage. According to the Global Initiative on Out-of-School Children study covering West and Central Africa, barriers to education include “economic hardships related to family issues, child health problems, cultural factors and a poor perception of the value of education” together with “the direct and indirect costs of education, lack of schools, teachers and equipment, as well as bad teaching practices and violence at school” (UNICEF and UIS, 2014c). In many countries, it is the poorest children who receive the poorest quality education, served by schools with overcrowded classrooms, insufficient teaching materials and textbooks, high teacher absenteeism and poor quality facilities.
Pakistan illustrates the range of challenges faced by policymakers who must determine what should be prioritised. In this one country, for example, the challenges include the yawning disparity in school attendance by household wealth and the highest urban-rural gap in South Asia, with children in rural Balochistan having significantly higher rates of exclusion than the national average. As shown in the following sections, Pakistan must also contend with barriers faced by particular marginalised groups, with its dismal attendance rates for girls throughout the basic education cycle and a child labour rate of
13% that translates into an out-of-school rate for child labourers of around 88%. Here again, instability fuels non-attendance with widespread violence in the Swat valley in 2007 leading to a mass exodus of internally-displaced people and a marked drop in school attendance.
Not surprisingly, the single most important barrier to education in the countries that have the farthest to travel is usually the high cost of education for families: whether these are direct, such as fees for schooling, or ‘hidden’, such as informal fees paid to teachers or the loss of income from a child’s labour.
An increasing body of literature documents the positive impact of strategies that address these costs, with three responses identified as having a strong impact (whether applied universally or targeted towards particular children): the abolition of school fees, cash transfer programmes, and school feeding programmes.
m The abolition of school fees is a system-wide approach to addressing the cost of education. While such programmes require careful management to ensure that quality is not compromised, they have played a critical role in enrolment gains in Eastern and Southern Africa (World Bank, 2009) and to a lesser extent in West and Central Africa (UNICEF and UIS, 2014c). This approach is most effective in reducing the barriers faced by children from poorer families when other expenses, such as the cost of textbooks, are abolished at the same time as tuition fees.
m Cash transfer programmes (either conditional or unconditional) are most often used as a targeted intervention to reduce the barriers to access for particular groups of disadvantaged children. These programmes have been effective in increasing enrolment and attendance in school, as well as contributing to reductions in child labour. Cash transfers have been implemented successfully in Latin America and the Caribbean,13
13 A well-known example is Brazil’s Bolsa Familia (Family Grant), which is conditional on the recipient family ensuring that their children attend school.
The single most important barrier to education in the countries that have
the farthest to travel is usually the high cost of education for families
such as fees for schooling, informal fees paid to teachers or the loss of
income from a child’s labour

43Findings from the Global Initiative on Out-of-School Children
and in some Eastern and Southern African countries like the Basic Education Assistance Model in Zimbabwe. In Bangladesh (UNICEF and UIS, 2014d), they have stimulated girls’ enrolment (in particular) in lower secondary school. Despite these successes, the spread of cash transfer programmes is often hampered by the challenges associated with the testing that is necessary to determine whether or not families fall into the eligible target group.
m School feeding programmes can also be either system-wide or targeted, and often have significant impacts. The largest such programme was implemented in India with 120 million school children benefiting by 2006 and has been credited with a significant positive effect on both school enrolment and attendance rates. A systematic review of the evidence over the past 20 years finds consistent positive effects of school feeding on children’s enrolment and attendance, while its impact on academic achievement is less conclusive (Jomaa et al., 2011).
Countries in the final mile
Countries that are in the last mile of their journey to universal primary school completion face a different set of challenges. These countries have already made very significant strides in providing primary education to their children, and their efforts are now often centred on expanded access to pre-primary and secondary education. Despite these advances, however, the central challenge of realising the right to education for every child remains unfulfilled. There are still some children of primary age who are out of school because they are the most disadvantaged and hardest to reach, requiring more complex and often more costly policy responses. These children might represent only a small percentage of the total student population, but their numbers may still be large. In Brazil, for example, an out-of-school rate of only 2.4% in 2009 represented over 730,000 children of primary and lower secondary school age (UNICEF and UIS, 2012a).
Countries facing these challenges are undertaking system-wide approaches to streamline schooling pathways of children and to enrol all children into primary school at the intended age and with adequate school preparation. In Latin America and the Caribbean, one of the most common risk factors for not completing a full course of primary education is over-age enrolment. Over-age students are at much higher risk of dropping out of school early. The relatively large numbers of over-age children in many countries is due to a combination of significant proportions of children who start primary school late, stubbornly high grade-repetition rates (especially in the early years of school), limited pre-primary education to prepare children for entry into primary school, and the prevalence of temporary drop-out and re-enrolment. Taken together, these factors too often result in an age-grade gap from the very start of a child’s education—a gap that can widen over time—and may contribute to early drop-out.
The cumulative impact of this age-grade gap often materialises at the transition from primary to secondary education, with the most disadvantaged children at much greater risk of being pushed out of the education system early. What begins as exclusion that affects a relatively small proportion of the primary school-age population grows to affect a significant percentage by adolescence. In violence-scarred Honduras, for example, enrolment rates in 2011 stood at 89% for 6-year-olds and close to 100% for 8- to 11-year-olds, but these were followed by a precipitous drop to 64% by age 14, meaning that one out of every three adolescents of this age group was excluded. As is common in Latin America and the Caribbean, boys in Honduras were more likely to be over-age for their grade and, therefore, at greater risk of early drop-out (UNICEF and Asociación Civil Educación para Todos, 2011).
Such barriers to the completion of education are often reinforced by irrelevant curricula, poor pedagogy that fails to impart basic skills to children in primary school, and low expectations about the academic potential of

44 Fixing the Broken Promise of Education for All
certain children, including those from poorer families or other disadvantaged groups.
In general, the response to these barriers involves system-wide reforms, particularly a commitment to expand, or even universalise, pre-primary and secondary education. These are often combined with efforts to clarify the regulatory framework to minimise over-age enrolment, improvements in teacher training and curriculum reform to improve the relevance of education in children’s lives. These efforts are often accompanied by communications initiatives to dispel myths about some children, such as those with disabilities, and their ability to benefit from education. An example of the latter is the Cero Falta (Zero Absence) campaign in Uruguay, where children, classes and schools are invited to share their experiences in an annual competition, with selected entries awarded prizes and made into short videos. Another is the follow-up to Brazil’s Global Initiative on Out-of-School Children study organised around the slogan, Fora da escola não pode! (‘Out of school, just won’t do!’), which showcases related multimedia content, including a web-based documentary and a user-friendly website where people can learn about the situation in their municipality and add their comments and ideas.14
14 www.foradaescolanaopode.org.br
One of the simplest and yet most fundamental approaches to providing learning opportunities to children is simply to ensure that these children do not remain invisible. In another region that is well within the final mile, CEE/CIS, several system-wide barriers, including a lack of information-sharing and coordination among the various ministries whose programmes target vulnerable children, have impeded the development of a more robust system to monitor the situation. However, efforts to enrol the remaining out-of-school children (once again, the hardest to reach) and monitor the students at greatest risk of dropping out are now being supported by efforts to improve data systems and interagency cooperation. Key data gaps and problems with the reliability of data have been identified in the national Global Initiative on Out-of-School Children studies in Kyrgyzstan, Romania, Tajikistan and Turkey, and have led to the development of a Regional Framework for Monitoring Out-of-School Children (UNICEF and UIS, 2014f forthcoming).
Work in these countries has focused on the development of a complete and accurate national database of school-age children that can act as the foundation for evidence-informed policies, in addition to mapping and streamlining the procedures and
Figure 3.1 Gaps in data, analysis and policymaking on out-of-school children
All out-of-school children in the compulsory school-age population
Out-of-school children accurately recorded in government databases, including the ministry of education database
Out-of-school children in ministry of education database only (usually those whoenrolled but left school before completion)
Out-of-school children included in analysis and reporting
Out-of-school children supported through targeted policies and strategies
Out-of-school children not receiving any support Out-of-school children supported through targeted policies and strategies
0%
100%
Out-of-school childrennot recorded in the ministryof education database
Out-of-school childrennot recorded in anygovernment database
Source: UNICEF and UIS (2014f, forthcoming) DataLink: http://dx.doi.org/10.15220/2014/ed/sd/7/f3.1
45Findings from the Global Initiative on Out-of-School Children
interventions undertaken by multiple ministries and other actors to ensure that all children complete their basic education (see Figure 3.1). It requires the closing of the horizontal information gaps between ministries by improving and formalising relationships to share information on school-age children.
The cross-sector nature of the barriers and responses around out-of-school children means that reporting and policymaking for this group too often lack the sustained, coordinated commitment needed to reach all children excluded from education. Ministries collect data on and design policies for the children for whom they are responsible: ministries of education for the children who enter school, and ministries of health, social protection and justice for only specific sub-groups of children. To guarantee that no child falls through the cracks, there is a need to understand and streamline the way in which these authorities at the national and community levels intervene to ensure that all children enter school and complete a full cycle of education.
In East Asia, Cambodia has demonstrated that it is possible to conduct a relatively low-cost survey of out-of-school children that illuminates the faces behind the numbers—identifying individual children district by district and region by region, identifying the particular challenges they face, and engaging both schools and NGO partners to bring these children to school. Cambodia has also pioneered the use of a cross-sectoral survey instrument to identify children with disabilities and to provide them with the services they need, as described in Section 2.6. Viet Nam also incorporated provincial level surveys in its Out-of-School Children study allowing a more fine-grained approach to the varied contexts that exist, especially in the mountainous areas and for specific ethnic groups. This has been linked to the development of new policies around the language of instruction (UNICEF and UIS, 2014h).
This chapter now turns the spotlight on to the children who are out of school, examining the barriers they face to their education and highlighting a range of policy solutions and responses that enable them to take their place in the classroom.
3.3 ONE-HALF OF THE WORLD’S OUT-OF-SCHOOL CHILDREN: CHILDREN CAUGHT UP IN CONFLICT15
“My father went to ten schools [to find a school
place for his child]. Finally, I was registered.
They referred us to one school with all the Syrian
children. Now they want to move us to another
school farther away. When we go to school,
no one respects us. My father wanted to cry
because the principal doesn’t respect us.”
Syrian refugee boy aged 14, in Irbid, Jordan
(UNICEF and UIS, 2014b)
Few challenges have more devastating consequences for education than armed conflict. Its most immediate and grave threats are obvious, from the loss of life to the deliberate targeting of schools, teachers and pupils and the abandonment of schooling as families flee for their survival. Less apparent is the creeping erosion of vital educational resources—human as well as financial—and the cumulative and life-long impact on the children who miss months, or even years, of schooling.
The scale of the problem is immense. Children in conflict-affected countries account for just 22% of primary school-age children, but one-half of all children who were denied an education in 2011—and their share of the global out-of-school population is rising, up from 42% in 2008 (UNESCO, 2014a).
In 2011, the largest numbers of primary school-age out-of-school children in conflict-affected areas—12.6 million—were found in sub-Saharan Africa. A further 5.3 million children out of school as a result of conflict lived in South and West Asia and—prior to the Syria crisis (see Box 3.2)—4 million in the
15 This section draws on “Barriers to Education in Conflict-Affected Countries and Policy Opportunities”, a background paper prepared for this report by Patricia Justino, Institute of Development Studies, United Kingdom.
Most out-of-school children and adolescents in conflict-affected countries are girls
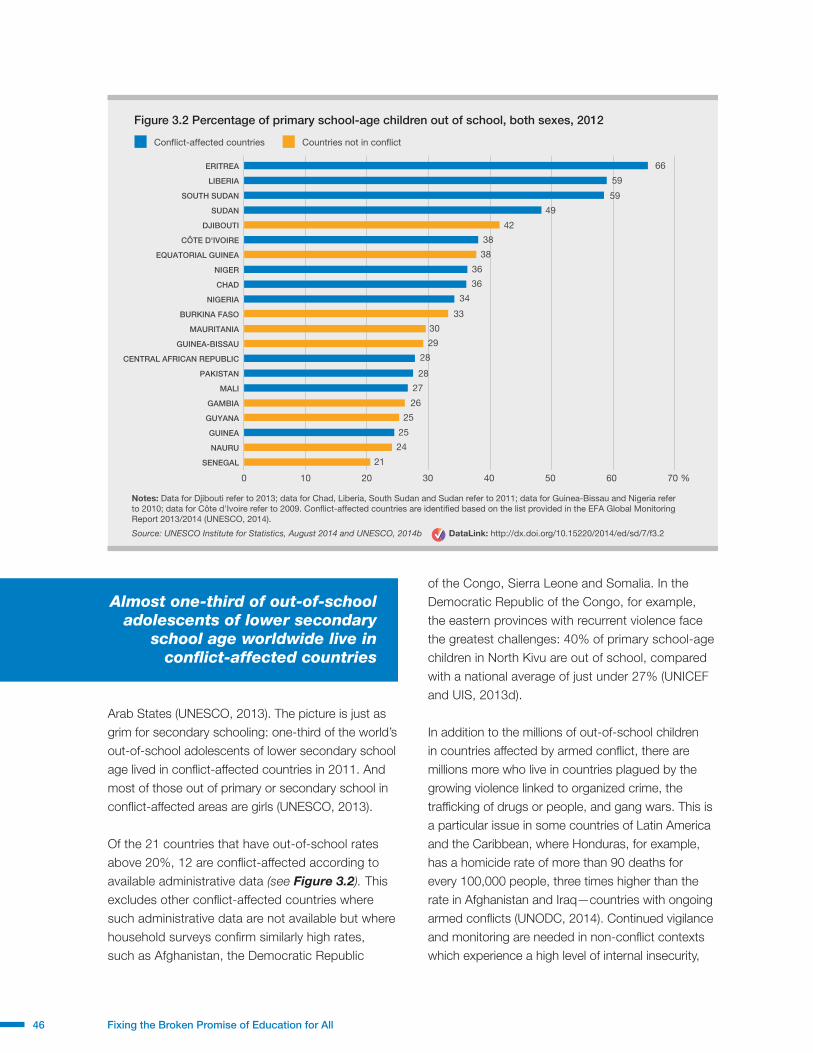
46 Fixing the Broken Promise of Education for All
Arab States (UNESCO, 2013). The picture is just as grim for secondary schooling: one-third of the world’s out-of-school adolescents of lower secondary school age lived in conflict-affected countries in 2011. And most of those out of primary or secondary school in conflict-affected areas are girls (UNESCO, 2013).
Of the 21 countries that have out-of-school rates above 20%, 12 are conflict-affected according to available administrative data (see Figure 3.2). This excludes other conflict-affected countries where such administrative data are not available but where household surveys confirm similarly high rates, such as Afghanistan, the Democratic Republic
of the Congo, Sierra Leone and Somalia. In the Democratic Republic of the Congo, for example, the eastern provinces with recurrent violence face the greatest challenges: 40% of primary school-age children in North Kivu are out of school, compared with a national average of just under 27% (UNICEF and UIS, 2013d).
In addition to the millions of out-of-school children in countries affected by armed conflict, there are millions more who live in countries plagued by the growing violence linked to organized crime, the trafficking of drugs or people, and gang wars. This is a particular issue in some countries of Latin America and the Caribbean, where Honduras, for example, has a homicide rate of more than 90 deaths for every 100,000 people, three times higher than the rate in Afghanistan and Iraq—countries with ongoing armed conflicts (UNODC, 2014). Continued vigilance and monitoring are needed in non-conflict contexts which experience a high level of internal insecurity,
Notes: Data for Djibouti refer to 2013; data for Chad, Liberia, South Sudan and Sudan refer to 2011; data for Guinea-Bissau and Nigeria refer to 2010; data for Côte d'Ivoire refer to 2009. Con�ict-affected countries are identi�ed based on the list provided in the EFA Global Monitoring Report 2013/2014 (UNESCO, 2014).
Con�ict-affected countries Countries not in con�ict
0 10 20 30 40 50 60 70
66
59
59
49
42
38
38
36
36
34
33
30
29
28
28
27
26
25
25
24
21
%
Figure 3.2 Percentage of primary school-age children out of school, both sexes, 2012
ERITREA
LIBERIA
SOUTH SUDAN
SUDAN
DJIBOUTI
CÔTE D'IVOIRE
EQUATORIAL GUINEA
NIGER
CHAD
NIGERIA
BURKINA FASO
MAURITANIA
GUINEA-BISSAU
CENTRAL AFRICAN REPUBLIC
PAKISTAN
MALI
GAMBIA
GUYANA
GUINEA
NAURU
SENEGAL
Source: UNESCO Institute for Statistics, August 2014 and UNESCO, 2014b DataLink: http://dx.doi.org/10.15220/2014/ed/sd/7/f3.2
Almost one-third of out-of-school adolescents of lower secondary
school age worldwide live in conflict-affected countries

47Findings from the Global Initiative on Out-of-School Children
due to inter-tribal warfare, street violence or gender-based violence. These countries can also benefit from lessons learned in supporting education in conflict-affected countries. The impact on education for children in the affected areas can be every bit as severe as for children in countries facing all-out war (UNESCO, 2011).
This failure means that children of primary school age in fragile and conflict-affected situations16 are nearly three times more likely to be out of school than children in other parts of the developing world (World Bank, 2011). Conflict means that children in school are more likely to drop out, with only 65% of children in conflict-affected countries reaching the final grade of primary school, compared with 86% across other developing countries. Children who miss school during episodes of armed violence tend not to go back (UNESCO, 2011). As a result, the countries in which they live have some of the lowest literacy levels in the world.
The loss of education deprives children of at least some protection from the sexual exploitation, physical attacks and recruitment into armed groups that are grotesque features of warfare, and they lose the precious sense of ‘normalcy’ that education can provide (Norwegian Refugee Council, 1999; ICWAC, 2000). They miss the chance to acquire vital skills for the future and the long-term impact includes diminished employment prospects and earnings in later life (Justino, 2011), which may aggravate the risks of an outbreak or renewal of violent conflict (Justino et al., 2013).
The scale of the response to the impact of armed conflict on education has been totally inadequate. As millions of children elsewhere take their rightful place in the classroom, the lack of progress for children in conflict-affected countries serves as a constant reminder of the failure of political will, effective policies and adequate resourcing, as well as the logistics, to tackle this problem. This failure is short-sighted
16 This statistic relates to fragile and conflict-affected situations as outlined in the 2011 World Development Report on Conflict, Security and Development: countries or territories that have a harmonised average Country Policy and Institutional Assessment (CPIA) rating of 3.2 or less (or no CPIA), and/or have or have had a UN and/or regional peace-keeping or peace-building mission during the past three years.
in the extreme, given the importance of education in preventing conflict, in creating a vital sense of normalcy for children during conflict, and as an essential part of post-conflict recovery in its wake.
The barriers to the education of children affected by conflict are formidable, but evidence from the Global Initiative on Out-of-School Children and other sources reveals the potential for a more concerted and comprehensive response, even at the height of the violence.
The barriers
“As a result of the conflict, my family had to
leave home and was pushed into poverty. The
continuous displacement and being separated
from my family, relatives and friends affected my
mental ability and totally destroyed my eagerness
for studies. Schools were also closed and their
activities ceased.”
Boy from Kilinochchi, Sri Lanka
(UNICEF and UIS, 2013c)
Supply barriers
Armed conflict destroys or consumes the infrastructure and resources needed to keep the supply of education flowing. During the Gaza emergency that began in July 2014, for example, displaced people (among them children) sheltering from the violence in school buildings were killed or injured when those schools came under fire (OCHA, 2014).
Conflict scatters communities as people flee, with the number of people living as refugees from war and persecution in 2013 exceeding 50 million for the first time since World War II, and available evidence suggests that one-half of the world’s refugees are
Only 65% of children in conflict-affected countries reach the final grade of primary school, compared with 86% across other developing countries

48 Fixing the Broken Promise of Education for All
now children (UNHCR, 2014). It also skews the equity of education, with some children even more excluded than others in times of war.
Reports from several conflict-affected countries show that schools, teachers and students—visible symbols
of state presence and local coherence—are often targeted for violence by armed groups intent on local control (O’Malley, 2007, 2010; UNESCO, 2011).
Schools in areas affected by violence may become temporary shelters for those who have been uprooted or may even be closed down. Add to this the problems of recruiting or retaining teachers in areas affected by conflict, the disruption of examinations and education supplies, and the woeful lack of funding for education in conflict-affected countries (see Box 3.1), and even schools that manage to stay
Box 3.1 Follow the money: The funding gap
Following the money for education in conflict-affected countries often reveals the entrenched security interests of powerful donor countries, with an emphasis on countries seen as strategic priorities, such as Afghanistan, Iraq and Pakistan (UNESCO, 2011). The global education community has called for a modest 4% of humanitarian aid to be allocated to education, but the share of humanitarian aid for education is actually falling, from 2.2% of aid in 2009 to just 1.4% in 2012. This represents the largest funding gap for any humanitarian sector, a gaping hole of US$221 million in 2012 (UNESCO, 2013), and languishes far below the 4% target.
When looking in detail at the 19 consolidated humanitarian appeals made to the United Nations Office for the Coordination of Humanitarian Affairs (OCHA) in 2013 (see Figure 3.3), only 4 of the 16 countries with requests for education financing received funds equal to at least 4% of humanitarian aid: Somalia (4%), the Syrian Arab Republic (4%), Sudan (6%) and the Central African Republic (8%). In the case of the Central African Republic, however, 81% of the resources received for education were for school feeding programmes.
Unmet requirements Funded % of total humanitarian funding to education
In the Democratic Republic of the Congo, only 9% of requests for the education sector were met. Of the total available funds from the appeal, just 1% was for the education sector.
Figure 3.3 Consolidated appeal requests and funding for education received by conflict-affected countries, 2013
0
10
20
30
40
50
60
70
80
90
100 %
SYRIAN ARABREPUBLIC
SUDAN SOUTHSUDAN
SOMALIA PALESTINE CENTRALAFRICAN REP.
CONGO,DR
MALI YEMEN AFGHANISTAN BURKINAFASO
PHILIPPINES NIGER KENYA CHADMAURITANIA
In m
illio
n U
S$
4%4%
3%
2%0% 0% 0%
6%
3% 8%1%
1%
3% 1%
1%
1%
Source: Office for the Coordination of Humanitarian Affairs, 2014 DataLink: http://dx.doi.org/10.15220/2014/ed/sd/7/f3.3
One-half of the world’s more than 50 million refugees are
thought to be children

49Findings from the Global Initiative on Out-of-School Children
open will struggle to provide a reasonable education (UNESCO, 2011). Such effects have been seen in a mass of conflict-affected countries, including Afghanistan, Colombia, the Democratic Republic of the Congo, Iraq, Nepal, Niger, Pakistan, Palestine, Somalia, Sudan, Thailand and Zimbabwe (O’Malley, 2007, 2010; UNESCO, 2011).
The uprooting of entire communities will, inevitably, derail the supply of education. While some schooling may be available in camps for displaced and refugee children, it is often disorganised, temporary, under-resourced, overcrowded and limited to primary education (UNHCR/OSCE, 2002; Watkins, 2013). These children may be unable to access local schools beyond the camps because of restrictions on their movements, security fears or those schools being unable to cope with more children—a challenge facing Syrian refugee children in Lebanon (see Box 3.2).
Primary education also remains inaccessible for many of Kenya’s refugee children. The Eastern and Southern Africa Global Initiative on Out-of-School Children study shows that while many refugee children in Nairobi, for example, are born in Kenya, their lack of birth certificates hinders their enrolment in public schools. Nairobi’s city council primary schools require refugee parents and guardians to produce a proper registration document, such as a UNHCR-mandated certificate, in addition to their child’s birth certificate (UNICEF and UIS, 2014a).
“Typically, children in conflict zones and broken-down states have been provided with food and shelter as refugees, but few receive any education”
Gordon Brown, UN Special Envoy on Education
Box 3.2 A lost generation? The children of the Syrian Arab Republic
The Syrian conflict has devastated its children’s education. While estimates on the precise impact differ, they all confirm that a large proportion of Syrian children have missed out on education since the outbreak of violence in 2011. Data from the Syrian Ministry of Education (MOE) show that enrolments in Grades 1 to 12 fell by more than one-third (35%) between the 2011/2012 and 2012/2013 school years. The MOE estimates that nearly one-half of those children have left the country, while the remainder are still in the Syrian Arab Republic but have dropped out of school. Another 1.3 million children (approximately) attend school irregularly and are at risk of dropping out (UNICEF and UIS, 2014b).
Many children who have left the Syrian Arab Republic with their families are in Lebanon, where at least 300,000 are out of school. If the Syrian refugee population in Lebanon were a country, it would have one of the world’s lowest primary school enrolment rates—lower than some of the worst-performing countries in sub-Saharan Africa. The net enrolment rate among Syrian refugee children of primary and lower secondary school age (aged 6 to 14 years) is around 12%—less than one-half of the level in South Sudan. For children of upper secondary school age, probably below 5% are attending upper secondary education (Watkins, 2013). By contrast, in 2010 before the conflict began, the Syrian Arab Republic had enrolled virtually all of its primary school-age children in school and was nearing universal enrolment of lower secondary school-age adolescents at 90%.
Lebanon faces immense pressures on all basic services but particularly on education. Its schools have thrown open their doors to the refugee children of the Syrian Arab Republic but are now stretched beyond breaking point: absorbing every refugee child would be equivalent to New York taking in the entire school populations of Washington D.C. and Chicago (Watkins, 2013).
This challenge cannot be resolved through short-term humanitarian appeals, which are already chronically under-funded. Providing education for every Syrian refugee child requires a strong international response and strengthened partnerships, backed by an international action plan of an estimated US$165 million per year (Watkins, 2013) to get every refugee child into the classroom. Without such a response, there are growing concerns at the prospect of a ‘lost generation’ of Syrian children.

50 Fixing the Broken Promise of Education for All
The situation may be even worse for children who are internally displaced within the border of their own conflict-affected country and beyond the reach of international educational support for cross-border refugees or domestic educational services.
While displacement can be temporary, as in Timor-Leste (Justino et al., 2013), it often lasts for decades (as in Colombia, the Democratic Republic of the Congo, Palestine and Sudan), leaving whole generations without access to education and its important social structures (Watkins, 2013).
‘Winners’ have been known to punish ‘losers’ by prioritising school enrolment for some groups or segregating schools along the lines of language (Timor-Leste), race (South Africa), ethnicity (pre-1994 Rwanda) and religion (Northern Ireland) (Bush and Saltarelli, 2000; Shemyakina, 2011). Existing disparities linked to location and income are often reinforced: the Colombia Global Initiative on Out-of-School Children study, for example, reports a geographic divide between children in urban and rural areas, with the worst educational outcomes found among rural populations in areas at risk of armed attacks. These effects only aggravate economic disparities, with obvious consequences for the likelihood of future conflict (UNICEF and UIS, 2012c, 2009; Watkins, 2013).
Demand barriers
In the worst scenarios, violent conflict undermines demand for education by taking the lives of pupils and teachers, instilling relentless fear and insecurity, and by pulling children out of school and into active combat.
Beyond the school gate, conflict reduces demand for education by exacerbating poverty and poor health and by reducing the returns to education. Families that are already impoverished, including the displaced and refugees, may be unable to cover the costs of education, such as uniforms, school fees, school lunches, books and other materials, certificates, transportation and so on (Shemyakina, 2011; UNICEF and UIS, 2014b), with armed conflict
only intensifying their exclusion. Armed conflict can also sweep away a key incentive for education—the chance of a decent job. To put it simply, it may no longer pay to send children to school where job opportunities have been shattered by the destruction of industries, markets and infrastructure, eroding the prospects of higher incomes for households that invest in the education of their children (Santos, 2014; Shemyakina, 2011; Chamarbagwala and Moran, 2009).
More evidence is needed on how this loss of incentive plays out across different conflict-affected contexts and populations. It seems certain, however, that many parents have to make tough choices about the costs and benefits of education for their children in the face of deteriorating job prospects, continued insecurity and growing poverty. Most reports from the Global Initiative on Out-of-School Children from conflict-affected countries confirm the link between conflict, poverty and the loss of education, as seen in Colombia, the Democratic Republic of the Congo, Pakistan, Sri Lanka and Tajikistan (UNICEF and UIS, 2012c; 2013b; 2013c; 2013d; 2013e). Families that have been plunged into extreme poverty and destitution by armed conflict may well remove their children from school to augment household income (Justino et al., 2013; Rodriguez and Sanchez, 2009; UNICEF and UIS, 2014b, 2013a) or to fill the shoes of an adult breadwinner lost to recruitment, death or injury (Akresh and de Walque, 2008; Merrouche, 2006; Shemyakina, 2011; Rodriguez and Sanchez, 2009).
No study has, to date, examined the links between bereavement during armed conflict and reduced demand for education, although a link seems likely. What has been studied, however, is the impact of armed conflict on child and maternal health and nutrition. Children exposed to high levels of violence are often inches shorter than other children—a sign of long-term undernutrition (Bundervoet et al. 2007; Alderman et al., 2006; Bundervoet and Verwimp, 2005; Guerrero-Serdan, 2009). Similarly, a combination of stress and limited access to health services during pregnancy in conflict-affected regions in Jammu and Kashmir (Parlow, 2012), Colombia (Camacho, 2008) and Nepal (Valente, 2011) has

51Findings from the Global Initiative on Out-of-School Children
resulted in children being born with low birth weight. Malnourished children are more likely to miss school, fall sick and struggle to concentrate in the classroom and are, therefore, more likely to drop out of school.
Exposure to violent conflict can result in deep psychological trauma and stress among children, as well as greater family stress: factors that can limit not only their school attendance but also their school performance and future development.
Demand for education is reduced by fear and insecurity. Parents may have valid concerns about keeping their children in school during armed conflict, given that schools are often in the firing line and that teachers and pupils are often seen as legitimate targets for violence, rape and other sexual violence, as well as forced recruitment. Nothing has illustrated this problem more vividly than the kidnap of more than 200 girls from their school in northern Nigeria in early 2014 by Boko Haram, an armed group opposed to ‘western’ education (OHCHR, 2014). The consequence is, as one United Nations report puts it: “a growing fear among children to attend school, among teachers to give classes, and among parents to send their children to school” (United Nations, 2010).
Fear can linger long after the violence ends, particularly in contexts where the original conflict lasted for years and might reignite (Justino, 2012). Fear may also aggravate gender inequalities, restricting the movements of girls, in particular, in the wake of conflict (UNICEF and UIS, 2012b, 2013a, 2013b).
One of the most extreme demand-side barriers to education is the recruitment of children (forced or voluntary). There is no agreed estimate of the number of child combatants worldwide, given the severe data challenges in conflict-affected areas, but it is clear that children are recruited as soldiers, porters, messengers, cooks and sexual slaves (UNHCR/OSCE, 2002; USAID, 2007). Their chance of any education is, effectively, zero, and those who survive and escape are unlikely to return to school (Blattman and Annan, 2009). Many are left traumatised,
depressed and socially withdrawn (UNFPA, 2006), and those who return to the classroom are likely to lag behind or abandon their studies prematurely.
Breaking the barriers
The reform of education systems is no easy task in environments characterised by shattered infrastructure and social institutions. The question is what to prioritise and how? Should the focus be on a good quality education as part of wider social reforms to prevent conflict, keeping children in school during conflict, or the reform of education in the wake of conflict? The answer is a combination of all three, backed by strenuous efforts to close the data gap on education in conflict-affected areas.
While more resources are needed for education during armed conflict, the focus needs to broaden beyond education itself to address what is happening beyond the school gates—the economic and social exclusion that can ignite violence and, in turn, push children out of school.
Reform has to go beyond education. The education sector alone cannot address the complex and interlinked barriers to education presented by armed conflict. Formal education systems must be part of wider reform efforts that transform economic and social institutions to address the inequalities, poverty, vulnerabilities and, indeed, the aspirations of children and families that can work for or against conflict.
This requires education systems that are designed and implemented alongside wider economic and social policies. The most critical are economic interventions to reduce poverty, undernutrition and the need for child labour (see Section 3.5).
A three-pronged approach is needed: reforms that go beyond education, measures to keep education going during conflict, and reforms in the wake of conflict—all backed by better data
52 Fixing the Broken Promise of Education for All
Standard anti-poverty measures may have little impact in countries affected by conflict, where acute economic distress requires a more robust response. Evidence from the Global Initiative on Out-of-School Children studies and wider research suggests that the demand for schooling may be augmented by economic-support interventions, including social protection safety nets and cash transfer programmes.
Such approaches are relatively new among conflict-affected populations, but results are encouraging: the Familias en Acción cash transfer programme in Colombia, for example, is pulling children into school in conflict areas (Bozzoli et al., 2011) and reducing overall school absenteeism (UNICEF and UIS, 2012c). While children in conflict areas still do less homework and miss more days of school (Bozzoli et al., 2011) than other children, a complementary school feeding programme provides a simple incentive to go to school (UNICEF and UIS, 2012c). Other examples include the Punjab Education Voucher Scheme and the Benazir Income Support Programme in Pakistan (UNICEF and UIS, 2013b) and the Samurshi Poverty Alleviation Programme in Sri Lanka (UNICEF and UIS, 2013c).
Education reforms also need to ensure that the schooling on offer is effective, inclusive and equitable. Wider social policy reforms should be complemented by interventions to reduce the economic burden of schooling, such as the abolition of school fees and the provision of subsidised uniforms and other school materials (UNESCO, 2011). While such interventions have a universal impact on enrolment, more specific approaches are needed to reach the children most likely to miss out on schooling—whether in peacetime or in times of conflict: the very poorest; girls; child labourers; children from particular
religious, ethnic or language groups; and children with disabilities.
Keep education going. Education systems must do whatever it takes to keep children learning—even at the height of conflict—while recognising that some children are more likely to be out of school than others. The response must also be flexible enough to respond to fast-changing situations without losing sight of the need for long-term engagement, not only during a conflict but also once the conflict has ended.
Sector-wide approaches are crucial, with the maintenance of early childhood education providing a pathway into—and reducing drop-out from—primary education, while continued support for secondary education and teacher training will enhance the benefits of completing a primary education.
Common measures are seen across a number of the Global Initiative on Out-of-School Children studies to address the loss of education among displaced and refugee children, including the hiring of teachers drawn from displaced populations, advocacy and negotiations with host governments and schools to let refugee children attend school, temporary documentation for those who have lost or do not possess key documentation, and the provision of non-formal catch-up programmes for youth.
Non-formal education (NFE) needs special attention in conflict-affected countries, including system-wide approaches to coordinate diverse providers in each phase of the emergency and the inclusion of NFE in national plans of action from the earliest reconstruction phase (Yasunaga, 2014). Several NGOs and UN agencies in the Middle East and North Africa region support non-formal alternative education programmes as a flexible response to education exclusion. Experiences from Iraq and Sudan show that such programmes play a key role during protracted crises, where large numbers of children have missed years of schooling. In Iraq, UNICEF has intensified its support to the accelerated learning programmes, expanding the number of students benefiting from such programmes from around 17,000 in the 2007/2008 school year to more
A non-formal education programme in Iraq—the accelerated learning
programme—is now reaching more than 60,000 students a year, up from
around 17,000 in 2007
53Findings from the Global Initiative on Out-of-School Children
than 60,000 in 2010/2011 in close collaboration with national authorities and local communities (UNICEF and UIS, 2014b).
The second-chance Youth Education Programme supported by the Norwegian Refugee Council spans ten countries, targeting displaced, returnee and other vulnerable youth aged 14 years and older, and combines literacy training with practical skills for employability. One barrier has been the lack of trained teachers, with Sudan among only a handful of countries where the government has seconded teachers to the programme and paid their salaries (UNICEF and UIS, 2014b).
At the most basic level, children need to be safe on the way to and from school and while in the classroom. Examples of physical protection include guards to protect schools, provision of housing for children close to schools, accompanying children to and from school, and transportation safety. In Palestine, a system of so-called protective presence groups has seen international volunteers accompanying children to school when feasible, given the continuing volatility of the situation there. In the Gaza Access Restricted Areas, parents can call teachers to get advice on safe routes to school and an alert system has been introduced to support children’s safety (UNICEF and UIS, 2014b).
When it is simply too dangerous to go to school, tried and tested alternatives have included the organization of temporary schools in religious buildings or at home, summer sessions and distance learning programmes.
Reform education in the wake of conflict. Education is critical for the economic and social recovery of households and countries affected by conflict, but there are clear constraints to the reform of education systems in the wake of violent conflict. Countries may lack the financial capacity to rebuild schools—let alone reform education systems—while trying to meet many other pressing needs, from housing to clean water. It can be done, however, as Rwanda has demonstrated.
Rwanda has made a remarkable recovery from the impact of the 1994 Genocide, during which schools had become sites of betrayal and massacre. Indeed, the country’s recovery has been particularly marked in the education sector, which was seen as fundamental in tackling the historic inequity and exclusion that fuelled the conflict, and went through a series of reforms to promote peaceful social transformation. The key approach was to create an inclusive education system that achieved good learning outcomes for every student, with an emphasis on the ability of the system to mitigate the sources of violent conflict in Rwandan society. This was backed by intense personal commitment, with ministers and other leaders going from province to province to persuade parents to return children to their schools. As a result, the World Bank Country Study of 2004 noted that the numbers of children enrolled in primary school from 1994 to 1999 surpassed the number that would have been enrolled had the system expanded at its pre-conflict rate (World Bank, 2013).
A multi-country response was the Back on Track Programme on Education in Emergencies and Post-Crisis Transition, which operated on the premise that countries with strong internal capacities are less likely to slip back into armed conflict or be overwhelmed by the next disaster. This four-year programme launched in 2006 by UNICEF, the Government of the Netherlands and the European Commission aimed to help countries tackle the precarious conditions that were preventing them from accessing global education funding. It helped countries to build their own capacity, reform their education sectors and deepen partnerships between governments, communities and civil society. By the end of 2010, the programme had restored access to schools and improved education quality for almost 6 million
The Back on Track Programme for conflict-affected countries restored access to school for 6 million children in 40 countries and territories between 2006 and 2010

54 Fixing the Broken Promise of Education for All
children in 40 countries and territories (Back on Track and UNICEF, 2011).
The programme had a sharp focus on access to education for displaced, refugee and returnee children; girls and children from ethnic minorities, including concrete measures such as the provision of temporary learning spaces; the construction and rehabilitation of schools; back-to-school campaigns; and education and recreation kits, as well as support for early childhood development (ECD) programmes. As part of these efforts, a total of 4,700 schools were either constructed or rehabilitated. UNICEF country offices reported improved enrolment and retention rates in the target locations: for example, 23 districts in the Acholi sub-region, northern Uganda reported higher net intake and primary completion rates as a result of the programme (Back on Track and UNICEF, 2011).
Work is also needed to improve post-conflict disarmament, demobilisation and reintegration (DDR) programmes that aim to reintegrate former child combatants into civilian life. The effectiveness of these programmes, which provide money, social and psychological support and employment training for ex-combatants, has been mixed, often because the reasons why individuals join armed groups—particularly children—are poorly understood (Humphreys and Weinstein, 2008; Guichaoua, 2009). Clearly, armed groups expose children to extreme violence but may also provide some sense of ‘belonging’ at a time of extreme instability (Blattman and Annan, 2009; Humphreys and Weinstein, 2008)—considerations that are often absent from DDR programmes and from education programming in conflict-affected countries.
It is also crucial that education nurtures the aspirations that are so often undermined by armed conflict by delivering a good quality education that prepares children for a peaceful and productive adult life. Education can support stability and economic resilience when children and young people learn to support positive social change and when it works in tandem with interventions to address the vulnerabilities and aspirations of those affected by
violence. Educating and training young people to act as constructive and productive citizens may reduce the risk of future conflict, while addressing family and community vulnerabilities may help to break the economic and social barriers that keep children out of school.
Filling the data gap
While data always matter for effective policymaking and efficiency in government spending, they are particularly crucial during conflicts. The building of equitable and sustainable education systems to reduce the number of out-of-school children in conflict-affected countries requires at least some good data and analysis, and there are ‘quick fix’ approaches that can, at the very least, provide vital information on the scale of the problem.
At present, however, the lack of timely evidence on what is happening is, in itself, a barrier to the educational inclusion of children in conflict-affected areas. The data that are available tend to describe the impact of conflict after it has happened, when it is too late to address its most devastating effects (Montjourides, 2013).
Despite recent improvements in data availability and the collection of qualitative and quantitative data in conflict-affected contexts (Justino et al., 2013), the data remain sparse, scattered and non-comparable, while rigorous monitoring and evaluation of policy interventions in such contexts is a rarity. Household surveys, such as DHS, often miss areas affected by conflict and violence, as well as internally displaced and refugee populations. According to the Pakistan Global Initiative on Out-of-School Children study, the DHS survey excludes the Khyber Pakhtunkhwa province because of security concerns. Similarly, the Global Initiative on Out-of-School Children Regional Report on Eastern and Southern Africa notes that population samples for Angola, Burundi and South Sudan were not representative as data were only gathered from non-conflict areas. In all of these countries, therefore, the true impact of conflict on education remains unclear (UNICEF and UIS, 2013b; 2014a).

55Findings from the Global Initiative on Out-of-School Children
Policies and programmes to meet the needs of out-of-school children require a new approach to data, with the emphasis on speed and flexibility and on tools that can be mobilised at different phases of the conflict to assess the specific and changing situation of different groups of children and the impact of current interventions. Rapid Assessment of Learning Spaces (RALS) is a prime example, allowing the evaluation of the changing educational needs of children in conflict-affected areas in order to plan effectively for the reconstruction and reform of education systems in the post-war environment.
The RALS approach has been mobilised successfully in Ethiopia and South Sudan, the world’s youngest state. Southern Sudan had made impressive progress on education before its independence in 2011, doubling the number of pupils in school and halving the pupil-teacher ratio between 2006 and 2009 and prioritising education infrastructure in the most disadvantaged states. This would have been impossible without assessments conducted between 2003 and 2005, but these assessments were limited to the most secure provinces.
In December 2005, the Ministry of Education, Science and Technology, working with UNICEF, undertook a RALS to fill in information gaps and prepare the ground for an annual education census and the development of a full EMIS. The information collected, combined with data from geographic information systems, gave planners a global view of the system as well as detailed information. They had access to gender-disaggregated enrolment figures by grade and level, numbers of teachers by level of training and gender, learning and teaching materials available to students and teachers, subjects taught, and language(s) of instruction.
A yearly statistical booklet now details the state of the education system at all levels and the progress being made.
Another innovative approach to education data collection is the EduTrac system: a mobile phone-based data collection system developed by UNICEF to support the Ministry of Education and Sports of
Uganda to collect real-time data, including teacher and student attendance and delivery of materials. It provides districts with a tool to identify bottlenecks at the school level, facilitates the tracking of accountability for solving any issues arising from system reports and helps to improve planning for education. At the same time, EduTrac complements the existing EMIS. EduTrac has also been used to monitor the schooling status of refugee children from South Sudan who fled the country’s continuing conflicts. Drawing on its successful experience in Uganda, EduTrac has been introduced to Kandahar province in Afghanistan, where there are many out-of-school children and monitoring is hampered by both conflict and remoteness. Teachers are now using EduTrac for real-time reporting and getting feedback on the problems they identify. In other countries, such as Liberia and Sierra Leone, similar progress has been made through the use of comprehensive school censuses or the establishment of an EMIS. While it is too early to determine the precise links between education progress and such approaches to data, it is clear that, without them, it would be impossible to estimate progress at all (Montjourides, 2013).
Data from conflict-affected countries do not meet the most basic data prerequisites in terms of resources, coverage and methodologies. First, there are almost no resources for data collection during emergencies. Second, coverage is patchy (at best), excluding large parts of the population from the picture, particularly the most vulnerable; refugees and internally displaced children. Even when available, data cover only some parts of education, neglecting crucial areas such as learning outcomes, early childhood education and teachers. Third, methodologies need to improve: lack of means does not have to equate lack of rigour, and the comparability and comprehensiveness of indicators produced should follow the same standards that apply in countries
At present, available data tend to describe the impact of conflict after it has happened

56 Fixing the Broken Promise of Education for All
that are not affected by conflict (Montjourides, 2013). UN agencies, such as UNICEF, UNHCR, UNRWA and the UIS, should partner to develop efficient and flexible toolkits to collect and analyse education data during emergency situations.
There can be no doubt that there are serious constraints to data collection and analysis in conflict-affected countries. To address these constraints, the international community needs to be more creative and innovative than ever before.
3.4 WHY GENDER MATTERS17
When her mother migrated to work overseas,
Lalanthi, a 14-year-old girl from Puttalam, Sri
Lanka, was left to care for her younger siblings.
Her father was a violent alcoholic and there was
nobody else who could help. She had to drop out
of school.
(UNICEF and UIS, 2013c)
It seems so obvious that girls and boys should have the same opportunities when it comes to schooling. Indeed, gender parity in education has been seen as a crucial indicator of gender equality overall since 2000 as part of the Millennium Development Goals and was an intermediate goal to be achieved by 2005, well ahead of the other goals. The principle of gender parity has gained considerable traction and is
17 This section draws on “Out-of-School Children: Why Gender Matters”, a background paper prepared for this report by Nelly P. Stromquist, University of Maryland, United States.
now embedded in national education strategies, with governments of most political orientations backing it wholeheartedly.
The situation on the ground, however, is often more complex—particularly when looking beyond school enrolment to school completion. Perceptions and traditions around gender can often combine with location, income and age to determine whether a child is in school or not, as shown in Figure 3.4, contrasting the situation of the poorest rural girls of primary school age in Iraq and the poorest urban boys of lower secondary school age in Bangladesh. They often shape what the state is willing to provide and what families and communities are likely to demand, and when all three perceive gender-based inequities as ‘normal’, some children—most often girls, but sometimes boys (as shown in Figure 3.4 and Box 3.5)—fall through the educational net.
While the world as a whole has progressed towards gender parity in primary enrolment, girls still account for 53% of out-of-school children of primary school age. The vast majority of girls do now complete primary school worldwide. Yet if they are out of school, girls of primary age are more likely to never enter school at all compared to out-of-school boys, who are more likely to have some exposure to schooling (UIS and EFA GMR, 2014a). Girls’ enrolment rates tend to fall when they reach lower secondary school age, which coincides with puberty, and tumble even further when they reach upper secondary school age.
According to the 2014 EFA Global Monitoring
Report, many countries had not achieved gender parity by 2011, six years after the 2005 deadline. The proportion of 161 countries with gender parity at the primary level of education rose only marginally between 1999 and 2011: from 57% to 63%. It is projected that 70% of countries will have reached the goal by 2015—a decade late—and that another 9% of countries will be getting close. However, 15% of countries will still be far from the target, and 7% will be very far from it—three-quarters of them in sub-Saharan Africa (UNESCO, 2014b).
Globally, girls still account for 53% of out-of-school children of
primary school age
70% of countries are expected to reach the goal of gender parity in
primary education by 2015, 15% will be far from that target, and 7% very
far from it—three-quarters of them in sub-Saharan Africa

57Findings from the Global Initiative on Out-of-School Children
Sub-Saharan Africa is now home to more than one-half of all out-of-school girls of primary school age (UIS and EFA GMR, 2014a) and has the lowest regional proportion of countries—just 13 out of 49—which have reached gender parity to date. As shown in Chapter 2, West and Central Africa has the world’s largest gender gap for both primary and lower secondary school age groups.
Some girls remain far more likely to be out of school than others, with the poorest girls in rural areas particularly disadvantaged and women from poor households, in general, far less educated than any other group. In Nigeria, wealthy urban women have attained, on average, around ten years of education, in stark contrast to the poorest women from the Hausa ethnic group in rural areas, who had just a few months of schooling on average (UNESCO,
50
60
80
70
90
100
%
Low
er s
econ
dar
y sc
hool
-age
ad
oles
cent
s in
sch
ool
BANGLADESH, 2011
Rural
Average
Poorest
Richest
Rural
Urban
Urban
Poorest urban boys
Poorest urban girls
Poorest rural boys
Poorest rural girls
50
60
80
70
90
100
%
Figure 3.4 Percentage of primary and lower secondary school-age children in school, by household wealth quintile, location and sex
Prim
ary
scho
ol-a
ge c
hild
ren
in s
choo
l
IRAQ, 2011
Rural Average
Poorest
Richest
Rural
Urban
Urban Poorest urban boys
Richest urban boys Richest rural boys
Poorest urban girls
Richest urban girls
Richest urban boys Richest urban girls
Richest rural girls
Richest rural boys Richest rural girls
Poorest rural boys
Poorest rural girls
Source: UIS calculations based on the Iraq Multiple Indicator Cluster Survey (MICS) 2011 and the Bangladesh Demographic and Health
Survey (DHS) 2011 DataLink: http://dx.doi.org/10.15220/2014/ed/sd/7/f3.4
58 Fixing the Broken Promise of Education for All
2010b). The situation for Hausa girls also reflects the way in which poverty and gender intersect with social and cultural practices, such as purdah, and attitudes to education (UNICEF, 2011a).
Such gender gaps matter, with girls’ education both an intrinsic right and a pathway to wider economic and social objectives. It helps to break cycles of poverty and poor health, with adolescent girls in school less likely to marry early and against their will; less likely to die in childbirth; less vulnerable to diseases, including HIV and AIDS; more likely to have healthy babies; more likely to send their own children to school; and more likely to acquire the information and skills that lead to increased earnings (UNESCO, 2003) (see Box 3.3). Around one-half of the reductions in maternal and infant mortality over the past four decades have been attributed to the expansion of girls’ education, especially when they finish primary school and complete at least lower secondary school (Gakidou et al., 2010).
A number of countries—including some of the poorest—have taken a lead on closing the gender gap in primary education, offering lessons for countries that still have a long journey ahead of them. As shown in Chapter 2, the greatest improvements have been seen in South Asia, where girls of primary school age were twice as likely to be out of school as boys in 2000—a gap that had been closed by 2012. Some countries in sub-Saharan Africa have also made impressive progress from a low starting point. Ethiopia, in particular, has emerged as a global leader, increasing the number of children enrolled in primary education five-fold between 1994 and 2012 and introducing a special policy focus on girls’ education (Nega, 2012).
The barriers
Many barriers to gender parity in education—and to girls’ education in particular—remain firmly entrenched. They range from broad institutional constraints, such as inadequate legislation and policies on sexual violence, female genital mutilation/cutting (FGM/C) or child marriage, to the deliberate targeting of girls’ education seen, for example, in Afghanistan, Nigeria and Pakistan that can result in their physical harm, as well as their removal from school.
Boys have higher repetition rates than girls in primary and lower secondary education in nearly every country in
Latin America and the Caribbean
Box 3.3 The economic argument
The moral case for girls’ education is overwhelming: it is a human right that helps to forge more equitable societies. But there is also a compelling economic argument to be made.
■ Countries with greater gender parity in primary and secondary education are more likely to have higher economic growth. Based on World Bank research and data and UIS education statistics, Plan (2008) estimated that the economic cost to 65 developing countries of failing to educate girls to the same standard as boys was a staggering US$92 billion each year, just less than the US$103 billion annual aid budget of the OECD countries in 2007.
■ Girls who have even one year of education above the national average earn 10% to 20% more than the average national income in later life (Psacharopoulos and Patrinos, 2002). Returns to female secondary education range from 15% to 25% (Schultz, 2002).
■ More productive farming as a result of increased female education is thought to have accounted for 43% of the decline in malnutrition between 1970 and 1995, according to a 63-country study (Smith and Haddad, 2000). Better nutrition, in turn, boosts returns to educational investments, with children better able to concentrate in class.

59Findings from the Global Initiative on Out-of-School Children
Within schools, the way in which girls experience their education and the cumulative nature of the disadvantages they face leave them vulnerable to the risk of drop-out. All too often, curriculum materials, teaching and learning processes, assessment systems and teachers’ expectations of their students are highly gendered and, when combined with a lack of female teachers, present major barriers to girls’ completion of their education and learning.
Such barriers can become insurmountable when compounded by conflict and natural disasters, migration and displacement, HIV and AIDS, disability, ethnicity, religion and caste.
Supply barriers
The lack of a nearby school is a problem for any child—boy or girl—undermining punctuality, attendance and learning, all precursors of school drop-out. Girls, however, face particular risks linked to distance and the time it takes to go to and from school, including the danger of being assaulted. Fears of such assaults may explain why girls in rural areas are more likely than boys to attend school at a later age, when they are better able to make their own way to school. Distance to school is an issue that also affects boys and that cuts across nations, from Bolivia to India and from Tajikistan to Togo.
Even where there is ready access to a local school, the lack of a safe and supportive school environment is another major barrier to girls’ education. While schools are usually considered ‘safe havens’, many girls experience intimidation and abuse from teachers and other pupils and sexual harassment is a major cause of female drop-out (Stromquist, 2014). An estimated 500 million to 1.5 billion children are thought to experience violence every year, many of them within schools, and millions more live in fear of physical abuse under the guise of discipline: more than 80% of students in some countries suffer corporal punishment at school (Greene et al., 2013). According to the Global Initiative on Out-of-School Children study in Tajikistan (UNICEF and UIS, 2013e), 15% of girls out of school reported
that parents or other relatives had prevented them from going to school because of concerns for their safety.
In some school environments, girls face considerable peer pressure to experiment sexually, usually with very little understanding of the consequences (Stromquist, 2014). For example, high drop-out levels have been detected among girls in the Bolivian Amazon region, where 27% of adolescents leave school as a result of pregnancy (UNICEF and UIS, 2011).
The lack of private and separate latrines and washing facilities in under-resourced schools presents an often unacceptable risk to a girl’s modesty, dignity and basic human rights. The absence of such basic facilities is a particular issue for girls who are menstruating and has been cited in studies across Africa and Asia, in particular, as a factor in girls abandoning their education (Adukia, 2014; Herz and Sperling, 2004; Mooijman et al., 2005; Sommer, 2010).
The presence of female teachers helps to attract girls to school and improve their learning outcomes in some contexts, and female teachers can be valuable role models for young girls, helping to ensure that girls are not merely present in the classroom but are also active participants in lessons. But there is a chronic shortage of female teachers in some regions, especially in secondary education. In sub-Saharan African countries with available data, female teachers account for less than 40% of teachers in 43% of countries at the primary level, in 72% of countries at the lower secondary level and in all countries at the upper secondary level (UNESCO, 2014b).
Another supply barrier is the lack of flexible education opportunities for girls who have dropped out of school and who now want to return, particular girls who are pregnant or young mothers. According to
By one UNICEF estimate, only 49 of 155 countries have dedicated policies to allow pregnant girls and young mothers to continue their education

60 Fixing the Broken Promise of Education for All
UNICEF Country Office Annual Reports, only 49 out of 155 countries appeared to have policies in place to allow pregnant girls and young mothers to continue their education in 2013 (UNICEF, 2014d). Even where such policies are in place, they may have little impact on the ground if school principals, teachers and fellow pupils reject girls who have given birth. It is unlikely that legislation alone can entice girls back into the classroom or keep them there, given the continuing stigma around pregnancies or births outside marriage, and the social assumption that education is over once a girl marries and gives birth. What is clear is that girls of school age who become pregnant tend to abandon schooling (Chae, 2013), as seen in Brazil, where over 70% of girls aged 10 to 17 years who have children are not in the classroom (UNICEF and UIS, 2012a).
Few of the most marginalised and excluded children have access to NFE opportunities that might provide a route back into schooling or, at the very least, provide them with the basic skills they need.
Demand barriers
The barriers to demand for girls’ education include problems related to cultural norms around gender—including FGM/C and child marriage, as well as poverty, ethnicity, child labour and orphanhood—and these problems often work in combination to keep girls out of school. They are only reinforced by failures to enforce not only compulsory education laws, but also laws of crucial relevance to girls, such as legislation on the minimum age for marriage and the prohibition of FGM/C.
In patrilineal societies, where it is sons who inherit from their fathers, girls may be seen as ‘temporary’ family members who will soon be given away by marriage to join another household (UNICEF and UIS, 2012b).
FGM/C and child marriage—marriage before the age of 18—are thought to account, in part, for the low educational attainment of girls in African and Asian countries and high levels of illiteracy among women in these regions. The precise links between child marriage and low educational achievement are not yet clear (see Box 3.4), but the decisions not to send a girl to school and to marry her off early are often made at the same time. In some African populations, FGM/C is the first signal that a girl is marriageable and disrupts the attendance of girls who are in school, and the prolonged absence it causes often leads to drop-out. For girls who have never enrolled in school at all, child marriage may be seen as the only possible and appropriate option. Whether girls are withdrawn from school or have never attended, child marriage marks the beginning of subordination to their husbands and the dangers of early pregnancy, as well as the end of education (Equality Now, 2014).
“I finished seventh grade and left school because
of marriage. I didn’t want to get married, but my
father forced me to. He told me that education
won’t do anything for me... I had no choice.”
Sultana, married at age 16 in Yemen
(Brown, 2012)
UNICEF data show that women are two and a half times more likely to be married as children if they are poor than if they come from richer households: around four in every ten women aged 20 to 49 years in the poorest 20% of households were married as children, compared to only 16% of girls in the richest 20% of households. Child marriage is also more prevalent in rural areas. Regionally, 56% of women aged 20 to 49 years in South Asia, 46% in West and Central Africa, and 38% in Eastern and Southern Africa were married before the age of 18, often to much older men. At the country level, India is home to one-third of all child brides globally (UNICEF global databases, 2014).
Some parents see child marriage as a way to protect their daughters and the family from the shame of premarital sex and pregnancy outside marriage, and encourage their daughters to marry as soon as they reach puberty, as is the case in Nigeria’s
Each year of marriage before the age of 18 in Africa reduces the probability of secondary school
completion by 6.5 points

61Findings from the Global Initiative on Out-of-School Children
northern areas (UNICEF and UIS, 2012f). A related practice, called ‘child betrothal,’ commonplace in South Asia, sees a girl staying with her own family until a certain age, at which point she goes to her groom’s home (Edmeades and Hayes, 2014). This practice creates uncertainties around girls’ education and often interrupts their schooling at upper primary or lower secondary school levels. An extreme but rare practice is marriage by abduction, which has been seen as a legitimate way to procure a bride, particularly in parts of the Horn of Africa (IRIN, 2007).
Other cultural norms affect the demand for girls’ education in less perceptible ways. Even in schools with functioning and separate toilets, for example, demand for girls’ education can fluctuate in communities with strict cultural norms around menstruation. In many communities in India, menstruation is seen as ‘unclean’ and girls may be kept at home during their periods (Thakre et al., 2011). The resulting monthly absences see girls falling behind in their studies and may well lead to drop-out.
Cultural expectations can also combine with poverty to fuel the child labour that keeps girls out of school. Most children out of school worldwide live in the poorest households, but poverty may merge with strict cultural norms to deny girls, in particular, an education. Girls are expected to fetch and carry fuel and water in households that lack electricity
and a clean water supply, for example. The Global Initiative on Out-of-School Children study in Ghana found that such strenuous work cuts into their time for school and homework and affects their ability to concentrate, resulting in underachievement and eventual drop-out (UNICEF and UIS, 2012d). This only seems to confirm parental beliefs that there are few economic benefits to be gained by educating girls.
Poor, rural parents often send their children (particularly girls) to urban families in the hope that they will be enrolled in school in exchange for some domestic chores (Gustafsson-Wright and Pyne, 2002)—a common practice in several African countries (through the fosterage or confiage system) as noted in the Global Initiative on Out-of-School Children studies in Ghana, the Democratic Republic of the Congo, Haiti and some other countries. In reality, it often results in heavy domestic child labour, leading to school absenteeism and drop-out. In Haiti, one in every ten children is subject to this practice called restavek, three-quarters of them girls (Smith, 2014).
Box 3.4 Measuring the impact of child marriage on education
Approximately one in three young women aged 20 to 24 years in 2012 were married before the age of 18 in developing countries, and one in nine were married before their fifteenth birthday (UNICEF, 2014b). Child marriage often means the end of education, but it is not clear precisely how parental views on the value of education for girls link to child marriage, with decisions on both issues often tied together. This makes it difficult to assess the precise linkages between child marriage and educational attainment, but it seems clear that education itself acts as a safeguard against child marriage. One study found that secondary education for girls was a crucial factor in increasing the age of marriage of girls in India, Indonesia, Pakistan, Sri Lanka, Taiwan of China and Thailand (Mathur et al., 2003).
One approach to analysing the links between education and child marriage is to analyse the decision to marry. Field and Ambrus (2008) used the timing of puberty as the instrumental variable for the age at first marriage in Bangladesh, finding that each additional year of delay in the age of marriage increased schooling by 0.22 year and the likelihood of literacy by 5.6 percentage points. Nguyen and Wodon (2014b) generated markedly similar results by examining current and past incidence of child marriage, finding that each year of marriage before the age of 18 in Africa reduces the probability of secondary school completion by 6.5 points.
In sub-Saharan Africa, the poorest boys are expected to achieve universal primary completion by 2069. The poorest girls will not reach this target until 2086

62 Fixing the Broken Promise of Education for All
In Senegal, thousands of young boys are sent to urban areas to receive education from a ‘Marabout’, a religious teacher, but instead of going to school they are sent to beg for money on the street.
In many countries, poverty combines with geography and ethnicity to keep girls out of school, and schooling disparities between girls and boys from socially excluded groups are much larger than in the wider population. Because remote rural populations tend to be scattered and may not have a government school nearby, their children—particularly girls—tend to enter the school system about two years late and seldom make up enough lost ground to move beyond primary education. Rural areas in Bolivia, Guatemala and Peru all have lower enrolment and attendance for girls than boys in secondary school, reflecting the scarcity of local schools, the heavy toll of domestic work on rural girls, and the discrimination they face within several ethnic groups (Glick, 2008).
In India, education gender gaps are more severe among scheduled castes and tribes (UNICEF and UIS, 2014d). Poverty in sub-Saharan Africa threatens the region’s chances of achieving universal primary school completion for decades to come, but even the poorest boys are expected to achieve universal primary completion by 2069—a goal that will not be reached by the poorest girls until 2086 (UNESCO, 2014).
Girls who have lost one or both parents and who live in poverty are particularly vulnerable to educational exclusion. Girls orphaned as a result of AIDS, for example, often drop out of school to care for younger siblings and may be urged to marry early for their own security (UNICEF and UIS, 2012b). Although more children have lost their fathers than mothers to AIDS in Zimbabwe, it is maternal death that seems to have the greatest impact on their chances of completing primary school (Nyamukapa and Gregson, 2005). Findings from a review of 244 studies in developing countries also indicate that orphanhood is a risk factor for early sexual practices (Mmari and Sabherwal, 2014). Orphaned girls are particularly vulnerable to sexual abuse and to being forced into prostitution, which limits any chance of an education.
Breaking the barriers
The ambition must be to ensure that even the most vulnerable and disadvantaged girl has access to a school within a reasonable distance from her home—a school that meets her most basic needs for safety, privacy and cleanliness, that delivers the best possible education and that places a high value on both her presence and her potential. The barriers to girls’ education can be overcome if the environment around them—their homes and communities—
Box 3.5 Out-of-school boys and boys who fall behind
Cultural norms and gender roles can work against demand for education for boys as well as girls. Entrenched concepts of masculinity can result in more boys being out of school, particularly at the secondary level, in certain commercial, agricultural and pastoralist contexts where their labour is seen as vital for family livelihoods (Gustafsson-Wright and Pyne, 2002; also Global Initiative on Out-of-School Children studies for Bolivia, 2011; Nigeria, 2012f; Pakistan, 2013b).
In Latin America and the Caribbean, in particular, boys are falling behind on key education indicators, particularly at the secondary level. In 2011, there were 106 girls for every 100 boys enrolled in secondary school across the region. Of the 30 countries in Latin America and the Caribbean with available data, 21 reported a gender gap in secondary enrolment that left boys lagging behind (UIS Data Centre, 2014). Boys in school are also more likely than girls to repeat school years—a well-known trigger for school drop-out. An analysis of repetition rates in primary and lower secondary education showed that rates are higher for boys than girls at both levels, in every country in the region, with the exception of Saint Kitts and Nevis (UIS, 2012b).
Boys also account for the vast majority of children living and working on the world’s streets—many of whom are out of school. Analysis of children on the streets in 75 Brazilian cities indicates that nearly three-quarters (around 72%) are boys (Consortium for Street Children, 2012).

63Findings from the Global Initiative on Out-of-School Children
supports their schooling, and if schools themselves are accessible, safe and inclusive. It will take time to root out the discrimination that keeps so many girls out of the classroom, but much can be done to ensure that schools welcome, nurture and protect all their pupils, girls as well as boys.
First, every girl needs access to a nearby school. In Afghanistan, for example, the distance to school may well determine whether a girl attends or not, given safety concerns and traditional seclusion practices. The introduction of village-based schools in Ghor Province in the north of the country, with support from Catholic Relief Services, has resulted in increased enrolment and better test scores for all students, but girls have benefited disproportionately and the gender gap in enrolment was eliminated completely within the first year of this initiative (Burde and Linden, 2010).
Girls need ‘girl-friendly’ schools. In Burkina Faso, well-resourced and gender-friendly schools (BRIGHT schools) built in poor and previously under-served rural areas have boosted the enrolment of all children aged 5 to 12 years by 20%, with girls—once again—benefiting disproportionately. These schools are characterised by a mix of interventions spanning separate latrines for boys and girls, canteens and take-home rations, textbooks and attempts to change institutional cultures through advocacy and mobilisation, literacy training and capacity building among local partners (Kazianga et al., 2012).
This links to the need for schools that have zero tolerance for violence of any kind, from corporal punishment to playground bullying. While the strong enforcement of legislation to outlaw corporal punishment is vital, ending violence in schools also requires the implementation of teachers’ codes of practice, measures to monitor and address cases of violence, and independent and confidential mechanisms that children can trust, such as hotlines, when reporting abuse.
There is a pressing need for more female teachers in some contexts. Provision of scholarships to women who want to become
teachers could help to close the gender gap, as would more flexible entry qualifications. For example, the Girls’ Education Project in Nigeria, funded by the UK Department for International Development (DFID) in partnership with UNICEF, aims to get 1 million more girls into school by 2020. The project calls for the deployment of 10,500 female teachers to rural areas where the predominance of male teachers deters parents from sending their girls to school. In return for a scholarship grant of around £200, newly-qualified female teachers commit to teach in rural schools for two years. In South Sudan, where women make up about 65% of the post-war population, yet less than 10% of all teachers, financial and material incentives have been given to over 4,500 girls to complete secondary school and to women trainees to enter the teaching profession (UNESCO, 2014b).
Child-friendly and gender-sensitive teaching approaches should be required elements in teacher certification, as introduced by the Ministry of Education of Tajikistan in 2013 (UNICEF, 2013e). Tajikistan’s creation of a Center for Gender Pedagogies within the Ministry of Education is a promising innovation that involves systematic gender audits of the curriculum, textbooks and teacher training programmes. In Ghana, in-service training for teachers in gender and child-friendly teaching approaches was found to be effective in improving girls’ enrolment and retention in schools in the most deprived areas (UNICEF and UIS, 2012d).
Effective educational support is needed for pregnant girls and young mothers, including childcare and counselling. However, this support has to move beyond education policies that—on paper at least—allow pregnant girls or young mothers to continue their studies. Multisectoral approaches, spanning sexual and reproductive health, child
An initiative to establish village-based schools in the north of Afghanistan closed the gender gap within its first year

64 Fixing the Broken Promise of Education for All
protection and financial support are all needed alongside education policies on this issue.
The provision of sex education courses at primary and secondary school levels, including reproductive health and rights, must be intensified, given the links between early pregnancy and school drop-out. Studies across a wide range of cultures indicate that parental fears that such courses promote premature sexual activity are unfounded (UNICEF, 1999), and greater efforts are needed to link sexuality education to reproductive health services and contraceptive provision in countries with high rates of adolescent pregnancy.
Non-formal education gives out-of-school girls a chance to learn vital skills and, in some cases, to enter or re-enter the formal education system. In Gambia, the Re-Entry Programme for Girls, initiated by the Ministry of Basic and Secondary Education, reaches girls who have dropped out, providing extensive guidance and counselling services for each participant. In India, the ‘Pehchan’ project by the Centre for Unfolding Learning Potentials (CULP) in collaboration with the Government and UNICEF offers two- to three-year courses at the primary level to rural adolescent girls who are out of school as a prelude to their reintegration into the formal school system, while the Hope for Teenage Mothers organization in Kenya gives teenage mothers access to economic and educational opportunities through formal education, vocational training and skills building (Yasunaga, 2014).
Alliances between governments and civil society organizations can strengthen national efforts to alter cultural norms around gender. Such alliances can bolster attempts to enforce compulsory education laws and laws on the legal minimum age for marriage
and can support advocacy and awareness-raising programmes for parents, youth and communities to modify deeply-rooted cultural beliefs about femininity and masculinity and make the case for girls’ education. A good example of the impact of such alliances can be seen in Turkey, where the four-year “Hey Girls, Let’s Go to School” campaign, characterised by partnerships between public institutions, civil society organizations and volunteers, resulted in the enrolment of an estimated 350,000 additional children in school (UNICEF and UIS, 2012h).
Few parents are averse to investing in the education of their daughters once they have good information on its benefits. A study in India, for example, found that providing villagers with precise information about the availability of jobs for girls with secondary education and how to get such jobs resulted in teenage girls staying longer in school, being more likely to look for paid work and delaying marriage. Primary school-age girls in villages receiving such information were 5 percentage points more likely to be in school than girls in control villages (Jensen, 2010).
Altering the political economy of the household in countries with high levels of poverty could ensure that parents do not have to rely on girls’ domestic labour or boys’ labour outside the home. One approach that is having an impact is cash transfers granted to households on condition that children attend school. In Bangladesh, for example, the Female Secondary School Stipend Program has supported impressive progress on girls’ school enrolment—which now exceeds that of boys at both primary and lower secondary levels—and on delaying marriage. Analysis of an intervention in Malawi providing cash transfers tied to school attendance for adolescent unmarried girls and their families found that such conditional cash transfers are more effective in boosting girls’ enrolment than cash transfers with no conditions attached (Baird et al., 2011).
Filling the data gap
Countries have made great strides in recent years in disaggregating data by gender. As a result, we have a fairly clear idea of the continued gender gap among
Research from India confirms that good information for parents on
the long-term benefits of girls’ education helps to keep girls in
school and delays their marriages

65Findings from the Global Initiative on Out-of-School Children
out-of-school children and, as confirmed by the data from countries participating in the Global Initiative on Out-of-School Children, we have evidence on the likelihood of girls entering school later, dropping out before they complete basic education, or never attending at all. However, while such data tell us what is happening, they do not necessarily tell us why. As this section has highlighted, we do not yet fully understand the interplay between decisions around child marriage, the withdrawal of girls from school and perceptions of the value of girls’ education. There is now a clear need for data—both quantitative and qualitative—that drill down to look more closely at the precise impact of gender norms on the likelihood of being out of school.
3.5 CHILD LABOURERS AND SCHOOL PARTICIPATION18
“My name is Ruslan and I am 14 years old. I do
not go to school, since I work in Osh Bazaar. I
come here before 8 o’clock in the morning and
leave for home at 8 o’clock in the evening… I
have no other options because my family has
nobody else to feed us. I would like to attend
school, but I don’t want to study with children
much younger than me.”
Boy from Kyrgyzstan
(UNICEF and UIS, 2012e)
UNICEF estimates that 15% of children aged 5 to 14 years (or approximately 150 million children in all) are engaged in some form of child labour (UNICEF, 2014b) (see Box 3.6). Almost one-third of child labourers are thought to be engaged in hazardous work that threatens their health, safety or emotional well-being (ILO/IPEC, 2013).19
While most child labourers are in school, their labour may act as a ‘push’ factor in decisions to leave school prematurely, putting pressure on their
18 This section draws on “Child Labour and Out-of-School Children: Evidence from 25 Developing Countries”, a background paper and study prepared for this report by Furio Rosati and Lorenzo Guarcello, Understanding Children’s Work, Italy.
19 There are also an estimated 48 million children aged 15 to 17 years engaged in child labour, which poses a threat to their continued education (ILO-IPEC, 2013).
attendance and on their energy and concentration in class, hampering their learning and their ability to keep up. Those who fall further and further behind are at even greater risk of dropping out of school altogether. Child labour is also linked to school absenteeism and tardiness, only adding to the risk of school drop-out.
Regionally, sub-Saharan Africa has the highest prevalence rate for child labour at 27%, followed by South Asia at 12%, but South Asia accounts for the highest absolute numbers of child labourers—an estimated 77 million (UNICEF, 2014b).
Most out-of-school children are engaged in some form of work. Equally, children who work are more likely to drop out of school (Rosati and Guarcello, 2014). Understanding the interplay between these two trends is, therefore, critical to achieving two key goals for children: education for all and the elimination of child labour. All the evidence suggests that child labour and school participation are incompatible, and that the more onerous the labour, the greater the impact on schooling.
This conclusion has been reinforced by analysis carried out for this report by Understanding Children’s Work (UCW), which examined the way in which child labourers intersect with out-of-school children in the countries that participated in the Global Initiative on Out-of-School Children.20 The study focused on child labourers aged 7 to 14 years and their likelihood of never enrolling in school or dropping out.
Drawn from the UCW analysis, Figure 3.5 highlights child labour as a policy concern in almost all countries analysed. The sub-Saharan African countries stand out as having especially high child labour rates, with around 45% of children aged 7 to 14 years in Ethiopia, 37% in Ghana and more than 30% in Zambia involved in child labour. While the
20 South Asia: Bangladesh, India, Pakistan, Sri Lanka; East Asia and the Pacific: Cambodia, Indonesia, Philippines, Timor-Leste; Latin America and the Caribbean: Bolivia, Brazil, Colombia, Mexico; Central and Eastern Europe and Commonwealth of Independent States: Kyrgyzstan, Romania, Tajikistan, Turkey; sub-Saharan Africa: Democratic Republic of the Congo, Ethiopia, Ghana, Liberia, Mozambique, Nigeria, Sudan, Zambia.

66 Fixing the Broken Promise of Education for All
rates are generally lower in the sample countries from other regions, there are some important exceptions. Bolivia, Kyrgyzstan and Timor-Leste all have far higher child labour rates than the other countries analysed in their respective regions. The findings confirm that child labourers are at far greater risk of being out of school than children who are not working.
The more hours children work, the greater the likelihood that they will miss out on an education. The UCW analysis also confirms that out-of-school child labourers aged 7 to 14 years work for many more hours than child labourers who attend school. The most marked difference in working hours is seen in Turkey, where out-of-school child labourers work for an average of 45 hours each week, compared with an average of 15 hours for their peers who are in school. This suggests that the time intensity of child labour, as well as the type of work, matters for school attendance.
What type of work do child labourers do? While household chores may take up a child’s time,
such as caring for siblings, cooking or cleaning, these contribute to the everyday consumption of a household and are not seen as economic activities that contribute to household or national income.21 Current definitions stipulate a 28-hour per week threshold beyond which household chores are considered child labour. By this definition, household chores form a much smaller component of child labour than economic activities. In every country studied, with the exception of Tajikistan, it is the economic activities around family work—such as working in a store or harvesting crops—that constitute the largest component of the child labour performed by out-of-school children. Family work—paid or unpaid—accounts for at least 40% of all out-of-school child labourers in the eight sample countries where this information is available (Democratic Republic of the Congo, Ghana, India, Liberia, Nigeria and Tajikistan) and rises to over 80% in Ethiopia and Mozambique.
Boys had a higher child labour rate than girls in Bangladesh, Ethiopia, Pakistan, Philippines and Sudan. In contrast, girls were more likely to be caught up in child labour in the Democratic Republic of the Congo, Mozambique and Tajikistan (Rosati and Guarcello, 2014). It is worth noting, however, that household chores are overwhelmingly the
21 As defined in the System of National Accounts.
Child labourers are at greater risk of being out of school than children
who are not working
Box 3.6 Defining child labour
The child labour indicator used in this report is adapted from UNICEF’s standard definition and refers to the percentage of children aged 7 to 14 years who were involved in child labour according to the following thresholds:
■ children aged 7 to 11 years who performed at least one hour of economic activity in the week before the survey;
■ children aged 12 to 14 years who performed at least 14 hours of economic activity in the week before the survey; and
■ children aged 7 to 14 years who performed at least 28 hours of household chores in the week before the survey.
This indicator draws on three international conventions on child labour: ILO Convention No. 138, the United Nations Convention on the Rights of the Child, and ILO Convention No. 182, as well as the resolution on child labour statistics adopted at the 18th International Conference of Labour Statisticians (ICLS) in 2008 (ILO, 2009).

67Findings from the Global Initiative on Out-of-School Children
Notes: * Denotes child labour statistics which vary from the international de�nition of child labour due to limitations of the household survey or census used. Data for Pakistan, Sudan and Timor-Leste cover children aged 10-14 years, for Turkey they cover 6-14 years. Data for Cambodia, Pakistan, Philippines, Romania and Zambia do not include information about hours spent in household chores: the de�nition of child labour in these countries is based on hours in employment only. Data for Sudan do not include information about hours spent in employment and household chores, the de�nition of child labour is based on involvement in employment only. Data for Brazil use the international de�nition, although Brazilian national legislation does not allow light work for children aged 12-14 years.
0 10 20 30 40 50 %
0 10 20 30 40 50 60 80 9070 %
Figure 3.5 Children involved in child labour and its impact on school attendance
Percentage of children involved in child labour, 7-14 years, by country
Percentage of children who are out of school, 7-14 years, by child labour status and country
3019
2727
2437
4518
3 12
1 30
6 6 5
2918
75
1010
1314
10
ZAMBIA*
SUDAN*
NIGERIA
MOZAMBIQUE
LIBERIA
GHANA
ETHIOPIA
CONGO, DR
TURKEY*
TAJIKISTAN
ROMANIA*
KYRGYZSTAN
MEXICO
COLOMBIA
BRAZIL*
BOLIVIA
TIMOR-LESTE*
PHILIPPINES*
INDONESIA
CAMBODIA*
SRI LANKA
PAKISTAN*
INDIA
BANGLADESH S
UB
-SA
HA
RA
N A
FR
ICA
CE
E/C
ISLA
TIN
A
ME
RIC
A
AN
D T
HE
C
AR
IBB
EA
N
EA
ST
AS
IA
AN
D T
HE
P
AC
IFIC
SO
UT
HA
SIA
SU
B-S
AH
AR
AN
AF
RIC
AC
EE
/CIS
LAT
IN
AM
ER
ICA
A
ND
TH
E
CA
RIB
BE
AN
EA
ST
AS
IA
AN
D T
HE
P
AC
IFIC
SO
UT
HA
SIA
ZAMBIA*
SUDAN*
NIGERIA
MOZAMBIQUE
LIBERIA
GHANA
ETHIOPIA
CONGO, DR
TURKEY*
TAJIKISTAN
ROMANIA*
KYRGYZSTAN
MEXICO
COLOMBIA
BRAZIL*
BOLIVIA
TIMOR-LESTE*
PHILIPPINES*
INDONESIA
CAMBODIA*
SRI LANKA
PAKISTAN*
INDIA
BANGLADESH
Children not in child labourChild labourers
2075
2518
5529
3722
569
271
2123
46
3719
1423
1088
4048
Sources: Understanding Children’s Work calculations based on Bangladesh Labour Force Survey, 2005-2006; Bolivia Encuesta de Trabajo Infantil (SIMPOC), 2008; Brazil Pesquisa Nacional por Amostra de Domicílios, 2011; Cambodia Labour Force and Child Labour Survey (SIMPOC), 2012; Colombia GEIH: Módulo de Trabajo Infantil, 2012; DR Congo MICS, 2010; Ethiopia DHS, 2011; Ghana MICS, 2006; India DHS, 2005-2006; Indonesia Child Labour Survey (SIMPOC), 2009; Kyrgyzstan Child Labour Survey, 2007; Liberia DHS, 2007; Mexico Encuesta Nacional de Ocupación y Empleo: Módulo de Trabajo Infantil, 2011; Mozambique MICS, 2008; Nigeria MICS, 2011; Pakistan Labour Force Survey 2007-2008; Philippines Labour Force Survey (SIMPOC), 2001; Romania Child Labour Curve (SIMPOC), 2000; Sri Lanka Child Activity Survey (SIMPOC), 1999; Sudan Fifth Population and Housing Census, 2008; Tajikistan MICS, 2005; Timor-Leste Survey of Living Standards, 2007; Turkey Child Labor Survey (SIMPOC), 2006; Zambia Labour Force Survey, 2008 DataLink: http://dx.doi.org/10.15220/2014/ed/sd/7/f3.5

68 Fixing the Broken Promise of Education for All
responsibility of girls. The 28-hour threshold has important implications for estimates of girls’ child labour relative to that of boys. A lower threshold would mean higher child labour rates, especially for girls.
The barriers
As shown in relation to other barriers to the universal inclusion of children in education, poverty lies at the very heart of the child labour barrier, with poor households less able to afford the direct and indirect costs of education and more likely to need any additional income that can be earned by their children. As a result, children from such households are more likely to be involved in child labour. Across all countries with available data, the wealthier the household, the lower the rates of child labour (UNICEF global databases, 2014).
This is no surprise, as better-off households do not need their children’s productivity or wages to make ends meet and the opportunity cost of schooling is, therefore, lower. But the UCW analysis also found that household poverty does more than increase the likelihood of child labour: it also increases the impact of that labour on education. Across most of the countries surveyed, child labourers from the very poorest households are far more likely to be out of school than child labourers from better-off households.
Seven-year-old Saritha, a girl from Colombo,
begs with her mother near the Dehiwala mosque.
This helps them to earn money. However, it is an
offence to go begging with children and, if the
police catch them, they are taken to court. Some
days, they have no food in the mornings, but
there is always something for lunch and dinner.
Her parents never went to school. The family lives
in a small wooden hut built on unauthorised land
near the Keththaramaya. The house does not
have basic amenities other than a water tap.
OOSCI Country Study on Sri Lanka
(UNICEF and UIS, 2013c)
Lack of education is, in itself, a red flag for child labour, with low educational levels among household
heads proving to be a risk factor for child labour in every country with available data. The lower the level of household education, the greater the likelihood that children will be out of school.
Breaking the barriers
The relevance and quality of education are not a given: getting working children into school requires more flexible and responsive education systems and improved learning environments. Above all, primary education must be free and accessible to all, including children who are, or were, working. It also requires reforms that go far beyond education itself, including broader changes in public policy that empower families to choose education over labour. This means addressing social and economic disparities through social protection, livelihoods assistance and access to social services, as well as advocacy and awareness-raising to tackle the harmful social norms that perpetuate child labour (UNICEF, 2014a).
Taken together, the evidence from the countries involved in the Global Initiative on Out-of-School Children underscores the important linkages between child labour and the risks of being out of school. These linkages reinforce the need to invest in improved schooling, to mitigate poverty and household vulnerability, and to raise household awareness of the value of education and the damage caused by child labour as part of a broader strategy to address both child labour and non-attendance at school.
There are strong links between being a child labourer and being out of school and the two challenges must be addressed together. On the one hand, child labour needs to be reduced in order to increase school attendance. On the other hand, increased school attendance is the most effective way to reduce child labour. It is essential to develop approaches that improve education access, quality and relevance, so that families not only have the opportunity to invest in their children’s education as an alternative to child labour but also find that the returns to schooling make their investment

69Findings from the Global Initiative on Out-of-School Children
worthwhile. This also links to the affordability of schooling and the need to ensure that free education really is just that: free, with no hidden costs that might act as barriers for the poorest families.
Second-chance and non-formal learning opportunities are needed to compensate for the adverse educational consequences of child labour. It is vital to reach former working children and other out-of-school children, including those who live and work on the streets, with educational opportunities that are part of a broader push for their social reintegration. Such opportunities are critical to prevent large numbers of children carrying a burden of disadvantage into adulthood, permanently harmed by their early work experiences.
In the six largest cities of Bangladesh, for example, learning centres under the Basic Education for Hard-To-Reach Urban Working Children project provide life skills-based, non-formal basic education for working children aged 10 to 14 years who have either never been to or have dropped out of school (UNICEF and UIS, 2014d). Joint programmes of the International Labour Organization (ILO) and the International Programme on Elimination of Child Labour (IPEC) on non-formal or transitional education aim to reintegrate former child workers into formal school in countries such as Brazil, India, Mongolia and Nicaragua. Through Bridge Schools or intensive transitional education programmes, former working children are supported to catch up the years of study they have ‘lost’ and reach an adequate academic level for enrolling in formal school or vocational training (ILO, 2009; Yasunaga, 2014).
Mustafa, aged 11, is just starting to learn to
read. While his peers are in 5th grade, Mustafa is
attending a 1st–3rd grade remedial programme
(Catch Up Curriculum Programme). He used to
collect paper with his brother during the days and
had school attendance problems, but now both
of them have started attending the programme
regularly.
OOSCI Country Study on Turkey
(UNICEF and UIS, 2012h)
Social protection needs to be expanded to prevent the use of child labour as a household survival strategy in hard times. Social protection should contain basic social security guarantees to ensure that anybody in need has access to essential health care and income security at a nationally-defined minimum level (at the very least) throughout their lives.
Filling the data gap
It is vital to improve the evidence base to inform policy and ensure the effective targeting of interventions. The UCW analysis has confirmed the relationship between child labour and schooling, but there are many unanswered questions beyond this general pattern. What impacts do different kinds of work and the number of working hours have on schooling? What is the impact of work on learning achievement? Why are there large variations across countries in the way in which work affects schooling?
Research has shown that both school access and the quality of education help to keep children in school and out of work by influencing key household decisions concerning their education. However, information on school quality or its proxies (such as the experience of teachers, class sizes, curricula, school management and organization, or school violence) is not always available and is generally not collected through household surveys in conjunction with child labour information. Administrative data may be of some help, but—again—are not always cross-referenced with household surveys. This lack of data severely limits the number of indicators that can actually be used to study the relationship between child labour and education.
It is time to open the ‘black box’ of child labour and look more closely at the effect of different forms of work on the chances of children enrolling in school, staying in school and maximising the benefits of their education.

70 Fixing the Broken Promise of Education for All
3.6 THE LANGUAGE BARRIER22
By the late 1990s, the Zambian National Reading
Committee could conclude: “What was for a
long time seen as a reading problem in Zambian
schools was, in fact, a language problem. Reading
was being introduced in a language which was for
most pupils a foreign and alien language.”
OOSCI Country Study on Zambia
(UNICEF and UIS, 2014g forthcoming)
An estimated 2.3 billion people, nearly 40% of the world’s population, lack access to education in their own language—a clear stumbling block to their learning that will not be removed by getting more children into the classroom (Walter and Benson, 2012). Language overlaps with ethnicity, poverty, rural life, religion and gender in ways that can exclude children from gaining access to or completing even a basic education (UNESCO, 2010b). When it comes to policies on the language to be used in education, policymakers face a mix of challenges and trade-offs: how can they ensure both universal access and successful learning outcomes in multilingual contexts, while at the same time balancing nation-building ambitions against the need for tailored education for each individual child?
22 This section draws on “School Access for Children from Non-Dominant Ethnic and Linguistic Communities”, a background paper prepared for this report by Carol Benson, Independent, United States.
The vision behind the EFA goals and the education-related Millennium Development Goals is that school participation allows people to lead happier, healthier and more productive lives. However, most education systems are designed by and for the most dominant group in society. This group could be the ethnic majority in a particular country, but is, in some cases, a dominant minority that holds the reins of economic, social and political power (Kosonen and Benson, 2013). In either case, those who are not part of this group may well be socially excluded in certain contexts.
The end result can be serious educational harm for children for whom the languages spoken at home, as well as their own cultural values and experiences, do not feature in their education. Instruction in a language learners do not yet understand inhibits their literacy and learning (see Box 3.7) and, very importantly, devalues their cultural identities. This devaluation can be implicit through, for example, the absence of images that reflect their lives or culture in school materials, or explicit, with children banned from wearing their traditional clothing or speaking the language they use at home in the classroom.
The implication is that children may not be attracted by an educational system that seems to have little place for them. Some families cope by sacrificing scarce resources so that their children can learn the language of instruction; others may reject schools as socially irrelevant or pedagogically ineffective.
The impact is clear in a number of countries participating in the Global Initiative on Out-of-School Children. Children from marginalised social groups are two to three times more likely than those from other groups to be out of school in Bolivia, Ecuador, India and Lao People’s Democratic Republic. Research indicates that girls from these socially-excluded groups face the greatest risk of education exclusion and are about two times more likely to be out of school than boys in the same countries (Lockheed and Lewis, 2012).
Barriers
The problems children face in the classroom stem from problems in the wider environment, particularly
An estimated 2.3 billion people lack access to education in their own language
Children from socially-excluded groups are significantly more likely to not
attend school in Bolivia, Ecuador, India and Lao People’s Democratic Republic
Most out-of-school girls are from socially-excluded groups, according to
one study across 16 countries
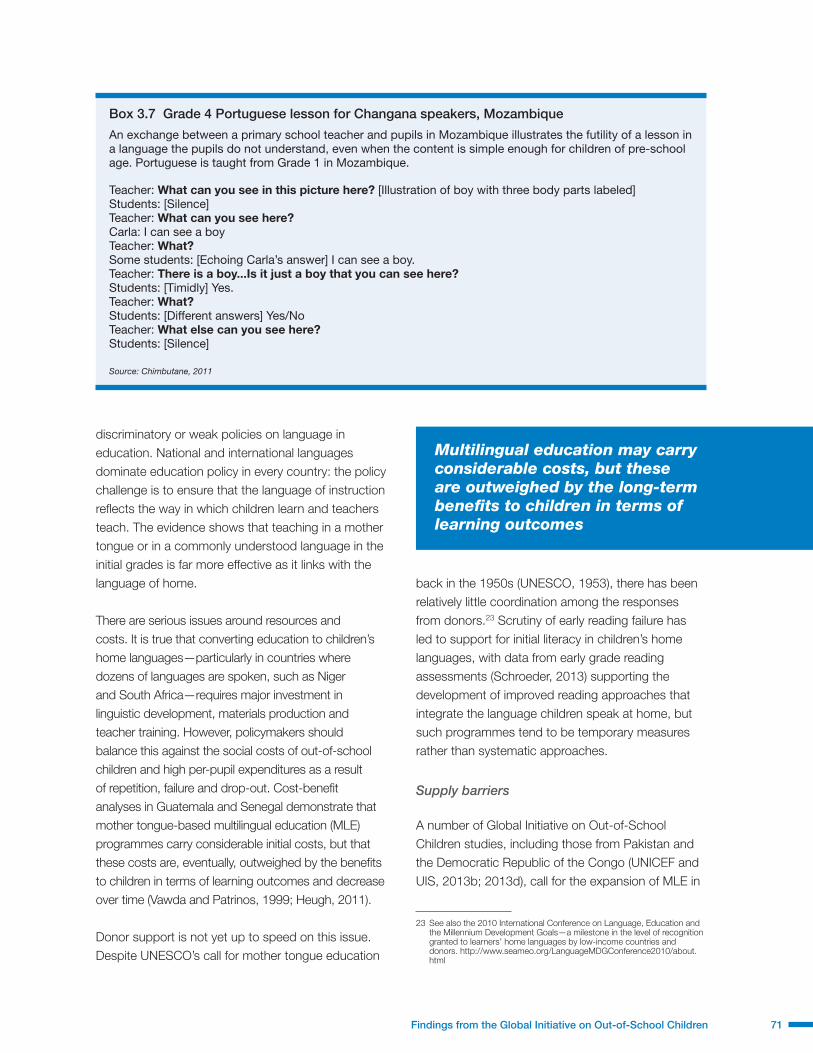
71Findings from the Global Initiative on Out-of-School Children
discriminatory or weak policies on language in education. National and international languages dominate education policy in every country: the policy challenge is to ensure that the language of instruction reflects the way in which children learn and teachers teach. The evidence shows that teaching in a mother tongue or in a commonly understood language in the initial grades is far more effective as it links with the language of home.
There are serious issues around resources and costs. It is true that converting education to children’s home languages—particularly in countries where dozens of languages are spoken, such as Niger and South Africa—requires major investment in linguistic development, materials production and teacher training. However, policymakers should balance this against the social costs of out-of-school children and high per-pupil expenditures as a result of repetition, failure and drop-out. Cost-benefit analyses in Guatemala and Senegal demonstrate that mother tongue-based multilingual education (MLE) programmes carry considerable initial costs, but that these costs are, eventually, outweighed by the benefits to children in terms of learning outcomes and decrease over time (Vawda and Patrinos, 1999; Heugh, 2011).
Donor support is not yet up to speed on this issue. Despite UNESCO’s call for mother tongue education
back in the 1950s (UNESCO, 1953), there has been relatively little coordination among the responses from donors.23 Scrutiny of early reading failure has led to support for initial literacy in children’s home languages, with data from early grade reading assessments (Schroeder, 2013) supporting the development of improved reading approaches that integrate the language children speak at home, but such programmes tend to be temporary measures rather than systematic approaches.
Supply barriers
A number of Global Initiative on Out-of-School Children studies, including those from Pakistan and the Democratic Republic of the Congo (UNICEF and UIS, 2013b; 2013d), call for the expansion of MLE in
23 See also the 2010 International Conference on Language, Education and the Millennium Development Goals—a milestone in the level of recognition granted to learners’ home languages by low-income countries and donors. http://www.seameo.org/LanguageMDGConference2010/about.html
Multilingual education may carry considerable costs, but these are outweighed by the long-term benefits to children in terms of learning outcomes
Box 3.7 Grade 4 Portuguese lesson for Changana speakers, Mozambique
An exchange between a primary school teacher and pupils in Mozambique illustrates the futility of a lesson in a language the pupils do not understand, even when the content is simple enough for children of pre-school age. Portuguese is taught from Grade 1 in Mozambique.
Teacher: What can you see in this picture here? [Illustration of boy with three body parts labeled] Students: [Silence]Teacher: What can you see here?Carla: I can see a boyTeacher: What?Some students: [Echoing Carla’s answer] I can see a boy. Teacher: There is a boy...Is it just a boy that you can see here?Students: [Timidly] Yes. Teacher: What?Students: [Different answers] Yes/No Teacher: What else can you see here?Students: [Silence]
Source: Chimbutane, 2011

72 Fixing the Broken Promise of Education for All
non-dominant languages to improve the quality and provision of basic education as a means to reduce drop-out and make education more attractive for out-of-school children. Despite the growing recognition of the importance of MLE, however, these approaches are often limited in depth and breadth. They are shallow in terms of the extent to which they build on literacy and learning foundations in children’s home languages and narrow in terms of the number of such languages used for curriculum, training and materials (Ouane and Glantz, 2011). They are also often underfunded and lack necessary capacity development to implement and maintain the MLE programme.
There has also been inadequate investment in home language and bilingual materials and teacher development, an issue raised in the Viet Nam and other Global Initiative on Out-of-School Children studies that have called for more and better-quality materials and teacher preparation (UNICEF and UIS, 2014h). Even bilingual intercultural programmes in Bolivia and Ghana are hampered by a lack of materials and training, which hurts teaching quality and learner motivation. The Bolivia Global Initiative on Out-of-School Children study, for example, found that teachers of indigenous children spoke Spanish at least 75% of the time, with a negative impact on their pupils’ comprehension and motivation (UNICEF and UIS, 2011)—a problem that can increase the risk of drop-out. In Mozambique, teachers are posted outside their language communities to encourage national unity, yet this practice limits their ability to take a bilingual approach to teaching Portuguese, a language few teachers have mastered. This may account, in large part, for the poor scores in the SACMEQ assessments (UNICEF and UIS, 2014a).
Demand barriers
There is a false perception that families fail to demand education in their home languages. The Ghana Global Initiative on Out-of-School Children study, for example, calls “lack of parental awareness of the importance of schooling” a major factor in children being out of school, but it also stresses how irrelevant and incomprehensible lessons can be for a child who is taught in a dominant language that they do not understand (UNICEF and UIS, 2012d).
There is, however, a clear need to partner with communities to address certain attitudes that can hamper education. The Nigeria Global Initiative on Out-of-School Children study, for example, discusses how non-literate parents believe school-educated girls will reject future husbands, and how Quranic teachers convince Hausa families to shun Western education (UNICEF and UIS, 2012f). This challenge could be eased if parents were involved in developing curricular approaches and were part of the negotiations between traditional values and national educational aims.
There are also issues connected to gender, language and ethnicity. Most out-of-school girls worldwide are from socially-excluded groups, mainly as a result of the mismatch between their own language and culture and their experience at school, according to a study of gender-within-ethnicity disparities in school participation in 16 countries, including countries involved in the Global Initiative on Out-of-School Children: Bolivia, India, Nigeria, Pakistan and Romania (Lockheed and Lewis, 2012).
MLE programmes in Guinea-Bissau, Mozambique and Niger seem to be attractive to girls in particular, keeping them in school for longer and allowing them to do better because they trust local bilingual teachers and can use their home languages to demonstrate their capabilities (Benson, 2005).
Breaking the barriers
The first step has to be to create an environment that enables education in the languages that children use in their everyday lives. For
Ghana’s non-formal education programme School for Life features
classes in mother tongue languages for children in disadvantaged communities.
It has helped over 120,000 children to date, with 82% of them making the
transition to formal education

73Findings from the Global Initiative on Out-of-School Children
that to happen, national recognition of the value of multilingual education is a must. Multilingual education based on the languages children speak at home attracts children to school and helps to keep them there by addressing the needs of all learners, including the most marginalised. It does so by using the best languages of pupils and teachers, while helping children to learn the dominant languages needed for their future participation in society. Schools that work in languages children can understand allow pupils to participate and demonstrate what they know, and encourage the involvement of their families. It is a cultural right. Such education must be reinforced by enabling policies and adequate resourcing that permit good, quality implementation and lower per-pupil expenditure. The costs of multilingual education may be substantial, but the pay-offs include bilingual, biliterate learners who are likely to develop the critical thinking skills and self-confidence needed to live better-informed, happier, healthier and more productive lives.
Policy alone is not enough: it must be backed by resources and implementation. Because choices about the medium of instruction are central to educational access, they should be built into national strategic plans, resourced appropriately and structured for implementation at grassroots and technical levels to meet the specific needs in the local context (see Table 3.1).
Typically, programmes based on children’s home languages have higher levels of participation, success and enjoyment (as well as parental involvement) and lower levels of repetition and drop-out, particularly among girls. This reinforces the need to collect and disaggregate data on such programmes and their impact (Benson, 2014).
The ‘pull’ factors to address supply barriers include respect for cultural and religious traditions and local calendars, along with MLE programmes based on learners’ home languages and policies that enable appropriate linguistic and cultural approaches to influence the curriculum. Demand—the ‘push’ factor—can and should be created by tailoring educational services to the needs of children and
their communities, providing equitable access to national curricular goals, including the learning of dominant languages.
Decentralised processes are needed to maximise local linguistic resources and the inclusion of linguistic proficiency as part of teachers’ job portfolios. Creative, low-cost solutions are available to address such challenges as linguistically mixed classrooms or languages that do not have written standards. Strategies include organising multi-grade classrooms by language (Kosonen, 2006) and community-based language development (UNESCO, 2007).
Non-formal educational approaches have a key role to play, given their emphasis on instruction in the language children use at home and their use of educational content that is often linked very closely to the daily lives of their pupils. Appropriate non-formal curricula, materials, pedagogies and the use of appropriate language of instruction can help out-of-school children from minority groups to learn in safe and appropriate environments and prevent potential discrimination (Yasunaga, 2014).
MLE design needs to be consistent with language, literacy and learning research. Educational quality is affected positively by the use of home languages even for a few years, as demonstrated by the ‘early-exit’ approaches seen in, for example, Cameroon and the Philippines (Walter, 2013). However, research suggests a need for the extended use of home languages and for the continued development of biliteracy (reading and writing) across the curriculum to maximise the benefits (Cummins, 2009) (see Table 3.1). Among low-income countries, Eritrea and Ethiopia currently offer the strongest approaches: eight full years of primary schooling in their most widely-spoken, non-dominant languages (Walter, 2013; Skutnabb-Kangas and Heugh, 2012). In Ethiopia, this translates into eight years of education offered in seven languages (not including English) (Heugh et al., 2007).
Under Romania’s Law of Education (2011), in all districts where ethnic minorities account for at least 10% of the total population, free public schooling is

74 Fixing the Broken Promise of Education for All
Table 3.1 Effective implementation of multilingual education (MLE)
Educational language policy
■ A good policy allows mother tongues to be used for schooling/literacy; a better policy specifies the approach to mother tongue-based MLE and how it will be implemented.
■ The ministry of education should make it clear to teachers and parents (via official channels and public media) that previous prohibitions of the home language no longer apply.
Implementation strategies
■ Public awareness and involvement is essential; MLE should be discussed widely at all levels.
■ Offering MLE as an option in Mozambique has allowed implementation to follow demand rather than taking a top-down approach that communities may resist.
■ Autonomous Education Councils representing the major ethnolinguistic groups in Bolivia have facilitated implementation by raising community awareness of how MLE works.
■ Decentralised educational decision-making has allowed Ethiopian regions to implement up to eight years of mother tongue schooling, depending on demand and resources.
Teacher recruitment, training and placement
■ The training of teachers from the same linguistic communities as their students is only part of the picture; they require standardised literacy, academic vocabulary and bilingual methodologies.
■ Where there are too few teachers, it is preferable to raise the capacity of non-professionals from the same linguistic communities as their students; in Bolivia special ‘pedagogical secondary schools’ prepare young local women to teach in their home communities.
■ There may be a need for specialised subject teachers in second or third languages, whose language proficiency should be developed, assessed and accredited.
■ Teacher educators, administrators and personnel should also receive training in MLE.
Language and materials development
■ With support from NGOs, university linguists and educators, teachers and linguistic community members can develop pedagogical vocabulary and materials in the language spoken at home.
■ Using the Language Experience Approach (the promotion of reading and writing through the use of personal experiences and oral language), learners can write their own reading materials.
■ MLE materials should be as colourful as any other materials, but low-cost, local publishing alternatives may be more practical to get essential print resources into MLE classrooms.
■ Viet Nam is piloting bilingual side-by-side content learning materials for Grades 3 to 5 to support bilingual methodologies and the continued development of vocabulary and skills in both languages.
Curriculum and assessment
■ The MLE curriculum should be based on the national curriculum, with the exception that most language skills will be taught initially in the home language and transferred gradually to second and third languages.
■ Assessment of learning outcomes can often be carried out bilingually to ensure understanding.
Monitoring and evaluation
■ Learner statistics should be maintained and disaggregated by language, sex and age.
■ The language that children speak at home should be used to check for understanding.
Source: Benson, 2014

75Findings from the Global Initiative on Out-of-School Children
provided in their home language, although Romanian remains compulsory. Under the law, primary education in the mother tongue is guaranteed to national minorities and, for secondary education, classes in the languages of national minorities are organised at the request of parents and guardians. As a result of policies to promote the Romani language in the curriculum, the enrolment of Roma children has improved in the past decade but lack of Romanian language knowledge continues to be an obstacle and a drop-out risk factor. Children aged 7 to 16 years from Romani-speaking families are still two and a half times more likely to be out of school than those from non-Romani speaking households (UNICEF and UIS, 2012g).
Ethiopia’s top-down policy as implemented by regional education bureaus functions in homogeneous regions but strains limited resources in the linguistically-diverse south of the country (Skutnabb-Kangas and Heugh, 2012). Bolivia’s bilingual intercultural education approach began with top-down policies, phased-in implementation and education councils that respond to challenges among non-dominant communities, but subsequent lack of resources and political distancing has weakened its implementation (López, 2005; UNICEF and UIS, 2011). In Mozambique, the offer of MLE as an option has allowed time for public demand to be met by decentralised implementation, but the chronically under-resourced programme depends on small NGOs and a number of linguists (Chimbutane and Benson, 2012). Under-resourcing may cause communities to reject MLE as a result of low-quality implementation.
It is essential to address structural barriers. Given adequate financial and technical resources, decentralised implementation allows relevant responses to local linguistic and cultural needs. These include instruction based on the home languages of learners and teachers, the involvement of parents in choices around curriculum delivery, and the adaptation of school calendars to local lifestyles, all within reasonable national guidelines. In addition, appropriate non-formal curricula, materials, pedagogies and the use of appropriate language of instruction can help out-of-school children from
minority groups to learn in safe and appropriate environments and prevent potential discrimination.
Ghana, for example, has rolled out one of Africa’s most successful complementary education programmes, School for Life, with classes in mother tongue languages for children aged 8 to 14 years proving particularly attractive for out-of-school children. The aim is to ensure that children achieve basic literacy within the space of nine months. To date, the programme has helped over 120,000 children in northern Ghana from the most disadvantaged districts and communities. An external evaluation found impressive results, with 82% of the children participating in School for Life making the transition to formal education, completing their primary education and making the transition to lower secondary school (UNICEF and UIS, 2012d).
Filling the data gap
It is crucial to get the research methodology and the data collection strategies right. A number of Global Initiative on Out-of-School Children studies, including those in Bolivia and Nigeria (UNICEF and UIS, 2011; 2012f), use language as a proxy for ethnicity to illustrate disparities between groups, but such data have little explanatory power. It seems, in fact, that data on linguistic and cultural issues are more relevant than data on ethnicity alone for educational decision-making. To analyse the effect of language on educational success or failure, repetition and drop-out, it is vital to have data on the language children use at home in relation to the language of instruction at school. This includes youth and adult literacy targets: how, for example, is literacy measured and in which language(s) relative to the learner’s own language, given that an adult head of household responding to a survey may do so in a language that differs from the one spoken by their children?
Assessment data should also be analysed in relation to languages: what is the learner’s home language relative to the language of instruction and to the language of assessment? According to Ethiopia’s national assessments, learners taught and tested in their own languages tend to do better in all subjects

76 Fixing the Broken Promise of Education for All
(including English) than learners with a language mismatch (Heugh et al., 2012). MLE programmes should test strategically in one or more languages (Mdube-Shale et al., 2004), because testing only in the dominant language masks whether any difficulty lies in understanding the content, understanding the test questions or expressing knowledge in the test language. An innovative dual-language assessment in Niger, for example, found that results were highest for learners taught and tested in their own language, and lowest for those taught and tested in the dominant language (Hovens, 2002).
3.7 EXCLUDED AND UNCOUNTED: CHILDREN WITH DISABILITIES24
Yasas, an 18-year-old from Nuwara Eliya,
Sri Lanka, has never been to school as he
has a serious speech impediment with acute
stammering. He uses his hands to express
himself and his family understands him easily.
His parents were unaware of speech therapy,
although this could have helped him to a certain
extent, and didn’t have the time or money to
take Yasas to Kandy or Colombo for therapy.
OOSCI Country Study on Sri Lanka
(UNICEF and UIS, 2013c)
Children with disabilities are among the most disadvantaged in terms of missing out on education, being ‘invisible’ in the data and being overlooked in responses to out-of-school children (UNESCO, 2013).
Too often, children with disabilities are denied an education because education systems are simply
24 This section draws on “Children with Disabilities”, a background paper prepared for this report by Natasha Graham, Senior Disability Advisor, Partnership for Child Development, Imperial College, London.
not adapted or equipped to meet their basic needs, lacking everything from accessible school buildings to teachers who have been trained to teach in inclusive settings. These children miss out because continuing stigma around disability excludes them from the wider society around them, which includes education. And they miss out because they are, very often, ‘below the radar’ of current data collection.
It is hard to know how many children have disabilities. In 2011, the World Report on Disability estimated that more than 1 billion people (or 15% of the global population) live with some form of disability, with estimates for the number of children up to the age of 14 living with disabilities ranging between 93 million and 150 million (WHO, 2011). However, such global estimates are speculative and have been in circulation since 2001, and they are derived from data of quality too varied and methods too inconsistent to provide any reliable number of children with disabilities.
Attempts to generate global figures have been hampered by the lack of a common definition of disability (UNICEF, 2013a). Not surprisingly, international and national disability prevalence rates fluctuate wildly, depending on the different surveys used and the different questions they ask.
In principle, a child with a disability has the same right to an education as any other child, as set out in the 2006 UN Convention on the Rights of Persons with Disabilities (CRPD) which came into force in 2008 (see Box 3.8).
In practice, however, children with disabilities are denied this right disproportionately. Household survey data from 13 low- and middle-income countries show that children with disabilities aged 6 to 17 years are significantly less likely to be enrolled in school than their peers without disabilities. A 2004 study in Malawi found that a child with a disability was twice as likely to have never attended school than a child without a disability (UNICEF, 2013a).
India has achieved close to universal enrolment in primary education. However, the figures for children
In Ethiopia, learners taught and tested in their own languages do
better in all subjects, including English, than learners with a
language mismatch

77Findings from the Global Initiative on Out-of-School Children
with disabilities are staggering: out of 2.9 million children with disabilities in India, 990,000 children aged 6 to 14 years (34%) are out of school. The percentages are even higher among children with intellectual disabilities (48%), speech impairments (36%) and multiple disabilities (59%) (SRI-IMRB Survey, 2009). India has made tremendous efforts to make its education system more inclusive. Under the Right to Education Act, all children have the right to go to school. Additional financial resources have been provided for children with disabilities to attend mainstream schools and for the adaptation of school infrastructure. Resource centres focused on inclusive education have been established to support clusters of schools, and large numbers of teachers have been trained on inclusive education. To accommodate a greater number of children with disabilities, further progress is needed (UNICEF and UIS, 2014d).
Evolving perspectives on disability
Disability is a complex, varied and evolving phenomenon. While some health conditions associated with disability result in poor health,
many others do not, and the social impact can often outweigh any health or medical implications (WHO, 2013).
As a result of intense efforts by individual people with disabilities and the groups that represent them, there is growing consensus that definitions of disability should include social as well as the more traditional medical determinants. The World Health Organization (WHO) defines ‘disabilities’ as an umbrella term that covers impairments (see
Box 3.9), limitations on activities and restrictions on participation. Similarly, the CRPD defines those with disabilities as people who have long-term physical, mental, intellectual or sensory impairments that interact with various barriers external to themselves—whether physical or cultural, or related to communication and attitudes—to hinder their full and effective participation in society on an equal
The barrier to participation in education is often a bigger problem than the disability itself
Box 3.8 Education in the United Nations Convention on the Rights of Persons with Disabilities
The United Nations Convention on the Rights of Persons with Disabilities (CRPD), which came into force in May 2008, states that persons with disabilities should be guaranteed the right to inclusive education at all levels, regardless of age, without discrimination and on the basis of equal opportunity. It has been ratified by most of the countries that have taken part in the Global Initiative on Out-of-School Children and marks a global shift in thinking about disability. It entails a shift in attitudes from viewing people with disabilities as objects of charity and medical treatment to being full and equal members of society.
Article 7 is dedicated specifically to children with disabilities:
1. States Parties shall take all necessary measures to ensure the full enjoyment by children with disabilities of all human rights and fundamental freedoms on an equal basis with other children.
2. In all actions concerning children with disabilities, the best interests of the child shall be a primary consideration.
3. States Parties shall ensure that children with disabilities have the right to express their views freely on all matters affecting them, their views being given due weight in accordance with their age and maturity, on an equal basis with other children, and to be provided with disability and age-appropriate assistance to realize that right.
The Convention also includes specific references to education, particularly in Article 24, which states that persons with disabilities should be guaranteed the right to inclusive education at all levels, without discrimination and on the basis of equal opportunity, and children with disabilities shall not be excluded from free and compulsory primary education or from secondary education on the basis of disability.

78 Fixing the Broken Promise of Education for All
basis with others. When viewed through the lens of a social approach, people with disabilities are, in effect, no longer ‘disabled’ if they can participate fully in society. For a child with disabilities, this includes full participation in the classroom.
The starting point for the measurement of functional capacity under this social approach was the International Classification of Functioning, Disability and Health (ICF) developed by WHO (2001). In 2007, WHO built on the ICF classification to publish the International Classification of Functioning, Disability and Health for Children and Youth (ICF-CY) (WHO, 2007). The first unifying framework to describe the impact of context on a child’s functioning encompasses several environmental factors—including a child’s ability to participate in education—that should be examined when recording a profile of whether a child can function in society. In 2012, WHO and other stakeholders agreed to merge ICF and ICF-CY into one classification to arrive at a comprehensive ICF that addresses all aspects of functioning across a person’s lifespan.
This positive global shift towards a social approach to disability represented by the CRPD is not yet fully embedded in practice. The ways in which disability is measured and programme responses remain predominantly medical, with a continued focus on specific physical or mental impairments. In some
regions, including CEE/CIS, the emphasis often tends to be on the individual’s diagnosis and their perceived inability to take part in society (UNICEF and UIS, 2013a), rather than on society’s ability to include the individual. Progressive shifts are being seen in some CEE/CIS countries, however, with a growing focus on the ability of schools to include children with disabilities, rather than on the inability of a child to function in school.
The prevailing approach to disability—be it medical or social—will influence the policy response to out-of-school children with disabilities. As shown in Table 3.2, there are marked differences between the two approaches in terms of perceptions of disability and measures to ensure that children with disabilities receive an education.
The barriers
The barriers to the education of children with disabilities can range from the immediate and tangible, such as the lack of a ramp to enter a school building or the cost of transport, to the long-term impact of social norms and stigma that reinforce their exclusion.
The sheer lack of reliable and comparable data on children with disabilities—their numbers, the nature of their disabilities and their educational needs—only adds to the serious barriers they face to their education, making it difficult to develop effective policies and budgets for their inclusion.
Supply barriers
Children with particular physical disabilities may be confronted by school facilities that are inaccessible to them, from classrooms to toilets. Children with visual or hearing impairments struggle in environments with inadequate light or poor acoustics, while wider problems with transport often prevent children with disabilities from making the journey to school in the first place. In Kyrgyzstan, for example, few (if any) school buildings and classrooms are accessible to children with disabilities. Transportation for children with disabilities has been reported as being too costly
Box 3.9 Impairments and disabilities
In general, an impairment is an injury, illness or congenital condition that causes a loss or difference in physiological function. An impairment is not, in itself, a disability. One example would be children with reduced vision who have the eyeglasses that allow them to participate fully in the classroom.
A disability is the loss or limitation of equal opportunities to participate in society as a result of social, institutional and environmental barriers. One example would be children with reduced vision who do not have eyeglasses and who cannot, as a result, participate in school on an equal basis with other children.
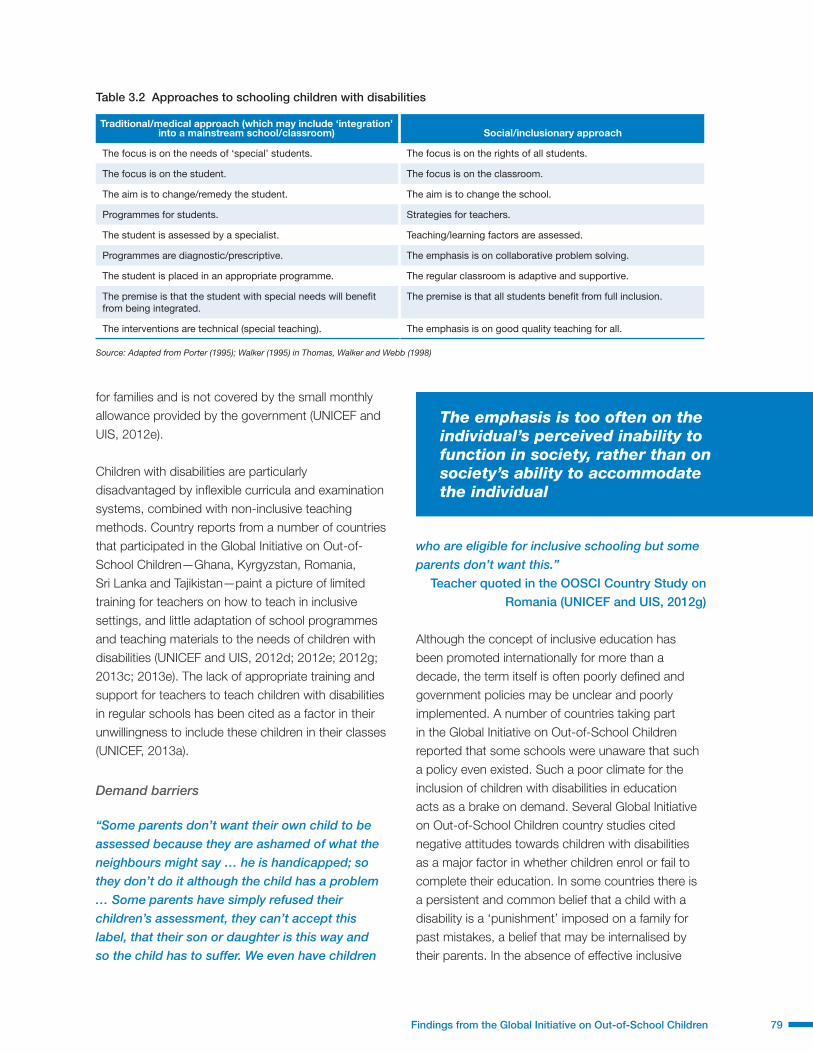
79Findings from the Global Initiative on Out-of-School Children
for families and is not covered by the small monthly allowance provided by the government (UNICEF and UIS, 2012e).
Children with disabilities are particularly disadvantaged by inflexible curricula and examination systems, combined with non-inclusive teaching methods. Country reports from a number of countries that participated in the Global Initiative on Out-of-School Children—Ghana, Kyrgyzstan, Romania, Sri Lanka and Tajikistan—paint a picture of limited training for teachers on how to teach in inclusive settings, and little adaptation of school programmes and teaching materials to the needs of children with disabilities (UNICEF and UIS, 2012d; 2012e; 2012g; 2013c; 2013e). The lack of appropriate training and support for teachers to teach children with disabilities in regular schools has been cited as a factor in their unwillingness to include these children in their classes (UNICEF, 2013a).
Demand barriers
“Some parents don’t want their own child to be
assessed because they are ashamed of what the
neighbours might say … he is handicapped; so
they don’t do it although the child has a problem
… Some parents have simply refused their
children’s assessment, they can’t accept this
label, that their son or daughter is this way and
so the child has to suffer. We even have children
who are eligible for inclusive schooling but some
parents don’t want this.”
Teacher quoted in the OOSCI Country Study on
Romania (UNICEF and UIS, 2012g)
Although the concept of inclusive education has been promoted internationally for more than a decade, the term itself is often poorly defined and government policies may be unclear and poorly implemented. A number of countries taking part in the Global Initiative on Out-of-School Children reported that some schools were unaware that such a policy even existed. Such a poor climate for the inclusion of children with disabilities in education acts as a brake on demand. Several Global Initiative on Out-of-School Children country studies cited negative attitudes towards children with disabilities as a major factor in whether children enrol or fail to complete their education. In some countries there is a persistent and common belief that a child with a disability is a ‘punishment’ imposed on a family for past mistakes, a belief that may be internalised by their parents. In the absence of effective inclusive
Table 3.2 Approaches to schooling children with disabilities
Traditional/medical approach (which may include ‘integration’ into a mainstream school/classroom) Social/inclusionary approach
The focus is on the needs of ‘special’ students. The focus is on the rights of all students.
The focus is on the student. The focus is on the classroom.
The aim is to change/remedy the student. The aim is to change the school.
Programmes for students. Strategies for teachers.
The student is assessed by a specialist. Teaching/learning factors are assessed.
Programmes are diagnostic/prescriptive. The emphasis is on collaborative problem solving.
The student is placed in an appropriate programme. The regular classroom is adaptive and supportive.
The premise is that the student with special needs will benefit from being integrated.
The premise is that all students benefit from full inclusion.
The interventions are technical (special teaching). The emphasis is on good quality teaching for all.
Source: Adapted from Porter (1995); Walker (1995) in Thomas, Walker and Webb (1998)
The emphasis is too often on the individual’s perceived inability to function in society, rather than on society’s ability to accommodate the individual
80 Fixing the Broken Promise of Education for All
education policies, the resulting shame and stigma are thought to keep many children with disabilities hidden from view at home.
The Ghana country study, for example, noted a high degree of stigmatisation, with a recent study in the northern rural area finding that children with disabilities are viewed by parents as not having any (or only a very limited) capacity to learn. These parental perceptions combine with the failure of schools to promote inclusive education to keep children with disabilities out of the classroom (UNICEF and UIS, 2012d). Similarly, in Kyrgyzstan the public perception of disability and the frequent teasing and bullying of children with disabilities were cited as significant social barriers to their education (UNICEF and UIS, 2012e).
While looking at demand barriers, it is important to consider how disability, poverty, gender, ethnicity and geographic location intersect, given that the school participation of children with disabilities is often determined by the interplay of such factors. It is clear that children with disabilities face multiple forms of discrimination that lead to their exclusion from society and education. Girls with disabilities experience double discrimination, which places them at higher risk of being out of school, experiencing gender-based violence, sexual abuse, neglect, maltreatment and exploitation (United Nations, 2014).
Poverty and disability are often inter-related. According to the 2011 World Report on Disability, 80% of people with disabilities live in developing countries and they are disproportionately represented among the poor. Disability is both a cause and consequence of poverty: with limited opportunities for education and economic participation, people with disabilities often experience life-long poverty and exclusion. Poverty itself can contribute to disability, linked as it is to poorer access to nutrition and healthcare and a greater risk of being exposed to dangerous working conditions. Households that include people with disabilities carry the direct cost of their care, which often results in lower standards of living.
The data challenges
Global Initiative on Out-of-School Children studies across the board concur: the barriers to the education of children with disabilities are reinforced by the invisibility of children with disabilities in the data. Most country studies revealed a chronic lack of quality administrative or household survey data to understand how many children with disabilities there are and what kinds of disabilities they face. This makes it difficult to gauge how many are out of school, why they are out of school and how best to fulfil their right to an education. Most Global Initiative on Out-of-School Children countries reported that they lack the necessary assessment tools and methodologies to identify children with disabilities, which makes it difficult to collect disaggregated disability data and, by extension, to plan and budget for appropriate services, infrastructure and resources.
The collection of data is hampered by the serious and persistent differences in definitions of disability, alongside the mass of methodologies and measurement instruments that are used to identify the children concerned. As a result, existing prevalence estimates of childhood disability vary to such an extent that cross-country comparisons become almost meaningless—from less than 1% in countries like China to almost 50% in the Central African Republic (UNICEF Global databases, 2014). It is often the case that different instruments within one single country generate conflicting rates of disability.
The Global Initiative on Out-of-School Children Regional Report on CEE/CIS, for example, points out that only 1.5 million children in the region are officially registered by their governments as having a disability, but this is likely to leave millions more unaccounted for (UNICEF and UIS, 2013a). Many of these uncounted children may be in school but lack the specific and appropriate support they need to prevent poor learning outcomes and drop-out. Each country’s estimate comes from a combination of hospital registries of children that are identified at birth as having a disability; data on the number of children living in institutions or

81Findings from the Global Initiative on Out-of-School Children
attending special schools or classes; and lists of children registered by parents or doctors as having disabilities. This excludes many children with disabilities that develop after birth, children who are not registered as a result of stigma, children deemed ‘uneducable’, or children under the care of different ministries that may not be captured in any data-sharing. However, it is common that children from socially-vulnerable groups may be disproportionately assigned to ‘special schools’ when they do not have any impairment but rather are non-native speakers of the language of instruction or are simply the poorest of the poor. As a result, the definitions used in the CEE/CIS region are country-specific and are not necessarily harmonised with each other or with the global definition (UNICEF, 2011b).
The Global Initiative on Out-of-School Children Regional Report on South Asia cited the invisibility of children with disabilities as a significant factor in their exclusion from education. In India, for example, a nationwide survey of 99,226 households in 2009 identified 1.5% of primary and lower secondary school-age children as having a disability. As stated earlier, an estimated 34% of primary and lower secondary school-age children with disabilities were out of school, compared to a national average of 4% (UNICEF and UIS, 2014d). The design of the questionnaire is thought to have had a major impact on the reported disability prevalence, identifying children with disabilities through two questions: a filter question (“Does [name] have a disability?”) and a general question on the type of disability. No information was gathered on either severity or functioning. As a result, the low prevalence rate in India may capture only those children with the most severe or apparent disabilities. Not surprisingly, similar prevalence rates are reported in surveys from other developing countries that use these same basic questions (UNICEF and UIS, 2013a).
An additional challenge is bias in reporting. While children with visible impairments may be acknowledged, those with mild or ‘hidden’ disabilities, such as learning or psycho-social impairments, may well be overlooked.
Under-reporting is a major issue and may well reflect the reluctance of parents to report a child’s disability, given the continued stigmatisation of children with disabilities and their families, or their lack of awareness of their child’s disability in the absence of effective screening services.
Breaking the barriers
Ultimately, the education of children with disabilities hinges on the removal of the many barriers they face, from the lack of physical access to classrooms to the stigma that keeps them hidden away at home. It also requires the provision of appropriate support and an understanding of their functioning and needs, all backed by robust and comparable data. When the school environment is welcoming and sensitive to the needs of children with disabilities, even simple adjustments can make an immense difference, as shown in Namibia:
Simenda was struggling to cope at secondary
school in rural Namibia until his hearing
impairment was diagnosed. His teachers were
briefed on supportive strategies to help him in
class, such as allowing him to sit wherever he
could hear and checking that he was following
the lesson. After two terms, his results in class
tests had substantially improved—to the eighth
highest result in a class of around 30 pupils.
OOSCI regional report for Eastern and Southern
Africa (UNICEF and UIS, 2014b)
Above all, governments need to deliver on their repeated promises, including those made under the CRPD, to ensure that all children have an equal right to education. This requires inclusive education policies that benefit all children, with or without disabilities, by ensuring that teaching responds to individual differences and diverse abilities as a matter
Negative public perceptions of disability, coupled with teasing and bullying, can be barriers to the education of children with disabilities

82 Fixing the Broken Promise of Education for All
Table 3.3 A checklist for the effective implementation of inclusive education
The enabling legislative and policy environment
■ Harmonise existing legislation with the relevant international conventions, such as the Convention on the Rights of Persons with Disabilities (particularly Article 24 on education) and the Convention on the Rights of the Child, to create education systems that are inclusive at all levels.
■ Remove legislative barriers to the participation of children and teachers with disabilities in education. For example, abolish laws and policies that prevent the admission of children with disabilities into school or that do not allow people with disabilities to become teachers.
■ A good education policy or sector plan includes the needs of children with disabilities through the adaptation of existing measures, such as the provision of training on inclusive teaching and the provision of textbooks in accessible formats.
■ A good education policy or sector plan also incorporates targeted measures for children with disabilities. These include the provision of allowances/funds for transport or assistive devices and technology for children with disabilities.
Implementation strategies
■ Strengthen data on children with disabilities, align definitions and instruments with international standards and the ICF framework, and synchronise data collection on children with disabilities between ministries and national statistical offices.
■ Plan and implement public awareness campaigns to change attitudes towards children with disabilities.
■ Promote inclusive early childhood care and education programmes. Early intervention and stimulation can enhance the development of children with disabilities and foster inclusive and non-discriminatory attitudes among children from the start.
■ Design social protection programmes that account for the additional costs of disability experienced by households with an adult or child with a disability, which can pose significant barriers to school participation.
Teacher recruitment, training and placement
■ Embed the principles and strategies of inclusive education and inclusive teaching strategies throughout the teacher training curriculum.
■ Design teacher training to incorporate practical experience of teaching in inclusive settings with adequate interaction with children with different types of disabilities.
■ Establish teacher support systems through periodic monitoring, peer support, support from resource teachers and resource centres, and the exchange of knowledge and support.
■ Train and enable teacher educators to adopt an inclusive orientation and to put that orientation into practice in inclusive settings.
■ Remove barriers to the education and recruitment of people with disabilities as teachers and take reasonable measures to enable them to participate in the education system. This can break down stereotypes around disability and provide role models for learners with disabilities.
■ Promote whole school-based training on inclusive education that includes community members.
■ Apply the expertise available in the special education system to support inclusion of children with disabilities in general schools.
Accessible schools
■ Promote standards, budgets and monitoring to ensure accessible school construction and the provision of water, sanitation and hygiene facilities that are designed to be universally accessible.
■ Provide assistive devices, alternative or augmented forms of communication such as sign language and accessible materials such as textbooks and other learning materials in Braille or as audio books.
■ Promote positive images of people with disabilities in textbooks and other school materials.
Curriculum and assessment
■ The MLE curriculum should be based on the national curriculum, with the exception that most language skills will be taught initially in the home language and transferred gradually to second and third languages.
■ Assessment of learning outcomes can often be carried out bilingually to ensure understanding.
Monitoring and evaluation
■ Data from education management information systems (EMIS) should record information on learners which can be disaggregated by disability.
■ EMIS should include data on the accessibility of schools.
Multi-sectoral approaches
■ Adopt multi-sectoral approaches and coordination of services between ministries of education, health, social welfare, transport, etc. to ensure the seamless provision of the support and services necessary for the education and school participation of children with disabilities.
■ Strengthen linkages with community-based rehabilitation services to identify, prepare, enrol and sustain the educational participation of children with disabilities.

83Findings from the Global Initiative on Out-of-School Children
of course. A checklist for the effective implementation of inclusive education is set out in Table 3.3.
Several recent publications and reports have recommended key actions to be taken by governments to include children with disabilities in mainstream policies, systems and services (WHO, 2012). There are two main strands: broad social reforms beyond the education sector and reforms within the sector itself.
Broader social reforms should promote inclusive education for children with disabilities at all levels (including early childhood education) and support the practice and culture of inclusion across education systems by reviewing national policies in all relevant sectors—health and social, as well as education. The aim is to ensure that policies are inclusive and aligned with international conventions and commitments and that multi-sectoral strategies promote the inclusion and participation of children with disabilities in different spheres. Sector-wide strategies, programmes and budgets should be reviewed to determine whether they include concrete actions to support children with disabilities and their families. Every country needs a comprehensive multi-sectoral national strategy and plan of action for children with disabilities that follow an inclusive approach to address family support, community awareness and mobilisation, human resource capacity, coordination and service provision. Such reforms must be bolstered by clear lines of responsibility and mechanisms for coordination, monitoring and reporting across all relevant sectors.
In particular, social reforms must aim to build positive attitudes towards disability. For example, the ‘It’s About Ability’ campaign in Montenegro, launched by the government in partnership with UNICEF, reduced the percentage of people who found it unacceptable for a child with disability to attend the same class as their own child from 64% in 2010 to 39% in 2012.
Education sector reforms need to ensure that all education strategies and action plans are inclusive, first and foremost, and that they therefore include children with disabilities. Curricula and learning
materials, processes and assessments need to be accessible and applicable to every child. These should be reinforced by teachers who have received practical training and ongoing support for teaching in inclusive settings and who have the backing of schools and communities that are committed to inclusive approaches. At the most practical level, schools need to be built or retrofitted to ensure that they are accessible for children with disabilities: ramps instead of stairs, for example, and doorways wide enough for wheelchair users.
A number of countries provide solid examples of what works. Kenya’s Oriang Inclusive Education scheme, for example, focuses on and addresses the constraints to the education of children with disabilities and has increased the number of children with disabilities attending five state primary schools. Its key interventions include: access to sensory-stimulation learning materials and assistive devices, financial support to adapt school environments, and building close links between community health workers and teachers (United Nations, 2011).
In Bangladesh, the Centre for Disability in Development (CDD) is working to address the lack of teachers who have disabilities through its inclusive education trainers, several of whom are visually impaired or have other impairments. In Mozambique, Ajuda de Desenvolvimento de Povo
para Povo, a national NGO, has worked with the national organization for people with disabilities, ADEMO, to train student teachers to work with children with disabilities and to train student teachers who have disabilities (UNICEF, 2013a). Serbia’s ‘big bang’ approach to inclusive education is outlined in Box 3.10.
Non-formal education also offers a pathway for the educational inclusion of children with disabilities
Existing prevalence estimates of childhood disability vary to such an extent that cross-country comparisons become almost meaningless

84 Fixing the Broken Promise of Education for All
Box 3.10 Towards inclusive education in Serbia
In partnership with the World Bank, UNICEF and other partners and stakeholders, the government of Serbia has adopted a ‘big bang’ approach towards realising inclusive education.
Enabling Legislative Environment: Serbia enacted the Law on the Foundations of the Education System in September 2009, which is imbued with the principles of equal opportunity, inclusion, anti-discrimination and the best interest of the child and demands systemic changes. For example, the Law prescribes that school enrolment policies have to be unconditional and inclusive and abolishes the need for an assessment of the child’s capacity and skills as a pre-condition for enrolment. Instead such assessments are carried out during the course of the first year of schooling and serve as the basis for designing an individual education plan as needed, aimed at facilitating each child’s learning and inclusion in the school community.
Teacher Training: Within a short period of two years, Serbia provided in-service professional training for some 15,000 teachers in Serbia (about 20% of the total teaching staff) to work in classrooms with children with disabilities and change mind-sets of individuals and educational institutions in order to fully understand, accept and ultimately embrace inclusion.
Public awareness campaigns: The Ministry of Education, Science and Technological Development, in partnership with non-governmental and international organizations, media and local partners, organized a campaign entitled “All to School—Future for All”. The campaign focused on changing perceptions about inclusion and helped to build a critical mass of supporters from all parts of society—including parents, politicians and professionals in the health, social welfare and education sectors.
Horizontal learning: In Serbia, a Network for Support of Inclusive Education was established in 2010 by the Ministry of Education and in cooperation with the World Bank and UNICEF with the aim to provide inclusive education models, provide capacity building for inclusive education in pre-primary and primary education, ensure the presence of trained professionals to provide continuous development, as well as direct coaching, consulting and supervision to schools. It supported capacity building for inclusive education in pre-primary and primary education. Model inclusive schools were established in 14 locations. By 2014, over 2,000 practitioners and school advisors were included in different forms of knowledge exchange, including observance of actual classroom practice and discussions on challenges and solutions for inclusive education. The student population covered by schools that are supported through the network is around 150,000 students.
Strengthening inclusive learning environments: With the aim of empowering schools to implement inclusive education, Serbia designed a programme of grants for small school projects. These grants, financed under a World Bank loan, have been implemented in over 30% of schools in 96% of Serbian municipalities. While varying in scope and focus, the school initiatives were primarily directed to capacity building of staff, the elimination of physical and communication barriers for inclusion of children with disabilities, the promotion of cooperation with parents, and local community awareness-raising on the importance of inclusive education.
Monitoring: In December 2010, four months after the entry into force of the Law, UNICEF supported an independent, rapid assessment in order to identify bottlenecks and constraints in the implementation of the Law’s inclusive provisions. It provided important insights into what was and was not working, and formed the basis for an improvement plan, which was then implemented, including the initiation of the development of a monitoring framework. To enable the tracking of progress of Serbia’s implementation of inclusive education laws and policies, UNICEF, together with the Government Unit on Social Inclusion and Open Society Foundation Serbia, supported development of the Framework for Monitoring of Inclusive Education in Serbia. The monitoring framework consists of indicators at school, municipal and national levels that are, to a large extent, correlated with each other and enable the flow of information in both directions (bottom-up and top-down). For each of the indicators, the framework includes input, process, and output/outcome targets.
85Findings from the Global Initiative on Out-of-School Children
who might otherwise miss out. In Bangladesh, for example, BRAC primary schools use a learner-centred approach. Teachers, all female, are recruited from local communities and receive an initial 12-day training course from BRAC, plus in-service monthly training. Class schedules are flexible and schools include students with disabilities, with BRAC providing corrective surgeries (when appropriate) and assistive devices free of charge to students who need them. BRAC builds ramps to improve the accessibility of its schools, and classroom policies for children with disabilities include sitting them at the front, studying in pairs, the inclusion of disability-related issues in textbooks and awareness-building among classmates and teachers. BRAC students can sit for the government examination that marks the end of primary school, and their results show that they can often compete with, if not perform better
than, students from government schools (Nath, 2002; Yasunaga, 2014).
Filling the data gap
The collection, analysis and reporting of good, quality data on children with disabilities and the extent of inclusiveness in the school system can help governments to meet their commitments to the education of children with disabilities. It is crucial that the definitions of disability used by each country comply with international standards and that data collection uses measurement procedures that provide internationally-comparable prevalence rates.
What is needed is data collection based on a broad and consistent definition of disability to
Box 3.11 A way forward on the data
Partnership is essential for a reliable and globally-relevant monitoring and reporting system on child disability. No single entity can hope to capture the complex ways in which the barriers within education systems and in the wider environment combine to keep children with disabilities out of school.
Many initiatives are being undertaken by UNICEF and its partners to address the need for comparable and reliable data on children with disabilities.
A manual is being prepared for the production of statistics on children with disabilities to guide those collecting data on this issue. The manual, guided by inputs from 40 international experts, will set out conceptual and theoretical issues on the measurement of disability in children and review methods and tools that have been used to collect data in this area.
UNICEF and the Washington Group on Disability Statistics have developed a survey module on child functioning and disability for use in household surveys and censuses. The model reflects current thinking around disability and can produce internationally-comparable data on children aged 2 to 17 years. The module will explore their ability to take part in a range of activities and social interactions and look beyond simple yes/no answers to better reflect the degree of disability and its impact on a child’s daily life.
The two organizations are also working on a related survey module to measure the school environment and children’s participation in education, with an emphasis on measuring the barriers to the education of children with disabilities and their solutions. The module will cover attitudes, as well as accessibility, getting to school and affordability.
A team of international experts is working with UNICEF to create a toolkit and methodological guidelines for in-depth assessment of the limits and restrictions children face, based on existing examples of best practice in low-income countries. This uses the International Classification of Functioning, Disability and Health for Child and Youth (ICF-CY) as the framework for an approach to disability focused on the barriers to the participation of children with disabilities.
Source: UNICEF, 2014c
86 Fixing the Broken Promise of Education for All
capture the scale of the challenges, combined with expert assessment and follow-up to respond to the educational needs of each individual child.
There are welcome efforts to move away from the classification of children by their type of disability and towards assessment of the way in which they are able to function in society and in school. The provision of education and individualised support should be based on such tailored assessment of functioning of a child within a given environment. Two children may be diagnosed with cerebral palsy, for example, but have markedly different functional capacities and needs. Similarly two children using wheelchairs may have vastly different levels of school participation depending on how enabling or disabling their environment is.
Any reform that aims to improve the lives of children with disabilities needs to be driven by the best possible evidence, with effective data collection on disability tied directly to service provision (see
Box 3.11). Data that identify gaps in service delivery for children with disabilities should be used to advocate for the sustainable financial and technical support that will—among many other benefits—bring these children into the classroom and keep them there.
A number of countries are already changing the way in which they measure and respond to disability, with Cambodia a prime example of a country that is mobilising data collection to respond to the needs of individual children (see Box 3.12).
Box 3.12 Making the invisible child visible in Cambodia
“Knowing the situation about children with disabilities will allow Cambodia to plan and provide quality education for ALL of Cambodia’s children.”
Nath Bunroeun, Secretary of State for Education, Youth and Sport
The 2008 census in Cambodia reported that just 1.4% of the country’s people had some form of disability (Cambodian National Institute of Statistics, 2014), a strikingly low rate that may well have been linked to confusion over terminology.
In 2010, the Cambodian Ministry of Education, Youth and Sport (MOEYS) mounted a national survey with support from the Global Partnership for Education (GPE) to gather data on all out-of-school children, including children with disabilities, to better understand the links between these two groups. A ten-question screening instrument was used to identify children aged 2 to 9 years with potential impairments, disabilities or any other major health issues. Children who screened positively were referred for additional health screening by a team of doctors, psychologists, and hearing and vision specialists to confirm the presence of an impairment or disability and to provide treatment wherever necessary.
The results confirmed that many children had easily-treatable health conditions, such as partial hearing loss caused by untreated ear infections, and that about 5% of children with poor eyesight simply needed eyeglasses to read properly and participate fully in school. Most of these conditions had been undiagnosed prior to the survey.
The disaggregated disability data generated by the 2010 survey has made children with disabilities more ‘visible’ in Cambodia. As a result, the MOEYS is designing a national disability screening approach for all first graders, including eyesight tests, to increase the enrolment of children with impairments and disabilities. An inclusive education training module has been developed and approved by the MOEYS, and pilot projects to mainstream education for children with disabilities in 18 provinces are beginning to inject greater equity into Cambodia’s education system.
MeiMei, a 9-year-old third grader in Takéo Province, began to miss school because of headaches and was no longer the good student she had once been. She struggled in class because she could not see clearly what was written on the board. A disability screening confirmed her poor vision as the source of her headaches and this was corrected with a simple pair of glasses. She is now back at school and flourishing in her studies.
Source: Global Partnership for Education (n.d.)

87Findings from the Global Initiative on Out-of-School Children
There is no doubt that the inclusion of children with disabilities in education will carry a significant financial cost related to the training and re-training of teachers, the re-modelling of schools to make them accessible, and the provision of specialised support and equipment in the classroom. However, these costs are outweighed by the positive impact of inclusion, not only on the children concerned but also on their fellow pupils, their schools and communities.
A similar argument applies to all children profiled in this chapter, from those caught up in war to girls
in remote rural areas, and from child labourers to children whose home language differs from that used in the classroom. In each case, governments need to commit significant resources to reach the world’s out-of-school children, but the long-term benefits in terms of health, prosperity, social cohesion and national productivity are well worth the price. The next chapter looks at this issue in more detail, aiming to close the current knowledge gap on the true costs of universal primary education.

88 Fixing the Broken Promise of Education for All

89Findings from the Global Initiative on Out-of-School Children
4.1 INTRODUCTION
This chapter builds on the findings of previous chapters in order to set out recommendations on the all-important financing of policies affecting out-of-school children. Chapter 2 uses the latest administrative and household survey data to reveal the magnitude of the challenge and outlines where, and towards whom, we must target our interventions. Chapter 3 describes the barriers to school inclusion and provides a menu of proven policies and strategies to overcome them. The fact is, however, that the resources—financial and human—that are available to tackle the barriers are limited. Policymakers who are deciding where and how to spend public financing need solid information on the cost of getting all children into school and the expected impact of the interventions they select to address this challenge.
The standstill in global progress on reducing the number of out-of-school children reinforces the need to reconsider the resources required to provide education for every child.
The enrolment of all out-of-school children and adolescents of primary and lower secondary school age must take into account both the costs of system-wide expansion of education and targeted interventions to reach the most marginalised children. Rather than presenting a new global estimate of the cost to enrol all primary and lower secondary school-age out-of-school children and adolescents, this chapter will drill down into the costs of, and challenges for, financing the system-
wide and targeted interventions that are crucial for decision makers at the national and sub-national levels. Indeed, transferring resources toward the most marginalised requires a dramatic shift from the existing resource allocations whereby wealthier, urban areas receive disproportionately more resources than poorer, rural areas with more need.
The chapter presents a new model focused on out-of-school children that provides policymakers with an overall picture of the costing implications for both expansion and targeted strategies. This innovative approach is elaborated using available data from a country that still has a long way to go to achieve universal primary education and that faces some of the greatest and most pressing challenges: the Democratic Republic of the Congo.
If they are to enact the system-wide and targeted interventions listed in Chapter 3, policymakers need answers to three key questions.
m What are the optimal levels of each of these programmes?
m How should they be distributed within the country? m Should particular programmes be prioritised or
accelerated?
Financing needs for out-of-school children
Chapter 4
The standstill in global progress on the number of out-of-school children reinforces the need to reconsider the resources required to provide education for every child

90 Fixing the Broken Promise of Education for All
The selection of targeted interventions is, at present, hampered by a lack of information on effectiveness and costs. However, an initiative by UNICEF and the World Bank seeks to compile data on the effectiveness of targeted interventions and uses a new policy tool called the Simulations for Equity in Education (SEE) to reproduce the impact of policy options on the enrolment of marginalised children. This chapter therefore also presents results for a sub-national analysis of gender-specific policies in the Balochistan province of Pakistan using the SEE approach.
4.2 AN EVOLVING UNDERSTANDING OF FINANCING NEEDS FOR UNIVERSAL BASIC EDUCATION
Alongside the progress made toward universal basic education over the past two decades, there has been progress in our understanding of the financial resources required to achieve that goal. A number of models that estimate the financing needs for universal enrolment (or completion) at different levels of education have emerged since 2000. Early models used a linear costing approach to assess global education financing needs, estimating the spending on primary education that would be needed to expand existing education systems to accommodate universal enrolment, based on average recurrent spending per pupil (Devarajan et al., 2002). More sophisticated models incorporated capital expenses (Brossard and Gacougnolle, 2001) and accounted for improvements in the quality of education provision (Delamonica et al., 2001). These generated estimates of annual financing needs that ranged from $6.5 billion (Bruns et al., 2003) to $17 billion (Delamonica et al., 2001). The wide range reflects the variation in the sets of countries covered by the models, as well as their sensitivity to underlying assumptions about unit costs of schooling, population growth, economic growth, the treatment of private education, repetition,
dropout and the timeline for the achievement of global education goals.
One major flaw of these early models identified by Glewwe et al. (2006) was their assumption that supply-side considerations, such as the availability of school places and the number of teachers, are—invariably—the most binding constraints on participation in basic education. As discussed in Chapter 3, however, the mere expansion of the existing education offer will not ensure enrolment of children who face specific types of disadvantage (for example, see World Bank, 2004). Children are out of school for a variety of reasons: many of them linked to demand-side barriers, such as social norms around gender, stigma that works against the enrolment of children with disabilities or the failure to teach children in the language they use at home. Furthermore, some supply-side failures—and in particular poor quality education—cannot be remedied by simply expanding the current education infrastructure but require improved teaching, among other reforms.
Such shortcomings in the early models were addressed by the Education and Policy Data Center (EPDC) and UNESCO in a background paper for the 2010 EFA Global Monitoring Report (EPDC and UNESCO, 2009). Using the EPDC’s High-Level Interactive Projections model, the paper estimated the financing required to achieve four of the six EFA goals: early childhood education, primary education, lower secondary education and adult literacy. The authors augmented the average per-pupil spending approach by factoring in the additional spending required to reach marginalised children. However, as a result of data constraints, the model’s treatment of marginalisation was necessarily somewhat crude, estimating the size of just one generic and marginalised group in each country. It did not account for the different types of marginalisation or the different costs of interventions designed specifically to reach those different groups. Assuming that countries were able to meet certain domestic contribution targets between 2008 and 2015, the annual funding gap estimated by this exercise was $24.1 billion (in US constant 2007 dollars)
The selection of targeted interventions is hampered by a lack of information
on effectiveness and costs

91Findings from the Global Initiative on Out-of-School Children
for primary and lower secondary school in all low-income countries, of which 13% would be required for marginalised groups of children who experience “extreme and persistent disadvantage in education that sets them apart from the rest of society” (UNESCO, 2010b).
Consideration of the needs of marginalised populations has continued to move to the forefront of costing approaches in recent years, with improved data on marginalised children and adolescents and the interventions to reach them. The UNICEF and World Bank Simulations for Equity in Education (SEE) model, piloted in Ghana and Pakistan in 2013, projects the impact of targeted interventions on participation in education. This shift in modelling is driven by the consequences of global trends in enrolment: recent progress toward universal basic education in the majority of countries has confirmed that the remaining out-of-school children and adolescents are likely to be the most difficult to reach. As a result, the general expansion of existing education systems becomes less effective in increasing enrolment, and specific targeted interventions to enrol marginalised children and adolescents become ever-more important.
4.3 A MODEL FOR ESTIMATING FINANCING NEEDS FOCUSED ON OUT-OF-SCHOOL CHILDREN AND ADOLESCENTS
Children with certain profiles, such as those with disabilities or who do not speak the language used at school, are most likely to be out of school because they face significant barriers to education that are highly context-specific. In countries where universal access—let alone completion—remains a distant goal, widespread and extreme poverty erects serious financial barriers to schooling for large numbers of children of school age, often forcing them into child labour or child marriage. In countries that are within the last mile of the journey towards universal access and completion, it is the most marginalised children who face specific barriers, such as the lack of accessible schools for children with disabilities, mother
tongue instruction for non-native speakers of that language of instruction, or schools in remote areas, as outlined in Chapter 3. For children facing these vulnerabilities, the cost of enrolling is higher than the cost of enrolling the average pupil—these are the children for whom the Glewwe et al. critique, with its emphasis on demand-side barriers, is most relevant.
Data on past and expected school exposure can be used to estimate the costs to enrol out-of-school children who, without interventions, will not complete primary education: the children who have left school early and those who are unlikely to ever set foot in a classroom (as discussed in Chapter 2). This assumes that out-of-school children who are expected to enter school in the future, in most cases one or two years late, do not need the kind of interventions necessary for children who have dropped out or who will never attend.
There will, inevitably, be an expansion cost in enrolling every out-of-school child and adolescent of primary and lower secondary school age in primary education—an expansion cost associated with increasing the supply of teachers (teacher training cost and salary), classrooms and materials. The responsibility for financing that expansion cost is split between the public sector (the Public Expansion cost) and households (the Household Expansion cost). The total of these costs represents the financing required to create enough school places to accommodate out-of-school children in the public education system. On top of this, there will also be Targeted Intervention costs to reach children with different profiles linked to marginalisation (for example, children with disabilities, working children, girls, and children affected by conflict), allowing them
There will, inevitably, be an expansion cost in enrolling every out-of-school child of primary and lower secondary school age in primary education

92 Fixing the Broken Promise of Education for All
to access the school places created by spending on expansion. The cost of enrolling children currently out of school in any country is, therefore, the sum of the Public Expansion cost, the Household Expansion cost and the Targeted Interventions cost.
It is helpful to derive annualised costs for enrolling out-of-school children. The annualised Public Expansion costs include the construction costs for temporary and permanent classrooms, average teacher salaries, the cost of training teachers, and expenditures on supplies such as textbooks. These costs will be directly proportional to the number of children who have dropped out or are expected never to enrol and, with the exception of supplies, are inversely proportional to the pupil-teacher ratio (because larger classes reduce costs).
The annualised Household Expansion cost is simply the sum of all household spending on educational supplies, fees and any supplement to teacher salaries made in a single year. Again, these costs will be directly proportional to the number of children who have dropped out or who are never expected to enrol.
Finally, the Targeted Interventions cost must take account of annual spending on each child in each marginalised group for every different type of intervention.
These costs can be expressed in terms of the formulae in Box 4.1.
Although school fees have been abolished in many developing countries, households often continue
Box 4.1 Formulae for estimating the cost of enrolling out-of-school children
Annual cost of enrolling out-of-school children in country X
= Public Expansion cost + Household Expansion cost + Targeted Interventions cost
Public Expansion cost
= 7 n— µ — 8 p
[annualised construction cost per temporary classroom ]
+ 1 n— µ — 8 p
[annualised construction cost per permanent classroom ]
+ n— p
[average teacher salary]
+ n— p
[ training cost per teacher]
+ n [per-pupil public expenditure on supplies]
Household Expansion cost
= n [per-pupil household spending on supplies and fees]
+ n [per-pupil household supplement to teacher salaries]
Targeted Interventions cost
=∑ ∑ n
i=1
m j=1
dij [annual cost of intervention per child i in group j]
where dij = 1 if child i belongs to marginalised group j, dij = 0 otherwise, p is the target pupil-teacher ratio, n is the number of out-of-school children in country X that have dropped out of school or are expected never to enrol, m is the number of types of marginalisation in country X.
93Findings from the Global Initiative on Out-of-School Children
to supplement government expenditure with out-of-pocket payments for teachers, supplies, parent-teacher association dues and other fees (World Bank, 2009). It is important, therefore, to distinguish between expansion costs that are publicly and privately financed. In this analysis, government policy on education financing can be taken as a given, so that households and government maintain the existing cost-sharing arrangement for education spending. Alternatively, unit costs can be adjusted to shift the responsibility of expansion between public and private sources. For example, to emulate a shift of financing from households to governments, the average teacher salary (part of the Public Expansion cost) could be increased with a commensurate decrease in the current per-pupil household supplement to teacher salaries (part of the Household Expansion cost).
To spread capital costs evenly over the period of integration of out-of-school children into schools, classroom expenses are annualised over their expected lifetimes. To prevent either a shortage or oversupply of classrooms as the bulk of former out-of-school children who are now enrolled make their way through primary school, temporary and permanent classrooms are financed in proportion to the current numbers of out-of-school children and their annual expected inflow, respectively.25 Constant population growth and a constant age structure of the out-of-school population are assumed, so that the annual flow is one-eighth of the total current out-of-school population (this assumption can be refined based on country-specific data). Under these assumptions, the ratio of temporary to permanent classrooms is 7:1 (giving rise to the 7/8 and 1/8 multipliers observed in the first two lines of the Public Expansion cost formula in Box 4.1). A similar issue applies to the supply of teaching staff. In some countries, this may be resolved using contract teachers to increase the supply temporarily.
Another key feature of this analysis is that it accounts for the possibility that a single child may have multiple profiles linked to marginalisation, compounding the
25 Double-shifting could also be a solution to the overflow problem, particularly where population density is high.
cost of his or her enrolment. The proposed analysis can be applied to countries to estimate the financing needs for enrolling their out-of-school populations, but it can only be used effectively if it is based on a comprehensive understanding of the barriers faced in a given country, as well as of the interventions needed to address marginalisation. The analysis makes a few simplifying assumptions: a one-to-one mapping of marginalisation types to interventions and, unlike SEE (discussed later in this chapter), 100% efficacy of the interventions and perfect, costless targeting. Necessary interventions are scaled-up immediately (in one school year) in the model, but this may not be feasible in practice. Pre-service teacher training, for example, takes time (a problem that could be eased in some settings by recalling retired teachers). It also assumes constant population growth and no diminution of the marginalisation of the child during the time in school, so that the intervention costs are incurred every year to keep the child in school through primary school completion.
Finally, and perhaps most importantly, there is no consideration of the quality of education and no link to learning outcomes. Improving the quality of education is a critical demand-enhancing intervention in cases where enrolment is deterred by the poor quality of existing schools. Improving quality also reduces repetition and dropout, to which marginalised children and adolescents are most vulnerable. In cases where the quality of education provision is poor as a result of relatively low education spending, it may be appropriate to set the parameters of the analysis to target future levels (for example, a lower pupil-teacher ratio, higher spending on materials per pupil, etc.), rather than current levels.
4.4 ILLUSTRATION: AN EQUITY-BASED APPROACH TO ASSESSING THE COST OF ENROLLING OUT-OF-SCHOOL CHILDREN IN THE DEMOCRATIC REPUBLIC OF THE CONGO
How much would it cost to enrol a country’s out-of-school children in primary education? In this illustration, we apply the model outlined above, with

94 Fixing the Broken Promise of Education for All
an emphasis on equity, to estimate the financial resources required to enrol out-of-school children and adolescents in the Democratic Republic of the Congo, holding as constant the country’s quality of education and its financing shares from government and households. In many countries with a high number of out-of-school children, governments provide an insufficient share of total education financing, leaving households to fund their children’s right to a good quality basic education. In the case of the Democratic Republic of the Congo, the existing situation is characterised by a low share of public financing (with households covering 80% of recurring per-pupil costs) and low per-pupil spending relative to other African countries. Although in calculating the annual cost of enrolment we do not specify sources of financing or model improvements in the quality of education, this analysis could indirectly model increases in both the public share of education financing (by shifting costs between Public Expansion and Household Expansion) and the quality of primary education (by increasing unit costs).
With over 4 million of its 17 million children aged 6 to 13 years out of school, according to a 2012 national household survey (UNICEF and UIS, 2013d), the Democratic Republic of the Congo has one of the highest rates of exclusion from primary and lower secondary education in the world. Indeed, it may account for 3% of the global total of out-of-school children and adolescents of primary and lower secondary age (UNESCO, 2013). The 2012 survey revealed that children in the Democratic Republic of the Congo are out of school because of a variety of the barriers discussed in Chapter 3—particularly high rates of poverty that result in child labour and the distance between the home and the nearest school. Armed conflict is also a major cause of exclusion, as is linguistic fragmentation in a country where 242 languages are spoken.
Table 4.1 shows that two-thirds of out-of-school children in the Democratic Republic of the Congo are expected to enrol in the future (UNICEF and UIS, 2013d). The model focuses on the 519,000 out-of-school children and adolescents who are expected never to enrol and the 830,000 early school leavers, who are certain to require additional financing to ensure they complete their primary education. The analysis that follows projects the annual cost of enrolling these more than 1.3 million out-of-school children and adolescents (n in the cost functions in Box 4.1) through six years of primary school, using the analysis outlined in the previous section.26
Table 4.1 Out-of-school children and adolescents of primary and lower secondary age in the Democratic Republic of the Congo, 2012
Total children aged 6-13 years 17,036,000
Total out-of-school children 4,022,000
Dropped out 830,000
Will never enrol 519,000
Will enrol late 2,673,000
Source: Data from EADE-RDC27 2012 (UNICEF and UIS, 2013d)
We first estimate the Public Expansion cost (see
Table 4.2) using current public expenditure data (for teacher salaries and supplies) from the UIS (2014)28 and capital expenditure data (for rural classrooms, given that 80% of the Democratic Republic of the Congo’s out-of-school children live in rural areas) estimated by the World Bank (2005a).
Teacher training costs are approximated using the estimated unit cost of pedagogical secondary school completion, which is based on statistics from SECOPE (the Democratic Republic of the Congo’s Department for Monitoring the Payment of Teacher Salaries). We assume that classrooms and teachers can be re-purposed for different grade levels as children who were once out of school (a
26 The example assumes that out-of-school children of lower secondary school age did not complete primary school and must, therefore, be enrolled in primary rather than lower secondary education. This is based on the high rate of overage attendance in primary school (60% of primary school-age students are two or more years overage), as well as the short length of lower secondary school (two years) relative to primary school (six years) in the Democratic Republic of the Congo (UNICEF and UIS, 2013d).
27 L’enquête nationale sur la situation des enfants et adolescents en dehors de l’école en République démocratique du Congo.
28 The per-pupil costs presented are not unit costs. They represent total government expenditure divided by the number of children enrolled in school (public and private).
A single child may have multiple profiles linked to marginalisation,
compounding the cost of enrolment

95Findings from the Global Initiative on Out-of-School Children
disproportionate number of whom would start in the first grade) progress through primary school. All costs are normalised by the Democratic Republic of the Congo’s current 37:1 pupil-teacher ratio (p in Box 4.1) (UNESCO, 2013).
Household Expansion cost (see Table 4.3) is estimated based on Verhaghe’s (2013) analysis of statistics from the Ministry of Primary, Secondary and Professional Education (MEPSP).
The total annual expansion cost (Public and Household) for the Democratic Republic of the Congo is estimated at $95.9 million in 2010 US dollars. Assuming that the country’s existing financing for education is unchanged, $51.4 million of that sum would be the responsibility of households. While gradual fee abolition has been underway since 2010, households still provide 54% of total spending on primary and secondary education in the Democratic Republic of the Congo (Verhaghe, 2013). Annual household spending per child in primary school is $38—nearly four times the public per-pupil recurrent
spending on primary education and one-fifth of the gross domestic product (GDP) per capita. This constitutes a significant burden for the poorest households, which earn less than $50 per month and account for 65% of the Democratic Republic of the Congo’s out-of-school children (UNICEF and UIS, 2013d). Transferring the Household Expansion cost to public sources by increasing the share of education expenditure assumed by the government, so that households spend less per pupil on supplies, fees and teacher compensation, would go a long way to enrolling out-of-school children who are currently excluded by financial barriers, while also promoting the right to basic education.
Lowering household spending on education does not reduce the opportunity cost of education, for example through foregone earnings of a child or adolescent (see Section 3.4 on child labour and
school participation). For an estimated 40% of out-of-school children in the Democratic Republic of the Congo, the reduction of Household Expansion costs via increased government spending would be
Table 4.2 Public Expansion cost in the Democratic Republic of the Congo
Annual per-pupil cost (in 2010
constant US$)
Sub-total (in millions
US$) Notes
Temporary classrooms11.93
(annualised)14.1
$2,000 per community classroom. Assumed lifespan is six years, 5% cost of capital. Source: World Bank, 2005a
Permanent classrooms* 23.97
(annualised)4.0
$9,870 per rural classroom. Assumed lifespan is 20 years, 5% cost of capital. Source: World Bank, 2005a
Teacher salaries 8.14 11.0 Based on the UIS, 2014.
Teacher training 11.23 15.1Pre-service training unit costs based on 2012-2013 SECOPE.
Public expenditure on supplies 0.25 0.3Current, non-salary government expenditure, from the UIS, 2014.
Public Expansion total 44.5
Note: * Assumes a 7:1 ratio of temporary-to-permanent classrooms.
Table 4.3 Household Expansion cost in the Democratic Republic of the Congo
Annual per-pupil cost (in 2010
constant US$)
Sub-total (in millions
US$) Source
Supplement to teacher salaries 10.45 14.1 Based on MEPSP (2012), deflated to 2010 constant US$
Household spending on supplies 17.58 23.7Based on MEPSP, deflated to 2010 constant US$. Includes school uniform
Other fees 10.07 13.6School operating fees based on MEPSP (2012) deflated to 2010 constant US$. Includes examination fees
Household Expansion total 51.4

96 Fixing the Broken Promise of Education for All
insufficient to improve enrolment (Verhaghe, 2007). These children require a combination of targeted interventions that goes far beyond expansion costs. According to the 2012 EADE-RDC survey (UNICEF and UIS, 2013d), the main reason for exclusion from education is poverty—69% of households with children out of school cited lack of money as a reason for their non-enrolment, broadly consistent with Verhaghe’s (2007) assertion that 60% of out-of-school children in the Democratic Republic of the Congo could be enrolled by removing financial barriers at the system level. As discussed previously, financial barriers could be addressed by reducing household responsibility for expansion spending. Such spending could also assist the 35% of households that cited distance from school as the reason for non-enrolment, through careful distribution of newly-constructed rural classrooms.
Other barriers identified in the 2012 EADE-RDC survey require targeted interventions. As well as transferring the responsibility of financing the Expansion Cost from households to the government, cash transfers that address the opportunity costs of education could be essential to increase enrolment
in the Democratic Republic of the Congo, especially for the poorest families that rely on children’s contributions to household income. About 4% of respondents identified the need for children’s domestic work and paid labour as reasons for not enrolling, while 6% cited language difficulties in terms of the language of instruction at school. Gender-related barriers to enrolment were not included in the survey, but a large gender gap certainly exists in a few provinces. A further 8% of out-of-school children are excluded because they have a disability or because of poor health and undernutrition, according to the survey. These are all likely to be underestimates of the true level of marginalisation, however, as marginalised children are less likely to be reached by surveys.
Data on the cost of interventions to overcome these barriers are scarce (UNICEF, 2014), especially for the Democratic Republic of the Congo. Table 4.4 shows some illustrative per-pupil costs of targeted interventions, which are not all specific to the Democratic Republic of the Congo and span a wide range of approaches. Specific intervention costs for many groups (children with disabilities, child labourers, orphans and children living or working on the streets) are unavailable, preventing any precise estimation of the Targeted Interventions cost for the Democratic Republic of the Congo. However, assuming that 40% of out-of-school children require targeted interventions (Verhaghe, 2007), an average intervention cost is $18 (based on the subset of interventions in Table 4.4), and 1.5 interventions
After the majority of children who were once out of school pass through
primary education, the annual per-pupil cost falls because capital expansion
spending is no longer required
Table 4.4 Examples of Targeted Intervention costs
Profile
% of out-of-school children
according to EADE-RDC
Possible intervention
Cost estimate (in 2010 constant US$) Source
Children in conflict areas 4.4Emergency education
46.74 per out-of-school child per year
IRC, 2011 (for the Democratic Republic of the Congo)
Children living with disabilities or poor health/nutrition*
6.8
School feeding17.46 per out-of-school child per year
Gelli, 2012 (for 32 developing countries)
Deworming4.04 per out-of-school child per year
Miguel and Kremer, 2004 (for Kenya)
Ethno-linguistic minorities 5.6Mother-tongue instruction
8% of non-capital per-pupil expenses
World Bank, 2005b (for developing countries)
Note: * Calculated by combining the percentages of children for whom disability, undernutrition and poor health were cited as reasons for being out of school. Derived from Table 3, UNICEF and UIS, 2014c.

97Findings from the Global Initiative on Out-of-School Children
per year are needed for each child out of school, a preliminary estimate for the annual Targeted Interventions cost in the Democratic Republic of the Congo is $14.7 million, or 13% of the total $111 million required annually to enrol the country’s out-of-school children (see Table 4.5). This is comparable to the EPDC (2009) estimate that 13% of the cost of expanding access in low-income countries would be devoted to reaching marginalised children, but more data on intervention costs and target group sizes are required to refine this estimate.
Table 4.5 Total estimated annual cost of enrolling 1.3 million out-of-school children and adolescents in the Democratic Republic of the Congo
Expense type
Cost (in million US$) % of total
Source of financing under current financing arrangement
Expansion44.5 40 Public
51.4 46 Households
Targeted Interventions 14.7 13 n/a
TOTAL 110.6 100
Note: Percentages do not sum to 100 due to rounding.
The estimated annual cost of enrolling out-of-school children is $111 million, or $82 per child per year (see Table 4.5). This is higher than current spending ($47 per pupil, based on Verhaghe, 2013 and UIS, 2014) because of the need for capital spending (on classroom construction and teacher training) and targeted interventions to reach marginalised children. After the majority of children who were once out of school pass through primary education, the annual per-pupil cost would fall because capital expansion spending would no longer be required. Raising $111 million would be a significant challenge for the government and supporting donors: it is equivalent to one-quarter of the Democratic Republic of the Congo’s total public spending on education in 2011 and exceeds the foreign aid that the country received for basic education in 2011 by a factor of 1.4 (the Democratic Republic of the Congo receives only 1.5% of global aid to basic education according to OECD Development Assistance Committee aid statistics, even though household survey data indicate that it has 3% of the world’s out-of-school children).
The exercise relies on simplifying assumptions and is incomplete because of the scarcity of data on out-of-school children and interventions for their enrolment. As noted in Chapter 2, household sample surveys may underestimate the number of children who are likely to be marginalised in education—though it must be noted that the EADE-RDC survey in the Democratic Republic of the Congo (UNICEF and UIS, 2013d) was designed explicitly to collect data on out-of-school children and included a special data collection on children who were not living in households: those on the street and in institutions.
The analysis above takes all education parameters as given. Adjusting those parameters to reflect improvements in quality would, of course, further increase the expansion share of the total cost. For example, raising total teacher compensation in the Democratic Republic of the Congo from 3.3 times the GDP per capita to the average for sub-Saharan Africa (3.9 times the GDP per capita) would increase the Expansion Cost to $101 million and the total cost to $116 million. On the other hand, efficiency-enhancing reforms in the Democratic Republic of the Congo, such as reducing the overhead costs associated with administrative bureaus and regulating the growth of teacher numbers, could lower the unit costs of providing education (Verhaghe, 2013) and reduce the expansion cost of enrolling out-of-school children.
Despite these limitations, the case study illustrates the importance of expansive and targeted spending for the enrolment of out-of-school children. Roughly estimated, accounting for Targeted Interventions costs increases the financing required to enrol out-
While expanding existing education infrastructure is necessary to increase enrolment, it is not sufficient in countries like the Democratic Republic of the Congo, where demand-side constraints stop children from accessing basic education

98 Fixing the Broken Promise of Education for All
of-school children in primary education significantly. While expanding existing education infrastructure is necessary to increase enrolment, it is not sufficient in countries like the Democratic Republic of the Congo, where demand-side constraints stop children from accessing basic education. Surveys similar to the EADE-RDC survey conducted in the Democratic Republic of the Congo would allow investigation into the nature of exclusion in other countries that are still a long way from the goal of universal primary attendance and completion, and into the cost of overcoming country-specific barriers through a combination of expansion and targeted spending.
Because they treat all students equally in their costing methodology, most of the earlier and traditional models reviewed in this chapter are likely to underestimate the cost of achieving universal primary education, because they ignore the need for investments that go far beyond the expansion of existing education infrastructure and programmes.
Although stylised, the model presented in this chapter, with its focus on marginalised children and equity, demonstrates the magnitude of financing needs for the enrolment of out-of-school children. It also confirms that those needs are defined by the situation of marginalised children who will not enrol even when the number of school places increases. Many of the world’s out-of-school children are the hardest to reach and face the greatest hurdles in accessing education. The equity-based example of the Democratic Republic of the Congo, while only partial, increases the financing needs far above the costs of basic expansion, especially when children face multiple barriers to education.
4.5 INNOVATIONS IN COSTING AND SIMULATING TARGETED INTERVENTIONS FOR OUT-OF-SCHOOL CHILDREN
The implication that policies based on equity may increase the cost of enrolling the remaining out-of-school children makes it more important than ever to identify the policies that deliver the best results. The SEE initiative was launched by UNICEF and the World Bank in 2011 to create tools to help policymakers select pro-equity, efficient and cost-effective interventions to improve education outcomes, in particular for marginalised children.
The SEE project focused on two main outputs. First, it aimed to shore up the existing evidence on the effectiveness of targeted interventions in developing countries. Over 400 research papers were reviewed and compiled as information sources for effective education interventions. Together, this information provides evidence-based parameters for how different interventions can improve education outcomes—crucial for countries that have only scant information about their own context. Second, the SEE simulation model provides a virtual arena where policymakers can compare the costs and outcomes of intervention options, focusing on the impact on enrolment of specific marginalised groups.
The SEE model allows policymakers to optimise the recommended programmes—including their scale, timing and distribution across risk groups. The exercise starts by entering data into the model: education outcomes for different groups of marginalised children (as identified in reports from the Global Initiative on Out-of-School Children or other studies), the list of proposed interventions, and the parameters for their effectiveness (drawn from the research on programme effectiveness). Next, the policymaker sets hypothetical scenarios and the model computes estimated education improvements based on those inputs. In this way, it is possible to select cost-effective interventions that target the groups in greatest need.
This model provides policymakers with a tool to compare and optimise different strategies and
The Simulations for Equity in Education (SEE) model allows
policymakers to focus their interventions on different groups
of marginalised children, who have different education
outcomes and needs

99Findings from the Global Initiative on Out-of-School Children
interventions. Other planning tools tend to focus on just one path, without inviting policymakers to consider alternate options explicitly. It also allows policymakers to focus their interventions on different groups of marginalised children, who have different education outcomes and needs.
4.6 ILLUSTRATION: COMPARING THE IMPACT OF TARGETED INTERVENTIONS TO ENROL OUT-OF-SCHOOL GIRLS IN THE BALOCHISTAN PROVINCE, PAKISTAN
The Balochistan province in southwest Pakistan has among the highest rates of out-of-school children and gender disparity in the country: 40% of primary school-age boys are not in school and 57% of girls (UNICEF and UIS, 2013b). The lack of schools in rural areas and parents’ reluctance to send girls to school are among the key barriers children face to their schooling, as identified in the Pakistan study conducted within the Global Initiative on Out-of-School Children (UNICEF and UIS, 2013b) and the Balochistan Education Sector Plan (BEPS) (PPIU, 2014). Both reports propose investment in community schools and a strong focus on female teachers for girls. The SEE model shows the benefits of this targeted approach as compared to the current approach of expanding the construction of regular schools in villages (see Table 4.6).
Scenario 1 assumes that Balochistan builds regular schools, staffed with the existing female-to-male teacher ratio of 1:2. The total cost would be US$524 million over the ten-year period from 2014 to 2023
and the new schools would allow 133,000 additional boys to go to school and 146,000 additional girls. In contrast, the community school model in Scenario 2 costs only $356 million, already a considerable financial gain. Furthermore, with its focus on hiring more female teachers, the community model would result in an estimated 236,000 more girls entering school, over 60% more than the gains from the traditional model.29 The results of the SEE model were used by policymakers in the Balochistan Ministry of Education to plan the building of 2,000 schools in remote regions of the province.
4.7 REACHING THE MARGINALISED MAY COST MORE, BUT BETTER DATA AND INNOVATIVE TOOLS CAN HELP US SPEND SMARTER
The innovative models described in this chapter, applied to the Democratic Republic of the Congo and Pakistan, highlight the need for concerted efforts on three fronts in global education.
First, the availability and quality of data on interventions for out-of-school children must continue to improve. In recent years, more comprehensive data on marginalised groups have allowed researchers to depart from the average unit-cost modelling approaches of the early 2000s
29 Scenario 2 assumes that if a teacher in a nearby school is female, the likelihood that a girl will not enter school is reduced by 50%. The estimated effectiveness of the proposed intervention is based on analysis of MICS data from Balochistan, which shows that in villages with a school, as many as one-quarter of girls do not enter, compared to only 13% of girls in villages with community schools with female teachers. A positive effect of female teachers on girls’ school attendance was also observed elsewhere in South Asia, including rural areas of the Indian state of Rajasthan (Banerjee et al., 2001) and Nepal (Bista, 2006).
Table 4.6 Comparison of a system-wide and targeted intervention to improve the enrolment of girls, Balochistan province, Pakistan
Scenario 1: Regular schools with current teacher distribution
Scenario 2: Community schools with greater proportion of female
teachers
Total cost including teachers, 2014-2023 US$524 million US$356 million
Number of new classrooms 12,000 12,000
Female teachers to be recruited 4,000 7,000
Male teachers to be recruited 8,000 5,000
Additional children to enter school, 2014-2023Boys
133,000Girls
146,000Boys
133,000Girls
236,000

100 Fixing the Broken Promise of Education for All
and have enabled the development of improved policy planning tools, such as SEE. More and better data are needed to improve the estimates of the cost and effectiveness of interventions targeted at out-of-school children in developing countries. The most important limitation of the SEE model is that, where no in-country data exist, the parameters for the effectiveness of interventions are extrapolated from pilot studies or experience in other countries. It is likely that actual effectiveness on the ground will differ from these parameters but with careful consideration the differences can be minimised. Statistics and research on policies and interventions to reach marginalised children contribute to informed decisionmaking on resource allocation in the education sector and strengthen advocacy to mobilise the resources needed to achieve universal basic education.
Second, there is a clear need for equity-based approaches to financing education. Despite
the significant progress that has been made over the past two decades, more resources are urgently needed for the most disadvantaged children. Expanding the education system in its current form will not be enough to reduce out-of-school prevalence. Furthermore, recent results from the SEE model in Ghana and Balochistan show that using a pro-equity approach can be more cost-effective than business-as-usual approaches.
Third, the Democratic Republic of the Congo case study in particular underscores the importance of lowering unit costs of education for the poor to make provision financially sustainable. A number of other innovative approaches to reach marginalised children are being piloted worldwide. Continuing to explore, gather cost-effectiveness data and build the evidence base on programming that focuses on all out-of-school children and adolescents are critical to reduce the financing needs for their enrolment and meet—at last—the goal of universal basic education.
101Findings from the Global Initiative on Out-of-School Children
5.1 THE BROKEN PROMISE OF EDUCATION
The work of the Global Initiative on Out-of-School Children, summarised in this report, has confirmed the urgent need to prioritise the world’s unfinished business—out-of-school children and adolescents—in the post-2015 development agenda.
Despite every effort and the impressive progress made on educational access in some countries and regions, the world as a whole has broken a fundamental promise to children: that each and every one of them would be able to complete primary education by 2015. That promise seemed realistic and achievable when it formed part of the Education for All goals and Millennium Development Goals. Yet the world has failed to deliver, leaving 58 million children and 63 million adolescents out of school and unable to reach their full potential (see http://on.unesco.org/oosc-map). Furthermore, progress has stalled and there are serious concerns that unless something changes—and fast—hard-won achievements on primary enrolment could begin to erode.
At the same time, post-2015 discussions are highlighting every country’s need for universal secondary education, which is vital for national economic prosperity and social well-being. Yet many governments are finding that the foundations they have built for universal primary education are not yet strong enough to enrol all children or keep them in the classroom, let alone lift them to the next stage of their schooling.
While efforts to improve national administrative data collection must continue to be a priority, so too must be the continued use of household survey and census data to better identify the characteristics of out-of-school children. Here we can learn from the experience of countries participating in the out-of-school initiative: these data sources are complementary, and harnessing the strengths of a wide range of data sources provides a better understanding of school attendance and learning. As a result of the national studies, many countries identified avenues to improve how data are collected, harmonised and analysed. This underscores the importance of data use as a key driver to improve quality. Using existing data can also encourage improved supply: countries identified an urgent need to close the data gap on the most vulnerable groups of children, who may not be captured by existing data sources. Not enough is known about the extent of school exclusion among children caught up in conflict, on the streets or in slums, and especially those with disabilities.
Meanwhile, education systems and the societies that surround them often reinforce the barriers that marginalise specific groups of children. This report has highlighted the situation of children in conflict-affected countries, for example, who account for just one-fifth of the world’s children of primary school age but one-half of the world’s out-of-school children. It has explored the gender norms and discrimination that leave more girls out of school than boys—particularly the poorest girls in rural areas, and the child labour that undermines learning and often leads to drop-out. The report has shown how the
Conclusions and recommendations
Chapter 5

102 Fixing the Broken Promise of Education for All
lack of schooling in the languages children speak at home can limit their participation in the classroom, and how the right of a child with a disability to an education is so often denied. These barriers often work in combination to keep millions of marginalised children out of school. For those who do enrol, the continuing barriers to their education can become too much to endure and they eventually vanish from the classroom.
It is clear that business-as-usual approaches based on more teachers, more classrooms and more textbooks are not enough to keep the promise of a quality primary education for the most disadvantaged children. These children need targeted interventions to sweep away the barriers to their schooling, once and for all. At the same time, this report has highlighted the need for a long overdue reality check on the scale of the resourcing required to guarantee a basic education for every child, including those children who are the very hardest to reach.
5.2 FIXING THE BROKEN PROMISE
A mix of far-reaching policies to address educational supply and demand
A number of policy recommendations have emerged from countries participating in the Global Initiative on Out-of-School Children, all of which should be underpinned by a revitalised political commitment to universal primary education. While different countries need policies that are tailored to their specific circumstances, every country needs to renew its commitment, backed by the necessary resources—
human and financial—to fix the broken promise of education.
This report has made a distinction between countries that are nearing the goal of universal primary education and those where large proportions—and numbers—of children are still out of school. It argues that those countries in the ‘final mile’ must strive to break down the persistent barriers to education faced by the most marginalised children. Countries with the furthest to travel, on the other hand, must increase their investment in approaches to expand and improve education systems as a whole. In these countries, targeted interventions to reach marginalised children are urgently required but not enough to shore up education systems that are under-resourced, under-staffed and that offer education of poor quality.
The findings from the Global Initiative on Out-of-School Children show that most countries need a policy framework consisting of three priorities: broad investment to strengthen and expand education systems, a sharp focus on inclusion and the quality of the education on offer, and targeted interventions for the children who are the very hardest to reach.
This report sets out a new equity-based costing model to assess the potential scale of the investment needed for universal primary education, recognising that resources are generally limited. The costs may be significant: the report notes that policies based on equity will likely increase the cost of enrolling the remaining out-of-school children, given that any single child may face multiple barriers to education.
While it is difficult to estimate the global amount needed to deliver universal primary education, the report provides equity-focused costing analysis for the Democratic Republic of the Congo. It gives an idea of the scale of resources needed to get every out-of-school child in this one country into the classroom: $111 million each year—equivalent to one-quarter of the Democratic Republic of the Congo’s total public spending on education in 2011. The report concludes that the provision of
Most countries need a policy framework combining three priorities:
broad investment to strengthen and expand education systems, a sharp
focus on inclusion and the quality of the education on offer, and targeted
interventions for the children who are the very hardest to reach

103Findings from the Global Initiative on Out-of-School Children
sustainable universal education requires far greater expenditure—coupled with far more effective use of those resources—than we see today. This makes it more important than ever to sharpen the focus on policies that deliver the best results for the most disadvantaged children. It is encouraging to note that the findings of the equity-based costing models in Ghana and Pakistan’s Balochistan Province show that using pro-equity interventions can be more cost-effective than business-as-usual approaches.
Education systems reflect their wider environments, and what happens outside the school gates will often determine whether or not a child is in the classroom. Measures to ensure inclusion and address the specific barriers to children’s schooling through the reform of education systems can only succeed when matched by measures to address wider disadvantage and to smooth out inequities linked to income poverty, gender, ethnicity, language, geographic location and disability.
Certain key measures have proven to be effective and need to be part of the policy agenda in every country facing the challenge of out-of-school children.
On the supply side, for example, fee abolition is a crucial first step. It needs to be balanced, however, by grants to schools and formula funding that follows students to ensure that schools can cope with the influx of new students that inevitably follows fee abolition. It is important to note that fee abolition alone may not make education affordable for the most marginalised and impoverished families. The hidden costs of sending their children to school—from transportation and uniforms, to textbooks and informal payments to teachers, as well as the lost earnings from child labour—may outweigh the benefits, particularly if the education on offer is of poor quality. It is time to move beyond ‘fee-free’ primary education to ensure that primary education is truly free of charge for all children and their families.
On the demand side, cash transfers to reduce poverty, particularly those that are conditional on school attendance, have boosted enrolment for
all beneficiary children, particularly girls, in parts of Latin America and the Caribbean, South Asia and sub-Saharan Africa. Ideally, such transfers should be linked to improved learning rather than just school attendance in a poorly-resourced school. Moreover, cash transfers will not work in contexts where schools are far and few between and not of good quality. The report makes the case for the scale-up of conditional transfers within the countries where they are already making a difference and their expansion to more countries and regions.
Demand for education is also shaped by the quality of the education on offer. The incentives for families to send their children to school and keep them there are far higher when they are confident that a school has well-trained and motivated teachers, relevant learning materials and high standards, and that their children will emerge with the skills they need for a productive adulthood.
Lastly, even the best policies on out-of-school children will have little impact if delivery and governance systems are weak. In some countries, sound policies are in place, but children and schools on the ground see little of the intended effects due to inefficiency, corruption or low capacity at the local or district level.
Breaking the specific barriers that confront marginalised children
This report has set out measures to break five key barriers to universal basic education.
Conflict. A three-pronged approach is needed to ensure that a good quality education is positioned as part of wider social reforms to prevent conflict, enable schooling to continue during conflict, and ensure that post-conflict education reforms support the economic and social recovery that can prevent a re-ignition of violence.
Gender discrimination. The priority is to ensure that even the most vulnerable and disadvantaged girl has access to a school close to home—a school that meets her most basic needs for safety, privacy and

104 Fixing the Broken Promise of Education for All
cleanliness, that delivers the best possible education and that values her presence and her potential. Boys, too, need support to ensure they stay in school and out of child labour.
Child labour. Child labour must be reduced in order to increase school attendance. Given the strong links between poverty and child work, removing the direct and indirect costs associated with education is the most effective way to reduce child labour. More flexible and responsive education systems and improved learning environments are needed to attract working children into the classroom and keep them there.
Language challenges. Education programmes based on children’s home languages have higher levels of participation, success and enjoyment (as well as parental involvement) and lower levels of repetition and drop-out, especially among girls. Schools that work in languages children can understand allow pupils to participate and demonstrate what they know, and encourage the involvement of their families.
Social, institutional and environmental barriers linked to disability. The education of children with disabilities hinges on the removal of the many barriers that come between them and the chance of an education, from the lack of physical access to classrooms to the stigma that keeps them hidden away at home. It also requires the provision of appropriate support and an understanding of their functioning and needs, all backed by robust and comparable data.
Thinking outside the box: The importance of non-formal education
For many children and adolescents who are out of school, the foundational skills provided through non-formal education (NFE) that takes place outside the mainstream education system, often provided by non-governmental organizations, are indispensable in realising their right to a meaningful education. It can provide a pathway back to regular schooling or even, in some cases, a viable alternative. Findings
from the Global Initiative on Out-of-School Children suggest that it is time for a greater recognition of the importance of non-formal or flexible learning strategies for children who have been denied a mainstream education, as well as its role as a crucible for educational innovation. NFE should no longer be seen as ‘second best’ by policymakers, practitioners and development partners.
A final word on data and partnerships
Children who are excluded from education often face multiple and overlapping disadvantages. If we are to reach them, we need a much clearer picture of who they are, where they are and exactly why they are out of school (see http://on.unesco.org/oosci-global). Without good data, governments are struggling to establish what and where the problems are, and therefore, an effective response is challenging.
This report presents the best available data on the world’s out-of-school children. It argues that the unfinished business of universal primary education and the stagnation in global trends of the number of out-of-school children, as well as the large number of out-of-school adolescents, make it more important than ever to invest in the improved collection and analysis of data on their needs. Given that scarce resources are a political reality, better data are essential to target those resources towards the most severe problems and towards context-relevant interventions that have been shown to be effective.
Policymakers who must decide where and how to spend public financing need solid information on the cost of getting all children into school and the expected impact of the interventions they select to achieve this goal. There is also a pressing need for better data on the specific barriers that confront marginalised children. These include more rapid and flexible assessment of the needs of children caught up in fast-moving conflicts and greater disaggregation of data to see how gender discrimination shapes school attendance and performance. We need closer scrutiny of the ways in which child labour and non-attendance reinforce each other and how the languages children use at

105Findings from the Global Initiative on Out-of-School Children
home can become the languages they use at school. Finally, we need a concerted and global effort to ensure comparable and standardised definitions of disability, based on social rather than medical models, to end the ‘invisibility’ of children with disabilities in the data and in the classroom.
In short, a comprehensive evidence base is the bedrock for effective policies to enrol more children in school and to support them in the successful completion of a full cycle of high-quality basic education.
In every country, the appropriate mix of policies to ensure that every child is in school should be guided by the best available evidence on what is needed and on what works. This report has stressed that the barriers to universal education are complicated and intertwined, and that our ability to deliver a comprehensive response—globally, regionally and nationally—is limited by both a lack of data and a weakness in cross-sectoral coordination among stakeholders.
By providing evidence and recommendations on out-of-school data and policy, the Global Initiative on Out-of-School Children has aimed to build political commitment and action to generate a real and sustained decrease in the numbers of out-of-school children and adolescents worldwide. It has done so by linking data to policy and, very importantly, to the cross-sectoral partnerships needed to address this complex issue.
Ultimately, the responsibility for the information that is needed lies not only with national ministries of education but also with any government ministry that collects data or implements programmes for
vulnerable children. Local governments, schools and communities have a crucial role to play in identifying and providing coordinated support to out-of-school children and those at high risk of dropping out.
International organizations and donors must support this work by improving international definitions of key issues (such as drop-out) as well as the standards used for data collection on out-of-school children. In addition, they must also support the strengthening of national and sub-national education data systems. These actors can also play a crucial role in leveraging the data revolution that is generating technological advances in data collection, processing and analysis. They must ensure that governments are empowered to make the best possible use of these advances. Overall, the international community should draw on the enhanced evidence base to continue to assist governments in developing innovative and inclusive policies and in implementing cost-effective programmes.
Above all, this report has shown that governments, donors and international organizations must make it a priority to bring both financial and human resources to the places and the children with the greatest needs. To make a true breakthrough, it is essential to mobilise the concerted, innovative support needed to reach the most vulnerable children who often go uncounted or unsupported: children with disabilities, in conflict zones or those facing barriers to education due to language, gender or poverty. This will also require strong backing from non-governmental organizations, civil society, the private sector and communities. To put it simply: the world’s out-of-school children have been overlooked for too long—they are now everybody’s business.

106 Fixing the Broken Promise of Education for All

107Findings from the Global Initiative on Out-of-School Children
Adukia, Anjali (2014). Sanitation and Education. Cambridge, MA: Harvard University. Available at: http://scholar.harvard.edu/files/adukia/files/adukia_sanitation_and_education.pdf
Akresh, Richard and Damien de Walque (2008). “Armed Conflict and Schooling: Evidence from the 1994 Rwandan Genocide”. IZA Discussion Paper No. 3516. Bonn: Forschungsinstitut zur Zukunft der Arbeit (Institute for the Study of Labor).
Alderman, Harold, John Hoddinott and Bill Kinsey (2006). “Long Term Consequences of Early Childhood Malnutrition”. Oxford Economic Papers, 58(3): 450–474.
Back on Track and UNICEF (2011). “Education in Emergencies and Post-crisis Transition”. 2012 Consolidated Progress Report to the Government of the Netherlands and The European Commission. New York: Back on Track (The Transition Fund) and UNICEF. Available at: http://www.educationandtransition.org/wp-content/uploads/2011/07/2010_EEPCT_Consolidated_Report_30June2011.pdf
Baird, Sarah, Craig McIntosh and Berk Özler (2011). “Cash or condition? Evidence from a cash transfer experiment”. Quarterly Journal of Economics 126(4): 1709–1753.
Banerjee, Abhijit, Suraj Jacob and Michael Kremer with Jenny Lanjouw and Peter Lanjou (2001). “Promoting School Participation in Rural Rajasthan: Results from Some Prospective Trials”. Mimeo, MIT. Cited in: Barbara Herz and Gene B. Sperling (2004). What Works in Girls’ Education: Evidence and Policies from the Developing World. Washington, D.C.: Council on Foreign Relations.
Benson, Carol (2005). Girls, Educational Equity and Mother Tongue-Based Teaching. Bangkok: UNESCO. Available at: http://www.ungei.org/infobycountry/files/unesco_Girls_Edu_mother_tongue.pdf
Benson, Carol (2014). “School access for children from non-dominant ethnic and linguistic communities”. Background paper for Fixing the Broken Promise of Education For All: Findings from the Global Initiative on Out-of-School Children. Montreal: UNESCO Institute for Statistics.
Bista, Min Bahadur (2006). Status of Female Teachers in Nepal. Kathmandu: UNESCO.
Blattman, Christopher and Jeannie Annan, J. (2009). “The consequences of child soldiering”. Review of Economics and Statistics. November 2010, 92(4): 882–898.
Bozzoli, Carlos, Tilman Brück and Nina Wald (2011). “Self-employment and conflict in Colombia”. DIW Berlin Discussion Paper No. 1098. Available at: http://dx.doi.org/10.2139/ssrn.1767914
BRAC (2012). Children with Special Needs (CSN) (web-page). Available at: http://education.brac.net/children-with-special-needs-csn
Braithwaite, Jeanine and Daniel Mont (2009). “Disability and poverty: A survey of World Bank Poverty Assessments and implications”. ALTER – European Journal of Disability Research 3:219–232. Available at: http://siteresources.worldbank.org/DISABILITY/Resources/280658-1239044853210/5995073-1246917324202/braithwaite_and_mont_final_pub_version_ALTER57.pdf
References
108 Fixing the Broken Promise of Education for All
Brossard, Mathieu and Luc-Charles Gacougnolle (2001). Financing Primary Education for All: Yesterday, Today and Tomorrow. Paris: UNESCO.
Brown, Gordon. (2012). Out of Wedlock, Into School: Combating Child Marriage Through Education. London: The Office of Gordon and Sarah Brown.
Bruns, Barbara, Alain Mingat and Ramahatra Rakotomalala (2003). Achieving Universal Primary Education by 2015: A Chance for Every Child. Washington, D.C.: World Bank.
Bundervoet, Tom and Philip Verwimp (2005). “Civil war and economic sanctions: An analysis of anthropometric outcomes in Burundi”. HiCN Working Paper No. 11. Brighton: Households in Conflict Network. Available at: http://www.hicn.org/wordpress/?page_id=28
Bundervoet, Tom, Philip Verwimp and Richard Akresh (2007). “Civil war, crop failure and child stunting in Rwanda”. Policy Research Working Paper Series 4208. Washington, D.C.: The World Bank.
Bundy, Donald (ed.) (2011). Rethinking School Health: A Key Component of Education for All. Directions in Development. Washington, D.C.: World Bank.
Burde, Dana and Leigh L. Linden (2010). “The effect of village-based schools: Evidence from a randomized controlled trial in Afghanistan”. Working Paper Series No. 18039. Cambridge, MA: National Bureau of Economic Research.
Burnett, Nicholas and Milan Thomas (2013). Exclusion from Education: The Economic Cost of Out-of-School Children in 20 Countries. Washington, D.C.: Results for Development Institute.
Bush, Kenneth and Diana Saltarelli (2000). “The two faces of education in ethnic conflict: Towards a peacebuilding education for children”. Technical Report. UNICEF Innocenti Insight. Florence, Italy: UNICEF Innocenti Research Centre.
Camacho, Adriana (2008). “Stress and birth outcomes: Evidence from terrorist attacks in Colombia”. American Economic Review 98(2): 511–515.
Cambodian National Institute of Statistics (2014). Home page. Available at: http://www.nis.gov.kh/index.php/en/ (Accessed 28 March 2014)
Carr-Hill, Roy (2013). “Missing millions and measuring development progress”. World Development 46(C): 30–44.
Chae, Sophia (2013). “Times of orphanhood, early sexual debut and early marriage in four sub-Saharan countries”. Studies in Family Planning, 44(2): 123–146.
Chamarbagwala, Rubiana and Hilcías E. Morán (2009). “The human capital consequences of civil war: Evidence from Guatemala”. HiCN Working Paper No. 59. Brighton: Households in Conflict Network. Available at: http://www.hicn.org/wordpress/wp-content/uploads/2012/06/wp59.pdf
Chang, Gwang-Chol, Raphaëlle Martinez and Hilaire Mputu (2009). “Estimating the costs of education development—Case study for Democratic Republic of Congo, Nigeria and Sudan for EFA GMR 2010 - Part I: Synthesis report”. Background paper prepared for the EFA Global Monitoring Report 2010. Paris: UNESCO.
Chimbutane, Feliciano (2011). Rethinking Bilingual Education in Postcolonial Contexts. Bristol, UK: Multilingual Matters.
Chimbutane, Feliciano and Carol Benson (2012). “Expanded spaces for Mozambican languages in primary education: Where bottom-up meets top-down”. In McCarty, Teresa and Nancy Hornberger (eds), “Globalization from the bottom up: Indigenous language planning and policy in globalizing spaces and places”. Special issue of the International Multilingual Research Journal, 6(1): 8–21.
Colclough, Christopher, Samer Al-Samarrai, Pauline Rose and Mercy Tembon (2003). Achieving Schooling for All in Africa: Costs, Commitment and Gender. Aldershot, UK: Ashgate.
Consortium for Street Children (2012). “Street children in Brazil”. Briefing to the IPU. London: Consortium for Street Children.

109Findings from the Global Initiative on Out-of-School Children
Cummins, Jim (2009). “Fundamental psycholinguistic and sociological principles underlying educational success for linguistic minority students.” In Skutnabb-Kangas, Tove; Robert Phillipson, Ajit K. Mohanty and Minati Panda (eds), Social Justice Through Multilingual Education, pp 19–35. Bristol, UK: Multilingual Matters.
Delamonica, Enrique, Santosh Mehrotra and Jan Vandemoortele (2001). “Is EFA affordable? Estimating the global minimum cost of education for all”. Innocenti Working Paper 87. Florence, Italy: UNICEF.
Devarajan, Shantayanan, Margaret Miller and Eric V. Swanson (2002). “Goals for development: History, prospects and costs”. Policy Research Working Paper No. 2819. Washington, D.C.: World Bank.
DFID Nigeria (2011). Girls Education Project Phase 3 (GEP3), Business Case. Lagos: UK Department for International Development.
Edmeades, Jeffrey and Robin Hayes, with Gillian Gaynair (2014). Improving the Lives of Married Adolescent Girls in Amhara, Ethiopia. Washington, D.C.: ICRW.
Education Policy and Data Center and UNESCO. (2009). “Estimating the costs of achieving Education for All in low income countries”. Background Paper prepared for the EFA Global Monitoring Report 2010. Paris: UNESCO.
Equality Now (2014). Protecting the Girl Child. Using the Law to End Child, Early and Forced Marriage and Related Human Rights Violations. New York: Equality Now.
Field, Erica and Attila Ambrus (2008). “Early marriage, age of menarche, and female schooling attainment in Bangladesh”. Journal of Political Economy, 116(5): 881–930.
Filmer, Deon (2005). “Disability, poverty, and schooling in developing countries: Results from 11 household surveys”. World Bank Social Protection Discussion Paper No. 0539. Washington, D.C.: World Bank.
Foko, Borel, Beifith Kouak Tiyab and Guillaume Husson (2012). Household Education Spending: An Analytical and Comparative Perspective for 15 African Countries. Dakar: UNESCO.
Gakidou, Emmanuela, Krycia Cowling, Rafael Lozano and Christopher J.L. Murray (2010). “Increased educational attainment and its effect on child mortality in 175 countries between 1970 and 2009: A systematic analysis”. The Lancet, 376(9745): 959–974.
Garcia, Marito and Charity M.T. Moore (2012). The Cash Dividend: The Rise of Cash Transfer Programs in Sub-Saharan Africa. Washington, D.C.: World Bank.
Gelli, Aulo (2012). Food for Education Works: A Review of WFP FFE Monitoring and Evaluation 2002-2006. Rome: World Food Programme.
Ghana MoE (Ministry of Education) (2013). Education Sector Performance Report 2013. Accra: Ghana. Available at: http://www.moe.gov.gh/docs/ESPR%202013%20Final%20August.pdf (Accessed October 2014).
Glewwe, Paul, Meng Zhao and Melissa Binder (2006). Achieving Universal Basic and Secondary Education: How Much Will It Cost? Cambridge MA: American Academy of Arts and Sciences.
Glick, Peter (2008). “What policies will reduce gender schooling gaps in developing countries: Evidence and interpretation,” World Development, 36(9): 1623–1646.
Global Partnership for Education (n.d.). Children with Disabilities (web page). Available at: http://www.globalpartnership.org/focus-areas/children-with-disabilities (Accessed 23 June 2014)
Global Partnership for Education (2012). Results for Learning. Washington, D.C.: Global Partnership for Education.
Graham, Natasha (2014). “Children with disabilities”. Background paper prepared for Fixing the Broken Promise of Education for All: Findings from the Global Initiative on Out-of-School Children. Montreal: UNESCO Institute for Statistics.

110 Fixing the Broken Promise of Education for All
Greene, Margaret, Omar Robles, Krista Stout and Tanya Suvilaakso (2013). A Girl’s Right to Learn Without Fear: Working to End Gender-Based Violence at School. Woking, UK: Plan International. Available at: https://www.plan.org.au/~/media/Documents/Research%20and%20Reports/Plan%20Report%20-%20A%20girls%20right%20to%20learn%20without%20fear.ashx
Guerrero-Serdan, Gabriela (2009). “The effects of the war in iraq on nutrition and health: An analysis using anthropometric outcomes of children”. HiCN Working Paper No. 55. Brighton: Households in Conflict Network. Available at: http://www.hicn.org/wordpress/wp-content/uploads/2012/06/wp55.pdf
Guichaoua, Yvan (2009). “How do ethnic militias perpetuate in Nigeria? A micro-level perspective on the Oodua People’s Congress”. MICROCON Reasearch Working Paper No. 19. MICROCON, EU Integrated Project on Micro-Level Analysis of Violent Conflicts. Brighton, UK: Institute of Development Studies. Available at: http://www.microconflict.eu/publications/RWP19_YG.pdf
Gustafsson-Wright, Emily and Hnin Hnin Pyne (2002). “Gender dimensions of child labor and street children in Brazil”. World Bank Policy Research Working Paper. Washington, D.C.: World Bank.
Hattori, Hiroyuki (2014). “Demographic and socioeconomic determinants of school attendance: An analysis of household survey data”. Background paper prepared for Fixing the Broken Promise of Education for All: Findings from the Global Initiative on Out-of-School Children. Montreal: UNESCO Institute for Statistics.
Herz, Barbara and Gene B. Sperling (2004). What Works in Girls’ Education: Evidence and Policies from the Developing World. New York: Council on Foreign Relations.
Heugh, Kathleen (2011). “Cost implications of the provision of mother-tongue and strong bilingual models of education in Africa.” In Ouane, Adama and Christine Glanz (eds), Optimising Learning, Education and Publishing in Africa: The Language Factor, pp 255-289. Hamburg, Germany: UNESCO. Available at: http://unesdoc.unesco.org/images/0021/002126/212602e.pdf
Heugh, Kathleen, Carol Benson, Berhanu Bogale and Mekonnen Alemu Gebre Yohannes (2007). “Final report: Study on medium of instruction in primary schools in ethiopia”. Addis Ababa: Ministry of Education. Available at: http://www.everythingharar.com/publication/4379_Heugh_Studyonmediumofinstruction.pdf
Heugh, Kathleen, Carol Benson, Mekonnen Alemu Gebre Yohannes and Berhanu Bogale (2012). “Implications for multilingual education: Student achievement in different models of education in Ethiopia.” In Skutnabb-Kangas, Tove and Kathleen Heugh (eds), Multilingual Education and Sustainable Diversity Work From Periphery to Center, pp 239-262. New York: Routledge.
Hovens, Mart (2002). “Bilingual education in West Africa: Does it work?” International Journal of Bilingual Education and Bilingualism 5(5): 249-266.
Huebler, Friedrich (2008). “Child labour and school attendance: Evidence from MICS and DHS surveys”. Paper presented at the Seminar on child labour, education and youth employment. Understanding Children’s Work Project, Madrid, 11-12 September.
Humphreys, M. and Weinstein, J. (2008). “Who fights? The determinants of participation in civil war”. American Journal of Political Science, 52(2): 436–455.
ICWAC (2000). “Caught in the crossfire no more: A framework for commitment to war-affected children”. Summary by the Chairs of the Experts’ Meeting 13-15 Sept. 2000. Winnipeg: The International Conference on War-Affected Children.
ILO (2009). “Report of the Conference” 18th International Conference of Labour Statisticians, Geneva, 24 November-5 December 2008”. ICLS/18/2008/IV/FINAL. Geneva: ILO. Available at: http://www.ilo.org/wcmsp5/groups/public/@dgreports/@stat/documents/meetingdocument/wcms_101467.pdf.
ILO-IPEC (2013). Marking Progress Against Child Labour—Global Estimates and Trends 2000-2012. International Labour Office, International Programme on the Elimination of Child Labour (IPEC). Geneva: ILO. Available at: http://www.ilo.org/ipec/Informationresources/WCMS_221513/lang--en/index.htm
111Findings from the Global Initiative on Out-of-School Children
International Rescue Committee (2011). International Rescue Committee in the Democratic Republic of Congo: Annual Report 2011. New York: International Rescue Committee.
IRIN (2007). “Ethiopia: Surviving forced marriage”. Available at: http://www.irinnews.org/report/69993/ethiopia-surviving-forced-marriage (Accessed 23 June 2014)
Jacoby, Hanan G. and Emmanuel Skoufias (1997). “Risk, financial markets, and human capital in a developing country”. Review of Economic Studies, 64(3): 311-335.
Jensen, Robert, T. (2010). “Economic opportunities and gender differences in human capital: Experimental evidence for India”. NBER Working Paper No. 16021. Cambridge, MA: National Bureau of Economic Research.
Jomaa, Lamis H., Elaine McDonnell and Claudia Probart (2011). “School feeding programs in developing countries: Impacts on children’s health and educational outcomes”. Nutrition Reviews, 69(2): 83-98.
Justino, Patricia (2011). “Violent conflict and human capital accumulation”. CRPD Working Paper 8. Leuven, Belgium: Centre for Research on Peace and Development, University of Leuven. Available at: https://soc.kuleuven.be/web/files/12/80/wp08.pdf
Justino, Patricia (2012). “Shared societies and armed conflict: Costs, inequality and the benefits of peace”. IDS Working Papers, 410: 1-23.
Justino, Patricia (2014). “Barriers to education in conflict-affected countries and policy opportunities”. Background paper prepared for Fixing the Broken Promise of Education for All: Findings from the Global Initiative on Out-of-School Children. Montreal: UNESCO Institute for Statistics.
Justino, Patricia, Marinella Leone and Paola Salardi (2013). “Short- and long-term impact of violence on education: The case of Timor Leste”. World Bank Economic Review, 28(2): 320-353.
Kazianga, Harounan, Dan Levy, Leigh L. Linden and Matt Sloan (2012). “The effects of girl-friendly schools: Evidence from the BRIGHT school construction program in Burkina Faso”. Research Working Paper No. 18115. Cambridge, MA: National Bureau of Economic Research.
Kosonen, Kimmo (2006). “Multi-grade teaching among ethnic minority children: The language issue.” In Cornish, Linley (ed.), Reaching EFA Through Multi-Grade Teaching: Issues, Contexts and Practices, pp 239-258. Armidale: Kardoorair Press.
Kosonen, Kimmo and Carol Benson (2013). “Introduction: Inclusive teaching and learning through the use of non-dominant languages and cultures.” In Benson, Carol and Kimmo Kosonen (eds), Language Issues in Comparative Education: Inclusive teaching and learning in non-dominant languages and cultures, pp 1-16. Rotterdam: Sense.
Lockheed, Marlaine and Maureen Lewis (2012). “Addressing primary and secondary education for socially excluded girls.” In Heymann, Jody and Adèle Cassola (eds), Lessons in Educational Equity: Successful Approaches to Intractable Problems Around the World, pp 116-141. New York: Oxford University Press.
López, Luis Enrique (2005). De Resquicios a Boquerones: La Educación Intercultural Bilingüe en Bolivia. La Paz: PROEIB Andes.
Mathur, Sanyukta, Margaret Greene and Anju Malhotra (2003). Too Young To Wed: The Lives, Rights and Health of Young Married Girls. Washington, D.C.: International Center for Research on Women.
Mbude-Shale, Naledi, Zola Wababa and Peter Plüddemann (2004). “Developmental research: A dual-medium schools pilot project, Cape Town, 1999-2002.” In Brock-Utne, Birgit, Zubeida Desai and Martha Qorro (eds), Researching the Language of Instruction in Tanzania and South Africa, pp 151-168. Cape Town: African Minds.
Merrouche, Ouarda (2006). “The human capital cost of landmine contamination in Cambodia”. HiCN Working Paper 25. Brighton: Households in Conflict Network. Available at: http://www.hicn.org/wordpress/wp-content/uploads/2012/06/wp25.pdf

112 Fixing the Broken Promise of Education for All
Miguel, Edward and Michael Kremer (2004). “Worms: Identifying impacts on education and health”. Econometrica, 72(1): 159-217.
Mmari, Kristin and Simran Sabherwal (2014). “A review of risk and protective factors for adolescent sexual and reproductive health in developing countries: An update”. Journal of Adolescent Health, 53(5): 562-572.
Montjourides, Patrick (2013). “Education data in conflict-affected countries: The fifth failure?” Prospects, 43(1): 85–105. Paris: UNESCO. Available at: http://dx.doi.org/10.1007/s11125-012-9260-8
Mooijman, Annemarieke, Caroline van den Berg, Lene Odum Jensen and Donald Bundy (2005). Toolkit on Hygiene, Sanitation and Water in Schools. Washington, D.C.: World Bank.
Nath, Samir R. (2002). “The transition from non-formal to formal education: The case of BRAC, Bangladesh”. International Review of Education, 48(6): 517-524.
Nega, Abeyot (2012). “Improving education quality, equity and access in Ethiopia: Findings from the young lives school component”. Ethiopia Policy Brief 1. Addis Ababa: Young Lives in Ethiopia. Addis Ababa: UK Aid and the Ministry of Foreign Affairs, Netherlands. Available at: http://www.younglives.org.uk/files/policy-papers/yl-ethiopia-pb1-education
Nguyen, Minh Cong and Quentin Wodon (2014a). “Analysing the gender gap in education attainment: A simple framework with application to Ghana”. Journal of International Development, 26(1): 59-76.
Nguyen, Minh Cong and Quentin Wodon (2014b). “Estimating the impact of child marriage on literacy and education attainment in Africa.” In Wodon, Quentin (ed.), Child Marriage and Education. Washington, D.C.: The World Bank.
Nordstrum, Lee E. (2013). “Teacher supply, training and cost in the context of rapidly expanding enrolment: Ethiopia, Pakistan and Tanzania”. Background paper prepared for the EFA Global Monitoring Report 2013/2014. Paris: UNESCO.
Norwegian Refugee Council (1999). Global IDP Project of the Norwegian Refugee Council. Available at: http://www.internal-displacement.org
Nyamukapa, Constance and Simon Gregson (2005). “Extended family’s and women’s roles in safeguarding orphans’ education in AIDS-afflicted rural Zimbabwe”. Social Science and Medicine, 60(10): 2155-2167.
OCHA (2013). Financial Tracking Service (FTS). OCHA, Cited in UNICEF and UIS (2014), Regional Report on Middle East and North Africa. Global Initiative on Out-of School Children. Amman: UNICEF and UNESCO Institute for Statistics.
OCHA (2014). Occupied Palestinian Territory: Gaza Emergency. Humanitarian Snapshot. Available at: http://www.ochaopt.org/documents/humanitarian_snapshot_13july2014_opt_v1.pdf (Accessed 13 July 2014)
OECD Development Assistance Committee Statistics (2014). Available at: http://stats.oecd.org (Accessed July 2014)
OHCHR (2014). “Nigeria: UN and African experts call for immediate release of abducted girls and accountability of perpetrators”. Press release 8 May 2014. Geneva: Office of the High Commissioner for Human Rights. Available at: http://www.ohchr.org/EN/NewsEvents/Pages/DisplayNews.aspx?NewsID=14577&LangID=E
O’Malley, Brendan (2007). Education Under Attack: A Global Study on Targeted Political and Military Violence Against Education Staff, Students, Teachers, Union and Government Officials, and Institutions. Paris: UNESCO.
O’Malley, Brendan (2010). Education Under Attack: A Global Study on Targeted Political and Military Violence Against Education Staff, Students, Teachers, Union and Government Officials, and Institutions. Paris: UNESCO.
Ouane, Adama and Christine Glanz (eds) (2011). Optimising Learning, Education and Publishing in Africa: The Language Factor, pp 255–289. Hamburg and Tunis Belvédère: UNESCO and the Association for the Development of Education in Africa (ADEA) / African Development Bank. Available at: http://unesdoc.unesco.org/images/0021/002126/212602e.pdf
Parlow, Anton (2012). “Armed conflict and children’s health. Exploring new directions: The case of Kashmir”. MPRA Paper No. 38033. Munich: Munich Personal RePEc Archive.

113Findings from the Global Initiative on Out-of-School Children
Plan (2008). Paying the Price: The Economic Cost of Failing to Educate Girls. Woking: Plan International.
Porter, Gordon (1995). “Organisation of schooling: Achieving access and equality through inclusion”. Prospects, 25(2): 299-309.
PPIU, Education Department, Government of Balochistan (2014). Balochistan Education Sector Plan 2013-2018. Quetta, Pakistan. Available at: http://www.globalpartnership.org/content/education-sector-plan-2013-2018-balochistan-province-pakistan
Psacharopoulos, George and Harry Anthony Patrinos (2002). “Returns to investment in education: A further update”. World Bank Policy Research Working Paper 2881. Washington, D.C.: World Bank.
Rodriguez, Catherine and Fabio Sanchez (2009). “Armed conflict exposure, human capital investments and child labor: Evidence from Colombia”. HiCN Working Paper No. 68. Brighton: Households in Conflict Network. Available at: http://www.hicn.org/wordpress/wp-content/uploads/2012/06/wp68.pdf
Rosati, Furio and Lorenzo Guarcello (2014). “Child labour and out of school children: Evidence from 25 developing countries”. Background paper and study prepared for Fixing the Broken Promise of Education for All: Findings from the Global Initiative on Out-of-School Children. Montreal: UNESCO Institute for Statistics.
Salmon, Lizette and Quentin Wodon (2014). “Children living in the streets.” In Wodon, Quentin (ed.), Education and Highly Vulnerable Groups. Washington, D.C.: The World Bank.
Santos, Ricardo (2014). “Post-conflict returns to education: The case of Timor Leste”. Unpublished PhD thesis. Brighton: Institute of Development Studies.
Schroeder, Leila (2013). “Teaching and assessing independent reading skills in multilingual African countries: Not as simple as ABC.” In Benson, Carol and Kimmo Kosonen (eds), Language Issues in Comparative Education: Inclusive Teaching and Learning in Non-Dominant Languages and Cultures, pp 245–264. Rotterdam: Sense.
Schultz, T. Paul (2002). “Why governments should invest more to educate girls”. World Development, 30(2): 207–225.
Shemyakina, Olga (2011). “The effect of armed conflict on accumulation of schooling: Results from Tajikistan”. Journal of Development Economics 95(2): 186–200.
Sigdel, Shailendra (2014). “Process behind selecting and calculating out-of-school children estimates in India”. Background paper prepared for Global Report on Out-of-School Children. Montreal: UNESCO Institute for Statistics.
Skutnabb-Kangas, Tove (2000). Linguistic Genocide in Education—Or Worldwide Diversity and Human Rights? Mahwah N.J.: Lawrence Erlbaum.
Skutnabb-Kangas, Tove and Kathleen Heugh (eds) (2012). Multilingual Education and Sustainable Diversity Work From Periphery to Center. New York: Routledge.
Smith, Amy Erica (2014). “What perpetuates child servitude? Public opinion on children’s domestic labor in Haiti”. AmericasBarometer Insights, 103. Available at: http://www.vanderbilt.edu/lapop/insights/IO903en.pdf
Smith, Lisa C. and Lawrence Haddad (2000). Explaining Child Malnutrition in Developing Countries: A Cross-Country Analysis. Washington, D.C.: International Food Policy Research Institute. Available at: http://www.ifpri.org/sites/default/files/pubs/pubs/abstract/111/rr111.pdf
Social & Rural Research Institute of IMRB International (SRI-IMRB) (2009). All India Survey of Out-Of-School Children of Age 5 and in 6-13 Years Age Group. Noida, Uttar Pradesh, India: Educational Consultants India Ltd.
Soe-Lin, Shan, Tae Min Kim, Milan Thomas, Julian Schweitzer, Robert Hecht (2014). How to Close the Gap on MDGs 4 & 5 in Africa. Washington, D.C.: Results for Development Institute.

114 Fixing the Broken Promise of Education for All
Sommer, Marni (2010). “Where the education system and women’s bodies collide: The social and health impact of girls’ experiences of menstruation and schooling in Tanzania”. Journal of Adolescence, 33(4): 521–529.
Stromquist, Nelly (2014). “Out-of-school children: Why gender matters”. Background paper prepared for Fixing the Broken Promise of Education for All: Findings from the Global Initiative on Out-of-School Children. Montreal: UNESCO Institute for Statistics.
Thakre, Subhash B., Sushama S. Thakre, Monica Reddy, Nidhi Rathi, Ketaki Pathak and Suresh Ughade (2011). “Knowledge and practice among adolescent girls in Saoner, Nagpur District”. Journal of Clinical and Diagnostic Research, 5(5): 1027-1033.
Thomas, Gary, David Walker and Julie Webb (eds) (1998). The Making of the Inclusive School. London: Routledge.
Understanding Children’s Work (2013). Child Labour and Out-of-School Children: Evidence from 25 Developing Countries. Rome: Understanding Children’s Work, an Interagency Research Cooperation Project.
UNESCO (1953). “The use of vernacular languages in education. Report of the UNESCO meeting of specialists (1951). Monographs on Fundamental Education VIII.” Paris: UNESCO.
UNESCO (2003). Gender and Education for All, The Leap to Equality: EFA Global Monitoring Report. Paris: UNESCO.
UNESCO (2007). Advocacy Kit for Promoting Multilingual Education: Including the Excluded. Bangkok: UNESCO. Available at: http://www.unescobkk.org/education/multilingual-education/resources/mle-advocacy-kit/
UNESCO (2010a). “The quantitative impact of conflict on education”. Background paper for EFA Global Monitoring Report 2011. Paris: UNESCO.
UNESCO (2010b). Reaching the Marginalized. EFA Global Monitoring Report. Paris: UNESCO. Available at: http://unesdoc.unesco.org/images/0018/001866/186606E.pdf
UNESCO (2011). The Hidden Crisis: Armed Conflict and Education. EFA Global Monitoring Report. Paris: UNESCO.
UNESCO (2012). From Access to Equality: Empowering Girls and Women through Literacy and Secondary Education. Paris: UNESCO.
UNESCO (2013). “Children still battling to go to school”. EFA GMR policy paper 10. Paris: UNESCO. Available at: http://unesdoc.unesco.org/images/0022/002216/221668E.pdf
UNESCO (2014a). “Aid reductions threaten education goals”. EFA GMR policy paper 13. Paris: UNESCO. Available at: http://unesdoc.unesco.org/images/0022/002280/228057E.pdf
UNESCO (2014b). Teaching and Learning: Achieving Quality for All. EFA Global Monitoring Report 2013/4. Paris: UNESCO.
UNESCO Institute for Statistics (UIS) (2005). Children Out of School: Measuring Exclusion from Primary Education. Montreal: UNESCO Institute for Statistics.
UNESCO Institute for Statistics (UIS) (2006). International Standard Classification of Education (ISCED 1997). Montreal: UIS. Available at: http://www.uis.unesco.org/Library/Documents/isced97-en.pdf
UNESCO Institute for Statistics (UIS) (2010). Global Education Digest 2010: Comparing Education Statistics Across the World—Special Focus on Gender. Montreal: UIS.
UNESCO Institute for Statistics (UIS) (2011a). Global Education Digest 2011: Comparing Education Statistics Across the World—Focus on Secondary Education. Montreal: UIS.
UNESCO Institute for Statistics (UIS) (2011b). Financing Education in Sub-Saharan Africa: Meeting the Challenges of Expansion, Equity and Quality. Montreal: UIS. Available at: http://dx.doi.org/10.15220/978-92-9189-079-2-en

115Findings from the Global Initiative on Out-of-School Children
UNESCO Institute for Statistics (UIS) (2012a). International Standard Classification of Education (ISCED) 2011. Montreal: UIS. Available at: http://dx.doi.org/10.15220/978-92-9189-123-8-en
UNESCO Institute for Statistics (UIS) (2012b). Opportunities Lost: The Impact of Grade Repetition and Early School Leaving—Global Education Digest 2012. Montreal: UIS. Available at: http://dx.doi.org/10.15220/978-92-9189-120-7-en
UNESCO Institute for Statistics (UIS) (2014). UIS Data Centre (website). Available at: http://data.uis.unesco.org. (Accessed August 2014)
UNESCO Institute for Statistics (UIS) and Education for All Global Monitoring Report (EFA GMR) (2014a). “Progress in getting all children to school stalls, but some countries show the way forward”. GMR Policy Paper 14, UIS Fact Sheet 28. Paris: UNESCO. Available at: http://unesdoc.unesco.org/images/0022/002281/228184e.pdf
UNESCO Institute for Statistics (UIS) and Education for All Global Monitoring Report (EFA GMR) (2014b). “Wanted: Trained teachers to ensure every child’s right to primary education”. GMR Policy Paper 15, UIS Fact Sheet 30. Paris: UNESCO. Available at: http://unesdoc.unesco.org/images/0022/002299/229913E.pdf
UNFPA (2006). Sexual Violence Against Women and Girls in War and Its Aftermath: Realities, Responses, and Required Resources. New York: UNFPA.
UNHCR (2014). War’s Human Cost. Global Trends 2013. Geneva: UNHCR. Available at: http://www.unhcr.org/5399a14f9.html (Accessed 24 June 2014)
UNHCR and OSCE (2002). Ninth Assessment of the Situation of Ethnic Minorities in Kosovo (31 May 2002). New York and Vienna: United Nations High Commissioner for Refugees and Organization for Security and Cooperation in Europe (UNHCR/OSCE).
UNICEF (1999). Children Orphaned by AIDS: Front-Line Responses from Eastern and Southern Africa. New York: UNICEF.
UNICEF (2007a). The State of the World’s Children: Women and Children, the Double Dividend of Gender Equality. New York: UNICEF.
UNICEF (2007b). UNICEF Education Strategy. New York: United Nations Economic and Social Council.
UNICEF (2009). All Children, Everywhere: A Strategy for Basic Education and Gender Equity. New York: UNICEF.
UNICEF (2011a). “Situation analysis of children and women in Nigeria”. 2011 Update. Lagos: UNICEF Nigeria. Available at: http://www.unicef.org/nigeria/SITAN_UNICEF_Nigeria_2011_FINAL_2012_Sept.pdf
UNICEF (2011b). “The right of children with disabilities to education: A rights-based approach to inclusive education in the CEE/CIS region”. Background Note. Geneva: UNICEF Regional Office for Central and Eastern Europe and the Commonwealth of Independent States (CEE/CIS). Available at: http://www.unicef.org/ceecis/Background_NoteFINAL(1).pdf
UNICEF (2013a). Children with Disabilities. The State of the World’s Children 2013. New York: UNICEF.
UNICEF (2013b). Equitable Access (web-page). Available at: http://www.unicef.org/education/bege_61657.html
UNICEF (2013c). Girls’ Education and Gender Equality (web-page). Available at: http://www.unicef.org/education/bege_70640.html
UNICEF (2013d). Summary of Midterm Review of Country Programs: Central and Eastern Europe and the Commonwealth of Independent States region. New York: UNICEF Executive Board.
UNICEF (2014a). Child Labour and UNICEF in Action: Children at the Centre. New York: UNICEF.
UNICEF (2014b). Every Child Counts: The State of the World’s Children 2014 in Numbers. New York: UNICEF.

116 Fixing the Broken Promise of Education for All
UNICEF (2014c). Strengthening Statistics on Children with Disabilities: UNICEF’s Work and Planned Activities. New York: UNICEF.
UNICEF (2014d). Thematic Report 2013: Basic Education and Gender Equality. New York: UNICEF.
UNICEF global databases (2014). Available at: http://www.data.unicef.org
UNICEF and Asociación Civil Educación para Todos (2011). Caracterización del perfil de la exclusión al año 2011—República de Honduras: Breve compendio de indicadores para la identificación de los cuellos de botella en la cobertura, el acceso y la progresión de la escolaridad. Tegucigalpa: UNICEF/Asociación Civil Educación para Todos.
UNICEF and UIS (2011). Bolivia Country Study. Global Initiative on Out-of-School Children. La Paz: UNICEF and the UNESCO Institute for Statistics (UIS). Available at: http://dx.doi.org/10.15220/uis-unicef-cntry-bolivia-2011-sp
UNICEF and UIS (2012a). Brasil: Acesso, permanência, aprendizagem e conclusão da Educação Básica na idade certa—Direito de todas e de cada uma das crianças e dos adolescentes. Global Initiative on Out-of-School Children. Brasilia: UNICEF and the UNESCO Institute for Statistics (UIS). Available at: http://dx.doi.org/10.15220/uis-unicef-cntry-brasil-2012-po
UNICEF and UIS (2012b). Completar la Escuela: Un Derecho para Crecer, un Deber para Compartir. América Latina y el Caribe. Global Initiative on Out-of-School Children. Panamá: UNICEF and the UNESCO Institute for Statistics (UIS). Available at: http://dx.doi.org/10.15220/978-92-806-4653-5-sp
UNICEF and UIS (2012c). Estudio de País: Colombia: Construcción de una Política Nacional para Mejorar la Retención y el Acceso de Estudiantes al Sistema Educativo. Global Initiative on Out-of-School Children. Bogota: UNICEF and the UNESCO Institute for Statistics (UIS). Available at: http://dx.doi.org/10.15220/978-958-8514-41-3-sp
UNICEF and UIS (2012d). Ghana Country Study. Global Initiative on Out-of-School Children. Accra: UNICEF and the UNESCO Institute for Statistics (UIS). Available at: http://dx.doi.org/10.15220/uis-unicef-cntry-ghana-2012-en
UNICEF and UIS (2012e). Kyrgyzstan Country Study. Global Initiative on Out-of-School Children. Bishkek: UNICEF and the UNESCO Institute for Statistics (UIS). Available at: http://dx.doi.org/10.15220/978-9967-26-912-5-en
UNICEF and UIS (2012f). Nigeria Country Study. Conducted within the Conceptual and Methodology Framework (CMF). Global Initiative on Out-of-School Children. Lagos: UNICEF and the UNESCO Institute for Statistics (UIS). Available at: http://dx.doi.org/10.15220/uis-unicef-cntry-nigeria-2012-en
UNICEF and UIS (2012g). Romania Country Study: Analysing the Situation of Out-of-School Children in Romania. Global Initiative on Out-of-School Children. Islamabad: UNICEF and the UNESCO Institute for Statistics (UIS). Available at: http://dx.doi.org/10.15220/uis-unicef-cntry-romania-2012-en
UNICEF and UIS (2012h). Turkey Country Study. Global Initiative on Out-of-School Children. Ankara: UNICEF and the UNESCO Institute for Statistics (UIS). Available at: http://dx.doi.org/10.15220/978-92-806-4725-9-en
UNICEF and UIS (2013a). Education Equity Now! A Regional Analysis of the Situation of Out-of-School Children in Central and Eastern Europe and the Commonwealth of Independent States. Global Initiative on Out-of-School Children. Geneva: UNICEF and the UNESCO Institute for Statistics (UIS). Available at: http://dx.doi.org/10.15220/uis-unicef-reg-cee/cis-2013-en
UNICEF and UIS (2013b). Out-of-School Children in the Balochistan, Khyber Pakhtunkhwa, Punjab and Sindh Provinces of Pakistan. Global Initiative on Out-of-School Children. Islamabad: UNICEF and the UNESCO Institute for Statistics (UIS). Available at: http://dx.doi.org/10.15220/uis-unicef-cntry-balochistan-2013-en
UNICEF and UIS (2013c). Out-of-School Children in Sri Lanka. Global Initiative on Out-of-School Children. Colombo: UNICEF and the UNESCO Institute for Statistics (UIS). Available at: http://dx.doi.org/10.15220/uis-unicef-cntry-sri-lanka-2013-en
UNICEF and UIS (2013d). Rapport de l’enquête nationale sur les enfants et adolescents en dehors de l’école [République Démocratique du Congo]. Global Initiative on Out-of-School Children. Kinshasa: UNICEF and the UNESCO Institute for Statistics (UIS). Available at: http://dx.doi.org/10.15220/uis-unicef-cntry-congo-2013-fr

117Findings from the Global Initiative on Out-of-School Children
UNICEF and UIS (2013e). Tajikistan Country Study. Global Initiative on Out-of-School Children. Dushanbe: UNICEF and the UNESCO Institute for Statistics (UIS). Available at: http://dx.doi.org/10.15220/uis-unicef-cntry-tajikistan-2013-en
UNICEF and UIS (2014a). Eastern and Southern Africa Regional Report. Global Initiative on Out-of-School Children. Nairobi: UNICEF and the UNESCO Institute for Statistics (UIS). Available at: http://dx.doi.org/10.15220/uis-unicef-reg-esar-2014-en
UNICEF and UIS (2014b). Regional Report on Middle East and North Africa. Global Initiative on Out-of-School Children. Amman: UNICEF and the UNESCO Institute for Statistics (UIS).
UNICEF and UIS (2014c). Regional Report: West and Central Africa. Global Initiative on Out-of-School Children. Dakar: UNICEF and the UNESCO Institute for Statistics (UIS). Available at: http://dx.doi.org/10.15220/uis-unicef-reg-wca-2014-en
UNICEF and UIS (2014d) South Asia Regional Study: Covering Bangladesh, India, Pakistan and Sri Lanka. Global Initiative on Out-of-School Children. Kathmandu: UNICEF and the UNESCO Institute for Statistics (UIS). Available at: http://dx.doi.org/10.15220/978-9937-8215-6-8-en
UNICEF and UIS (2014e forthcoming). Ethiopia Country Study. Global Initiative on Out-of-School Children: Ethiopia country study. Addis Ababa: UNICEF and the UNESCO Institute for Statistics (UIS).
UNICEF and UIS (2014f forthcoming). Framework for Monitoring Out-of-School Children and Adolescents in the ECA Region, Geneva: UNICEF Regional Office for Central and Eastern Europe and the Commonwealth of Independent States.
UNICEF and UIS (2014g forthcoming). OOSCI Zambia Country Report. Lusaka: UNICEF and the UNESCO Institute for Statistics (UIS).
UNICEF and UIS (2014h). OOSCI Viet Nam Country Report. Hanoi: UNICEF and the UNESCO Institute for Statistics.
UNICEF and University of Wisconsin (2008). Monitoring Child Disability in Developing Countries. Results from the Multiple Indicator Cluster Surveys. New York: UNICEF.
UNICEF and World Bank (2013). Simulations for Equity in Education (SEE): Background, Methodology, and Pilot Results. New York: UNICEF.
UNICEF and World Bank (2013b). Simulations for Equity in Education (SEE): Model Description and User’s Guide. New York: UNICEF.
United Nations (2005). Security Council Resolution 1612 (2005) on Children and Armed Conflict. Available at: http://www.un.org/ga/search/view_doc.asp?symbol=S/RES/1612(2005)
United Nations (2006). United Nations Convention on the Rights of Persons with Disabilities. New York: United Nations.
United Nations (2010). “Report of the special representative of the Secretary-General for children and armed conflict (A/65/219)”. New York: United Nations General Assembly. Available at: http://www.refworld.org/docid/4c8f2d922.html
United Nations (2011). “Selected examples: Best practices at the international, regional, subregional and national levels for including persons with disabilities in development efforts.” New York: United Nations.
United Nations (2013). Education First: The United Nations Secretary-General’s initiative to ensure quality, relevant and transformative education for everyone. New York: United Nations. Available at: http://www.globaleducationfirst.org/files/EdFirst_G29383UNOPS_lr.pdf
United Nations (2014). Disabilities web page. Available at: http://www.un.org/disabilities/default.asp?navid=13&pid=1514 (accessed 5 August 2014).
UNODC (2014). Global Study on Homicide 2013, pp 22– 24. Vienna: UNODC. Available at: http://www.unodc.org/documents/gsh/pdfs/2014_GLOBAL_HOMICIDE_BOOK_web.pdf

118 Fixing the Broken Promise of Education for All
Unterhalter, Elaine, Amy North, Madeleine Arnot, Cynthia Lloyd, Lebo Moletsane, Erin Murphy-Graham, Jenny Parkes and Mioko Saito (2014). “Interventions to enhance girls’ education and gender equality”. Education Rigorous Literature Review. London: Department for International Development. Available at: http://r4d.dfid.gov.uk/pdf/outputs/HumanDev_evidence/Girls_Education_Literature_Review_2014_Unterhalter.pdf
USAID (2007). “Role of education and the demobilization of child soldiers”. Issue Paper No. 1. Washington, D.C.: USAID.
Valente, Christine (2011). “Children of the revolution: Fetal and child health amidst violent civil conflict”. Health, Econometrics and Data Group (HEDG) Working Paper 11/12. York: University of York.
Vawda, Ayesha Yaqub, and Harry Anthony Patrinos (1999). “Producing educational materials in local languages: Costs from Guatemala and Senegal”. International Journal of Educational Development 19: 287-299.
Verhaghe, Johan (2007). “School fee practice and policy in the DRC: Frais de fonctionnement ou fonds de famille?” Kinshasa. Unpublished manuscript.
Verhaghe, Johan (2013). “La gratuité de l’enseignement primaire en République démocratique du Congo face aux défis structurels”. Congo-Afrique LIIème 478.
Walter, Stephen (2013). “Exploring the development of reading in multilingual education programs”. In Benson, Carol and Kimmo Kosonen (eds), Language Issues in Comparative Education: Inclusive teaching and learning in non-dominant languages and cultures, pp 265-281. Rotterdam: Sense.
Walter, Stephen and Carol Benson (2012). “Language policy and medium of instruction in formal education”. In Spolsky, Bernard (ed.) The Cambridge Handbook of Language Policy, pp 278-300. Cambridge: Cambridge University Press.
Watkins, Kevin (2013). Education without Borders: A Report from Lebanon on Syria’s Out-of-School Children. A World at School.
Wodon, Quentin (ed.) (2014). Child Marriage and Education. Washington, D.C.: The World Bank.
World Bank (2002). Achieving Education for All by 2015: Simulation Results for 47 Low-Income Countries. Washington, D.C.: Human Development Network, Africa Region and Education Department, World Bank.
World Bank (2004). Books, Buildings and Learning Outcomes: An Impact Evaluation of World Bank Support to Basic Education in Ghana. Washington, D.C.: World Bank.
World Bank (2005a). Education in the Democratic Republic of Congo: Priorities and Options for Regeneration. World Bank Country Study. Washington, D.C.: World Bank.
World Bank (2005b). “Education for All: In their own language”. World Bank Education Note. Washington, D.C.: World Bank.
World Bank (2007). “Measuring disability prevalence”. SP Discussion Paper No. 0706. Washington, D.C.: World Bank p.1.
World Bank (2009). Abolishing School Fees in Africa: Lessons from Ethiopia, Ghana, Kenya, Malawi, and Mozambique. Washington, D.C.: World Bank.
World Bank (2011). World Development Report: Conflict, Security and Development. Washington, D.C.: International Bank for Reconstruction and Development and The World Bank.
World Bank (2013). Rwanda Education Resilience Case Report. Washington, D.C.: World Bank. Available at: http://www-wds.worldbank.org/external/default/WDSContentServer/WDSP/IB/2013/05/14/000445729_20130514145339/Rendered/PDF/776820WP0CR0Rwanda0Box0342041B00PUBLIC0.pdf
WHO (2001). International Classification of Functioning, Disability and Health (ICF). Geneva: WHO.
WHO (2007). International Classification of Functioning, Disability and Health for Children and Youth (ICF-CY). Geneva: WHO.

119Findings from the Global Initiative on Out-of-School Children
WHO (2011). “Early marriages, adolescent and young pregnancies”. Report by the Secretariat. Geneva: Executive Board, WHO.
WHO (2012). “Early childhood development and disability”. Discussion paper. Geneva: WHO.
WHO (2013). “Disability and health”. Factsheet, No. 352. Geneva: WHO. Available at: http://www.who.int/mediacentre/factsheets/fs352/en/
WHO and World Bank. (2011). World Report on Disability. Geneva: World Health Organization. Available at: http://www.who.int/disabilities/world_report/2011/en/ (accessed 25 July 2014).
Wils, Anababette (2014). “Simulations for Equity in Education”. Background paper prepared for Fixing the Broken Promise of Education for All: Findings from the Global Initiative on Out-of-School Children. Montreal: UNESCO Institute for Statistics.
Yasunaga, Mari (2014). “Non-formal education as a means to meet learning needs of out-of-school children and adolescents”. Background Paper prepared for Fixing the Broken Promise of Education for All: Findings from the Global Initiative on Out-of-School Children. Montreal: UNESCO Institute for Statistics.

120 Fixing the Broken Promise of Education for All

121Findings from the Global Initiative on Out-of-School Children
SUB-SAHARAN AFRICAEastern and Southern Africa, West and Central Africa, Djibouti, Sudan
Eastern and Southern AfricaAngola, Botswana, Burundi, Comoros, Eritrea, Ethiopia, Kenya, Lesotho, Madagascar, Malawi, Mauritius, Mozambique, Namibia, Rwanda, Seychelles, Somalia, South Africa, South Sudan, Swaziland, Uganda, United Republic of Tanzania, Zambia, Zimbabwe
West and Central AfricaBenin, Burkina Faso, Cabo Verde, Cameroon, Central African Republic, Chad, Congo, Côte d’Ivoire, Democratic Republic of the Congo, Equatorial Guinea, Gabon, Gambia, Ghana, Guinea, Guinea-Bissau, Liberia, Mali, Mauritania, Niger, Nigeria, Sao Tome and Principe, Senegal, Sierra Leone, Togo
MIDDLE EAST AND NORTH AFRICAAlgeria, Bahrain, Djibouti, Egypt, Iran (Islamic Republic of), Iraq, Jordan, Kuwait, Lebanon, Libya, Morocco, Oman, Palestine, Qatar, Saudi Arabia, Sudan, Syrian Arab Republic, Tunisia, United Arab Emirates, Yemen
SOUTH ASIAAfghanistan, Bangladesh, Bhutan, India, Maldives, Nepal, Pakistan, Sri Lanka
EAST ASIA AND THE PACIFICBrunei Darussalam, Cambodia, China, Cook Islands, Democratic People’s Republic of Korea, Fiji, Indonesia, Kiribati, Lao People’s Democratic Republic, Malaysia, Marshall Islands, Micronesia (Federated States of), Mongolia, Myanmar, Nauru, Niue, Palau, Papua New Guinea, Philippines, Republic of Korea, Samoa, Singapore, Solomon Islands, Thailand, Timor-Leste, Tonga, Tuvalu, Vanuatu, Viet Nam
LATIN AMERICA AND THE CARIBBEANAnguilla, Antigua and Barbuda, Argentina, Barbados, Belize, Bolivia (Plurinational State of), Brazil, British Virgin Islands, Chile, Colombia, Costa Rica, Cuba, Dominica, Dominican Republic, Ecuador, El Salvador, Grenada, Guatemala, Guyana, Haiti, Honduras, Jamaica, Mexico, Montserrat, Nicaragua, Panama, Paraguay, Peru, Saint Kitts and Nevis, Saint Lucia, Saint Vincent and the Grenadines, Suriname, Trinidad and Tobago, Turks and Caicos Islands, Uruguay, Venezuela (Bolivarian Republic of)
UNICEF regional classification
Appendix I

122 Fixing the Broken Promise of Education for All
CENTRAL AND EASTERN EUROPE AND THE COMMONWEALTH OF INDEPENDENT STATES (CEE/CIS)Albania, Armenia, Azerbaijan, Belarus, Bosnia and Herzegovina, Bulgaria, Croatia, Georgia, Kazakhstan, Kyrgyzstan, Montenegro, Republic of Moldova, Romania, Russian Federation, Serbia, Tajikistan, The former Yugoslav Republic of Macedonia, Turkey, Turkmenistan, Ukraine, Uzbekistan
WESTERN EUROPE, NORTH AMERICA AND AUSTRALASIA*
Andorra, Australia, Austria, Belgium, Canada, Cyprus, Czech Republic, Denmark, Estonia, Finland, France, Germany, Greece, Holy See, Hungary, Iceland, Ireland, Israel, Italy, Japan, Latvia, Liechtenstein, Lithuania, Luxembourg, Malta, Monaco, Netherlands, New Zealand, Norway, Poland, Portugal, San Marino, Slovakia, Slovenia, Spain, Sweden, Switzerland, United Kingdom, United States
* The category ‘Western Europe, North America and Australasia’ is not an official UNICEF region, but it is used in this report to group all countries not belonging to other UNICEF regions. It includes countries in which UNICEF does not operate, primarily high- and upper-middle-income countries in Australasia, Europe and North America.

123Findings from the Global Initiative on Out-of-School Children
Attendance data. Data on school participation collected with household surveys or population censuses. According to the most common measure, pupils or students who have attended a given grade or level of education at least one day during the academic reference year are counted as attending school.
Educational attainment. The highest ISCED level of education an individual has successfully completed. This is usually measured with respect to the highest educational programme successfully completed, which is typically certified by a recognised qualification.
Education finance
All staff compensation as % of total expenditure in public institutions. Compensation for all staff (teachers and non-teachers) expressed as a percentage of direct expenditure in public educational institutions (instructional and non-instructional) of the specified level of education. Financial aid to students and other transfers are excluded from direct expenditure. Staff compensation includes salaries, contributions by employers for staff retirement programmes, and other allowances and benefits.
Current expenditure other than staff compensation as % of total expenditure in public institutions. Current expenditure other than for staff compensation expressed as a percentage of direct expenditure in public educational institutions (instructional and non-instructional) of the specified level of education. Financial aid to students and other transfers are excluded from direct expenditure. Current expenditure other than for staff compensation includes expenditure on school books and teaching materials, ancillary services (e.g. food and transport), and administration and other support activities.
Expenditure by level of education as % of total government expenditure on education. Expenditure on education by ISCED level, expressed as a percentage of total general government expenditure on education.
Expenditure on education as % of GDP (from government sources). Total general (local, regional and central) government expenditure on education (current, capital and transfers), expressed as a percentage of GDP.
Expenditure on education as % of total government expenditure (all sectors). Total general (local, regional and central) government expenditure on education (current, capital and transfers), expressed as a percentage of total general government expenditure on all sectors (including health, education, social services, etc.). It includes expenditure funded by transfers from international sources to the government.
Definitions
Appendix II

124 Fixing the Broken Promise of Education for All
Government expenditure per student as % of GDP per capita. Average total general government expenditure (current, capital and transfers) per student in the given level of education, expressed as a percentage of GDP per capita.
Enrolment data. Data on school participation from administrative records on pupils or students officially registered in a given grade or level of education, regardless of age.
Gross domestic product (GDP). The sum of gross value added by all resident producers in the economy, including distributive trades and transport, plus any product taxes, minus any subsidies not included in the value of the products.
Gross domestic product (GDP) per capita. The gross domestic product divided by mid-year population.
Gross intake ratio to the last grade of primary education. Total number of new entrants in the last grade of primary education, regardless of age, expressed as a percentage of the population at the theoretical entrance age to the last grade of primary education. The ratio can exceed 100% if many over- or under-aged children enter the last grade of primary education as a result of early or late entry into primary school and grade repetition.
International Standard Classification of Education (ISCED). A classification system that provides a framework for the comprehensive statistical description of national educational systems and a methodology that translates national educational programmes into internationally comparable levels of education (levels 0 to 6 according to ISCED 1997). The basic unit of classification in ISCED is the educational programme. ISCED also classifies programmes by field of study, programme orientation and destination.
ISCED level 0: Pre-primary education. Programmes at the initial stage of organized instruction, primarily designed to introduce very young children, aged at least 3 years, to a school-type environment and provide a bridge between home and school. Programmes classified at this level are variously referred to as infant education, nursery education, pre-school education or kindergarten.
ISCED level 1: Primary education. Normally designed to give pupils a sound basic education in reading, writing and mathematics. Main criteria include beginning of systematic studies characteristic of primary education, e.g. reading, writing and mathematics; entry into the nationally designated primary institutions or programmes. The commencement of reading activities alone is not a sufficient criterion for classification of an educational programme at ISCED level 1.
ISCED level 2: Lower secondary education. The lower secondary level of education generally continues the basic programmes of the primary level, although teaching is typically more subject-focused, often employing more specialised teachers who conduct classes in their field of specialisation. Main criteria include: programmes at the start of level 2 correspond to the point where programmes are beginning to be organised in a more subject-oriented pattern, more specialised teachers are conducting classes in their field of specialisation.
ISCED level 3: Upper secondary education. Programmes at ISCED level 3 are typically designed to complete secondary education in preparation for tertiary education or provide skills relevant to employment, or both. Programmes at this level offer studies more varied, specialised and with in-depth instruction than

125Findings from the Global Initiative on Out-of-School Children
programmes at lower secondary education (ISCED level 2). They are more differentiated, with an increased range of options and streams available.
Non-formal education. Education that is institutionalised, intentional and planned by an education provider. The defining characteristic of non-formal education is that it is an addition, alternative and/or complement to formal education within the process of the lifelong learning of individuals. It is often provided to guarantee the right of access to education for all. It caters to people of all ages but does not necessarily apply a continuous pathway-structure; it may be short in duration and/or low-intensity, and it is typically provided in the form of short courses, workshops or seminars. Non-formal education mostly leads to qualifications that are not recognised as formal or equivalent to formal qualifications by the relevant national or sub-national education authorities or to no qualifications at all. Non-formal education can cover programmes contributing to adult and youth literacy and education for out-of-school children, as well as programmes on life skills, work skills, and social or cultural development.
Number of out-of-school adolescents of lower secondary school age. Number of adolescents of official lower secondary school age who are not enrolled in primary or secondary education.
Number of out-of-school children of primary school age. Number of children of official primary school age who are not enrolled in primary or secondary education.
Out-of-school adolescents. Adolescents of official lower secondary school age who are not in primary or secondary education. Adolescents in pre-primary or non-formal education are considered out of school.
Out-of-school children. Children of official primary school age who are not in primary or secondary education. Children in pre-primary education or non-formal education are considered out of school.
Percentage of out-of-school adolescents of lower secondary school age. Number of adolescents of official lower secondary school age who are not enrolled in primary or secondary education, expressed as a percentage of the population of official lower secondary school age.
Percentage of out-of-school children of primary school age. Number of children of official primary school age who are not enrolled in primary or secondary education, expressed as a percentage of the population of official primary school age. Children enrolled in pre-primary education are considered out of school.
Percentage of out-of-school children of primary school age enrolled in pre-primary education. Number of children of official primary school age who are enrolled in pre-primary education, expressed as a percentage of the population of official primary school age.
Pupil-teacher ratio. Average number of pupils per teacher at a given level of education, based on headcounts of both pupils and teachers.
Second-chance education. Education specifically targeted at individuals who never attended school, left school either before completion of the level of education in which they were enrolled, or completed the level but wish to enter an education programme or occupation for which they are not yet qualified. Participants are often older than the typical target age group for the given ISCED level programme (but not necessarily adults). Sometimes also referred to as ‘bridging programmes’ or ‘re-integration programmes’.

126 Fixing the Broken Promise of Education for All
Special needs education. Education designed to facilitate learning by individuals who require additional support and adaptive pedagogical methods in order to participate and meet learning objectives in an education programme. Reasons may include (but are not limited to) disadvantages in physical, behavioural, intellectual, emotional and social capacities. Programmes in special needs education may follow a similar curriculum as that offered in the parallel regular education system, but they take individual needs into account by providing specific resources (e.g. specially-trained personnel, equipment or space) and, if appropriate, modified educational content or learning objectives. These programmes can be offered to individual students within already-existing education programmes or as a separate class in the same or separate educational institutions.
For more definitions, refer to the multilingual UIS online glossary at http://www.uis.unesco.org/Pages/Glossary.aspx

127Findings from the Global Initiative on Out-of-School Children
METHODOLOGY FOR ESTIMATING OUT-OF-SCHOOL CHILDREN
The UIS generates estimates of the number of out-of-school children for two age groups: children of primary school age and adolescents of lower secondary school age. The age ranges used for primary and lower secondary education in each country are based on the International Standard Classification of Education (ISCED). Within each age group, only children in formal primary or secondary education are counted as in school. Children in pre-primary education or in non-formal education are considered out of school.
The out-of-school rate is calculated as the proportion of children not enrolled in primary or secondary education. Example: the official primary school age range in a country is 6 to 11 years. Of 100 children aged 6 to 11 years, 80 are enrolled in primary education and 5 are enrolled in secondary education. 85 children of primary school age are in school and 15 are out of school. The primary out-of-school rate is then 15/100=15%.
The absolute number of out-of-school children and adolescents at the national, regional and global levels is calculated by subtracting the number of primary and lower secondary school-age children and adolescents enrolled in primary and secondary education at the national, regional and global levels from estimates of the population of primary and lower secondary school age by the United Nations Population Division.
This methodology was also used for the national and regional studies in the Global Initiative on Out-of-School Children.
GLOBAL AND REGIONAL AVERAGE METHODOLOGY
Although the UIS and UNICEF use different sources of data on school participation, the basic methodology used for the calculation of regional averages of the out-of-school rate is similar. Regional averages of the out-of-school rate are calculated as weighted averages of national out-of-school rates. National populations of primary school age (lower secondary school age) are used as weights during the calculation of the regional percentage of children of primary school age (adolescents of lower secondary school age) out of school.
Both the UIS and UNICEF have developed regional average methodology to account for cases of missing data. The UIS, which uses administrative data, provides an explanation of the methodology to calculate regional averages on its website: http://www.uis.unesco.org/Education/Pages/FAQ.aspx. UNICEF, which uses household survey data, publishes regional estimates only if the countries with available data in that region cover at least 50% of the corresponding regional population. More information is provided in Appendix IV.
Reader’s guide
Appendix III

128 Fixing the Broken Promise of Education for All
REFERENCE PERIOD
The reference year for the administrative data used for out-of-school children estimates is the academic year ending in 2012 or the most recent year available within the period 2010 to 2013. Where a given reference period is spread across two calendar years, the later year is cited. For example, the school year 2011/2012 is presented as 2012.
The reference period for the household survey data used for out-of-school children estimates is within the period 2008 to 2013.
DATA SOURCES
Administrative data
The UIS compiles education statistics in aggregate form from official administrative sources at the national level. These include data on educational programmes, access, participation, progression, completion, internal efficiency, and human and financial resources. They cover:
• education in pre-primary, primary and secondary schools, and in colleges, universities and other tertiary education institutions;
• education in public (or state) and private sectors; and• special needs education (both in regular and special schools).
These data are collected annually by the UIS and its partner agencies through the following three major surveys: the UIS education survey; the UNESCO, Organisation for Economic Co-operation and Development (OECD), Eurostat (Statistical Office of the European Union) (UOE) Education Data Collection; and the World Education Indicators (WEI) programme. The questionnaires for the UIS, UOE and WEI surveys can be downloaded from the UIS website: http://www.uis.unesco.org/UISQuestionnaires
Household survey data
Multiple Indicator Cluster Surveys (MICS) are initiated by UNICEF to assist countries in collecting and analysing data for monitoring the situation of children and women. More detailed information on MICS is available at http://www.data.unicef.org
The Demographic and Health Surveys (DHS) are designed to collect, analyse and disseminate nationally-representative data on population, health, HIV and nutrition in less-developed countries. More detailed information on DHS is available at http://www.dhsprogram.com
For other data sources of national household surveys used by UNICEF in the statistical annex and analytical chapters, please visit http://www.data.unicef.org
For other data sources used by the country and regional reports on the Global Initiative on Out-of-School Children, please visit http://www.allinschool.org

129Findings from the Global Initiative on Out-of-School Children
Population data
UIS and UNICEF estimates use population data from the 2012 revision of the World Population Prospects by the United Nations Population Division. For more information on UN Population Division estimates, please visit http://www.un.org/esa/population
Some national OOSCI studies used national population estimates. For more information see http://www.allinschool.org
Economic data
Data on economic indicators, such as gross domestic product (GDP) and purchasing power parity (PPP), are based on the World Bank’s economic data release of September 2013. Data for total government expenditure are based on the International Monetary Fund World Economic Outlook, with some additional data sourced from national ministries of education.
Conflict data
Countries are classified as conflict-affected based on the EFA Global Monitoring Report (UNESCO, 2014b).
Other data
Other data from national and regional Global Initiative on Out-of-School Children studies can be referenced from the OOSCI website: http://www.allinschool.org, which features an up-to-date list of all published studies and analysis on out-of-school children and children at risk of dropping out.
Data presented in the analytical chapters may not always be included in the statistical tables but can be referenced at the UIS Data Centre (http://www.uis.unesco.org/datacentre) and the UNICEF global statistical databases (http://www.data.unicef.org), which include data on child health, survival, development, education and protection.
TECHNICAL NOTE
This report features out-of-school children estimates calculated from both administrative and household survey sources. As discussed in Chapter 2, administrative records and household surveys are two data sources which differ in fundamental ways: who collects the data, as well as how, when and for what purpose. As a result, the out-of-school children estimates calculated from one data source may not match those based on other data sources.

130 Fixing the Broken Promise of Education for All

131Findings from the Global Initiative on Out-of-School Children
LIST OF STATISTICAL TABLES
A.1 OUT-OF-SCHOOL CHILDREN / Primary and lower secondary school age / Administrative data / 2012A.2 OUT-OF-SCHOOL CHILDREN / Primary school age / Household survey data / 2008-2013
THE FOLLOWING SYMBOLS AND FOOTNOTES ARE USED IN THE STATISTICAL TABLES
Symbol Interpretation
… No data available
* National estimation
** For country data: UIS estimationFor regional data: Partial imputation due to incomplete country coverage (between 33% and 60% of population)
– Magnitude nil or negligible
a Data refer to the most recent year available during the period specified in the column heading
+n Data refer to the school or financial year n years after the reference year
-n Data refer to the school or financial year n years prior to the reference year
x Data refer to years or periods other than those specified in the column heading. Such data are not included in the calculation of regional and global averages, with the exception of 2005-2006 data from India and 2006 data from Brazil. Estimates from years prior to 2000 are not displayed
y Data differ from the standard definition or refer to only part of a country. If they fall within the noted reference period, such data are included in the calculation of regional and global averages
Statistical tables
Appendix IV

132 Fixing the Broken Promise of Education for All
Country or territory
Age group Out-of-school children of primary school ageOut-of-school adolescents of lower secondary school age
Pri
mar
y
(ISC
ED
1)
Low
er
Sec
ond
ary
(IS
CE
D 2
)
Out-of-school rate (%)Number out
of school
Share of children of primary school age enrolled in pre-
primary education (%) Out-of-school rate (%)Number out of
school
MF M F MF (000) % F MF M F MF M F MF (000) % F(1) (2) (3) (4) (5) (6) (7) (8) (9) (10) (11) (12) (13) (14) (15)
Afghanistan 7-12 13-15 ... ... ... ... ... ... ... ... ... ... ... ... ...
Albania 6-10 11-14 ... ... ... ... ... ... ... ... ... ... ... ... ...
Algeria 6-10 11-14 1 ... ... 25 ... ... ... ... ... ... ... ... ...
Andorra 6-11 12-15 ... ... ... ... ... ... ... ... ... ... ... ... ...
Angola 6-11 12-14 14 -1 3 -1 26 -1 513 -1 89 -1 4 -1 3 -1 5 -1 12 **, -2 ... ... 166 **, -2 ...
Anguilla 5-11 12-14 ... ... ... ... ... — -1 — -1 — -1 ... ... ... ... ...
Antigua and Barbuda 5-11 12-14 15 13 16 2 55 1 1 1 25 35 15 1 30
Argentina 6-11 12-14 ... ... ... ... ... ... ... ... 1 -1 ... ... 20 -1 ...
Armenia 6-9 10-14 ... ... ... ... ... ... ... ... ... ... ... ... ...
Aruba 6-11 12-13 1 -2 ... ... 0.1 -2 ... — -2 — -2 — -2 ... ... ... ... ...
Australia 5-11 12-15 3 3 3 61 44 2 ... ... 2 2 3 28 51
Austria 6-9 10-13 ... ... ... ... ... ... ... ... ... ... ... ... ...
Azerbaijan 6-9 10-14 11 * 10 * 12 * 54 * 52 * 3 * 3 * 3 * 13 * 12 * 13 * 85 * 49 *
Bahamas 5-10 11-13 2 -2 ... ... 1 -2 ... ... ... ... 9 -2 11 -2 7 -2 2 -2 38 -2
Bahrain 6-11 12-14 ... ... ... ... ... ... ... ... 10 10 9 5 46
Bangladesh 6-10 11-13 4 *, -2 6 *, -2 2 *, -2 621 *, -2 20 *, -2 — *, -2 — *, -2 — *, -2 22 *, -2 30 *, -2 15 *, -2 2,206 *, -2 32 *, -2
Barbados 5-10 11-13 3 *, -1 3 *, -1 3 *, -1 1 *, -1 54 *, -1 2 *, -1 3 *, -1 2 *, -1 7 *, -1 ... ... 1 *, -1 ...
Belarus 6-9 10-14 6 6 ** 6 ** 20 48 ** 5 6 5 2 ... ... 9 ...
Belgium 6-11 12-13 1 1 1 7 47 1 1 1 ... ... ... ... ...
Belize 5-10 11-14 1 2 — 0.4 11 — — — 3 2 4 1 66
Benin 6-11 12-15 5 ... ... 83 ... — ... ... ... ... ... ... ...
Bermuda 5-10 11-13 12 -1 13 -1 12 -1 1 -1 47 -1 — -1 — -1 — -1 19 -1 23 -1 14 -1 0.4 -1 36 -1
Bhutan 6-12 13-16 8 10 7 8 40 ... ... ... 14 18 10 8 35
Bolivia 6-11 12-13 13 -1 13 -1 13 -1 194 -1 48 -1 — -1 — -1 — -1 10 -1 10 -1 10 -1 47 -1 50 -1
Bosnia and Herzegovina 6-10 11-14 ... ... ... ... ... ... ... ... ... ... ... ... ...
Botswana 6-12 13-15 ... ... ... ... ... ... ... ... ... ... ... ... ...
Brazil 7-10 11-14 ... ... ... ... ... ... ... ... ... ... ... ... ...
British Virgin Islands 5-11 12-14 15 *, -1 13 *, -1 16 *, -1 0.5 *, -1 56 *, -1 4 *, -1 4 *, -1 4 *, -1 6 *, -1 4 *, -1 9 *, -1 0.1 *, -1 68 *, -1
Brunei Darussalam 6-11 12-13 4 4 5 2 55 3 3 3 — ... ... — ...
Bulgaria 7-10 11-14 4 4 3 9 47 — — — 10 10 9 24 46
Burkina Faso 6-11 12-15 33 32 35 917 52 … … … 50 47 53 784 52
Burundi 7-12 13-16 6 -2 6 -2 6 -2 81 -2 51 -2 — -2 — -2 — -2 31 -2 28 -2 35 -2 264 -2 57 -2
Cambodia 6-11 12-14 2 — 3 29 90 — — — ... ... ... ... ...
Cameroon 6-11 12-15 8 3 14 295 83 — — — ... ... ... ... ...
Canada 6-11 12-13 ... ... ... ... ... … … … ... ... ... ... ...
Cabo Verde 6-11 12-14 3 1 4 2 78 — — — 8 7 8 2 52
Cayman Islands 5-10 11-13 ... ... ... ... ... ... ... ... ... ... ... ... ...
Central African Rep. 6-11 12-15 28 19 36 194 66 . . . 54 43 66 229 61
Chad 6-11 12-15 36 -1 28 -1 44 -1 770 -1 61 -1 — -1 — -1 — -1 ... ... ... ... ...
Chile 6-11 12-13 7 7 7 109 49 2 2 2 3 3 4 18 52
TABLE A.1. OUT-OF-SCHOOL CHILDREN / Primary and lower secondary school age / Administrative data / 2012

133Findings from the Global Initiative on Out-of-School Children
Country or territory
Age group Out-of-school children of primary school ageOut-of-school adolescents of lower secondary school age
Pri
mar
y
(ISC
ED
1)
Low
er
Sec
ond
ary
(IS
CE
D 2
)
Out-of-school rate (%)Number out
of school
Share of children of primary school age enrolled in pre-
primary education (%) Out-of-school rate (%)Number out of
school
MF M F MF (000) % F MF M F MF M F MF (000) % F(1) (2) (3) (4) (5) (6) (7) (8) (9) (10) (11) (12) (13) (14) (15)
China 7-11 12-14 ... ... ... ... ... ... ... ... ... ... ... ... ...
China, Hong Kong SAR 6-11 12-14 1 * 1 * 2 * 5 * 67 * — — — 8 * 7 * 9 * 16 * 55 *
China, Macao SAR 6-11 12-14 ... ... ... ... ... ... ... ... 13 14 13 2 47
Colombia 6-10 11-14 14 13 14 599 49 … … … 7 8 7 263 46
Comoros 6-11 12-15 ... ... ... ... ... ... ... ... ... ... ... ... ...
Congo 6-11 12-15 8 12 4 56 26 — — — ... ... ... ... ...
Congo, DR 6-11 12-13 ... ... ... ... ... … … … ... ... ... ... ...
Cook Islands 5-10 11-14 3 * ... ... — * ... ... ... ... 13 * 11 * 14 * 0.2 * 55 *
Costa Rica 6-11 12-14 7 8 7 33 45 — 1 — 12 13 12 30 48
Côte d'Ivoire 6-11 12-15 ... ... ... ... ... ... ... ... ... ... ... ... ...
Croatia 7-10 11-14 1 2 - 2 11 — — — 1 ... ... 2 ...
Cuba 6-11 12-14 3 4 3 28 46 — — — — — 1 2 95
Curaçao 6-11 12-13 … … … … … … … … … … … … …
Cyprus 6-11 12-14 2 * 2 * 2 * 1 * 44 * 1 * 1 * — * 1 * 2 * 1 * 0.4 * 23 *
Czech Republic 6-10 11-14 ... ... ... ... ... ... ... ... ... ... ... ... ...
Denmark 6-12 13-15 2 2 1 9 37 1 2 1 2 2 2 4 50
Djibouti 6-10 11-14 42 +1 38 +1 45 +1 39 +1 53 +1 … … … ... ... ... ... ...
Dominica 5-11 12-14 4 -2 5 -2 3 -2 0.3 -2 33 -2 3 -2 4 -2 3 -2 5 **, -1 9 **, -1 1 **, -1 0.2 **, -1 13 **, -1
Dominican Republic 6-11 12-13 11 10 12 137 53 — — — 9 7 10 34 56
Ecuador 6-11 12-14 3 4 2 59 36 2 3 2 6 6 7 57 54
Egypt 6-11 12-14 3 **, -1 ... ... 258 **, -2 ... 1 **, -1 1 **, -1 — **, -1 1 ** ... ... 64 ** ...
El Salvador 7-12 13-15 5 5 5 41 47 4 4 4 9 8 9 39 52
Equatorial Guinea 7-12 13-16 38 38 38 38 50 — — — ... ... ... ... ...
Eritrea 7-11 12-14 66 64 68 518 51 — — — 65 61 69 255 52
Estonia 7-12 13-15 3 4 3 2 39 — — — 5 5 5 2 47
Ethiopia 7-12 13-16 ... ... ... ... ... ... ... ... ... ... ... ... ...
Fiji 6-11 12-15 1 ... ... 1 ... ... ... ... 4 ... ... 2 ...
Finland 7-12 13-15 1 1 1 4 43 — — — 3 3 3 5 50
France 6-10 11-14 1 2 1 43 23 1 1 1 — ... ... 9 ...
Gabon 6-10 11-14 ... ... ... ... ... ... ... ... ... ... ... ... ...
Gambia 7-12 13-15 26 29 24 75 45 … … … 22 **, -2 23 **, -2 21 **, -2 25 **, -2 48 **, -2
Georgia 6-11 12-14 1 2 1 4 24 ... ... ... ... ... ... ... ...
Germany 6-9 10-15 — ** 1 ** - ** 13 ** 15 ** ... ... ... ... ... ... ... ...
Ghana 6-11 12-14 12 +1 13 +1 12 +1 467 +1 48 +1 11 +1 11 +1 12 +1 8 +1 5 +1 11 +1 130 +1 69 +1
Gibraltar 5-10 11-12 ... ... ... ... ... ... ... ... ... ... ... ... ...
Greece 6-11 12-14 — -1 1 -1 - -1 3 -1 19 -1 — -1 — -1 — -1 — -2 ... ... 1 -2 ...
Grenada 5-11 12-14 ... ... ... ... ... ... ... ... ... ... ... ... ...
Guatemala 7-12 13-15 5 -1 4 -1 5 -1 110 -1 53 -1 — -1 — -1 — -1 20 -1 16 -1 25 -1 213 -1 61 -1
Guinea 7-12 13-16 24 19 30 431 61 … … … 52 **, -1 43 **, -1 60 **, -1 520 **, -1 58 **, -1
Guinea-Bissau 6-11 12-14 29 -2 27 -2 31 -2 70 -2 53 -2 — -2 — -2 — -2 ... ... ... ... ...

134 Fixing the Broken Promise of Education for All
Country or territory
Age group Out-of-school children of primary school ageOut-of-school adolescents of lower secondary school age
Pri
mar
y
(ISC
ED
1)
Low
er
Sec
ond
ary
(IS
CE
D 2
)
Out-of-school rate (%)Number out
of school
Share of children of primary school age enrolled in pre-
primary education (%) Out-of-school rate (%)Number out of
school
MF M F MF (000) % F MF M F MF M F MF (000) % F(1) (2) (3) (4) (5) (6) (7) (8) (9) (10) (11) (12) (13) (14) (15)
Guyana 6-11 12-14 25 30 20 32 37 1 1 1 6 **, -1 ... ... 3 **, -1 ...
Haiti 6-11 12-14 ... ... ... ... ... ... ... ... ... ... ... ... ...
Holy See . . . +1 . +1 . +1 . +1 . +1 . +1 . +1 . +1 . +1 . +1 . +1 . +1 . +1
Honduras 6-11 12-14 6 7 5 67 42 2 2 2 ... ... ... ... ...
Hungary 7-10 11-14 3 4 3 13 46 1 1 1 1 1 2 5 57
Iceland 6-12 13-15 1 -1 2 -1 1 -1 0.4 -1 39 -1 — -1 — -1 — -1 3 -1 2 -1 4 -1 0.4 -1 68 -1
India 6-10 11-13 1 -1 ... ... 1,387 -1 ... ... ... ... 23 -1 23 -1 23 -1 16,396 -1 48 -1
Indonesia 7-12 13-15 5 5 4 1,336 42 — — — 13 14 11 1,674 43
Iran, Islamic Rep. 6-10 11-13 — * ... ... 3 * ... ... ... ... 5 * 3 * 6 * 146 * 61 *
Iraq 6-11 12-14 ... ... ... ... ... … … … ... ... ... ... ...
Ireland 5-12 13-15 — — - 1 34 — — — — ... ... 0.1 ...
Israel 6-11 12-14 3 -1 3 -1 3 -1 23 -1 43 -1 3 -1 3 -1 3 -1 — -1 ... ... — -1 ...
Italy 6-10 11-13 1 -1 1 -1 1 -1 26 -1 70 -1 — -1 1 -1 — -1 — -1 ... ... 5 -1 ...
Jamaica 6-11 12-14 ... ... ... ... ... ... ... ... ... ... ... ... ...
Japan 6-11 12-14 — ... ... 6 ... . ... ... — ... ... 4 ...
Jordan 6-11 12-15 3 2 4 25 62 — — — 6 -1 6 -1 6 -1 31 -1 50 -1
Kazakhstan 7-10 11-15 1 **, +1 2 **, +1 - **, +1 13 **, +1 14 **, +1 — +1 — +1 — +1 4 **, +1 3 **, +1 4 **, +1 42 **, +1 55 **, +1
Kenya 6-11 12-13 ... ... ... ... ... ... ... ... ... ... ... ... ...
Kiribati 6-11 12-14 ... ... ... ... ... ... ... ... ... ... ... ... ...
Korea, DPR 7-10 11-13 ... ... ... ... ... ... ... ... ... ... ... ... ...
Korea, Republic of 6-11 12-14 1 — 1 22 69 … … … — ... ... 4 ...
Kuwait 6-10 11-14 ... ... ... ... ... ... ... ... ... ... ... ... ...
Kyrgyzstan 7-10 11-15 2 1 2 6 69 1 1 1 9 *, -1 9 *, -1 9 *, -1 47 *, -1 49 *, -1
Lao PDR 6-10 11-14 4 3 5 30 60 — — — 29 26 31 178 54
Latvia 7-12 13-15 2 2 1 2 33 1 2 1 8 7 8 4 50
Lebanon 6-11 12-14 4 ** 1 ** 7 ** 18 ** 89 ** 1 1 1 20 ** 17 ** 22 ** 50 ** 58 **
Lesotho 6-12 13-15 18 20 16 62 45 ... ... ... 23 27 18 35 40
Liberia 6-11 12-14 59 -1 58 -1 60 -1 389 -1 50 -1 ... ... ... ... ... ... ... ...
Libya 6-11 12-14 ... ... ... ... ... ... ... ... ... ... ... ... ...
Liechtenstein 7-11 12-15 1 *, -1 ... ... — *, -1 ... — *, -1 — *, -1 — *, -1 5 *, -1 2 *, -1 9 *, -1 0.1 *, -1 82 *, -1
Lithuania 7-10 11-16 2 2 2 2 47 1 1 — — ... ... 1 ...
Luxembourg 6-11 12-14 5 -1 6 -1 4 -1 2 -1 39 -1 1 -1 1 -1 1 -1 3 -1 3 -1 2 -1 0.5 -1 36 -1
Madagascar 6-10 11-14 ... ... ... ... ... … … … ... ... ... ... ...
Malawi 6-11 12-15 ... ... ... ... ... ... ... ... ... ... ... ... ...
Malaysia 6-11 12-14 ... ... ... ... ... ... ... ... 9 -1 6 -1 13 -1 154 -1 71 -1
Maldives 6-12 13-15 ... ... ... ... ... ... ... ... ... ... ... ... ...
Mali 7-12 13-15 27 22 32 637 58 — — — 45 -1 37 -1 53 -1 440 -1 58 -1
Malta 5-10 11-13 5 5 5 1 48 — — — 10 13 7 1 33
Marshall Islands 6-11 12-13 — -1 ... ... — -1 ... ... ... ... ... ... ... ... ...
Mauritania 6-11 12-15 30 32 27 169 45 ... ... ... ... ... ... ... ...
Mauritius 5-10 11-13 2 2 2 2 50 2 2 2 ... ... ... ... ...
Mexico 6-11 12-14 2 3 1 291 27 — — — 14 15 12 977 45
TABLE A.1. OUT-OF-SCHOOL CHILDREN / Primary and lower secondary school age / Administrative data / 2012

135Findings from the Global Initiative on Out-of-School Children
Country or territory
Age group Out-of-school children of primary school ageOut-of-school adolescents of lower secondary school age
Pri
mar
y
(ISC
ED
1)
Low
er
Sec
ond
ary
(IS
CE
D 2
)
Out-of-school rate (%)Number out
of school
Share of children of primary school age enrolled in pre-
primary education (%) Out-of-school rate (%)Number out of
school
MF M F MF (000) % F MF M F MF M F MF (000) % F(1) (2) (3) (4) (5) (6) (7) (8) (9) (10) (11) (12) (13) (14) (15)
Micronesia 6-11 12-13 ... ... ... ... ... ... ... ... ... ... ... ... ...
Monaco 6-10 11-14 ... ... ... ... ... — — — ... ... ... ... ...
Mongolia 6-10 11-14 2 2 3 5 64 — — — — ... ... 0.4 ...
Montenegro 6-10 11-14 2 2 1 1 28 1 1 1 ... ... ... ... ...
Montserrat 5-11 12-14 ... ... ... ... ... ... ... ... ... ... ... ... ...
Morocco 6-11 12-14 1 +1 1 +1 1 +1 43 +1 57 +1 1 +1 1 +1 — +1 ... ... ... ... ...
Mozambique 6-12 13-15 14 11 16 692 59 ... ... ... 38 33 43 665 57
Myanmar 5-9 10-13 ... ... ... ... ... … … … ... ... ... ... ...
Namibia 7-13 14-16 11 13 10 43 43 ... ... ... ... ... ... ... ...
Nauru 6-11 12-15 24 * 25 * 23 * 0.3 * 48 * 2 * 2 * 1 * 3 * ... ... — * ...
Nepal 5-9 10-12 1 **, +1 ... ... 45 **, +1 ... ... ... ... 5 **, +1 ... ... 98 **, +1 ...
Netherlands 6-11 12-14 1 1 1 16 46 — — — — ... ... 2 ...
New Zealand 5-10 11-14 1 2 1 5 40 1 1 1 — ... ... 1 ...
Nicaragua 6-11 12-14 7 -2 7 -2 6 -2 54 -2 44 -2 . -2 . -2 . -2 18 -2 18 -2 17 -2 72 -2 48 -2
Niger 7-12 13-16 36 31 42 1,049 57 — — — 78 -1 75 -1 82 -1 1,133 -1 52 -1
Nigeria 6-11 12-14 34 **, -2 29 **, -2 40 **, -2 8,709 **, -2 57 **, -2 ... ... ... ... ... ... ... ...
Niue 5-10 11-14 ... ... ... ... ... ... ... ... ... ... ... ... ...
Norway 6-12 13-15 1 1 — 2 29 — — — 1 2 — 2 5
Oman 6-11 12-14 3 3 2 7 42 2 2 2 9 12 6 13 33
Pakistan 5-9 10-12 28 * 23 * 33 * 5,370 * 57 * ... ... ... 54 49 58 6,461 52
Palau 6-10 11-13 ... ... ... ... ... ... ... ... ... ... ... ... ...
Palestine 6-9 10-15 7 7 8 33 51 1 — 1 15 17 13 98 42
Panama 6-11 12-14 8 8 8 35 51 — — — 13 14 13 28 47
Papua New Guinea 6-12 13-14 13 10 17 165 61 ... ... ... ... ... ... ... ...
Paraguay 6-11 12-14 17 -1 17 -1 18 -1 150 -1 50 -1 1 -1 1 -1 1 -1 15 -1 15 -1 15 -1 62 -1 50 -1
Peru 6-11 12-14 4 -1 4 -1 4 -1 129 -1 48 -1 — — — 6 -1 6 -1 6 -1 104 -1 49 -1
Philippines 6-11 12-14 ... ... ... ... ... ... ... ... ... ... ... ... ...
Poland 7-12 13-15 3 3 3 70 47 — — — 5 5 5 65 50
Portugal 6-11 12-14 1 2 1 8 24 1 1 1 ... ... ... ... ...
Puerto Rico 6-11 12-14 15 -1 18 -1 13 -1 48 -1 39 -1 — -1 — -1 — -1 ... ... ... ... ...
Qatar 6-11 12-14 ... ... ... ... ... ... ... ... 2 -1 2 -1 1 -1 1 -1 29 -1
Republic of Moldova 7-10 11-15 9 * 9 * 10 * 14 * 49 * 1 * 1 * 1 * 13 * 13 * 14 * 28 * 51 *
Romania 7-10 11-14 ... ... ... ... ... 2 2 1 ... ... ... ... ...
Russian Federation 7-10 11-15 3 3 2 151 36 2 2 2 ... ... ... ... ...
Rwanda 7-12 13-15 1 ... ... 23 ... — ... ... ... ... ... ... ...
Saint Kitts and Nevis 5-11 12-14 16 ** 18 ** 15 ** 1 ** 45 ** … ... ... 8 -1 8 -1 7 -1 0.2 -1 44 -1
Saint Lucia 5-11 12-14 17 17 17 4 51 1 1 1 12 12 12 1 51
Saint Vincent/Grenadines 5-11 12-14 1 ... ... 0.1 ... ... ... ... 6 -2 4 -2 7 -2 0.4 -2 61 -2
Samoa 5-10 11-12 4 5 3 1 32 3 2 3 1 ... ... 0.1 ...
San Marino 6-10 11-13 7 7 7 0.1 47 — — — 7 *, -1 7 *, -1 7 *, -1 0.1 *, -1 46 *, -1

136 Fixing the Broken Promise of Education for All
Country or territory
Age group Out-of-school children of primary school ageOut-of-school adolescents of lower secondary school age
Pri
mar
y
(ISC
ED
1)
Low
er
Sec
ond
ary
(IS
CE
D 2
)
Out-of-school rate (%)Number out
of school
Share of children of primary school age enrolled in pre-
primary education (%) Out-of-school rate (%)Number out of
school
MF M F MF (000) % F MF M F MF M F MF (000) % F(1) (2) (3) (4) (5) (6) (7) (8) (9) (10) (11) (12) (13) (14) (15)
Sao Tome and Principe 6-11 12-14 3 +1 3 +1 3 +1 1 +1 43 +1 — +1 — +1 — +1 12 -2 11 -2 12 -2 1 -2 53 -2
Saudi Arabia 6-11 12-14 3 **, +1 5 **, +1 2 **, +1 115 **, +1 30 **, +1 — +1 — +1 — +1 5 **, +1 ... ... 77 **, +1 ...
Senegal 7-12 13-16 21 23 18 439 43 — — — ... ... ... ... ...
Serbia 7-10 11-14 7 * 7 * 7 * 22 * 48 * — * — * — * 4 * 3 * 4 * 10 * 53 *
Seychelles 6-11 12-14 6 -1 ... ... 1 -1 ... 4 -1 ... ... 2 -1 ... ... 0.1 -1 ...
Sierra Leone 6-11 12-14 ... ... ... ... ... ... ... ... ... ... ... ... ...
Singapore 6-11 12-13 ... ... ... ... ... ... ... ... ... ... ... ... ...
Sint Maarten 6-11 12-13 … … … … … … … … … … … … …
Slovakia 6-9 10-14 ... ... ... ... ... ... ... ... ... ... ... ... ...
Slovenia 6-11 12-14 2 3 2 2 40 1 1 1 4 4 3 2 44
Solomon Islands 6-11 12-14 ... ... ... ... ... 7 7 7 ... ... ... ... ...
Somalia 6-11 12-13 ... ... ... ... ... ... ... ... ... ... ... ... ...
South Africa 7-13 14-15 10 ** 10 ** 9 ** 656 ** 49 ** ... ... ... — ** ... ... 5 ** ...
South Sudan 6-11 12-13 59 **, -1 52 **, -1 66 **, -1 992 **, -1 55 **, -1 1 -1 1 -1 1 -1 ... ... ... ... ...
Spain 6-11 12-15 — — - 7 26 — — — — ** ... ... 0.4 ** ...
Sri Lanka 5-9 10-13 6 6 6 108 50 ... ... ... 7 -1 8 -1 6 -1 94 -1 43 -1
Sudan 6-11 12-13 48 -1 46 -1 51 -1 2,811 -1 52 -1 ... ... ... 35 -1 32 -1 39 -1 610 -1 55 -1
Suriname 6-11 12-15 8 -1 8 -1 7 -1 5 -1 46 -1 — -1 — -1 — -1 16 -1 16 -1 15 -1 6 -1 47 -1
Swaziland 6-12 13-15 ... ... ... ... ... … … … ... ... ... ... ...
Sweden 7-12 13-15 1 — 1 3 69 — — — 4 4 4 13 47
Switzerland 7-12 13-15 1 1 - 4 20 — — — 4 4 4 10 47
Syrian Arab Republic 6-9 10-14 1 -2 ... ... 19 -2 ... — -2 — -2 — -2 10 9 11 255 53
Tajikistan 7-10 11-15 1 ... ... 7 ... … … … 6 -1 2 -1 9 -1 50 -1 78 -1
Tanzania 7-13 14-17 ... ... ... ... ... — — — ... ... ... ... ...
Thailand 6-11 12-14 ... ... ... ... ... … … … ... ... ... ... ...
TFYR Macedonia 6-10 11-14 8 ** 8 ** 8 ** 10 ** 48 ** 2 2 2 ... ... ... ... ...
Timor-Leste 6-11 12-14 8 -1 8 -1 9 -1 16 -1 54 -1 ... ... ... 34 -1 33 -1 34 -1 34 -1 50 -1
Togo 6-11 12-15 ... ... ... ... ... — -1 ... ... ... ... ... ... ...
Tokelau 5-10 11-13 ... ... ... ... ... ... ... ... ... ... ... ... ...
Tonga 5-10 11-14 10 ** 11 ** 9 ** 2 ** 41 ** ... ... ... ... ... ... ... ...
Trinidad and Tobago 5-11 12-14 1 -2 1 -2 2 -2 2 -2 62 -2 ... ... ... ... ... ... ... ...
Tunisia 6-11 12-14 — ... ... 1 ... ... ... ... ... ... ... ... ...
Turkey 6-10 11-13 5 4 5 313 55 — — — 1 ... ... 38 ...
Turkmenistan 7-9 10-14 ... ... ... ... ... ... ... ... ... ... ... ... ...
Turks and Caicos Islands 6-11 12-14 ... ... ... ... ... ... ... ... ... ... ... ... ...
Tuvalu 6-11 12-15 ... ... ... ... ... ... ... ... ... ... ... ... ...
Uganda 6-12 13-16 9 -1 10 -1 8 -1 663 -1 43 -1 … … … ... ... ... ... ...
Ukraine 6-9 10-14 2 2 * 1 * 24 22 * ... ... ... 4 4 * 4 * 80 47 *
United Arab Emirates 6-10 11-14 2 * 1 * 3 * 6 * 75 * 1 * 1 * 1 * ... ... ... ... ...
United Kingdom 5-10 11-13 — — - 7 62 — — — 2 2 3 51 53
TABLE A.1. OUT-OF-SCHOOL CHILDREN / Primary and lower secondary school age / Administrative data / 2012
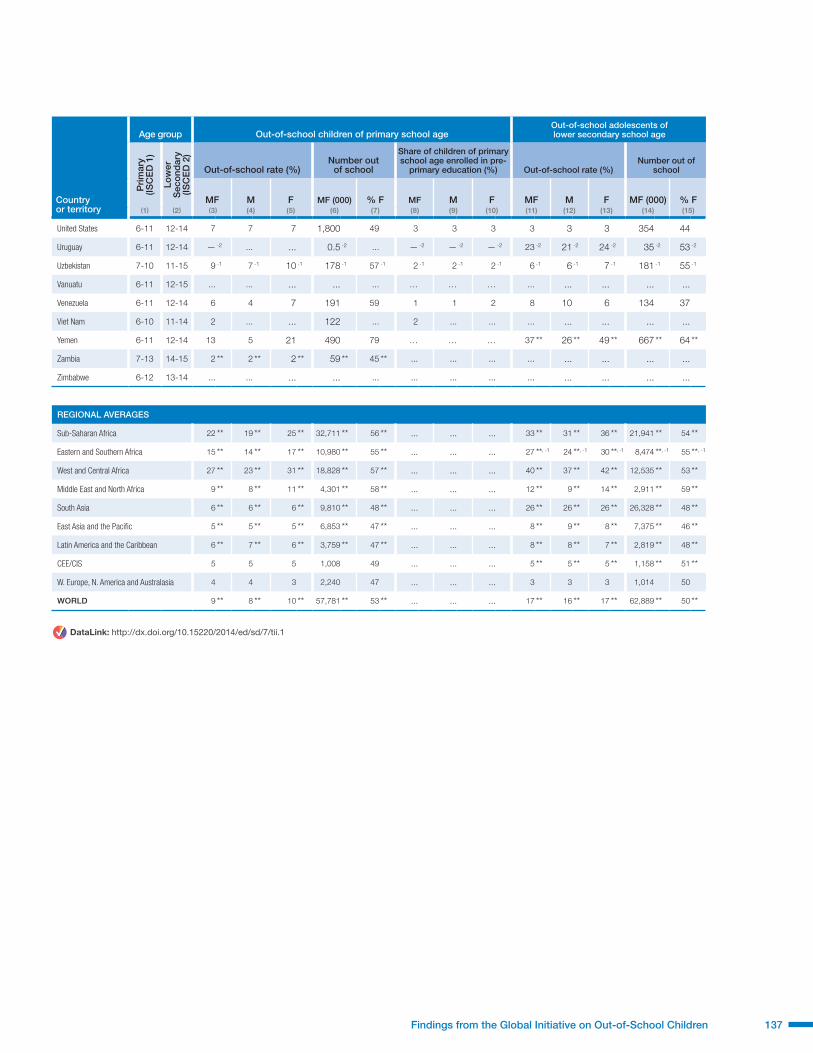
137Findings from the Global Initiative on Out-of-School Children
Country or territory
Age group Out-of-school children of primary school ageOut-of-school adolescents of lower secondary school age
Pri
mar
y
(ISC
ED
1)
Low
er
Sec
ond
ary
(IS
CE
D 2
)
Out-of-school rate (%)Number out
of school
Share of children of primary school age enrolled in pre-
primary education (%) Out-of-school rate (%)Number out of
school
MF M F MF (000) % F MF M F MF M F MF (000) % F(1) (2) (3) (4) (5) (6) (7) (8) (9) (10) (11) (12) (13) (14) (15)
United States 6-11 12-14 7 7 7 1,800 49 3 3 3 3 3 3 354 44
Uruguay 6-11 12-14 — -2 ... ... 0.5 -2 ... — -2 — -2 — -2 23 -2 21 -2 24 -2 35 -2 53 -2
Uzbekistan 7-10 11-15 9 -1 7 -1 10 -1 178 -1 57 -1 2 -1 2 -1 2 -1 6 -1 6 -1 7 -1 181 -1 55 -1
Vanuatu 6-11 12-15 ... ... ... ... ... … … … ... ... ... ... ...
Venezuela 6-11 12-14 6 4 7 191 59 1 1 2 8 10 6 134 37
Viet Nam 6-10 11-14 2 ... ... 122 ... 2 ... ... ... ... ... ... ...
Yemen 6-11 12-14 13 5 21 490 79 … … … 37 ** 26 ** 49 ** 667 ** 64 **
Zambia 7-13 14-15 2 ** 2 ** 2 ** 59 ** 45 ** ... ... ... ... ... ... ... ...
Zimbabwe 6-12 13-14 ... ... ... ... ... ... ... ... ... ... ... ... ...
REGIONAL AVERAGES
Sub-Saharan Africa 22 ** 19 ** 25 ** 32,711 ** 56 ** ... ... ... 33 ** 31 ** 36 ** 21,941 ** 54 **
Eastern and Southern Africa 15 ** 14 ** 17 ** 10,980 ** 55 ** ... ... ... 27 **, -1 24 **, -1 30 **, -1 8,474 **, -1 55 **, -1
West and Central Africa 27 ** 23 ** 31 ** 18,828 ** 57 ** ... ... ... 40 ** 37 ** 42 ** 12,535 ** 53 **
Middle East and North Africa 9 ** 8 ** 11 ** 4,301 ** 58 ** ... ... ... 12 ** 9 ** 14 ** 2,911 ** 59 **
South Asia 6 ** 6 ** 6 ** 9,810 ** 48 ** ... ... ... 26 ** 26 ** 26 ** 26,328 ** 48 **
East Asia and the Pacific 5 ** 5 ** 5 ** 6,853 ** 47 ** ... ... ... 8 ** 9 ** 8 ** 7,375 ** 46 **
Latin America and the Caribbean 6 ** 7 ** 6 ** 3,759 ** 47 ** ... ... ... 8 ** 8 ** 7 ** 2,819 ** 48 **
CEE/CIS 5 5 5 1,008 49 ... ... ... 5 ** 5 ** 5 ** 1,158 ** 51 **
W. Europe, N. America and Australasia 4 4 3 2,240 47 ... ... ... 3 3 3 1,014 50
WORLD 9 ** 8 ** 10 ** 57,781 ** 53 ** ... ... ... 17 ** 16 ** 17 ** 62,889 ** 50 **
DataLink: http://dx.doi.org/10.15220/2014/ed/sd/7/tii.1

138 Fixing the Broken Promise of Education for All
Country or territory
Age group Out-of-school rate for children of primary school age (%)
Primary (ISCED 1) MF
Sex Location Household wealth quintile
SourceM F Urban RuralPoorest quintile
Secondpoorest quintile
Middle quintile
Second richest quintile
Richest quintile
(1) (2) (3) (4) (5) (6) (7) (8) (9) (10) (11) (12)
Afghanistan 7-12 43 y 36 y 52 y 22 y 46 y ... ... ... ... ... Living Condition Survey 2011-2012
Albania 6-10 10 10 9 10 9 11 7 10 11 9 DHS 2008-2009
Algeria 6-10 4 x 3 x 4 x 3 x 5 x 7 x 3 x 2 x 2 x 3 x MICS 2006
Andorra 6-11 ... ... ... ... ... ... ... ... ... ...
Angola 6-11 21 23 25 15 33 37 26 23 14 10 Inquérito Integrado sobre o Bem-Estar da População 2008-2009
Anguilla 5-11 ... ... ... ... ... ... ... ... ... ...
Antigua and Barbuda 5-11 ... ... ... ... ... ... ... ... ... ...
Argentina 6-11 1 2 1 ... ... 2 1 2 2 1 MICS 2011-2012
Armenia 6-9 3 y 3 y 3 y 3 y 2 y 2 y 4 y 3 y 3 y 3 y DHS 2010
Aruba 6-11 ... ... ... ... ... ... ... ... ... ...
Australia 5-11 ... ... ... ... ... ... ... ... ... ...
Austria 6-9 ... ... ... ... ... ... ... ... ... ...
Azerbaijan 6-9 27 x 26 x 28 x 26 x 28 x 28 x 29 x 25 x 30 x 22 x DHS 2006
Bahamas 5-10 ... ... ... ... ... ... ... ... ... ...
Bahrain 6-11 14 x 14 x 13 x ... ... ... ... ... ... ... MICS 2000
Bangladesh 6-10 21 23 19 23 20 28 20 17 17 19 DHS 2011
Barbados 5-10 ... ... ... ... ... ... ... ... ... ...
Belarus 6-9 8 7 10 9 7 7 7 11 10 7 MICS 2012
Belgium 6-11 ... ... ... ... ... ... ... ... ... ...
Belize 5-10 6 6 6 2 8 12 6 3 1 2 MICS 2011
Benin 6-11 24 21 27 17 28 43 29 18 12 10 DHS 2011-2012
Bermuda 5-10 ... ... ... ... ... ... ... ... ... ...
Bhutan 6-12 5 5 5 2 6 ... ... ... ... ... Living Standard Survey 2012
Bolivia 6-11 3 3 3 2 4 5 3 3 2 1 DHS 2008
Bosnia and Herzegovina 6-10 2 2 3 3 2 5 1 3 2 3 MICS 2012
Botswana 6-12 13 x 15 x 12 x 11 x 15 x ... ... ... ... ... Family Health Survey 2007
Brazil 7-10 5 x 6 x 5 x ... ... ... ... ... ... ... Pesquisa Nacional por Amostra de Domicilios 2006
British Virgin Islands 5-11 ... ... ... ... ... ... ... ... ... ...
Brunei Darussalam 6-11 ... ... ... ... ... ... ... ... ... ...
Bulgaria 7-10 ... ... ... ... ... ... ... ... ... ...
Burkina Faso 6-11 48 46 50 17 55 69 58 49 39 15 DHS 2010
Burundi 7-12 15 15 16 9 16 24 18 14 13 8 DHS 2010
Cambodia 6-11 14 y 14 y 14 y ... ... ... ... ... ... ... Socio-Economic Survey 2012
Cameroon 6-11 15 13 18 6 22 40 15 8 4 1 DHS 2011
Canada 6-11 ... ... ... ... ... ... ... ... ... ...
Cabo Verde 6-11 ... ... ... ... ... ... ... ... ... ...
Cayman Islands 5-10 ... ... ... ... ... ... ... ... ... ...
Central African Republic 6-11 27 22 32 14 34 43 37 27 18 10 MICS 2010
Chad 6-11 48 45 52 29 53 60 58 51 43 26 MICS 2010
Chile 6-11 9 y 10 y 8 y 9 y 8 y ... ... ... ... ... Encuesta Caracterización Socioeconómica Nacional 2011
TABLE A.2. OUT-OF-SCHOOL CHILDREN / Primary school age / Household survey data / 2008-2013a

139Findings from the Global Initiative on Out-of-School Children
Country or territory
Age group Out-of-school rate for children of primary school age (%)
Primary (ISCED 1) MF
Sex Location Household wealth quintile
SourceM F Urban RuralPoorest quintile
Secondpoorest quintile
Middle quintile
Second richest quintile
Richest quintile
(1) (2) (3) (4) (5) (6) (7) (8) (9) (10) (11) (12)
China 7-11 3 y 3 y 3 y 3 y 4 y ... ... ... ... ... Population Census 2010
China, Hong Kong SAR 6-11 ... ... ... ... ... ... ... ... ... ...
China, Macao SAR 6-11 ... ... ... ... ... ... ... ... ... ...
Colombia 6-10 9 10 8 9 9 10 8 10 9 7 DHS 2010
Comoros 6-11 69 x 69 x 69 x 59 x 71 x 76 x 74 x 68 x 64 x 61 x MICS 2000
Congo 6-11 8 y 8 y 8 y 8 y 8 y 10 y 7 y 8 y 8 y 8 y DHS 2011-2012
Congo, DR 6-11 25 23 28 14 30 35 32 27 24 8 MICS 2010
Cook Islands 5-10 ... ... ... ... ... ... ... ... ... ...
Costa Rica 6-11 4 4 4 3 5 6 3 4 3 2 MICS 2011
Côte d'Ivoire 6-11 32 y 28 y 36 y 27 y 35 y 43 y 30 y 37 y 28 y 20 y DHS 2012
Croatia 7-10 ... ... ... ... ... ... ... ... ... ...
Cuba 6-11 ... ... ... ... ... ... ... ... ... ...
Curaçao 6-11 ... ... ... ... ... ... ... ... ... ...
Cyprus 6-11 ... ... ... ... ... ... ... ... ... ...
Czech Republic 6-10 ... ... ... ... ... ... ... ... ... ...
Denmark 6-12 ... ... ... ... ... ... ... ... ... ...
Djibouti 6-10 31 y 29 y 32 y ... ... ... ... ... ... ... Enquête Djiboutienne auprès des Ménages pour les Indicateurs Sociaux 2012
Dominica 5-11 ... ... ... ... ... ... ... ... ... ...
Dominican Republic 6-11 ... 9 y 8 y ... ... ... ... ... ... ... Encuesta Nacional de Hogares de Propósitos Múltiples 2012
Ecuador 6-11 4 y 4 y 3 y 3 y 4 y ... ... ... ... ... Encuesta Nacional de Empleo, Desempleo y Subempleo 2013
Egypt 6-11 12 y 11 y 13 y 10 y 13 y 18 y 12 y 12 y 11 y 7 y Family Condition Survey 2009
El Salvador 7-12 ... ... ... ... ... ... ... ... ... ...
Equatorial Guinea 7-12 40 x 39 x 40 x ... ... ... ... ... ... ... MICS 2000
Eritrea 7-11 43 y 43 y 44 y 21 y 53 y 69 y 59 y 39 y 16 y 16 y Population and Health Survey 2010
Estonia 7-12 ... ... ... ... ... ... ... ... ... ...
Ethiopia 7-12 35 36 35 14 39 48 42 38 30 14 DHS 2011
Fiji 6-11 ... ... ... ... ... ... ... ... ... ...
Finland 7-12 ... ... ... ... ... ... ... ... ... ...
France 6-10 ... ... ... ... ... ... ... ... ... ...
Gabon 6-10 13 y 13 y 13 y 13 y 11 y 16 y 13 y 11 y 10 y 14 y DHS 2012
Gambia 7-12 37 39 36 25 46 53 41 38 34 18 MICS 2010
Georgia 6-11 4 5 4 3 5 8 5 3 3 4 Reproductive Health Survey 2010
Germany 6-9 ... ... ... ... ... ... ... ... ... ...
Ghana 6-11 27 28 26 20 33 39 33 23 18 14 MICS 2011
Gibraltar 5-10 ... ... ... ... ... ... ... ... ... ...
Greece 6-11 ... ... ... ... ... ... ... ... ... ...
Grenada 5-11 ... ... ... ... ... ... ... ... ... ...
Guatemala 7-12 ... ... ... ... ... ... ... ... ... ...
Guinea 7-12 42 37 47 16 53 68 55 46 25 11 Enquête Démographique et de Santé et à Indicateurs Multiples 2012
Guinea-Bissau 6-11 33 31 35 17 44 48 44 35 16 13 MICS 2010

140 Fixing the Broken Promise of Education for All
Country or territory
Age group Out-of-school rate for children of primary school age (%)
Primary (ISCED 1) MF
Sex Location Household wealth quintile
SourceM F Urban RuralPoorest quintile
Secondpoorest quintile
Middle quintile
Second richest quintile
Richest quintile
(1) (2) (3) (4) (5) (6) (7) (8) (9) (10) (11) (12)
Guyana 6-11 5 6 4 4 6 9 3 5 4 3 DHS 2009
Haiti 6-11 23 y 23 y 22 y 14 y 27 y 35 y 28 y 21 y 13 y 8 y DHS 2012
Holy See . ... ... ... ... ... ... ... ... ... ...
Honduras 6-11 7 y 8 y 7 y 6 y 8 y 11 y 7 y 6 y 4 y 7 y DHS 2011-2012
Hungary 7-10 ... ... ... ... ... ... ... ... ... ...
Iceland 6-12 ... ... ... ... ... ... ... ... ... ...
India 6-10 17 x 15 x 18 x 12 x 18 x 30 x 19 x 12 x 8 x 4 x National Family Health Survey 2005-2006
Indonesia 7-12 6 6 5 5 6 9 6 5 4 3 DHS 2012
Iran, Islamic Rep. 6-10 3 4 3 3 5 ... ... ... ... ... Multiple Indicator Demographic and Health Survey 2010-2011
Iraq 6-11 10 7 13 6 16 21 10 6 4 2 MICS 2011
Ireland 5-12 ... ... ... ... ... ... ... ... ... ...
Israel 6-11 ... ... ... ... ... ... ... ... ... ...
Italy 6-10 ... ... ... ... ... ... ... ... ... ...
Jamaica 6-11 2 3 1 2 2 3 2 3 2 1 MICS 2011
Japan 6-11 ... ... ... ... ... ... ... ... ... ...
Jordan 6-11 2 2 2 2 2 3 1 3 1 1 DHS 2012
Kazakhstan 7-10 1 1 1 1 1 1 1 1 — — MICS 2010-2011
Kenya 6-11 13 15 12 6 15 28 11 10 8 4 DHS 2008-2009
Kiribati 6-11 15 17 13 ... ... ... ... ... ... ... Census of Population and Housing 2010
Korea, DPR 7-10 1 1 1 0.4 2 ... ... ... ... ... MICS 2009
Korea, Republic of 6-11 ... ... ... ... ... ... ... ... ... ...
Kuwait 6-10 ... ... ... ... ... ... ... ... ... ...
Kyrgyzstan 7-10 2 2 1 3 1 1 1 2 1 3 DHS 2012
Lao PDR 6-10 15 15 15 5 17 29 18 9 5 3 Social Indicator Survey 2011-2012
Latvia 7-12 ... ... ... ... ... ... ... ... ... ...
Lebanon 6-11 2 2 2 ... ... ... ... ... ... ... MICS Style 2009
Lesotho 6-12 11 13 9 7 12 17 12 8 8 6 DHS 2009
Liberia 6-11 66 x 64 x 67 x 44 x 79 x 84 x 81 x 72 x 62 x 34 x DHS 2007
Libya 6-11 ... ... ... ... ... ... ... ... ... ...
Liechtenstein 7-11 ... ... ... ... ... ... ... ... ... ...
Lithuania 7-10 ... ... ... ... ... ... ... ... ... ...
Luxembourg 6-11 ... ... ... ... ... ... ... ... ... ...
Madagascar 6-10 31 y 32 y 29 y 14 y 34 y 46 y 32 y 27 y 20 y 18 y Enquête Nationale du Suivi des OMD 2012-2013
Malawi 6-11 15 16 14 7 16 25 19 14 11 4 DHS 2010
Malaysia 6-11 ... ... ... ... ... ... ... ... ... ...
Maldives 6-12 6 7 5 6 6 6 6 5 5 7 DHS 2009
Mali 7-12 43 40 45 20 50 64 53 45 30 15 MICS 2010
Malta 5-10 ... ... ... ... ... ... ... ... ... ...
Marshall Islands 6-11 ... ... ... ... ... ... ... ... ... ...
Mauritania 6-11 39 41 38 28 45 55 46 34 32 17 MICS 2011
TABLE A.2. OUT-OF-SCHOOL CHILDREN / Primary school age / Household survey data / 2008-2013a

141Findings from the Global Initiative on Out-of-School Children
Country or territory
Age group Out-of-school rate for children of primary school age (%)
Primary (ISCED 1) MF
Sex Location Household wealth quintile
SourceM F Urban RuralPoorest quintile
Secondpoorest quintile
Middle quintile
Second richest quintile
Richest quintile
(1) (2) (3) (4) (5) (6) (7) (8) (9) (10) (11) (12)
Mauritius 5-10 ... ... ... ... ... ... ... ... ... ...
Mexico 6-11 3 x 3 x 3 x ... ... ... ... ... ... ... Census of Population and Housing 2005
Micronesia 6-11 ... ... ... ... ... ... ... ... ... ...
Monaco 6-10 ... ... ... ... ... ... ... ... ... ...
Mongolia 6-10 4 5 4 3 6 7 7 3 2 2 MICS 2010
Montenegro 6-10 3 x 3 x 2 x 3 x 2 x 8 x 1 x 1 x — x — x MICS 2005-2006
Montserrat 5-11 ... ... ... ... ... ... ... ... ... ...
Morocco 6-11 11 x 9 x 12 x 4 x 17 x 23 x 14 x 5 x 3 x 3 x MICS 2006-2007
Mozambique 6-12 23 y 23 y 23 y 14 y 26 y 33 y 31 y 24 y 16 y 9 y DHS 2011
Myanmar 5-9 10 10 9 7 11 19 9 6 5 5 MICS 2009-2010
Namibia 7-13 13 y 14 y 12 y 10 y 15 y ... ... ... ... ... Population and Housing Census 2011
Nauru 6-11 3 y 3 y 2 y ... ... ... ... ... ... ... Population and Housing Census 2011
Nepal 5-9 6 4 9 3 7 9 9 6 3 1 DHS 2011
Netherlands 6-11 ... ... ... ... ... ... ... ... ... ...
New Zealand 5-10 ... ... ... ... ... ... ... ... ... ...
Nicaragua 6-11 30 29 31 24 36 ... ... ... ... ... Living Standards Measurement Survey 2009
Niger 7-12 50 45 54 17 55 66 60 55 43 19 Enquête Démographique et de Santé et à Indicateurs Multiples 2012
Nigeria 6-11 41 y 38 y 43 y 29 y 48 y 73 y 44 y 27 y 25 y 30 y DHS 2013
Niue 5-10 — — — ... ... ... ... ... ... ... Census of Population and Housing 2011
Norway 6-12 ... ... ... ... ... ... ... ... ... ...
Oman 6-11 ... ... ... ... ... ... ... ... ... ...
Pakistan 5-9 36 33 40 25 41 61 41 29 23 13 DHS 2012-2013
Palau 6-10 ... ... ... ... ... ... ... ... ... ...
Palestine 6-9 7 7 7 8 3 10 8 7 6 4 MICS 2010
Panama 6-11 ... ... ... ... ... ... ... ... ... ...
Papua New Guinea 6-12 ... ... ... ... ... ... ... ... ... ...
Paraguay 6-11 12 13 11 11 13 ... ... ... ... ... Encuesta Permanente de Hogares 2008
Peru 6-11 3 3 3 3 3 4 3 2 2 2 DHS 2012
Philippines 6-11 12 x 12 x 11 x 10 x 13 x 21 x 12 x 8 x 6 x 8 x DHS 2003
Poland 7-12 ... ... ... ... ... ... ... ... ... ...
Portugal 6-11 ... ... ... ... ... ... ... ... ... ...
Puerto Rico 6-11 ... ... ... ... ... ... ... ... ... ...
Qatar 6-11 ... ... ... ... ... ... ... ... ... ...
Republic of Moldova 7-10 1 1 2 2 1 2 1 2 1 1 MICS Summary Report 2012
Romania 7-10 ... ... ... ... ... ... ... ... ... ...
Russian Federation 7-10 ... ... ... ... ... ... ... ... ... ...
Rwanda 7-12 8 y 9 y 7 y 7 y 9 y 13 y 9 y 7 y 8 y 4 y Integrated Household Living Conditions Survey 2010-2011
Saint Kitts and Nevis 5-11 ... ... ... ... ... ... ... ... ... ...
Saint Lucia 5-11 1 — 1 1 — ... ... ... ... ... MICS 2012
Saint Vincent/Grenadines 5-11 ... ... ... ... ... ... ... ... ... ...

142 Fixing the Broken Promise of Education for All
Country or territory
Age group Out-of-school rate for children of primary school age (%)
Primary (ISCED 1) MF
Sex Location Household wealth quintile
SourceM F Urban RuralPoorest quintile
Secondpoorest quintile
Middle quintile
Second richest quintile
Richest quintile
(1) (2) (3) (4) (5) (6) (7) (8) (9) (10) (11) (12)
Samoa 5-10 12 y 12 y 11 y 11 y 12 y 15 y 12 y 10 y 12 y 9 y DHS 2009
San Marino 6-10 ... ... ... ... ... ... ... ... ... ...
Sao Tome and Principe 6-11 6 6 6 6 7 12 9 6 2 3 DHS 2008-2009
Saudi Arabia 6-11 ... ... ... ... ... ... ... ... ... ...
Senegal 7-12 38 40 37 19 50 53 43 36 31 22 DHS 2010-2011
Serbia 7-10 1 2 1 1 2 4 — 1 — 2 MICS 2010
Seychelles 6-11 ... ... ... ... ... ... ... ... ... ...
Sierra Leone 6-11 26 27 24 21 28 42 32 24 17 12 MICS 2010
Singapore 6-11 ... ... ... ... ... ... ... ... ... ...
Sint Maarten 6-11 ... ... ... ... ... ... ... ... ... ...
Slovakia 6-9 ... ... ... ... ... ... ... ... ... ...
Slovenia 6-11 ... ... ... ... ... ... ... ... ... ...
Solomon Islands 6-11 35 x,y 38 x,y 31 x,y 28 x,y 36 x,y 42 x,y 36 x,y 39 x,y 33 x,y 22 x,y DHS 2007
Somalia 6-11 77 x 75 x 79 x 59 x 88 x 96 x 93 x 81 x 66 x 47 x MICS 2006
South Africa 7-13 ... ... ... ... ... ... ... ... ... ...
South Sudan 6-11 74 71 77 57 79 89 85 78 66 46 MICS 2010
Spain 6-11 ... ... ... ... ... ... ... ... ... ...
Sri Lanka 5-9 ... ... ... ... ... ... ... ... ... ...
Sudan 6-11 25 22 28 11 31 45 38 23 8 3 MICS 2010
Suriname 6-11 5 5 4 4 6 9 4 2 1 4 MICS 2010
Swaziland 6-12 4 4 3 3 4 5 3 5 2 1 MICS 2010
Sweden 7-12 ... ... ... ... ... ... ... ... ... ...
Switzerland 7-12 ... ... ... ... ... ... ... ... ... ...
Syrian Arab Republic 6-9 13 x 13 x 14 x 11 x 15 x ... ... ... ... ... MICS 2006
Tajikistan 7-10 3 2 4 2 3 5 4 2 2 2 DHS 2012
Tanzania 7-13 20 21 18 9 23 32 26 17 12 7 DHS 2010
Thailand 6-11 4 4 4 5 4 6 5 4 4 3 MICS 2012
TFYR Macedonia 6-10 2 2 2 1 2 4 2 1 1 — MICS 2011
Timor-Leste 6-11 28 29 27 20 30 40 31 28 22 16 DHS 2009-2010
Togo 6-11 11 9 14 6 14 20 15 8 6 4 MICS 2010
Tokelau 5-10 ... ... ... ... ... ... ... ... ... ...
Tonga 5-10 ... ... ... ... ... ... ... ... ... ...
Trinidad and Tobago 5-11 2 x 2 x 2 x ... ... 6 x 2 x 1 x 1 x 2 x MICS 2006
Tunisia 6-11 2 2 2 1 3 4 2 2 1 2 MICS 2011-2012
Turkey 6-10 7 y 7 y 8 y 7 y 9 y 13 y 7 y 5 y 4 y 4 y DHS Style 2008
Turkmenistan 7-9 ... ... ... ... ... ... ... ... ... ...
Turks and Caicos Islands 6-11 ... ... ... ... ... ... ... ... ... ...
Tuvalu 6-11 2 x,y 3 x,y 1 x,y 3 x,y 1 x,y 1 x,y 2 x,y 1 x,y 5 x,y — x,y DHS 2007
Uganda 6-12 19 19 19 15 19 27 21 16 15 13 DHS 2010
Ukraine 6-9 — — — — — — 1 — — — MICS 2012
United Arab Emirates 6-10 ... ... ... ... ... ... ... ... ... ...
United Kingdom 5-10 ... ... ... ... ... ... ... ... ... ...
TABLE A.2. OUT-OF-SCHOOL CHILDREN / Primary school age / Household survey data / 2008-2013a
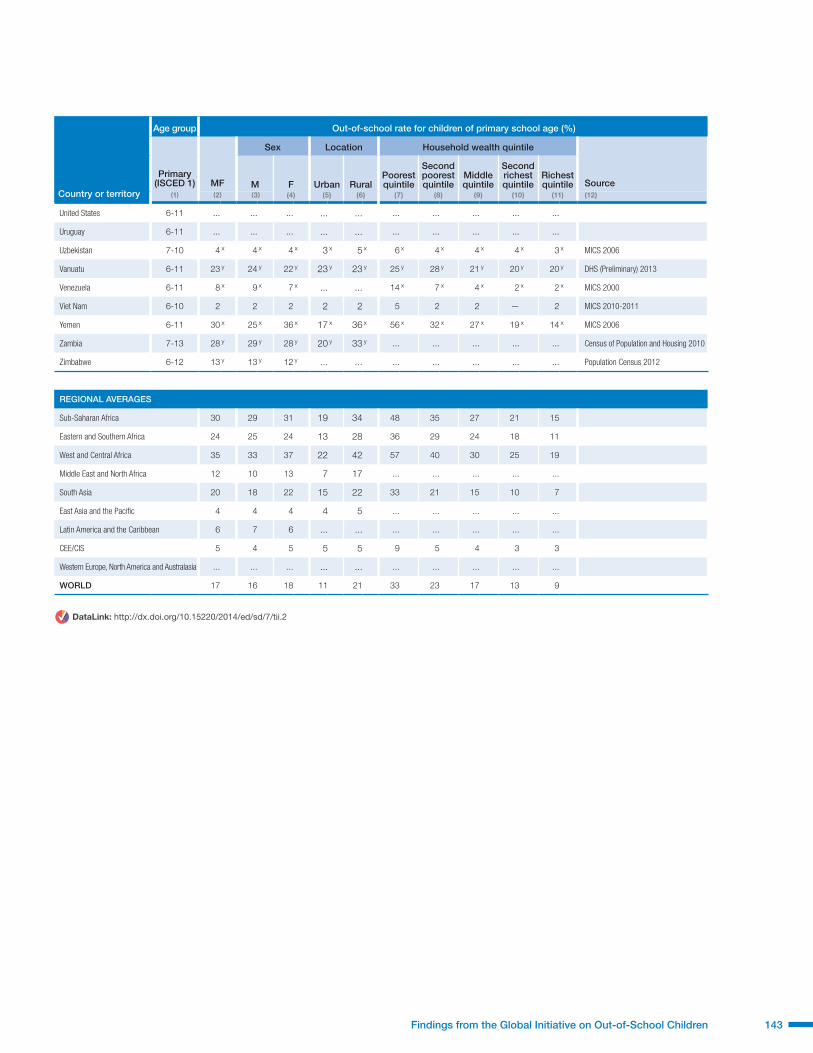
143Findings from the Global Initiative on Out-of-School Children
Country or territory
Age group Out-of-school rate for children of primary school age (%)
Primary (ISCED 1) MF
Sex Location Household wealth quintile
SourceM F Urban RuralPoorest quintile
Secondpoorest quintile
Middle quintile
Second richest quintile
Richest quintile
(1) (2) (3) (4) (5) (6) (7) (8) (9) (10) (11) (12)
United States 6-11 ... ... ... ... ... ... ... ... ... ...
Uruguay 6-11 ... ... ... ... ... ... ... ... ... ...
Uzbekistan 7-10 4 x 4 x 4 x 3 x 5 x 6 x 4 x 4 x 4 x 3 x MICS 2006
Vanuatu 6-11 23 y 24 y 22 y 23 y 23 y 25 y 28 y 21 y 20 y 20 y DHS (Preliminary) 2013
Venezuela 6-11 8 x 9 x 7 x ... ... 14 x 7 x 4 x 2 x 2 x MICS 2000
Viet Nam 6-10 2 2 2 2 2 5 2 2 — 2 MICS 2010-2011
Yemen 6-11 30 x 25 x 36 x 17 x 36 x 56 x 32 x 27 x 19 x 14 x MICS 2006
Zambia 7-13 28 y 29 y 28 y 20 y 33 y ... ... ... ... ... Census of Population and Housing 2010
Zimbabwe 6-12 13 y 13 y 12 y ... ... ... ... ... ... ... Population Census 2012
REGIONAL AVERAGES
Sub-Saharan Africa 30 29 31 19 34 48 35 27 21 15
Eastern and Southern Africa 24 25 24 13 28 36 29 24 18 11
West and Central Africa 35 33 37 22 42 57 40 30 25 19
Middle East and North Africa 12 10 13 7 17 ... ... ... ... ...
South Asia 20 18 22 15 22 33 21 15 10 7
East Asia and the Pacific 4 4 4 4 5 ... ... ... ... ...
Latin America and the Caribbean 6 7 6 ... ... ... ... ... ... ...
CEE/CIS 5 4 5 5 5 9 5 4 3 3
Western Europe, North America and Australasia ... ... ... ... ... ... ... ... ... ...
WORLD 17 16 18 11 21 33 23 17 13 9
DataLink: http://dx.doi.org/10.15220/2014/ed/sd/7/tii.2

Fixing the Broken Promise of Education for All, published by the UNESCO Institute for Statistics
and UNICEF, presents the latest statistical evidence
from administrative records and household surveys
to better identify children who are out of school
and the reasons for their exclusion from education.
It aims to inform the policies needed to reach
these children and finally deliver the promise of
Education for All.
Based on a series of national and regional studies
and policy analysis by leading experts, the
report explains why better data and cross-sector
collaboration are fundamental to the design of
effective interventions to overcome the barriers
facing out-of-school children and adolescents.
While highlighting the way forward for system-
wide policies to improve educational quality
and affordability, the report also presents the
information needed for targeted approaches to
address the compounding effects of disadvantage
faced by children caught up in armed conflict,
girls, working children, children with disabilities,
or members of ethnic or linguistic minorities.
This report presents a roadmap to improve the
data, research and policies needed to catalyse
action for out-of-school children as the world
embarks on a new development agenda for
education.
UNICEF AND UNESCO INSTITUTE FOR STATISTICS
Out-of-School Children Initiative
ALL IN SCHOOL
see the data!9 789291 891627
ISBN 978-92-9189-162-7