PRICE-FIXING OVERCHARGES:
316
Electronic copy available at: http://ssrn.com/abstract=2400780 J. M. Connor Price-Fixing Overcharges 3 rd Edition February 2014 1 PRICE-FIXING OVERCHARGES: REVISED 3 rd EDITION John M. Connor* Purdue University [email protected] Abstract Many jurisdictions fine illegal cartels using penalty guidelines that presume an arbitrary 10% overcharge. This paper surveys more than 700 published economic studies and judicial decisions that contain 2,041 quantitative estimates of overcharges of hard-core cartels. The primary findings are: (1) the median average long-run overcharge for all types of cartels over all time periods is 23.0%; (2) the mean average is at least 49%; (3) overcharges reached their zenith in 1891-1945 and have trended downward ever since; (4) 6% of the cartel episodes are zero; (5) median overcharges of international-membership cartels are 38% higher than those of domestic cartels; (6) convicted cartels are on average 19% more effective at raising prices as unpunished cartels; (7) bid-rigging conduct displays 25% lower mark-ups than price-fixing cartels; (8) when cartels operate at peak effectiveness, price changes are 60% to 80% higher than the whole episode; and (9) laboratory and natural market data find that the Cartel Monopoly Index (CMI) varies from 11% to 95%. Historical penalty guidelines aimed at optimally deterring cartels are likely to be too low. Key words: cartel, collusion, price fixing, overcharge, antitrust, optimal deterrence JEL Classifications: L12, L42, K22, B14, F29 • The author is Professor Emeritus at Purdue University, West Lafayette, Indiana. He is indebted to Professor Robert H. Lande, who worked with the author on law review articles on cartel overcharges; he also was responsible for locating several overcharges from antitrust verdicts in U.S. courts. Anonymous reviewers of subsequent publications made a large number of constructive suggestions, for which I am grateful. My students Jeff Zimmerman, David Ubilava, and Yuliya Bolotova assisted in coding early versions of the Master Data spreadsheet summarizing these data. Numerous spreadsheet users have provided useful feedback as well.
-
Upload
khangminh22 -
Category
Documents
-
view
0 -
download
0
Transcript of PRICE-FIXING OVERCHARGES:

Electronic copy available at: http://ssrn.com/abstract=2400780
J. M. Connor Price-Fixing Overcharges 3rd Edition February 2014
1
PRICE-FIXING OVERCHARGES:
REVISED 3rd EDITION
John M. Connor* Purdue University
Abstract Many jurisdictions fine illegal cartels using penalty guidelines that presume an arbitrary 10% overcharge. This paper surveys more than 700 published economic studies and judicial decisions that contain 2,041 quantitative estimates of overcharges of hard-core cartels. The primary findings are: (1) the median average long-run overcharge for all types of cartels over all time periods is 23.0%; (2) the mean average is at least 49%; (3) overcharges reached their zenith in 1891-1945 and have trended downward ever since; (4) 6% of the cartel episodes are zero; (5) median overcharges of international-membership cartels are 38% higher than those of domestic cartels; (6) convicted cartels are on average 19% more effective at raising prices as unpunished cartels; (7) bid-rigging conduct displays 25% lower mark-ups than price-fixing cartels; (8) when cartels operate at peak effectiveness, price changes are 60% to 80% higher than the whole episode; and (9) laboratory and natural market data find that the Cartel Monopoly Index (CMI) varies from 11% to 95%. Historical penalty guidelines aimed at optimally deterring cartels are likely to be too low. Key words: cartel, collusion, price fixing, overcharge, antitrust, optimal deterrence JEL Classifications: L12, L42, K22, B14, F29 • The author is Professor Emeritus at Purdue University, West Lafayette, Indiana. He is indebted to
Professor Robert H. Lande, who worked with the author on law review articles on cartel overcharges; he also was responsible for locating several overcharges from antitrust verdicts in U.S. courts. Anonymous reviewers of subsequent publications made a large number of constructive suggestions, for which I am grateful. My students Jeff Zimmerman, David Ubilava, and Yuliya Bolotova assisted in coding early versions of the Master Data spreadsheet summarizing these data. Numerous spreadsheet users have provided useful feedback as well.

Electronic copy available at: http://ssrn.com/abstract=2400780
J. M. Connor Price-Fixing Overcharges 3rd Edition February 2014
2
PREFACE TO THE THIRD EDITION
The first edition of this working paper was prepared in 2004 and published in 2005 (Connor 2005a). It contained 884 overcharge estimates (674 long-run “episodic” and 210 short-run “peak” observations) from 332 episodes of 237 cartelized markets. Since 2004, antitrust convictions of cartels and the economics literature on the price effects of cartels have exploded. Between 2004 and December 2013, I collected 1200 additional observations of cartel overcharges, a 142% increase in the sample. The lion’s share of the added estimates come from enforcement actions concerning hard-core cartels punished by antitrust authorities in the past 20 years. Besides a greatly expanded sample, this edition cites new research and includes some new topics on hard-core cartels, such as laboratory experiments, buyers’ cartels, and duration. These overcharges data have been cited in almost 900 scholarly publications (see http://scholar.google.com) and have been used for analyses in:
• Five Myths About Antitrust Damages. USFL Review 40 (2005): 651. • How High Do Cartels Raise Prices? Implications for Optimal Cartel Fines, Tulane Law Review
80 (December 2005): 513-570. • Cartel Overcharges: Survey and Meta-Analysis, International Journal of Industrial Organization
24 (Nov. 2006): 1109-1137. • Factors Influencing the Magnitude of Cartel Overcharges: An Empirical Analysis of Food-
Industry Cartels, Agribusiness: An International Journal 23 (Winter 2006-2007): 17-33. • Price-Fixing Overcharges: Legal and Economic Evidence, Chapter 4, pp. 59-153 in John B.
Kirkwood (editor), Volume 22 of Research in Law and Economics. Oxford, Amsterdam, and San Diego: Elsevier (January 2007).
• Cartel Overcharges: Implications for U.S. and EU Fining Policies, Antitrust Bulletin 51 (January 2007): 983-1022.
• Factors Influencing the Magnitude of Cartel Overcharges: An Empirical Analysis of the US Market. Journal of Competition Law and Economics Vol. 5, No. 2 (June 2009): 361 - 381.
• Optimal Cartel Fines, Chapter 88, pp. 2203-2218, Issues in Competition Law and Policy: Volume III, Wayne Dale Collins (editor). Chicago: Section of Antitrust Law of the American Bar Association (July 2008).
• Cartel Overcharges: An Empirical Analysis. Journal of Economic Behavior and Organization 70 (May 2009): 321-41.
• Strategic leniency and cartel enforcement. American Economic Review (2009): 750-768. • Governments as Cartel Victims: American Antitrust Institute Working Paper. (2009). • About cartel overcharges: Kroes is correct. Concurrences 1-2010 (2010): 1-6. • What could anti-trust in the OECD do for development? ISS Working Paper Series/General
Series 473 The Hague: Institute of Social Studies. (2010). • Fighting Hard Core Cartels: ZEW Discussion Papers No. 10-084. (2010). • Industrial Diplomacy and Economic Integration: The Origins of All-European Paper Cartels,
1959-72. Journal of Contemporary History 46 (2011): 179-202. • Price Effects of International Cartels in Markets for Primary Products, Chapter 4 in Trade,
Competition, and the Pricing of Commodities, Simon J. Evenett and Frédéric Jenny editors). London: CEPR (Feb. 2012).
• Cartel overcharges and the deterrent effect of EU competition law: ZEW-Centre for European Economic Research Discussion Paper 12-050 (2012).
J. M. Connor Price-Fixing Overcharges 3rd Edition February 2014
3
• On the Effectiveness of European Cartel Law Enforcement (Council Regulation 1/2003)–A Monte Carlo Simulation: SSRN Working Paper 2002034 (2012).
• Economic Approaches to Fight Bid Rigging. Journal of European Competition Law & Practice 4 (2013): 185-191.
• Predicting U.S. Antitrust Fines on Corporate Participants of Global Cartels: SSRN Working Paper (March 2013)
• Predicting EC Antitrust Fines on Participants of Global Cartels: SSRN Working Paper (March 2013)
• Smokescreen: How Managers Behave When They Have Something To Hide: Working Paper No. w18886. National Bureau of Economic Research (March 2013).
• Heterogeneity of Penalties and Private Information: Journal Preprint. Dublin: Economics Department, Trinity College (May 29, 2013).
• Quantification of Antitrust Damages, in David Ashton and David Henry (editors), Competition Damages Actions in the EU: Law and Practice. Edward Elgar (2013).
• Cartel Overcharges. Review of Law and Economics 29 (forthcoming 2014): 249-386.*
I am also gratified that overcharges reported in the publications above have informed numerous debates about strengthening anti-cartel laws around the world. Examples that have come to my attention include: the criminalization of antitrust violations in Australia and New Zealand; stiffening cartel fining guidelines in Japan, Finland, and Canada; the need for private rights of action in the EU (Oxera 2011, Renda et al. 2007); certain recommendations of the U.S. Antitrust Modernization Commission (2007); and anti-cartel policy guidelines prepared by the European Commission (EC 2013) and the International Competition Network (ICN 2005 and 2010). More than a dozen research projects and policy analyses (by academics, consultants, and antitrust authorities) that rely upon Private International Cartels spreadsheets are underway. John M. Connor Zionsville, Indiana, USA February 2014 * This Working Paper is a companion piece to the RLE article. Besides having additional explanatory text and more extensive appendices, it also reproduces in Data Appendix Tables 1 and 2 the raw overcharges data and the sources and methods used by the authors to compute the overcharges.

J. M. Connor Price-Fixing Overcharges 3rd Edition February 2014
4
TABLE OF CONTENTS
Page
INTRODUCTION ....................................................................................... 6 Objective 6 Overcharge Defined ……………………………………………………………….... 7 Overcharge Rates Computed 8 Overcharges Are Important in Economics and the Law 10 Overcharges and Cartel Fines ……………………………………………………… 12
The United States 12 Other Jurisdictions 15
Overcharges and Cartel Deterrence ………………………………………………… 16 LITERATURE SURVEY ………….………………….……………………. 19 Early Cartel Studies in Brief ……………………………............................. 19 Post-World War II Studies ……………………………............................................. 21 Quantitative Estimates of Cartel Overcharges ……................................................... 25 Surveys of Cartel Price Effect s …….......................................................................... 26 GENERAL DESCIPTION OF THE SAMPLE …………………………… 30 Number of Cartelized Markets…….......................................................................... 31 Number of Episodes…….......................................................................................... 34
Number of Episodic Overcharges……....................................................................... 35 Defining Cartel Eras ……………….......................................................................... 38 Number of Episodic Overcharges……........................................................................40 Numbers of Episodic Overcharge Estimates Over Time.............................................40
London Coal Cartels 40 Total Episodes over Time: International Cartels 41
Rates of Discovery 44 Guilty or Guilt Not Proven? 47 Bid Rigging 49 ANALYSIS OF OVERCHARGES ………………………………….……… 50 Number of Overcharge Observations ......................................................................... 50 Height of Episodic Overcharges by Type and over Time........................................... 51 International-Membership Cartels 53 Bid Rigging Schemes 54
Sanctioned versus Unsanctioned Cartels 55 Buyers’ Cartels 55 Overcharges over Time 56 Unsuccessful Cartel Episodes 58 Commodity Cartels 59 Size Distribution of Overcharges .............................................................................. 59
Looking in Detail at Extreme Observations ............................................................ 61 Peak Overcharges ..................................................................................................... 62
Overcharges by Location of Cartel ......................................................................... 66 Geographic Spread and Price Effects .........................................................................68
J. M. Connor Price-Fixing Overcharges 3rd Edition February 2014
5
Market Structure ...................................................................................................... 70 Overcharges and Duration ......................................................................................... 70
Overcharges and Market Size ................................................................................... 71 Laboratory Market Experiments ............................................................................... 72
Cartel Experiments 73 The Cartel Monopoly Index (CMI) 73
DECISIONS OF ANTITRUST AUTHORITIES ………………………….. 75 Economists versus Courts or Commissions .............................................................. 75
Cartels Targeted by Class Actions ............................................................................ 79 Price Effects of Antitrust Intervention...................................................................... 80 RELIABILITY ISSUES ................................................................................... 80 Data Sources ............................................................................................................ 81 Sensitivity to Advances in Methods of Analysis .................................................... 83 Intra-Episode Comparisons ..................................................................................... 84 SUMMARY AND IMPLICATIONS…………………………………….….. 85 Summary .................................................................................................................. 85 Implications for Economics ..................................................................................... 86 Implications for Public Policy .................................................................................. 89 BIBLIOGRAPHY…………………………………………….……………... 92 APPENDIX: SOURCES AND COLLECTION METHODS ……............…139 Selection Criteria........................................................................................................139
Social Science Studies ...............................................................................................142 Defining Episodes ......................................................................................................144
Decisions of Antitrust Authorities .............................................................................146 The 50 Highest-Overcharge Observations .................................................................148
LITERATURE APPENDIX: Pre-Modern Cartel Studies ….............…….... 151
Evolution of Definition of “Cartel”.......................................................................... 151 European Scholarship on Cartels ............................................................................. 154 Early European Anti-Cartel Legislation................................................................... 158 Early Cartel Research in North America ................................................................. 159 Early Cartel Research in the Rest of the World..........................................................162 Cartel Price Effects..................................................................................................... 162
DATA APPENDIX TABLES ……………………………….……………... 164

J. M. Connor Price-Fixing Overcharges 3rd Edition February 2014
6
INTRODUCTION Since at least 1888, thousands of economists, historians, lawmakers, commissioners, and jurists have labored mightily to assess the effectiveness of cartels.1 Several criteria that have been devised to assess effectiveness, including longevity, stability, efficiency, and profitability of these joint ventures, but by far the greatest attention has been lavished on market price effects.2 The particular price effect of interest in cartel studies is the increase in selling prices3 caused by the collusive conduct of suppliers in a market. Objective The principal purpose of this paper is to assemble and analyze the most comprehensive collection of quantitative estimates of monopoly overcharges generated by private, hard-core cartels.4 Candidates are cartels that operated in all geographic locations of the world and in all historical eras. The estimates are assembled from serious published social-science studies by disinterested authors and from the decisions of competent judicial bodies (see Data Appendix). Although the sources met minimal quality standards, no effort was made to apply additional subjective quality filters during the collection phase. Later, however, the estimates were examined for systematic differences in reliability across types of sources or methods of calculating overcharges. Analysis in this paper is limited to descriptive tabulations using categories that have been shown to be significantly different by more formal analyses. However, this paper attempts to convey its findings in a style approachable by practitioners and policy makers who may not be professional economists.
1 I eschew the term “success” used by many authors of cartel studies, because it connotes the financial performance 2 Longevity, also called duration, measures the lifespan of a cartel or, if it has more than one, the length of time of one episode. Some researchers use the term stability synonymously with duration, but more commonly it refers to the absence of price wars or other reversions to competitive conduct during a cartel’s time span. Stability is perhaps equivalent to low variation in a cartel’s “discipline,” where discipline may be measured by how close a cartel’s selling prices are to its desired target price or to the theoretical monopoly price. In the context of commodity agreements or marketing orders, stability will show up as lower variation in prices compared to the absence of such an agreement. Efficiency can refer to static allocative efficiency (low net social welfare loss) or, rarely, to technical efficiency or dynamic efficiency (rates of technological change). Allocative inefficiency is smaller than but closely correlated with the overcharge. Ceteris paribus, price increases will result in a parallel increase in the joint economic profits of the members of the cartel. 3 The undercharge from a buyers’ cartel is symmetrically defined as a price effectuated by buyers of an input purchased by companies acting as a cartel. For details, see the best legal-economic treatise on monopsony and oligopsony (Blair and Harrison 2010). 4 Private cartels are those not protected by treaties or sovereignty, and “hard-core” is overt price-setting or quantity-setting conduct. Such cartels are subject to the most severe penalties.

J. M. Connor Price-Fixing Overcharges 3rd Edition February 2014
7
Compilation should serve two subsidiary concerns. First, the results of the survey can be used as benchmarks to assess the ability of current antitrust penalties to deter illegal cartels. Second, these data may demonstrate empirical regularities that may suggest hypotheses for formal economic model-building. Overcharge Defined The increase in purchase costs to buyers due to an effective sellers’ cartel is customarily called an overcharge by economists and legal writers.5 When multiplied by the quantity sold be a cartel, it becomes the major portion of the key legal concept of damages.6 The overcharge rate is calculated by comparing actual cartel-enhanced prices to an appropriate non-collusive (competitive) benchmark price7 (Connor 2008). To be precise, if a sellers' cartel is effective in raising the market price Pm for a period of time because of collusion, then the unit monetary overcharge is Pm - Pc , where Pc is the competitive or benchmark price that would have been observed in the market absent overt collusion.8 Given the quantity sold during the conspiracy (Qm), the total overcharge is: 5 The term overcharge is little used in economic discourse. For example, the magisterial New Palgrave lists it nowhere (Eatwell et al.1987). In contrast, a basic handbook on antitrust damages prepared by a committee of lawyers and economists has a long chapter devoted to entirely to overcharges (ABA 2010: Chapter 7). However, the overcharge rate has close correlate in the well known economic measure of market power, the Lerner Index. The Lerner Index is further discussed below. 6 Antitrust damages are legal remedies for persons (natural or business) that are injured by prohibited anti-competitive conduct of other persons (ABA 2010:3). While courts can order many remedies, the most common are monetary payments to compensate victims for their losses ("make them whole"). These are also known as objective or special damages. Injunctive relief in the form of constraints on future conduct by the defendants is sometimes seen. Authorities may also impose punitive costs on the perpetrators, but these are rare. Overcharges incurred by buyers are only partial damages. Potential buyers who reduce or eliminate their purchases are also injured, but the latter effect is not an overcharge. Economists refer to this consumer loss as the dead-weight loss. Courts generally do not regard the harm inflicted on buyers priced out of the market compensable harm because it is difficult to identify these particular victims and because of the presumed difficulty of accurately calculating the dead-weight loss. (However, the State of Mississippi’s antitrust law does allow for harm to the State’s economy, which might reasonably be equated with the dead-weight loss). A solution to this conundrum would seem to be for courts to allocate additional cy pres awards of 10% to 20% of the value of recoveries. (See Connor and Lande (2012) for the derivation of these percentages). 7 The benchmark is referred to as the “but-for price” – the market equilibrium price that would have been observed were it not for the overtly collusive conduct of the sellers. The benchmark may be the purely competitive price, or it may be a somewhat higher price generated by legal tacit collusion by companies in an oligopolistic industry. 8 An overcharge can also be calculated for a single product sold by a single firm, i.e., a monopoly.
Dollar Overcharge = (Pm – Pc) x Qm

J. M. Connor Price-Fixing Overcharges 3rd Edition February 2014
8
The price difference Pm - Pc is conventionally converted to a rate (a ratio or percentage) by dividing the price wedge by the benchmark price. That is,
The overcharge can in theory range from zero to infinity, though the latter is highly unlikely. If Pc is properly measured, an overcharge of 0% would imply that the cartel was ineffective in controlling market price and that buyers from the cartel had suffered no antitrust injuries. Overcharge Rates Computed There are a couple of reasons why overcharge ratios may be under-reported. First, commentators can err, even when the dollar overcharge and the affected sales are known precisely. Calculating an overcharge rate is straightforward when working with prices, but converting a monetary overcharge into a percentage overcharge can easily lead to an underestimate of the overcharge rate.9 Let us examine a specific overcharge calculation. In 1992-1995, the world’s five producers of synthesized lysine (an amino acid that accelerates the growth of muscle tissue in animals) conspired to raise its global price. In the U.S. market, the cartel obtained a dollar overcharge of $80 million on sales of $460 million (Connor 2007b: 200, 220-235). Most observers would readily infer that the overcharge rate is (80/460)x100 = 17.4%. This is the method commonly followed by counsel when reporting how well they have represented their clients. However, the appropriate calculation is more complicated. It involves dividing the overcharge by the competitive or but-for sales, not the actual (affected) sales.10 The correct formula is: So, in the lysine example the divisor ought to be competitive rather than overcharge-inflated affected sales. That is, the proper divisor is $460-$80 = $380 million, and the true overcharge rate is (80/380) x100 = 21.1%. Note that when working with prices, underreporting overcharge rates is not an issue. The average monthly prices were about $0.945 and the but-for price about $0.78, which also yields an overcharge of 21%. 9 It is also easy to convert the (incorrect) ratio of overcharge to affected sales (OV/AS) to the correct one. Let OR be the overcharge rate. Then OR = 1/(1 – OV/AS). For example, if the overcharge is $5 and affected sales $10, then the true OR is 1/(1 – 5/10) = 1/0.5 = 100%. This shows that if reported overcharge rates are computed using affected sales, the true overcharge rates are being under-reported. 10 The but-for sales might also be output under Cournot or some other reasonable non-cooperative oligopolistic conduct, which would also be considerably smaller than collusive sales. In the lysine case, the conspirators twice reverted to prices that were slightly below the long-run marginal cost of the industry leader.
Overcharge Rate = (Pm - Pc)/Pc
Overcharge Rate = (Pm – Pc)xQm/(PmxQm(1 – ((Pm – Pc)xQm/PmxQm)))

J. M. Connor Price-Fixing Overcharges 3rd Edition February 2014
9
A recent example of using the wrong denominator to calculate the overcharge rate can be seen in a widely read report commissioned by the European Commission from a respected consultancy: prices of an Austrian cartel fell from €1140 during collusion to €900 after a raid; the report computes the overcharge to be 22%, whereas the correct overcharge is 26.7% (Komninos et al. 2009: 52). A second cause of low reported overcharge rates is under-reporting of affected sales (see Box). Under-reporting of cartel sales is a common practice by antitrust authorities. One reason for this tendency is that authorities must defend their imposed fines when the alleged cartelists appeal their fines to a higher court. Because fines are directly, positively related to affected sales, the authorities customarily (1) cut down the list of products that probably were cartelized to list only products that were incontrovertibly subject to price fixing, (2) exclude regions within the jurisdictions that arguably were subject to price fixing, and (3) foreshorten the collusive time period either because early-period written documents are incomplete or because there is possibly contradictory testimony by cartel managers concerning start or ending dates. Lengthy appeals over imposed fines are common in the EU, Brazil, and many other legal systems. Appeals are also possible when defendants go to trial in criminal antitrust regimes. In criminal jurisdictions like the United States, cartel fines are also linked to the size of affected sales, but the size of fines are the result of guilty-plea negotiations; the resulting agreements
The Iowa Ready-Mix Concrete Antitrust Case An order handed down by U.S. District Court Judge Mark W. Bennett in this case contains the following information:
“The combined settlement fund of $18.5 million is sufficient to repay completely each class member’s actual overcharge damages …. even after fees and costs….[which is] ‘very unusual’ in an antitrust class action …. The $18.5 million sum is especially remarkable, given that the United States Department of Justice estimated that the total volume of commerce affected by the price fixing conspiracies was only $5,666,348.61” (Bennett 2011: 4).
Later in this decision we learn that the settlement fund includes $7,638,113 in fees and costs, which implies that the overcharges were $10,861,887. To compute the rate, the first impulse of counsel is to take the overcharges ($10,861,887) and divide them by the sales during the collusive period ($5,670,000). The result is 191.7%. Hold on: This is an impossible number! The overcharges to direct buyers cannot exceed 100% of the value of their purchases. Overcharges can exceed competitive sales but not total affected sales. The solution to this conundrum is that the affected sales mentioned in the judicial order are far too small. The Judge was quoting from affected sales calculated by the U.S. DOJ for its criminal prosecution in which it counted only projects within 15 miles of each concrete plant. Private litigants used a more expansive approach to identifying geographic market boundaries, which resulted in more logical affected sales above $18.5 billion.

J. M. Connor Price-Fixing Overcharges 3rd Edition February 2014
10
cannot be appealed. However, prosecutors have incentives to carve down affected sales in order to avoid the risky outcomes of corporate antitrust litigation where the standard of proof is “beyond a reasonable doubt.” Concessions may be and are offered to defendants about which products, geographic regions, and time periods to include in affected sales (or the degree of harm caused). For example, a plea agreement may state that price fixing began “...as early as May 1, 2000,” when in fact collusion is later proven to have begun in January 1999.11 Overcharges are Important in Economics and the Law A price-fixing overcharge is a transfer of income or wealth from buyers to the members of the cartel that occurs as a result of an overt collusive agreement.12 Ceteris paribus when a cartel achieves high levels of effectiveness (i.e., longevity, stability, and high overcharge rates), it tends to generate large customer losses in the form of decline in consumer surplus.13 Although there are other economic effects of price fixing, legal-economic scholarship on antitrust injuries tends to focus on the overcharge.14 Effective cartels are also viewed as destructive of the competitive process in the sense that they weaken the natural effects of demand and supply in price formation and cause deadweight social losses.15 The deadweight losses result from the costs incurred by customers when they are forced to substitute inferior substitutes, if any, the costs incurred by the members of the cartel in managing the collusive enterprise, and rent- 11 The follow-on U.S. private damages litigation frequently adds time to the period of time mention in DOJ plea agreements. Also, in international cartel cases, the durations in decisions of other antitrust authorities tend to be longer than the durations for the same cartels negotiated in U.S. plea agreements. 12 An overt collusive agreement is a contract that is the result of observable, explicit communication between the parties. The contract may be a written document, a verbal unwritten agreement, a “handshake” (or “gentlemen’s) agreement, a cryptic or encoded message, or even simply body language (a “wink and a nod”). In some cultures, silence at the conclusion of a meeting at which consistent proposals were made may indicate a consensus agreement. In a jurisdiction with no antitrust laws or one that provides an industry exemption, the contracts may be publicized and may be enforceable in a court of law. In jurisdictions with anti-cartel laws, such contracts are usually hidden and are enforced only by the cartel members themselves. The need for self-enforcement of a secret agreement is the unique economic feature of contemporary cartels. 13 Customers are direct buyers and they are usually industrial buyers, but overcharge pass-on will transfer the losses in whole or in part to final consumers as indirect buyers. If cartels improve technical or dynamic efficiency, this may offset the buyers’ losses. The EU and some other jurisdictions permit innovation cartels in those rare occasions when the fruits of innovation passed on to consumers outweigh the static losses. 14 Technically, as a matter of economic and statistical principles, collusion can and does affect prices in ways other than a correctly measured overcharge. Keep in mind that Pm and Pc are ordinarily prices averaged over the collusive period for several hours or several years. However, there is a burgeoning literature that focuses on the dispersion of prices that result from collusive conduct (Connor 2005). In statistics, the mean average is but the first of four "moments" (or formulas) that describe a sample of numbers; the other higher-order moments are variance, skewness, and kurtosis. Theoretically, cartels can significantly affect price dispersion without creating an overcharge, but empirical works shows that changes in mean prices are usually accompanied by changes in dispersion (Connor 2004d, Connor et al. 2008, and von Blanckenburg 2010). Analyses of price-dispersion effects have promise in the detection of cartels and in proof of antitrust damages. 15 In large U.S. markets for manufactured products, the dead-weight loss is typically one-fifth to one-tenth as large as the overcharge, and the two losses are highly correlated (Peterson and Connor 1995). Lande and Connor (2012: 457-461) determined that from the few good studies available, the ratio was more in the 3% to 20% range.

J. M. Connor Price-Fixing Overcharges 3rd Edition February 2014
11
seeking behavior by the cartel such as efforts directed at forestalling entry. “Umbrella pricing” or “free riding,” the tendency of suppliers outside the cartel to sell at the cartel’s elevated price, creates further harm for customers of fringe suppliers. In this paper I focus on cartel overcharge rates as the principal indicator of harm or damages created by price fixing. Direct purchasers from an effective sellers’ cartel are the immediate losers. However, if the cartel is comprised of manufacturers (the most common story), then other buyers farther down the distribution channel are also harmed. These indirect purchasers typically will be other manufacturers, wholesale distributors, retail distributors, and the final consumers of the cartelized product.16 Indirect buyers pass on part or all of the overcharge contained in the direct purchase. Under simplifying assumptions, indirect purchasers in perfectly competitive industries pass on 100% of the initial overcharge, but if the indirect buyer is a monopolist then only 50% will be passed on at any one stage.17 If all the distributors use percentage mark-up rules, a fairly common situation, then the consumer pass-through rate is 100%. If the cartelized product is highly differentiated, then the pass-on rate will exceed 100%. Until about 1990 scholarly literature surveys of the economics of cartels seldom addressed overcharges, but interest in this subject has blossomed in the past decade. For example, Levenstein and Suslow (2006: §6.1), while focusing their article on duration, examine eight cross-industry and 54 “selected” case studies of cartels in 19 industries for evidence about price or profit effects.18 They conclude that (1) almost half of the industry case studies do not address the issue, (2) when addressed, nearly all find at least short-run price changes due to cartelization, but (3) few of the latter are explicit about the counterfactual (i.e., the but-for price) (ibid. pp. 81-82). Today textbooks of economics conventionally devote considerable space to the market price effects of cartels.19 While empirical studies of cartels routinely survey selected antecedents as a prelude to the study being presented, to my knowledge no one has published a work aimed principally at comprehensively surveying and analyzing cartel overcharges.20 This paper is aimed principally at filling this gap in the legal-economic literature. 16 This picture is simplified. Real-world distribution channels may lengthened if there are multiple sales from distributor to distributor, the cartel members may sell their products as components to other manufacturers for final assembly, or the channel may be foreshortened by manufacturer-distributor integration. Or, the chain may be much shorter than the example above, if, for example, consumers buy directly from cartelists via Internet sites. 17 Linear demand and supply curves, a homogeneous product, constant returns to scale, and fixed proportions in input use. See Harris and Sullivan (1979). In an extreme case of a monopolistic wholesaler and retailer, the pass-through rate from a manufacturing cartel to consumers is 0.5 x 0.5 = 0.25 or 25%. If the chain of sellers in the vertical distribution system is long, then a pass-through rate below one will shrink greatly before it reaches the consumer. If the distributors are competitive and the product is highly differentiated like cigarettes, then consumers could bear a 120% overcharge or higher. 18 An early (2004) version of the present study is cited (Levenstein and Suslow 2006: note 96). 19 The dominant U.S. textbook in the 1990s devoted 15 pages to cartels (Scherer and Ross 1990: 235-248, 258). Its market successor, about the same total length, spends 13 pages (Carlton and Perloff 2004: 128-131, 140-145, 148-150). 20 I exclude, of course, antecedents of this article by the present author.

J. M. Connor Price-Fixing Overcharges 3rd Edition February 2014
12
The actual size of cartel overcharges is an issue at the heart of a number of legal and economic controversies. First, knowing the size and distribution of cartel overcharges is necessary to justify the underpinnings of U.S. and foreign guidelines for sanctioning illegal cartel conduct. Many commentators on government fining practices have noted the absence of appropriate empirical data for the rational design of such policies. Second, because the typical harm from cartel operations was mainly anecdotal, there are widely varying opinions among experts on the critical issue of the size of sanctions needed for optimal deterrence of cartel formation.21 The following sections discuss these issues. Overcharges and Cartel Fines The United States The Sentencing Reform Act of 1984 created the U.S. Sentencing Commission (USSC), a judicial-branch unit charged by the U.S. Congress with devising guidelines for criminal sentencing for the federal judiciary (USSG Advisory Group 2003). The first set of guidelines was promulgated in 1987, and after three years of study and public comment was made law in 1989. The guidelines included sanctions for organizations guilty of horizontal price fixing and bid rigging (Cohen and Scheffman 1989: 332). Although the Sherman Act of 1890 is a criminal statute that encompasses other types of restrictive business practices, by long tradition only horizontal price fixing and market-sharing agreements have triggered criminal indictments by the Department of Justice (DOJ).22 Passage of the USSGs was a major step in the evolving and complex criminal enforcement regime for antitrust offenses (Kovacic 2006). The issue of how high cartels typically raise prices was crucial when the U.S. Sentencing Commission (USSC) established the fine levels for cartel violations. The USSC’s formulas for calculating cartel fines follow from an embedded assumption: “It is estimated that the average gain from price-fixing is 10 percent of the selling price.”23 The Commission added: “The 21 In a personal communication to the author in 2006, Terry Calvani (former Commissioner of the U.S. FTC) commented on the release of first edition of this paper, saying: “[M]uch of what we thought we knew about cartel overcharges was largely ‘urban legend.’ ” 22 Criminal filings are made in cases of per se, covert, intentional conspiracies by participants who are aware of the probable anticompetitive consequences (Hovenkamp 1999:585-586). While there are a few exceptions, potentially illegal anticompetitive conduct such as sharing among rivals of sensitive trade secrets, signaling, refusals to deal, resale minimum-price maintenance, tied sales, exclusive dealing, patent or trademark pooling, vertical price fixing (or resale price maintenance), mergers, monopolization, and attempts to monopolize are treated as civil matters. More than 95% of all naked cartel cases are brought as criminal actions, but a small number of such cases are, at the discretion of the DOJ, filed as civil matters. 23 The USSC Guidelines start with a base fine double the 10% presumed overcharge and use it in conjunction with the assigned base Offence level (of 10) for antitrust offenses. They adjust this offense level by a number of factors, such as whether bid rigging and other aggravating factors were involved, and by mitigating factors as well. This adjustment results a pair of “culpability multipliers” that are between 0.75 and 4.0. The product of the base fine (20% of the affected commerce) and the culpability multipliers results in the fine range that is to be imposed on a cartel member. Thus, the fine range recommended for convicted cartelists is at its lowest 15% and at its highest 80% of affected sales. These fines usually are adjusted downwards for cooperation or as a part of the Division’s leniency program. The USSC’s Commentary also notes that “In cases in which the actual monopoly overcharge appears to be

J. M. Connor Price-Fixing Overcharges 3rd Edition February 2014
13
purpose for specifying a percent of the volume of commerce is to avoid the time and expense that would be required for the court to determine actual gain or loss."24 As the Sixth Circuit noted, the Sentencing Commission “opted for greater administrative convenience” instead of undertaking a specific inquiry into the actual loss in each case.”25 The USSC appears to have adopted the 10% presumption because its use was advocated by the then-head of the Antitrust Division, Douglas Ginsburg.26 The origin of Ginsberg’s 10% figure is not publicly known. However, a prominent analysis of the issue by Cohen & Scheffman (1989) published shortly after the antitrust sentencing Guidelines were promulgated, asserts that the economic evaluation of only three price-fixing conspiracies was particularly important in shaping Ginsburg’s views. It says further that “…there is little credible statistical evidence that would justify the Commission’s assumptions which underlie the Antitrust Guidelines (p. 333).” If this analysis is correct, a critical assumption in setting cartel penalties in the United States is supported by a surprisingly small amount of evidence. The USSC’s 10% presumption was attacked as unreliable and overstated almost as soon as it was issued. For example, Cohen and Scheffman (1989) conclude “…there is little credible statistical evidence that would justify the Commission’s assumptions which underlie the Antitrust Guidelines … At least in price fixing cases involving a substantial volume of commerce, ten percent is almost certainly too high (pp. 343-344).” Moreover, the specific data that the Commission uses was characterized as exaggerated: “later research has cast considerable doubt on ... these estimates, concluding that the markups, if they existed, were quite small” (ibid. p. 345). Although the Antitrust Division of the DOJ has exclusive criminal powers in cartel enforcement in the United States, other federal agencies can be part of interagency task forces in especially large and complex prosecutions. In the investigations of the culpability of large banks in
either substantially more or substantially less then 10%” it might not employ the 20% base fine. But in practice the DOJ almost always uses the figure of 20% of affected commerce as their starting point in their criminal fine calculations. 24 See U.S. Sentencing Commission Guidelines For the United States Courts, 18 U.S.C. Section 2R1.1, Bid-Rigging, Price Fixing or Market-Allocation Agreements Among Competitors, Application Note 3. 25 See United States v. Hayter Oil Co., 51 F.3d 1265, 1277 (1995). The court noted: “The offense levels are not based directly on the damage caused or profit made by the defendant because damages are difficult and time consuming to establish. The volume of commerce is an acceptable and more readily measurable substitute...” 26 In a statement to the Commission, Assistant Attorney General Ginsburg stated that “the optimal fine for any given act of price-fixing is equal to the damage caused by the violation divided by the probability of conviction . . . such a fine would result in the socially optimal level of price-fixing, which in this case is zero”(USSG 1986:14). He stated his judgment that “price fixing typically results in price increases that has harmed the consumers in a range of 10 percent of the price...” and that these violations had no more than 10% chance of detection (ibid. p.15). Connor and Lande (2012) comment extensively on the appropriate detection probability for cartels and the other standard assumptions of the simple optimal deterrence model. For example, they consider the implications of risk-loving behavior of cartel managers or corporate cartelists in place oft he usual assumption of risk neutrality (ibid., pp. 432-455), and the implications of the prevent value of expected future monopoly profits and cartel penalties rather than nominal values (ibid.)

J. M. Connor Price-Fixing Overcharges 3rd Edition February 2014
14
collusion or manipulation of interest-rate indexes (LIBOR and others), currency exchange, bid rigging of municipal derivatives, commodity price indexes, and many other markets, the SEC, CFTC, Federal Reserve Bank, and the DOJ’s other divisions join together. Moreover, the DOJ can enlist the many Federal Attorneys and 55 State Attorneys General in common or parallel prosecutions of price fixing that can result in civil fines (Baer 2014: 1-5). Finally, the private damages suits that are launched against cartelists primarily provide compensation for victims, but also non-monetary injunctive relief and the possible punitive settlements that assist in cartel deterrence (ibid., Connor 2012). In the history of antitrust before 1990, the sum of all cartel penalties amounted to less than $100 million (Gallo et al. 2004).27 From 1990, a series of record corporate fines and other penalties were imposed for criminal price fixing by U.S. courts, most of which were prosecutions of international cartels (Connor 2011c).28 By the end of 2011, additional U.S. criminal price-fixing fines had reached $11 billion (Connor 2012). A similar upswing may be noted for fines imposed by the European Commission, the EU’s Member States, and a few antitrust authorities in Asia, Africa, and Latin America. This figure does not include legal fees, corporate reputational effects, or penal sanctions. The consensus of scholars is that current antitrust regimes are under-deterring price fixing (Ginsberg and Wright 2010, Harrington 2012, Connor and Lande 2012). However, some attorneys engaged in defending alleged international price-fixing conspiracies have argued that the Guidelines have resulted in excessive penalties. For example, just as the DOJ’s campaign against international cartels was gathering steam, Adler and Laing (1997) assert that “the fines being imposed against corporate members of international cartels are staggering (p.1)”, placing the blame on the “uniquely punitive” requirements of the U.S. Sentencing Guidelines.29 Denger (2003) too decries the prevalence of excessive price-fixing fines and private settlements. He places the blame for excessive fines on the Corporate Guidelines base fine calculation (p. 3). This approach, he notes, unlike all other white-collar federal crimes, means that the actual degree of direct harm caused does not have to be proven by prosecutors.30 Denger blames this state of affairs on a gap in the economic-legal literature: “…we have little information on what level of criminal or civil exposure is needed to deter most cartels (p.4).”
27 Although the Gallo et al. (1994) study covers only U.S. fines, cartel fines in other jurisdictions were negligible before 1990. This number is expressed in roughly 1982 dollars. 28 For the definition of the term “international cartels” and related concepts, see the section “Evolution of Definition of ‘Cartel’ ” below in the LITERATURE APPENDIX. 29 Adler and Laing are correct that the fining standards of the DOJ do not compute fines simply as a function of damages, but rather as a function of the company’s affected commerce, which is loosely related to damages. However, these authors do not document their claim that antitrust fines are harsher than other corporate crimes. In recent years, corporate fines for fraud and environmental crimes have greatly eclipsed antitrust fines. 30 Denger appeals primarily to an increase in settlement rates in treble-damage direct-purchaser suits to establish the unfairness of the high fines imposed on corporate price fixers, an increase that, he believes, cannot be explained by increases in overcharge rates. He cites about 8 domestic U.S. law cases that settled for 2 to 4 % of sales in the 1970s and one international case in 2001 that settled for 18 to 20% (pp. 3-4). It is argued below that settlements are inappropriate evidence of overcharges.
J. M. Connor Price-Fixing Overcharges 3rd Edition February 2014
15
Concern about the lack of empirical evidence on the size of overcharges caused by price fixing is not confined solely to those sympathetic to the increased exposure of corporate defendants. DOJ official Graubert (2003) notes that the controversy over whether antitrust payments are excessive is largely attributable to the “…difficulty of gathering useful data.” In a law-review article noting the sharp increase in U.S. criminal fines on international cartels in the late 1990s, Klawiter (2001) believes that these fines and other related antitrust penalties “…have substantially increased the level of deterrence in antitrust criminal cases” (ibid. p. 756).31 Yet, he laments the paucity of information needed to make a more sweeping conclusion. “There are no known applicable empirical studies on the adequacy of the present mix of criminal and civil antitrust sanctions from the standpoint of deterrence” (ibid. note 79). Other Jurisdictions U.S. antitrust enforcement has been a model for many other countries that have more recently adopted such laws (Wells 2002). Germany and Japan had antitrust laws imposed on them by the U.S. occupation authorities in the late 1940s.32 After a vigorous debate, Germany revised its competition law in 1958; it, in turn, became one of the principal influences on the adoption of a similar statute by the original six members of the European Economic Community (Goyder 1998:18-33). After four years of confidential political discussions 33 within the EEC’s Commission, Regulation 17 was passed in 1962; it lays out the powers of the Directorate General for Competition (DG-COMP) to fine companies for competition-law infringements (ibid. p. 45). That rule sets a maximum corporate fine of 10% of the company’s total sales in the year prior to the Commission’s decision and specifies that the specific fine will depend on the duration and seriousness of the offense.34 Harding and Joshua (2003: 240) state that EC fines are supposed to incorporate both compensatory and punitive components, the latter meant to serve deterrence. Methods of calculating EC cartel fines are explained in 1998 and 2006 Notices (Connor 2010a). Under the earlier guidelines, EC cartel fines were loosely related to overcharges because cartels with large damages that are geographically widespread and relatively large companies were given larger
31 Klawiter contrasts enforcement powers in the late 1990s with the clearly suboptimal maximum fine of $10 million available to the DOJ in the 1970s and 1980s. 32 Japan’s Antimonopoly Law was seriously weakened after 1953 by a perceived need for centralized industrial planning. However, it has been reinvigorated since the 1980s by the growing influence of the country’s consumer organizations and a new appreciation of the efficiency benefits of more intense market competition. Taiwan, Korea, and other East Asian countries have aspects of Japan’s antitrust law. 33 The practice at the time was for the Council of Ministers to appoint an Advisory Committee comprised of Commission civil servants to develop a report on proposed regulations of administrative practices. Although these regulations were essentially EEC laws, the Parliament had no role at the time. The Commissioner of Competition (a German) is often credited with drafting Regulation 17. 34 Rule 17 was amended in 2004, but these provisions were unaffected.

J. M. Connor Price-Fixing Overcharges 3rd Edition February 2014
16
fines. Since late 2006, EC fines have been computed using affected sales in the EU35; total fines have risen (Veljanovski 2010 and 2011); and they have become more severe (Connor 2010b). After considering a number of culpability factors, the Commission ensures that the fine does not exceed 10% of a defendant’s global sales in the year prior to the date of the decision.36 By 2010, U.S. and EU government and private monetary penalties amounted to at least $84 billion (Connor 2012). In early 2012, worldwide cartel penalties had surpassed $100 billion. Canada is another jurisdiction with relatively tough sentencing for cartels. Under a 1996 law, the Canadian Bureau Competition Bureau37 uses a fairly simple standard for setting fines. Although not spelled out in any administrative guidelines, decisions of Canadian courts have, in the absence of aggravating and mitigating circumstances, imposed fines close to 20% of Canadian affected sales (Low 2004, Connor 2003).38 A former Canadian prosecutor comments “there has not been any economic or judicial analysis of the assumptions behind this proxy for harm that this represents…” (Low 2004:19). Cooperating firms get leniency discounts, and recently recidivists have paid fines as high as 45% of affected sales, yet the large majority of convicted cartelists pay fines equal to 20% of Canadian affected sales. The Canadian 20% rule mimics the base fine of the USSGs. If Canada intends to punish cartels, then the presumed overcharge may also be 10%; if only compensation is the aim, then a 20% overcharge is assumed. Overcharges and Cartel Deterrence Concerns about the inadequacy or excessiveness of antitrust sanctions are part of the larger issue of the effectiveness of antitrust interventions. Most legal scholars accept that the fundamental objective of price-fixing laws is deterrence: that is, to minimize the future formation of new cartels or recidivism by previous cartel violators. To make any headway in assessing empirically the adequacy of anticartel enforcement, analysts must have reliable information about the degree of harm generated by private cartels. Antitrust sanctions should be calibrated to cartels’ overcharges. Total cartel injuries to purchasers are 35 Veljanovski (2011) demonstrated for a small sample (11) of recent EC cartel decisions that once the cartel’s share of the EU market and whether the offense was bid-rigging (both statistically positive), the gravity percentage is unaffected by the size of EU affected sales. 36 As the great majority of offenders are large multiproduct, multinational corporations, in only 6% of all cases does the EC need to make reductions because of the 10% cap (Veljanovski 2011: Table 7). Also, while previously quite rare, under the 2006 Guidelines about 7% of cartelists are granted reductions in fines because of a financial inability to pay (ibid.). 37 In April 2013 the Bureau was merged with another competition regulator and was renamed the Competition and Markets Authority (CMA). 38 Under Section 45 of Canada’s Competition Act, fines are limited to C$10 million, but foreign price-fixing conspiracies can be prosecuted under Section 46, which has no fine limit (Low 2004:17). Canada’s competition code was amended in late 2012 to impose much stiffer individual sentences for cartel offenses (Randles 2012). The maximum prison sentence was raised to 14 years, and judges will no longer be able to convert prison sentences to house arrest or community service (the universal practice prior to 2013). The burden of proof was lightened for prosecutors by removing a requirement that a perpetrator was “dishonest.”

J. M. Connor Price-Fixing Overcharges 3rd Edition February 2014
17
positively related to three economic factors: the size of the cartel’s market, the duration of the conspiracy, and the percentage overcharge. Cartel deterrence can also be affected by other enforcement rules. Amnesty programs and general investigatory procedures can increase the probability of cartel detection or reduce the duration of cartels. The sentencing guidelines developed in the United States, the EU, and elsewhere for fining hard-core cartels are consistent with the optimal deterrence standard first suggested in a seminal article by Becker (1968) and elaborated by William Landes (1983). Landes showed that to achieve optimal deterrence the damages from an antitrust violation should be equal to the violation’s “net harm to others”, divided by the probability of detection and proof 39 (Landes 1983:666-68). Critics of the U.S. Sentencing Guidelines suggest that their assumed average overcharges are too high. For example, Cohen and Scheffman (1989) argue that fines based on the U.S. sentencing guidelines, when coupled with civil and marketplace sanctions will cause “a serious overdeterrence problem” (p. 334). That is, they and other critics of the Guidelines believe that there is a disparity between the size of the corporate fines mandated40 for antitrust violations and the amount of the economic injuries caused by overt price fixing.41 Specifically, Cohen and Scheffman argue that actual overcharges are well below the 10% level assumed in the Guidelines (pp. 343-347).42 During recent years, their criticism has been repeated with perhaps even more intensity. For example, in a provocative essay that quickly drew rebuttals,43 Crandall and Winston (2003) argue that extant empirical evidence demonstrates that U.S. antitrust policy has been ineffective in deterring anticompetitive conduct. To support their view that the prosecution of overt price 39 In 1986, the Assistant Attorney General for Antitrust, Douglas Ginsburg, estimated that the enforcers catch less than 10% of all cartels (USSG 1986: 15). If he is correct, optimal penalties for cartels should be more than tenfold damages. See also the illustration of detection probability in Landes (1983: 115 fn. 1). The percentage of cartels that are caught and proven guilty is probably higher since the mid 1990s (Miller 2009). There is, however, neither evidence nor speculation that it exceeds 33%, either historically or at present (Connor and Lande 2012: Table 3). 40 Mandatory since their inception, the U.S. Sentencing Guidelines became advisory in January 2005. 41 Those critical of aggressive antitrust policy have often embraced the notion that cartels are fragile coalitions. However, empirical studies of discovered cartels from the 1920s to the early 2000s find that the average duration is between four and seven years (Zimmerman 2005; Levenstein and Suslow 2006). Modern international private discovered cartels continue to display the same average longevity (Connor 2009a). Legal U.S. export cartels – a sample unaffected by possible bias inherent in studies of prosecuted conspiracies – endured an average of 5.3 years (Dick 1996). 42 For larger price-fixed markets “…ten percent is almost certainly too high” (Cohen and Scheffman 1989: 343). This conclusion is contradicted by evidence cited in this article. In part, they rely on evidence of price-fixing settlements rather than awards made after trial; because settlements are the result of bargaining under uncertainty, reliance upon settlements biases overcharge estimates downward. My reading of their article turns up seven to ten overcharge observations. Despite the downward bias, the median is in the range of 8% to 14% (see Table 1 below). They also assert that there is “a sparse amount of economics literature” on cartel mark-ups, which is at variance with the scores of references in this paper published before 1989 (see Bibliography). 43 See Baker (2003), Werden (2003), and Kwoka (2003). According to Kwoka (2003: note 2), Crandall and Winston’s earlier drafts “… endorsed consideration of outright appeal of the antitrust laws.”
J. M. Connor Price-Fixing Overcharges 3rd Edition February 2014
18
fixing is misdirected, they cite five empirical studies of overt collusion that find no upward effects on prices of conspiracies convicted in U.S. courts.44 In his comment on Crandall and Winston, Kwoka (2003) faults them for their “startlingly selective” body of evidence. He suggests that they should have included “… studies from any source with appropriate evaluation of their credibility” (p. 4). There are few empirical studies of cartel deterrence. Even the most ambitious have focused on strictly national data (Connor and Lande 2012). Yet, since about 1995, a large majority of the overcharges generated by cartels have been international in membership and global in their geographic impact (Connor 2001a, 2003, 2008). To assess the likelihood of deterrence in the context of international schemes, worldwide monetary sanctions must be considered. Connor (2012: Figures 8 and 9) summarizes a large data set on the severity of penalties on global cartels during 1990-2010.45 He finds that total monetary penalties worldwide average about 11% of affected sales (higher in North America and the EU, lower elsewhere). Penalties disgorge at most 40% of the worldwide overcharges generated.46 Given that the odds of being caught are less than 100%, optimal deterrence requires cartel sanctions to be somewhat punitive. That is, disgorgement must exceed 100% of overcharges. Because it does not, punitive sanctions are the exception not the rule for illegal international price fixing. Clearly, information on both damages and penalties are needed on a worldwide basis. In sum, there does indeed seem to be a broad consensus among legal and economic writers that the question of the optimality of price-fixing penalties turns mightily on the actual degree of harm caused by cartel conduct, and that not enough is known about this issue. Moreover, even if the creators of the USSC Guidelines were correct that in the 1980s cartels generally raised prices by 10%, the harsher cartel sanctions imposed more recently could mean that this presumption is no longer justified. The contents of this paper could provide a factual foundation for dialogs on optimal deterrence and rational anticartel policies.
LITERATURE SURVEY
This paper was prepared by examining approximately 1500 social science publications and legal documents.47 Of these, 524 contained usable quantitative overcharge estimates.48 The major 44 Space constraints do not appear to be responsible for such a skimpy treatment of this topic, for they list 59 references. Somewhat inconsistently, Crandall and Winston do admit that the large DOJ fines meted out to cartels in the 1990s possibly deterred the most harmful cartels. They appear to refer to the lysine, citric acid, and vitamins cartels --international cartels with overcharges in the 15% to 40% range. 45 Severity for non-global cartels with international membership is similar but lower than global cartels in every jurisdiction (Connor 2012). 46 If adjusted for inflation and the time value of money, the 40% figure would be reduced by 20% to 40%. 47 Almost half of the publications seemed promising, but ultimately contained no useful information. 48 The References section below lists about 780 sources with useful information about private cartels. The 514 unique citations used for quantitative overcharge estimates are listed in Appendix Table 2.
J. M. Connor Price-Fixing Overcharges 3rd Edition February 2014
19
portion of the overcharge estimates included in this paper is taken from books, book chapters, conference proceedings, or papers published in economic, historical, and legal journals whose readers and contributors are mainly academics. The great majority of these publications are peer reviewed. A minority of the estimates are taken indirectly from newspapers, magazines, and similar journalistic outlets; from reports issued by governments; from academic working papers; and from decisions rendered by courts or antitrust commissions. This section focuses on the evolution of social-science concepts about cartels and their price effects. This section focuses on the evolution of social-science concepts about cartels and what I call “cartel studies.” In this report, the term cartel studies is reserved for empirical economic or legal analyses of real-world cartels and cartel enforcement. Cartel studies include historical examinations of the management and market impacts of a single cartel or groups of cartels, quantitative economic analyses of samples of cartels, or legal assessments of the effectiveness of actual anti-cartel cases or decisions. The present paper on cartel price effects falls within the definition of a cartel study. Early Cartel Studies in Brief Industrial-organization economics is the organizing theory of Adam Smith’s classic book The Wealth of Nations (1776), which signaled the emergence of economics (formerly called “political economy”) from other related fields of thought.49 Smith explicitly examined business collusion, which he called “a conspiracy against the public.” From 1880 to 1920 there were numerous debates over public policies to address market power, market regulations, and the “trust problem” (Martin 2007). However, these discussions were hampered by the exclusive reliance of the economics profession on the models of pure competition and monopoly.50 What changed in the 1930s was the development, slow at first, of conceptual models of oligopoly (ibid. pp. 6-11).51 At that point the sub-field of industrial economics was born and flourished. Cartel studies spent 70 years being practiced before it had a name. The empirical economics literature on cartels up to the 1940s is characterized by a groping towards a conceptual
49 The term political economy was coined in France (économie politique) in the early 17th century (ca. 1615), used in scholarly books, and adopted for the names of professorships, courses, and departments in the 18th and early 19th centuries in European universities (Groenewegen 1987). It is the antecedent field of thought for nearly all the modern social sciences, economics most particularly. In 1797 Glasgow University became the first to change the name of its department of Political Economy to Economics. It was not until the very late 19th century that economics became the preferred appellation in most academic institutions. The shift was signaled by the by the publication of The Economics of Industry by Alfred and Mary Marshall in 1879 in the UK and solidified in the United States by the founding of the American Economic Association and its journal, the American Economic Review, in 1890. 50 The exclusive attention to the theories of perfect competition, perhaps monopolistic competition, and monopoly (and the absence of oligopoly) prior to the 1920s is illustrated by the dominance of the English-language microeconomics textbook of Alfred Marshall (1890). However, a few oligopolistic topics are treated in Marshall’s largely empirical Industry and Trade (1919). 51 Although Cournot’s oligopoly model was published in 1838, it was more than 100 years before it was rediscovered (Martin 2007).

J. M. Connor Price-Fixing Overcharges 3rd Edition February 2014
20
understanding of the nature of private cartels and the first tentative steps toward quantitative evaluation of the market effects of overt collusion (for more details see the LITERATURE APPENDIX). Economic studies of cartels began in Germany in 1870s; books and articles written in German continued to dominate the literature through the 1920s. Among German scholars, the ideas of Smith, Ricardo, and the other classical economists spread only slowly during the early 19th century (Gerber 1998: 81-88). While the core concepts of classical economics continued to be accepted, during the late 19th century the “historical school” came to dominate the scholarship of German academic economists. The historical school emphasized the importance of unique temporal and institutional factors in explaining empirical phenomena; it consciously rejected abstract theories as a guide to empirical studies. Cartels were usually seen as an inevitable response to historical overproduction. Despite their understanding of the monopolistic tendencies of cartels, evaluation of cartels was almost solely from the producers’ perspective rather than consumers’ interests. Especially influential was the German economist Liefmann (1897, 1932). His concept of a cartel as a voluntary, contractual association of independent firms intent on profit maximization52 and monopolistic control of a market later became the accepted definition. An unfortunate legacy of the German historical school of cartel studies was its view that gauging price effects was either fruitless or impossible, a presumption that discouraged Continental European economists from attempting to estimate overcharges until the late 20th century.53 However, U.S. social scientists inherited a more pragmatic tradition driven by an awareness of the country’s new antitrust law, which was passed in 1890 after a long debate that highlighted the negative effects of cartels on small businesses. Court decisions interpreting the Sherman Act in the early 1900s stimulated further scholarship on cartels. As a result, most quantitative estimates of overcharges made prior to 1945 were produced largely by American social scientists.54 Some highlights include Jenks’ (1888) path-breaking analysis of the Midwest salt cartel; Jones’ (1914) book on the anthracite coal industry; Edgerton’s (1897) superb analysis of price effects of a short-lived but highly effective international cartel, the U.S. Wire Nail Association; Andrews (1889) sketch of what is quite possibly the world’s first global cartel, the Secrétan copper
52 An issue among economists up to the 1940s was whether cartels raised average prices in a manner consistent with monopolies or whether cartels simply stabilize price movements with no net increase in prices. Liefmann was in the minority that accepted profit maximization as the goal of a cartel. 53 Unlike most of his colleagues, who believed that price or output stabilization were the objectives, Liefmann accepted that raw-materials cartels typically did raise prices. However, Liefmann considered the price effects of industrial cartels an open question. While most of his contemporaries considered such calculations impossible, Liefmann took the position that precision was difficult because of simultaneous changes in demand and supply. The lack of attention to estimates of price effects may also have resulted from an absence of cartel suits in German courts. 54 An interesting exception is the book on Australian trusts by Wilkinson (1914), which grew out of that colony’s 1906 federal competition law modeled on the U.S. Sherman Act (Shanahan and Round 2008). However, the law’s requirement that collusive conduct had to be proven to have been to the “detriment of the public” lead to confusion in the courts.

J. M. Connor Price-Fixing Overcharges 3rd Edition February 2014
21
syndicate of 1887-1889; and Stevens’ (1912b, 1912c) study of the convicted Gunpowder Trust, notable for focusing on what was believed to be the longest-running discovered cartel in the Nation’s history (it lasted 35 years, of which 17 were illegal).55 Jenks and Jones were innovators in measuring cartel overcharges (see Box).
In the decade after World War I, hundreds of cartels were established (or re-established) in a wide range of commodities and industrial products, gaining control if nearly half of world trade in the 1930s. Nearly all of them operated in the open. Contemporary scholars now regard the Inter-War era as something of a Golden Age of Cartels. Yet, exceedingly few cartel studies by professional economists dates from this era. Post-World War II Cartel Studies During and immediately after World War II, a surge in publications examined the roles of cartels in international trade and in war production. Ervin Hexner (1946), a Czech refugee turned
55 The current world champion for endurance is the Indo-Ceylon-Pakistan Shipping Conference, which was established in 1875 and dissolved by the Competition Commission of India in October 2008 – a life of 134 years (Connor 2009b).
MILESTONES IN MEASURING OVERCHARGES
It is quite likely that the before-and-after method of computing a cartel overcharge is the most ancient. As will be documented below, it is by far the most popular. The author first in print with it was Jenks (1888) when writing about the second 1881-1882 episode of the U.S. Salt cartel centered in Michigan; he employed both before and after prices. However, the first to employ the relatively unusual intra-episodic price war is McCrosty (1907) when describing the 1898-1906 episode of the UK White Salt Union.
I credit Jones (1900) with being the innovator of the constant-cost (or constant-margin) method, which he first applied to the 1882-1886 U.S. Whiskey Alcohol cartel and to many others thereafter. As for the yardstick method, a good case can be made for Judge William Taft as the innovator in his famous Federal Court decision in Addyston Pipe (a cast iron pipe cartel in 1895-1896), though Jones (1900) book about the Eastern U.S. Sugar cartel was written at about the same year. Two publications mark the start of econometrics as a method for estimating overcharges. Sultan’s (1975) book on the Great Electrical Conspiracy in the U.S. apparently originated from testimony for defendants in damages trials in the early 1960s. Parker’s (1972) article on the U.S. concrete pipe cartel is the first peer-reviewed statistical study of cartel overcharges. An article on the U.S. milk cartel by Kwoka (1977) marked the beginning of a flood of econometric measurements of cartel price effects.

J. M. Connor Price-Fixing Overcharges 3rd Edition February 2014
22
scholar at a U.S. university, produced the most comprehensive economic study of international cartels yet published.56 Hexner had an insider’s knowledge of cartels (Barjot 1994: 65). Louis Marlio (1947), a French economist who wrote a detailed account of the international aluminum cartel, had a similar background (ibid. p. 66). Both of these authors found much to admire in the effects of international cartels, whereas post-World-War-II works by American authors tend to be distinctly more skeptical, if not hostile concerning the economic and political effects of the interwar cartels (e.g., Berge 1944, Edwards 1946). Although they may overstate the issue, Harding and Joshua (2003) draw sharp a distinction between the views held toward cartels of North American lawyers and lawmakers and those in Europe in the immediate decades following the War:
“…the North American approach has been, since the end of the nineteenth century, one of categorical censure [and] recourse to criminalization of antitrust violations as a central plan of legal control… On the other hand, the general European approach …has been altogether more tentative, more agnostic…and only in recent years moving towards an uncompromising condemnation of cartel activity…” (p. 40).
One finds these disparate but changing views reflected in the social-science literature on cartels. Perhaps the first publications to attempt to quantify systematically the price effects of cartels were a pair of books produced by a team of economists that had access to information handed over to investigators of Congressional committees and to criminal court proceedings (Stocking and Watkins 1946, 1948).57 These books were the culmination of eight years of study by a team of economists.58 They set a new intellectual standard for the economics literature on cartels, because they were the first to apply rigorous modern concepts of the emerging field of industrial economics; because of access to normally secret quantitative and organizational information spawned by numerous Congressional investigations, the Federal Trade Commission, and law suits; and because they were among the first to focus on the market effects of international
56 Hexner’s (1946) book spends dozens of pages toying with alternative definitions of “cartel,” ultimately adopting one quite close to Liefmann’s. 57 Stocking and Watkins had access to the results of a number of major investigations. The Temporary National Economic (or “Kilgore”) Committee published its hearings a few years before their books were published (U.S. Congress 1938-1940). Other Congressional committees investigated the munitions industry and patent pools. The authors also had information on U.S. criminal prosecutions by the Justice Department of more than 40 international cartels. 58 Stocking appears to have had overall leadership of the team. George W. Stocking was a professor at the University of Texas during 1926-47. He was appointed as the economic advisor to the new U.S. Attorney General Thurman Arnold in 1938, just as a revival of antitrust began after repeal of the National Industrial Recovery Act of 1933-1937. Stocking served as the co-chair of the Consent Decree Section of the DOJ through at least 1943 (Mueller 2007: 187-188). It was in the early 1940s that the DOJ investigated the many international cartels that would be formally indicted by the DOJ in 1944-48. As there were few if any economists employed by the DOJ, Stocking played a role something like the first Chief Economist of the DOJ. Both at the University of Texas and at Vanderbilt University (1947-1963), Stocking mentored many students who became leaders in the fields of industrial organization economics and antitrust law, including my mentor Willard F. Mueller (Anon. 1976, Marion 2007).

J. M. Connor Price-Fixing Overcharges 3rd Edition February 2014
23
cartels.59 Numerous and continuing citations to their books by leading contemporary scholars attest to their status as seminal works and classics in the field (Mueller 2007: 188). The increasing evidence of negative impacts of cartels during 1920-1945 began to bring about a reappraisal of the welfare impacts of cartels among Europeans just after World War II. In Germany, there was a healthy parliamentary debate over its cartel laws in 1951-57 (Wells 2002:165-74). Through the early 1950s, a majority of the UK’s manufacturing output was affected by cartels (Symeonidis 2002, Swann et al. 1974). The reconsideration of the benefits of cartels by Europeans began around 1950 with a series of empirical studies by the Monopolies Commission, which investigated the structure and performance of British industries and made recommendations to the government about restrictive practices, dominant firms and mergers.60 By the late 1950s, anticartel legislation had been adopted that placed the burden of proof on cartels to prove the economic benefits of their price fixing and related conduct. Germany was the prime mover behind the adoption of tough anticartel provisions in the Treaty of Rome, which solidified the antitrust tradition in the EU and its Member States. In the second half of the 20th century, relatively few books were written about the empirical economics of cartels, but there have been three brief periods of interest.61 First, there was intense but short-lived U.S. interest in domestic cartels when the “Great Electrical Equipment Conspiracy” burst onto the Nation’s consciousness in 1960-1961. 62 The great electrical equipment conspiracy resulted in the release of more publications in a few years than any other single historical event since the beginning of cartel literature. The scope of the conspiracy, the fame of the leading companies involved, and the U.S. Government’s aggressive prosecution of the violators – all these factors lead to a degree of public fascination and publicity about an antitrust action not seen since the Supreme Court decisions against the Standard Oil and American Tobacco trusts in 1911.63 Several trials provided unusually detailed pictures of the cartel’s organization. The books written about the heavy-electrical-equipment conspiracy include at least six monographs documenting the complex organizational details of these long-lasting and widespread bid-rigging conspiracies (Herling 1962, Smith 1963, U.S. Congress 1965, Sultan 1975, Epstein and Newfarmer 1980, and Bane 1973). Sultan’s books are by far the most 59 Technically, because one of the defendants was British American Tobacco, the 1911 conviction of American Tobacco et al. was the first U.S. prosecution of an international cartel, but the international character of the collusion was a minor aspect of the case. 60 I found 22 of these reports had useful overcharges estimates. 61 Overcharges were taken from about 50 books and chapters in edited books, of which 30 were published after 1950. Compared to the total number of economics books printed after 1950, the share of them devoted to cartel studies is smaller than before. 62 When the guilty pleas were receive in the Philadelphia U.S. District Court in early 1961, nearly every daily newspaper in the United States placed the events on their front page. 63 The conspiracies are notable for their duration (up to 40 years), the huge size of the sales involved ($7 billion per year in the late 1950s), the large number of well known companies involved (General Electric, Westinghouse, etc.), the record size of the fines imposed (over $2 million), the size of the damage awards granted from three trials and hundreds of private settlements (totaling $400 to $500 million) from more than 1900 suits, and the imposition for the first time of significant prison sentences for several top executives.

J. M. Connor Price-Fixing Overcharges 3rd Edition February 2014
24
quantitative. In addition, three journal articles were devoted to the cartels (Kuhlman 1972, Finkelstein and Levanbach 1983, and Lean et al. 1985). These studies have become staple references in textbooks in industrial organization (e.g., Carlton and Perloff 1990, 2005). Second, there was a brief revival of focus on international cartels after 1973 when the Organization of Petroleum Exporting Countries (OPEC) first used its power to raise crude petroleum prices.64 Many books and articles were written about the cartel. Two economic studies tried to predict OPEC’s staying power by studying previous international cartels.65 A chapter in a book by Eckbo (1976) is notable for its effort in classifying cartels according to a large number of potentially significant economic dimensions. One dimension is a binary variable that separates cartels with significant price effects from those that were ineffective in this respect. Another book chapter may be the most comprehensive quantitative study of cartel price effects (Griffin 1989).66 Griffin, who has several cartel studies to his credit, specifies a formal cartel model, which allows for a fringe of competitive, non-cooperating producers outside the cartel. From this theoretical model, Griffin derives a simple empirical model that explains variation in the Lerner Index67 of market power. Third, scholarship seems to have been stimulated by the large number of well publicized, U.S. and EU prosecutions of global cartels that commenced in the mid 1990s. Many of these cartels were organized by some of the world’s most recognizable multinational companies. The first global case in decades in both jurisdictions was Lysine, which was capped in the United States by a notorious 1998 criminal trial of three executives of the Archer Daniel Midlands Co. The trial record provided a degree of testimonial evidence that is unique for international cartels discovered after World War II (Lieber 2000, Eichenwald 2000, and Connor 2007b). EC 64 I do not include OPEC’s price effects in this survey because it was created and enforced by what amounts to a multilateral treaty organization. 65 George W. Stocking wrote a non-technical study in 1970 of the oil industry, Middle East Oil, that his biographer calls “prophetic” (Anon. 1976: 454). 66 Eckbo (1976) comes close. Eckbo studies 51 episodes in 18 markets, but does not really calculate overcharges so much as place them somehow in high/low categories; Griffin terms Eckbo’s approach subjective. 67 The Lerner Index is also computed by starting with the dollar overcharge in the numerator, just as one calculates the overcharge rate, except that the Lerner Index is measured by dividing the overcharge by the monopoly price instead of the competitive benchmark price. That is, the Lerner Index is a margin on the collusive selling price, while the overcharge is a mark-up on the competitive benchmark price. Thus, for the same cartel the Lerner Index is a smaller number than the overcharge ratio, though the differences are small for small overcharges. The Lerner Index is L = (P-C)/P, where P is the observed market price and C is the but-for or competitive price. Because C is equal to marginal cost in competitive equilibrium, L is also a profit margin on sales. L is zero in perfectly competitive markets and has a maximum value of one. The monopoly overcharge is a mark-up: MO = (P-C)/C. MO is also zero in perfectly competitive markets, but can approach positive infinity when C is very small. Because P is always greater than or equal to C, MO is greater than L whenever L is positive. If the but-for scenario is perfect competition, the simple algebraic substitution allows one to express MO as a function of L, viz., MO = L/(1-L). Alternatively, L=MO/(MO+1). If, however, the but-for state of competition is effective noncooperative oligopoly, then the overcharge conversion will overstate the Lerner Index (Boyer and Kotchoni 2012). For that reason, we include Lerner Indexes in the sample of overcharges without conversion. This will cause averages of overcharges to be understated.
J. M. Connor Price-Fixing Overcharges 3rd Edition February 2014
25
decisions have become major sources of information about contemporary cartel conduct (Harrington 2007). After about 1973, many empirical analyses of cartel effects began to appear in professional academic journals. The shift away from monographs to journal papers is remarkable. Of the 125 journal papers with useful overcharge information, 88% were published after 1973.68 While a few are historical narratives69, the later articles tend to focus on statistical tests of theoretical hypotheses or demonstrations of the superiority of a novel estimation technique. In general, these journal papers supplied only about one-fifth of the estimates in the vast literature in economics that measures the price effects of cartels. It is small because external information is needed to identify markets in which sellers overtly colluded from the much larger number of markets characterized by presumptively tacit collusion. These papers for the most part depend heavily on statistical methods of analysis. Around the early 1970s, statistical methods started to become standard for proving cartel damages (Finkelstein and Levanbach 1983). Other important sources of scores of overcharge estimates are the decisions of courts and competition-law commissions, most published since 1990. Quantitative Estimates of Cartel Overcharges Statistical methods and regression analysis in particular have been employed in nonexperimental empirical economic analyses since at least 1928.70 By the 1960s, regression analysis was a required subject for economics Ph.D. graduates. While regression analysis and other market simulation methods are not new methods of computing overcharges, they are more precise and objective. Most cartel studies published in academic journals since about 1974 use econometric methods to estimate overcharges. The first published work that uses econometrics to estimate a cartel overcharge is Sultan’s (1974) analysis of the U.S. electrical equipment conspiracy of the 1950s. Fisher (1980) and Finkelstein and Levanbach (1983) show that experts in U.S. civil trials as early as 1970 were presenting econometric evidence of price fixing. Econometric evidence on monopoly overcharges was also published to critique government-enforced compulsory cartels; Kwoka (1977) is the first of many analyses of the price effects of agricultural marketing orders. However, quantitative analyses of the size of buyers’ cartels’ undercharges are rare; Daggett and Freedman (1985) seem to be the first to publish such a study. Sophisticated econometric 68 In addition to journal articles, this study draws upon numerous working papers of economists, many of which became journal papers. 69 Elzinga penned an influential survey (1984). Elzinga’s paper was intended to mark the 10th anniversary of the DOJ’s antitrust Economic Policy Office, but was in fact at the time a rare survey of the state of the economics profession’s views of cartels. It focuses almost entirely on the huge impact of Stigler’s formal model of collusion and pays little attention to empirical developments, which were few either in economic publications or in enforcement. Joshua (2006) quotes Elzinga’s non-technical paper at length and cites it as an inspiration to him when he became a new EC cartel hunter. 70 I believe that the Columbia University Ph.D. dissertation of the great agricultural economist Frederick Waugh (1928) was the first to employ the technique. He measured the hedonic value of characteristics of fresh vegetables.

J. M. Connor Price-Fixing Overcharges 3rd Edition February 2014
26
modeling has spread into historical studies of cartels: a notable pair of studies by Hausman (1980, 1984) examines two UK coal markets from 1699 to 1845. Levenstein (1997) analyses the century-old bromine cartel. Genesove and Mullin (2001) is a rare example of a widely cited historical cartel study that does not employ statistics. A new development in the cartel literature was the statistical analysis of auctions and bid rigging, much of it inspired by the urge to test game-theoretic notions (Porter 2001 surveys this literature). Howard and Kaserman (1989) study collusion in public tenders for sewer construction; Froeb et al (1993) federal-government procurement of frozen fish; Brannman and Klein (1992) state road-building contracts; and Lee (1999), Porter and Zona (1999), and Pesendorfer (2000) school-milk procurement. These studies were made possible by U.S. “freedom-of-information” laws that mandate public access to bids for public project tenders. Although such laws exist outside the United States, few have been used to obtain data on bid rigging of public tenders. Novel methods continue to be applied to estimating cartel mark-ups. There is substantial work focused on understanding cartel stability from which price effects can be derived. Grossman (1996) looked at the 1851-1913 railroad express delivery market, and several have studied the 19th century Joint Economic Committee railroad cartel (Porter 1983, Briggs 1992, and Ellison 1994). Bajari and Ye (2003) applied the Bayesian statistical method to a U.S. seal-coating conspiracy. Clarke and Evenett (2003) apply a trade model to importing countries to estimate price increases during the 1990’s bulk vitamins cartel. Dynamic estimation methods have begun to yield insights into cartel conduct (e.g., de Roos 2006). Zona (2011) has invented a structural method for estimation. Surveys of Cartel Price Effects Given the importance of the topic for legal-economic discourse, there have been surprisingly few compilations of the empirical findings of cartel overcharges. Economics textbooks devote limited space to the subject.71 I have been unable to find any research publication that has as its principal aim collecting or analyzing information on the price effects of overt collusion.72 However, I have found seven works that mention a significant number of studies of mark-ups due to overt collusion. The overcharges are assembled as a prelude to scholarly research or policy analysis, not as an end in itself; none claims to be a comprehensive survey. The seven surveys are summarized in Table 1.
71 Of the leading textbooks in industrial organization, Carlton and Perloff (1990) devote more space to cartels than most – almost 50 pages out of 852 total pages. This work mentions by name 60 cartels, most of them interwar, international cartels. Other textbooks have far fewer numbers of cartels cited. 72 Hay and Kelley (1974) authored a classic review of 65 U.S. price fixing conspiracies, which Fraas and Greer (1977) extended to 606 cases from 1910 to 1972. Both studies contain a wealth of information about the number of conspirators, duration, industry, and specific collusive methods employed. A comprehensive book by economists on competition-law decisions of the European Commission has extensive discussions of punished cartels (Russo 2010). However, none of these works covered the topic of price effects.

J. M. Connor Price-Fixing Overcharges 3rd Edition February 2014
27
First, the most comprehensive previously published quantitative study of cartel price effects appears in a chapter by Griffin (1989).73 He estimates a simple behavioral empirical model that predicts the Lerner Index of market power econometrically using three factors. The model was fitted to data on 54 cartel episodes of 22 cartels.74 The episodes span 1888 to 1984, but most were active during the interwar period, and all operated unconcerned about legal punishments.75 All but four of the cartel episodes (7%) were effective at raising price.76 Griffin (1989: Table 1) concludes that the mean Lerner Index for the 54 cartel episodes is 0.31, which is equivalent to a 45% cartel overcharge if the but-for scenario is perfect competition. Focusing on the 38 private cartel episodes, the mean overcharge is 54.4% (Table 1). There is a close, but not perfect relationship between measuring cartels price effects with the overcharge or the Lerner Index.77 If the but-for price is the purely competitive price or marginal costs, then the Lerner Index can be easily converted to an overcharge. The formulas for the two are the same, except that the Lerner Index uses the monopoly price as the numeraire, whereas the overcharge uses the competitive or benchmark price. That is, the Lerner Index is a margin on the collusive selling price, while the overcharge is a mark-up on the competitive price. Thus, for the same cartel the Lerner Index is a smaller number than the overcharge.78 If, on the other hand, the but-for price is supra-competitive (because the non-collusive regime was tacit collusion), then converting the Lerner index to an overcharge will overstate the correct overcharge. In practice, the two indexes are closely positively correlated. 73 Eckbo (1974) comes close. Eckbo studies 51 episodes in 18 markets, but does not really calculate overcharges so much as place them somehow in high/low categories; Griffin (1989) politely characterizes Eckbo’s approach as “subjective.” 74 An episode is a period during which a cartel’s agreement remains by and large unaltered. If an existing cartel renegotiates a previous contract so as to change participant composition, geographic area of influence, or significant new terms (e.g., market shares where none were previously allocated), then a new episode commences. Often, the demarcation between episodes is signaled by a return to more competitive pricing conduct, but in some instances expert judgment is required (see Levenstein and Suslow 2004a). 75 The sample in this paper excludes 16 of Griffin’s episodes that were government-sponsored cartels: Sugar I, Sugar IV - VII, Coffee I –I II, Tea I and II, Cocoa, Wheat I and II, Rubber I, Bauxite I, Tin III, and Nitrogen fertilizer I. That leaves 38 private cartel episodes in this paper’s sample. 76 That figure is consistent with present survey. 77 In my experience, the Lerner Index is strongly preferred by economists because it appears as an equilibrium condition in a large number of oligopoly models. Lawyers and legal scholars habitually write about overcharges because they are closely tied to cartel damages. 78 For example, if the competitive benchmark price is $1.00 and the cartel mark-up (or overcharge) is 5%. Then the Lerner Index L is (1.05 - 1.00)/1.05 = 0.0476 = 4.76%. However, if an overcharge is 25%, L = (1.25 - 1.00)/ 1.25 = 0.20 = 20%. If the but-for price is the perfectly competitive price, one can derive algebraically a one-to-one linear functional relationship between the overcharge (MO) and L; MO = L/(1-L).

J. M. Connor Price-Fixing Overcharges 3rd Edition February 2014
28
Table 1. Summary of Seven Economic Surveys of Cartel Overcharges Reference Number of Cartels Episodic overcharge Mean (%) Median (%) 1. Cohen and Scheffman (1989) 5-7 7.7-10.8 14.0 2. Werden (2003) 13 21 18 3. Posner (2001) 12 49 38 4. Levenstein and Suslow (2002) 22 43 44.5 5. Griffin (1989) 39 28.0 c 28.7 c 6. OECD (2003), excluding peaks a 13 21.6 14.0 7. Davies and Majumdar (2002) b 23 24.9-33.9 20-25 Total, simple average of seven above 127-129 32.4 27.1 Total, weighted average of seven 127-129 38.1 31.0 a) One overcharge in the OECD survey with missing affected sales (U.S. lysine) was converted to percentages using affected sales data in a published U.S. Court decision. One overcharge reported to be “more than 13%" was recorded as 14%. If a range, the midpoint is used for averaging. Three percentages cited to be “as high as” were omitted because they are not likely to be representative of the overcharge rate for the whole episode. The OECD report states that its sample median is “between 15 and 20%.” b) The present author did not discover this estimable survey until 2011, perhaps because of its title. c) Because one does not know what the benchmark prices are for these observations, I show average Lerner Indexes. If the benchmark is perfect competition, the mean and median overcharges would be higher, 53.2% and 38.9%, respectively.
Second, Cohen and Scheffman (1989) recognize that the average size of price-fixing overcharges generated by overt collusion is a critical issue in evaluating cartel fines. Their paper cites five to seven estimates for price-fixing cases from the 1970s.79 Third, a working paper by Werden (2003) cites 14 studies of cartel overcharges. All of his sampled studies examine conspiracies that operated after 1974, the first year in which cartels could be prosecuted as felonies in the United States; three studies examined international cartels prosecuted by the DOJ in 1996-97. Fourth, Posner’s (1975, 2001) treatises on antitrust law illustrate the social costs of cartelization, Posner assembles data on 12 “cartel price increases…[in] industries having well-organized (mainly international) private cartels” (Posner 2001:303), which he admits are “crude and probably exaggerated” (ibid. p.304).80 Given that Posner is an avatar of the Chicago School of economics, it is noteworthy that his estimates are among the highest of the seven studies.81 79 One of them (Block et al. 1981) is irrelevant because it quotes the ratio of out-of-court settlements to annual sales for several U.S. bread price-fixing cases. As Cohen and Scheffman recognize in footnote 66, both the numerator and denominator of this ratio are inappropriate indicators of an overcharge; nevertheless, in the text of their article, they persist in citing this ratio. 80 Moreover, I regard his inclusion of several studies in his sample as highly dubious examples of cartels; rather, they are well-executed, perhaps classic studies of market power from tacit collusion. These dubious studies are: Applebaum (1979), Morrison (1990, 1993), Barnett (1995), and Bhuyan and Lopez (1997). I have excluded these studies’ overcharges from all tables and figures in this paper, except Table 1. 81 The Chicago School of industrial economics is well recognized in textbooks (e.g., Martin 1994:8-11) and by members of the school itself (Posner 1979). The Chicago School generally maintains that sustained collusion by

J. M. Connor Price-Fixing Overcharges 3rd Edition February 2014
29
Fifth, Levenstein and Suslow (2006) focus on the determinants of success for both interwar and more contemporary cartels. Although the authors are modest about their accomplishment, this paper contains 21 estimates of price effects for international cartel episodes. The Levenstein-Suslow paper lists monetary or percentage overcharges generated by 17 cartels (ibid. Annex A). While not all of the survey responses can be converted to overcharge percentages, the usable responses represent an unusually authoritative compilation of data on mark-ups by contemporary cartels that have been prosecuted by courts or commissions.82 Sixth, an influential OECD (2003) report on private “hard-core” cartels reports on a 2001-2002 survey of its government-members on the economic harm caused by cartels recently prosecuted by the European Commission and several national antitrust authorities.83 Finally, Davies and Majumdar (2002: 52-67) critically survey 16 mostly econometric studies of price effects of hard-core cartels that they judge to be representative; in addition, they cite price effects from the decisions of one EC and six DOJ prosecutions.84 The overcharge estimates of the 126 to 128 estimates cited in the seven surveys are summarized in Table 1. The simple mean average overcharge across the seven surveys is 32.4% of cartel affected sales, and the median is 27.1%. If the seven surveys are given weights, equal to the number of studies they summarized, then the weighted mean overcharge is 38.1%, and the weighted median is 31.0%.
GENERAL DESCRIPTION OF THE SAMPLE Technically, the observed cartel overcharges collected for this paper are a sample of a larger population of cartel overcharges, both seen and unseen. The unobserved overcharges are the vast majority of the total for two reasons. First, since about the middle of the 20th century (and earlier
private firms alone is empirically rare. Posner’s (2001) insistence on widespread cartel success is a departure from the School’s normal themes. 82 In a few cases, the harm was reported as a monetary value and the size of affected commerce was missing, but I was able to find a reasonable estimate of the affected commerce from an alternative source. For example, the U.S. DOJ provided a monetary estimate of the U.S. harm caused by the international lysine cartel of 1992-1995, and I found the value of affected commerce in a sentencing opinion written by a federal judge in a criminal jury trial that convicted three of the cartel’s managers. I was able to derive 16 overcharge percentages, of which 12 were long run and 4 were peak. 83 A few non-members that participated in an OECD-sponsored “Global Forum on Competition” also submitted responses to the survey. “Hard-core” is a European term that refers to conspiracies that fix prices and/or quantities. Other cartels (soft core?) cooperate on information, technology, marketing, and the like. The distinction seems roughly to correspond to criminal versus civil violations under U.S. law. 84 These authors provide ranges of overcharge estimates in six instances, and for five other studies they mention the minimum effect. Two studies (Sproul 1993, Newmark 1988) find zero price effects. I use the ranges and the minima as given to summarize in Table 1. There is no bibliography provided, but the text citations make the sources fairly straightforward to pinpoint.

J. M. Connor Price-Fixing Overcharges 3rd Edition February 2014
30
in the United States) most cartels are clandestine. The great body of expert opinion is that in the past few decades fewer than one-third of all cartels are discovered by antitrust authorities (Connor and Lande 2012: Table 1). Second, among those cartels that never hid themselves or that were discovered by antitrust authorities, sufficient price data were unavailable (or of no interest to the writer) for roughly half or more.85 Thus, the sample of overcharges in this paper, while quite large, is no more than one-fourth of the total of all cartel overcharges. Because the sample of observed cartels may be different in some respects from the total population of all cartels, the features of the sample about to be described may be subject to “selection bias.” Only samples that are selected randomly from a list of the whole population are fully representative of that population, but that process is not possible in the case of cartels. Fortunately, a recent study from Germany suggests that selection bias may be minor. Haucap et al. (2010) compared all illegal cartels with state- or federal-authorized German cartels during 1958-2004, hundreds of the latter being permitted for a wide range of reasons.86 In terms of industry distribution, the legal cartels had a greater share in mining, textiles, machinery, and metals manufacturing than did illegal cartels. Surprisingly, there was virtually no difference in the average number of firms per cartel between the two types. The major difference was that the median duration of legal cartels, having state support, was 2.75 times the illegal cartels, and legal cartel with few members or in the food industry tended to be the most durable (ibid. p. 18). What Haucap et al. (2010) suggest is that the cartels sampled for this study may well be representative of all cartels, except for their endurance. The data are organized according to three levels of analysis: markets, episodes, and overcharge estimates. By “market” is meant the industry or product that was subject to price fixing.
(1) Markets are precisely self-identified by the participants in the conspiracy, though occasionally there are alternative names for the same market.87 The name of the market is eponymous for the cartel. The range of cartelized markets is impressive.88
(2) Episodes, discussed more fully in the Data Appendix, are distinct periods of collusion separated by price wars, temporary lapses in agreements, or changes in cartel membership or internal organization. Episodes may be adjacent in time or may be
85 Of the published cartel studies that I found from the periods when cartels operated openly (and for some export cartels up to the present time), about half were discarded because they contained no usable price data. In the Private International Cartels data set, which is comprise entirely of discovered cartels since 1990, for only about one-third can overcharges be obtained or computed. 86 Of the 360 cartels operating in 2004, 17% were permitted to set conditions of sale, 66% could set domestic quantities or prices, and 15% were export cartels. 87 For example, the “nitrogen” cartel is in fact dry salts of nitrogen used as fertilizer, not the gaseous form. The hugely successful “vitamins” cartel is best regarded as a series of overlapping ventures, each of which focused on one of 15 products. 88 There is no limit on the types of goods and service cartelized. Even spiritual services can become cartels (Axarloglou et al. 2012).

J. M. Connor Price-Fixing Overcharges 3rd Edition February 2014
31
separated by significant gaps of time.89 The markets marked by adjacent multiple episodes will typically be regarded by antitrust law as one infraction, but as economic phenomena as multiple cartels. Because there are sometimes multiple publications about the same episode and because a single analyst will sometimes apply alternative methods of estimation, this paper often records several estimates for a single episode.
(3) Overcharge estimates are the most numerous and detailed level of observation in this study. Each episode will in principle have one true “average” (episode-long) overcharge and one “peak” overcharge.90 After examining the distribution of the three levels in this “General Description“ section, I find that the three result in similar information. Thus, most of the analyses in this paper will use overcharge estimates as the units of observation.
Number of Cartelized Markets My search yielded useful overcharge or undercharge information on cartels that operated in 532 markets (Table 2).91 If one group of sellers decided to fix prices of a product in one geographical region and a different group colluded on the same product in a separate geographical region, these may be counted as two markets. Of the 532 markets, 55% were cartelized by international agreements, where “international” describes the membership composition of the cartel and not necessarily the geographic spread of the cartel’s effects. Some international cartels affected directly the commerce of only one nation, though the vast majority was international in a geographic sense as well. National-membership cartels account for the remaining 45% of the cartelized markets.92 In this category I count some purely national price-fixing cartels that were formed for the sole purpose of controlling a nation’s export sales of a particular product; in the United States, these export cartels93 are called Webb-Pomerene Associations. In addition, some domestic cartels had side agreements with international cartels that protected their domestic market from exports from the international cartel’s members. 89 Episodes are in principle different from phases of cartels that give rise cartels instability. Episodes mark changes in cartel organization, whereas stability is measured by changes in the degree of cartel discipline or cohesiveness. 90 In the rare instances where a cartel kept the market price constant for the whole episode, the two overcharge concepts collapse to the same number. 91 A complete alphabetical list of these cartels may be viewed in Appendix Table 1 (see DATA APPENDIX) 92 A few markets were cartelized by both types; typically, a domestic cartel was expanded to respond to foreign competition. The potash cartel is one example; originally German, it became international shortly after World War I because after World War I potash mines in Lorraine became part of France. A joint Franco-German scheme was established to regulate world exports. Thus, after 1918 the two jointly administered national potash cartels became counted as international; however, the earlier pre-1918 domestic German episodes are classified as national. 93 Of course, if an export cartel is composed of companies drawn from two or more countries, then this cartel is categorized in this study as international. Some contemporary export cartels registered in Germany contain companies from several European nations. Price-fixing export cartels maintain the fiction that their activities do not affect prices in the “home country.” Most export cartels cooperate on merchandising or other non-price matters. For a survey of export cartels, see Levenstein and Suslow (2004b).
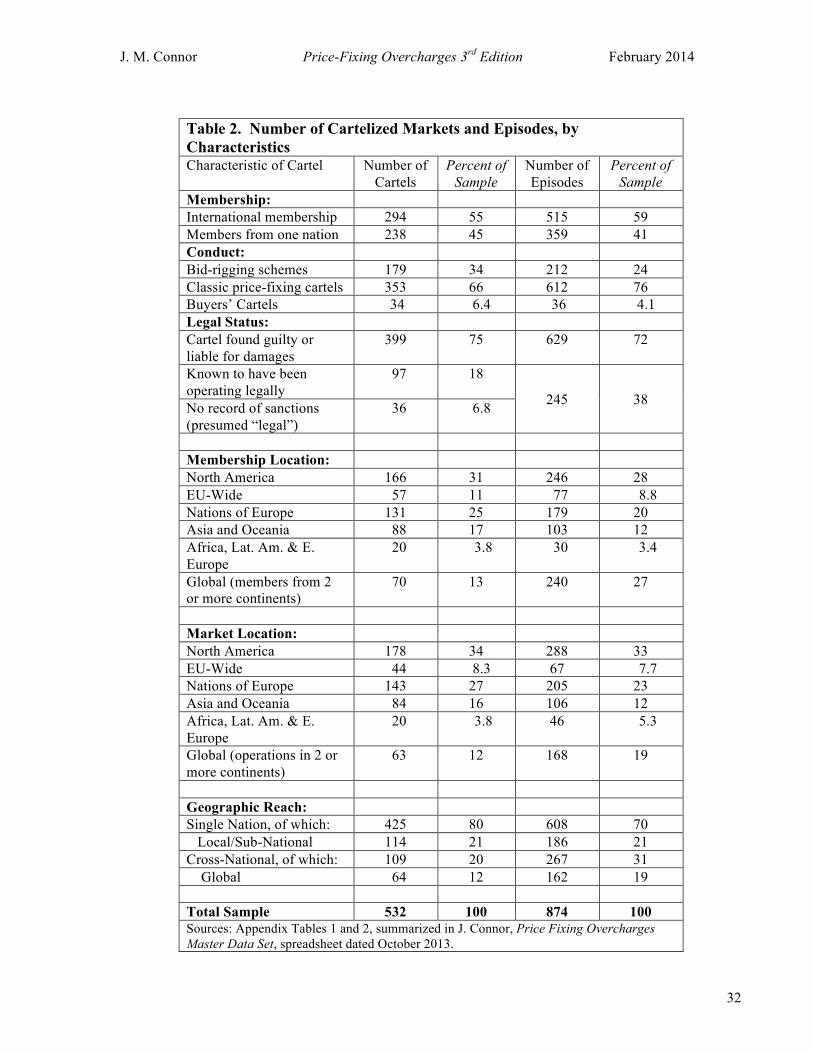
J. M. Connor Price-Fixing Overcharges 3rd Edition February 2014
32
Table 2. Number of Cartelized Markets and Episodes, by Characteristics Characteristic of Cartel Number of
Cartels Percent of
Sample Number of Episodes
Percent of Sample
Membership: International membership 294 55 515 59 Members from one nation 238 45 359 41 Conduct: Bid-rigging schemes 179 34 212 24 Classic price-fixing cartels 353 66 612 76 Buyers’ Cartels 34 6.4 36 4.1 Legal Status: Cartel found guilty or liable for damages
399 75 629 72
Known to have been operating legally
97 18
245 38 No record of sanctions (presumed “legal”)
36 6.8
Membership Location: North America 166 31 246 28 EU-Wide 57 11 77 8.8 Nations of Europe 131 25 179 20 Asia and Oceania 88 17 103 12 Africa, Lat. Am. & E. Europe
20 3.8 30 3.4
Global (members from 2 or more continents)
70 13 240 27
Market Location: North America 178 34 288 33 EU-Wide 44 8.3 67 7.7 Nations of Europe 143 27 205 23 Asia and Oceania 84 16 106 12 Africa, Lat. Am. & E. Europe
20 3.8 46 5.3
Global (operations in 2 or more continents)
63 12 168 19
Geographic Reach: Single Nation, of which: 425 80 608 70 Local/Sub-National 114 21 186 21 Cross-National, of which: 109 20 267 31 Global 64 12 162 19 Total Sample 532 100 874 100 Sources: Appendix Tables 1 and 2, summarized in J. Connor, Price Fixing Overcharges Master Data Set, spreadsheet dated October 2013.

J. M. Connor Price-Fixing Overcharges 3rd Edition February 2014
33
One-third (34%) of the sample consists of markets affected by bid-rigging cartels.94 Although many cartels have some sales to government entities or industrial customers that purchase by tenders, these cartels are explicitly described to have been principally or exclusively engaged in bid rigging. The proportion of bid-rigging schemes in the sample is probably underestimated because some sources did not always provide enough detail on the cartels to be certain of the degree of bid rigging. Recall that the U.S. sentencing guidelines assume that bid rigging leads to higher overcharges than otherwise identical conspiracies. The remaining 66% of the cartelized markets may be called “classic” price-fixing cartels, those that set market prices and/or market quotas for each or its members.95 Cartels may profit by attempting to either raise selling prices of their outputs or suppress the prices of their purchased inputs. Buyers’ cartels are often overlooked in the literature. I find that 6.4% of the cartels buyers’ cartels; that is, one out of ten of the price-fixing cartels fixed the prices of their inputs, not their outputs. This ratio is likely to be higher than many experts would have expected. Three-fourths of the cartels (75%) were found to be in violation of antitrust laws by at least one legal body.96 Sometimes these are called “discovered” or detected cartels. The determination of guilt or liability may take the form of guilty pleas (or nolo contendere in U.S. courts up until the early 1960s); of a decision at trial by judge or jury; of a commission decision to impose fines, consent decrees, or other sanctions; of the payments of civil penalties; or of negotiated settlements by defendants in a suit. Eighteen percent of the remaining cartelized markets are known or believed to be “legal,” because they operated prior to the enactment of antitrust laws in the jurisdictions in which they functioned or because they were organized and registered under antitrust exemptions, such as export cartels or ocean shipping conferences. About 7% of the cartels may be described as “extra-legal” because there was nothing in the case material indicating that an antitrust authority punished them. Who ran these cartels and where did they function? Regarding membership composition, the largest number (187 or 35%) hail from Western or Central Europe, of which about 40% were comprised of companies from a single European nation. The next highest number is North American cartels (165 or 31%), followed by Asian (16.5%), and rest of the world (ROW = 3.8%). The final category is one that will loom large in the discussion below – global cartels. These are the 70 cartels (13%) with at least two members from different continents, though typically North America, Western Europe, and East Asia are represented.
94 In Europe, bid rigging is generally referred to as collusion involving “tenders.” 95 Only a small number of cartels were oligopsonies. 96 Counted in this category are criminal convictions; adverse decisions of the UK Monopolies Commission, which made recommendations to the government similar to consent decrees; adverse decisions of the European Commission and similar civil authorities; and those cartels that paid court-approved damages. A few unfinished probes by antitrust authorities are placed in this category because 96% of these investigations yield convictions. Since 1990, virtually all the cartels in the sample are guilty; prior to 1990, the ratio is below 60%.

J. M. Connor Price-Fixing Overcharges 3rd Edition February 2014
34
The loci of operations are somewhat different (Table 2). The large majority of price fixing by cartels (80%) is directed within the boundaries of a single national jurisdiction (and one-fourth of that is more localized. The rest involves cross-national operations (and more than half of that is global). The largest single geographic category (34%) is North American cartels – those operating in the United States, Canada, or both markets. The second largest geographic group (27%) is cartels that functioned in only one nation in Western Europe; if these are combined with trans-EU cartels, then Western Europe is the largest continent with 35.1% of the sample. Global cartels (trans-continental cartels) comprise merely 12% of the sample; these tended to fix prices in North America, Western Europe, and Asia. Asian and ROW cartels (20%) tend to be domestic schemes populated by local companies. The apparently heavy location of cartels in only two continents is somewhat misleading. It is an artifact of the relatively early enforcement of anti-cartel laws in North America and Western Europe, giving rise to numerous well documented cartel cases that could be studied by academics in those regions. The numbers likely understate cartel activity in Asia and the ROW. Going forward, cartel numbers are more likely to reflect the geographical distribution of antitrust convictions and the local capacities to analyze the cases. Number of Episodes A more precise way of accounting for the distribution of cartel activity is by counting cartel episodes rather than whole cartels. This term episode is commonly used in modern cartel studies. If a cartel had more than one episode, then each episode is marked by a change in membership composition, the terms of the collusive agreement, method of management, geographic focus, or other major organizational innovation.97 In other words, when a cartel is re-formed, it adopts a new organizational configuration. The end of an episode is often instigated by expansion of fringe sales, by an intolerable level of cheating by cartel members, or by the appearance of a new process or product technology that redefines the market boundary. Between episodes, pricing discipline often breaks down; for some of the cartels the interregnum is a period of contract renegotiation. The inter-war global aluminum cartel, for example, went through six distinct phases from 1901 to 1939 that sometimes were adjacent in time and sometimes were several years apart. This heavily researched cartel has 28 overcharge observations (Appendix Table 2). The total number of episodes is undercounted. Some single episodes reported are in fact averages of groups of episodes. For example, one episode summarized the results of 109 bid-rigging convictions in numerous distinct fluid milk markets of the Southeastern United States that occurred within a few years of each other (Lanzillotti 1996). Each of the 109 convictions should be counted as separate episodes because each conviction represented a distinct buyer. Similarly, the long-running Dutch Construction cartels involved tens of thousands of rigged bids,
97 Because of the multiple dimensions that must be assessed, it is not unusual for experts to differ on the dates of cartel episodes.
J. M. Connor Price-Fixing Overcharges 3rd Edition February 2014
35
and the contemporary Auto Parts super-cartel98 encompasses more than one hundred parts and separate schemes for each part directed at several major auto manufacturers (Connor 2013a). For 49% of the cartels found, only one episode was reported. The Bulk Vitamins cartels had 78 episodes, or about five for each vitamin product. The most impressive single-product cartel was the Newcastle Coal cartel, for which 22 distinct episodes were recorded during its impressively long life from 1699 to 1845. An additional 17 cartels have had five or more episodes, most of them global commodity cartels. Table 2 shows several key characteristics of cartel episodes. They are generally distributed in a similar fashion to the cartels themselves (cf., Table 1). International cartels tend to have more episodes than non-international cartels, and this is especially true of geographically global cartels. So, while global cartels comprise only 13% of the sample, their episodes are 27% of the sample. On the other hand, bid-rigging cartels (34% of the sample) tend to have single episodes written up (24%). Number of Episodic Overcharges While many cartels have only one overcharge estimate, there are multiple overcharge estimates for a large minority of the markets. Consequently, for three reasons there are many more overcharge estimates than the number of cartelized markets (Table 2). First, about half of the markets experienced multiple phases or “episodes” for which the price effects differed. This term is commonly used in cartels studies. If a cartel had more than one episode, then each episode is marked by a change in membership composition, the terms of the collusive agreement, method of management, geographic focus, or other major organizational innovation. In other words, when a cartel is re-formed, it adopts a new organizational configuration. The end of an episode is often instigated by expansion of fringe sales, by an intolerable level of cheating by cartel members, or by the appearance of a new process or product technology. Between episodes, pricing discipline often breaks down; for some of the cartels the interregnum is a period of contract renegotiation. The inter-war global aluminum cartel, for example, went through six distinct phases from 1901 to 1939 that sometimes were adjacent in time and sometimes were several years apart. This heavily researched cartel has 28 overcharge observations (Appendix Table 2). The present study’s sample consists of 1530 cartel episodic overcharges. In the simplest and most common situation, a cartel has only one episode. However, about half of the markets experienced multiple phases or episodes; they had an average of about six episodes.
98 Connor (2013a: 2) defines a super-cartel as: (1) global in scope and (2) have a large number of distinct products (i.e., separate cartels) with partially overlapping corporate membership, and (3) direct their price fixing at customers in one vertical production-distribution channel. In short, supercartels have wheels within wheels. Super-cartels are rare.

J. M. Connor Price-Fixing Overcharges 3rd Edition February 2014
36
Researchers usually report the average price increases over a whole episode or a representative portion of it. Episodic averages are the measure most relevant for forensic99 purposes and are the measures that will be the focus of most analyses in this paper. Many, probably most episodic overcharges are conservative numbers.100 In some cases, the episodic prices are carefully weighted by the sales in each year or month of the episode, but in most cases the authors give equal weights to the price changes in each sub period during the total affected period. Sometimes it is not clear from the source whether the averages are weighted or unweighted; if the conspiracy period is marked by steady slow market growth, it matters little which is reported. Less commonly, some authors report minimum overcharge estimates. To be conservative, all minimum estimates are counted as episodic averages.101 If analysts give minimum and maximum estimates, I employ the center of the range for calculation purposes. The distribution of episodic overcharges across types of cartels is shown in Table 3. In general, that distribution is similar to the distribution of cartelized markets across cartel characteristics (cf., Table 2). International cartels tended to have above-average number of multiple overcharges than did domestic ones and bid-rigging cartels lower. However, global international cartels really stand out with 7.7 overcharges per cartel on average. The number of overcharges per market does not vary significantly across other type categories. Therefore, international cartels seem to be uniquely able to fall apart and reform, often with better internal organization than before. This ability to reform, renew, and regenerate new episodes is a major factor that accounts for the longevity of international – and especially global -- cartels. Two kinds of cartel mark-up data are available: episodic and peak. Peak overcharges are interesting because they indicate the effectiveness of cartels when internal and external conditions are briefly optimal. Comparisons of the two measures will be made in the “Peak Overcharges“ section below.
99 On the meaning of forensic economics in an antitrust setting, see Connor (2007c). For a survey of a broader meaning of the term – covering all hidden unethical behavior by economic agents – see Zitzewitz (2012). 100 Sometimes authors report monetary overcharges along with affected sales, in which case a true calculation of the percentage overcharge can be made (i.e., one that calculates the denominator by subtracting the dollar overcharge from affected sales). More commonly, authors provide a percentage overcharge that is understated because they divide the overcharge by total affected sales during the episode. Readers often are in the dark as to which method of calculation is used. 101 I have preserved these ranges in the appendix tables of Connor (2004b), but have used the midpoints of the ranges for the tables in this paper. The median ranges, if any, are quite narrow.
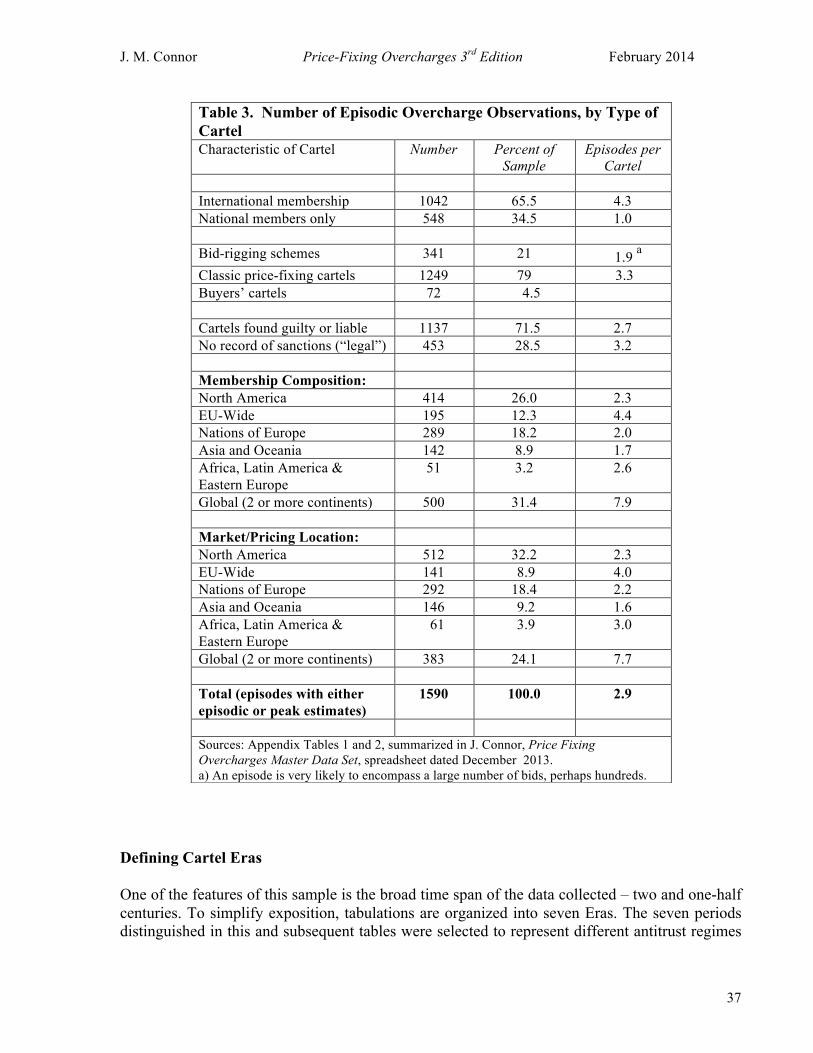
J. M. Connor Price-Fixing Overcharges 3rd Edition February 2014
37
Defining Cartel Eras One of the features of this sample is the broad time span of the data collected – two and one-half centuries. To simplify exposition, tabulations are organized into seven Eras. The seven periods distinguished in this and subsequent tables were selected to represent different antitrust regimes
Table 3. Number of Episodic Overcharge Observations, by Type of Cartel Characteristic of Cartel Number Percent of
Sample Episodes per
Cartel International membership 1042 65.5 4.3 National members only 548 34.5 1.0 Bid-rigging schemes 341 21 1.9 a Classic price-fixing cartels 1249 79 3.3 Buyers’ cartels 72 4.5 Cartels found guilty or liable 1137 71.5 2.7 No record of sanctions (“legal”) 453 28.5 3.2 Membership Composition: North America 414 26.0 2.3 EU-Wide 195 12.3 4.4 Nations of Europe 289 18.2 2.0 Asia and Oceania 142 8.9 1.7 Africa, Latin America & Eastern Europe
51 3.2 2.6
Global (2 or more continents) 500 31.4 7.9 Market/Pricing Location: North America 512 32.2 2.3 EU-Wide 141 8.9 4.0 Nations of Europe 292 18.4 2.2 Asia and Oceania 146 9.2 1.6 Africa, Latin America & Eastern Europe
61 3.9 3.0
Global (2 or more continents) 383 24.1 7.7 Total (episodes with either episodic or peak estimates)
1590 100.0 2.9
Sources: Appendix Tables 1 and 2, summarized in J. Connor, Price Fixing Overcharges Master Data Set, spreadsheet dated December 2013. a) An episode is very likely to encompass a large number of bids, perhaps hundreds.
J. M. Connor Price-Fixing Overcharges 3rd Edition February 2014
38
in the United States and abroad.102 In addition, the Eras correspond roughly to the major changes in the relationship of antitrust jurisprudence to economics (Kovacic and Shapiro 2000).
(1) Before 1890. The era up to 1890 is an obvious first period because of the enactment of the Sherman Act in the United States and the 1889 Anti-Combines Act in Canada. Prior to 1890, no effective antitrust statute had been passed, mainly because of weak sanctions.103 Except for a few export-trade cartels, international cartels were rare.
(2) 1891-1919. During the early decades of the 20th century, numerous U.S. court decisions made the scope and power of the U.S. anticartel law apparent to lawyers, enforcement officials, and businesspersons in the United States (Wells 2002).104 This period marks the emergence of significant numbers of international cartels. I choose the year 1919 as a break point because it represents the end of a period of intense interest by economists and U.S. antitrust activism. Because of World War I during 1914-1919 nearly all international cartels, a few of them with U.S. corporate members, ceased operating. Many of the prewar cartels were re-established after 1919, but in the majority of instances without the active participation of U.S. firms.
(3) 1920-1945. This period witnessed the appearance of hundreds of truly international private cartels – often dubbed the Golden Era of Cartels. During the Inter-War period U.S. antitrust enforcement retrenched, as did the empirical writings of economists. The year 1945 is another logical break point.105 During 1939-1945, nearly all of the interwar international cartels became infeasible and were disbanded; moreover, wartime price controls and cost-plus government contracts made cartels superfluous. Scores of U.S. criminal prosecutions of international cartels during 1944-1947 clarified for U.S. firms the illegality of many more subtle forms of cartel participation, such as patent pools, cross-licensing of technologies, and the creation of overseas subsidiaries as loci for cartel participation.
(4) 1946-1973. The post-World War II era is characterized by the emergence of industrial-organization as a separate discipline within economics, of rapid advances in empirical methods of analysis, and of the adoption of effective anticartel laws outside of North America. Kovacic and Shapiro (2000) note that in the United States by the 1940s “…there was considerable consistency between judicial decisions and economic thinking…” (pp. 51-52). Moreover, the vast expansion of higher education in North America and Europe brought about a parallel expansion of the economics profession as a whole and, consequently, an acceleration in the total resources devoted to theoretical
102 They are also convenient to chart changes in the historical views toward cartels or in methods of analysis. 103 There were written laws against price-fixing in ancient times (Assyria, for example), in 15th century England, and in revolutionary France. None is known to have been effective against private hard-core cartels. The Canadian Statute was largely ineffective until a 1986 revision (Low and Halladay 2011). 104 But few economists. The first time the Supreme Court took notice of the work of economists was in the 1925 Maple Flooring decision (Kovacic and Shapiro 2000:47). 105 While the world war interrupted international cartel cooperation, Berge (1944: 186-187) mentions that the 1901-1944 Match cartel had plans already drawn up plans to resume full collusion immediately after the War ended.

J. M. Connor Price-Fixing Overcharges 3rd Edition February 2014
39
modeling (particularly after 1980) and related empirical testing on collusion.106 While econometric methods began to be offered as evidence in U.S. courts around 1970, 1974 was the year the first econometric analysis of an overcharge appeared in a published work. The transition years 1945-1973 correspond with four relevant changes in anticartel enforcement. First, the antitrust idea became firmly implanted in the laws of countries outside North America for the first time: Germany and Japan in 1947, the United Kingdom in 1956, and the European Economic Communities (EEC) in 1958.107 Second, the European Commission (EC), the administrative arm of the EEC, after a decade of registering cartels, successfully prosecuted its first cartel in 1969. Third, U.S. price-fixing enforcement penalties became significantly more severe in 1974. A change in U.S. anticartel legislation was the 1974 law that made price fixing a felony, thereby lengthening maximum individual prison sentences and strengthening the bargaining power of the DOJ.108 Class action suits became far more common by the mid 1970s because of changes in federal court rules, a change that permitted plaintiffs to attract better lawyers and economic expertise (White 1988: Table 1.1). Fourth, Beginning in the 1960s, economists in North America began to work more closely with prosecutors and the private bar in antitrust cases, and many of them began to analyze and write about those activities. This is a major factor responsible for the fact that nearly 80% of the estimates of “national” cartels (most of them prosecuted in North America) are drawn from the post-1945 time period.
(5) 1974-1989. Kovacic and Shapiro (2000) identify 1973-1991 as the years during which the Chicago School of economics had its greatest influence on antitrust law and enforcement. The Chicago School was as hostile to cartels as the mainstream economists, but tended to be skeptical that cartels were widespread or durable market phenomena. In the 1980s, U.S. federal antitrust
(6) 1990-1999. By 1990, nearly all the present criminal sanctions available to the U.S. government were in place. In 1990, penalties for corporations rose from $1 million to $10 million.109 Moreover, in the early 1990s, the DOJ had in place three devices that improved detection and prosecution of cartels: the U.S. Sentencing Guidelines for corporations (1989), the automatic amnesty policy for corporate whistle-blowers meeting
106 Up until the mid 1990s, however, there is a notable absence of empirical publications by European economists working out of European research institutions. Obviously, there are many European analysts, most lawyers by training, located in EU and national antitrust authorities’ bureaucracies and performing cartel studies, but few of them publish outside of their governments’ official organs. 107 However, these were early, uncertain years for cartel enforcement: the EEC did not fine its first cartels until 1969. Moreover, elements of the EC’s bureaucracy outside of the Competition Directorate encouraged cartels in some industries. Jensen-Eriksen (2011) details how national paper-export cartels in the Nordic countries maneuvered successfully in the 1960s to form global paper cartels that affected most of Western Europe and North America. 108 Although the prosecution of price-fixing of relatively inconsequential domestic conspiracies was at a high level in 1974-1990, the DOJ did not give a high priority to investigating international cartels, nor did it have any success in the courtroom in the few international cases it did pursue (Connor 2001a). 109 Raised to $100 million in April 2004; maximum prison sentences rose from 3 to 10 years.

J. M. Connor Price-Fixing Overcharges 3rd Edition February 2014
40
certain criteria (1993), and a demonstrated ability since 1994 to impose fines above the $10-million statutory cap by means of an alternative sentencing provision. These devices were in some cases adopted by the EU and other antitrust authorities, which significantly improved the investigation and prosecution of international cartels. Both U.S. and EU prosecutions of international cartels increased markedly; both convicted global cartels for the first time.
(7) 2000-2013. The U.S. DOJ refined its ability to imprison non-U.S. cartel managers, and began an anti-cartel campaign that substituted prison sentences for corporate fines. The decade of the 1990s was when leniency programs were new and experimental; in the 2000s, leniency programs became standard features of antitrust enforcement worldwide. In particular, a flawed EU leniency program was revised and a new, more effective one put into place by the EC in 2001. EC Commissioners Monti and Kroes negotiated and implemented fining guidelines (2001 and 2006) that vastly enhanced EC cartel fines. Additionally, around 2000 the EU’s National Competition Authorities began to coordinate their activities and ramped up enforcement against international cartels. Some NCAs criminalized their price-fixing laws. Finally, around 2000 a dozen antitrust authorities in middle-income countries began attacking international cartels. Because of these shifts in antitrust enforcement, this paper distinguishes data of the decades of the 1990s from the 2000s.
To summarize, there are seven Cartel Eras distinguished in the present analysis: the years prior to 1890, 1890-1919, 1920-1945, 1946-1973, 1974-1989, 1990-1999, and 2000-2013. Connor and Bolotova (2006) demonstrated in formal econometric testing that these periods were significantly different with respect to the level of overcharges. Numbers of Episodic Overcharge Estimates Collected Over Time London Coal Cartels Identifying cartel episodes is sometimes a challenging proposition, even for the most experienced experts. Consider the several episodes of what is historically the longest-running documented cartel (or is it cartels?): the market for coal brought by coastal ships from northern England up the Thames River to London. This is an old market. Records of taxes paid on “sea coal” in London go back to 1213 – more than 800 years ago (Levy 1927:9). The London coal-buyers’ cartel that began as early as 1595 and persisted on and off for about 200 years. 110 The buyers were lightermen, wholesale coal merchants who were able to manipulate the prices paid to the owners of coal-laden ships in London’s harbor. The government took many ineffectual actions against this cartel. Acts of Parliament against bid rigging were passed in 1642 and 1665. Later, in 1729 a Parliamentary investigation found that ten lightermen controlled 67% of purchases in London, and the investigation report specifically
110 Coal was mined in many parts of Britain, but high land transportation costs conferred a monopoly on the Vend over a wide range of delivered London prices. UK coal-cartel studies with overcharge estimates include Ashton and Sykes (1964), Levy (1927), Sweezy (1938), Hausman (1980), and Tan (2003).

J. M. Connor Price-Fixing Overcharges 3rd Edition February 2014
41
blamed them for 1722-29 price increases. Moreover, price controls for London coal were legalized in 1744, to be administered by three judges. In 1788, a law made any agreements among or partnerships of more than five coal buyers illegal “combinations in restraint of trade.” Whether these laws had more than fitful, short-term effects on this buyers’ cartel is doubtful.111 A 1700-1702 coal bid-rigging episode in London is the second-oldest overcharge estimate in the present study.112 Sometime between 1700 and 1750, the locus of power in the London sea-coal market moved north. London consumers of coal were later exploited by a sellers’ cartel of coalmine owners.113 It is the Coal Gild of northeastern England (later known as the “Newcastle Vend”), which made its first recorded collusive agreement on London coal prices in 1699. In the early 19th century when the Vend was best organized, Tan (2003: 22) estimates that various episodes resulted in coal overcharges of from 12% to 16%. Although highly unstable, the Vend did not finally collapse until 146 years later in 1845. The two coal cartels operated for 250 years, making them the most durable in this study’s data set.114 Total Episodes over Time: International Cartels The total number of episodic estimates in this study is summarized in Figure 1. Because of the long period covered by the sample, the mix of overcharge numbers changes quite a bit. Except for a bump in the two decades following the 1890 Sherman Act and a drop in the Inter-War period, the total number of domestic cartel estimates is surprisingly constant across the seven Cartel Eras (Table 4). However, the number of international-membership cartel estimates tends to increase and peak twice: first in the interwar years (1920-1945) and then in the last 24 years (1990-2013). Although not shown, dual peaks for global cartels are even more pronounced than other international cartels in those years.
111 Reliable time-series price data (from the records paid for coal by London hospitals) begin around 1700. 112 I could not resist including one cartel from classical Greece (2300 years ago), for which I made a rough yardstick-approach overcharge estimate. For a lighthearted rendition of this cartel and the fatal consequences of the public trial by an Athens jury, see Connor (2007c: 31-34). 113 Mine owners who sent coal by coastal ships from Newcastle to London controlled this cartel. The number of mines was quite large at times. Output was reduced through closing smaller mines and paying the owners compensation (“side-payments”). The lightermen’s buyers’ cartel may have operated simultaneously with the Newcastle mine-owners’ sellers’ cartel during 1700-1750 114 When railroads from the Midlands reached London in the early 1840s, the Newcastle owners’ transportation-cost advantage disappeared and so did the Vend.

J. M. Connor Price-Fixing Overcharges 3rd Edition February 2014
42
Table 4. Number of Episodic Overcharge Estimates, by Year and Type Cartel Episode End Date
Membership Legal Status Bid Rigging
Classic Price Fixing
Buyers’ Cartels
ALL TYPES National Inter-
national Found Guilty Legal
Number Before 1890 78 5 47 36 8 75 1 83 1891-1919 109 51 42 118 43 117 1 160 1920-1945 30 169 60 139 1 198 5 199 1946-1973 84 32 73 43 42 74 5 116 1974-1989 79 36 96 19 53 62 9 115 1990-1999 74 386 436 24 74 386 15 460 2000-2013 76 326 360 42 144 258 34 402 ALL YEARS 530 1005 1103 432 330 1205 70 1535 Sources: Appendix Tables 1 and 2, summarized in J. Connor, Price Fixing Overcharges Master Data Set, spreadsheet dated December 2013.

J. M. Connor Price-Fixing Overcharges 3rd Edition February 2014
43
The increasing awareness of the illegality of price fixing in the United States likely accounts for the absence internal records of domestic cartels in the United States after 1890. Moreover, because the penalties were so low (a maximum of $5000 per count), relatively few court decisions bothered to give details about sales or prices during the conspiracy. During 1920 to 1945, for the first time, the majority of observations are drawn from studies of international cartels.115 The Inter-War period witnessed an explosion in global cartels, many of them Europe-based export cartels. During 1920-1945, 169 episodic overcharges of international price fixing were recorded; these cartels account for an impressive 85% of all episodes in the interwar period, a record-high proportion that still stands. During 1946-1989, discovered international cartels remained relatively scarce. Moreover, the 86 episodes of international cartel overcharges comprise only 29% of all of the episodes in that period. One can only speculate as to why global collusion apparently first became feasible in the 1920s and then later – during 1980-2000 – revived in popularity. The availability of improved international and trans-oceanic communication and transportation very likely played a role. International trade and foreign investment surged in the 1920s and 1980s. These conditions may account for intensified price competition or the formation of strategic conjectures about all the world’s major suppliers in an industry.
The post-World War II decline in total numbers of overcharges is also very likely due to an absence of convictions of international cartels by the U.S. DOJ in the 1950s to 1970s, aided by small numbers of private damages cases in North America.116 During these years, large U.S. businesses were rapidly expanding into overseas markets by means of largely unregulated horizontal acquisitions where they faced weak local rivals. Profits on these overseas ventures were higher than parallel domestic lines of business (Connor 1977). To American multinationals, illegal price fixing may have appeared less profitable than in prior or subsequent eras. A Harvard professor of international business who wrote several popular books went so far as to proclaim that “.... global cartels have passed into history“ (Vernon 1977: 75). Shortly thereafter, an experienced DOJ prosecutor averred that “.... the old-fashioned private international cartel.... is now rarely found“ (Rosenthal 1979). The inability of the DOJ particularly to discover international cartels persisted until the early 1990s, partly because of a federal-government policy decision enforced in the 1980s to focus on bid rigging in localized markets.117
115 Exceptions include USDA-overseen fruit and vegetable Marketing Orders. These USDA Marketing Orders were formed voluntarily in the 1930s by votes of their farmer-members, but once approved all producers must conform to the quality and timing restrictions imposed by the Order’s administrators. Few farmers are opposed to their continuing operation. Four overcharge estimates of marketing orders are in the data set. 116 The modern era in private litigation began around 1977 when the U.S. Rules of Civil Procedure were amended in ways that facilitated the formation of class actions; in Canada similar rules’ changes occurred in 1992. Economists are often spurred to write about cartels after serving as class-action experts. 117 The alleged blindness of the DOJ to international cartels is a frequent theme of Joshua (2006: 1-5), who credits the EC with moving aggressively against them as early as a decade earlier. However, it must be conceded that the EC, once it began employing unannounced visits (“dawn raids“) in 1979, held a considerable advantage over the DOJ in collecting inculpatory written evidence of international intra-EU collusion (Harding and Joshua 2003: 164-166). Both authorities faced similar challenges in obtaining extra-jurisdictional evidence of collusion until effective

J. M. Connor Price-Fixing Overcharges 3rd Edition February 2014
44
Finally, it is important to note the special role of global international cartels. There are 277 episodes of global-cartel overcharges, and these global estimates account for 18.3% of the total number of overcharge estimates in the sample. There are very few global-cartel overcharges prior to 1920. The first recorded global cartel118 is the Secrétan copper syndicate of 1887-1889. Although organized by four French and British firms, the syndicate cornered the supply of copper by signing long-term supply contracts with mine owners all over the world. The syndicate made profits when the contraction of supply forced up the price of copper contracts traded on European commodity exchanges (Andrews 1889). The cartel managers did not anticipated that supplies of Asian recycled copper that brought this pioneering global cartel to its end. It is noteworthy that nearly all the global-cartels episodes in the sample that ended before 1890 were metals or metallic ores, industries with very high fixed, sunk costs. Rates of Discovery Looking at total numbers of overcharges may distort the picture because the number of years per Cartel Era varies considerably. The annualized rate of overcharges observed may be more instructive. The number of observations per year has grown over time (Figure 2). The growth in the rate of episodes ending in 1990-1999 was extraordinary. The primary factor that explains the upward trend in the number of overcharges is the growth in the number international cartels with usable data (Figure 3).119 Up until 1890 when price-fixing was legal everywhere in the world, only one estimate is available about every six months on average. During this early period, the vast majority of price effects are reported for domestic cartels operating in the United States, the United Kingdom, and Germany. Although there were large numbers of domestic cartels extant in the late 19th century; the small size of the fledgling economics profession, a literary approach to writing in economics, and inevitable destruction of most business records over time contributed to the fewness of quantitative overcharge observations for 19th century cartels. From 1891 to 1989, five to seven overcharge estimates are available per year. The proportion of international schemes is especially high during the interwar period and especially low during 1946-1990 when most overcharges are from domestic cartels. It is likely that there were more domestic cartels operating legally in Europe in the early 20th century than there were international cartels, but the latter were given more publicity because they appeared to be novel forms of business organization.120 corporate leniency programs were instituted. After 1993 and up to the late 2000s, the DOJ seems to have held an investigatory and lead over the EC in pursuing international and especially global cartels. 118 The French-Belgian zinc national cartels that began in 1847 later morphed into a global cartel of four episodes during 1910 to 1963. 119 Although there is a dip in 1946-1990, the correlation between the number of episodic observations per year and a linear time trend highly positive. 120 When the UK, Germany, and the EEC began requiring registration of cartels in the 1950s, hundreds came forth in each jurisdiction.

J. M. Connor Price-Fixing Overcharges 3rd Edition February 2014
45

J. M. Connor Price-Fixing Overcharges 3rd Edition February 2014
46
During 1891-1919, there are 3.8 price observations per year; the rate rises to 5.6 per year in the interwar period. More data are available for international cartels during 1891-1945 than for cartels composed of companies from a single nation. About two-thirds of the observations are drawn from international cartels. One reason is that international cartels mostly were based in Europe, where they operated with legal impunity. That is, they had freedom to set monopolistic prices. Only in Weimar Germany for a few years after 1923 were cartels regulated. In a few European countries, cartels were required to register with the government. In others, cartel contracts were enforceable in the courts. Many of the interwar international cartels were organized as federations of national cartels and were aimed primarily at creating national monopolies and assigning shares for export sales.121 As nearly all of them were believed by their members to be legal at the time, the business press often openly reported their activities.122 Members of these cartels did not attempt to hide their activities; indeed they often publicized their operations, particularly if they achieved putatively efficiency-enhancing industry rationalization, protected national markets, increased national employment during stressful economic times, or promoted price stability. During this period, many countries passed legislation specifically authorizing cartels that controlled national exports, even if that meant agreements on prices in various overseas markets. In a few cases, including the United States, these cartels were used as cover organizations for domestic price-fixing. In the early and mid 1940s, many of the interwar cartels were investigated by the U.S. Congress, indicted by the DOJ, and sued by private parties. Combined with the expanding size of the economics profession and the growing interest among economists in imperfect competition, the transparency of non-U.S. cartels led to a large number of empirical cartel studies. For 50 years after the end of World War II, the number of known international cartels declined markedly. Perhaps because of the aggressive prosecution of cartels by the DOJ in the early 1940s, it appears that international cartels were by and large driven underground for decades after 1945. From 1946 to 1989 an average of five or six overcharge estimates could be found, nearly all of them domestic conspiracies. Few international cartels were discovered or prosecuted until the early 1990s -- less than one international cartel episode every two years.
121 I do not include national cartels that were fostered by governments (some governments even compelled all the companies in an industry to join) in this data set; likewise, I exclude many international commodity-stabilization schemes that were regulated by government ministries under parliamentary laws or came about because of a multilateral treaty. The second tea cartel in the 1930s, which was authorized by several parliaments of the British Empire and regulated by the Colonial Office, is one example of a “public” cartel. However, I do include a few international cartels with one or more members consisting in part of government-appointed committee members, government-owned corporations, or government-sanctioned national cartels, if they were formed by a agreement among the members. An example is the sugar cartel in the late 1930s. Many of the European export cartels also created national monopolies for their members. 122 U.S. companies apparently believed that patent pooling with foreign firms was legal; others joined cartels indirectly through controlled overseas subsidiaries. U.S. courts judged these and other subterfuges illegal.

J. M. Connor Price-Fixing Overcharges 3rd Edition February 2014
47
Several explanations have been offered for the hiatus in international cartel formation in the two decades following 1945. The destructiveness of World War II left the United States with as much as 65% of world industrial capacity in the late 1940s. As a result, manufacturers in Europe and Japan were oriented mainly toward rebuilding their domestic markets; not only were few industrial partners available for international agreements, it seems that U.S. firms were less prone to form cartels than firms from countries with no or weaker antitrust cultures. In the 1950s and accelerating in subsequent decades, U.S. firms embarked on a period of rapid foreign direct investment as the preferred means of entering overseas markets; leading European and Asian firms adopted this strategy increasingly after the late 1960s. Until the early 1980s, most United States markets were subjected to little import competition, but by the 1990s imports were exerting a powerful influence on price competition across a wide spectrum of commodity markets. Most international cartels have arisen only in industries with internationally traded merchandise and populated by multinational corporations with strong leading positions. For all these reasons and probably several others as yet unknown, international-cartel formation was seemingly at an historically low level until the 1980s. Since 1989, the number of overcharges available has exceeded 35 per annum on average – more than double the previous period. In part, this may be ascribed to the launching of an historically high number of international cartels in the early and mid 1980s. Many of these cartels could not have been contemplated without the direct participation or passive cooperation of leading U.S. companies in the cartelized markets. Other factors that may be responsible for the surge in overcharge estimates may include greater interest in collusive phenomena by economists, shifts in antitrust enforcement priorities, expansion in the sheer number of antitrust authorities worldwide, and improved cartel-detection programs. Guilty or Guilt Not Proven? A second important trend is that most cartel data now arise from prosecuted cartels (Figure 4). Prior to 1946, about one-third of the observations refer to cartels known to have been sanctioned.123 Prior to the 1940s, U.S. anticartel sanctions were weak by today’s standards, but increasingly after 1911 or so U.S. businesspersons became aware of the legal dangers of overt collusion in the domestic market. However, until the early 1970s national and international cartels comprised of European companies could form cartels subject only to registration requirements in most European countries (and in the EEC after 1960).124 123 This ratio may be deceptively high. Many durable cartels straddled eras that bridged shifts in public attitudes or antitrust enforcement. Almost all the sanctioned-cartel observations prior to 1890 derive from the Newcastle Vend, which was not “punished” until the 1830s when a British Parliamentary committee issued an unfavorable report but no further consequences. Later in the 19th century, Parliament again passed laws making coal price fixing illegal, but no monetary sanctions were levied. Similarly, the U.S. anthracite coal cartel operated for four decades before it was indicted. 124 Export cartels that in theory did not affect the jurisdiction’s commerce were permitted in the United States from 1918 and in most other nations throughout the 20th century. Today less than one-third of all countries permit export cartels, and many that have an antitrust exemption appear ready to repeal the loophole (Levenstein and Suslow 2004b).

J. M. Connor Price-Fixing Overcharges 3rd Edition February 2014
48
The European Commission began imposing fines on unregistered cartels that affected EEC trade beginning in 1969 (Harding and Joshua 2003:121). During 1974-1990, U.S. corporate sanctions on cartels became significantly more severe, and the European Union’s prosecutions moved in the same direction (Connor 2003). Both jurisdictions imposed historically unprecedented penalties on international cartels beginning in the late 1990s. After 1990, virtually all the observed cartels in the sample were prosecuted or fined by one or more antitrust authority. This pattern suggests a marginal improvement in cartel deterrence (albeit still sub-optimal), but it does not necessarily mean that the probability of discovery by prosecuting bodies has gone up.
However, it probably does represent a heightened aggressiveness in anticartel enforcement by a much larger number of authorities as well as more productive research methods by social scientists.125
125 In the last decade, announcements of probes, guilty pleas, and fines on cartelists are more and more to be found in convenient Internet sites and through Internet search engines than formerly.

J. M. Connor Price-Fixing Overcharges 3rd Edition February 2014
49
The proportion of estimates from cartels that were judged guilty by a competent antitrust authority rose very slowly until 1989, but reversed positions thereafter (Table 4). The large majority of the guilty-cartel overcharges occur in episodes ending after 1989. Before 1990, 47% of the episodic estimates were from guilty cartels, whereas after 1990, 92% were. It is likely that these estimates patterns reflect objective market conditions, i.e., the globalization of many markets in the early 20th century, recessions in the Inter-War period, and the surge in anti-cartel detection after 1990. Bid Rigging One other change in the mix of cartel pricing conduct may reflect the availability of data and the changing preferences of economists rather than objective market conditions. In particular, the number and proportion of episodes involving bid rigging increased markedly. Prior to the 1950s, overcharges could be located for only six cartels that primarily engaged in bid-rigging conduct.126 Before 1945, bid-rigging episodes accounted for only 12% of all sample overcharges; during 1946-1989, it rose to 41%; but after 1989 it fell to 25% (Table 4 and Figure 5). Rather than a doubling or trebling of the proportion of bid rigging in natural markets, a more likely explanation may lie in a reorienting of the research interest of economists.
126 They are four early episodes of UK copper smelting (1787-1867), coal lightermen in London ((1700-1729), a UK books auction (1919), military gunpowder (1851-1862), power equipment in Japan (1931-39), and cast-iron pipes in the United States (1895-1896).

J. M. Connor Price-Fixing Overcharges 3rd Edition February 2014
50
The well-publicized U.S. electrical equipment conspiracies discovered around 1957 and publicized in the early 1960s might have triggered awareness of the importance of bid rigging among economists. In addition, there were advances in economic theories of auctions that spurred interest in empirical testing the theories. Post-War studies of bid-rigging cartels focused on national cartels in the United States, most of them local milk or construction conspiracies. The immediate victims of most of these bid-rigging conspiracies were governments. Relatively few international cartels rely primarily on rigging auctions or tenders for public projects. What may seem like a refocus in research effort may also be a consequence of changes in data availability.127 Most of the articles on bid rigging have drawn on public records of state or federal agencies that have been the objects of these conspiracies. It is possible that the increase in bid-rigging cases seen in the data is simply due to the advent of open-records laws in the 1960 and 1970s at the state and municipal levels similar to the federal Freedom of Information Act.
ANALYSIS OF OVERCHARGES This section covers several topics. First, the number and pattern of overcharge estimates are explained. Second, a series of illustrations show the average heights of episodic overcharges according to analytically meaningful types. Third, the size distribution of overcharges is shown to be quite asymmetric, so special attention is focused on the highest overcharges responsible for skewing the sample. Fourth, I examine the relationship of peak to episodic estimates. Fifth, overcharges are related to geographic location, cartel size, and duration, Finally, I explore the size of overcharges from controlled market experiments. Number of Overcharge Observations There is a total of 2044 quantitative estimates of overcharges and undercharges drawn from about 350 publications.128 The sample consists of 1535 episodic (long-term) and 470 peak estimates (highest price achieved for one year or less). Every estimate is assigned to one episode. Of the 1589 price-fixing episodes in the sample, 1536 (96.7%) have only an episodic estimate129
127 In the 1970s many U.S. state passed laws releasing bids on requests for proposals under open record laws. The U.S. Freedom of Information Act and similar national laws elsewhere opened up valuable, large data sets on government tenders. See Hansen (1985) and Athey et al. (2011). 128 The same estimates sometimes appear in multiple publications (see Bibliography). Here I count only the total number of books, articles, and reports that contain one or more original estimates. The undercharges are entered as positive numbers. 129 By “an estimate,” I mean to include a point estimate, single range, or the midpoint of a range.

J. M. Connor Price-Fixing Overcharges 3rd Edition February 2014
51
and 53 (3.3%) have only a peak estimate, but 455 episodes (28.6%) have both types of overcharge estimates.130 A large majority (65%) of the episodic overcharge estimates are drawn from international-membership cartel episodes (Table 4). More than two-thirds of the estimates (71%) come from episodes that were legally sanctioned and almost four-fifths (78%) from “classic” price-fixing schemes. The smallest cartel type by far is buyers’ cartels (4.6%). The episodes may be classified according to their geographic extent or geographic region of operation. Of the episodic overcharges, 17% are local/subnational, 47% cover entire nations, 36% involved multiple nations within one continent, and 25% are global. In regional terms, the great majority of episodic overcharge estimates are drawn from Western European (30%) or North American (25%) conspiracies (Table 9). However, the share of episodic estimates drawn from episodes of global price fixing is also quite large (31%). Information on African, Asian, or Latin American cartels is relatively sparse. International-membership and global-international collusion tends to be more durable and to spawn far higher numbers of episodes per cartel than any other types of collusion. Twenty-three percent of the 2005 overcharge figures that were assembled are peak price effects. In some cases, the peak price was reached for only one day during a cartel episode; in other cases, the peak may be the highest one of several years; most often peaks were portions of a year. Peak price changes indicate the potential for maximum harm when a cartel is at its most disciplined or when market conditions were most congenial. Classifying a particular estimate as an average or peak figure in a minority of cases required judgment. If the original source is unclear about which type of estimate is being presented, in order to be conservative I have assumed it is a peak estimate. Peak estimates are separately analyzed below. Height of Episodic Overcharges by Type and over Time Table 5 and Figure 6 display the medians of all episodic overcharges, distinguished by membership type, legal type, mode of pricing conduct, and time period. Some readers may prefer median averages, because nearly all the cells contain negatively skewed figures. That is, a few very high overcharges in any particular category tend to overwhelm the larger number of low-to-medium percentages when calculating the more common type of average, the mean. Moreover, while there is no upper limit on overcharge estimates, they cannot fall below zero. In such situations, the means are larger than the medians, and the median may be a better representation of central tendency. The median cartel overcharge for all types and Cartel Eras is 23.0% and for effective (“successful”) cartels 26.0%.131 130 Note that 1536+455+53 = 2044. Tabulations of episodic overcharges have only 1535 observations because one overcharge is infinity. 131 “Successful” cartels are those with nonzero overcharges. In the earliest report of this research (Connor 2005a), the median average was 25.0%, but as more observations were added, mostly from cartels ending in 1990-2013, the overall median has declined.

J. M. Connor Price-Fixing Overcharges 3rd Edition February 2014
52
Table 5. Median Average Episodic Overcharges, by Year and Type Cartel Episode End Date
Membership Legal Status Bid Rigging
Classic Price Fixing
Buyers’ Cartels
ALL TYPES National Inter-
national Found Guilty Legal
Median percent a Before 1890 8.4 18.2 26.1 b 16.0 85.0 19.3 32.5 19.3 1890-1919 19.5 35.0 15.0 31.3 12.5 31.6 25.0 34.5 1920-1945 20.0 35.0 27.0 29.0 20.0 29.0 12.5 29.0 1946-1973 24.0 28.5 16.7 24.0 18.7 21.2 57.0 19.5 1974-1989 13.5 15.9 21.5 18.5 15.0 22.3 12.5 18.1 1990-1999 27.5 45.5 23.9 21.0 17.8 22.1 20.0 24.0 2000-2013 20.0 15.0 20.5 57.0 21.0 25.1 36.7 20.0 ALL YEARS 18.2 26.0 22.0 27.7 20.0 24.0 26.3 23.0 Sources: Appendix Tables 1 and 2, summarized in J. Connor, Price Fixing Overcharges Master Data Set, spreadsheet dated December 2013.
a) Medians of the point estimates or, where appropriate, of the midpoint of range estimates. Includes many zero estimates. See Table 4 for the numbers of observations in each cell.
b) Only three cartels (but with 47 episodes) were deemed guilty prior to 1890: Wholesale Grain Merchants in Greece (guilty by public trial), Anthracite Coal (by U.S. court), and Newcastle Coal (by the UK Parliament).

J. M. Connor Price-Fixing Overcharges 3rd Edition February 2014
53
I will demonstrate later below that the highest overcharge estimates are in no sense aberrations. They are generally taken well-conducted studies of cartel episodes that arose from monopolistically structured markets. These high estimates ought not to be rejected. Hence, the mean average, which is considerably higher than the median, also has a strong claim to represent the central tendency of the sample.
International-Membership Cartels The median overcharge for national cartels is 18.2%, whereas for international cartels it is 25.1% (38% higher). Measured by the mean averages, international overcharges are 56% and national are 35% (Table 5B). Regression analyses verify that international cartels have overcharges about 45% higher than domestic schemes (Bolotova 2009: Table 4). The strongest categorical pattern is that until the 2000s in every historical period international cartels have had higher overcharge rates than domestic cartels (Table 5). Up to the 1990s, international cartels were on average 133% more effective in raising prices than “national” (or domestic) cartels: those that fixed prices in one nation and were comprised of firms from that same nation. This is not so surprising in the pre-World War II era because most of the prewar sample of national cartels operated in the United States and achieved quite low
Fig.%7.%Mean%Episodic%Overcharges%by%Cartel%Type%
0%
10%
20%
30%
40%
50%
60%
NaConal%
InternaConal%
Guilty%
Legal%
Bid%Rigging%
Price%Fixing%
Buyers'%Cartel%
Percent%

J. M. Connor Price-Fixing Overcharges 3rd Edition February 2014
54
overcharges.132 But the fact that the differences persisted in the postwar period is somewhat unexpected. Besides antitrust-enforcement considerations, the greater pricing power demonstrated by international agreements may reflect a greater degree of freedom from threat of entry than for geographically more localized cartels. International cartels in all eras tended to attract members that controlled the lion’s share of production in all the regions of the world with modern production facilities. Also, international cartels by their very nature deal with internationally tradable commodities, mostly homogeneous producer intermediates with relatively low long-distance transportation costs. Finally, international cartels can more easily engage in third-degree price discrimination among national markets than cartels organized within a single geographic market. In the 1990-2005 period, the superior pricing power of international schemes ebbed. The median overcharge fell to an historical low of 24.4%. In a sharp break from the first five periods, overcharges of international cartels averaged only 16% higher than national ones. The reasons for the convergence of national and international cartel mark-ups are difficult to divine.133 Bid Rigging Schemes A somewhat similar difference may be seen in the higher median overcharges for classic price fixing over bid rigging. In the sampled cartels classic price-fixing conduct led to 32% higher median overcharges than observed for bid-rigging methods. Bid rigging cartels often are organized to exploit tenders for government public-works projects. Some economists have hypothesized that government buyers are less competent in detecting rigged bids than are professional industrial buyers.134 Relatively few international cartels engage primarily in bid rigging, so this conduct category may be confounded with geographic extent or industry type (most are found in construction). The apparently lower overcharges arising from bid rigging may be an illusion. Regression analyses suggest that overcharges from bid rigging are no different from classic price fixing (Connor and Bolotova 2006, Bolotova 2009). This finding has policy significance, because it undermines an assumption of the U.S. Sentencing Guidelines, which impose higher penalties for bid rigging. Most other governments have no stated guidelines imposing extra fines for bid rigging, but there is evidence that bid rigging of government tenders is treated more harshly (Connor 2009c). 132 Few international cartels in 1900-1945 had U.S. corporate members. Those U.S. companies that did join international conspiracies may have believed that they had structured their participation in international cartels in ways that would not run afoul the Sherman Act. 133 One possibility is the rise in exports of manufactures from China. Prior to 2005, there is no example of a Chinese company forming or joining an international cartel. One reason is that on average China’s large and fast-growing manufacturing sector is remarkably more competitively structured: The average CR4 in China in 2002-2006 was one-half as high as that in the United States, which is itself one of the most competitive in the world (Wang and Whalley 2014). 134 Cohen and Scheffman (1989:345) also cite low normal profits and declining demand.
J. M. Connor Price-Fixing Overcharges 3rd Edition February 2014
55
Sanctioned versus Unsanctioned Cartels The difference in median overcharges for “legal” versus guilty cartels is rather small; punished cartels achieve lower median overcharges overall, though not in most Cartel Eras (Table 5). Regression analysis verifies that there is no significant difference in overcharges by legal status (Bolotova 2009: Table 4). Contrasting cartels according to their legal status may shed light on “sample selection bias,” an important methodological issue in cartel studies. Many cartel studies depend on samples of convicted cartels, and critics of these studies have asserted that cartels discovered through government investigations or sued by private plaintiffs are as a group inept compared to cartels that either had no fear of sanctions or remained clandestine. “…[I]t is not known whether cartels that find themselves in court are unsuccessful or merely unlucky” (Carlton and Perloff 1990:216-217). In particular, an influential study by Asch and Seneca (1976) finds that price fixers that were caught in 1958-1967 were significantly less profitable during collusion than a control group of unprosecuted firms.135 Lower profitability ought to go hand in hand with relatively low overcharges. The data in Table 5 suggest a resolution of this paradoxical finding. Cartels punished in the time period covered by the Asch and Seneca study (1946-1974) were indeed relatively inept: their median overcharges of 14.3% are the lowest of the “guilty” cartels in any of the seven Cartel Eras. Moreover, their sample appears to have been drawn disproportionately from domestic bid-rigging conspiracies, the categories that throughout history have generated the lowest overcharges. While a more precise analysis is needed, it appears that the Asch and Seneca study may itself be flawed by sample selection bias. Buyers’ Cartels Blair and Harrison (2010) argue that monopsony and oligopsony are topics often given short shrift by economics and rarely addressed by the courts, in part because of the mistaken belief that if buyer power forces down prices below competitive level then consumers must benefit. In fact, if buyers explicitly collude on the price of a procured input, then an undercharge136 is likely to be imposed on suppliers that is symmetric to the antitrust damages created by overcharges on buyers from sellers’ cartels (ibid. pp. 157-163). In both cases, industry output contracts from the level that would be seen in purely competitive or noncooperative oligopsonistic procurement markets and allocative inefficiency is created.
135 The authors interpret their results in two ways. Firms are more likely to collude when industry conditions cause profits to decline, or cartels that are relatively ineffective at raising prices are also inept at hiding their illegal conduct and, consequently, the most likely to be detected and indicted by the antitrust authorities. 136 Oddly, this term does not appear in Blair and Harrison’s book. They stick to the more rigidly formal economic jargon of a “Buyer Power Index.” They do not present more than one or two examples of empirical power estimates.

J. M. Connor Price-Fixing Overcharges 3rd Edition February 2014
56
Blair and Harrison (2010) valiantly attempt to readers that buyers’ cartels are “...far more prevalent than many have recognized” (ibid. pp. 1-14). Restricting their purview to cases brought in U.S. courts137 or documented in publications by American economists, by my count they assemble a sample of 24 documented buyers’ cartels. Drawing upon a slightly older version of this work’s price-fixing overcharges data, Jing Liu (2011) statistically analyzed the prevalence and unique economic characteristics of buyers’ cartels. She finds four notable differences. Throughout history, only 5.5% of all cartel price effects were undercharges by buyer groups, but that ratio had risen from practically zero to above 8% after 1990 (ibid. Table 1). While sellers’ cartels are mainly in manufacturing, buyers’ cartels are preponderantly discovered in the food, tobacco, raw materials, and services industries (ibid. Table 4). Buyers’ cartels are much more likely to be domestic bid-rigging schemes than other cartels (ibid. Figures 8 to 10). Finally, the average price effects of buyers’ cartels are 33% weaker than those of sellers’ cartels (ibid. Table 11). Enlarging upon her work, I find that scholars have published studies on 70 cartel undercharges; that these comprise 4.6% of the sample; and that median undercharges are 19.8%, the lowest type-of-cartel overcharges (4A and 4B). Overcharges over Time Cartel mark-ups vary according to time period, but it is hard to tell from the raw data whether the 300-year trend is rising or falling (Table 5 and Figure 8). They are above average for two periods (1891 to 1945), below average during two periods (1946-1989, and closer to the all-periods average for the other three Cartel Eras (before 1890 and 1989-2013). Variation over time appears to be related primarily to changes in the mix of cartels types. For example, overcharges are relatively high when the time-period mix is rich in unpunished and/or international cartels but poor in bid-rigging cartels (cf., Table 4). Looking more deeply into the micro data (1531 episodes), a strong upward linear time trend in international-membership cartel episodes is apparent. 138 Episodic overcharges are slightly positively correlated with international membership (r = 0.06), but there is no evidence of a simple correlation of overcharges with any of the other cartel characteristics.
137 In some cases, plaintiffs were denied standing or lost their cases. 138 International membership is also bi-modal, rising sharply after 1880 and falling from a plateau after 1940 and repeating this pattern after 1989.

J. M. Connor Price-Fixing Overcharges 3rd Edition February 2014
57
A finding emphasized in this study is the superior price effectiveness of international cartels relative to domestic ones (and correspondingly the higher mark-ups of geographically expansive collusion over small-scale schemes). However, this disparity is disappearing over time. A steep secular decline in episodic overcharges is evident among international cartels. 139 Median international-cartel overcharges were an unequalled 53.0% prior to 1920. During the Inter-War period these cartels attained only average levels of price effectiveness; median overcharges fell by 31% compared to before 1920. Given the poor economic conditions of the 1930s, the profits generated by these cartels may have been satisfactory. But overcharges continued to decline by 43% in 1947-1989 and finally by 60% in 2000-2013 relative to pre-1920 levels. In fact, prior to 2000-2013 international cartel episodes had exceeded domestic ones in every period by large margins, whereas in the most recent 14 years their positions had reversed!140 Regression analysis confirms that, after changes in mix of types of cartels is taken into account, cartel overcharges were significantly lower after 1919 than before 1920 (Connor and Bolotova
139 It is rather odd that the notable surge in discovered international cartels after 1990 came at a time when the profit incentives for cartel formation were at an historic low (Connor 2003). Of course, if profits declined in the 1980s and 1990s, it is possible that the percentage increase in expected cartel profits was at an historic high point. Uctum (1998) presents evidence of just such a decline in the USA, Canada, Germany, and Japan from the 1950s or 1960s to the 1990s. 140 I do not often use explanation marks in professional writing. This is a most curious phenomenon that demands an explanation. Several experienced plaintiffs’ antitrust attorneys have conveyed to me privately their surprise at the historically low overcharges being estimated by economist-experts in high-profile global damages cases.

J. M. Connor Price-Fixing Overcharges 3rd Edition February 2014
58
2006: 1133). During the interwar period, overcharges were six to seven percentage points (about 20%) below the 1770-1919 reference period. During 1946-1989, overcharges were eight to 11 percentage points lower than the reference years. Finally, after 1989 – the era of strongest antitrust enforcement – overcharges declined about 40% below the pre-1920 reference period. While the temporal decline in cartel overcharges in undeniable, the historical forces responsible have not been pinned down. The rigor and geographic spread of antitrust enforcement seems to me the most natural candidate as the principal factor responsible, but other forces may be contributing.141 It is a challenge to explain the downward trends for some types of cartels. Besides the possible influence of the spread of effective anticartel enforcement, several alternative hypotheses may be put forward. Perhaps the application of more sophisticated quantitative methods by researchers in recent decades systematically yield lower estimates of price effects than the earlier studies that relied on simpler before-and-after comparisons. Perhaps expected profit rates in cartelized industries declined as the impacts of globalization were felt in formerly protected markets, and those companies that join cartels are satisfied with smaller percentage increases from collusion. Industry mix could provide an explanation. The sample drawn from the earlier periods tends to contain more minerals and metals conspiracies, whereas the later estimates have a higher proportion of chemical, construction, and services firms represented. Construction and services have historically returned very low profit margins. Because the most recent periods contain a higher proportion of cartels that were caught by antitrust authorities, the more recent estimates may be drawn from a population of cartels that is relatively incompetent in hiding their activities; similarly, the greater antitrust scrutiny in the United States from 1940 and from Europe since the 1960s could prompt cartelists to refrain from full monopoly pricing increases so as to reduce the chances of detection. Some of these hypotheses will be investigated below. There are significant differences in the height of overcharges when the sample is split according to three cartel characteristics: national or international in membership, bid-rigging or classic price-fixing conduct, and sanctioned or unsanctioned cartels history. In the aggregate and for all Cartel Eras, highest mark-ups are associated with international membership, classic price-fixing methods, and no history of official sanctions (Figure 6). The patterns evident from these tabulated overcharges have been verified by a more formal statistical analysis (Connor and Bolotova 2006). Unsuccessful Cartel Episodes It is worth noting that there are relatively few unsuccessful cartels in the data set. Only about 6% of the overcharges indicate that an analyst judged an episode to have produced no significant effect on market prices, even though the members had established an agreement in principle to fix prices. I do not wish to make too much of this percentage. It may understated because of 141 Globalization (through freer international trade and foreign direct investment) does not seem to be a strong alternative explanation. Most cartels appear in manufacturing. The rise of Asia as the world’s new center of gravity for manufacturing may have played a subtle role in international cartels. Most of these cartels discovered after the mid 1990s (but organized typically from the early 1980s or later) contained non-Chinese Asian companies. It is possible that these firms were more likely to cheat or, more likely in my view, were more likely to have lower long-term profit goals (before and during collusion). Chinese firms have been the biggest spoilers of international cartels since about 1990; if they should become joiners rather than remaining on the fringe, cartel formations will rise.

J. M. Connor Price-Fixing Overcharges 3rd Edition February 2014
59
selection bias in the studies relied upon. Injurious cartels may be inherently more interesting to analysts, because they are more policy relevant or the results more publishable than those about incompetent cartels. Not counting failures to discover a feasible contract, my intuition is that the true proportion of unsuccessful cartels (discovered and undiscovered) is likely to be higher than 6%. Commodity Cartels Recent research has discovered that so-called commodity (or primary-product) cartels are different from cartels at later stages of production. Commodity cartels are tied to the earth: they comprise the raw materials of mines, farms, or forests and the first-stage or primary processing of these raw materials (food processing, tobacco processing, basic metals, cotton and wool textiles, fertilizers, and wood). There are often tight geographic and vertical business relationships between these two stages of production. The major findings are that primary-product cartels as a group have declined radically as a share of the total, yet have achieved 31% higher overcharges than did secondary-product cartels Connor 2012a). The reasons for the latter result are unclear, but suggest that a greater effort should be extended to monitoring primary-product industries for signs of collusion. Size Distribution of Overcharges The cartel fining guidelines of several nations are based on formulas that are multiples of assumed overcharges (or proxies thereof), notably the EU and United States. Given the interest in the factual foundations of the U.S. Sentencing Guidelines applied to cartel sanctions, an examination of the size distribution of the overcharge estimates ought to be of interest. Figure 9 classifies the average estimates into eight size categories. Because the U.S. Guidelines are predicated on the assumption that the average cartel has a 10% overcharge, that break point is of special interest. The discussion of Table 6 focuses on the effective cartels (non-zero overcharges). Perhaps the most striking result is that 60% of the cartel episodes have overcharges above 20%.142 The remaining episodes have overcharges less than 20%. The mean overcharge of these episodes is 12%. These are the episodes imagined to be typical by the creators of the U.S. Sentencing Guidelines. By contrast, the 60% of the cartel episodes with overcharges of 20% or higher have a mean overcharge of 79.7%, which is eight times the level assumed by the authors of the U.S. Guidelines. 142 Note that from a legal perspective, each episode is an actionable offense. For the highest overcharges the implied own-price elasticities of demand are very large. One of the highest overcharges (800%) is for tungsten carbide, for which General Electric had a monopoly in the United States in 1927-1937. This newly developed material was sold at $453/lb. to most customers and at $360/lb. to a few favored buyers; up to 1927, Krupp sold it at $50/lb. in the United States and during 1927-1937 at $45 to $50/lb. in Europe (Stocking and Watkins 1948: 132). These numbers imply that the U.S. elasticity of demand was 81.5 to 64.8.

J. M. Connor Price-Fixing Overcharges 3rd Edition February 2014
60
The Guidelines were designed to deter recidivism, but even if one makes the wildly optimistic assumption that the probability of detection is 100%, five-eighths of the cartel episodes in the sample would have been under-deterred.
Table 6. Mean Average Episodic Overcharges by Size Category Percentage Range a
Number of Observations
Mean Average
Distribution of Observations Total Non-Zero
Number Percent Zero or less b 92 0 6.0 0 0.1-9.9 c 239 5.4 15.5 16.5 10.0-19.9 345 14.5 22.4 23.8 20.0-29.9 250 24.4 16.2 17.3 30.0-39.9 181 34.2 11.8 12,5 40.0-59.9 192 48.4 12.5 13.3 60.0-79.9 81 67.9 5.3 5.6 80.0-99.9 27 88.8 1.8 1.9 100.0-199.9 72 136.6 4.7 5.0 200 plus 50 563.9 3.3 3.5 Total 1540 48.7 d 100 100 Source: Appendix Tables 1 and 2, summarized in J. Connor, Price Fixing Overcharges

J. M. Connor Price-Fixing Overcharges 3rd Edition February 2014
61
Master Data Set, spreadsheet dated October 2013. a Point estimates or midpoints of ranges. b Undercharges are converted to positive numbers. c Four estimates of “weak cartels” are assumed to be 1% overcharges. d For effective cartels (those with positive overcharges) the mean average is 58.9%.
Looking in Detail at Extreme Observations As noted in the previous section, about 3% of the sample of episodic overcharges is 200% or higher. An anonymous reviewer and previous readers have expressed incredulity about these rates. Because they strongly affect the mean sample value143, I will examine them in detail. Are the high-overcharge cartels from unique historical periods? Were the data or analyses of poor quality? Do their other traits differ significantly from the rest of the sample? To answer these questions, Table A.1 isolates the 50 largest episodic overcharge observations and lists their essential characteristics.144 It also includes in the last column my subjective qualitative evaluative of the reliability of the estimates – something I have refrained from doing elsewhere in this report.145 The high-overcharge cartels tend to be drawn from older cases; their average beginning year is 1949 versus 1962 for the remaining effective observations. Another difference is that the high-overcharge cartels were on average two years more durable than the remaining cartels: 10.0 years as compared to 8.1 years. I would not ascribe the high estimated price effects to poorly executed analyses. Fully 75% of the grouped observations in Table 12 were rated from very good to excellent analyses. In terms of overall industrial mix, the high-overcharge cartels look very much the same as their lower-overcharge counterparts: a few raw materials, some services, but mostly manufactured intermediate inputs. However, closer look reveals that a large proportion of the cartelized products were new products in great demand as essential industrial inputs with few or no practical substitutes and that near-monopoly supply conditions obtained (Appendix Table A2). Ship owners relied almost exclusively on hemp cordage for their rigging in the late 19th century. With the use of natural manures, farmers worldwide have become dependent on phosphate and potash for fertilization of crops. Radium was highly prized as a novel illuminant for instruments in 1912-18 when world production was dominated by a duopoly. Incandescent light bulbs were 143 The reviewer suggested the 200% break point as worthy of special attention. The mean average of all 1,447 episodic non-zero overcharges is 51.02%. When the 49 overcharges of 200% or higher are excluded, the mean average drops to 32.57%, or by 36%. (The median average is very little affected: it falls from 24.8% to 24.0%). 144 See the APPENDIX: SOURCES AND COLLECTION METHODS below. 145 My assessment is based upon a combination of what I know about the quality of the price data available, craftsmanship in applying the method of overcharge analysis, professional reputation of the authors or organization responsible (if known), and evidence of balance in presentation of results (including peer or editorial review).

J. M. Connor Price-Fixing Overcharges 3rd Edition February 2014
62
also quite new consumer products in 1922-1941 in many parts of the world, and a global cartel effectively created territorial monopolies almost everywhere except Japan. The tungsten carbide cartel was a U.S.-German territorial duopoly for what was then patented and the hardest machine coating material available for four decades. 146 (Note also the large number of mutually supporting independent studies of high overcharges). I conclude that that is no reason to exclude the very high overcharges from the sample. They are high for reasons consistent with economic reasoning: very inelastic demand combined with duopoly or very tightly organized, monopolistic cartels and no threat of entry. Peak Overcharges So far, only the episodic overcharges have been examined – those that refer to the mean price change over all or most of a price-fixing episode. Figure 10 and Table 7 display over 500 peak price effects attained by cartels – the maximum, usually brief mark-ups observed for one week, one month, one quarter, or one year of an episode, depending on the price series available. It is not always clear from a source whether a price effect being reported is episodic or peak; if it is vague, the effect is classified as peak. It is well known that collusive arrangements typically generate price changes that fall short of what a pure monopolist in a blockaded market would set in order to obtain maximum profits. Tacit collusion generally results in prices that are above, but closer to competitive levels than to monopoly levels. While overt collusion should be somewhat more effective than tacit collusion at raising prices ceteris paribus, information failures, potential competition, and cheating also typically result in sub-monopoly price effects. Because the peak periods are generally too brief for significant changes in the structure of the industry to change, the observed peak overcharges are measures of the short-run market power exercised by cartels when the market-structure conditions are closest to optimal and the discipline of the members is at its most cohesive.147 Thus, the peak price effects are instructive about the potential harm that cartels can cause when they are unfettered by coordination problems. From Figure 10 it is apparent that on average the peak overcharges are 60% to 80% above the episodic overcharges for all types of cartels except buyers’ cartels. Table 7 shows the median peak overcharges in detail over time and across types of effective cartels. The highest median peak cartel mark-ups are from the interwar period.148 For all types of collusion, there is no trend 146 Tungsten carbide was simultaneously invented by General Electric and Krupp Steel in the early 1920s. Only industrial diamonds are harder, but natural diamonds were prohibitively expensive for most industrial applications until artificial diamonds were first marketed in the 1950s. 147 Peak price changes may well be affected by short-run shifts in demand. Exogenous, unanticipated shifts in demand may exaggerate the peak price changes. However, in some cases these shifts are endogenous. Especially when a well financed cartel felt free to announce a new agreement that buyers perceived as likely to be effective, “panic buying” often ensued, which amplified the purely collusive effect on prices. 148 Approximately one-fifth of the 413 observations available for Table 7 refer to interwar cartels, which have been well studied by economic historians who often had available public commodity-exchange prices. Forty-two percent of the observations on peak prices are for episodes ending after 1989.

J. M. Connor Price-Fixing Overcharges 3rd Edition February 2014
63
in peak effectiveness over time.149 There is a slight decline over time in peak overcharges of international cartels and a weak positive trend for bid rigging.150 The absence of significant time trends for peak overcharges reinforces the idea that these are proxies for monopoly overcharges.
The pattern of peak overcharges across cartel types is similar to that for the effective episodic overcharges (Table 7): (1) In all Cartel Eras, international cartels were able to reach higher levels of peak price effectiveness than the “national” cartels – on average 86% higher; (2) Peak mark-ups are also higher (68% higher) for legal cartels than for sanctioned ones; and (3) Cartels that fixed prices or production levels are 85% more harmful as bid-rigging agreements, both overall and in each of the seven Cartel Eras. Table 8 provides calculations of how much higher median peak overcharges are compared the median episodic overcharges. Generally speaking, the peaks are about 50% to 70% of the episodic mark-ups. There are no noteworthy trends in these ratios over time. However, the ratios for international cartels are far lower than domestic schemes, and lower for bid rigging than for classic price fixing. These ratios have a couple of interesting interpretations. First, a high ratio may be regarded as inverse indicators of pricing efficiency. An efficient cartel is one that has 149 The correlation of episode end year with peak overcharge for all 413 observations is not significantly different from zero. 150 The correlation over time (the end year of each episode) for international cartels is r = -0.102 and for national cartels r = +0.070; for bid-rigging schemes, there is a weak positive time trend (r = +0.085); but for guilty cartels, legal cartels, and classic price-fixing cartels, there is no time trend.

J. M. Connor Price-Fixing Overcharges 3rd Edition February 2014
64
achieved episodic prices that are close to the profit-maximizing (monopoly) price. That is, low ratios may be interpreted as cartels that achieved few operational problems or external challenges from customers or fringe producers. If this latter interpretation is correct, then peak/average ratio is a rough indicator of price instability during a conspiracy.151 Second, the international cartels and bid-rigging arrangements are relatively efficient. These hypotheses await formal tests.
151 These ratios could be relevant for assessing whether cartels intend to maximize profits through price increases (as most economists assume) or whether the goal is to control variation in their output or prices. Apologists for cartels, particularly those writing about international cartels during the Great Depression, tended to assert that cartels did not aim to raise prices so much as stabilize prices (Marlio 1947, Pyndyck 1979). There is little evidence in table 8 that the interwar, international cartels achieved greater price stability than those ending before or after the interwar period.
Table 7. Median Average Peak Overcharge Estimates, by Year and Type, Effective Cartel Episodes Cartel Episode End Date
Membership Legal Status Bid Rigging b
Classic Price Fixing
Buyers‘ Cartels
ALL TYPES National Inter-
national Found Guilty Legal
Median percent a Before 1890 55.5 114.5 46.8 64.0 21 b 65 -- 59.5 1890-1919 33.6 85.0 33.3 71.7 -- 51.3 430.0 51.3 1920-1945 48.0 72.0 52.5 72.0 50 b 69.0 7.6 67.0 1946-1973 45.9 53.0 49.0 45.6 42.6 59.0 42.8 49.0 1974-1989 27.4 74.0 29.4 315 c 27.5 70.0 11.3 31.0 1990-1999 23.7 50.0 49.0 16.7 44.0 48.9 21.9 48.9 2000-2013 30.1 45.0 50.0 30.5 40.0 18.2 7.6 38.8 ALL YEARS 33.3 60.5 45.0 67.0 28.2 52.9 10.2 50.0 Sources: Appendix Tables 1 and 2, summarized in J. Connor, Price Fixing Overcharges Master Data Set, spreadsheet dated December 2013. a) Medians of the point estimates or, where appropriate, of the midpoint of range estimates. b) Only four peak observations before 1946, so comparisons with classic price fixing are problematic. c) Three of the four estimates from the global Mercury cartel only; hazardous to compare with the guilty cartels.

J. M. Connor Price-Fixing Overcharges 3rd Edition February 2014
65
Table 7A. Number of All Peak Overcharge Estimates, by Year and Type Cartel Episode End Date
Membership Legal Status Bid Rigging
Classic Price Fixing
Buyers’ Cartels
ALL TYPES National Inter-
national Found Guilty Legal
Number Before 1890 17 2 4 15 3 14 0 17 1890-1919 54 30 25 59 0 84 0 84 1920-1945 16 72 31 57 1 87 1 88 1946-1973 24 19 23 20 14 29 3 43 1974-1989 26 25 44 7 22 29 3 51 1990-1999 16 119 130 5 18 117 7 135 2000-2013 29 58 79 8 32 55 13 87 ALL YEARS 182 325 336 171 90 417 27 507 Sources: Appendix Tables 1 and 2, summarized in J. Connor, Price Fixing Overcharges Master Data Set, spreadsheet dated December 2013.
Table 7B. Median Average of Positive Episodic Overcharges, by Year and Type Cartel Episode End Date
Membership Legal Status Bid Rigging
Classic Price Fixing
Buyers’ Cartels
ALL TYPES National Inter-
national Found Guilty Legal
Median percent a Before 1890 20.6 74.0 24.4 b 17.6 16.2 22.6 36.5 c 22.0 1890-1919 24.8 59.8 24.4 44.0 24.5 44.0 430 c 36.8 1920-1945 20.0 39.5 44.9 36.7 34.0 37.0 6.4 c 36.9 1946-1973 18.8 42.0 28.2 17.9 14.2 23.9 47 c 22.5 1974-1989 16.9 43.5 20.0 9.7 20.0 21.5 23.0 20.0 1990-1999 18.9 25.1 24.6 21.5 18.9 25.0 16.9 24.0 2000-2013 23.3 20.2 20.3 18.4 18.0 21.0 17.6 20.0 ALL YEARS 20.0 27.0 23.3 30.0 19.8 26.6 21.6 25.0 Sources: Appendix Tables 1 and 2, summarized in J. Connor, Price Fixing Overcharges Master Data Set, spreadsheet dated December 2013.
a) Medians of the point estimates or, where appropriate, of the midpoint of range estimates. This table excludes zero estimates. On average, 94% of all episodic overcharges are above zero, and that percentage increases over time. Very few peak overcharges are zero.
b) Only three cartels (but with 47 episodes) were deemed guilty prior to 1890: Wholesale Grain Merchants in Greece (guilty by public trial), Anthracite Coal (by U.S. court), and Newcastle Coal (by the UK Parliament).
c) Only five peak observations before 1974, so comparisons with totals are problematic.

J. M. Connor Price-Fixing Overcharges 3rd Edition February 2014
66
Overcharges by Location of Cartel Lawmakers and antitrust enforcement officials may be interested in the locus of decision-making by the cartels in the sample. Figure 10 and Table 9 classify episodes according to the location of the cartel’s headquarters or the place of residence of the great majority of the cartel’s corporate members. In many cases, corporate membership mix corresponds to a cartel’s geographic field of operations, which is examined next.152 Cartels may be composed of member companies with headquarters in only one country or one continent; many contemporary cartels are “virtual” joint ventures with no permanent addresses. On the other hand, many early 20th century cartels established secretariats with professional staffs in London, Zurich, or similar locations. In more recent decades trade associations or management consulting firms have assisted with cartel operation. In these cases, the geographic locus is easy to identify. Cartels with corporate members from multiple regions are more difficult to classify, but if a supra-majority of the companies were headquartered entirely in North America, Western Europe, or Asia, the cartel is categorized in one continent. Global
152 The major exception is export cartels, which are categorized in their country or region of origin but set prices in the “rest of the world.”
Table 8. Ratio of Peak/Episodic Effective Overcharges, by Year and Type Cartel Episode End Date
Membership Legal Status Bid Rigging b
Classic Price Fixing
Buyers‘ Cartels
ALL TYPES National Inter-
national Found Guilty Legal
Ratio of Medians a Before 1890 2.69 1.55 1.92 3.64 1.30 2.88 -‐-‐ 2.70 1890-1919 1.35 1.42 1.36 1.63 -‐-‐ 1.17 1.00 1.39 1920-1945 2.40 1.82 1.17 1.96 1.47 1.86 1.19 1.82 1946-1973 2.44 1.26 1.74 2.55 3.00 2.47 0.91 2.18 1974-1989 1.62 1.70 1.47 -‐-‐ 1.38 3.26 0.49 1.55 1990-1999 1.25 1.99 1.99 0.78 2.33 1.96 1.30 2.04 2000-2013 1.29 2.23 2.46 1.66 2.22 0.87 0.43 1.94 ALL YEARS 1.67 2.24 1.93 2.23 1.42 1.99 0.47 2.00 Sources: Tables 5A and 7 above. a) Medians of the point estimates or, where appropriate, of the midpoint of range estimates. Excludes zero estimates. b) Only four peak observations before 1946. -- = Not available

J. M. Connor Price-Fixing Overcharges 3rd Edition February 2014
67
cartels are international cartels that fixed prices on two or more continents; nearly all global cartels aimed at controlling prices in at least Western Europe, North America, and East Asia.
Table 9. Average Episodic Overcharge Estimates, by Geographic Concepts Location of Cartel Members’ Headquarters or Region of Operation
Number of Estimates
Median Overcharge
Mean Overcharge
Mean Positive
Overcharge Percent Membership Composition a USA and Canada 405 21.0 40.8 43.9 Multiple Nations in W. Europe (EU) b 184 29.2 49.9 52.8 Single Nations in W. Europe 275 16.1 62.3 67.4 Asia and Oceania 140 20.0 41.9 44.5 Africa, Latin America, & E. Europe 50 19.4 21.3 22.6 Global (Companies from Two or More
Continents) 480 27.5 51.9 54.2
Where Collusion Took Place a USA and Canada 512 22.0 38.3 40.2 Multiple Nations in W. Europe (EU) a 141 25.0 38.1 39.8 Single Nations in W. Europe 292 16.1 60.5 65.4 Asia and Oceania 146 20.4 37.9 40.1 Africa, So. America, & E. Europe 61 20.0 23.4 23.4 Global (Two or More Continents) 383 30.4 65.6 71.6 Geographic Extent of Collusion Global (Two or More Continents) 383 30.4 65.6 71.6 Non-Global: 1152 20.1 43.1 44.0 Cross-National c 559 29.0 56.8 60.8 Single National: 976 20.0 44.1 46.7 of which local/regional 286 18.3 36.8 39.5 Total 1535 23.0 48.7 51.8
Sources: Appendix Tables 1 and 2, summarized in J. Connor, Price Fixing Overcharges Master Data Set, spreadsheet dated December 2013. a) Export cartels that drew their membership from one nation or region are counted in that geographic area. However, many national-membership cartels affected world trade; hence, their “market location” is Global. b) Cartels that operated across several nations of the 27-Member European Union, most of them discovered and convicted by the European Commission. c) A high proportion of these cartels are either global (69%) or EU-wide (23%).
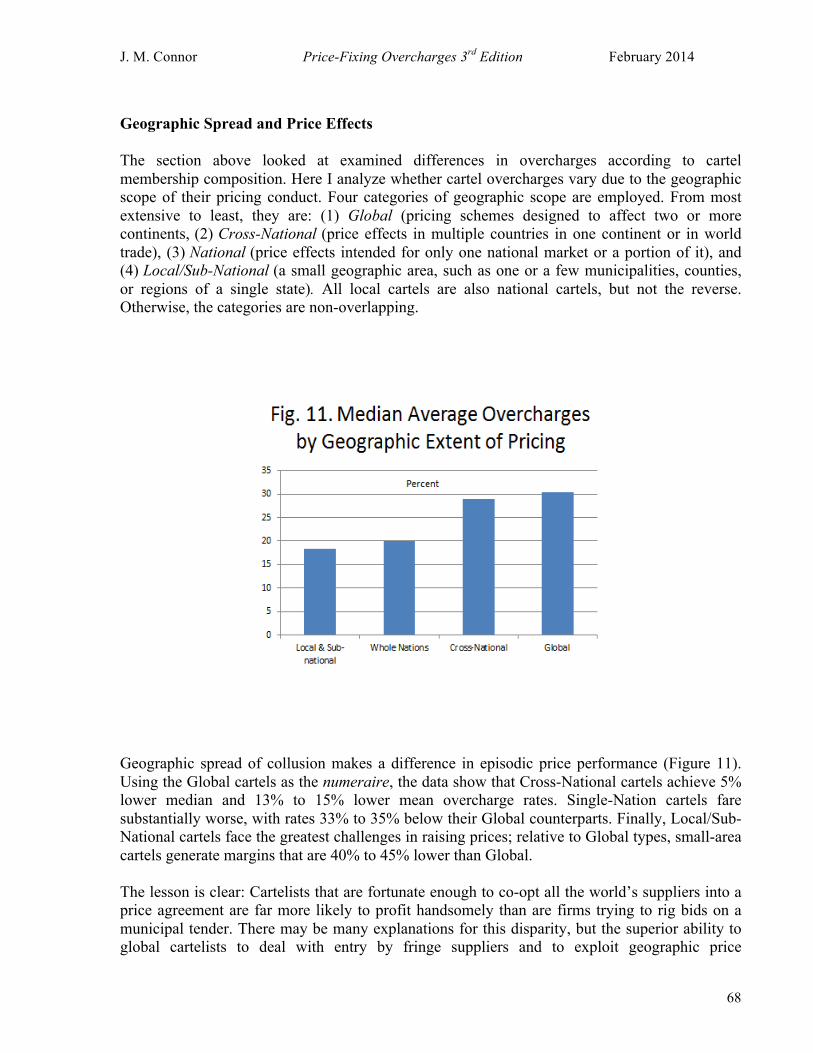
J. M. Connor Price-Fixing Overcharges 3rd Edition February 2014
68
Geographic Spread and Price Effects The section above looked at examined differences in overcharges according to cartel membership composition. Here I analyze whether cartel overcharges vary due to the geographic scope of their pricing conduct. Four categories of geographic scope are employed. From most extensive to least, they are: (1) Global (pricing schemes designed to affect two or more continents, (2) Cross-National (price effects in multiple countries in one continent or in world trade), (3) National (price effects intended for only one national market or a portion of it), and (4) Local/Sub-National (a small geographic area, such as one or a few municipalities, counties, or regions of a single state). All local cartels are also national cartels, but not the reverse. Otherwise, the categories are non-overlapping.
Geographic spread of collusion makes a difference in episodic price performance (Figure 11). Using the Global cartels as the numeraire, the data show that Cross-National cartels achieve 5% lower median and 13% to 15% lower mean overcharge rates. Single-Nation cartels fare substantially worse, with rates 33% to 35% below their Global counterparts. Finally, Local/Sub-National cartels face the greatest challenges in raising prices; relative to Global types, small-area cartels generate margins that are 40% to 45% lower than Global. The lesson is clear: Cartelists that are fortunate enough to co-opt all the world’s suppliers into a price agreement are far more likely to profit handsomely than are firms trying to rig bids on a municipal tender. There may be many explanations for this disparity, but the superior ability to global cartelists to deal with entry by fringe suppliers and to exploit geographic price

J. M. Connor Price-Fixing Overcharges 3rd Edition February 2014
69
discrimination must rank high on the list. Because the Cross-National cartels suffer little in price-raising ability on average, operating across customs unions like NAFTA and the EU seems to keep many fringe producers at bay because of distance or trade barriers.
Grouping cartels by geographic regions produces parallel results (Figure 12). Those that operated in only one Western European country have on average the lowest overcharges; cartels in single nations in the ROW were slightly more profitable – with median overcharges around 20%. Cross-national cartels -- those managed across North America,153 the EU, or other adjacent nations -- have significantly higher overcharges than the single-nation cartels. But those organized across continents were as a group the most successful. In general, cartels able to organize themselves over broader geographical areas were able to achieve higher price effects than those in smaller zones. There are some significant differences in average cartel overcharges across geographic regions. Those that operated in one Western European country have the lowest overcharges, but those organized across national boundaries in Western Europe were as a group the most effective in raising prices.154 North American conspiracies were also quite low.155 Median overcharges for
153 Defined here as the USA and Canada, but could include Mexico in many cases because of the absence of formal tariff barriers. Unfortunately, until recently the Mexican federal antitrust commission did not often prosecute international cartels. Connor and Bolotova (2006) confirm that North American cartels and single nations of Western Europe as a whole have significantly lower overcharges. 154 In the past few decades, these correspond to intra-EU international cartels.

J. M. Connor Price-Fixing Overcharges 3rd Edition February 2014
70
global conspiracies were relatively high.156 In general, cartels able to organize themselves over broader geographical areas were able to achieve higher price effects than those in smaller zones. Market Structure Overcharges are a measure of group (multilateral) market power exercised. A long tradition of empirical research in industrial economics has demonstrated a strong association between market power and several dimensions of market structure. For example, high seller market concentration raises sellers’ power, while buyer concentration lowers it. While information on market structure is difficult to obtain (particularly for older cartels), Bolotova (2009) constructed a sample of 156 international cartels discovered between 1990 and 2005 that includes five measures of market structure (Table 2). These variables have as a group strong power to explain variation in overcharges.157 Bolotova’s regression results demonstrate that the cartel supply share (close to seller market concentration) is positively related to overcharges and buyer concentration negatively related, as expected (Table 5). Furthermore, inequality of size among the cartel members (the leading firm’s market share) lowers overcharges. Two other structural variables were not statistically significant. There are historical examples of cartels that ended because of the growth of fringe production; in such cases, one would expect supplier concentration to decline after collusion ends. The vitamin C cartel of the 1990s is one well-documented case (Connor 2007b). However, that may not apply to cartels that were broken up through enforcement actions. A recent study by Levenstein et al. (2011:12) examines the levels and changes in an importer-based proxy for supplier concentration.158 While their sample is limited to seven global organic chemicals cartels in the 1990s that ended because of antitrust actions, they find that supply is very highly concentrated in all cases. A key regression analysis shows that three to four years after the break-up year, in six out of seven cases there was no significant decline in concentration (ibid. Table 8). Overcharges and Duration The price-fixing overcharges data set includes information on duration for each cartel episode. It is very likely the largest data set on cartel duration in existence. An earlier, smaller version of these data was analyzed by Zimmerman (2005) and by Abrantes-Metz and Connor (2009). Connor and Bolotova (2006) found evidence of a positive relationship between the two. 155 Connor and Bolotova (2006) confirm that North American cartels and single nations of Western Europe as a whole have significantly lower overcharges. 156 When this analysis is repeated using post-1989 data, the ranking remains the same but differences are smaller. 157 Market structure variables are far stronger explanatory variables than industry type or geographic location Bolotova 2009: Table 5). In a broader sample of cartel episodes, industry was the strongest explanatory group. This is evidence that industry variables capture variation in the structure of supply. 158 The Herfindahl index is computed from national import values for several years before and after the cartel broke up. It may be understated because in some cases (probably uncommon) two cartel members may each have plants in the same exporting country and because domestic production in the importing country is ignored.
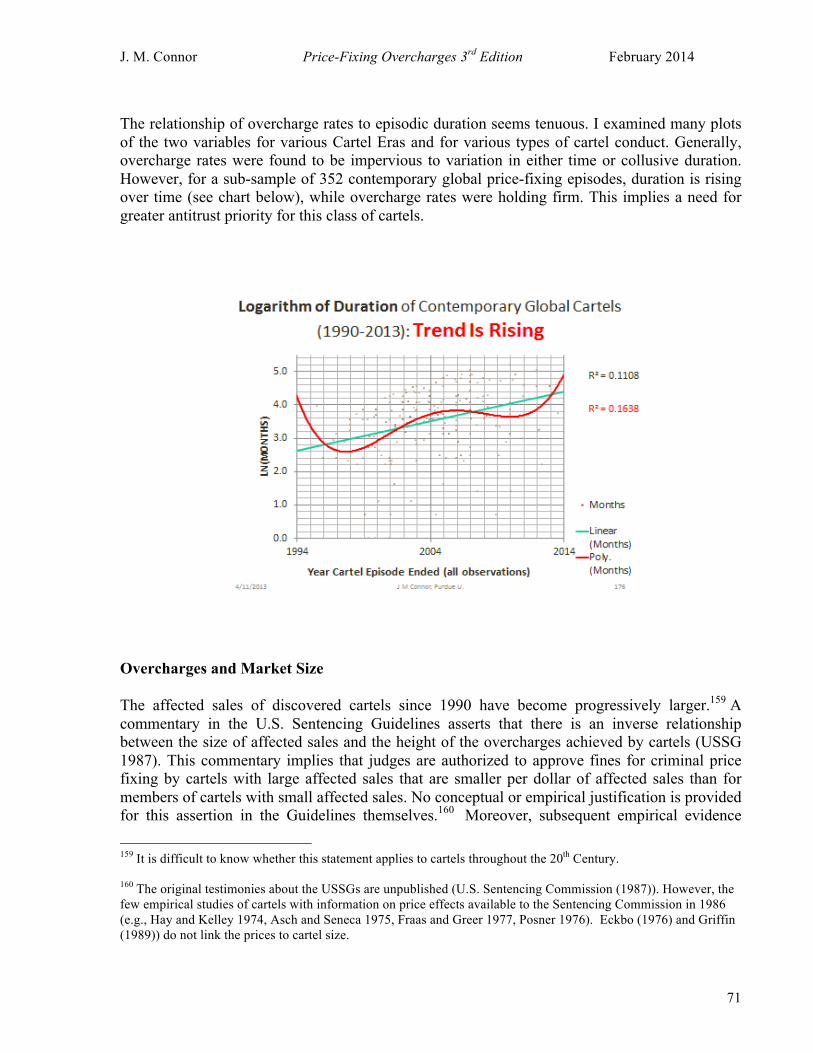
J. M. Connor Price-Fixing Overcharges 3rd Edition February 2014
71
The relationship of overcharge rates to episodic duration seems tenuous. I examined many plots of the two variables for various Cartel Eras and for various types of cartel conduct. Generally, overcharge rates were found to be impervious to variation in either time or collusive duration. However, for a sub-sample of 352 contemporary global price-fixing episodes, duration is rising over time (see chart below), while overcharge rates were holding firm. This implies a need for greater antitrust priority for this class of cartels.
Overcharges and Market Size The affected sales of discovered cartels since 1990 have become progressively larger.159 A commentary in the U.S. Sentencing Guidelines asserts that there is an inverse relationship between the size of affected sales and the height of the overcharges achieved by cartels (USSG 1987). This commentary implies that judges are authorized to approve fines for criminal price fixing by cartels with large affected sales that are smaller per dollar of affected sales than for members of cartels with small affected sales. No conceptual or empirical justification is provided for this assertion in the Guidelines themselves.160 Moreover, subsequent empirical evidence
159 It is difficult to know whether this statement applies to cartels throughout the 20th Century. 160 The original testimonies about the USSGs are unpublished (U.S. Sentencing Commission (1987)). However, the few empirical studies of cartels with information on price effects available to the Sentencing Commission in 1986 (e.g., Hay and Kelley 1974, Asch and Seneca 1975, Fraas and Greer 1977, Posner 1976). Eckbo (1976) and Griffin (1989)) do not link the prices to cartel size.

J. M. Connor Price-Fixing Overcharges 3rd Edition February 2014
72
does not support a positive market size-overcharge connection.161 Bolotova’s (2009) regression analysis of a large sample of modern international cartels finds that a cartel’s affected sales is unrelated to cartel overcharges (Table 5). Laboratory Market Experiments The overcharges reported in this paper are derived from studies that use a wide variety of analytical methods (see Connor 2007c). Most of these methods are not controlled scientific experiments in the strictest sense. Some come from econometric studies, which are quasi-experimental results derived form observations taken from natural markets.162 Controlled market experiments now provide supplementary results about overt collusion that reinforce outcomes about cartel price effects using older methods.163 Since at least 1948, economists have been reporting on prices generated by controlled, small-scale laboratory market experiments.164 The supply sides of these games are oligopolies, and the treatments consist of changes in the number of players, supply conditions, available information, trading rules, and seller communication protocols. Goods are almost always homogeneous and bought by anonymous buyers. All laboratory experiments allow the players to “communicate” tacitly through observed transaction prices or quantities, but a smaller number permits sellers or buyers to talk. Only the latter type opens up the possibility of cartel behavior. A classic survey of laboratory experiments with homogeneous-product monopoly and oligopoly can be found in Plott (1989: 1142-1159). The predictions of pure monopoly theory are verified by these controlled experiments. One laboratory experiment finds that “[W]hen the monopolists post prices, market behavior is … accurately captured by monopoly theory” (ibid. p. 1144). That is, buyers end up paying the monopoly price.165 161 Appropriate data to test this proposition are contained in Connor (2003: Tables A.1 - A.12). This working paper develops affected sales and overcharge data for a modest sample of modern international cartels: approximately 92 pairs of such data are available. Sales are in current U.S. dollars and generally fall into the decade of the 1990s. Correlation statistics were calculated for a number of sub samples. The first sample of 50 cartels examined the largest geographic market for each cartel; the coefficient correlating sales and overcharge rates was not significantly different from zero (r = -0.105). To see whether extreme observations might unduly affect the result, I repeated the experiment but dropped first all cartels with $5 billion in sales or more and second all cartels with overcharges of 65% or higher; in both cases r became closer to zero (-0.065 and +0.019, respectively)., which indicates that extreme observations do not account for the low correlations found. Finally, I examined geographic sub groups of the cartels: global, U.S., EU and other single national markets. The correlations for these four samples varied from -0.17 to +0.24, none statistically significant. 162 List (2006, 2011) argues for the continuing importance of field experiments in economics. 163 Levitt and List (2007) argue that laboratory market experiments too have their limitations. 164 Industrial-organization pioneer Edward Chamberlin (1948) was the first to publish the results of a laboratory market experiment. The Nobel Prize in Economics was granted to Prof. Vernon Smith for his innovative research in laboratory markets. 165 When the exchange mechanism is the double oral auction, buyers pay prices slightly below the full monopoly price (Plott 1989: 1143).

J. M. Connor Price-Fixing Overcharges 3rd Edition February 2014
73
Cartel Experiments More apropos this survey are oligopoly experiments that simulate cartels. A central conclusion of oligopoly experiments is that “market participants almost always recognize a harmony of interests” and that where direct communication is not permitted, observation of bids, offers, or transaction prices is one way that tacit agreements are realized (ibid. p. 1149). In other oligopoly experiments that allowed traders to talk among themselves (but prohibited profit-sharing or side payments), traders “discussed conspiracy almost immediately and they had no difficulty in articulating an agreement” (ibid. p. 1150). When the few sellers post prices and have full information about each other (i.e., perfect monitoring within the collusive group), prices are supra-competitive (ibid. p. 1154). Long periods of interaction also facilitate collusion. Similarly, bid riggers who post their offers are able to reach infra-competitive prices (ibid. p. 1157).166 Perhaps because profit-sharing, side payments, and punishment for cheaters are not allowed (all common features of cartels), collusion experiments result in prices below the full monopoly (above the monopsony) price. More recent experiments reinforce the importance of information and transparency among sellers in a cartel in achieving pricing effectiveness (Haan et al. 2009). Under tacit collusion, information about other sellers cannot be shared and sellers cannot talk to each other before or during trading. Experimental markets with tacit collusion generally result in competitive prices, except for homogeneous-product duopolies, which usually achieve Cournot-level prices. First, access to rival sellers’ information can be collusive. If private information about current sellers’ costs or market shares is made available voluntarily, through a trade association for example, experiments with repeated games produce collusive effects. Revealing information about all past outputs and profits of rival sellers usually increases collusion. Second, with posted pricing, explicit collusion among sellers who can easily detect cheating typically results in near-monopoly prices. Third, if sellers explicitly collude on list prices but buyers can also communicate and ask for secret discounts, transaction prices are still well above competitive levels; collusion ends only if sellers compete on both list and transaction prices. The Cartel Monopoly Index (CMI) A meta-analysis of 154 oligopoly publications reporting on 512 controlled experiments focuses on the collusive price effects of sellers’ oligopolies under various treatments (Engel 2007). These oligopoly price effects are reported using a measure of pricing efficiency or effectiveness that I will call the Cartel Monopoly Index (CMI).167 The monopoly index divides the observed equilibrium overcharge by the maximum possible (monopoly) overcharge, expressed as a
166 However, like monopoly, both buyers’ and sellers’ cartels showed weaker price effects when the trading system was a double auction. 167 I have coined this term because I can find no previous writer seems to have done so. Engel also presents two other pricing efficiency indexes, but little is lost by focusing on only the CMI.

J. M. Connor Price-Fixing Overcharges 3rd Edition February 2014
74
percentage.168 Because the monopoly price is the highest that would be observed in long-run equilibrium, the CMI is a useful indicator of how close a particular cartels came to extracting the maximum monopoly profits in a given market setting, whether in an artefactual laboratory on a natural market.169 When cheating is tolerated or punishment mechanisms are not credible, the CMI will drop below 100%. Without specifying the type of collusion, the efficiency of collusion increases with the fewness of sellers; CMI is highest for duopoly experiments (CMI=62%), lower for triopolies (CMI=43%), and lower still for quadropolies (CMI=14.6%)170 (Engel 2007: 504-506); similarly, the use of posted prices intensifies collusion relative to other pricing systems (ibid. pp. 537-538). There are three experimental designs that shed light on collusion with overt communication. First, some experiments permit communication among sellers before trading begins (the classic Prisoners’ dilemma with “cheap talk”), and this may permit either misleading posturing or a degree of trust to develop among sellers. Collusion with prior communication seems to instill trust, because it generally results in more efficient collusion than when communication is prevented (ibid. pp.521-525). The efficiency of price collusion when communication occurs depends strongly on certain interactive factors. When the choice variable is quantity (i.e., a Cournot game in which price is an outcome, not a choice variable), cartels achieve higher pricing power (CMI=74%) than do tacitly colluding sellers (CMI=47%); experienced sellers that are allowed to talk (possibly a proxy for trust) achieve much higher pricing efficiency (CMI=73%) than inexperienced participants (CMI=24%); and price effects are stronger when sellers have good ex ante information (CMI=61% to 64%). Second, a necessary feature of cartels is that sellers can conclude an enforceable agreement. In laboratory experiments, the availability of an enforceable agreement significantly increases price effects under certain conditions: when concentration is high (with duopoly CMI=87%), when buyers are anonymous (CMI=84%)171, when the game is Cournot (CMI=79%), when sellers are symmetric (CMI=93%), and when their capacity is unconstrained (ibid. pp. 523-528). Thus, when an enforceable agreement is concluded, high seller concentration, seller symmetry, low
168 CMI= (P-Pc)/(Pm-Pc), where P is the observed average outcome price, Pm the monopoly price, and Pc competitive benchmark price. The same indexes can be computed for quantity experiments. CMI cannot be converted into Lerner or overcharge indexes. 169 There are five cartel studies using data from natural markets that reveal the necessary overcharges to compute a CMI (i.e., an episodic cartel overcharge and a predicted monopoly price). Ellison (1994) found that CMI=80% for the five-member Joint Executive Committee railroad cartel. Genosove and Mullin (2001) computed a lifelong CMI of 11% for the 14-firm U.S. sugar cane refining cartel; during three 1890-1914 episodes CMI=70% to 83%; however, the peak price reached CMI=95% in one year. Yu (2003) finds a CMI of 79% for imports of “oil-country tubes” from a European export cartel into selected developing countries in 1990-1995. Clay and Troesken (2003) find a CMI of 83% to 94% for four episodes of the U.S. Whiskey Trust 1882-1895. Crespi and Chacon-Cascante (2004) predict CMIs of 63% and 66% for the U.S. domestic price and the world export price, respectively, of California almonds in 1962-1997. 170 However, CMI does not decline from N=4 to N=5, and the pattern for more than five sellers is irregular. 171 By “anonymous” is meant that sellers face a computerized demand curve, which seems to me equivalent to a large number of buyers. With face-to-face human buyers (i.e., small numbers of buyers), CMI is below 14%.

J. M. Connor Price-Fixing Overcharges 3rd Edition February 2014
75
buyer concentration, homogeneous products, or excess capacity resulted in Monopoly Indexes above 70%. Third, one experiment shows the profound price effects that result when sellers can communicate after bidding begins (Fonseca and Normann 2011). The CMI of a duopoly averages 94%, and it declines when the number of sellers increases from 2 to 4 (CMI=81%), to 6 (CMI=65%), or to 8 (CMI=55%). However, compared to tacit collusion, explicit agreements result in smaller price gains under duopoly and when N=8 than when N is 4 or 6 (ibid. p. 11). Similarly, when sellers expect a fine that is high (half of the monopoly gains), the sellers choose to cartelize more than half of the time when N= 2 to 8, whereas in a duopoly tacit collusion is chosen two-thirds of the time (ibid. p. 12). This study is unique in studying the content and purposes of messages sent between sellers; the authors conclude that explicit communications help raise prices by implement more sophisticated pricing strategies, assist in dispute mediation (e.g., after a defection is observed), and if permitted before trading begins (but not after) seems to instill trust that improves pricing effectiveness (ibid. pp. 29-30). In summary, laboratory market experiments are a promising way to study cartel price effects using the utmost scientific rigor. Unfortunately, none yet incorporates most or all of the salient characteristics of real-world cartels. In particular, only a small minority of market laboratory experiments permits overt communication among suppliers. Nevertheless, when limited pre-play communication or during-play discussion is permitted, monopolistic pricing conduct is observed. Collusive prices on homogeneous goods approach monopoly levels when buyers are many and sellers are few, symmetric, experienced, have excess capacity, post their prices, and chose output as the strategic variable. While it is tempting to include the price results of market experiments, they are excluded from the sample reported herein.
DECISIONS OF ANTITRUST AUTHORITIES
Economists versus Courts or Commissions Are there systematic differences between overcharge estimates made by economists and those resulting from a judicial process? The answer to this question is important for the policy relevance of the present study. If the estimates taken from social-science publications significantly differ from the conclusions of juries, judges, or commissions, then the overcharge estimates in this study are of limited value in confirming the wisdom of present anti-cartel enforcement or proposing changes in such enforcement. A survey of final verdicts of U.S. courts in collusion cases finds that 25 collusive episodes had a median average episodic overcharge of 21.6% and a mean overcharge of 30.0% (Connor and Lande 2005).172 The 9 cases that reported peak overcharges produce a median peak overcharge 172 Robert Lande and research assistants under his direction in 2004 calculated these figures. Less than 1% of all U.S. published court opinions on price-fixing damages contain both the dollar damages and the affected sales of a cartel. For a discussion of the merits of examining only final verdicts, see Connor and Lande (2005).

J. M. Connor Price-Fixing Overcharges 3rd Edition February 2014
76
of 71.4% and a mean peak overcharge of 130%. All but 5 found that the cartel had raised prices by more than 10%. Due to the small number of final verdicts, it would not be meaningful to analyze these verdicts in even smaller groups. By comparison, the 327 estimates for North American cartels had a median episodic overcharge of 21.0% and mean overcharge of 38.8%. Thus, the median averages from both sources are extremely close, but the mean is slightly higher from the economic studies. Figure 13 and Table 10 combine the U.S. court survey above with other episodic overcharge estimates derived from cartel decisions by other antitrust authorities.173 There are 485 such observations from 38 antitrust authorities – 32% from analyses of guilty findings of U.S. and Canadian courts, 24% from decisions of the European Commission that imposed fines on EU-wide cartels, 20% from commissions ruling on cartels that operated in single European nations, 20% from Asian and Oceanic antitrust authorities, and 3.5% from the rest of the world. Besides U.S., Canadian, and EC decisions, there are relatively large numbers of observations from decisions by the UK Monopolies Commission in the 1950s and 1960s and the Fair Trade Commissions of Korea, Japan, and Taiwan. Most of the decisions are from decisions that fined international cartels discovered since 1990. Texts of most of these decisions can be found on the web sites of the authorities or in various searchable law archives (Lexis Nexis, WestLaw, the Official Journal of the European Communities, EUR-Lex, and the like). In some cases press releases or press summaries contained sufficient information to calculate an overcharge, but more commonly an analyst used the product definition, affected sales, and conspiracy dates in the opinion and applied this information to prices from a third party to calculate an estimate. As in the case of U.S. final verdicts, only a small minority of available decisions contains the appropriate quantitative data.174 The median episodic overcharge from the 320 authority-decision-related estimates is 20.0%, and the mean is 40.8% (Table 10). The median and mean overcharges in Table 10 are close to the full sample median of 23.0% (Table 5) and mean of 48.7% (Table 6), respectively. Overcharges from all jurisdictions are negatively skewed.175 Moreover, the relative geographic pattern in Table 10 is parallel to that of Table 9; that is, median overcharge rates are highest for multiple-
173 Sometimes a published decision will mention explicitly an overcharge figure, but more commonly court and commission decisions need to be interpreted. For example, a decision may mention in passing the price series upon which it relied to determine the severity of a sentence, and that series is then interpreted by an economist. The DOJ, U.S. FTC, and federal courts and counted as one authority. However, the EC and the EU NCAs are counted as separate authorities. 174 Guilty pleas and sentencing memoranda of the DOJ and Canadian Competition Bureau almost never mention damages. The EC has fined more than 100 cartels since 1969, but the full decisions are not always published, publication can be delayed for up to five years, and only a small proportion include price data. EC decisions yielded usable information on product definition, affected sales, geographic area, dates of the conspiracy, or other helpful information for 75 episodes. Similar comments apply to the other authorities‘ press releases, newsletters, or formal decisions. 175 With three or more observations, the mean is higher than the median.

J. M. Connor Price-Fixing Overcharges 3rd Edition February 2014
77
nation EU cartels, lowest for single-nation European cartels, and about 20% for all the other continents.176
Table 10. Cartel Episodic Overcharges Derived from Decisions a of Antitrust Authorities
Location: Antitrust Authority
Number of Observations
(episodes)
Median Mean Percent
North America: 156 17.7 48.4 US, 1898-1911 9 22.5 31.2 US, 1948-1973 8 16.8 135.5 US, 1980-1999 13 18.0 155.3 US, 2000-2013 120 16.9 31.1 US, 1898-2013 150 17.7 47.5 Canada, 1945-2013 6 37.3 71.1
176 Although not shown, decisions regarding global cartels resulted in higher overcharge estimates than other types or locations of cartels.
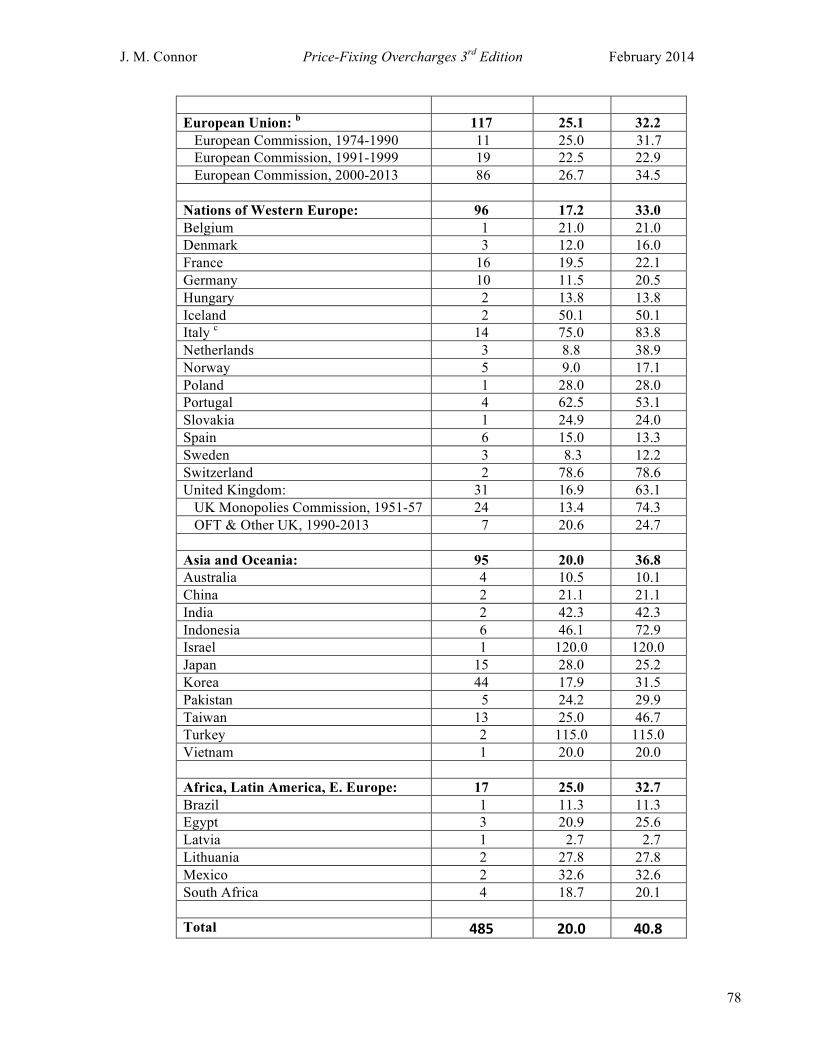
J. M. Connor Price-Fixing Overcharges 3rd Edition February 2014
78
European Union: b 117 25.1 32.2 European Commission, 1974-1990 11 25.0 31.7 European Commission, 1991-1999 19 22.5 22.9 European Commission, 2000-2013 86 26.7 34.5 Nations of Western Europe: 96 17.2 33.0 Belgium 1 21.0 21.0 Denmark 3 12.0 16.0 France 16 19.5 22.1 Germany 10 11.5 20.5 Hungary 2 13.8 13.8 Iceland 2 50.1 50.1 Italy c 14 75.0 83.8 Netherlands 3 8.8 38.9 Norway 5 9.0 17.1 Poland 1 28.0 28.0 Portugal 4 62.5 53.1 Slovakia 1 24.9 24.0 Spain 6 15.0 13.3 Sweden 3 8.3 12.2 Switzerland 2 78.6 78.6 United Kingdom: 31 16.9 63.1 UK Monopolies Commission, 1951-57 24 13.4 74.3 OFT & Other UK, 1990-2013 7 20.6 24.7 Asia and Oceania: 95 20.0 36.8 Australia 4 10.5 10.1 China 2 21.1 21.1 India 2 42.3 42.3 Indonesia 6 46.1 72.9 Israel 1 120.0 120.0 Japan 15 28.0 25.2 Korea 44 17.9 31.5 Pakistan 5 24.2 29.9 Taiwan 13 25.0 46.7 Turkey 2 115.0 115.0 Vietnam 1 20.0 20.0 Africa, Latin America, E. Europe: 17 25.0 32.7 Brazil 1 11.3 11.3 Egypt 3 20.9 25.6 Latvia 1 2.7 2.7 Lithuania 2 27.8 27.8 Mexico 2 32.6 32.6 South Africa 4 18.7 20.1 Total 485 20.0 40.8

J. M. Connor Price-Fixing Overcharges 3rd Edition February 2014
79
Sources: Appendix Tables 1 and 2, summarized in J. Connor, Price Fixing Overcharges Master Data Set, spreadsheet dated October 2013.
a) Most decisions have a single estimate reported by or interpreted by one person, but several decisions have alternative estimates (or models) by single authors, and some have single estimates by multiple authors. b) This is shorthand for collusion across two or more of the 27 nations that form the EU today. c) Nine observations are from the two Infant Formula cases. I am informed by an economist familiar with the evidence in these cases that, while the Authority strongly suspected overt collusion, it could not find documentary proof. Nevertheless, the participants were fined.
In three jurisdictions, there are enough observations to examine changes over time. In North America, median overcharges from before 1990 are slightly higher than from subsequent periods. Similarly, the UK Monopolies Commission’s reports produced very cautious estimates compared to more recent UK cases. The EC’s recent decisions suggest higher overcharges than earlier ones. I conclude that, on the whole, estimates of the height of overcharges developed from decisions of antitrust authorities around the world differ little from estimates derived from other economic studies. The overall median overcharge of the 485 legal decisions (20.0%) is about 15% lower than the remaining sample estimates. Cartels Targeted by Class Actions In American and other common-law regimes, counsel for private plaintiffs are commonly regarded as complementary to the anti-cartel efforts of the federal and state attorneys general (Lande 2010: 9, Baer 2014). This follows from the increasingly outdated view that private suits "follow-on” after criminal convictions have made the private suits relatively easy to prosecute. In fact, almost half of U.S. private damages suits do not follow DOJ convictions (Connor 2012; Lande and 2006, 2008 and 2010). So, what kind of cartels do plaintiffs sue these days? I informally analyzed the overcharges of the cartels that resulted in the 50 largest price-fixing settlements from class actions in North America during 1990-2012 (Connor 2012: Table1). The actions are ranked according to the amount of cash settlements that they received by direct or indirect purchasers in all jurisdictions (expressed in $2012). Of these 50 largest, 258 overcharge estimates are available for 41 cartels. The median overcharges of these 41 cartels were 29.4%, or 30% higher than all guilty cartels during the same period (Table 5). Except for being slightly less durable (7.2 years) than the average cartel (8.2), there were no other obvious differences between cartels that settled and other contemporary cartels. Hence, on balance, plaintiffs are targeting cartels generating larger dollar injuries.
J. M. Connor Price-Fixing Overcharges 3rd Edition February 2014
80
Price Effects of Antitrust Intervention There is a body of opinion that competition-law enforcement is ineffective in improving the competitiveness of formerly cartelized markets. For example, a provocative paper by Crandall and Winston (2003) opined that U.S. antitrust laws should be abandoned. In support of their position they assembled five studies that they interpreted to show either that cartels do not raise prices or that prices do not decline after cartel convictions. This opinion piece immediately evoked an onslaught of rebuttals by Baker (2003), Werden (2004), and Connor (2004c), among others. Rather than revisit that particular debate, it may be useful to examine what a larger body of studies shows about the effects of antitrust enforcement on cartel effectiveness. First, there is evidence of its effects on collusive price effects. Connor and Bolotova (2006) showed that price-fixing overcharges have declined secularly as anticartel laws and enforcement have strengthened since the late 19th century. Second, there is an analysis of cartel duration following the break-ups of contemporary cartels by antitrust authorities. Levenstein and Suslow (2010: 13-18) identified six "causes of death" for 79 international cartels that colluded since 1990; they found that 62% of the cartels expired because of antitrust legal actions and the remaining 38% because of unilateral reactions to economic incentives they term "natural causes" (including 22% convicted following defections by amnesty applicants) (ibid. Table 2). In their analysis of the antitrust determinants of duration, they find that duration shortens after 1995177 and when cartel organization includes share quotas but excludes third-party support and punishment mechanisms (ibid. Table 4). Third, one of the most convincing responses is the study of the long-lasting German high-voltage power-cable manufacturing cartel of 1901-1997 (Normann and Tan 2013). This cartel was legal from 1901 to 1957, illegal from 1958 to 1974 (and convicted three times), exempted from prosecution from 1975 to 1984, and once again made illegal after 1984 whereupon it was heavily fined in 1997. Profits rose 16% to 19% each year the cartel was exempted with no compensating efficiency gains (ibid. pp. 11-12).
RELIABILITY ISSUES
Many readers may have prior beliefs about the most appropriate data and methods to be used to derive estimates of the price effects of cartels. Some might regard a lengthy historical investigation with access to the internal communications of a cartel’s managers as the surest path
177 They choose 1995, the year the Lysine cartel war punished in the U.S., as a “defining moment” – a watershed or regime shift -- for international cartel enforcement (note 29). It is also close to the years in which leniency programs were introduced in the U.S. and EU. Besides being a rather Americocentric choice, so many other changes occurred before and after 1995 that I am skeptical that any qualitative variable is adequate to the task. A continuous variable along the lines of Zimmerman’s (2005) amnesty awareness index seems preferable.
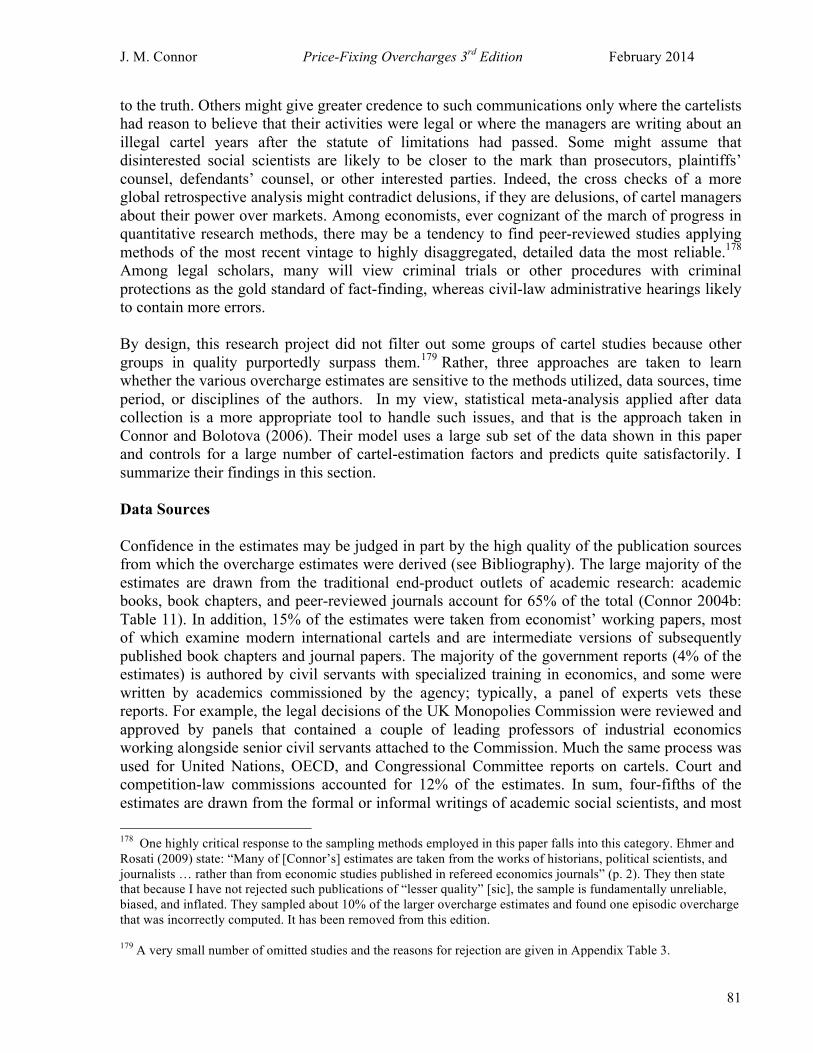
J. M. Connor Price-Fixing Overcharges 3rd Edition February 2014
81
to the truth. Others might give greater credence to such communications only where the cartelists had reason to believe that their activities were legal or where the managers are writing about an illegal cartel years after the statute of limitations had passed. Some might assume that disinterested social scientists are likely to be closer to the mark than prosecutors, plaintiffs’ counsel, defendants’ counsel, or other interested parties. Indeed, the cross checks of a more global retrospective analysis might contradict delusions, if they are delusions, of cartel managers about their power over markets. Among economists, ever cognizant of the march of progress in quantitative research methods, there may be a tendency to find peer-reviewed studies applying methods of the most recent vintage to highly disaggregated, detailed data the most reliable.178 Among legal scholars, many will view criminal trials or other procedures with criminal protections as the gold standard of fact-finding, whereas civil-law administrative hearings likely to contain more errors. By design, this research project did not filter out some groups of cartel studies because other groups in quality purportedly surpass them.179 Rather, three approaches are taken to learn whether the various overcharge estimates are sensitive to the methods utilized, data sources, time period, or disciplines of the authors. In my view, statistical meta-analysis applied after data collection is a more appropriate tool to handle such issues, and that is the approach taken in Connor and Bolotova (2006). Their model uses a large sub set of the data shown in this paper and controls for a large number of cartel-estimation factors and predicts quite satisfactorily. I summarize their findings in this section. Data Sources Confidence in the estimates may be judged in part by the high quality of the publication sources from which the overcharge estimates were derived (see Bibliography). The large majority of the estimates are drawn from the traditional end-product outlets of academic research: academic books, book chapters, and peer-reviewed journals account for 65% of the total (Connor 2004b: Table 11). In addition, 15% of the estimates were taken from economist’ working papers, most of which examine modern international cartels and are intermediate versions of subsequently published book chapters and journal papers. The majority of the government reports (4% of the estimates) is authored by civil servants with specialized training in economics, and some were written by academics commissioned by the agency; typically, a panel of experts vets these reports. For example, the legal decisions of the UK Monopolies Commission were reviewed and approved by panels that contained a couple of leading professors of industrial economics working alongside senior civil servants attached to the Commission. Much the same process was used for United Nations, OECD, and Congressional Committee reports on cartels. Court and competition-law commissions accounted for 12% of the estimates. In sum, four-fifths of the estimates are drawn from the formal or informal writings of academic social scientists, and most 178 One highly critical response to the sampling methods employed in this paper falls into this category. Ehmer and Rosati (2009) state: “Many of [Connor’s] estimates are taken from the works of historians, political scientists, and journalists … rather than from economic studies published in refereed economics journals” (p. 2). They then state that because I have not rejected such publications of “lesser quality” [sic], the sample is fundamentally unreliable, biased, and inflated. They sampled about 10% of the larger overcharge estimates and found one episodic overcharge that was incorrectly computed. It has been removed from this edition. 179 A very small number of omitted studies and the reasons for rejection are given in Appendix Table 3.

J. M. Connor Price-Fixing Overcharges 3rd Edition February 2014
82
of the remainder was the product of professionally trained individuals subject to the checks and balances of internal reviews.
The types of publication outlets have also changed over time (Figure 12). Before 1974 books and chapters in edited collections accounted for 58% of the publications that contained usable overcharge data. Most of these works show evidence of meticulous scholarship, but the share of them subject to blind reviews is small. After 1973, books became a minor component (11%) of this survey’s source materials. Instead, the greatest sources of overcharge estimates shifted to the published decisions of courts and commissions (44%) and to academic journal papers (34%). That is, in recent decades most estimates are drawn from papers that have been peer-reviewed, from an adversarial forum, or from decisions likely to be reviewed by courts of appeal. It is reasonable to regard review processes as likely to induce calculations that are more reliable.
Table 11. Average Episodic Overcharge Estimates, by Method of Estimation Employed Method Number
of Estimates
Median Overcharge
Mean Overcharge
Mean Positive
Overcharge Percent Unavailable/None given 74 18.3 33.2 40.3 Historical Examination of Cartel Archives 20 0 10.8 30.7
But-for Price from Before Collusion 411 26.0 40.3 41.9 But-for Price from Price War During Collusion 28 28.2 39.7 41.2
But-for Price from After Collusion 200 25.0 46.3 48.0 Cost-Based or Constant-Margin 69 21.5 50.3 52.6 Yardstick from Comparable Unaffected Market 192 28.8 78.7 81.7
Econometric Model prediction 289 19.5 31.3 33.6 Legal Decision a 245 17.5 35.0 35.5 Other Quantitative (Simulation, etc.) b 7 670 1277 1277 Total 1535 23.0 48.7 51.8
Sources: Appendix Tables 1 and 2, summarized in J. Connor, Price Fixing Overcharges Master Data Set, spreadsheet dated December 2013.
a) No specific method mentioned by court, jury, or commission issuing decision. May be a monetary amount or a percentage. Also includes judgments about what amounts constitute adequate compensation or restitution for victims. See Table 10 for details.
b) Four of the seven observations (and the highest) are from Normann and Tan (2011).
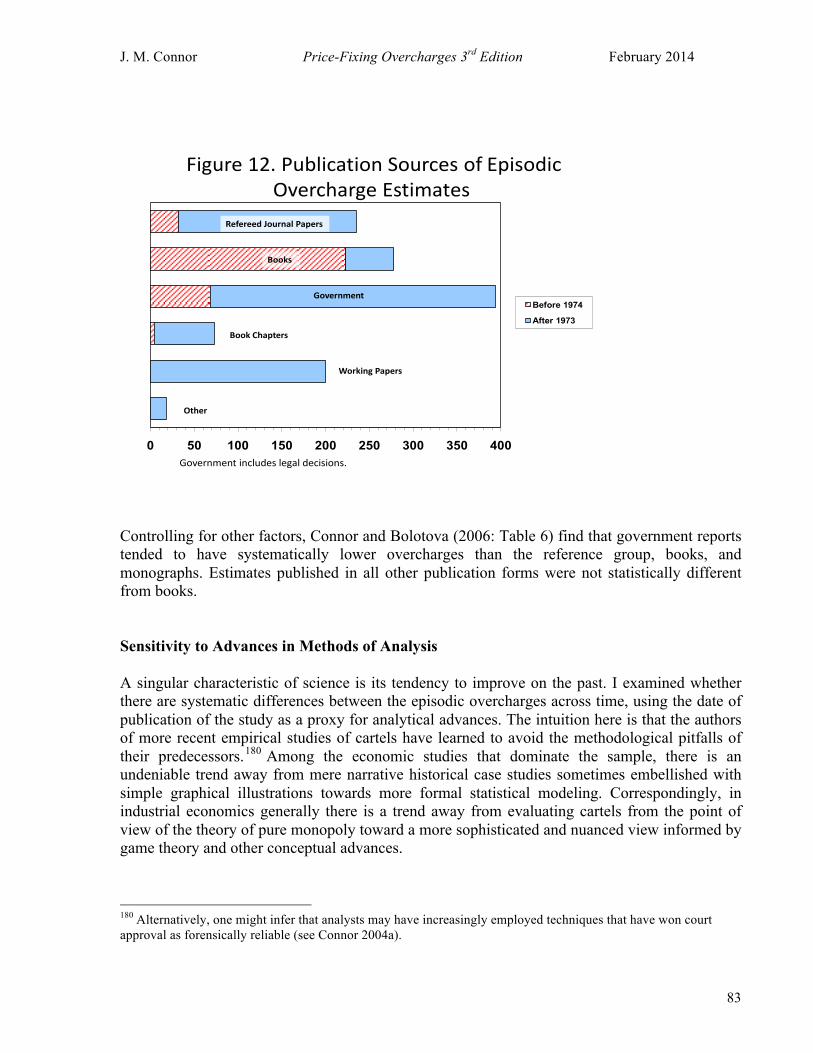
J. M. Connor Price-Fixing Overcharges 3rd Edition February 2014
83
Controlling for other factors, Connor and Bolotova (2006: Table 6) find that government reports tended to have systematically lower overcharges than the reference group, books, and monographs. Estimates published in all other publication forms were not statistically different from books. Sensitivity to Advances in Methods of Analysis A singular characteristic of science is its tendency to improve on the past. I examined whether there are systematic differences between the episodic overcharges across time, using the date of publication of the study as a proxy for analytical advances. The intuition here is that the authors of more recent empirical studies of cartels have learned to avoid the methodological pitfalls of their predecessors.180 Among the economic studies that dominate the sample, there is an undeniable trend away from mere narrative historical case studies sometimes embellished with simple graphical illustrations towards more formal statistical modeling. Correspondingly, in industrial economics generally there is a trend away from evaluating cartels from the point of view of the theory of pure monopoly toward a more sophisticated and nuanced view informed by game theory and other conceptual advances.
180 Alternatively, one might infer that analysts may have increasingly employed techniques that have won court approval as forensically reliable (see Connor 2004a).
Figure 12. Publication Sources of Episodic Overcharge Estimates
0 50 100 150 200 250 300 350 400
Before 1974
After 1973
Working Papers
Book Chapters
Government
Books
Refereed Journal Papers
Other
Government includes legal decisions.

J. M. Connor Price-Fixing Overcharges 3rd Edition February 2014
84
Controlling for other factors, Connor and Bolotova (2006: Table 6) find that overcharge estimates decline over time, but the effect is not completely monotonic. Of course, other things are changing over time as well, including generally tougher anti-cartel enforcement with respect to cartel discovery and severity of penalties. A more direct test involves qualitative variables for the author’s method. In this case, the yardstick method tends to result in significantly higher estimates than the reference group, which is the “after” method. The rest of the analytical methods are not significantly different from each other or the reference group. Thus with one minor exception, methods do not cause bias in estimating overcharges. For this paper, except for about 5% of the episodes where no method was given, I classified the remaining 1461 episodes according to one of eight estimation methods used to derive the overcharge rates (Table 11). One of the most unusual methods (accounting for 2% of the episodic overcharges) is an historical examination of original cartel archives. This method of analysis resulted in by far the lowest mean overcharge of 10.8%; in fact, more than half of such estimates were zero. Echoing the findings of Connor and Bolotova (2006), estimates derived from a yardstick approach were the highest on average. Cost-based estimation (69 episodes) produced the second-highest mean overcharges. Interestingly, the most popular method (639 episodes) – the three “straight-line“ before-and-after methods -- had lower-than-average mean values. But even lower were episodes derived from econometrics (289) and from legal decisions (245). The fact that some methods result in above- or below-average overcharges does have implications for accuracy, as each type of method may be associated with different mixes of cartel types, locations, or Cartel Eras. Econometric methods and legal decisions, for example, tend to be of a more recent vintage. Intra-Episode Comparisons An additional check on reliability of estimates across various analytical methods controls for changes in the composition of the sample by focusing on pairs of estimates applied to identical cartel episodes. Recall that a cartel episode refers to a single market, time period, and form of cartel organization. There are 291 pairs of observations available for this analysis of reliability, which examines six general methods of estimation. The most widely used is the so-called before-and-after method in which the price during the episode is compared to one of three “but-for” or base prices. The second most popular method is statistical modeling, which accounts for 20% of the estimates. The yardstick methods accounts for about 10% of the sample. Overcharges derived from costs of production or profits are the least frequently employed method (about 3%). U.S. courts have sanctioned the five methods for determining damages in price-fixing trials (Connor 2004a). Sixth, approximately 10% of this study’s estimates are quotes from or interpretations of decisions made by antitrust authorities.181 By and large, different authors and different methods applied to identical cartel episodes do not result in markedly different estimates. The correspondence among the three before-and-after 181 Seventh, “method unspecified” estimates are on average quite close to the before-and-after price method.

J. M. Connor Price-Fixing Overcharges 3rd Edition February 2014
85
methods is quite close. Nevertheless, there are two differences worth commenting on. One somewhat surprising result is that the before-and-after method produces cartel-overcharge estimates that are higher than econometric modeling applied to the same episodes. Econometric techniques offer the opportunity to the analyst to make precise allowances for several sources of shifts in demand and supply, for seasonality, for trends in technology, and for feedback effects. If in fact econometric techniques are the most accurate, what this result seems to suggest is that authors of traditional before-and-after analyses are failing to adjust for all the competitive factors that might drive up the competitive benchmark price. However, this result could be explained by other factors, such as the time available to perform a calculation or to differences in access to confidential price data.182 Second, compared with the before-and-after method, the cost-based and yardstick techniques yield relatively high overcharge estimates.183 This suggests that the methods that use costs or profits fail to fully account for all competitive industry costs, perhaps those related to product marketing or overhead. Similarly, as yardsticks are frequently chosen to be prices in proximate regions in which the cartel did not attempt to fix prices, this result suggests that analysts may be identifying prices in regions with lower cost structures than the conspiracy-affected markets. Possibly the full costs of transportation and transfer from geographic yardsticks to the affected geographic market are underestimated. If the yardsticks are product substitutes, analysts may have underestimated quality differences between the cartelized product and the analogous product.184 In sum, apart from minor exceptions, neither sources nor methods suggest unreliability.
SUMMARY AND IMPLICATIONS
Summary This paper’s major goal is to collect and analyze the largest possible body of serious, quantitative estimates of price-fixing and bid-rigging overcharge rates. From several hundred publications dating to 1888, I assembled 2044 such estimates that belong to 532 cartels functioning during the past three centuries.
182 See Connor (2004a, 2008) for just such an example. Connor and Bolotova (2006) find no differences between before-and-after estimates and econometric estimates. 183 These two methods seem to be conservative relative to statistical modeling, but the number of pair-wise observations is quite limited. Historical case studies, many by historians with access to original documents, tend to produce lower estimates (Connor and Bolotova 2006). 184 Yardstick prices are more likely to be available at geographic points close to large centers of supply (concentrations of production or major ports of importation). Public price reporting of products with multiple grades normally is restricted to the most common, least differentiated grade.

J. M. Connor Price-Fixing Overcharges 3rd Edition February 2014
86
The primary finding is that the median185 episodic cartel overcharge for all types of cartels over all Cartel Eras is 23.0%. It is lower for cartels with solely domestic membership (18.2%), higher for international cartels (25.1%), and highest of all for global cartels (30.4%). Overcharges from courts and commissions are slightly lower that from social science analyses. Cartel overcharges are skewed to the high side, pushing the mean overcharge for all successful cartels to 52%. The “peak” cartel overcharges in the sample are typically almost double those of the long-run averages.186 This paper’s findings are generally consistent with the few, more limited works that comment on cartel overcharges.187 Seven previously published economic studies with samples ranging from five to 38 overcharges report a simple average median overcharge of 28% of affected sales. A comparison of social-science and legal sources also yields generally similar average estimates. Finally, more recent results from controlled market experiments with representative cartel structures also support the social-science-based conclusions. The authors’ professions, types of publications, years of publication, intensity of peer review, and analytical estimation methods incorporated in the sample vary greatly. There is some indication that estimates prepared from the yardstick method are higher than other approaches and that estimates appear in government publications are lower than others.188 Otherwise, however, extensive examinations of variation in overcharge rates across such categories give no reason to regard any sub set of the sample as inherently biased or unreliable. Implications for Economics The great majority of economists, whether swayed by collusion theory or by empirical evidence, roundly condemn cartels. Yet, there is a small minority view among industrial-organization economists that there is little evidence that cartels injure the markets in which they operate. Cartels, they believe, rarely raise prices significantly above non-collusive levels. Moreover, even if cartel price effects are significant, cartels are such fragile coalitions that the harm to the allocative functions of markets is negligible. Finally, they believe that the negative static allocative effects of cartels are counterbalanced by two forces: improved static productive and increases in the dynamic performance of cartelized industries through increased productivity growth.189 In sum, these critics dismiss the importance of the cartel phenomenon and, by 185 All medians presented in this section incorporate all relevant zero estimates and omit peak results unless otherwise mentioned. 186 If one assumes that the peak mark-ups are the result of a cartel having achieved something close to monopoly price levels, then the lower episodic overcharges imply that historical cartels are constrained by substitutes, fear of entry, internal discord, or other factors that frustrate optimization. This is a common finding from studies that measure the degree of monopoly power. 187 All of the relevant estimates in the seven works are incorporated in the sample assembled for this paper. 188 Two other types (historical case studies and government reports) tended to be low. 189 Such beliefs seem to arise from theoretical modes of collusion that typically do not allow for communication or contain unrealistically strict assumptions. For example, Telser (1985) has a proof that joint sales agencies improve
J. M. Connor Price-Fixing Overcharges 3rd Edition February 2014
87
implication, the relevance of economic cartel studies. In this sub-section, I briefly respond to the empirical validity of these criticisms.190 In defending the value of empirical studies of cartels, I must once again mention a great limitation of the behavioral social sciences: one cannot observe the unobservable. Increasingly, since the middle of the 20th century, most cartel managers have gone to great lengths to hide their illegal joint ventures from public view. Consequently, in the past several decades, empirical studies of cartels have been limited to analyzing samples of discovered, punished cartels. “…[W]e know a great deal about cartels that get caught, but very little about those that escape detection” (Carlton and Perloff 2005:127). These samples may not be representative of the population of all cartels. Successful, clandestine cartels may well have better managers, greater endurance, and superior financial returns than the putatively inept discovered cartels. Or not. Several responses can be made to concerns about “sample selection bias” (nonrepresentative cartel samples). First, this survey’s sample is unparalleled in its extraordinarily large amount of data spanning centuries. The historical depth of the sample suggests that time is not a source of potential bias. Large numbers of the cartels in the present study operated in legal environments with little or no fear of prosecution or severe monetary penalties: they predate the current era of high penalties.191 Second, the present study distinguished between overcharges of “guilty” cartels versus unsanctioned cartels. These categories mimic, however imperfectly, discovered versus undiscovered cartels. There is no great difference in overcharge rates between the two categories. Third, there are still legal cartels to be studied today. Samples of legally registered export cartels and government-sponsored cartels also tend to find evidence of positive price effects. Fourth, controlled laboratory market experiments find ample evidence of strong price effects when the conditions are correctly specified. Fifth, even if undiscovered cartels are indeed different from detected cartels, international discovered cartels are the most appropriate sample for studying the influence of competition laws. In short, the absence of sample selection bias seems just as likely as its presence. Beliefs about the fragility of collusive conduct are driven by cartel theories that focus on the profit incentive that individual cartel members have to cheat on price agreements. While this incentive is undeniable, so is the creativity of cartels that create credible punishment mechanisms. 192 The empirical reality is that durable cartels are observed in the great preponderance of quantitative studies. Duration is bimodal, with a large number lasting less than a year and the remainder much longer lasting (Levenstein and Suslow 2006: 44-45). Median efficiency, but in fact few contemporary cartels forward vertically integrate. Those in the past that did create sales agencies tend to have longer duration (Levenstein and Suslow 2006: 69). 190 There are theoretical models that prove the possibility of efficiency improvements under overt collusion. 191 In the United States, corporate penalties for cartel conduct were light until the early 1990s, and prison sentences for individuals likewise (Connor 2004b, 2009b). The EU only began imposing serious cartel fines in the late 1980s and still has no managerial penalties. Outside these jurisdictions, significant penalties appeared in only the past ten years. There is a good case to be made that even today global cartels function with impunity. 192 The development of infinitely repeated games demonstrates the wide range of conditions over which collusion can persist indefinitely.

J. M. Connor Price-Fixing Overcharges 3rd Edition February 2014
88
duration of cartels is typically five to seven years, but the median life of international and global cartels is higher, probably because of smaller fringe competition and higher profits from geographic price discrimination. Moreover, the mean cartel duration is higher than the median because some cartels last for many decades.193 Finally, although data constraints are especially severe, most recent economic analyses of, investment, or productivity change do not support a sanguine view of cartels on this score.194 One intensely studied phenomenon is legal German commodity cartels. Regression analyses of output of a large sample of German coal-mining firms determined that productive efficiency did not change when they joined the Ruhr cartel during 1883-1913 (Burhop and Luebbers 2008). Audretsch (1989) collected information on a large number of post-1945 German cartels; he showed that cartel formation resulted in lower output, not lower costs.195 Blankenberg and Geist (2011) analyzed data from the German cement cartel of 1981-2002; during collusion this cartel experienced significant price increases, changes in price dispersion, and declines in cost efficiency. Another heavily researched natural market experiment is the temporary introduction of government-supervised cartels in the United States under the National Industrial Recovery Act (NIRA) in 1933. Although Bittlingmayer (1995) found no output changes due to cartelization, this finding is not supported by several other studies.196 After mid 1934 when federal compulsion flagged, many of the cartels fell apart; however, those that were able to implement open-price filing (Krepps 1997), those industries where firms had symmetric costs (Alexander 1994), and those cartels with viable self-enforcement mechanisms (Alexander 1997) did experience output contraction.197 One might think that higher profits from collusion might result in increased industry investment. Peters (1989) and Steen and Sorgard (1989) do observe this in two cartels. However, Connor (2008: 205) displays internal capacity data for the lysine cartel that shows more plant investment before and after collusion than during collusion. Levenstein and Suslow (2006: 85) conclude that the effects of national cartel policies have no clear effects on national economic productivity and development. However, rigorous empirical research on the dynamic effects of cartelization is just beginning.
193 Four cartels endured from 96 to 134 years. Two were ended by antitrust agencies and two by entry. 194 An oft-cited study that the author suggests shows that cartels can be efficient is Dick’s (1992a) study of 16 legal U.S. export cartels. Of the 16, he finds that six either lowered prices, raised output exported, or both; of these, only three were “efficiency-seeking.” Three cartels raised prices, and seven had insignificant or conflicting effects either way. This seems to be an almost random outcome. See also Günster et al. (2011). 195 For studies that purport to find that late 19th century government-controlled German coal, iron and steel cartels were efficiency-enhancing, see Troeksen (1989), Kinghorn (1996), and Kinghorn and Nielsen (2004). 196 Brittlingmayer’s study was rejected for inclusion herein for other quality problems (Appendix Table A4) 197 The aggregate impact of the NIRA codes on U.S. durable-goods manufacturing output was at least negative 10% (Taylor 2002: 8). In a later paper using more disaggregated data, Taylor (2010) finds that about one-fourth of the industries with the most variable production displayed output increases associated with efficiency enhancement (many were dairy products); the remaining three-fourths experienced the expected output reductions.

J. M. Connor Price-Fixing Overcharges 3rd Edition February 2014
89
Implications for Public Policy The results of the survey have significant policy implications. First, there is a minority view among antitrust writers that there is little evidence that cartels raise prices significantly for a period long enough to justify anticartel laws and, especially, contemporary cartel penalties.198 Consequently, they argue for the repeal or scaling back of the fines or damages that result from collusion. This survey’s results, which are based upon an extraordinarily large amount of data spanning a broad swath of history of all types of private cartels, sharply contradict these views. In fact, the data suggest the opposite. Mean overcharges are several times as high as the average level presumed by the U.S. Sentencing Commission (i.e., 10% of sales) and similar guidelines of other antitrust authorities. Generally speaking, sanction guidelines aim at optimal deterrence of cartel formation (Connor and Lande 2012). More specifically, antitrust enforcement generally seeks general deterrence rather than specific deterrence. Hence, rules for imposing cartel fines ideally combine a proxy for a cartelist’s antitrust damages (typically its affected commerce) with some average multiplier of cartel harm.199 It is not clear which of the many concepts of “average” are the most appropriate for an antitrust authority to employ in designing effective and transparent sanction guidelines. What is clear is that the median averages discussed in this paper are inappropriately conservative guides to cartel fines. Alternative and perhaps superior mean averages are shown in Table 12. Mean episodic overcharges are more than double the respective median averages. Moreover, if authors failed to compute overcharges with competitive sales instead of actual sales200, then the mean overcharges attained by cartels were around 100% -- much higher than the medians of 23% to 25%. Second, the relative injuriousness of bid rigging is sensitive to the measure of central tendency employed. Compared to other forms of collusion, median bid rigging overcharges were generally 25% lower; but mean episodic bid-rigging overcharges were 11% to 24% higher than classical price fixing. These results suggest that antitrust sanctions’ guidelines should not necessarily treat bid rigging per se more harshly than other forms of collusion.
198 A paper by Crandall and Winston (2003) disparages the effectiveness of antirust laws and enforcement. It is answered well by Baker (2003) and Werden (2003). Connor (2004c) also criticizes Crandall and Winston’s reliance on a slim sample of facts concerning cartels. 199 While most jurisdictions adopt a single percentage multiplier (within a stipulated range) as a starting point, others have categorical multipliers. The United States uses 10% and 20% to calculate a range. The EC chooses a single number between 15 and 30, depending on gravity. The JFTC has a much higher percentage for manufacturers than for retailers. Connor and Lande (2008) proposed a single percentage that was double for international cartelists compared to domestic cartels. 200 I do not know what share of estimates this correction ought to be to. In most cases when working with dollar overcharges, authors did not reduce affected commerce by the amount inflated by collusion. However, authors computing overcharges with prices need no such correction. So, these figures are to be regarded as upper limits.

J. M. Connor Price-Fixing Overcharges 3rd Edition February 2014
90
Third, international cartels are typically more destructive of competitive market forces than domestic conspiracies. Connor and Lande (2005) propose raising the overcharge presumption for U.S. fines to 15% for domestic cartels and 25% for international cartels.201 This is a conservative and modest proposal in light of this article’s demonstration that cartels typically generate at least two or three times the antitrust damages presumed by the current U.S. Sentencing Guidelines. Global cartels have historically generated greater overcharges than other international conspiracies. Despite the evident increases in cartel detection rates and the size of monetary fines and penalties in the past decade, a good case can be made that current global anticartel regimes are under-deterring (Bush et al. 2004, Connor 2005). Global cartels are more difficult to detect, have less fear from entry of rivals, achieve higher levels of sales and profitability, and systematically receive weaker corporate antitrust sanctions than comparable domestic cartels. Base fines of 20% of cartelists’ affected commerce, even when adjusted by significant culpability multipliers,202 will do little to deter most of these cartels. Fourth, hundreds of overcharge estimates based on the after-price method conclude that when cartels collapse because of the direct intervention of antitrust authorities, prices both in the short run and long run typically do decline. Nor does antitrust enforcement that suppresses collusion seem to have adverse effects on either static or dynamic industrial efficiency. See, for example, the research in Buccirossi et al (2012) showing that competition-law enforcement directly spurs total factor productivity growth. When the effects of private suits are factored in, it is clear that the U.S. court system is already shouldering the bulk of the world’s burden of punishing international cartels and their managers; moreover, more severe prison sentences for executives have little additional deterrence power (Connor and Lande 2012). This survey suggests that overcharges generated by cartels discovered in most jurisdictions are higher than North America-centered cartels. Consequently, barring multilateral antitrust treaties, anticartel laws and fine-setting practices abroad are in even greater need of strengthening. The surge in EU cartel fines (by both the EC and the EU’s National Competition Authorities) and the rising intensity of enforcement in 50 more jurisdictions since 2000 will marginally improve cartel deterrence. But with virtually no private rights of action outside North America, total penalties are likely to remain sub-optimal for quite some time (Connor 2010).
201 As an anonymous reviewer of an article derived from material in this paper suggested that such changes need to be considered alongside appropriate levels for private settlements. These recommendations are particularly complicated by corporate leniency programs and by the joint fining policies of overseas antitrust authorities for international conspiracies. 202 For a variety of factors, however, very few firms actually pay a fine amounting to 20% or more of the amount of commerce affected. Most violators have their fines reduced by 60% to 80% of the maximums.
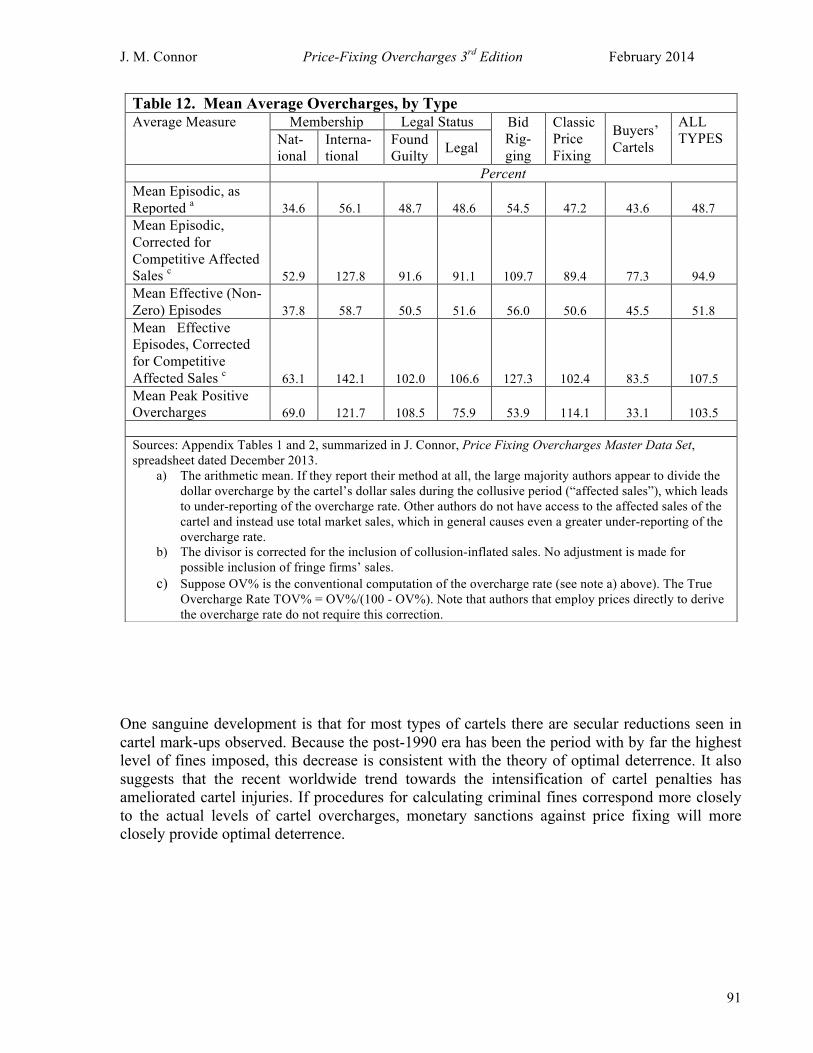
J. M. Connor Price-Fixing Overcharges 3rd Edition February 2014
91
One sanguine development is that for most types of cartels there are secular reductions seen in cartel mark-ups observed. Because the post-1990 era has been the period with by far the highest level of fines imposed, this decrease is consistent with the theory of optimal deterrence. It also suggests that the recent worldwide trend towards the intensification of cartel penalties has ameliorated cartel injuries. If procedures for calculating criminal fines correspond more closely to the actual levels of cartel overcharges, monetary sanctions against price fixing will more closely provide optimal deterrence.
Table 12. Mean Average Overcharges, by Type Average Measure Membership Legal Status Bid
Rig- ging
Classic Price Fixing
Buyers’ Cartels
ALL TYPES Nat-
ional Interna-tional
Found Guilty Legal
Percent Mean Episodic, as Reported a 34.6 56.1 48.7 48.6 54.5 47.2 43.6 48.7 Mean Episodic, Corrected for Competitive Affected Sales c 52.9 127.8 91.6 91.1 109.7 89.4 77.3 94.9 Mean Effective (Non-Zero) Episodes 37.8 58.7 50.5 51.6 56.0 50.6 45.5 51.8 Mean Effective Episodes, Corrected for Competitive Affected Sales c 63.1 142.1 102.0 106.6 127.3 102.4 83.5 107.5 Mean Peak Positive Overcharges 69.0 121.7 108.5 75.9 53.9 114.1 33.1 103.5
Sources: Appendix Tables 1 and 2, summarized in J. Connor, Price Fixing Overcharges Master Data Set, spreadsheet dated December 2013.
a) The arithmetic mean. If they report their method at all, the large majority authors appear to divide the dollar overcharge by the cartel’s dollar sales during the collusive period (“affected sales”), which leads to under-reporting of the overcharge rate. Other authors do not have access to the affected sales of the cartel and instead use total market sales, which in general causes even a greater under-reporting of the overcharge rate.
b) The divisor is corrected for the inclusion of collusion-inflated sales. No adjustment is made for possible inclusion of fringe firms’ sales.
c) Suppose OV% is the conventional computation of the overcharge rate (see note a) above). The True Overcharge Rate TOV% = OV%/(100 - OV%). Note that authors that employ prices directly to derive the overcharge rate do not require this correction.
J. M. Connor Price-Fixing Overcharges 3rd Edition February 2014
92
BIBLIOGRAPHY
The publications below include all those from which overcharge estimates were taken or derived plus noteworthy milestones in the intellectual development of empirical cartel studies. ABA. Proving Antitrust Damages: Legal and Economic Issues: Second Edition. Chicago: ABA Section
of Antitrust Law, American Bar Association (2010). Abrantes-Metz, Rosa and John M. Connor. Determinants of Cartel Duration, paper presented at
the 7th International Industrial Organization Conference, Boston, April 3-‐‑5, 2009. Abrantes-Metz, Rosa, Luke Froeb, John Geweke and Christopher Taylor. A Variance Screen for
Collusion. International Journal of Industrial Organization 24 (May 2006): 467–486.
Abrantes-Metz, Rosa M., Sofia B. Villas-Boas and George Judge. Tracking the LIBOR Rate. Applied Economics Letters 18 (2011): 893-899.
Adams, Richard F. and George M. Bock. Damages in Horizontal Price Fixing Cases. Antitrust Law
Journal 49 (1980): 141-152. Adelman, Morris A. Is the Oil Shortage Real? Foreign Policy 71 (Winter 1972-73): 69-107. Adler, Howard. and David J. Laing. Explosion of International Criminal Antitrust Enforcement. The
Corporate Counselor 11 (March 1997): 1. __________. As Corporate Fines Skyrocket. Business Crimes Bulletin 6 (1999): 1. AGCM. BATTERY RECYCLING: ANTITRUST AUTHORITY IMPOSES TOTAL OF EURO 13.3
MILLION IN FINES OVER TWO ANTI-COMPETITIVE ARRANGEMENTS: Press release. Rome: Autorita Garente della Concorrenza e del Mercato (May 5, 2009). [http://www.agcm.it/eng/index.htm]
Aiginger, Karl et al. Do American and European Industrial Organization Economists Differ? Review of
Industrial Organization 19 (2001): 383-405. Aiginger, Karl and Michael Pfaffermayr. Looking at the Cost Side of Monopoly. The Journal of
Industrial Economics 45 (1997): 245-267. Albaek, Svend, Peter Møllgaard, and Per B. Overgaard. Government-Assisted Oligopoly Coordination?
A Concrete Case. Journal of Industrial Economics 45 (1997): 429-443. Alexander, Barbara. The Impact of the National Industrial recovery Act on Cartel Formation and
Maintenance Costs. Review of Economics and Statistics 76 (1994): 245-254. __________. Failed Cooperation in Heterogeneous Industries Under the National Recovery
Administration. Journal of Economic History 57 (1997): 322-344.

J. M. Connor Price-Fixing Overcharges 3rd Edition February 2014
93
Alexander, Cindy R., Jennifer Arlen, and Mark A. Cohen. Toward an Empirical Foundation for Federal
Sentencing Practice: An Evaluation of Corporate Sentencing Data: Economic Analysis Discussion Paper EAG 00-12. Washington, DC: Antitrust Division, U.S. Department of Justice (December 29, 2000).
Alexander, Donald L. An Empirical Test of Monopoly behavior: An Application to the Hardwood Case.
Applied Economics 20 (1988): 1115-1127. Allen, G.C. An Eighteenth Century Combination in the Copper-Mining Industry. Economic Journal 33
(1923): 74-85. Andrews, E. Benjamin. The Late Copper Syndicate. Quarterly Journal of Economics 3 (1889): 508-516. Anon. In Memoriam: George W. Stocking, 1892-1975. American Economic Review 66 (1976): 453-54. Antitrust Division. CONGRESSIONAL SUBMISSION: FY 2009 PERFORMANCE BUDGET.
Washington, DC: U.S. Department of Justice (2008). [http://www.usdoj.gov/jmd/2009justification/pdf/fy09-atr.pdf]
ATTR. Antitrust and Trade Regulation Report. Serial publication (various dates). Appelbaum, Elie. Testing Price Taking Behavior. Journal of Econometrics 9 (1979): 283-294. Arnold, Thurman W. Cartels or Free Enterprise? Pamphlet No. 103. Washington, DC: U.S. Public
Affairs Committee (1946). Asch, Peter and Joseph J. Seneca. Characteristics of Collusive Firms. Journal of Industrial Economics
23 1975): 223-237. Ashenfelter, Orley C. and Kathryn Graddy. Art Auctions: A Survey of Empirical Studies, Discussion
Paper 3387. Center for Economic Policy Research (May 2002) [www.cepr.org]. __________. Anatomy of the Rise and Fall of a Price-Fixing Conspiracy: Auctions at Sotheby's and
Christie's. Journal of Competition Law and Economics 1 (2005):3-20. Asker, John. A Study of the Internal Organization of a Bidding Cartel: Working Paper. New York: Stern
School of Business, New York University (July 2008). [http://pages.stern.nyu.edu/~jasker/stamps070628.pdf]
Ashton, Thomas S and Joseph Sykes. The Coal Industry of the Eighteenth Industry: 2ed edition.
Manchester: Manchester University Press (1964). Athey, Susan, Jonathan Levin, and Enrique Seira. Comparing Open and Sealed Bid Auctions: Evidence
from Timber Auctions. Quarterly Journal of Economics 126 (2011): 207-257. Audretsch, David B. Legalized Cartels in West Germany. Antitrust Bulletin 34 (Fall 1989): 579-600. Autorité de la Concurrence. Decisions by date [posted on http://www.autoritedelaconcurrence.fr].

J. M. Connor Price-Fixing Overcharges 3rd Edition February 2014
94
Baldwin, Laura H., Robert C. Marshall, and Jean-Francois Richard. Bidder Collusion at Forest Service Timber Sales. Journal of Political Economy 105 (1997): 657-695.
Bajari, Patrick and Lixin Ye. Deciding between Competition and Collusion. Review of Economics and
Statistics 85 (2003): 971-989. Bajari, Patrick and Garret Summers. Detecting Collusion in Procurement Auctions. Antitrust Law Journal
70 (2002): 143-170. Baker, Jonathan B. Identifying Cartel Policy Under Uncertainty: The U.S. Steel Industry, 1933-1939.
Journal of Law and Economics 32 (1989): S47-S76. __________. The Case for Antitrust Enforcement. Journal of Economic Perspectives 17 (Fall
2003):27-50. Baker, Jonathan B. and Daniel L. Rubinfeld. Empirical Methods in Antitrust Litigation. American Law
and Economics Review 1 (1999):386-435. Baker, Wayne E. and Robert P. Faulkner. The Social Organization of Conspiracy: Illegal Networks in
the Heavy electrical Equipment Industry. American Sociological Review 58 (1993): 837-860. Bane, Charles A. The Electrical Equipment Conspiracies: The Treble Damage Actions. New York:
Federal Legal Publications (1973). Banerji, A. and J. V. Meenakshi. Buyer Collusion and Efficiency of Government Intervention in Wheat
Markets in Northern India: An Asymmetric Structural Auctions Analysis. American Journal of Agricultural Economics 86 (2004a): 236-253.
__________. Millers, Commission Agents and Collusion in Grain Auction Markets: Evidence from
Basmati Auctions in North India: Working Paper 129. Centre for Development Economics, Department of Economics, Delhi School of Economics (September 2004b). [http://www.cdedse.org/pdf/work129.pdf]
Barbeau, Neolene. Medical Bodies in Probe into Price Fixing. Sunday Tribune (February 17, 2008:E1). Barbezat, Daniel. Competition and Rivalry in the International Steel Cartel, 1926-1933. Journal of
Economic History 49 (1989): 435-447. __________. International Cooperation and Domestic Cartel Control: The International Steel Cartel,
1926-1932. Business and economic history: Papers presented at the thirty-sixth annual meeting of the Business History Conference Baltimore, Maryland, pp. 14-16, Second Series, vol. 19. Williamsburg, Va.: College of William and Mary, Department of Economics Business History Conference (March 23-25, 1990).
__________. Structural Rigidity and the Severity of the German depression: The AVI and the German
Steel Cartels, 1925-1932. Explorations in Economic History 31 (1994): 479-500. __________. The Comptoire de Sidurgique de France, 1930-1939. Business History Review 70 (1996):
517-540.

J. M. Connor Price-Fixing Overcharges 3rd Edition February 2014
95
Barker, T.C. and J. R. Harris. A Merseyside Town in the Industrial Revolution: St. Helens, 1750-1900. London: Cass (1993).
Barjot, Dominique (editor). International Cartels Revisited (1880-1980). Caen, France: Edition-
Diffusion du Lys (1994). Barnett, Paul G., Theodore E. Keeler, and Teh-wei Hu. Oligopoly Structure and the Incidence of
Cigarette Excise Taxes. Journal of Public Economics 57 (1995): 457-470. Bear, Bill. Public and Private Antitrust Enforcement in the United States, Remarks tot he European
Commission Forum, Brussels, Belgium (February 11, 2014). Beaton-Wells, Caron, and Ariel Ezrachi (Editors). Criminalising Cartels: Critical Studies of an
International Regulatory Movement. London: Hart (2011). Beaton-Wells, Caron, and Neil Brydges. The Cardboard Box Cartel Case. Australian Business Law
Review 36 (2008). Becker, Gary. Crime and Punishment: An Economic Approach. Journal of Political Economy 76 (1968):
169- . Beckerath, Herbert von. Modern Industrial Organization: An Economic Interpretation. New York:
McGraw-Hill (1930, translated 1933). Beckmann, Michael. Art Auctions and Bidding Rings: Empirical Evidence from German Auction Data.
Journal of Cultural Economics 28 (2004): 125-141. Bennett, Judge Mark W. In Re: Iowa Ready-Mix Concrete Antitrust Litigation: Memorandum Opinion
and Order Regarding Plaintiffs’ Unopposed Motion for an Award of Attorneys’ Fees, the Reimbursement of Expenses, and Incentive Awards for Class Representatives (Case No. C 10-4038-MWB). U.S. District Court, Northern Iowa, Western Division (November 9, 2011).
Benni, Antonio Stefano, Clemens Lammers, Louis Marlio, and Aloys Myer. Review of the Economic
Aspects of Several International Agreements. Geneva: Economic Committee, League of Nations (1930).
Berge, Wendell. Cartels: Challenge to a Free World (1st ed., 2nd printing). Washington, DC: Public
Affairs Press (1944). Bergeijk, Peter A. G. van, P. Meulmeester, and R. van der Laan. On the Alleged Invisibility of the Dutch
Construction Cartels, paper delivered at the Amsterdam Center for Law and Economics Workshop, University of Amsterdam, Amsterdam, Netherlands (March 17, 2006). [later published in the Journal of Competition Law and Economics 2008]
Bergenstock, Donna J. and James M. Maskulka. The De Beers Story: Are Diamonds Forever? (De Beers
Botswana Mining Company). Business Horizons 44 (May 2001): 37 - . Bernheim, B. Douglas. Expert Report of B. Douglas Bernheim: In Re Vitamins Antitrust Litigation, MDL
No. 1285, U.S. District Court for the District of Columbia (May 24, 2002).

J. M. Connor Price-Fixing Overcharges 3rd Edition February 2014
96
Bergman, Mats A. Quis Custodiet Ipsos Custodes? Or Measuring and Evaluating the Effectiveness of Competition Enforcement. De Economist 156 (2008): 387-409.
Berry, Steven and Hugh Briggs. A Non-Parametric Test of a First-Order Markov Process for Regimes in
a Non-Cooperatively Collusive Industry. Economics Letters 27 (1988): 73-77. Besanko, David and Daniel F. Sperber. Are Treble Damages Neutral? American Economic Review 80
(1990): 870-887. Beyer, John C. Affidavit of John C. Beyer: In Re Vitamin Antitrust Litigation (MDL No. 1285) (2000). Beyger, Sylwester. Cartel in the Indian Cement Industry: An Attempt to Identify It: Discussion Paper
2012-18. Economics (E-Journal) [http://papers.ssrn.com/sol3/papers.cfm?abstract_id=2035307] Bhatia, G.R. Combating Cartel in Markets – Issues & Challenges. New Delhi, India: Competition
Commission (2006). Bhuhan, Sanjib and Rigoberto Lopez. Oligopoly Power in the Food and Tobacco Industries. American
Journal of Agricultural Economics 79 (1997): 1035-1049. Bittlingmayer, G. Decreasing Average Cost and competition: A new Look at the Addyston Pipe Case.
Journal of Law and Economics 25 (1982): 201-229. __________. Output and Stock Prices When Antitrust Is Suspended: The Effects of the NIRA, in The
Causes and Consequences of Antitrust: The Public Choice Perspective, F. S. McChesney and W. F. Shughart II (editors). Chicago: University of Chicago Press (1995).
Bizzari, Sebastian N. Methyl Methacrylate: CEH Marketing Research Report. Palo Alto, CA: SRI
International (August 2003). BKT. Bundeskartellamt decisions. n(year of decision). Blair, John M. The Control of Oil. New York: Pantheon (1976). Blair, Roger D. and Jeffrey L. Harrison. Monopsony in Law and Economics. Cambridge: Cambridge
University Press (2010). Blair, Roger, James Mak, and Carl Bonham. Collusive Duopoly: The Effects of the Aloha and Hawaiian
Airlines’ Agreement to Reduce Capacity. Antitrust Law Journal 74 (2007): 409-438. Blanckenburg, Korbinian von and Alexander Geist. Detecting Illegal Activities: The Case of Cartels.
European Journal of Law and Economics 32 (2011): 15-33. Blanckenburg, Korbinian von, Alexander Geist, and Konstantin A Khodlodilin. The Influence of
Collusion on Price Changes: New Evidence from Major Cartel Cases: DIW Discussion Paper 1004. Berlin: Deutsches Institut fuer Wirtschaftsforschung (May 2010).
__________. The influence of collusion on price changes: New evidence from major cartel cases.
German Economic Review 13 (2011): 245-56.
J. M. Connor Price-Fixing Overcharges 3rd Edition February 2014
97
Bloch, Kurt. On German Cartels. Journal of Business 5 (1932): 213-222. Block, Michael Kent and Frederick Carl Nold. The Deterrent Effect of Antitrust Enforcement. Journal of
Political Economy 89 (1981): 429-445. Blum, Ulrich. The East German Cement Cartel. Eastern European Economics 45 (2009): 5-28. Boies, David. Courting Justice. New York: Miramax Books (2004). Bolotova, Yuliya V. Does the Potato Supply Management Program Work? A Case of the Idaho Potato
Industry, SSRN Working Paper 1175202 (December 2008) [Available at SSRN: http://ssrn.com/abstract=1175202]
__________. Cartel overcharges: An Empirical Analysis. Journal of Economic Behavior & Organization
70 (2009): 321-341. Bolotova, Yuliya, John M. Connor, and Douglas Miller. The impact of Collusion on Price Behavior:
Empirical Results from Two Recent Cases, paper at the 3rd International Industrial Organization Conference, Atlanta, April 9, 2005.
Bolotova, Yuliya, Christopher S. McIntosh, Kalamani Muthusamy, and Paul E. Patterson. The Impact of
Coordination of production and Marketing Strategies on Price Behavior: Evidence from the Idaho Potato Industry. International Food and Agribusiness Review 11 (2008): 1-28
__________. Is Stabilization of Potato Price and Supply Effective? Empirical Evidence from Idaho.
Agribusiness: An International Journal 26 (2010): 177-201. Boone, Jan. Private Communication to John M. Connor. (February 8, 2011). Boone, Jan and Michiel van Leuvensteijn. Measuring Competition Using the Profit elasticity: American
Sugar Industry, 1890 - 1914. SSRN Working Paper (December 2010). Borgeson, Nancy. S. Amino Acids: CEH Marketing Research Report. Palo Alto: SRI International (May
1999). Bos, Pierre V F. International Scrutiny of Payment Card Systems. Antitrust Law Journal 73 (2006): 739-
777. Bosch, J. and E.W. Eckard. The Profitability of Price Fixing: Evidence from Stock-Market Reactions to
Federal Indictments. Review of Economics and Statistics 73 (1991): 309-317. Boyer, Marcel and Rachidi Kotchoni. How Much Do Cartels Typically Overcharge? CIRANO -
Scientific Publications 2012s-15. (May 31, 2012). [Available at http://ssrn.com/abstract=2076055]
Brander, James A., and Thomas W. Ross. Estimating damages from price-fixing. Canadian Class Action
Review 3 (2006): 335-369. Brännlund, Runar. The Social Loss from Imperfect Competition – The Case of the Swedish Pulpwood
Market. Scandinavian Journal of Economics 91 (1989): 689-704.

J. M. Connor Price-Fixing Overcharges 3rd Edition February 2014
98
Brannman, Lance E.; Klein, J. Douglass. The Effectiveness and Stability of Highway Bid-Rigging, in Empirical Studies in Industrial Organization: Essays in Honor of Leonard W. Weiss: Studies in Industrial Organization, vol. 16. Norwell, Mass. and Dordrecht: Kluwer Academic (1992).
Briggs, Hugh. The Effects of Concentration and Cartels on Nineteenth-Century Railroad Freight Rates, in
Empirical Studies in Industrial Organization: Essays in Honor of Leonard W. Weiss: Studies in Industrial Organization, vol. 16. Norwell, Mass. and Dordrecht: Kluwer Academic (1992).
Bright, Arthur A. The Electric Lamp Industry: Technological Change and Economic Development from
1800 to 1947. New York: Macmillan (1949). Brown, John H. Jeremiah Jenks: A Pioneer of Industrial Organization? Journal of the History of
Economic Thought 26 (March 2004): 69-89. Bruland, Kristine and Patrick O’Brien (editors). From Family Firms to Corporate Capitalism. Oxford:
Clarendon Press (1998). Bullock, Charles J. Trust Literature: A Survey and Criticism. Quarterly Journal of Economics 15
(1901): 167-217. __________. Pools, Trusts and Corporations. Boston: Ginn & Co. (1905). BKA. Bundeskartellamt verhaengt Millionenbussen gegen Drogereiartikelhersteller, press release
(February 20, 2008). [http://www.bundeskartellamt.de/wDeutsch/aktuelles/2008_02_20.php] Buccirossi, Paolo (ed.). Handbook of Antitrust Economics. Cambridge: MIT Press (2008). Buccirossi, Paolo et al. Competition Policy and Productivity Growth: An Empirical Assessment.
Forthcoming in the Review of Economics and Statistics (draft of June 19, 2012). Burhop, Carsten and Thorsten Lübbers. Cartels, Managerial Incentives, and productive Efficiency in
German Coal Mining, 1881-1913. Bonn: Max Planck Institute (April 2008). [later published in the Journal of Economic History, 2009]
Burnside, Alec. European Cartel Enforcement and Investigations. Speech at the annual spring meeting
of the Antitrust Section of the American Bar Association, Washington, DC. (April 2-4, 2003). Buschena, D. E. and J. M. Perloff. The Creation of Dominant Firm Market Power in the Coconut Oil
Export Market. American Journal of Agricultural Economics 73 (1985): 1000 – 1008. Bush, Darren, J. M. Connor, J. J. Flynn, S. Ghosh, W. Grimes, J. E. Harrington Jr., N. Hawker, R. Lande,
W. G. Shepherd, and S. Semeraro. Brief Amici Curiae No. 03-724 in the Supreme Court of the United States, F. Hoffmann-LaRoche et al. v. Empagran et al (March 15, 2004).
Cabolis, Christos, Axarloglou, Kostas Axarloglou, and Nikolaos Chrissidis. A Cartel that Lasts for
Centuries: The Case of the Eastern Orthodox Church Indulgences: Yale ICF Working Paper No. 06-13 (April 13, 2012). [Available at http://ssrn.com/abstract=2083870]
Calvert, Albert F. A History of the Salt Union. London: Effingham Wilson (1913).
J. M. Connor Price-Fixing Overcharges 3rd Edition February 2014
99
Canada. Canada and International Cartels: An Inquiry into the Nature and Effects of International Cartels and other Trade Combinations. Ottawa: Combines Investigation Commission (1945).
Carlton, Dennis W., Gustavo E. Bamberger, and Roy J. Epstein. Antitrust and Higher Education: Was
There a Conspiracy to Restrict Financial Aid? Rand Journal of Economics 26 (1995): 131-147. Carlton, Dennis W. and Jeffrey M. Perloff. Modern Industrial Organization. Glenview, Illinois: Scott
Foresman (1990). __________. Modern Industrial Organization: Fourth Edition. Boston: Pearson (2005). Carmen, Hoy F. and Daniel H. Pick. Orderly marketing for lemons: Who Benefits? American Journal of
Agricultural Economics 72 (1990): 347 – 357. Carbó-Valverde, Santiago, Sujit Chakravorti, and Francisco Rodriguez-Fernandez. Regulating two-sided
markets: an empirical investigation. (March 7, 2011). [http://santiagocarbo.com/CCR07Mar2011.pdf]
Carbó-Valverde, Santiago and Jose Manuel Linares-Zeggara. Payment Card Interchange Fees: Assessing
the Effectiveness of Antitrust Investigations and Regulation in Europe: SSRN Working Paper No. 2052056. (May 6, 2012). [Available at http://ssrn.com/abstract=2052056]
Caron, F. Cartels et Fusions en France: 1914-1945 in Pohl, Hans (Editor). Wettbewerbsbeschraenkungen
auf Internationalen Maerkten [Competition Restrictions in International Markets], Zeitschrift fuer Unternehmensgeschichte [Special Edition of the Journal of Corporation History] 46. Wiesbaden, Germany.
Cassady, Ralph. Auctions and Auctioneering. Berkley: University of California Press (1967). Cawson, A. Organized Interests and the State. London: Sage (1985). CBC. Press release of the Competition Bureau of Canada, Ottawa, Canada. (various dates) CCI. In re: On the Alleged Cartelization of Cement Manufacturers. New Delhi: Competition Commission
of India (July 30, 2012), 82 pp. [http://www.cci.gov.in/index.php?option=com_content&task=view&id=150]
CFTC. ORDER INSTITUTING PROCEEDINGS PURSUANT TO. SECTIONS 6(c) AND 6(d): In the
Matter of Sumitomo Corporation. Washington, DC: Commodities Futures Trading Commission (1998). [http://www.cftc.gov/ogc/oporders98/ogcfsumitomo.htm]
Ciaretta, Aitor. Empirical Analysis on the Effects of Cartels on Prices and real Sales in Sweden from
1976 to 1990. Unpublished. University of Alicante (2001). Chakravorti, Sujit. "Externalities in Payment Card Networks: Theory and Evidence." Review of Network
Economics 9, no. 2 (2010). Chamberlin, Edward H. An Experimental Imperfect Market. The Journal of Political Economy (1948):
95-108.

J. M. Connor Price-Fixing Overcharges 3rd Edition February 2014
100
Christie, William G., Jeffery Harris, and Paul Schultz. Why did NASDAQ Market Makers Stop Avoiding Odd-Eighth Quotes? Journal of Finance 49 (1994): 1841-1860.
Clabault, James M. and M. Block. Sherman Act Indictments, 1955-1980, unpublished statistical
compilation of fines as proportions of volume of commerce (1981). [From Cohen and Scheffman 1989, note 12].
Clark, Robert and Jean-Francois Houde. Collusion with asymmetric retailers: Evidence from a gasoline
price-fixing case: Working Paper. Montreal, Quebec and Madison, Wisconsin (February 8, 2011).
Clark, Benjamin C. The Cordage Industry, Chapter 74 in Chaubcy M. Depew (editor), One Hundred
Years of American Commerce: 1795-1895. New York: D. O. Haynes & Co. (1895). Clarke, Julian L. and Simon J. Evenett. The Deterrent Effects of National Anti-Cartel laws: Evidence
from the International Vitamins Cartel: Working Paper 02-13. Washington, DC: AEI-Brookings Joint Center for Regulatory Studies (December 2002).
__________. The Deterrent Effects of National Anticartel Laws: Evidence from the International
Vitamins Cartel. Antitrust Bulletin 48 (2003): 289-726. Clay, Karen and Werner Troesken. Further Tests of Static Oligopolistic Models: Whiskey, 1882 - 1898.
Journal of Industrial Economics 51 (2003) : 151-166. CNC. Press Release: CNC Fines 47 Construction Companies for Bid Rigging Bids in Public Works
Tenders. Madrid (October 24, 2011). Cohen, Mark A. The Role of Criminal Sanctions in Antitrust Enforcement. Contemporary Policy Issues 7
(1989a): 36-46. __________. Corporate Crime and Punishment: A Study of Social Harm and Sentencing Practices in the
Federal Courts, 1984-1987. American Criminal Law Review 26 (1989b): 605-660. Cohen, Mark A., Chih-Chin Ho, Edward D. Jones III, and Laura M. Schleich. Organizations as
Defendants in Federal Court: A Preliminary Analysis of Prosecutions, Convictions, and Sanctions, 1984-1987. Whittier Law Review 10 (1988): 103-124.
Cohen, Mark A. and David T. Scheffman. The Antitrust Sentencing Guideline: Is the Punishment Worth
the Costs? Journal of Criminal Law 27 (1989): 331-366. Coleman, D.C. International Consortia (1969), in Jones (1993):51-78. Comanor, W.S. and M.A. Schankerman. Identical Bids and Cartel Behavior. Bell Journal of Economics 7
(1976): 281-286. Committee on the Judiciary. Authorizing Association producers of Agricultural Producers: Hearings on
H. R 2373. Washington, DC: U.S. Senate (June 2 to 20, 1921). __________. Prices of Quinine and Quinidine: Hearings Before the Subcommittee on Antitrust and
Monopoly. Washington, DC: U.S. Senate (1967).

J. M. Connor Price-Fixing Overcharges 3rd Edition February 2014
101
Conference Board. Saskatchewan in the Spotlight: Acquisition of Potash Corporation of Saskatchewan Inc. – Risks and Opportunities. Conference Board of Canada (October 1, 2010).
Connor, John M. The Market Power of Multinationals: A Quantitative Analysis of U.S. Corporations in
Brazil and Mexico. New York: Praeger Publishers, Inc. (1977). __________. The Global Citric Acid Conspiracy: Legal-Economic Lessons. Agribusiness: An
International Journal 14 (1998): 253-259. ___________. Global Price Fixing: “Our Customers are the Enemy.” Boston: Kluwer Academic
(2001a). __________. “Our Customers Are Our Enemies:” The Lysine Cartel of 1992-1995. Review of
Industrial Organization 18 (2001b): 5-21. ___________. Private International Cartels: Effectiveness, Welfare, and Anticartel Enforcement, Staff
Paper 03-12. W. Lafayette, IN: Dept. of Agricultural Economics, Purdue University (November 2003).
__________. Global Cartels Redux: The Amino Acid Lysine Antitrust Litigation (1996), in John E.
Kwoka and Lawrence White (eds.), The Antitrust Revolution (Fourth Edition). Oxford: Oxford University Press (2004a).
__________. Global Antitrust Prosecutions of Modern International Cartels. Journal of International
Competition and Trade 4 (September 2004b): 239-267. __________. A Comment on Crandall and Winston, American Antitrust Institute Web site
[http://www.antitrustinstitute.org/Archives/291.ashx] (January 2004c). __________. Collusion and Price Dispersion, Staff Paper 04-14. West Lafayette, IN: Department
of Agricultural Economics, Purdue University (May 2004d). [http://agecon.lib.umn.edu/cgi-bin/view.pl]
__________. Collusion and Price Dispersion. Applied Economics Letters 12 (May 2005): 335-338. __________. Price-Fixing Overcharges: Legal and Economic Evidence: SSRN Working Paper (April 24,
2005a; revised November 2005a). [http://papers.ssrn.com/sol3/papers.cfm?abstract_id=787924] __________. Price-Fixing Overcharges: Legal and Economic Evidence, Chapter 4, pp. 59-153 in John B.
Kirkwood (editor), Volume 22 of Research in Law and Economics. Oxford, Amsterdam and San Diego: Elsevier (January 2007a).
__________. Global Price Fixing: 2nd Updated and Revised Edition: Studies in Industrial Organization
No. 26. Heidelberg, Germany: Springer (2007b). __________. Forensic Economics Applied to Price-Fixing Overcharges. Journal of Competition Law &
Economics Vol. 4, No. 1 (October 2007c): 31-59. __________. Global Cartels Redux: The Amino Acid Lysine Antitrust Litigation (1996), The Antitrust
Revolution (Fifth Edition), John E. Kwoka and Lawrence White (editors). Oxford: Oxford University Press (July 2008).

J. M. Connor Price-Fixing Overcharges 3rd Edition February 2014
102
__________. Cartels & Antitrust Portrayed: Private International Cartels from 1990 to 2008: AAI
Working Paper #09-‐06. (August 31, 2009a). [http://ssrn.com/abstract=1467310] __________. Private International Cartels Full Data. Excel Spreadsheet (dated July 2009b). [A
proprietary data set with estimates prepared by the author from convicted modern international cartels; data and methods are detailed in App. Tabs. 1 & 2]
__________. Recidivism Revealed: Private International Cartels 1990-2009. Competition Policy
International Vol. 6, No. 2 (December, 2010a): 101-128. [Available at http://ssrn.com/abstract=1688508]
__________. Has the European Commission Become More Severe in Punishing Cartels? Effects of the
2006 Guidelines. European Competition Law Review 1/2011 (December 2010b): 27-36. [preprint available at http://ssrn.com/abstract=1737885]
__________. Problems with Prison in International Cartel Cases. Terry and Torello Calvani editors,
Antitrust Bulletin: Symposium: Cartel Penalties: Effective Deterrents or License Fees? 56 (Summer 2011a): 311-344.
__________. Cartel Detection and Duration Worldwide. Competition Policy International Antitrust
Chronicle 2 (September 28, 2011b): 2-10. [https://www.competitionpolicyinternational.com/cartel-detection-and-duration-worldwide]
__________. Private Recoveries in International Cartel Cases Worldwide: What Do the Data Show?
AAI Working Paper No. 12-03. (October 15, 2012). [http://www.antitrustinstitute.org/~antitrust/sites/default/files/WorkingPaperNo12-03.pdf] and [http://ssrn.com/abstract=2165431]
__________. Price Effects of International Cartels in Markets for Primary Products, Chapter 4, pp. 61-80
in Simon J. Evenett and Frederic Jenny (editors), Trade, Competition, and the Pricing of Commodities. London: The Centre for Economic Policy Research (CEPR) (2012a).
__________. Private International Cartels Full Data. Excel Spreadsheet (February 2013). [A proprietary
data set with estimates prepared by the author from convicted modern international cartels; data and methods are detailed in App. Tabs. 1 & 2 of the present paper]
__________. Is Auto Parts Evolving into a Supercartel?: AAI Working Paper No. 13-04 (August 28,
2013a) [Available at http://www.antitrustinstitute.org/~antitrust/sites/default/files/WorkingPaper13-04.pdf]
__________. Cartel Overcharges. Review of Law and Economics 29 (2014): 249-386. Connor, John M. and Yuliya Bolotova. A Meta-Analysis of Cartel Overcharges. International Journal of
Industrial Organization 24 (2006): 1109-1137 [http://papers.ssrn.com/sol3/papers.cfm?abstract_id=788884]
Connor, John M., Yuliya Bolotova and Douglas J. Miller. The Impact of Collusion on Price Behavior:
Empirical Results from Two Recent Cases. International Journal of Industrial Organization 26 (November 2008): 1290-1307. [Available at http://ssrn.com/abstract=991908]

J. M. Connor Price-Fixing Overcharges 3rd Edition February 2014
103
Connor, John M. and C. Gustav Helmers. Statistics on Modern Private International Cartels: Working Paper 07-01. Washington, DC: American Antitrust Institute (January 2007). [http://www.antitrustinstitute.org/recent2/567.pdf]
Connor, John M. and Robert H. Lande. How High Do Cartels Raise Prices? Implications for Optimal
Cartel Fines. Tulane Law Review 80 (Winter 2005): 513-570. __________. Optimal Cartel Fines, Chapter 88, pp. 2203-2218, Issues in Competition Law and Policy:
Volume III, Wayne Dale Collins (editor). Chicago: Section of Antitrust Law of the American Bar Association (July 2008). [Available at SSRN: http://ssrn.com/abstract=1285455]
_________. Cartels As Rational Business Strategy: New Data Demonstrates that Crime Pays. Cardozo
law Review Vol. 34 Issue 2 (December 2012): 428-491. [preprint available at http://ssrn.com/abstract=1917657]
Conseil Concurrence. Decision No. 03-D-17 of 31st March 2003, relative to anticompetitive practices
observed in the motorway fuel distribution market. Paris: Conseil de la concurrence (March, 31, 2003).
Conseil Concurrence. Decision No. 05-D-69 of 15th December 2005, relative to anticompetitive practices
observed in the roadworks sector in the Seine-Maritime département. Paris: Conseil de la concurrence (December 15, 2005).
__________. Decision No.075-D-15 of 9 May 2007, relative to anticompetitive practices observed in the
public tenders for secondary schools in Ile-de-France region. Paris: Conseil de la concurrence (May 6, 2007).
Constantine, Lloyd. Priceless: The Case That Brought Down the Visa/Mastercard Bank Cartel. Kaplan
Books (2009). Crampton, Peter and Thomas Palfry. Collusive Bidding: Lessons from the FCC Spectrum Auctions.
Journal of Regulatory Economics 17 (2000): 229-252. Crandall, Robert W. and Clifford Winston. Does Antitrust Policy Improve Consumer Welfare?
Assessing the Evidence. Journal of Economic Perspectives 17 (Fall 2003):1-26. Crespi, John M. and Adriana Chacon-Cascante. Do U.S. Marketing Orders Have Much Market Power?
An Examination of the Almond Board of California. Agribusiness: An International Journal 21 (2004): 1-16.
Cseres, Katalin J., Maarten Pieter Schinkel, and Floris O. W. Vogelaar (editors), Criminalization of
Competition Law Enforcement. Cheltenham: Edward Elgar (2006). Curtis, Roy Emerson. Trusts and Economic Control: A Book of Materials. New York: McGraw-Hill
(1931). Daggett, R. S. and D.A. Freedman. Econometrics and the Law: A Case Study in the Proof of Antitrust
Damages, in Lucien M. Le Cam and Richard A. Olshen (eds.), Proceedings of the Berkeley Conference in Honor of Jerzy Neyman and Jack Kiefer, Vol. 1. New York: Wadsworth (1985).
Daily News Egypt. Scandals of 2008. Daily News Egypt (December 23, 2008). [available on line].

J. M. Connor Price-Fixing Overcharges 3rd Edition February 2014
104
Dalkir, Serdar. Near Discoveries and Half Punishments Against Cartels Can Be Self-Defeating. İktisat,
İşletme ve Finans 21, No. 242 (2006): 5-22. __________. Personal Communication on the Turkish Cement Cartel. (January 12, 2007). Dana, Durand E. Jones’ the Trust Problem in the United States. Quarterly Journal of Economics 28
(Nov. 1922): 175-182. Davidow, Joel. Proof of Purchases and Damages by Public Buyers of Price-Fixed Goods. The Antitrust
Bulletin 17 (1972): 363-378. Davies, Stephen, Heather Coles, Matthew Olczak, Christopher Pike, and Christopher Wilson. Benefits
from competition: some illustrative UK cases: DTI Economics Paper No. 9. London: Department of Trade and Industry, UK Government (July 2004). [Available at http://www.dti.gov.uk/files/file13299.pdf]
Davies, Stephen and Adrian Majumdar. The development of targets for consumer savings arising from
competition policy: Economic Discussion Paper 4/OFT 386. London: Report prepared for the Office of Fair Trading (June 2002).
Davis, Joshua P. and Robert H. Lande. Towards an Empirical and Theoretical Assessment of Private
Antitrust Enforcement: Univ. of San Francisco Law Research Paper No. 2012-17. (2012). [Available at http://ssrn.com/abstract=2132981]
Davis, Peter and Eliana Garcés. Quantitative Techniques for Competition and Antitrust Analysis.
Princeton: Princeton University Press (2009). De Jong, H.W. and W.G Shepherd (editors). Pioneers of Industrial Organization: How the Economics of
Competition and Monopoly Took Shape. Cheltenham: Edward Elgar (2007). De Rousiers, Paul. Cartels Trusts and Their Development. Geneva: League of Nations (1927). Denger, Michael L. Too Much or Too Little, a summary of discussion, American Bar Association’s
Antitrust Remedies Forum, Washington, DC (April 2003). Demaree, Allen T. How Judgment Came for the Plumbing Conspirators. Fortune (December 1969): 96-
99 and 175-182. Demarest, Lloyd Henry. Lords of Industry. New York: G. P. Putmam’s Sons (1910). Depew, Chauncy M. (editor). One Hundred Years of American Commerce: In Two Volumes. New York:
D. O. Haynes (1895). Dewing, Arthur S. A History of the National Cordage Company. Cambridge: Harvard University Press
(1913). Devos, Greta. International Cartel Agreements in the Zinc Industry, pp.143-151 in Dominique Bardot
(ed.), International Cartels Revisited, 1880-1980. Caen, France: Editions-diffusion du Lys (1994).
J. M. Connor Price-Fixing Overcharges 3rd Edition February 2014
105
Dick, Andrew R. Are Export Cartels Efficiency-Enhancing or Monopoly-Promoting? Research Law and Economics. 15 (1992a): 89-127.
__________. The Competitive Consequences of Japan’s Export Cartel Associations. Journal of
Japanese and International Economics 6 (1992b): 275-298. __________. When Are Stable Cartels Stable? Journal of Law and Economics 39 (1996): 241-283. DOJ. Press releases, plea agreements, etc. by the Antitrust Division of the U.S. Department of Justice.
(various dates 1991-2008). [http://www.usdoj.gov/atr/index.html]. __________. Government’s Memorandum in Aid of Sentencing: United States v. Baer, Crim. No. 90-
0314 (HHG). Washington, DC: District Court of the District of Columbia. (October 24, 1990). Domeratzky, Louis. The International Cartel Movement: Trade Information Bulletin No. 556.
Washington, DC: U.S. Department of Commerce (1928). Donovan, Karen. Goliath: The Trials of David Boies. New York: Pantheon (2005). Drewery. Global Container Market: prospects and profitability in a high growth era. London: Drewery
Shipping Consultants (1996). Duffy, Shannon P. Instant Appeal Certified in Chocolate Price-Fixing Case. Legal Intelligencer 239 (13
April 2009): 1. Duggan, James E. and Gorti V. L. Narasimham. Price Fixing in the Titanium Industry: A Time Series
Analysis. Proceedings of the Business and Economic Statistics Section, American Statistical Association. Washington, DC: American Statistical Association (1981).
Eatwell, John, Murray Milgate, and Peter Newman (editors). The New Palgrave: A Dictionary of
Economics: Volumes 1-4. London: Macmillan (1987). EC. Decisions of the European Commission. RAPID search engine (various dates of decisions). __________. Practical Guide: Quantifying Harm in Actions for Damages Based on Breaches of Article
101 or 102 of the Treaty on the Functioning of the European Union (C(2013) 3440). Strasbourg, France. (11 June 2013).
Eckbo, Paul L. The Future of World Oil. Cambridge, Mass: Ballinger (1976). Economic and Financial Section. Electrical Industry. Geneva: League of Nations (1927). Eden, Holger van. Fighting Hard-Core Cartels: Harm, Effective Sanctions and Leniency Programmes.
Paris: OECD (2002). Edwards, Corwin D. Economic and Political Aspects of International Cartels. Washington, DC: U.S.
Government Printing Office (1944). __________. Cartelization in Western Europe. Washington, DC: Bureau of Intelligence and Research,
U.S. Department of State (1946).

J. M. Connor Price-Fixing Overcharges 3rd Edition February 2014
106
__________. Trade Regulations Overseas: The National Laws. New York: Oceana Publications (1966). __________. Control of Cartels and Monopolies: An International Comparison. New York: Oceana
Publications (1967). Edgerton, Charles E. The Wire-Nail Association of 1895-96. Political Science Quarterly 12 (1897): 246-
272. Ehmer, C. and F. Rosati. Science, Myth, and Fines: Do Cartels Typically Raise Prices by 25%?
Concurrences No 4-2009 (November 2009): 1-5. Eichenwald, Kurt. The Informant: A True Story. New York: Broadway Books (2000). Elliott, William Yandell, Mrs. Elizabeth Stoffregen May, John Wilkinson Foster Rowe, and Donald
Holmes Wallace. International control in the non-ferrous metals. New York: Macmillan (1937). Ellison, Glenn. Theories of Cartel Stability and the Joint Executive Committee. RAND Journal of
Economics 25 (1994): 37-57. __________. Personal communication to J. M. Connor about Ellison’s 1994 JEC study, dated November
12, 2003. Elzinga, Kenneth G. Predatory Pricing: The Case of the Gunpowder Trust. The Journal of Law and
Economics 13 (1970): 223-240. __________. New Developments on the Cartel Front. Antitrust Bulletin 29 (Spring 1984): 3-26. Elzinga, Kenneth G. and William C. Wood. The Costs of the Legal System in Private Antitrust
Enforcement, in White, Lawrence J. (ed.). Private Antitrust Litigation: New Evidence, New Learning. Cambridge, MA: MIT Press (1988).
Engel, Christoph. How Much Collusion? A Meta-Analysis of Oligopoly Experiments. Journal of
Competition law and Economics 3 (2007): 491-549. Epstein, Barbara. Politics of Trade in Power Plants. London: Trade Policy Research Center (1971). Epstein, Barbara and Richard S. Newfarmer. International Electric Association: A Continuing Cartel,
Report to the Subcommittee on Oversight and Investigations, House Committee on Interstate and Foreign Commerce, U. S. Congress. Washington, DC: USGPO (1980).
Erickson, W. Bruce. Price-Fixing Conspiracies: Their Long-Term Impact. Journal of Industrial
Economics 24 (1976): 189-202. Erutku, Can and Vincent A. Hildebrand. Conspiracy at the Pump. Journal of Law and Economics 53
(2010): 223-237. Eswaran, Mukesh. Cartel Unity over the Business Cycle. Canadian Journal of Economics 30 (1997):
644-672. Euromonitor. Euromonitor International: Passport Search. (2013). [online library research service,
frequent source of sales and prices, mostly consumer goods and services]
J. M. Connor Price-Fixing Overcharges 3rd Edition February 2014
107
European Commission (EC). Commission Decision of …[date given]. Brussels (date of decision)
[www.europa.eu.int] Evans, David S. and Mateus, Abel M., How Changes in Payment Card Interchange Fees Affect
Consumers Fees and Merchant Prices: An Economic Analysis with Applications to the European Union (June 27, 2011). [Available at SSRN: http://ssrn.com/abstract=1878735 or http://dx.doi.org/10.2139/ssrn.1878735]
Evenett, Simon J., Margaret C. Levenstein, and Valerie Y. Suslow. International Cartel Enforcement:
Lessons from the 1990s. World Economy 24 (2001): 1221-1246. FTC. Press releases, complaints, reports by the U.S. Federal Trade Commission [http://www.ftc.gov] Fallenius, Christer. A Swedish Example – the Petrol case, in Fighting Cartels – Why and How?:
Proceedings of a conference sponsored by the Konkurrensverket. Stockholm: Elanders Graphic Systems (2001).
Feinstein, Jonathan S., Michael Block, and Frederick Nold. Asymmetric Information and Collusive
Behavior in Auction Markets. American Economic Review 75 (1985): 441-460. Fejø, Jens. Deterrent Effect of Competition Law on Hard Core Cartels, in Fighting Cartels – Why and
How? Stockholm: Konkurrensverket (2001). Fetter, Frank A. The Masquerade of Monopoly. New York: Harcourt Brace (1931). Filson, Darren, Edward Keen, Eric Fruits, and Thomas Borcherding. Market Power and Cartel Formation:
Theory and Empirical Test. Journal of Law and Economics 44 (2001): 465-480. Fine, B. Economies of Scale and a Featherbedding Cartel? A Reconsideration of the Interwar British Coal
Industry. Economic History Review (second ser.) 43 (1990): 438-449. Fink, Carsten, Aaditya Mattoo, and Ileana Cristina Neagu. Trade in International Maritime Services: How
Much Does Policy Matter? World Bank Economic Review 16 (2002): 81-88. Finkelstein, M. and H. Levanback. Regression Estimates of Damages in Price-Fixing Cases. Law and
Contemporary Problems 46 (1983): 145-169. Fisher, Franklin. Multiple Regression in Legal Proceedings. Columbia Law Review 80 (1980): 702- . Fisher, Franklin M. and Paul H. Cootner. An Econometric Model of the World Copper Industry. Bell
Journal of Economics and Management Science 3 (1972): 570-591. Fisher, L.A. and A.D. Owen. An Econometric Model of the U.S. Aluminum Market. Resources Policy
(1981): 150-160. Fleming, Grant. Collusion and Price Wars in the Australian Coal Industry during the Late Nineteenth
Century. Business History 42 (2000): 47-70. Foer, Albert A. and Jonathan W. Cuneo (editors). The International Handbook of Private Enforcement of
Competition Law. Cheltenham, UK: Edward Elgar (2010).

J. M. Connor Price-Fixing Overcharges 3rd Edition February 2014
108
Fourie, F. C. and A. Smith. The South African Cement Cartel: An Economic Evaluation.. South African
Journal of Economics 62 (1994): 123-143. __________. The South African Cement Cartel: Reply. South African Journal of Economics 63 (1995):
91-102. Fog, Bjarke. How Are Cartel Prices Determined? Journal of Industrial Economics 5 (1956): 16-23. Fölster, Stefan and Sam Peltzman. The Social Cost of Regulation and the Lack of Competition in
Sweden, in Freeman, Richard B., Robert H. Topel, and Birgitta Swedenborg (editors). The Welfare State in Sweden: Reforming the Swedish Model. Chicago: University of Chicago Press (1997).
Fonseca, Miguel A. and Hans-Theo Normann. Explicit vs. Tacit Collusion: The Impact of
Communication in Oligopoly Experiments: Working Paper. Dusseldorf: Dusseldorf Institute for Competition Economics (DICE). (May 2011).
Fraas, Arthur G. and Douglas F. Greer. Market Structure and Price Collusion: An Empirical Analysis.
Journal of Industrial Economics 26 (1977): 21-44. Frank, Niels and Rainer P. Lademann. Economic evidence in Private Damage Claims: What Lessons Can
Be Learned from the German Cement Cartel Case? Journal of European Competition Law & Practice 1 (2010): 360-366.
French, B. C. and C. F. Nuckton. An Empirical Analysis of Economic Performance under the Marketing
Order for Raisins. American Journal of Agricultural Economics 64 (1982): 581-593. Friedman, Milton. FEO and the Gas Line. Newsweek (March 4, 1974):71. Frode, Steen. Cement and Lerner Index: Personal email communication (December 4, 2006). Froeb, Luke M., Robert A. Koyak, and Gregory J. Werden. What Is the Effect of Bid-Rigging on Prices?
Economics Letters 42 (1993): 419-423. __________. Bid Rigging against the Government. The Owen Manager 15 (1994). __________. Effects of Price-Fixing and Bid-Rigging Conspiracies (1995a, downloaded 2/24/99)
(www.antitrust.org/economics/conspiracy effects.html) __________. Japan’s Price-Fixing and Bid-Rigging Conspiracies (1995b, downloaded 2/24/99).
(www.antitrust.org/economics/conspiracyeffects.html). FTC. Report of the Federal Trade Commission on International Electrical Equipment Cartels.
Washington, DC: U.S. Federal Trade Commission (1948). __________. Press Release: Illegal Conduct Resulted in Price Increases of up to 3000 Percent for Two
Anti-anxiety Drugs, FTC Alleges; Agency to Seek $120 Million in Consumer Refunds. (Dec. 21, 1998).[http://www.ftc.gov/opa/1998/12/mylanpv.shtm]

J. M. Connor Price-Fixing Overcharges 3rd Edition February 2014
109
Fugate, Wilbur L. Foreign Commerce and the Antitrust Laws, 2nd ed. Boston: Little Brown (1973). Funderburk, Dale R. Price Fixing in the Liquid Asphalt Industry: Economic Analysis versus the “Hot
Document.” Antitrust Law & Economic Review 7 (1974): 61-74. Gaban, Eduardo Molan and Juliana Oliviera Domingues. Antitrust Law in Brazil: Fighting Cartels.
Alphen aan den Rijn: Wolters Kluwer (2012). Gallet, Craig A. Cyclical Fluctuations and Coordination in the US Steel Industry. Applied Economics 29
(1997): 279-285. Gallo, Joseph C. et al. Criminal Penalties under the Sherman Act: A Study in Law and Economics.
Research in Law and Economics 16 (1994): 25-71. Gately, Dermot. A Ten-Year Retrospective: OPEC and the World Oil Market. Journal of Economic
Literature 22 (1984): 1100-1114. Gaver, Kenneth M. and Jerold L. Zimmerman. An Analysis of Competitive Bidding on BART Contracts.
Journal of Business 50 (1977): 279-295. Gavin, Andrew. Email to John M. Connor dated October 7, 2004. Genesove, David and Wallace P. Mullin. Testing Static Oligopoly Models: Conduct and Cost in the
Sugar Industry, 1890-1914. Rand Journal of Economics 29 (1998): 355-77. Genesove, David and Wallace P. Mullin. Rules, Communication, and Collusion: Narrative Evidence
from the Sugar Institute Case. American Economic Review 91 (2001): 379-398. Gerber, David. Law and Competition in Twentieth Century Europe: Protecting Prometheus. Oxford:
Oxford University Press (1998). Ghosal, Vivek and Johan Stennek (editors). The Political Economy of Antitrust. Amsterdam: Elsevier
(2007) Gillingham, John. An Ill-Fitting Jacket: The United States and the International Steel Cartel, pp. 129-
142 in Dominique Bardot (ed), International Cartels Revisited, 1880-1980. Caen, France: Editions-diffusion du Lys (1994).
Gilo, David and Yossi Spiegel. The Credit Card Industry in Israel. Review of Network Economics 4
(2005): 266-289. Ginsberg, Douglas H. Statement of the Assistant Attorney General for Antitrust, U.S. Department of
Justice. Hearings Before the United States Sentencing Commission Concerning Alternatives To Incarceration. (July 15, 1986).
Goldberg, Victor P. The International Salt Puzzle. Research in Law and Economics 14 (1991): 39-41. Goldscmidt, Bertrand. How It All began in Canada – The Role of French Scientists. Proceedings of the
29th Annual Conference of the Canadian Nuclear Society: Special Symposium: 50 Years of Nuclear Fission in Review 1 (June 5, 1989). [http://www.cns-snc.ca/history/fifty_years/goldschmidt.html]

J. M. Connor Price-Fixing Overcharges 3rd Edition February 2014
110
Gommesen, Henrik. Cartels in Denmark, personal communication. (December 3, 2003). Goyder, D. G. EC Competition Law: Third Edition. Oxford: Clarendon (1998). Graubert, John D. Too Much or Too Little, a summary of discussion, American Bar Association’s
Antitrust Remedies Forum, Washington, DC (April 2003). Graebner, William. Great Expectations: The Search for Order in Bituminous Coal, 1890-1917. Business
History Review 48 (1973):49-72. Gray, Earle. The Great Uranium Cartel. Toronto: McClelland & Stewart (1982). Granitz, Elizabeth and Benjamin Klein. Monopolization by “Raising Rivals’ Costs”: The Standard Oil
Case. Journal of Law and Economics 39 (1996): 1-47. Grant, Hugh and Henry Thille. Tariffs, Strategy and Structure: Competition and Collusion in the Ontario
Petroleum Industry, 1870-1880. Journal of Economic History 61 (2001): 390-413. Great Britain Board of Trade. Survey of International Cartels and Internal Cartels (two volumes).
London: Board of Trade (1944, 1946). Greer, Douglas F. Industrial Organization and Public Policy, 2nd edition. New York: Macmillan (1984). Griffin, James M. Previous Cartel Experience: Any Lessons for OPEC?, in Lawrence R. Klein and J.
Marquez (eds), Economics in Theory and Practice: An Eclectic Approach. Boston: Kluwer Academic (1989).
Griffin, James M. and William S. Neilson. The Oil Price Collapse and Afterwards: What Does Game
Theory Add? Economic Inquiry 32 (1994): 543-561. Groenewegen, Peter. “Political Economy” and “Economics”, in The New Palgrave: Volume 3, John
Eatwell et al. (eds.). London: Macmillan (1987). Groner, Jonathan. Chalk up a Few Wins for Microsoft. The National Law Journal (October 2, 2000):
A4. Grossman, Peter Z. The Dynamics of a Stable Cartel: The Railroad Express, 1851-1913. Economic
Inquiry 34 (1996): 220-236. __________(ed.). How Cartels Endure and How They Fail: Studies of Industrial Collusion. Cheltenham,
UK: Edward Elgar (2004). Grout, Paul A. and Silvia Sonderegger. Predicting Cartels, Office of Fair Trading Discussion Paper
(OFT 773). London: Office of Fair Trading (March 2005). Guersent, Oliver (editor). The Fight against International Cartels of the European Commission: 19
Decisions in 19 Months between July 2001 and December 2003. Brussels: EC Directorate-General for Competition (2001). [http://europa.eu.int/comm/competition/antitrust, downloaded March 2004].

J. M. Connor Price-Fixing Overcharges 3rd Edition February 2014
111
Guilfoil, John D. Damage Determination in Private Antitrust Suits. Notre Dame Lawyer 42 (June 1967):
647-679. Günster, Andera, Martin Carree, and Mathijs A. van Dijk. Do Cartels Undermine Economic Efficiency?
(December 2011). [Available at http://scholar.google.com/scholar?sciupd=1&hl=en&as_sdt=0,22] Gupta, Bishnupriya. The International Tea Cartel during the Great depression, 1929-1933. Journal of
Economic History 61 (2001a):144-159. __________. Why Did Collusion Fail? The Indian Jute Industry in the Inter-War Years. Business History
47 (2005): 532-552. Gupta, Srabana. The Effect of Bid-Rigging on Prices: A Study of the Highway Construction Industry.
Review of Industrial Organization 19 (2001b): 453-467. Haan, Marco A., Lambert Schoonbeek, and Barbara M. Winkel. Experimental results on Collusion: The
Role of Information and Communication, pp. 9-33 in Experiments and Competition Policy, Jeroen Hinloopen and Hans-Theo Normann (editors). Cambridge: Cambridge University Press (2009).
Haber, L. F. The Chemical Industry 1990-1930. Oxford: Clarendon Press (1971). Hajivassilou, Vassilis A. Testing Game-Theoretic Models of Price-Fixing Behavior: Discussion Paper
No. 935. New Haven: Cowles Foundation for Research in Economics (1989). Haney, Lewis H. Price Fixing in the United States during the War I. Political Science Quarterly 34
(March 1919a): 104-126. __________. Price Fixing in the United States during the War II. Political Science Quarterly 34 (June
1919b): 262-289. __________. Price Fixing in the United States during the War III. Political Science Quarterly 34
(September 1919b): 434-453. Hansen, Robert G. Empirical Testing of Auction Theory. American Economic Review 75 (1985): 156-
159. Harding, Christopher and Julian Joshua. Regulating Cartels in Europe: A Study of Legal Control of
Corporate Delinquency. Oxford: Oxford University Press (2003, 2010). Harrington, Joseph E. Post-Cartel Pricing during Litigation. Journal of Industrial Economics 52 (2004):
517-533. __________. How Do Cartels Operate? Boston: now (2007). Harris, Robert G. Harris & Lawrence A. Sullivan. Passing on the Monopoly Overcharge: A
Comprehensive Policy Analysis. University of Pennsylvania Law Review 128 (1979): 269.

J. M. Connor Price-Fixing Overcharges 3rd Edition February 2014
112
Hasagawa, Shin. International Cartels and the Japanese Electrical Machinery Industry, pp. 243-252 in Dominique Bardot (ed), International Cartels Revisited, 1880-1980. Caen, France: Editions-diffusion du Lys (1994).
Hausfeld, Michael D. Class Plaintiffs’ Motion for Preliminary Approval of Settlement Between Class
Plaintiffs and Defendants Mitsui & Co., Mitsui & Co. (U.S.A.), Inc., and Bioproducts, Inc. Washington, DC: U.S. District Court for the District of Columbia (October 31, 2003).
Hausman, William J. A Model of the London Coal Trade in the Eighteenth Century. Quarterly Journal
of Economics 94 (1980): 1-14. __________. Cheap Coals or Limitation of the Vend? The London Coal Trade, 1770-1845. Journal of
Economic History 44(1984): 321-328. Hay, George A. and Daniel Kelley. An Empirical Survey of Price-Fixing Conspiracies. Journal of Law
and Economics 17 (1974): 13-38. Hayashi, Fumiko. Public Authority Involvement in Credit and Debit Card Markets: Various Countries.
Kansas City: Federal Reserve Bank of Kansas City (April 2010). [available at www.justice.gov/atr/cases/f269100/269181.pdf]
Heath, John. Still Not Enough Competition? Restrictive Business Practices Re-examined. London:
Institute of Economic Affairs Ltd. (1963). Heaulme, M. L’Évolution commerciale des houilleres du Nord et du Pas de Calais, 1919-1939.
University of Paris, Ph.D. Dissertation (1948). Hendricks, Kenneth and Robert H. Porter. An Empirical Study of an Auction with Asymmetric
Information. American Economic Review 98 (1988): 867-883. Henley, Andrew. Price Formation and Market Structure: The Inter-War Coal Industry. Oxford Bulletin
of Economics and Statistics 50 (1988):263-278. Herfindahl, Oris C. Copper Costs and Prices: 1870-1957. Baltimore: Johns Hopkins University Press
(1959). Herling, John. The Great Price Conspiracy: The Story of the Antitrust Violations of the Electrical
Industry. Washington, DC: Robert D. Luce (1962). Hendricks, Kenneth and Robert H. Porter. Collusion in Auctions. Annales d’Economie et de Statistique
15/16 (1989): 217-230. __________. An Empirical Study of an Auction with Asymmetric Information. American Economic
Review 78 (1988): 865-883. Heuvel, Grat van den. The Parliamentary Enquiry on Fraud in the Dutch Construction Industry. Crime,
Law, and Social Change 44 (2005): 133-151. Hexner, Ervin. The International Steel Cartel. Chapel Hill, NC: University of North Carolina Press
(1943).
J. M. Connor Price-Fixing Overcharges 3rd Edition February 2014
113
Hexner, Ervin (with the assistance of Adelaide Walters). International Cartels. Chapel Hill, NC: University of North Carolina Press (1946).
Hirsch, Andrew von. Federal Sentencing Guidelines: Do They Provide Principled Guidance? American
Criminal Law Review 27 (1989): 367-390. Hirst, Francis W. Monopolies, Trusts, and Kartells. London: Methuen (1905). Holloway, Steven K. The Aluminum Multinationals and the Bauxite Cartel. New York: St. Martin’s
(1988). Holmes, William F. The Southern Farmers’ Alliance and the Jute Cartel. Journal of Southern History 60
(1994): 59-80. Holt, Byron W. The Relationship of the Protective Tariff to the Trusts. Publications of the American
Economic Association: Third Series, Vol. VIII. (1907): 212-228. Hong Kong Monetary Authority. Testing for Collusion in the Honk Kong Banking Sector: Research
Memorandum 03-2007. (February 2007). [http://www.info.gov.hk/hkma/eng/research/RM03-2007.pdf]
Hovenkamp, Herbert. Federal Antitrust Policy: Second Edition. St. Paul: WestGroup (1999). Hoxby, Caroline M. Benevolent Colluders?: Working Paper No. 7754. Cambridge, MA: NBER (2000). Howard, Jeffery H. and David Kaserman. Proof of Damages in Construction Industry Bid-Rigging Cases.
Antitrust Bulletin 34 (1989): 359-393. Hudson, Henry. The Southern Railway and Steamship Association. Quarterly Journal of Economics 5
(1890): 70-94. Hüeschelrath, Kai, Kathrin Müller, and Tobias Veith. Concrete Shoes for Competition: The Effect of the
German Cement Cartel on Market Price, Discussion Paper No. 12-035. Mannheim, Germany: ZEW - Centre for European Economic Research. (May 2012a). [Available at http://ftp.zew.de/pub/zew-docs/dp/dp12035.pdf]
__________. Estimating Damages from Price-Fixing: The Value of Transaction Data, Discussion Paper
No. 12-036. Mannheim, Germany: ZEW - Centre for European Economic Research. (May 2012b). [Available at http://ftp.zew.de/pub/zew-docs/dp/dp12036.pdf]
Hüeschelrath, Kai and Tobias Veith. Cartel Detection in Procurement Markets: Discussion Paper No.
11-066. Mannheim, Germany: ZEW - Centre for European Economic Research. (December 2011). [Available at http://papers.ssrn.com/sol3/papers.cfm?abstract_id=1983280]
ICN. Building Blocks for Effective Anti-Cartel Regimes: Vol. 1. Bonn, Germany: ICN Working Group on
Cartels. (June 2005). [http://www.internationalcompetitionnetwork.org/uploads/library/doc346.pdf]
__________. Anti-Cartel Enforcement Manual: Chapter 4. ICN Working Group on Cartels (Revised
March 2010). [http://www.internationalcompetitionnetwork.org/working-groups/current/cartel/manual.aspx]

J. M. Connor Price-Fixing Overcharges 3rd Edition February 2014
114
Indian Express. MRTPC Pulls Up ACC, Lafarge, Birla for Cement Price Rigging. Indian Express
(March 3, 2008). Ippolito, R. A. and R. T. Masson. The Social Cost of Government Regulation of Milk. Journal of Law
and Economics 21 (1978): 33-65. Isaacson, William. Investigation of Chinese Cartels Affecting U.S. Commerce. Unpublished presentation
(2008). Jacquemin, Alexis, Tsuruhiko Nambu, and Isabelle Dewez. A Dynamic Analysis of Export Cartels: The
Japanese Case. The Economic Journal 91 (1981): 685-696. Jacquemin, Alexis and Margaret E. Slade. Cartels, Collusion, and Horizontal Merger, in Richard
Schmalensee and Robert D. Willig (editors.), Handbook of Industrial Organization, Volume 1. Amsterdam: Elsevier (1989).
Jarkarta Post. KPPU Rules against Temasek. Jarkarta Post (November 20, 2007). Jenks, Jeremiah W. The Michigan Salt Association. Political Science Quarterly 3 (1888): 78-98. __________. The Trust Problem. Garden City, NY: Doubleday, Page (1st, 2nd, and 3rd editions 1900,
1901, 1903). Jenks, Jeremiah W. and Walter E. Clark. The Trust Problem. Garden City, NY: Doubleday, Doran (4th
and 5th editions 1917, 1929). Jensen-Eriksen, Niklas. Industrial Diplomacy and Economic Integration: The Origins of All-European
Paper Cartels, 1959-72. Journal of Contemporary History 46 (2011): 179-202. Jenny, Frederic. A Tale of Three Cartels, presentation at the 2003 Forum on International Competition
Law, Section of Antitrust Law, American Bar Association, New York (February 7, 2003). __________. Cartels and Collusion in Developing Countries, paper at the Fifth Annual UNCTAD
Conference [on] Restrictive Business Practices. Antalya: Turkey (November 14-18, 2005). __________. Global Potash Trade and Competition. The Financial Times (India). (November 25, 2010). Jeon, Seonghoon and Kwanhshik Shin. Economic Analysis of Competition Effects of International
Electrodes Cartel on Korean Import Market. Paper at the 3rd International Industrial Organization Conference, Atlanta, April 2005.
JFTC. Basic Idea behind the Planned Major Revision of the Antimonopoly Law. Tokyo: Fair Trade
Commission (May 19, 2004) [www2.jftc.go.jp/kaisei.htm, downloaded Aug. 2004] Johnsen, D. Bruce. Property Rights to Cartel Rents: The Socony-Vacuum Story. Journal of Law and
Economics 34 (1991): 177-203. Jones, Elliot. The Anthracite Coal Combination in the United States. Cambridge: Harvard (1914). __________. The Trust Problem in the United States. New York: Macmillan (1921).

J. M. Connor Price-Fixing Overcharges 3rd Edition February 2014
115
Jones, Geoffrey (editor). Coalitions and Collaboration in International Business. Aldershot, UK: Edward
Elgar (1993). Jong, Henry W. de. Economists from the German Language Area (Nineteenth and Twentieth Centuries),
chapter 3 in Pioneers of Industrial Organization, Henry W. de Jong and William G. Shepherd (editors). Cheltenham, UK: Edward Elgar (2009).
__________. Market Theory in the Low Countries, chapter 4 in Pioneers of Industrial Organization,
Henry W. de Jong and William G. Shepherd (editors). Cheltenham, UK: Edward Elgar (2009a). Josephson, Matthew. The Robber Barons. San Diego: Harcourt Brace (1962). Joshua, Julian. Single Continuous Infringement of Article 81 EC: Has the Commission Stretched the
Concept Beyond the Limit of its Logic? European Competition Journal 5 (August 2009): 451-477.
Joshua, Julian and Elvira aliened Rodriguez. E Pluribus Unum: Rolling Up Cartel Infringements in EC
Competition Law. The European Antitrust Review 2010. London: Global Competition Review. [http://www.globalcompetitionreview.com/reviews/19/the-european-antitrust-review-2010]
Joskow, Paul. Commercial Impossibility, the Uranium Market and the Westinghouse Case. Journal of
Legal Studies 6 (1976): 119-176. Just, Richard E. and Wen S. Chern. Tomatoes, Technology, and Oligopsony. Bell Journal of Economics
11 (1980): 584-602. Kamerschen, David R. and J.E. Morgan. Collusion Analysis of the Alabama Asphalt Market. Applied
Economics 36 (2004):690. Kamita, Rene Y. Analyzing the Effects of Temporary Antitrust Immunity: The Aloha-Hawaiin Immunity
Agreement. Journal of Law and Economics 53 (May 2010): 238-261. Kemp, T. The French Economy, 1913-1939. London: Longman (1972). KFTC. The KFTC Imposes Surcharges on the International Cartel of Vitamin Companies, Press Release.
Seoul: Korea Fair Trade Commission (April 25, 2003). __________. Harms of Cartels and Sanctions against Them: Report to the OECD. Seoul: Republic of
Korea (June 7, 2001). Kikkawa, Takkeo. International Cartel and Domestic Cartel in Japan: The Case of the 1932 Gasoline
Agreement, pp. 233-241 in Dominique Bardot (ed), International Cartels Revisited, 1880-1980. Caen, France: Editions-diffusion du Lys (1994).
Kinghorn, Janice Rye and Randall Nielsen. A Practice without Defenders: Price Effects of Cartelization,
in Grossman, Peter Z. (ed.). How Cartels Endure and How They Fail: Studies of Industrial Collusion. Cheltenham, UK: Edward Elgar (2004).
Kirby, M. W. The Control of Competition in the British Coal-Mining Industry in the Thirties. Economic
History Review (2nd ser.) 26 (1973): 273-284.

J. M. Connor Price-Fixing Overcharges 3rd Edition February 2014
116
Kishi, Nobuko. Translation of JFTC (2004) (August 2004) Kleinwächter, Fritz. Die Kartelle: Ein Beitrag zur Frage der Organisation der Volkswirtschaft.
Innsbruck, Austria (1883). Kneuper, Robert, and James Langenfeld. The Potential Role of Civil Antitrust Damage Analysis in
Determining Financial Penalties in Criminal Antitrust Cases. George Mason Law Review 18 (2011): 953- 986.
Kobayashi, Bruce H. Antitrust, Agency, and Amnesty: An Economic Analysis of Criminal Enforcement
of the Antitrust Laws Against Corporations. George Washington Law Review 69 (2001): 715- . Kovacic, William E. Competition policy and cartels: the design of remedies, Chapter 3 in Cseres, Katalin
J., et al. (editors), Criminalization of Competition Law Enforcement. Cheltenham: Edward Elgar (2006).
Kovacic, William E. and Carl Shapiro. Antitrust policy: A Century of Economic and Legal Thinking.
Journal of Economic Perspectives 14(2000):43-60. Komninos, Assimakis, et al. Quantifying Antitrust Damages: Study Prepared for the European
Commission. Oxera (December 2009). [http://www.unipr.it/arpa/defi/econlaw/econlaw%20non%20collegati/Oxera(2009).pdf]
KFTC. Korea Fair Trade Commission: 2008 Annual Report. [www.ftc.go.kr/eng] KPMG. Rapport om erstatningssopgørelser I forbindelser med kommunernes handel med Alstom Power
Flowsystems A/S I perioden 1991-1998: Aalborg, Århus, Odense, og Københavns Kommuner. Copenhagen: KMPG (2003).
Kreps, Theodore J. Point Four and the Domestic Economy. The ANNALS of the American Academy of
Political and Social Science (1950): 160-172. Krepps, M. B. Another Look at the Impact of the National Industrial Recovery Act on Cartel Formation
and Maintenance Costs, Review of Economics and Statistics 79 (1997): 151-154. Kronstein, Heinrich. The Law of International Cartels. Ithaca: Cornell University Press (1973). Kudo, Akira. The Japanese Strategy of the International Dyestuffs Cartel, pp. 215-222 in Dominique
Bardot (ed.), International Cartels Revisited, 1880-1980. Caen, France: Editions-diffusion du Lys (1994).
Kuhlman, John M. Theoretical Issues in the Estimation of Damages in Private Antitrust Actions.
Antitrust Bulletin 17 (1972): 548-558. Kwoka, John E. Pricing under Federal Milk Market Regulation. Economic Inquiry 5 (1977): 367–384. __________. The Attack on Antitrust Policy and Consumer Welfare: A Response to Crandall and
Winston, Working Paper 03-008. Boston: Department of Economics, Northeastern University (March 2003).

J. M. Connor Price-Fixing Overcharges 3rd Edition February 2014
117
__________. The Price Effect of Bidding Conspiracies: Evidence from Real Estate “Knockouts.” Antitrust Bulletin 42 (1997): 503-516.
Labys, W.C. and J.F. Hewheler. Survey of Commodity Demand and Supply Elasticities: Memorandum
No. 48. Geneva: Research Division, UNCTAD (1974). Lamer, Mirko. The World Fertilizer Economy. Stanford, California: The Food Research Institute,
Stanford University Press (1957). Lande, Robert H. Are Antitrust “Treble” Damages Really Single Damages? Ohio State Law Journal 54
(1993):117-174 . __________. Why Antitrust Damage Levels Should Be Raised. Loyola Consumer Law Review 16
(2004): 329-345. __________. Benefits of Private Enforcement: Empirical Background, Chapter 1, pp. 3-11, in Foer,
Albert A. and Jonathan W. Cuneo (editors). The International Handbook of Private Enforcement of Competition Law. Cheltenham, UK: Edward Elgar (2010).
Lande, Robert H. and Joshua P. Davis. An Evaluation of Private Antitrust Enforcement: 29 Case Studies,
unpublished Ms. (November 8, 2006). __________. Benefits From Private Antitrust Enforcement: An Analysis of Forty Cases, paper presented
at the AAI Symposium “Future of Private Antitrust Enforcement,” Washington, DC (December 10, 2007). [http://www.antitrustinstitute.org/archives/files/AAI%20Benefits%20from%20Private%20AT%20Enforcement%20-%20Lande%20Davis%20Report%20-%2012.10.07_121220070944.pdf]
___________. Benefits from Private Antitrust Enforcement: An Analysis of Forty Cases. University of
San Francisco Law Review 42 (2008): 879. __________. Comparative Deterrence from Private Enforcement and Criminal Enforcement of the U.S.
Antitrust Laws: SSRN Working Paper 1565693. (March 5, 2010). [Available at http://ssrn.com/abstract=1565693] (later published in Brigham Young University Law Review (2011): 101-175).
Landes, William H. Optimal Sanctions for Antitrust Violations. University of Chicago Law Review 50
(1983): 652-678. Lanzillotti, Robert F. The Great School Milk Conspiracies of the 1980s. Review of Industrial
Organization 11 (1996): 413-458. __________. Great School Milk Conspiracies Revisited: Rejoinder. Review of Industrial Organization
17 (2000): 343-353. Leach, D.F. The South African Cement Cartel: A Critique of Fourie and Smith. South African Journal of
Economics 62 (1994): 254-279. Lean, David F., Jonathan D. Ogur, and Robert P. Rodgers. Does Collusion Pay… Does Antitrust Work?
Southern Economic Journal 51 (1985): 828-841.

J. M. Connor Price-Fixing Overcharges 3rd Edition February 2014
118
LeCraw, D.J. The Uranium Cartel. Business Quarterly (1977): 77-83. Lee, In Kwon. Non-Cooperative Tactic Collusion, Complementary Bidding and Incumbency Premium.
Review Industrial Organization 15 (1999): 115-134. Lee, In Kwon and Kyungdong Hahn. Bid-Rigging in Auctions for Korean Public-Works Contracts and
Potential Damage. Review of Industrial Organization 21 (2002): 73-88. Leffler, Kieth. United States of America v. AU Optronics Corp. et al. (U. S. District Court, Northern
District of California): Expert Testimony of Keith Leffler, Trial Transcript pp. 3274-3506. (February 9, 2012).
Leiden University. Interwar Cartel Database. Leiden, Netherlands: Historical Institute. (downloaded
September, 26, 2002). [http://www.let.leidenuniv.nl/history/rtg/cartels/bal2.html]. Leitzinger, J. Regression Analysis in Antitrust Cases: Opening the Black Box. The Philadelphia Lawyer
20 (1983): 1- . Levenstein, Margaret C. Price Mass Production Conquers the Pool: Firm Organization and the nature of
Competition in the Nineteenth Century. Journal of Economic History 55 (1995): 575-611. __________. Wars and the Stability of Collusion: A Study of the Pre-World War I Bromine Industry.
Journal of Industrial Economics 45 (1997): 117-137. __________. Strategic Consumer Behavior and Cartel Stability: The Potash Industry 1870-1914. Ann
Arbor, MI: mimeo (2000). Levenstein, Margaret C., Jagadeesh Sivadasan, and Valerie Y. Suslow. The Effect of Competition on
Trade Patterns: Evidence from the Collapse of International Cartels: Working Paper 02-001. University of Michigan, Ross School of Business (February 2011).
Levenstein, Margaret C. and Valerie Y. Suslow. What Determines Cartel Success?: Working Paper 1147.
University of Michigan Business School (January 2002). [updated in 2006 below]. __________. Contemporary International Cartels and Developing Countries: Economic Effects and
Implications for Competition Policy. Antitrust Law Journal 71 (2003): 801-852. __________. Cartel Contract Duration: Empirical Evidence from International Cartels, in Grossman,
Peter Z. (ed.). How Cartels Endure and How They Fail: Studies of Industrial Collusion. Cheltenham, UK: Edward Elgar (2004a).
__________. The Changing International Status of Export Cartel Exemptions. (November 10, 2004b).
[http://ssrn.com/abstract=618201] __________. What Determines Cartel Success? Journal of Economic Literature 64 (March 2006): 43-95. __________. Breaking Up is Hard to Do: Determinants of Cartel Duration: Ross School of Business
Paper No. 1150. (September 2010). [Available at http://ssrn.com/abstract=1676968] Levenstein, Margaret, Jagadeesh Sivadasan, and Valerie Suslow. Effect of Collusive Agreements on
International Trade: Evidence from an International Cartel, paper at the International Industrial

J. M. Connor Price-Fixing Overcharges 3rd Edition February 2014
119
Organization Conference, Arlington, Virginia, May 17, 2008. [available at http://papers.ssrn.com/sol3/papers.cfm?abstract_id=1628822]
__________. The Effect of Competition on Trade Patterns: Evidence from the Collapse of International
Cartels: Ross School of Business Paper 1147 (2011). [Available at SSRN: http://ssrn.com/abstract=1628822]
Levenstein, Margaret, Valerie Suslow, and Lynda Oswald. International Price-Fixing Cartels and
Developing Countries: A Discussion of Effects and Policy Remedies, Working Paper 9511. Cambridge, Massachusetts. National Bureau of Economic Research (February 2003).
Levitt, Steven D., and John A. List. What Do Laboratory Experiments Measuring Social Preferences
Reveal About the Real World?. The Journal of Economic Perspectives 21 (2007): 153-174. Levitt, Steven D. and Sudhir Alladi Venkatesh. Drug-Selling Gang’s Finances: NBER Working Paper
No. 6592. National Bureau of Economic Research (June 1998). __________. An Economic Analysis of a Drug-Selling Gang's Finances. Quarterly Journal of
Economics 115 (August 2000): 755-789 (later published in Levitt, Steven D. and Stephen J. Dubner. Freakonomics. New York: William Morrow. (2005).)
Levy, Hermann. Monopoly, Cartels and Trusts in British Industry: 2nd edition. London: Cass & Co.
(1927, reprinted 1968). Lieber, James B. Rats in the Grain: The Dirty Tricks and Trials of Archer Daniel Midland. New York:
Four Walls Eight Windows (2000). Liefmann, Robert. Die Unternehmerverbande, Konventionen, Kartelle. (1897). __________. Cartels, Concerns and Trusts. New York: Dutton (1932). List, John A. Field Experiments: A Bridge between Lab and Naturally Occurring Data. BE Journal
of Economic Analysis and Policy (Advances) 6 (2006). __________. Why economists should conduct field experiments and 14 tips for pulling one off. The
Journal of Economic Perspectives 25 (2011): 3-15. Lister, Louis. Coal: Concerted Practices, in Europe’s Coal and Steel Community: An Experiment in
Economic Union. New York: Twentieth Century Fund (1960): 251-281. Liu, Jing. Buyers‘ Cartels: An Empirical Study of Prevalence and Economic Characteristics: Honor’s
Thesis. West Lafayette: Department of Agricultural Economics, Purdue University (February 25, 2011).
Liu, Paul C. Expert Report of Paul C. Liu: In Re DRAM Antitrust Litigation (MDL 1486, Master File M-
02-1486PJH). U.S. District Court for the Northern District of California (2006). Loescher, Samuel M. Imperfect Collusion in the Cement Industry. Cambridge: Harvard University Press
(1959).

J. M. Connor Price-Fixing Overcharges 3rd Edition February 2014
120
___________. Economic Collusion, Civil Conspiracy, and Treble-Damage Deterrents: The Sherman Act Breakthrough with Southern Plywood. Quarterly Review of Economics and Business 20 (Winter 1980): 6-35.
Lord, Richard A. and W. Ken Farr. Collusion and Financial Leverage: An Analysis of the Integrated
Steel Mill Industry. Financial Management (Spring 2003): 127-148. Lorenz, Christian. Screening Markets for Cartel Detection – Collusive Marker in the CDF Cartel Audit:
Muenster University Working Paper. Muenster, Germany: Institute of Public Economics (March 2006).
Low, D. Martin. Cartel Enforcement, Immunity, and Jurisdiction: Some Recent Canadian Developments,
speech at the International Bar Association, Rome, Italy (May 17-18, 2004). Low, D. Martin and Casey W. Halladay. Redesigning a Criminal Cartel Regime: The Canadian
Conversion, Chapter 4 in Beaton-Wells, Caron, and Ariel Ezrachi (Editors). Criminalising Cartels: Critical Studies of an International Regulatory Movement. London: Hart (2011).
Lozowick, Arnold H., Peter O. Steiner, and Roger Miller. Law and Quantitative Multivariate Analysis:
An Encounter. Michigan Law Review 66 (1968): 1641-1678. Luebbers, Thorsten. Is Cartelization Profitable? A Case Study of the Rhenish Westfalian Coal Syndicate,
1893-1913: Preprint 2009/9. Bonn: Max Planck Institute (March 2009). Ma, Tay-Cheng. An Empirical Test of the Collusive Equilibrium in a Quantity-Setting Supergame.
Unpublished paper, National Kaohsiung University of Applied Sciences, Taiwan (2005). _________. Strategic Investment and Excess Capacity: A Study of the Taiwanese Flour Industry.
Journal of Applied Economics 1 (May 2005a): 153-170. MacAvoy, Paul W. The Economic Effects of Regulation. Cambridge, MA: MIT Press (1965). MacKie-Mason, Jeffrey K. and Robert S. Pindyck. Cartel Theory and Cartel Experience in International
Minerals Markets, in Gordon, Richard L., Henry D. Jacoby, and Martin B. Zimmerman (eds.), Energy: Markets and Regulation. Cambridge: MIT Press (1987).
McClave, J.,P. Rothrock, and J.P. Ailstock. Computerized Statistical Investigation of the Florida Bread
Market. Southeastern Anti-Trust Review 1 (1978): 13-54. McCrosty, W. H. The Trust Movement in British Industry: A Study of Business Organization. London:
Longmans (1907). McGee, John S. Ocean Freight Rate Conferences and the American Merchant Marine. University of
Chicago Law Review 27 (1960): 191-314. Mason, Edward S. The Future of International Cartels. Foreign Affairs 22 (July 1944): 604-615. MacGregor, David H. International Cartels. Geneva: League of Nations (1927). McMillan John. Dangō: Japan’s Price-Fixing Conspiracies. Economic and Politics 3 (1991): 201-218.
J. M. Connor Price-Fixing Overcharges 3rd Edition February 2014
121
__________. Reinventing the Bazaar: A Natural History of Markets. New York: W. W. Norton (2002). Madhavan, Ananth, Robert T. Masson, and William H. Lesser. Cooperation for Monopolization? An
Empirical Analysis of Cartelization. Review of Economics and Statistics 76 (1994): 161-175. Mailmath, George J. and Peter Zemsky. Collusion in Second Price Auctions with Homogeneous Bidders.
Games and Economic Behavior 3 (1991): 467-486. Marion, Bruce. Willard Fritz Mueller, pp. 232-34 in (De Jong and Shepherd 2007). Mariuzzo, Franco and Patrick Paul Walshy. Deterministic Demand Cycles in Cartel Price Data: The Joint
Executive Committee (1880-1886), paper presented at the International Industrial Organization Conference, Boston, Mass. (April 2009).
Marlio, Louis. Les Ententes Industrielles. Revue de Paris 1 (1930): 823-852. __________. The Aluminum Cartel. Washington, DC: Brookings Institution (1947). Markham, Jesse W. Competition in the Rayon Industry. Cambridge: Harvard University Press (1952). Marshall, Alfred. Principles of Economics. London: Macmillan (1890). __________. Industry and Trade. London: Macmillan (1919). Marshall, Robert C. and Leslie M. Marx. The Economics of Collusion: Cartels and Bidding Rings.
Cambridge: The MIT Press (2012). __________. Cartel Price Announcements: The Vitamins Industry. International Journal of Industrial
Organization 26 (2008): 762-802. Martin, Stephen. Remembrance of Things Past: Antitrust, Ideology, and the Development of Industrial
Economics, Chapter 2 in Ghosal, Vivek, and Johan Stennek (eds.). The Political Economy of Antitrust. Amsterdam: Elsevier. (2007).
Martin, Steven. Advanced Industrial Economics (Second Edition). Malden, Mass.: Blackwell (2002). Martinez, Ans Paula. Crushed Rock Cartel Case. International Competition Network Workshop (October
2007). Marvel, Howard P., Jeffry M. Netter, and Anthony M. Robinson. "Price Fixing and Civil Damages: An
Economic Analysis." Stan. L. Rev. 40 (1987): 561. Mason, Christopher. The Art of the Steal: Inside the Sotheby’s-Christie’s Auction House Scandal. New
York : G.P. Putnam’s Sons (2004). Maurer, Harry and Kurt Mirow. Webs of Power: International Cartels and the World Economy. Boston:
Houghton Mifflin (1982). Mehmood, Javed. Monopoly Control Authority Asks Cement Makers to Deposit Rs. 4 Billion Excess
Charge in Bait-ul-Maal. Business Recorder (Feb. 22, 1999).
J. M. Connor Price-Fixing Overcharges 3rd Edition February 2014
122
Mehra, Salil K. More is Less: A Law-and-Economics Approach to the International Scope of Private Antitrust Enforcement. Temple Law Review 77 (2004):47-70.
Merchant, E.O. The Government and the Newsprint Manufacturers. Quarterly Journal of Economics 34
(1920): 313-328. Messerlin, Patrick A. Antidumping Regulations or Procartel Law? The EC Chemical Case: Working
Paper WPS397. International Economics Department: The World Bank (April 1990). (later published in The World Economy 13 (December 1990)). [available at http://www-wds.worldbank.org/servlet/WDSContentServer/WDSP/IB/1990/04/01/000009265_3960929174031/Rendered/PDF/multi0page.pdf]
Michels, Rudolf K. Cartels, Combines and Trusts in Post-War Germany. New York: Columbia
University Press (1928). Mihm, Michael M. Decision IN RE: HIGH FRUCTOSE CORN SYRUP ANTITRUST LITIGATION, GRAY & CO. V.
ADM ET AL., 97-1203 (MDL NO. 1087 and Master File No. 95-1477), UNITED STATES DISTRICT COURT FOR THE CENTRAL DISTRICT OF ILLINOIS, PEORIA DIVISION (May 13, 2003).
Miller, Nathan H. Strategic Leniency and Cartel Enforcement. American Economic Review 99 (June
2009): 750-768. Miyajima, Hideaki. Strategic Intervention against International cartels: The Case of the Japanese
Chemical Industries in the Interwar Period, pp. 223-232 in Dominique Bardot (ed), International Cartels Revisited, 1880-1980. Caen, France: Editions-diffusion du Lys (1994).
Møllgaard, Peter. Assessment of Damages in the District Heating Pipe Cartel: Working Paper 10-2006.
Department of Economics, Copenhagen Business School. (June 2006). Montant, Gil. The Effectiveness of the Nord-Pas-de-Calais Coal Cartel during the Interwar Period: A
Research Note. Explorations in Economic History 41 (2004): 300-307 Montero, Juan Pablo and Juan Ignacio Guzman. Welfare-Enhancing Collusion in the presence of a
Competitive Fringe: Working Paper No. 298. Pontifical University of Chile (September 2005). Morrison, Catherine J. Market Power, Economic Profitability, and Productivity Growth Measurement:
An Integrated Structural Approach: National Bureau of Economic Research, NBER Working Paper No. 3355 (1990).
__________. Productive and Financial Performance in U.S. Manufacturing Industries: An Integrated
Structural Approach. Southern Economic Journal 69 (1993): 376-392. Morrison, Steven A. and Clifford Winston. Causes and Consequences of Airline Fare Wars. Brookings
Papers on Economic Activity (Microeconomics 1996): 85-123. Morse, Adair B. and Jeffery Hyde. Estimation of Cartel Overcharges: The Case of Archer Daniels
Midland and the Market for Lysine, Staff Paper 00-8. West Lafayette, Indiana: Department of Agricultural Economics, Purdue University (2000). (revised version presented at the 1st International Industrial Organization Conference, Boston, Mass., April 2003).
J. M. Connor Price-Fixing Overcharges 3rd Edition February 2014
123
MRA. Market Resaerch.com Academic. (2013). [online library research service, frequent source of market sales estimates, mostly producer goods]
Mueller, Willard F. George Ward Stocking, pp. 187-89 in Pioneers of Industrial Organization, Henry W.
de Jong and William G. Shepherd (editors). Cheltenham, UK: Edward Elgar (2009). Mueller, Willard F. and Russell C. Parker. Bakers of Washington Cartel: Twenty-Five Years Later.
Review of Industrial Organization 7 (1992): 75-82. Mund, Vernon. Identical Bid Prices. Journal of Political Economy 68 (1960): 150-169. Nelson, Jon P. Comparative Antitrust Damages in Bid-Rigging Cases: Some Findings from a Used
Vehicle Auction. Antitrust Bulletin 38 (1993): 369-394. New York State Attorney General. Agreement Between the Attorney General of the State of New York
and American International Group. (January 18, 2006). [http://www.ins.state.ny.us/acrobat/oag0209061.pdf]
Newell, Edmund. “The Irremediable Evil”: British Copper Smelters’ Collusion and the Cornish Mining
Industry, 1725-1865, in Bruland and O’Brien (1998). Newfarmer, Richard S. The International Market Power of TNCs (UNCTAD/ST/MD/13). New York:
United Nations (1978). Newman, Philip C. Key German Cartels under the Nazi Regime. Quarterly Journal of Economics 62
(1948): 576-595. Newmark, Craig M. Does Horizontal Price Fixing Raise Price? A Look at the Bakers of Washington.
Journal of Law and Economics 31 (1988): 469-484. Noll, Roger G. The DRAM Antitrust Litigation (2008), in John E. Kwoka and Lawrence J. White (eds.),
The Antitrust Revolution: Sixth Edition. New York: Oxford University press (2014). Normann, Hans-Theo and Elaine Tan. The Effects of Cartel Policy: Evidence from the German Power-
Cable Industry: Working Paper. Royal Holloway College, University of London (October 2005). __________. The Effects of Cartel Policy: Evidence from the German Power-Cable Industry. Revised
Working Paper. Dusseldorf, Germany: DICE (2011). __________. Effects of Different Cartel Policies: Evidence from the German Power-Cable Industry.
Discussion Paper No. 108. Dusseldorf, Germany: DICE (September 2013). (forthcoming Industrial and Corporate Change 2014).
Notaro, Giovanni. Methods for Quantifying Antitrust Damages: The Pasta Cartel in Italy. Journal of
Competition Law and Economics (draft September 19, 2013). Notz, William F. International Private Agreements in the Form of Cartels, Syndicates, and Other
Combinations . Journal of Political Economy 28 (1920): 658-679. __________. Representative International Cartels, Combines, and Trusts: Trade Promotion Series No.
81. Washington, DC: U.S. Department of Commerce (1929).

J. M. Connor Price-Fixing Overcharges 3rd Edition February 2014
124
OECD. Export Cartels. Paris: Organization of Economic Co-Operation and Economic Development
(1974). __________. Collusive Tendering. Paris: Organization of Economic Cooperation and Development
(1976). __________. Summary of Cartel Cases Described by Invitees (CCNM/GF/COMP(2001)4). Paris:
OECD (October 2001). ___________. Report on the Nature and Impact of Hard Core Cartels and Sanctions against Cartels
under National Competition Laws (DAFFE/COMP (2002) 7). Paris: Organization of Economic Co-Operation and Development (April 9, 2002). [a/k/a “The Second Report on Cartels”] [http://www.oecd.org/dataoecd/16/20/2081831.pdf]
__________. Competition Law and Policy: 2002-2003 Annual Reports. Paris: Organization of Economic
Co-Operation and Development (2003). [http://browse.oecdbookshop.org/oecd/pdfs/browseit/2403011E.PDF] (National antitrust authorities’ annual reports appended; site goes back to 1994-1995).
__________. Case of Cartel Agreement in the Construction Sector. OECD Workshop on Competition
Policy, Vilnius, Lithuania. (11-13 June 2003a) [www.konkuren.lt/English/cases_article_5_vilnius_case.html]
__________. Evaluations of the Actions and Resources of Competition Authorities
(DAF/COMP(2005)30. Paris: Organization of Economic Co-Operation and Development (December 16, 2005a).
__________. Hard Core Cartels: Third Report on the Implementation of the 1998 Recommendation.
Paris: Organization of Economic Co-Operation and Development (December 15, 2005b). __________. Competition Law and Policy in Brazil. Paris: Organization of Economic Co-Operation and
Development (2005c). __________. Roundtable on Prosecuting Cartels without Direct Evidence of Agreement
(DAF/COMP/GF(2006)7). Paris: Organization of Economic Co-Operation and Development (September 11, 2006).
__________. Roundtable on Prosecuting Cartels without Direct Evidence of Agreement: Contribution
from Italy (DAF/COMP/GF/WD(2006)5). Paris: Organization of Economic Co-Operation and Development (2006a).
__________. Roundtable on Prosecuting Cartels without Direct Evidence of Agreement: Contribution
from Argentina (DAF/COMP/GF/WD(2006)7. Paris: Organization of Economic Co-Operation and Development (2006b).
__________. Roundtable on Prosecuting Cartels without Direct Evidence of Agreement: Contribution
from Lithuania (DAF/COMP/GF/WD(2006)9. Paris: Organization of Economic Co-Operation and Development (2006c).

J. M. Connor Price-Fixing Overcharges 3rd Edition February 2014
125
__________. Roundtable on Prosecuting Cartels without Direct Evidence of Agreement: Contribution from Turkey (DAF/COMP/GF/WD(2006)17. Paris: Organization of Economic Co-Operation and Development (2006d).
__________. Roundtable on Prosecuting Cartels without Direct Evidence of Agreement: Contribution
from Chinese Taipei (DAF/COMP/GF/WD(2006)20. Paris: Organization of Economic Co-Operation and Development (2006e).
__________. Roundtable on Prosecuting Cartels without Direct Evidence of Agreement: Contribution
from Peru (DAF/COMP/GF/WD(2006)27. Paris: Organization of Economic Co-Operation and Development (2006f).
__________. Roundtable on Prosecuting Cartels without Direct Evidence of Agreement: Contribution
from Romania (DAF/COMP/GF/WD(2006)30. Paris: Organization of Economic Co-Operation and Development (2006g).
__________. Roundtable on Prosecuting Cartels without Direct Evidence of Agreement: Contribution
from Korea (DAF/COMP/GF/WD(2006)38. Paris: Organization of Economic Co-Operation and Development (2006h).
__________. Competition and Efficient Usage of Payment Cards: DAF/COMP (2006) 32. Paris:
Organization of Economic Co-Operation and Development (2007). __________. Competition Payment Systems: Policy Roundtables 2012 (DAF/COMP(2012)24. Paris:
Organization of Economic Co-Operation and Development (June 28, 2013). Officer, Micah S., Oguzhan Ozbas, and Berk A. Sensoy. Club Deals in Leveraged Buyouts. Journal of
Financial Economics 98, no. 2 (2010): 214-240. OFT. MasterCard Interchange Fees: OFT634. London: UK Office of Fair trading (2003). Ohio OIG. Report of Investigation. Columbus, Ohio: Office of the Inspector General, State of Ohio
(January 6, 2010). Osiatynski, Jerzy (ed.). Collected Works of Michael Kalecki: Volume VI. Oxford: Clarendon (1996). Oualid, W. International Raw Commodity Price Control. Paris: International Studies Conference,
League of Nations (1938). Oxera. Comments on the European Commission’s Draft Guidance Paper on Quantifying Damages: Note
Prepared for the Commission. Oxford, Brussels, and London: Oxera Consulting. (30 September 2011). [Available at http://ec.europa.eu/competition/consultations/2011_actions_damages/oxera_en.pdf]
Page, William. Antitrust Damages and Economic Efficiency: A Study in Law and Economics. University
of Chicago Law Review 47 (1980): 1539. Page, William H. (General Editor). Proving Antitrust Damages: Legal and Economic Issues. Chicago:
Section of Antitrust Law, American Bar Association (1996).

J. M. Connor Price-Fixing Overcharges 3rd Edition February 2014
126
Parker, Alfred A. Measuring Damages in Federal Treble Damages Actions. Antitrust Bulletin 17 (1972): 497-517.
Passer, Harold C. The Electrical Manufacturers 1897-1900: A Study in Competition, Entrepreneurship,
Technical Change, and Economic Growth. Cambridge: Harvard University Press (1953). Paxton, Robert O. The Calcium Carbide Case and the Decriminalization of Industrial Ententes in France,
1915-26, in Patrick Fridenson (editor), The French Home Front, 1914-1918. Berg Publishers (1992).
PCA. Press Releases of the Portugal Competition Authority. (various dates).
[http://www.autoridadedaconcorrencia.pt/Aconcorrencia_C03.aspx?cat=Cat_ProcessosDecisoes_OutrosProceDecisoes&idmenu=2]
Peck, M.J. Competition in the Aluminum Industry 1945-1958. Cambridge: Harvard University Press
(1961). Pesendorfer, Martin. A Study of Collusion in First-Price Auctions. Review of Economic Studies 67
(2000): 381-411. Peterman, John L. The International Salt Case. Journal of Law and Economics. 22 (1979): 351-
364. Peters, Lon LeRoy. Managing Competition in German Coal, 1893-1913. Journal of Economic History
49 (1989): 419-434. Peterson, Everett B. and John M. Connor. A comparison of oligopoly welfare loss estimates for US food
manufacturing. American Journal of Agricultural Economics 77 (1995): 300-308. Pfeiffer, Roberto A. C. Recent Aspects of Hard Core Prosecution in Brazil, presentation at the Third
Latin American Competition Forum. Madrid (2005). Phillips, Almarin. Price Fixing in UK Manufacturing Industries 1953-1956, in Market Structure and
Corporate Behaviour, Keith Cowling (ed.). London: Gray-Mills (1972). Pierce, Richard J. Essay: Antidumping Law as a Means of Facilitating Cartelization. Antitrust Law
Journal 76 (2000): 725. Pierce, Franklin. The Trusts Resulting from the Protective Tariff and Leading to Socialism, Chapter II,
pp. 47- 88, in The Tariff and the Trust. New York: Macmillan (1913). Piotrowski, Roman. Cartels and Trusts. London: George Allen & Unwin (1933). Pirrong, Stephen C. An Application of Core Theory to the Analysis of Ocean Shipping Markets. Journal
of Law and Economics 35 (1992): 89-131. Plott, Charles R. An Updated Review of Industrial Organization: Applications of Experimental Methods,
Chapter 19, pp. 1109-1176 in Handbook of Industrial Organization: Volume 2, Richard Schmalensee and Robert D. Willig (editors). Amsterdam: North-Holland (1989).
Plummer, Alfred. International Combines in Modern Industry. London: Pittman (1934, 1951).
J. M. Connor Price-Fixing Overcharges 3rd Edition February 2014
127
Pohl, Hans (Editor). Wettbewerbsbeschraenkungen auf Internationalen Maerkten [Competition
Restrictions in International Markets], Zeitschrift fuer Unternehmensgeschichte [Special Edition of the Journal of Corporation History] 46. Wiesbaden, Germany.
Porter, Robert H. A Study of Cartel Stability: The Joint Executive Committee, 1880-1886. Bell Journal of
Economics and Management 14 (1983): 301-314. __________. Book Review: Anatomy of an Auction: Rare Books at Ruxley Lodge, 1919. Journal of
Political Economy 100 (1992): 433-436. __________. Detecting Collusion among Bidders in Auction Markets, in Fighting Cartels – Why and
How? Stockholm: Konkurrensverket (2001). __________. Detecting Collusion. Review of Industrial Organization 26 (2005): 147-167. Porter, Robert H. and J. Douglas Zona. Detection of Bid Rigging in Procurement Markets. Journal of
Political Economy 101 (1993): 518-538. __________. Ohio School Milk Markets: An Analysis of Bidding. RAND Journal of Economics 30
(1999): 263-288. __________. Bidding, Bid Rigging, and School Milk Prices: Ohio v. Trauth (1994) in John E. Kwoka and
Lawrence J. White (eds.), The Antitrust Revolution: Fourth Edition. New York: Oxford University press (2004).
Posner, Richard A. Antitrust Law: An Economic Perspective. Chicago: University of Chicago Press
(1976) __________. Antitrust Law: (Second Edition). Chicago: University of Chicago Press (2001). __________. Personal Communication to John M. Connor, dated February 4, 2004. __________. The Social Costs of Monopoly and Regulation. Journal of Political Economy 83 (1975):
807-828. Powers, Nicholas J. Marketing Order Impacts on Farm-Retail Price Spreads: Comment. American
Journal of Agricultural Economics 73 (1991): 507-510. Prain, R. Copper: Anatomy of an Industry. London: Mining Journal Books Limited (1976). Prais, Sigmund.J. The Electric Lamp Monopoly and the Life of Electric Lamps. Journal of Industrial
Economics 23 (Dec. 1974): 153-58. Pribram, Karl. Cartel Problems. Washington, DC: Brookings (1935). Price, Robert M. and Douglas G. Bonett. Distribution-Free Confidence Intervals for Difference and Ratio
of Medians. Journal of Statistical Computational Simulation 72 (2002): 119-124. PriceWaterhouseCoopers. Alternative Calculation of Damages based on ALSTOM’s Economic Profit.
Hellerup, Denmark (2002).

J. M. Connor Price-Fixing Overcharges 3rd Edition February 2014
128
Procurement News. Spain: Spanish Competition Authority Fines Three Companies $11.6 Million for
Bath Gel Cartel. [Online edition at www.tendersinfo.com] (4 May 2010).
Pursiainen, Heikki, Ville Mälkönen, Tanja Saxell, Janne Tukiainen, and Markku Siikanen. Asfalttikartellin kunnille aiheuttamien vahinkojen arviointi – Loppuraportti:VATT Policy Report 8. Helsinki, Finland: Government Institute for Economic Research (VATT) (June 2011). [http://www.vatt.fi/file/vatt_publication_pdf/valm.rap.8.pdf]
Pursiainen, Heikki, Tanja Saxell, and Janne Tukiainen. Asfalttikartellin vahinkojen arviointi - vastauksia
kritiikkiin: VATT Working Paper 19. Helsinki, Finland: Government Institute for Economic Research (VATT) (March 2012). [http://www.vatt.fi/file/vatt_publication_pdf/muistiot_19.pdf]
Pyndyck, Robert S. The Cartelization of World Commodity Markets. American Economic Review 69
(1979): 154-158. Randles, Jonathan. Sentencing Under Canada's Competition Law Stiffens. Law 360. (November 20,
2012). [available at http://www.law360.com/articles/395492/sentencing-under-canada-s-competition-law-stiffens]
Read, Robert. Cartels and Internalization in the Eighteenth-Century Copper Industry, in
Entrepreneurship, Networks and Modern Business, Jonathan Brown and Mary B. Rose (editors). Manchester: Manchester University Press (1993).
Reader, W.J. Imperial Chemical Industries: A History (1975), in Jones (1993): 283-316. Rees, Ray. Collusive Equilibrium in the Great Salt Duopoly. Economic Journal 103 (1993): 833-848. Reimann, Guenter. Patents for Hitler. New York: Vanguard Press (1942). Renda, Andrea, et al. Making Antitrust Damages Actions More Effective in the EU: Welfare Impact and
Potential Scenarios: Final Report (Contract DG COMP/2006/A3/012). Brussels, Rotterdam, and Rome: Centre for European Policy Studies, Erasmus University Rotterdam, and Luiss Guido Carli. (21 December 2007). [Available at http://ec.europa.eu/competition/antitrust/actionsdamages/files_white_paper/impact_study.pdf#page=1]
Reuter, Peter. The Cartage Industry in New York. Crime and Justice 18 (1993): 149-201. Richardson, G.B. Pricing of Heavy Electrical Equipment. Bulletin of the Oxford University Institute of
Economics and Statistics 73 (1966): 73-92. Rieber, M. International Commodity Agreements. Resources Policy (1985): 87-98. Ripley, William Z. (editor). Trusts, Pools and Corporations: Revised Edition . Boston: Ginn (1916). Röller, Lars-Hendrik and Frode Steen. On the Workings of a Cartel: Evidence from the Norwegian
Cement Industry: Discussion Paper No. 25/03. Bergen, Norway: Norwegian School of Economics and Business Administration (2003).
__________. On the Workings of a Cartel: Evidence from the Norwegian Cement Industry. American
Economic Review 96 (2006): 321-338.
J. M. Connor Price-Fixing Overcharges 3rd Edition February 2014
129
de Roos, Nicolas. A Model of Collusion Timing. International Journal of Industrial Organization 22
(2004a): 351-387. __________. Collusion with a Competitive Fringe: An Application to Vitamin C, unpublished
manuscript, Dept. of Economics, Yale University, 30pp. (October 2001). __________. Examining Models of Collusion: the Market for Lysine, unpublished manuscript 49pp.
(December 2004b). __________. Examining Models of Collusion: The Market for Lysine. International Journal of Industrial
Organization 24 (November 2006): 1083-1107. Rosenthal, D. An Overview of the Guide and Its Objectives, in Griffin, James M. (ed.). Perspectives on
the Territorial Application od U.S. Antitrust and Other Laws. Chicago: ABA (1979). Ross, Thomas. Affidavit of Thomas Ross in Glen Ford et al. v. F. Hoffmann-La Roche et al. (Ontario
Superior Court of Justice, Court File No. 00-CV-202080CP). (2005). Rothwell, Richard P. The Mineral Industries. New York: McGraw-Hill (1921 and previous annual
volumes from 1893). Rowe, J.W.F. Markets and Men. New York: Macmillan (1936). Rubinfeld, Daniel L. and Peter O. Steiner. Regression Estimates of damages in Price-Fixing Cases.
Journal of Law and Contemporary Problems 46 (1983): 68-144. Russo, Francesco, M.P. Schinkel, A. Günster, and M. Carree. European Commission Decisions on
Competition: Landmark Antitrust and Merger Cases from an Economic Point of View. Amsterdam: ACLE (forthcoming 2007). [draft of Sept. 2007]
Russo, Francesco, Maarten Pieter Schinkel, Andrea Günster. European commission decisions on competition: economic perspectives on landmark antitrust and merger cases. Cambridge: Cambridge University Press (2010).
Salop, Steven C. and Lawrence J. White, Private Antitrust Litigation: Introduction and Framework, in
Private Antitrust Litigation (Lawrence White ed.) (1988). Salvo, Alberto. Inferring Conduct under the Threat of Entry: The Case of the Brazilian Cement Industry:
SSRN Working Paper (Feb. 2007). [http://ssrn.com/abstract=868543] (Later published in the RAND Journal of Economics 2010).
Samkeppniseftirlitid. The Oil Cartel in Iceland, Report of the Icelandic Competition Authority.
Reykjavik: Iceland (January 29, 2005; translation September 23, 2005). [www.samkepni.is downloaded 10/28/05] Sarkar, G.K. The World Tea Economy. Bombay: Oxford University Press (1972). Sarkar, Subrata. Did the U.S. Gypsum Industry Really Collude? Some evidence Using tests on Non-
Nested Hypotheses. Journal of Quantitative Economics 12 (July 1996): 1-19.
J. M. Connor Price-Fixing Overcharges 3rd Edition February 2014
130
Sauvy, A. and A. Hirsch. Histoire Economique de la France entre les Deux Guerres. Paris: Economica (1984).
Saxell, Tanja, Tukiainen, J., and Siikanen, M. Asfalttikartellin valtiolle aiheuttamien vahinkojen arviointi:
Valmisteluraportit 9. Helsinki, Finland: Government Institute for Economic Research (VATT) (2011): 1-21. [http://www.vatt.fi/file/vatt_publication_pdf/valm.rap.9.pdf]
Sayous, Andre E. Cartels and Trusts in Holland in the Seventeenth Century. Political Science Quarterly
17 (1902): 381-393. Schalk, Willem van de. Over Ondernemers-Verenigingen (Kartels en Trusts).Leiden: Leiden University
(1891). Scherer, F.M. Industry Structure, Strategy, and Public Policy. New York: HarperCollins (1996). __________. Class Actions in the U.S. Experience: An Economist’s Perception: Research Working Paper
RWP07-028. Cambridge: Kennedy School of Government, Harvard University (June 2007). Scherer, F. M. and David Ross. Industrial Market Structure and Economic Performance (3rd edition).
Boston: Houghton Mifflin (1990). Schaub, Alexander. Cartel Enforcement by the European Commission, in Fighting Cartels – why and
how? Stockholm: Konkurrensverket (2001). Schinkel, Maarten Pieter. Effective Cartel Enforcement in Europe (January 2007).; Amsterdam Center
for Law & Economics Working Paper No. 2006-14 (2006). (Later in World Competition: Law and Economics Review 30 (2007): 539-572. [Available at http://ssrn.com/abstract=948641]
__________. Interview by ZEMBLA TV. The Dutch Construction Cartel: Documentaries on CD.
VARA/NPS (2009). __________. Market Oversight Games. Amsterdam Center for Law & Economics Working Paper No.
2010-11 (October 15, 2010). [Available at http://ssrn.com/abstract=1692733] Schmitt, Nicolas and Rolf Weder. Sunk Costs and Cartel Formation: Theory and Application to the
Dyestuff Industry. Journal of Economic Behavior & Organization 36 (1998): 197-220. Schröter, Harm G. Cartels as a Form of Concentration in Industry: The Example of the International
Dyestuffs Cartel from 1927 to 1939 (1988), reprinted in Jones (1993): 109-140. __________. The International Potash Syndicate, in Dominique Bardot (ed), International Cartels
Revisited, 1880-1980. Caen, France: Editions-diffusion du Lys (1994). __________. Cartelization and Decartelisation in Europe, 1870-1995: Rise and Decline of an Economic
Institution. Journal of Economic History 25 (1999): 129-153. Scott, Frank A. Great School Milk Conspiracies Revisited. Review of Industrial Organization 17 (2000):
325-341. Scott Morton, Fiona M. Entry and Predation: British Shipping cartels 1879-1929. Journal of Economics
and Management Strategy 6 (1997): 679-724.

J. M. Connor Price-Fixing Overcharges 3rd Edition February 2014
131
Seager, Henry R and Charles Adam Gulick. Trust and Corporation Problems (Second Printing). New
York: Harper (1929). Shanahan, Martin P. and David K. Round. Serious Cartel Conduct, Criminalization, and Evidentiary
Standards: The Coal Vend Case of 1911 in Australia, paper at the European Business History Association Conference, Bergen (2008). (subsequently in Business History 51 (2009): 875-906). [http://scholar.google.com/scholar?hl=en&q=serious+cartel+coal+australia&btnG=&as_sdt=1%2C22&as_sdtp=]
Sheer, A. and C. Ho. Preliminary Review of Sentences Imposed on Organizations in 1988, memorandum
to the U.S. Sentencing Commission (August 16, 1989). Shepard, Lawrence. Cartelization of the California-Arizona Orange Industry, 1934 – 1981. Journal of
Law and Economics 29 (1986): 83-123. Shepard, William G. The Economics of Industrial Organization (7th Edition). Homewood, Illinois:
Richard O. Irwin (1985). Shin, Kwangshik. The Treatment of Market Power in Korea. Review of Industrial Organization 21
(2002): 113-128. Sjostrom, William. Collusion in Ocean Shipping: A Test of Monopoly and Empty Core Models. Journal
of Political Economy 75 (1989): 1160-1179. __________. An Empirical Test of Monopoly Behavior: An Application to the Hardwood Case: A
Comment. Applied Economics 23 (1991): 339-341. Smith, Adam. The Wealth of Nations. New York: Modern Library (1776, reprinted 1937). Smith, David C. History of Papermaking in the United States (1691-1969). New York: Lockwood
(1970). Smith, Richard Austin. Corporations in Crisis. Garden City, N.Y.: Doubleday (1963). Sørgard, Lars. Cartels Investigations in Norway, seminar hosted by the Norwegian Competition
Authority, Bergen, Norway. (February 22, 2007). Spar, Deborah. Cooperative Edge: The Internal Politics of International Cartels. Ithaca: Cornell
University Press (1994). __________. Markets: Continuity and Change in the International Diamond Market. Journal of Economic
Perspectives 20 (Summer 2006): 195. Spratling, Gary R. Detection and Deterrence. George Washington Law Review 69 (2001): 817-823. Sproul, Michael F. Antitrust and Prices. Journal of Political Economy 101 (1993): 741-754. Staley, Eugene. Raw Materials in Peace and War. New York: Council on foreign Relations (1937). STAT-USA. On-line U.S. Trade Data. Washington DC: U.S. Department of Commerce (various dates).

J. M. Connor Price-Fixing Overcharges 3rd Edition February 2014
132
Steen, Frode and Lars Sørgard. Semicollusion in the Norwegian Cement Market. European Economic
Review 43 (1999): 1775-1796. Stephan, Andreas. An Empirical Assessment of the 1996 Leniency Notice: CCP Working Paper No. 05-
10. (September 2005). [Available at http://ssrn.com/abstract=911592]. Stevens, William S. A Group of Trusts and Combinations. Quarterly Journal of Economics 26
(December 1912c): 593-644. __________. The Powder Trust, 1872-1912. Quarterly Journal of Economics 26 (May 1912a): 444-
481. __________. The Dissolution of the Powder Trust. Quarterly Journal of Economics 26 (August 1912b):
202-207. Stewart, James B. Bidding War. The New Yorker (Oct. 15, 2001):158. Stigler, George J. and James K. Kindahl. The Behavior of Industrial Prices. New York: Columbia
University Press (1970). Stiglitz, Joseph. Globalization and Its Discontent. New York: New Press (1998). Stockder, Archibald H. Regulating an Industry: The Rhenish-Westphalian Coal Syndicate 1893-1929.
New York: Columbia University Press (1932). Stocking, George W. and Myron W. Watkins. Cartels in Action. New York: Twentieth Century Fund
(1946). __________. Cartels or Competition? New York: Twentieth Century Fund (1948). __________. Monopoly and Free Enterprise. New York: Twentieth Century Fund (1951). Stucke, Maurice E. Morality and Antitrust. Columbia Business Law Review 2006 (2006): 443-538. Sunnevåg, Kjell Jostein. Personal Communications, dated February 2 and March 1, 2007. Sullivan, Lawrence A and Warren S. Grimes. The Law of Antitrust: 2nd Edition. Thompson West (2006). Sultan, Ralph G.M. Pricing in the Electrical Oligopoly, Vols. I and II. Boston: Harvard Business School
(1974, 1975). Suslow, Valerie Y. Estimating Monopoly Behavior with Competitive Recycling: An Application to
Alcoa. RAND Journal of Economics 17 (1986). __________. Cartel Contract Duration: Empirical Evidence from International Cartels, unpublished
manuscript that updates a 1988 Hoover Institution Working Paper, University of Michigan Business School (October 2001).
__________. Cartel Contract Duration: Empirical Evidence from Inter-War International Cartels.
Industrial and Corporate Change 14 (2005): 705-744.

J. M. Connor Price-Fixing Overcharges 3rd Edition February 2014
133
Swann, D., O’Brien, D. P., W. P. J. Maunder, and W. S. Howe. Competition in British industry:
Restrictive practices legislation in theory and practice: Volume 126 of Unwin university books. London: Allen & Unwin. (1974).
Sweezy, Paul M. Monopoly and Competition in the English Coal Trade 1550-1850. Cambridge:
Harvard University Press (1938). Sultan, Ralph G.M. Pricing in the Electrical Oligopoly, Vols. I and II. Boston: Harvard Business School
(1974, 1975). Symeonidis, George. The Effects of Competition: Cartel Policy and the Evolution of Strategy and
Structure in British Industry. Cambridge: MIT Press (2002). Tan, Elaine S. Economic Regulation and Rent Protection: A Study of the Coal Cartel in the First
Industrial Revolution: WP03-23. Ann Arbor: Michigan Business School (October 25, 2003). __________. Market Structure and the Coal Cartel in Early Nineteenth-Century England. Economic
History Review 62 (2009): 350–365. Taylor, C. Robert. Impacts of Captive Supplies on the Cash Market Price for Slaughter Cattle: Updated,
report prepared for Pickett, et al, v. Iowa Beef Packers, Inc. (Civil Action No. 96-A-1103-N, U.S. District Court, Middle District of Alabama Northern Division) (October 15, 2003).
Taylor, C. Robert and Diana L. Moss. The Fertilizer Oligopoly: The Case for Global Antitrust
Enforcement: AAI Working Paper No. 13-05. Washington, DC: American Antitrust Institute (September 4, 2013). [Available at http://www.competitivemarkets.com/wp-content/uploads/2013/09/WP13-5_Fertilizer_Body.pdf]
Taylor, Jason E. The Output Effects of Government-Sponsored Cartels during the New Deal. Journal of
Industrial Economics 50 (2002): 1-10. __________. The Welfare Impact of Collusion under Various industry Characteristics: A Panel
Examination of Efficient Cartel Theory. B. E. of Economic Analysis and Policy 10 (2010): 1-27. Taylor, June H. and Michael D. Yokell. Yellowcake: The International Uranium Cartel. New York:
Pergamon (1979). Taylor, W. G. Langworthy. The World’s Prosperity in the Year 1903. Journal of Political Economy 13
(1905): 217-236. Teece, David J., David Sunding, and Elaine Mosakowski. Natural Resource Cartels, pp. 1131-1166, in
Allen V. Kneese and James L. Sweeney (editors), Handbook of Natural Resource and Energy Economics: Volume 3 (1993): 1131-1166. . Amsterdam: North-Holland (1993).
Telser, Lester G. Cooperation, Competition, and Efficiency. Journal of Law and Economics 28 (1985):
271–95. TFTC. Decisions of the Taiwan Fair Trade Commission. Taipei, Taiwan (date of decision).

J. M. Connor Price-Fixing Overcharges 3rd Edition February 2014
134
TFTC-OECD. OECD Global Forum on Competition: Contribution on Competition (CCNM/GF/WD(2001)16). Paris: OECD (2001).
Thompson, G. D. and C.C. Lyon. Marketing Order Impacts of Farm-Retail Price Spreads: The
Suspension of Prorates on California-Arizona Navel Oranges. American Journal of Agricultural Economics 71 (1989): 647-660.
Thompson, John S. and David L. Kaserman. After the Fall: Stock price movements and the Deterrent
Effect of Antitrust Enforcement. Review of Industrial Organization. 19 (2001): 329-334. Tilton, Mark. The Difference Government Policy Makes: The Case of Japan, Chapter 7 in Grossman
(ed.), How Cartels Endure and How They Fail: Studies of Industrial Collusion. Cheltenham, UK: Edward Elgar (2004).
Timberlake, E. Compton. The Legal Injury Requirements and Proof of Damages in Treble Damage
Actions under the Antitrust Law. The George Washington Law Review 30 (1961): 231-284. Tosdal, H.R. The German Potash Syndicate, pp. 795-832 in Ripley, William Z. (editor). Trusts, Pools
and Corporations: Revised Edition . Boston: Ginn (1916). Troesken, Werner. A Note on the Efficacy of the German Steel and Coal Syndicates. Journal of
European Economic History 18 (1989): 595-603. Tsokhas, Kosmas. The Rise and Decline of an International Zinc and Lead Cartel. Australian Economic
History Review 40 (2000): 263-286. Tweede Kamer. Tweede Kamer Report of 12 December 2002 (2001-2, 28093, No. 11). The Hague:
Netherlands (2002). UKCC. BASF and Takeda Chemical Industries Ltd: A Report on the Acquisition by BASF AG of Certain
Assets of Takeda Chemical Industries Ltd. London: UK Competition commission (July 2001). Ulen, Thomas S. The Market for Regulation: The ICC from 1887 to 1920. American Economic Review
70 (1980): 306-310. UK Monopolies Commission.203 Chlordiazepoxide and Diazapam: A Report on the Supply of
Chlordiazepoxide and Diazapam. London: HMSO (1973a). __________. Concrete Roofing Tiles. London: HMSO (1981). __________. Flat Glass: A Report on the Supply of Flat Glass. London: HMSO (1968a). __________. Man-made Cellulosic Fibres: A Report on the Supply of Man-made Cellulosic Fibres.
London: HMSO (1968b). __________. Metal Containers. London: HMSO (1970). __________. Opium Derivatives. London: HMSO (1989).
203 Includes the Monopolies and Restrictive Practices Commission and the Monopolies and Mergers Commission.
J. M. Connor Price-Fixing Overcharges 3rd Edition February 2014
135
__________. Plasterboard. London: HMSO (1990). __________. Report on the Supply and Export of certain Semi-Manufactures of Copper and
Copper-Based Alloys. London: HMSO (1955). __________. Report on the Supply and Export of Electrical and Allied Machinery and Plant. London: HMSO (1957a). __________. Report on the Supply and Export of Matches and the Supply of Match-Making Machinery.
London: HMSO (1953). __________. Report on the Supply of Chemical Fertilizers. London: HMSO (1959). __________. Report on the Supply of Electric Lamps. London: HMSO (1951). __________. Report on the Supply of Hard Fibre Cordage. London: HMSO (1956a). __________. Report on the Supply of Insulated Electric Wires and Cables. London: HMSO (1952a). __________. Report on the Supply of Linoleum. London: HMSO (1956b). __________. Report on the Supply of Certain Industrial and Medical Gases. London: HSMO (1956a). __________. Report on the Supply of Electrical Equipment for Mechanically Propelled Land Vehicles.
London: HMSO (1963). __________. Report on the Supply of Electronic Valves and Cathode Ray Tubes. London: HMSO
(1957b). __________. Report on the Supply of Insulin. London: HMSO (1952b). __________. Report on the Supply of Wallpaper. London: HMSO (1964). __________. Starch, Glucoses, and Modified Starches. London: HMSO (1971). __________. White Salt. London: HMSO (1986). U.S. Antitrust Modernization Commission. Report and Recommendations. Washington, DC (April 2007).
[http://govinfo.library.unt.edu/amc/report_recommendation/amc_final_report.pdf] U.S. Congress. Hearings of the Temporary National Economic Committee, Vols. 1-11. Washington, DC:
U.S. Government Printing Office (1938-1940). __________. Staff Study of Income Tax Treatment of Treble Damages Payments under the Antitrust
Laws. Washington, DC: Joint Committee on Taxation, U.S. Government Printing Office (1965). __________. Hearings on Prices of Quinine and Quinidine. Subcommittee on Antitrust, U.S. Senate
Committee on the Judiciary. Washington, DC: U.S. Government Printing Office (1966-1967).

J. M. Connor Price-Fixing Overcharges 3rd Edition February 2014
136
__________. Hearings on the International Uranium Cartel, Subcommittee on Oversight and Investigations, Committee on Interstate and Foreign Commerce, U.S. House of Representatives. Washington, DC: U.S. Government Printing Office (1977).
U.S. Industrial Commission. Report on Trusts and Industrial Combinations: Document 182: Volume XIII.
Washington, DC: U.S. House of Representatives (December 1901). U.S. Sentencing Commission. United States Sentencing Guidelines: Unpublished Public Hearings for the
First Guidelines Made Law in 1987. Washington, DC: United States Sentencing Commission. (July 15, 1986)
U.S. Tariff Commission. Incandescent Electric Lamps: Report No. 133, 2nd Series. Washington, DC:
U.S. Government Printing Office (1939). Uctum, Merih. Why Have Corporate Profits Declined? An International Comparison. Review of
International Economics 6 (1998): 234-251. UNCTAD. A Synthesis of Recent Cartel Investigations that Are Publicly Available (TD/RBP/CONF.6/4).
Geneva: United Nations Conference on Trade and Development (September 5, 2005). __________. Recent Important Cases Involving More than One Country (TD/RBP/CONF.6/5). Geneva:
United Nations Conference on Trade and Development (September 6, 2005). USSG. United States Sentencing Guidelines. Washington, DC: U.S. Government Printing Office. (first
adopted by Congress and published in 1987, revised annually). USSG Advisory Group. Report of the ad hoc Advisory Group on the Organizational Guidelines.
Washington, DC: U.S. Sentencing Commission (October 7 2003). Veljanovski, Cento. European Commission Cartel Prosecutions and Fines, 1998-2006: An Updated
Statistical Analysis of Fines Under the 1998 Penalty Guidelines: SSRN Working Paper No. 1016014. (November 21, 2010). [available at www.SSRN.com/abstract=1016014]
Veljanovski, Cento. Deterrence, Recidivism, and European Cartel Fines. Journal of Competition Law and
Economics 7 (2011): 871-915. [preprint available at www.SSRN.com/abstract=1758639] Vernon, Raymond. Storm over the Multinationals: The Real Issues. Cambridge: Harvard University Press
(1977). Wallace, B.B. and L.R. Edminster. International Control of Raw Materials. Washington: Brookings
(1930). Walker, Francis. The German Steel Syndicate. Quarterly Journal of Economics 20 (1906): 353-398).
[reprinted as pp. 833-868 in Ripley, William Z. (editor). Trusts, Pools and Corporations: Revised Edition. Boston: Ginn (1916)].
Walters, Adelaide. The International Copper Cartel. Southern Economic Journal 11 (1944): 133- 156.

J. M. Connor Price-Fixing Overcharges 3rd Edition February 2014
137
Wang, Jun and John Walley. Are Chinese Markets for Manufactured Products More Competitive than in the U.S.? A Comparison of China-U.S. Industrial Concentration Ratios: NBER Working Paper No. 19898. (February 2014).
Wang, Xuezheng. OECD Global Forum on Competition: Contribution from China (CCNM/COMP/WD(2001)10). Paris: OECD(2001). [http://www.oecd.org/dataoecd/40/61/2491690.pdf]
Waugh, Frederick V. Quality as a Determinant of Vegetable Prices. New York: Columbia University
Press (1929). Webb, Steven B. Tariffs, Cartels, Technology and Growth in the German Steel Industry, 1879-1914.
Journal of Economic History 40 (1980): 309-330. Weder, Rolf. The Swiss Dyestuffs Industry, in Studies in Swiss Competitive Advantage, Michael J.
Enright and Rolf Weder (eds.). Bern: Peter Lang (1995). Wells, Wyatt. Antitrust and the Formation of the Postwar World. New York: Columbia University Press
(2002). Werden, Gregory J. Price-Fixing and Civil Damages: Setting the Record Straight. Antitrust Bulletin 34
(Summer 1989): 307-335. __________. The Effect of Antitrust Policy on Consumer Welfare: What Crandall and Winston Overlook,
EAG 03-2. Washington, DC: Economic Analysis Group, Antitrust Division, U.S. Department of Justice (January 2003).
__________. Economic Evidence on the Existence of Collusion: Reconciling Antitrust Law with
Oligopoly Theory. Antitrust Law Journal 71 (2004):719-800. Werden, Gregory J. and Mailan J. Simon. Why Price Fixers Should Go to Prison. Antitrust Bulletin 32
(1965): 924-958. Whinston, Michael D. Lectures on Antitrust Economics. Cambridge: MIT Press (2006). White, Lawrence J. (ed.). Private Antitrust Litigation: New Evidence, New Learning. Cambridge, MA:
MIT Press (1988). Whitney, E. B. Brief submitted to the 6th Circuit Court of Appeals in U.S. v. Addyston Pipe and Steel Co.
(1896). Wiedenfeld, Kurt. Cartels and Combines. Geneva: League of Nations (1927). Wiggins, Steven N. and Gary D. Libecap. Firm Heterogeneities and cartelization Efforts in Domestic
Crude Oil. Journal of Law, Economics, and Organization 3 (1987):1-25. Wiley, John Shepard, Jr. Antitrust and Core Theory. University of Chicago Law Review 54 (Spring
1987): 556-589. Wilkinson, Harold. L. The Trust Movement in Australia. Melbourne: Critchley Parker (1914).

J. M. Connor Price-Fixing Overcharges 3rd Edition February 2014
138
Williams, Michael A. An Economic Application of Bootstrap Statistical Methods: Addyston Pipe
Revisited. American Economist 30 (1986): 52-58. Wils, Wouter P. J. Is Criminalization of EU Competition Law the Answer? World Competition 28 (June
2005): 117-159. Wilson, Mark R. Gentlemanly Price Fixing and Its Limits: Collusion and Competition in the U.S.
Explosives Industry during the Civil War Era. Business History Review 77 (2003): 207-234. Wood, Fiona. Fuelling the Local Economy: The Fenland Coal Trade, 1760-1850, in Bruland and O’Brien
(1998). Woodall, Brian. Japan Under Construction: Corruption, Politics, and Public Works. Berkeley, CA:
University of California Press (1996). Wrobel, Sharon. Treasury Finalizing Law to Break Cooking Gas Cartel Lower Costs. Jerusalem Post
(August 7, 2007): 17. [http://www.jpost.com/LandedPages/PrintArticle.aspx?id=71160] Wurm, Clemens A. International Industrial Cartels, the State and Politics (1989), in Jones (1993): 234-
245. Yonhap. A Korean News Service. (various dates). Yoon, Ja-young. HanGlas, KCC Admit Glass Price Fixing. Korea Times (June 26, 2009). [press release
of KFTC decision] Yu, Yinne. The Impact of Private International Cartels on Developing Countries: Honors Thesis,
Department of Economics, Stanford University (Timothy Bresnahan, Advisor) (May 2003). [http://www.econ.stanford.edu/academics/honors_thesis/Theses_2003/Yu.pdf]
Yuspeh, Larry. A Case for Increased Use of Competitive Procurement in the Department of Defense, in
Bidding and Auctioning for Procurement and Allocation, Yakov Amhuid (ed.). New York: NYU Press (1976).
Zembla. Four Documentaries: ″The Dutch Construction Cartel.″ [a CD]. (2009). Zimmerman, Jeffrey E. Determinants of Cartel Duration: A Cross-Sectional Study of Modern Private
International Cartels, M.S Thesis, Purdue University (May 2005). Zitzewitz, Eric. Forensic Economics. Journal of Economic Literature 50 (2012): 731-769. Zona, J. Douglas. Structural Approaches to Estimating Overcharges in Price-Fixing Cases. Antitrust Law
Journal 77 (2011): 473-494.

J. M. Connor Price-Fixing Overcharges 3rd Edition February 2014
139
APPENDIX: SOURCES AND COLLECTION METHODS Selection Criteria I have made every attempt to locate and extract all useful information on private, hard-core cartel overcharges available from serious204 published sources. A private, hard-core cartel is one that by contemporary U.S. standards could be criminally indicted under the Sherman Act.205 Private cartels are those not protected by treaties or national sovereignty. Hard-core or “naked” cartels are those that made explicit agreements on horizontal restraints to control prices or limit quantities to be produced or sold. Price agreements may cover list prices or transaction prices; the transactions prices may be floor prices, target prices, or, if a common sales agency is employed, actual transactions prices. Prices may refer to sales of goods or services, procurement of inputs, or bids in auctions or tenders. Quantity restrictions most commonly involve fixed market shares for each participant, but may also include territorial exclusivity, customer allocations, production-capacity, or fringe-boycott agreements. Cartels that focused exclusively on collective action regarding vertical restraints, advertising, patent pooling, technical standards, R & D, and the like are not considered hard-core. 204 Some readers have overlooked this selection criterion. For example, Bergman (2008) has said the following:
"Connor's results are based on all estimates of price effects that he has been able to find, irrespective of the quality of the underlying analysis...[M]any of the studies are unsubstantiated claims by competition authorities."
“Serious” studies are identified primarily by form of publication. Books, monographs, academic journals, and government publications that are written by professionals and show attention to detail nearly always make the cut. Working papers by scholars that seem to have publication potential are included. Newspaper articles, editorials, and opinion pieces; essays in popular magazines; and blogs are rarely included, unless they happen to be cited approvingly by academic experts. Statements by antitrust officials about overcharges are included only if their methods are explained and are methods normally accepted by U.S. courts. To my knowledge, other than a well regarded OECD (2003) survey, there are no unfiltered assertions by antitrust officials – or any other parties to cartel legal suits -- in this survey. I have, however, omitted a very small number of egregiously methodologically flawed studies (See Appendix Table 3 for the brief list of excluded studies and the reasons for their exclusion). Admittedly, and by design, seriousness and professionalism is not a high bar, but when authors attempt to pick a sample of studies according to some subjective criterion of "quality," excluding data points opens them to reasonable suspicion of tilting results to fit their inevitable prior beliefs (and lose friends). Indeed, Bergman's analysis itself may be criticized for basing his paper on a sample of 13 overcharges when so many others available; he displays a strict preference for econometric studies that I have argued may be the counsel of perfection in practical competition enforcement (Connor 2007c). Meta-analysis is one appropriate method for dealing ex post with heterogeneous quality; minimal, harmless heterogeneity has been detected in this paper‘s (see Connor and Bolotova 2006). 205 In the United States, bringing criminal indictments for only hard-core cartels is a matter of custom, not law. Some hard-core cartels are brought as civil matters because prosecutors judge that the criminal burden of proof cannot be met. Since the 1980s, the EU and most other other civil-law jurisdictions have abandoned requiring an effects test and now follow more or less the same conspiracy approach used in common-law countries (Joshua and Jordan 2003).

J. M. Connor Price-Fixing Overcharges 3rd Edition February 2014
140
Classifying the sampled cartels at times requires judgment. Some cartels operated prior to 1890, after which passage of the Sherman Act made participation by U.S. companies illegal, but many 20th-Century cartels headquartered in Europe predate the beginnings of effective European anticartel laws. If these cartels were not formed by means of a legally enforced government monopoly, they are generally considered private schemes.206 However, if a government simply required registration or chartering of a cartel but left its management in corporate hands, they are included in the data set. Beginning in 1918 in the United States and in most European countries in the interwar period, domestic producers were permitted to register and operate export cartels with no or minimal supervision; I consider these private cartels, unless they were compulsory by law. Similarly, if a government-owned national monopoly or commodity association voluntarily joins an international cartel, the latter may qualify as a private cartel. Thus, the mere fact that governments tolerated or turned a blind eye to cartels does not disqualify them from inclusion in the data set. However, commodity agreements known to have been initiated, actively sponsored, or intentionally protected by national sovereignty are not included in this paper.207 In these “public” cartels the active involvement of governments are signaled by the signing of a treaty, government ownership of stocks or commodities, or the appointment of civil servants to cartel-management positions. There are many fine studies of such agreements, but the inclusion of government-sponsored or -enforced cartels would tend to bias upward the overcharges in the sample (Suslow 2001). Moreover, public cartels are beyond the reach of antitrust law. With very few exceptions, this paper reports on every scholarly or serious study that contained quantitative information on the price effects of hard-core private cartels. Writings by economists, political scientists, economic historians, and legal scholars are included. Written decisions or detailed reports of decisions of antitrust authorities everywhere in the world were examined. While no time limit was placed on the literature search, the large majority of the sources consulted were written after 1945.208 I have examined more than 1000 English-language books, journal articles, working papers, reports, and other shorter analyses looking for evidence of cartel price effects. Many were written primarily as historical case studies or are focused on demonstrating a new method. Some mention price effects only in passing. Economists write the great majority of cartel studies,
206 Wallace and Edminster (1930: Appendix A) provide a convenient chronology of most government-sponsored export-control monopolies through the late 1920s. The Japanese camphor monopoly of 1899, the Italian citric acid monopoly of 1910, the Greek currant monopoly of 1895, and the New Zealand kauri-gum monopoly of 1927 are examples of clearly public, government-managed cartels. 207 In some cases particularly in the early 1930s, the earlier phases of an international cartel were controlled by national producers’ organizations of private firms that negotiated voluntary quota reductions; when cheating threatened the effectiveness of the cartel, colonial or metropolitan governments stepped in to pass mandatory supply-control legislation. The early phase of the cartel I deem private, but not the latter. 208 Unless available in translation, I have mostly confined this survey to English language sources. Many antitrust authorities now translate their press releases, decisions, and annual reports into English; moreover, members and some nonmembers submit summaries of their annual reports in English to the OECD. The preponderance of sources published after 1945 is explained by the growth of the field of industrial-organization economics and the passage of effective anti-cartel legislation worldwide.

J. M. Connor Price-Fixing Overcharges 3rd Edition February 2014
141
typically by North American academics using cartel episodes that affected commerce in the United States or Canada. The small number of empirical studies by European or Asian academics is striking.209 In addition, countless hours were spent reading press releases, decisions, etc. at the Web sites of antitrust authorities.210 In general, I aimed at collecting the largest possible body of reasonably professional, quantitative estimates of cartel overcharges, and avoided applying possibly subjective quality screening. In the vast majority of cases, the writers themselves provided the overcharge calculations. In a small minority of cases, I made inferences from price data contained in the works, following the judgment of and the facts supplied by the author, such as dates of collusion. The bases for my inferences are briefly outlined in Connor (2007c). 211 Overcharge claims appearing in newspapers, magazines, and newsletters are avoided because such assertions are usually from anonymous sources who may not be disinterested parties in an ongoing law suit or in some public policy debate, roles that may color their assertions. In some cases, overcharge estimates may originate from information in industry trade journals, but if they were cited by economists, historians, or legal scholars with some background in cartel studies, such estimates are reported in the present survey (e.g., Demaree 1969). Estimates found in a small number of book-length, years-long investigations by journalists, public servants, or other professional nonfiction writers are included (e.g., Berge 1944, Taylor and Yokell 1979). Clearly, this catholic approach to data-gathering will create concerns in the minds of many readers about the reliability and precision of the overcharges. There may be substantial variation in the quality of the price data, the methods used, degrees of judicial scrutiny, and the professional orientation of the sources that could affect reliability as perceived by any individual. I noted above the lack of clarity among professional writers about the essential characteristics of 209 One might speculate as to why this is so. The supply of well-trained industrial economists in Europe is unlikely to be an explanation. The principal European organization for industrial economists (EARIE) equally active in sponsoring meetings the past decade than its U.S. counterpart (IOS), and the EARIE meetings had a good proportion of empirical and legal-economic papers. The structure of academic departments at European and Asian universities may be one explanation of the paucity of useful studies. Compared to U.S. departments of economics, European departments tend to be smaller (perhaps falling below the threshold necessary for collaborative teamwork on large-scale data sets), more focused on IO theory, and have different expectations for Ph.D. dissertations. Perhaps a more important factor is the inability of academics to obtain access to the price data needed to calculate overcharges. Civil antitrust damages cases are unusual in Europe, so the little work being done on cartel overcharges is done in-house by antitrust authorities. Unlike North America, there is little mobility between the staffs of European antitrust authorities and universities or think tanks. Finally, a survey of European and North American industrial-organization economists reveals that there are very few attitudinal differences between the two groups on economic theory, but the former were less inclined to expect economists to influence competition policies (Aiginger et al. 2001). 210 The term “antitrust authority” has gained currency in recent years to cover any national or supra-national government agency empowered to enforce criminal or civil antitrust laws or competition-law rules. Thus, it encompasses, the U.S. DOJ Antitrust Division, the Fair Trade Commissions of many nations, the EC, and the many administrative authorities modeled on the aforementioned. Courts supervising antitrust trials or damages litigation are acting as antitrust authorities. 211 If a credible study of a cartel concludes that it was “ineffective,” I have coded this comment as a zero price effect and included this observation in the averages. Likewise, conclusions that the impact of collusion was “overwhelmed” by natural market forces are interpreted as a zero overcharge. However, vague conclusions that a cartel episode was “effective” in controlling prices are not tabulated in the quantitative summaries.
J. M. Connor Price-Fixing Overcharges 3rd Edition February 2014
142
the cartels until at least the 1920s. Consequently, some readers may wish to dismiss scholarship before that decade, while others will be untroubled by semantic differences. Economists may well give greater weight to writings by professionals in their own field than to opinions reached by judges, commissions, or juries, whereas legal scholars will often give greater credence to the latter. Legal professionals may have strong preferences for high court decisions over state or district courts, or they may have strong opinions about European versus American antitrust jurisprudence. Similarly, many economists might trust results published in refereed scientific journals more than other publication outlets that receive less peer scrutiny, prefer modern quantitative methods to deep historical case studies, or express skepticism about the analyses of economists writing before the Age of Game Theory. To contend with the disparate preferences of readers, I have chosen to cast my net widely, but look across the sources for evidence of systematic bias. In addition, the data are displayed across several Cartel Eras, data sources, and methods of computation so as to permit readers to choose the combinations they prefer. Indeed, the analysis of these data by source, time period, or method may provide useful insights in itself. I hope to provide the interested reader with enough information to make up his or her own mind about reliability.212 Social Science Studies The first block of sources consists of archived materials: books, monographs, reports, and refereed journal articles written by specialists in many fields: economists, historians, political scientists, lawyers, and in a few instances journalists.213 Newer publications were located by using various bibliographic search engines, by noting the references cited by authors in the works themselves, and by searching on-line library catalogs. These studies vary substantially in terms of depth and the degree of professional commitment to the study of cartels. Some economists and historians have spent substantial portions of their careers specialized in cartel analysis, but most of the publications quoted herein are by social scientists for whom cartels were just a passing interest. There are several methods used by social scientists to derive the effects of cartels on prices. Older economic studies tended to use a rather informal method of price analysis that now comes under the rubric of the “before-and-after method” (Connor 2007c). That is, armed with knowledge of when overt collusion occurred, the author would compare prices during the affected period with prices before the cartel began or after it ended; in some cases, the basis of 212 The influences of types of publications and methods of computation are formally analyzed in Connor and Bolotova (2006). 213 I have confined journalists’ accounts of cartels primarily to book-length treatments of cartels, in the belief that such monographs are in-depth accounts of a cartel collected from many sources, some of them anonymous, over a period of time sufficient for the author to provide a balanced account of conflicting claims. Books by journalists typically do not focus on the quantitative economic aspects of the case at hand, so in practice there are relatively few overcharges drawn from these sources in the present study. I rarely include overcharge estimates embedded in newspaper or magazine articles, though some specialists may judge such assertions to be sufficiently reliable to include in their published studies. For example, Elzinga (1984) cites Demaree (1969), and Carlton and Perloff (1990) cite Smith (1963).
J. M. Connor Price-Fixing Overcharges 3rd Edition February 2014
143
comparison would be a price war that erupted during the affected period. The base price was typically assumed to be the long-run competitive equilibrium benchmark price (now rather succinctly, if inelegantly, termed the “but-for price”). Although some were careful to take such factors into account, in many cases the possibility that shifts in demand or supply conditions could have caused the benchmark price during the affected period to depart systematically from the before or after price was ignored; moreover, the idea that price wars could generate unsustainably low prices was not often recognized. Some economists of the time realized the importance of averaging before or after prices for periods long enough to eliminate the influence of transitory disturbances in markets, but others were satisfied to identify one month’s prior price as the but-for price. A second way of calculating a benchmark price is the yardstick method. In this type of analysis, an economist would collect prices for analogous markets that were believed to be free from cartelization. For a localized conspiracy, the competitive yardstick could be prices in a nearby city or an adjacent state with similar demand or cost conditions. If prices before or after collusion are highly correlated, then the trend in cartel prices could then be compared to the trend in the yardstick-market prices during the collusive period. Yardstick price movements can also be constructed for a noncartelized product made in the same region that is made with the same inputs, utilizes a similar technology, and is consumed by the same customers.214 If a cartel colludes against only some of its customers, then the discounts offered to other similarly situated customers could yield a yardstick. Third, sometimes the costs of production and the margins earned by firms in the relevant lines of business may provide collateral indicators of variations in the degree of competitiveness of a firm or market. Absent significant changes in production technology, constant long run marginal costs or constant operating margins may be assumed before, during and after alleged collusion; if they are not constant, collusion may be the cause. Cost-based estimates are relatively uncommon because detailed internal business records are needed. The before-and-after, yardstick, and constant-margin methods require expert judgment about the market or industry in question, but all are acceptable methods used in courts of law or commission hearings to determine the fact of injury or the amount of damages. Fourth, since the 1970s the rigor and precision displayed in deriving estimates of cartel overcharges have made several advances (Baker and Rubinfeld 1999). Driven by developments in oligopoly theory, statistical methods, and the increasing availability of detailed company and market data, increasingly econometric models are specified and fitted to the data from the alleged collusive market.215 Game theory has influenced contemporary concepts of collusion, the design of competition policies, and empirical modeling of oligopolies (Werden 2004). One type of econometric modeling is an elaboration of the before-and-after method. A structural model of the market before or after the conspiracy can be estimated and used to predict the 214 The danger with this method is that the product yardstick may be a substitute for the cartelized product, and, hence, price-responsive to a cartel overcharge. 215 These data are often proprietary facts revealed during the discovery phase of litigation or submitted to an antitrust authority under compulsory legal processes. In addition to transaction prices of the defendants, production and marketing costs of details of business contracts may be handed over on a confidential basis.
J. M. Connor Price-Fixing Overcharges 3rd Edition February 2014
144
competitive benchmark price during the conspiracy (Brander and Ross: 17-20). A second type of econometric model can specify demand, supply, and an oligopoly model (usually Cournot or Bertrand) and fit the model to data from the collusive period (ibid. pp. 21-23). An early example of this approach is Dick’s (1992a) study of 16 U.S. Webb-Pomerene cartels.216 The most common approach is a reduced-form model. These models usually specify the demand and supply conditions in the relevant market as a function of the observed market price before, during, and after a conspiracy; the analyst then investigates through statistical tests whether and to what extent changes in prices or output fail to respond to normal, competitive market forces (ibid. pp. 23-29).217 Because these models can simultaneously incorporate multitudinous factors that explain prices, economists tend to regard overcharge estimates from such models as more accurate than analyses that depend on more informal ways of accounting for such factors.218 Defining Episodes Like most natural phenomena, most cartels are born and die only once, and the dates of those events are known with precision. A cartel’s birth and death describe one episode and one cartel. The birth of a cartel (“formation”) is marked by the day a collusive agreement is adopted.219 Cartel deaths are more varied and sometimes more difficult for observers to pinpoint. Cartels can die “natural” deaths if changes in market conditions make collusion unsustainable. Natural deaths may be quiet events marked by a consensus among the cartelists to close shop (e.g., if fringe entry becomes large, a new superior substitute product appears, or warfare among nations makes business as normal impossible), or they may end in convulsion (e.g., if cheating or defections become excessive or if major players engage in open warfare) (Levenstein and Suslow 2010). Cartels may also die “unnatural“ deaths if the cheating or defections are caused by the presence of effective anti-cartel laws. That is, antitrust authorities can decide to investigate suspicious prices being charged to buyers, examine unusual signals from a screening program that shows market prices to be incredibly steady or significantly less variable, or follow up on a leniency application by a participant in a cartel. However, some cartels have led charmed lives, dying and being reborn. Indeed, some cartels are formed, disband, reform, and disband several times. Each collusive cycle is an episode.
216 Dick (1992a) interprets his results as identifying only two cartls that either significantly raised prices (Crude Sulphur) or caused quantity to contract (Carbon black). However, I add Pebble Phosphate to this list because I believe a one-tail test of significance is warranted. 217 Either a dummy variable is included for the assumed collusive period, or the model can forecast or backcast benchmark prices from a noncollusive period. 218 On the other hand, if a cartel operated during a span in which cost conditions (input prices, expansion of capacity, inventories, and technology) were steady and demand conditions (consumer preferences, disposable income, available substitutes, and the like) did not shift, then elaborate econometric models and the more traditional methods will yield the same overcharges. For durable cartels, constancy of all these factors is unlikely. 219 This event may be marked by the signatures of the cartelists on a written contract, by the adoption of a verbal agreement and handshakes all around, or by some similar less formal method of communication.

J. M. Connor Price-Fixing Overcharges 3rd Edition February 2014
145
Overcharges are computed for episodes rather than cartels, so the dates of those episodes are critical parameters for analysts. Consistent with contemporary empirical studies of cartels, in this study each cartel episode is treated as a unique observation.220 The reasons for analyzing episodes rather than one cartelized market over time are straightforward. When a new episode appears, the cartel may have new members, a different territory, or simply a revised agreement. Pauses between episodes are often quite lengthy. Because the agreement or the players are different, in effect a new cartel is launched. Changes in these contractual factors will generally affect price outcomes. The period between the termination of one episode and the rebirth of the next episode is known in economic game theory as a “reversion to competition.” During this interim, the cartelists cease to observe and enforce the contract, cease to have harmonious multilateral contacts, may engage in open warfare, and typically suffer lower prices and profits than previously. During reversion prices may fall from near-monopoly levels to levels associated with noncooperative oligopoly (Cournot equilibrium, for example), purely competitive prices, or even sub-competitive prices. Price wars are not necessarily signs of failure, rather, they may be opportunities for a cartel to reorganize and adopt better rules for price-setting, profit-sharing, compensation and the like (Levenstein and Suslow 2006). Sometimes there are practical impediments to measuring episodic dates. In a forensic setting, the dates marking an episode may be obvious or uncontroversial; both sides stipulate the dates, and fines or damages can be computed with the stipulated dates. However, particularly for more durable cartels, the beginning date of an episode may be debatable, because written records have been lost or destroyed, cartel managers have retired or moved on, or memories faded.221 Ending dates should be better documented because in modern times most cartels end with publicly reported raids. However, cartel deaths are quite varied and some are difficult for observers to pinpoint. Cartels can die “natural” deaths if fringe supply grows too large, if cheating becomes excessive, or if defections (including leniency applications) occur; or cartels can die sudden “antitrust” deaths from raids resulting from tips222 to an antitrust authority (Levenstein and Suslow 2010: Table 2). Of these causes of death, only the dates of raids can be objectively recorded. Moreover, in the case of global cartels, various antitrust authorities often cite different dates. 220 Some early writers were fuzzy about this notion, but Sweezy (1938) and his successors like Eckbo (1976) and Griffin (1989) were meticulous in identifying temporal episodes carefully. 221 Beginning dates may be reported by government antitrust authorities as later than the true dates because the standard of proof is high or because they are only interested in dates after their laws take effect. In the United States, the DOJ can make plea bargaining more expeditious by moving forward a provable starting date as a concession to a defendant. Frequently, follow-on private plaintiffs are able to secure damages from a longer episode than that written in a plea agreement. 222 The main source of tips is disaffected directors or employees of cartel participants, the secondary source is outgrowths of other investigations (including Amnesty-Plus applications), and the tertiary source is customer complaints.

J. M. Connor Price-Fixing Overcharges 3rd Edition February 2014
146
To assist forensic economists in objectively identifying the existence and dates of collusion, a quantitative technique called a variance screen has been developed and implemented. Statistical analysis of price distributions begins with determining when the mean average price deviates from the but-for price. The mean is the first moment of the distribution, and there are three higher moments: variance, skewness, and kertosis. Connor (1985) was probably the first to suggest the rationale for the notion that higher moments could be used to identify cartel price effects. Abrantes-Metz et al. (2006) found that price variance declined during collusion by frozen fish sellers. Connor et al. (2008) also successfully tested the variance as a screen for cartel behavior. Blanckenburg et al. (2012) test for the effects of cartelization on all four moments of price distribution. Abrantes-Metz et al. (2011) applied Benford’s Law to demonstrate how LIBOR rates differed from the expected non-collusive distribution of digits, suggesting that bid rigging could have been detected. Decisions of Antitrust Authorities The second big block of information includes the printed reports and Web pages of scores of antitrust agencies, lists of court and commission decisions, and multilateral organizations concerned with competition issues. Data collection began by trying to collect verdicts in collusion cases, namely, final decisions antitrust cases involving horizontal collusion, broadly defined to include bid rigging and related practices, where a judge, jury, or commission calculated the damages. Starting with the United States, in theory researchers should be easily able to determine how high cartels raise prices by a straightforward examination of a statistically significant sample of the thousands of U.S. antitrust cases that involved cartels. However, for many decades in U.S. government cases, resolution of these numerous cases has involved fewer than ten trials per year, most of them of individuals, not corporations. Moreover, the amount that prices changed, or even whether prices were affected at all, is not relevant to the issue of whether a defendant violated U.S. criminal antitrust law.223 In U.S. criminal antitrust cases, it is unnecessary for prosecutors to present evidence of the extent of any overcharges or undercharges. Even at the sentencing phase of criminal price-fixing trials, prosecutors rarely offer information on damages. Guilty-plea statements and sentencing memoranda often mention affected sales and culpability factors that were used to calculate the sentencing guidelines ranges. Only a few contain stipulated damages as percentages of affected sales, and these percentages are probably minimal overcharge rates.224
223 See the discussion in Sullivan and Grimes (2000:165-233), which shows that in per se cases the plaintiff does not have to prove whether prices rose (or even whether defendants had market power). The issue of whether prices rose can be an element of a rule of reason case, but rule of reason cases do not give rise to criminal fines, so are not the subject of this paper. 224 What the documents say is that the percentage of what the defendant and the Government both agree is the amount of damages that prosecutors could prove beyond a reasonable doubt had a criminal trial been held. This is a higher standard of certainty than economic statistical reasoning can usually provide.

J. M. Connor Price-Fixing Overcharges 3rd Edition February 2014
147
In civil damages cases, however, the damages awarded to a successful plaintiff are equal to three times the overcharges, so in these cases plaintiffs must demonstrate how much prices increased or decreased due to the actions of the cartel. Finding overcharge rates in judicial decisions in civil actions also proved to be extremely difficult, because almost every private antitrust suit for damages settles or is dismissed before an overcharge can be calculated by a neutral observer and made part of the public record of the case. As a consequence, final verdicts involving cartels where a judge or jury calculated an overcharge are surprisingly rare. This approach yielded less than 30 episodic overcharges (Connor and Lande 2005). Besides U.S. court decisions, the Web sites of many foreign antitrust authorities were examined.225 In the jurisdictions employing Common Law, most cartels are sanctioned after government negotiations that result in guilty pleas or by monetary settlements with private parties out of court. When this is the method of resolution, the press releases practically never mention the degree of harm caused by the cartel. Very few cartels defend themselves in court, and very few of the trials result in published decisions that reveal the overcharges. Although judicial decisions themselves may not mention an overcharge rate, there are other ways to obtain overcharges from some of the decisions. Three sources were explored: computer assisted searches of data bases, reading through a large number of articles and treatises on cartels and on antitrust damages, and messages to groups of knowledgeable antitrust professionals. For example, inquiries were made on the antitrust list serves of the ABA Antitrust Section, the National Association of Attorneys’ General, and of the American Antitrust Institute. Every qualifying final collusion verdict is included.226 The small sample size of overcharges from U.S. decisions is disappointing. In other legal systems, antitrust commissions hold confidential hearings to determine guilt and impose sanctions. These decisions are announced in press releases that seldom mention the extent of cartel damages. Italy, the Netherlands, and Korea are exceptions to this rule; these overcharges are collected in Connor (2003). Moreover, these antitrust authorities and some others have reported a few of their decisions and overcharge estimates to the OECD (2003). However, in some jurisdictions a detailed report is released a year or two after the decision, and
225 The most useful sites were: The European Commission (EC); the Australian Competition and Consumer Commission (ACCC); the Canadian Competition Bureau (CCB); the German Bundeskartellamt (BKA); the Fair Trade Commissions of Japan, Korea, and Taiwan; and the competition authorities of Finland, Sweden, Norway, Denmark, the Netherlands, France, Italy, Portugal, and Israel. Many of these authorities seem committed to reminding taxpayers of precisely how harmful the cartels they ensnared have been. In past decade, the large majority of the authorities’ Web sites translate summaries of their decisions and their annual reports into English. However, I also read some earlier, untranslated documents in French, German, Spanish, and Italian. In recent years, (using browsers with the names of punished cartelists, for example) I have found short press releases from antitrust authorities or news bureaus written other languages and obtained sensible on-line translations. 226 Many of the verdicts found were only expressed in monetary amounts, which could only be translated into percentages if trade sources could be found for the often narrowly defined cartelized products. Other decisions gave good or at least minimally acceptable price change data for the affected markets.

J. M. Connor Price-Fixing Overcharges 3rd Edition February 2014
148
some of these reports have prices that can yield useful overcharge information, though that is not often the case.227 Additionally, commission decisions can be appealed to a court that renders a decision with a recitation of the facts of the case.228 The 50 Highest-Overcharge Observations The following table provides support for the text section “Looking in Detail at Extreme Observations”.
227 I read almost 100 EC decisions that imposed fines on cartels (listed in Burnside (2003: Annex 1) and others published since 2003). The UK Monopolies Commission also released detailed reports, and I read about 40 of the ones that declared the cartel was “not in the public interest.” 228 Occasionally, the commission reported an absolute overcharge, and the size of affected sales needed to be estimated.
Table A.1. Summary of the Characteristics of the 50 Highest-Overcharge Observations, by Year Cartel Began
Cartel Market [Number estimates above one]
Years Over- charge a
Source of Estimate (s) b
Quality Assessment c
% Cordage, sisal or hemp, Eastern U.S. 1878-81 350.0 Dewing (1913) book Very good
Borax, European-based 1890-94 223.5 Pierce (1913), Holt (1907) books Very good
Steel Tubes, US 1899-14 227.0 Jones (1921) popular book, academic author Very good
Steel, barbed wire, US 1900-08 233.0 Jenks and Clark (1929)
popular book, academic authors
Very good
Telephone service, home and office, NY City [2] 1908 433-620
Demarest (1910), an opinionated book on evils of monopoly by an author considered one of the pioneering „muckrakers“
Perhaps poor yardstick if Bell
Co. had no competition
Radium, global 1912-18 243.0 Government of Canada (1945) research report Excellent
Raisins, US 1913-22 257.0 Jenks and Clark (1929)
popular book, academic authors
Very good
Phosphate Rock, US, World Exports 1919-49 254.0 Dick (1992a) refereed article Excellent
Rare books auction, bidding ring, country estate in Surrey, UK
1919 430.0 Porter (1992) refereed article Excellent
Sulfur, global [2] 1922-40 201.8 –
203.0 MacKie-Mason and Pindyck (1987) academic book chapter
Excellent
Electric Light Bulbs, world price 1924-39 222.0 Stocking and Watkins (1946) classic book Excellent
Electric Light Bulbs, world price [4] 1924-39 214-322 UK Monopolies Very good
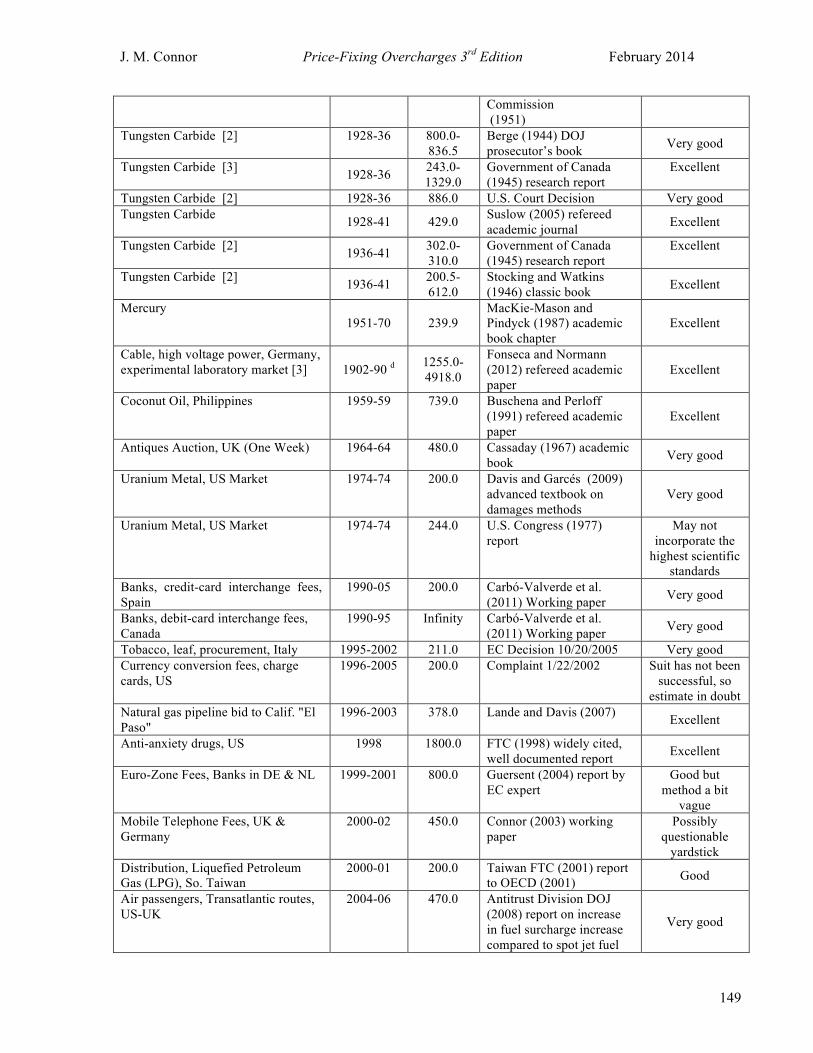
J. M. Connor Price-Fixing Overcharges 3rd Edition February 2014
149
Commission (1951)
Tungsten Carbide [2] 1928-36 800.0- 836.5
Berge (1944) DOJ prosecutor’s book Very good
Tungsten Carbide [3] 1928-36 243.0-1329.0
Government of Canada (1945) research report
Excellent
Tungsten Carbide [2] 1928-36 886.0 U.S. Court Decision Very good Tungsten Carbide 1928-41 429.0 Suslow (2005) refereed
academic journal Excellent
Tungsten Carbide [2] 1936-41 302.0-310.0
Government of Canada (1945) research report
Excellent
Tungsten Carbide [2] 1936-41 200.5-612.0
Stocking and Watkins (1946) classic book Excellent
Mercury 1951-70 239.9
MacKie-Mason and Pindyck (1987) academic book chapter
Excellent
Cable, high voltage power, Germany, experimental laboratory market [3] 1902-90 d 1255.0-
4918.0
Fonseca and Normann (2012) refereed academic paper
Excellent
Coconut Oil, Philippines 1959-59 739.0 Buschena and Perloff (1991) refereed academic paper
Excellent
Antiques Auction, UK (One Week) 1964-64 480.0 Cassaday (1967) academic book Very good
Uranium Metal, US Market 1974-74 200.0 Davis and Garcés (2009) advanced textbook on damages methods
Very good
Uranium Metal, US Market 1974-74 244.0 U.S. Congress (1977) report
May not incorporate the
highest scientific standards
Banks, credit-card interchange fees, Spain
1990-05 200.0 Carbó-Valverde et al. (2011) Working paper Very good
Banks, debit-card interchange fees, Canada
1990-95 Infinity Carbó-Valverde et al. (2011) Working paper Very good
Tobacco, leaf, procurement, Italy 1995-2002 211.0 EC Decision 10/20/2005 Very good Currency conversion fees, charge cards, US
1996-2005 200.0 Complaint 1/22/2002 Suit has not been successful, so
estimate in doubt Natural gas pipeline bid to Calif. "El Paso"
1996-2003 378.0 Lande and Davis (2007) Excellent
Anti-anxiety drugs, US 1998 1800.0 FTC (1998) widely cited, well documented report Excellent
Euro-Zone Fees, Banks in DE & NL 1999-2001 800.0 Guersent (2004) report by EC expert
Good but method a bit
vague Mobile Telephone Fees, UK & Germany
2000-02 450.0 Connor (2003) working paper
Possibly questionable
yardstick Distribution, Liquefied Petroleum Gas (LPG), So. Taiwan
2000-01 200.0 Taiwan FTC (2001) report to OECD (2001) Good
Air passengers, Transatlantic routes, US-UK
2004-06 470.0 Antitrust Division DOJ (2008) report on increase in fuel surcharge increase compared to spot jet fuel
Very good
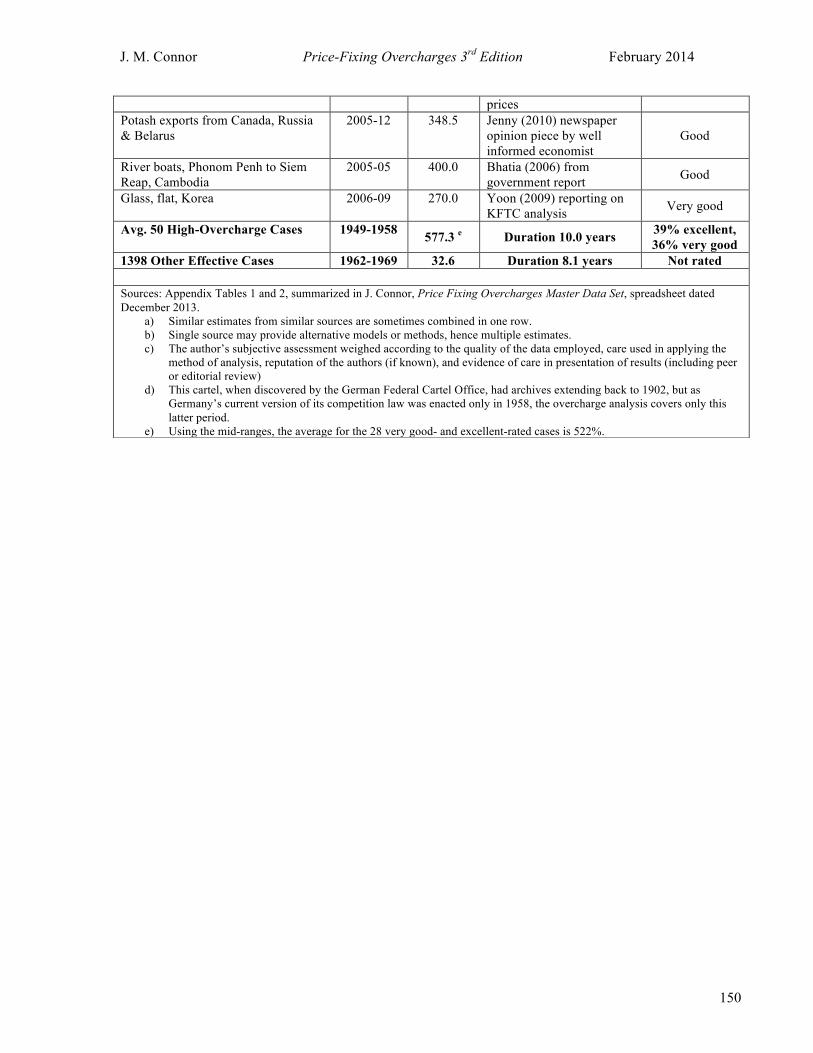
J. M. Connor Price-Fixing Overcharges 3rd Edition February 2014
150
prices Potash exports from Canada, Russia & Belarus
2005-12 348.5 Jenny (2010) newspaper opinion piece by well informed economist
Good
River boats, Phonom Penh to Siem Reap, Cambodia
2005-05 400.0 Bhatia (2006) from government report Good
Glass, flat, Korea 2006-09 270.0 Yoon (2009) reporting on KFTC analysis Very good
Avg. 50 High-Overcharge Cases 1949-1958 577.3 e Duration 10.0 years 39% excellent, 36% very good
1398 Other Effective Cases 1962-1969 32.6 Duration 8.1 years Not rated
Sources: Appendix Tables 1 and 2, summarized in J. Connor, Price Fixing Overcharges Master Data Set, spreadsheet dated December 2013.
a) Similar estimates from similar sources are sometimes combined in one row. b) Single source may provide alternative models or methods, hence multiple estimates. c) The author’s subjective assessment weighed according to the quality of the data employed, care used in applying the
method of analysis, reputation of the authors (if known), and evidence of care in presentation of results (including peer or editorial review)
d) This cartel, when discovered by the German Federal Cartel Office, had archives extending back to 1902, but as Germany’s current version of its competition law was enacted only in 1958, the overcharge analysis covers only this latter period.
e) Using the mid-ranges, the average for the 28 very good- and excellent-rated cases is 522%.
J. M. Connor Price-Fixing Overcharges 3rd Edition February 2014
151
LITERATURE APPENDIX: Pre-Modern Cartel Studies It took roughly 75 years of groping in the dark before economics had a clear-eyed vision of the essential nature of the price-fixing cartel and had the necessary theoretical framework to organize empirical studies in a logical manner. As the example of Adam Smith shows, interest in collusive business organizations began well before industrial-organization economics was first taught as a distinct discipline in a few universities in the 1930s. Yet, cartels were initially conceptually conflated with monopolies, horizontal corporate mergers, and short-run commodity-market manipulation schemes involving pooling or hoarding. The German-speaking profession debated the details of the definition of kartell from the 1870s for 50 years, but was held back by its long adherence to a historical-institutional method of analysis hostile to classical economics. Cartels were primarily of interest from business or esoteric legal perspectives. English-language economists, who would come to dominate the profession, forged growing disciplines by wedding classical economics to empirical testing, but they totally lacked a precise, consensus definition until the 1940s. Most importantly, serious economic studies of cartels was inhibited by the absence of models of oligopoly. Private cartels are not only forms of business enterprise “in between“ competition and monopoly, they are essentially distinct from either. Moreover, cartel studies were discouraged by the absence of a public policy debate. Cartels were promoted (or tolerated by registration laws) by Continental European governments and were subject to only mild censure in the United States. Consequently, prior to World War II, only a few dozen archival academic publications treated the economics of cartels. Only a few pioneers seemed to have intuited that cartels were unique and pervasive business organizations with potentially large welfare effects inevitably injurious to efficient markets. Because theories of oligopoly were slow to be developed and accepted by the economics profession and because public-policy debates were infrequent or inconsequential, economists largely disregarded cartels as an economic phenomenon worthy of formal analysis or empirical testing. The three-volume set of books by Stocking and Watkins (1946, 1948, and 1951) was a watershed event. These authors who were well versed in the primitive field of industrial economics of the time, demonstrated that cartels were pervasive in the U.S. and world economies, had strong negative effects on their markets, and were dangerously incompatible with democratic institutions. Stigler’s (1964) oligopoly model of cartels gave legitimacy to cartel studies, and the exposure of Great Electrical Conspiracy in 1959-60 added policy urgency to the burgeoning field. Evolution of the Definition of “Cartel” A comprehensive bibliography about “trusts” compiled by the U.S. Industrial Commission in 1901 lists about 600 items in English, French, and German (ibid. 947-977). These early publications tended to use the terms “pools,” “corners,” “trusts,” “combinations,” “monopolies,” and “syndicates” interchangeably to identify various monopolistic business arrangements.229 Bullock’s (1901) seminal survey paper of late 19th century U.S. publications tends to regard all of these words as roughly equivalent terms for what
229 Other terms include monopolies, trade associations, conventions, comptoirs, ententes, and intergovernmental commodity agreements.

J. M. Connor Price-Fixing Overcharges 3rd Edition February 2014
152
would be more precisely called today monopolistic business entities with market power over price (p. 183).230 Consistent use of these terms to represent analytically different phenomena was not well established in economics written in English until the mid 20th century.231 Robert Liefmann coined one of the most cited and pithy definitions of cartels: “free [voluntary] associations of producers for the monopolistic control of the market" (Liefmann 1932: ix). By this definition he meant to include only arrangements by independent companies linked by formal or informal contractual agreements; compulsory commodity schemes enforced by government decrees or parliamentary statutes are not true cartels by his definition, though international agreements negotiated between compulsory national cartels would qualify if the negotiated agreement did not require statutory enforcement.232 He dismisses the widely accepted view of the time that cartelists are merely aiming to achieve a “reasonable profit,” insisting that cartels are instruments for maximizing profits. Liefmann assembles a great deal of information on German cartels and limited information on cartels outside Germany, but with one exception, he includes no useful price series that could be used to compute price effects.233 Liefmann’s positions continued to influence German economists for decades to come. However, other German economists like Beckerath (1930) opined that cartels were motivated primarily by a desire to reduce fluctuations in output or prices. To do so, durable cartels typically used their power to raise prices during slumps and restrain prices during booms. While he admits that raw-materials cartels and patent pools were successful in raising prices above competitive levels in the long run, he believed that for other 230 In a footnote on p. 184, Bullock quotes with approval Jenks observation that trusts and cartels also aim “to check competition,” that is, prevent market entry. 231 Until World War I or later, the word “cartel” or Kartell was not in general use among Anglophone economists; Sayous (1902), a French economic historian, discusses 16th and 17th century cartels. Sayous (1902:381) appears to be the first academic writer in a U.S. journal to use the word cartel in its present economic sense. He is one of the first writers to clearly distinguish private cartels from government-run schemes, trusts, holding companies, and the like. The famous Dutch East India Company, he argues, was a government-supported monopoly, not a cartel. Sayous believes that a cattle-procurement monopoly by butchers of Anvers, France in the 16th century qualifies as an early private European cartel. Notz (1920, 1929), a U.S. Government economic analyst whose work is discussed below, helped popularize the term in the United States. In Germany, the word kartell came into popular usage in 1887 when two formerly antagonistic political parties formed a ruling government coalition under Chancellor Bismarck. In the UK, cartel first appeared in the press in the May 24, 1902 edition of the Daily Chronicle. The business press regularly reported on cartel developments, including price effects. For example, on p. 68 of The Economist (January 12, 1935) an unsigned article on Austria says in part: “The cartel movement is spreading....The Vienna coal trade has arranged for a cartel for house coal, and a 4 per cent price rise has occurred.” This is an example of an overcharge that does not meet this study’s minimum requirement for seriousness. 232 That is, if a government-to-government treaty joins two or more national cartels, the result is not a cartel proper. It is the voluntary nature of the agreement that is the defining characteristic of true cartels, according to Liefmann. This distinction is a useful one for the present survey, because I wish to focus “private” cartels that are indictable under U.S. antitrust law. Private cartels may contain state-owned companies or legal export cartels as members, but if the arrangement is sanctioned by national laws, protected by national sovereignty, or the result of international treaties, I deem them “public.” Compulsory cartels, a type popular in Europe and Japan in the 1930s, are a special type of public cartel. 233 Liefmann (1932) has no doubts that cartels frequently raise prices (or prevent them from falling during recessions), but he is a bit of a perfectionist, insisting that “…it is impossible to say what the prices would have been if there had been no cartel (p. 104).”

J. M. Connor Price-Fixing Overcharges 3rd Edition February 2014
153
types the evidence was lacking (p. 262). “…[I]t can only rarely be proved that a cartel is the only reason behind a price rise” (p. 263).234 Indeed, the book contains no price data. In 1916, Ripley lead the way in differentiating between cartels, mergers, and dominant firms, using terms that became commonly accepted economic and legal jargon by the 1940s. Pools or corners were contractual joint-profit-increasing agreements by independent sellers over prices or quantities; in most cases, speculators (or sometimes suppliers themselves) secretly purchased or contracted for a large inventory of a commodity235 in order to profitably control its price. Today, these are regarded as one variety of cartel (Ripley 1916: xiv).236 Ripley cites the U.S. cordage cartel, formed in 1860, as the first documented U.S. pool. Other 19th century pool-cartels include cotton bags, distilling, iron pipes, steel, salt (Jenks 1888), wire nails (Edgerton 1897), and a patent pool for porcelain bathtubs.237 “Trusts“ proper were legal instruments used in the United States from about 1879 to 1902 for combining independent companies under a single board of directors (Ripley 1916). Hence the U.S. legal term “antitrust” to refer to laws governing price fixing, monopolies, and merger control; “antitrust” is now the world-wide term adopted in many foreign languages to refer to price fixing and other restraints on trade (but excluding merger control, dominant firms, and anticompetitive state support of national firms). Beginning in the late 1890s trusts were supplanted as a means of industrial merger by the holding company. Thus, trusts, combines, and holding companies can and often do refer to the outcomes of mergers and acquisitions rather than to cartels. However, when a trust was created as a cover for previously independent companies to collude, they closely resemble modern cartels (see Genosove and Mullin (1998) for a remarkable study of the U.S. Sugar Trust). Yet, the word “trust” continued to be used loosely and popularly throughout the early 20th century to cover both cartels and mergers intended to increase market power. As late as the 1930s, several terms were often used interchangeably for cartels (Plummer 1936, Curtis 1931). Curtis considered cartel to be a term used mainly in Europe. His preferred terminology was pools for more informal and unstable cartels and trusts for cartels with strong central direction and control. Industrial organization economics pioneer Edward Mason, professor at Harvard University, writing to a broad audience in 1944, dwelled on the ubiquity of the term “cartel” and “international cartel” among U.S. writers.
234 However, Beckerath undercuts his agnostic position by noting that most cartels have members with varying costs and set their common price so as to allow its highest-cost member to make a profit (p. 265); it follows that at such a price all the others are making economic profits. 235 A variant of the pool was one that spread false rumors exaggerating the size of its supply control. 236 However, pools often were organized to obtain only short run profits, whereas cartel connotes a more enduring scheme. “Cartel,” from the German cognate Kartell, came into general use in British writing in 1902 (Connor 2001:20). Although more common in the 19th century, modern cartels do not usually endow a joint venture with capital contributions, though they may set up a sales office or secretariat. The first work in the United States that I have seen referring to German cartels is to “combinations” that “regulate” industries (Bullock 1901:207). Ripley (1916: xiv) cites German kartells. On the continent of Europe, “syndicate” or comptoir was often used to describe a cartel, with a joint sales agency often implied. 237 Other early examples (1908-1915) of convicted cartels based upon patent pooling are paper (1908), electrical equipment (1911), umbrella frames (1907), bicycle coasters (1912-13), shoe machinery (1914), cash registers (1915), harvesters (1914), and watch cases (1915) (Ripley 1916: 604-605).

J. M. Connor Price-Fixing Overcharges 3rd Edition February 2014
154
“The word ‘cartel’ is enjoying and extraordinary and somewhat curious vogue in the United States. Its meaning, like that of many more or less technical words adopted for popular use, has become more vague while at the same time becoming more portentous. And the overtones are definitely sinister [in the United States]….Those opposed have relied on such words as conspiracy, monopoly, Fascism…[T]he United States is rather enthusiastically to an anti-trust policy…[but] our antipathy to monopoly … is not shared by other countries.” (Mason 1944: 604-607).
After noting the precise definition 238 developed by economists and consistent with contemporary discourse in economics, Mason (1944) then went on to discus the various ways the appearance of international cartels have necessarily broadened the term cartel. He would include under the rubric international patent-pooling agreements, the establishment of joint marketing ventures by dominant firms,239 voluntary export associations (like the U.S. Webb-Pomerene export cartels), and voluntary export associations with government-owned companies as participants. These are all “private international cartels” in the strict sense, he proposed. However, if an international cartel was formed by inter-governmental agreements, these are best called international commodity agreements (or perhaps public international cartels). Mason notes that international commodity agreements typically arise from pre-existing national (and often mandatory) cartels that were formed in response to falling prices and perceived “excess supply.” Sometimes the formation international cartel agreements places pressure on certain governments to cartelize previously competitive industries, because as long as the industries remain competitive they can undercut the agreement.240 European Scholarship on Cartels Perhaps the earliest careful writer on (public) cartels was the Dutch statistical economist H. W. Tydeman (de Jong 2009a: 56-58), who analyzed the market effects of municipally licensed craft guilds in towns in the 15th to 19th century. The first of them appeared in Amsterdam around 1400, had increased to 45 in 1688, and rose to 51 in 1818. After 20 years of public debate, guilds were abolished in the Netherlands by a royal decree in 1818. In a 124-page “essay” published a few years after they were abolished, Tydeman examines the economics of the Amsterdam guilds. Guilds set minimum quality standards and prices for its member’s goods and services. Tydeman found that by limiting the number of suppliers, the extra profits flowing from membership were low but measureable. The costs of joining a guild (i.e., becoming a fully qualified “Master”) equaled 1 to 5 years of apprenticeship at low wages, plus a purchase fee of 4% to 15% of the initial year's income of a new Master. Public policy of the Dutch rulers had consistently been to restrain abuses of the guilds. But the greatest restraints on the power of guilds were substitutes --
238 “Cartels… are agreements between firms in the same branch of trade limiting the freedom of these firms to in the productions and marketing of their products…that aim at the restriction of output or sales by the member firms…” (Mason 1944: 604). “…[C]artel, in the strict sense of the word, means a marketing agreement between private firms…” (ibid. p.605). 239 An example is the several Duperial companies in Latin America jointly owned by DuPont and Imperial Chemical Industries to sell products for which both companies had dominant positions in their respective home markets (Berge 1944: 183). Kreps (1950: 166) says that the Duperial agreement signed in 1929 was to have lasted for 50 years and involved territorial noncompetition for 400 chemical and drug products. 240 Mason (1944: 607) gives the inter-War European steel cartel as an example. This cartel initially included most of the important steel-producing nations of Continental Europe. After UK steel producers joined this export cartel, the UK government insisted that its steel companies form a domestic cartel.

J. M. Connor Price-Fixing Overcharges 3rd Edition February 2014
155
such as public markets and craftsmen located outside the city's boundary (and, hence, the guild’s jurisdiction) -- and the purchasing power of ship owners or other powerful buyer groups. Private cartels first came to the attention of Low Country economists from Kleinwächter's (1883) book (de Jong 2009a: 62-63). European cartels began to release some information to the public on their operations in the 1880s, and this was used for the first Dutch academic publication on cartels by Willem van der Schalk (1891). Van der Schalk developed a sensible typology of five types of cartel organizations that he thought went from least effective to most effective, where the latter is equivalent to a monopoly: (1) P-fix, (2) Q-fix, (3) P- and Q-fix, (4) common sales office, and (5) a Central Bureau for sales-and-output direction. These degrees of performance assume that a cartel has tariff protection; if not, then he contended that the formation of an international (cross-border) cartel is necessary. Van der Schalk judged that only 2 of 11 international cartels in existence in 1888 (including UK-German dynamite) were minimally successful. Lack of success generally could be traced to long contract negotiations, a high degree of cheating, and no punishment mechanism. A factor that assisted effectiveness was state intervention in making transparent cartel members' market shares (e.g., monthly inspections of German coal mines, publication of brewery excise taxes, the use of public auctions for procurement).241 Robert Liefmann (1897) published one of the first economic monographs that contained the word Kartell in its title.242 The book appeared in five editions in German from 1897 to 1929. He was a widely read writer on cartels (de Jong 2009: 38-39). The last edition was updated, translated into English, and published in London in 1932; the Oxford University economist who wrote the book’s Introduction hailed it as the best known study of cartels and trusts “from a German perspective.”243 In many ways Liefmann was leagues ahead of his contemporaries in the analysis of the cartel phenomenon.244 Herman Levy was a contemporary of Liefmann. Levy was a prolific writer of books on economic history. Not counting revised editions, he authored ten books between 1900 and 1927, eight in German and two in English.245 De Jong (2009) calls Levy a "very perceptive" economist on the topic of cartels and trusts, including dynamic aspects (pp. 36-38). In disagreement with Schumpeter, Levy suggested that there were market conditions that would facilitate concentrated markets through cartels or mergers to monopoly: tariff protection, large economies of plant scale, input supply inelasticity, cost-reducing vertical integration, and seller reputation. Levy opposed state planning of an economy because it resulted
241 Schalk's modern views on cartels would come to be replaced by Dutch economists (Wibaut, de Vries) writing in 1903-1940 who attempted to distinguish between good and bad cartels, the latter to be handled by nationalization or other forms of regulation (de Jong 2009a). In fact few nationalizations took place for 60 years in the Netherlands. Public opinion was mostly pro-cartel, tolerant of price fixing, and unreceptive to competition policy. Laws passed in the 1950s to correct abuses were ineffective. Only in 1998 did the Netherlands join in with the EC in properly enforcing anti-cartel legislation. 242 The first appears to be Kleinwächter (1883), but this author was not as influential as Liefmann. Hirst (1905) seems to be the first book in English to have Kartell or Cartel in its title. 243 I interpret this phrase to imply that the British economics profession did not share German economists‘ fascination with the topic. 244 De Jong (2009: 38-39) credits Liefmann with other important contributions to Industrial economics. He may have been one of the first economists to write about potential competition (he called it "latent" competition) that would likely arise from the increase in prices due to cartelization of a market. 245 Levy wrote the first book on on English agricultural economics in 1904 (Large and Small Holdings: A Study of English Agricultural Economics. Cambridge Univ. Press, translated 1911).
J. M. Connor Price-Fixing Overcharges 3rd Edition February 2014
156
in compulsory cartelization. While indebted to Liefmann’s concepts and definitions, Levy covers different ground than Liefmann. Unlike Liefmann, Levy is eager to quantify the economic impacts of cartels and trusts. Levy (1968) is a reprint of the second (1927) English-language edition of his book on British cartels, monopolies, and oligopolies. This work is concerned about why the British cartel movement was weaker and slower to develop than on the Continent of Europe. It contains unique information on 18th and 19th century British cartels. An issue among European writers is when and why kartells first appeared. Piotrowski (1933) delves into pre-Christian, Roman, and medieval history to find many examples of organizations that appear to resemble private cartels, but in most cases pre-modern historians fail to provide details about cartel conduct, organization, or the degree of government support. However, Sayous (1902) makes a well-documented case for the existence of private cartels in the strict sense of the term in 17th century Holland.246 The Dutch Company of the North was chartered in 1614 to exploit the Greenland whale-oil industry; by 1618 the Company had adopted a supply-restraint objective to keep domestic prices above competitive levels. However, the private nature of the Company of the North ceased in 1622 when the States-General of Holland granted it a long-lasting monopoly for whale-fishing.247 Nevertheless, it is Germany that has the best claim as the birthplace of industrial cartels that were organized and managed along contemporary lines.248 Liefmann (1932) believes that the first domestic German cartel was the Neckar Salt Union, an 1829 combination of salt mines in three German states. Five more were formed prior to 1870. However, Liefmann and other writers point to the German depression of the mid 1870s as a peak period for the formation of many of Germany’s earliest industrial cartels. From 1903 to 1944 a German monthly magazine (Kartell-rundschau) was published that contained numerous articles on legal and business developments concerning cartels.249 A 1905 German government survey found 385 industrial cartels operating; the number rose to 3000 by 1925.250 As for international cartels, Liefmann identifies the 1867 merger of the Neckar Salt Union in Germany with the Eastern French Salt Works Syndicate as the first of its kind. By 1897 there were at least 40 international cartels with German companies as members, most of them in chemical or nonmetallic minerals product markets. Notz (1920) quotes a German book that found 114 international cartels in 1912; in 1920 he could identify 11 of those international cartels with participation by U.S. companies.
246 Sayous (1902:381), a French economic historian, appears to be the first academic writer in a U.S. journal to use the word cartel in its economic sense. He clearly distinguishes private cartels from government-run schemes, trusts, holding companies, and the like. The more famous Dutch East India Company, he argues, was a government-supported monopoly. Sayous believes that a cattle-procurement monopsony by butchers of Anvers, France in the 16th century also qualifies as an early European private cartel. 247 However, the government refused repeated appeals by the Company of the North to impose import barriers on whale oil or bone. The principal advantage of the Company of the North was secrecy about the location of its fishing grounds; it became weakened by the entry of three other Dutch companies that required a reallocation of its market share and by leakage of the secret to the Danish whale-fishing fleet in the 1630s. 248 Cartels evolved in a parallel fashion in the more industrialized parts of the Austrian Empire. 249 It may reasonably be inferred that in the early 20th century there was a large readership of professional cartel administrators (Verbandsmanager) and legal advisors in German-speaking nations and surrounding areas. 250 Liefmann (1932) notes that these numbers do not count hundreds of local German price-fixing agreements among hairdressers, hotels, and other local service providers.

J. M. Connor Price-Fixing Overcharges 3rd Edition February 2014
157
Another early European writer who was concerned about the lack of concrete measures of the market effects of cartels is a then-young lawyer and economics lecturer, Hirst (1905). His book grew out of an 1899 Oxford student essay that attempted to develop price-based indicators of the price effects of cartels. Noting that German cartels frequently exported significant shares of domestic output to other countries at lower prices than their fixed domestic prices, he proposes using the export prices as a yardstick. Although there is some danger of overstating the domestic overcharge if the cartel is dumping product at predatory prices or if the marginal costs of exporting are lower than comparable domestic sales, he applies this method to six German cartels using 1900-1902 prices.251 Hirst may be the first author, in the English language at any rate, formally to apply the yardstick method. There were two important interwar conferences the focused on international cartels. Cartels, mergers, trade, and foreign direct investment were major concerns of the League of Nations, which sponsored a major conference in Geneva organized by its Economic Committee on cartels in 1927. Papers prepared by some of the leading European cartel writers of the day were published as part of the conference proceedings (de Rousiers 1927, MacGregor 1927, Wiedenfeld 1927, and Economic and Financial Section 1927).252 These papers dwell on conceptual and organizational issues surrounding cartels and contain little of interest on price or welfare impacts. Indeed the near absence of empirical detail in these reports and other studies by European scholars active in the interwar period provide a striking contrast with the industrial analyses emerging in the United States. The final report of the 1927 conference reveals a deep split between those participants who believed that cartels harmed consumers (or laborers), national economies, and international trade and those who believed that cartels stabilized prices, investment, and employment. Representatives of social-democratic parties favored significant government action to control cartels, but the economists and civil servants who dominated the conference rejected the need for such laws (Gerber 1998: 159-161). Perhaps to rectify these ambiguities, the League later sponsored cartel studies with more empirical content (Benni et al. 1930, Oualid 1938). From the 1920s, advances in European economic scholarship in cartel studies languished for decades. It is true that researchers at European universities and economic research institutes made important contributions to game theory and other theoretical developments in industrial organization economics, but that occurred in the late 1970s and 1980s. Similarly, novel research on legal-economic topics like optimal deterrence or „antitrust economics“ were largely North American preserves until the late 1980s or 1990s. major empirical economic studies of cartel price effects were rare or fitful in Europe until the mid 1990s,253 and empirical analyses of large samples of cartel prosecutions did not begin to appear until after about 2004.254
251 This method also may result in an inaccurate benchmark price if the elasticity of demand in the export market differs from that in the domestic market and this difference is not taken into account. In Hirst’s study, however, I judge this factor to be a minor source of inaccuracy, because the export markets (mostly the Benelux countries) were geographically proximate to Germany and were at similar levels of industrial development. 252 The United States was not a member of the League of Nations and sent only observers to the 1927 conference. Similarly, there were members of the U.S. Congress at the Interparliamentary Union conference of 1930, but the U.S. delegation abstained from endorsing the conference report. 253 Exceptions are Swann et al. (1974), Schroeter (1993), and Barbezat (1989). Probably the first empirical studies of cartel overcharges out of Europe are Schroeter (1996), Albaek et al. (1997), Fölster and Peltzman (1997), and Scott-Morton (1997). 254 The Netherlands (especially the Amsterdam Center for Law and Economics (from 2003) and the University of East Anglia’s Centre for Competition Policy (from 2004) led the way. Among the first such studies are Schinkel (2006) and Stephan (2005). See also Russo et al. (2010)

J. M. Connor Price-Fixing Overcharges 3rd Edition February 2014
158
Early European Anti-Cartel Legislation Most writers about the establishment of competition law in Europe emphasize the key role played by the adoption of strong anti-cartel legislation by the German parliament in January 1958 after years of debate on the subject. German negotiators almost singlehandedly pushed for the inclusion of provisions for the control of cartels and monopolization in the Treaty of Rome that established the predecessors of the European Union, and at was the EU’s antitrust laws that have served as the model or inspiration of competition laws in European and other jurisdictions. However, less appreciated are earlier attempts to fashion such laws in Europe. Gerber (1998: 51-62) traces the origin of struggles over competition laws in Europe to the Austrian Empire of the 1890s.255 Like Germany, cartels were initially viewed as inevitable and benign creatures, but unlike Germany Austrian law invalidated cartel agreements. In the 1890s, growing reports of aggressive, harmful conduct by cartels turned public opinion against them. In the 1895 election, two major political parties attacked cartels as exploiters of the people. In 1897 and 1898 the parties in power introduced legislation that required cartel registration and information-sharing; an office of civil servants would then distinguish beneficial from harmful cartels and if necessary invalidate or punish the offending conduct. The justification for this law was that cartels interfered with the process of competition, transferred wealth from consumers to cartel owners, concentrated power in the hands of a few, and reduced government excise taxes. Because of political turmoil this competition law was never voted upon in Austria, but it was an influential model for academic and parliamentary debates in Germany in the 1950s (ibid. p. 67). Public disenchantment with cartels also grew in Germany after 1900 (Gerber 1998: Chapter V). In 1908 and for several years thereafter the Reichstag requested a cartel office to be established, but delays by the bureaucracy and World War I intervened. The first European legislation to protect the competitive process from cartels was enacted in Germany in 1923. It was emergency legislation intended to address the nation’s hyperinflation, modeled after pre-World-War-I ideas. A small cartel court in the Ministry of Economics registered cartels, heard cases, and ordered corrections for abusive conduct until 1933, thereby creating a body of judicial decisions that had some influence outside Germany, most notably in laws passed in 1925 in Sweden and 1926 Norway. The Norwegian competition law was by all accounts highly effective, but had modest influence on further developments in Europe. Competition laws adopted in Czechoslovakia (1933), Poland (1933), Yugoslavia (1934), and the Netherlands (1935) were variations on the German model (Harding and Joshua 2003: 79). A meeting on antitrust issues was sponsored by the Interparliamentary Union at its 27th Conference in London in 1930.256 The Union regularly sponsored international conferences for members of various
255 The first European antitrust statute in modern times was France’s Loi Chapelier of 1891, which aimed to protect economic freedom by prohibiting members of the same industry from regulating conduct that served their “common interest” (Gerber 1998: 183-186). An 1810 criminal law, designed to combat hoarding during wartime, further made manipulating prices a serious violation. These laws were applied infrequently in the early 19th century and after that not at all. These laws were a legal dead end in France and had no influence outside France. 256 The Union was created in 1889, originally as a venue for individual parliamentarians to engage in conflict resolution. In 2009 it had 143 parliaments as members and observer status at the United Nations.
J. M. Connor Price-Fixing Overcharges 3rd Edition February 2014
159
national parliaments. This conference issued an unopposed resolution endorsing the enactment of strong national antitrust laws to protect the “public interest” and a set of ideas “… that was to be the core of the European competition law tradition for decades” (Gerber 1998: 161). Specifically, it recommended the establishment of an independent government entity to supervise cartels and have powers to prevent “harmful effects” and “abuses” arising from cartel conduct.257 This conference articulated a distinctly European model of competition law based upon the notion of abuse of market power that would continue to guide “…competition law thought and decisions more than half a century later” (ibid. p. 162). Following decisions made by the Allies at the Potsdam Conference of 1945, tough anticartel laws were adopted in the U.S. and British zones of occupation of Germany (Edwards 1966). In 1947 alone more than 1000 cartel agreements were voided, and the process accelerated in 1950 with criminal proceedings, cease-and-desist orders, and private suits in German courts seeking damages. As the Allied High Commission intended, these actions had considerable effects in industrial and legal circles in Germany, including the voluntary abandonment of many cartels (Wells 2002: 146-174). This program had the support of Economics Minister Ludwig Erhard, his Christian Democratic Party, and the Ordo-liberal school of law and economics that were to dominate German political and intellectual life in post-War Germany through at least the late 1960s (Gerber 1998: 270-277). In 1951, the responsibility for enforcing the 1947 decrees was transferred to the nascent German government, on condition that soon after sovereignty was restored in 1955 a new statute would be debated and enacted. There was a vigorous debate over more than 20 draft laws from 1952 to 1957 in the Bundestag, with the Ordo-liberals embattled by national industrial interests and their allied political parties. Germany’s competition law of 1957 is a hybrid of Ordo-Liberal ideas, U.S. antitrust law, and the earlier administrative-law concepts of European competition law (ibid. p. 276-277). The Federal Cartel Office is an independent administrative body whose decisions are appealable to regular German courts; the criminal law prohibits hard-core horizontal cartels, but allows exemptions for many other horizontal and vertical restraints. A second important development was also required by the Occupation Authority as a condition for the cessation of their direct control over the German steel industry, viz., the European Coal and Steel Community (ECSC) (Harding and Joshua 2003: 93-99). The 1951 ECSC Treaty prohibited cartel conduct and authorized the High Authority to impose fines for such conduct; the Authority’s decisions were not appealable to a court. The Treaty’s anticartel provisions were strongly influenced by American law advisors.258 The ECSC and Germany’s competition law are the two most important direct precedents for current EU antitrust rules. Early Cartel Research in North America Bullock (1901,1905), a professional economist and author of an early American economics textbook, wrote the first English-language survey of cartels and trusts in the social-science literature. After noting that there was a near absence of publications on the topic during 1890-1896, he finds an astonishing
257 Gerber (1998) speculates that the proposed commission structure was influenced by the 1923 German and 1920 and 1926 Norwegian competition laws. Norway’s law was probably the most effective in interwar Europe (ibid. pp. 156-158). Harding and Joshua (2003: 82) judge that the Norwegian law was major model for the Union resolution. 258 Edwards (1967: 246) claims that they were written in Washington, DC. Gerber (1998: 336-340) emphasizes that U.S. influence was hidden as much as possible; notes that drafts made by an American law professor were redrafted into a “European idiom” by a French civil servant; and speculates that the prohibition of cartels was accepted because of the Ordo-liberal orientation of the chief German negotiator.
J. M. Connor Price-Fixing Overcharges 3rd Edition February 2014
160
outpouring of 34 books and 48 serious articles in 1897-1900.259 Interest in the subject continued in the early 20th century, with most of the cartel literature from 1900 to 1940 appearing in books.260 Some of these works were written by historians and others by some of the earliest practitioners of the emerging field of industrial economics. Most of these studies contain little or no quantitative data. Bullock opines that the quantitative measurement of the market-price effects of cartels and trusts is not possible. Jeremiah W. Jenks was a political science professor at Cornell University in 1900 when the first of his five editions of The Trust Problem was published, though he had already been researching pools, trusts, and monopolies for 20 years by that time.261 Jenk’s 1888 study of the Michigan salt cartel seems to be the first economic study of cartels to appear in a peer-reviewed professional journal.262 His publications display a strong empirical bent and show a deep interest in gauging the economic effects of cartels. Unusual among academics of the time, his commitment to the study of trusts seems to have been cemented by his extensive work as an advisor for the U.S. Industrial Commission, which held a series of public hearings in 1898-1899 on conditions in several oligopolistic industries. Jenks‘ books (1900, 1901, 1903, 1917, 1929) contain carefully constructed series of wholesale prices for refined sugar, whiskey, wire nails, barbed wire, steel, and other products controlled by cartels or dominant firms. Among his analytical advances was the creation of coterminous price series for the principal inputs for the final products (corn for whiskey, steel for nails, etc.). By correcting for changes in product prices due to input prices, he was able to determine more precisely when and how strongly prices were affected by a cartel.263 Harvard University seems to have been the leading campus for economic and legal studies of cartels in the early 20th century.264 One indication of its preeminence is the publication of what is probably the first textbook on cartels, mergers, and monopolies in 1905.265 The revised edition is a huge (872 pages of
259 The books include a couple of government reports of investigations and proceedings of major conferences. Moreover, there was no sharp distinction between academic journals and serious pieces in intellectual magazines like The Atlantic Monthly at the time. Bullock includes one book written in French, but none of the large German literature. He seems unaware of the extensive bibliography in the report of the U.S. Industrial Commission (1901). 260 Among the earlier post-Bullock monographs in English with significant economic content are books by Liefmann (1897, 1932), Jenks (1900, 1907, 1911), Jenks and Clark (1917, 1929), Hirst (1905), Jones (1914, 1921), Levy (1927, 1968), Michels (1928), Seagar and Gulick (1929), Domeratsky (1928), Notz (1929), von Beckerath (1930), Piotrowski (1933), and Plummer (1934, 1951). Levy (1968), a careful historian, cites about 30 books on cartels and closely related subjects published before 1927, the great majority in German. 261 Jenks seems to be the originator of the cost-based method of calculating overcharges. The 1921 edition of Jenk’s book received a glowing review by a well known cartel economist (Dana 1922). The most complete biography of Jenks appears in Brown (2004). 262 The Salt Association was still operating successfully in 1888. Jenks judges that the Association had only four limited and brief upward effects on prices; as an exclusive marketing organization, it may have lowered the costs of transportation and selling in the upper Midwest. He does not calculate the cost benefits of this cartel relative to its damagingly higher prices. 263 McCrosty (1907) also wrote a book on the “trust problem” in the UK. While lively and impassioned on the subject, it is from an analytical perspective but a poor imitation of Jenk’s works. 264 Other economists with occasional interests in cartels worked at California, Columbia, Cornell, and Stanford universities. 265 Perhaps the most important U.S. study of cartels to appear in the 1930s was a long monograph on seven international cartels or dominant firms in markets for nonferrous metals: nickel, platinum, aluminum, tin, copper,

J. M. Connor Price-Fixing Overcharges 3rd Edition February 2014
161
small print) compilation of reprints from professional journals of law and economics, excerpts from briefs and court decisions, and legal commentary (Ripley 1916).266 Ripley aimed at applying the case-study method pioneered by Harvard Law School into advanced economics courses. The history of perhaps the first U.S. cartel, the marine cordage industry, was written at Harvard (Dewing 1913). Eliot Jones wrote a Ph.D. dissertation at Harvard University on several episodes from 1871 to 1914 of cartelization of the U.S. anthracite coal industry, the largest U.S. mineral industry of the early 20th century. His dissertation won a University prize and was published by Harvard University Press in 1914. Jones’ first book is for its time one of the best analyses of the economic history, market structure, collusive conduct, and price effects in any industry. It may be one of the first books to combine an empirical interest in industrial concentration with attention to the antitrust laws. In addition to detailed ownership and price data from industry trade sources, Jones had available testimony and exhibits from one of the early U.S. antitrust trials. This industry case study illustrated how a concentrated, technologically dynamic industry with extensive network economies, the railroads, could leverage its market power in transportation through backward vertical integration and collusion in the coal-mining industry; after the Sherman Act was passed, the railroads adopted new strategies (mergers, cross-ownership, and interlocking directorships) to maintain their market power in coal. Along with papers in the Quarterly Journal of Economics, his writings received extensive peer review that was unusual for the period. Jones’ interest in competition and antitrust laws was extended in his 1921 book. Jones was a contemporary of Jenks, but better versed in the still-emerging concepts of industrial-organization economics. Despite his evident interest in the price effects of cartels, in his second book quantitative data were presented on price effects for only three cartels. The 1870s were also a formative period for U.S. cartels. Seagar and Gulick (1929) trace the earliest documented U.S. pools to the East Coast cordage industry, which began making agreements on prices at least as early as 1861, but cordage manufacturers did not begin a formal association until 1878. The Michigan Salt Association, formed in January 1876, may be the first recorded formal U.S. cartel. Because of the high costs of transporting salt, an elaborate organizational structure, and the highly inelastic demand for salt, this cartel was successful in dominating the Midwest market for 25 years. Two lengthy reports from analysts in the U.S. Department of Commerce presage the triumph of the more precise German usage of the term cartel (Domeratsky 1928, Notz 1929) Notz (1929) accepts Liefmann’s classic definition of a private cartel: a voluntary association of two or more independent business organizations in the same line of business with the aim of increasing joint profits by controlling markets or reducing competition.267 Essential is an overt agreement to divide market territories, set or stabilize prices, limit or allocate industry supply, establish a common sales agency, pool intellectual property, or some combination of these five strategies. If the organizations are registered in at least two countries, then it is an international cartel. While the Department of Commerce reports are strong in detailing cartel membership and industry supply conditions, they have little to offer by way of price effects.
lead, and zinc (Elliott et al. 1937). This book was the result of a multiyear project by several economists working at Harvard University and Radcliff College. A different member of the project team authored each cartel study. 266 A similar book was edited by Curtis (1931). 267 Notz dwells on private cartels because compulsory cartels were mostly a phenomenon of the 1930s. However, he does briefly mention a phase of the German potash cartel that was nationalized during the Weimar Republic.

J. M. Connor Price-Fixing Overcharges 3rd Edition February 2014
162
Relatively few books were written about cartels in the 1930s, a period during which antitrust was in temporary eclipse in the United States. In this decade, cartels were often embraced because they were perceived as antidotes to the worldwide depression and, in some industries, deflation. Cartels took on distinctly political roles as tools of economic planning in Europe and Japan. Indeed, the Brookings Institution sponsored a series of books during this time to assist U.S. policy makers in implementing the National Recovery Act of 1933 (e.g., Pribram 1935). U.S. Supreme Court decisions quickly restored the antitrust laws by 1938 (Wells 2002). Around that time President Roosevelt and his advisors became apprised of the intimate connections between the principles of National Socialism and compulsory cartels in Germany in the 1930s. The Roosevelt administration henceforth rejected using cartels to foster economic recovery. Early Cartel Research in the Rest of the World Outside Europe and North America, publications about cartels are scarce. One very early book on Australian combinations and cartels is by Wilkinson (1914). This work was preceded by more than a decade of decisions by Royal Commissions and a 1906 federal antitrust law. It contains extensive case studies of Australian trusts in the sugar, tobacco, shipping, coal, food manufacturing, wire, nails, fertilizer, wood, brick, and printing industries. Price effects, profits, cost inflation, and entry conditions -- both horizontal and vertical -- are documented. Some of these trusts were true monopolies, others cartels. Wilkinson (1914: Chapter 4) shows how American Tobacco and British-American Tobacco formed a manufacturing cartel around 1903-1905 that extended control to distribution and importation; manufacturers’ accounting profits rose, and local Australian tobacco farmers saw prices decline and were told that the cartel would stop buying locally. Prices and wages rose as much as 129% after an interstate shipping cartel was formed (ibid. Chapter 5). While all these effects are consistent with effective cartelization, showing that they were causally related was beyond the ability of the author. Cartel Price Effects Although most books written prior to 1945 lacked empirical analyses of the market effects of cartels, a small number of U.S. economists268 published a few well documented case studies of price effects. Many were written during the heady times (1885-1920) during which state and federal antitrust laws were being debated and first enforced, though none of the authors of these works suggested that their approaches had forensic value.269 Among the most useful papers containing overcharges are Jenks (1888), Andrews (1889), Edgerton (1897), Hudson (1890), Walker (1906), Stevens (1912), and Tosdal (1916). Jenks’s study of the Michigan Salt Association of the 1880s is a classic example of a well researched history of the methods used by a mining cartel to control a market that incorporates substantial information on costs and prices.270 Edgerton’s (1897) paper on the U.S. Wire Nail Association is a superb analysis of the evolution, operation, and price effects of a short-lived but tightly structured, highly
268 Hirst (1905) and Allen (1923) were among the very few European writers to write about cartel price effects. 269 These years bracket what is generally called the Progressive Era in American history. Some historians limit the period to the beginning of the first T. Roosevelt administration in 1901 to the late Wilson administration ca. 1919. 270 Until World War I or later, the word “cartel” or Kartell was not in general use among Anglophone economists; Sayous (1902), a French economic historian, discusses 16th and 17th century cartels. Notz (1920, 1929) helped popularize the term in the United States.

J. M. Connor Price-Fixing Overcharges 3rd Edition February 2014
163
effective manufacturers’ cartel; his paper was written with the help of insider interviews just a year after the cartel dissolved. This study is notable because the conspiracy is the first U.S. work on a U.S.-based international conspiracy.271 Andrews (1889) drew upon contemporary business publications to recount what is quite possibly the world’s first global cartel, the infamously scandalous Secrétan copper syndicate of 1887-1889. Stevens’ 1912 study of the gunpowder trust is notable for focusing on what was believed to be the longest-running discovered cartel in the Nation’s history; Stevens carefully delineated three distinct phases of the cartel, and he drew upon the records of a 1911 antitrust trial to document the final episode. Tosdal (1916) and Walker (1906) provide competent analyses of the earlier episodes of two highly durable domestic German cartels, potash and steel, respectively; subsequent scholars have repeatedly returned to these cases. Ripley (1916) reprints a fascinating court decision of the U.S. enameled bathtub cartel, which used patent licenses on a new machine to achieve effective collusion. Allen’s (1923) account of the 18th century English copper-smelting cartel is the first quantitative assessment of cartel effectiveness by a European economist to appear in a peer-reviewed academic journal. The absence of cartel studies in professional journals in the 1920s and 1930s is striking.
271 The paper contains an intriguing hypothesis about the optimality of price fixing. The cartel’s organizers were well aware that most U.S. pools at the time were ephemeral because most manufacturing processes permitted quick entry, about six months in this industry. To discourage entry, the perpetrators consciously decided to raise prices higher than the monopoly level within a few months. They reasoned that potential entrants would view such unsustainable prices as evidence that the members were irrational and that the pool would quickly crash before the outsiders could start production. This information-obfuscation tactic worked because large-scale entry was thwarted for a year, which allowed the cartel to operate successfully for 19 months, about 12 months longer than if a more moderate pricing policy had been adopted.

J. M. Connor Price-Fixing Overcharges 3rd Edition February 2014
164
DATA APPENDIX TABLES* * Professor Robert H. Lande was initially responsible for preparing the material on overcharges from antitrust verdicts in U.S. courts up to about 2004. Jeff Zimmerman, David Ubilava, and Yuliya Bolotova were of great assistance in doing data crosschecks and in rechecking the tables summarizing the social-science overcharges.
Appendix Table 1. Alphabetic List of Cartelized Markets
Cartel Market Name Code No.
Characteristics
Interna- Loca- tional tion a
Bid Rig-ging
Found Guilty and Penalized or Liable for Civil Penalties (Blank cell means “legal”) b
Acrylic Glass/MMA and PMMA 343 X GLOBAL EU fines, US civil suit Aggregate (crushed stone), Sao Paulo, BR 424 X BR X Fined by Brazil Air cargo 345 X GLOBAL US, EU, AU, KR, UK fines Air passengers, US-Korea 348 X GLOBAL US fines Air passengers, US-UK 347 X GLOBAL US fines Air route, Latvia (LV) 425 X Latvia Fined by Latvia Air Routes, Brazil 325 BR Fined by CADE Air Routes, Danish 235 X EUR EC fines Air Routes, Hawaii 294 US Legal Airline ticket commissions, US 354 US US civil suit settlement Airlines, passenger, Indonesia 426 X ID Fined by Indonesia Airlines, US passenger 172 US Almonds, US and export 205 US Legal cartel Aluminum foil, JP 276 X JP JFTC probe Aluminum phosphide, US 82 US U.S. guilty pleas Aluminum, metal (1990s) 199 X GLOBAL Aluminum, metal (interwar & earlier) 18 X EUR U.S. consent decree Anti-anxiety drugs, US 370 US US FTC fines Asphalt paving, Alabama, US 204 US X US settlement Asphalt paving, Finland 419 X FI X Fined by Finland Asphalt paving, Oklahoma, US 7 US X Jury trial decision Asphalt paving, Seine-Maritime, FR 305 FR X FR fines Asphalt paving, Suffolk County, New York 328 US X Guilty pleas Asphalt paving, Sweden 331 X SE X SE fines Auction houses, fine art 42 X US+UK U.S. pleas, EU fines Auction, UK Antique 416 UK X Legal Auctions, houses in DC, US 53 US X U.S. trial Auctions, used police cars, NY City 52 US X Civil settlement Auto repair, Ft. Erie, Canada 420 CA Fined by Canada Automobile manufacture, US 25 US Listed below, but not a cartel Automobile testing equipment, JP 308 X JP X JFTC sanctions Automobiles, Canadian imports, US 427 X US&CA Damages paid in US Automotive refinishing paint, US 403 X US US Private settlement
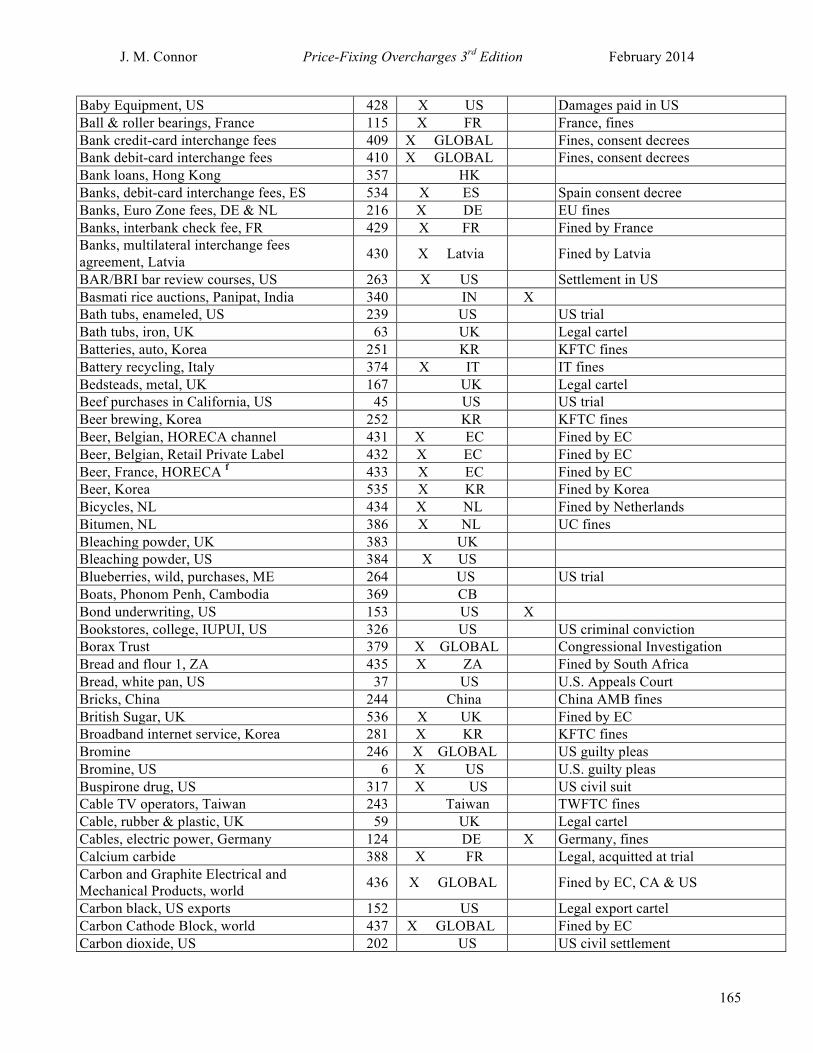
J. M. Connor Price-Fixing Overcharges 3rd Edition February 2014
165
Baby Equipment, US 428 X US Damages paid in US Ball & roller bearings, France 115 X FR France, fines Bank credit-card interchange fees 409 X GLOBAL Fines, consent decrees Bank debit-card interchange fees 410 X GLOBAL Fines, consent decrees Bank loans, Hong Kong 357 HK Banks, debit-card interchange fees, ES 534 X ES Spain consent decree Banks, Euro Zone fees, DE & NL 216 X DE EU fines Banks, interbank check fee, FR 429 X FR Fined by France Banks, multilateral interchange fees agreement, Latvia 430 X Latvia Fined by Latvia
BAR/BRI bar review courses, US 263 X US Settlement in US Basmati rice auctions, Panipat, India 340 IN X Bath tubs, enameled, US 239 US US trial Bath tubs, iron, UK 63 UK Legal cartel Batteries, auto, Korea 251 KR KFTC fines Battery recycling, Italy 374 X IT IT fines Bedsteads, metal, UK 167 UK Legal cartel Beef purchases in California, US 45 US US trial Beer brewing, Korea 252 KR KFTC fines Beer, Belgian, HORECA channel 431 X EC Fined by EC Beer, Belgian, Retail Private Label 432 X EC Fined by EC Beer, France, HORECA f 433 X EC Fined by EC Beer, Korea 535 X KR Fined by Korea Bicycles, NL 434 X NL Fined by Netherlands Bitumen, NL 386 X NL UC fines Bleaching powder, UK 383 UK Bleaching powder, US 384 X US Blueberries, wild, purchases, ME 264 US US trial Boats, Phonom Penh, Cambodia 369 CB Bond underwriting, US 153 US X Bookstores, college, IUPUI, US 326 US US criminal conviction Borax Trust 379 X GLOBAL Congressional Investigation Bread and flour 1, ZA 435 X ZA Fined by South Africa Bread, white pan, US 37 US U.S. Appeals Court Bricks, China 244 China China AMB fines British Sugar, UK 536 X UK Fined by EC Broadband internet service, Korea 281 X KR KFTC fines Bromine 246 X GLOBAL US guilty pleas Bromine, US 6 X US U.S. guilty pleas Buspirone drug, US 317 X US US civil suit Cable TV operators, Taiwan 243 Taiwan TWFTC fines Cable, rubber & plastic, UK 59 UK Legal cartel Cables, electric power, Germany 124 DE X Germany, fines Calcium carbide 388 X FR Legal, acquitted at trial Carbon and Graphite Electrical and Mechanical Products, world 436 X GLOBAL Fined by EC, CA & US
Carbon black, US exports 152 US Legal export cartel Carbon Cathode Block, world 437 X GLOBAL Fined by EC Carbon dioxide, US 202 US US civil settlement

J. M. Connor Price-Fixing Overcharges 3rd Edition February 2014
166
Carbon fiber, US 198 US US investigation Carbon, arc lighting, US 188 US Legal cartel Cardboard boxes, AU + NZ 438 X AU&NZ X Fined by AU & NZ Cardizem CD hypertension medicine, US 203 X US US FTC and civil trial Carpets, polypropylene US 319 US US fine Carpets, polypropylene, US 224 US US trial Carpets, woven, UK 62 UK Legal cartel Carton board, EU 39 X EUR EU fines Cartons, corrugated, US 142 US US trials Cathode ray tubes (see electronic radio & TV tubes)
Cattle procurement, fed, US 271 US X Jury trial Cell phones (see telephone) Cement 1, Pakistan 439 X PK X Fined by Pakistan Cement, Aegean region, Turkey 314 TR Turkey fines Cement, Brazil 353 X BR Cement, Corsica, France 339 FR France fines Cement, Egypt 327 EG Cement, Germany 106 X DE X Germany, fines Cement, importation, Taiwan 441 X TW X Fined by Taiwan Cement, India 415 X IN X India, CCI fines Cement, Jalalpur, India 363 X IN X India, consent decree Cement, Norway 212 NO Legal cartel Cement, Pakistan 358 PK Restitution requested by Govt Cement, Poland 440 X PO X Fined by Poland Cement, Romania 277 X RO X Romania fines Cement, South Africa 70 ZA X Cement, Turkey 329 TU Turkey fines Chicken, Peru 393 PE Fined by Peru authorities Chicken, US 144 US US trial & decree Chocolate candy 372 X GLOBAL U.S. damages suit Choline chloride (Vitamin B4) 81 X GLOBAL US jury trial Cigarettes, U.S. 26 US Cipro, Pay-for-Delay, US 537 X US Private Calif. suit still undecided Circuit plates, copper-plated phenolic paper laminate, JP 538 X JP Fined by JFTC
Citric acid 76 X GLOBAL U.S. pleas, EU fines Coal, anthracite, eastern US 160 US US trial Coal, black, Australia 179 AU Coal, interwar, UK 324 UK Legal cartel Coal, Newcastle, England 166 UK Parliamentary inquiries Coal, Nord-Pas-de-Calais, FR 323 FR Legal cartel Coal, Ruhr, Germany 155 DE Legal cartel Coconut oil, Philippines 206 PL Legal cartel Coffee, Hungary 248 X HU Hungary, fines Coffee, roasted, Germany 394 X DE German fines Coke, Europe 147 X EUR Legal export cartel Compact discs, prerecorded, US 444 X US Fined by US FTC Compressors, refrigeration, BR 445 X GLOBAL X Fined by US & EC

J. M. Connor Price-Fixing Overcharges 3rd Edition February 2014
167
Concrete poles, electric power, PK 446 X PK X Fined by Pakistan Concrete, Denmark 51 DK X Concrete, precast pipes, culverts, manholes, & sleepers, ZA 447 X ZA X Fined by South Africa
Concrete, ready mix, Germany 114 X DE X Germany, fines Concrete, ready mix, Northwest Iowa, US 448 X US X Fined by US Concrete, ready-mix, central Indiana, US 449 X US X Fined by US Construction & other industries, US 196 US X US convictions Construction & procurement, JP 213 JP X JFTC actions Construction machinery mfg., Korea 278 X KO Korea FTC fines Construction of athletic tracks, NL 450 X NL X Fined by Netherlands Construction projects, Korea 32 KO X Korea, fines Construction, agric. engineering projects, JP 305 X JP JFTC sanctions Construction, buildings, Germany 174 DE X Germany fines Construction, buildings, NL 539 X NL Fined by Netherlands Construction, buildings, UK 540 X NL Fined by UK Construction, civil engineering projects, NL 108 X NL X Netherlands, fines Construction, concrete, NY, US 261 US X US trial Construction, D-1 Highway, Slovakia (SK) 453 X SK X Fined by Slovakia Construction, electric wiring contractors, DK 122 DK X Denmark, fines Construction, electrical, France 175 FR X France consent decree Construction, heavy-lift marine, global 541 X GLOBAL Fined by US Construction, Hibernia oil platform, CA 454 X CA X Fined by Canada Construction, installation engineering, NL 455 X NL X Fined by Netherlands Construction, kitchen, Japan 163 JP X Japan trial Construction, landscaping, NL 456 X NL X Fined by Netherlands Construction, Natl. Library façade, CH 312 CH X Swiss fines Construction, Normandy Bridge, France 247 FR X French fines Construction, Norway 107 X NO X Norway, probe Construction, pipes & cables, NL 458 X NL X Fined by Netherlands Construction, public bridge project, Norway 542 X NO Fined by Norway Construction, public bridges, JP 322 JP X JFTC and High Court fines Construction, public works 4, France 459 X FR X Fined by France Construction, public works 8, Meuse, France 460 X FR X Fined by France Construction, public works 9, asphalt, Seine-Maritime, FR 461 X FR X Fined by France
Construction, public, Japan 161 JP X A few civil actions Construction, roads, Colorado, US 222 US X US trial Construction, roads, Florida, US 1 US X Trials, settlements Construction, roads, France 177 FR X France consent decree Construction, roads, Germany 123 DE X Germany, fines Construction, roads, Korea 193 KO X Korea FTC fines Construction, roads, NY, US 260 US X US trial Construction, roads, SD & NC, US 34 US X Trials, settlements Construction, roads, seal coating, US 211 US X Construction, roads, Spain 407 ES X Spanish fines Construction, roads, US 195 US X Trials, settlements Construction, school bldg., China 245 China X China AMB fine Construction, schools, 4 towns, France 342 FR X Fines, France

J. M. Connor Price-Fixing Overcharges 3rd Edition February 2014
168
Construction, sewers, Lithuania 368 LT X Commission decision Construction, sewers, US 33 US X Trial Construction, SRO, Netherlands 463 X EU X Fined by EC Construction, tendered, SRO, NL 290 NL X EC fines Construction, university, France 176 FR X France consent decree Construction, US Navy shipyard, Japan 162 JP X JFTC fines Construction, wastewater, USAID in Egypt 101 X Egypt X U.S. trial, conviction Construction: see also asphalt Copper concentrate 88 X GLOBAL US, EU Probes Copper metal 1 22 X US/GLOBAL Copper, London Metal Exchange 418 X GLOBAL US, UK, JP penalties Copper smelters, UK 225 UK X Copper tubes & fittings, EU 395 X EU EU fines Copper, London Metal Exchange 418 X GLOBAL Corn Glucose Syrup, US 466 X US X Damages paid to direct buyer Corn Syrup, high fructose, US 414 US Private US settlement Currency conversion fees, charge cards, US 467 X US Damages paid to US cardholders Dairy processing, US 54 US US consent decree Defense Department procurement, US 367 US X Detergent manufacturing, KR 469 X KR Fined by So. Korea Detergent, laundry, FR 470 X FR Fined by France Diabetes testing strips, PT 330 X PT X PT fines Diamonds, gem, So. Africa 71 X ZA Legal cartel Diamonds, Industrial 543 X GLOBAL Settlement in US Distribution, bananas, 8 northern EU states 472 X EU Fined by EC Distribution, drugs, ZA 364 X ZA X ZA authority report Distribution, food, New York City 366 US X US convictions Distributors, natural gas, TW 229 TW TFTC fines DRAMs (memory chips) 292 X GLOBAL US guilty pleas Dredging, river, Japan 164 JP X Japan trial Driver training, Graz, Austria 552 AT Austria fines and appeal Drug-gang cartel, local US 373 US Never penalized Drugs (also see pharmaceuticals) Drugs, generic, UK 105 X UK X UK probe, civil restitution DVD, "3C" technology Patent Pool, world 473 X GLOBAL Fined by Taiwan FTC Dyestuffs, synthetic 159 X EUR Legal cartel E-Rate federal Internet program, 8 states 485 X US X Fined by US Education, bar review prep., GA 263 US US trial Electric hydro-power equipment, NO 116 X NO X Norway, fines Electric light bulbs 21 X EUR Electric light bulbs, UK 184 UK UK Commission Electric light bulbs, US 189 US Electric meters, UK 61 UK X Legal cartel Electric motors, UK 60 UK Legal cartel Electric pipes, Israel 249 IL Israel court fines, prison Electric power equipment, global 129 X GLOBAL X US conviction Electric power equipment, Japan 273 JP X Electric power equipment, U.S. 48 US X US pleas, settlements Electric power equipment, UK 183 UK X UK Commission

J. M. Connor Price-Fixing Overcharges 3rd Edition February 2014
169
Electrical subcontracting, GA, US 267 US X US trial
Electricity and gas utilities, US 474 X US US obtained mandatory Restitution from a federal court
Electricity, green certificates, BE 475 X BE Case undecided Electronic books, US 550 X US U.S. trial Electronic radio & TV tubes, UK 192 X UK UK Commission Elevators & escalators in Belgium 476 X BE X Fined by EC Elevators & escalators in Canada 530 X GLOBAL X No fine in Canada, but by EC Elevators & escalators in US 531 X GLOBAL X No US fine, but by EC Elevators & escalators, world 532 X GLOBAL X Fined by EC and EU NCAs Elevators and escalators in Austria 477 X AT X Fined by Austria Elevators and escalators in Germany 479 X DE X Fined by EC Elevators and escalators in Korea 482 X KR X Fined by So. Korea Elevators and escalators in Luxembourg 480 X LU X Fined by EC Elevators and escalators in Netherlands 481 X NL X Fined by EC EPDM synthetic rubber, world 483 X GLOBAL US buyers got damages Eurocheque commissions, EU 289 X EU EC fines Explosives, US 98 X US X U.S. guilty pleas Ferrosilicon, US 100 X US U.S. pleas Ferry services, English Channel 41 X EUR EU, fines Fertilizer (see nitrogen, phosphate, potash) Fire protection installation, AU 121 AU Australia, fines Flour imports, Taiwan 220 TW TW FTC fines Flour milling, KR 332 KR KFTC fines Football replica kits, UK 311 UK UK OFT fines Forklift trucks mfg., Korea 279 X KR Korea FTC fines Frozen fish procurement, US 36 US X US guilty pleas Frozen foods, Australia 120 AU Australia, fines Fuels, military, Korea 112 X KR X Korea, fines Futures contract, ME potatoes, US 266 US US trial Garbage collection, NY & NJ 233 US X NYC convictions Gas, liquid propane, Israel 349 IL Israel guilty pleas Gas, liquid propane, Mexico 253 MX Mexican FCC fine Gas, liquid propane, Taiwan 242 Taiwan TWFTC fines Gas, natural, distribution, Taiwan 221 Taiwan Taiwan FTC fines Gasoline, diesel, & kerosene, Korea 337 X GLOBAL Korea, fines Gasoline, retail, Florianopolis, Brazil 360 BR Fined, Brazil Gasoline, retail, France 110 X FR France, fines Gasoline, retail, Italy 109 X IT Italy, fines Gasoline, retail, Sherbrooke, Canada 391 Canada Canada federal fines Gasoline, retail, Sweden 111 X SE Swedish court, fines Gasses, compressed, Canada 102 X CA X Canada, fines Gasses, compressed, NL 274 X NL EU fines Gasses, industrial, JP 477 X JP Fined by JFTC Glass, flat, Benelux 237 X EUR EU fines Glass, flat, Korea 381 KR KFTC fines Glass, flat, US 113 X US US settlement Glass, window, US 380 US Legal Grain, wholesale merchants, Athens 414 GR X Convicted at trial 326BC

J. M. Connor Price-Fixing Overcharges 3rd Edition February 2014
170
Graphite electrodes 84 X GLOBAL US, CA, EU, KR fines Graphite, isostatic 351 X GLOBAL EU fines Gunpowder, US 158 US First episode legal Gymnasium seats, folding, US 2 US X US settlements Gypsum wallboard, US 269 US US trial Harbor loading services, Taiwan 240 TW TWFTC fines Hardwood, US 284 US US trial High fructose corn syrup, US 197 US US settlements Hotel association, Spain 125 ES Spain, fines Hotels, luxury, Paris, FR 305 FR France fines Hydro-Electric power equipment, NO 478 X NO X Fined by Norway Hydrogen peroxide, EU 397 X GLOBAL UC fines Ice cream manufacture, Korea 338 KR KFTC fines Infant & baby formulas, Italy 286 X IT IT fines (twice) Insecticide, forest, Canada 83 X CA X Canada pleas Insurance brokers’ fees, US & UK 336 X GLOBAL X US settlements Insurance, auto, Italy 551 X IT IT fines Insurance, auto, Korea 250 KR KFTC fine Insurance, Auto, Vietnam 478 X VN Fined by Vietnam Insurance, industrial property, Germany 479 X DE Fined by Germany Iodine 40 X EUR Legal export cartel Iron & steel rolls, cast, EU 227 X EUR X EU fines Jute textile, U.S. 344 US Legal Jute yarn and bags, India 359 IN Legal Lamp oil (Kerosene), U.S. 375 US Legal Land surveys, Edmonton, Canada 421 CA Fined by Canada LCDs, TFT Type, sold to Apple 489 X GLOBAL X Apple received damages LCDs, TFT Type, sold to Dell 490 X GLOBAL X Dell received damages LCDs, TFT Type, sold to Motorola 491 X GLOBAL X Motorola received damages Lead 69 X GLOBAL Legal export cartel Lease oil fees for landowners, US 355 US US civil settlement Legal aid fees, DC, US 256 US US trial Lemons, California 210 US Legal cartel Linerboard, US 201 US US civil settlement Linoleum exports 137 X EUR Legal export cartel Linoleum, UK 180 UK UK Commission Lipitor, "Pay-for-delay," US 493 X US Civil suit undecided Liquid Crystal Display panels (LCDs) 411 X GLOBAL X US jury trial Liquor, retail, TX, US 258 US US trial Lysine 75 X GLOBAL US pleas, EU fines Magnesite 94 X EUR US prosecution Magnesium metal 28 X US US pleas, fines Manufacturing basic materials, JP 214 JP JFTC actions Manufacturing, Sweden 303 SE Legal cartels Manufacturing, U.S. 38 US US pleas, fines Manufacturing, UK 55 UK Legal cartels Manufacturing, W. Germany 304 DE Legal “rationalization” cartels Marine hose, global 398 X GLOBAL X EC fines Market makers, NASDAQ, US 31 US U.S. settlements

J. M. Connor Price-Fixing Overcharges 3rd Edition February 2014
171
MCAA (monochloroacetic acid) 385 GLOBAL US, EU fines Mercury 72 X EUR Legal cartel Methionine 78 X GLOBAL EU fines, US settlements Methyl glucamine 85 X GLOBAL EC, Canada fines Methyl methacrylate (see Acrylic) Microcrystalline cellulose (MCC) 356 X GLOBAL US FTC consent decree Milk, mfg., 2 counties, Florida 10 US X U.S. state convictions Milk, mfg., 3 counties, Florida 11 US X U.S. state convictions Milk, mfg., 3 counties, Kentucky 9 US X U.S. state convictions Milk, mfg., AMPI cooperative 226 US U.S. trial Milk, mfg., Cincinnati, Ohio 30 US X U.S. trial Milk, mfg., core area, Kentucky 14 US X U.S. state convictions Milk, mfg., Dallas, Texas 19 US X U.S. settlement Milk, mfg., Danville, Kentucky 12 US X U.S. state convictions Milk, mfg., North Texas 262 US US trial Milk, mfg., Owensboro, KY 13 US X U.S. state convictions Milk, mfg., Southeastern U.S. 15 US X U.S. state convictions Milk, U.S. marketing orders 207 US Legal cartel Mobile phone fees 1, Netherlands 533 X NL Fined by Netherlands Mobile phone operators in FR 494 X FR Fined by France Mobile phone service, IT 495 X IT Investigation in progress Mobile phone service, PK 496 X PK Investigation in progress Mobile/cell phones (see telephone) Motors, large-medium industrial, KR 497 X KR Fined by Korea Movie distributors, ES 544 X ES Fined by Spaon Movie rentals, first run, MN, US 259 US US trial Movie tickets, KR 499 X KR Fined by Korea Moving and storage services, (intl. freight forwarding), DE-US 500 X GLOBAL X Fined by DE and US
MSG and Nucleotides (IMP, GMP), world 501 X GLOBAL Fined by CA, EC & US Municipal Bond Derivatives, US 545 X US X Fined by US Mushrooms, canned, Germany 230 X GLOBAL EC fines Nails, Germany 186 DE Legal cartel NASDAQ (see Securities, NASDAQ) Natural gas pipeline bid to Calif. 316 US X Civil US settlement Nitrogen (sodium nitrate) fertilizer 16 X GLOBAL Legal cartel Nitrogen, nitrate, ammonium sulfate for fertilizer, Chile 217 Chile Legal cartel
Nonferrous metals, UK 181 UK UK Commission Oil (see petroleum) Oranges, California navel 209 US Legal cartel Paints, export, Japan 157 JP Legal cartel Paper pulp, bleached sulphate 228 X GLOBAL EC fines Paper pulp, mechanical sulfite 138 X EUR Paper, Adhesive label Stock, US & CA 503 X US US settlement approved Paper, carbonless, EEC/EU 89 X EUR EC fines Paper, copy paper imports, KR 465 X KR Fined by South Korea Paper, newsprint, CA 302 CA Legal cartel Paper, thermal fax, US 99 X US U.S. pleas & trial
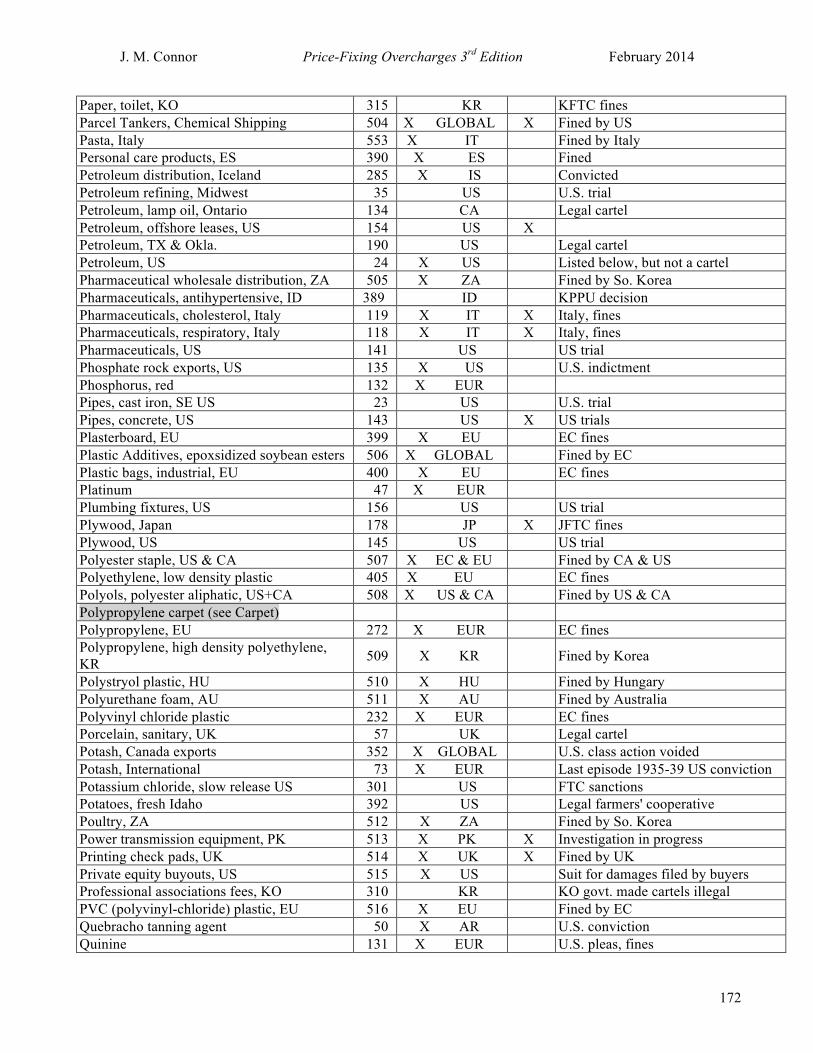
J. M. Connor Price-Fixing Overcharges 3rd Edition February 2014
172
Paper, toilet, KO 315 KR KFTC fines Parcel Tankers, Chemical Shipping 504 X GLOBAL X Fined by US Pasta, Italy 553 X IT Fined by Italy Personal care products, ES 390 X ES Fined Petroleum distribution, Iceland 285 X IS Convicted Petroleum refining, Midwest 35 US U.S. trial Petroleum, lamp oil, Ontario 134 CA Legal cartel Petroleum, offshore leases, US 154 US X Petroleum, TX & Okla. 190 US Legal cartel Petroleum, US 24 X US Listed below, but not a cartel Pharmaceutical wholesale distribution, ZA 505 X ZA Fined by So. Korea Pharmaceuticals, antihypertensive, ID 389 ID KPPU decision Pharmaceuticals, cholesterol, Italy 119 X IT X Italy, fines Pharmaceuticals, respiratory, Italy 118 X IT X Italy, fines Pharmaceuticals, US 141 US US trial Phosphate rock exports, US 135 X US U.S. indictment Phosphorus, red 132 X EUR Pipes, cast iron, SE US 23 US U.S. trial Pipes, concrete, US 143 US X US trials Plasterboard, EU 399 X EU EC fines Plastic Additives, epoxsidized soybean esters 506 X GLOBAL Fined by EC Plastic bags, industrial, EU 400 X EU EC fines Platinum 47 X EUR Plumbing fixtures, US 156 US US trial Plywood, Japan 178 JP X JFTC fines Plywood, US 145 US US trial Polyester staple, US & CA 507 X EC & EU Fined by CA & US Polyethylene, low density plastic 405 X EU EC fines Polyols, polyester aliphatic, US+CA 508 X US & CA Fined by US & CA Polypropylene carpet (see Carpet) Polypropylene, EU 272 X EUR EC fines Polypropylene, high density polyethylene, KR 509 X KR Fined by Korea
Polystryol plastic, HU 510 X HU Fined by Hungary Polyurethane foam, AU 511 X AU Fined by Australia Polyvinyl chloride plastic 232 X EUR EC fines Porcelain, sanitary, UK 57 UK Legal cartel Potash, Canada exports 352 X GLOBAL U.S. class action voided Potash, International 73 X EUR Last episode 1935-39 US conviction Potassium chloride, slow release US 301 US FTC sanctions Potatoes, fresh Idaho 392 US Legal farmers' cooperative Poultry, ZA 512 X ZA Fined by So. Korea Power transmission equipment, PK 513 X PK X Investigation in progress Printing check pads, UK 514 X UK X Fined by UK Private equity buyouts, US 515 X US Suit for damages filed by buyers Professional associations fees, KO 310 KR KO govt. made cartels illegal PVC (polyvinyl-chloride) plastic, EU 516 X EU Fined by EC Quebracho tanning agent 50 X AR U.S. conviction Quinine 131 X EUR U.S. pleas, fines

J. M. Connor Price-Fixing Overcharges 3rd Edition February 2014
173
Radium 300 X GLOBAL Legal cartel Railroad, Chicago to East, US 49 US Legal U.S. cartel Railroad, U.S. South 133 US Legal U.S. cartel Raisins, US 208 US Legal US cartel Rare books auction, bidding ring, UK 291 UK X Raw materials, Germany 350 DE Legal Rayon (Artificial Silk) 136 X EUR Real estate auction, Wash. DC, US 334 US X Guilty at trial Realtors’ listing service, CA, US 257 US US trial Realtors’ sales commissions, MD 268 US US trial Rock Salt, northern Ohio 417 X US X State damages suit Rock salt, northern US 3 US X U.S. convictions Roof tiles (clay), DE 518 X DE Fined by Germany Roofing felt, Belgium 219 BE EU fines Roundwood (logs) buying, Sweden 236 SE X Rubber, crude 20 X EUR Legal export cartel Rubber, nitrile synthetic 401 X GLOBAL U.S. guilty pleas, EC fines Rubber, polychloroprene synthetic 293 X GLOBAL U.S. guilty pleas, EC fines Rubbers, two synthetic, EU (293+401) 402 X EU EC fines Salt, Michigan 194 US Salt, PT 519 X PT Fined by Portugal Salt, white, duopoly, UK 215 UK Commission decision Salt, white, Salt Union, UK 168 UK Legal cartel Scholarships, graduate, US 173 US DOJ consent decree School books in Indonesia, IBRD 520 X ID X Bidders Banned by World Bank School uniforms, KO 309 KR KFTC fines Securities, NASDAQ exchange, US 318 X US US civil suit Shipping (marine frieght lines) US-Puerto Rico 521 X US Fined by US
Shipping TACA (Trans-Atlantic Conference Agreement) 522 X GLOBAL Fined by EC
Shipping-agent services, PT 333 PT PCA fine Shipping, chemical parcel tankers 86 X GLOBAL X U.S. convictions Shipping, Europe-Australia wheat 404 X GLOBAL Legal Shipping, express packages, US 127 US Legal U.S. cartel Shipping, Maritime, 3 UK conferences 171 X EUR Legal cartels Shipping, Maritime, EATA Conference 287 X GLOBAL EC consent decree Shipping, Maritime, France-Africa 43 X EUR EU fines Shipping, Maritime, US Imports 412 X US Legal cartels Sodium chlorate 79 X EUR Soft drink bottling, KR 523 X KR Fined by Korea Soft drinks, US 27 US Soil & gravel, Japan 165 JP X JFTC warning? Sorbates 77 X GLOBAL US and EU fines Stamp auctions, bidding ring 371 X GLOBAL X US fines1 Steel and iron, Germany 238 DE Legal cartel Steel beams (structural steel), EU 524 X EU Fined by EC Steel drums, UK 64 UK Legal UK cartel

J. M. Connor Price-Fixing Overcharges 3rd Edition February 2014
174
Steel girders, Germany 187 DE Legal cartel Steel pipes, insulated, EU 93 X EUR EU fines Steel pipes, sewage, UK 58 UK Legal UK cartel Steel rails, Europe 169 X EUR Legal cartel Steel rails, US 150 US First episode legal Steel tubes, US 151 US Legal cartel Steel, bulk metal, European 74 X EUR Legal cartel Steel, flat rolled 218 X GLOBAL Steel, flat rolled, Brazil 361 BR Brazil (CADE) fines Steel, flat stainless, EU 92 X EUR EU fines Steel, flat, ZA 525 X KR Fined by EC Steel, integrated, Japan 270 JP Government-tolerated Steel, merchant bars, France 297 FR Legal cartel Steel, pipes, specialty, US 320 X US X US fines Steel, road culverts, US 254 US X US trial Steel, seamless tubes, EU 91 X EUR EU fines Steel, semi-finished, France 295 FR Legal cartel Steel, structural, bridges, US 5 US X U.S. convictions Steel, structural, buildings, US 4 US X U.S. convictions Steel, structural, EU 95 X EUR EU fines Steel, structural, France 296 FR Legal cartel Steel, thick plates, France 298 FR Legal cartel Steel, thin sheets, France 299 FR Legal cartel Sugar beets procurement, US 44 US U.S. trial Sugar refining, Korea 365 KR KFTC fines Sugar refining, UK 96 UK EU, fines Sugar refining, US 67 US U.S. trial Sugar, cane 17 X GLOBAL Legal export cartel Sugar, Spain 126 ES Spain, fines Sulfur 87 X GLOBAL Sulfur, crude, US exports 191 US Legal export cartel Sulfuric acid, US & Canada 103 X US+CA DOJ probe Switchgear, gas-insulated, EU 396 X GLOBAL EU fines Taxi service, Lithuania 313 LI Lithuania fines Tea 128 X EUR Legal cartel Telephone fees, Indonesia 382 X ID KPPU fines Telephone fees, international, Korea 283 X KR KFTC fines Telephone fees, Italy 117 X IT Italy, fines Telephone fees, local service, Korea 280 X KR KFTC fines Telephone fees, long distance, Korea 282 X KR KFTC fines Telephone fees, long distance, Philippines-US 546 X PL Abandoned because of comity
Telephone fees, UK & Germany 97 X IT EC probe Telephone service, home, NY City ca. 1908 423 US Legal Terazosin hydrochloride drug, US 322 X US US civil suit Tetracycline, US 223 US Civil settlement Text message service (SMS), ID 526 X ID Fined by Indonesia Thorium nitrate, Germany 170 DE Legal cartel Thread, surgical, Taiwan 241 X Taiwan X TWFTC fines
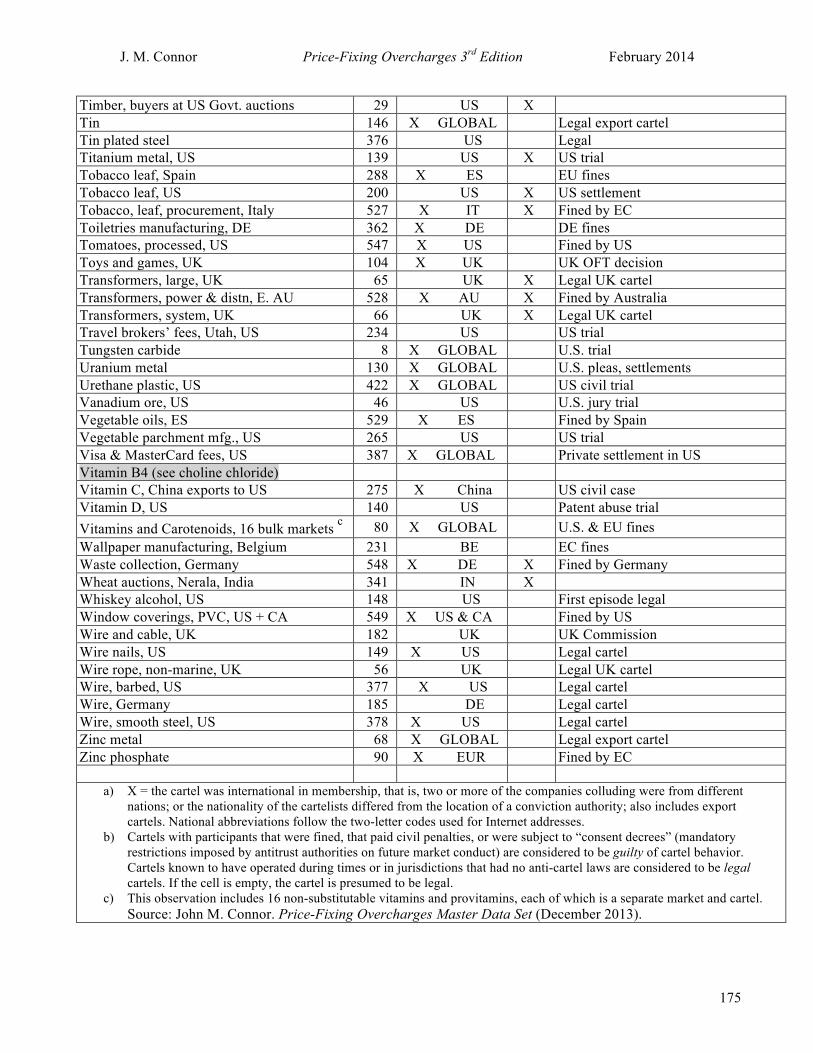
J. M. Connor Price-Fixing Overcharges 3rd Edition February 2014
175
Timber, buyers at US Govt. auctions 29 US X Tin 146 X GLOBAL Legal export cartel Tin plated steel 376 US Legal Titanium metal, US 139 US X US trial Tobacco leaf, Spain 288 X ES EU fines Tobacco leaf, US 200 US X US settlement Tobacco, leaf, procurement, Italy 527 X IT X Fined by EC Toiletries manufacturing, DE 362 X DE DE fines Tomatoes, processed, US 547 X US Fined by US Toys and games, UK 104 X UK UK OFT decision Transformers, large, UK 65 UK X Legal UK cartel Transformers, power & distn, E. AU 528 X AU X Fined by Australia Transformers, system, UK 66 UK X Legal UK cartel Travel brokers’ fees, Utah, US 234 US US trial Tungsten carbide 8 X GLOBAL U.S. trial Uranium metal 130 X GLOBAL U.S. pleas, settlements Urethane plastic, US 422 X GLOBAL US civil trial Vanadium ore, US 46 US U.S. jury trial Vegetable oils, ES 529 X ES Fined by Spain Vegetable parchment mfg., US 265 US US trial Visa & MasterCard fees, US 387 X GLOBAL Private settlement in US Vitamin B4 (see choline chloride) Vitamin C, China exports to US 275 X China US civil case Vitamin D, US 140 US Patent abuse trial Vitamins and Carotenoids, 16 bulk markets c 80 X GLOBAL U.S. & EU fines Wallpaper manufacturing, Belgium 231 BE EC fines Waste collection, Germany 548 X DE X Fined by Germany Wheat auctions, Nerala, India 341 IN X Whiskey alcohol, US 148 US First episode legal Window coverings, PVC, US + CA 549 X US & CA Fined by US Wire and cable, UK 182 UK UK Commission Wire nails, US 149 X US Legal cartel Wire rope, non-marine, UK 56 UK Legal UK cartel Wire, barbed, US 377 X US Legal cartel Wire, Germany 185 DE Legal cartel Wire, smooth steel, US 378 X US Legal cartel Zinc metal 68 X GLOBAL Legal export cartel Zinc phosphate 90 X EUR Fined by EC
a) X = the cartel was international in membership, that is, two or more of the companies colluding were from different nations; or the nationality of the cartelists differed from the location of a conviction authority; also includes export cartels. National abbreviations follow the two-letter codes used for Internet addresses.
b) Cartels with participants that were fined, that paid civil penalties, or were subject to “consent decrees” (mandatory restrictions imposed by antitrust authorities on future market conduct) are considered to be guilty of cartel behavior. Cartels known to have operated during times or in jurisdictions that had no anti-cartel laws are considered to be legal cartels. If the cell is empty, the cartel is presumed to be legal.
c) This observation includes 16 non-substitutable vitamins and provitamins, each of which is a separate market and cartel. Source: John M. Connor. Price-Fixing Overcharges Master Data Set (December 2013).

J. M. Connor Price-Fixing Overcharges 3rd Edition February 2014
176
Appendix Table 2. Summary of Price-Fixing Overcharges
Cartel Type, Location, and Dates a Method of Analysis
Overcharge or Undercharge Source c Epis-
odic b Peak
Percent 1. Florida State road-building construction contract auctions, 1738 projects, 1981-1986; no mention of convictions by Gupta, but by June 1983 the Florida Attorney General had collected $15 million in fines and settlements from road construction companies the state.
Econometric model explains variation in price-cost margins; compares the minimum of 2 bidders with average number (5) of bidders. Maximum observed number of bidders in the sample (19) is the competitive benchmark.
28-37 34-45
Gupta (2001b: 464), Christian Science
Monitor (6/15/1983:4)
2A. Bid rigging against US schools by the members of the Folding Gymnasium Seating Council, U.S., April 1954-early 1960; DOJ consent decree in early 1960; study controls for changes in costs
Benchmark pre-cartel price is for Jan.-Mar. 1954 ($6.43) vs. avg. 1955-58 price of $9.06 per foot
40.9 -- Erickson (1976: 192-193)
2B. Same as 2A above Benchmark price is for brief breakdown period April-June 1959 ($6.68)
35.6 -- Erickson (1976: 192-193)
2C. Same as 2A above Benchmark price is post-cartel: Sept. 1960- March 1961 ($6.95) 30.4 -- Erickson (1976: 192-
193) 3. Bid rigging, rock salt sold to state and local governments, northern U.S.; began in early 1930s and renewed in 1948-49, but court testimony covers only 1954-1960; umbrella pricing by two largest U.S. companies; guilty at trial
But-for price is average of 1961-63 prices; study controls for changes in costs 60 66 Erickson (1976: 197)
4A. Bid rigging and market divisions, structural steel sold to construction contractors for public buildings, upper Midwest of U.S., March 1950-August 1962; probably convicted
Pre-conspiracy prices (1948-March 1950) compared to conspiracy period except for one brief breakdown in collusion; peak is 1961-62
9.0 27.9 Erickson (1976: 199)
4B. Same as 4A above Conspiracy prices compared to post-conspiracy prices (Sept. 1962-Dec. 1963); peak prices from 1961-62
0 17.3 Erickson (1976: 199)
5. Bid rigging and market divisions, structural steel sold to construction contractors for bridges, upper Midwest of U.S., March 1950-Aug. 1962; meetings were “interrupted” from July 1960 to March 1961
5A. Conspiracy period March 1950 – August 1962, excluding “interruption”
Benchmark price is for 1948- March 1950 9.0 -- Erickson (1976:199)
5B. Same as 5A. Benchmark price is for 1948- March 1950 27.9 -- Erickson (1976:199)
5C. Late phase of conspiracy, April 1961 – August 1962
Benchmark price is for Sept. 1962 – Dec. 1963 0.0 -- Erickson (1976:199)
5D. Same as 5C. Benchmark price is for Sept. 1962 – Dec. 1963 17.3 -- Erickson (1976:199)
5E. Same as 5A Compares profit on equity 50 -- Erickson (1976:199)

J. M. Connor Price-Fixing Overcharges 3rd Edition February 2014
177
1950-1961 of a typical conspirator with the U.S. national industry average
6. Price fixing of bromine sold to pharmaceutical manufacturers to make potassium bromide, U.S., three episodes:
6A. National Bromine Co., pool 1885- 1891
Base is 1880-1884 prices 9.7 19 Levenstein (1997)
6B. Shields pool, 1892-1902 Base is March 1891-October 1892 prices 65.2 126 Levenstein (1997)
6C. Shields pool, 1892-1902 Base is 1880-1884 prices 31.6 81 Levenstein (1997)
6D. Dow Chemical pool, 1902-1914 Base is several non-cooperative periods during 1905-1908 74.4 257 Levenstein (1997)
7. Bid rigging by 8 members of the Asphalt refiners Assn. of liquid asphalt contracts for the Oklahoma Highway Dept., 1954-1968, found guilty by jury trial.
Comparison of constant OK winning bid price with yardstick: average delivered prices in 6 surrounding states supplied from OK
71 71 Funderburk (1974:69-70)
8A. Cemented tungsten carbide, invented by Krupp Steel and General Electric in early 1920s; two firms formed a cartel in 1928, protected by patents later invalidated, that divided the U.S. and European markets between them; GE had a U.S. production monopoly, but Krupp sold to two US importers, which colluded with GE and were bought by GE in 1936 and 1937 to preserve its U.S. monopoly; GE was indicted for price fixing by DOJ in 1941, found guilty at trial in 1947.
U.S. price in 1927 when Krupp still exported to U.S. compared to GE’s U.S. 1928-Oct. 1936 price when 3 US firms were colluding
800+ 800+
Stocking and Watkins (1948:132-
134), Berge (1944:43)
8B. Same as 8A U.S. price 1928-36 compared to yardstick of (Krupp’s) monopoly European price
787-886 -- Stocking and
Watkins (1948:132-134), Berge (1944:43
8C. Same as 8A above, except in second episode price lowered during Oct. 1936-1941
U.S. price October 1936 to 1941 compared to yardstick of (Krupp’s) monopoly European price
99-302 -- Stocking and
Watkins (1948:132-134)
8D. Same as 8C
U.S. monopoly price October 1936 to 1941 compared to highly profitable Government wartime price
395-829 395-829 Stocking and
Watkins (1948:132-134)
8E. Same as 8A
U.S. price in 1928-1936 compared to Krupp’s U.S. import price to two US exclusive importers and GE co-conspirators
886 886 U.S. v. General
Electric Co. et al (10/8/1948)
8 F. Same as 8A. Price 1928-35 compared to (inflated) price in Germany same years.
806 806 Canada (1945: 14)
8 G. Same as 8C. Price 1936-39 compared to (inflated) price in Germany. 310 310 Canada (1945: 14)
8 H. Same as 8A. Price 1928-1935 compared to (inflated) price in Germany. 243 243 Canada (1945: 14)
8 I. Same as 8C. Price 1939 compared to (inflated) price in Germany. 50-321 50-321 Canada (1945: 14)
8 J. Same as 8A. Price 1928-1935 compared to 1329 1329 Canada (1945: 14)

J. M. Connor Price-Fixing Overcharges 3rd Edition February 2014
178
price in October 1941 after antitrust indictment by DOJ
8 K. Same as 8C. Price 1939 compared to price in October 1941 after antitrust indictment by DOJ
61-543 61-543 Canada (1945: 14)
8L. Same as 8A+8C (no distinction between two episodes)
Mean annual deflated wholesale prices during 1929-1941, relative to 1926-28 average; peak is 1941
429 700 Suslow (2005:734)
9A. Bid rigging by three processors (Turner, Flav-O-Rich, and Prairie Farms) of school milk contracts, ½ pints of lowfat white milk, in Boone, Kenton, and Campbell Counties, Kentucky, 1984-1988; bid riggers won 20 of 22 contracts in 1987.
Benchmark is 1983 pre-collusion price of three riggers ($0.12 per ½ pint); May- Sept. 1987 is representative cartel period, avg. of 20 winning bid prices ($0.141); peak is 1st bid ($0.153)
18.3 27.5 Lanzillotti
(1996:Figure 7, p.442)
9B.Same as 9A. Geographic yardstick is price ($0.1156) in surrounding more competitive counties; May- Sept. 1987 is representative cartel period, avg. of 20 winning bid prices ($0.141); peak is “LIVI” bid ( $0.145)
22.0 26.1 Lanzillotti
(1996:Figure 7, p.442)
9C. Bid rigging by three processors (Holland, U.C., and Ideal American) of school milk contracts, ½ pints of lowfat white milk, school districts in Boone, Kenton, and Campbell Counties, Kentucky, 1984-1988; bid riggers won 20 of 22 contracts in 1987.
Benchmark is 1980 pre-collusion price of 3 riggers ($0.12); May- Sept. 1987 is representative cartel period, avg. of 20 winning bid prices ($0.1417); peak is 1st bid ($0.153)
18.1 27.5 Lanzillotti
(1996:Figure 7, p.441)
9D. Same as 9C Benchmark is 1987 yardstick prices of non-colluding processors in adjacent counties ($0.1095); May- Sept. 1987 is representative cartel period, avg. of 20 winning bid prices ($0.1417); peak is 1st bid ($0.153)
29.4 39.7 Lanzillotti
(1996:Figure 7, p.441)
9E. Bid rigging by two processors (Meyer and Trauth) of school milk contracts, ½ pints of lowfat white milk, school districts in Boone, Kenton, and Campbell Counties, Kentucky, 1984-1988; author shows that for 3 years after conspiracy, duopoly and yardstick prices were identical
Benchmark is avg. 1984-88 yardstick prices of non-colluding processors in adjacent counties ($0.1223); avg. winning prices of duopoly is $0.1363); peak in 1988
11.5 21.9 Lanzillotti
(1996:Figure 3c, p.433)
10A. Bid rigging school milk contracts, half pints, Dade and Broward counties, Florida, 1980-1985
Average 1986-89 post-conspiracy prices ($0.145) is the benchmark vs. avg. 1980-85 price ($0.164); peak is 1984 ($0.17)
13.1 17.2 Lanzillotti (1996:Fig. 8a, 443)
10B. Same as 10A Pre-conspiracy price ($0.142) is the benchmark vs. avg. 1980-85 price ($0.164); peak is 1984 ($0.17)
15.5 19.7 Lanzillotti (1996:Fig. 8a, 443)
11A. Bid rigging school milk contracts, Tampa Average 1986-89 post- 2.3 12.8 Lanzillotti (1996:Fig.

J. M. Connor Price-Fixing Overcharges 3rd Edition February 2014
179
Bay area (three counties), Florida, 1980-1985 conspiracy prices ($0.133) is the benchmark vs. avg. 1980-85 price ($0.136); peak is 1985 ($0.15)
8b, p. 433)
11B. Same as 11A Pre-conspiracy price ($0.132) is the benchmark vs. avg. 1980-85 price ($0.136); peak is 1984 ($0.17)
3.0 28.8 Lanzillotti (1996:Fig. 8b, p. 433)
12A. Bid rigging school milk contracts, Danville, Kentucky 1983-1988; author shows that in nearby unaffected counties, state and school bids were nearly same during 1983-88
Yardstick is avg. price bid to state agency in same county in 1983-88 ($0.1045) vs. school district ($0.1555); peak is 1988
48.8 59 Lanzillotti (1996: Fig. 9c, p. 447)
12B. Same as 12A Benchmark is 1989 post-cartel price ($0.125) vs. school district ($0.1555); peak is all years except 1986
24.4 27.2 Lanzillotti (1996: Fig. 9c, p. 447)
13A. Bid rigging school milk contracts, Owensboro, Kentucky 1983-1988; author shows that in nearby unaffected counties, state and bids were nearly constant.
Yardstick is avg. price bid to state agency in nearby counties in 1983-88 ($0.1195) vs. school district ($0.122); peak is 1988
2.1 4.9 Lanzillotti (1996: Figs. 8 and 9c, p.
447)
13B. Same as 13A Yardstick is 1989 post-cartel price ($0.125) vs. school district ($0.1555); peak is all years except 1986
24.4 27.2 Lanzillotti (1996: Figs. 8 and 9c, p.
447)
14. Bid rigging school milk contracts, Kentucky “core conspiracy area,” 1981- 1988
Geographic yardstick is median price in surrounding competitive counties ($0.117) vs. core conspiracy ($0.1294); peak is 1986
10.4 35.1 Lanzillotti (1996:Fig 10a, p. 448)
15. Bid rigging school milk contracts, summary of several selected school disricts of school-milk bid rigging in southeast of U.S., 1979-1988, 2 to 9 bid riggers; estimates prepared for trial and used for settlements, from among 109 specific cases listed; may include observations 9-14 above
Various methods used for observations numbered 9 to 14 above
15-20 - - Lanzillotti (1996:452)
16A. Price fixing of nitrogen and nitrate (nitrate of soda and its subtitute ammonium sulfate) international private cartel, including some national cartels; called the Convention de l’Industrie de l’Aziote (CIA); included Chilean miners’ national export cartel (See also Cartel #217 below) and French, UK and German producers of coke-byproduct and synthetic manufactures; had 98% of Europe and 80% of world capacity; after four years of sharply falling prices, first episode began July 1929; collapsed July 1931.
Posner’s method compares the UK price 30 days after the collapse with the six-monthly prices before the 1931 collapse, which is 43% in the original source (S&W 1946:163) 75.4 --
Posner (1975:818-820 and 2001:304),
Stocking and Watkins (1946:163),
Wallace and Edminster (1930: 54-
56)
16B. Same as 16A, except UK market Ammonium sulfate average UK prices in all of 1932 (128.8s.) after the collapse compared with 1930 average of 1940s, which is 33.6%.
50.6 -- Stocking and Watkins (1946:163)
16C. International cartel was reformed (second episode) at end of 1932 and continued to
Average U.S. nitrate of soda price index in 1936-39 relative 10.7 13.8 Stocking and
Watkins (1946:165)

J. M. Connor Price-Fixing Overcharges 3rd Edition February 2014
180
operate until at least 1947; a period of rising demand; wartime is omitted.
to the "before" 1935 price index; peak pears are 1938-39
16D. Same as 16C, except that prices rose immediately after 1932
Average U.S. ammonium sulfate price index in 1933-39 relative to the "before" 1932 price index; peak is 1938
24.1 38.1 Stocking and Watkins (1946:165)
16E. Same as 16C Ave. UK ammonium sulfate prices in 1933-39 relative to 1932; peak years 1937-38.
15.4 21.1 Stocking and
Watkins (1946:163-65)
16F. Same as 16A, but probably world prices Lerner index predicted from econometric model 30 -- Griffin (1989:189-
190) 16G. Same as 16C, but probably world prices Lerner index 22 -- Griffin (1989:189-
190) 16H. Same as 16A, but probably world prices. When the cartel dissolved in
July 1931, a price war caused prices to drop by 50% in 8/1931 to 6/1932.
100 -- Lamer (1957: 171-173)
16I. Same as 16A, except new episode, 2010-2012 world prices.
Econometric model using an estimated supply relationship; “The dynamic Lerner index …. averaged about 0.4 over 2010-2012”
40 -- Taylor (2013: 50)
17A. Second episode of price fixing of beet and cane sugar; international quasi-private cartel comprised of “advisors” (mostly diplomats or civil servants) of the 21 governments with 85-90% of world sugar output and consumption; no treaty; began Sept. 1937, ended Sept. 1939; agreement froze the export shares of all exporting regions but also operated in part to placate consuming countries (i.e., buyers’ cartel).
Ave. prices on the London market in Sept. 1937-Sept. 1939, relative to 1935-36 prices
30 --
Posner (1975:818-820), Posner
(2001:304), Stocking and Watkins
(1946:46)
17B. Same as 17A Lerner index 6 -- Griffin (1989:189-190)
17C. Huge increases in global inventories and plunging prices from 1922 to 1932 was the main cause of the formation of international cane and beet sugar exporters’ cartel of May 1931- Sept. 1935; a private agreement among national industry associations, with possible government encouragement/enforcement in the background, applied to the national sugar cartels of Cuba, Java, Peru, and five European countries to reduce output and set export quotas; no price agreement; global stocks fell 28%; Hexner calls this episode a dismal failure because importing countries outside the cartel boosted their production and self-sufficiency; Plummer says only Hungary passed legislation to enforce the agreement
Lerner index calculated by Griffin
13 --
Griffin (1989:189-190), Hexner
(1946:192-193), Plummer (1934:20-
23)
17D. Same as 17A+17C, but with no pause in collusion from 1935 to 1937
Mean annual deflated wholesale price 1931-38 relative to 1931 price; peak is 1931
0 0 Suslow (2005:733)
17E. Same as 17A+17C, but with no pause in Mean annual deflated 13.9 100 Suslow (2005:733)

J. M. Connor Price-Fixing Overcharges 3rd Edition February 2014
181
collusion from 1935 to 1937 wholesale price 1931-38 relative to 1939 price; peak year 1931
17F. Same as 17A Mean 1938 price (2nd episode) in London market compared to 1932 (before 1st episode)
17.0 -- Stocking and Watkins (1946:51)
17G. Same as 17A Mean 1933-36 prices in London market compared to 1932 (before 1st episode)
11-16.5 -- Stocking and Watkins (1946:51)
18. Price fixing and territorial quotas of aluminum metal. Six episodes beginning Oct. 2, 1901 and ending early 1939.
Posner (1975:818-820), Posner
(2001:304), Stocking and Watkins
(1946:228), Eckbo (1976:33)
18A. The first international private cartel of the world’s five sole manufacturers, all located in Western Europe, was formed by contract on Nov. 2, 1901 which was in effect until late 1906
Price in Europe in 1905 compared to early 1901
-- 100, 100 b
Posner (1975:818-820), Posner (2001:304)
18B. Second international cartel episode; same membership as 18A, but a tighter contract signed in late 1906; members and outsiders added 200% more capacity in 1905-08; entry, excess capacity, and a late 1907 recession put stress on the cartel; it formally dissolved Sept. 30, 1908
Benchmark is German ingot prices in late 1908 relative to mid 1907; decline in part due to fall in demand -- 50 Stocking and
Watkins (1946:233)
18C. Same as 18B Author’s interpretation of case studies of other researchers 50+ -- Eckbo (1976:33)
18D. Same cartel as 18B, but data are from a top manager of the cartel in its later years who is an apologist for the benefits of cartels
Exact transaction prices from 1906 to 1908 in gold French francs; the base of comparison is the price demanded by the cartel’s French members in Jan. 1908 which would have guaranteed a good rate of return; cartel dissolved in April 1908 and prices fell far below the base price; peak is all of year 1907
83 167 Marlio (1947: 13)
18E. Same as 18A and 18B combined, but tracks prices in U.S. market; imports flood into the U.S. market in 1910-1912
Alcoa’s U.S. prices in 1910-1912 compared to 1902-07 average cartel U.S. prices
65 82 Stocking and
Watkins (1946:229,233)
18F. Third international cartel agreement reached June 12, 1912 (5 days after Alcoa accepted a DOJ consent decree to end an antitrust probe!); ended by outbreak of war in August 1914
Average annual U.S. price in 1913 versus 1912
5.0 -- Stocking and
Watkins (1946:238-245, note 44)
18G. Same as 18F above Average European transaction prices Jan. 1913 to Jan. 1915; peak is 1914; compared to same base price as in 18D above
30.4 33.3 Marlio (1947: 18)
18H. Prices fall after end of war prompting a 4th, unwritten cartel agreement in 1923; lasted until 1926; Alcoa hid its participation by
Method not explained and numbers not found in S&W; S&W refers to 1922-1924
-- 38, 59b Posner (2001:304),
Stocking and Watkins (1946:251),

J. M. Connor Price-Fixing Overcharges 3rd Edition February 2014
182
forming a holding company for its burgeoning European assets which was controlled through its Canadian subsidiary; European members refrained from exporting to US and Alcoa did not export to Europe at less than cartel’s prices
price changes of 33% in Europe and 44% in the U.S.; Elliott considers 1923-25 boom “mainly” responsible for price increases
Elliott et al. (1937:256)
18I. Same as 18H above Author’s interpretation of case studies of other researchers 50+ -- Eckbo (1976:33)
18J. Fifth international private cartel, 1926-1930; unlike some others, this author interprets new cartel agreement in 1926 as start of a new episode; other authors consider 1924-1938 as one episode
Author’s interpretation of case studies of other researchers
50+ -- Eckbo (1976:33)
18K. Sixth episode in Europe by 8 companies that owned a common joint venture, the Alliance Aluminum Co., lasted from July 1931 to early 1939; joint venture purchased and sold aluminum stocks to members; cost-saving technological change rapid in 1930s
London list or “official” price compared to the price members could buy out of Alliance Aluminum stocks; peak is Nov. 1931
45 75.1 Marlio (1947: 37-40)
18L. Same as 18K. Transaction prices from Nov. 1931 to Dec. 1936 in gold French francs compared to Mar. 1938–Jan. 1939 (1.1 FF) , a period the author, an expert insider, calls cooperative but not very effective; peak is Nov. 1931
83.6 101.2 Marlio (1947: 39-40)
18M. Same as 18K above Author’s interpretation of case studies of other researchers 50+ -- Eckbo (1976:33)
18N. Study that measures the U.S. market power of Alcoa during three episodes when it was a monopolist in the U.S. market (1923-1940) partly because of agreements with European producers that limited imports
Econometric model with excellent data that measures short-run and long-run mark-up over Alcoa’s U.S. marginal costs, including accounting profits
59-65 -- Posner (2001:304), Suslow (1986: 399-
400)
18O. Same as 18J above
Compares average London metal price 1926-29 with price in late 1930 after US-Canadian entry
24.4 -- Oualid (1938:20-21)
18P. Same as 18K above Average London price 1932-36 with July 1931 or late 1930 5.3-17.7 -- Oualid (1938:20-21)
18Q. Same as 18K above
Same as 18P, except base of comparison is price in “cartel-free” markets Belgium, Netherlands, and Central Europe
17.7-25 -- Oualid (1938:20-21)
18R. Same as 18A Lerner index predicted from econometric model 67 -- Griffin (1989:189-
190)
18S. Same as 18F Lerner index predicted from econometric model 40 -- Griffin (1989:189-
190)
18T. Same as 18J Lerner index predicted from econometric model 31 -- Griffin (1989:189-
190)
18U. Same as 18K Lerner index predicted from econometric model 34 -- Griffin (1989:189-
190) 18V. Same as 18A, but authors believe that 1904-07 prices were strongly affected by a
European price change from 1900 to 1902 25 -- Elliott et al.
(1937:226)

J. M. Connor Price-Fixing Overcharges 3rd Edition February 2014
183
boom in demand 18W. Same as 18H above Changes in prices in the US
from 1922 to 1924 44 -- Stocking and Watkins (1946:251)
18X. Same as 18F European prices in 1912-14 relative to competitive 1908-11 period
0-70 -- Elliott et al. (1937:228)
18Y. Same as 18H, except that transactions prices are taken from an exhibit from a private antitrust suit against Alcoa
Peak U.S. price in Dec. 1925 relative to 1920-21 when Alcoa faced large European import competition; adjusted for $.03 rise in U.S. tariff in Sept. 1922
-- 32 Elliott et al. (1937:255)
18Z. Same as 18H; author believes that over-capacity, increased scrap supplies, and depression caused prices to decline 20%; costs also declined by 20% 1926-1930/31
Cartel was able to bring off an “orderly reduction in prices” with no change in profits
0 -- Elliott et al. (1937:260)
I8AA. Same as 18H above Changes in prices in Europe from 1922 to 1924 33 -- Stocking and
Watkins (1946:251) 18BB. Same as combination of 18H and 18J. Average U.S. net realization
prices in 1924-1938 compared to 1921-22; peak is 1937; includes Great Depression.
13 38 Stocking and
Watkins (1946:229,252-269)
19. Bid rigging of Dallas-Fort Worth school milk contracts in 1980-1992 by 9 dairy processors, which paid a large settlement to end a civil suit.
Examines winning bids in DFW to those in San Antonio, Texas for several types of milk 5.0-6.0 -- Lee (1999)
20A. Price fixing of crude natural rubber international private cartel, London-based Rubber Growers’ Assn., agreed in recession year 1920 to cut output by 25% in 1921; Dutch producers supported cut; in November 1921 UK and colonial legislatures made it a mandatory government program; price effects were large from 11/21 to 1925-26, but no analysis presented here; UK government rubber-quota program encouraged expansion of Dutch East Indies production; by 1926-27 it was no longer effective; officially abandoned Oct. 1928
World price change from just before cartel (1920- early 1921) to late 1921
-- 100
Posner (1975:818-820), Posner
(2001:304), Stocking and Watkins (1946:64-65)
20B. New scheme implemented June 1934-April 1944; the Intl. Rubber Regulation Cmte. in London with government and industry members set output and export limits, which were negotiated by Britain, Holland, France (and their colonies) and Siam; Suslow judges the IRRC to be a private cartel
Real world prices in 1934-39 compared to base years 1930-33; peak year is 1937
119 149 Suslow (2001: 57), Hexner (1946: 280-
293)
20C. Same as 20B; IRRC based its price objective on covering full costs of production plus a rate of return on assets of about 7.5%; extensive studies of plantation costs in all areas were commissioned
Nominal prices 1936-1939 compared to upper limit of full costs of production 15-134 141 Hexner (1946: 287)
20D. Same as 20B Lerner index 66 -- Griffin (1989:189-190)
20E. Same as 20B Mean annual deflated 138 287 Suslow (2005:732)
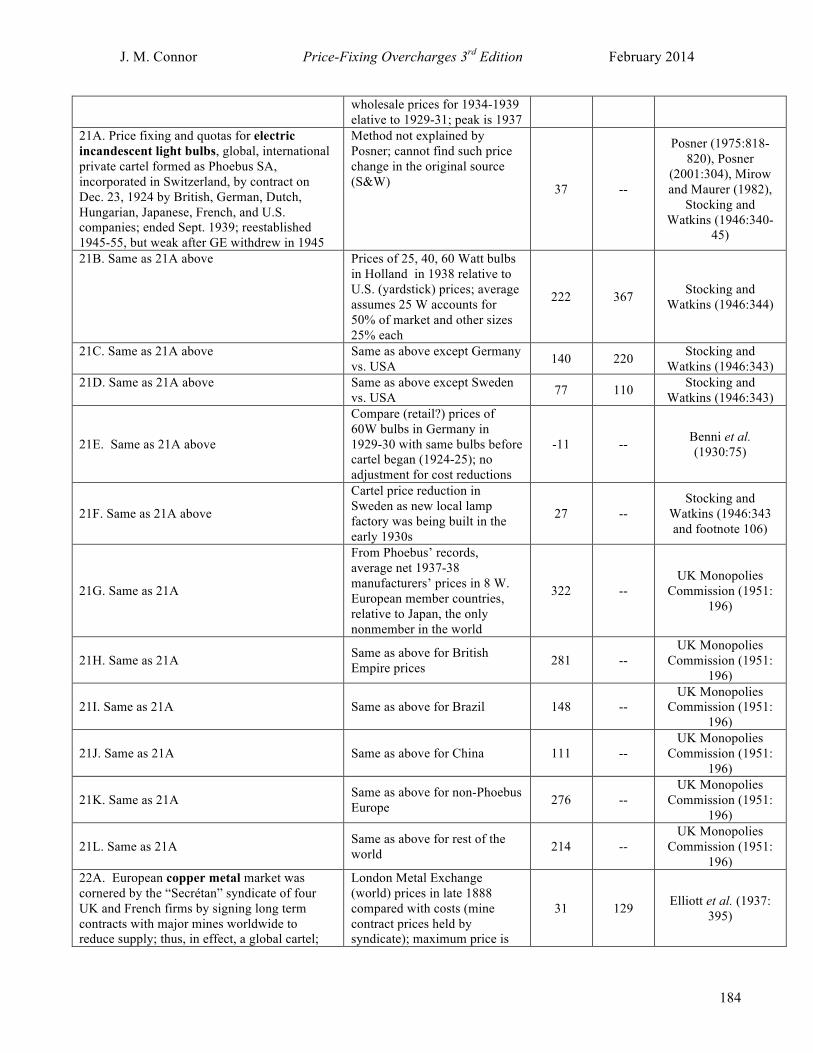
J. M. Connor Price-Fixing Overcharges 3rd Edition February 2014
184
wholesale prices for 1934-1939 elative to 1929-31; peak is 1937
21A. Price fixing and quotas for electric incandescent light bulbs, global, international private cartel formed as Phoebus SA, incorporated in Switzerland, by contract on Dec. 23, 1924 by British, German, Dutch, Hungarian, Japanese, French, and U.S. companies; ended Sept. 1939; reestablished 1945-55, but weak after GE withdrew in 1945
Method not explained by Posner; cannot find such price change in the original source (S&W) 37 --
Posner (1975:818-820), Posner
(2001:304), Mirow and Maurer (1982),
Stocking and Watkins (1946:340-
45)
21B. Same as 21A above Prices of 25, 40, 60 Watt bulbs in Holland in 1938 relative to U.S. (yardstick) prices; average assumes 25 W accounts for 50% of market and other sizes 25% each
222 367 Stocking and Watkins (1946:344)
21C. Same as 21A above Same as above except Germany vs. USA 140 220 Stocking and
Watkins (1946:343) 21D. Same as 21A above Same as above except Sweden
vs. USA 77 110 Stocking and Watkins (1946:343)
21E. Same as 21A above
Compare (retail?) prices of 60W bulbs in Germany in 1929-30 with same bulbs before cartel began (1924-25); no adjustment for cost reductions
-11 -- Benni et al. (1930:75)
21F. Same as 21A above
Cartel price reduction in Sweden as new local lamp factory was being built in the early 1930s
27 -- Stocking and
Watkins (1946:343 and footnote 106)
21G. Same as 21A
From Phoebus’ records, average net 1937-38 manufacturers’ prices in 8 W. European member countries, relative to Japan, the only nonmember in the world
322 -- UK Monopolies
Commission (1951: 196)
21H. Same as 21A Same as above for British Empire prices 281 --
UK Monopolies Commission (1951:
196)
21I. Same as 21A Same as above for Brazil 148 -- UK Monopolies
Commission (1951: 196)
21J. Same as 21A Same as above for China 111 -- UK Monopolies
Commission (1951: 196)
21K. Same as 21A Same as above for non-Phoebus Europe 276 --
UK Monopolies Commission (1951:
196)
21L. Same as 21A Same as above for rest of the world 214 --
UK Monopolies Commission (1951:
196) 22A. European copper metal market was cornered by the “Secrétan” syndicate of four UK and French firms by signing long term contracts with major mines worldwide to reduce supply; thus, in effect, a global cartel;
London Metal Exchange (world) prices in late 1888 compared with costs (mine contract prices held by syndicate); maximum price is
31 129 Elliott et al. (1937: 395)

J. M. Connor Price-Fixing Overcharges 3rd Edition February 2014
185
Sept. 1887-Mar. 1889; Mar. 1889 crash came after unexpected increases in mine output and recycled Asian supplies arrived.
compared to LME price at end of March 1889
22B. The “Amalgamated Pool” raised $155 million to finance purchase of large stocks of U.S. copper metal in April 1889; world price rose in late 1901 and crashed at end of 1901 when pool owned 200,000 tons
London Metal Exchange (world) Price in mid 1901 compared with end of 1901
35 -- Elliott et al. (1937: 397-98)
22C. Amalgamated Copper Co. organized a US supply-control cartel in 1906; effective 1907-1912.
London Metal Exchange (world) Average prices late 1907-1912 compared to 1906; peak effect was from early 1906 to “Panic of 1907”
35 127 Elliott et al. (1937: 398)
22D. Copper Export Assn. was formed by 4 US producers in Dec. 1918 covering 95% of US production; it agreed (illegally) to reduce output by 42% during 1919; all mines were closed for 9 months in 1921; by 1923 large post-war govt. stocks were liquidated and it disbanded; prices recovered but new African mines opened in the 1920s; 1923-26 was one of the few normal, competitive periods in the copper market, with world prices fairly steady at $0.13/lb.
Authors’ analysis of London Metal Exchange (world) price elevation late 1919 to 1923 above competitive levels in early 1919
29 -- Elliott et al. (1937: 418-419)
22E. Price fixing of copper metal by Copper Exporters Inc., the first Webb-Pomerene Association to have foreign (non-U.S.) members; U.S. and African mine companies coordinated output from 10/1926 to 12/1932 through “the Copper Institute,” ostensibly a statistical agency; effective in propping world prices October 1926 - May 1930; coordinated large output cuts in 1930-31 also, but price fell to $0.05/lb. by 12/32.
Posner’s method not explained; Posner cites Stocking and Watkins, but I cannot find Posner’s estimate in the original source (however, it is close to 22G below) 31 --
Posner (1975:818-820), Posner
(2001:304), Stocking and Watkins
(1948:125-131)
22F. Same as 22E above; world prices during 10/1926-5/1930 peaked at $0.212/lb in March 1929
Based on the narrative, average prices waer $0.175/lb.; benchmark is average of $0.13 during 3 years before cartel contract signed
34.5 63.1 Stocking and
Watkins (1948:127-128)
22G. Same as 22E; world copper prices in year following Great Crash, May 1929-May 1930; cartel lost control of prices after May 1930 when more large African mines opened; formally dissolved in 1932
Same as above
38 -- Stocking and Watkins (1948:127)
22H. Same period as 22E; an early economic study of international cartels, most of them European based, that depends on information from previously published economic studies and press accounts; writing at the beginning of the Great Depression, the author is more impressed by the failures of cartels to raise prices than their successes; of scores of private cartels studied, only two have data on their price effects; international copper cartel maintained near monopoly over supply, but experienced rapidly falling demand and rising
World export prices in Dec. 1932 compared to peak period May 1929-April 1930
-- -72 Plummer (1934:149-152)

J. M. Connor Price-Fixing Overcharges 3rd Edition February 2014
186
stocks 22I. Same as 22B, but judged effective only from early 1899 to Dec. 1901; ended by lack of European cooperation and domestic cheating
New York wholesale prices 1899-1901 compared with 1898
31-64 -- Herfindahl (1959:81)
22J. Same as 22B New York wholesale prices 1899-1901 compared with 1902-03
55-64 -- Herfindahl (1959:81-82)
22K. Same as 22C; Herfindahl is skeptical that any of the collusive arrangements alleged by other researchers in 1904-05, 1906-07, 1908, 1909, or 1912-13 were effective
New York wholesale prices 1904-13 compared with early 1906 benchmark
0 -- Herfindahl (1959:92-99)
22L. Same as 22D, except slightly shorter conspiracy period; the CEA was successful in restricting supply in 1921-22 and possibly in 1918-20 also.
New York wholesale prices 1921-22 compared with 1923-26 benchmark; price effects were weak and brief
1 -- Herfindahl (1959:92-99)
22M. Same as 22E above. Compared world prices March 1929 with average of 3 years before cartel contract signed
-- 63.1 Stocking and Watkins (1948:127)
22N. Same as 22E, except shorter effective period of 4/1929 – 4/1930
New York wholesale prices April 1929-April 1930 compared with competitive 1926-28
28 -- Herfindahl (1959:208)
22O. Same as 22N New York wholesale prices April 1929-April 1930 compared with 1931
88 -- Herfindahl (1959:208)
22P. Same as 22D; a 1918-1922 (or 1924) U.S. Webb-Pomerene Assn. that liquidated large wartime (WWI) stocks, but may not have affected export prices
Lerner index 0 -- Griffin (1989:189-
190), Hexner (1946:224)
22Q. Second international copper cartel (first is 22A); formed with exporters of all countries except Canada as members; active May 1935 – Sept. 1939; agreement on output reductions; New York export prices
Base price late 1934-early 1935 compared to 1938-1939 average price; peak price March 1937 affected by “war fever”
11-33 84
Stocking and Watkins (1948:129),
Herfindahl (1959:115)
22R. Same as 22Q; London exchange prices, which S&W assert are better reflection of output and export quotas
Comparison of May 1937 price with May 1935 price -- 150+ Stocking and
Watkins (1948:129)
22S. Same as 22Q; average annual prices of spot purchases of standard copper on the London exchange, in pounds sterling ; author believes that rise chiefly due to increased demand
Base is 1932-34 prices compared to 1936-39; peak is 1937 40 73 Hexner (1946: 228)
22T. Same as 22E; League of Nations copper price series; authors state that cartel aimed at a price of $0.18/lb. and tried to stabilize market by reducing prices during early 1929 demand spike; it lost control of price after late April 1930
Price before contract signed compared to May 1929-mid April 1930 when cartel achieved its target price; peak was a few days in April 1929
29 71 Benni et al. (1930:21)
22U. Same as 22E above; second study of same cartel by League of Nations researcher, but 8 years later
Considers the cartel a failure because it could not control prices when demand dropped in early 1930 and African mines opened compare 1929 price with lowest in 1930s (1932)
-- -72 Oualid (1938:35)
22V. Same as 22Q above Author believes that March 36.6 90.3 Oualid (1938:37)
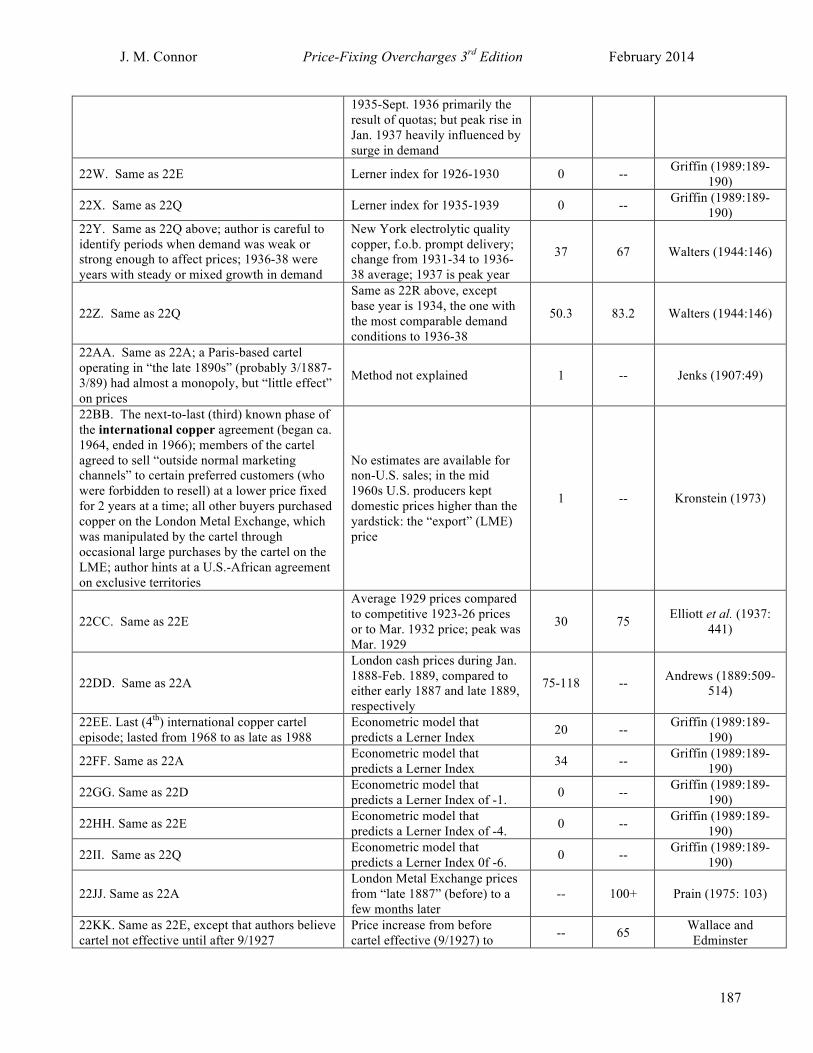
J. M. Connor Price-Fixing Overcharges 3rd Edition February 2014
187
1935-Sept. 1936 primarily the result of quotas; but peak rise in Jan. 1937 heavily influenced by surge in demand
22W. Same as 22E Lerner index for 1926-1930 0 -- Griffin (1989:189-190)
22X. Same as 22Q Lerner index for 1935-1939 0 -- Griffin (1989:189-190)
22Y. Same as 22Q above; author is careful to identify periods when demand was weak or strong enough to affect prices; 1936-38 were years with steady or mixed growth in demand
New York electrolytic quality copper, f.o.b. prompt delivery; change from 1931-34 to 1936-38 average; 1937 is peak year
37 67 Walters (1944:146)
22Z. Same as 22Q
Same as 22R above, except base year is 1934, the one with the most comparable demand conditions to 1936-38
50.3 83.2 Walters (1944:146)
22AA. Same as 22A; a Paris-based cartel operating in “the late 1890s” (probably 3/1887-3/89) had almost a monopoly, but “little effect” on prices
Method not explained 1 -- Jenks (1907:49)
22BB. The next-to-last (third) known phase of the international copper agreement (began ca. 1964, ended in 1966); members of the cartel agreed to sell “outside normal marketing channels” to certain preferred customers (who were forbidden to resell) at a lower price fixed for 2 years at a time; all other buyers purchased copper on the London Metal Exchange, which was manipulated by the cartel through occasional large purchases by the cartel on the LME; author hints at a U.S.-African agreement on exclusive territories
No estimates are available for non-U.S. sales; in the mid 1960s U.S. producers kept domestic prices higher than the yardstick: the “export” (LME) price
1 -- Kronstein (1973)
22CC. Same as 22E
Average 1929 prices compared to competitive 1923-26 prices or to Mar. 1932 price; peak was Mar. 1929
30 75 Elliott et al. (1937: 441)
22DD. Same as 22A
London cash prices during Jan. 1888-Feb. 1889, compared to either early 1887 and late 1889, respectively
75-118 -- Andrews (1889:509-514)
22EE. Last (4th) international copper cartel episode; lasted from 1968 to as late as 1988
Econometric model that predicts a Lerner Index 20 -- Griffin (1989:189-
190)
22FF. Same as 22A Econometric model that predicts a Lerner Index 34 -- Griffin (1989:189-
190)
22GG. Same as 22D Econometric model that predicts a Lerner Index of -1. 0 -- Griffin (1989:189-
190)
22HH. Same as 22E Econometric model that predicts a Lerner Index of -4. 0 -- Griffin (1989:189-
190)
22II. Same as 22Q Econometric model that predicts a Lerner Index 0f -6. 0 -- Griffin (1989:189-
190)
22JJ. Same as 22A London Metal Exchange prices from “late 1887” (before) to a few months later
-- 100+ Prain (1975: 103)
22KK. Same as 22E, except that authors believe cartel not effective until after 9/1927
Price increase from before cartel effective (9/1927) to -- 65 Wallace and
Edminster

J. M. Connor Price-Fixing Overcharges 3rd Edition February 2014
188
3/1929 (1930:261)
22. LL. Same as 22Q Econometric model with emphasis on fringe producers 1.0 -- Montero and
Guzman (2005:17) 23A. Bid rigging of purchases by municipalities cast-iron pipes, used for rail beds, culverts, drainage, or sewage; all U.S. states west and south of Pennsylvania and Virginia, circa 1895-1896; found guilty at trial; Judge Taft concluded that an f.o.b. plant price of $13/t for 16” or smaller pipe and $15/t for 30-36” pipe was sufficient for a reasonable profit
Dates, cities and method not explained, but probably judge’s reasonable profit benchmark; apparently Posner’s interpretation of this famous Supreme Court case
39 --
Posner (1975:818-820), Posner
(2001:304), U.S. v. Addyston Pipe
23B*. Same as 23A for an Omaha, NE municipal tender for 512 pieces of 20” pipe in 12/1895
Trial documents reveal that a “premium” or “bonus” of $23.40/ton (a profit yardstick) was the overcharge split among the cartel, whereas the delivered cartel price was $15.40
52.0 -- U.S. v. Addyston Pipe
23C*. One of the episodes in 23A for a St. Louis, MO tender, exact date unknown
Bonus of $6.50/t on a winning bid price of $24/t 37.1 -- U.S. v. Addyston Pipe
23D*. Same as 23C Bonus of $6.50/t when the delivered but-for price was $17 to $18/t
36-38 -- U.S. v. Addyston Pipe
23E*.One of the episodes in 23A for an Atlanta, GA contract of 12/1895, size of pipe and winning bid not mentioned
Bonus was $7.10/t; reasonable profit yardstick is the but-for price of $13to $15/t
47-55 -- U.S. v. Addyston Pipe
23F*. One of the episodes in 23A ; average bonus of $3.63 made by cartel from 6/1/1895 to 12/31/1895
Bonus relative to reasonable profit yardstick 20-21 -- U.S. v. Addyston Pipe
23G*. Some of the episodes in 23A; sales of So. Pittsburg Co. in WV, MI, and OH; a non-member of the cartel was located in Columbus, OH
Bonus varied from $1/t to $1.50/t; yardstick is reasonable profit price 5.6-8.8 -- U.S. v. Addyston Pipe
23H*. Some of the episodes in 23A; Chattanooga Co. generated a $3/t bonus on all sales in West-central Tennessee
Yardstick is reasonable profit price 16.7-
17.7 -- U.S. v. Addyston Pipe
23I*. Some of the episodes in 23A; in Jan. 1896 cartel made an average bonus of $7 to $8/t
Yardstick is reasonable profit price 39-47 -- U.S. v. Addyston Pipe
23J. Same as 23A U.S. Appeals Court decision 35-43+ -- Appendix Table 4: entry 1 below
Numbers 24 to 27 are listed only because they are cited by Posner (see asterisked footnote below #27) 24. Sophisticated oligopoly model that measures sellers’ market power in the U.S. crude petroleum and natural gas markets 1947-1971; Appelbaum’s model does not distinguish tacit from overt collusion, but Posner asserts that this study refers to collusion; some members non-U.S.
Econometric model prediction of average mark-up on full marginal costs
6.5* -- Posner (2001:304),
Appelbaum (1979:283)
25A. Mark-ups in the U.S. automobile industry; study is a general one of mark-up and productivity change; it does not distinguish overt from tacit behavior; oddly, 6 of 17 industry groups have higher average mark-ups than “automobiles” (e.g., chemicals is 61%); financial profits for the industry averaged only
Morrison uses a large scale, sparsely specified, pooled 1953-1986 time-series econometric model of 18 major industry groups in manufacturing, one of which is transportation equipment
14* -- Posner (2001:304),
Morrison (1990: 25,43)

J. M. Connor Price-Fixing Overcharges 3rd Edition February 2014
189
3.2%; source is a 1990 NBER working paper, but results same in 1993 refereed journal paper
25B. Same as 25A above
Tables 2, 2A show mark-ups average 30.6%; Table 2A shows the largest mark-up of 38.5% in 1978
31* 39*
Morrison (1990: 25,43), Morrison
(1993: Tables II and V)
26. Price elevation due to oligopoly market power from all sources (unilateral, tacit collusive, and overt collusive) in the U.S. cigarette manufacturing industry.
Large-scale, richly specified oligopoly econometric model fitted to 1955-90 data; focused on excise tax incidence; average wholesale price (with taxes) divided by the sum of variable production cost, advertising expenditures, and excise taxes
37* -- Posner (2001:304), Barnett et al. (1995:
tables 1 and 3)
27. Price elevation due to all sources of market power (unilateral, tacit, or overt) of the U.S. soft drinks bottling industry (does not include the syrup makers like Coca-Cola)
A cross-sectional econometric model applied to 1972-1987 data on 40 food processing industries; Lerner index of market power is 3rd highest and virtually tied with the 4th and 5th highest
37.5* - - Posner (2001:304), Bhuyan and Lopez
(1997:1039-40)
* These figures are not, in the opinion of the present author, cartel overcharges, and are therefore excluded from the spreadsheet. 28A. International patent-pooling cartel in magnesium metal market combined with exclusive supply contract by Dow Chemical with fabricator AMC (a General Electric affiliate), July 1927-1942, which raised prices to all U.S. buyers
Prices charged to all U.S. buyers 6/33-11/38 compared to yardstick of AMC’s prices or export prices 27-37 -- Stocking and
Watkins (1946:295)
28B. Dates of cartel above are changed to Oct. 1932 (the date Alcoa signs a contract with I.G. Farben) to April 1942 (Alcoa, Dow and 3 others indicted by DOJ); U.S. cartel member pleaded nolo and paid fines; beginning in 1942, wartime price controls were imposed at levels to guarantee high profits
Real net prices charged by Dow Chemical on exports to foreign (non-US) customers during 1933 -1941 compared to 1942-1943; “after” prices more reasonable because of rapid cost reductions before and during earlier years of cartel; peak year 1933
9.4+ 47
Suslow (2001:56), Stocking and
Watkins (1946:274-303)
28C. Same as 28A for years 1927-1929 Lerner index 38 -- Griffin (1989:189-190)
28D. Same as 28B for years 1934-1937 Lerner index 25 -- Griffin (1989:189-190)
28E. Same as 28B
Mean annual deflated wholesale price for 1932-1943, relative to mean 1929-31 price; peak year 1932
0 0 Suslow (2005:731)
28F. Same as 28B
Mean annual deflated wholesale price for 1932-1943, relative to 1943 price; peak year 1932
22.6 58 Suslow (2005:731)
29. Auctions for U.S. Forest Service timber, 1975-1981, Pacific Northwest; evidence that buyers colluded against Forest Service; 108 auctions in an area with high timber density and
Econometric model of collusion with supply effects; mean compared to model of competitive market price
5.7 -- Baldwin et al. (1997)

J. M. Connor Price-Fixing Overcharges 3rd Edition February 2014
190
several buyers; most other forest areas are less competitive
30A. School district milk-supply-contract bid rigging in Cincinnati, Ohio by three dairies, 1980-1990, for 2% chocolate milk in pints; from a trial with finding of guilt
Average price of winning bids relative to competitive control group of dairies, effective years, from fitted econometric model; maximum is highest year
-6.5 -11.3 Porter and Zona
(1999:263), Porter and Zona (2004:229)
30B. Same as 30A, except only for school districts in which a defendant was an incumbent in the previous year
Average price of winning bids relative to competitive control group of dairies, effective years, from fitted econometric model; maximum is highest year
-24.6 -49
Whinston (2006: 35), Porter and Zona
(1999:263), Porter and Zona (2004:229)
32. Winning bids in 134 construction contracts for Government of Korea public works construction projects worth more than $10 million each, Jan. 1995-June 1998
Econometric model using forecasting approach 15.5 -- Lee and Hahn
(2002:83)
33A. Bid rigging by three contractors on city contracts for sewer construction in a Southeastern U.S. city, late 1970s to Jan. 1980, from plaintiff’s expert opinion prepared for a trial held in 1985-1988
Direct court testimonial evidence on City Project No. 67 18+ -- Howard and
Kaserman (1989:389)
33B. Same as 33A
Three statistical models applied to six other projects (ratio, dummy variable, and forecasting methods)
27-41 -- Howard and Kaserman (1989:389)
33C. Same as 33A Statistical model applied to Project No. 67 25-47 -- Howard and
Kaserman (1989:389) 34A. Bid rigging in 2,014 No. Carolina and So. Dakota state highway construction projects, 1975-1982, with identity of some collusive firms certain and others suspected
Econometric model for NC price data 18 --
Werden (2003:2); Brannman and Klein
(1992)
34B. Same as 34A Econometric model, auction prices in SD 6.5 --
Werden (2003:2); Brannman and Klein
(1992) 35. From well-known price-fixing trial, U.S. v. Socony-Vacuum, of 24 integrated Midwest petroleum refiners (of which 12 were convicted); agreement to restrict refinery output, March 1935-April 1936; prices are Midwestern spot 3rd grade gasoline, 60-62 octane, f.o.b. Oklahoma
But-for prices are averages of 1934, 1933-34, or 1932-34; max. price was 5.4 ¢ per gal. in 12/35 23-31 36-46 Johnsen (1991:179)
36. Five fish processors pleaded guilty to bid rigging U.S. Dept. of Defense procurement contracts for supplying frozen fish, 1981-Sept. 1989, consisting of three distinct episodes
Econometric model that uses post-conspiracy prices to predict bid prices with no bid rigging.
Froeb et al. (1993:419-423
36A. Same as 36, for 11/86-7/88 (103 bids) Backcast period A 30 -- 36B. Same as 36, for 6/84-11/86 (74 bids) Backcast period B 23 -- 36C. Same as 36, for 9/88-9/89 (44 bids) Forecast period C 23 -- 37. Bakers of Washington State colluded on price of white pan bread from about 1954 to 1964; confirmed by a decision of the U.S. 9th Circuit Court
Yardstick is conservative, the average U.S. retail price; maximum price difference is late 1958
15+ 20.5 Mueller and Parker (1992:79)

J. M. Connor Price-Fixing Overcharges 3rd Edition February 2014
191
38. An event study of the impact on stock prices of price-fixing indictments, mostly U.S. manufacturing sector, announced during 1962-1980 on 127 publicly traded U.S. firms in 57 conspiracies (out of 200 total); at least 85% pleaded guilty and were fined
Econometric study; estimated additional revenues from the conspiracies are compared to the companies’ total sales; 8.7 -- Bosch and Eckard
(1991: 315)
39. EU carton board cartel; manufacturers colluded on selling prices 1/86-12/91
EC decision to impose fines, 7/13/94, contains estimate 20-26 --
Connor(2003: Table A.5), Levenstein and Suslow (2002: 49),
EC (7/13/94) 40. An international cartel in iodine was formed in 1878 by Chilean, English, and French companies; in the 1930s these companies and others from Germany, Italy, and Norway were linked by a common selling organization in London; Japanese producers joined in June 1937; ended in Sept. 1939
Eckbo’s estimate is in a table, but he provides no discussion of his reasoning
50+ -- Eckbo (1967:37),
Hexner (1946: 254-255)
41. Ferry Operators, English Channel Freight, raised prices to passengers, 10/92-12/92; EC fines
EC orders nullification of collusive rate increase 10 10
Levenstein and Suslow (2002:Table 15), Connor(2003:
Table A.5) 42A. International fine-art auction house services 1993-2000, two firms (Sotheby’s and Christies) convicted by U.S.DOJ, EU, and large (up to $512 mil.) private plaintiffs’ settlement; collusion began either 1/93 (plaintiffs’ position) or 3/95 (DOJ’s) and ended 2/2000; appears that both sellers’ and buyers’ fees were fixed.
Plaintiffs’ assertion vetted by Levenstein and Suslow; not clear whether the percentage applies to fees only or (more likely) the sales’ value of the art itself.
0-20 -- Levenstein and
Suslow (2002:Table 15)
42B. Same as 42A above Information about changes in U.S. commission rates paid by all clients, buyers and sellers
91-200 -- Connor (2003: Table A.4)
42C. Same as 42A above; estimate for sellers’ commissions (30% of revenues) increased to include buyers’ commissions also; both commissions were basis of successful civil trial
Based on unchallenged testimony at US trial about Sotheby’s increased profits of $50-75 million, its market share (50%), and its revenues from seller’s commissions only
104-168 --
Ashenfelter and Graddy (2002:section 6), Donovan (2005:
210)
42D. Same as 42A above, adjusted as for 42C
US Government’s calculation of overcharge and affected commission revenues of sellers’ only, accepted by judge for sentencing of Sotheby’s owner
91-98 -- AP (4/23/2002), NY Law J. (4/23/2002),
Donovan (2005: 210)
42E. Same as 43A above
Calculations of class-action lead counsel and defense counsel of total damages ($286- $300 million) and from transactions data on buyers’ and sellers’ commissions
94-100 -- Stewart (2001),
Donovan (2005:209, 233)
42F. Same as 43A Reading of the US court decision 50 150 Appendix Table 4:
entry 9 below
42G. Same as 42A EC decision gives internal projection of likely fee-revenue effect of raising the
149-190 202 EC (Oct. 30, 2002: ¶104-105, 131-137)

J. M. Connor Price-Fixing Overcharges 3rd Edition February 2014
192
buyers’ commission schedule; compared to revenues before collusion started; actual revenue increases in 1995-96 verify profit increases
42H. Same as 42A
Judge’s decision in Auction Houses Antitrust Litigation: US settlement ($512) was 1.8 to 4 times overcharge
25-47 -- Lande and Davis (2007: Case 2), Connor (2007a)
43A. Shipping conference, France to Central & West Africa 1975-1992; fined by EC 4/1/92
From decision of the European Commission printed in the Official Journal 34-39 --
Levenstein and Suslow (2002:Table 15), Connor(2003:
Table A.4), EC Official Journal L134 (5/18/92:3)
43B. Same as 43A From decision of the European Commission printed in the Official Journal
43.1
Connor (2013), EC
Official Journal L134 (5/18/92:3)
43C. Same as 43A From decision of the European Commission printed in the Official Journal 35.5
Connor (2013), EC
Official Journal L134 (5/18/92:3)
44. A 1952 U.S. court decision concluded that 3 beet-sugar refiners (buyers’ cartel) had conspired to undercharge sugar-beet farmers in the 1939-1941 crop years by $0.25 /ton
Prices paid to growers by processors in 1939-1941, excluding Sugar Act payments; lowest (peak) price is from 1939
-4.6 -7.6 Adams and Bock (1980; 143-144)
45. U.S. jury trial concluded that grocery retailers in California had conspired from 1953 to 1970 to under pay their suppliers of beef
1953-1970 wholesale prices of beef compared the three years after the conspiracy terminated
-47 -65 Adams and Bock (1980; 145-146)
46A. Smelters of vanadium ore conspired to lower prices to certain Colorado miners in 1933-March 1948; a rare monopsony case; jury trial decision in 1961
But-for price was that paid for the same grade of ore at the same time by the U.S. Government
-39? -- Adams and Bock (1980; 146)
46B. Same as 46A Reading of the court decision -22.5 -38 to -47.5
Appendix Table 4: entry 18 below
47A. First international platinum cartel was formed in 1903; one UK and one French marketer of Russian metal; fixed non-Russian world prices; ended 1914
Average stabilized price 1905-14 compared to 1903 125 -- Elliott et al.
(1937:152)
47B. Second intl. wholesalers’ cartel formed 1920; included original 2 members plus one U.S. firm and “German interests”; ended in early 1931 after new mines began opening after 1927 in Russia, Columbia, So. Africa, and Canada
Cartel’s peak effectiveness was 1920-1927; peak price of $120/oz. reached in 1925; comparison is with price early 1931
-- 336 Elliott et al. (1937:153)
47C. The second international platinum (a byproduct of gold, copper, or nickel mining); global miners cartel was formed in 1918 by companies mining and smelting in Russia, UK, Canada, So. Africa, Columbia, Germany, and France; Russia withdrew in 1927; did not control substitute palladium prices; may be related to 47B
Real prices 1919-1927, compared to non-cartel period 1929-1931; peak is 1924
74 122 Suslow (2001: 56), Hexner (1946: 235-
237)
47D. The third international platinum miners’ cartel began Oct. 1931 with establishment of
Real prices in 1932-1933 compared to 1930-31; 1932 is 4.6 11 Suslow (2001: 56),
Hexner (1946: 235-
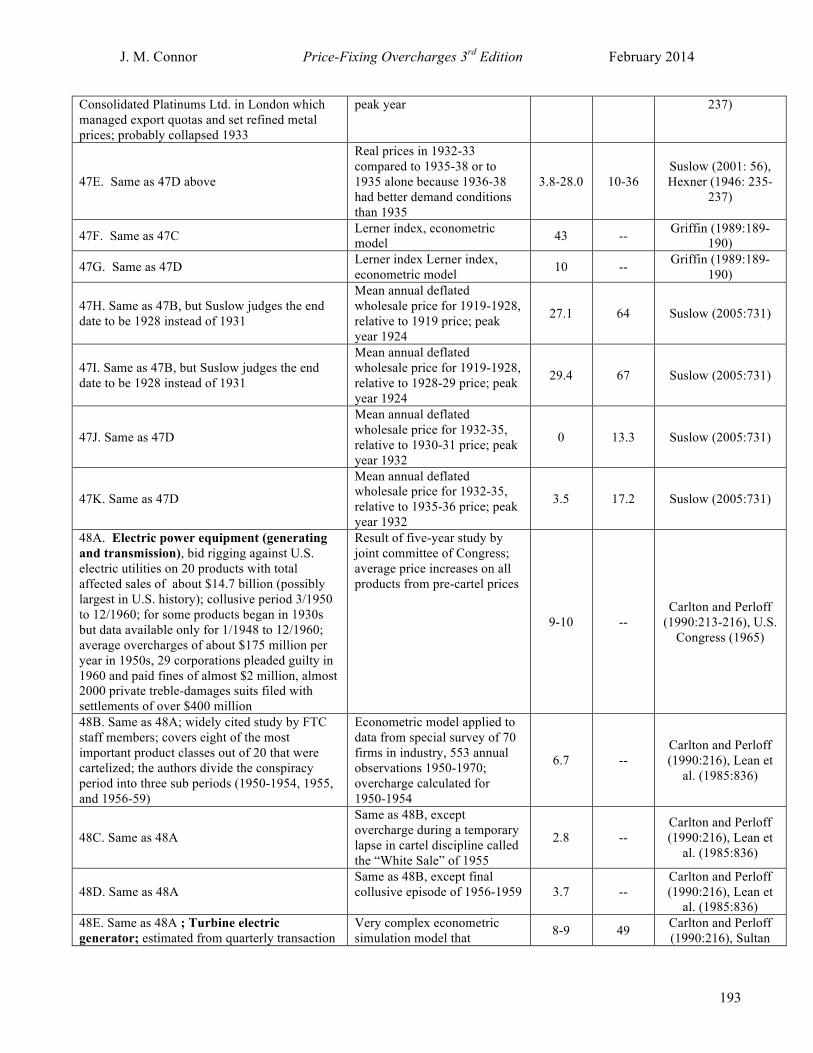
J. M. Connor Price-Fixing Overcharges 3rd Edition February 2014
193
Consolidated Platinums Ltd. in London which managed export quotas and set refined metal prices; probably collapsed 1933
peak year 237)
47E. Same as 47D above
Real prices in 1932-33 compared to 1935-38 or to 1935 alone because 1936-38 had better demand conditions than 1935
3.8-28.0 10-36 Suslow (2001: 56), Hexner (1946: 235-
237)
47F. Same as 47C Lerner index, econometric model 43 -- Griffin (1989:189-
190)
47G. Same as 47D Lerner index Lerner index, econometric model 10 -- Griffin (1989:189-
190)
47H. Same as 47B, but Suslow judges the end date to be 1928 instead of 1931
Mean annual deflated wholesale price for 1919-1928, relative to 1919 price; peak year 1924
27.1 64 Suslow (2005:731)
47I. Same as 47B, but Suslow judges the end date to be 1928 instead of 1931
Mean annual deflated wholesale price for 1919-1928, relative to 1928-29 price; peak year 1924
29.4 67 Suslow (2005:731)
47J. Same as 47D
Mean annual deflated wholesale price for 1932-35, relative to 1930-31 price; peak year 1932
0 13.3 Suslow (2005:731)
47K. Same as 47D
Mean annual deflated wholesale price for 1932-35, relative to 1935-36 price; peak year 1932
3.5 17.2 Suslow (2005:731)
48A. Electric power equipment (generating and transmission), bid rigging against U.S. electric utilities on 20 products with total affected sales of about $14.7 billion (possibly largest in U.S. history); collusive period 3/1950 to 12/1960; for some products began in 1930s but data available only for 1/1948 to 12/1960; average overcharges of about $175 million per year in 1950s, 29 corporations pleaded guilty in 1960 and paid fines of almost $2 million, almost 2000 private treble-damages suits filed with settlements of over $400 million
Result of five-year study by joint committee of Congress; average price increases on all products from pre-cartel prices
9-10 -- Carlton and Perloff
(1990:213-216), U.S. Congress (1965)
48B. Same as 48A; widely cited study by FTC staff members; covers eight of the most important product classes out of 20 that were cartelized; the authors divide the conspiracy period into three sub periods (1950-1954, 1955, and 1956-59)
Econometric model applied to data from special survey of 70 firms in industry, 553 annual observations 1950-1970; overcharge calculated for 1950-1954
6.7 -- Carlton and Perloff (1990:216), Lean et
al. (1985:836)
48C. Same as 48A
Same as 48B, except overcharge during a temporary lapse in cartel discipline called the “White Sale” of 1955
2.8 -- Carlton and Perloff (1990:216), Lean et
al. (1985:836)
48D. Same as 48A Same as 48B, except final collusive episode of 1956-1959 3.7 --
Carlton and Perloff (1990:216), Lean et
al. (1985:836) 48E. Same as 48A ; Turbine electric generator; estimated from quarterly transaction
Very complex econometric simulation model that 8-9 49 Carlton and Perloff
(1990:216), Sultan

J. M. Connor Price-Fixing Overcharges 3rd Edition February 2014
194
prices 1948-1963 from industry trade association; Sultan concludes that conspiracy was “ineffectual” (p ix) and had no “measurable impact on price… when measured with the dummy variable technique” (p.111); yet hidden in an appendix is a Version II model cited by Carton and Perloff that includes both direct and indirect effects; this analysis finds positive 1960-72 price differences, which seem to be due to tacit behavior
compares average 1955-59 prices with and without conspiracy effects; average price differences are much larger in 1958-1960 than after 1960; maximum effect is 1960
(1975:346-348)
48F. Same as 48A ; Large electric power transformers 1947-late 1959
Simple comparison of defendants’ transaction prices with the 10 quarters of prices after the cartel was prosecuted; peak prices 1956
30-38 90 Kuhlman (1967: 553)
48G. Same as 48A; a journalistic monograph of the U.S. electrical equipment conspiracy based on interviews, court proceedings, and Congressional hearings
Comparison of “book” (list collusive ) prices in 1950-1954 with late 1949 and early 1955 price war “discounted” prices, all products
-- 40-45 Smith (1963: 110)
48H. Same as 48A above, but for one product, large electrical circuit breakers
Benchmark price in winter of 1957-1958 price war among members of the electrical circuit breakers cartel, compared to previous book prices 1950-1956
60 60 Smith (1963: 112)
48I. Same as 48A above, large electrical switchgear
Same as 48H above for 1958 prices -- 40-45 Smith (1963: 114)
48J. Same as 48A and E, except 1950-1959 period; decision from a bench trial in Ohio Valley Electric v. General Electric
Judge compared actual prices paid with post-conspiracy prices and adjusted the price difference downward to account for a number of changes in demand and supply conditions
21 -- Finkelstein and Levenbach (1983)
48K. Same as 48A, except steam turbine generators 1950-1960; estimates made by two academic economists in late 1962 working for the Anti-Trust Investigation Group, a consortium of 164 plaintiffs’ counsel for the 1,912 treble-damage suits;
But-for prices were before, during, during, and after (1948, 1950, 1955, and 1961) with the last year giving the largest overcharges; analysis used both list prices and buyers’ prices paid from 1948 to end of 1961 and corrected price increases for labor and material costs; “conservative” Blue Book figures used all four years
10-11 -- Bane (1973:217-219)
48L. Same as 48A and H, large circuit breakers 1956-1959 Same as 48K above 28 -- Bane (1973:217-219)
48M. Same as 48A and K above, large power transformers 1956-1959 Same as 48K above 37 -- Bane (1973:217-219)
48N. Same as 48A and K above, except watt-hour meters 1956-1959 Same as 48K above 13 -- Bane (1973:217-219)
48O. Same as 48A; result of a jury trial in 1964 in Philadelphia Electric v. General Electric et
Jury decision on actual damages 8.7 -- Bane (1973:314)

J. M. Connor Price-Fixing Overcharges 3rd Edition February 2014
195
al. for a mix of products purchased by the plaintiff 48P. Same as 48A; result of a bench trial in 1964 in Ohio Valley Electric v. General Electric et al.
Bench decision on actual damages 11 -- Bane (1973:314)
48Q. Same as 48A; result of a court’s special master’s analysis, Prof. Kessel of the Univ. of Chicago, in Atlantic City Electric v. I-T-E Circuit Breaker trial; plaintiffs included Gulf State and Kansas City Power and Light; after the Special Master’s report was issued, I-T-E quickly settled
Range of estimates is for different mix of purchases by two utilities
21-24 -- Bane (1973:217-219)
48R. Same as 48A and E Previous estimate in 48E is from the text; this one is from Table A18.4 for 1955-59
13.3 -- Sultan (1975:348)
48S. Same as 48A, but in Ohio Valley Electric Corp. v. General Electric Co., 244 F. Supp. 914 (SDNY 1965) the court found that there was bid rigging against the Ohio Valley Electric Corp.
Reading of the court decision 10.9 -- Appendix Table 4: entry 13 below
49A. Oft-replicated classic empirical study of the "Joint Executive Committee," a famously unstable U.S. railroad cartel that fixed prices and market shares on transport from Chicago to East Coast cities for 328 weeks from 1880 to 1886 prior to the passage of the Sherman Act; JEC had 3 members in 1880 but accommodated two more entrants during its life by reallocating shares; one Canadian railroad joined the cartel. Degree of collusion (CMI) was 40% of monopoly price for the cartel’s entire life.
Average price increase during “cooperative periods” identified by the JEC’s detailed internal records from an econometric model
66 -- Porter (1983), Ulen (1980)
49B. Same as 49A; an econometric analysis of the Joint Executive Committee, one of the most intensely examined cartels in history; the model specifies both demand and supply relationships and, unlike Porter (1983), corrects for serial correlation; Ellison calculates the "degree of collusion" reached 80% of monopoly price.
To derive the average equilibrium price during collusive periods, one must solve the supply equation for logP in terms of estimated coefficients
50.8 -- Ellison (1994: Table
2, p.42), Ellison (2003)
49C. Same product market as 49A, except for 1871-74 duopoly period prior to the JEC period; distinguishes between “warm” months when Great lakes shipping via Buffalo was competitive with rail and “cold” months when ships could not sail.
Author’s econometric model uses 1871-1898 data on 56 semiannual observations of real prices of grain shipments; controls for a few railroad costs and demand factors; “winter” (cold weather) rates
24.4 -- Briggs (1989:201)
49D. Same as 49C above
Same as 49C above except rates when there was a large fringe of ships competing with two railroads in warm months
19.5 -- Briggs (1989:201)
49E. Same as 49A above; the period of interest is during operation of the JEC when there were 4 and then 5 members in the cartel
Econometric model estimates that cold-weather and warm-weather rates have the same price effects
15.5 -- Briggs (1989:201)
49F. Same as 49A Same as above except warm-weather rates 15.5 -- Briggs (1989:201)

J. M. Connor Price-Fixing Overcharges 3rd Edition February 2014
196
49G. Same as 49A; model is based on weekly prices; has two equations solved simultaneously, which allows for feedback effects; covers only the JEC cartel period; has a greater array of controls for demand and supply shifters, including market concentration
Alternative model specifications result in some variation in the estimated coefficient for price; larger effects are highly significant
13.7-30.8 -- Briggs (1989:203)
50A. Quebracho (tanning agent) cartels organized voluntarily by about 20 Latin American and 1 UK firm in four agreements 1916-17, 1919-22, 1926-31, and 1935-44; sellers’ cartels were “reinforced by decrees of the Argentinean and Paraguayan governments”; nevertheless, the cartel’s U.S. agents were prosecuted by the DOJ in 1942; this analysis refers to the 3rd episode
New York import prices for 1926-30 compared to 1923-25 “before” prices from Hexner (1946)
5 --
Hexner (1946: 281), Suslow (2001: 57),
Wallace and Edminster
(1930:359-361)
50B. Same as 50A above, except for 2nd episode, years 1919-1922
Real prices in 1920-22 taken from Berge (1944) compared with 1924-1925; peak is 1920
12.4 15 Suslow (2001: 57), Berge (1944: 112-
120)
50C. Same as 50A above Real prices in 1926-31 compared with 1924-1925 and with 1932-34; peak is 1930
26 45-60 Suslow (2001: 57), Berge (1944: 112-
120)
50D. Same as 50A above, except for 4th episode, years 1935-1942
Real prices in 1935-39 compared with 1932-34; peak is 1939
23 35 Suslow (2001: 57), Berge (1944: 112-
120)
50E. Same as 50A above NY import prices for 1935-39 compared to 1932-33 52 -- Hexner (1946: 281)
50F. Same as 50A above
Eckbo’s interpretation of Hexner and information from the 1942 U.S. antitrust indictment
50+ -- Eckbo (1976: 38-39), Hexner (1946: 279-
281)
50G. Same as 50A above, but Eckbo extends dates to 1934-1946 Same as 50F above 50+ --
Eckbo (1976: 38-39), Hexner (1946: 279-
281) 50H. Same as 50A above; information from Congressional testimony in 1942 and from court documents when six trading companies pleaded nolo in 1942
Last of six price increases from Nov. 1934 to Jan. 1941, compared to pre-Nov. 1934 price
-- 95 Berge (1944:118)
50I. Same as 50A Real prices in 1926-31 compared with 1932-34; peak is 1930
40 45-60 Suslow (2001: 57), Berge (1944: 112-
120)
50J. Same as 50B
Mean annual deflated wholesale price for 1920-24, relative to 1920 price; peak year 1920
0 0 Suslow (2005:732)
50K. Same as 50B
Mean annual deflated wholesale price for 1920-24, relative to 1923-25 price; peak year 1930
17.8 46.7 Suslow (2005:732)
50L. Same as 50A
Mean annual deflated wholesale price for 1926-32, relative to 1923-25 price; peak year 1930
10.2 28.9 Suslow (2005:732)
50M. Same as 50A Mean annual deflated wholesale price for 1926-32, relative to 1932-33 price; peak
25.5 46.8 Suslow (2005:732)

J. M. Connor Price-Fixing Overcharges 3rd Edition February 2014
197
year 1930
50N. Same as 50D
Mean annual deflated wholesale price for 1933-39, relative to 1932-33 price; peak year 1939
20.3 0 Suslow (2005:732)
50O. Same as 50D
Mean annual deflated wholesale price for 1933-39, relative to 1939 price; peak year 1939
0 0 Suslow (2005:732)
51. Ready-mix concrete bid-rigging cartel in Denmark, January 1994 to January 1996; prices on several grades from 18 sites; collusion was facilitated by detailed price reports issued by the Danish Competition Authority that made previously secret discounts known to sellers; study controls for costs; no mention of prosecution
Average prices compared to quarter before new government price reporting began
19 25 Albaek et al. (1997:433,440)
52A. Bid rigging of English oral auctions of 340 quality-graded used 1988 Chevrolet Caprice police cars, New York City, January 1990-May 1991; alleged bidding ring (buyers’ cartel) active in 3 of 13 auctions; reduced price received by City of NY; civil case settled out of court
Ratio approach statistical analysis of Howard and Kaserman (1989); mean of three auctions -17.1 -22.4 Nelson (1993:385)
52B. Same as above
Dummy variable model following Howard and Kaserman (1989); from Equation 1
-16.6 -21.4 Nelson (1993:390)
53. Bid rigging ring in Washington, DC of 680 houses sold at public auction (mortgage foreclosures or NISI proceedings), Jan. 1967-August 1990, followed by English “knockout” auctions among ring members to distribute profits; reduced prices received by DC govt.; 6 members pled guilty, 6-9 found guilty at trial.
Econometric model with almost perfect fit to sample of bids by members found guilty at trial; model accounts for complex profit payout system
-32.5 -59 Kwoka (1997: Tables 1 and 2)
54. Regional market power of AMPI dairy cooperative with 30,000 members; concerns 1972-April 1975 period (up to date of DOJ consent decree) power over raising farm milk prices
Econometric dummy-variable model of the price premium in markets with average market shares, relative to post-decree margin, as a proportion of U.S. average blend price of farm milk
3.0-4.0 -- Madhaven et al.
(1994: Tables 1 and 4)
55. Intensive case studies of 40 cartels in UK manufacturing before and after the 1956 antitrust legislation and Restrictive Practices Court decisions from 1959 and later made 85% of the sample cartels illegal. Despite strong demand increases and moderate inflation in early 1960s, 39 of 40 cartels showed significant price declines.
Change in nominal wholesale UK prices reported by sellers or major buyers from 1956-59 price levels to various periods following first negative Court ruling in 1959
0-30 -- Swann et al. (1974: 156-57, 166)
56. Same as 55 above, UK wire ropes, non-marine, 1956-59
Price 36 months after negative ruling 15.3 -- Swann et al. (1974:
156-57, 166) 57. Same as 55 above, UK porcelain sanitary bathroom fixtures, 1956-59
12 months after 20.0 -- Swann et al. (1974: 156-57, 166)
58. Same as 55 above, UK steel pipes, sewage 36 months after 25.0 -- Swann et al. (1974:

J. M. Connor Price-Fixing Overcharges 3rd Edition February 2014
198
and drainage, 1956-59 156-57, 166) 59. Same as 55 above, UK rubber and plastic coated cable, 1956-59
6 months after 25-30 -- Swann et al. (1974: 156-57, 166)
60. Same as 55 above, UK small electric motors, 1956-59
36 months after 20-25 -- Swann et al. (1974: 156-57, 166)
61. Same as 55 above, UK electric meters; probable bid rigging against government electricity-generating companies
72 months after, as reported by one buyer 15.0 -- Swann et al. (1974:
156-57, 166)
62. Same as 55 above, UK carpets, mechanically woven, 1956-59
Up to 10 years later 0 -- Swann et al. (1974: 156-57, 166)
63. Same as 55 above, UK iron bath tubs, 1956-59
Average 1965-69 prices 30+ -- Swann et al. (1974: 156-57, 166)
64. Same as 55 above, UK steel drums, 1956-59
Average 1960-69 prices -- 10 Swann et al. (1974: 156-57, 166)
65. Same as 55 above, UK electricity transformers, largest sizes; probable bid rigging against government electricity-generating companies, 1956-59
Average 1960-1970 prices
-- 25 Swann et al. (1974: 156-57, 166)
66. Same as 55 above, UK electricity transformers, system and distribution; probable bid rigging against government electricity-generating companies, 1956-59
Average 1960-1970 prices
-- 25-41 Swann et al. (1974: 156-57, 166)
67. The U.S. cane Sugar Trust was formed in Nov. 1887 and had a near monopoly in the Eastern U.S. until late 1889 (1st episode); followed by a price war with large entrant Spreckles from 1/1890 to 6/1892; 2nd monopoly mid 1892 to7/1898 (2nd episode); 2nd price war when 2 entrants appear 9/1892-6/1900; then "mixed regime"oligopoly (3rd episode); finally break up of cartel when U.S. sues 1/1910 to 1914 (4th episide). The 5th episode was the Istitute 12/1927-1936.
Jenks and Clark (1929: 82-98) ,
Genesove and Mullin (2001:382), Boone and Leuvensteijn
(2010)
67A. First, monopolistic episode was effective in eastern U.S. until the large Spreckels factory in Philadelphia opened in mid 1889; collusion is signaled by a rise in the gross margin from its pre-cartel level of $0.50 to $0.75/lb. When the Trust gave up trying to drive the new entrant out of the market in 1900, authors believe margins returned to normal until 1914.
The increase in gross margins in 1888-89 divided by the average wholesale price in the three years before Trust was formed; peak is Sept. 1889; UK and German yardsticks show that no technological change affected prices
6-14 15 Jenks (1900:133-
145), Jenks and Clark (1929: 82-98)
67B. Same as 67A, except a 2nd monopolistic episode that began in mid 1892 when the Trust bought out Spreckels; episode ended when a new rival firm (Arbuckle) appeared in Sept. 1898
The increase in gross margins in 1892 to mid 1898 relative to average price 1/1892-9/1898; peak is ca. June 1896
7-9 16 Jenks (1900:133-145)
67C. Authors distinguish 4 episodes: 1st cartel, 2nd cartel, a "mixed regime" of oligopoly, and the break-up period (4th episode). Authors fit a new index of low market power (the Profit Elasticity) econometrically to the Genosove and Mullin data fot the 2 price-war periods.
find that the PE is highest, as expected, during the 2 competitive interludes, the duopoly price war and the triopoly price war
1.5 16.6 Boone and
Leuvensteijn (2010), Boone (2011)
67D. Same as 67A and 67B combined "monopoly regime": 1st cartel and 2nd cartel episodes.
find that the PE is lowest, as expected, during the 2 cartel episodes; figures are increases
9.5 16.6 Boone and
Leuvensteijn (2010), Boone (2011)

J. M. Connor Price-Fixing Overcharges 3rd Edition February 2014
199
from price-war levels in 67C
67E. The "mixed regime" of oligopoly between the Trust and episode with 2 rivals (1900Q3-1909Q4). This estimate refers to the mixed "ologopoly" period (3rd episode).
find that the PE is at a moderate level, as expected, during the oligopoly period; overcharges are increases from price-war levels in 67C
4.6 10.1 Boone and
Leuvensteijn (2010), Boone (2011)
67F. In the break-up period (4th episode), Trust is sued by Justice Dept., but also begins to dissolve voluntarily after the Std. Oil case decision in 1911.
find that the PE is close to price war level, as expected; overcharges are increases from price-war levels in 67C
1.8 10.1 Boone and
Leuvensteijn (2010), Boone (2011)
67G. From “narrative evidence,” weekly memos of meetings of the Sugar Institute, a trade assn. of the 14 U.S. cane sugar refiners from Dec. 1927 to 1936 (4th episode) when Supreme Court declared it to be an illegal cartel; Institute achieved higher prices solely through collusion on trading rules, in face if increasing competition from beet sugar and imports
Comparison of prices in relatively competitive period 1926-27 (Lerner Index was 0.031) to cartel period (Lerner ave. 0.085 and monopoly index 0.110) and adjusts for only source of cost changes (raw cane sugar)
6.3
11.9 (calcu- lated to be 95%
of monopoly price)
Levenstein and Suslow (2001: 42)
Genesove and Mullin (2001:382),
67H. Same as 67G above But-for price is from 1937-1939, after the 4th episode ends
1.1 -- Genesove and Mullin (2001:382)
67I. Same as 67B (part of 2nd episode); Eastern U.S. Sugar Trust Am. Sugar Refining Co.’s market share fell from 91% in 1892 to 71-86% in 1893-97 to below 62% after 1901; study finds 4 periods of effective collusion (authors do not treat them as different episodes, but I impose the ones asserted by other authors above). [NB the 1890-1914 cartel price averages 70% to 83% of the pure monopoly price]
From a quantitative NEIO model fitted to 1890-1914 price, demand, and cost data; elasticity-adjusted Lerner indexes significantly greater than zero for 1893-1897, between two price wars; peak 1893
23.4 39.0 Genesove and Mullin (1998:368)
67J. Same as 67B (part) Elasticity-adjusted Lerner indexes significantly greater than zero for 1901-02
15.5 20.0 Genesove and Mullin (1998:368)
67K. Same as 67C Elasticity-adjusted Lerner indexes significantly greater than zero for 1908
7.0 7.0 Genesove and Mullin (1998:368)
67L. Same as 67D Elasticity-adjusted Lerner indexes significantly greater than zero for 1913
3.0 3.0 Genesove and Mullin (1998:368)
67M. 67B+67C+67D (1890-1924 average)
Elasticity-adjusted Lerner indexes, including 17 years non- significantly greater than zero
11.8 29.0 Genesove and Mullin (1998:368)
68. History of several brief early attempts (beginning in 1847, 1862, and 1885) at forming national zinc cartels in France and Belgium that held stocks of zinc off the market to raise prices; the first was “successful” for 13 years (viz., 1847-60), the others were not.
-- -- Devos (1994)
68A. The first national episode was “successful” for 13 years (viz., 1847-60), the others were not.
Historical case study, but no price data discussed; method unclear
1 -- Devos (1994)
68B. First international zinc export cartel (and 4th episode) began 1910, ended Sept. 1914; included all the largest firms in AT, BL, UK,
No prices available, but characterized by Plummer as a “weak” cartel
1 -- Plummer (1934:102), Benni et al. (1930)

J. M. Connor Price-Fixing Overcharges 3rd Edition February 2014
200
FR, DE, and NL with 62% of world production; the large US market was protected by tariffs. 68C. Second international zinc cartel (5th episode); organized like 68A, but began Sept. 1928, revised in Jan. 1929, and dissolved Dec. 1929 because market price stayed above its target price; members signed only 3-month contracts
A “weak” cartel also, presumably because of the cartel’s low target prices
1 -- Plummer (1934:102), Benni et al. (1930)
68D. Same as 68C; Griffin gives different dates for the 2nd international zinc cartel: May 1928-late 1929
Lerner index estimated from an econometric model 27 --
Griffin (1989:189-190), Hexner (1946:249)
68E. Same as 68C; members included all major European producers; monthly agreements on production cuts of 5% to 10%; no control over new electrolytic-zinc process factories and friction between vertically integrated and nonintegrated members
European prices from Mar. 1929 to lowest level in May 1931
63 -- Elliott et al. (1937)
68F. The 3rd intl. cartel: a revival of the 1928-29 European cartel with Australia and Canada added; output adjusted every 3 months if price exceeded or fell below £24/t; mid 1931-1934 (or 1935)
Lerner index estimated from an econometric model 13 --
Griffin (1989:189-190), Hexner
(1946:249), Plummer (1934:102-103)
68G. Same as 68F; beginning in July 1931 and continuing through 1933, European producers reduced production to 45% below rated capacities; stocks reached normal levels by 1933 causing prices to rise through mid 1934; end date unclear
No precise data provided, but analysis consistent with 68E above
1 -- Elliott et al. (1937:764)
68H. Historical case study based on internal memorandums of 4th international zinc cartel; the Zinc Producers Group of 22 companies in Australia, UK, Germany, France, Spain, and Canada; formally in operation from 1945 to 1975 using output restraints, purchases of stocks, list price targets, and manipulation of the zinc contracts on the London Metals Exchange; refers to 1945 to about 1963
Examination of cash prices on the London Metals Exchange, but method of analysis unknown
0 0 Tsokhas (2000: Table 1)
68I. Same as 68H, except July 1964 to Dec. 1968
But-for price is 1960-62 or 1961-63 average f.o.b. cash prices on the London Metals Exchange compared to July 1964 - Dec. 1968 average; peak is 1965 average
39-46 53 Tsokhas (2000: Table 1)
68J. Same as 68H, except 1969 to 1975
Examination of cash prices on the London Metals Exchange, but method of analysis unknown
0 0 Tsokhas (2000: Table 1)
68K. Same as 68A, except the second national episode (1862-?) was “unsuccessful.”
Historical case study, but no price data discussed; method unclear
0 -- Devos (1994)
68L. Same as 68A, except the third national episode (1885-?) was “unsuccessful.”
Historical case study, but no price data discussed; method unclear
0 -- Devos (1994)
69A. Same companies (from 6 countries), conduct, and similar time period as 68H above,
Base period is 1960-64 or 1961-65 LME cash contract 34-53 49-69 Tsokhas (2000: Table
2)

J. M. Connor Price-Fixing Overcharges 3rd Edition February 2014
201
1945-1967, except for the Lead Producers Group; price increases effective only in 1965-1967.
prices; collusive period is 1965-1967; peak is 1966
69B. Lead cartel, all leading mining and smelting companies in 8 countries, signed an agreement 11/1/38, abandoned 9/39, but considerable doubts about whether agreed reductions in sales were ever implemented
London spot exchange prices Nov. 1938 to August 1939 0 -- Hexner (1946: 230)
69C. International lead cartel 1921-1923 Lerner index from econometric model 17.0 -- Griffin (1989:189-
190) 69D. This author states that there were no (effective?) international agreements prior to April 1931, the month by which London prices had declined by 60% since 1929; in 1930 and 1931 the Lead Producers’ Association cut non-US production by 80-85%
Production quotas caused late 1931-1932 prices to rise above the lowest previous price observed in June 1931
10-50 -- Elliott (1937:662)
69E. Same as 69A, but for years 1945 to 1964
Examination of cash prices on the London Metals Exchange, but method of analysis unknown
0 0 Tsokhas (2000: Table 2)
69F. Same as 69A, but for years 1968 to 1975
Examination of cash prices on the London Metals Exchange, but method of analysis unknown
0 0 Tsokhas (2000: Table 2)
69G. Same as 69A; refers to Rio Tinto-led cartel from 1964 to 1976; share of world production was very low -- about 55%
Cartels tried to manipulate prices on the London Metal Exchange; no method cited
0 0 MacKie-Mason and Pindyck (1987: 210)
70A. South African cement cartel fixed prices and quotas from at least 1922 to 1994; adopted a multiple basing-point pricing system in 1956; legally exempted after 1986 by the So. African Competition Board, which reversed its position in 1995; Leach‘s extensive apologia of cartels fails to criticize the Natal-import episode
Prices set by cartel in Natal area compared to bulk prices charged by a new importer of Spanish cement in 1984-85; cartel later cut prices in Natal by 24% and drove importer out of business
5-10 --
Fourie and Smith (1994:130), Leach (1994), Levenstein and Suslow (2001:
42)
70B. Same as 70A above
Authors derive average 1972-1990 mark-up by comparing cement price-cost margins with those in buildings-materials mfg. and all manufacturing
17-26 -- Fourie and Smith (1995)
71. Historical/political-science study of the So. African gem diamond cartel, the Diamond Syndicate, that got control of all major mines in 1888 and began to reduce sales in that year; news reports say that the cartel gave up supply control around 1998 in favor of a new strategy that emphasizes building the De Beers brand of diamonds at retail. In the 1990s, new supplies of yellow-brown gem diamonds were discovered in Australia and later in Canada. In 2008, a secret supply arrangement between De Beers and Alrosa of Russia (the 2nd-largest supplier of white gem diamonds) that began in the 1950s was ended in 12/2008 by a decision of the EC in 2006; this may have been the final blow to the cartel’s formal supply control. In 2013 Alrosa
Prices in 1889 to 1890 compared to 1888
50 80
Spar (1994), Levenstein and
Suslow (2001: 42), EC (2/22/2006)

J. M. Connor Price-Fixing Overcharges 3rd Edition February 2014
202
opened a public rough-diamond exchange. 72A. A mercury export cartel (“Mercurio Europeo”) organized in 1928 by one Spanish and two Italian mines, each with partial or full government ownership; together with a side agreement with a Mexican mine, the cartel controlled 60-70% of world exports in late 1940s; cartel reserved home markets for each company and operated exports through joint sales agents first in Switzerland, later in London and in the importing countries; interrupted briefly by Spanish Civil War in 1936
Eckbo’s interpretation of case studies by others; prices may refer to export markets that were subject to antitrust actions
50+ --
Eckbo (1976:33), Hexner (1946: 232-
233); MacKie-Mason and Pindyck
(1987:192-203)
72B. Same as 72A above, except for 1939-1949; in late 1949 one Italian mine was accused of cheating on a sale to the U.S. government stockpile; the Spanish mine cut prices to the Italian mine’s cost of production for 10 months in 1951
Eckbo’s interpretation of case studies by others; prices may refer to export markets that were subject to antitrust actions
50+ --
Eckbo (1976: 33), Hexner (1946: 232-
233); MacKie-Mason and Pindyck
(1987:192-203)
72C. Same as 72B above from period when sole selling agency was established in London until it was nationalized by the UK government in 1942
Eckbo’s assumption on the basis of the UK nationalization 50+ -- Eckbo (1967: 40)
72D. Same as 72A; from an early economic study of international cartels, most of them European based; writing at the beginning of the Great Depression, the author is more impressed by the failures of cartels to raise prices than their successes; of scores of private cartels studied, only two have data on their price effects, one of them the international mercury cartel, which controlled 88% of global supply in 1927 and 58% in Aug. 1932, during a period of rapidly falling demand
Price change from May 1931 to August 1932 in UK, from information in previously published economic studies and press accounts; author interprets failure to stop fall in prices as evidence of ineffectiveness
-- -58 Plummer (1934:149-152)
72E. Same as 72A above, except dates of operation are 1926-30; in 1931 mercury cartel control dropped to 57%; prices are minimum ones from annual League of Nations series
Average 1926-30 prices compared to relatively competitive 1932-35 period; peak is 1926
99 126 Oualid (1938:22-23)
72F. Same as 72A and 72B combined Lerner index, econometric model 52.0 -- Griffin (1989:189-
190)
72G. Same as 72A, except 1954-1970 Lerner index, econometric model 73.0 -- Griffin (1989:189-
190)
72H. Same as 72A, except 1975-1982 Lerner index, econometric model 30.0 -- Griffin (1989:189-
190)
72I. Same as 72B Average 1947-1949 world export prices are compared to 1950 price; peak is 1947
3.3 11.2 MacKie-Mason and Pindyck (1987:192-
203)
72J. Same as 72B
Average world export price 1947-1949 compare to conservative estimate of costs of production of high-cost mine in cartel; peak is 1947
20.4 29.6 MacKie-Mason and Pindyck (1987:192-
203)
72K. Same as 72G for slightly different 1951-1970 period
Average 1951-1970 world export price compared to the 1950 price; peak is 1965
191.7 407 MacKie-Mason and Pindyck (1987:192-
203) 72L. Same as 72G for slightly different 1951-1970 period
Average 1951-1970 world export price compared to 239.9 490 MacKie-Mason and
Pindyck (1987:192-

J. M. Connor Price-Fixing Overcharges 3rd Edition February 2014
203
average total costs of production; peak is 1965
203)
72M. Same as 72H Average 1951-1970 world export price compared to non-cartel 1972 price; peak is 1965
94.7 239 MacKie-Mason and Pindyck (1987:192-
203)
72N. Same as 72H
Authors use a formal cartel model and estimates of elasticities to predict the peak 1965 price for the Italian member of the cartel
-- 391 MacKie-Mason and Pindyck (1987:202)
72O. Same as 72H
Authors use a formal cartel model and estimates of elasticities to predict the peak 1965 price for the Spanish member of the cartel
-- 454 MacKie-Mason and Pindyck (1987:202)
73A. From 1897 to 1919, the German potash cartel, the Deutche Kali Syndikat, which contained a mix of private and state-owned mines, had a near monopoly on world exports; Newman states that industry was nationalized and all producers compelled to join the cartel in April 1919; Schroeter judges that the cartel began as early as 1876 and that the Prussian state began controlling the cartel in late 1910; Tosdal believes start date is 1879
In June 1909 the cartel’s contract expired and three dissident members signed contracts with U.S. importers at prices well below the 1908- early 1909 U.S. c.i.f. import price
45+ --
Newman (1948: 578), Schroeter (1994), Tosdal
(1916)
73B. Same as 73A above
As interpreted by Levenstein, prices in 1910 reached “double average costs” -- 50+
Levenstein (2000), Schroeter (1994),
Spar (1994), Levenstein and
Suslow (2001: 42)
73C.Same as 73A above German price of chloride of potash in 1878 compared to the 1896-1906 average
55 -- Levy (1927:295)
73D. Same as 73A above Estimates price-cost margin in 1910 to be 200%; costs appear to be close to LRMC
100+ -- Schroeter (1994:76)
73E. First international potash cartel formed in August 1924, after deep price cuts during 1919-1923; voluntary agreement between the German and French national (both were government-controlled) cartels to set prices and quotas (70%, 30% respectively) for U.S. (and eventually world) exports; in 1929 the only significant U.S. producer was secretly bought and controlled by the German cartel up until 1942; lasted in its original form until 1932; overcapacity was cut and the industries rationalized, causing production costs to decline in 1920s and 1930s; no cost changes in 1920s
U.S. import prices of Manure salts (20% potash) set at start of cartel compared to competitive 1909-10 U.S. import prices
25.8 --
Newman (1948: 583), Schroeter
(1994:77) , Wallace and Edminster
(1950:105)
73F. Same as 73E above Same as 73E for muriate of potash (51% potash) 42.7 -- Newman (1948: 583)
73G. Same as 73E above Same as 73E for sulfate of potash (49% potash) 50.7 -- Newman (1948: 583)
73H. Same as 73E above Change in U.S. import prices from September 1924 to May 65.2 -- Newman (1948: 583)

J. M. Connor Price-Fixing Overcharges 3rd Edition February 2014
204
1929 for manure salts
73I. Same as 73E above Change in U.S. import prices from September 1924 to May 1929 for muriate of potash
12.4 -- Newman (1948: 583)
73J. Same as 73E above Change in U.S. import prices from September 1924 to May 1929 for sulfate of potash
11.4 -- Newman (1948: 583)
73K. Second international cartel; Polish producers were added in 1932 as members and given a 4% export share; Spanish production expanded rapidly under French and British ownership from 1932 to 1934 when it captured 33% of U.S. market
Prices of U.S. imports in 100%-potash-equivalents fell from 1933 to 1934 because of Spanish entry into the world export market
71.6 -- Newman (1948: 584)
73L. Third international cartel; signed a new agreement with Spanish producers in 1935 giving them 15% world export share; outbreak of Spanish Civil War in 1936 reduced Spain’s exports; new Russian and Palestinian mines co-opted (added to cartel in 1936); probably ended Sept. 1939; convicted by US of antitrust violations, but remedies unenforceable.
Same as 73E above for years 1934 to 1937-1941
37.7 -- Newman (1948: 583)
73M. Unlike most other authors, Oualid views 1st, 2nd, 3rd international potash cartels 1926-35 (73E + 73K + 73L) as one continuous cartel episode
Compare average 1927-35 German potash prices with price in 1926; peak is 1934
24 33 Oualid (1938:26)
73N. Same as 73M Compare 1926-35 French prices with 1926; peak is 1927-29
40 46 Oualid (1938:26)
73O. Same as 73M Lerner index 36.0 -- Griffin (1989:189-190)
73P. Same as 73E; Schroeter ascribes price increase to a renewed agreement in May 1925 that adjusted the French-German export quotas and set of 50-50 common sales agencies in the importing countries.
Berlin potash prices in late 1925 compared to 1924 and early 1925 prices
50+ -- Schroeter (1994:78)
73Q. Same as 73E Average Berlin prices in 1928-1932 relative to 1924 prices 55-65+ -- Schroeter (1994:80)
73R. Polish potash mines opened in 1927 and were admitted to intl. cartel with a national hegemony and a 4% export share in 1932; Russian cartel entered with a 10% quota in April 1934; but failure to incorporate large Spanish production from 1932 to May 1935 was the cause of a price crash in 1934-35
Berlin prices in 1928-32 relative to 1934-35; peak price in 1931
73 89 Schroeter (1994:80)
73S. Same as 73E; in May 1935 Spanish producers were allotted a national hegemony and a 15% world export share; U.S. producers made a secret agreement in 1935 to follow the intl. cartel’s prices, for which they were found guilty in US court in 1940
Berlin prices in 1936-37 after Spain joined cartel compared to 1934-35
26 -- Schroeter (1994:78)
73T. Same as 73A
Compares prices in 1908 with prices offered during cartel suspension on two-year 1909-1910 contracts to US importers
25-40 40 Wallace and Edminster (1950:97)
73U. Same as 73E Compares average 1926-28 7.8 13.5 Wallace and

J. M. Connor Price-Fixing Overcharges 3rd Edition February 2014
205
muriate of potash US import prices with period of weak cartel power 1924-25; peak is 1928
Edminster (1950:105)
73V. Same as 73E
Compares average 1926-28 potash sulphate US import prices with period of weak cartel power 1924-25; peak is 1928
6.1 11.3 Wallace and Edminster (1950:105)
73W. Same as 73E
Compares average 1926-28 manure salt US import prices with period of weak cartel power 1924-25; peak is 1928
19.2 27.4 Wallace and Edminster (1950:105)
73X. Same as 73E
Compares average 1926-28 kainite of potash US import prices with period of weak cartel power 1924-25; peak is 1928
22.0 30.3 Wallace and Edminster (1950:105)
73Y. Same as 73A. Yardstick is prices (approx. 1900-1910) of profitable German mines not in cartel
30 -- Tosdal (1916:830)
73Z. Same as 73 E.
Compares North American import prices in 1924-33 with the price after the cartel fell apart in 1934.
107-110 -- Canada (1945: 3)
73AA. Same as 73 L. Compares North American import prices in 1937-39 with the price before in 1934.
57 -- Canada (1945: 3)
74A. International steel cartel centered in Western Europe in late 1920s and 1930s; cartel raised prices in domestic markets of members, but sold steel in the U.S. and elsewhere at lower, possibly competitive prices; this study seems to cover two episodes below (74B and 74C)
Prices in Germany above world price, apparently from Barbezat’s studies; Baker applies a general oligopoly model to U.S. data from 1933-39; Gallet’s model refers to oligopoly pricing in the US 1950-1988
33 --
Levenstein and Suslow (2002:12,42),
Barbezat (1989, 1990, 1994), Baker
(1989), Gallet (1997)
74B. First international steel cartel of Sept. 1926-March 1931
S & W conclude that it “…lacked power over prices”; Benni et al. agree with S&W for most of the period; peak is Sept. 1928-March 1929
1 20 Stocking and
Watkins (1946:203), Benni et al.(1930:14)
74C. Second international steel cartel of June 1933- Sept. 1939
This reorganized cartel was bigger and more successful than the first, but S&W Believe that its power over price cannot be disentangled from the recovery of the world economy from the Great Depression
? ? Stocking and
Watkins (1946:182-211)
74D. Same as 74C, except author seems to claim that his method takes care of simultaneity Lerner index 28 -- Griffin (1989:189-
190) 74E. Same as 74C, but League of Nations prices collected f.o.b. Antwerp in pounds sterling, which author states are the same as found all over continental Europe
Average prices July 1933-Oct. 1936 compared to either Jan. or April 1933
9.3-17.5 -- Oualid (1938:40)

J. M. Connor Price-Fixing Overcharges 3rd Edition February 2014
206
74F. Same as 74A Lerner index 12 -- Griffin (1989:189-190)
75. International lysine cartel June 1992-July 1995, prosecuted and sanctioned by the U.S., EU, Canada, and Mexico; global cartel with two episodes separated by a disciplinary price war from about May 1993 to Sept. 1993.
75A. First US episode began in June 1992 and ended about April 1993 when a brief price war began; cartel bickered about market shares
Selling prices in U.S. relative to LRMC in U.S. of $0.75 to $0.80 per lb.
7.9-15.1 22.5-30.7
Connor (2001b, 2004)
75B. Second and more effective episode began in Oct. 1993 when members finally agreed to constant world volume-of-sales shares and a fifth small producer joined the cartel; ended June 1995
Change in U.S. prices from intermediate price war in early 1993 to late 1993 peak prices; from a trade journal
-- 67
Levenstein and Suslow (2003:50),
Chem. Market Reporter 7/17/95
75C. Seems to be an average of two episodes, 75A and 75B, US market
Official estimate of US overcharge during 1992-95, combined with court records of U.S. affected sales
17.1 -- Connor (2007c), OECD (2002:55)
75D. Same as 75C
Selling prices in U.S. relative to: sum of U.S. LRMC and generous allowance for LR competitive accounting profits
17.6 56 Connor (2001b, 2007b, 2004a)
75E. Same as 75C Econometric model of the U.S. lysine market
17.6-18.0 56-57 Morse and Hyde
(2000)
75F. Same as 75C, except Canadian market data Benchmark is pre-cartel Canadian prices 22 -- Connor (2001b,2003:
Table A.1)
75G. Same as 75C, except EU data Benchmark is average pre-cartel EU price 17 --
Connor (2003: Table A.1), EC decision of
6/27/2000
75H. Same as 75C, except world market Benchmark is pre-cartel world prices 14 -- Connor (2001b,
2003: Table A.1) 75I. Same as 75A, except Asia and Latin America data
Residual analysis from 75D,F,G, and H above 8 -- Connor (2001b,
2003: Table A.1)
75J. Same as 75F Magazine article; Canadian peak prices -- 50
Levenstein and Suslow (2002:Table
15)
75K. Same as 75C
Prediction of US price change due to collusion from a dynamic simulation model of the lysine industry that focuses on the role of ADM’s entry
24.6 -- De Roos (2004a:50)
75L. Same as 75C , except imports to selected developing countries
Import price decline after the demise of the cartel 10 -- Yu (2003:10)
75M. Same as 75C Reading of U.S. court decision -- 71.4 Appendix Table 4: entry 21 below
75N. Same as 75C Prediction of change in US mark-up from a dynamic simulation model
45.6 -- De Roos (2004b: Table 3, Model 1)
75O. Same as 75C Prediction of change in US mark-up from a dynamic simulation model
44.1 -- De Roos (2004b: Table 3, Model 2)
75P. Same as 75C Sophisticated GARCH econometric model applied to US prices
33.3 -- Bolotova et al.(2005)

J. M. Connor Price-Fixing Overcharges 3rd Edition February 2014
207
75Q. Same as 75B Selling prices in U.S. relative to LRMC in U.S. of $0.75 to $0.80 per lb.
39.9-49.3
53.8-64.0
Connor (2001b, 2004)
75R. Same as 75B Compares EU selling prices with intervening price war benchmark
36.4 51.2 Connor (2003: Table A.1), EC decision of
12/5/2001
75S. Same as 75C
Changes in world prices compared to pre-cartel prices -- 41
Levenstein and Suslow (2003:49),
The Observer 10/25/98
75T. Same as 75A Compares U.S. transaction prices to 3 months before cartel began
23.3 40.0 Connor (2003: Table A.1)
75U. Same as 75B Compares U.S. transaction prices to 3 months before cartel began
59.9 75.7 Connor (2003: Table A.1)
75V. Same as 75A Compares U.S. transaction prices to 3 months during brief price war
23.3 40.0 Connor (2003: Table A.1)
75W. Same as 75B Compares U.S. transaction prices to 3 months during brief price war
59.9 75.7 Connor (2003: Table A.1)
75X. Same as 75A Compares EU selling prices with pre-cartel benchmark 10.0 22.3
Connor (2003: Table A.1), EC decision of
12/5/2001
75Y. Same as 75B Compares EU selling prices with pre-cartel benchmark 34.7 48.9
Connor (2003: Table A.1), EC decision of
12/5/2001
75Z. Same as 75A Compares EU selling prices with intervening price war benchmark
11.7 51.2 Connor (2003: Table A.1), EC decision of
12/5/2001
75AA. Same as 75C
Prediction of US price above marginal cost due to collusion, from a dynamic simulation model of the lysine industry that focuses on the role of participants’ asymmetries
61.5 140 De Roos (2006:Table 3, Fig. 7)
75BB. Same as 75A
Prediction of US price above marginal cost due to collusion, from a dynamic simulation model of the lysine industry that focuses on the role of participants’ asymmetries
75 120 De Roos (2006: Fig. 7)
75CC. Same as 75B
Prediction of US price above marginal cost due to collusion, from a dynamic simulation model of the lysine industry that focuses on the role of participants’ asymmetries
100 140 De Roos (2006: Fig. 7)
75DD. Same as 75B for US
Davies and Marjumdar's interpretationof White's graphical analysis of before and after benchmark prices
25+ -- White (2001), Davies
and Majumdar (2002)
75EE. Same as 75C for CA Selling prices in U.S. relative to: sum of U.S. LRMC and 17.7 -- Connor (2013,
2001a)

J. M. Connor Price-Fixing Overcharges 3rd Edition February 2014
208
generous allowance for LR competitive accounting profits
75FF. Same as 75C for EU Benchmark is average pre-cartel EU price; better sales data
17.4 -- Connor (2013, 2007b), EC decision
of 6/27/2000
75GG.. Same as 75C for US
Selling prices in U.S. relative to: sum of U.S. LRMC and generous allowance for LR competitive accounting profits
16.2 -- Connor (2013, 2001a)
75HH. Same as 75C for world Benchmark is pre-cartel world prices; better sales data 13.3 -- Connor (2013,
2001a) 76A. International citric acid cartel, met from Mar. 1991 to May 1995; convicted and fined in the U.S. and EU; global cartel with only one time episode
Transaction prices in US compared to a range of long run full economic costs 16-20 18-33
Connor(1998 and 2007b), Connor
(2003: Table A.1)
76B. Same as 76A, for Canada Benchmark is pre-cartel prices in Canada 19-32 -- Connor (2003: Table
A.1)
76C Same as 76A, for EU Benchmark is pre-cartel prices in EU 45-50 --
Connor (2003: Table A.1), EC decision of
12/5/2001
76D. Same as 76A, for world Benchmark is pre-cartel world prices 30-34 -- Connor (2003: Table
A.1)
76E. Same as 76A, for US Official U.S. government estimate, method not reported 31.25 -- OECD (2003:55)
76F. Same as 76A, for EU
Statement of EC Commissioner M. Monti 9/13/00 after fines imposed -- 50
Levenstein and Suslow (2003:50), European Report
9/13/00
76G. Same as 76A, for developing countries Developing countries’ import prices decline after the demise of the cartel
20 -- Yu (2003:10)
76H. Same as 76A. Sophisticated GARCH econometric model applied to US prices
13.6 -- Bolotova et al.(2005)
76I. Same as 76A.
Econometric trade model of short-run (1 to 2 years) world-trade price effects after cartel collapses.
4.5-8.8 -- Levenstein et al.
(2011: Tables 4 and 5)
76J. Same as 76A. Econometric trade model of long-run (3 to 4 years) price effects after cartel collapses.
7.5-14.2 -- Levenstein et al.
(2011: Tables 4 and 5)
76K. Same as 76A.
Transaction prices in US compared to a range of long run full economic costs; more precise sales data
18.3
-- Connor (2013,
2007b)
76L. Same as 76B. Benchmark is pre-cartel prices in Canada; more precise sales data
33.3 -- Connor (2013,
2007b)
76M. Same as 76F. Benchmark is pre-cartel prices in EU; more precise sales data 47.5 -- Connor (2013), EC
decision of 12/5/2001
76N. Same as 76G. Benchmark is pre-cartel prices; more precise sales data 30.8 -- Connor (2013,
2007b)
76O. Same as 76D. Benchmark is pre-cartel world prices 14 -- Connor (2013,
2007b)

J. M. Connor Price-Fixing Overcharges 3rd Edition February 2014
209
77A. International sorbates cartel 1979-1997, successfully prosecuted by U.S. DOJ, Canada, EU, and private plaintiffs in U.S.; global cartel with only one episode
Press report from anonymous source on US price effects 14 --
Levenstein and Suslow (2003:50),
WSJ 10/1/98
77B. Same as 77A, for US
Benchmark is pre-cartel and post-cartel U.S. prices from trade magazines 35-45 --
Connor (2003: Table A.1), Chem. Market Reporter (various
dates)
77C. Same as 77A, for Canada Same as above for Canada 37-47 -- Connor (2003: Table A.1)
77D. Same as 77A, for world Same as above, world prices 42 -- Connor (2003: Table A.1)
77E. Same as 77A, for US Trade journal.; simple increase in U.S. transaction prices
-- 14 Levenstein and
Suslow (2002:Table 15)
78. International cartel in methionine, Feb. 1986 to Feb. 1999, successfully prosecuted by EU and large private settlements in U.S.; global cartel with three episodes
Benchmark is pre-cartel U.S. prices from trade magazine sources for entire conspiracy period 2/86-2/99 (3 episodes)
10-14 --
Connor (2003: Table A.1), Borgeson
(1999), STAT-USA (1999)
78A. From 2/86 to 9/88 (first episode) all four major world suppliers agreed to both list and “rock bottom” (contract) prices everywhere in world; US and Japan were duopolies; fringe small; CR4 =92%; EC report says price increase highest of 3 episodes
Prices unavailable in EC report, but infer that EU price increases are somewhat higher than for 78B below 30-90 --
EC Official Journal L255 (10/8/2003):1-
32;
78B. From 9/88 to July 1990 (2nd episode) Sumitomo withdrew from meetings of cartel but may have cooperated passively with cartel of 3 firms; nonmember Monsanto had 18-20% global share in late 1980s but in 1988 began aggressive expansion of liquid methionine in US; Russian producers increased exports to EU, but price effects weakly positive
U.S. list or spot prices for 99% pure DL-methionine in dry form for 1990 compared to 1980 and 1985 benchmark; long-term supply contract prices track spot prices very closely
26-78 --
EC Official Journal L255 (10/8/2003):1-
32; Borgeson (1999:77)
78C. From July 1990 to Feb. 1999 (3rd episode), Sumitomo not in cartel but sold its product through the cartel in the EU; in 6/93 cartel got an agreement from Russian suppliers to limit their EU imports to 75Kt;
Narrative of meetings gives both EU target and transaction (“going”) prices from mid 1990 to Feb. 1999; overstated benchmark (proxy for pre-cartel price) is mid 1990 price; peak is mid 1993
13.5+ 15.6+ EC Official Journal L255 (10/8/2003):1-
32
78D. Same as 78C for US prices
Average U. S. import prices 1991 to 1997 compared to 1981-84 prices; peak is 1997 14.1 37
Connor (2003: Table A.1), Borgeson
(1999), STAT-USA (1999)
78E. Came as 78C for US prices
Same as above but benchmark is 1990 import prices 37.5 65
Connor (2003: Table A.1), Borgeson
(1999), STAT-USA (1999)
78F. Same as 78C for US prices
U.S. list or spot prices for 99% pure DL-methionine in dry form for 1991-1998 compared to 1980 and 1985 benchmark; long-term supply contract prices track spot prices very closely; peak is 1997
38-95 40-99 Connor (2003: Table
A.1), Borgeson (1999:77)

J. M. Connor Price-Fixing Overcharges 3rd Edition February 2014
210
78G. Same as 78C
List prices in the EU from July 1990 to Feb. 1999, using July 1990 price as a benchmark (well above pre-1986 prices)
13.5 15.6 EC (Oct. 8, 2003)
78H. Same as 78C Econometric model using world trade prices during and after the cartel
22-24 Levenstein et al.
(2008: Tables 6 and 7)
78I. Same as 78A Econometric trade model of short-run (1 to 2 years) price effects after cartel collapses.
6.4-28.8 -- Levenstein et al.
(2011: Tables 4 and 5)
78J. Same as 78A Econometric trade model of long-run (3 to 4 years) price effects after cartel collapses.
25.9-32.3 --
Levenstein et al. (2011: Tables 4 and
5) 78K. Same as 78A+B+C+D, except for all areas affected
See 78A, 78B, 78C and 78D above 13 -- Connor (2013) sales
79. International sodium chlorate cartel formed by exporters from Switzerland, Sweden, Italy, Germany, France, and Czechoslovakia 1931; ended in Sept. 1939
Real mean annual wholesale world export prices in 1931-1939 compared to nearly constant prices in 1920-1930, a period of relatively robust demand; peak year 1934
45 67 Suslow (2001: 58), Hexner (1946: 339-
340)
80. International cartels in 16 bulk vitamins and Carotenoids (plus “all vitamins” and the “Global Branch” of Choline chloride no. 81), various dates between 1988 and 1999; prosecuted by U.S. DOJ, EC, Canada, Australia, Korea, and private plaintiffs in U.S.; global cartel with 16 distinct products and, for some products, multiple time episodes; dry and liquid forms are classified in the same market.
80A. All vitamins in US, late 1989-Feb. 1999 a
Press report of U.S. class-action counsel estimate mentioned as credible by scholars
20 -- Levenstein and
Suslow (2002:Table 15)
80B. Same as 80A for Canada, late 1989-Feb. 1999 a
Statement of Bureau of Competition officials 30 --
Levenstein and Suslow (2002:Table
15)
80C. Vitamin E in US, Jan. 1990-Feb. 1999 Analysis of U.S. list or spot prices before cartel operated 55-65 82-90
Connor (2003: Table A.1), Connor
(2001a:322-330)
80D. vitamin B1 in US, Jan. 1991- Dec. 1994 Analysis of U.S. list or import prices pre-cartel 9-11 16 Connor (2003: Table
A.1)
80E. vitamin B2 in US, Jan. 1991- Dec. 1995 Analysis of U.S. list or import prices before and after cartel for vitamin B2
12-19 21 Connor (2003: Table A.1)
80F. vitamin B5 (calpan), Jan. 1991- Dec. 1998
Analysis of U.S. list or spot prices before cartel 25 59
Connor (2003: Table A.1), Connor
(2001a:322-330)
80G. folic acid (B9), in US Jan. 1991- Dec. 1994
Analysis of U.S. list or import prices before cartel for folic acid (a B vitamin)
23 38 Connor (2003: Table
A.1), Connor (2001a:328)
80H. vitamin C, in US Jan. 1991-Dec. 1995 Analysis of U.S. list or import prices pre cartel 10-23 31
Connor (2003: Table A.1), Connor
(2001a:322-330)
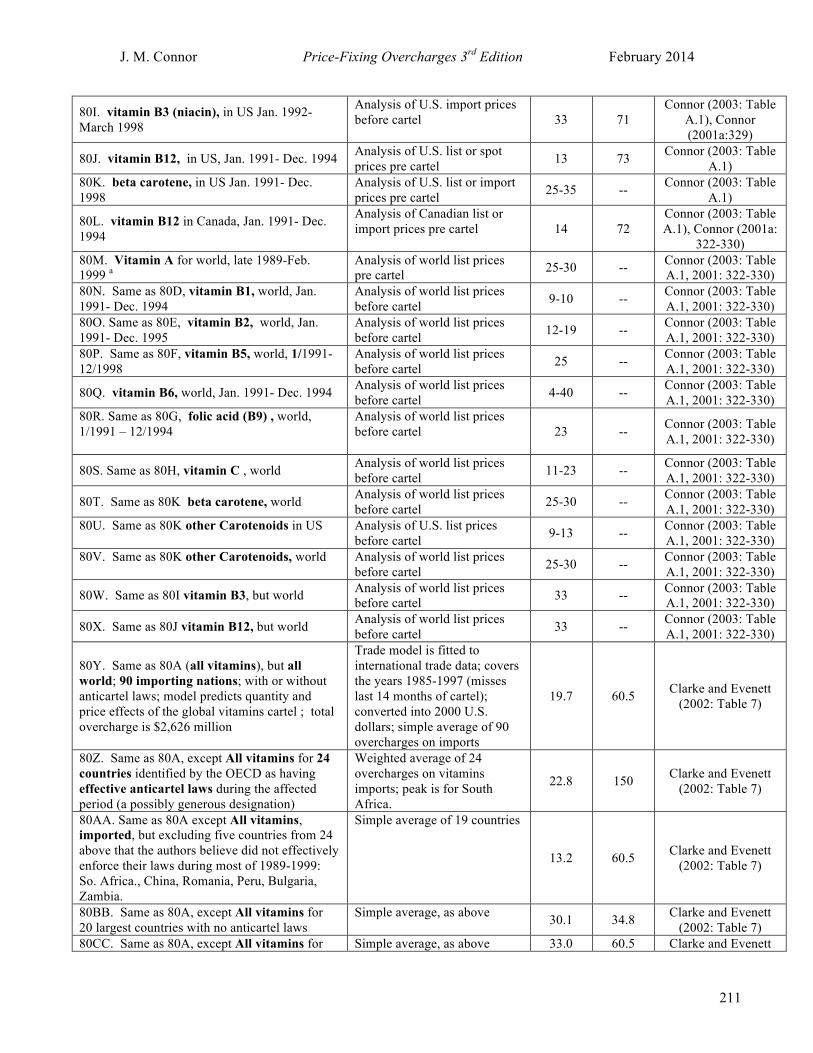
J. M. Connor Price-Fixing Overcharges 3rd Edition February 2014
211
80I. vitamin B3 (niacin), in US Jan. 1992- March 1998
Analysis of U.S. import prices before cartel 33 71
Connor (2003: Table A.1), Connor (2001a:329)
80J. vitamin B12, in US, Jan. 1991- Dec. 1994 Analysis of U.S. list or spot prices pre cartel 13 73 Connor (2003: Table
A.1) 80K. beta carotene, in US Jan. 1991- Dec. 1998
Analysis of U.S. list or import prices pre cartel 25-35 -- Connor (2003: Table
A.1)
80L. vitamin B12 in Canada, Jan. 1991- Dec. 1994
Analysis of Canadian list or import prices pre cartel 14 72
Connor (2003: Table A.1), Connor (2001a:
322-330) 80M. Vitamin A for world, late 1989-Feb. 1999 a
Analysis of world list prices pre cartel 25-30 -- Connor (2003: Table
A.1, 2001: 322-330) 80N. Same as 80D, vitamin B1, world, Jan. 1991- Dec. 1994
Analysis of world list prices before cartel 9-10 -- Connor (2003: Table
A.1, 2001: 322-330) 80O. Same as 80E, vitamin B2, world, Jan. 1991- Dec. 1995
Analysis of world list prices before cartel 12-19 -- Connor (2003: Table
A.1, 2001: 322-330) 80P. Same as 80F, vitamin B5, world, 1/1991-12/1998
Analysis of world list prices before cartel 25 -- Connor (2003: Table
A.1, 2001: 322-330)
80Q. vitamin B6, world, Jan. 1991- Dec. 1994 Analysis of world list prices before cartel 4-40 -- Connor (2003: Table
A.1, 2001: 322-330) 80R. Same as 80G, folic acid (B9) , world, 1/1991 – 12/1994
Analysis of world list prices before cartel 23 -- Connor (2003: Table
A.1, 2001: 322-330)
80S. Same as 80H, vitamin C , world Analysis of world list prices before cartel 11-23 -- Connor (2003: Table
A.1, 2001: 322-330)
80T. Same as 80K beta carotene, world Analysis of world list prices before cartel 25-30 -- Connor (2003: Table
A.1, 2001: 322-330) 80U. Same as 80K other Carotenoids in US
Analysis of U.S. list prices before cartel 9-13 -- Connor (2003: Table
A.1, 2001: 322-330) 80V. Same as 80K other Carotenoids, world
Analysis of world list prices before cartel 25-30 -- Connor (2003: Table
A.1, 2001: 322-330)
80W. Same as 80I vitamin B3, but world Analysis of world list prices before cartel 33 -- Connor (2003: Table
A.1, 2001: 322-330)
80X. Same as 80J vitamin B12, but world Analysis of world list prices before cartel 33 -- Connor (2003: Table
A.1, 2001: 322-330)
80Y. Same as 80A (all vitamins), but all world; 90 importing nations; with or without anticartel laws; model predicts quantity and price effects of the global vitamins cartel ; total overcharge is $2,626 million
Trade model is fitted to international trade data; covers the years 1985-1997 (misses last 14 months of cartel); converted into 2000 U.S. dollars; simple average of 90 overcharges on imports
19.7 60.5 Clarke and Evenett (2002: Table 7)
80Z. Same as 80A, except All vitamins for 24 countries identified by the OECD as having effective anticartel laws during the affected period (a possibly generous designation)
Weighted average of 24 overcharges on vitamins imports; peak is for South Africa.
22.8 150 Clarke and Evenett (2002: Table 7)
80AA. Same as 80A except All vitamins, imported, but excluding five countries from 24 above that the authors believe did not effectively enforce their laws during most of 1989-1999: So. Africa., China, Romania, Peru, Bulgaria, Zambia.
Simple average of 19 countries
13.2 60.5 Clarke and Evenett (2002: Table 7)
80BB. Same as 80A, except All vitamins for 20 largest countries with no anticartel laws
Simple average, as above 30.1 34.8 Clarke and Evenett (2002: Table 7)
80CC. Same as 80A, except All vitamins for Simple average, as above 33.0 60.5 Clarke and Evenett

J. M. Connor Price-Fixing Overcharges 3rd Edition February 2014
212
20 no-antitrust countries in 80BB plus 5 mentioned in 80AA
(2002: Table 7)
80DD. Same as 80A, except All vitamins, South Korea, 1990-99
Comparison of 1997 import price relative to 1990, year before cartel
70.0 -- KFTC (2003: 2)
80EE. Same as 80DD, except All vitamins, South Korea, 1990-99
Comparison of 1997 import price relative to 2000, year after cartel
38.4 -- KFTC (2003: 2)
80FF. Same as 80H; vitamin C in US; one of the weakest and least durable of the vitamins cartels because of large Chinese exports
Sophisticated simulation model estimated with accurate industry parameters that predicts “no collusion” price of $27/kg. and collusive price with Chinese fringe of $33
22.2 -- de Roos (2001:20)
80GG. Same as 80H ; vitamin C in US
Same as 80FF except that but-for price of $29.96 is from noncooperative oligopoly regime; peak price assumes no fringe
22.3 29.5 de Roos (2001:28)
80HH. Same as 80H ; vitamin C in US Same as 80 GG except that but-for price of $29.00 is punishment-phase price war
26.3 33.8 de Roos (2001:28)
80II Same as 80Q, vitamin B6, Jan. 1991- Dec. 1994
Analysis of U.S. list or import prices before and after cartel 7-28 19 Connor (2001a:326)
80JJ. Vitamin D3, 1992-1998, but end date is slightly uncertain
Analysis of U.S. list or import prices before cartel 36 47 Connor (2001a:323)
80KK. Same as 80H, vitamin C in US Analysis of U.S. list or import prices after cartel 10 21 Connor (2001a:326)
80LL. Same as 80Q and 80II, vitamin B6 in US
Analysis of U.S. list or import prices after cartel 48 79 Connor (2001a:326)
80MM. Same as 80D, vitamin B1 in US Analysis of U.S. list or import prices after cartel 50 59 Connor (2001a:326)
80NN. Same as 80I, vitamin B3 in US Analysis of U.S. list or import prices after cartel 16 33 Connor (2001a:329)
80OO. Same as 80M, vitamin A in EU
Average annual 1991-98 EU transactions prices in euros vs. before (1990) prices; peak is 1998
25.0 40 EC (2001:86)
80PP. Same as 80C, vitamin E in EU
Average annual 1991-98 EU transactions prices in euros vs. after (1999) prices; peak is 1998
51.9 67.2 EC (2001:86)
80QQ. Same as 80C, vitamin E in EU
Average annual 1991-94 EU transactions prices in euros vs. after (1999) prices; peak is 1998
10.6 19.2 EC (2001:86)
80RR. Same as 80D, vitamin B1 in EU
Average annual 1991-94 EU transactions prices in euros vs. before (1989-90) prices; peak is 1993
4.6 16.4 EC (2001:87)
80SS. Same as 80D, vitamin B1 in EU
Average annual 1991-98 EU transactions prices in euros vs. after (1996-99) prices; peak is 1993
62 79 EC (2001:87)
80TT. Same as 80E, vitamin B2 in EU Average annual 1991-94 EU 19.4 30 EC (2001:87)

J. M. Connor Price-Fixing Overcharges 3rd Edition February 2014
213
transactions prices in euros vs. before (1990) prices
80UU. Same as 80E, vitamin B2 in EU Average annual 1991-98 EU transactions prices in euros vs. after (1997-99) prices
29.9 35 EC (2001:87)
80VV. Same as 80F, vitamin B5 in EU Average annual 1991-94 EU transactions prices in euros vs. before (1990) prices
39.6 58.3 EC (2001:88)
80WW. Same as 80Q and 80II, but vitamin B6 EU
Average annual 1991-94 EU transactions prices in euros vs. before (1990) prices
67 86 EC (2001:88)
80XX Same as 80Q and 80II, but vitamin B6 in EU
Average annual 1991-94 EU transactions prices in euros vs. after (1996-99) prices
91.5 144.7 EC (2001:88)
80YY. Same as 80H, vitamin C but EU Average annual 1991-95 EU transactions prices in euros vs. before (1989-90) prices
14.8 30.4 EC (2001:89)
80ZZ. Same as 80H, vitamin C but EU Average annual 1991-95 EU transactions prices in euros vs. after (1997-99) prices
76.0 100 EC (2001:89)
80AAA. Liquid vitamin A in US, late 1989- Feb. 1999
Benchmark is pre-cartel spot and list US prices 70-75 200 Connor
(2001a:320,331) 80BBB. Dry vitamin A in US, , late 1989- Feb. 1999
Benchmark is pre-cartel spot and list US prices 40-45 70-75 Connor
(2001a:320,331) 80CCC. Vitamin E, world, , late 1989- Feb. 1999 Benchmark is pre-cartel price 35 -- Connor (2001a:336)
80DDD. Same as 80A (all vitamins), except refers to imports to selected developing countries
Import price decline after the demise of the cartel 35 -- Yu (2003:10)
80EEE. Biotin (vitamin H), in EU Oct. 1991 to April 1994
Post-cartel decline in prices, conservatively estimated (because quantity increases) from the sales decline from 1994 to 1997-98
31 -- EC (1/10/03:para 18)
80FFF. Same as 80E Vitamin B2 in EU from Jan. 1991 to Sept. 1995
Post-cartel decline in prices, conservatively estimated (because quantity increases) from the sales decline from 1994-95 to 1997-98; peak is 1995
21 24 EC (1/10/03:para 18)
80GGG. Same as 80S, DC (human) grade vitamin C, 1/1991 – 12/1995
UK transaction prices 1995 compared to 1997-2000 post cartel prices
-- 51 UKCC (2001:64)
80HHH. Same as 80S, regular (feed) grade vitamin C, 1/1991 – 12/1995
UK transaction prices 1995 compared to 1997-2000 post cartel prices
-- 62-65 UKCC (2001:10)
80III. Same as 80E, except food-grade vitamin B2, 1/1991 – 12/1995
UK transaction prices 1995 compared to 1997-2000 post cartel prices
-- 42-48 UKCC (2001:10)
80JJJ. Same as 80E, except feed-grade vitamin B2, 1/1991 – 12/1995
UK transaction prices 1995 compared to 1997-2000 post cartel prices
-- 67-72 UKCC (2001:10)
80KKK. Same as 80M vitamin A, except in Canada for conspiracy period 1/1990 – 2/1999
Econometric model explaining purchase prices of two large buyers from July 1991 to
16.6 -- Ross (2005: Table B1)

J. M. Connor Price-Fixing Overcharges 3rd Edition February 2014
214
October 2000.
80LLL. Same as 80H vitamin C, except in Canada for conspiracy period 1/1990 – 12/1995
Econometric model explaining purchase prices of two large buyers from July 1991 to October 2000.
16.2 -- Ross (2005: Table B2)
80MMM. Same as 80C vitamin E, except in Canada for conspiracy period 1/1990 – 2/1999
Econometric model explaining purchase prices of two large buyers from July 1991 to October 2000.
16.2 -- Ross (2005: Table B3)
80NNN. Same as 80A, all bulk vitamins in the U.S. market
A benchmark industry price is developed from the U.S. producer price index for all vitamins products; unadjusted
26.8 -- Breyer (2000: Table 2 )
80OOO. Same as 80A, but all bulk vitamins in the U.S. market [Note that Breyer also models a 1988-1989 base period, but the EC decision states that 1988 was a collusive period in the EU, and Connor (2001) shows that the U.S. market was also cartelized in 1988]
A benchmark industry price is developed from the U.S. producer price index yardstick for all vitamins products and a 1989 base period; adjusted for 50% demand and 50% exchange-rate pass-through
21.4 -- Breyer (2000: Table 2 )
80PPP. Same as 80OOO, all bulk vitamins in the U.S. market
A benchmark industry price is developed from the U.S. producer price index for all vitamins products and a 1989 base period; adjusted for 100% demand and 100% exchange-rate pass-through
15.7 -- Breyer (2000: Table 2 )
80QQQ. Same as 80A, all bulk vitamins in the U.S. market
Same as above plus an adjustment for manufacturing costs changes in Switzerland
15.0 -- Breyer (2000: Table 2 )
80RRR. Same as 80A, all bulk vitamins in the U.S. market
A benchmark industry price is developed from the U.S. producer price index for all vitamins products and a 1999 base period; adjusted for 50% demand and 50% exchange-rate pass-through
15.7 -- Breyer (2000: Table 2 )
80SSS. Same as 80A, all bulk vitamins in the U.S. market [Breyer in Equation 2 states that he has estimate a Lerner index of 13.5%, which here is converted to an overcharge]
Econometric model with demand, costs, and exchange rates explaining monthly transactions selling prices of the six largest sellers from 1980 to 1998.
13.5 -- Breyer (2000: Table 2)
80TTT. Vitamin premixes in the US market, plea period
Detailed, sophisticated econometric study using defendant’s internal prices
28.5-30.2 -- Bernheim (2002: 8)
80UUU. Same as 80C, Vitamin E in US Detailed, sophisticated econometric study using defendant’s internal prices
37.1-40.5 -- Bernheim (2002: 8)
80VVV. Same as 80BBB, Dry vitamin A in US,
Detailed, sophisticated econometric study using defendant’s internal prices
32.3-33.7 -- Bernheim (2002: 8)
80WWW. Same as 80H Detailed, sophisticated econometric study using defendant’s internal prices
23.2-23.8 -- Bernheim (2002: 8)

J. M. Connor Price-Fixing Overcharges 3rd Edition February 2014
215
80XXX. Same as 80F Detailed, sophisticated econometric study using defendant’s internal prices
29.2-34.3 -- Bernheim (2002: 8)
80YYY. Same as 80I Detailed, sophisticated econometric study using defendant’s internal prices
14.5-17.5 -- Bernheim (2002: 8)
80ZZZ. Same as 80E Detailed, sophisticated econometric study using defendant’s internal prices
22.9-23.1 -- Bernheim (2002: 8)
80AAAA. Vitamin biotin (H) in the US market Detailed, sophisticated econometric study using defendant’s internal prices
17.1-19.2 -- Bernheim (2002: 8)
80BBBB. Same as 80D, vitamin B1 in US Detailed, sophisticated econometric study using defendant’s internal prices
16.5-18.6 -- Bernheim (2002: 8)
80CCCC. Same as 80J Detailed, sophisticated econometric study using defendant’s internal prices
43-48.9 -- Bernheim (2002: 8)
80DDDD. Same as 80II Detailed, sophisticated econometric study using defendant’s internal prices
21.7-24.9 -- Bernheim (2002: 8)
80EEEE. Same as 80U Detailed, sophisticated econometric study using defendant’s internal prices
19-20 -- Bernheim (2002: 8)
80FFFF. Same as 80JJ Detailed, sophisticated econometric study using defendant’s internal prices
13.5 -- Bernheim (2002: 8)
80GGGG. Same as 80G Detailed, sophisticated econometric study using defendant’s internal prices
22.3 -- Bernheim (2002: 8)
80HHHH. Same as 80K Detailed, sophisticated econometric study using defendant’s internal prices
30.4-31.7 -- Bernheim (2002: 8)
80IIII. Same as 80A, all bulk vitamins in US Detailed, sophisticated econometric study using defendant’s internal prices
29.2-31.9 -- Bernheim (2002: 8)
80JJJJ. Same as 80M, except for 1995 only. Author uses a structural, numerical analysis that estimates demand and posits various forms of conduct for each supplier.
Assumes cartelists' margin 0.53 to 0.66, elasticity of demand -1.50, and cartel share 95%
15-36 36 Zona (2010: 13)
80KKKK. Same as 80M, except for 1995 only. Author uses a structural, numerical analysis that estimates demand and posits various forms of conduct for each supplier.
Assumes cartelists' margin 0.60, elasticity of demand from -0.75 to -1.50, and cartel share 95%
31-50 50 Zona (2010: 13)
80LLLL. Same as 80M, except for 1995 only. Author uses a structural, numerical analysis that estimates demand and posits various forms of conduct for each supplier.
Assumes cartelists' margin 0.60, elasticity of demand -1.50, and cartel share 99% 51-52 52 Zona (2010: 13)
80MMMM. Same as 80M Econometric trade model of short-run (1 to 2 years) price effects after cartel collapses.
33.1-36.4 --
Levenstein et al. (2011: Table 4 and 5)
80NNNN. Same as 80M Econometric trade model of long-run (3 to 4 years) price effects after cartel collapses.
17.3-27.2 --
Levenstein et al. (2011: Table 4 and 5)
80OOOO. Same as 80W Econometric trade model of 3.8-30.8 -- Levenstein et al.

J. M. Connor Price-Fixing Overcharges 3rd Edition February 2014
216
short-run (1 to 2 years) price effects after cartel collapses.
(2011: Table 4 and 5)
80PPPP. Same as 80W Econometric trade model of long-run (3 to 4 years) price effects after cartel collapses.
29.9-46.3 --
Levenstein et al. (2011: Table 4 and 5)
80QQQQ. Same as 80C, vitamin E, except world
Econometric trade model of short-run (1 to 2 years) price effects after cartel collapses.
7.1-79.7 -- Levenstein et al.
(2011: Table 4 and 5)
80RRRR. Same as 80C, vitamin E,except world Econometric trade model of long-run (3 to 4 years) price effects after cartel collapses.
76.6-91.5 --
Levenstein et al. (2011: Table 4 and 5)
80SSSS. Same As 80Y AND 80MMMM
Authors calculate the mean price changes with and without collusion and show significant changes in mean and dispersion.
16.4 -- von Blanckenburg et al. (2010: Table 2)
80TTTT. Same as 80OO Vitamin A in EU. Econometric trade model of long-run (3 to 4 years) price effects after cartel collapses. 26.0
-- Levenstein et al. (2011: Table 4 and 5)
80UUUU. Vitamin A in ROW. Econometric trade model of long-run (3 to 4 years) price effects after cartel collapses. 35.6
-- Levenstein et al. (2011: Table 4 and 5)
80VVVV. Same as Vitamin A 80AAA+80BBB.
Detailed, sophisticated econometric study using defendant’s internal prices 32.8
-- Bernheim (2002: 8)
80WWWW. Same Vitamin A as 80M. Econometric trade model of long-run (3 to 4 years) price effects after cartel collapses. 30.3
-- Levenstein et al. (2011: Table 4 and 5)
80XXXX. Same as 80D, vitamin B1 in EU Average annual 1991-98 EU transactions prices in euros vs. after (1996-99) prices
6.4 -- EC (2001:87)
80YYYY. Same as Vitamin B1, ROW Analysis of U.S. list or import prices after cartel 15.2 -- Connor (2003, 2013)
80ZZZZ. Same as Vitamin B1, US & CA Detailed, sophisticated econometric study using defendant’s internal prices 18.2
-- Connor (2013), Bernheim (2002: 8)
80AAAAA. Same as 80N. Same as Vitamin B1, world
Analysis of U.S. list or import prices after cartel 12.1 -- Connor (2003, 2013)
80BBBBB. Same as 80D, vitamin B2 in EU Average annual 1991-98 EU transactions prices in euros vs. after (1996-99) prices
26.7 -- EC (2001:87)
80CCCCC. Same as Vitamin B2, ROW Average annual 1991-98 EU transactions prices in euros vs. after (1996-99) prices
35.6 -- EC (2001:87)
80DDDDD Same as Vitamin B1, US & CA Detailed, sophisticated econometric study using defendant’s internal prices 23
-- Connor (2013), Bernheim (2002: 8)
80EEEEE. Same as Vitamin B2, world Average annual 1991-98 EU transactions prices in euros vs. after (1996-99) prices
30.3 -- EC (2001:87)
80FFFFF. Same as 80D, vitamin B3 in EU Average annual 1991-98 EU transactions prices in euros vs. after (1996-99) prices
26.6 -- EC (2001:87)
80GGGGG. Same as 80D, vitamin B3 in EU Straight-line method, « before » but-for price 15.6 -- EC (2001:87), sales
from Connor (2013)
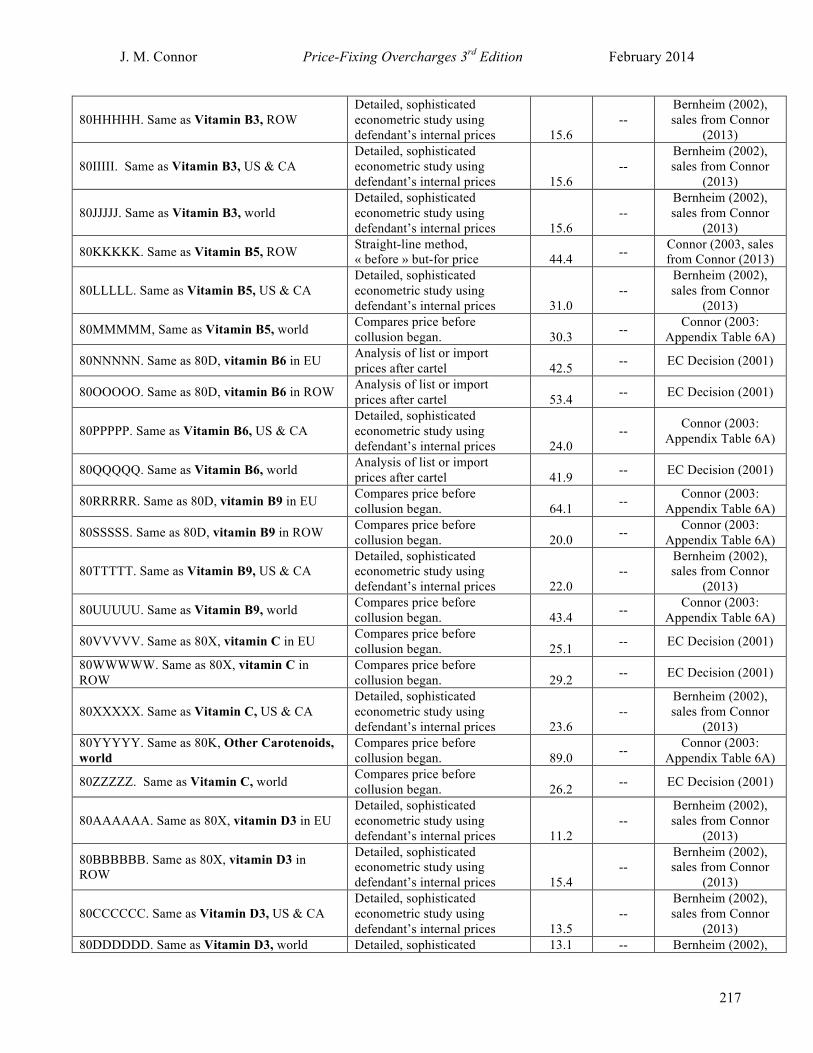
J. M. Connor Price-Fixing Overcharges 3rd Edition February 2014
217
80HHHHH. Same as Vitamin B3, ROW Detailed, sophisticated econometric study using defendant’s internal prices 15.6
-- Bernheim (2002), sales from Connor
(2013)
80IIIII. Same as Vitamin B3, US & CA Detailed, sophisticated econometric study using defendant’s internal prices 15.6
-- Bernheim (2002), sales from Connor
(2013)
80JJJJJ. Same as Vitamin B3, world Detailed, sophisticated econometric study using defendant’s internal prices 15.6
-- Bernheim (2002), sales from Connor
(2013)
80KKKKK. Same as Vitamin B5, ROW Straight-line method, « before » but-for price 44.4 -- Connor (2003, sales
from Connor (2013)
80LLLLL. Same as Vitamin B5, US & CA Detailed, sophisticated econometric study using defendant’s internal prices 31.0
-- Bernheim (2002), sales from Connor
(2013)
80MMMMM, Same as Vitamin B5, world Compares price before collusion began. 30.3 -- Connor (2003:
Appendix Table 6A)
80NNNNN. Same as 80D, vitamin B6 in EU Analysis of list or import prices after cartel 42.5 -- EC Decision (2001)
80OOOOO. Same as 80D, vitamin B6 in ROW Analysis of list or import prices after cartel 53.4 -- EC Decision (2001)
80PPPPP. Same as Vitamin B6, US & CA Detailed, sophisticated econometric study using defendant’s internal prices 24.0
-- Connor (2003: Appendix Table 6A)
80QQQQQ. Same as Vitamin B6, world Analysis of list or import prices after cartel 41.9 -- EC Decision (2001)
80RRRRR. Same as 80D, vitamin B9 in EU Compares price before collusion began. 64.1 -- Connor (2003:
Appendix Table 6A)
80SSSSS. Same as 80D, vitamin B9 in ROW Compares price before collusion began. 20.0 -- Connor (2003:
Appendix Table 6A)
80TTTTT. Same as Vitamin B9, US & CA Detailed, sophisticated econometric study using defendant’s internal prices 22.0
-- Bernheim (2002), sales from Connor
(2013)
80UUUUU. Same as Vitamin B9, world Compares price before collusion began. 43.4 -- Connor (2003:
Appendix Table 6A)
80VVVVV. Same as 80X, vitamin C in EU Compares price before collusion began. 25.1 -- EC Decision (2001)
80WWWWW. Same as 80X, vitamin C in ROW
Compares price before collusion began. 29.2 -- EC Decision (2001)
80XXXXX. Same as Vitamin C, US & CA Detailed, sophisticated econometric study using defendant’s internal prices 23.6
-- Bernheim (2002), sales from Connor
(2013) 80YYYYY. Same as 80K, Other Carotenoids, world
Compares price before collusion began. 89.0 -- Connor (2003:
Appendix Table 6A)
80ZZZZZ. Same as Vitamin C, world Compares price before collusion began. 26.2 -- EC Decision (2001)
80AAAAAA. Same as 80X, vitamin D3 in EU Detailed, sophisticated econometric study using defendant’s internal prices 11.2
-- Bernheim (2002), sales from Connor
(2013)
80BBBBBB. Same as 80X, vitamin D3 in ROW
Detailed, sophisticated econometric study using defendant’s internal prices 15.4
-- Bernheim (2002), sales from Connor
(2013)
80CCCCCC. Same as Vitamin D3, US & CA Detailed, sophisticated econometric study using defendant’s internal prices 13.5
-- Bernheim (2002), sales from Connor
(2013) 80DDDDDD. Same as Vitamin D3, world Detailed, sophisticated 13.1 -- Bernheim (2002),
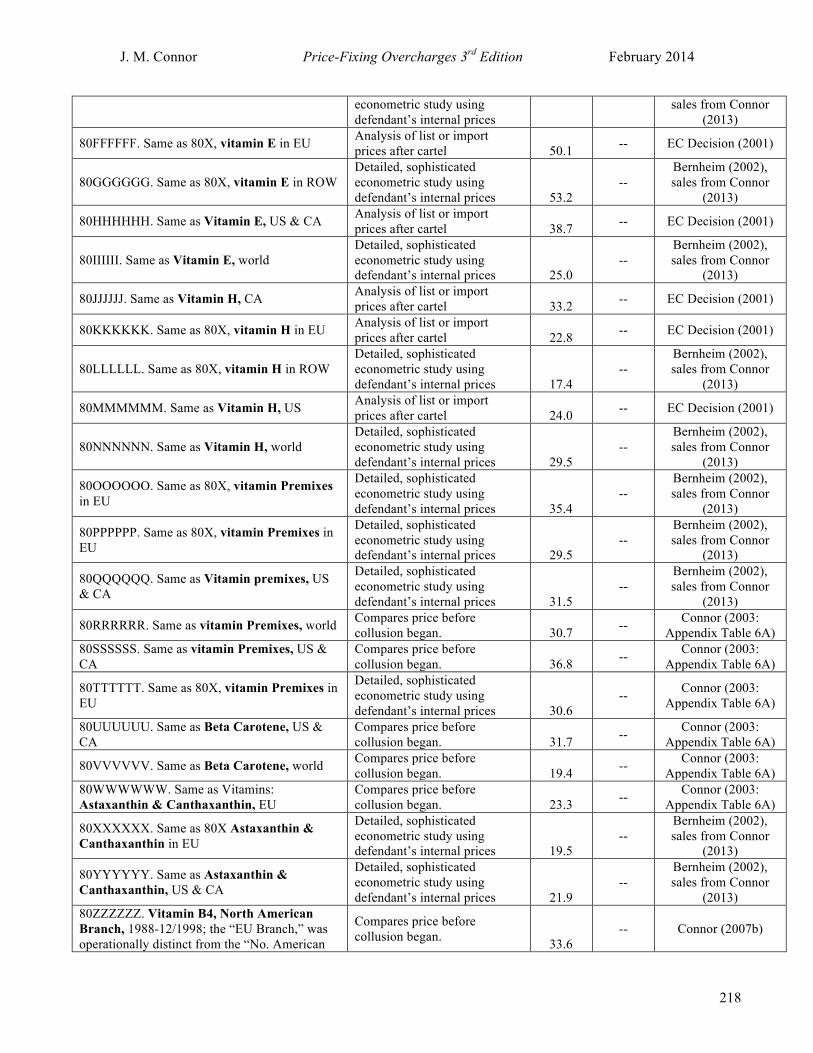
J. M. Connor Price-Fixing Overcharges 3rd Edition February 2014
218
econometric study using defendant’s internal prices
sales from Connor (2013)
80FFFFFF. Same as 80X, vitamin E in EU Analysis of list or import prices after cartel 50.1 -- EC Decision (2001)
80GGGGGG. Same as 80X, vitamin E in ROW Detailed, sophisticated econometric study using defendant’s internal prices 53.2
-- Bernheim (2002), sales from Connor
(2013)
80HHHHHH. Same as Vitamin E, US & CA Analysis of list or import prices after cartel 38.7 -- EC Decision (2001)
80IIIIII. Same as Vitamin E, world Detailed, sophisticated econometric study using defendant’s internal prices 25.0
-- Bernheim (2002), sales from Connor
(2013)
80JJJJJJ. Same as Vitamin H, CA Analysis of list or import prices after cartel 33.2 -- EC Decision (2001)
80KKKKKK. Same as 80X, vitamin H in EU Analysis of list or import prices after cartel 22.8 -- EC Decision (2001)
80LLLLLL. Same as 80X, vitamin H in ROW Detailed, sophisticated econometric study using defendant’s internal prices 17.4
-- Bernheim (2002), sales from Connor
(2013)
80MMMMMM. Same as Vitamin H, US Analysis of list or import prices after cartel 24.0 -- EC Decision (2001)
80NNNNNN. Same as Vitamin H, world Detailed, sophisticated econometric study using defendant’s internal prices 29.5
-- Bernheim (2002), sales from Connor
(2013)
80OOOOOO. Same as 80X, vitamin Premixes in EU
Detailed, sophisticated econometric study using defendant’s internal prices 35.4
-- Bernheim (2002), sales from Connor
(2013)
80PPPPPP. Same as 80X, vitamin Premixes in EU
Detailed, sophisticated econometric study using defendant’s internal prices 29.5
-- Bernheim (2002), sales from Connor
(2013)
80QQQQQQ. Same as Vitamin premixes, US & CA
Detailed, sophisticated econometric study using defendant’s internal prices 31.5
-- Bernheim (2002), sales from Connor
(2013)
80RRRRRR. Same as vitamin Premixes, world Compares price before collusion began. 30.7 -- Connor (2003:
Appendix Table 6A) 80SSSSSS. Same as vitamin Premixes, US & CA
Compares price before collusion began. 36.8 -- Connor (2003:
Appendix Table 6A)
80TTTTTT. Same as 80X, vitamin Premixes in EU
Detailed, sophisticated econometric study using defendant’s internal prices 30.6
-- Connor (2003: Appendix Table 6A)
80UUUUUU. Same as Beta Carotene, US & CA
Compares price before collusion began. 31.7 -- Connor (2003:
Appendix Table 6A)
80VVVVVV. Same as Beta Carotene, world Compares price before collusion began. 19.4 -- Connor (2003:
Appendix Table 6A) 80WWWWWW. Same as Vitamins: Astaxanthin & Canthaxanthin, EU
Compares price before collusion began. 23.3 -- Connor (2003:
Appendix Table 6A)
80XXXXXX. Same as 80X Astaxanthin & Canthaxanthin in EU
Detailed, sophisticated econometric study using defendant’s internal prices 19.5
-- Bernheim (2002), sales from Connor
(2013)
80YYYYYY. Same as Astaxanthin & Canthaxanthin, US & CA
Detailed, sophisticated econometric study using defendant’s internal prices 21.9
-- Bernheim (2002), sales from Connor
(2013) 80ZZZZZZ. Vitamin B4, North American Branch, 1988-12/1998; the “EU Branch,” was operationally distinct from the “No. American
Compares price before collusion began. 33.6
-- Connor (2007b)

J. M. Connor Price-Fixing Overcharges 3rd Edition February 2014
219
Branch.” 80 AAAAAAA. Same as 80ZZZZZZ, except Canada.
Compares price before collusion began. 30.8 -- Connor (2007b)
80 BBBBBBB. Same as 80ZZZZZZ, except EU Compares price before collusion began. 39.9 -- Connor (2007b)
80 CCCCCCC. Same as 80ZZZZZZ, except US. Compares price before collusion began. 29.9 -- Connor (2007b)
80 DDDDDDD. Same as 80ZZZZZZ, except WORLD.
Compares price before collusion began. 33.7 -- Connor (2007b)
81A. Choline chloride (a/k/a vitamin B4) cartel 1/1988-10/1998, the European Branch divided markets between No. American and European manufacturers; convicted by U.S. DOJ and EU and in a US civil jury trial; the “EU Branch,” was operationally distinct from the “No. American Branch.”
81A. EU prices, EU Branch This is an analysis of EU transactions prices, benchmark is pre-cartel EU prices 33.6
-- Connor (2003: Table A.2), EC (2001:86)
81B. Same as 81A, except No. Am. branch Benchmark is 1988 price for analysis of U.S. import prices from Canada 30.0
57 Connor (2003: Table
A.3), Connor (2001a:330)
81C. Same as 81B US jury trial; jury chose plaintiffs’ expert’s econometric model estimate 33.7
-- Hausfeld (2003:5)
81D. Same as 81B Benchmark is post-cartel price (1999) compared to U.S. import prices from Canada
66 88 Connor (2003: Table
A.3), Connor (2001a:330)
81E. Same as 81B Reading of U.S. court decision 38 -- Appendix Table 4: entry 24 below
81F. Same as 81B Detailed, sophisticated econometric study using defendant’s internal US prices
33.7 -- Bernheim (2002: 8)
81G. Same as 81A, except world Econometric trade model of short-run (1 to 2 years) price effects after cartel collapses.
5.4-27.8 -- Levenstein et al.
(2011: Table 4 and 5)
81H. Same as 81G Econometric trade model of long-run (3 to 4 years) price effects after cartel collapses.
22.3-25.5 --
Levenstein et al. (2011: Table 4 and 5)
81I. Same as 81A, except EU Benchmark is 1988 price for analysis of U.S. import prices from EU
39.9 -- Connor (2003: Table
A.3)
81J. Same as 81A, except EU Benchmark is 1988 price for analysis of U.S. import prices from EU
9.1 -- Connor (2003: Table
A.3)
81K. Same as 81A, except ROW Benchmark is 1988 price for analysis of U.S. import prices from ROW
33.6 -- Levenstein et al.
(2011: Table 4 and 5)
81L. Same as 81B Detailed, sophisticated econometric study using defendant’s internal US prices
27.9 -- Connor (2013),
Bernheim (2002: 8)
81M. Same as 81B Detailed, sophisticated econometric study using defendant’s internal US prices
8.3 Connor (2013),
Bernheim (2002: 8)
81N. Same as 81B Detailed, sophisticated 30 Connor (2013),

J. M. Connor Price-Fixing Overcharges 3rd Edition February 2014
220
econometric study using defendant’s internal US prices
Bernheim (2002: 8)
81O. Same as 81G Econometric trade model of long-run (3 to 4 years) price effects after cartel collapses.
5.1 Levenstein et al.
(2011: Table 4 and 5)
81P. Same as 81G Econometric trade model of long-run (3 to 4 years) price effects after cartel collapses.
30.7 Levenstein et al.
(2011: Table 4 and 5)
82A. Aluminum phosphide international cartel, colluded in US Jan. 1990 to Nov. 1990; some companies convicted by U.S. DOJ at trial
Benchmark is pre-cartel price 47 -- Connor (2003: Table
A.3)
82B. Same as 82A
Estimate reported in press, method unknown 48 --
Levenstein and Suslow (2003:49), Kansas City Star
7/14/94 83. BT forest insecticide, bid-rigging of Canadian government tenders 1991-1992, convicted after CBC probe
Statement of CBC officials
65 -- Connor(2003: Table A.3)
84A. From March 1992 to February 1998, 10 firms colluded wordwide on prices of graphite electrodes, used to melt steel; heavily fined by EU, US, Canadian, and Korean antitrust authorities.
Statements of DOJ officials about U.S. prices; DOJ sentencing memo of 10/19/99 shows start price of $1.00/lb.; peak is Feb. 1997.
24.8 56
Levenstein and Suslow (2003:49),
DOJ (10/19/99, 11/30/00)
84B. Same as 84A, except Canadian market
Statements of CBC officials about Canadian prices; CCB press release 7/20/00; government report to OECD;
90 --
OECD (2003: 53), Levenstein and
Suslow (2003:49), CBC (7/18/00)
84C. Same as 84A, except EU market EC report to OECD, EU prices -- 50 OECD (2003: 54)
84D. Same as 84A, except Korean imports KFTC report to OECD, Korean import prices 25.14 -- OECD (2003: 54)
84E. Same as 84A
U.S. govt. report to OECD about U.S. prices -- 65 OECD (2003: 55)
84F. Same as 84A Benchmark is before prices in U.S. 51-65 -- Connor (2003: Table
A.4)
84G. Same as 84A, except EU market Benchmark is before prices in EU 50 -- Connor (2003: Table
A.4)
84H. Same as 84A, except world market Benchmark is before world prices 50-58 -- Connor (2003: Table
A.4) 84I. Same as 84A ; data are imports to selected developing countries
Import price decline after the demise of the cartel 45 -- Yu (2003:10)
84J. Same as 84A; data are sales in the EU Prices from June 1992 to Jan. 1998 in the EU in DEM compared to May 1998 price
34.0 55.6 EC(4/16/02)
84K. Same as 84A, except Korean imports Average annual Korean import prices 1992-1997 compared to before (1988-1990 average)
36.9 57.4 Jeon and Kwangshik (2005: 19)
84L. Same as 84A, except Korean imports Average annual Korean import prices 1992-1997 compared to after (1999-2001 average)
13.7 30.7 Jeon and Kwangshik (2005: 19)
84M. Same as 84A, except Korean imports
Regression analysis with 14 years’ data and 3 independent variables; demand is mis-specified; collusion dummy is positive but of borderline
42.8 -- Jeon and Kwangshik (2005: 20)

J. M. Connor Price-Fixing Overcharges 3rd Edition February 2014
221
significance (t=1.68)
84N. Same as 84A.
Authors suggest that the US and EU fines of $600 million were an imperfect proxy of the cartel overcharge, divided by US and EU affected sales.
14.5 --
Levenstein and Suslow (2006: 56), Connor (2006b: line
75)
84O. Same as 84A, except Korean imports
Korean FTC analysis of increase in import prices from cartel compared to a yardstick of prices of non-members
36.5 -- OECD (2006:141)
84P. Same as 84A; affected period is 7/1/92 to 6/30/98 (lagged price effects included)
Econometric model presented by plaintiff’s expert at jury trial conviction of Mitsubishi; US affected sales from DOJ estimates
33.9 -- Lande and Davis (2006:32-34)
84Q. Same as 84A, except world market Prices in world 1992-97 compared to average of 1989-1991 price; peak is 1997
29.6 48 Levenstein and
Suslow (2003: 826-843)
84R. Same as 84A, except world market Prices in world 1992-97 compared to July 2000 price; peak is 1997
10.0 23.4 Levenstein and
Suslow (2003: 826-843)
84S. Same as 84A. Prices in U.S.1992-97 compared to average 1989-1991 price; peak is 1997
39.0 64.2 Levenstein and
Suslow (2003: 826-843)
84T. Same as 84A. Prices in U.S.1992-97 compared to July 2000 price; peak is 1997
9.0 24.8 Levenstein and
Suslow (2003: 826-843)
84U. Same as 84A, except Korean imports
Import prices in Korea 1992-97 compared to pre-cartel prices; peak is 1997; estimate by Korean FTC
25.14 48.8 Levenstein and
Suslow (2003: 826-843)
84V. Same as 84A, except Canadian market
Import prices in Canada 1992-97 compared to pre-cartel prices; peak is 1997; estimate by Competition Bureau
-- 90 Levenstein and
Suslow (2003: 826-843)
84W. Same as 84A, except Canadian market Benchmark is pre-cartel prices 52.6 -- Connor (2013) 84X. Same as 84A, except Rest of World Benchmark is pre-cartel prices 59.9 -- Connor (2013) 84Y. Same as 84A. Benchmark is pre-cartel prices 58.6 -- Connor (2013) 84Z. Same as 84A, except world market Benchmark is pre-cartel prices 55.4 -- Connor (2013) 85. Global cartel in methyl glucamine 1990-1999, convicted by CBC and EC
Benchmark is pre-cartel prices 75 -- Connor (2003: Table A.4)
86. International bid-rigging cartel in shipping of chemicals in parcel tankers 1998-2002, convicted in U.S.
Estimates reported in business press 15 -- Connor (2003: Table
A.4), WSJ 2002
87. International sulfur export cartel operated from 1906 to the late 1960s; originally a Sicilian monopoly from 1833 to 1906, when the sulfur Consorzio was established; in 1907 the sole U.S. producer made a bilateral agreement with the Consorzio to divide the world market 67/33%; in 1922, the legal U.S. export cartel Sulexco joined the Consorzio (75/25% world exports share agreement)
Eckbo (1976:39), Hexner (1946: 272-
273); MacKie-Mason and Pindyck
(1987:203-210)
87A. Refers to 1934-1939; four U.S. producers controlled 75-80% of world supply and Italy the
Eckbo’s interpretation of Hexner’s case study 50+ -- Eckbo (1976:39),
Hexner (1946: 272-

J. M. Connor Price-Fixing Overcharges 3rd Edition February 2014
222
rest 273)
87B. Same as 87A Lerner index derived from an econometric model 45 --
Griffin (1989:189-190), Hexner (1946:273)
87C. Cartel 1907-1913; Union Sulfur Co. agreed to cease U.S. exports to Europe and vice-versa
Lerner index derived from an econometric model 53 --
Griffin (1989:189-190), Hexner (1946:272)
87D. Cartel during 1922-1932; an agreement between the U.S. Webb-Pomerene Assn. Sulexco of 3 members and the Consorzio to limit exports and set quotas for each party [see also cartel 291]
Lerner index derived from an econometric model 24 --
Griffin (1989:189-190), Hexner (1946:272)
87E. Cartel of 1947-1958 Lerner index derived from an econometric model 28 -- Griffin (1989:189-
190) 87F. Same as 87C, except slightly longer period 1906-1917; two more U.S. suppliers entered by 1919, briefly ending collusion
Average world export prices 1906-1917 compared to 1919-1920 prices; peak is 1908
70 77.3 MacKie-Mason and Pindyck (1987: 203-
210)
87G. Same as 87D, except 1922-1940 Average world export prices 1922-1940 compared to 1919-1920 prices; peak is 1932
36.7 93.6 MacKie-Mason and Pindyck (1987: 203-
210)
87H. Same as 87D, except 1922-1940
Average world export prices 1922-1940 compared to long-run marginal costs; peak is 1932
201.8 327 MacKie-Mason and Pindyck (1987: 203-
210)
87I. Same as 87D
Authors choose 1928 as a representative year and compare elevated discriminatory export prices to the domestic price
203 -- MacKie-Mason and Pindyck (1987: 206-
208)
87J. Same as 87E, except 1947-1973; fringe supply grew in Mexico, Canada, and France; in 1968 posted prices replaced by delivered pricing
Average world export prices 1947-1973 compared to 1973 price; peak is 1954
69 131.6 MacKie-Mason and Pindyck (1987: 203-
210)
87K. Same as 87D and E; cartel years 1922-1932 and 1947-1962
Econometric model predicts 8.3% decline in export volume during cartel years; price effect predicted from elasticity is statistically significant
6.3 -- Dick (1992:103)
87L. Same as 87D; dates U.S. collusion with the Consorzio from Dec. 1923
Compares prices in 1924-1929 with 11/1923 30 --
Wallace and Edminster (1930:262)
88. International cartel alleged in copper concentrate 2001-2003, probe by U.S. and EU
Press reports, method unknown 25 -- Connor (2003: Table A.4)
89A. EU carbonless paper cartel 1992-1995, fined by EC
From Eur. Commission decision with EU prices 10-24 -- Connor (2003: Table
A.5), EC (8/8/2002)
89B. Same as 89A
From final EC decision, EU quarterly 1994-95 price increases of reels, mean across countries; average assumes 1992-93 increases same as 1994-95; peak is 9/95
58 116 EC(4/21/04:82-88)
89C. Same as 89A
From final EC decision, EU quarterly 1994-95 price increases of reels, mean across countries; average assumes 1992-93 increases same as
39 78 EC(4/21/04:82-88)
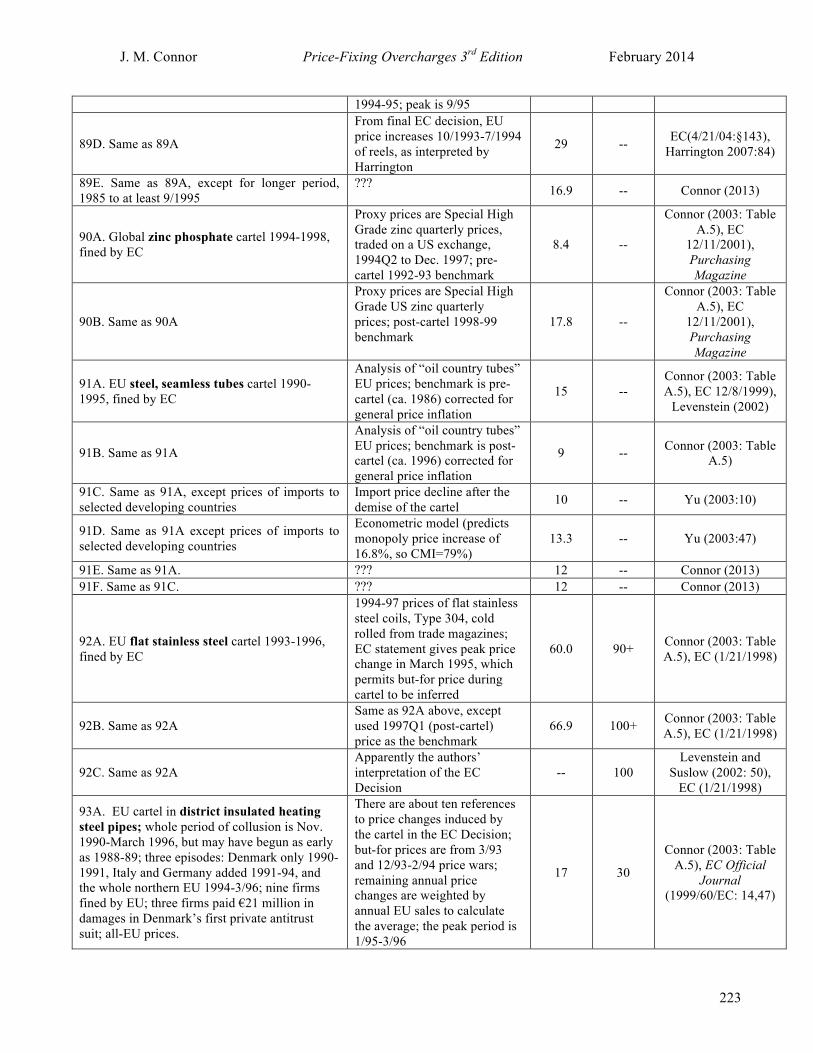
J. M. Connor Price-Fixing Overcharges 3rd Edition February 2014
223
1994-95; peak is 9/95
89D. Same as 89A
From final EC decision, EU price increases 10/1993-7/1994 of reels, as interpreted by Harrington
29 -- EC(4/21/04:§143), Harrington 2007:84)
89E. Same as 89A, except for longer period, 1985 to at least 9/1995
??? 16.9 -- Connor (2013)
90A. Global zinc phosphate cartel 1994-1998, fined by EC
Proxy prices are Special High Grade zinc quarterly prices, traded on a US exchange, 1994Q2 to Dec. 1997; pre-cartel 1992-93 benchmark
8.4 --
Connor (2003: Table A.5), EC
12/11/2001), Purchasing Magazine
90B. Same as 90A
Proxy prices are Special High Grade US zinc quarterly prices; post-cartel 1998-99 benchmark
17.8 --
Connor (2003: Table A.5), EC
12/11/2001), Purchasing Magazine
91A. EU steel, seamless tubes cartel 1990-1995, fined by EC
Analysis of “oil country tubes” EU prices; benchmark is pre-cartel (ca. 1986) corrected for general price inflation
15 -- Connor (2003: Table A.5), EC 12/8/1999),
Levenstein (2002)
91B. Same as 91A
Analysis of “oil country tubes” EU prices; benchmark is post-cartel (ca. 1996) corrected for general price inflation
9 -- Connor (2003: Table A.5)
91C. Same as 91A, except prices of imports to selected developing countries
Import price decline after the demise of the cartel 10 -- Yu (2003:10)
91D. Same as 91A except prices of imports to selected developing countries
Econometric model (predicts monopoly price increase of 16.8%, so CMI=79%)
13.3 -- Yu (2003:47)
91E. Same as 91A. ??? 12 -- Connor (2013) 91F. Same as 91C. ??? 12 -- Connor (2013)
92A. EU flat stainless steel cartel 1993-1996, fined by EC
1994-97 prices of flat stainless steel coils, Type 304, cold rolled from trade magazines; EC statement gives peak price change in March 1995, which permits but-for price during cartel to be inferred
60.0 90+ Connor (2003: Table A.5), EC (1/21/1998)
92B. Same as 92A Same as 92A above, except used 1997Q1 (post-cartel) price as the benchmark
66.9 100+ Connor (2003: Table A.5), EC (1/21/1998)
92C. Same as 92A Apparently the authors’ interpretation of the EC Decision
-- 100 Levenstein and
Suslow (2002: 50), EC (1/21/1998)
93A. EU cartel in district insulated heating steel pipes; whole period of collusion is Nov. 1990-March 1996, but may have begun as early as 1988-89; three episodes: Denmark only 1990-1991, Italy and Germany added 1991-94, and the whole northern EU 1994-3/96; nine firms fined by EU; three firms paid €21 million in damages in Denmark’s first private antitrust suit; all-EU prices.
There are about ten references to price changes induced by the cartel in the EC Decision; but-for prices are from 3/93 and 12/93-2/94 price wars; remaining annual price changes are weighted by annual EU sales to calculate the average; the peak period is 1/95-3/96
17 30
Connor (2003: Table A.5), EC Official
Journal (1999/60/EC: 14,47)

J. M. Connor Price-Fixing Overcharges 3rd Edition February 2014
224
93B. Same as 93A
Authors’ interpretation of the full EC decision 10-20 --
Levenstein and Suslow (2002: 51), EC Official Journal (1999/60/EC: 14,47)
93C. Same as 93A, except Denmark only
Plaintiffs’ estimate of single damages (€38.07 million) using 1999 price in Odense after the cartel collapsed as the but-for price; peak is 1992
54-67 69 Møllgaard (2006:7-8)
93D. Same as 93C
Defendants’ estimate using the price in 1990 as the but-for price (the Court’s expert/referee Møllgaard believes that price is inappropriate because collusion began 2 years earlier); peak is 1992
9-11 12.5
KPMG (2003), PriceWaterhouse-
Coopers (2002:16), Møllgaard (2006:8-9)
93E. Same as 93C
The High Court of Western Denmark approved a private compensatory suit settlement of €21 million: 57% of plaintiffs’ claimed damages and 3.5 times defendants’ estimate
34 43
KPMG (2003), PriceWaterhouse-
Coopers (2002:16), Møllgaard (2006:8-9), High Court of Western Denmark
(2005)
93F. Same as 93C
Defendants’ estimate using the cost-based method to develop a but-for price (the Court’s expert/referee Møllgaard believes the normal rate of return used was exaggerated because of the defendants’ X-inefficiency); peak is 1992
12 15
KPMG (2003), PriceWaterhouse-
Coopers (2002:16), Møllgaard (2006:8-
9)4
93G. Same as 93A
Before price and 1st price war price are the same; peak is 6/91-9/91
4.9 10.0 EC Decision (10/21/98)
93H. Same as 93B Base is 1st price war price 10 -- EC Decision (10/21/98)
93I. Same as 93B Base is 2nd price war price 22.2 44.4 EC Decision (10/21/98)
93J. Same as 93C 3rd episode called "the Euro Plan." Base is 2nd price war price; peak 1/1995-3/1996.
26.7 40.0 EC Decision (10/21/98)
93K. Same as 93C 4th episode called "the Euro Plan." Base is before price; peak 1/1995-3/1996.
24.8 -- EC Decision (10/21/98)
94. A magnesite export cartel was established by Austrian and Czech producers in 1923 (probably ended 1939) as a joint marketing venture; U.S. producers later developed “an understanding” with the cartel to divide the No. Am. and European markets, for which they were prosecuted by the DOJ in 1941
Eckbo’s interpretation of the antitrust prosecution 50+ -- Eckbo (1967:40)
95. EU steel beams cartel 1984-1990, EC fines Benchmark is EU prices in mid 1990 to late 1992 after the 20-30 -- Connor(2003: Table
A.5), EC (2/16/94),

J. M. Connor Price-Fixing Overcharges 3rd Edition February 2014
225
cartel members were raided The Independent (1/14/93)
96. British sugar refining cartel 1986-1990, fined by EC
From EC decision 50 --
Connor (2003: Table A.2), EC
(10/14/1998) 97. Mobile telephone roaming charges in UK and Germany; EC probe underway 2003; dates uncertain (2000-2002?)
Trade journal reports of yardstick fees in other European countries
450 -- Connor(2003: Table A.5)
98. Explosives cartel in U.S. regions 1985-1993; some bid-rigging; U.S. convictions
DOJ indictment for the IL, IN, and KY prosecution, dated 11/5/1997; method unknown 3-4.5 --
Connor (2003: TableA.6), Business
Crimes Bulletin (11/1997)
99A.International cartel in thermal fax paper sold in large rolls in U.S. 1990-1992, U.S. convictions
Press stories paraphrasing DOJ and CCB officials
10 --
Connor(2003: Table A.6), Levenstein and Suslow (2002: 51),
DOJ officials quoted in L.A. Times
(7/15/94)
99B. Same as 99A, except Canada
Press stories paraphrasing DOJ and CCB officials 10 --
Canada Bureau of Competition officials
in L.A. Times (7/15/94)
100. International ferrosilicon cartel 1989-1991, convicted in U.S.
From a decision of the US Court of Appeals 2nd Circuit of 11/1999 on the prices set by the cartel in its early months, compared to prices in 1989
5.2-10.3 --
Connor (2003: Table A.6), NY Law J.
(11/19/1999), Platt’s Metals Week (8/12/2002)
101A. International bid-rigging cartel, USAID wastewater plant construction projects in Egypt, 1988-1996, convicted in U.S. courts; court opinion gives details on profits made on one large bid (47%)
U.S. federal Court of Appeals 11th Circuit (2002) decision gives restitution ordered to be paid to USAID and affected sales; also U.S. govt. report to OECD; consistent with profit rate minus a generous “normal” industry profit rate.
33-38 -- Connor (2003: Table
A.6), OECD (2003:56)
101B. Same as 101A Reading of U.S. court decision 16.4-39.2 -- Appendix Table 4:
entry 20 below
101C. Same as 101A Survey response of US DOJ to OECD 33.3 -- OECD (2003: 56)
102A. Canadian bid-rigging cartel in the compressed industrial gasses industry June 1989 – May 1990; fined by predecessor of the CCB
Statement of the Canada’s Ontario Ministry of Health on the effects of the post-cartel price cut on its gas purchases
21 -- Connor (2003: Table A.6), Globe and Mail
2/8/1992)
102B. Same as 102A Prices in Ontario compared to US border cities during conspiracy
40 -- Connor (2003: Table A.6), Globe and Mail
2/8/1992)
103A. International sulfuric acid cartel in U.S. and Canada 1988-1998; under DOJ and Bureau investigations 2003-08; no fines, but private plaintiffs win antitrust settlement in 2008
From Chem Market Reporter and other trade magazines, prices for bulk deliveries of pure or standard virgin grade to US, Gulf or Tampa; but-for US price is from year 2000
32-53 -- Connor (2003: Table A.6)
103B. Same as 193A, except 1/1988-1/16/2003 Same as above, but improved affected sales data from Connor (2013)
63.3 -- Connor (2013)

J. M. Connor Price-Fixing Overcharges 3rd Edition February 2014
226
104A. An international price-fixing agreement between a U.S. toy and games manufacturer and two UK retailers to raise prices to manufacturer’s “recommended retail” price; agreement in force from early 1999 to at least May 15,2001 (possibly as late as 9/2001); fined by UK Office of Fair Trade, upheld in April 2005 by the Competition Appeal Tribunal
UK Office of Fair Trade estimate
42 -- Connor (2003: Table A.6)
104B. Same as 104A
The simple arithmetic mean of changes in UK retail prices of five popular toys and games (Monopoly, Dr. X, Action Man, Tweenies Doodles, Knex construction set) from early 1999 to 2001; peak is Knex set
41.8 100.0
UK Office of Fair Trade Decision No.
CA98/8/2003 (11/21/2003); Times
of London (2/20/03:5)
104C. Same as 104A
Statement by UK OFT of fall in the two retailers’ catalog prices from 2001 to 2003 of the Monopoly game
22.2-25.0 --
UK Office of Fair Trade Decision No.
CA98/8/2003 (11/21/2003); AP
4/29/05) 105. International cartel in the markets for generic drugs (Warfarin and penicillin) sold by bidding for UK national health service contracts 1996-2000; under UK investigation, restitution paid to Health Service
UK National Health Service estimate
163 -- Connor (2003: Table A.6)
106 A. International cartel, cement, mostly bid rigging against several German government units 1991-2001; four geographic areas of collusion identified within Germany (E., S., N. and W-Central); fined in 2003 by the Bundeskartellampt (BKA); Higher Court heard private damages suits.
Press reports of BKA decision include BKA-estimated overcharges by cartel on a price per ton basis; trade sources on Belgian and EU-wide prices are used for a competitive "yardstick" price
11-23 -- Connor (2003: Table A.6)
106 B. Same as above 106A
Based on a real price index of cement in Germany compared to prices before (1978-82); peak is 1999
16.9 28 Lorenz (2006: 6)
106 C. Same as above 106A
Based on a real price index of cement in Germany compared to prices after (2004); peak is 1999
16.9 28 Lorenz (2006: 6)
106 D. Same as 106A, except refers to East Germany only
Econometric model finds no evidence that pricing conduct changed in 2002
0 0 Blum (2007)
106 E. Same as 106A
Analysis of Higher Court decision agrees with Court’s position that prices after cartel was raided (e.g., late 2003) are good benchmark; peak price Jan. 2002.
9.4 22.5 Friederiszick and Roeller (2010: 6)
106 F. Same as 106A
Analysis (mainly non-German yardstick prices) of Germany's Federal Cartel Office performed to justify the fines (not to exceed 3X overcharges).
10-15 -- Frank and Lademann (2010:361)

J. M. Connor Price-Fixing Overcharges 3rd Edition February 2014
227
106 G. Same as 106A
Econometric study of 2500 transaction prices, and where post-collusion benchmark price is determined by a novel “structural break analysis”
16.1 -- Hueschelrath and
Veith (2011: Table 4, Equation 1)
106 H. Same as 106A
Econometric study of 2500 transaction prices, and where post-collusion benchmark price is determined by a novel “structural break analysis”
16.7 -- Hueschelrath and
Veith (2011: Table 4, Equation 2)
106 I. Same as 106A
Econometric study of 2500 transaction prices, and where post-collusion benchmark price is determined by a novel “structural break analysis”
20.5 -- Hueschelrath and
Veith (2011: Table 4, Equation 5)
106 J. Same as 106A Same as 106 I, using the “basic method” of before-and-after regression.
20.7 -- Hueschelrath et al. (2012a: 12)
106 K. Same as 106A
Same as 106 I, using the “extended approach with instrumented cement demand” regression method.
20.3 -- Hueschelrath et al. (2012a: 14-15)
106 L. Same as 106A Same as 106 I, using the “pooled OLS” before-and-after regression method.
23.0-26.0 -- Hueschelrath et al.
(2012a: 17-18)
106 M. Same as 106A Same as 106 I, using the “differences-in-differences” regression method.
26.2-26.5 -- Hueschelrath et al.
(2012a: 21)
106 N. Same as 106A
Econometric study of 340,000 customer invoices, and where post-collusion benchmark price is determined by a novel “structural break analysis”
32.5 -- Hueschelrath et al. (2012b: Table 5,
disaggregated data)
106 O. Same as 106A
Econometric study of 340,000 customer invoices, and where post-collusion benchmark price is determined by a novel “structural break analysis”
31.3 -- Hueschelrath et al. (2012b: Table 5, aggregated data)
107A. International bid-rigging cartel in large-scale construction projects, mostly purchased by the Norwegian government, 1994-2000
Estimate by the Norwegian antitrust authority, method uncertain
37 -- Connor (2003: Table A.6)
107 B. Same as 107A, except for the years 1993, 1995, 1996, and 1997; the number of bidders varied from N=2 to N=7, and the project sizes from NOK13 to NOK106 million.
The contract values of 5 rigged bids are divided into the side payments made to the losers (a yardstick for cartel profits), where the payments are adjusted by N/(N-1); peak is 1997
3.17 5.66 Sunnevåg (2007)
108A. International bid-rigging of Dutch civil construction projects, exposed by parliamentary investigations in 2002-2003; 90% of the bids were for government projects; began before 1986, but illegal only after 1998; believed to have ended 2002; one-third of the bidding rings had 6 or more bidders; of the
Dutch government estimates from internal company documents; given in testimony at Parliamentary hearings; covers 1998-2001 period; method unknown
8.8 --
Connor (2003: Table A.6), Van Bergeijk et
al (2006), Tweede Kamer (2002), Van den Heuvel (2005:
133)

J. M. Connor Price-Fixing Overcharges 3rd Edition February 2014
228
1400+ firms, the Netherlands Competition Authority imposed fines of €306 million on 1,300+ firms during 2003-06
108B. Same as 108A, but refers to the construction of government office buildings
A “detailed statistical study by SEO/TNO” (the NL Court of Audit) of construction costs
14 -- Van Bergeijk et al (2006:4), Van den
Heuvel (2005: 146) 108C. Same as 108A, but refers to a broad analysis of more than 1300 bids during 1986-1998 and the secret internal cartel records (the “Bos Shadow Accounts”)
All “available national empirical studies”; methods unknown
9-16 -- Van Bergeijk et al (2006:8)
108D. Same as 108A, except refers to tenders that were lost by the Dutch cartels to profitable Belgian construction firms
Compares prices Belgian yardstick to prices of similar projects by Dutch firms
43 -- Van den Heuvel (2005: 136)
108E. Same as 108A. “Conservative estimate” by economist, method unknown 10-15 -- Schinkel (2009)
109. International cartel in retail gasoline in Italy 1994-2000
Italian competition authority statement; method unknown 3.6 -- Connor (2003: Table
A.6),
110. International cartel in retail gasoline on French superhighways 1999-2002; four international petroleum processors were fined €27 million in 2003
Estimate based on yardstick comparisons of prices in nearby, off-highway stations; costs of French superhighway stations actually lower than those in rest of Europe
25-30 -- Conseil Concurrence
(2003), Connor (2003: Table A.6),
111. International cartel in retail gasoline in Sweden Nov. 1999-Feb. 2000, convicted by the competition authority and by Stockholm City Court on appeal
Estimate of the Swedish competition authority 8.3 --
Connor (2003: Table A.6), Fallenius
(2001: 145, 148)
112A. International cartel of suppliers rigged bids for military fuels for the Korean defense procurement agency 1998-2000; heavy fines levied 9/00
Analysis by the Korean FTC presented with its fine decision 17 -- Connor (2003: Table
A.6); KFTC (6/7/01)
112B. Same as 112A Study (probably econometric) by Seoul University found an overcharge of $99 million
18.1 -- Energy Compass (8/20/04), KFTC
(6/7/01) 113. International flat glass cartel operating in U.S. 1991-1995; DOJ investigation, no indictments; civil settlement approved 2/2000 after jury finding of guilt in private treble-damages trial (but before damages phase)
Conclusion of plaintiffs’ expert’s (John Beyer) testimony from an econometric model
30-35 -- Connor (2003: Table A.6)
114. International cartel in ready-mix concrete in Germany 1995-1998; fined by Germany’s Bundeskartellampt (BKT)
Report of the German government to the OECD; method not revealed
9 -- OECD (2003:54),
Connor (2003: Table A.6)
115. International cartel in manufacture of ball and roller bearings in France 1993-1997, fined by the French competition council
French Competition Council statement; method not revealed but probably 1992 price comparison
9.4 16.4
Connor (2003: Table A.6), Conseil Concurrence
(9/23/02) 116A. International bid rigging by ABB and Siemens in the Norwegian electrical (hydro-power) equipment industry 1970?-1997; kept market shares constant at 67% and 33% for decades; fined by Norway
Norwegian competition authority report to OECD; method not revealed 9 -- OECD (2003:55)
116B. Same as 116A
Analysis by the chief economist of the Norwegian Competition Authority that shows price effects of 7 rigged
26.9 39 Sølgard (2007:16)

J. M. Connor Price-Fixing Overcharges 3rd Edition February 2014
229
contracts; method unknown 117. International cartel that fixed the fees for Italian cell (mobile) telephone services 1998-1999, fined by Italian antitrust authority (AGCM)
Estimate of the Italian antitrust Authority AGCM; method not revealed 11 -- Connor (2003: Table
A.6),
118. Bid rigging against Italy’s national health service for pharmaceuticals treating respiratory illnesses 1995-1997, fined by AGCM
Statement of the AGCM; method not revealed 50 -- Connor (2003: Table
A.6),
119. Bid rigging against Italy’s national health service for pharmaceuticals treating high cholesterol 1995-1997, fined by AGCM
Statement of the AGCM; method not revealed 50 -- Connor (2003: Table
A.6),
120. Frozen foods cartel in Tasmania, Australia , “late 1990s” (ca. 1996-99), prosecuted and fined by Australian Competition and Consumer Commission
Report of the government of Australia to the OECD 10-12 -- OECD (2003:53)
121. Installation of fire protection devices in Australia; ca. 1996-99; fined by Australian CCC
Report of the government of Australia to the OECD 5-15 -- OECD (2003:53)
122A. Bid-rigging by 260 electric wiring contractors and electricians in Denmark in late 1990s (ca. 1996-2001); convicted and fined by Danish courts
Report of the Government of Denmark to the OECD; method not revealed 20-30 -- OECD (2003:54),
Gommesen (2003)
122B. Same as 122A
Analyses of “long run prices” by the Danish Competition Authority (DCA) using several yardsticks
12 -- OECD (2006:120)
122C. Same as 122A
A DCA survey of several property-management companies of the post 2001 change in prices
11.1 -- OECD (2006:120)
123. Bid rigging of public tenders for road markings in Germany in 1990s (ca. 1990-99); fined by BKA
Report of the government of Germany to the OECD; from a decision; method not revealed
13+ -- OECD (2003:54)
124A. Cables, high voltage electricity in Germany began in 1901; legal until 1958, and again 1975-84; formally ended when fined in 1997, but may have broken down after 1992-93 as a result of German unification; bid rigging conduct; national cartel protected from imports and entry by a separate intl. cartel; 34 members in 1968, declined to 24 in 1990; CR4=84% in mid 1990s; convicted by BKA in 1959, 1972, and 1974, then heavily fined by BKA in 1997.
Report of the German government to the OECD; refers to 1958-1997 period when price-fixing was mostly illegal in Germany; method not revealed -- 50
OECD (2003:54), Hahn and Normann
(2001), Normann and Tan (2005, 2011,
2014)
124B. Same as 124A, except 1958-1990; cartel registered but ignored by BKA until fined in 1972 and 1974; from 1974 to 1985, cartel granted a “rationalization exemption” but secretly fixed prices contrary to rules through a trust and a trade association; ended 1997; no increase in efficiency detected, only profits.
Regression analysis of annual data for 1958-1990; profit increase during 11-year period cartel was exempted compared to non-exempt period
16.4 -- Normann and Tan (2005: 16-20)
124C. Same as 124B
Regression analysis of annual data for 1958-1990; profit increase during 11-year period cartel was exempted compared corrected for reduced output
13 -- Normann and Tan (2011: 18)

J. M. Connor Price-Fixing Overcharges 3rd Edition February 2014
230
124D. Same as 124B
Authors and Fed Cartel Office decision suggest that decline in real prices in 1993-96 is evidence of overcharges in 1958-1992
59 -- Normann and Tan (2011: 22)
124E. Controlled market experiment with explicit communication; the parameters employed appear to be inspired by the structure of the cable industry: inelastic demand, homogeneous product, large number of buyers, constant costs, no supply constraints. Repeated Cournot game, without and then with explicit communication, and with N=2, 4, 6, or 8 sellers.Cheating is detected with certainty and immediately.
Authors compute increase in avg. selling prices observed in explicit communication relative to Cournot “implicit” noncooperative competition when N=2 sellers 85.5 --
Hahn and Normann (2001), Fonseca and
Normann (2011: Figure 1)
124F. Same as 124E
Authors compute increase in avg. selling prices observed in explicit communication with N=2 relative to Cournot “implicit” noncooperative competition when N=4 sellers bidding
1255 --
Hahn and Normann (2001), Fonseca and
Normann (2011: Figure 1)
124G. Same as 124E
Authors compute increase in avg. selling prices observed in explicit communication with N=2 relative to Cournot “implicit” noncooperative competition when N=6 sellers
2500 --
Hahn and Normann (2001), Fonseca and
Normann (2011: Figure 1)
124H. Same as 124E
Authors compute increase in avg. selling prices observed in explicit communication with N=2 relative to Cournot “implicit” noncooperative competition when N=8 sellers
4918 -- Fonseca and
Normann (2011: Figure 1)
125. Hotel association in Spain; ended late 1990s; fined by Spain’s competition authority
Report of the government of Spain to the OECD; method not revealed
3 -- OECD (2003:55)
126. Sugar in Spain; ended late 1990s; fined by Spain’s competition authority
Report of the government of Spain to the OECD; method not revealed
3 -- OECD (2003:55)
127A. The U.S. Railroad Express Cartel fixed prices for long-distance shipments of packages by rail or ship from 1851 to 1913, when its members came under the authority of the Interstate Commerce Commission; in its 62 years; only one price war, in response to a failed attempt at large-scale entry; only two brief episodes of dissention; annual profits in late 19th cent. averaged 40% on invested capital despite very large side payments to shipping firms (which provided no free services)
Rates are taken from several archives of the internal business records of the five cartel members; mark-ups are calculated from the inter-member charges (costs) for transshipments between exclusive territories in 1885-1900
150-233 -- Grossman (1996:227)
127B. Same as above Change in rates in overlapping cities during the only recorded price war in 1886 -1888
50-72 -- Grossman (1996:229)

J. M. Connor Price-Fixing Overcharges 3rd Edition February 2014
231
128. To stem to steep decline in tea prices since 1927, a voluntary agreement in 1930 by four regional producer associations in Asia representing hundreds of tea plantations led to an agreement on significant output reductions in 1931-1932; followed by a mandatory British Empire cartel in 1933
Prices in 1931-1932 (the first since before 1927) compared to prices in late 1920s in the London market (handled 56% of world market) for four teas, weighted by the four regions’ average quantities sold in 1931 and 1932.
29.0 -- Gupta (2001a: 146)
129A. The first episode of the global cartel in heavy electrical power equipment began in 1892 and ended 1914; the second lasted from 1919 to 1939; and the third called the International Electric Association operated from London from 1945 to at least the early 1980s; members rigged bids to private and public utilities, most in low-income countries; controlled 72-86% of world trade in heavy electrical power equipment in 1965-67; 1945 DOJ conviction of 2nd episode and 1947 FTC consent decree covered only IEA trade with U.S.; U.S. Congress hearings and Brazilian investigation in early 1980s, but no legal actions after 1947; the IEA as a formal organization was still in existence in 1999 but effectiveness ended earlier (ca. 1990-95)
No price data for first two episodes.
Mirow and Maurer (1982: 276-282), Epstein (1971),
Epstein and Newfarmer (1980: 52), Jenny (2003);
Hexner (1946: 360-362)
129A . Refers to 3rd episode
Detailed internal records of IEA’s bids for large power transformers May 1965-Dec. 1967 show differences in winning prices between rigged and unrigged tenders (latter is the yardstick); average is for a large sample of industrialized countries; peak is for bids with single bidders
11.9 69
Mirow and Maurer (1982: 276-282), Epstein (1971),
Epstein and Newfarmer (1980: 52
129B. Same as 129A above
Winning bid prices in 1970s when by agreement only one IEA member bid and no outsiders bid vs. bids with outsiders
50 -- U.S. Congress (1980:125)
129C. Same as 129A Same as 129A, but refers to mark-ups for less developed countries
18.7 69 Epstein and
Newfarmer (1980: 52)
130A. International uranium metal cartel of world’s major producers in France, Canada, Australia, UK, and South Africa was founded in 1972 and operated effectively from mid 1974 to Dec. 1975; a private U.S. suit filed against Gulf Oil (parent of Canadian member) resulted in payout of about $1 billion; criminal DOJ misdemeanor case ended with Gulf pleading nolo contendare and paying $40,000 fine, low because of Canadian government objections.
U.S. prices in Dec. 1974 to Dec. 1975 compared to early 1974; peak is Dec. 1975; world prices followed similar trend
244 471 Mirow and Maurer
(1982: 95-118), U.S. Congress (1977)
130B. Same as 130A above; book by Canadian journalist identifies the effective cartel period as mid 1972 to Feb. or Mar. 1974, after which
Price data not very precise; appears that pre-cartel price outside U.S. was about
44 74 Gray (1982: 147,151,164)

J. M. Connor Price-Fixing Overcharges 3rd Edition February 2014
232
market forces influenced primary control; by July 1974, world prices were 25% higher than the cartel’s list price
$4.50/lb.; cartel raised prices by $2 to end of 1973 and by another $1.34 in late Jan. 1974
130C. Same as 130A Lerner index predicted from econometric model 50 -- Griffin (1989:189-
190) 130D. Same as 130A, except that price data from the US civil trial show that the cartel floor prices in 10/1973 and 1/1974 led the rise in spot US prices; author concludes that cartel had only short-run price effects.
Average US Nuesco spot prices in 10/73 to 12/74 compared to spot prices in 6/73 to 9/73 ($6.25)
62.7 140 LeCraw (1977: 78)
130E. Same as 130A
Same as above except that the base price is total economic costs, including profit and a risk premium (also $6.25)
67.2 140 LeCraw (1977: 78 and 82)
130F. Same as 130A Author concludes that it was “unlikely” that cartel affected prices
0 0 Joskow (1976)
130G. Same as 130A Reading of U.S. court decision -- 567 Appendix Table 4: entry 19 below
130H. Same as 130A, except authors suggest that cartel exhibited supra-normal prices from mid 1974 to about the end of 1989; prices from the 1969-1986 Nuexco Exchange spliced to 1987-2005 Ux U308 prices; the average annual price 1975-88 was about $57 (in $2005). Prices were declining from about $27 in 1969 to $22 in 1974 and continued to decline from $19 in Dec. 1989 to $12 to $10 in the mid 1990s.
Authors calculate the real $2005 prices and identify $27 as the approximate “before” price; price peaked at $110 in early 1977 111 307
Estimated by author from Davis and
Garces (2009: Fig. 2 of chapter on
damages)
130I. Same as 130H.
Authors calculate the real $2005 prices and identify $19 as the approximate “after” price; price peaked at $110 in early 1977
200 479
Estimated by author from Davis and
Garces (2009: Fig. 2 of chapter on
damages) 131A. The first international (Dutch-German) Quinine cartel began in 1892. This cartel became global in 1913, with a Secretariat in Amsterdam and every producer in the world as members (except one large government-owned Indonesian firm). The cartel refused to buy Indonesian quinine. The Quinine Convention, intl. export cartel of two manufacturers in NL (Nedchem) and DE (Boehringer) began in 1959; in 1960 3 firms added from DE, FR, and UK (last owned by U.S. parent Rexall Drug and Chemical); unsigned agreements on reducing export quantities, stocks, and member quotas from 1959 to1966; in 1961 it organized a monopsony to buy quinine bark; in late 1962 a price war bugun by Nedchem; in 1963, the agreement was renegotiated without one UK firm that ceased production; in 1968 criminal indictments by U.S. DOJ resulted in nolo pleas and substantial fines; EC investigated 7/1967 and fined 6 firms
World prices in early 1964 to 1966 compared to prices in early 1960s; some of the increase was due to a surge in demand by the US military, but this is not corrected for
-- 400
Mirow and Maurer (1982: 130), U.S.
Congress (1966-67), Martin (2010: 669-
671)

J. M. Connor Price-Fixing Overcharges 3rd Edition February 2014
233
$470,000 in 1970; ended early 1965?
131B. Same as 131A for early 1930s Price offered to League of Nations for relief programs compared to cartel price
77.5 -- Staley (1937:289-290)
131C. Same as 131A for 12/1962 to 12/1964
Before price in 1962 to end of 1964, aided somewhat by increased demand by the US military for Vietnam War.
-- 500 Martin (2010: 669-671)
132. Red phosphorous cartel 1959-“early 1960s” (ca. 1963); three companies from UK, NL, and DE; price fixing and territorial division everywhere except Asia
Prices before cartel compared to cartel price in early 1960s 43 -- Mirow and Maurer
(1982: 134-135)
133. The Southern Railway & Steamship Association was the second successful and stable U.S. cartel 1875-1887; all long distance freight and passenger transport among companies operating south of the Potomac and Ohio rivers and east of the Mississippi; historical study based on its internal records
An estimate made by the association in prior to its first month of operation of revenue losses due to discounting from regular rates
42 -- Hudson (1890: 71)
134A. The Western Ontario petroleum lamp oil refiners’ cartels operated 1870 to 5/1880; first episode was 1870-73
Econometric cartel model with monthly wholesale lamp oil prices Jan. 1870 to May 1880, with dummy variable for known collusive periods; difference between predicted competitive and collusive prices
31 55 Grant and Thille (2001: Figure 2)
134B. Same as 134A above, but for 2nd episode 1874 to mid 1877
Same as above 68 84 Grant and Thille (2001: Figure 2)
134C. Same as 134A above, except for 3rd episode mid 1877 to May 1880
Same as above 0 -- Grant and Thille (2001: Figure 2)
135A. The international 1926-1939 phosphate rock exports cartel began with the cooperation of the French and German national cartels (under government pressure); in 1933 the Phosphate Export Assn. (a U.S. Webb-Pomerene assn.) joined the European cartel, for which it was indicted by the DOJ in 1939; other phosphate cartels from North Africa, Egypt, and Curacao also joined in 1933-1934; ended 1939
Eckbo’s interpretation of the abuse of dominant position of the French-German cartel; compares domestic prices 1926-1933 relative to “unpublished” export prices; such prices are shown in Hexner (1946:265)
50+ -- Eckbo (1967:39),
Hexner (1948: 264-266)
135B. New episode. U.S. national Webb-Pomerene phosphate export association, active 50 years, 1919-49; except for 1933-39, formally separate cartel from 135A for most of its existence
Econometric model with insignificant quantity effects; price effect almost significant
254 1156 Dick (1992:103)
135C. U.S. national Webb-Pomerene phosphate export association, second episode 1961-67; separate cartel from 135A for most of its existence
Econometric model with insignificant quantity effects; price effect almost significant
9.2 65.9 Dick (1992:103)
135D. Same as 135A, but Griffin studies only years 1933-1937
Lerner index from econometric model 42 -- Griffin (1989:189)
135E. Same as 135B. From 1919 to 1930, the Author ascribes difference 42 85 Lamer (1957: 146-
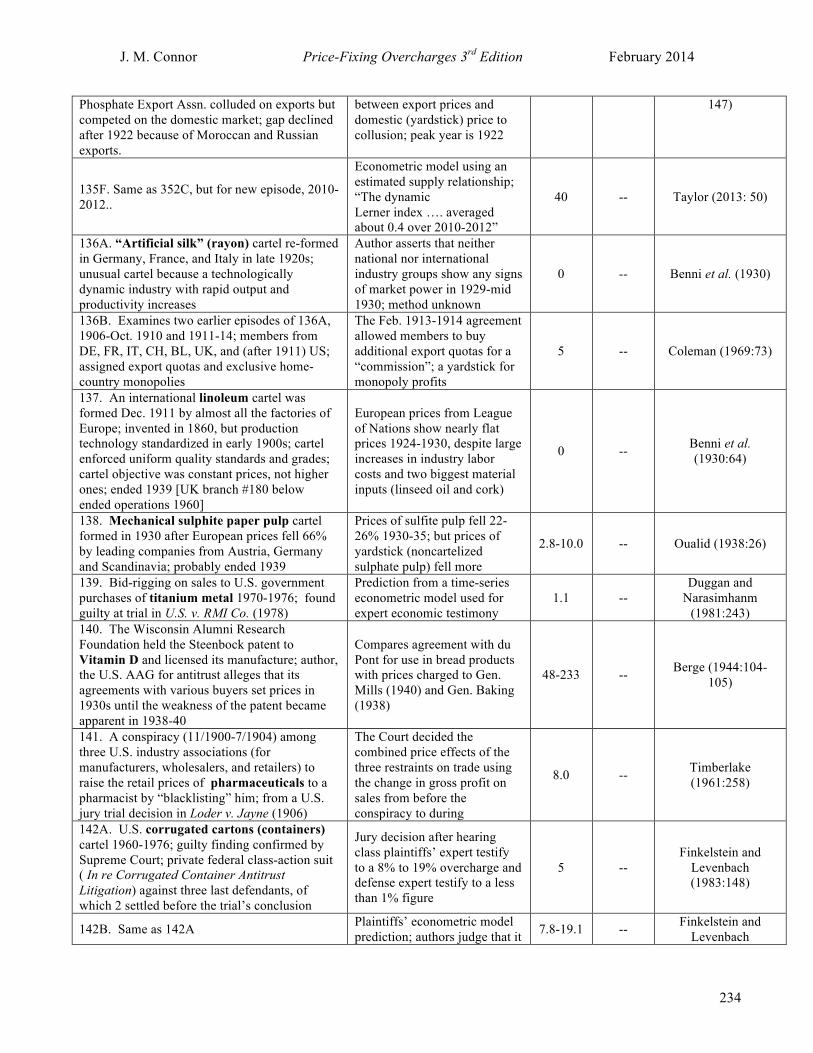
J. M. Connor Price-Fixing Overcharges 3rd Edition February 2014
234
Phosphate Export Assn. colluded on exports but competed on the domestic market; gap declined after 1922 because of Moroccan and Russian exports.
between export prices and domestic (yardstick) price to collusion; peak year is 1922
147)
135F. Same as 352C, but for new episode, 2010-2012..
Econometric model using an estimated supply relationship; “The dynamic Lerner index …. averaged about 0.4 over 2010-2012”
40 -- Taylor (2013: 50)
136A. “Artificial silk” (rayon) cartel re-formed in Germany, France, and Italy in late 1920s; unusual cartel because a technologically dynamic industry with rapid output and productivity increases
Author asserts that neither national nor international industry groups show any signs of market power in 1929-mid 1930; method unknown
0 -- Benni et al. (1930)
136B. Examines two earlier episodes of 136A, 1906-Oct. 1910 and 1911-14; members from DE, FR, IT, CH, BL, UK, and (after 1911) US; assigned export quotas and exclusive home-country monopolies
The Feb. 1913-1914 agreement allowed members to buy additional export quotas for a “commission”; a yardstick for monopoly profits
5 -- Coleman (1969:73)
137. An international linoleum cartel was formed Dec. 1911 by almost all the factories of Europe; invented in 1860, but production technology standardized in early 1900s; cartel enforced uniform quality standards and grades; cartel objective was constant prices, not higher ones; ended 1939 [UK branch #180 below ended operations 1960]
European prices from League of Nations show nearly flat prices 1924-1930, despite large increases in industry labor costs and two biggest material inputs (linseed oil and cork)
0 -- Benni et al. (1930:64)
138. Mechanical sulphite paper pulp cartel formed in 1930 after European prices fell 66% by leading companies from Austria, Germany and Scandinavia; probably ended 1939
Prices of sulfite pulp fell 22-26% 1930-35; but prices of yardstick (noncartelized sulphate pulp) fell more
2.8-10.0 -- Oualid (1938:26)
139. Bid-rigging on sales to U.S. government purchases of titanium metal 1970-1976; found guilty at trial in U.S. v. RMI Co. (1978)
Prediction from a time-series econometric model used for expert economic testimony
1.1 -- Duggan and
Narasimhanm (1981:243)
140. The Wisconsin Alumni Research Foundation held the Steenbock patent to Vitamin D and licensed its manufacture; author, the U.S. AAG for antitrust alleges that its agreements with various buyers set prices in 1930s until the weakness of the patent became apparent in 1938-40
Compares agreement with du Pont for use in bread products with prices charged to Gen. Mills (1940) and Gen. Baking (1938)
48-233 -- Berge (1944:104-105)
141. A conspiracy (11/1900-7/1904) among three U.S. industry associations (for manufacturers, wholesalers, and retailers) to raise the retail prices of pharmaceuticals to a pharmacist by “blacklisting” him; from a U.S. jury trial decision in Loder v. Jayne (1906)
The Court decided the combined price effects of the three restraints on trade using the change in gross profit on sales from before the conspiracy to during
8.0 -- Timberlake (1961:258)
142A. U.S. corrugated cartons (containers) cartel 1960-1976; guilty finding confirmed by Supreme Court; private federal class-action suit ( In re Corrugated Container Antitrust Litigation) against three last defendants, of which 2 settled before the trial’s conclusion
Jury decision after hearing class plaintiffs’ expert testify to a 8% to 19% overcharge and defense expert testify to a less than 1% figure
5 -- Finkelstein and
Levenbach (1983:148)
142B. Same as 142A Plaintiffs’ econometric model prediction; authors judge that it 7.8-19.1 -- Finkelstein and
Levenbach

J. M. Connor Price-Fixing Overcharges 3rd Edition February 2014
235
has some major econometric estimation problems
(1983:148)
142C. Same as 142A
Plaintiffs’ model is fitted to same data, but some if not all estimation problems are corrected
4.0-4.3 -- Finkelstein and
Levenbach (1983:148)
142D. Second treble damages suit by opt-outs from federal class (see 142B above)
Revised econometric model by plaintiffs’ expert, which authors judge to be more problematic than the original
26 -- Finkelstein and
Levenbach (1983:149)
142E. Same as 142D above
Testimony by Defendants’ expert finds numerous problems with plaintiffs’ model
0 -- Finkelstein and
Levenbach (1983:149)
142F. Same as 142D above Jury’s decision 0 -- Finkelstein and
Levenbach (1983:149)
142G. Same as 142A Plaintiffs’ expert’s econometric model prediction 7.8-26.0 --
Cohen and Scheffman (1989:345)
142H. Same as 142A Defendants’ expert’s econometric model prediction 0 -- Fisher (1980:729)
143A. In New Mexico v. American Pipe and Construction bid-rigging on concrete pipes from Feb. 1968 to Dec. 1973; one of several similar cases
Plaintiff’s expert predicted the but-for price from an econometric model using dummy variable for a brief competitive period; model judged sound by experts
15.5 --
Finkelstein and Levenbach
(1983:150), Parker (1977)
143B. Same as 143A
Defendant’s expert presented a rival econometric prediction using the “residuals” approach, which is inappropriate
0 -- Finkelstein and
Levenbach (1983:149, 164)
144. In In re Chicken Antitrust Litigation (1980) only the plaintiffs presented econometric evidence on an alleged association program to raise prices Jan. 1971-March 1973; the DOJ imposed injunctive relief
Plaintiff’s experts predicted a negative overcharge, which is judged to have serious autocorrelation problems; reruns indicate ineffective collusion
-5 -- Finkelstein and
Levenbach (1983:165)
145A. In In re Plywood Antitrust Litigation, three manufactures were found guilty of price fixing (using basing-point pricing system) of plywood in Southern US from Feb. 1968-Dec. 1973 by a jury; jury ignored the statistical evidence and figured damages from the “phantom freight” charges and excess weight allowances.
Defendants’ econometric model predicted no overcharge because of high demand during conspiracy, but later econometric experts judge the R&S model to be highly flawed
0 --
Finkelstein and Levenbach
(1983:154-158), Rubinfeld and Steiner (1983)
145B. Same as 145A, but this author believes the Southern plywood cartel lasted from 1964 to Dec. 1973; system used Douglas fir plywood prices in Portland, OR plus Denver-to-East RR delivery prices; cartel had 4 members 1964 and 24 by 1974, when CR4 slipped to 55%
The average discount from the official basing price was 5% 1967-1973; post cartel discounts are the but-for prices; best measure is Feb. 1977 when all sellers shifted to F.o.b. plant pricing
19 -- Loescher (1980:16)
146A. International tin cartel Sept. 1929-March 1931; initially an entirely voluntary agreement
Lerner index predicted from an econometric model 13 -- Griffin (1989:189-
190), Hexner

J. M. Connor Price-Fixing Overcharges 3rd Edition February 2014
236
of British, Dutch and Bolivian producers to reduce production by major mines; when cuts became too large, British and Dutch governments stepped in to enforce them and buy stocks; in 1931 an intergovernmental commodity agreement was signed that strongly increased prices soon thereafter
(1946:240-242)
146B. Same as 146A; Plummer quotes only falling prices
London exchange prices from before cartel to 1930-early 1932
-10 -- Plummer (1934:92-94)
146C. Same as 146A Judged to be “ineffective” 0 -- Elliott et al. (1937)
146D. Same as 146A
Price rise from fall 1932 to spring 1933 due to cartel’s cut in export volume; after spring 1933 demand increased prices
27-36 -- Staley (1937: 308)
146E. International cartel of 1921-1924 Econometric model predicts Lerner Index 18 -- Griffin (1989:189-
190) 146F. International cartel of 1956-1981; possibly government sponsored
Econometric model predicts Lerner Index 32 -- Griffin (1989:189-
190)
146G. Same as 146E
Mean annual deflated wholesale price for 1921-25, relative to 1920 price; peak year 1925
37.3 83 Suslow (2005:734)
146H. Same as 146E
Mean annual deflated wholesale price for 1921-25, relative to 1926-27 price; peak year 1925
0 0 Suslow (2005:734)
146I. Same as 146A, except 1931-32
Mean annual deflated wholesale price for 1931-32, relative to 1930 price; peak year 1931-31
0 0 Suslow (2005:734)
147A. International coke cartel April 1937-Sept. 1939; world export quotas for all major European producers administered by a joint venture in Brussels
Lerner index from econometric model 46 --
Griffin (1989:189-190), Hexner
(1946:275-276)
147B. Same as 147A, except for year 1902
Compares 1902 domestic German price with price of exports to Austria (a yardstick)
53 -- Hirst (1905:115)
148A. The formal U.S. Whiskey Trust was formed in May or June 1887 to make distilled alcohol for cheap whiskeys; preceded by numerous short-lived pools that were briefly effective in raising prices during 1882-86; first successful episode ended late 1888; data from hearings of US (Congressional) Industrial Commission.
When pools were operating, gross margin increased about $0.25/bu. of corn; avg. prices net of taxes and discount were $0.85-$1.12 for whiskey made from 1 bu.
22-29 -- Jenks (1900:146-
150), Jenks and Clark (1929: 99-107)
148B. Same as 148A above, except 2nd episode 1890-94
First effective period for formal trust is 1890-1894; comparison of gross margin increase with wholesale prices
12-18 -- Jenks (1900:146-150)
148C. Same as 148A above, except 3rd episode 1896-99
Effective period is 1896-99; uses gross margin approach 0-9 -- Jenks (1900:146-150)
148D. Same as 148A above, except 4th episode 1906-09
Gross margins in 1906-09 compared to competitive 1903- 7-12 -- Jenks and Clark
(1929:100-105)

J. M. Connor Price-Fixing Overcharges 3rd Edition February 2014
237
06 period, taking into account upgrading of product quality
148E. Studies 16 years of at least 4 episodes: the summer quarters of 1882 to 1898 (except for 1895); thus same as 148A to 148C plus 1882-86; peak cartel supply control of total US market was 40% to 48% in 1887-1892; slipped to 29% by 1895.
The authors fit four different demand functions to a complex econometric system of equations; the model predicts four elasticity-adjusted Lerner indexes; average overcharges are 83% to 94% below the monopoly overcharge; two peak periods, 4 quarters in late 1888 and 1824-93, are 58% to 84% below monopoly overcharge
8.2-9.1 18.3 Clay and Troesken (2003: 162-163)
148F. Same as 148E, but adds 22 new quarters of data from April 1888 to March 1895, a total of 38 quarters
Same as above, but for more observations 9.4-11.5 18.3 Clay and Troesken
(2003: 162-163)
149A. The U.S. Wire Nails Pool lasted for 19 months in May 1895-Nov.1896; very complex organization; made side agreement with similar cartels in Canada and Europe; also co-opted U.S. cut-nail makers; collapsed when new factories came on stream; ineffective after 1901
Comparison of prices in month before cartel with average prices in 18-month period; peak is last 6 months
97 117 Jenks (1900:62), Jenks and Clark
(1929)
149B. Same as 149A Method not explained, but probably constant-margin 113 -- Jones (1921:10)
149C. In January 1899, a 2nd episode began with the formation of the Am. Steel and Wire Co. trust, which controlled 65 to 95% of the US market. The gross margin increased from about $0.70 in 1898 to $1.00 in 1899; peak was $1.40 in Oct. 1899 ended early 1900.
The price increased from about $0.80 to $0.90 in 1898 to $1.50 to $2.95 in 1899; peak was $2.95 in Oct. 1899.
67-269 228-269 Jones (1900:165-170 and chart)
149D. Same as 149A, except that 3rd episode began when, in response to rapidly falling prices in early 1900 (about 25%), the Wire Trust closed several of its mills in April 1900; produers outside the Trust followed with closures of their own; gross margins rose well above 1897-98 levels and remained high until end of 1901.
Prices of wire nails stabilized in 4/1900, declining slowly until the end of 1901; competitive bench mark is 1897-98 prices; peak is 1/1991-9/1901.
73 77 Jones and Clark
(1929: 121-122 and chart)
149E. Same as 149C.
Chicago-NY price per keg in 1888 $1.45 compared to 1899-1900 average; peak is 12/1899-3/1900
85 143 U.S. Industrial
Commission (1901: 561)
149F. Same as 149A.
Author gives monthly prices of 8 d. nails, the modal type; benchmark is prices for 4 months before May 1895; peak is May-Nov. 1896
75 113 Edgerton (1897:260)
149G. Same as 149A. Same as above, but corrects for increase in major input price, No. 11 steel wire
50 88 Edgerton (1897:260)
149H. Same as 149A. Benchmark is prices 4 months after cartel dissolved 69 106 Edgerton (1897:260)
149I. Same as 149A. Same as above, but corrects for increase in major input price, 44 81 Edgerton (1897:260)

J. M. Connor Price-Fixing Overcharges 3rd Edition February 2014
238
No. 11 steel wire 150. U.S. steel rails pool; analysts identify four episodes; Jones gives dates of the 1st episode as 1887-93 and the 2nd as 1894-98; Seager and Gulick describe a 3rd episode from 1897 to 1904; the association of 15 members controlled 90%+ of the U.S. market; set total tonnage and quantity shares to achieve an elevated price; later sued by US DOJ. The 4th episode led by U.S. Steel was 2/1901 to 3/1916.
Jones (1921: 9-10), Seager and Gulick
(1929:90-91)
150A. The latter part of the 1st episode seems to have started Feb. 1890 and ended Dec. 1894; prices absolutely flat during three sub-periods; possible price war Jan.- June 1895.
Report prepared by the Industrial Comission that used the constant-margin (cost-based) approach; avg. price $28.07; war price $22; peak in 1891-92
27.6 36.4 U.S. Industrial
Commission (1901: 766-770)
150B. Same as A, except 1894-98.
Jones refers to a U.S. DOJ court brief that states that after 1897 prices fell 41% after the 2nd episode of 1894-98 ended
69 -- Jones (1921: 9-10)
150C. Same as B: part of the 2nd episode, July 1895 to Dec. 1896; prices absolutely flat during all but one month; possible price war Jan.- June 1895.
Report prepared by the Industrial Comission used the constant-margin (cost-based) approach; avg. price $27.83; war price of $17 in late 1898; peak in Aug. 1895- Dec. 1896
63.7 64.7 U.S. Industrial
Commission (1901: 766-770)
150D. Part of the 3rd episode, May 1900 to April 1901
Report prepared by the Industrial Comission that used the constant-margin (cost-based) approach; avg. price $28.80; cartel war price $17; peak in May 1900 to Aug. 1900
69.4 106 U.S. Industrial
Commission (1901: 766-770)
150E. Same as 150B.
Jones refers to a U.S. DOJ court brief that states that after 1897 prices fell 41% after the 2nd episode of 1895-96
69 -- Jones (1921: 9-10), Seager and Gulick
(1929:90-91)
150F. A 4th episode began in Feb. 1901 with the formation of the U.S. Steel Corp. and lasted until at least 3/1916, after which the effects of WWI begin to overwhelm the cartel led by U.S. Steel.
In late 1899 and early 1900, price was $26/ton; despite general inflation and considerable shifts in demand and pig iron costs, from Feb. 1901 until Mar. 1916 price was an unwavering $28.
7.7 7.7 Jones and Clark
(1929: 122- 128 and chart)
150G. Same as 150F.
Testimony before the Industrial Commission is that rails were being exported (with normal profits) at $20-21/ton vs. $28 in US
33-40 -- U.S. Industrial
Commission (1901: 555)
151. U.S. cartel in steel tubes from June 1899 to 1900
Prices in 1899 compared with before cartel 227 -- Jones (1921:264)
152A. U.S. Webb-Pomerene export association for carbon black, active for 48+ years 1923-51 and 1958-70+. The first episode lasted from 1/1923 to 12/1932.
Econometric model with dummy variable for the cartel’s active years; quantities exported fell 19.8%
176 -- Dick (1992a:103)

J. M. Connor Price-Fixing Overcharges 3rd Edition February 2014
239
152B. Same as 152A, except 2nd episode 1/1934 to 12/1970.
Econometric model with dummy variable for the cartel’s active years
50 -- Dick (1992a:103)
152C. Three firms colluded from 1/1999 to 11/2002; private plaintiffs got a $20-million settlement in 6/2007. The EC investigated.
New price series compared to prices before collusion 5.9 -- Purchasing
Magazine (2002)
153. Effects of concentration (numbers of firms) on the spreads of U.S. tax-exempt bond underwriting auctions; a study of 9420 bond issues during 1959-1967; suggests bid-rigging behavior by bond buyers (buyers’ cartel) against the Treasury/seller
Comparison of estimated regression coefficients of winning bids in issues with 9 or more bidders with price spread when only two bidders were in the auction
-- -2.35 Brannman (1989:73)
154. Same as 153 above for 2221 auctions for government offshore oil leases from the U.S. Department of the Interior 1954-1975; suggests bid-rigging behavior by buyers against seller
Same method as 153 above except competitive number of bidders in 10 or more
-- -2.5 Brannman (1989:73)
155A. The Rhenish-Westphalian (Ruhr) Coal cartel (a/k/a RKWS) was formed in 1893, a mix of private and state-owned mines; effective in raising prices until state price controls were imposed in March 1919; the Deutsche Mark experienced little or no inflation through at least 1909; this is the cautious Liefmann’s only price estimate in a long book on cartels [Stockder splits 1893-1914 into 4 episodes]
The author states that Essen Coal Exchange prices were representative of the pre-cartel period 1891-93 (i.e., a competitive yardstick); average 1894-1913 prices and peak 1907-09 prices compared to the yardstick
16.5 34.6 Liefmann (1932:52)
155B. Same as 155A
Compares 1902 domestic German price with the yardstick price of exports to Belgium and Netherlands
5.8 -- Hirst (1905:115)
155C. Same as 155A
Compares coal exchange prices during the 1901-04 depression with the 1891-93 base period
14 -- Liefmann (1932:52)
155D. Part of A. Stockder distinguishes several possible episodes of the Ruhr coal cartel; during first of 4 episodes (1893-1898) there was significant undercutting of cartel annual supply contract prices by steel producers that were integrated backward into coal mining
Stockder shows annual 1893-1898 contract prices; but-for price is 1893 price of 7 marks per tonne 12.0 20.0 Stockder (1932: 121)
155E. Same as 155D
Stockder shows annual 1893-1898 contract prices; but-for price is 1922 post-cartel price of 7 marks per tonne
12.0 20.0 Stockder (1932: 121)
155F. Part of A. Second episode: in 1898 the cartel offered attractive incentives to the integrated steel-coal producers to observe the cartel’s prices; other minor revisions in the cartel agreement occurred in 1903, 1909; ended 1914
1899-1914 annual contract prices are compared to 1893 pre-cartel price 47.5 71.4 Stockder (1932: 121)
155G. Same as 155F 1899-1914 annual contract prices are compared to 1922 post-cartel price
47.5 71.4 Stockder (1932: 121)
155H. In the 3rd episode, 1915-1921, the cartel was effectively nationalized by the German Government (no longer private)
No information on price effects -- -- Stockder (1932)

J. M. Connor Price-Fixing Overcharges 3rd Edition February 2014
240
155I. After a 1922 price war, a new international-export agreement was created (4th episode) in 1924 that lasted to about 1939; some historians argue that monitoring and sanction powers were absent; others believe that the common sales agency made the cartel quite disciplined about export sales and prices
Judged “ineffective” by Stockder, “effective” by Heaulme, but latter has no quantitative estimate
0 0 Stockder (1932), Heaulme (1948)
155J. Same as A.
Econometric study of stock prices of all listed coal mines in the cartel and their financial performance; concludes that the cartel reduced price variation and raised prices “above the competitive level.”
1> 0 > 0 Luebbers (2009)
156. The second phase of a U.S. plumbing fixtures conspiracy involved 15 companies from Sept. 1962 (for cast-iron bath tubs) or Oct. 1962 (porcelain toilets) to 1968; most companies pleaded guilty and were fined, but three companies and three executive were found guilty at trial in late 1969.
Authors were guided by direct testimonial evidence accepted by the jury in the trial; these price changes apparently were only the first increases implemented by the cartel in late 1962
6-7 -- Demaree (1969:99), Davidow (1972:374)
157. A regression model fitted to 1950-1985 data on 12 legal Japanese export cartels; only the one for paints has results consistent with price mark-ups
Coefficient on export price 56.9 -- Dick (1992b:287)
158A. The U.S. gunpowder trust was formed in 1872 as a price-setting trade association; became a formal cartel of 7 producers in 1886-1902; later grew to 12 members; assigned quotas in 7 regions, had a penalty system and a trigger mechanism; after 1895 the agreement was kept secret and code names were used to prevent discovery; morphed into the du Pont monopoly by 1907; found guilty of price fixing and monopolization in 1912
In 1882-1884, members of the cartel that were over quota were required to compensate the others by selling powder at 16-25% below the fixed price
16-25 -- Curtis (1931:28), Stevens (1912a: 452 )
158B. During 1896-1902, three new gunpowder firms briefly entered the Midwestern market; the strongest of the entrants was Indiana Powder; the trust built a new plant nearby and cut prices in its sales region
Difference between price in Indiana Powder sales region (the yardstick) and prices charges by trust in surrounding regions
29 -- Stevens (1912a:459)
158C. During the period 1851-1862 the big three black gunpowder makers raised prices east of Pittsburg for short periods; military sales were about 5% of national demand; saltpeter accounted for 75% of the materials, and it was imported bay all US manufacturers; when the Union Army mobilized in mid 1961, both saltpeter and military-grade powder prices sold to US Army and Navy rose; demand slackened after 3/1865.
Using the constant-margin method and delivered prices in Philadelphia, the avg. margin in 9/1862-3/1865 is compared to the (oligopolistic) margins in 1/1857-8/1962; peak is 3/1965.
4.0 63 Wilson (2003: Figure 1)
158D. Same as 158C, except for higher priced commercial rifle powder. Same as 158C; peak is 7/1965 10.4 65 Wilson (2003: Figure
1) 159A. The Swiss-German (international) synthetic dyestuffs cartel had dominated the Japanese market before WWI [this early date is
Comparison of Japanese prices of imported dyes (net of tariffs) in early 1928 with
5 -- Kudo (1994:216),
Martin (2010: 671-672)

J. M. Connor Price-Fixing Overcharges 3rd Edition February 2014
241
inconsistent with other authors]. A domestic Japanese industry developed during the War to serve the rapidly developing textile industry; tariffs were imposed to protect Japanese dyestuffs in 1924 until the national industry negotiated a division of dye types between exclusively domestic lines and I.G. Farben import lines; made effective Aug. 1928; tariffs were eliminated; ended formally in 1945 but effectively in late 1939. The last episode of the international cartel was from Jan. 1964 to October 1967; 10 manufacturers (CR10 = 80% in EU, but cartel defined 5 national submarkets each with a clear leader) were convicted and fined by the EC on 24 July 1969. Each firm sold more than 1000 colors.
immediate price increase after bilateral agreement by Farben in Oct. 1928
159B. Legal Swiss synthetic dyestuffs cartel was formed by three companies in 9/1918 to combat expected decline in export demand as major importing countries increase tariffs; starting in late 1918, quantity exported fell by 73% in 1924-25 compared to 1913; prices highest in 1918-1920, but this was an abnormal period; national cartels ended 1929 when Swiss, French, and German sellers joined together.
Real average Swiss export prices of dyestuffs in 1921-1925 are compared to prices in 1910-13; peak is 1922
18.3 48.0 Schmitt and Weder (1998: Table 2)
159C. A German dyestuffs national cartel was formed under I. G. Farben in 1925; joined with the French cartel in 1927 to form 1st international cartel that allocated world exports; 3 more episodes followed, when the Swiss joined in 1929, UK’s ICI in 1932, and Japan’s NSK in 1935; by 1938, 80-90% of world exports under its control; ended Sept. 1939
During 1932-1939, members could sell export quotas to each other for cash equal to 15-25% of the price; this is a monopoly profit yardstick
15-25 -- Haber (1971: 275-
76), Schroeter (1990:139)
160. Beginning as early as 1829, railroads began vertically integrating by buying anthracite coal mines in 5 counties of NE Pennsylvania; they eliminated competition for coal by refusing to carry coal of independent mines (except under onerous tolling contracts); in early 1830s excess mine capacity developed; in 1870s dual ownership accelerated, even though PA constitution outlawed it from 1874; in 1873, top 5 RRs carried 90% of coal to Tidewater points; by 1900, the railroads controlled 62% of coal production, and in 1904-1923 it was 70%; court testimony in 1908 revealed that Reading RR was the collusive price leader; from 1864 to 1927 there were at least 11 documented episodes
160A. First episode: NYC prices fell 54% 1864-72; various pool agreements began Jan. 1873 with 5 members; first cartel episode ended August 1876 but was renegotiated quickly
Curtis interprets “Pooling agreement” of 1873 that set supply limits; immediate effect on Eastern Tidewater price of
38 -- Curtis (1931:343), Jones (1914)

J. M. Connor Price-Fixing Overcharges 3rd Edition February 2014
242
coal compared with before 1873 price
160B. Second episode: August 1876 to December 1877
Same method as above for what Curtis calls the “1876 pool agreement”; Jones writes that pool unable to agree from Aug. 1876 to Dec. 1877
0 -- Curtis (1931:343), Jones (1914)
160C. Third episode: 1886; Jones says that this episode was 3/1886-12/1891;[note that Curtis omits mention of three successful pools that began 1/1878, 1879, and 12/1884].
Same method as above for 1886 pool agreement, which Curtis interprets as ineffective
0 -- Curtis (1931:343), Jones (1914)
160D. Tenth episode: 1907; [Curtis also omits mention of the pools that Jones judges to be effective that began in 1/1892, 2/1896, and late 1902]
Same method as above for 1907 pool agreement 0 -- Curtis (1931:343),
Jones (1914)
160E. eleventh episode: 1921-26; Curtis notes that during 1923-27, average profit rates for railroad-owned anthracite mines were 14 times the rates of the seven railroads carrying the largest volume of coal
Easter Tidewater price in 1921-1926 corrected for inflation compared to the 1913 price
50 -- Curtis (1931:344)
160F. Prices in 2nd episode in New York City from a report by the New York State Legislature in 1878
Cost-based estimate of f.o.b- on-ships prices 53-63 --
Summarizing a 1894 Atlantic Magazine article, Demarest
(1910)
160G. Same as 160A; Jones’ “first pool” of Jan. 1873 to Aug 1876; concentration of coal-tonnage hauling was high (HHI=1809)
Compares average 1873-75 prices of all grades f.o.b. NYC per long ton with 1872 price; peak year was 1875
32.2 37.5 Jones (1914: 41-42, 228)
160H. Same as 160A
Compares average 1873-75 prices of all grades f.o.b. NYC with 1877 price; peak year was 1875
108.1 116.4 Jones (1914: 41-42, 228)
160I. Fourth episode is Jones’ “2nd pool” of Jan. 1878 to 12/31/1878; concentration fell slightly (HHI=1789)
Compares average 1878 prices of all grades f.o.b. NYC with 1877 price
29.1 -- Jones (1914: 45, 228)
160J. Same as 160I for 2nd pool of Jan. 1878 to 12/31/1878
Compares average 1878 prices of all grades f.o.b. NYC with 1879 price
34.6 -- Jones (1914: 45,228)
160K. Fifth episode is Jones’ 3rd pool of 1880-1884; unlike previous pool, no formal association was formed, just a “friendly understanding” after negotiations in 1879
Compares average 1880-84 prices of all grades f.o.b. NYC with 1879 price
56.9 -- Jones (1914: 46-47, 228)
160L. Sixth episode: Jones’ 4th pool of Dec. 1884 to end of 1885; despite high concentration (HHI = 2363), ineffective because Penn. RR dissatisfied with its quota share; Reading RR went bankrupt in 1884
Prices fell throughout cartel episode 0 -- Jones (1914: 47-48,
228)
160M. Same as 160C, Jones’ 5th pool organized by J. P. Morgan in March 1886; agreement in effect April 1886-Dec 1891, but set total output too high, so prices fell in 1891; HHI=2288
Compares average 1888-1890 prices of all grades f.o.b. NYC with 1891 average price
7.9 -- Jones (1914: 49, 228)
160N. Seventh episode: Jones’ 6th pool efective Jan. 1892 to late 1894; dissolved sometime in 1895; Reading RR failed again in 1892, so this
Compares wholesale price of long ton of “stove coal” f.o.b. NYC in 1893-94 with 1895;
24.4 33.8 Jones (1914: 156-157)

J. M. Connor Price-Fixing Overcharges 3rd Edition February 2014
243
year is ignored for price analysis peak year 1893 160O. Episode 8: Jones’ 7th pool; after numerous secret meetings among 11 railroads that controlled 100% of coal hauling (HHI=1105), in effect 2/1/1896 to late 1897; in early 1897 mines operated only 5-10% of the time; nearly perfect adherence to quotas until recession of 1898 leads to cheating; 1898-99 termed normal, competitive years
Compares wholesale price of long ton of “stove coal” f.o.b. NYC in 1896-97 with 1895; peak year 1897
24.6 28.1 Jones (1914: 55-58,156)
160P. Same as 160O Compares wholesale price of long ton of “stove coal” f.o.b. NYC in 1896-97 with 1898-99
4.0 -- Jones (1914: 58, 156)
160Q. Episode 9: Jones’ 8th pool of late 1902 to 1911; RRs solved low concentration problem by RR mergers, cross-ownership, interlocking directorships, and elimination of rival mines (by 1907 RRs controlled 78% of all coal output; labor strikes in late 1900 and mid 1902 boost costs; during 1903-11 monthly prices nearly constant; collusion “nearly perfect” (p.180) despite 1908 antitrust trial and conviction.
Compares wholesale price of long ton of “stove coal” f.o.b. NYC in 1903-11 with 1898-99 prices adjusted upward for changes in total costs of mining
12.3 12.4 Jones (1914: 59-97, 156-157)
161A. Japanese public-works construction bid rigging, several cases discovered roughly 1970-1990; parameters are verified by guilty judgments in legal suits
Using data on the average number of bidders (10) and comparable Canadian data on the spread in bidders’ costs, a mathematical model of competitive bidding can simulate the difference between the competitive and collusive price; an elaborate yardstick method
19-50 -- McMillan (2002:141-
147), McMillan (1991:208)
161B. Same as 161A
Summary of estimates of scholarly Japanese studies and government commission findings
30-50 -- Woodall (1996: 48)
162. The Star Friendship Association with about 100 corporate members rigged bids on U.S. naval shipyard construction projects in Japan in “the 1980s” (ca., 1981-1988); the Japan FTC investigated and fined the firms in 1989; after a threat of a U.S. suit, the association paid $32.6 million in compensation
Statements by U.S. government officials of the “low-end estimate” of the U.S. Navy’s losses due to bid rigging, which were 8% higher than the firms’ payout
32-35 --
McMillan (1991:209), Time
Magazine (1/15/90), New York Times (11/24/89), Los Angeles Times
(11/26/89) 163. Bid rigging on a kitchen construction project in Matsuyama City, Japan in 1982; bidders were convicted in court; average pre-tax operating income of civil engineering firms in Japan 1966-89 was 5.6% of total assets
Japanese court decision that total profits by the winning firm were an excessive 31% of revenues; I subtract 4-12% of sales as a normal profit
23-37 --
McMillan (1991:210-212), Kensetsugyo Dokukin Mondai Kenkyukai (1984)
164. Bid rigging on a river-dredging project in Tsukuba City, Japan in 1979 ; tried in court
Prosecution estimate of the excess profits made by the winning bidder
37 -- McMillan (1991:210)
165. Bid rigging among companies that delivered soil and gravel to build Kansai, Japan Airport in late 1980s
Comparison of winning bid with the government’s (generous) ceiling price
9.7 -- McMillan (1991:210)
166. Coal buyers’ cartels were formed by London coal-dealers (wholesale merchants a/k/a Ashton and Sykes
(1964), Levy (1927),

J. M. Connor Price-Fixing Overcharges 3rd Edition February 2014
244
Lightermen) to raise prices from 1595; Acts of Parliament against bid rigging were passed in 1642 and 1665. In 1729 a Parliamentary investigation found that 10 lightermen controlled 67% of purchases and blamed them for 1722-29 price increases; price controls for London were legalized in 1744, to be administered by three judges; in 1788 a law made any agreements among or partnerships of more than 5 coal buyers illegal “combinations in restraint of trade.” Informal collusion by mine owners on sales of coal sent on ships from Newcastle (the Tyne and Wear Rivers) to London, England began in 1699; Ashton and Sykes find written evidence of effective overt agreements in 1710, 1727-30, 1738-39, 1743-44, and 1765; the formal Northeastern English Coal Gild (a/k/a the Newcastle Vend or Limitation of the Vend) was formed by Northern mine owners in 1771; began as a monopsony to suppress wages and labor mobility; it controlled an average of 90-92% of London’s market in late 18th century; supplies from Wales and Scotland constrained pricing 1800-1845 (simultaneously, the Vend reached its greatest degree of organizational sophistication); experienced many brief intermittent “fighting trades” (price wars) and at least 12 episodes (probably 22). Parliamentary inquiries in 1691, 1703, 1729, 1730, 1800, 1829, and 1830 generally found that consumer complaints about price manipulation by miners and London buyers were “not unfounded”; in 1711, 1730-38, and 1744 Parliament passed “restraining Acts”, but otherwise imposed no penalties. At the Vend’s peak in 1831, 100% of Newcastle coal was controlled by the Vend; effective, periodic labor strikes began in 1831; the formal Vend endured for 75 years until 1844-45 when rail shipments of coal from the Midlands to London became significant.
Sweezy (1938), Hausman (1980), Tan
(2003, 2009)
166A. 2nd episode: the first Vend agreement of 1771 began to collapse between late 1780 and early 1781; prices stayed low 1782-85
Rochester Harbor prices in shillings per chaldron in 1780 are compared to 1785
17 -- Levy (1927:116)
166B. Cartel reformed in 1786-87 with more elaborate agreements on monthly quotas for each mine and fines for overproduction; but, according to Levy, not effective in raising prices until about 1824 and lost control in 11/1832; Levy’s 3rd episode is 1824 to mid 1832; however, Sweezy identifies 7 effective cartel episodes from 1810 to 1832 and 3 more short ones after that (see 166C to 166N).
Comparison of before (early 1832) price for best grade of coal with lowest month’s price (June 1833) during the Nov. 1832-Aug. 1833 price war
-- 56 Levy (1927:120), Sweezy (1938)
166C. Sweezy Episode 9: 1836 Price at the mouth of the Tyne River in 1836 compared to 22-27 -- Levy (1927:138-139)

J. M. Connor Price-Fixing Overcharges 3rd Edition February 2014
245
“pre-cartel” year 1823
166D. Sweezy Episode 10: 1844-1845 Same as 166C above, except price change from 1844 22 22 Levy (1927:161)
166E. First Sweezy episode: 1810-11
London price of best grade coal per chaldron before “open market” (competitive period) began in 1812
4-11 -- Sweezy (1938: 155)
166F. Sweezy Episode 4: 1823- July 1824 Same as 166E before open market of 8/1824-7/1825 12 -- Sweezy (1938: 155)
166G. Sweezy Episode 5: Aug. 1825- March 1826
Same as 166E above before open market of 4/1826-12/1826
16 -- Sweezy (1938: 155)
166H. Sweezy Episode 6: 1827- Feb. 1829 Same as 166E above before open market of 3/1829-8/1829 12 -- Sweezy (1938: 155)
166I. Sweezy Episode 7: Sept. 1829 - 1831 Same as 166E above before open market of 1/1832-3/1834 28 -- Sweezy (1938: 155)
166J. Sweezy Episode 2: 1813-14 London price best grade for 1-2 years after open market of 1812
11 -- Sweezy (1938: 155)
166K. Same as 166G Same as above for open market of 8/1824-7/1825 7 -- Sweezy (1938: 155)
166L. Same as 166H Same as 166E above for open market of 4/1826-12/1826 5 -- Sweezy (1938: 155)
166M. Same as 166I Same as 166E above for open market of 3/1829-8/1829 9 -- Sweezy (1938: 155)
166N. Sweezy Episode 8: April 1834-1835 Same as 166E above for open market of 1/1832-3/1834 33 -- Sweezy (1938: 155)
166O. Same as 166D
Price change after the final collapse of the Vend in May 1845 when many small inefficient mines had closed, compared to late 1844 price
75 -- Sweezy (1938: 127, 155)
166P. Covers all 11 episodes of 1770-1845
Econometric models using annual data on wholesale prices; average of 11 episodes shown
6.9-7.8 -- Hausman (1984: 326)
166Q. 1st episode: Covers the years 1699-1770 [no other author suggests that this was an effective Newcastle Vend episode]
Econometric model using annual data on retail prices paid by two London buyers
0 -- Hausman (1980)
166R. Covers years 1816-20
Econometric model prediction of London wholesale prices (controlling for fringe supply, demand, and railway development), which rise when the cartel's market share is higher.
15.1 -- Tan (2003: 22)
166S. Includes 166.F and years 1821-25 Econometric model prediction 12.9 -- Tan (2003: 22), Tan (2009: 259)
166T. Includes 166.H and years 1826-30 Econometric model prediction 12.2 -- Tan (2003: 22), Tan (2009: 259)
166U. Includes 166.N and years 1831-35 Econometric model prediction 12.4 -- Tan (2003: 22), Tan (2009: 259)
166V. Includes 166.C and years 1836-40 Econometric model prediction 16.1 -- Tan (2003: 22), Tan (2009: 259)

J. M. Connor Price-Fixing Overcharges 3rd Edition February 2014
246
166W. Includes 166.D and years 1841-45 Econometric model prediction 15.9 -- Tan (2003: 22), Tan (2009: 259)
166X. Episode covers pre-Vend years 1727-29; during this period there were no wars or freezing of the Thames River (factors that raise prices).
A “Limitation Act” of Parliament restrained collusion in 1730-1738; Newcastle price in 1729 compared to 1730
58 -- Ashton and Sykes (1964: 212, 252-53)
166Y. Episode covers pre-Vend years 1739-1743; during part of this period (1739-40) there was a war, and the Thames River froze in 1739; thus, price change probably exaggerated.
A “Limitation Act” of Parliament restrained collusion in 1730-1738; Newcastle price in 1739 compared to 1738
37 -- Ashton and Sykes (1964: 212, 252-53)
166Z. Episode covers pre-Vend years 1739-43; during part of this period (1739-40) there was a war, and the Thames River froze in 1739; however 1743 was unaffected by either.
A “Limitation Act” of Parliament restrained collusion beginning in 1744; Newcastle price in 1743 compared to 1744
18.2 -- Ashton and Sykes (1964: 212, 252-53)
166AA. Same as 166A; during this period there were no wars or freezing of the Thames River
Newcastle price in 1781 compared to 1786 20.6 -- Ashton and Sykes
(1964: 214, 252-53)
166BB. Refers to bid rigging in London by Lightermen in approximately 1700-02; during 1702-04 there was a war, but no freezing of the Thames River
Authors quote from a book that quotes the advance in retail prices from early 1700 as soon as buyers begin “engrossing” the coal supply
4.7-7.0 -- Ashton and Sykes (1964: 219, 252-53)
166CC. Refers to bid rigging by Lightermen in approximately 1723-29; during this period there were no wars or freezing of the Thames River
Parliamentary report charts increase from 1722 to 1729 21.7 --
Ashton and Sykes (1964: 219-20, 252-
53) 167. The Birmingham Bedstead Makers’ Alliance successfully raised prices on metal bed frames from 1891 to 1900; ended because of imports from European continent
Simple comparison of 1891-1900 prices with pre-1891 prices
100 -- Levy (1927:200)
168A. The British Salt Union was formed in Oct. 1888 by 64 firms that controlled 91% of UK white salt (a/k/a “common salt”) supply, much of it exported; coal accounts for 90% of the cost of production; the Salt Union was acquired by ICI in 1937; mergers from 1945 to 1975 produced a virtual UK duopoly (see No. 215 below).
Levy (1927), UK Monopolies
Commission (1990), McCrosty (1907)
168A. Salt Union raised UK prices strongly in Nov. 1888 to end of 1890; prices fell 1891-1898
Average export prices in 1878-1887 (the yardstick) compared to 1888-1891, corrected for the increase in coal prices
-1 -- Levy (1927:243), UK
Monopolies Commission (1990)
168B. Same as 168A; evidence of geographic price discrimination
Average prices in the county where salt was produced in 1888-91 compared to 1878-87, corrected for increase in price of coal; prices briefly peaked in 1888
19 320 Levy (1927:243, 295)
168C. New salt producers entered in early 1890s and by 1892 began to depress prices, though they never dipped below 1878-87 levels; from 1888 to 1905, the cartel formed side agreements with non-Union mines, but entry continued and collusion formally ended late 1905 or early 1906; by 1907 former members of the Salt Union controlled only 46% of UK production;
Change in export prices from 1904 to 1907 13 -- Levy (1927:243)

J. M. Connor Price-Fixing Overcharges 3rd Edition February 2014
247
although domestic power waned after 1907, power over export prices continued. 168D. The drop in domestic prices from 1904 to 1906 caused a new cartel, the North-Western Salt Co., to be formed in October 1906; achieved nearly 100% market control through at least 1927; used supply controls and fixed members’ shares; profits in 1907 rose 46% over 1906 levels and were 355% higher in 1925
Change in export prices 1906-1907 9.1 -- Levy (1927:244)
168E. Same as 168A Immediate change in price of common salt f.o.b. works from 10/1888 to 2/1889
-- 100-133 Calvert (1913: xxiii)
168F. Same as 168A Same as 168D above, but for prices of “fine” grade salt -- 100 Calvert (1913: xxiii)
168G. Same as 168A Change in works price of finest “brisk” grade from 11/1888 to 9/1890
100 -- Calvert (1913: 15)
168H. Same as 168A Same as above for 9/1890 to 3/1891 75 -- Calvert (1913: 15)
168I. Same as 168A Same as above for 3/1891 to 8/1891 50 -- Calvert (1913: 15)
168J. Same as 168A Comparison of “brisk” grade export price with UK price in 3/1889 to March 1891
52 -- Calvert (1913: 18-20)
168K. Same as 168A
Comparison of Prussian Rock Salt sold to chemical manufacturers versus all others, 12/1888 to 12/1889
38 -- Calvert (1913: 18-20)
168L. Same as 168A Peak price in 4/1889 was 10.5s., avg. in 1887-88 was 5.5s.
-- 91 McCrosty (1907: 181-83)
168M. Same as 168A Prices of exported “lump” salt in 1888-89 conpared with 1898-1906; peak is 1890
10.5 16.4 McCrosty (1907: 181-87)
168N. After a period of very low prices 1880-85, a combination was formed in 1885; failed summer of 1888; purchased by Salt. Union
Cartel had only “feeble” effects on UK prices 1 -- McCrosty (1907:
181-87)
169A. The European steel rails cartel included the leading manufacturers of the UK, Germany, and Belgium; first formed in 1883, but first episode was unstable until French producers joined in 1907 (2nd episode), which ended August 1914
UK rail prices in 1907 compared to the 1904-06 average
35-75 -- Levy (1927:268)
169B. First episode 1883-1907; with a US-UK price difference of 12% in 1901, large US exports to UK had occurred, but there were none in 1907
UK prices compared to US export prices 21-25 -- Levy (1927:268)
169C. Same as 169B Compares 1900 domestic German price with (yardstick) price of exports to Portugal
26 -- Hirst (1905: 115)
170. In 1902, German manufacturers of thorium nitrate were able to monopolize the only world source in Brazil of monacite, the key raw material; supply reduction raised price of thorium; ended sometime after 1904
The price of saltpeter in Germany in 1904 compared to early 1902
56 -- Levy (1927:295)

J. M. Connor Price-Fixing Overcharges 3rd Edition February 2014
248
171A. A study of three British ocean shipping conferences 1870-1913; focus is on 47 episodes of entry and 15 price-fixing episodes punctuated by 14 predatory price wars, each from 2 days to 1 year long precipitated by entry; all wars saw price changes of at least 30%; no line lost money
Price during war compared to rate before war, average of 4 episodes 1891-1902
60 75 Scott-Morton (1997:693)
171B. Same as 171A above Price during war compared to two episodes after war when entrant was admitted to cartel
49 75 Scott-Morton (1997:693)
172. Study of the determinants of all price wars among U.S. passenger airlines 1978Q2 to 1995Q4; discussion assumes that conduct observed is tacit collusion by price leadership, but later convicted of illegal signaling, a facilitating collusive device.
Econometric study, but no averages given 15-25+ -- Morrison and
Winston (1996)
173. Buyers’ cartel by 23 elite U.S. universities that met to fix the (purchase) price of needs-based graduate scholarships from 1958 to 1991; 22 found guilty by U.S. court, but DOJ settled (by means of a consent decree) with one university that appealed
Both econometric studies find that income was redistributed from high- to low-income applicants, but no average price effects
0 0 Carlton et al. (1995), Hoxby (2000)
174. Bid rigging by more than 2000 building construction companies in northern Germany in 1959-1973; 559 were prosecuted by the Federal Cartel Office (BKA), which provided a written report to the OECD on the 8000 projects
Federal Cartel Office analysis of overcharges on the 8000 projects
9 -- OECD (1976:24)
175. A report of the French Technical Commission on Cartels and Dominant Positions to the OECD on bid rigging on public tenders in electrical wiring construction ca. 1975
Estimated by the reduction in the winning bid on the same project after the cartel was disciplined
20 -- OECD (1976:26)
176. Same as 175 above, except for construction of a Mirail University building ca. 1970 - 1975
Same as 175 above 40 -- OECD (1976:26)
177. Same as 175 above, except for road building project in France in 1968 Same as 175 above 22 -- OECD (1976:26)
178. Based on a Japan FTC prosecution of Yuasa Timber Co. and 64 other plywood manufacturers that made identical bids for a public tender ca. early 1970s
JFTC report that found that the identical bids were exactly 10% higher than the previous winning bid for the same product
10+ -- OECD (1976:37)
179. The Northern Collieries Association fixed the price of black coal in the Newcastle, Australia region in six episodes from 1855 to 1893; the NCA accounted for 85% of colonial supply in the 1860s, but slipped to 60% by 1900.
Flemming (2000:50)
179A. First episode began with 2 mines in 1855, but high prices quickly (by ca. 1856) induced large-scale entry
Price increases ineffective in the long run 0 0 Flemming (2000:50)
179B. Second episode: 1861-62 “Price increases” only in the short run 1 -- Flemming (2000:50)
179C. Third episode: 1865-66 “Price increases” only in the short run 1 -- Flemming (2000:50)
179D. Fourth episode: mid 1866-1868 Comparison of real prices of 30 -- Flemming (2000:50)

J. M. Connor Price-Fixing Overcharges 3rd Edition February 2014
249
“Northern” coal in 1867-68 with early 1866 price
179E. Same as 179D Comparison of real prices of “Northern” coal in 1867-68 with 1870-72 average price
30 -- Flemming (2000:50)
179F. Fifth episode: 1874-1880 Comparison of real prices of “Northern” coal in 1874-80 with 1872 price
55 -- Flemming (2000:50)
179G. Same as 179F Comparison of real prices of “Northern” coal in 1874-80 with 1881 price
80 -- Flemming (2000:50)
179H. Sixth episode: 1882-1893 Comparison of real prices of “Northern” coal in 1882-93 with 1881 price
46 -- Flemming (2000:50)
179I. Same as 179H Comparison of real prices of “Northern” coal in 1882-93 with average 1895-1900 price
34 -- Flemming (2000:50)
179J. Seventh episode for coal shipped by 13 mining companies (with 90%+ of market) interstate in Sept. 1906-1910; from 1911 trial decision Associated Northern Collieries, a/k/a “The Vend” which also colluded with steamship and railway lines.
A cost-based method where costs were supplied by a mine that did not participate in the cartel; total affected sales were £275.6 million, about £61.25 million in 2006 when overcharge was £105,500; peak year 1910.
0.17 30 Shanahan and Round (2008: 15, 18)
179K. Same as 179J
Prices f.o.b. Newcastle harbor in 1907-1910 compared to pre-cartel 1905-1906 prices; peak price 1908
40 47 Wilkinson (1914: 85)
179L. Same as 179J
Delivered prices of large coal to eight large buyers in Victoria State in 1907-1910 compared to pre-cartel 1905-1906 prices; peak price 1908
46 51 Wilkinson (1914: 85)
179M. Same as 179J
Delivered prices of large coal to four large buyers in South Australia State in 1907-1910 compared to pre-cartel 1905-1906 prices; peak price 1910
50.5 51.5 Wilkinson (1914: 85)
179N. Same as 179J
Delivered prices of large coal to two large buyers in Western Australia State in 1907-1910 compared to pre-cartel 1905-1906 prices; peak price 1910
18.1 -- Wilkinson (1914: 85)
179O. Same as 179J
Delivered prices of large coal to Queensland Harbor in 1907-1910 compared to pre-cartel 1905-1906 prices; peak price 1910
29.8 33.3 Wilkinson (1914: 85)
180A. The UK Linoleum Manufacturers Association formed in 1905, formalized in 1934, was judged to have engaged in a long list of horizontal and vertical restrictive practices through 1955 that were anticompetitive;
The two UK nonmembers sell linoleum of the same quality and grade at prices 10% below LMA members
10 -- UK Monopolies
Commission (1956b:26,66)

J. M. Connor Price-Fixing Overcharges 3rd Edition February 2014
250
agreements with other European assns. guaranteed a UK monopoly for the LMA (see #137 above); the LMA controlled 80% of the market in 1955; setting common prices; though “not against the public interest,” pricing was deemed “perilous” by the Commission.
180B. Same as 180A
The Commission seems to suggest that the “loyalty rebate” awarded to all LMA-“approved wholesalers” is a (rent-seeking) yardstick of the cartel overcharge
12.5 -- UK Monopolies
Commission (1956b:28)
180C. Same as 180A for episode early 1887 to 1904
Pool kept prices at a constant $28/t from 1887 to 1904, except for one brief, “ruinous” price war in (late?)1887
-- 87 Seager and Gulick (1929:90-91)
181A. The British Non-Ferrous Metals Federation was created in 1945 by the merger of 12 metals associations, one founded in 1875; had 69 members in 1945 covering semi-manufactured copper, brass, zinc and nickel alloys; set common prices in UK and since 1946 in exports under the Lausanne Agreement, which protects UK market from European exports; many other restrictive practices that Commission says “operate against the public interest” and “keep prices up” ; ended 1955
In July 1946, export prices to British Commonwealth countries were raised by £7 to 10 at a time when (yardstick products) copper wire, strips, and tubes sold elsewhere for £242-415/tonne
2-4 -- UK Monopolies
Commission (1955: 58,102-03, 208-11)
181B. Same as 181A Same as 181A above, but £10-21 increase to non-Commonwealth countries
4-8 -- UK Monopolies
Commission (1955: 58,102-03, 208-11)
182A. The UK Cable Makers Association, formed 1899, and Covered Conductors Assn. had 22 members in 1950 with 65-69% of UK market for insulated wires and cables; prices fixed on exports from 1928 when Intl. Cable Development Corp. formed for power distribution cables; ended 1952
UK parliamentary Standing Committee on Trust reported that in 1921 non-CMA firms sold at 10% lower prices than CMA members
10 -- UK Monopolies
Commission (1952a: 17)
182B. Same as 182A Loyalty rebates in 1948 are rent-seeking portion of overcharge
10.0 -- UK Monopolies
Commission (1952a:75)
182C. Same as 182A
Commission seems to suggest that profit/sales of 10% is reasonable; subtracted 10% from average actual profits on 7 types of cables
14.4+ -- UK Monopolies
Commission (1952a: 167)
183A. The British Electrical & Allied Manufacturers Assn set common prices and terms of sale for 84% of the UK’s market for large electric power equipment ca. 1930 to 1957; covers 37 lines of business; cooperates with the Intl. Elec. Assn. on exports; analysis of price effects 1950-1957
In early 1950s, a yardstick firm, the Central Electric Authority, paid 5-15% lower prices on small transformers of same quality from non-BEAMA firms
5-15 -- UK Monopolies
Commission (1957a: 169-77)
183B. Same as 183A A large industrial firm got 13 bids for 1000 KVA transformers in Jan. 1949; 3
12.3 13.1 UK Monopolies
Commission (1957a: 177)

J. M. Connor Price-Fixing Overcharges 3rd Edition February 2014
251
non-BEAMA bids were lower than 10 BEAMA firms
183C. Same as 183A
Another large industrial buyer got lower bids from nonmembers on a tender for 17 transformers (10 to 4000 KVA) in 1951-53
8.5 21.5 UK Monopolies
Commission (1957a: 178)
183D. Same as 183A
North Scotland Electric Board reports lower bids from nonmembers on small transformers of identical quality
5 -- UK Monopolies
Commission (1957a: 178-79)
184A. Since 1905 the Electric Lamp Manufacturers Assn. of Great Britain fixed common prices and standardized product quality; 8 members (two dominant) have 90-95% control of UK electric bulb market; ELMA is affiliated with Phoebus (#21 above); price fixing is condemned; ELMA largely prevented superior long-life bulbs from being sold; ended 1951
In 1933-35, UK chain stores sold Japan-made bulbs at lower retail prices than ELMA members
37-66 -- UK Monopolies
Commission (1951: 13), Prais (1974)
184B. Same as 184A
In 1939 5 firms not in ELMA sold 60W general-service filament bulbs of same quality to chain stores at 68-71% lower price than ELMA firms; after acquisition in 1950, prices only 31-32% lower
54-57 -- UK Monopolies
Commission (1951: 41)
184C. Same as 184A
Price charged by intl. cartel in Sweden of most popular size bulb in 1930 when local consumer cooperative’s bulb factory was being built, compared to ca. 1929 before construction began
28.0 -- Great Britain Board of Trade (1944: 126)
184D. Same as 184A
Same as above, except cartel’s price change from 1929 to 1931 after cooperative’s plant was on stream
39 -- Great Britain Board of Trade (1944: 126)
184E. Same as 184A
From 1931 to 1936, Swedish cooperative yardstick price declined 23% to 0.71 shillings, but cartel could not match it; peak is cartel’s price reduction from 1929 to 1936
5.6 50 Great Britain Board of Trade (1944: 126)
185. German wire cartel in operation in early 1900s (ca. 1900-04)
Compares 1900 domestic German price with price of exports
38 -- Hirst (1905:115)
186. German nail cartel in early 1900s (ca. 1900-04)
Compares 1900 domestic German price with price of exports
44 -- Hirst (1905:115)
187. German steel girders cartel active in early 1900s (ca. 1900-04)
Compares 1900 domestic German price with price of exports to Belgium and Netherlands
20-30 -- Hirst (1905:115)

J. M. Connor Price-Fixing Overcharges 3rd Edition February 2014
252
188A. The U.S. arc-light carbon industry began in 1879 and attempted to fix prices 3 times between 1885 and 1887; the first successful episode was by six leading firms in late 1886 (ca. 8/1886-12/1886)
Price increase from early 1886 to late 1886 20 -- Passer (1953: 60)
188B. Episode 2: ten leading firms with 75% of supply agreed to raise prices on April 15, 1887; ended because of large scale entry in July 1887 and inability to control coke (principal ingredient) supplies
Prices in mid 1887 compared to early 1887 100 -- Passer (1953: 61)
189A. U.S. incandescent electric light bulb industry became unconcentrated because the validity of GE’s Edison patent was in doubt until a 1891 court decision affirmed its validity; in August 1896 GE made a price-fixing agreement with 6 other leading manufacturers through the Incandescent Lamp Manufacturers association; 10 more joined by 1901; cartel became a monopoly when smaller companies merged into a holding company controlled by GE in 1901-11; cartel controlled 95% of U.S. market for several years; federal antitrust suit and consent decree issued 1911 disbanded the monopoly
Change in price of light bulbs reported by Passer of various sizes from before cartel (1895-early 1896) to late 1896 and some time afterwards
11-67 -- Passer (1953:162-
163), Bright (1949: 103-104, 144-156)
189B. Same as 189A. Bright reports that the price of a 16-candlepower lamp was $1.00 in 1890-1896,but then fell steadily to early 1896 as large numbers of new manufactures entered production, but did not fall below the late 1886 “pool price” until it reached $0.17 in 1910; virtual monopoly formally dissolved 1911
The “pool price” of $.20 for 8- to 25-candlepower carbon-filament bulbs from late 1896 to about 1909 compared to prices ($0.12 to 0.18) in early 1896
11-67 11-67
Bright (1949: 93, 103-104, 144-45, 151), U.S. Tariff
Commission (1938: 32)
189C. General Electric’s major electric bulb patents expired in 1929, ending the US monopoly period that began 1912; GE had a no-export agreement 12/1924-9/1939 with the international cartel (see cartel 21), but Japanese imports into US surged 1929-1933 until a dumping suit brought by GE resulted in higher tariffs.
Prices in US of a 60-watt tungsten-filament bulb ($0.20) compared with yardstick: pre-tariff Japanese imports ($0.08) and corrected for quality (US-made bulbs lasted twice as long)
20 20 Bright (1949: 262-269)
190. Major oil fields discovered in Texas and Oklahoma 1926-31 doubled U.S. reserves, causing price of crude petroleum to fall 92%; private cartelization attempted ca. 1926- Sept. 1933 resulted in an “imperfect cartel” that was “quite ineffective”; entry at small scales was easy; even imposition of legal quotas from 1929 by TX and OK state commissions was observed by only the top 25 producers that had 1% shares or more
Change in price per bbl. from 1926 to 1932 due mainly to huge shift in supply and some general deflation; no quantitative analysis of whether price decline was slowed by sporadic supply controls.
1 -- Wiggins and Libecap (1987)
191A. U.S. Webb-Pomerene crude sulfur association Sulexco effective in raising U.S. domestic prices for 50+ years 1922 to about 1973; by 1927 Sulexco successfully practicing price discrimination by keeping export prices about 25% higher than domestic
Average 1922-1940 prices compared to 1919-1920 price; peak is 1932
55.1 242 MacKie-Mason and Pindyck (1989:203-
210)
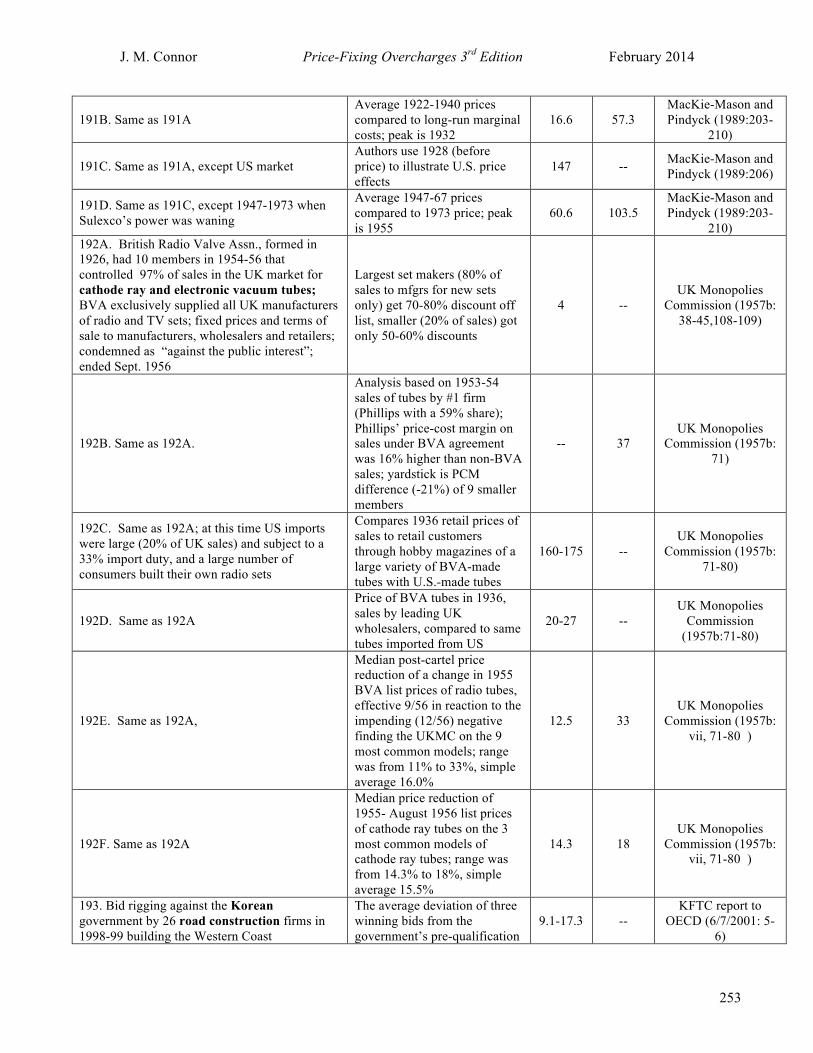
J. M. Connor Price-Fixing Overcharges 3rd Edition February 2014
253
191B. Same as 191A Average 1922-1940 prices compared to long-run marginal costs; peak is 1932
16.6 57.3 MacKie-Mason and Pindyck (1989:203-
210)
191C. Same as 191A, except US market Authors use 1928 (before price) to illustrate U.S. price effects
147 -- MacKie-Mason and Pindyck (1989:206)
191D. Same as 191C, except 1947-1973 when Sulexco’s power was waning
Average 1947-67 prices compared to 1973 price; peak is 1955
60.6 103.5 MacKie-Mason and Pindyck (1989:203-
210) 192A. British Radio Valve Assn., formed in 1926, had 10 members in 1954-56 that controlled 97% of sales in the UK market for cathode ray and electronic vacuum tubes; BVA exclusively supplied all UK manufacturers of radio and TV sets; fixed prices and terms of sale to manufacturers, wholesalers and retailers; condemned as “against the public interest”; ended Sept. 1956
Largest set makers (80% of sales to mfgrs for new sets only) get 70-80% discount off list, smaller (20% of sales) got only 50-60% discounts
4 -- UK Monopolies
Commission (1957b: 38-45,108-109)
192B. Same as 192A.
Analysis based on 1953-54 sales of tubes by #1 firm (Phillips with a 59% share); Phillips’ price-cost margin on sales under BVA agreement was 16% higher than non-BVA sales; yardstick is PCM difference (-21%) of 9 smaller members
-- 37 UK Monopolies
Commission (1957b: 71)
192C. Same as 192A; at this time US imports were large (20% of UK sales) and subject to a 33% import duty, and a large number of consumers built their own radio sets
Compares 1936 retail prices of sales to retail customers through hobby magazines of a large variety of BVA-made tubes with U.S.-made tubes
160-175 -- UK Monopolies
Commission (1957b: 71-80)
192D. Same as 192A
Price of BVA tubes in 1936, sales by leading UK wholesalers, compared to same tubes imported from US
20-27 -- UK Monopolies
Commission (1957b:71-80)
192E. Same as 192A,
Median post-cartel price reduction of a change in 1955 BVA list prices of radio tubes, effective 9/56 in reaction to the impending (12/56) negative finding the UKMC on the 9 most common models; range was from 11% to 33%, simple average 16.0%
12.5 33 UK Monopolies
Commission (1957b: vii, 71-80 )
192F. Same as 192A
Median price reduction of 1955- August 1956 list prices of cathode ray tubes on the 3 most common models of cathode ray tubes; range was from 14.3% to 18%, simple average 15.5%
14.3 18 UK Monopolies
Commission (1957b: vii, 71-80 )
193. Bid rigging against the Korean government by 26 road construction firms in 1998-99 building the Western Coast
The average deviation of three winning bids from the government’s pre-qualification
9.1-17.3 -- KFTC report to
OECD (6/7/2001: 5-6)

J. M. Connor Price-Fixing Overcharges 3rd Edition February 2014
254
Expressway; fined in 1999 review, compared to yardstick of the same ratio for all contracts
194 The U.S. salt industry began with solar drying on the East Coast, though most of the supply was imports – ballast in sailing ships from the UK. In the 19th cent. NY, WV, and MI became the main Eastern sources, using brine from wells, then dried with wood scraps or coal fires. Until transportation costs declined, salt markets were highly localized. Most regional cartels could not control fringe production for more than a year or two; attempted interstate cartels were not successful. Real secular prices declined in 19th cent.
Jenks (1888),
Levenstein (1995: 578-86)
194A. The Michigan Salt Association operated from April 1868 to at least 1888; supplied northern US west of Pennsylvania; controlled 75% to 95% of MI production; ineffective in raising prices for most of its existence but enjoyed first brief success in 1868
MI prices per bbl. in 1868 compared to linear price trend in the competitive periods during 1866-1877
13.8 -- Jenks (1888:92)
194B. Same as above, except second episode May 1881 to March 1882
May 1881 to March 1882 prices, compared to average monthly prices June 1880 to April 1881
22.6 -- Jenks (1888:94)
194C. Same as 194B
May 1881 to March 1882 prices, compared to average monthly prices April 1882 to Mar. 1883
28.7 -- Jenks (1888:94)
194D. Episode 3, approx. 5/1887-8/1887 Prices in mid 1887 compared to early 1887 6.1 -- Jenks (1888:92)
195A. A summary of a large number of federally prosecuted instances of bid-rigging, all over the U.S., road construction, mostly in the late 1970s and early 1980s
Various methods, used by the Dept. of Justice, not discussed 10 -- Werden and Simon
(1987:925)
195B. Not clear, but appears to be same as 195A; cases ended between 1984 and 1987, but cartels probably operated 1975-1985; mostly construction projects financed by governments
Survey of 7 U.S. convictions, commissioned by the U.S. Sentencing Commission ; mean and median; peak is maximum case; methods of calculation unknown
20 35
Cohen (1989b: 607), Cohen and
Scheffman (1989: 347)
196. A summary of an analysis of seven 1984-1987 U.S. federal court final decisions in bid rigging in construction and other industries involving a total of 12 defendants.
Trial decisions of a judge or jury based on direct testimony and perhaps other methods
20 35
Cohen and Scheffman
(1989:347), Cohen (1989b)
197A. High fructose corn syrup (42 and 55) raised prices in the US market from Jan. 1989 to June 1995; the 5 defendants in a U.S. civil suit settled in mid 2004.
Estimated from the increase in USDA-reported wholesale list prices in 1986-87 and expert opinions in plaintiffs’ briefs; peak is HFCS-55 in 1991.
9.9-15.7 33.2 Connor (2003: Table A.3)
197B. Same as 197A ??? 13.1 -- Connor (2013) 198. Carbon fiber; 1993 to May 2002; under US DOJ investigation
Press reports of rise from pre-cartel prices 25 -- Connor (2003: Table
A.4) 199. Aluminum metal; Feb. 1994 to Feb. 1996; some quasi-official national trade associations
Increase in prices in June 1994 relative to Nov. 1993 pre-cartel 30+ -- Connor (2003: Table
A.4), Jenny (2003),

J. M. Connor Price-Fixing Overcharges 3rd Edition February 2014
255
were members and openly signed a Memorandum of Understanding; investigated by US DOJ but not indicted, possibly because of international comity reasons (not an extension of #18 above)
prices; caused in part by increased demand
Stiglitz (1998:176)
200. Tobacco leaf; bid rigging by buyers against sellers in US auctions 1996-2001; antitrust class action by 400,000 growers and quota holders settled by 4 defendants May 2003; trial for remaining manufacturer scheduled for 2004
Preliminary minimum yardstick estimate made from settlement worth $1,400 million; gross farm sales from USDA data are $15,588 million
-9.0 or more --
Connor (2003: Table A.6), Legal Times
(6/21/2004)
201A. Linerboard; 10/1993 to 11/1995 in US market; US civil court case resulted in eight firms settling
Settlement of $202 million is asserted to amount to about 50% of the overcharge; benchmark is pre-cartel price; peak occurred at end of cartel
42-55 96 Connor (2003: Table
A.6), Legal Intel-ligence (4/22/2004)
201B. Same as 210A
Judge’s decision in Linerboard Antitrust Litigation is that the $203 mil. settlement is 42-55% of damages
6.6-8.6 -- Connor (2007a), Davis and Lande (2007: Case 18)
201C. Same as 210A Same as above, revised sales data 8.2 --
Connor (2013), Davis and Lande (2007:
Case 18) 202. Carbon dioxide; Jan. 1968 to Nov. 1992 in US market civil case settled 7/1996 just days before trial was to begin
Estimated from Court comments on overcharge during fairness hearing on fees
16.5 -- Connor (2003: Table A.6)
203A. Two drug companies (US and French) conspired in 7/98-6-/99 to monopolize the US market for Cardizem CD hypertension drug (diltiazem hydro-chloride) and generic equivalents; the French firm paid the US generic manufacturer $10 million per quarter not to enter the market; private antitrust damages suit settled for plaintiffs in 2002; motion to dismiss denied 6/13/2003
The patent holder of Cardizem paid a maker of a generic substitute $90 million as profit compensation to withhold the generic from the market; this is likely to be half or less of the monopoly profits earned by both companies
16-32+ -- Connor (2003: Table A.6)
203B. Same as 203A; the FTC issued an analysis and a consent decree to cease and desist private contracts to delay the introduction of generic drugs; FTC decision is contrary to decision of court in private damages suit
The FTC analysis states that the payment did not in fact delay entry by the US firm or other generic firms beyond what is prescribed by the Hatch-Waxman Act; the payment was 13.3% of affected sales
0 0 FTC (4/2/2001)
203C. Same as 202A US District Court decision of 2/2/2004 (p.6) 8.2 --
Lande and Davis (2006:38-40), 2003
U.S. Dist. Lexis 25638
203D. Same as 203A
Plaintiffs’ expert estimated overcharge is $55 million , probably an econometric model
7.2 -- Lande and Davis
(2006:15-20), Connor(2007a)
204. Asphalt, liquid ; Alabama bid rigging 1971-78; class-action suit of 133 government units was initiated in 1979 and settled a few years later
Overcharge is shown in Figure 2; based on an econometric model
126 165 Kamerschen and Morgan (2004:690)

J. M. Connor Price-Fixing Overcharges 3rd Edition February 2014
256
205A. The Almond Board of California, a group of elected industry representatives operating under a USDA-enforced Marketing Order, controls 95% of the US market and two-thirds of the world market with inventory; cannot control tree plantings and sells to a concentrated processing sector; from about 1935 to 2004
An econometric model applied to 1962-1997 data predicts a Lerner Index for the US market that is 63% below the monopoly price
27.4 -- Crespi and Chacon-Cascante (2004:10)
205B. Same as 205A, except non-US export prices
Same as above for the world export market; the Lerner Index is 66% below the monopoly price
20.4 -- Crespi and Chacon-Cascante (2004:12)
206. Four-fifths of the world coconut oil market is controlled by a Philippines processors’ export cartel after 1972 that was composed of 7 companies
An econometric model applied to 1959-1987 data to predict a Lerner Index for the pre-cartel (0.41) and cartel period (.89) 1973-87
88.1 -- Buschena and Perloff (1991: 1007)
207A. Fluid milk in the US is controlled by USDA-mandated Marketing Orders; mid 1930s to 2004
Econometric model applied to producer (blend) prices in 38 markets (1960) and 46 in 1970; peak is 1970
14.4 17.8 Kwoka (1977:377)
207B. Same as 207A
Slightly different econometric model applied to 1973 blend-price data; range depends on elasticity of supply of raw milk
3.0-4.4 Ippolito and Masson (1978:54)
207C. Same as 207B
Effect on consumer prices is net effect of increases in fluid-milk products and decrease in manufactured-milk products
3.6 -- Ippolito and Masson (1978:55)
208A. Attempts to collude in the U.S. raisin market began as early as 1889, but middlemen countervailed; in 1913 the California Associated Raisin Co. (later Sun-Maid Raisin Growers) was formed with 9000 members and 76% of supply under control; by 1917 control rose to 90%; defectors from the cooperative’s supply contracts were fined; acreage limits were imposed;in June 1920 Sun-Maid was found by the FTC to be illegally restraining trade; the Justice Dept. tried and failed to enjoin price increases in 1919 and 1920; in 1922 price fixing by farmers’ was legalized.
Cost data showed that growers’ production coasts were at most $0.015/lb.; grower prices for Muscat raisins were $0.035/lb. in 1913-1915; a joint Dept. of Justice-FTC report stated that 1919-1920 prices were unreasonably high at an average of $0.125/lb.; peak was $0.15 in 1920
257 329
Jenks and Clark (1929: 132-34 and
chart); Committee on the Judiciary (1921:
48-53)
208B. Same as 208A.
Wholesale prices for Muscat raisins were $0.07/lb. in 1913-1915; a joint Dept. of Justice-FTC report stated that 1919-1920 prices were unreasonably high at an average of $0.186/lb.; peak was $0.2225 in 1920
166 218
Jenks and Clark (1929: 132-34 and
chart); Committee on the Judiciary (1921:
48-53)
208C. The California raisin marketing order controled by USDA mandate a reserve pool through an elected board or industry representatives since 1949; three joint products are made: raisins, fresh grapes, and raisins; price
Authors develop a complex econometric model of the US industry for 1963-1984, with 9 no-control scenarios; grower prices for juice grapes rise
0 -- French and Nuckton (1991: 591)

J. M. Connor Price-Fixing Overcharges 3rd Edition February 2014
257
stabilization is achieved. slightly but fall by a nearly equal amount on raisins and by a larger amount for fresh; net returns virtually zero
209A. The California-Arizona navel orange USDA marketing order (1934-present) controls the supply of about 75% of US winter orange supplies; because of a freeze in Florida, the restrictions on selling fresh oranges were unexpectedly suspended in 1985
Predict the negative effect on FOB grower prices during the suspension of the marketing order from best-performing of 4 econometric models with 42 weeks of data from 2/1985 to 5/1987; they later repeat the analysis with more data
7.5 -- Thompson and Lyon (1989:657 and 1991)
209B. Same as 209A; the California-Arizona fresh navel orange industry was cartelized by a mandatory USDA marketing order in 1934; study covers equilibrium prices in 1970s; competition raises prices to growers
An econometric simulation mode predicts prices for oranges with and without the marketing order for Valencia oranges in the 1970s; no price effect
-20 -- Shepard (1986:118)
209C. Same as 209A Same as above -15 -- Shepard (1986:118) 210A. The California-Arizona lemon marketing order controls the US supply under a USDA mandate; in 1973 the policy was changed from one that emphasized constant prices to one that kept price constant; grower prices decreased and retail prices increased
An econometric model compares actual 1986-87 retail prices under the constant-price policy with the former consumer-friendly constant-quantity-policy yardstick
1.1 -- Carmen and Pick (1990:354)
210B. Same as 210A, but examines the effect of the new stabilization policy of returns to middlemen
Same as above, but calculates change in the marketing margin compared to the old policy yardstick
6.8 -- Carmen and Pick (1990:354)
211A . Two bid-rigging cartels in the Upper Midwest U.S. road seal-coating construction industry are detected from 1994-1998 data on almost 18,000 procurement contracts by private and public buyers; authors judge that prices in the upper quintile of contracts (3500 contracts) were affected by one or more of two duopolistic cartels.
A sophisticated econometric model incorporating Baysian expert knowledge predicts cartel behavior on bids where the two largest firms are bidders; largest 20% of collusive markups are compared to the upper 20% of markups of competitive bids
8.0 -- Bajari and Yi (2003:Table 12)
211B. Same as 211A Same as above, except cartel consists of the #1 and #3 firms 21.0 -- Bajari and Yi
(2003:Table 12) 212A. The legal Norwegian cement cartel was established in 1923; until 12/1968 (when it became a monopoly through merger) it set market quotas based on capacity, charged a cartel price in Norway, and exported at world prices through a common sales agency; without capacity constraints, the cartel over-invested in capacity (high X-inefficiency) and exported the excess production at a loss.
Using an innovative econometric model, the authors predict LR marginal cost during 1955-1968; mean domestic price in real 1985 NOK was 524.44 per tonne and MC was 417.37; peak year 1968
34.5 43.7 Röller and Steen (2006:332, Figure 4)
212B. Same as 212A
Divided predicted change in consumer surplus for 1955-1986 due to moving from Cournot to cartel conduct by total revenue (2.01%) and converted to mark-up
2.05 -- Röller and Steen (2006:336)
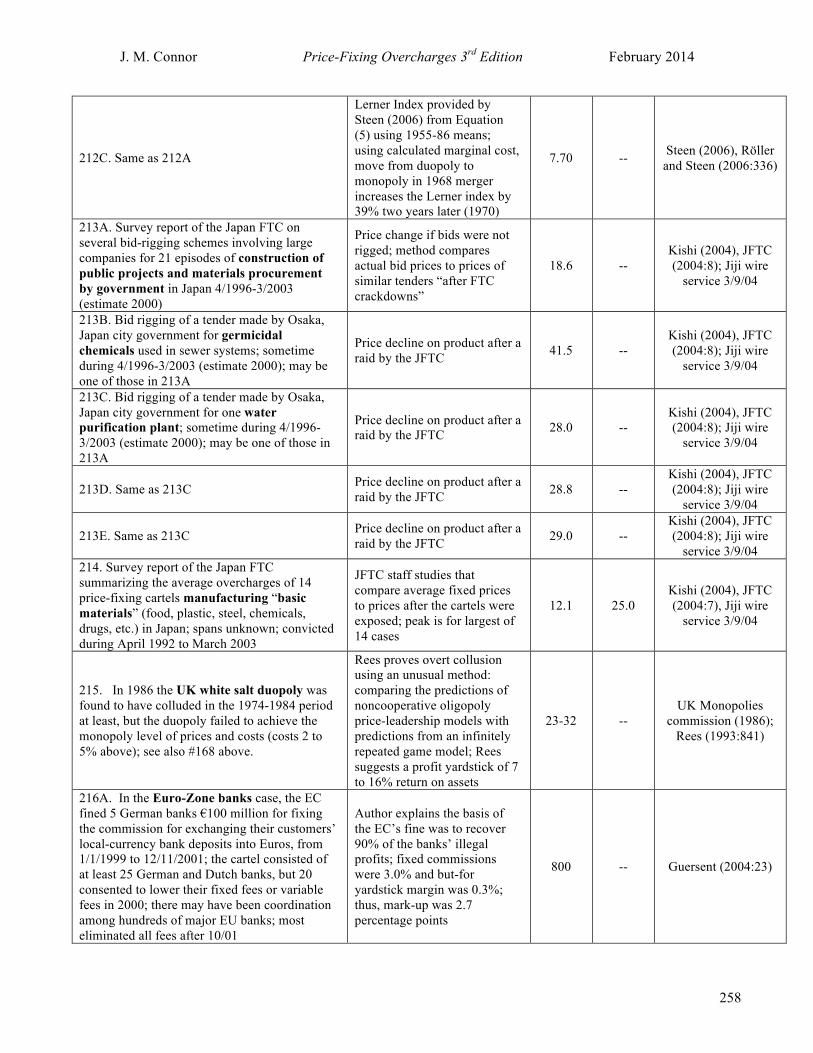
J. M. Connor Price-Fixing Overcharges 3rd Edition February 2014
258
212C. Same as 212A
Lerner Index provided by Steen (2006) from Equation (5) using 1955-86 means; using calculated marginal cost, move from duopoly to monopoly in 1968 merger increases the Lerner index by 39% two years later (1970)
7.70 -- Steen (2006), Röller and Steen (2006:336)
213A. Survey report of the Japan FTC on several bid-rigging schemes involving large companies for 21 episodes of construction of public projects and materials procurement by government in Japan 4/1996-3/2003 (estimate 2000)
Price change if bids were not rigged; method compares actual bid prices to prices of similar tenders “after FTC crackdowns”
18.6 -- Kishi (2004), JFTC (2004:8); Jiji wire
service 3/9/04
213B. Bid rigging of a tender made by Osaka, Japan city government for germicidal chemicals used in sewer systems; sometime during 4/1996-3/2003 (estimate 2000); may be one of those in 213A
Price decline on product after a raid by the JFTC 41.5 --
Kishi (2004), JFTC (2004:8); Jiji wire
service 3/9/04
213C. Bid rigging of a tender made by Osaka, Japan city government for one water purification plant; sometime during 4/1996-3/2003 (estimate 2000); may be one of those in 213A
Price decline on product after a raid by the JFTC 28.0 --
Kishi (2004), JFTC (2004:8); Jiji wire
service 3/9/04
213D. Same as 213C Price decline on product after a raid by the JFTC 28.8 --
Kishi (2004), JFTC (2004:8); Jiji wire
service 3/9/04
213E. Same as 213C Price decline on product after a raid by the JFTC 29.0 --
Kishi (2004), JFTC (2004:8); Jiji wire
service 3/9/04 214. Survey report of the Japan FTC summarizing the average overcharges of 14 price-fixing cartels manufacturing “basic materials” (food, plastic, steel, chemicals, drugs, etc.) in Japan; spans unknown; convicted during April 1992 to March 2003
JFTC staff studies that compare average fixed prices to prices after the cartels were exposed; peak is for largest of 14 cases
12.1 25.0 Kishi (2004), JFTC (2004:7), Jiji wire
service 3/9/04
215. In 1986 the UK white salt duopoly was found to have colluded in the 1974-1984 period at least, but the duopoly failed to achieve the monopoly level of prices and costs (costs 2 to 5% above); see also #168 above.
Rees proves overt collusion using an unusual method: comparing the predictions of noncooperative oligopoly price-leadership models with predictions from an infinitely repeated game model; Rees suggests a profit yardstick of 7 to 16% return on assets
23-32 -- UK Monopolies
commission (1986); Rees (1993:841)
216A. In the Euro-Zone banks case, the EC fined 5 German banks €100 million for fixing the commission for exchanging their customers’ local-currency bank deposits into Euros, from 1/1/1999 to 12/11/2001; the cartel consisted of at least 25 German and Dutch banks, but 20 consented to lower their fixed fees or variable fees in 2000; there may have been coordination among hundreds of major EU banks; most eliminated all fees after 10/01
Author explains the basis of the EC’s fine was to recover 90% of the banks’ illegal profits; fixed commissions were 3.0% and but-for yardstick margin was 0.3%; thus, mark-up was 2.7 percentage points
800 -- Guersent (2004:23)

J. M. Connor Price-Fixing Overcharges 3rd Edition February 2014
259
216B. Same as 216A, except 5 German banks agreed to fix their foreign exchange fees for the Deutsche mark at 3% during the Euro transition period 1/98-12/01
One of the original members of the cartel (Bayerische Landesbank) agreed to eliminate its fixed fee and reduce its variable fee to 2%
50+ -- EC (5/3/01 and 12/11/01), OJ
(1/21/03)
216C. Same as 216A above; information from an EC consent decree involving Westdeutsche Landesbank of Germany
Percentage charge reduced from 3.5% to 1.5% 133 133 EC (5/14/01)
216D. Same as 216A, except EC consent decree with Bank J. Van Breda of NL
Fixed fee of €2.48 eliminated, but 1.25% fee retained; assumed that a typical exchange amount was €50-200
50-80 -- EC (5/14/01)
216E. Same as 216A; information from an EC consent decree with ING, Postbank, and ABN AMRO Bank of NL
Minimum fee lowered from fl. 7.5 to 3.5, but 2.75% charge unchanged; assumed typical amount exchanged is €50-200
20-38 -- EC (5/7/01)
216F. Same as 216A; information from an EC consent decree with Fortis Bank Nederland
Fixed service fee reduced from fl.5 to 2.5 100 100 EC (5/7/01)
216G. Same as 216A; information from EC consent decree with ING Bank Group in Belgium
Reduced their minimum fee from BEL 100 to 45, but fee of 2.25% unchanged; assumed typical amount exchanged is €50-200
17-35 -- EC (5/7/01)
216H. Same as 216A; information from EC consent decree with Ulster Bank of Ireland
Reduced its fee from 2.25% to 1% and eliminated a minimum fee of €2.5; assumed typical amount exchanged is €50-200
56-80 -- EC (5/3/01)
216I. Same as 216A; information from EC consent decree with Bayerische Landesbank of Germany
Abolished its minimum fee of €2 and reduced its service fee from 3% to 2%; assumed typ-ical amount exchanged is €50-200
33-50 -- EC (5/3/01)
217. Chilean miners of sodium nitrate, from the world’s sole source of natural caliche deposits, formed a series of six voluntary export cartels from June 1884 to January 1914; each lasted an average of 3 years; exports grew 900% from 1880 to 1910; cartel set sales and export quotas for each mine and imposed penalties for violations but did not control entry; constant per ton export tax accounted for 30-70% of the export price. After 1929, the Chlean export cartel joined several others to form a supra-national cartel (see #16 above).
When first formed, each cartel saw an increase in prices, followed by a slump when it was dissolved because of entry. However, when Chilean producers joined into a global cartel initiated by German manufacturers of synthetic nitrogen in 1929, it was more effective (see Cartel #16 above)
Stocking and Watkins (1946: 120-127), Wallace and
Edminster (1930: 26-56)
217A. First Chilean export cartel of 1884-1886 Chilean f.a.s. export prices 1884-86 compared to 1883; peak is 1886
7.4 21.6 Stocking and
Watkins (1946: 121-123)
217B. Same as A; first Chilean export cartel of 1884-1886
Chilean f.a.s. export prices 1884-86 compared to 1887-1890; peak is 1886
30.1 47.3 Stocking and
Watkins (1946: 121-123)
217C. Second Chilean export cartel of 1891-1894
Chilean f.a.s. export prices 1891-94 compared to 1887-90; peak is 1894
4.8 7.8 Stocking and
Watkins (1946: 121-123)
217D. Same as C; second Chilean export cartel of 1891-1894
Chilean f.a.s. export prices 1891-94 compared to 1895; 7.7 10.8 Stocking and
Watkins (1946: 121-

J. M. Connor Price-Fixing Overcharges 3rd Edition February 2014
260
peak is 1894 123)
217E. Third Chilean export cartel of 1896-1897 Chilean f.a.s. export prices 1896-97 compared to 1885; peak is 1896
0 3.4 Stocking and
Watkins (1946: 121-123)
217F. Same as E: third Chilean export cartel of 1896-1897
Chilean f.a.s. export prices 1896-97 compared to 1885; peak is 1898-1900
9.7 13.6 Stocking and
Watkins (1946: 121-123)
217G. Fourth Chilean export cartel of 1901-06 Chilean f.a.s. export prices 1901-06 compared to 1898-1900; peak is 1906
44.0 71.7 Stocking and
Watkins (1946: 121-123)
217H. Fifth Chilean export cartel of 1907-08 Chilean f.a.s. export prices 1907-08 compared to 1909-1910
18.2 26.2 Stocking and
Watkins (1946: 121-123)
217I. Sixth Chilean export cartel of 1913- July 1914; in July 1919 the Chilean Nitrate Producers’ Assn. was formed with active government assistance (by 1925-26 with effective entry control tradable quota rights sold for 24% of the export price)
Chilean f.a.s. export prices in 1913 compared to 1909-1912 8.1 --
Stocking and Watkins (1946: 121-123, 128), Wallace
and Edminster (1930: 48)
218. The “east of Burma” agreement covered flat rolled steel products in East Asia; began ca. 1985; still in operation 2003; steel mills in EU and Eastern Europe agreed to export only west of Burma; Japanese and Korean producers only east of Burma; fixed quotas annually and prices quarterly
Method not explained, but cites a 1993 OECD report by Alan William Wolff
25-30 -- Jenny (2003)
219. Roofing felt manufacturers in Belgium fixed prices and shares from at least 1/1978 to 4/1984; 9 companies controlled 60% of market; fined by EC in 1986
EC Decision mentions several times that the cartel agreed to limit discounts to certain buying groups the yardstick) while charging list to other customers
23-25+ -- EC (8/19/1986)
220A. Flour procurement collusion by the Taiwan Flour Mills Association, 32 member companies, from May 1997 to May 2000; fined by the Taiwan FTC in May 2000
Press release by Taiwan FTC estimates cost to consumers to be NT$ 2 billion; method unknown
5.8 5.8 Taiwan Business News (5/5/2000),
KFTC (2002)
220B. Same as 220A
Econometric model using 1994-1999Q1 quarterly data on 11 of the largest firms; overcharge derived from a conjectural elasticity and demand elasticity.
105 -- Ma (2005:18)
220C. Same as 220A
Econometric model using 1994-1999Q1 quarterly data on 11 of the largest firms; overcharge derived from a conjectural elasticity and demand elasticity.
49.3 -- Ma (2005a:166)
221. Distributors of natural gas in southern Taiwan (Pingtung-Kaohsiung and Tainan) fixed prices from 4/2000 to 1/2001 and were required to pay record fines by the Taiwan FTC
An analysis by the Taiwan FTC used the before price as a basis
175-300 -- China Post
(1/12/2001), KFTC 2002)
222A. Bid rigging on road construction in Greeley, Colorado (the “Second 35th Av. Project”) around 1983
Autor’s interpretation of bench-trial decision; damages from plaintiffs’ econometric
10.6 -- State of Colorado v.
Goodell Brothers (1987)
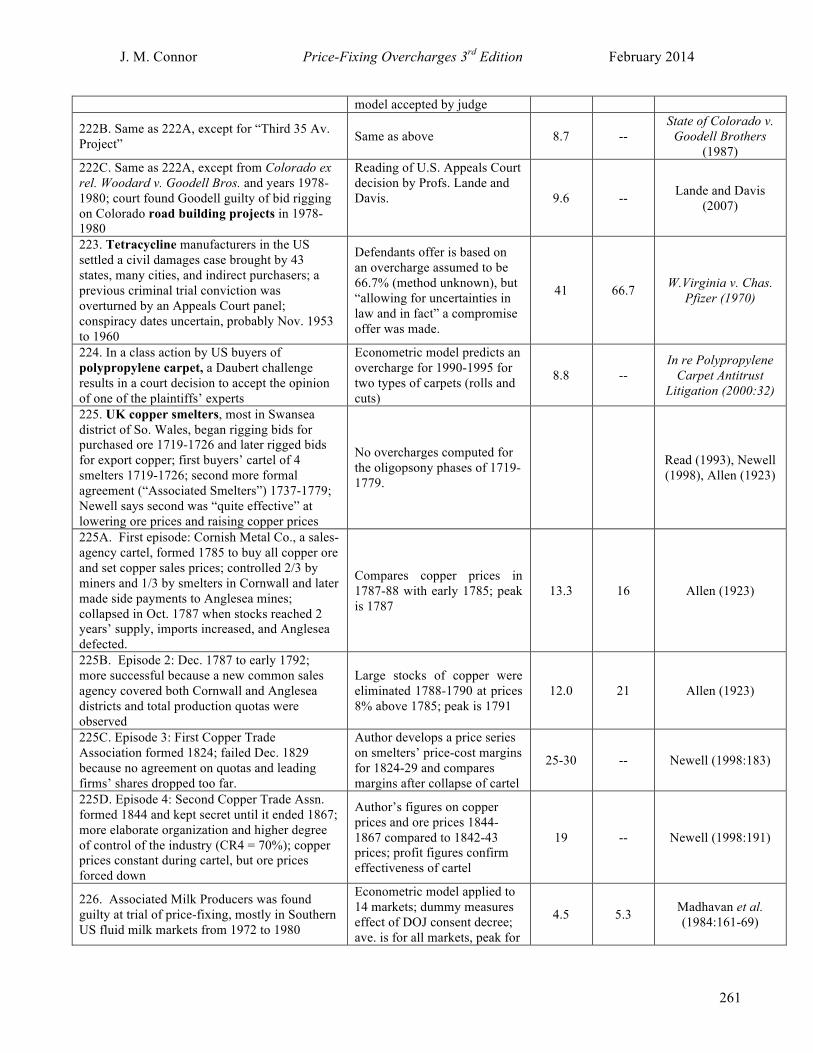
J. M. Connor Price-Fixing Overcharges 3rd Edition February 2014
261
model accepted by judge
222B. Same as 222A, except for “Third 35 Av. Project” Same as above 8.7 --
State of Colorado v. Goodell Brothers
(1987) 222C. Same as 222A, except from Colorado ex rel. Woodard v. Goodell Bros. and years 1978-1980; court found Goodell guilty of bid rigging on Colorado road building projects in 1978-1980
Reading of U.S. Appeals Court decision by Profs. Lande and Davis. 9.6 -- Lande and Davis
(2007)
223. Tetracycline manufacturers in the US settled a civil damages case brought by 43 states, many cities, and indirect purchasers; a previous criminal trial conviction was overturned by an Appeals Court panel; conspiracy dates uncertain, probably Nov. 1953 to 1960
Defendants offer is based on an overcharge assumed to be 66.7% (method unknown), but “allowing for uncertainties in law and in fact” a compromise offer was made.
41 66.7 W.Virginia v. Chas. Pfizer (1970)
224. In a class action by US buyers of polypropylene carpet, a Daubert challenge results in a court decision to accept the opinion of one of the plaintiffs’ experts
Econometric model predicts an overcharge for 1990-1995 for two types of carpets (rolls and cuts)
8.8 -- In re Polypropylene
Carpet Antitrust Litigation (2000:32)
225. UK copper smelters, most in Swansea district of So. Wales, began rigging bids for purchased ore 1719-1726 and later rigged bids for export copper; first buyers’ cartel of 4 smelters 1719-1726; second more formal agreement (“Associated Smelters”) 1737-1779; Newell says second was “quite effective” at lowering ore prices and raising copper prices
No overcharges computed for the oligopsony phases of 1719-1779.
Read (1993), Newell (1998), Allen (1923)
225A. First episode: Cornish Metal Co., a sales-agency cartel, formed 1785 to buy all copper ore and set copper sales prices; controlled 2/3 by miners and 1/3 by smelters in Cornwall and later made side payments to Anglesea mines; collapsed in Oct. 1787 when stocks reached 2 years’ supply, imports increased, and Anglesea defected.
Compares copper prices in 1787-88 with early 1785; peak is 1787
13.3 16 Allen (1923)
225B. Episode 2: Dec. 1787 to early 1792; more successful because a new common sales agency covered both Cornwall and Anglesea districts and total production quotas were observed
Large stocks of copper were eliminated 1788-1790 at prices 8% above 1785; peak is 1791
12.0 21 Allen (1923)
225C. Episode 3: First Copper Trade Association formed 1824; failed Dec. 1829 because no agreement on quotas and leading firms’ shares dropped too far.
Author develops a price series on smelters’ price-cost margins for 1824-29 and compares margins after collapse of cartel
25-30 -- Newell (1998:183)
225D. Episode 4: Second Copper Trade Assn. formed 1844 and kept secret until it ended 1867; more elaborate organization and higher degree of control of the industry (CR4 = 70%); copper prices constant during cartel, but ore prices forced down
Author’s figures on copper prices and ore prices 1844-1867 compared to 1842-43 prices; profit figures confirm effectiveness of cartel
19 -- Newell (1998:191)
226. Associated Milk Producers was found guilty at trial of price-fixing, mostly in Southern US fluid milk markets from 1972 to 1980
Econometric model applied to 14 markets; dummy measures effect of DOJ consent decree; ave. is for all markets, peak for
4.5 5.3 Madhavan et al. (1984:161-69)
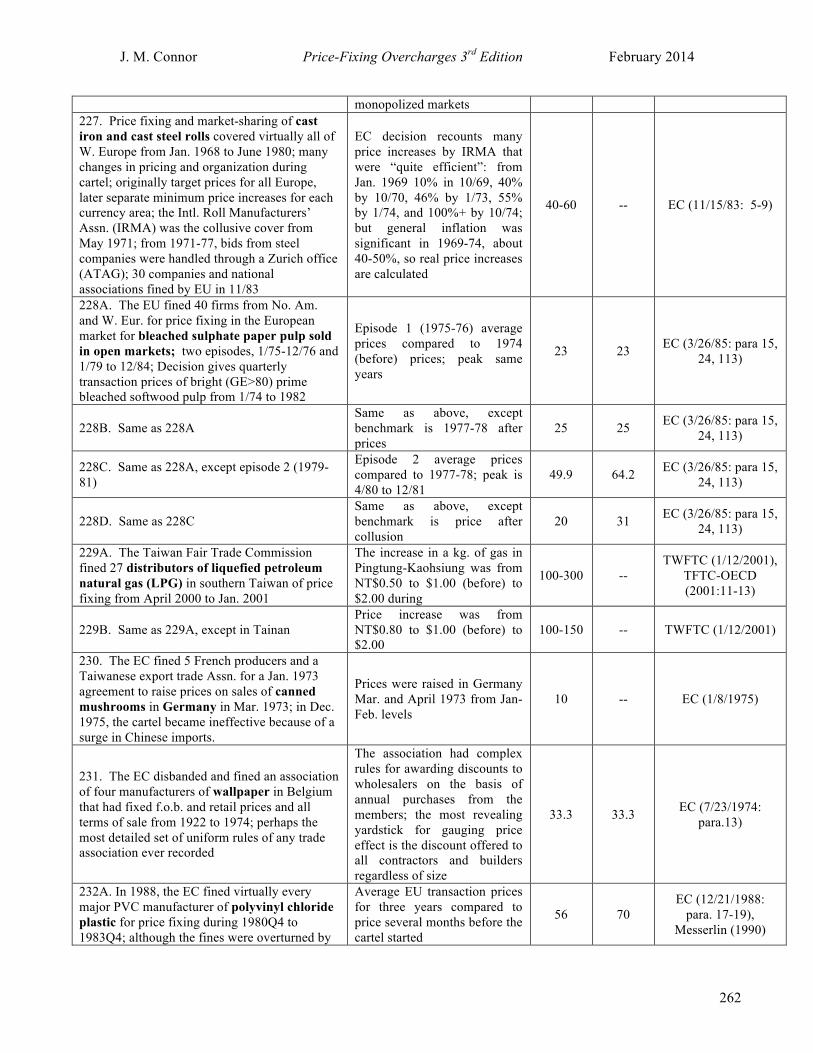
J. M. Connor Price-Fixing Overcharges 3rd Edition February 2014
262
monopolized markets 227. Price fixing and market-sharing of cast iron and cast steel rolls covered virtually all of W. Europe from Jan. 1968 to June 1980; many changes in pricing and organization during cartel; originally target prices for all Europe, later separate minimum price increases for each currency area; the Intl. Roll Manufacturers’ Assn. (IRMA) was the collusive cover from May 1971; from 1971-77, bids from steel companies were handled through a Zurich office (ATAG); 30 companies and national associations fined by EU in 11/83
EC decision recounts many price increases by IRMA that were “quite efficient”: from Jan. 1969 10% in 10/69, 40% by 10/70, 46% by 1/73, 55% by 1/74, and 100%+ by 10/74; but general inflation was significant in 1969-74, about 40-50%, so real price increases are calculated
40-60 -- EC (11/15/83: 5-9)
228A. The EU fined 40 firms from No. Am. and W. Eur. for price fixing in the European market for bleached sulphate paper pulp sold in open markets; two episodes, 1/75-12/76 and 1/79 to 12/84; Decision gives quarterly transaction prices of bright (GE>80) prime bleached softwood pulp from 1/74 to 1982
Episode 1 (1975-76) average prices compared to 1974 (before) prices; peak same years
23 23 EC (3/26/85: para 15, 24, 113)
228B. Same as 228A Same as above, except benchmark is 1977-78 after prices
25 25 EC (3/26/85: para 15, 24, 113)
228C. Same as 228A, except episode 2 (1979-81)
Episode 2 average prices compared to 1977-78; peak is 4/80 to 12/81
49.9 64.2 EC (3/26/85: para 15, 24, 113)
228D. Same as 228C Same as above, except benchmark is price after collusion
20 31 EC (3/26/85: para 15, 24, 113)
229A. The Taiwan Fair Trade Commission fined 27 distributors of liquefied petroleum natural gas (LPG) in southern Taiwan of price fixing from April 2000 to Jan. 2001
The increase in a kg. of gas in Pingtung-Kaohsiung was from NT$0.50 to $1.00 (before) to $2.00 during
100-300 -- TWFTC (1/12/2001),
TFTC-OECD (2001:11-13)
229B. Same as 229A, except in Tainan Price increase was from NT$0.80 to $1.00 (before) to $2.00
100-150 -- TWFTC (1/12/2001)
230. The EC fined 5 French producers and a Taiwanese export trade Assn. for a Jan. 1973 agreement to raise prices on sales of canned mushrooms in Germany in Mar. 1973; in Dec. 1975, the cartel became ineffective because of a surge in Chinese imports.
Prices were raised in Germany Mar. and April 1973 from Jan-Feb. levels
10 -- EC (1/8/1975)
231. The EC disbanded and fined an association of four manufacturers of wallpaper in Belgium that had fixed f.o.b. and retail prices and all terms of sale from 1922 to 1974; perhaps the most detailed set of uniform rules of any trade association ever recorded
The association had complex rules for awarding discounts to wholesalers on the basis of annual purchases from the members; the most revealing yardstick for gauging price effect is the discount offered to all contractors and builders regardless of size
33.3 33.3 EC (7/23/1974: para.13)
232A. In 1988, the EC fined virtually every major PVC manufacturer of polyvinyl chloride plastic for price fixing during 1980Q4 to 1983Q4; although the fines were overturned by
Average EU transaction prices for three years compared to price several months before the cartel started
56 70 EC (12/21/1988:
para. 17-19), Messerlin (1990)

J. M. Connor Price-Fixing Overcharges 3rd Edition February 2014
263
the European Court, the price effects were not questioned; the cartel was formed in response to a Nov. 1981 antidumping action by the EC against E. European suppliers that doubled the import tariff from 12.5% to 24.5%.
232B. Same as 232A, except that collusive period is Feb. 1983 to Nov. 1984 minimum estimate assumes no anti-dumping tariffis imposed by EC
Compares EU market prices with benchmark of Nov. 1980 to Nov. 1981 avg. prices, before anti-dumping proceedings public; peak is 12/83-3/84
10.0 18.7 Messerlin (1990: Table 6)
232C. Same as 232B, except a preferred scenario in which cartel is aided by EC antidumping tariffs
Compares EU market prices with benchmark of Nov. 1980 to two yardstick prices: Japan export prices and domestic US prices ; peak is 12/83-3/84
14.0 16.0 Messerlin (1990: Table 6)
233B. Same as 233A, except for residential customers in NJ and Long Island, NY Same as above 15 -- Reuter (1993:193)
234. In Webb v. Utah Tour Brokers Association, 568 F. 2d 670 (1977) the court found a conspiracy from Feb. 1973 to about Dec. 1974 by travel/tour brokers in Utah to deny plaintiffs entry through boycotts
Reading of U.S. court decision
5 -- Appendix Table 4: entry 26 below
235A. In 3/1999 SAS Airlines (a DK-SE-NO joint venture) and Maersk Air informed the EC about a new code sharing agreement. After raids in June 2000, the EC determined (the “Danish Air Routes” case) that Maersk had agreed to withdrawal from the Copenhagen-Oslo and Copenhagen-Stockholm routes in return for Maersk’s monopoly on the Billung-Copenhagen and Copenhagen-Venice routes plus monetary compensation; the agreement was effective from 3/99 to 4/01
The EC decision uncovered secret planning documents that showed that SAS would and did raise the fares on its route to Stockholm by DKK 100 to pay for the Maersk withdrawal; fares are about DKK2000-2500 on this route
4.75 -- EC (7/18/2001: para. 92-95)
235B. Same as 235A, except for the Copenhagen-Oslo route
Price increase of DKK 100 relative to fares of DKK 2100-2700
3.7-4.8 -- EC (7/18/2001: para. 92-95)
236A. A study of the Swedish roundwood (timber) procurement market in 1954-1984 found evidence of oligopsonistic pricing behavior by paper buyers against forest owners in two interrelated sub markets: sawtimber and pulpwood [an EC-FI antitrust probe was launched in 2004; 3 companies fined by Finland in 12/06].
A sophisticated econometric model simultaneously estim-ates the negative price effects on forestry firms for pulpwood in 1979-1984; peak is 1984 -25 -29.4 Brännlund
(1989:702-703)
236B. Same as 236A Same as above for sawtimber -10 -11.8 Brännlund (1989:702-703)
237. The European Union fined 3 companies for price-fixing of flat glass products in Benelux; 1978-1981
From internal documents of the cartel quoted in the EC decision (para. 14 and 41)
10-15 -- EC (8/8/84)
238A. The German steel and iron cartel of Mar. 1904 – June 1907 fixed prices of crude metal, rails, beams, rods, bars, sheets, axels, wheels, and castings; may be a successor to cartels #185-187 above; this refers to ingots.
Benchmark is 1895-1897 prices (the last normal demand period) of crude ingots 0 -- Walker (1906:860)

J. M. Connor Price-Fixing Overcharges 3rd Edition February 2014
264
238B. Same as 238A, billets Benchmark is 1895-1897 prices (the last normal demand period)
5.3 - Walker (1906:860)
238C. 238C. Same as 238A, beams
Benchmark is 1895-1897 prices (the last normal demand period)
6.1-9.1 - Walker (1906:860)
238D. Same as 238A, rails Benchmark is 1895-1897 prices (the last normal demand period)
7.7 -- Walker (1906:860)
238E. Same as 238B, billets
Yardstick is f.o.b. Antwerp prices adjusted for transportation costs and subsidies
30 -- Walker (1906:864)
238F. Refers to Thomas-Bessermer pig iron in the Ruhr market 1879-1913
Author compares market prices 1883-1913 with the “internal price” (shadow or accounting price) yardstick of a major steel maker
10 -- Webb (1980: 311)
239. A U.S. Circuit Court convicted 16 companies for price fixing of enameled iron bath tubs from 6/1/1910 to 1/1/1911; one of the first cases of anticompetitive patent pooling
The decision quotes letters from the head of the Sanitary Enameled Ware Assn. complaining about cheaters undercutting the fixed price; peak price is from testimony of a nonmember of the cartel
15-17 45 Ripley (1916:614-616)
240. From 1982 to 1999, three companies colluded on harbor loading services in Taichung, Taiwan; fined by the TFTC
Based on yardstick prices for unloading scrap iron in two similar harbors
20-120 -- TWFTC-OECD (2001:14)
241. Bid rigging on a tender by National Taiwan University Hospital for surgical suture thread, by 3 Taiwanese, one U.S., and one German companies in August 1988
Yardstick is prices paid for same products by other Taiwan hospitals in 1997 50-80 -- TWFTC-OECD
(2001:16)
242. The Taiwan Fair Trade Commission fined 15 distributors of liquefied petroleum natural gas (LPG) in Tamshui, Taiwan area of price fixing from May 1999 to May 2000
Before price NT$400 raised to NT$500 per cylinder 25 -- TWFTC-OECD
(2001:18)
243A. The Taiwan FTC fined 5 cable TV operators for fixing the price of services from 1/1/2000 to 12/31/2000 in Kaohsiung City and County, Taiwan
TFTC calculated the monopoly profits of the 5 operators for 2000 30.5 30.5 TWFTC-OECD
(2001:14,19)
243B Same as 243A
A TWFTC survey of cable prices in Jan. 1999 (weighted by subscribers, simple mean of 4 plans) compared to 1998; peak is annual fee
19.7 34.6 OECD (2006e:3)
243C Same as 243A, except for Neihu District of Taipei
A TWFTC survey of cable prices in Jan. 1999 (weighted by subscribers, simple mean of 4 plans) compared to 1998; peak is apartment building shared service
48.9 171.4 OECD (2006e:3)
243D. Same as 243A, except Keelung No evidence of price increase from survey like 243A&B 0 0 OECD (2006e:3)
243E. Same as 243A, except Hinshu No evidence of price increase from survey like 243A&B 0 0 OECD (2006e:3)

J. M. Connor Price-Fixing Overcharges 3rd Edition February 2014
265
243F. Same as 243A, except Taichung No evidence of price increase from survey like 243A&B 0 0 OECD (2006e:3)
243G. Same as 243A, except Fengshan District, Kaohshung County
No evidence of price increase from survey like 243A&B 0 0 OECD (2006e:3)
245. The Chinese Anti-Monopoly Bureau fined 5 business groups for rigging a bid in October 1998 to construct a school building in Chanding County, Fujian Province, China
The Bureau calculated the illegal gains of the winner to be RNB 9000 on the RNB 263.574 project
3.4? Wang (2001:9-10)
246. International bromine cartel of 1995-1998, 2 US and one Israeli company; two of them convicted by the US DOJ
Import price decline in US after the demise of the cartel 15 -- Yu (2003:10)
247. Three construction firms were fined by the Competition Council of France in 12/1994 for rigging bids for the Normandy Bridge project in the early 1990s
The Competition Council used as a yardstick an estimate of costs of construction prepared by an international committee of experts
40 40 Agence France
Presse newswire (12/13/94)
248. Five coffee companies (2 German, 2 US, 1 Swiss) were fined $3.5 million in 12/94 by the Hungarian Competition Council for fixing prices from 6/15/94 to 10/15/94
In the second week of January 1995 in reaction to their fines, major coffee sellers dropped their prices 15%
15 -- Euromarketing
1/10/95), OECD (1994-95:474-475)
249. Three makers and 7 managers of electric pipes were found guilty of illegal price fixing and fined by the Israel Antitrust Authority and found guilty by trial in 2002; dates of cartel unknown (assumed to be 1995-2000)
Decision of an Israeli court reported by the IAA to the OECD (also in the IAA’s 2003 annual report)
120 -- OECD (4/16/03:
Israel 14), UNCTAD (2005:6)
250. The Korean FTC fined 11 auto insurance companies in 2001 for colluding from 11/99 to at least 8/00 on rate increases higher than the increases allowed in 2000 by the Financial Supervisory Service
Assuming that the Korean FSS based its allowed increases on changes in costs, the overcharge is the actual increase less the permitted increase
10 11.6 OECD (2001:Korea p. 11)
251A. Four manufacturers of batteries for automobiles were fined by the Korean FTC for price fixing from June 2003 to about Sept. 2004
KFTC report gives peak price change for large batteries May-Sept. 2004; for average, assumed equal price increases in 6/03, 1/04, and 5/04.
24.1 38.5 KFTC News (Dec. 2004)
251B. Same as 251A Same as above, except for small batteries 20 31.9 KFTC News (Dec.
2004)
252. Three beer manufacturers in Korea were fined for price fixing from 2/1998-5/1999
Report of KFTC, using price before simultaneous price announcements
10 10 Korea Herald (5/29/99)
253A. Three suppliers of liquid propane gas (LPG) in Toluca, Mexico were fined by the Mexican Federal Competition Commission in 1998 for fixing prices in 1996
Report of the CFC to the OECD decided that the price increase of 26.8% could not be justified by the 8% increase in LNG price
18.8 -- OECD (1998:2)
253B. Same as 253A. ??? 46.3 -- Connor (2013) 254A. In Armco Steel Corp. v. North Dakota, 376 F.2d 206 (U.S. App. 1967) the court found Armco guilty of fixing the price of corrugated steel road drainage culverts in ND from 1957 to June 1960
Reading of U.S. Appeals Court decision
18.5 -- Appendix Table 4: entry 2 below
254B. Same as 254A, except that plaintiff is Adams County, No. Dakota
Reading of U.S. Appeals Court decision
17.3-20.3 -- Appendix Table 4:
entry 3 below 255. A series of cordage (sisal and Manilla No information on prices -- -- Dewing (1913: 5)

J. M. Connor Price-Fixing Overcharges 3rd Edition February 2014
266
hemp ropes) cartels were established among the major makers in the Eastern U.S. ports from Feb. 1861 to 1893. The 1st episode (1861-July 1874), a loose “gentlemens’ agreement” on prices, is probably the first recorded US industrial cartel. 255A. A series of informal agreements from 7/1874 to 12/1877 (2nd episode) on price proved ineffectual.
Judgement of historian-author; no method cited. 0 0 Dewing (1913: 5)
255B. In Jan. 1878, a formal pool (an inventory of rope) was formed that assigned production quotas to each maker (from 0.25% to 11%); every month, members over quota sold to those under-quota at cost; ended Jan. 1881. Similar pools were reformed in 1882-84 and 1885-2/1888. (3rd to 5th episodes); pools controlled 70% of supply.
In early 1880, under-quota members paid 2 cents to buy from those over quota; price of hemp ropes ranged from 3.5 to 14.5 cents
75-625 -- Dewing (1913: 5-6:113)
255C. After a period of intense price competition due to cheating, the National Cordage Co. (6th episode) was formed in July 1887, initially with 4 members with 30% of market, but many rivals were bought out so by 1/1892 it had 90% of supply; a common sales agency was used; Paid cordage machinery makers to have exclusive purchase contracts, freezing out rivals; made high profits 1891-92; high prices attracted new entry; NCC developed huge unsold stocks in early 1893 and began to borrow heavily; entered bankruptcy 5/5/93.
Before NCC formed, price of hemp was 7.5 cents/lb.; avg. price 11/1887-1/1891 about 9 to 10 cents; peak of 13 cents 4/1889
20-33 73 Dewing (1913: 6-16)
255D. Same as 255C. After collapse of NCC in mid 1893, price of hemp fell to 3 to 3.62 cents
149-233 259-433 U.S. Industrial Commission (1901)
255E. Same as 255B Author says that this pool “undoubtedly had [the] effect” of preventing price cutting.
1 -- Clark (1895: 491)
256. In FTC v. Superior Court Trial Lawyers Association, 493 U.S. 411 (1990) the court found that association of legal aid attorneys fixed their fees, paid by District of Columbia to assist indigent defendants, 9/6/83-9/20/83
Reading of U.S. Appeals Court decision
16.7 75 Appendix Table 4: entry 5 below
257. In Freeman v. San Diego Ass’n. of Retailers,322 F. 3d 1133 (2003)the court found a conspiracy to standardize realtors’ multiple-listing-service subscription charges from 1992 to March 2003 in San Diego, CA
Reading of U.S. Appeals Court decision
-- 150 Appendix Table 4: entry 6 below
258. In Greenhaw v. Lubbock County Beverage Ass’n., 721 F. 2d 1019 (5th Cir. 1983) the court found a conspiracy in Texas to fix retail price of alcoholic beverages (liquor) during the period June 1970 to December 1974
Reading of U.S. Appeals Court decision
7.7 -- Appendix Table 4: entry 7 below
259. In Homewood Theatre v. Loew’s, 110 F. Supp. 398 (D. Minn. 1952) the court found a conspiracy in Minneapolis, MN from Jan. 1935 to Sept. 1948 involving rental of first run movie films
Reading of U.S. court decision
6.3 -- Appendix Table 4: entry 8 below

J. M. Connor Price-Fixing Overcharges 3rd Edition February 2014
267
260A. In New York v. Hendrickson Bros. 840 F.2d 1065 (2d. Cir. 1988) the court found bid rigging on NY state highway construction contracts; first episode 1977 (and two other years below)
Reading of U.S. court decision
49.2 -- Appendix Table 4: entry 10 below
260B. Episode 2: 1978 contract Reading of U.S. court decision 32.1 -- Appendix Table 4: entry 10 below
260C. Episode 3: contract Reading of U.S. court decision 13.6 -- Appendix Table 4: entry 10 below
261. In New York v. Cedar Park Concrete Corp, 85 Civ 1887 (2001) the court found bid rigging in the NY concrete superstructure construction industry during 1978-1985
Reading of U.S. court decision 5.9 -- Appendix Table 4:
entry 11 below
262. In North Texas Producers Ass’n v. Young, 308 F. 2d. 235 (5th Cir. 1962) the court found a conspiracy in Dallas, Texas from Nov. 1956 to Feb. 1961 to keep milk prices high by excluding a low cost fluid milk processor
Reading of U.S. court decision
36 -- Appendix Table 4: entry 12 below
263A. In Palmer v BRG of Georgia, 498 U.S. 46,47 (1990) the court found naked division of the Georgia state market by two providers of RAR/BRE Education services (Bar Review preparation courses), from 1980 to approximately Nov. 1990
Reading of U.S. court decision
167 -- Appendix Table 4: entry 14 below
263B. Same as 263A. Same as above, new sales data 15 --
Connor (2013), Appendix Table 4:
entry 14 below 264. In Pease v. Jasper Wyman & Son, 2004 ME 29 (2004) the court found a conspiracy during August 1996 to October 1999 by four processors to suppress prices paid for wild blueberries in Maine
Reading of U.S. court decision
-21.6 -32.8 Appendix Table 4: entry 15 below
265. In Story Parchment Co. v Patterson Parchment Paper Co., 282 U.S. 555 (1931) the court found a conspiracy by three U.S. manufacturers to monopolize and destroy plaintiff’s business by predatory pricing in the market for vegetable parchment from Nov. 1927 to at least the bankruptcy of Aug. 1928
Reading of U.S. court decision
27.7 -- Appendix Table 4: entry 16 below
266. In Strobl v. N. Y. Mercantile Exchange, 582 F. Supp. 770 (1984) the court found a conspiracy from about Jan. 1976 to May 1976 by two Idaho food processors to lower the price of a Maine potato futures contract
Reading of U.S. court decision
-48.6 -- Appendix Table 4: entry 17 below
267. In United States v. Dynalectric Co., 859 F.2d 1559 (11th Cir. 1988) the court found a bid-rigging conspiracy on electrical subcontracting portion of building the Snapfinger Creek Wastewater Treatment Plant in Dekalb County, Georgia; bid made on September 7, 1979 and the final side payment to the loser was made on January 24, 1985
Reading of U.S. court decision
34 -- Appendix Table 4: entry 22 below
268. In U. S. v. Foley, 598 F. 2d 1323,1327 (C.A. Md., 1979) the court found that real estate companies in Montgomery County, MD
Reading of U.S. court decision 16.7 16.7 Appendix Table 4:
entry 23 below

J. M. Connor Price-Fixing Overcharges 3rd Edition February 2014
268
agreed Sept. 5, 1975 to raise their sales commissions on houses; ended about April 1977 269A. In Wall Products v. National Gypsum, 357 F. Supp. 832 (N.D. Calif. 1973) the court found a U.S. conspiracy from December 15, 1965 until January 1, 1968 over price of gypsum wallboard
Reading of U.S. court decision
27 -- Appendix Table 4: entry 25 below
269B. Same as 269A, except an episode lasting from 1968 to 1973; the industry fixed prices solely through information-sharing; the FTC sued in 1973 and won on appeal to the Supreme Court in 1978.
A structural model of supply and demand; monthly prices and quantities fitted to the conspiracy period; author finds that the collusive model fits significantly better than Cournot and competition; implied Lerner Index is 0.4237
-- 42.4 Sarkar (1996: 9-16)
270A. The Japanese steel cartel was formed by the major integrated steel manufacturers sometime before 1960 and continued to at least 2002; a precisely observed market-share agreement has been tolerated but not enforced by the Japanese government
Prices of Japanese domestic contracts on cold-rolled sheet steel 1993-1997 are compared to yardstick of contracts for same product in the U.S.
47 -- Tilton (2004:184)
270B. Same as 270A Same as above for 1993-1997 prices of hot-rolled coil steel 19 -- Tilton (2004:184)
271. In the first of three U.S. trials (Pickett v. Tyson) under the Packers and Stockyards Act Tyson Foods was found liable by a jury for manipulating the purchase prices of fed cattle from Jan. 1994 to August 2002; on appeal in 2005.
The jury was swayed by the plaintiffs’ econometric evidence into awarding single damages of $1.28 billion, which was 60% of the expert’s prediction; peak effect in 2002 Q1
3 8.9 Taylor (2003: 20-21)
272. The international polypropylene plastic cartel fixed prices and market shares from June 1979 to December 1983; fined by EC
Price before (1977-early 1979) compared to EU transaction prices in DM given in decision
44.8 -- EC (Aug. 18, 1986:13-22)
273. With the advice of their foreign licensors, the four Japanese manufacturers of heavy electrical equipment formed a cartel in Japan in May 1931; became effective when two more joined in Dec. 1933; rigged bids to achieve agreed quotas; effective in certain more standardized product lines but not high-tech lines until about 1938-39
National Japanese price indexes for all heavy electrical equipment in 1933-1937 relative to base years 1930-32; peak year was 1937
34 50 Hasegawa (1994:252)
274. An international cartel in compressed (industrial and medical) gasses in the Netherlands from Nov. 1989 to Dec. 1997; fined by EU in 2002 and trade assn. cited; expanded from 3 (1989) to 5 (1990-91, 1995-97) to 7 (1994-95) firms over 4 episodes
Price changes set by cartel are adjusted downward by 2% per year for cost inflation for all 4 episodes 30-45 -- EC (7/24/2002: ¶112-
154)
274A. 11/1989-11/1990 episode Actual price change implemented Feb. 1990 5 5 EC (7/24/2002: ¶112)
274B. 11/90-12/92 episode Actual price changes (2) implemented after Nov. 1990 15-18 15-18 EC (7/24/2002: ¶119)
274C. 12/93-10/95 episode Actual price changes implemented 2/94 and 12/95 10.5 10.5 EC (7/24/2002: ¶129-
137) 274D. 11/95-12/97 episode Actual price changes 10.5-16 10.5-16 EC (7/24/2002: ¶149-

J. M. Connor Price-Fixing Overcharges 3rd Edition February 2014
269
implemented 1/96 and early 1997
154)
275. Four to six Chinese manufacturers of vitamin C were alleged to have colluded on the price of exports to the US market; 2 episodes; a civil antitrust suit was filed in 2/2005; the six control over 68% of world supply in 2004-05
275A. First episode began at a trade assn. (Chamber of Commerce of Medicines and Health Products Importers and Exporters) meeting 12/2001; six firms controlled about 70% of US imports in 2003; a price war began after July 2003 and ended October 2003.
US import prices were flat at $3.40/kg. from 6/01 to 8/02; averge price 8/03 to10/03 was $5.77/kg.; peak of $6.80 reached on 5/03.
70 100 Isaacson (2008: slide 4)
275B. Second episode began at an “emergency meeting” of the trade assn. in Nov. 2003;four firms controlled 77% to 86% of US imports in 2004-05; prices rose for next 3 months, then fell slowly; collusion ended about 2/2005 but price effects lagged through all of 2005.
US import price reached $3.40 in 12/05 after collusion ended; averge price 11/04 to12/05 was $4.62/kg.; peak of $6.05 reached on 2/04.
36 78 Isaacson (2008: slide 4)
275C. Same as 275B
US import price before 2001 meeting was $2.80/kg.; reached average of $4.57 in 2004; peak price in 2004 was $6.05 in 2/04.
63 116 SinoCast (6/24/05)
276. Six Japanese firms fixed the prices of aluminum foil in Japan July 2002-Feb. 2005; JFTC raided firms on 2/8/05
Following a drop of 15% in 2001, prices were raised 5-10% in late 2002 and winter 2003-04
10-20 -- Daily Yomiuri(2/9/05:2)
277A. Three cement makers from France, Switzerland, and Germany were fined by the Romanian Antitrust authority for bid rigging and price fixing from 2000 to 2005
A statement of a spokesperson of the Authority asserted that prices rose from €20 to €50 during the collusive period
75 150 AFX (5/27/05)
277B. Same as 277A
Competition Authority spokes-person used prices in nearby European countries as a yardstick
33-45 -- AFX (5/27/05)
278. Three manufacturers in Korea fixed the prices of construction machinery (excavators and loaders) from May 2001 to Nov. 2004
Estimate of the KFTC 3.5-9.2 -- Asia Pulse (4/6/05)
279A. Three manufacturers in Korea fixed the prices of forklift trucks from Dec. 1999 to Nov. 2004
Estimate of the KFTC is 4% to 5% per year 20-25 --
KFTC Decision (2005), Asia Pulse
(4/6/05)
279B. Same as 279A
Same as above, new sales data
4.23 --
Connor (2013), KFTC Decision
(2005), Asia Pulse (4/6/05)
280A. Collusion from June 2003 to May 2005 on telephone fees for local land lines, Korea; fined by the Korean FTC May 2005
Statement of the KFTC Director-General 15-20 --
KFTC Decision (2005), Asia Pulse
(9/15/2005)
280B. Same as 280A
Same as above, new sales data
17.1 --
Connor (2013), KFTC Decision
(2005), Asia Pulse (9/15/2005)
281. Collusion from June 2003 to May 2005 on connection fees for broadband internet
Statement of the KFTC Director-General 15-20 -- KFTC Decision
(2005), Asia Pulse

J. M. Connor Price-Fixing Overcharges 3rd Edition February 2014
270
service, Korea; fined by the Korean FTC May 2005; one firm is US-UK owned
(9/15/2005)
282. Collusion from June 2003 to May 2005 on telephone fees for long-distance land lines, Korea; fined by the Korean FTC May 2005
Statement of the KFTC Director-General 15-20 --
KFTC Decision (2005), Asia Pulse
(9/15/2005)
282B. Same as 282A
Same as above, new sales data
17.15 --
Connor (2013), KFTC Decision
(2005), Asia Pulse (9/15/2005)
282C. Same as 282A
Same as above, new sales data
3.4 --
Connor (2013), KFTC Decision
(2005), Asia Pulse (9/15/2005)
283. Collusion from June 2003 to May 2005 on telephone fees for international land lines, Korea; fined by the Korean FTC May 2005
Statement of the KFTC Director-General
15-20 --
KFTC Decisi KFTC Decision (2005), Asia Pulse (9/15/2005)on (2005), Asia Pulse
(9/15/2005) 283B. Same as 283A Same as above, new sales data 17.14 -- Connor (2013), 284. The U.S. Supreme Court in 1921 ruled that the American Hardwood Manufacturers Assn. colluded through an information-sharing plan from Dec. 1918 to March 1921among its 465 members, which represented 30% of output of the 9000 U.S. mills at the time; however, the price effects were sub-national in scope.
Alexander applies an econometric model to national prices in the US hardwood industry and finds no anticompetitive effect on output; thus, one can infer no price effect
0 0
Carlton and Perloff (2004: 383);
Alexander (1988); Sjostrom (1991)
285A. The Icelandic Competition Authority in 2005 fined 3 petroleum distribution firms with the whole national market for price fixing 1993-2001; also bid-rigging against the government and fishing ships
Gross margins in the strongest collusive period 1997-2001 are compared to margins in a weaker collusive period (1993-1997) to calculate the cartel’s gain
0.01-0.02 0.02 Samkeppniseftirlitid
(9/23/2005: 22)
285B. Same as 285A
The Competition Authority report says that in 1998 Icelandic fishing vessels paid 50% less for fuel in the Faeroe Islands, Norway (a yardstick)
100 -- Samkeppniseftirlitid (9/23/2005: 16)
286A. Six multinational drug manufacturers fixed prices and rigged bids on infant and baby formula in Italy from about 1995 to March 2000; fined by the Italian Antitrust Authority in March 2000
Prices in Italy compared to yardstick of prices of identical items in pharmacies in neighboring European countries
100+ -- Italian Competition
Authority (3/16/2000)
286B. Same as 286A except only 4 companies colluded from March 2000 to July 2004; companies also prevented sales to Italian supermarkets and blocked parallel imports from DE, FR, and ES; fined a larger amount a second time in October 2005
Prices of infant formula in Italy compared to yardstick of prices of identical items in pharmacies in neighboring European countries
150 300 Italian Competition
Authority (10/20/2005)
286C. Same as 286B
Price reductions of infant formula in Italian pharmacies from July 2004 to October 2005
33 -- Italian Competition
Authority (10/20/2005)
286D. Same as 286B From an Italian Competition Authority survey of prices of baby formulas in Italy
100 200 Italian Competition
Authority (10/20/2005)

J. M. Connor Price-Fixing Overcharges 3rd Edition February 2014
271
compared to yardstick of prices of identical items in pharmacies in neighboring European countries
286E. Same as 286B
Price reductions of baby formulas in Italian pharmacies from July 2004 to October 2005
33 -- Italian Competition
Authority (10/20/2005)
286F. Same as 286B
Survey of pharmacy prices of 9 brands infant formula for babies up to 4 months old in 7 large EU nations in 2002; simple average across brands in one country and then simple average of 7 countries; peak is UK
186 280 OECD(2006b:6-7)
286G. Same as 286B Same as 286F, except survey in 2004; peak is UK comparison
193.3 335 OECD (2006b:6-7)
286H. Same as 286B Same as 286F for formulas for infants over 4 months old; peak is UK
126.8 240 OECD (2006b:6-7)
286I. Same as 286B
Same as 286F for prices of formulas for infants with special medical conditions; peak is prices in Germany
101.9 142.5 OECD (2006b:6-7)
287A. The Europe-Asia Trades Agreement (EATA) for shipping containers from northern Europe to East Asia had 18 members; it agreed to limit capacity by 31% in Nov. 1992- Dec. 1993 and kept the reduced capacity until disbanded in Sept. 1997; consent decree by the EC in April 1999
Compared to 1992, freight rates rose in 1993, 1994, and 1995 as a result of the capacity reductions in 1993
32.6 48 Drewery (1996: 110),
EC Decision (4/30/99: 33)
287B. Same as 287A Same as above, new sales data 0.3 -- Connor (2013), EC Decision (4/30/99:
33) 288A. Four tobacco processors in Spain began overtly colluding on the maximum procurement prices to pay 5000+ farmers represented by four unions for four types of their “raw” leaf tobacco in March 1996; was ineffective until punishment mechanism adopted in March 1998; failed to agree on prices in 2000-01; ended in Oct. 2001when processors were raided by European Commission; 4 processors and 4 farmers’ unions fined in 2003.
Ineffective episode 3/96- 2/98; prices to farmers actually declined an average of 162% from monopsony period 1993-1995 to marketing year 1997-98
0 0 EC (10/20/04: 13)
288B. Same as 288A, except for effective episode 2/1998-2/2000
Prices of Virginia grade in 1998-2000 compared to 1997-98; peak is 1999-2000
-4.1 -6.0 EC (10/20/04: 13)
288C. Same as 288B Prices of Virginia grade in 1998-2000 compared to 2000-2001; peak is 1999-2000
-8.4 -10.2 EC (10/20/04: 13)
288D. Same as 288B Prices of Burley E grade in 1998-2000 compared to 1997-98; peak is 1999-2000
-4.8 -6.0 EC (10/20/04: 13)

J. M. Connor Price-Fixing Overcharges 3rd Edition February 2014
272
288E. Same as 288B Prices of Burley E grade in 1998-2000 compared to 2000-2001; peak is 1999-2000
-0.1 -1.4 EC (10/20/04: 13)
288F. Same as 288B Prices of Burley F grade in 1998-2000 compared to 1997-98; peak is 1999-2000
-8.8 -9.1 EC (10/20/04: 13)
288G. Same as 288B Prices of Burley F grade in 1998-2000 compared to 2000-2001; peak is 1999-2000
0 0 EC (10/20/04: 13)
288H. Same as 288B Prices of Havana grade in 1998-2000 compared to 1997-98; peak is 1999-2000
-4.3 -4.7 EC (10/20/04: 13)
288I. Same as 288B Prices of Havana grade in 1998-2000 compared to 2000-2001; peak is 1999-2000
-0.4 -0.8 EC (10/20/04: 13)
289. The “Helsinki Agreement” signed by virtually all W. European national banking associations in May 1983 (effective 12/83) raised the maximum commission to be paid to a group of 703 French banks; also, for the first time a minimum rate was specified on Eurocheque bank commissions; EU stopped the agreement and fined both groups in 3/92
The maximum percentage commission in 12/83 compared to the 1982 maximum
20-25 28 EC (3/25/92: 1-11)
290. The Society of Price-Regulating Organizations in the Building Trades (SRO), a federation of construction-industry trade associations, began allocating winners and rigging the prices of all tenders in all branches of the construction industry of the Netherlands in 4/1/87; some of its member associations began colluding as early as 10/1980; in 1982-88 the SRO rigged 25-30,000 bids per year; ended 2/92 with large EU fines on the SRO’s 28 members
The EC decision cites an independent study that calculates the increased annual costs of the SRO’s bid rigging at NGL400 million in 1987-88; sales of tendered construction projects in 1987-88 were NGL12.2 to 12.9 billion.
3.1-3.3 -- EC(2/5/92: 17)
291. At an auction of rare books held at Claygate Estate, Surrey, England over 10 days in October 1919, 81 book sellers formed a bidding ring for 447 of the 641 lots of 13,600 volumes sold; one of the dealers kept a detailed diary of the bidding ring published in 1990; bid rigging was made illegal in the UK in 1927
The ring met secretly later to hold 4 “knockout” auctions among themselves; prices advanced each time; total knockout sales (a yardstick) were £19,696, up from £3714 paid to the estate at the original auction
-81 -- Porter (1992:434)
292A. Five manufacturers cartelized the global market for DRAMs (dynamic random access memory semiconductors) from April 1999 to June 2002; top 4 held 76% world share; U.S. investigation began June 2002 and guilty pleas made in 2004-07
In a DOJ plea agreement of May 11, 2005 with Hynix Semiconductor, the two parties agreed that the company’s affected sales was $839 million and that the minimum proveable U.S. overcharge was more than $92.5 million
12.4+ --
Korea Herald (8/18/04); DOJ
(5/11/2005) Hynix guilty plea
[www.usdoj.gov/atr/cases/f209200/209231
.pdf]
292B. Same as 292A
In a DOJ plea agreement of March 8, 2006 with Elpida Memory, the two parties agreed that the company’s affected sales was $425 million
11.0+ -- DOJ (3/8/2006)
Elpida plea agreement

J. M. Connor Price-Fixing Overcharges 3rd Edition February 2014
273
and that the minimum proveable U.S. overcharge was more than $42 million.
292C. Same as 292A, except world prices
Weekly data from iSuppli on prices of 128MB DRAM shows mean world price $2.88 from 12/01 to 6/02; prices after collusion were $1.50 to $1.70.
69-92 --
WSJ (2/26/04:A1) quoting industry trade publication iSuppli (2004)
292D. Same as 292A
From settlement in DRAM Antitrust Litigation, plaintiff’s expert’s econometric model found damages of $362-$384 mil.; the DOJ plea statements place U.S. affected sales at $5749 million.
6.3-6.7 -- Lande and Davis (2007: Case 11), Connor (2007a)
292E. Same as 292A, except EU prices But-for is intra-collusion price war 28.2 Connor (2013),
iSuppli (2004)
292F. Same as 292A, except ROW prices But-for is intra-collusion price war 28.2 Connor (2013),
iSuppli (2004)
292G. Same as 292A, except EU prices But-for is intra-collusion price war 19.2 Connor (2013),
iSuppli (2004) 292H. Same as 292A, except U.S. prices and three collusive periods: 9/98-3/99, 4/99-12/00, and 12/01-6/02. The earliest period of collusion is marked by extensive information exchange starting in early 1997 and U.S. antidumping duties on Korean exporters. The eight-month price war in 2001 was an attempt to drive Hynix out of business, foiled only by a $7 billion Korean Govt. loan.
Noll describes the econometric model of Liu, which uses three time-period dummy indicator variables to capture collusion and many market demand and supply shifters to predict weekly prices; found effects were same across various customer sizes.
32 -- Noll (2014: 275), Liu (2006)
293A. Four manufacturers of polychloroprene synthetic rubber (a/k/a Neoprene) cartelized the global market from Sept. 1999 to April 2002; U.S. guilty pleas
In a public plea agreement of March 29, 2005 with DuPont Dow Elastomers, the two parties mutually agreed that the company’s u.s. affected sales was $410.5 million and its US overcharge was at least $42 million; latter probably an underestimate
11.4 + --
DOJ (5/29/2005) [www.usdoj.gov/atr/cases/f209200/209200
.pdf]
293B. Same as 293A, except for EU Price increases in EC Decision 82.2 -- Connor (2013), EC Decision (1/23/2008)
293C. Same as 293A, except for EU Price before collusion 9.6 --
Connor (2013), International Institute of Synthetic Rubber
Producers, Inc. (2004)
293D. Same as 293A, except for ROW Price before collusion 9.6 --
Connor (2013) Connor (2013),
International Institute of Synthetic Rubber
Producers, Inc. (2004)
293E. Same as 293A, except for world Price before collusion 17.8 -- Connor (2013) Connor (2013),
International Institute

J. M. Connor Price-Fixing Overcharges 3rd Edition February 2014
274
of Synthetic Rubber Producers, Inc. (2004)
294 A. The Aviation and Transportation Security Act of 2001 allowed Aloha Airlines and Hawaiian Airlines to obtain temporary antitrust immunity from 9/30/2002 to 10/1/2003 for their agreement to reduce passenger seat capacity on routes between Hawaii’s major inter-island airports: prices on Hawaiian air routes rose immediately and a lagged price-adjustment effect until at least December 2004; U.S. average prices are shown to follow airfares in 6 other tourist destinations in Florida, Las Vegas, and Puerto Rico.
ATPI (Average Transportation Price Index) data for entire U.S. supplied by the U.S. Dept. of Transportation shows changes in Kona, Hawaii airfares from 2002Q4 to 2004Q4 compared to US ATPI yardstick in same period; peak price refers to 2003Q4
16.8 24.5 Blair et al. (2007: Figure 3 and Table5)
294 B. Same as 294A, except for Lihue, Hawaii
Average ATPI changes from 2002Q4 to 2004Q4 are compared to US ATPI price changes in same period; peak price refers to 2003Q3
15.8 21.6 Blair et al. (2007: Figure 3 and Table5)
294 C. Same as 294A, except for Kahului, Hawaii
Average ATPI changes from 2002Q4 to 2004Q4 are compared to US ATPI changes in same period; peak price refers to 2003Q4
12.7 18.6 Blair et al. (2007: Figure 3 and Table5)
294 D. Same as 294A, except for Honolulu, Hawaii
Average ATPI changes from 2002Q4 to 2004Q4 are compared to US ATPI changes in same period; peak price refers to 2004Q3
8.3 16.9 Blair et al. (2007: Figure 3 and Table5)
294E. Same as 294A Regression analysis using dummy variable for period of Hawaii State immunity
10-18 -- Kamita (2010: 258)
294F. Same as 294A, except period for 2.5 years after immunity expired but before a third airline entered
Regression analysis using more time periods and dummy variable for period of Hawaii State immunity
22-43 -- Kamita (2010: 259)
295. The French semi-finished steel cartel of 1932-1939 had 15 members; prices and domestic quotas were managed by the Comptoir Sidurgique de France (CSF); government encouragement but not participation; maximum market control of 52%
Price rise from 1936 to 1939 due to general inflation, labor policies, and devaluation of the franc; highly unstable quotas and inadequate penalties for cheating
0 0 Barbezat (1996: 529-530)
296. The French structural-shapes steel cartel of 1932-1939 had 15 members; prices and domestic quotas were managed by the Comptoir Sidurgique de France (CSF); government encouragement but not participation; maximum market control of 52%
Price rise from 1936 to 1939 due to general inflation, labor policies, and devaluation of the franc; highly unstable quotas and inadequate penalties for cheating
0 0 Barbezat (1996: 529-530)
297. The French merchant-bars steel cartel of 1932-1939 had 15 members; prices and domestic quotas were managed by the Comptoir Sidurgique de France (CSF); government encouragement but not participation; maximum market control of 52%
Price rise from 1936 to 1939 due to general inflation, labor policies, and devaluation of the franc; highly unstable quotas and inadequate penalties for cheating
0 0 Barbezat (1996: 529-530)

J. M. Connor Price-Fixing Overcharges 3rd Edition February 2014
275
298. The French thick plate steel cartel of 1932-1939 had 12 members; prices and domestic quotas were managed by the Comptoir Sidurgique de France (CSF); government encouragement but not participation; maximum market control of 52%
Price rise from 1936 to 1939 due to general inflation, labor policies, and devaluation of the franc; highly unstable quotas and inadequate penalties for cheating
0 0 Barbezat (1996: 529-530)
299. The French thin sheet steel cartel of 1932-1939 had 12 members; prices and domestic quotas were managed by the Comptoir Sidurgique de France (CSF); government encouragement but not participation; maximum market control of 52%
Price rise from 1936 to 1939 due to general inflation, labor policies, and devaluation of the franc; highly unstable quotas and inadequate penalties for cheating
0 0 Barbezat (1996: 529-530)
300 A. Radium was discovered in 1898 and isolated in 1910; a Bohemian monopoly until about 1910 when U.S. mines were opened; from 1912 to 1923 a U.S. cartel dominated world supply (1st episode ended in 1918)
Prices were held steady 1912-1918 at $170,000 per gram [sic] when U.S. cost of production was $70,000
243 243 Canada (1945: 36)
300B. In the early 1920s a Belgian Congo monopoly (Union Minière du Haut-Katanga) developed new radium supplies, causing U.S. cartel to drop its price during 1920-1923 (2nd episode); “sometime in the mid 1920s” (ca. 1925), the U.S. producers stopped producing and became distributors for the Belgian firm, a world monopoly 1925-1931
Prices were held steady 1920-1923 at $105,000 to $120,000 per gram [sic] when U.S. cost of production was $70,000
50-71 50-71 Canada (1945: 36)
300C. In 1931 a Canadian mine (Eldorado Gold Mining) discovered new, lower-cost radium supplies and prices fell until 1938 when a world market-sharing agreement was concluded (3rd episode); 40% for Canada, 60% for Congo; for military security the Canadian mine was secretly nationalized in 1942, probably ending duopoly contract.
Price reached $20,000 to $25,000 per gram in 1938, but new international duopoly set 1938-1940 prices at $25,000
0-25 0-25 Canada (1945: 36), Goldscmit (1989:1)
301. Schering-Plough, a US drug maker, paid two other drug makers $90 million if they agreed not to produce generic versions of a patented drug K-Dur 20 (extended-release potassium chloride supplement) from 6/98 to 9/01; the FTC ordered the practice to stop on 12/03, but lost on appeal when the Supreme Court refused to hear the case (after the Bush II DOJ intervened for the defendants!)
FTC Complaint states that overcharge is at least $100 million and that patented drug sales are about $220 mil. annually (which overstates sales had generics entered)
11.4 -- FTC(4/2/2001)
302. In 1928 the Canadian Newsprint Institute export cartel (legal in Canada at the time) was formed with the encouragement of the Premiers of Quebec and Ontario Provinces; members included all non-US newsprint paper companies with a national share of 70% of supply, of which 75% was exported to the US; subsequent Canadian cartel-formation efforts during 1934-1938 seem to have been equally unsuccessful.
Despite the role of governments, the Institute was able to raise prices on only one contract to the Hearst newspapers chain; by 1933 cheating and the Depression had caused prices to fall 24%
0 0 Canada (1945: 37-38)
303. Prices (corrected for the destination of exports) were collected for 83 Swedish manufactured products, some from industries that had export cartels in 1976-1990; if some of
An econometric model regresses the ratio of Swedish prices to EEC prices against a dummy variable (=1 when the
0 0 Fölster and Peltzman
(1997: Table 8.8, column 3).

J. M. Connor Price-Fixing Overcharges 3rd Edition February 2014
276
the same products from Swedish cartels with horizontal price agreements are cartelized in the EEC, then the price effects of Swedish cartels are biased toward zero
industry had a legally registered price-fixing cartel); thus, essentially a yardstick method
304A. This study examines the price and output effects of 64 “rationalization and specialization” manufacturing cartels in West Germany during 1973-1986; they are legally exempted from German cartel prohibitions if consumers benefit from lower prices; most are in the non-electrical machinery, non-metallic mineral, food, and transportation equipment industries; the first sample consists of 33 cartels newly legalized
The cartels’ prices during the legal period are divided by the industry’s price 3 years before cartelization, then further divided by the same ratio for the industry group to which the cartel belongs, and finally a before/during difference calculated; a yardstick method
2.2 -- Audretcsh (1989: 597)
304B. Same as 204A, except that the sample is 13 cartels that were unexempted during 1976-1983
Same as above, except that relative prices during the legal period are compared to relative changes 3 years after the exemption was nullified
4.5 -- Audretcsh (1989: 597)
304C. Same as 204A, except that the sample is 18 cartels that were exempted throughout 1976-1983
Same method as 304A 3.3 -- Audretcsh (1989: 597)
305. Six construction firms rigged bids on road projects (worth €83 million) and the price of asphalt in the Seine-Maritime Department of France from 1988 to the end of 1998; by 2005, the six had been acquired by three firms; France imposed fines of €33.6 million in 12/2005.
Studies commissioned by the Conseil found an overcharge to the Department of €24.8 million; method unknown
30 -- Conseil Concurrence, (12/15/2005:2)
306. Six luxury hotels in Paris, France (five foreign-owned) were fined by the Conseil Concurrence in 2005 for fixing prices as early as 1999 to 2003 through detailed information exchanges; price variation among the six five-star “palaces” was extremely low during these years
The Decision shows the ratio of 1999-2001average prices of rooms at the six “palaces” compared to “Grand luxe” and “Hotels de charme” (1.88); the yardstick is the same ratio calculated for advance-purchase on 10/15/06 for four periods of 3 to 7 days in 11/06-1/07 at 10 four-star Paris hotels (the cheapest double room found on several travel search engines) (1.65)
13.9 37.2 Conseil Concurrence (2005:5,31)
307. Bid rigging in 4/1/2000 to 2/2/2001 by “dozes of firms” of government tenders for construction of agricultural-engineering projects in Shinjo City and Mogami Ward of Yamagata Prefecture, Japan; Yamagata construction industry association involved; Prefecture officials alleged to have leaked the RCPs to bidders
An internal analysis by the Japan FTC compared the RCP (a yardstick, the buyer’s construction price from engineering estimates) during the collusive period with the RCP during 2/7/2001-12/31/2001.
5.4 -- OECD (2005a:134)
308. Bid rigging by four manufacturers in 4/1/97 to 2/21/2001 of tenders by the District Transport Bureau of the Ministry of Land, Infrastructure and Transport of Japan for Automobile testing machines and equipment
An internal analysis by the Japan FTC compared the RCP (buyer’s estimated price) during the collusive period with the RCP during 2/23/2001-12/31/2001.
41.5 -- OECD (2005a:134)

J. M. Connor Price-Fixing Overcharges 3rd Edition February 2014
277
309A. Three manufacturers of school uniforms in South Korea were found guilty by the KFTC of price fixing and obstructing purchases of uniforms by parents’ buying cooperatives from 11/98 to 5/01; overcharges were $573 million; fines of $8.8 million were imposed on the three manufacturers and colluding wholesalers and retailers
The KFTC calculated that the manufacturers’ prices increased 84 to 100% compared to the price before the cartel was formed
84-100 100 OECD (2005a:140)
309B. Same as 307A
The KFTC compared cartel prices of winter-weight uniforms with prices after the fines
20.7 -- OECD (2005a:140)
309C. Same as 307A
The KFTC compared prices of winter-weight uniforms made by non-members with prices after the fines
24.0 -- OECD (2005a:140)
309D. Same as 307A
The KFTC compared cartel prices of summer-weight uniforms with prices after the fines
25.0 -- OECD (2005a:140)
310A. In 1999 the Korean Omnibus Cartel Repeal Act eliminated the legality of professional associations to set fees for their members; prior to April 1981, Korea had no price-fixing law; the KFTC regularly surveyed those fees following deregulation in 2000, 2001 and 2002
Surveys found the fees of patent lawyers falling from 2000 to late 2001
11.4 -- OECD (2005a:140-41)
310B. Same as 308A, except fees for all lawyers Fees in 1999 compared to late 2001 12.0 -- OECD (2005a: 140-
41) 310C. Same as 308A, except fees of auditing services
Fees in 1998 compared to late 2001 11.0 -- OECD (2005a: 141)
311A. In August 2003 the UK Office of Fair Trade fined a maker and 9 retailers of football replica kits (shirts, shorts, and socks) for price-fixing, a long-time practice formally made illegal in the UK since 1956; the infringement was both a vertical and horizontal restraint
An analysis for the UK Government by the Centre for Competition Policy, University of East Anglia compared prices of adult shirts in 2002 with Nov.-Dec. 2003 retail prices; peak is stores in Boston, UK
16.9 29.0 Davies (2004:73-84), OECD (2006:196)
311B. Same as 311A above
Same as above, except prices of junior-size shirts in 2002 with Nov.-Dec. 2003 retail prices; peak is stores in Norwich, UK
17.3 29.7 Davies (2004:73-84), OECD (2006:196)
311C. Same as 311A above Price change after the cartel was exposed 43+ -- OECD (2005b: 20)
311D. Same as 311A
In response to a threat of a class-action damages suit, UK sports-clothing retailer JJB offered to compensate victims by giving away free a shirt with retail price £13.49 to all buyers of similar priced-fixed shirts (sold at £40-45)
43-51 -- The Mirror (2/10/07:21)
312A The Competition Commission of Switzerland found 4 construction firms guilty
The Commission invited an expert to estimate the 112.4 112.4 OECD (2006a:3)

J. M. Connor Price-Fixing Overcharges 3rd Edition February 2014
278
of bid-rigging on a March 1999 tender to renovate the façade of the National Library
competitive cost of the project, which was divided into the lowest collusive bid
312B. Same as 312A
The Commission invited a 5th firm to make a bid; this yardstick was divided into the lowest collusive bid
47.7 47.7 OECD (2006a:3)
313. Under the cover of the Taxi Service Providers Assn., a cartel with 39 participants was fined by the Lithuanian Antitrust Authority for fixing the prices charged by call taxis in Vilnius from 7/2004 to 12/2004
Prices rose by 33% on October 1, 2004 compared with the price a few months earlier
33.3 33.3 OECD (2006c:3)
314A. In Feb. 2004 the Turkish Antitrust Authority fined several cement producers in the Aegean Region for fixing prices during 2003-2004
The price of bagged cement in Izmir, the largest city in the Region, rose 165% faster than inflation in 2003-2004, and costs were constant
165 -- OECD (2006d:3)
314B. Same as 314A
The price of bagged cement in Izmir, the largest city in the Region, were 65% higher than the Ankara Region (yardstick) in 2003-2004
65 -- OECD (2006d:3)
315. The Korean FTC fined 4 manufacturers of toilet paper for price fixing from 1/1996 to 1/1998; after 1/96 the 4 charged identical prices; however, the Supreme Court overturned the finding of collusion from 1/96 to 7/97
Change in manufacturers’ prices from 1996 to 1/98; peak is 12/97-1/98
18.3 21.1 OECD (2006h:6)
316. El Paso Corp. and Sempra (So. Calif. Natural Gas) settled 4 civil damages actions for $1.6 billion for fixing the price of natural gas sold by pipeline in California from 9/1/1996 to 3/20/2003; El Paso was also convicted for self-dealing and price manipulation in No. Calif.
One illegal act by El Paso was purchasing pipeline capacity in 2/2000 for $38.5 million that generated $184 million in illegal profits (p.4 of Court Ruling)
378 378 Lande and Davis (2006:23-28)
317A. Bristol Myers Squibb and Schein Pharmaceutical colluded to prevent entry into the US market for the anti-anxiety drug buspirone from 11/21/00 to April 2001; after being sued, the two firms settled damages to direct purchasers ($220 mil.) and to indirectly overcharged consumers ($93 million)
Probably by econometrics, plaintiff’s expert estimated direct overcharges at $232 million for the period 11/00 to 2006; sales of drug estimated to be $2.2 billion
10.4 -- Lande and Davis
(2006:10-14), Connor (2007a)
317B. Same as 317A. ??? 69.9 -- Connor (2013)
318A. From May 1, 1998 to May 24, 1994, 37 Nasdaq market makers fixed the prices of securities, namely, the buy-sell spreads (i.e., the traders’ fees) by avoiding “odd-eighth quotes” on the stocks of four large companies; a class action representing 1.25 million plaintiffs recovered $1.027 billion in damages in 1997-98; the SEC and DOJ imposed a consent decree in 1996
A law review analyzing the case quotes an academic affidavit affirming that the settlement was 100% of damages; the DOJ press release of 7/17/96 mentions affected sales of securities of about $10 trillion (but trader’s fees, which are the better measure of sales, are much smaller)
3.3 -- Lande and Davis (2006:45-47)
318B. Same as 318A. Comparison of bid/offer spreads on four stocks before and after 5/27/94 (i.e., “after”
50 -- Christie et al. (1994)

J. M. Connor Price-Fixing Overcharges 3rd Edition February 2014
279
price) 319. During 10/92-6/93, 7 manufacturers of polypropylene carpets fixed US prices; one firm was criminally fined by the DOJ, seven paid a civil settlement in 1998
The class-action Court decision (p. 1360) cites the plaintiffs’ expert’s study (probably econometric)
8.3 -- Lande and Davis (2006:64-66)
320. In 1992 a US federal government task force discovered a 22-year (1966-1988) bid-rigging scheme by 32 manufacturers and distributors of specialty steel (stainless, nickel, and other alloys) piping purchased by the Washington State Public Power Supply System and other utilities and refineries; the ringleader and his company were criminally prosecuted and convicted at trial in 1990; a 1988 class action with 6000 plaintiffs and 31 defendants settled in 1992 for $50 million.
A decision of the 5th Circuit Court of Appeals filed 5/28/92 affirmed the criminal convictions of 6 pipe distributors and cites the price effects as facts on p. 5
20 75 Lande and Davis
(2006:94-96); 962 F.2nd 465
321A. Collusion between Abbott Laboratories and Sandoz (a Novartis subsidiary) from 4/1/98 to 8/99 raised the price of the drug terazosin hydrochloride (Hytrin brand) and prevented the launch of competing generic equivalents; a class action was settled in Feb. 2005 for $72.5 million
The Court decision approving the settlement filed 4/6/05 cites the plaintiffs’ expert’s calculation of damages (probably econometric) with approval on p. 15; sales from a newspaper article
43-63 --
Lande and Davis (2006:89-93); WSJ (2/7/00:B20); MDL
1317
321B. Same as 321A. Same as above, but new sales data 63.3 --
Connor (2013), Lande and Davis
(2006:89-93) 322A. In 10/2004 the Japan FTC discovered 70 firms involved in bid rigging 180 contracts for construction of public bridges in 2003-04; 45 firms paid $110 mil. in civil surcharges and 23 others paid $55 mil. in criminal fines, both Japanese records; 8 men received prison sentences
The Tokyo High Court ruled that overcharges totaled $78.9 million on projects costing the government $634 mil.
14.2 --
Daily Yomiuri 11/11/06:2), Jiji 11/10/06), AP
(11/10/06)
322B. Same as 322A
The ratio of winning bids to engineering estimates declined from 90% in 2003-04 to 60% after 2004
50 -- Daily Yomiuri 11/11/06:2)
323A. The first episode of the Nord-Pas-de-Calais (NPC) coal cartel in 16 Départments of northern France lasted from 1901 to 1919; 10 firms controlled 87% of the cartel’s area of dominance
No information; historical study -- -- Montant (2001:301)
323B. In 1922 a private NPC cartel was re-formed but without an punishment mechanism (cheaters’ identities were kept secret); 10 firms controlled 87% of the cartel’s area of dominance; apparently price wars were frequent; external competition came from Belgium, Germany, and the UK
Judged ineffective 0 0
Montant (2001:301-303), Caron (1988), Sauvy and Hirsch
(1984), Kemp (1972)
323C. The third episode began in 1927 when a recession caused the cartel to implement a 3-zone supply-control scheme with a more effective punishment mechanism; a 1932 agreement with the other two French coal cartels reinforced collusion; the NPC cartel lasted
Judged “effective,” but no numerical estimates 1 + --
Montant (2001:303-306), Heaulme
(1948)

J. M. Connor Price-Fixing Overcharges 3rd Edition February 2014
280
without price wars until government price controls were imposed in Aug. 1936 324A. The interwar UK coal cartel operated from 1930 to 1939 with 17 production districts; organized by statute but operated by the mine owners; 1st episode (prior to 1936) dumping across districts was common, each district set its own minimum prices, and quotas were exchanged among owners at a few pence per ton.
Judged to be ineffective during 1930-1935 0 0
Fine (1990:445); Kirby (1973:280), Marlio (1930:842)
324B. From 1936 to 1939 a national council allocated quotas to each district, eliminating dumping
Henley compares the mark-up on direct costs during 1936-39 with the mark-up before 1936
13-24 -- Henley (1988)
325. Five airlines raised the prices on the Rio de Janeiro to Sao Paulo, Brazil route in August 1999; ended sometime before Sept. 2004; fined 1% of their revenues by CADE, the Brazil antitrust authority
Simple before-and-during price comparison 10 10 UNCTAD (2005:4),
OECD 2005c:22)
326. From 4/2001 to 11/2002 two college bookstores on the campus of Indiana University-Purdue University at Indianapolis (IUPUI) fixed the prices of textbooks by eliminating discounts on books sold to students; One of the store managers was criminally convicted by the DOJ
Plea Agreement states the profit margins rose from 25 to 27% during the conspiracy
8 -- DOJ (5/10/04:3)
327A. Virtually all cement makers (100+) in Egypt fixed prices in 2002, affecting sales of $630 million; indictments of 20 company officials by new Egyptian Competition Authority 1/08 and convicted in 2008
Price rise from 2001 (before cartel agreement in 2002) 37 40
Jenny (2005:16), Financial Express
(7/5/07)
327B. Same as above, except cartels were fined illegal price fixing from 2002 to 2006.
From the decision of the court in Egypt’s first antitrust trial of executives of 8 cartel participants; cost-based method for years 2003-04
20.9 -- Decision reported by
Daily News Egypt (2008)
327C. Same as above, except cartels were fined for illegal price fixing from 2002 to 2006.
From the decision of the court in Egypt’s first antitrust trial of executives of 8 cartel participants; cost-based method for 2006
17.5 -- Decision reported by
Daily News Egypt (2008)
327d. Same as 327C. ??? 38.5 -- Connor (2013)
328. From July 2003 to Dec. 2005, 4 asphalt paving contractors rigged bids against Suffolk County and Brookhaven Town, New York; all four pleaded guilty and paid fines in 1/07
DOJ press release cites contract revenues and “restitution” (i.e., overcharge) amounts, price increase and selling price ranges
16.5 29 DOJ (12/22/2006)
329A. A large number of cement producers in Turkey colluded from 1993 to 2005, in three episodes; four investigations and two decisions to fine the cartel by the Turkish Competition Authority; first episode 1993-June 1999 when the first fine was imposed
Simple econometric model fitted to 1993-2005 data incorporates U.S. cement prices as a yardstick; year 2000 assumed to be competitive
24.6-33.6 -- Dalkir (2006:19 and
29), Dalkir (2007)
329B. Same as 329A Econometric model above is corrected for mild autocorrelation
19.8-25.2 -- Dalkir (2007)

J. M. Connor Price-Fixing Overcharges 3rd Edition February 2014
281
330A. A cartel composed of five multinational drug firms rigged one bid in Jan 2001 on a tender for diabetes (blood glucose) testing reagent strips by Coimbra Hospital in Portugal; fined by PT competition authority (PCA)
Five identical bids of €20 per package were submitted, which were increases on bids from the same firms for the identical product one year earlier
34-76 76 OECD (2005b: 24), PCA (1/11/05)
330B. Same as 330A, except the same cartel rigged 36 bids during 7/01-12/04 on tenders for diabetes (blood glucose) testing reagent strips by 22 hospitals in Portugal; fined a much higher amount by PCA
Four mostly identical bids received by Hospital de Santa Maria in Lisbon, compared to early 2001 bids for the identical product
49-91 91 PCA (10/13/05)
330C. Same as 330B. Same as above, new sales data 49-114 114 Connor (2013), PCA (10/13/05)
331. The Swedish asphalt paving cartel of 11 Swedish, Finnish, and Norwegian companies rigged bids 1995-2002 on tenders by the National Road Administration (NRA) and several municipalities; the NRA was held complicit; fined by the national antitrust authority
A survey of road-services procurement officials found a significant drop in prices of asphalt paving following the end of the cartel
25 -- OECD (2005b: 24)
332. From 2000 to 2004, 10 flour millers in Korea fixed prices; 8 of the 10 were fined by the KFTC
Appears to be the peak increase from about 1999 -- 40 Yonhap (3/3/06)
333. From 2001 to 2004 102 members of the Portuguese Assn. of Shipping Agents set “maximum” (i.e., target prices for shipping-agent services; Assn. fined by PCA in 2005
PCA decision reports “one case” (may not be typical) of a price impact from 2001 to 2002 for “assistance to the crew outside port limits”
-- 2,024 PCA (2006)
334. In 1989 the house of a Washington, DC schoolteacher was sold at public real estate auction by her court-appointed conservator; a bid-rigging ring was later convicted for lowering the house price.
The designated winner of the bid paid $22,000 for the house that was soon sold for $36,500; market sale is a yardstick
-39.7 -- Stucke (2006: 504), DOJ (1990)
335. Four companies were convicted and fined in Norway for fixing the prices of corrugated cardboard paper from 1983 to 1990; total affected sales was NOK 5.3 billion ($842 million); decision sustained on appeal to the Supreme Court
The chief economist of the Competition Authority cites an expert opinion (used by the Court?) that the overcharge was NOK70 to 80 million and the deadweight loss 30-40 million; probably econometrics
8.3-9.5 -- Sølgard (2007:14-15), Sunnevåg (2007)
336A. As many as 40 insurance companies and insurance brokers in the US and UK conspired to rig bids on commercial insurance brokers’ contingent fees paid by buyers of insurance from 1/2001 to 10/2004; civil suits by many of the state attorneys general (initiated by New York) obtained more than $3 billion in restitution and civil penalties by early 2007; fees were 0.3% to 0.4% of the insurance premiums
Several settlements mentioned the agreed restitution (single damages) and the size of the companies contingent fees
-2.9 to -6.1 --
AP (2006-07), Insurance Business
(2006-07)
336B. Same as 336A Same as above method for Prudential Ins. Co. settlement -27.5 -- AP (12/12/06)
336C. Same as 336A
One winner of a bid had a contract to pay a side payment to a loser of 10% to 15.75%; I assumed that the two divided these yardstick profits equally
-20 to -31.5 --
New York State Attorney General
(2006: 2)

J. M. Connor Price-Fixing Overcharges 3rd Edition February 2014
282
336D. Same as 336A Client A charged 19.6% more than target price (price with normal profits)
-19.6 -- New York State
Attorney General (2006: 5)
336E. Same as 336A After bid rigging, Client B charged 111% more in 8/2002 than year before
-111 -- New York State
Attorney General (2006: 5-6)
336F. Same as 336A After bid rigging, Client C charged 65% more in 10/2002 than year before
-65 -- New York State
Attorney General (2006: 7)
336G. Same as 336A
Client G charged 65% more than target price (price with normal profits) for lower quality insurance with more exclusions
-20+ -- New York State
Attorney General (2006: 8
337. Three Korean and one US petroleum company were criminally convicted and fined for fixing the prices of light oil products (Gasoline, diesel, kerosese) in Korea, 4/1/2004 to 6/10/04;
The KFTC decision estimated customer damages at $255 million on sales of $1701 million
15.0 -- Yonhap (2/23/2007)
338. Four ice cream manufacturers were fined in Korea for price fixing from May 2005 to March 2007; the 4 controlled 80% of the Korean market
The KFTC decision calculated the increase on major items from 5/05 to early 2007
-- 42.9 Yonhap (3/18/2007)
339. Two French cement manufacturers colluded on prices and entry with two local distributors and two wholesale trade associations in the Haut-Corse region of Corsica from 1977 to 2007; all six entities were fined
The decision of the Conseil de la Concurrence compared prices in Corsica with prices in the nearest Italian and Greek production areas
25 -- Conseil de
Concurrence press release (3/12/07)
340A. The authors surveyed a random sample of 495 lots at auctions of basmati rice during the Oct.-Nov.1999 season in Panipat, Hariyana, India. The auctions are oral ascending (English) bids managed by an auctioneer in a regulated market. There are many small farmers that sold lots to one large local miller and three large distant millers (CR4=55%) and to 5 to 10 additional small local millers; the 3 distant millers are represented by commission agents that (perversely) make larger fees when the large local miller withdraws from bidding on a lot and when the 3 collude on lowering the procurement price.
Controlling for quality (7 characteristics) and weeks, an econometric monopsony model of asymmetric overt collusion by bid rotation between the largest buyer and the next 3 buyers predicts the winning bid price best; numerical analysis is used to calculate the undercharge for the largest buyer when the other 3 large millers don’t bid; peak is when only 6 buyers bid
-7.1 -8.4 Banerji and
Meenakshi (2004b: Table 5)
340B. Same as 340A.
Same as 340A, except numerical analysis is used to calculate the undercharge for the the 2nd, 3rd, and 4th largest millers when the largest doesn’t bid; peak is when 13 buyers bid
-0.16 -0.23 Banerji and
Meenakshi (2004b: Table 5)
341. The authors surveyed a random sample of 421 lots at auctions of wheat during the April-May.1999 season in Nerala, Punjab, India. The auctions are oral ascending bids managed by an auctioneer in a regulated market. Many
Controlling for quality (4 characteristics) and weeks, an econometric asymmetric monopsony model of overt collusion by bid rotation
-2.2 to -2.9 -3.25
Banerji and Meenakshi (2004a:
Table 7)

J. M. Connor Price-Fixing Overcharges 3rd Edition February 2014
283
small farmers sold lots to one large local miller or two large distant millers (buyer CR4=45%) and to 6 to 13 additional small local millers; the authors compare winning prices in a bid-rotation model of overt collusion with a competitive model in which all 3 large buyers bid simultaneously.
among the 3 largest buyers; numerical analysis is used to calculate the undercharge when 2 of the 3 large millers don’t bid; mean is when there are 9 or 10 small buyers bidding; peak is when only 7 buyers bid
342A. The French Conseil de la Concurrence fined six groups the maximum possible for bid rigging on 88 tenders for construction of high schools in Ile-de-France region during 1989-1996
The Decision gives several examples of increases in profit rates from the normal industry rate; for the school at Coulommieres, France
11-15 -- Conseil de la Concurrence
(5/9/2007: 130)
342B. Same as A, except a high school at La Courneuvre, France
Same method (constant-profit-margin) as in 342A 11-14 --
Conseil de la Concurrence
(5/9/2007: 130)
342C. Same as A, except a high school at Chatenay Malabry, France
Same method (constant-profit-margin) as in 342A 11-14 --
Conseil de la Concurrence
(5/9/2007: 130)
342D. Same as A, except a high school at Sartrouville, France
Same method (constant-profit-margin) as in 342A 12-15 --
Conseil de la Concurrence
(5/9/2007: 130) 343A. Four manufacturers of acrylic glass (or polymethyl methacrylate/PMMA) were fined by the EU for price fixing from 1/1995 to 8/2005; in 2006 a U.S. class action alleged that the three largest of those four companies had fixed U.S. prices of both PMMA and the main input MMA (acetone) from 1/1995 to 12/2003
The simple mean 1995-2002 (’03-’05 NA) EU transaction price of $1.302 per kg. was divided by the 1993 and 1994 “before”prices; peak is 1995
17.3-26.4 79-93 Connor (2013) from
Bizzari (2003: 41-43)
343B. Same as 343A, except for the U.S. domestic market
The simple mean US market price 1995-2003 was $0.61 per lb., up from $0.52-$0.55 in 1993-94; peak year is 1997
17.3-19.6 29-40 Connor (2013) from
Bizzari (2003: 41-43)
343C. Same as 343A, except refers to 1995-2002 US exports
Mean export price $0.534 per lb., up from $0.45-$0.47 1993-94; peak is 1996
13.6-18.7 28-33 Connor (2013) from
Bizzari (2003: 41-43)
344A. In early 1888 U.S. manufacturers formed a national jute textile cartel and immediately made side payments to 8 small members to cease production; despite a partially successful boycott by cotton farmers, prices remained high for two seasons (fall 1888 and fall 1889); prices fell 32% in 1889 because of new entry; by 1890 cartel members controlled only 52% of the market.
But-for price is average of Jan. 1886-June 1888 71.2 71.2 (Holmes 1994)
344B. Same as 344A. But-for price is average of fall 1890 to fall 1892 76.1 76.1 (Holmes 1994)
345A. 65+ airlines raised prices of US-UK air cargo services from “as early as” 3/2002 (actually 1/2000) to 2/14/2006 by colluding on fuel surcharges, which rose 1000%, much faster than fuel costs; US guilty pleas began in July 2007
From British Airway’s fine, the minimum provable overcharge is $200 mil.on sales of $488.7 mil.
20.5+ -- DOJ (7/31/2007) guilty plea
345B. 65+ airlines raised prices of US-Korea air cargo services from 1/1/2000 to 2/14/2006 by
From Korean Air’s fine, the minimum provable overcharge 12.4+ -- DOJ (8/31/2007)
guilty plea
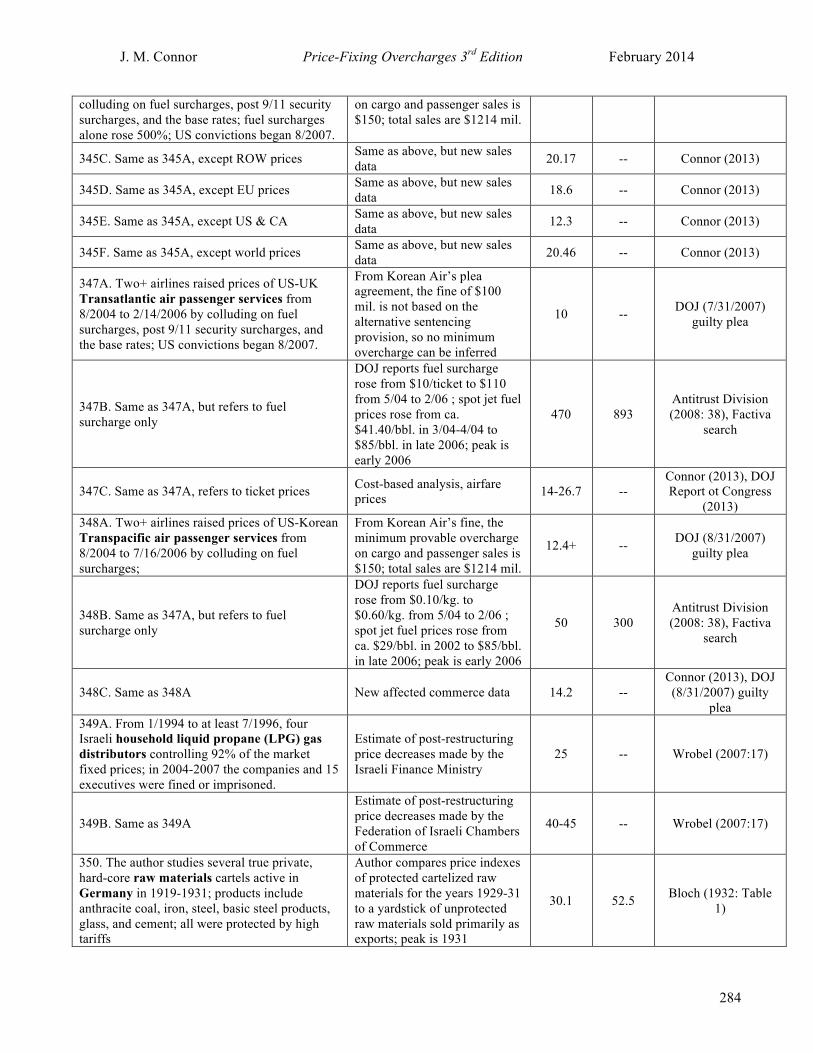
J. M. Connor Price-Fixing Overcharges 3rd Edition February 2014
284
colluding on fuel surcharges, post 9/11 security surcharges, and the base rates; fuel surcharges alone rose 500%; US convictions began 8/2007.
on cargo and passenger sales is $150; total sales are $1214 mil.
345C. Same as 345A, except ROW prices Same as above, but new sales data 20.17 -- Connor (2013)
345D. Same as 345A, except EU prices Same as above, but new sales data 18.6 -- Connor (2013)
345E. Same as 345A, except US & CA Same as above, but new sales data 12.3 -- Connor (2013)
345F. Same as 345A, except world prices Same as above, but new sales data 20.46 -- Connor (2013)
347A. Two+ airlines raised prices of US-UK Transatlantic air passenger services from 8/2004 to 2/14/2006 by colluding on fuel surcharges, post 9/11 security surcharges, and the base rates; US convictions began 8/2007.
From Korean Air’s plea agreement, the fine of $100 mil. is not based on the alternative sentencing provision, so no minimum overcharge can be inferred
10 -- DOJ (7/31/2007) guilty plea
347B. Same as 347A, but refers to fuel surcharge only
DOJ reports fuel surcharge rose from $10/ticket to $110 from 5/04 to 2/06 ; spot jet fuel prices rose from ca. $41.40/bbl. in 3/04-4/04 to $85/bbl. in late 2006; peak is early 2006
470 893 Antitrust Division (2008: 38), Factiva
search
347C. Same as 347A, refers to ticket prices Cost-based analysis, airfare prices 14-26.7 --
Connor (2013), DOJ Report ot Congress
(2013) 348A. Two+ airlines raised prices of US-Korean Transpacific air passenger services from 8/2004 to 7/16/2006 by colluding on fuel surcharges;
From Korean Air’s fine, the minimum provable overcharge on cargo and passenger sales is $150; total sales are $1214 mil.
12.4+ -- DOJ (8/31/2007) guilty plea
348B. Same as 347A, but refers to fuel surcharge only
DOJ reports fuel surcharge rose from $0.10/kg. to $0.60/kg. from 5/04 to 2/06 ; spot jet fuel prices rose from ca. $29/bbl. in 2002 to $85/bbl. in late 2006; peak is early 2006
50 300 Antitrust Division (2008: 38), Factiva
search
348C. Same as 348A New affected commerce data 14.2 -- Connor (2013), DOJ (8/31/2007) guilty
plea 349A. From 1/1994 to at least 7/1996, four Israeli household liquid propane (LPG) gas distributors controlling 92% of the market fixed prices; in 2004-2007 the companies and 15 executives were fined or imprisoned.
Estimate of post-restructuring price decreases made by the Israeli Finance Ministry
25 -- Wrobel (2007:17)
349B. Same as 349A
Estimate of post-restructuring price decreases made by the Federation of Israeli Chambers of Commerce
40-45 -- Wrobel (2007:17)
350. The author studies several true private, hard-core raw materials cartels active in Germany in 1919-1931; products include anthracite coal, iron, steel, basic steel products, glass, and cement; all were protected by high tariffs
Author compares price indexes of protected cartelized raw materials for the years 1929-31 to a yardstick of unprotected raw materials sold primarily as exports; peak is 1931
30.1 52.5 Bloch (1932: Table 1)
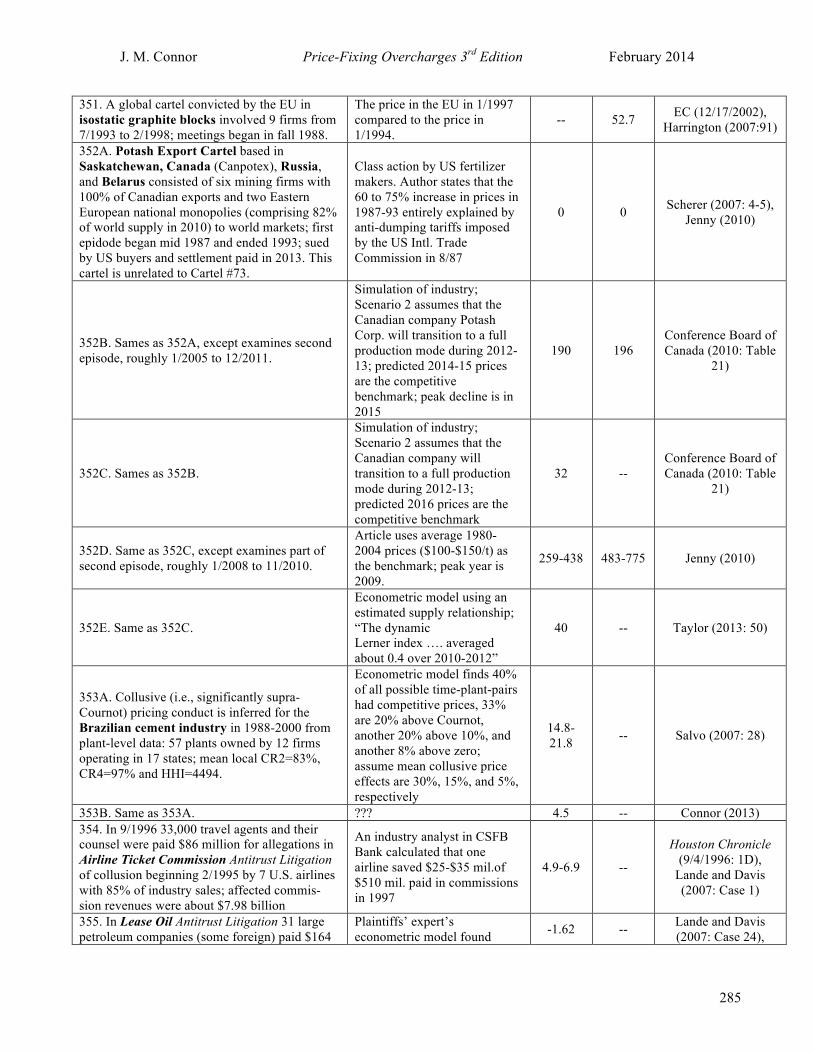
J. M. Connor Price-Fixing Overcharges 3rd Edition February 2014
285
351. A global cartel convicted by the EU in isostatic graphite blocks involved 9 firms from 7/1993 to 2/1998; meetings began in fall 1988.
The price in the EU in 1/1997 compared to the price in 1/1994.
-- 52.7 EC (12/17/2002), Harrington (2007:91)
352A. Potash Export Cartel based in Saskatchewan, Canada (Canpotex), Russia, and Belarus consisted of six mining firms with 100% of Canadian exports and two Eastern European national monopolies (comprising 82% of world supply in 2010) to world markets; first epidode began mid 1987 and ended 1993; sued by US buyers and settlement paid in 2013. This cartel is unrelated to Cartel #73.
Class action by US fertilizer makers. Author states that the 60 to 75% increase in prices in 1987-93 entirely explained by anti-dumping tariffs imposed by the US Intl. Trade Commission in 8/87
0 0 Scherer (2007: 4-5), Jenny (2010)
352B. Sames as 352A, except examines second episode, roughly 1/2005 to 12/2011.
Simulation of industry; Scenario 2 assumes that the Canadian company Potash Corp. will transition to a full production mode during 2012-13; predicted 2014-15 prices are the competitive benchmark; peak decline is in 2015
190 196 Conference Board of Canada (2010: Table
21)
352C. Sames as 352B.
Simulation of industry; Scenario 2 assumes that the Canadian company will transition to a full production mode during 2012-13; predicted 2016 prices are the competitive benchmark
32 -- Conference Board of Canada (2010: Table
21)
352D. Same as 352C, except examines part of second episode, roughly 1/2008 to 11/2010.
Article uses average 1980-2004 prices ($100-$150/t) as the benchmark; peak year is 2009.
259-438 483-775 Jenny (2010)
352E. Same as 352C.
Econometric model using an estimated supply relationship; “The dynamic Lerner index …. averaged about 0.4 over 2010-2012”
40 -- Taylor (2013: 50)
353A. Collusive (i.e., significantly supra-Cournot) pricing conduct is inferred for the Brazilian cement industry in 1988-2000 from plant-level data: 57 plants owned by 12 firms operating in 17 states; mean local CR2=83%, CR4=97% and HHI=4494.
Econometric model finds 40% of all possible time-plant-pairs had competitive prices, 33% are 20% above Cournot, another 20% above 10%, and another 8% above zero; assume mean collusive price effects are 30%, 15%, and 5%, respectively
14.8-21.8 -- Salvo (2007: 28)
353B. Same as 353A. ??? 4.5 -- Connor (2013) 354. In 9/1996 33,000 travel agents and their counsel were paid $86 million for allegations in Airline Ticket Commission Antitrust Litigation of collusion beginning 2/1995 by 7 U.S. airlines with 85% of industry sales; affected commis-sion revenues were about $7.98 billion
An industry analyst in CSFB Bank calculated that one airline saved $25-$35 mil.of $510 mil. paid in commissions in 1997
4.9-6.9 --
Houston Chronicle (9/4/1996: 1D),
Lande and Davis (2007: Case 1)
355. In Lease Oil Antitrust Litigation 31 large petroleum companies (some foreign) paid $164
Plaintiffs’ expert’s econometric model found -1.62 -- Lande and Davis
(2007: Case 24),

J. M. Connor Price-Fixing Overcharges 3rd Edition February 2014
286
million for undercharging royalty recipients by depressing the price of crude oil from 1/1986 to 1993
damages of $359 million; total royalties from Statistical Abstract of US
Connor (2007a)
356A. In Microcrystalline cellulose Antitrust Litigation US plaintiffs got a settlement from the 2 members of this 1984-95 global cartel ; medical grade US prices
Plaintiffs’ expert’s econometric model for the Pharma class
22.1 -- Lande and Davis (2007: Case 20)
356B. Same as 356A, except food grade Plaintiffs’ expert’s econometric model for the food-processing class
18.5 -- Lande and Davis (2007: Case 20)
356C. Same as 356A, except both grades’ world prices Used before price 35 -- Connor (2013)
357. Covers loan markets in the Honk Kong banking sector 1991-2002
Econometric conjectural-variations model 0 0
Hong Kong Monetary Authority
(2007) 358. Report of a decision of the Pakistan Monopoly Control Authority of a cement cartel of 16 local firms that raised prices from 10/16/98 to 2/9/99; the Ministry of Commerce intervened to cancel the restitution, allowing the cartel to continue until at least 7/2007
The Authority calculated the market overcharge of 4 billion rupees and the overcharge for each company for restitution using selling price before cartel
74 74 Mehmood (1999)
359A. The Indian jute yarn and bag industry, which dates from 1855, began restricting output as early as Feb. 1886 through late 1891 because of excess capacity. Excess capacity again developed in the early 1920s, reaching 30% by 1929, and prices fell 40% to 50% from 1925-29 to 1930-1931. The 18 members of the Indian Jute Manufacturers Assn., which controlled 90 to 97% of supply in the 1930s, reduced hours in 1930-31 by 33% compared with non-members. Fringe producers’ share rose from 3% to 9%.
The cartel had cheating and internal dissention about how to handle the fringe producers; the “doves” in the IJMA wanted to accommodate the fringe and avoid a price war; but industry output rose about 45% from 1931-32 season to 1936-37, much of it going to the fringe. Cartel ineffective in slowing price declines.
0 0 Gupta (2005)
359B. In 1933-37, the profits per loom for the “hawks” in the IJMA declined to 83% of 1929 levels and were half the levels of non-members. In March 1937, the output restrictions were lifted and prices fell to new lows in Dec. 1937-Feb. 1938. With the encouragement of the Bengal government later in 1938, the enlarged IJMA reimposed output limits in Jan. 1939
Prices in 1939 are compared to the 1937-38 price war year; the onset of WWII in 9/39 prevents an assessment of the cartel’s long-term effects.
19 -- Gupta (2005)
360. In Feb. 2000, the retail gasoline stations in Florianopolis, Brazil, through their local owners’ association, agreed to raise prices through 12/2000; companies and owners fined by CADE
An analysis of prices in the second half of 2000 by the Brazilian antitrust authority (CADE), compared to Jan. 2000 prices
20 20 Pfeiffer (2005: 3)
361A. In early August 1996, Brazil’s three larges and dominant steel manufacturers agreed to raise their prices of hot-rolled steel sheets and announced their decision to the Ministry of Finance in advance; they were fined by CADE in 1999.
An analysis by CADE ruled out changes in costs; before-and-after
3.6-4.1 -- Pfeiffer (2005: 3)
361B. Same as above, but for cold-rolled steel sheets
An analysis by CADE ruled out changes in costs; before-and-after
4.3-4.5 -- Pfeiffer (2005: 3)
362. From 2005 to 2006, at least five US, UK, An estimate of the German 5 5 BKT (2008)

J. M. Connor Price-Fixing Overcharges 3rd Edition February 2014
287
and German manufacturers of toiletries (liquid hand soap, shower gel, and toothpaste) in Germany colluded on the 2005-06 price increase; the firms and their sales executives were fined in 2/2008
Federal Cartel Office developed from direct (internal historical records) evidence
363. Nine cement companies were found guilty of bid rigging in the Jalalpur, India market from 11/24/2000 to 1/19/2001
From the decision of the Indian Monopolies and Restrictive Trade Practices Commission, apparently the before price being used
20 56 Indian Express (March 3, 2008)
364. Four pharmaceuticals distributors in South Africa were accused of bid rigging against hospitals from 1998 to 2007; fines recommended to Tribunal
Report of the Competition Commission estimated price effects from 2001, during a brief non-collusive period
10-15 -- Barbeau (2008)
365. The Korean Fair Trade Commission imposed large fines on 3 sugar refiners with 100% of the national market for colluding 1991-9/2005
KFTC staff compared the increase in 2004-05 sugar prices with a yardstick of other comparable industrial goods
20 -- KFTC (2008: 58)
366. Restitution was paid by two of 13 distributors of food in New York City who rigged bids to supply schools in the NYC Board of Education from 5/1996 to 4/1999
Total restitution sought is over $20 million on contracts worth over $200 million
10 -- DOJ (8/9/2001)
367. Procurement of many goods and services by the U.S. Defense Department in 1960s
Author compares bid prices of identical products with several versus only one bidder (sole source contracts)
50 -- Yuspeh (1976)
368. Two firms out of 4 were convicted of bid rigging tenders in construction of sewers in Klaipeda, Lithuania in 2000 worth $4.43 million;
Commission decision cites price increase based on yardstick of normal prices charged by two guilty parties and other rivals in market
22.3 22.3 OECD (2003a: 2)
369A. River boat operators between Phonom Penh and Siem Reap, Cambodia colluded on prices during ca. 2005.
Immediate increase in prices for Cambodian nationals from USD 5 to USD 10.
100 100 Bhatia (2006: 5).
369 B. Same as 369A. Note price discrimination.
Immediate increase in prices for non-Cambodian nationals from USD 5 to USD 25.
400 400 Bhatia (2006: 5).
370. “Mylan Laboratories, Inc., the nation’s second largest generic drug manufacturer, and three other companies, were charged [in 12/98] … by the Federal Trade Commission with restraint of trade, monopolization and conspiracy to monopolize the markets for two widely-prescribed anti-anxiety drugs, lorazepam and clorazepate.” Later convicted and required to disgorge profits. Span 1/98-12/98.
Report of FTC estimates average annual increase from1997 in range of 1400% to 2200%.
1400-2200 3000 FTC (1998)
371A. A knockout-auction bidding ring of 11 dealers from US, UK, France colluded against other buyers in stamp auctions from about 1980 to July 1997, mostly in New York City auction houses, but also in the UK; world prices.
A structural econometric model estimates true damages (less than half of “naïve damages,” i.e., side payments by winner) from data on 1781 lots auctioned during 6/1996-6/1997
-3.4 to -4.2 -- Asker (2008: Tables
6 and 7)
371B. Same as 371A. mean damages to sellers plus to non-bidders/mean lot value
10.1-10.4 -- Asker (2008)
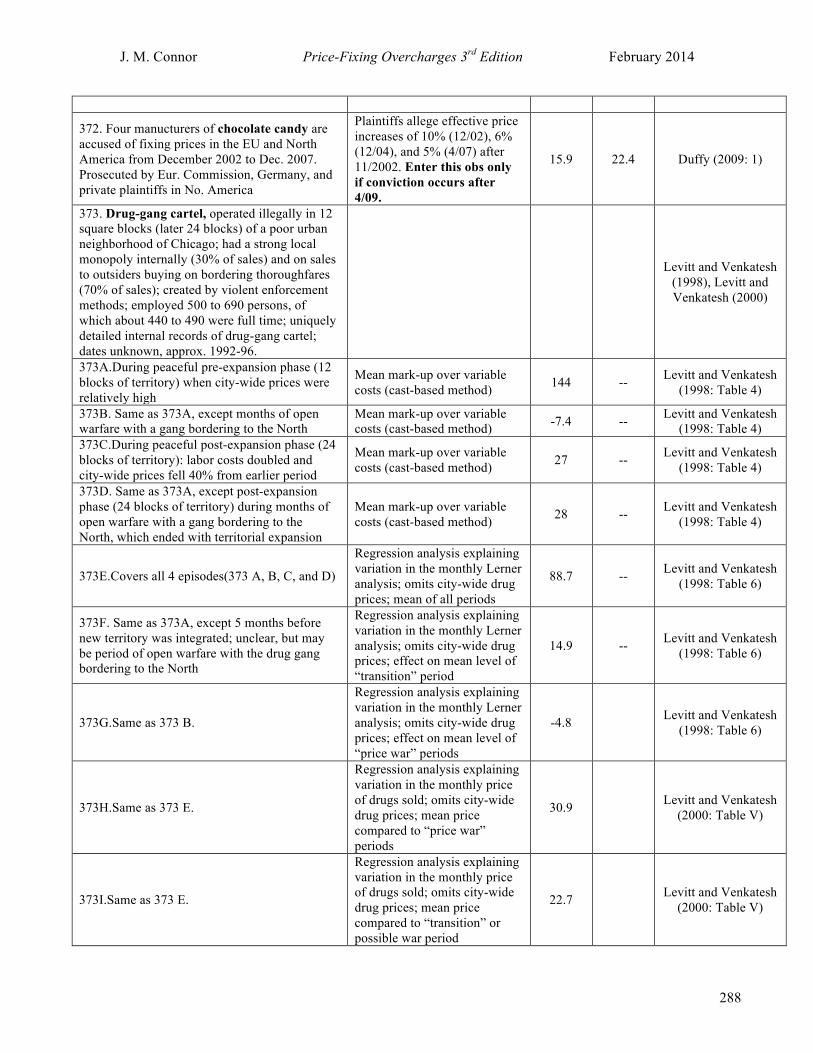
J. M. Connor Price-Fixing Overcharges 3rd Edition February 2014
288
372. Four manucturers of chocolate candy are accused of fixing prices in the EU and North America from December 2002 to Dec. 2007. Prosecuted by Eur. Commission, Germany, and private plaintiffs in No. America
Plaintiffs allege effective price increases of 10% (12/02), 6% (12/04), and 5% (4/07) after 11/2002. Enter this obs only if conviction occurs after 4/09.
15.9 22.4 Duffy (2009: 1)
373. Drug-gang cartel, operated illegally in 12 square blocks (later 24 blocks) of a poor urban neighborhood of Chicago; had a strong local monopoly internally (30% of sales) and on sales to outsiders buying on bordering thoroughfares (70% of sales); created by violent enforcement methods; employed 500 to 690 persons, of which about 440 to 490 were full time; uniquely detailed internal records of drug-gang cartel; dates unknown, approx. 1992-96.
Levitt and Venkatesh
(1998), Levitt and Venkatesh (2000)
373A.During peaceful pre-expansion phase (12 blocks of territory) when city-wide prices were relatively high
Mean mark-up over variable costs (cast-based method) 144 -- Levitt and Venkatesh
(1998: Table 4)
373B. Same as 373A, except months of open warfare with a gang bordering to the North
Mean mark-up over variable costs (cast-based method) -7.4 -- Levitt and Venkatesh
(1998: Table 4) 373C.During peaceful post-expansion phase (24 blocks of territory): labor costs doubled and city-wide prices fell 40% from earlier period
Mean mark-up over variable costs (cast-based method) 27 -- Levitt and Venkatesh
(1998: Table 4)
373D. Same as 373A, except post-expansion phase (24 blocks of territory) during months of open warfare with a gang bordering to the North, which ended with territorial expansion
Mean mark-up over variable costs (cast-based method) 28 -- Levitt and Venkatesh
(1998: Table 4)
373E.Covers all 4 episodes(373 A, B, C, and D)
Regression analysis explaining variation in the monthly Lerner analysis; omits city-wide drug prices; mean of all periods
88.7 -- Levitt and Venkatesh (1998: Table 6)
373F. Same as 373A, except 5 months before new territory was integrated; unclear, but may be period of open warfare with the drug gang bordering to the North
Regression analysis explaining variation in the monthly Lerner analysis; omits city-wide drug prices; effect on mean level of “transition” period
14.9 -- Levitt and Venkatesh (1998: Table 6)
373G.Same as 373 B.
Regression analysis explaining variation in the monthly Lerner analysis; omits city-wide drug prices; effect on mean level of “price war” periods
-4.8 Levitt and Venkatesh (1998: Table 6)
373H.Same as 373 E.
Regression analysis explaining variation in the monthly price of drugs sold; omits city-wide drug prices; mean price compared to “price war” periods
30.9 Levitt and Venkatesh (2000: Table V)
373I.Same as 373 E.
Regression analysis explaining variation in the monthly price of drugs sold; omits city-wide drug prices; mean price compared to “transition” or possible war period
22.7 Levitt and Venkatesh (2000: Table V)

J. M. Connor Price-Fixing Overcharges 3rd Edition February 2014
289
374. The Italian antitrust authority fined 6 manufacturers (1 from US) and their “mandatory consortium” that recycled batteries to extract lead; collusion occurred 2002-07
Report of the authority compared 2002-04 prices of recycled lead in IT with yardstick of same prices in UK and DE
31.8 -- AGCM (2009)
375. Lamp oil (a/k/a Illumination oil or kerosene) began to be extracted from crude petroleum in the 1850s, eventually replacing whale oil; export prices were collected starting in 1879 and domestic prices from 1885; the Standard Oil Trust was formed in 1882; though formally “dissolved” in 1892 after the Sherman Act was passed in 1890, it was found guilty of monopolization in 1911.
Jenks (1900: 150-157)
375A. In 1896-97, the Standard Oil monopoly was challenged in New York City by the entry of Pure Oil Co., which built a more efficient plant than previous independents.
The decine in the NYC price of standard-grade illuminating oil in barrels fell from $8-10 in 1895 to about $6.50 in 1896-97; trough was $5.50 in 12/1897.
19-35 31-45 Jenks (1900: 150-152 and chart)
375B. In 1899-1900, the price-cost margin between crude oil and refined oil in New York City “decidedly” increased from $4 in 1896-97 to $5 in 1899; the Trust increased its dividends 30% in each of the past 3 years; these trends are also seen in Chicago and Cincinnati.
Much of the increase in the gross margin in 1899 can be explained by the added costs of refining a broader range of products and by higher input costs, but higher profits seem to account for at least half of the margin increase since 1896-97; peak is Dec. 1899.
10 18.8 Jenks (1900: 153-155 and chart)
376A. The U.S. tin plated steel cartel (American Tin-Plate Co.), joined by all 6 to 8 major producers, began in January 1899 after a two-year period of declining profits (up to 50% by Oct. 1888); prices of imported tin plate remained about $0.40 to 0.70 above the Pittsburg price to end of 1899.
The gross margin in the industry, using the price of “American coke tin plate” in Pittsburg rose to about $1.15 to $1.20 in 1899-1900, up from $0.60-$0.85 in June-Oct. 1898; peak in Mar. 1899.
35-100 117 Jenks (1900: 157-164 and chart)
376B. Author shows that tin-plate-industry-cartel prices are by mark-ups over import price + tariff -- almost exactly -- as tariffs change; pricing began before cartel officially formed.
Compares actual NY wholesale prices/lb. 1891-99 of 14x20 tin plated sheets with pre-tarrif import prices as yardstick; peak is 1884
52 81 U.S. Industrial
Commission (1901: 557-59)
377A. In January 1899, the the Am. Steel and Wire Co. trust was formed, which controlled 65 to 95% of the US market for barbed steel wire. The gross margin increased from about $1.00 in 1898 to $1.50 to $2.00 in 1899, in part because of the ownership of patents; peak was $2.00 in Oct. 1899; ended 12/1899.
The price increased from about $1.60 to $1.70 in 1898 to $2.50 to $3.00 in 1899; peak was $3.00 in Oct. 1899.
47-88 88 Jenks (1900:165-170 and chart)
377B. Same as 377A, except that 2nd episode began when, in response to rapidly falling prices in early 1900 (about 25%), the Wire Trust closed several of its mills; produers outside the Trust followed with closures of ther own; gross margins rose well above 1897-98 levels and remained high until mid 1915.
Prices of barbed wire stabilized in 4/1900, declining very slowly until the end of 1914; competitive bench mark is 1897-98 prices; peak is 1/1991-8/1902.
233 287 Jenks and Clark
(1929: 119-122 and chart)

J. M. Connor Price-Fixing Overcharges 3rd Edition February 2014
290
378. In January 1899, the the Am. Steel and Wire Co. trust was formed, which controlled 65 to 95% of the US market for smooth steel wire. The gross margin increased from about $0.50 in 1898 to $1.50 to $2.00 in 1899; peak was $2.00 in Oct. 1899.
The price increased from about $1.12 in 1898 to $2.00 to $2.95 in 1899; peak was $2.95 in Oct. 1899.
79-163 163 Jenks (1900:165-170 and chart)
379. A European centered global borax cartel was formed in 1878-79 and operated until Jan. 1899. Fitfull collusion occurred in the US from 1878; a US monopoly (Pacific Borax a/k/a the Borax Trust) was formed about 1888. Prior to 1894, U.S. producers had an understanding with the European cartels: a US monopoly for Pacific Borax and the rest of the world for the Europeans. In 1894, a US tariff reduction sparked aggressive warfare by Pacific Borax on the European cartel.In June 1896, a joint US-UK borax company was formed by Pacific Borax. The Europeans capitulated in Jan. 1899, selling all their assets to the Borax Consolidated Works trust (a UK company) of 12 companies, a global near monopoly that collapsed in 1913, but came out of bankruptcy as a public UK company. By 1980, U.S. Borax had become part of Rio Tinto Group.
To obtain a competitive price, one can chart changes in the delivered New York price of refined borax as the US import tariff varied from 5¢ (9/1890 to 8/27/1894), to2¢ (8/28/1894 to 8/1997), to 5¢ (9/1897 to late 1999). After a few months of adjustment and near the end of these three periods, the US price settled down to 8.25¢, 5.25¢, and 7.25¢, respectively. Pacific Borax was known to mark up to the import price (the yardstick) plus the tariff. Thus, the competitive price ranged from 2.25¢ to 3.25¢ and was falling during the 1890s. Pierce and Holt also conclude that 2.25 to 3¢ is the competitive price.
U.S. Industrial Commission (1901:
567-570), Holt (1907: 223- 224), Pierce (1913: 63-
65), Rothwell (1893-1921)
379A. For the period 9/1890 - 8/27/1894 Same as above; peak 10/1890 165-282 322
U.S. Industrial Commission (1901: 567-570), Rothwell
(1893-1921)
379B. For the period 8/28/1894 -8/1897 Same as above; peak 9/1894 77-156 211
U.S. Industrial Commission (1901: 567-570), Rothwell
(1893-1921)
379C. For the period 9/1897- 12/1899 Same as above; peak is 1999 115-211 222
U.S. Industrial Commission (1901: 567-570), Rothwell
(1893-1921) 380A. The U.S. window glass cartel began in 1880-1892 (1st episode) as the Window Glass Manufacturers’ Assn.; set prices, plant output, and wages; fell apart 1893-95
No prices, but deemed “very effective” -- --
U.S. Industrial Commission (1901:
564-566)
380B. Am. Glass Co. trust re-formed 1895; a selling pool for 85% of US production until Oct. 1999 when succeeded by Am. Window Glass Co.; pool made very high profits 1896-98; ended 1899; import duties 80-100% of import price.
Price of glass in 1893 relative to 1896-99 100 100
U.S. Industrial Commission (1901:
564-566)
381. Two South Korean manufactuers (one and affiliate of St. Gobain of France) of flat glass with 84% of the national market fixed prices from 11/2006 to 3/2009
KFTC decision uses before method 40-50 -- Yoon (2009)
382A. Nine companies with with extensive, hidden cross-ownership colluded on mobile telephone service rates in Indonesia from 2003
The KPPU compared actual rates on purchases by consumers with a yardstick:
119-207 -- KPPU Decision
(2007), Jarkarta Post (2007)

J. M. Connor Price-Fixing Overcharges 3rd Edition February 2014
291
to 2006; the Indonesian antitrust authority KPPU fined all 9 the maximum possible in November 2007.
average prices of the same services in nearby countries in Southeast Asia.
382B. Same as 382A. Same as above, but re-decided after adverse Court decision 11.1 -- KPPU Decision
(8/20/2010) 383. The UK bleaching powder industry was centered in Lancashire in the 19th cent.; major input was mined salt, converted to chlorine with the LeBlanc process; exports to US were only source of bleach until 1897 when two US chemical firms (Dow Chemical and Mathieson Alkali) began production using a new low-cost electrolytic production method; two more US producers entered industry in 1906 and 1908.
Barker and Harris (1993), McCrosty (1907), Levenstein
(1995: 595-601)
383A. In response to falling prices, Lancashire Bleaching Powder Manufactures’ Assn. formed in 1883, dissolved in Dec. 1889; aggressively bought or drove entrants out of business.
Prices rose to £7 per ton in 1884 from £3 7s. 6d. in 1883 -- 107 Barker and Harris
(1993: 440-444)
383B. In Feb. 1891 UK manufacturers merged to form the United Alkali (predecessor of ICI) cartelcartel ceased to be effective around 1897-98
Prices rose during October from £5 to £6 per ton 20 20 McCrosty (1907:
187-188)
383C. Same as 383B
In 1898, German producers adopted the electrolytic method and exported to UK; prices fell from £6.35 in 1897 to £4 in 1903-05
59 -- McCrosty (1907: 192)
383D. In late 1899 or early 1900 a new unnamed syndicate was formed that lasted until at least 1905; colluded with German cartel.on exports to US (possibly combining German manufacture with UK cartel’s US distributors)
Prices in late 1900 to 1902, compared to 1898-99 when no cartels existed
26 -- McCrosty (1907:
141-143), Levenstein (1995: 597-98)
383E. Same as 383D US prices declined from $1.75 in 1901 to $1.50 in 1911 17 -- Levenstein (1995:
595 fn. 67) 384. When the Lancashire bleaching powder cartel operated (1883-1889), a US distribution monopoly was given to New York’s James Lee & Co.
The US price in 1881 was $1.07/cwt., but rose to $2.25 in 1891
111 -- Levenstein (1995: 595 fn. 67)
385A. Three manufactutres of the chemical intermediate MCAA (monochloroacetic acid) held a 53-55% global share (and 90%+ EU share) operated several episodes of a global cartel from the late 1970s to May 1999; this first episode in EU began about Jan. 1984, ended Dec. 1992.
After constant 1984-89 prices, there was a decline in EU prices in 1/91-12/92 (1993 after price) due to a new plant opening; peak is 1984-89.
15.2 18.1 EC Decision (1/19/2005: §2.3.3)
385B. Same as 385A, except a 4th company joined the EU cartel and the cartel began improved monitoring of sales data; episode is 1/1994-5/1999
There was a low price in EU in 1993 (before price) due to a new plant opening; peak is 1997
15.6 21.2 EC Decision (1/19/2005: §2.3.3)
385C. Same as 385A+B for world Econometric trade model of short-run (1 to 2 years) price effects after cartel collapses.
12.2-31.1 -- Levenstein et al.
(2011: Table 4 and 5)
385D. Same as 385C Econometric trade model of long-run (3 to 4 years) price effects after cartel collapses.
25.4-30.1 -- Levenstein et al.
(2011: Table 4 and 5)
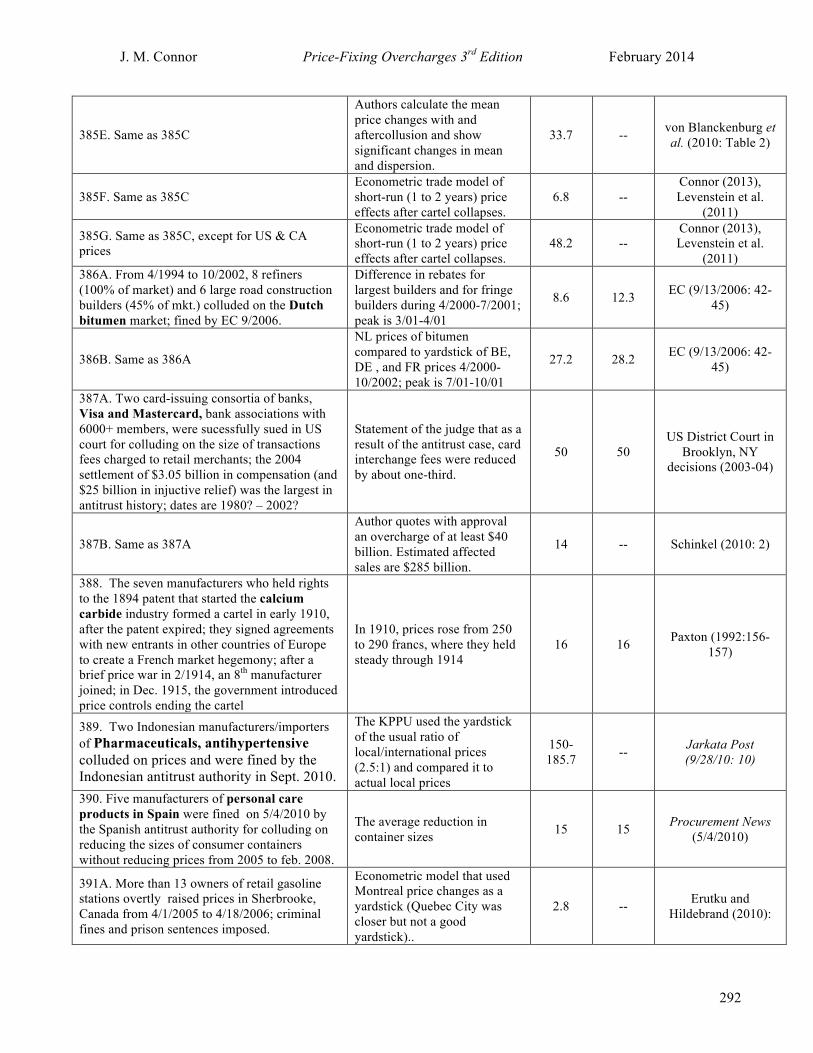
J. M. Connor Price-Fixing Overcharges 3rd Edition February 2014
292
385E. Same as 385C
Authors calculate the mean price changes with and aftercollusion and show significant changes in mean and dispersion.
33.7 -- von Blanckenburg et al. (2010: Table 2)
385F. Same as 385C Econometric trade model of short-run (1 to 2 years) price effects after cartel collapses.
6.8 -- Connor (2013), Levenstein et al.
(2011)
385G. Same as 385C, except for US & CA prices
Econometric trade model of short-run (1 to 2 years) price effects after cartel collapses.
48.2 -- Connor (2013), Levenstein et al.
(2011) 386A. From 4/1994 to 10/2002, 8 refiners (100% of market) and 6 large road construction builders (45% of mkt.) colluded on the Dutch bitumen market; fined by EC 9/2006.
Difference in rebates for largest builders and for fringe builders during 4/2000-7/2001; peak is 3/01-4/01
8.6 12.3 EC (9/13/2006: 42-45)
386B. Same as 386A
NL prices of bitumen compared to yardstick of BE, DE , and FR prices 4/2000-10/2002; peak is 7/01-10/01
27.2 28.2 EC (9/13/2006: 42-45)
387A. Two card-issuing consortia of banks, Visa and Mastercard, bank associations with 6000+ members, were sucessfully sued in US court for colluding on the size of transactions fees charged to retail merchants; the 2004 settlement of $3.05 billion in compensation (and $25 billion in injuctive relief) was the largest in antitrust history; dates are 1980? – 2002?
Statement of the judge that as a result of the antitrust case, card interchange fees were reduced by about one-third.
50 50 US District Court in
Brooklyn, NY decisions (2003-04)
387B. Same as 387A
Author quotes with approval an overcharge of at least $40 billion. Estimated affected sales are $285 billion.
14 -- Schinkel (2010: 2)
388. The seven manufacturers who held rights to the 1894 patent that started the calcium carbide industry formed a cartel in early 1910, after the patent expired; they signed agreements with new entrants in other countries of Europe to create a French market hegemony; after a brief price war in 2/1914, an 8th manufacturer joined; in Dec. 1915, the government introduced price controls ending the cartel
In 1910, prices rose from 250 to 290 francs, where they held steady through 1914
16 16 Paxton (1992:156-157)
389. Two Indonesian manufacturers/importers of Pharmaceuticals, antihypertensive colluded on prices and were fined by the Indonesian antitrust authority in Sept. 2010.
The KPPU used the yardstick of the usual ratio of local/international prices (2.5:1) and compared it to actual local prices
150-185.7 -- Jarkata Post
(9/28/10: 10)
390. Five manufacturers of personal care products in Spain were fined on 5/4/2010 by the Spanish antitrust authority for colluding on reducing the sizes of consumer containers without reducing prices from 2005 to feb. 2008.
The average reduction in container sizes 15 15 Procurement News
(5/4/2010)
391A. More than 13 owners of retail gasoline stations overtly raised prices in Sherbrooke, Canada from 4/1/2005 to 4/18/2006; criminal fines and prison sentences imposed.
Econometric model that used Montreal price changes as a yardstick (Quebec City was closer but not a good yardstick)..
2.8 -- Erutku and Hildebrand (2010):

J. M. Connor Price-Fixing Overcharges 3rd Edition February 2014
293
391B. Same as 391A, except authors employ station-level price data and focus on the role of telephonic communication in four towns in Quebec (Sherbrooke included); these estimates refer to the Bilodeau-led cartel.
Econometric model estimates the absolute value of the decline in margins (2.73 cents per liter) after the announcement of a federal investigation; base is avg. price in Sherbrooke "before" 9 sucessful episodes
2.8 -- Clark and Houde (2011: 20, 40, and
43)
391C. Same as 391A, except authors employ station-level price data and focus on the role of telephonic communication in four towns in Quebec (Sherbrooke included); these estimates refer to the Bourassa-led cartel.
Econometric model estimates the decline in margins (0.67 cents per liter) after the announcement of a fed base is avg. price in Sherbrooke "before" 9 sucessful episodes eral investigation;
0.7 -- Clark and Houde (2011: 20, 40, and
43)
392. A farmers' marketing cooperatve, United Fresh Potato Growers of Idaho, was formed in Nov. 2004 and controls 85% of fresh Idaho potato supply.
Econometric models (ARCH and GARCH) predict price increases after 1994 and after production cost increases
56-60 -- Bolotova (2009),
Bolotova et al. (2008, 2010)
393. In 1995 a cartel of chicken producers was formed in the Lima-Callao region of Peru; in Jan. 1997 the national competition authority FCC fined 21 firms for illegal supply reduction.
Econometric model with many food substitutes underpredicts the actual price during the collusive period; result from the most conservative model shown
2 -- Pirola (2003: 420
394A. Three manufacturers of roasted coffee in Germany are alleged to have colluded from 1/1976 to 6/2008; large fines imposed by the Federal Cartell Office in 2010
Authors calculate the mean price changes with and after collusion and show significant changes in dispersion, though not in mean.
4.5 -- von Blanckenburg et al. (2010: Table 2)
394B. Same as 394A Direct estimate of FCO officials 35.4 -- Federal Cartel Office
(12/23/2009)
395. Eight manufacturers of copper plumbing tubes and fittings in EU colluded from 5/1988 to 3/2001; large fines imposed by the EC
Authors calculate the mean price changes with and after collusion and show significant changes in dispersion, though not in mean.
91.5 -- von Blanckenburg et al. (2010: Table 2)
396. Ten manufacturers of gas-insulated electric power switchgear colluded globally from 1988 to 2004; large fines imposed by the EC
Authors calculate the mean price changes with and after collusion and show significant changes in dispersion, though not in mean.
6.1 -- von Blanckenburg et al. (2010: Table 2)
397A. Eight manufacturers of hydrogen peroxide colluded globally from 1/1994 to 12/2000; large fines imposed by the EC
Authors calculate the mean price changes with and after collusion and show significant changes in mean and dispersion.
35.2 -- von Blanckenburg et al. (2010: Table 2)
397B. Same as 397A Probably same as above 50.0 -- Connor (2013)
398. Six manufacturers of marine plastic hoses colluded glogally from 1986 to 2007; large fines imposed by the EC and US; price effects for EU.
Authors calculate the mean price changes with and after collusion and find no significant changes in dispersion.
0 -- von Blankenburg et al. (2010: Table 2)
399. Four manufacturers of plasterboard in EU colluded from 1992 to 1998; large fines imposed
Authors calculate the mean price changes with and without 0 -- von Blanckenburg et
al. (2010: Table 2)

J. M. Connor Price-Fixing Overcharges 3rd Edition February 2014
294
by the EC collusion and show significant changes in dispersion, though not in mean.
400. Thirteen manufacturers of plastic industrial bags in EU colluded from 1/1982 to 6/202; large fines imposed by the EC
Authors calculate the mean price changes with and without collusion and show significant changes in dispersion, though not in mean.
0 -- von Blanckenburg et al. (2010: Table 2)
401A. Seven manufacturers of nitrile synthetic rubber colluded globally from 1/2004 to 10/2007; large fines imposed by the US & EC
IISR survey of members’ prices, relative to before price 15.2 --
International Institute of Synthetic Rubber
Producers, Inc. (2004)
401B. Same as 401A, except No. America
IISR survey of members’ prices, relative to before price 26.0 --
International Institute of Synthetic Rubber
Producers, Inc. (2004)
401C. Same as 401A, except EU
IISR survey of members’ prices, relative to before price 81.4 --
International Institute of Synthetic Rubber
Producers, Inc. (2004)
401D. Same as 401A, except ROW
IISR survey of members’ prices, relative to before price 4.1 --
International Institute of Synthetic Rubber
Producers, Inc. (2004)
402. seven manufacturers of synthetic rubbers (nitrile and polychlorene) in EU colluded from 5/1996 to 11/2002; large fines imposed by the EC
Authors calculate the mean price changes with and without collusion and show significant changes in dispersion, though not in mean.
24.9 -- von Blanckenburg et al. (2010: Table 2)
403. From Jan. 1993 to Dec. 2000, five manufacturers (with 90%+ of market) of Automotive refinishing paints, US colluded on paints sold to thousands of small auto repair shops; they did not collude on paint sold to Original Equipment Manufacturers (OEMs); US DOJ investigated but did not fine; cartel members settled civil case in 2003-04
US Producer Price index for other auto paints is compared to yardstick of PPI for auto paints sold to OEMs; cartel ineffective in raising prices from 1993-96; average effect during 1996-2000, peak is 1999-2000.
17.8 40 Connor (2007)
404. During the First World War, the Australian government established the Commonwealth Line to combat the high prices of several British cartels (“The Conference Combine”) in Shipping, Europe-Australian wheat; it operated independently during 1919-1921, but eventually after predatory boycotts, in 1922 the Line was forced to join the Conference Combine.
In 1919, the Commonwealth Line charged much less than the British Conference Combine for wheat shipped from Australia to the UK
53.3 -- Tsokhas (1997 : 361)
405A. After the EC instituted anti-dumping measures to protect the EU’s chemical industries from Japanse imports, 17 firms and their subsidiaries colluded on EU prices of low density polyethylene plastic (ldPE) from 1976 to 1985, but Messerlin focuses on the 6/1983 to 9/1984 episode during which share agreements were reached; EC fines were imposed in 1988
The minimum estimate; compares EU market prices with benchmark of 6/1981 to 5/1982 avg. prices, before anti-dumping proceedings public; peak is 12/83-3/84
3.0 3.5 Messerlin (1990: Table 6)
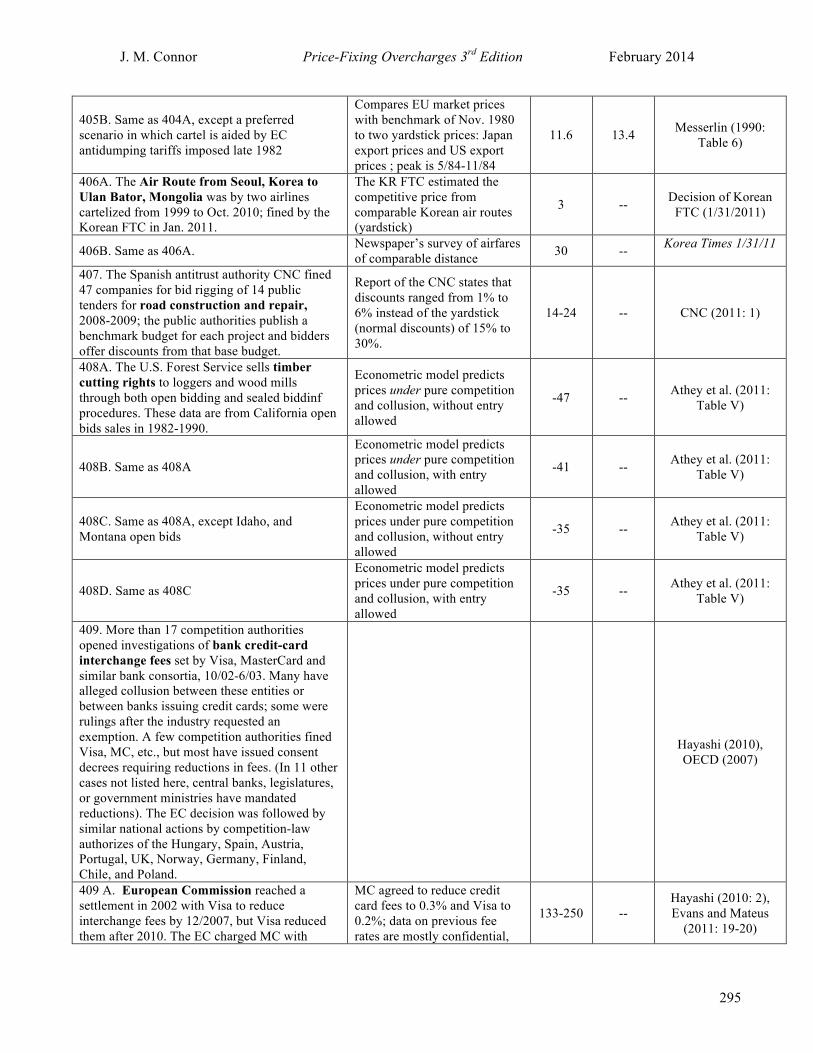
J. M. Connor Price-Fixing Overcharges 3rd Edition February 2014
295
405B. Same as 404A, except a preferred scenario in which cartel is aided by EC antidumping tariffs imposed late 1982
Compares EU market prices with benchmark of Nov. 1980 to two yardstick prices: Japan export prices and US export prices ; peak is 5/84-11/84
11.6 13.4 Messerlin (1990: Table 6)
406A. The Air Route from Seoul, Korea to Ulan Bator, Mongolia was by two airlines cartelized from 1999 to Oct. 2010; fined by the Korean FTC in Jan. 2011.
The KR FTC estimated the competitive price from comparable Korean air routes (yardstick)
3 -- Decision of Korean FTC (1/31/2011)
406B. Same as 406A. Newspaper’s survey of airfares of comparable distance 30 -- Korea Times 1/31/11
407. The Spanish antitrust authority CNC fined 47 companies for bid rigging of 14 public tenders for road construction and repair, 2008-2009; the public authorities publish a benchmark budget for each project and bidders offer discounts from that base budget.
Report of the CNC states that discounts ranged from 1% to 6% instead of the yardstick (normal discounts) of 15% to 30%.
14-24 -- CNC (2011: 1)
408A. The U.S. Forest Service sells timber cutting rights to loggers and wood mills through both open bidding and sealed biddinf procedures. These data are from California open bids sales in 1982-1990.
Econometric model predicts prices under pure competition and collusion, without entry allowed
-47 -- Athey et al. (2011: Table V)
408B. Same as 408A
Econometric model predicts prices under pure competition and collusion, with entry allowed
-41 -- Athey et al. (2011: Table V)
408C. Same as 408A, except Idaho, and Montana open bids
Econometric model predicts prices under pure competition and collusion, without entry allowed
-35 -- Athey et al. (2011: Table V)
408D. Same as 408C
Econometric model predicts prices under pure competition and collusion, with entry allowed
-35 -- Athey et al. (2011: Table V)
409. More than 17 competition authorities opened investigations of bank credit-card interchange fees set by Visa, MasterCard and similar bank consortia, 10/02-6/03. Many have alleged collusion between these entities or between banks issuing credit cards; some were rulings after the industry requested an exemption. A few competition authorities fined Visa, MC, etc., but most have issued consent decrees requiring reductions in fees. (In 11 other cases not listed here, central banks, legislatures, or government ministries have mandated reductions). The EC decision was followed by similar national actions by competition-law authorizes of the Hungary, Spain, Austria, Portugal, UK, Norway, Germany, Finland, Chile, and Poland.
Hayashi (2010), OECD (2007)
409 A. European Commission reached a settlement in 2002 with Visa to reduce interchange fees by 12/2007, but Visa reduced them after 2010. The EC charged MC with
MC agreed to reduce credit card fees to 0.3% and Visa to 0.2%; data on previous fee rates are mostly confidential,
133-250 -- Hayashi (2010: 2), Evans and Mateus
(2011: 19-20)

J. M. Connor Price-Fixing Overcharges 3rd Edition February 2014
296
illegal price fixing in 12/2007, but while it was under appeal, they settled in 4/2009.
but industry insiders said that they averaged about 0.7%.
409 B. Same as 409A. European Commission reached a settlement in 2002 with Visa to reduce interchange fees by 12/2007, but Visa reduced them after 2010. The EC charged MC with illegal price fixing in 12/2007, but while it was under appeal, they settled in 4/2009.
Evans and Mateus state that the average EU reduction in fees was 60% (“after” price)
133 -- Hayashi (2010: 2), Evans and Mateus
(2011: 19-20)
409 C. Same as 409A, except Australia. The Australian antitrust authority (ACCC) began investigating these fees as a competition-law violation, but relinquished it to the Reserve Bank of Australia in 2003, which imposed a cost-based fee in that year
Evans and Mateus report that the average fee fell from 0.95% to 0.55% (“after” price)
172 --
Hayashi (2010: 1), Bos (2006), Evans and Mateus (2011:
28)
409 D. Same as 409A, except Israel. In 2001 the Antitrust Authority investigated a restrictive agreement in Israel’s highly concentrated credit card industry; seems to have been a civil action; in 2006 a settlement was reached to lower fees.
Interchange fees were reduced through a settlement negotiation from 1.25% to 0.875%
42.9 -- Hayashi (2010: 3), Gilo and Spiegel
(2005)
409 E. Same as 409A, except Spain. In 2005 the Antitrust Authority (CNC) investigated a restrictive agreement in Spain’s highly concentrated credit card industry; seems to have been a civil action; in 12/2005 a settlement was reached to lower fees by the end of 2008.
Interchange fees were reduced through a settlement negotiation from 2.32% maximum to 1.1%
111 -- Hayashi (2010: 4)
409F. US, “Wal-Mart” case, U.S., 10/1992-6/2003; U.S. settlement; refers to change in total banking revenues
Fees during collusion compared to after conviction 3.53 ---
Affected sales from Connor (2013),
Packaged Facts (Jan. 2008)
409G. US; “AMEX-Discover” case; U.S., 10/1992-6/2003; refers to change in total banking revenues
Fees during collusion compared to after conviction 3.53 --
Affected sales from Connor (2013),
Packaged Facts (Jan. 2008)
409H. US; “Merchant Discount” case; U.S., 2004-2011; settlement; refers to change in total banking revenues
Fees during collusion compared to after conviction 1.6 ---
Affected sales from Connor (2013),
Packaged Facts (Jan. 2008)
409I. Korea 1; 1990-12/2005; fines KFTC analysis 0.94 -- KFTC Decision (3/14/01)
409J. Korea 3; 2004-2011; fines KFTC analysis 25 --- KFTC Decision (11/20/11)
409K. Australia; 4/2004-3/2005; consent agreement; changes in fees
Reporting on action of RBA (AU central bank) 72.7 -- Hayashi (2010)
409L. Spain;1990-12/2005; changes in fees Antitrust Authority mandate 52.6 --- Hayashi (2010) 409M. Israel; 1998-2006; changes in fees Antitrust Authority mandate 24.5 -- Hayashi (2010)
409N. EU; 1985-4/2010 EC mandate 57.7-73.2 --- Evans and Mateus
(2011)
409 O. Same as 409 E (Spain).
Interchange fees were reduced using a competitive costs approach through a mandate from 1.40% in 1/2006 to 0.35% in 12/2009
200 -- Carbó-Valverde et al (2011)
409 P. Same as 409A, except Switzerland. In 2005 the Antitrust Authority investigated a restrictive agreement in Switzerland’s highly
Interchange fees were reduced through a settlement negotiation from 1.65 to 1.70%
22-31 -- Hayashi (2010: 4), OECD (2013: 117-
118)

J. M. Connor Price-Fixing Overcharges 3rd Edition February 2014
297
concentrated credit card industry; seems to have been a civil action; in 2005 a settlement was reached to lower fees.
range to 1.30-1.35%
409 Q. Same as 409A; refers to fees Fees during collusion compared to after conviction 172 -- Bos (2006)
410. More than 9 competition authorities opened investigations of bank debit-card interchange fees set by Visa, MasterCard and similar bank consortia, 1990-2005. Many have alleged collusion between these entities or between banks issuing credit cards. A few competition authorities fined Visa, MC, etc., but most have issued consent decrees requiring reductions in fees. (In other cases not listed here, central banks, legislatures, or government ministries have mandated reductions)
Hayashi (2010)
410 A. European Commission reached a settlement in 2002 with Visa to reduce interchange fees in EU by 12/2007, but Visa delayed reducing them until after 2010. The EC charged MC with illegal price fixing in 12/2007 and MC settled in 4/2009.
MC and Visa agreed to reduce debit card fees to 0.2%; data on previous fee rates are mostly confidential, but industry insiders said that they averaged about 0.5%.
150 -- Hayashi (2010: 2), Evans and Mateus
(2011: 19-20)
410 B. European Commission reached a settlement in 2002 with Visa to reduce interchange fees in EU by 12/2007, but Visa reduced them after 2010. The EC charged MC with illegal price fixing in 12/2007 and they settle in 4/2009.
Evans and Mateus state that the average EU reduction in fees was 57%
132.6 -- Hayashi (2010: 2), Evans and Mateus
(2011: 19-20)
410 C. In mid 1990s, the Canadian Bureau of Competition issued a consent order reducing fees to zero, i,e, the LR Marginal Cost was judged by the Bureau to be zero ($0.00).
Reduction to zero from any positive collusive level to zero implies an infinite mark-up.
Infinity infinity Hayashi (2010: 1), OECD (2013: 9-13)
410D. Same as 410, except Spain, beginning date unknown; consent agreement 12/2005
Probably after-decree decline in rates. 51.4 --
Hayashi (2010) or Carbo-Valverde et al.
(2011)
411 A. At least eight and possibly 12 manufacturers of large liquid crystal display panels (LCDs), located in Japan, Korea, and Taiwan, colluded worldwide on the selling pries of panels used in computer monitors, notebook computers, and possibly TV screens from at least April 2001 to September 2006; bid rigging of purchasers that assembled computers, monitors, and large TVs was a common form of conduct.
The jury accepted the testimony of the U.S. Government’s expert economist when it rendered a guilty verdict against AU Optronics in March 2012. He calcutated that U.S. overcharges of the six largest cartel members were much greater than $500 million and later says “The overcharges are certainly in excess of $2 billion.” AUO’s affected U.S. commerce was $23.5 billion.
8.5+ -- Leffler (2012: 3282, 3378, 3380)
411 B. Same as 411 A, except that Leffler refers only to the first and last 6 months of the conspriacy. Trade magazines say the industry was growing at 15% to 20% per year, which implies US affected commerce of about $3.4 to $4.3 billion.
He calcutated that U.S. overcharges of the six largest cartel members were greater than $500 million. In that 12-month period
11.6-14.7 -- Leffler (2012: 3282,
3378, 3380)

J. M. Connor Price-Fixing Overcharges 3rd Edition February 2014
298
411 C. Same as 411 A.
“I have reached the opinions that the Crystal Meeting conspiracy was effective in raising prices above the competitive levels; that, as a result, the Crystal Meeting participants overcharged purchasers by over $12 billion."
51.1 + -- Leffler (2012: 3263)
412. A study of all Maritime Shipping liner-conferences imports into the US, for the year 1998 (the year TACA was fined by the EC), excluding tramp and tanker services. Authors found that national trade restrictions raised import prices by only 8%.
Econometric estimation of a sub-sample 99,000 shipments ($8.325 billion) with a dummy variable for liner-conference shipments
24 -- Fink et al. (2002: 101)
413. In 328-326 BC, during wartime, several Athenian wholesale grain merchants formed a trade association to collude on bids made to importers of grain at Athen’s port (a buyers’ cartel). In 326 they were convicted of price fixing by a jury at a public trial and sentenced to death. The prosecutor’s famous speech survived. Undrchsrge shown as a positive percentage.
The prosecutor charged, and the defendants did not dispute, that their gross margins (monopoly profits) increased 500% during the collusive period compared to pre-cartel times. Based on grain-marketing conditions in low-income countries today, Connor assumes that normal gross margins were 5% to 33% of costs of grain purchased.
24 to 49 -- Connor (2007c: 2-6)
414. In antitrust litigation in a U.S. court, the judge cites evidence that supports certifying the plaintiff’s contention that high fructose corn syrup may have been overpriced due to a five-firm cartel during 1989-1995.
Price “was up $3/cwt….” during the conspiracy and fell to $13.40/cwt. in 1996 after the cartel ceased.
22.4 -- Mihm (2003:24)
415. Evidence of at least three episodes of nationwide collusion in the Indian cement market by major producers from 2/1994 to 12/2009. India Competition Commission levied historic fines on 11 firms with 70%+ of market in 2012.
Sylwester Beyger (2012), CCI (2012)
415 A. From as early as 4/1999 to 6/1996.
Using the approximate avg. weekly wholesale price index for cement during collusion relative to the competitive period after (2001-2002).
0 -- Bejger (2012: Fig 1 and p. 14)
415 B. From 1/2000 to 7/2001.
Using the approximate avg. weekly wholesale price index for cement during collusion relative to the competitive period before (2001-2002).
20 -- Bejger (2012: Fig 1 and p. 14)
415 C. From 7/2006 to at least as late as 12/2009.
Using the approximate avg. weekly wholesale price index for cement during collusion relative to the competitive period before (2006).
50 -- Bejger (2012: Fig 1 and p. 14)
415 D. From 12/2005 to at least 12/2006, part of 415C.
Using the approximate avg. national wholesale price 45-84 -- CCI (2012: 2)

J. M. Connor Price-Fixing Overcharges 3rd Edition February 2014
299
increase for cement during collusion relative, and evidence that costs were constant.
416. A bidding ring of five dealers at a UK Antiques Auction in Leamington near London in 1964 suppressed the price of an antique mohogany Chippendale commode. No legal action mentioned or likely.
The object sold at auction for £750 and was resold the same evening at a dealers-only Knockout sale for £4350; it later sold to at retail for £10,000
480 -- Cassaday (1967: 181)
417A. Two suppliers (1 US, 1DE) of rock salt, the sole owners of rock salt mine in Ohio, were accused of rigging bids in the Northern 54 counties of Ohio during the winters of 2004-05 to 2007-08. State and cities sued for damages.
Used the profit margins of the two suppliers in northern New York State during period (27% average) as a yardstick
68 -- Ohio OIG (2010: iii)
417B. Same as 417A.
Used the profit margins of the two suppliers in southern Ohio during period (27% average) as a yardstick
15.3 68 Ohio OIG (2010: 29-30)
417C. Same as 417A.
Used the constant-margin method: compared margins in year 2000 before collusion with margins during collusion
19.2 68 Ohio OIG (2010: 29-30)
417D. Same as 417A, except longer collsion, winters of 2000-2010 Yardstick method 50 -- Ohio OIG (2010: 29-
30) 418. In 1993 to May 1996 (and perhaps much earlier) the head trader at Sumitomo Corp. colluded with two other traders and a U.S. metals wholesaler to corner the markey for physical copper to manipulate the London Metal Exchange (therefore world) prices; the 4 firms paid fines to the US CFTC and the UK regulator as well as private settlements over 1999-2001.
The US CFTC Order placing a fine on Sumitomo states that peak prices declined from $2899/t to $2000/t for several monthas after May 1996
-- 40 CFTC (1999)
419A. The nationwide Finnish asphalt paving cartel of seven Finnish and Swedish companies rigged bids in 1994–2002 on tenders by the Finnish Road Authority (FRA), municipalities and private parties; cartel fined by the Supreme Administrative Court; a 2012-13 trial over private damages claims filed by the Finnish State and numerous counties and municipalities.
Econometric evidence on 1994-2009 bids presented in court prepared by plaintiffs’ experts at an independant research organization; compares county and municipal bids during collusion with bids after collusion
20 -- Pursiainen, et al. (2011, 2012)
419B. Same as 419A, except bids made on tenders by the national government for paving of national roads. It is interesting that the government unit most likely to have the capability to detect bid rigging incurred a lower overcharge rate.
Econometric evidence presented in court prepared by plaintiffs’ experts at an independant research organization; compares FRA bids during collusion with bids after collusion
15 -- Saxell, Tukiainen & Siikanen (2011)
419C. Same as 419A, except bids made by one defendant on tenders.
Econometric models using bids submitted by Lemminkäinen, the cartel's ringleader, to municipalities or to the FRA in 1993–2009, comparing prices
0 --
Riipinen & Toivanen/Tempo Economics (2010); Helsinki District Court, case ID L

J. M. Connor Price-Fixing Overcharges 3rd Edition February 2014
300
during the cartel and after the cartel.
08/16883 (joint cases), evidence DT 12
419D. Same as 419A, except bids made by one defendant on tenders.
Econometric models using bids submitted by Skanska, the cartel's ringleader, to the FRA in 1993–2009, comparing prices during the cartel and after the cartel.
0 --
Hyytinen/Spillover Economics (2011); Helsinki District Court, case ID L 08/16883 (joint cases), evidence DT 18
420. In January 1980, a Canadian auto repair firm circulated a letter stating that 14 repair shops in Fort Erie, Ontario, Canada had met and agreed to raise labor rates by 10%; in January 1981 another 13.6% increase was announced, effective for another year. The Bureau of Competition sued, and a trial ensued in 1986; the authors believe guilty, but case was dismissed by the judge because of a few arithemetic errors by the prosecutor’s expert.
The authors are convinced that this cartel was effective in raising prices from the 1979 labor rate of C$20 per hour for at least two years, Jan. 1980 to Dec. 1981.
17.5 25 Low and Halladay (2011: 84-85)
421A. In 1997, the Canadian Bureau of Competition prosecuted land surveyors in Edmonton, Canada colluded at a meeting in Nov. 1, 1994 to raise the price of surveying a residential property from C$225 to C$325 effective immediately;
Testimony at trial revealed that prices rose to the agreed higher price and held steady all over the city compared to before Nov. 1 1994.
44.4 44.4 Low and Halladay (2011: 89-90)
421B. Same as 421A.
Testimony at trial revealed that prices rose to the agreed higher price and held steady all over the city compared to after the Bureau’s investigation began
11-47 -- Low and Halladay (2011: 89-90)
422A. From Jan. 1999 (some plaintiffs claim 1993) to Dec. 2003, six urethane plastics manufacturers colluded on prices in the huge US market, and very likely in the rest of the world; plaintiffs won 3 settlements and one judgment in a jury trial against one of the largest defendants, Dow Chemical in Feb. 2013.
Econometric model presented by plaintiff’s economist at trial 13 --
Report of trial outcome in Kansas
City Business Journal (Feb. 19,
2013)
422B. Same as 422A
Jury decides that damages were only 33% of what plaintiffs’ claimed and for 4 years, not 5.
5.4 -- Kansas City Business
Journal (Feb. 20 2013)
423A. Telephone service in New York City circa 1908 before rates were state-regulated in New York; home service prices by Bell Telephone Co. compared in two similar cities; not clear if Bell had any competition at this time; unlike NYC, Bell paid a 5% tax to City of Toronto.
Yardstick is prices in Toronto, Canada ($180 per year in NYC vs. $25)
620 -- Demarest (1910: 187-88)
423B. Same as 423A, except for office rates (note price discriminination by Bell Telephone).
Yardstick is prices in Toronto, Canada ($240 per year vs. $45) 433 -- Demarest (1910:
187-88) 424. Aggregate (crushed stone), Sao Paulo, BRAZIL 10/2000-7/2003
Compares collusive prices to prices before cartel 14.1 -- Martinez (2007)
425. Air route, Latvia , 8/1998-1/1999 Compares collusive prices to 4.0 -- OECD Competition
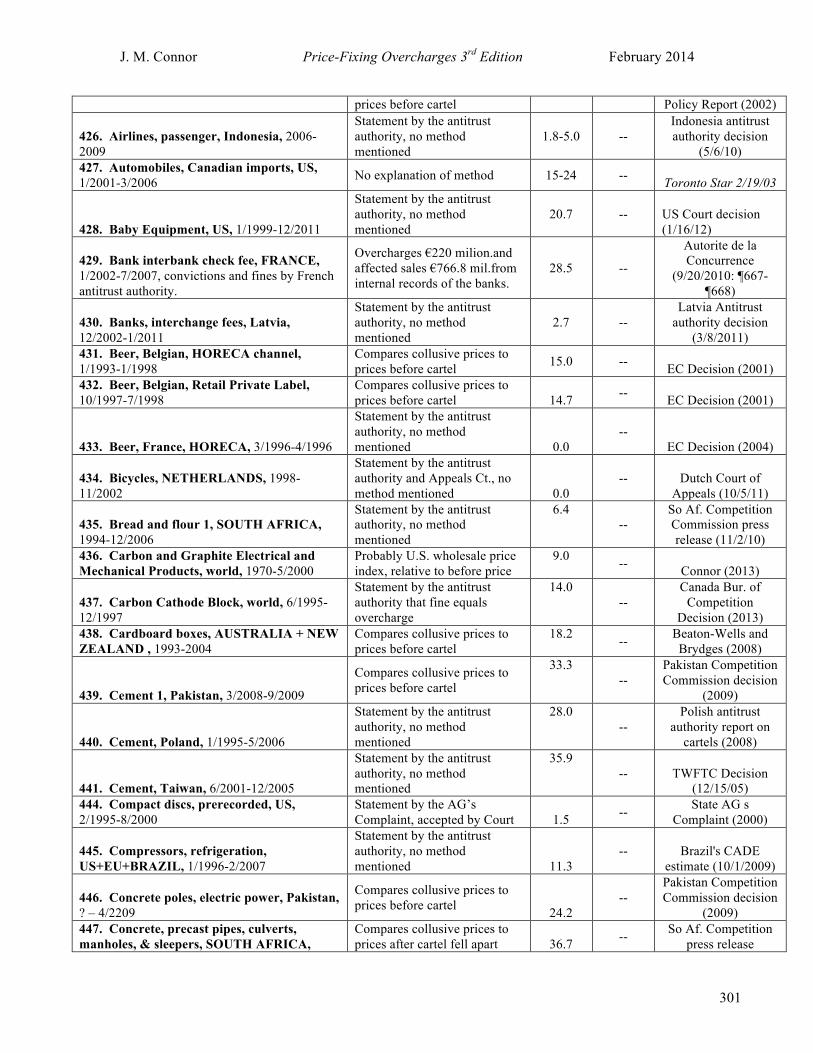
J. M. Connor Price-Fixing Overcharges 3rd Edition February 2014
301
prices before cartel Policy Report (2002)
426. Airlines, passenger, Indonesia, 2006-2009
Statement by the antitrust authority, no method mentioned
1.8-5.0 -- Indonesia antitrust authority decision
(5/6/10) 427. Automobiles, Canadian imports, US, 1/2001-3/2006 No explanation of method 15-24 -- Toronto Star 2/19/03
428. Baby Equipment, US, 1/1999-12/2011
Statement by the antitrust authority, no method mentioned
20.7 -- US Court decision (1/16/12)
429. Bank interbank check fee, FRANCE, 1/2002-7/2007, convictions and fines by French antitrust authority.
Overcharges €220 milion.and affected sales €766.8 mil.from internal records of the banks.
28.5 --
Autorite de la Concurrence
(9/20/2010: ¶667-¶668)
430. Banks, interchange fees, Latvia, 12/2002-1/2011
Statement by the antitrust authority, no method mentioned
2.7 -- Latvia Antitrust
authority decision (3/8/2011)
431. Beer, Belgian, HORECA channel, 1/1993-1/1998
Compares collusive prices to prices before cartel 15.0 -- EC Decision (2001)
432. Beer, Belgian, Retail Private Label, 10/1997-7/1998
Compares collusive prices to prices before cartel 14.7 -- EC Decision (2001)
433. Beer, France, HORECA, 3/1996-4/1996
Statement by the antitrust authority, no method mentioned 0.0
-- EC Decision (2004)
434. Bicycles, NETHERLANDS, 1998-11/2002
Statement by the antitrust authority and Appeals Ct., no method mentioned 0.0
-- Dutch Court of Appeals (10/5/11)
435. Bread and flour 1, SOUTH AFRICA, 1994-12/2006
Statement by the antitrust authority, no method mentioned
6.4 --
So Af. Competition Commission press release (11/2/10)
436. Carbon and Graphite Electrical and Mechanical Products, world, 1970-5/2000
Probably U.S. wholesale price index, relative to before price
9.0 -- Connor (2013)
437. Carbon Cathode Block, world, 6/1995-12/1997
Statement by the antitrust authority that fine equals overcharge
14.0 --
Canada Bur. of Competition
Decision (2013) 438. Cardboard boxes, AUSTRALIA + NEW ZEALAND , 1993-2004
Compares collusive prices to prices before cartel
18.2 -- Beaton-Wells and Brydges (2008)
439. Cement 1, Pakistan, 3/2008-9/2009
Compares collusive prices to prices before cartel
33.3 --
Pakistan Competition Commission decision
(2009)
440. Cement, Poland, 1/1995-5/2006
Statement by the antitrust authority, no method mentioned
28.0 --
Polish antitrust authority report on
cartels (2008)
441. Cement, Taiwan, 6/2001-12/2005
Statement by the antitrust authority, no method mentioned
35.9 -- TWFTC Decision
(12/15/05) 444. Compact discs, prerecorded, US, 2/1995-8/2000
Statement by the AG’s Complaint, accepted by Court 1.5 -- State AG s
Complaint (2000)
445. Compressors, refrigeration, US+EU+BRAZIL, 1/1996-2/2007
Statement by the antitrust authority, no method mentioned 11.3
-- Brazil's CADE estimate (10/1/2009)
446. Concrete poles, electric power, Pakistan, ? – 4/2209
Compares collusive prices to prices before cartel 24.2
-- Pakistan Competition Commission decision
(2009) 447. Concrete, precast pipes, culverts, manholes, & sleepers, SOUTH AFRICA,
Compares collusive prices to prices after cartel fell apart 36.7 -- So Af. Competition
press release
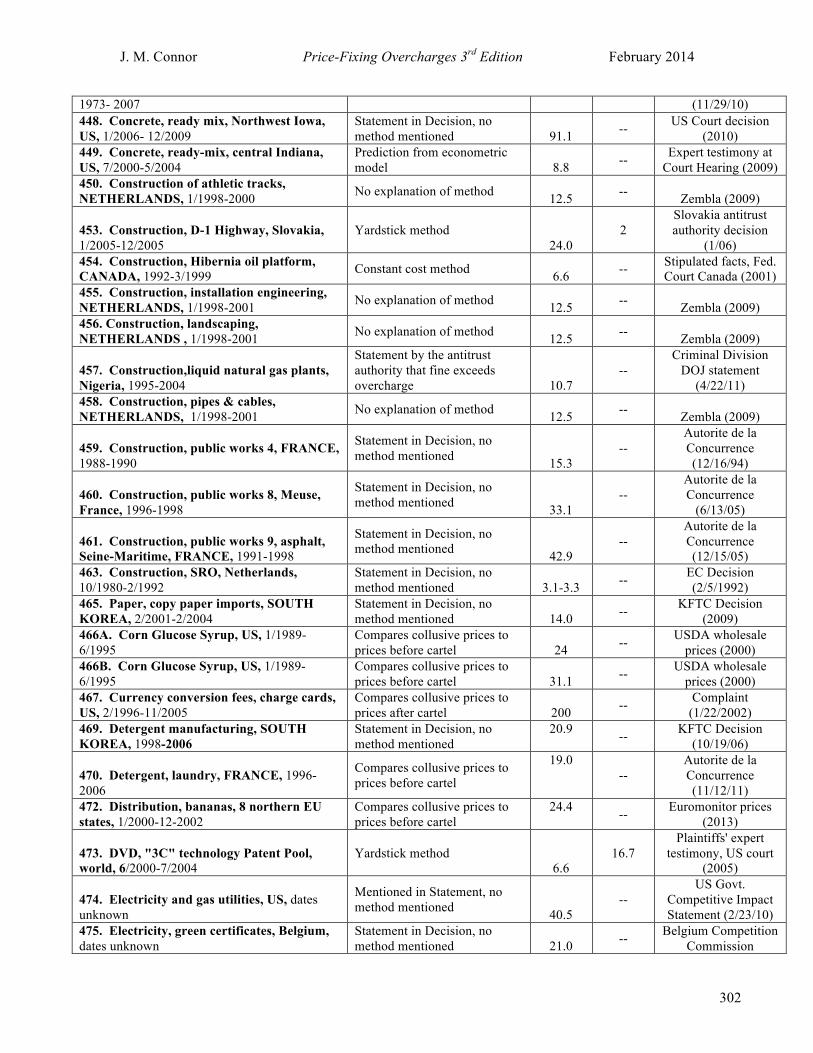
J. M. Connor Price-Fixing Overcharges 3rd Edition February 2014
302
1973- 2007 (11/29/10) 448. Concrete, ready mix, Northwest Iowa, US, 1/2006- 12/2009
Statement in Decision, no method mentioned 91.1 -- US Court decision
(2010) 449. Concrete, ready-mix, central Indiana, US, 7/2000-5/2004
Prediction from econometric model 8.8 -- Expert testimony at
Court Hearing (2009) 450. Construction of athletic tracks, NETHERLANDS, 1/1998-2000 No explanation of method 12.5 -- Zembla (2009)
453. Construction, D-1 Highway, Slovakia, 1/2005-12/2005
Yardstick method 24.0
2 Slovakia antitrust authority decision
(1/06) 454. Construction, Hibernia oil platform, CANADA, 1992-3/1999 Constant cost method 6.6 -- Stipulated facts, Fed.
Court Canada (2001) 455. Construction, installation engineering, NETHERLANDS, 1/1998-2001 No explanation of method 12.5 -- Zembla (2009) 456. Construction, landscaping, NETHERLANDS , 1/1998-2001 No explanation of method 12.5 -- Zembla (2009)
457. Construction,liquid natural gas plants, Nigeria, 1995-2004
Statement by the antitrust authority that fine exceeds overcharge 10.7
-- Criminal Division
DOJ statement (4/22/11)
458. Construction, pipes & cables, NETHERLANDS, 1/1998-2001 No explanation of method 12.5 -- Zembla (2009)
459. Construction, public works 4, FRANCE, 1988-1990
Statement in Decision, no method mentioned 15.3
-- Autorite de la Concurrence (12/16/94)
460. Construction, public works 8, Meuse, France, 1996-1998
Statement in Decision, no method mentioned 33.1
-- Autorite de la Concurrence
(6/13/05)
461. Construction, public works 9, asphalt, Seine-Maritime, FRANCE, 1991-1998
Statement in Decision, no method mentioned 42.9
-- Autorite de la Concurrence (12/15/05)
463. Construction, SRO, Netherlands, 10/1980-2/1992
Statement in Decision, no method mentioned 3.1-3.3 -- EC Decision
(2/5/1992) 465. Paper, copy paper imports, SOUTH KOREA, 2/2001-2/2004
Statement in Decision, no method mentioned 14.0 -- KFTC Decision
(2009) 466A. Corn Glucose Syrup, US, 1/1989-6/1995
Compares collusive prices to prices before cartel 24 -- USDA wholesale
prices (2000) 466B. Corn Glucose Syrup, US, 1/1989-6/1995
Compares collusive prices to prices before cartel 31.1 -- USDA wholesale
prices (2000) 467. Currency conversion fees, charge cards, US, 2/1996-11/2005
Compares collusive prices to prices after cartel 200 -- Complaint
(1/22/2002) 469. Detergent manufacturing, SOUTH KOREA, 1998-2006
Statement in Decision, no method mentioned
20.9 -- KFTC Decision (10/19/06)
470. Detergent, laundry, FRANCE, 1996-2006
Compares collusive prices to prices before cartel
19.0 --
Autorite de la Concurrence (11/12/11)
472. Distribution, bananas, 8 northern EU states, 1/2000-12-2002
Compares collusive prices to prices before cartel
24.4 -- Euromonitor prices (2013)
473. DVD, "3C" technology Patent Pool, world, 6/2000-7/2004
Yardstick method 6.6
16.7 Plaintiffs' expert
testimony, US court (2005)
474. Electricity and gas utilities, US, dates unknown
Mentioned in Statement, no method mentioned 40.5
-- US Govt.
Competitive Impact Statement (2/23/10)
475. Electricity, green certificates, Belgium, dates unknown
Statement in Decision, no method mentioned 21.0 -- Belgium Competition
Commission

J. M. Connor Price-Fixing Overcharges 3rd Edition February 2014
303
(10/6/11) 476 -481. About 8 firms from W. Europe, Austria, Finland, and U.S. colluded by bid rigging on the prices and territories for elevators and escalators, new and service contracts in most parts of the world from May 1992 to late 1997 or early 1998; costs of production were declining during collusion, but benchmarks usually not adjusted; convicted in EU and Korea
476A. Elevators & escalators in Belgium, 1995-2004, fined by EC.
Compares collusive prices to prices before cartel 29.6 -- Levenstein and
Suslow (2003) 476B. Elevators & escalators in Belgium, 1995-2004, fined by EC.
Compares collusive prices to prices after cartel fell apart 10 -- Levenstein and
Suslow (2003) 477A. Elevators and escalators in Austria, 8/1995-6/2004, fined by EC.
Compares collusive prices to prices before cartel 29.6 -- Levenstein and
Suslow (2003) 477B. Elevators and escalators in Austria, 8/1995-6/2004, fined by EC.
Compares collusive prices to prices after cartel fell apart 10 -- Levenstein and
Suslow (2003) 478A. Elevators and escalators in Germany, 8/1995-3/2002, fined by EC.
Compares collusive prices to prices before cartel 29.6 -- Levenstein and
Suslow (2003) 478B. Elevators and escalators in Germany, 8/1995-3/2002, fined by EC.
Compares collusive prices to prices after cartel fell apart 10 -- Levenstein and
Suslow (2003) 479A. Elevators and escalators in Luxembourg, 8/1995-3/2002, fined by EC.
Compares collusive prices to prices before cartel 29.6 -- Levenstein and
Suslow (2003) 479B. Elevators and escalators in Luxembourg, 8/1995-3/2002, fined by EC.
Compares collusive prices to prices after cartel fell apart 10 -- Levenstein and
Suslow (2003) 480A. Elevators and escalators in Netherlands, 8/1995-3/2002, fined by EC.
Compares collusive prices to prices before cartel 29.6 -- Levenstein and
Suslow (2003) 480B. Elevators and escalators in Netherlands, 8/1995-3/2002, fined by EC
Compares collusive prices to prices after cartel fell apart 10 -- Levenstein and
Suslow (2003)
481. Elevators and escalators in Korea, 4/1996-4/2006, fined by KFTC.
Compares collusive prices to prices before cartel 25.1
-- KFTC Decision
reported in Korea Times 8/16/09
482. EPDM synthetic rubber, world, 1/1996-10/2002
Compares collusive prices to prices before cartel
9.2
--
International Institute of Synthetic Rubber
Producers, Inc. (2004)
483. E-Rate federal Internet program, 8 states, 11/1998-11/2003
Compares collusive prices to prices before cartel 53.0 -- Connor (2012)
485. Gases, industrial, Japan, 1/2008-12/2009 Statement in Decision, no method mentioned
20.0 -- JFTC Decision (11/22/2012)
486. Hydro-Electric power equipment, Norway, 1990-2007
Statement in Decision, no method mentioned 26.9 39.0 Sorgard (2007)
487. Insurance, Auto, Vietnam, 10/2008-12/2008
Statement in Decision, no method mentioned
20.0 --
Vietnam antitrust authority Decision
(11/26/08) 488. Insurance, industrial property, Germany, 6/1999-7/2002
Statement in Decision, no method mentioned
5.3 -- Federal Cartel Office estimate (2013)
489. LCDs, TFT Type, sold to Apple, 9/2005-12/2006
Statement by the antitrust authority, no method mentioned 23.5
-- Connor (2013)
490. LCDs, TFT Type, sold to Dell, 4/2001-4/2004
Statement by the antitrust authority, no method mentioned 11.8
-- Plaintiffs' Complaint (2007)
491. LCDs, TFT Type, sold to Motorola, Statement by the antitrust 13.8 -- Connor (2013)

J. M. Connor Price-Fixing Overcharges 3rd Edition February 2014
304
9/2005-7/2006 authority, no method mentioned
493. Lipitor, "Pay-for-delay," US, 8/2011-5/2012
Yardstick method, generic prices
78.0 -- Connor (2013) 494. Mobile phone operators in FRANCE, 1997-2003
Compares collusive prices to prices before cartel 2.9 -- UFC-Que Choisir
report (2005) 495. Mobile phone service, Italy, dates unknown
Statement in Decision, no method mentioned 10.6 -- Italian antitrust
authority (10/1/99)
496. Mobile phone service, Pakistan, 9/2009-1/2010
Compares collusive prices to prices before cartel 0.0
-- Pakistan Competition
Commission (1/26/10)
497. Motors, large-medium industrial, SOUTH KOREA, 1998-2006
Statement in Decision, no method mentioned 19.6 -- KFTC Decision
(9/22/2007) 499. Movie tickets, SOUTH KOREA, 3/2007-7/2007
Statement in Decision, no method mentioned 57.0 -- KFTC Decision
(4/20/2008) 500. Moving and storage services, (intl freight forwarding), DE-US, 5/2000
Statement in Decision, no method mentioned
18.3-22.0 -- US DOJ statement
(7/31/07) 501. MSG and Nucleotides (IMP, GMP), world, 7/1992
Compares collusive prices to prices before cartel 27.5 -- Connor (2013)
503A. Paper, Adhesive lable Stock, CANADA, 1/1996
Mediated settlement is 30-67% of damages
5.4 -- US Court decision (10/22/2009)
503B. Paper, Adhesive lable Stock, US1/1996, Mediated settlement is 30-67% of damages
4.9 -- US Court decision (10/22/2009)
504. Parcel Tankers, Chemical Shipping, 8/1998
Statement in Decision, no method mentioned 5-25 -- Wall St. Journal 2/20
505. Pharmaceutical wholesale distribution, SOUTH AFRICA, 1998
Statement in Decision, no method mentioned 10-15
-- So Af. Competition
press release (2/17/2008)
506. Plastic Additives, epoxsidized soybean esthers, world, 1/1990
Compares collusive prices to prices before cartel
15.6-19.5 -- Moderm Plastics
(8/2001) 507A. Polyester staple, CANADA, 9/1991-7/2001
Compares collusive prices to prices before cartel 46.0 -- Business and
Industry (1999)
507B. Polyester staple, US, 9/1991-7/2001 Compares collusive prices to prices before cartel 24-30 -- Lande and Davis
(2006) 508. Polyols, polyester aliphatic, US+CANADA, 1998-2002
Bayer admits minimum amount of ocercharge in plea 7.8 -- DOJ plea agreement
with Bayer (5/24/05) 509. Polypropylene, high density polyethylene, SOUTH KOREA, 4/1994-4/2005
Statement in Decision, no method mentioned
18.7 -- KFTC Decision
(2/20/2007)
510. Polystryol plastic, Hungary, 2005-1/2008
Statement in Decision, no method mentioned
10-15 --
Hungary antitrust authority Decision
(1/25/2008)
511. Polyurethane foam, AUSTRALIA, 1985 Constant cost method 0.4 -- ACCC Decision (11/27/1998)
512. Poultry, SOUTH AFRICA, 2005-2009
Statement in Decision, no method mentioned
25.0
--
Soputh Africa Competition
Commission report (11/22/2010)
513. Power transmission equipment, Pakistan, 4/2009-12/2010
Compares collusive prices to prices before cartel
13.5-19.5 -- Pakistan Competition
Commission (4/4/12)
514. Printing check pads, UK , ?-2006 Compares collusive prices to prices before cartel
22.5 -- UK OFTdecision (3/31/06)
515A. Private equity buyouts, US , 2003-2007
Statement by the antitrust authority, no method mentioned
8.1-10.5 --
Officer et al. (2010)

J. M. Connor Price-Fixing Overcharges 3rd Edition February 2014
305
515B. Private equity buyouts, US , 2003-2007
Statement by the antitrust authority, no method mentioned
13.5-16.8 --
Officer et al.(2010)
516. PVC (polyvinyl-chloride) plastic, EU, 10/1980-7/1984
Target prices less customary 15% discounts, compared with before prices; peak12/83
55.9 70 EC Decision (12/21/1998)
518. Roof tiles (clay), Germany, 7/2006-12/2008
Statement in Decision, no method mentioned 5.0 --
Federal Cartel Office estimate
(12/22/2008)
519. Salt, Portugal, 1997-2005
Statement in Decision, no method mentioned 6.1 --
Portugal antitrust authority decision
(11/14/07) 520. School books in Indonesia, IBRD, 1999-2000
Restitution amount divided by donation value 18.9 -- IBRD Fraud Office
demand (10/2/2004) 521. Shipping (marine frieght lines) US-Puerto Rico, 5/2002-4/2008
Compares collusive prices to prices before cartel 6.8 -- Court Complaint
(2010: 82) 522. Shipping TACA (Trans-Atlantic Conference Agreement), world, 1/1994-12/1998
Compares collusive prices to prices before cartel 80 -- EC press release
(9/16/98)
523. Soft drink bottling, SOUTH KOREA, 1999-2/2009
Compares collusive prices to prices before cartel 21 --
KFTC Decision reported in Korea Times (8/16/09)
524. Steel beams (structural steel), EU, 1/1984-12/1990
Compares collusive prices to prices after cartel fell apart 25-43 -- The Independent
(1/14/93) 525. Steel, flat, SOUTH AFRICA, 1999-6/2008
Compares collusive prices to prices before cartel 20.0 -- Africa News
(7/18/2008)
526. Text message service (SMS), Indonesia, 1/2004-4/2008
Statement in Decision, no method mentioned 73.4 --
Indonesia antitrust authority decision
(6/19/2008) 527. Tobacco, leaf, procurement, Italy, 1995-2/2002 Yardstick method 210-212 -- EC Decision
(10/20/2005)
528. Transformers, power & distn, E. AUSTRALIA, 1993-1999
Decision says profits from bid rigging were A$169 mil, bids worth $900 mil.
18.8 -- Australian Fed Ct. decision 2003)
529. Vegetable oils, Spain, 2001-2005
Statement in Decision, no method mentioned 25 --
Spain antitrust authority report
(6/29/07)
530A. Elevators & escalators in Canada, 1995-2004, no fines
Change in prices compared to price after collusion stops 59 --
Levenstein and Suslow (2003: 826-
843)
530B. Same as 53A
Compares collusive prices to prices after cartel fell apart 13.5 --
Levenstein and Suslow (2003: 826-
843)
531A. Elevators & escalators in US, 1995-2004, no fines
Change in prices compared to price after collusion stops 39 --
Levenstein and Suslow (2003: 826-
843)
531B. Same as 53A
Change in prices compared to price before collusion starts 9 --
Levenstein and Suslow (2003: 826-
843)
532A. Elevators & escalators, world, 1995-2004, no fines
Change in prices compared to price after collusion stops 26.9 --
Levenstein and Suslow (2003: 826-
843)
532B. Same as 53A
Change in prices compared to price before collusion starts 10 --
Levenstein and Suslow (2003: 826-
843)

J. M. Connor Price-Fixing Overcharges 3rd Edition February 2014
306
533. Mobile phone operators in Netherlands, 7/2001-12/2002, fined by Dutch antitrust authority (NMa)
Prices fell 45% in 2 years after conviction 108 -- MNa 2004 Annual
Report, p.60.
534.Banks, debit-card interchange fees, 1990?-2011, ES
Compares collusive prices to prices after cartel fell apart 51.4 -- Chakravorti (2010)
535. Beer, 2/1998-5/1999, Korea Statement in Decision, no method mentioned 10 -- KFTC Decision
(5/29/1999)
536. British Sugar, 6/1986-7/1990, UK Statement in Decision, no method mentioned 49.9 -- EC Decision
(10/14/1998)
537. Cipro, Pay-for-Delay, 1997-2004, US
Bayer's profits during delay period plus side payment to Barr
92 -- Class action complaint (2012)
538. Circuit plates, copper-plated phenolic paper laminate, 6/1987-1989, Japan
Statement in Decision, no method mentioned 10-15 --
JFTC Decision 1989; High Court Appeal
(9/25/1995)
539. Construction, buildings, 1/1998-12/2001, NL
Statement in Report to Parliament, no method mentioned
8.8 --
Netherlands Parliament Committee
investigation & report (12/02)
540. Construction, buildings, 2000-2006, UK Statement in Decision, no method mentioned 9.9 -- UK OFT Decision
(9/22/2009) 541. Construction, heavy-lift marine, 1990/1/2007, global Constant cost method 37 -- Platt's Oilgram News
(3/29/200)
542. Construction, public bridge project, 1994-2000, Norway
Statement in Decision, no method mentioned 37.5 --
Norwegian Antitrust Authority, in OECD
Report (2003)
543. Diamonds, Industrial, 11/1987-5/1994, world
Class action settlement used as lower bound of compensation value
3 -- US Court decision (11/1/2000)
544. Movie distributors, 2000-2006, ES
Statement in Decision, agreeing with buyers’ claims 15 --
Decision of Spanish Competition
Authority (5/12/06)
545A. Municipal Bond Derivatives, 1/1992-8/2011, US
Based on details of effect on fees made from fees before one representative bid rig
11.8 -- DOJ Criminal
charging document (7/12)
545B. Municipal Bond Derivatives, 1/1992-8/2011, US
Based on details of effect on rates compared with before presented as evidence
0.8 -- DOJ Criminal trial testimony (4/12)
546. Telephone fees, long distance, 2/2003-12/2005, Philippines-US
Based on details of effect on rates compared with before presented as evidence
6.5 -- Business World
(Philippines) (1/20/2004)
547. Tomatoes, processed, 1/2004-4/2008, US Quality dilution of tomato paste 39 -- Class action
complaint (2010)
548. Waste collection, 9/2000-9/2003, Germany
Price effect in tendering areas (about half) where cartel arranged for only one bidder versus areas with no collusion
70 --
Financial Times (London) (9/12/2003)
Interview of BKA Official
549. Window coverings, PVC, 4/2002-7/2002, US + CA
Statement in Decision, no method mentioned 8 -- DOJ press release
(6/27/07) 550A. Apple Corp. conspired with five large book publishers to raise the prices of electronic books (”eBooks”) from late 2009 to early 2010 to prevent Amazon from selling most popular new releases at $9.99. the publishers paid civil
The US DOJ won the criminal bench trial and presented evidence accepted by the judge that the average price increase due to collusion by the five
18 50
Reuters Business & Financial News
(7/10/2013, 4:11 PM: p. 2), Bear (2014: 8)

J. M. Connor Price-Fixing Overcharges 3rd Edition February 2014
307
fines. publishers was 18% compared to the $9.99 price before collusion began.
550B. Same as 550A
A ststement by the Antitrust Division of the DOJ of the average price of the 25 best-selling eBooks several months before the prosecution ($9.99) compared to range of prices for similar ebooks during collusion ($12.99 to $14.99)
30-50 50 Bear (2014: 8)
550C. Same as 550A
An analysis by the Antitrust Division of the DOJ of the average price of the 25 best-selling eBooks several months after the prosecution ($6.47) compared to range of prices for similar ebooks during collusion ($12.99 to $14.99)
101-132 132 Bear (2014: 8)
551. Thirty auto insurance companies in Italy began colluding on rates as soon as the industry was liberalized, from 1994 to about 1999; fines and overcharge upheld by Supreme Court; moreover, double damages awarded to provide increased deterrence.
Before and after method and yardstick of other EU prices. 20 -- Komninos et al.
(2009: 6 and 94).
552. For two months around 2004, five driver-training schools in Graz, Austria colluded on the fees charged to students for the most popular type of training course; prices feel immediately after an investigation began; upheld by the Graz Court of Appeal.
Students charged identical fees of €1140;fell to €900. [Source erroneously calculates a 22% overcharge]
26.7 -- Komninos et al. (2009: 53).
553A. In 2007, the Italian antitrust authority (AGCM) discovered a cartel from 10/2006 to 3/2008 among the leading brands of pasta sold to supermarkets, many manufacturers (some foreign-owned) accounting for 76% of supply were fined; prices rose 15% on average from Sept. 2006 and peaked about 53% in March 2008. Fined by AGCM.
Notaro’s focus is on showing that the simple “before price” econometric method fails to account for costs of inputs. Model 2 uses the before approach, but allows for cost changes interacted with the cartel dummy variable (i.e., the cartel passed on costs faster during collusion).
11.0 -- Notaro (2013: 11)
553B. Same as 553A; implies an overcharge of €147 million on affected sales of €1441 million.
Model 2 is non-stationary. A dynamic econometric model 3 predicts a higher average but-for price; the peak collusive price increase in march 2008
10.2 40 Notaro (2013: 15 and Figure 4)
a) If the dates of the cartel’s effective period of operation are different from its formal existence, the former dates are given if known. b) If a source states that a collusive episode “failed” or was “unsuccessful” (or similar terms), the overcharge is zero; if the descriptor is “small,” “slight,” “weak,” or similar, then an arbitrary value of 1% is coded. c) A complete list of the publications can be found in the References abpve. In addition, the Wall Street Journal (WST), New York

J. M. Connor Price-Fixing Overcharges 3rd Edition February 2014
308
Times (NYT), Financial Times, and other newspapers or news wires (AP, APX, Jiji, Yonhap, Asia Pulse, etc.) are sometimes cited as sources for summaries of legal decisions. d) The first number is from the first edition of Posner, the second from the second (2001) edition. Note: Occasionally, a source gives a percentage decline (P%) in prices from during to after a cartel episode; in these cases the overcharge should be converted to using the formula P%/(1-P). The citation Connor (2011) is simply an earlier version of Connor (2013); the latter often has more accurate measures of affected sales and, therefore, better overcharge estimates.

J. M. Connor Price-Fixing Overcharges 3rd Edition February 2014
309
Appendix Table 3. Rejected Estimates and Reasons
Episode Number a Source Reasons for Concern ______________________________________________________________________________ 23 Bittlingmayer (1982) Analysis contradicted by Williams (1986), Taylor (2002) 74A Gallet (1997) Study cannot distinguish overt from tacit collusion. 74A Baker (1989) Refers to US data, whereas case is a European cartel 74B Barbezat (1989) Covers a period in which cartel was government-directed 84 Jeon and Shin (2005) Regression analysis assumes that Korean steel production affected global demand and the Korean import price; annual data used when quarterly preferred. None Sproul (1993) BLS data employed are inappropriate (see Werden 2003) None Block et al. (1981) Settlements in the bread industry are a poor guide to overcharges, and dividing them by 3 worsens the problem 37 Newmark (1988) Ten other economists have cited the FTC analysis of prices with approval; moreover, an Appeals court upheld the conviction; and Mueller and Parker (1992) provide a devastating critique of Newmark’s article. None Pesendorfer (2000) Author would not supply data necessary for calculation. 190 Wiggins and Libecap (1987) Repeated assertions by authors that cartel was ineffective are not supported by (an entirely feasible) quantitative analysis. 9 Scott (2000) A critique of Lanzilloti (1996), who appears to defend ably
his original conclusions in his 2000 rejoinder. 284 Sjostrom (1991) Finds no evidence of national collusion in the Hardwood decision of 1921, but most authorities have agreed on this point for some time. 155 Kinghorn and Nielson (2004) Find that the prices of the German coal and iron and steel cartels were below the yardstick prices in the UK; however, one of their major sources (Webb 1980) shows that during the cartel periods productivity change was higher in Germany than in the UK.

J. M. Connor Price-Fixing Overcharges 3rd Edition February 2014
310
284 Alexander (1988) An interesting study, but the Hardwood Association did not engage in explicit price fixing on a national basis. None Hendricks and Porter (1988) The authors find that federal government auctions of oil “drainage leases” on tracts on the Outer Continental Shelf return 14.3% lower prices per acre than “wildcat tracts”; they attribute the difference to collusion, but not necessarily explicit collusion. _____________________________________________________________________________
a) “None” means that this study is the only one about a potential cartel market; therefore, no cartel observation number was created for listing in Appendix Tables 1 or 2.

J. M. Connor Price-Fixing Overcharges 3rd Edition February 2014
311
Appendix Table 4. Final Court Decisions with Overcharges Data
Name and Type of Case Overcharge Average Peak
1. Addyston Pipe & Steel Co. v. U. S., 175 U.S. 211 (1899) (conspiracy to allocate customers via secret bidding pool)(Court provided a typical result, but not an average figure272)
34.7-42.6%+
2. Armco Steel Corp. v. North Dakota, 376 F.2d 206 (U.S. App. 1967) (highway construction bidding conspiracy.273) (period of injury involved was from 1957 to June 17, 1960)
18.5%
3. Armco Steel Corp. v. Adams County, 376F. 2d 212 (1967)(highway construction bidding conspiracy) (same defendants as previous case but different victims) (corrugated culverts for local road-work purposes during the years 1957-1960)
17.3-20.3%
4. Colorado ex rel. Woodard v. Goodell Bros., 1987-1 Trade Cas. (CCH) P67,476274 (road building projects bid in 1978 and 1980)
9.6%
5. FTC v. Superior Court Trial Lawyers Association, 493 U.S. 411 (1990) (legal aid attorneys conspired to raise fees275) (began September 6, 1983 and ended Sept. 20, 1983)
16.7%276 75%
272 “The cost of producing pipe at Chattanooga, together with a reasonable profit, did not exceed $ 15 a ton. It could have been delivered at Atlanta at $ 17 to $ 18 a ton, and yet the lowest price which that foundry was permitted by the rules of the association to bid was $ 24.25. The same thing was true all through 'pay' territory to a greater or less degree, and especially at 'reserved' cities." This means that the typical price increase was at least $24.25 - 18 = 6.25/18 = 34.7% And, 24.25 - 17 = $7.25/17 = 42.6% 273 “We have no difficulty whatever in holding that there was adequate basis... proximate injury in the amount of $258,355, on the extent of the artificiality involved in the fixed prices and its ingrediency in the $1,396,500 list-price aggregate ... which had entered into the construction projects let during the conspiracy period, and in the $2,000 quantity of direct purchases made by the State.” If $258,355 of the $1,396,500 was an overcharge, then the overcharge would have been 22.7% of the base figure of $1,138,145. 274 The court found that plaintiff has reliably proved the overcharges on two of the three contracts at issue; competitive prices of $333,253 and $343,051 were increases by $35,381 and $29,732. Colorado ex rel. Woodard v. Goodell Bros., 1987-1 Trade Cas. (CCH) P67,476 Id at 7. 275 Legal aid attorney conspired to raise fees. Cartel/boycott by Washington DC lawyers (public defenders) that demanded (& received) a price increase from $30 hr court time and $20 hr non court time to $35 hr for both in the span of a week. They would later seek and obtain a price increase to $55 hr court time & $45 hr non court time (without a boycott). 276 The increase was 16.7% for in court time and 75% for out of court time, but it was not possible to compute the average.

J. M. Connor Price-Fixing Overcharges 3rd Edition February 2014
312
6. Freeman v. San Diego Ass’n. of Retailers, 322 F. 3d 1133 (2003)(conspiracy to standardize subscription charges277) (from 1992 to March 2003)
150%
7. Greenhaw v. Lubbock County Beverage Ass’n., 721 F. 2d 1019 (5th Cir. 1983)(conspiracy to fix retail price of liquor for 4 ½ years278) (during the period June, 1970 to December, 1974)
7.74%
8. Homewood Theatre v. Loew’s, 110 F. Supp. 398 (D. Minn. 1952) (conspiracy in Minneapolis, MN from Jan. 1935 to Sept. 1948 involving first run films279)
6.3%
9. Kruman v. Christies’ Intern. PLC, 284 F. 3d 384, 390 (C.A. 2 2002)280 (global fine art auction cartel 1992-2000) 50 % 150% 10. New York v. Hendrickson Bros. 840 F.2d 1065 (2d. Cir. 1988281) (bid rigging on state highway construction contracts - three distinct episodes in 1977, 1978, and 1979)
49.2% 32.1%
277 Group of realtor associations combined and standardized their charges. Some raised subscription price from $10 up to $25, others lowered them. Although it was not a simple price fixing conspiracy, Judge Kozinski called it “price fixing”. However, since he did not state how much the average charge increased, we did not include it in our median or average estimates. 278 Jury decided amount of overcharge and appellate court upheld. Id at 1026-27. 279 $39,432.67 loss on sales of $625,763.78. 280 “On November 2, 1992, Sotheby's announced it would increase its buyer's premiums from 10% to 15% for the first $ 50,000.00 of the purchase price. On December 22, 1992, Christie's declared an identical increase in its buyer's premiums. The defendants allegedly agreed not to reduce these premiums. The defendants also agreed to set their seller's commissions at identical levels. Prior to March 1995, the defendants would permit clients to negotiate smaller seller's commissions. On or about March 10, 1995, Christie's announced it would implement a fixed schedule of non-negotiable seller's commissions ranging between 2% and 10% depending on the value of the item to be sold. On April 13, 1995, Sotheby's stated it would implement a fixed schedule of non-negotiable seller's commissions substantially identical to the schedule set by Christie's.” Id at 390. For the items covered by the agreement, buyers’ commissions rose by 50%, from 10% to 15%. In addition, the new sellers’ commissions means that total commissions had increased from 10% up to as much as 25% - a 150% increase. 281 Jury determined that contract overcharges were $590,000 on what should have been a $1.2 million contract (49.2%: page 1070), $644,000 on what should have been a $2,004,000 contract (32.1%: page 1071-72), and $1,113,000 on what should have been a $8,187,000 contract (13.6%). The Court also noted: “Amfar was advised not to "get too greedy," i.e., it was to limit the excess profit included in its bid to 20-25% and was not to seek excess profits of 40-50%. Later review by Ambrosio of bids submitted by other coconspirators led him to the conclusion that most of them were submitting bids that included excess profits higher than the 20-25 % benchmark.” Id at 1070. Most of the economic analyses we surveyed would have called these different episodes and analyzed them separately, even though legally they were treated together. This clearly is a judgment call upon which reasonable people could differ. If they were treated as one larger conspiracy, the overcharges would total $2,347,000 on a base of $11,391,000, or 20.6% overall. Alternatively the average of the three computed overcharges is 31.6%. In addition, the Court found that a subcontract that should have been bid at $512,000 was given to a fellow conspirator,

J. M. Connor Price-Fixing Overcharges 3rd Edition February 2014
313
13.6% 11. New York v. Cedar Park Concrete Corp, 85 Civ 1887 (2001) (concrete superstructure construction bid rigging during 7 year period 1978-1985282)
5.87%
12. North Texas Producers Ass’n v. Young, 308 F. 2d. 235 (5th Cir. 1962) (conspiracy from Nov. 1956 to Feb. 1961 to exclude low cost milk seller283)
36%
13. Ohio Valley Electric Corp. v. General Electric Co., 244 F. Supp. 914 (SDNY 1965) (bid rigging against U.S. electric utilities, began in 1930s but data available only for 1950-1959, in purchases of electric power generating and transmission equipment284)
10.9%
14. Palmer v BRG of Georgia, 498 U.S. 46,47 (1990)(naked division of market by two providers of Bar Review courses, from 1980 to approximately Nov. 1990285)
167%
15. Pease v. Jasper Wyman & Son, 2004 ME 29 (2004) (conspiracy during August 1996 to October 1999 by four processors to suppress prices paid for wild blueberries286)
21.6% 32.8%287
16. Story Parchment Co. v Patterson Parchment Paper Co., 282 U.S. 555 (1931) (conspiracy by three manufacturers to monopolize and destroy
27.7%
in return for not bidding, for an additional $338,000, a 66% overcharge. This was not included as a separate overcharge figure, however, since is subsumed in the conspiracy for its prime contract. 282 The conspiracy was organized personally by Paul Castellano, on behalf of "the governing body of New York's five organized crime families". Yet the Court only found that it raised prices by 5.87%. 283 This involved a horizontal conspiracy to exclude a low-priced milk seller that would have sold milk for 69 cents instead of 96 cents. He was awarded $100,000 in lost profit damages for the period at issues. The important point for our study, however, is the Court’s conclusion that that the horizontal competitors caused the price of the milk that plaintiff would have sold to consumers at 69 cents to be sold to them at 96 cents instead. The conspiracy prevented a 36% price drop. Id at 237. 284 ”This overcharge of $5,624,401 is slightly under eleven per cent of the total final order price for all units ($52,027,785) and slightly under ten per cent of the total final billed price, including escalation ($57,116,819). Page 947 This totals 10.92% of the pre-collusive amount. 285 This case involved an agreement by the only 2 Bar Review preparation companies in Georgia. They entered into a naked division of markets, after which the price of a Bar Review course in Georgia went from $150 to "over $400." Id. at 47. We will conservatively assume that the price only went up to $400, an increase of $167%. 286 This was a four year average, calculated from Solow exhibit 10, “Underpayment to Growers”, whose figures were accepted by the jury. A $56 million judgment was upheld. 287 For 1997.

J. M. Connor Price-Fixing Overcharges 3rd Edition February 2014
314
plaintiff’s business by predatory pricing in the market for vegetable parchment from Nov. 1927 to at least the bankruptcy of Aug. 1928288) 17. Strobl v. N. Y. Mercantile Exchange, 582 F. Supp. 770 (1984) (conspiracy from about Jan. 1976 to May 1976 by two processors to lower the price of a Maine potato futures contract on the NY Mercantile Exchange289)
48.6%
18. Union Carbide & Carbon Corp. v. Nisley, 300 F.2d 561 (10th Cir. 1961) (for recovery period Oct. 1938- March 1948 on a conspiracy that began 1933 by smelters to reduce prices paid for vanadium-bearing ore on the Colorado Plateau290)
22.5% 38-47.5%
19. United Nuclear Corp. v. General Atomic Co., 629 P. 2d 231 (N.M/ 1980)(global uranium cartel established 1972 but effective from about June 1974 to Dec. 1975291)
567%
20. U.S. v. Anderson, 326 F.3d 1319 11th Cir. 2003) (bid rigging on USAID contracts on construction of waste-water treatment plants in Egypt 1988-1996 292)
16.4-39.2%
21. United States v. Andreas, 216 F.3d 645 (2000) (global conspiracy 6/92-7/95 to raise lysine prices293) 71.4%
288 Conspiracy to monopolize and destroy plaintiff’s business. Jury verdict of $65,000, before trebling. Property that cost $235,000 allegedly reduced in value to $75,000. So damages must have been 65/235 = 27.7%. 289 Strobl v. New York Mercantile Exchange, 582 F. Supp. 770 (S.D.N.Y. 1984), motion to reduce award denied 590 F. Supp. 875 (S.D.N.Y. 1984), aff'd 768 F.2d 22 (2d Cir. 1985). “The $460,000 figure reached by the jury, therefore, was the equivalent of a finding that the price of the May potato futures contract would have been approximately $18.00, instead of $9.25, had the market been operating solely on the basis of supply and demand...The jury could have concluded from the evidence of low supply that the price of Maine potato futures was artificially low during the conspiracy period.” Id. at 779. Price therefore was depressed 48.6%. 290 “In these circumstances, we cannot say that the jury's finding to the effect that the free market price of 2 percent vanadium ore for the period October 1938 through March 1948 was 40 cents per pound instead of 31 cents was clearly erroneous.” 291 United Nuclear Corp. v. General Atomic Co., 629 P.2d 231, 242 (N.M. 1980) "Fourth, between 1972, when the cartel apparently began, and 1975, when this suit was filed, the price of uranium in the United States increased from approximately $6.00 per pound to approximately $ 40.00 per pound." The Court concluded that the price of Uranium had increased by 567% during the period of the conspiracy but did not say that all of this increase was due to the activity of the cartel. For this reason this cartel’s increase has been put in the maximum column, not the average column. 292 Exhibits 16 and 24 say that the winning bids on the three contracts at issue were $283.984 million On page 77 of the Transcript of Sentencing Before The Honorable Robert B. Propst, May 20, 2002, the judge found that the total overcharges for these three contracts were "greater than 40 and less than 80" million dollars. Using the $40 m loss figure -- this would mean that the three jobs together should have cost $244 million, so 40/244 is 16.4%. For the higher overcharge finding, the contracts should have totaled $204 million, so 80/204 = 39.2%.

J. M. Connor Price-Fixing Overcharges 3rd Edition February 2014
315
22. United States v. Dynalectric Co., 859 F.2d 1559 (11th Cir. 1988) (Bid Rigging on electrical subcontracting portion of at the Snapfinger Creek Wastewater Treatment Plant in Dekalb County, Georgia ; bid made on September 7, 1979 and the final payment to the loser was made on January 24, 1985.294)
34%
23. U. S. v. Foley, 598 F. 2d 1323,1327 (C.A. Md., 1979295) (real estate companies in Montgomery County, MD agreed Sept. 5, 1975 to raise their sales commissions on houses; ended about April 1977)
16.7% 16.7%
24. In Re Vitamins Antitrust Litigation, Animal Science Products v. Chinook Group, Misc. No. 99-0197 TFA, M.D.L. No. 1285 (choline chloride global cartel jury verdict296)
38%
25. Wall Products v. National Gypsum, 357 F. Supp. 832 (N.D. Calif. 1973) (U.S. conspiracy from December 15, 1965 until January 1, 1968 over price of gypsum wallboard297)
27%
26. Webb v. Utah Tour Brokers Ass., 568 F. 2d 670 (1977) (conspiracy by tour brokers to deny plaintiffs entry, boycott, etc.298) 5% 293 "The meeting ended without a sales volume allocation agreement, but two months later, at the recommendation of Whitacre, the cartel raised prices anyway, and prices rose from $ .70 to $ 1.05 per pound. ... [Much later] The producers also agreed on a new price of $ 1.20 for the United States market." Id at 652-53 The Court inferred that at least one sale took place at $1.20, so its maximum increase was (1.20-.70)/.70 = 71.4%. As is typical, this Court was not perfectly clear as to what caused the price to rise. But the plain meaning of the quotation is that the Court found that, as a maximum, the cartel raised the price of Lysine by 71.4%. In fact this would be a modest conclusion because the Court also wrote: "Together, the three parent companies produced all of the world's lysine until the 1990s, presenting an obvious opportunity for collusive behavior. Indeed the Asian cartel periodically agreed to fix prices, which at times reached as high as $3.00 per pound." This would mean that the maximum increase was roughly (3.00-.70)/.70 = 329% 294 7. United States v. Dynalectric Co., 859 F.2d 1559 A $1.7 million profit on a $5 million contract is a profit of 34%. 295 On Sept. 5, 1975, competing real estate executives agreed to raise their commission from 6% to 7%. ”Within the following months each of the corporate defendants substantially adopted a seven percent commission rate.” Id. at 1327. Since almost all, but not 100% of the sales were at a 7% Commission, 16.7% actually overstates the average actual rise somewhat. 296 The jury verdict was $49.54 million "before trebling and credit for prior settlements". On page 6 Plaintiff's expert gives total U.S. sales in the industry of $130.85 million. So this one jury verdict was 38% of total industry sales, which means that the markup by defendant had to be significantly more than 38%. Surely 38% is a conservative estimate of the markup involved, despite the fact that the total industry sales came from the plaintiff’s expert. 297 Wall Products Co. v. National Gypsum Co., 357 F. Supp. 832 conspired among themselves and with others, to stabilize and maintain the price level of gypsum wallboard 27%
J. M. Connor Price-Fixing Overcharges 3rd Edition February 2014
316
Source: Lande and Davis (2006), Davis and Lande (2006, 2007, 2008, 2011). ______________________________________________________________________
298 Webb v. Utah Tour Brokers Assn., 568 F. 2d 670, 676-77 (1977). “They had been able to obtain the same transportation service for 70 cents per mile from the other licensed brokers. However, with Greyhound they were obliged to pay a Special Operations Bus Order tariff of three and one-half cents per person per mile. Of the eleven tours operated they had to pay this higher rate for eight tours. Plaintiffs calculated that they suffered a total loss of $10,165 as a result of having to pay the higher tariff for the tours that they took.” 3.5/70 equals 5%.