Emperor International Journal of Finance and Management ...
19
EMPEROR INTERNATIONAL JOURNAL OF FINANCE AND MANAGEMENT RESEARCH [EIJFMR] ISSN : 2395-5929 Founder | Publisher | Editor Dr. R. MAYAKKANNAN, Assistant Professor of Commerce, Sri Sankara Arts & Science College, Enathur, Kanchipuram, Tamilnadu, India. Chief Editor Dr. C. THIRUCHELVAM, Head & Associate Professor of Commerce H.H.The Rajah’s College (Autonomous), Pudukkottai, Tamilnadu. Volume-II Issue-11 November-2017
-
Upload
khangminh22 -
Category
Documents
-
view
1 -
download
0
Transcript of Emperor International Journal of Finance and Management ...

EMPEROR INTERNATIONAL JOURNAL OFFINANCE AND MANAGEMENT RESEARCH
[EIJFMR]
ISSN : 2395-5929
Founder | Publisher | Editor Dr. R. MAYAKKANNAN,
Assistant Professor of Commerce,
Sri Sankara Arts & Science College,
Enathur, Kanchipuram,
Tamilnadu, India.
Chief Editor
Dr. C. THIRUCHELVAM, Head & Associate Professor of Commerce H.H.The Rajah’s College (Autonomous),
Pudukkottai, Tamilnadu.
Volume-II Issue-11 November-2017
ss
Typewritten text
Mayas Publication™ 45/5, Unathur & Post, Attur Tk., Salem Dt. Tamilnadu, India – 636112 No:03, Sri Vinayaka Mandir,4B Block Sarojini Nagar, New Delhi, India-110023 Narayanapuram Po. Templegate, Thalassery-2, Kannur Dt. Kerala.-670102

Emperor International Journal of Finance and Management Research [EIJFMR]
Published by
Mayas Publication™
# 45/5 Unathur. Post Attur. Tk, Salem. Dt Tamilnadu, India
Board of Editor’s
SCHOOL OF COMMERCE, MANAGEMENT, ECONOMICS
Dr.Balakrishnan
Department of International Business,
Administration,
Nizwa College of Applied Science,
Sultanate of Oman
Dr.Pratapsingh Chauhan
Dean and Syndicate Member,
Saurashtra University, Rajkot,
Gujarat. India
Dr.Kuppusamy Singaravelloo
Department of Administrative Studies and
Politics,
Faculty of Economics and Administration,
University of Malaya, Malaysia.
Dr. Bharati Pathak
Professor, School of Commerce,
Gujarat University, Ahmadabad, India
Dr. Mohan
Professor of Commerce,
Management and Information Sciences,
Sri Venkateswara University, Thirupati,
Andhra Pradesh, India
Dr.Meenu Meheshwari
Assistant Professor,
Department of Commerce and Management,
University of Kota, Kota
Dr. G. Raju
Professor of Commerce,
School of Management Studies,
University of Kerala
Thiruvanathapuram- 695 581 Kerala, India
Dr.Vijaya
Professor of Commerce,
Gulbarga University,
Gulbarga, Karnataka state
Dr. R. Periyasamy
Head & Assistant Professor,
Department of Commerce,
Barathiyar University Constitutional
College, Coimbatore, Tamilnadu, India
Dr.T.J.Arun
Associate Professor of Commerce,
Annamalai University, Chidambaram,
Tamilnadu,India.
www.eijfmr.com [email protected]
Chief Editor
Dr. C. THIRUCHELVAM,
Head & Associate Professor of
Commerce
H.H.The Rajah’s College (Autonomous),
Pudukkottai, Tamilnadu
Editor & Founder
Dr. R. MAYAKKANNAN,
Assistant Professor of Commerce,
Sri Sankara Arts & Science College,
Enathur, Kanchipuram, Tamilnadu,

Dr.A.Ravikumar
Associate Professor of Commerce,
Bishop Heber College (Autonomous),
Puttur, Trichy-17
Dr.N.Bharathidhasan
Assistant Professor in Commerce,
Dr.Ambedkar Goverment Arts College
(Autonomous),Vyasarpadi, Chennai.
Tamilnadu
Dr.Leela
Professor of Commerce,
T.S.Narayanaswami College,
Chennai, Tamilnadu
Dr .K.Krishnamurthy
Assistant Professor of Commerce,
Periyar Government Arts College,
Cuddalore
Dr. C. Saraswathy
Assistant Professor of Commerce,
VELS University, Chennai, Tamilnadu
Dr. R. Mathavan
Assistant Professor of Commerce,
Kandaswami Kandar’s College,
P.Velur, Namakkal (DT) Tamilnadu
Dr. S.Prabhu
Head & Assistant Professor of Commerce
Bharthi College of Arts and Science,
Thanjavur -613 007 Tamilnadu
Dr.F.Elayaraja
HOD of Commerce TKU Arts College
Karanthai, Thanjavur, Tamilnadu.
Dr. R. Hariharan
Associate Professor of Commerce,
National College,
Trichy, Tamilnadu
Dr. L.Gomathy
Assistant Professor of Commerce,
Agurchand Manmull Jain College,
Meenambakkam, Chennai – 600114
Dr.S.Raju
Assistant Professor of Commerce
A.V.V.M Sri Pushpam College
(Autonomous)
Poondi-613503, Thanjavur.
Dr.V.Dheenadhayalan
Assistant Professor in Commerce,
Annamalai University, Chidambaram.
Dr.Bama Sampath
Assistant Professor of Commerce
Dr.Ambedkar Govt. Arts College
Chennai-39.
Dr. R. Vasudevan
Assistant Professor in Corporate Secretary
Ship, D. G. Vaishnav College, Chennai
Dr.A.L.Mallika
Associate Professor and Head,
Department of Management Studies,
Mother Teresa Women’s University,
Kodaikanal.
Dr. P. Uma Meheshwari
Assistant Professor of Economics
Barathiyar University College,
Coimbatore, Tamilnadu, India
Dr.Dhanalakshmi Acharya
Bangalore Business School,
Andhrhalli Main Road, Bangalore
Dr.A.Vijaykanth
Assistant Professor of Economics,
Dr.Ambedkar Government Arts
College (Autonomous),
Vyasarpadi, Chennai-39, Tamil Nadu.

Dr. V. Rengarajan
Assistant Professor, Management Studies
SASTRA University, Thanjavur.
Dr.Ramanathan,
Principal and Head,
Nethaji Subbash Chandra Bose College,
Tiruvaurur
Dr.P.Arunachalam
HOD , Department of applied Economics,
Cochin University, Kerala.
Dr.S.R.Keshava
Professor of Economics
Bangalore University, Bangalore.
Dr.S.Chinnammai
Associate Professor of Economics,
University of Madras, Chennai,
Dr.A.Ranga Reddy
Professor Emeritus,
Sri Venkateshwara University
Andhra Pradesh.
Dr. V.Vijay Durga Prasad
Professor and Head Department of
Management Studies
PSCMR College of Engineering and
Technology
Kothapet, Vijayawada -520 001 A.P
Dr.A.Alagumalai
Associate Professor of Political Science,
P.T.M.T.M.College Kamudhi, 623 604
Ch. Anjaneyulu
Assistant Professor
Department of Business Management
Telangana University
Dichpally—Nizamabad, Telangana—India
Dr .Ishwara P
Professor in Commerce
Department of Commerce,
Mangalore University Karnataka
Dr.G.Parimalarani
Associate Professor
Department of Bank Management
Alagappa University
Karaikudi, Tamilnadu
Dr.Rambabu Gopisetti
Chairman, Board of Studies in Commerce
Department of Commerce
Telangana University
Dichpally, Nizamabad
Telangana State -503322
Ms.Bhagyshreehiremath
Assistant Professor of Economics
Indian Institute of Information Technology
Dharwad
Prof.M.Yadagiri
Head & Dean
Faculty of Commerce
Telangana University
Dichpally--Nizamabad--503322
Telangana State – India
Dr. C. Theerthalingam
Head & Assistant Professor of Economics,
Government Arts College (Men),
Krishnagiri – 635001
Dr.G. Uppili Srinivasan,
Assistant Professor of Management Studies,
SASTRA University, Tanjore.

SCHOOL OF COMPUTER SCIENCE, ENGINEERING & TECHNOLOGY
Prof. Naveen Kumar
Associate Professor
Department of Computer Science,
University of Delhi, India-110007
Dr. Rakesh Kumar
Mandal Secretary, CSI, Siliguri
Chapter Assistant Professor
School of Computer Science & Application
North Bengal University P.O.
Darjeeling West Bengal – 734013
Dr. D. Roy Chowdhury
Assistant Professor
School of Computer Science & Application
University of North Bengal
Dr. Ardhendu Mandal
Assistant Professor
School of Computer Science and
Application
University of North Bengal (N.B.U)
Dr. Ms. Bhagyashree D. Hiremath
Assistant Professor
Department of Computer Science and
Engineering
Indian Institute of Information Technology
Dharawd.

SCHOOL OF AGRICULTURAL & RURAL DEVELOPMENT AND EDUCATIONAL
TECHNOLOGY, ENVIRONMENTAL SCIENCE
Dr.V.M.Indumathi
Assistant Professor
Dept. of Agricultural and Rural
Management
Tamil Nadu Agricultural University,
Coimbatore - 641 003
Dr. M.Mirunalini
Assistant Professor
Department of Educational Technology
Bharathidasan University,
Khajamalai Campus
Thruchirappalli – 620 023
Dr.S.Angles
Assistant Professor
Department of Agricultural Economics,
Tamil Nadu Agricultural University,
Coimbatore, Tamil Nadu, India
Pin Code – 641003
Dr. K. Boomiraj
Assistant Professor
Department of Environmental Sciences,
Tamil Nadu Agricultural University,
Coimbatore- 3.
R.Ganesan
Professor and Head, Department of English,
Kongu Engineering College,
Perundurai--638 052
Prof. V.Murugaiyan
Assistant Professor
Post Graduate & Research
Department of History
H.H.Rajah’s College, Pudukottai.
Dr.P.Bamalin
Assistant Professor of English
Sri Bharathi Arts & Science College for
Women
Kaikkurichi, Pudukottai.

SCHOOL OF MATHEMATICS, PHYSIC, EARTH SCIENCE, BOTANY, CHEMISTRY,
MOLECULAR BIOLOGY, ZOOLOGY
Dr. P.K. Omana
Scientist
Ministry of Earth System Science,
Government of India
National Centre for Earth Science Studies,
Trivandrum, Kerala
Dr. S. Loghambal
Assistant professor
Department of Mathematics
V V College of Engineering
Tisaiyanvilai – 627 657
Tamil Nadu, South India
Dr. M.Kumaresan
Professor and Head
Department of Chemistry,
Erode Sengunthar Engineering College,
Perundurai, Erode, Tamilnadu
Dr. Pradip Sarawade
Assistant Professor,
School of Physics
University of Mumbai.
Mumbai-400098 India
Prof.B.Vidya vardhini
Professor in Botany
Principal, University College of Science
Head, Department of Botany
Telangana University
Dichpally, 503322 Nizamabad
Andhra Pradesh, India
Dr. Dhiraj Saha,
Assistant Professor (Senior Scale),
Insect Biochemistry and Molecular Biology
Laboratory,
Department of Zoology, University of North
Bengal,
Dr.Biju V
Assistant Professor of Mathematics,
College of Natural & Computational
Sciences,
Debre Markos University,
Federal Democratic Republic of Ethiopia
Dr.S.Priyan
Assistant Professor,
Department of Mathematics,
MepcoSchlenk Engineering College,
Virudhunagar- 626 005
Dr. M. Aruna
Associate Professor & Head
Department of Botany
Telangana University
Nizamabad. Telangana State India

Emperor International Journal of Finance and Management Research [EIJFMR] ISSN: 2395-5929
@ Mayas Publication Page 14
A STUDY AMONG THE SHAREHOLDERS IN CHIDAMBARAM TALUK,
CUDDALORE DISTRICT, TAMIL NADU
Dr. B. KARTHIKEYAN
Assistant Professor Commerce,
Annamalai University,
Chidambaram, Tamilnadu
Dr. R. SATHISH
Assistant Professor of Commerce,
Sri Sankara Arts and Science College,
Enathur, Kanchipuram, Tamilnadu
Abstract
The household sector represented by
individuals occupies a strategic place among
various economic units in a country as it
contributes substantially to the domestic
savings efforts. An understanding of the
savings behavior of this sector is of crucial
importance in devising appropriate savings
policies. A number of investment avenues
are available before the individual investors.
Among them shares are considered as best
investment avenues since they offer higher
rate of return, risk bearing capacity,
investors awareness, selection of investment
pattern, the researcher was taken by attitude
of the individual investor‟s behavior in
Chidambaram Taluk of Cuddalore District,
Tamil Nadu. The attitudes of the sample
individual investors have adopted assessed
with the help of five point scaling technique
Introduction
The household sector represented by
individuals occupies a strategic place among
various economic units in a country as it
contributes substantially to the domestic
savings efforts. An understanding of the
savings behavior of this sector is of crucial
importance in devising appropriate savings
policies. The word savings here implies the
residual amount that is available for a person
for investment after meeting all his
consumption expenses and repayment of
loans. The economic system depends on an
adequate supply of capital from private
investors. The savings of individual
investors are the main source of capital
investment for business expansion. The
future of the free enterprise system depends
mainly, and almost exclusively on the
continued ability and willingness of
individuals with larger incomes to provide
Paper ID: 13161102

Emperor International Journal of Finance and Management Research [EIJFMR] ISSN: 2395-5929
@ Mayas Publication Page 15
the capital and funds needed to finance the
growth.
The Individual investors can provide funds
to the Industry either by participating in its
equity or by subscribing to its debt
instruments. This participation may be either
direct, or indirect, through mutual funds.
Whatever be the form, their participation is
absolutely necessary for the Industry. If the
savings of the individuals are not trapped in
a proper manner, then it may find its way
into unproductive channels such as
investment in Gold or it may lead to
unscrupulous rise in the consumption
pattern, both of which are not good for the
economy. Hence there is a right need to tap
the savings of the Individuals for productive
investment.
Review of Literature
Sohan Patidar (2010)1 in his article entitled
“Investors Behavior towards Share Market”
has made an attempt to study the behavior of
investors towards share market in the dhar
district. The findings of the study have
proved that age of the investors plays a vital
role in their investment selection. The
investors in the age group of below 35 years
are actively participating in the speculation
trade and the age groups above 55 hesitates 1 Sohan Patidar, “Investor „s Behaviour towards
Share Market,” International Research Journal, Issue
13, October 2010: PP 55-57.
to take risk and are not at all interested in the
share market. Professional people are also
not interested to invest their money in the
share market. Investors falling under the
income group of below ` 20,000 show more
interest in investing their earnings in the
share market.
Anna and Merikas et al., (2011)2 in their
article titled “Economic Factors and
Individual Investor Behavior: The Case of
the Greek Stock Exchange” have examined
the factors that appear to exercise the
greatest influence on the individual investor.
According to the authors, most of the
variables that were rated important are
classic wealth maximization criteria such as
expected corporate earnings, condition of
financial statements, or firm status in the
industry. The authors have also pointed out
that experienced investors rely mostly on
wealth maximization criteria and they are
self reliant. They ignore the inputs of family
members, politicians, and co - workers when
purchasing stocks. The authors have
concluded that the individual behaviour of
active investors in the Athens Stock
Exchange (ASE) is influenced by the overall
2 Anna A. Merikas, Andreas G. Merikas, George S.
Vozikis, Dev Prasad, “Economic Factors and
Individual Investor Behavior: The case of the Greek
stock Exchange,” Journal of Applied Business
Research, Vol. 20, No. 4, 2011: PP 93-97.

Emperor International Journal of Finance and Management Research [EIJFMR] ISSN: 2395-5929
@ Mayas Publication Page 16
trends prevailing at the time of the survey in
the ASE.
Mohammad Reza Tavakoil Bagh
Dadabad. (2011)3 in their article “A Study
on Small Investors‟ Behavior in Choosing
Stock Case Study: Kuala-Lumpur Stock
Market” have attempted a study to
investigate small investors behaviour in
choosing stock in Kuala-Lumpur stock
market. The authors have found that more
than 92 per cent of the investors consult
other persons while making better
investment decision and only less than 8 per
cent rely on their personal experiences and
knowledge. From those people, who would
like to consult with any one, consulting with
a friend is selected as the most consulting
method. Second priority of investors for
making decision would be opinion of the
firms‟ majority stockholders. They have also
stated that newspapers are the most common
second-hand information sources among the
other resources. The authors have concluded
that the institutions and individual investors
consider three variables: of calculating the
risk to stock, government policies and
economic variables as influencing variables
3 Mohammad Reza Tavakoli Baghdadabad, Farid
Habibi Tanha, and Noreha Halid, “A study on small
Investors‟ Behavior in Choosing Stock case study:
Kuala- Lumpur Stock Market,” African Journal of
Business Management, vol. 5, November 2011: PP 1-
11.
on stock selection, but these three variables
have been reducibly applied by small
investors.
Varadharajan and Vikkraman (2011)4
have conducted a study under the title “A
Study on Investor‟s Perception towards
Investment Decision in Equity Market.” The
authors have made an attempt to identify the
investor‟s perceptions towards investment
decision in equity market. The authors have
found out that brokers‟ recommendation,
opinion taken from a friend or a family have
a least influence in decision making. The
authors have concluded that every person in
the equity market is in need of profits. When
there is a profit maker, there is also a loser.
So taking decisions by relying completely
on others opinion may result in negative
returns, this may also comply with the fact
of risk appetite in taking decisions. The
respondents could be self monitoring people
if they have a good decision making in
purchasing a stock. This aspect could be
high or low in them to obtain different
percentage of returns.
4 Varadharajan. P, Vikkraman. P, “ A study on
Investor‟s Perception towards Investment Decision in
Equity Market,” International Journal of
Management, IT and Engineering, vol.1, August
2011: PP
62-81.

Emperor International Journal of Finance and Management Research [EIJFMR] ISSN: 2395-5929
@ Mayas Publication Page 17
Sudarshan Kadariya et al., (2011)5 in their
article titled “Investor Awareness and
Investment on Equity in Nepalese Capital
Market” have made an attempt to study the
awareness of the investors and its
relationship with investment decision in
equity and investors access to market
information. According to the authors,
investor awareness is crucial for the
investment decision making and sustainable
growth of capital market. The result of the
study reveals that equity investors are aware
and their level of awareness is high
compared to desired level. The authors have
found that fully aware equity investors have
more chances of holding high volume of
equity investment. The authors have
concluded that the investor awareness level
is found to be affected by their respective
work experience, understanding of
investment environment, learning
expectation and access to market
information. Equity investors in secondary
market are not satisfied with the available
sources of information and efforts of
information disseminating mechanism.
5 Sudarshan kadariya, Phul Prasad Subedi, Bharati
Joshi, Ram Prasad Nyaupane, “Investor Awareness
and Investment on Equity in Nepalese capital
Market,” Banking Journal, vol. 2, 2011: PP 1-15.
Objectives of the Study
1. The main objective of the study is to
assess the attitude of the sample
individual investors in Chidambaram
Taluk.
2. The other objective being to study the
behaviour of the individual investors in
Chidambaram Taluk.
Research Methodology
The study has been conducted on 240
individual investors who were buying and
selling shares in the through stock broking
offices in Chidambaram Taluk. The study
was conducted in the month of September,
2016. The sample investors were selected by
adopting simple random sampling method.
The primary data relating to the study were
collected by using questionnaire method.
The questionnaire contained two parts
namely, part A and part B. Part A contained
questions relating to demographic profile of
the sample respondents and in part B
questions relating to opinion of individual
investors were included. Simple percentage
alone has been used to analyses the data. By
way of caution it is mentioned here that the
terms „individual investors‟ and „sample
respondents‟ have been interchangeably
used in this article.

Emperor International Journal of Finance and Management Research [EIJFMR] ISSN: 2395-5929
@ Mayas Publication Page 18
Analysis and Interpretation
The age- wise classification of the individual investors who have invested their hard earned
money in the shares is presented in the following table.
Table No.1
Age - wise Classification of the Sample Respondents
SL. No Age(in years) No. of Respondents Percentage
1 25 – 30 51 21.3
2 31 – 40 88 36.7
3 41 – 50 72 30.0
4 51 – 60 25 10.3
5 Above 60 4 1.7
Total 240 100.0
Source: Primary data
The above Table shows that out of the total 240 sample respondents 36.7 per cent, 30.0 percent,
21.3 percent, 10.3 percent and 1.7 percent of them are in the age group of 31 -40 years, 41 – 50
years, 25 – 30 years, 51 – 60 years and Above 60 years respectively. Hence it is concluded that a
considerable percentage of sample respondents are in the age group of 31 – 40 years.
Table No.2
Gender of the Respondents
SL. No Gender No. of Respondents Percentage
1 Male 201 83.7
2 Female 39 16.3
Total 240 100.0
Source: Primary data
The above Table 2 relating to gender of the sample respondents reveals that 83.7 per cent of the
sample respondents belong to male category and 16.3 per cent of the respondents belong to
female category. Hence it is concluded that majority of the sample respondents who have
invested in shares belong to male gender. There is no wonder in it because when compared to
male sex, female gender are more cautious in nature and due to this they might not have
preferred shares.
Marital status
The authors wanted to know whether the shares have been preferred by the married one or
Bachelors. For this purpose a question relating to this one had been included in the questionnaire
and the responses of the sample respondents are presented in the following table. Sample
respondents are presented below.
Table No.3
Marital status of the Sample Respondents
SL. No Marital status No. of Respondents Percentage
1 Married 190 79.2
2 Unmarried 50 20.8
Total 240 100.0
Emperor International Journal of Finance and Management Research [EIJFMR] ISSN: 2395-5929
@ Mayas Publication Page 19
The above Table exhibits that out of the total 240 sample respondents, 79.2 per cent of the
respondents are married and 20.8 per cent of the respondents are unmarried. So it may be
concluded that majority of the respondents who have preferred shares are married. Since the rate
of return on the shares are high when compared to Bank deposits and Govt. Guaranteed
investment avenues, the married people sample individual investors in order to run their families
in a better manner might have preferred shares than unmarried people sample individual
investors.
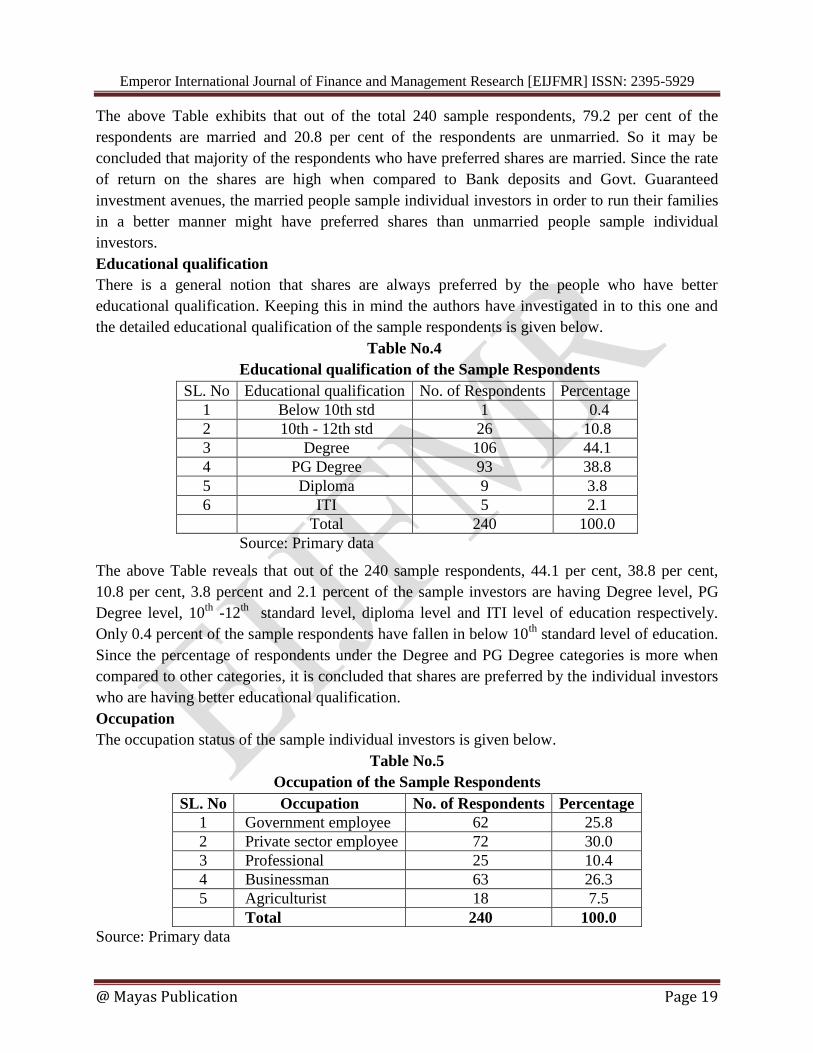
Educational qualification
There is a general notion that shares are always preferred by the people who have better
educational qualification. Keeping this in mind the authors have investigated in to this one and
the detailed educational qualification of the sample respondents is given below.
Table No.4
Educational qualification of the Sample Respondents
SL. No Educational qualification No. of Respondents Percentage
1 Below 10th std 1 0.4
2 10th - 12th std 26 10.8
3 Degree 106 44.1
4 PG Degree 93 38.8
5 Diploma 9 3.8
6 ITI 5 2.1
Total 240 100.0
Source: Primary data
The above Table reveals that out of the 240 sample respondents, 44.1 per cent, 38.8 per cent,
10.8 per cent, 3.8 percent and 2.1 percent of the sample investors are having Degree level, PG
Degree level, 10th
-12th
standard level, diploma level and ITI level of education respectively.
Only 0.4 percent of the sample respondents have fallen in below 10th
standard level of education.
Since the percentage of respondents under the Degree and PG Degree categories is more when
compared to other categories, it is concluded that shares are preferred by the individual investors
who are having better educational qualification.
Occupation
The occupation status of the sample individual investors is given below.
Table No.5
Occupation of the Sample Respondents
SL. No Occupation No. of Respondents Percentage
1 Government employee 62 25.8
2 Private sector employee 72 30.0
3 Professional 25 10.4
4 Businessman 63 26.3
5 Agriculturist 18 7.5
Total 240 100.0
Source: Primary data

Emperor International Journal of Finance and Management Research [EIJFMR] ISSN: 2395-5929
@ Mayas Publication Page 20
The above Table relating to the occupational status of the respondents reveals that out of the 240
sample respondents, 30.0 per cent of the them are private sector employees, 26.3 per cent of
them are businessmen, 25.8 per cent of the them are government employees, 10.4 per cent of
them are professionals and 7.5 per cent of them are agriculturists. Hence it may be concluded
that a sizeable number of sample respondents (72) who have invested in shares belong to private
sector employees category. When compared to Government employees, there is no job security
for private sector employees. This one might have motivated the private sector employees to
invest in shares which give higher rate of return than bank deposits.
Monthly income
The monthly income classification of the sample respondents is presented in the following table.
Table No.6
Monthly income of the Sample Respondents
SL. No Monthly income No. of Respondents Percentage
1 ` 10,000 – 20,000 49 20.4
2 ` 20,001 – 25,000 64 26.7
3 ` 25,001 – 30,000 55 22.9
4 ` 30,001 – 35,000 40 16.7
5 Above ` 35,000 32 13.3
Total 240 100.0
Source: Primary data
It is revealed from the Table 6 that out of the 240 sample respondents 26.7 per cent of the
respondents belong to the monthly income group of ` 20,001 – 25,000, 22.9 per cent of the
respondents fall in the monthly income group of ` 25,001 – 30,000, 20.4 per cent of the
respondents are in the monthly income group of ` 10,000 – 20,000, 16.7 per cent of the
respondents fall in the monthly income group of ` 30,001 – 35,000, 13.3 per cent of the
respondents fall in the monthly income group of above ` 35,000. It may be concluded that a
considerable size (26.7 per cent) of the respondents belong to ` 20,001 – 25,000 monthly income
category.
Size of the family
It is assumed by the authors that there is a strong relationship between the family size of the
respondents and their investment in shares. Hence a question relating to this one was
incorporated in the questionnaire and the responses of the sample individual investors are given
below.
Table No.7
Family size of the Respondents
SL. No Number of members No. of Respondents Percentage
1 1 to 3 members 102 42.5
2 4 to 6 members 120 50.0
3 Above 6 members 18 7.5
Total 240 100.0
Source: Primary data
Emperor International Journal of Finance and Management Research [EIJFMR] ISSN: 2395-5929
@ Mayas Publication Page 21
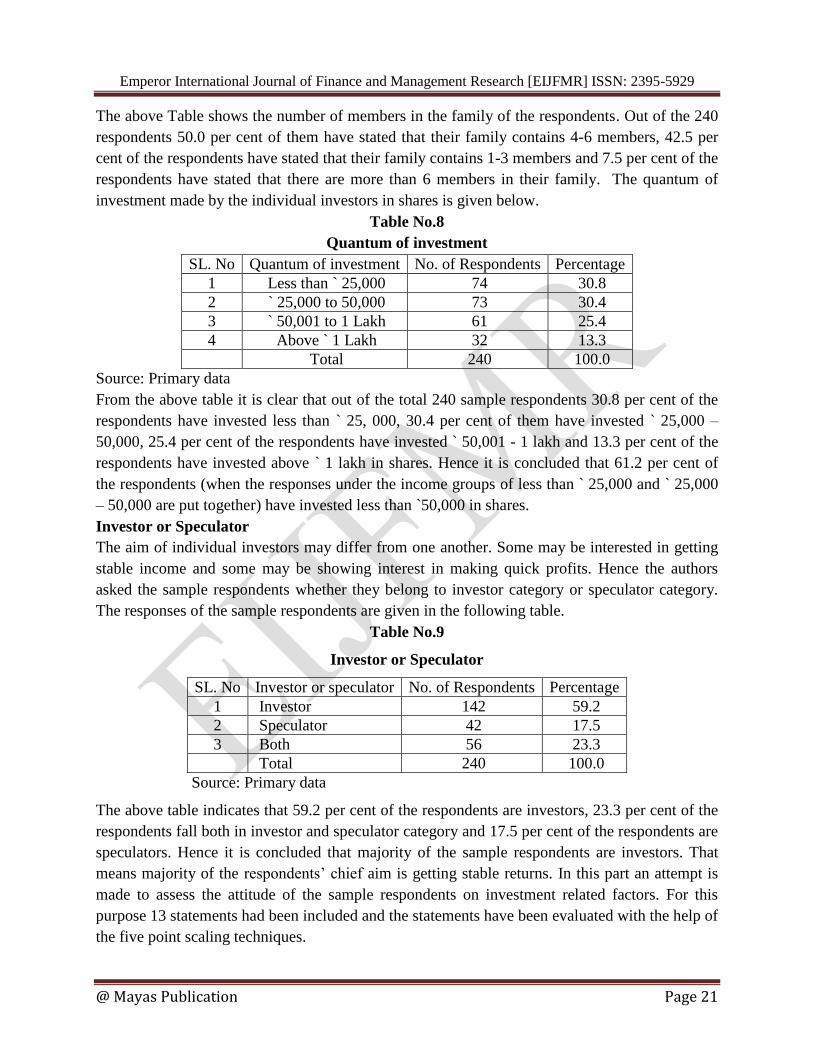
The above Table shows the number of members in the family of the respondents. Out of the 240
respondents 50.0 per cent of them have stated that their family contains 4-6 members, 42.5 per
cent of the respondents have stated that their family contains 1-3 members and 7.5 per cent of the
respondents have stated that there are more than 6 members in their family. The quantum of
investment made by the individual investors in shares is given below.
Table No.8
Quantum of investment
SL. No Quantum of investment No. of Respondents Percentage
1 Less than ` 25,000 74 30.8
2 ` 25,000 to 50,000 73 30.4
3 ` 50,001 to 1 Lakh 61 25.4
4 Above ` 1 Lakh 32 13.3
Total 240 100.0
Source: Primary data
From the above table it is clear that out of the total 240 sample respondents 30.8 per cent of the
respondents have invested less than ` 25, 000, 30.4 per cent of them have invested ` 25,000 –
50,000, 25.4 per cent of the respondents have invested ` 50,001 - 1 lakh and 13.3 per cent of the
respondents have invested above ` 1 lakh in shares. Hence it is concluded that 61.2 per cent of
the respondents (when the responses under the income groups of less than ` 25,000 and ` 25,000
– 50,000 are put together) have invested less than `50,000 in shares.
Investor or Speculator
The aim of individual investors may differ from one another. Some may be interested in getting
stable income and some may be showing interest in making quick profits. Hence the authors
asked the sample respondents whether they belong to investor category or speculator category.
The responses of the sample respondents are given in the following table.
Table No.9
Investor or Speculator
SL. No Investor or speculator No. of Respondents Percentage
1 Investor 142 59.2
2 Speculator 42 17.5
3 Both 56 23.3
Total 240 100.0
Source: Primary data
The above table indicates that 59.2 per cent of the respondents are investors, 23.3 per cent of the
respondents fall both in investor and speculator category and 17.5 per cent of the respondents are
speculators. Hence it is concluded that majority of the sample respondents are investors. That
means majority of the respondents‟ chief aim is getting stable returns. In this part an attempt is
made to assess the attitude of the sample respondents on investment related factors. For this
purpose 13 statements had been included and the statements have been evaluated with the help of
the five point scaling techniques.

Emperor International Journal of Finance and Management Research [EIJFMR] ISSN: 2395-5929
@ Mayas Publication Page 22
Table 12
Attitude of individual investors
SL .No FACTORS SA A NA DA SDA Total
1 I have good knowledge about the stock market. 47
(19.6)
86
(35.8)
61
(25.4)
40
(16.7)
6
(2.5) 240
(100)
2 Whenever there is a slowdown in the stock market in India Individual investors
Should focus their attention on risk free investments.
80
(33.3)
111
(46.3)
35
(14.6)
13
(5.4)
1
(0.4 240
(100)
3 By investing in shares an individual investor can beat inflation. 55
(22.9)
104
(43.3)
53
(22.1)
25
(10.4)
3
(1.3) 240
(100)
4 Before investing my money in shares as an
Individual investor I go through the prospectus carefully
54
(22.5)
112
(46.7)
52
(21.7)
20
(8.3)
2
(0.8) 240
(100)
5 I am always tempted by attractive headlines appealing
visuals and catchy messages.
46
(19.2)
60
(25.0)
69
(28.7)
53
(22.1)
12
(5.0) 240
(100)
6 Every individual investor should deal with registered intermediary only. 82
(34.1)
111
(46.2)
28
(11.7)
15
(6.3)
4
(1.7) 240
(100)
7 Companies are cheating the investing public by giving rosy picture. 22
(9.1)
87
(36.3)
55
(22.9)
45
(18.8)
31
(12.9) 240
(100)
8 Whenever I invest in the shares of any company
I notice the directors of that company.
37
(15.4)
70
(29.2)
60
(25.0)
61
(25.4)
12
(5.0) 240
(100)
9 I am adopting Buy low; Sell high mantra. 74
(30.8)
110
(45.8)
42
(17.5)
8
(3.3)
6
(2.6) 240
(100)
10 My investment preference mainly depends upon
my friends / colleagues/ peers investment decision.
27
(11.2)
64
(26.7)
75
(31.3)
60
(25.0)
14
(5.8) 240
(100)
11 Sometimes knowingly or unknowingly I am influenced
by hearsays and rumours.
29
(12.1)
66
(27.5)
82
(34.2)
44
(18.3)
19
(7.9) 240
(100)
12 I give less importance for the risk factors mentioned
in the prospectus of the company.
36
(15)
114
(47.5)
65
(27.0)
21
(8.8)
4
(1.7) 240
(100)
13 My investment decision mainly depends on the credit rating obtained by the
company.
34
(14.1)
99
(41.3)
52
(21.7)
44
(18.3)
11
(4.6) 240
(100)
SA - Strongly Agree, A - Agree, NDA - Neither Agree nor disagree, D - Disagree, SD - Strongly disagree

Emperor International Journal of Finance and Management Research [EIJFMR] ISSN: 2395-5929
@ Mayas Publication Page 23
From the above five point scale it is clear
that the statements such as „I have good
knowledge about the stock market‟,
„whenever there is a slowdown in the stock
market in India individual investors should
focus their attention on risk free
investments‟, By investing in shares an
individual investor can beat inflation‟,
„Before investing my money in shares as an
Individual investor I go through the
prospectus carefully‟, „Every individual
investor should deal with registered
intermediary only‟,. „I am adopting Buy
low; Sell high mantra‟, „I give less
importance for the risk factors mentioned in
the prospectus of the company‟ and „My
investment decision mainly depends on the
credit rating obtained by the company‟ have
been agreed and disagreed by 55.4 percent,
79.6 percent, 66.2 percent, 69.2 percent,
80.3 percent, 76.6 percent, 62.4 percent and
55.5 percent of the sample respondents
respectively. Statements such as „I am
always tempted by attractive headlines
appealing visuals and catchy messages‟,
„Whenever I invest in the shares of any
company I notice the directors of that
company‟, „My investment preference
mainly depends upon my friends /
colleagues/ peers investment decision‟,
„Sometimes knowingly or unknowingly I am
influenced by hearsays and rumours‟ have
been neither agreed nor disagreed by the
28.8 percent, 25.0 percent, 31.3 percent and
34.2 percent of the sample respondents
respectively. 31.7 percent and 30.4 percent
of the sample respondents have expressed
their level of disagreement with the
statements „companies are cheating the
investing public by giving rosy picture‟ and
„ whenever I invest in the shares of any
company I notice the directors of that
company‟ respectively.
Findings of the Study
A considerable percentage (36.7 per cent) of
the sample respondents are in the age group
of 31– 40 years. Majority (83.7 per cent) of
the sample respondents who have invested
in shares belong to male category. Majority
(79.2 Per cent) of the sample respondents
who have preferred shares are married. 44.2
per cent of the sample respondents are
graduates. A sizeable number of respondents
(72) are private sector employees. 26.7 per
cent of the sample respondents belong to `
20,001 – 25,000 monthly income category.
50.0 per cent of the respondents have stated
that their family contains 4-6 members. 61.2
per cent of the sample respondents have
invested less than ` 50,000. 59.2 per cent of
the sample respondents belong to investor‟s
category. The results of the five point

Emperor International Journal of Finance and Management Research [EIJFMR] ISSN: 2395-5929
@ Mayas Publication Page 24
scaling technique reveal (the responses
under strongly agree and agree have been
put together) the following: 55.4 percent of
the sample respondents are having good
amount of knowledge about the stock
market. 79.6 percent of the sample
respondents have stated that they would
focus their attention on risk free investment
when there is a slowdown in the Indian
stock markets which is quite natural one.
66.2 percent of the sample respondents
believe that by investing in shares inflation
can be beaten. 69.2 percent of the sample
respondents go through the prospectus
carefully before parking their hard earned
savings in shares. Only 44.2 percent of the
sample respondents are always tempted by
attractive headlines, appealing visuals and
catchy messages. 80.5 percent of the
individual investors are of the opinion that
individual investors should deal with
registered intermediary only. 76.2 percent of
the individual investors are adopting buy
low sell high mantra. These sample
respondents may be termed as wise
investors. It is wonder to mention that 62.4
percent of the individual investors have
accepted that they give less importance for
the risk factors mentioned in the prospectus
of the company. 55.3 percent of the sample
respondents have agreed that their
investment decision mainly depends on the
credit rating obtained by their companies.
Conclusion
The findings of the study it can be
concluded that majority of the sample
shareholders have good amount of
knowledge about the stock market. They
have begun to think that one can beat
inflationary pressure by investing in the
stock market. It is a welcome trend. Because
when money is parked in shares then the
industries will begin to flourish and this will
pave way for economic development of our
nation.
Reference
1. Sohan Patidar, “Investor„s Behaviour
towards Share Market,” International
Research Journal, Issue 13, October
2010: PP 55-57.
2. Anna A. Merikas, Andreas G. Merikas,
George S. Vozikis, Dev Prasad,
“Economic Factors and Individual
Investor Behavior: The case of the Greek
stock Exchange,” Journal of Applied
Business Research, Vol. 20, No. 4, 2011:
PP 93-97.
3. Mohammad Reza Tavakoli
Baghdadabad, Farid Habibi Tanha, and
Noreha Halid, “A study on small
Investors‟ Behavior in Choosing Stock
case study: Kuala- Lumpur Stock

Emperor International Journal of Finance and Management Research [EIJFMR] ISSN: 2395-5929
@ Mayas Publication Page 25
Market,” African Journal of Business
Management, vol. 5, November 2011:
PP 1-11.
4. Varadharajan. P, Vikkraman. P, “ A
study on Investor‟s Perception towards
Investment Decision in Equity Market,”
International Journal of Management, IT
and Engineering, vol.1, August 2011: PP
62-81.
5. Sudarshan kadariya, Phul Prasad Subedi,
Bharati Joshi, Ram Prasad Nyaupane,
“Investor Awareness and Investment on
Equity in Nepalese capital Market,”
Banking Journal, vol. 2, 2011: PP 1-15.