Empathic behavioral and physiological responses to dynamic stimuli in depression
12
Empathic behavioral and physiological responses to dynamic stimuli in depression Daniel Schneider a,b,n , Christina Regenbogen a,b , Thilo Kellermann a,b , Andreas Finkelmeyer c , Nils Kohn a,b , Birgit Derntl a,d , Frank Schneider a,b,e , Ute Habel a,b a Department of Psychiatry, Psychotherapy and Psychosomatics, Medical School, RWTH Aachen University, Germany b JARA Translational Brain Medicine, J¨ ulich, Germany c Institute of Neuroscience, Newcastle University, Newcastle Upon Tyne, England, UK d Institute of Clinical, Biological and Differential Psychology, University of Vienna, Austria e School of Medicine, University of Pennsylvania, Philadelphia article info Article history: Received 7 December 2011 Received in revised form 26 March 2012 Accepted 30 March 2012 Keywords: Depression Emotion processing Dynamic stimulus material Verbal information Emotional context insensitivity Galvanic skin conductance abstract Major depressive disorder (MDD) is strongly linked to social withdrawal and interpersonal problems which characterize the disorder and further aggravate symptoms. Investigating the nature of impaired emotional-social functioning as a basis of interpersonal functioning in MDD has been widely restricted to static stimuli and behavioral emotion recognition accuracy. The present study aimed at examining higher order emotional processes, namely empathic responses and its components, emotion recogni- tion accuracy and affective responses in 28 MDD patients and 28 healthy control participants. The dynamic stimulus material included 96 short video clips depicting actors expressing basic emotions by face, voice prosody, and sentence content. Galvanic skin conductance measurements revealed implicit processes in the multimethod assessment of empathy. Overall, patients displayed lower empathy, emotion accuracy, and affective response rates than controls. Autonomous arousal was higher in patients. A generalized emotion processing deficit is in line with the ‘‘emotional context insensitivity’’ (ECI) theory which proposes decreased overall responsive- ness to emotional stimuli. The dissociation between hypo-reactivity in explicit and hyper-reactivity in implicit measures of emotion processing can be related to the ‘‘limbic-cortical dysregulation’’ model of depression. Our findings support the dissociation of autonomic and subjective emotional responses which may account for interpersonal as well as emotional deficits in depression. & 2012 Elsevier Ireland Ltd. All rights reserved. 1. Introduction Empathy, the ability to recognize, understand, and share the emotions of others conveys a feeling of social coherence and constitutes a central part of human social interactions which are essential for our adaptive functioning (Ekman, 1982; Plutchik, 1982; Plutchik and Kellermann, 1989; Ekman, 2003; Lewis et al., 2008). Although a variety of different definitions contribute to the complex and multidimensional construct of empathy (Derntl et al., 2009, 2010) most theoretical models include three core components: emotion recognition, affective response, and per- spective taking (Preston and de Waal, 2002; Decety and Jackson, 2004; Leiberg and Anders, 2006; Singer, 2006; Batson, 2009; Singer and Lamm, 2009) while implying the distinction into ‘‘self’’ and ‘‘other’’ (de Vignemont and Singer, 2006). The ability to empathize is suggested to be affected in unipolar major depressive disorder due to the central defining clinical fea- tures: depressed mood and anhedonia which often lead to a limited affective range and subsequent social malfunctioning (Wells et al., 1989; Beck et al., 1996). Empirically, deficits have been characterized by an impaired ability to identify and discriminate emotions con- veyed via facial expressions (Lepp ¨ anen et al., 2004; Lepp ¨ anen, 2006; Surguladze et al., 2004, 2005; Suslow et al., 2004; Bourke et al., 2010), as well as distorted emotion self-regulation capacities (Beauregard et al., 2006; Diener et al., 2009). These findings are further supported by self-reports following mood induction procedures conveying a blunted affect in depressed patients (Goodwin and Williams, 1982; Nelson and Stern, 1988; Falkenberg et al., 2012). The latter is one facet of emotion reactivity, which we see as the response aspect of emotion processing (e.g. subjective, behavioral, physiological, as well as cerebral, Keltner and Gross, 1999). Contents lists available at SciVerse ScienceDirect journal homepage: www.elsevier.com/locate/psychres Psychiatry Research 0165-1781/$ - see front matter & 2012 Elsevier Ireland Ltd. All rights reserved. http://dx.doi.org/10.1016/j.psychres.2012.03.054 n Corresponding author at: Department of Psychiatry, Psychotherapy, and Psychosomatics, Medical School, RWTH Aachen University, Pauwelsstrasse 30, 52074 Aachen, Germany. Tel.: þ49 241 80 89693; fax: þ49 241 8082 401. E-mail address: [email protected] (D. Schneider). Please cite this article as: Schneider, D., et al., Empathic behavioral and physiological responses to dynamic stimuli in depression. Psychiatry Research (2012), http://dx.doi.org/10.1016/j.psychres.2012.03.054 Psychiatry Research ] (]]]]) ]]]–]]]
-
Upload
independent -
Category
Documents
-
view
0 -
download
0
Transcript of Empathic behavioral and physiological responses to dynamic stimuli in depression

Psychiatry Research ] (]]]]) ]]]–]]]
Contents lists available at SciVerse ScienceDirect
Psychiatry Research
0165-17
http://d
n Corr
Psychos
52074 A
E-m
PleasPsyc
journal homepage: www.elsevier.com/locate/psychres
Empathic behavioral and physiological responses to dynamic stimuliin depression
Daniel Schneider a,b,n, Christina Regenbogen a,b, Thilo Kellermann a,b, Andreas Finkelmeyer c,Nils Kohn a,b, Birgit Derntl a,d, Frank Schneider a,b,e, Ute Habel a,b
a Department of Psychiatry, Psychotherapy and Psychosomatics, Medical School, RWTH Aachen University, Germanyb JARA Translational Brain Medicine, Julich, Germanyc Institute of Neuroscience, Newcastle University, Newcastle Upon Tyne, England, UKd Institute of Clinical, Biological and Differential Psychology, University of Vienna, Austriae School of Medicine, University of Pennsylvania, Philadelphia
a r t i c l e i n f o
Article history:
Received 7 December 2011
Received in revised form
26 March 2012
Accepted 30 March 2012
Keywords:
Depression
Emotion processing
Dynamic stimulus material
Verbal information
Emotional context insensitivity
Galvanic skin conductance
81/$ - see front matter & 2012 Elsevier Irelan
x.doi.org/10.1016/j.psychres.2012.03.054
esponding author at: Department of Psyc
omatics, Medical School, RWTH Aachen Un
achen, Germany. Tel.: þ49 241 80 89693; fa
ail address: [email protected] (D. Schn
e cite this article as: Schneider, D.,hiatry Research (2012), http://dx.do
a b s t r a c t
Major depressive disorder (MDD) is strongly linked to social withdrawal and interpersonal problems
which characterize the disorder and further aggravate symptoms. Investigating the nature of impaired
emotional-social functioning as a basis of interpersonal functioning in MDD has been widely restricted
to static stimuli and behavioral emotion recognition accuracy. The present study aimed at examining
higher order emotional processes, namely empathic responses and its components, emotion recogni-
tion accuracy and affective responses in 28 MDD patients and 28 healthy control participants.
The dynamic stimulus material included 96 short video clips depicting actors expressing basic
emotions by face, voice prosody, and sentence content. Galvanic skin conductance measurements
revealed implicit processes in the multimethod assessment of empathy.
Overall, patients displayed lower empathy, emotion accuracy, and affective response rates than
controls. Autonomous arousal was higher in patients. A generalized emotion processing deficit is in line
with the ‘‘emotional context insensitivity’’ (ECI) theory which proposes decreased overall responsive-
ness to emotional stimuli. The dissociation between hypo-reactivity in explicit and hyper-reactivity in
implicit measures of emotion processing can be related to the ‘‘limbic-cortical dysregulation’’ model of
depression. Our findings support the dissociation of autonomic and subjective emotional responses
which may account for interpersonal as well as emotional deficits in depression.
& 2012 Elsevier Ireland Ltd. All rights reserved.
1. Introduction
Empathy, the ability to recognize, understand, and share theemotions of others conveys a feeling of social coherence andconstitutes a central part of human social interactions which areessential for our adaptive functioning (Ekman, 1982; Plutchik,1982; Plutchik and Kellermann, 1989; Ekman, 2003; Lewis et al.,2008). Although a variety of different definitions contribute to thecomplex and multidimensional construct of empathy (Derntlet al., 2009, 2010) most theoretical models include three corecomponents: emotion recognition, affective response, and per-spective taking (Preston and de Waal, 2002; Decety and Jackson,2004; Leiberg and Anders, 2006; Singer, 2006; Batson, 2009;
d Ltd. All rights reserved.
hiatry, Psychotherapy, and
iversity, Pauwelsstrasse 30,
x: þ49 241 8082 401.
eider).
et al., Empathic behaviorali.org/10.1016/j.psychres.201
Singer and Lamm, 2009) while implying the distinction into ‘‘self’’and ‘‘other’’ (de Vignemont and Singer, 2006).
The ability to empathize is suggested to be affected in unipolarmajor depressive disorder due to the central defining clinical fea-tures: depressed mood and anhedonia which often lead to a limitedaffective range and subsequent social malfunctioning (Wells et al.,1989; Beck et al., 1996). Empirically, deficits have been characterizedby an impaired ability to identify and discriminate emotions con-veyed via facial expressions (Leppanen et al., 2004; Leppanen, 2006;Surguladze et al., 2004, 2005; Suslow et al., 2004; Bourke et al., 2010),as well as distorted emotion self-regulation capacities (Beauregardet al., 2006; Diener et al., 2009). These findings are further supportedby self-reports following mood induction procedures conveying ablunted affect in depressed patients (Goodwin and Williams, 1982;Nelson and Stern, 1988; Falkenberg et al., 2012). The latter is onefacet of emotion reactivity, which we see as the response aspect ofemotion processing (e.g. subjective, behavioral, physiological, as wellas cerebral, Keltner and Gross, 1999).
and physiological responses to dynamic stimuli in depression.2.03.054

D. Schneider et al. / Psychiatry Research ] (]]]]) ]]]–]]]2
While these findings yield insights into one component ofempathy, emotion recognition, there exists also empirical evi-dence on impaired functioning in the cognitive aspect of empathy,‘Theory of Mind’ (Cusi et al., 2012). Here, depressed patients havealso been shown to be impaired in decoding and reasoning aboutmental states of others (Lee et al., 2005; Wolkenstein et al., 2011)or combining contextual information and prior knowledge aboutan individual or situation to understand behavior (Dziobek et al.,2006; Derntl et al., 2010). However, insights into the very natureof emotional empathy deficits in depression are very sparse(Brune and Brune-Cohrs, 2006). This may be due to the fact thatthe core emotional and cognitive components of empathy havebeen studied separately and not in their entity. Further, only fewstudies have addressed the processing of emotional verbal(Rubinow and Post, 1992; Elliott et al., 2002; Kan et al., 2004)or prosodic (Emerson et al., 1999) information. However, thesecommunication cues have also been shown to be importantsignals when conveying emotionality in human interactions (deGelder and Vroomen, 2000; Stevenson et al., 2011).
Several theoretical concepts have been developed to accountfor the emotional deficits in depression. One line of researchsuggested emotion-specific abnormalities with a so-called ‘nega-tivity bias’ (for a review see Bourke et al., 2010) accounting for‘negative potentiation’ and ‘positive attenuation’ phenomena.This explains why depressed patients recognize sad facial expres-sions significantly better and show a larger attention bias towardsthem (‘negative potentiation’) (Gur et al., 1992; Matthews andAntes, 1992; Bouhuys et al., 1996; Hale, 1998; Elliot et al., 2002;Gotlib et al., 2004; Leppanen, 2006; Raes et al., 2006) but at thesame time show reduced emotional reactions to happy facialexpressions (‘positive attenuation’) (Sloan et al., 1997). Otherstudies showed that acute patients judged facial expressionsmore negatively than remitted patients and controls (e.g.Levkovitz et al., 2003).
Contrary to this, the ‘emotional context insensitivity’ (ECI)suggests a generalized deficit in major depression to recognizeemotions irrespective of their valence (Taesdale, 1983; Feinberget al., 1986; Rubinow and Post, 1992; Persad and Polivy, 1993;Asthana et al., 1998; Rottenberg et al., 2005). The theory explainswhy patients become disengaged with the environment, and exhibitless attention and reactivity to both positive and negative stimuli(Nesse, 2000; Rottenberg, 2005; Rottenberg and Gross (2007);Bylsma et al., 2008). The evolutionary idea behind it is that furtheraction in a situation where it has not been effective (e.g. famine)may waste valuable resources or lead to more negative outcomes ifa previously tried strategy to reach a goal is not working. Sodepression can be described as a defensive motivational state thatadvocates personal and environmental disengagement resulting inan overall flattened affect (Nesse, 2000).
While these theories coexist, controversies on a behavioral aswell as physiological level cannot be accounted for by either ofthem. For instance, physiological responses towards emotionalstimuli have been reported to be blunted (Dawson et al., 1977,1985; Tsai et al., 2003; Foti et al., 2010), similar (Rottenberg et al.,2005), and even elevated (Guinjoan et al., 1995; Gross andLevenson, 1997; Falkenberg et al., 2012) in depressed patientscompared to healthy controls. Furthermore, emotion processing isa multi-faceted construct, comprising automatic or implicit aswell as consciously controlled or explicit components. Here,another dissociation became apparent by reports showingflattened emotional behavioral on the one side and elevatedautonomic responses on the other (Brown et al., 1978; Guinjoanet al., 1995; Gross and Levenson, 1997; Suslow et al., 2010;Falkenberg, et al., 2012; for a review see Cusi et al., 2012).
A theoretical model which may explain these inconsistenciesand shed light on the seemingly apparent dissociation is the
Please cite this article as: Schneider, D., et al., Empathic behavioralPsychiatry Research (2012), http://dx.doi.org/10.1016/j.psychres.201
‘limbic-cortical dysregulation’ model of depression (Mayberg,1997). Accordingly, depressed patients tend to show hypo-activ-ity in prefrontal regions and hyper-activity in limbic regions(Drevets, 1999, 2001; Mayberg et al., 1999; Siegle et al., 2007).Both of these regions are associated with a broader neuralnetwork involved in emotion processing (Henriques andDavidson, 1991; Damasio, 1996; Ochsner et al., 2002; Phanet al., 2002). Especially, the prefrontal cortex plays a role inemotion processing involving emotional decision making, reap-praisal, and self-regulation (for a review see Phan et al., 2002).Additionally, neural activity in limbic brain regions has beenlinked to implicit and autonomous physiological arousal(Fredrikson et al., 1998; LeDoux, 1998; Mayberg et al., 1999;Williams et al., 2001; Siegle et al., 2007; Laine et al., 2009).Consequently, the model might account for both a generalizeddeficit in emotion reactivity on a behavioral level as described bythe ECI and at the same time explains elevated autonomous arousal.
The present study follows an innovative experimentalapproach to study empathy in depression and pays tribute tothe multi-faceted construct of emotion processing while investi-gating aspects that can shed some light on the theoreticalinconsistencies. We measure behavioral empathy and its compo-nents (emotion recognition, affective responses) in depressedpatients. Except our own (Derntl et al., 2010; Regenbogen et al.,2012a,b), studies that assess the different empathy componentssimultaneously are completely lacking. We used a validated set ofnaturalistic dynamic emotional video clips instead of staticmaterial containing higher degrees of authenticity and natural-ness, enabling ecological validity and being potentially moreeffective in eliciting empathic responses (see also Weyers et al.,2006; Trautmann et al., 2009). Hence, we were able to examinethe combined influence and emotion-specific impact of non-verbal (facial expressions), para-verbal (prosody), and verbal(speech content) information on empathy and its two compo-nents. Furthermore, we controlled for the influence of speechcomprehension on empathy by including an experimentalcondition in which the actor spoke in a foreign language. Neutralvideo clips served as a control. Lastly, we assessed empathicresponses not only on a behavioral level but also includedgalvanic skin conductance (GSC) measurements to reveal bothexplicit and implicit components of empathy in a multimethodapproach.
We expected a generalized deficit of emotion processing indepressed patients. Patients were hypothesized to display attenu-ated behavioral empathy caused by low emotion recognition ratesand a coexisting decrease in affective response matching the targetemotion, the two components of empathy. In line with the ‘limbic-cortical dysregulation’ model and preceding evidence in our group(Falkenberg et al., 2012), depressed patients were expected toexhibit a higher number of skin conductance responses during theperception of emotional stimuli as compared to healthy controlswhich might represent a postulated physiological effect of increasedlimbic activation. Further, video clips with accessible verbal infor-mation were suggested to result in higher behavioral empathy thanthose with incomprehensible speech, irrespective of participantgroup. This was expected against the background of multimodalprocessing facilitating emotion processing and empathy (Seubertet al., 2010; Regenbogen et al., 2012b).
2. Methods
2.1. Participants
Twenty-eight patients with unipolar major depressive disorder (16 males, age
mean¼39.64, S.D.¼10.13 years, range 21–54 years) were included. All patients
were recruited from in- and out-patient treatment facilities of the Department of
and physiological responses to dynamic stimuli in depression.2.03.054

D. Schneider et al. / Psychiatry Research ] (]]]]) ]]]–]]] 3
Psychiatry, Psychotherapy, and Psychosomatics, RWTH Aachen University. They
were diagnosed by means of the Structured Clinical Interview for DSM-IV
Disorders (SCID-I; Wittchen et al., 1997) and excluded in case of any psychiatric
comorbidity or acute suicidal tendency. Depressive symptom severity was
assessed using the Hamilton Depression Scale (HAMD-17; Hamilton, 1960)
(mean¼8.61, S.D.¼3.03, range 4–15) and the Beck Depression Inventory (BDI-II;
Beck, Steer & Brown, 1996) (mean¼24.78, S.D.¼15.44, range 4–57). Scales
revealed a moderate to severe overall depressive symptomatology. All patients
received antidepressant medication (SSRI N¼7; SNRI N¼12; NARI N¼2; TCA
N¼2; TeCA N¼5, Table 1).
Twenty-eight healthy age- and education-matched control participants (15 males,
age mean¼34.68, S.D.¼8.76 years, range 25–52 years; age: t¼1.96, P¼0.06; educa-
tion: t¼1.58, P¼0.12, independent t-tests between groups). They were recruited via
local advertisements and reported a clear history of psychiatric illness. Exclusion
criteria for all participants involved a history of any neurological or cardiovascular
illness, head injury, metabolic, endocrinological or cardiac disease, current substance
abuse, mental retardation, left-handedness (Oldfield, 1971), or difficulties in identifying
and describing emotions according to the 20-item Toronto Alexithymia Scale (TAS-20,
Bagby et al., 1986) with an above threshold value of 61. Prior to testing, participants
were informed about the experimental procedure and data acquisition. Informed
written consent was obtained in accordance with the requirements of the local ethics
committee and the declaration of Helsinki. All participants were given a monetary
compensation of 20 h.
Table 1Participants’ demographic data, questionnaire results and neuropsychological
assessment. MDD¼patients with major depressive disorder, HC¼healthy controls.
For the VERT, data of one HC and six MDD patients were not available due to
recoding problems which reduces degress of freedom (d.f.) to 48. SSRIs: Selective
Serotonin Reuptake Inhibitors, SNRIs: Serotonin–Norepinephrine Reuptake Inhi-
bitors, NARI: Noradrenaline Reuptake Inhibitors, TCAs: Tricyclic Antidepressants,
TeCAs: Tetracyclic Antidepressants. For explanation of other abbreviations for
questionnaires and neuropsychological test batteries see text.
Demographic data t-Test
M7S.D.
MDD HC T (54) P
Age (years) 39.64710.13 34.6878.76 �1.96 0.055
Education (years) 12.0471.07 12.4670.96 1.58 0.121
Illness duration (years) 6.8279.04
Questionnaires
SPF 29.7576.11 33.8276.14 2.49 0.016*
FS 11.8673.34 13.2172.95 1.61 0.113
PT 14.3273.06 15.3972.81 1.37 0.177
EC 15.3272.61 14.8272.70 �0.71 0.484
PD 11.7573.15 10.0472.76 �2.17 0.034*
E-scale 3.0070.71 3.0770.72 0.37 0.715
CS 2.6070.92 2.8471.04 0.92 0.359
ES 2.9170.79 3.0970.90 0.78 0.440
EC 3.5570.83 3.3470.78 �0.97 0.336
CC 2.9470.88 3.0170.78 0.32 0.750
TAS-20 55.7179.45 37.6877.00 �8.11 o0.001*
DDF 15.9674.31 10.6473.05 �5.34 o0.001*
DIF 19.8975.86 10.8272.70 �7.44 o0.001*
EOT 19.8674.30 16.2174.33 �3.16 0.003*
Neuropsychology
WST (words total) 29.8976.41 33.2973.34 2.48 0.016*
TMT-A (s) 26.56714.74 19.4376.30 �2.35 0.022*
TMT-B (s) 44.47720.13 40.94716.52 �0.72 0.476
RWT (words total) 57.18712.72 67.61712.74 3.07 0.003*
VERT (% correct) 79.23710.42 80.86710.77 5.4 0.589
Psychopathology
HAMD-17 8.6173.03
BDI-II 24.78715.44
Medication
SSRIs n¼7
SNRIs n¼12
NARI n¼2
TCAs n¼2
TeCAs n¼5
*Po0.05.
Please cite this article as: Schneider, D., et al., Empathic behavioralPsychiatry Research (2012), http://dx.doi.org/10.1016/j.psychres.201
2.2. Stimulus material
The stimuli consisted of 96 short video clips (mean duration¼11.8 s, S.D.¼1) that
depicted a male or female actor in close-up, telling self-related short narratives.
Stories were standardized according to syntactic set-up (past tense, first-person
perspective), word count (mean¼28.26, S.D.¼3.10), and syllable count
(mean¼45.75, S.D.¼4.09). They conveyed one of four emotion categories (happiness,
sadness, fear, and disgust, 20 video clips each) or no emotion (neutral, 16 video clips
each). For the analysis of emotion categories; the total set of 96 video clips was
applied while for the analysis of different communication conditions, a subset of 48
video clips was analyzed. Here, stimuli were used in the following conditions:
comprehensible-emotional, ‘cE’, comprised the actor telling an emotional story with
corresponding emotional facial expression and prosody (16 clips). Incomprehensible-
emotional, ‘iE’, was presented in a foreign language incomprehensible to our German
native subjects (Polish, Russian, Croatian, Yugoslavian, or Serbian) but contained
congruent emotional facial expression and prosody (16 clips). The third condition
(comprehensible-neutral, ‘cN’) served as a control and contained a neutral narrative
with neutral facial expression and prosody (16 clips).
2.3. Data acquisition
Participants were tested in a sound-proof room while comfortably seated in front
of a notebook (IBM, ThinkPads; 15.6-in. screen), equipped with headphones (HPM
1000, Behringers). Two flat reversible silver/silver chloride (Ag–AgCl) electrodes of
10 mm diameter were attached to their non-dominant left hand to measure galvanic
skin conductance (GSC). Varioports 3-channel bioamplifier (Becker MEDITEC,
Germany) served as the recording tool for the GSC data (16 Hz sampling rate) which
was analyzed to extract phasic components from tonic activity based on continuous
decomposition analysis (Benedeck and Kaernbach, 2010) implemented in Ledalabs
software (Leipzig, Germany). Synchronization with the behavioral measures was
done using Presentations software.
2.4. Procedure
During the preparation phase (�5–10 min prior to the experiment), electrodes
were attached to the participant’s left hand, palms-up to avoid motion, in order to
enable the tonic GSC component to reach baseline level. Three demonstration
trials preceded the experiment’s start. All participants were instructed to engage
in the presented emotional communication situation interaction as vividly as
possible by regarding the presented actor as a personally familiar person and to
spontaneously give four subjective ratings after each video clip. The first two
ratings were to indicate the emotion category of the experienced emotion (‘happy’,
‘sad’, ‘fear’, ‘disgust’, or ‘neutral’) as well as the associated emotional intensity
(1–6). Subjects were then to rate the emotion and emotional intensity expressed
by the actor. A white fixation cross set against a black screen was shown between
the trials to allow GSC measures to return to baseline.
2.5. Neurocognitive assessment and empathy questionnaires
All participants underwent neuropsychological testing after the experiment
(Table 1). The battery included tests on crystallized verbal intelligence (Wortschatzt-
est: WST, Schmidt and Metzler, 1992), executive functions (Trail Making Test,
versions A and B, TMT-A/-B, Reitan, 1992), and word fluency (RWT, Aschenbrenner
et al., 2000). In addition, two empathy questionnaires were introduced: the German
version of the Interpersonal Reactivity Index, SPF (IRI, Davis, 1980) measures multiple
dimensions of emotional (fantasy, emotional concern, personal distress) and cognitive
components of empathy (perspective taking) on a five-point scale. The E-Scale
(Leibetseder et al., 2007) assesses a variety of components related to empathic
processing (emotional/cognitive sensitivity, emotional/cognitive concern). Also, the
Toronto Alexithymia Scale (TAS-20, Bagby et al., 1986) was included for the
exploration of deficits in identifying and describing emotions. To test basic emotional
face recognition performance in still photographs, the short version of the ‘Vienna
Emotion Recognition Task’ (VERT-K) was included.
2.6. Statistical analysis
Within each experimental condition or emotion category, the relative fre-
quencies of correctly recognized emotions (trials in which the recognized emotion
matched the target emotion, ‘other-matching-target’ (OMT)) and correct affective
responses (trials in which the own experienced emotion matched the target
emotion, ‘self-matching-target’ (SMT)) was analyzed. Empathy was defined as
trials in which both own emotion and other emotion matched the target emotion
(‘self-and-other-matching-target’, SOMT). We further analyzed mean intensity
levels of the other’s emotion (Int_OMT) as well as for the own emotion (Int_SMT).
For the latter, we also analyzed those own intensity levels in which the participant
had given an empathic response (Int_SOMT). For the error analysis, the absolute
error value for each emotion (e.g. ‘rated happy when target emotion was sad’) was
divided by the total number of cases when no congruence was achieved
and physiological responses to dynamic stimuli in depression.2.03.054

D. Schneider et al. / Psychiatry Research ] (]]]]) ]]]–]]]4
(SOMT�1). The latter included cases in which the subject either falsely indicated
the actor’s emotion, their own emotion, or both.
Data were analyzed with separate full factorial general linear models (general-
ized estimating equations, GEEs, IBM s SPSS s, accounting for non-parametric
distribution and/or violation of sphericity) were set up for each of the variables
OMT, SMT, SOMT, Int_OMT, Int_SMT, Int_SOMT. Within-subject factors included
‘Communication Condition’ (three levels: cE, cN, iE) or ‘Emotion Category’ (four
levels: happy, sad, fearful, disgusted, neutral [excluded for intensity levels]).
Group differences between patients and controls were assessed with a between-
subject factor (‘Group’). All post-hoc comparisons were Bonferroni corrected.
To test differences between patients and controls on normally distributed
variables, independent samples t-tests were applied. Pearson’s correlation r (one-tailed,
Bonferroni-corrected) was calculated to test relationships between explicit and implicit
measures, and potential associations with demographic or neuropsychological data.
For the analysis of skin conductance data, the number of galvanic skin responses
(nGSR) above 0,02 mS were summed up during stimulus presentation which expresses
general arousal level over time. Due to the relatively long stimuli, two time windows
were chosen. The first (TW1: 1–3 s) was expected to include immediate responses to
stimulus presentation (e.g. orienting response, appeal of the actor). In the second (TW2:
3–13 s) the emotional information developed and reached its apex which is why TW2
was the focused time window. Physiological data of 11 patients and 10 controls were
excluded due to technical errors (patients n¼1; controls n¼2) associated with the
vulnerability of SC measurements and hypo-or hyper-responsive participants (patients
n¼10; controls n¼8) exceeding three standard deviations of stimulus-driven GSRs
from the global mean across emotion categories. Regarding GSR measurements, this
reduced the sample size to n¼17 (patients) and n¼18 (controls), respectively.
3. Results
3.1. Behavioral differences between patients and controls in different
communication conditions
3.1.1. Emotion recognition and corresponding intensity levels
The average emotion recognition (OMT) rate across all com-munication conditions was 84.67% (S.D.¼14.95%) for patients and89.66% (S.D.¼12.96%) for controls (Table 2). The GEE analysis
Table 2Behavioral rating results of between groups and in three experimental conditions; be
empathy and the corresponding intensity levels of these variables.
Condition M7S.D.
All MDD HC
Emotion recognition (OMT)
Total 87.17714.17 84.67714.95 89.66712.96
cE 95.5477.60 92.8679.58 98.2173.34
iE 74.22713.00 71.21712.42 77.23713.09
cN 91.74710.93 89.95712.42 93.5379.08
Affective response (SMT)
Total 70.72727.99 66.74730.27 74.7725.07
cE 70.42725.82 66.29728.28 74.55722.88
iE 49.00725.11 44.20727.69 53.79721.67
cN 92.75710.37 89.73713.20 95.7675.12
Empathy (SOMT)
Total 68.56727.47 64.21729.72 72.92724.44
cE 69.08725.90 64.06728.24 74.11722.74
iE 48.21724.79 43.08726.81 53.35721.88
cN 88.39713.56 85.49716.32 91.2979.52
Intensity recognized emotion (Int_OMT)
Total 3.9870.71 3.8670.69 4.1070.95
cE 4.1670.75 3.9770.73 4.3570.72
iE 3.870.66 3.7570.65 3.8471.15
Intensity affective response (Int_SMT)
Total 3.3470.84 3.4270.76 3.2670.92
cE 3.4170.77 3.4670.68 3.3670.86
iE 3.2770.90 3.3870.84 3.1670.97
Intensity given SOMT (Int_SMT)
Total 3.0470.98 3.0171.01 3.0870.95
cE 3.2071.00 3.0871.08 3.3270.91
iE 2.8870.96 2.9370.93 2.8370.99
n Po0.05.nn Po0.01.nnn Po0.001.
Please cite this article as: Schneider, D., et al., Empathic behavioralPsychiatry Research (2012), http://dx.doi.org/10.1016/j.psychres.201
revealed significant main effects of ‘Group’ and ‘CommunicationCondition’ but no significant interaction effect. Pairwise compar-isons indicated that the OMT rate was highest in condition ‘cE’compared to ‘cN’ (t¼2.20, P¼0.018) and ‘iE’ (t¼13.97, Po0.001).In addition, OMT rates were higher in condition ‘cN’ than in ‘iE’(t¼7.07, Po0.001).
For the intensity levels of the recognized emotion (Int_OMT),the GEE revealed no significant main effect of ‘Group’ but asignificant main effect of ‘Communication Condition’ and a sig-nificant interaction effect. Controls (t¼6.46) but not patients(t¼2.38) rated the recognized emotional intensity higher incondition ‘cE’ than in ‘iE’ (Po0.001 and P¼0.092, respectively).The difference between these two conditions in patients was onlysignificant if no correction was applied (t¼2.38, Po0.025).
3.1.2. Affective responses and corresponding intensity levels
The GEE for affective response (SMT) rates revealed that acrossall conditions, the affective responses matched the target emotion in66.74% (S.D.¼30.27%) of video clips for patients and in 74.7%(S.D.¼25.07%) for controls. The data showed two significant maineffects of ‘Group’ and ‘Communication Condition’ but no interactioneffect. Similar to the pattern present in OMT rates, patients matchedtheir own affective state less frequently with the target emotion inall experimental conditions compared to controls. Again, SMT rateswere significantly higher in condition ‘cE’ than in ‘iE’ (t¼8.84;Po0.001). However, SMT rates were highest in condition ‘cN’ ascompared to ‘cE’ (t¼5.64, Po0.001) and ‘iE’ (t¼11.03, Po0.001).
The GEE analysis of intensity ratings of the own emotion(Int_SMT) revealed no significant main effects of ‘Group’, ‘Com-munication Condition’, nor an interaction effect.
havioral responses comprised emotion recognition accuracy, affective responses,
CEE
Effect d.f. Wald w2 P
Group 1 12.97 o0.001nnn
Condition 2 157.42 o0.001nnn
Cond.� group 2 5.79 0.055
Group 1 8.15 0.004nn
Condition 2 165.96 o0.001nnn
Cond.� group 2 0.63 0.731
Group 1 6.81 0.009nn
Condition 2 120.93 o0.001nnn
Cond.� group 2 0.06 0.972
Group 1 1.76 0.184
Condition 1 37.34 o0.001nnn
Cond.� group 1 5.84 0.016n
Group 1 0.62 0.433
Condition 1 2.43 0.119
Cond.� group 1 0.43 0.514
Group 1 0.113 0.736
Condition 1 42.45 o0.001nnn
Cond.� group 1 0.02 0.895
and physiological responses to dynamic stimuli in depression.2.03.054

Fig. 1. Rating results. Empathy (SOMT) and its two components emotion recognition (OMT) and affective response (SMT) in healthy controls (HC, white) and depressed
patients (MDD, gray). The difference of rating measures between groups and experimental conditions were tested in separate generalized linear models.
D. Schneider et al. / Psychiatry Research ] (]]]]) ]]]–]]] 5
3.1.3. Empathy and corresponding intensity levels
The average SOMT rate across all conditions was 64.21%(S.D.¼29.72%) for patients and 72.92% (S.D.¼24.44%) for controls.The GEE analysis revealed a significant main effect of ‘Group’significant main effect of ‘Communication Condition’ but nosignificant interaction effect. Compared to controls, patientsdisplayed lower SOMT rates. Again, SOMT rates were higher incondition ‘cE’ compared to ‘iE’ (t¼8.47, Po0.001) and highest incondition ‘cN1’ compared to ‘cE’ (t¼4.63) and compared to ‘iE’(t¼9.48) (both Po0.001).
The GEE analysis of empathic intensity ratings (Int_SOMT)yielded no significant main effect of ‘Group’ but a significant maineffect of ‘Communication Condition’. Here, the affective responseto video clips which were empathically responded to was rated asmore intense in condition ‘cE’ compared to ‘iE’ (t¼5.56;Po0.001). There was no significant interaction effect. For anoverview of rating results concerning communication conditions,see Fig. 1.
In sum, empathy was lower in patients compared to controls.Patients showed decreased emotion recognition accuracy and ownaffective responses. Moreover, controls rated comprehensible emo-tional video clips as more intense than incomprehensible ones.
1 Empathy, of course, is an emotional construct. The high rates of neutral
video clips should be regarded with care. High empathy rates here were seen as
validation of a good stimulus quality (easy to recognize and therefore, unequi-
vocally responded to with a neutral affective state).
Please cite this article as: Schneider, D., et al., Empathic behavioralPsychiatry Research (2012), http://dx.doi.org/10.1016/j.psychres.201
3.2. Behavioral differences between patients and controls regarding
emotion categories
3.2.1. Emotion recognition and corresponding intensity levels
Concerning emotion specific effects, the GEE analysis showedsignificant main effects of ‘Group’ and ‘Emotion Category’ con-firming that controls correctly recognized more emotional clipsthan patients. There was no significant interaction effect. Pairwisecomparisons indicated that happy video clips had higher OMTrates compared to fearful (t¼5.37) and disgusted (t¼4.92) videoclips (all Pso0.001). Moreover, OMT rates significantly differedbetween sad and fearful (t¼4.07, Po0.01) as well as sad anddisgusted (t¼3.02, P¼0.035) video clips. Neutral video clipsevoked highest OMT rates as compared to happy (t¼6.51), sad(t¼4.03), fearful (t¼4.07), and disgusted (t¼3.02) video clips (allPso0.001). OMT rates between happy and sad (t¼1.22,P40.999) as well as fearful and disgusted (t¼1.12, P40.999)video clips, however, did not significantly differ from each other.
For the intensity values of the other’s emotion (Int_OMT), theGEE analysis showed no significant main effect of ‘Group’ but asignificant main effect of ‘Emotion Category’ and a significantinteraction effect. Controls gave higher intensity ratings to happyclips than to sad (t¼5.08) and fearful (t¼5.24) clips (allPso0.001). Moreover, disgusted video clips were given higherintensity ratings than sad (t¼3.82, Po0.01) and fearful (t¼3.82,Po0.001) videos. There was no difference between happy anddisgusted (t¼2.98, P¼0.068) or between sad and fearful clips(t¼1.81, P40.999). In contrast, intensity levels did not differbetween emotions in patients. The comparison between more
and physiological responses to dynamic stimuli in depression.2.03.054

D. Schneider et al. / Psychiatry Research ] (]]]]) ]]]–]]]6
intensely rated happy video clips (compared to sad clips) wasonly significant if no correction was applied (t¼2.59, P¼0.015).
3.2.2. Affective response and corresponding intensity levels
Regarding the affective response to different emotion categories,the GEE analysis showed a similar response pattern in both groups(Table 3) for SMT rates with a significant main effect of ‘Group’ and‘Emotion Category’ but no significant interaction effect. Again,controls showed higher affective response rates than patients did.In addition, happy video clips were most often responded to with acongruent affective response than this was the case during thepresentation of fearful (t¼4.72, Po0.001) clips. The differencebetween happy and sad (t¼2.08, P¼0.237) or disgusted clips(t¼2.71, P¼0.057) was not significant. Only neutral video clipselicited higher SMT rates than happy (t¼3.59), sad (t¼4.83), anddisgusted (t¼5.92) video clips (Po0.001).
The GEE analysis of the affective response intensities(Int_SMT) showed a significant main effect of ‘Emotion Category’but no significant main effect of ‘Group’ or an interaction effect.More specifically, disgusted video clips were experienced moreintensely compared to sad (t¼4.63, Po0.001) and fearful
Table 3Behavioral rating results between groups and in different emotion categories; beh
behavioral empathy and the corresponding intensity levels of these variables.
Emotion M7S.D.
All MDD HC
Emotion recognition (OMT)
Total 81.49713.52 77.92714.61 85.06711.29
Happy 84.20710.82 81.07711.81 87.3278.87
Sad 81.70712.03 79.29713.24 84.11710.37
Fear 73.84713.42 68.75713.17 78.93711.81
Disgust 75.98712.66 70.54712.27 81.43710.70
Neutral 91.74710.93 89.96712.42 93.5379.08
Affective response (SMT)
Total 61.10729.00 56.59731.01 65.62726.17
Happy 60.54725.97 52.14726.99 68.93722.33
Sad 54.02726.81 52.86729.80 55.18723.94
Fear 45.09728.34 41.61729.78 48.57726.90
Disgust 53.13723.77 46.61727.62 59.64717.32
Neutral 92.75710.37 89.73713.20 95.7675.12
Empathy (SOMT)
Total 56.82727.93 51.31729.52 62.33725.17
Happy 57.05724.10 48.40724.83 65.71720.26
Sad 49.73725.05 46.43726.59 53.04723.43
Fear 40.80725.76 36.07726.05 45.54725.03
Disgust 48.13722.31 40.18724.55 56.07716.74
Neutral 88.39713.56 85.49716.32 91.2179.52
Intensity recognized emotion (Int_OMT)
Total 3.7270.72 3.6370.66 3.8170.76
Happy 3.9770.75 3.8470.75 4.1170.73
Sad 3.6070.74 3.5170.74 3.6870.75
Fear 3.5970.69 3.6070.57 3.5770.79
Disgust 3.7270.69 3.5770.56 3.8870.77
Intensity affective response (Int_SMT)
Total 3.3470.82 3.4470.76 3.2470.86
Happy 3.3970.83 3.3770.83 3.4070.85
Sad 3.2170.81 3.3470.71 3.0870.89
Fear 3.2670.83 3.4470.72 3.0770.89
Disgust 3.5170.80 3.6270.76 3.4170.83
Intensity given SOMT (Int_SOMT)
Total 2.9970.99 2.9171.07 3.0770.91
Happy 3.1170.97 2.8971.02 3.3470.89
Sad 2.8070.91 2.8170.95 2.7970.89
Fear 2.7571.00 2.7671.09 2.7370.92
Disgust 3.2971.08 3.1871.21 3.4070.94
n Po0.05.nn Po0.01.nnn Po0.001.
Please cite this article as: Schneider, D., et al., Empathic behavioralPsychiatry Research (2012), http://dx.doi.org/10.1016/j.psychres.201
(t¼2.84, P¼0.022) but not to happy (t¼1.3, P40.999.) videoclips. In contrast, there was no difference between happy and sad(t¼2.37, P¼0.078), happy and fearful (t¼1.54, P¼0.612), or sadand fearful (t¼�0.7, P40.999).
3.2.3. Empathy and corresponding intensity levels
Regarding differences in SOMT rates for emotion categories,GEE results indicated a significant main effect of ‘Group’ and‘Emotion Category’ but no significant interaction effect. Patientsdisplayed overall lower SOMT rates compared to controls. Post-hoc comparisons showed happy video clips to yield the highestSOMT rates compared to fearful (t¼5.18, Po0.001) and disgusted(t¼3.55, Po0.01) but not to sad (t¼2.42, P¼0.107) video clips.Again, neutral video clips had higher SOMT rates than happy(t¼3.76), sad (t¼5.04), fearful (t¼7.22), and disgusted (t¼6.3)video clips (all Pso0.001). In addition, sad video clips inducedhigher SOMT rates than fearful (t¼4.01, Po0.001) but notdisgusted (t¼0.71, P40.999) video clips. Likewise, disgustedvideo clips evoked higher SOMT rates than fearful video clips(t¼2.99, P¼0.022).
avioral responses comprised emotion recognition accuracy, affective responses,
GEE (N¼56)
Effect d.f. Wald w2 P
Group 1 16.77 o0.001nnn
Emotion 4 71.73 o0.001nnn
Emotion� group 4 2.23 694
Group 1 6.53 0.011n
Emotion 4 156.23 o0.001nnn
Emotion� group 4 9.18 0.057
Group 1 9.19 o0.01nn
Emotion 4 118.81 o0.001nnn
Emotion� group 4 6.35 0.175
Group 1 1.15 0.284
Emotion 3 28.62 o0.001nnn
Emotion� group 3 9.52 0.023n
Group 1 1.14 0.288
Emotion 3 28.01 o0.001nnn
Emotion� group 3 7.02 0.071
Group 1 0.004 0.947
Emotion 3 36.97 o0.001nnn
Emotion� group 3 8.38 0.039n
and physiological responses to dynamic stimuli in depression.2.03.054

D. Schneider et al. / Psychiatry Research ] (]]]]) ]]]–]]] 7
Concerning the affective response intensities to empathicallyresponded video clips (Int_SOMT), the GEE analysis showed nosignificant main effect of ‘Group’ but a significant main effect of‘Emotion Category’ and a significant interaction effect. For con-trols, happy video clips induced higher intensity ratings than sad(t¼4.3, Po0.01) and fearful (t¼4.98, Po0.001) but not disgusted(t¼�0.48, P40.999) video clips. Moreover, disgusted video clipswere experienced as more intense than sad (t¼5.37) and fearful(t¼4.83) video clips (both Po0.001). There was no significantdifference for intensity ratings between sad and fearful video clips(t¼0.99, P40.999). In contrast, the intensity ratings of patients’own affective response did not differ significantly between emo-tion categories (happy vs. sad: t¼0.52, P40.999; happy vs. fear:t¼0.76, P40.999; happy vs. disgust: t¼�1.29, P40.999; sad vs.fear: t¼0.54, P40.999; sad vs. disgust: t¼�2.05, P¼0.27; fear vs.disgust: t¼�2.45, P¼0.13). Disgusted video clips received sig-nificantly higher Int_SOMT values than fearful video clips(t¼2.45, P¼0.022) if no correction was applied.
Summed up, controls experienced happy and sad video clipswhich were empathically responded to as more intense thanfearful and disgusted ones. They also generally rated happy anddisgusted video clips as being more intense than sad andfearful ones.
Across all video clips, experimental empathy correlatedweakly with external measures of empathy. Pearson’s r in thepatient sample ranged between r¼0.351 (SOMT and total scoreSPF, P¼0.067) and r¼0.235 (SOMT and total score E-Scale,P¼0.229) and were slightly lower in the healthy subgroup forSOMT and the total score of the SPF: r¼0.211, P¼0.282 andslightly higher for SOMT and the total score of the E-Scale:r¼0.244, P¼0.210. Symptom severity or illness duration ofpatients did not significantly correlate with behavioral empathyor its components.
Table 4Error analysis, displaying mean percentage values (values in brackets¼MDD patients)
misclassifications happened in different emotion categories. A ‘confusion matrix’ is sho
M7S.D.
Target emotion
Happiness Sadness
A Wrong recognition and emotional response—34.64717.55% (37.29717.60%)
Emotion other
Happiness – 2.60 (0.00)
Sadness 5.66 (14.63) –
Fear 3.77 (3.66) 31.17 (24.05)
Disgust 0.00 (2.44) 15.58 (7.59)
Neutral 90.57 (79.27) 50.65 (68.35)
Affective response
Happiness – 2.60 (2.53)
Sadness 0.00 (9.76) –
Fear 0.00 (2.44) 6.49 (15.19)
Disgust 0.00 (1.22) 2.60 (1.27)
Neutral 100.00 (86.59) 88.31 (81.01)
B Wrong emotion recognition—9.80712.35% (13.87715.50%)
Emotion other
Happiness – 0.00 (0.00)
Sadness 5.56 (9.52) –
Fear 0.00 (4.76) 16.67 (19.44)
Disgust 0.00 (4.76) 16.67 (2.78)
Neutral 94.44 (80.95) 66.67 (77.78)
C Wrong emotional response—55.56720.13% (48.84723.45%)
Affective response
Happiness – 2.87 (5.98)
Sadness 0.83 (1.09) –
Fear 0.83 (1.09) 5.17 (2.17)
Disgust 0.83 (1.64) 1.15 (1.09)
Neutral 97.52 (96.17) 90.80 (90.76)
Please cite this article as: Schneider, D., et al., Empathic behavioralPsychiatry Research (2012), http://dx.doi.org/10.1016/j.psychres.201
3.3. Error analysis
The analysis of participants’ erroneous response pattern isbased upon all cases indicating no correct congruence betweenrecognized and felt emotion (SOMT�1). This includes choosing anemotion category differing from the target emotion during other-ratings, self-ratings, and their combination (Table 4).
Subclass A indicates all cases in which the SOMT�1 rate wasbased upon both wrong emotion recognition (nOMT) and wrongemotional response (nSMT). This occurred in 37.29% (S.D.¼17.6%)and 34.64% (S.D.¼17.55%) of the cases in patients and controls,respectively. For example, when the target emotion was neutral,controls indicated the recognized emotion and their affectiveresponse both to be sad in 33.33% of these cases. In contrast,patients rated the recognized emotion and their affectiveresponse to be sad in 84% and 80%, respectively.
Subclass B shows all cases in which the SOMT�1 rate wasbased only on nOMT. Patients misclassified an emotion in 13.87%(S.D.¼15.5%) and controls in 9.8% (S.D.¼12.35%) of these cases.For example, when the target emotion was sad, controls rated therecognized emotion to be fearful in 16.67%, disgusted in 16.67%,and neutral in 66.67% of erroneous cases. In contrast, patientsrated the recognized emotion to be fearful in 19.44%, disgusted in2.78%, and neutral in 77.78% of erroneous cases.
Subclass C indicated all cases in which the SOMT�1 rate issolely based on nSMT. This occurred in 48.84% (S.D.¼23.45%) ofthese cases in patients and in 55.56% (S.D.¼20.13%) of these casesin controls. For example, when the target emotion was happy,nSMT was based on a neutral affective response in 97.52% of thecases for controls and in 96.17% of the cases for patients. Groupdifferences were not significant in subclass A, B, and C (t¼0.57,P¼0.565, t¼1.09, P¼0.282, and t¼1.15, P¼0.255, respectively).We refrained from further statistical tests as the percentages in
of three different types of misclassifications (A–C). Within these subclasses, the
wn to explain which emotion participants chose other than the target emotion.
Fear Disgust Neutral
3.96 (2.10) 15.48 (8.66) 22.22 (0.00)
16.83 (15.38) 29.76 (28.35) 33.33 (84.00)
– 19.05 (12.60) 44.44 (16.00)
21.78 (9.09) – 0.00 (0.00)
57.43 (73.43) 35.71 (50.39) –
5.94 (4.90) 14.29 (12.60) 22.22 (4.00)
5.94 (6.29) 17.86 (14.96) 33.33 (80.00)
– 7.14 (6.30) 44.44 (16.00)
6.93 (5.59) – 0.00 (0.00)
81.19 (83.22) 60.71 (66.14) –
0.00 (0.00) 0.00 (5.56) 15.00 (26.32)
5.88 (9.68) 0.00 (2.78) 30.00 (42.11)
– 25.00 (2.78) 45.00 (26.32)
0.00 (0.00) – 10.00 (5.26)
94.12 (90.32) 75.00 (88.89) –
5.88 (6.01) 20.42 (18.82) 60.00 (45.00)
1.60 (2.19) 0.00 (1.18) 0.00 (30.00)
– 2.11 (1.18) 40.00 (20.00)
1.07 (1.09) – 0.00 (5.00)
91.44 (90.71) 77.46 (78.82) –
and physiological responses to dynamic stimuli in depression.2.03.054

D. Schneider et al. / Psychiatry Research ] (]]]]) ]]]–]]]8
each cell entry are based on a very restricted number of stimuliwhich has a considerably decremental effect on statistical power.
Taken together, indicating a ‘neutral’ response to an emotionalstimulus was the most common reason for misclassifying a targetemotion or not matching the own affective response to the targetin all subclasses for both groups. Moreover, patients displayed awider set of erroneous answers than controls.
3.4. Psychophysiological responses to the different emotion
categories
In the first time window (TW1; 1–3 s), ‘nGSR’ showed nosignificantly different effects between patients and controls(‘Group’) and all emotions (‘Emotion Category’).
In the second time window (TW2; 3–13 s) a GEE analyzing nGSRrevealed a significant main effect of ‘Group’ and ‘Emotion Category’as well as a significant interaction effect (Table 5). Patientsdisplayed more GSRs than controls in all emotion categories
Fig. 2. Physiological results. The number of galvanic skin responses during stimulus pr
during only empathically responded clips (nGSR_SOMT) is displayed on the right in h
rating measures between groups and experimental conditions were tested in separate
Table 5Results of galvanic skin conductance parameters between groups and in different emot
responded to are displayed sepatarely. TW2¼time window 2. nGSR ¼number of galvanic
Emotion M7S.D.
All MDD HC
nGSR (TW2)
Total 13.4279.2 17.1979.26 11.7276.73
Happy 18.1478.53 20.7179.82 15.7276.48
Sad 14.3178.22 18.0078.28 10.8376.65
Fear 15.9178.72 19.5979.59 12.4476.25
Disgust 15.6678.24 18.4178.86 13.0676.87
Neutral 7.8674.72 9.2475.12 6.5674.05
nGSR given SOMT (TW2)
Total 6.7976.16 8.1476.87 7.1675.27
Happy 10.6876.17 10.5076.61 10.8375.94
Sad 6.8276.92 8.3878.52 5.4474.95
Fear 6.4776.91 6.6778.08 6.2975.96
Disgust 7.4574.95 7.4076.00 7.5074.06
Neutral 6.6374.35 7.6574.87 5.6773.68
nnPo0.01.n Po0.05.nnn Po0.001.
Please cite this article as: Schneider, D., et al., Empathic behavioralPsychiatry Research (2012), http://dx.doi.org/10.1016/j.psychres.201
(Fig. 2). For controls, post-hoc comparisons showed that happyvideo clips evoked more GSRs compared to sad (t¼4.07, P¼0.001)but not to fearful (t¼2.39, P¼0.634) or disgusted (t¼2.36, P¼0.69)video clips. The number of GSRs did also not differ between sad andfearful (t¼�1.52, P40.999), sad and disgusted (t¼�2.27,P¼0.876) nor fearful and disgusted (t¼�0.66, P40.999) videoclips. Neutral video clips evoked less GSRs as compared to happy(t¼�7.51), sad (t¼�4.41), fearful (t¼�5.85), and disgusted(t¼�6.02) ones (all Pso0.001). For patients, the number of GSRsdid not differ between emotion categories (happy vs. sad: t¼2.52,P¼0.422; happy vs. fear: t¼1.23, P40.999; happy vs. disgust:t¼1.56, P40.999; sad vs. fear: t¼�1.71, P40.999; sad vs.disgust: t¼�0.33, P40.999; fear vs. disgust: t¼0.77, P40.999).However, neutral video clips evoked less GSRs as compared tohappy (t¼�8.31), sad (t¼�8.81), fearful (t¼�7.46), and dis-gusted (t¼�7.7) ones (all Pso0.001). The number of GSRs didnot differ between groups in response to neutral clips (t¼�1.73,P¼0.094).
esentation (nGSR) is displayed on the left, the number of galvanic skin responses
ealthy controls (HC, white) and depressed patients (MDD, gray). The difference of
generalized linear models.
ion categories. Responses to all video clips and to those which were empathically
skin responses.
GEE
Effect d.f. Wald w2 P
Group 1 6.03 0.014n
Emotion 4 174.73 o0.001nnn
Emotion�Group 4 12.77 0.012n
Group 1 4.17 0.041n
Emotion 4 40.91 o0.001nnn
Emotion�Group 4 11.31 0.023n
and physiological responses to dynamic stimuli in depression.2.03.054
D. Schneider et al. / Psychiatry Research ] (]]]]) ]]]–]]] 9
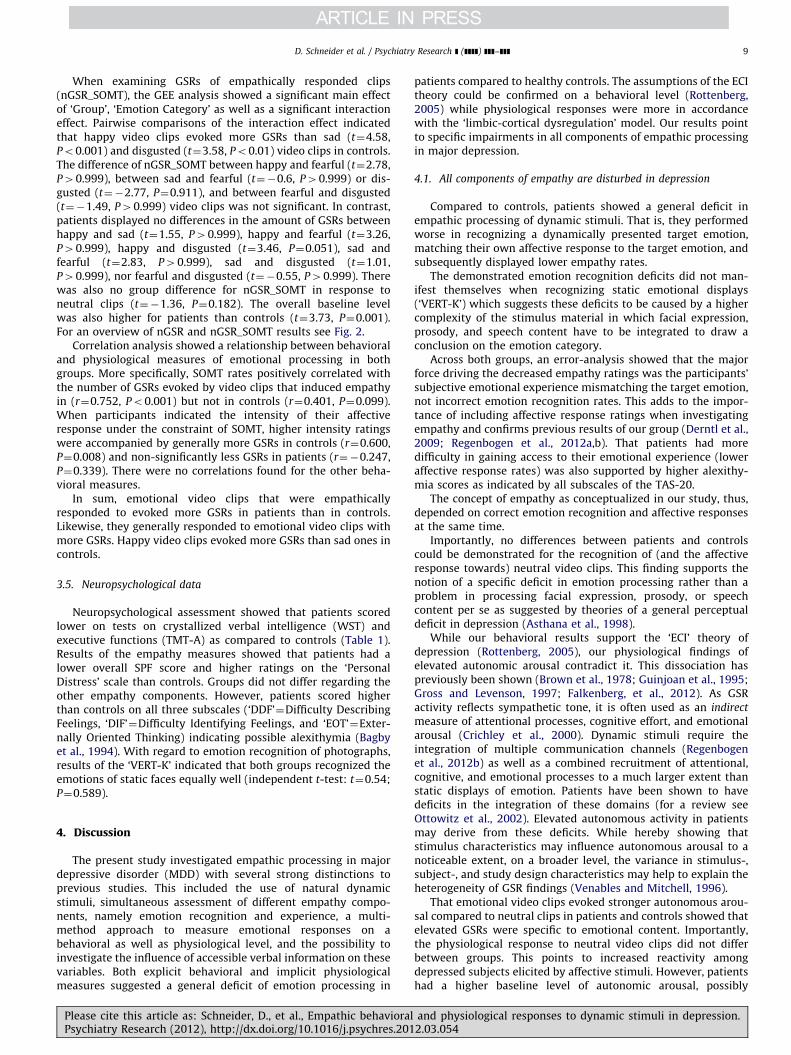
When examining GSRs of empathically responded clips(nGSR_SOMT), the GEE analysis showed a significant main effectof ‘Group’, ‘Emotion Category’ as well as a significant interactioneffect. Pairwise comparisons of the interaction effect indicatedthat happy video clips evoked more GSRs than sad (t¼4.58,Po0.001) and disgusted (t¼3.58, Po0.01) video clips in controls.The difference of nGSR_SOMT between happy and fearful (t¼2.78,P40.999), between sad and fearful (t¼�0.6, P40.999) or dis-gusted (t¼�2.77, P¼0.911), and between fearful and disgusted(t¼�1.49, P40.999) video clips was not significant. In contrast,patients displayed no differences in the amount of GSRs betweenhappy and sad (t¼1.55, P40.999), happy and fearful (t¼3.26,P40.999), happy and disgusted (t¼3.46, P¼0.051), sad andfearful (t¼2.83, P40.999), sad and disgusted (t¼1.01,P40.999), nor fearful and disgusted (t¼�0.55, P40.999). Therewas also no group difference for nGSR_SOMT in response toneutral clips (t¼�1.36, P¼0.182). The overall baseline levelwas also higher for patients than controls (t¼3.73, P¼0.001).For an overview of nGSR and nGSR_SOMT results see Fig. 2.
Correlation analysis showed a relationship between behavioraland physiological measures of emotional processing in bothgroups. More specifically, SOMT rates positively correlated withthe number of GSRs evoked by video clips that induced empathyin (r¼0.752, Po0.001) but not in controls (r¼0.401, P¼0.099).When participants indicated the intensity of their affectiveresponse under the constraint of SOMT, higher intensity ratingswere accompanied by generally more GSRs in controls (r¼0.600,P¼0.008) and non-significantly less GSRs in patients (r¼�0.247,P¼0.339). There were no correlations found for the other beha-vioral measures.
In sum, emotional video clips that were empathicallyresponded to evoked more GSRs in patients than in controls.Likewise, they generally responded to emotional video clips withmore GSRs. Happy video clips evoked more GSRs than sad ones incontrols.
3.5. Neuropsychological data
Neuropsychological assessment showed that patients scoredlower on tests on crystallized verbal intelligence (WST) andexecutive functions (TMT-A) as compared to controls (Table 1).Results of the empathy measures showed that patients had alower overall SPF score and higher ratings on the ‘PersonalDistress’ scale than controls. Groups did not differ regarding theother empathy components. However, patients scored higherthan controls on all three subscales (‘DDF’¼Difficulty DescribingFeelings, ‘DIF’¼Difficulty Identifying Feelings, and ‘EOT’¼Exter-nally Oriented Thinking) indicating possible alexithymia (Bagbyet al., 1994). With regard to emotion recognition of photographs,results of the ‘VERT-K’ indicated that both groups recognized theemotions of static faces equally well (independent t-test: t¼0.54;P¼0.589).
4. Discussion
The present study investigated empathic processing in majordepressive disorder (MDD) with several strong distinctions toprevious studies. This included the use of natural dynamicstimuli, simultaneous assessment of different empathy compo-nents, namely emotion recognition and experience, a multi-method approach to measure emotional responses on abehavioral as well as physiological level, and the possibility toinvestigate the influence of accessible verbal information on thesevariables. Both explicit behavioral and implicit physiologicalmeasures suggested a general deficit of emotion processing in
Please cite this article as: Schneider, D., et al., Empathic behavioralPsychiatry Research (2012), http://dx.doi.org/10.1016/j.psychres.201
patients compared to healthy controls. The assumptions of the ECItheory could be confirmed on a behavioral level (Rottenberg,2005) while physiological responses were more in accordancewith the ‘limbic-cortical dysregulation’ model. Our results pointto specific impairments in all components of empathic processingin major depression.
4.1. All components of empathy are disturbed in depression
Compared to controls, patients showed a general deficit inempathic processing of dynamic stimuli. That is, they performedworse in recognizing a dynamically presented target emotion,matching their own affective response to the target emotion, andsubsequently displayed lower empathy rates.
The demonstrated emotion recognition deficits did not man-ifest themselves when recognizing static emotional displays(‘VERT-K’) which suggests these deficits to be caused by a highercomplexity of the stimulus material in which facial expression,prosody, and speech content have to be integrated to draw aconclusion on the emotion category.
Across both groups, an error-analysis showed that the majorforce driving the decreased empathy ratings was the participants’subjective emotional experience mismatching the target emotion,not incorrect emotion recognition rates. This adds to the impor-tance of including affective response ratings when investigatingempathy and confirms previous results of our group (Derntl et al.,2009; Regenbogen et al., 2012a,b). That patients had moredifficulty in gaining access to their emotional experience (loweraffective response rates) was also supported by higher alexithy-mia scores as indicated by all subscales of the TAS-20.
The concept of empathy as conceptualized in our study, thus,depended on correct emotion recognition and affective responsesat the same time.
Importantly, no differences between patients and controlscould be demonstrated for the recognition of (and the affectiveresponse towards) neutral video clips. This finding supports thenotion of a specific deficit in emotion processing rather than aproblem in processing facial expression, prosody, or speechcontent per se as suggested by theories of a general perceptualdeficit in depression (Asthana et al., 1998).
While our behavioral results support the ‘ECI’ theory ofdepression (Rottenberg, 2005), our physiological findings ofelevated autonomic arousal contradict it. This dissociation haspreviously been shown (Brown et al., 1978; Guinjoan et al., 1995;Gross and Levenson, 1997; Falkenberg, et al., 2012). As GSRactivity reflects sympathetic tone, it is often used as an indirect
measure of attentional processes, cognitive effort, and emotionalarousal (Crichley et al., 2000). Dynamic stimuli require theintegration of multiple communication channels (Regenbogenet al., 2012b) as well as a combined recruitment of attentional,cognitive, and emotional processes to a much larger extent thanstatic displays of emotion. Patients have been shown to havedeficits in the integration of these domains (for a review seeOttowitz et al., 2002). Elevated autonomous activity in patientsmay derive from these deficits. While hereby showing thatstimulus characteristics may influence autonomous arousal to anoticeable extent, on a broader level, the variance in stimulus-,subject-, and study design characteristics may help to explain theheterogeneity of GSR findings (Venables and Mitchell, 1996).
That emotional video clips evoked stronger autonomous arou-sal compared to neutral clips in patients and controls showed thatelevated GSRs were specific to emotional content. Importantly,the physiological response to neutral video clips did not differbetween groups. This points to increased reactivity amongdepressed subjects elicited by affective stimuli. However, patientshad a higher baseline level of autonomic arousal, possibly
and physiological responses to dynamic stimuli in depression.2.03.054
D. Schneider et al. / Psychiatry Research ] (]]]]) ]]]–]]]10
attributed to hyper-arousal in limbic regions which has to betaken into account when interpreting these findings.
Taken together, both behavioral and physiological resultssupport the notion of low coherence across different domains ofemotional functioning and can be interpreted in the light ofprevious neuroimaging findings (e.g. Drevets, 1999; 2001). Morespecifically, the ‘limbic-cortical dysregulation’ model of depres-sion can explain the behavioral and psychophysiological effects asa result of disparate cortical and limbic network changes asso-ciated with the disorder. That is, the co-occurrence of reciprocalhypo-responsiveness in prefrontal brain regions such as theprefrontal cortex and the cingulate gyrus and hyper-responsive-ness of limbic structures such as the hypothalamus, hippocampus,and amygdala (Mayberg, 1997) might be related to the poorperformance on the behavioral level due to a lack of attribution ofemotional significance by the prefrontal areas and the increasedautonomic arousal on a physiological level of patients comparedto controls, respectively.
Both ECI theory and ‘limbic-cortical dysregulation’ modelpredict behavioral deficits in emotion reactivity but give differentexplanations. The former postulates depressed mood states asinternal signals that bias an organism against action. The latterillustrates neuroscientific findings on the nature of impairedemotion processing. In other words, the ECI does not directlyrelate to emotion processing abilities per se but rather to anevolutionary explanation of deficient motivational and rewardprocesses, whereas the ‘limbic-cortical dysregulation’ model moredirectly relates to the proximate bases of mood and emotionalprocessing. The present study suggests that deficits in empathicprocessing can best be interpreted in the light of the latter.However, we would like to stress that these are only possibleexplanations based on the different existing models, for ourresults. Since this was a behavioral study we are not able toreally sufficiently answer those questions. Future studies shouldfurther investigate the exact nature of emotional processing,including affective and cognitive components of empathy, indepression by combining behavioral, physiological and neuroima-ging tools to elucidate the implications and possible similarities ofboth theories.
4.2. The importance of verbal information in emotional processing
Both explicit and implicit experimental measures suggest theimportance of accessible verbal information for different aspectsof empathic processing in patients and controls. That is, patientsand controls showed higher behavioral empathy rates (and itscomponents) when the presented actor was understandable, i.e.spoke in the native language of the participants (‘cE’) compared toa foreign language ( ‘iE’). This finding is in line with the idea thatemotional information conveyed on multiple modalities simulta-neously facilitates emotion transfer and emotion contagion(Massaro and Egan, 1996; Dolan et al., 2001; de Gelder et al.,2003; Ethofer et al., 2006;) and challenges communication the-ories which may underestimate the role of verbal signals inemotion processing (Argyle et al., 1970, 1971; Mehrabian, 1981).
4.3. Limitations
The significant data loss of GSC measurements reduced thesample size considerably so that psychophysiological results andthe correlational analysis with the behavioral measures should beinterpreted with caution. Also, we provided isomorphic emotioncategories inquiring the own emotional state which hinderedparticipants, e.g., to respond to a sad video clip with pity. Limitingthe answer spectrum might therefore constrain interpretation ofexperimental empathy. In addition, the interpretation of multi-
Please cite this article as: Schneider, D., et al., Empathic behavioralPsychiatry Research (2012), http://dx.doi.org/10.1016/j.psychres.201
modal effects conveyed in dynamic video sequences on ratingscores, intensity levels, and physiological responses, becomesmore difficult to control for with the growing complexity ofstimulus characteristics. Our experimental and external measures(questionnaire variable) of empathy resemble different contex-tual approaches which might be the reason for a lacking correla-tion between these constructs. This clearly demonstrates thelimitations of self-reports in assessing emotion processing capa-cities. Self-reports in general may provide limited access to theexact nature and extent of empathic responses and are subject toresponse tendencies. Although important, relying on self-reportsonly is not sufficient to characterize empathic abilities. Indeed,previous studies have shown that a lack of correlations betweenself-report measures and experimental measures of empathyhighlights the importance of behavioral tasks when characteriz-ing empathic abilities (Dimaggio et al., 2008; Derntl et al., 2009;2010).
While antidepressant medication generally hinders explana-tory power of experimental effects, the lack of correlationsbetween antidepressant drug treatment and symptom severitywith the outcome measures suggests that empathic deficits mightbe a trait rather than a state characteristic of depression (Kanet al., 2004).
5. Conclusion
The present study extends valuable knowledge to pre-existingtheories of a general emotion processing deficit to the domain ofimpaired empathic function in depression in terms of its occur-rence in an authentic and socially relevant setting. Our behavioralfindings support response domain-specific deficits according tothe ECI theory but the ‘limbic-cortical dysregulation’ model ofdepression is in accordance with both explicit and implicitmeasures of emotion processing. Accessible speech content servesas an important cue for understanding and sharing the emotion ofanother person as well as feeling empathy.
Acknowledgments
This work was supported by the Interdisciplinary Center forClinical Research of the Medical Faculty of the RWTH AachenUniversity (IZKF, N2-6 and N4-4), the International ResearchTraining Group (IRTG 1328), DFG-KFO 112, and HA 3203/7-1 (allfunded by the German Research Foundation (DFG)), as well as theInitiative and Networking Fund of the Helmholtz Association(Helmholtz Alliance for Mental Health in an Aging Society),HelMA, HA-125. We are very grateful to Jonas Albers, AnnaBartsch, Jorn Kraemer, Carla Schirk, and Timur K. Toygar for theirassistance and to all our participants.
References
Argyle, M., Alkema, F., Gilmour, R., 1971. The communication of friendly andhostile attitudes by verbal and non-verbal signals. European Journal of SocialPsychology 1, 385–402.
Argyle, M., Salter, V., Nicholson, H., Williams, M., Burgess, P., 1970. The commu-nication of inferior and superior attitudes by verbal and non-verbal signals.British Journal of Social Psychology 1, 247–258.
Aschenbrenner, S., Tucha, O., Lange, K.W., 2000. Regensburger word fluency test(Regensburger Wortflussigkeits—test, RWT). Hogrefe, Gottingen.
Asthana, H.S., Mandal, M.K., Khurana, H., Haque-Nizamie, S., 1998. Visuospatialand affect recognition deficit in depression. Journal of Affective Disorders 48,57–62.
Bagby, R.M., Taylor, G.J., Ryan, D., 1986. Toronto alexithymia scale: relationshipwith personality and psychophysiology measures. Psychotherapy and Psycho-somatics 45, 207–215.
and physiological responses to dynamic stimuli in depression.2.03.054

D. Schneider et al. / Psychiatry Research ] (]]]]) ]]]–]]] 11
Bagby, R.M., Parker, J.D.A., Taylor, G.J., 1994. The twenty-item Toronto AlexithymiaScale-I. Item selection and cross-validation of the factor structure. Journal ofPsychosomatic Research 38, 23–32.
Batson, C.D., 2009. These things called empathy. In: Decety, J., Ickes, W. (Eds.), TheSocial Neuroscience of Empathy. MIT Press, Cambridge, Ma, pp. 3–16.
Beauregard, M., Paquette, V., Levesque, J., 2006. Dysfunction in the neural circuitryof emotional self-regulation in major depressive disorder. NeuroReport 17,843–846.
Beck, A.T., Steer, R.A., Brown, G.K., 1996. Manual for the Beck DepressionInventory-II. Psychological Corporation, San Antonio, TX.
Benedeck, M., Kaernbach, C., 2010. A continuous measure of phasic electrodermalactivity. Journal of Neuroscience Methods 190, 80–91.
Bouhuys, A.L., Geerts, E., Mersch, P.P.A., 1996. Relationship between perception offacial emotions and anxiety in clinical depression: does anxiety-relatedperception predict persistence of depression? Journal of Affective Disorders43, 213–223.
Bourke, C., Douglas, K., Porter, R., 2010. Processing facial emotion expression inmajor depression: a review. Australian and New Zealand Journal of Psychiatry44, 681–696.
Brown, S.L., Schwartz, G.E., Sweeney, D.R., 1978. Dissociation of self-reported andobserved pleasure in depression. Psychosomatic Medicine 40, 536–548.
Brune, M., Brune-Cohrs, U., 2006. Theory of mind—evolution, ontogeny, brainmechanisms and psychopathology. Neuroscience and Biobehavioral Reviews30, 437–455.
Bylsma, L.M., Morris, B.H., Rottenberg, J., 2008. A meta-analysis of emotionalreactivity in major depressive disorder. Clinical Psychology Review 28,676–691.
Crichley, H.D., Elliott, R., Mathias, C.J., Dolan, R.J., 2000. Neural activity relating togeneration and representation of galvanic skin conductance responses: afunctional magnetic resonance imaging study. The Journal of Neuroscience20, 3033–3040.
Cusi, A.M., Nazarov, A., Holshausen, K., MacQueen, G.M., McKinnon, M.C., 2012.Systematic review of the neural basis of social cognition in patients with mooddisorders. Journal of Psychiatry and Neuroscience 1, 1–16.
Damasio, A.R., 1996. The somatic marker hypothesis and the possible functions ofthe prefrontal cortex. Philosophical Transactions of the Royal Society London351, 1413–1420.
Davis, M.H., 1980. A multidimensional approach to individual differences inempathy. Catalog of Selected Documents in Psychology 10, 85.
Dawson, M.E., Schell, A.M., Catania, J.J., 1977. Autonomic correlates of depressionand clinical improvement following electroconvulsive shock therapy. Psycho-physiology 14, 569–578.
Dawson, M.E., Schell, A.M., Braaten, J.R., Catania, J.J., 1985. Diagnostic utility ofautonomic measures for major depressive disorders. Psychiatry Research 15,261–270.
de Gelder, B., Vroomen, J., 2000. The perception of emotions by ear and by eye.Cognition and Emotion 14, 289–311.
de Gelder, B., Vroomen, J., Annen, L., Masthof, E., Hodiamont, P., 2003. Audio-visualintegration in schizophrenia. Schizophrenia Research 59, 211–218.
de Vignemont, F., Singer, T., 2006. The empathic brain: how, when and why?Trends in Cognitive Sciences 10, 435–441.
Decety, J., Jackson, P.L., 2004. The functional architecture of human empathy.Behavioral and Cognitive Neuroscience Reviews 3, 71–100.
Derntl, B., Finkelmeyer, A., Toygar, T.K., Hulsmann, A., Schneider, F., Falkenberg,D.I., 2009. Generalized deficit in all core components of empathy in schizo-phrenia. Schizophrenia Research 108, 197–206.
Derntl, B., Finelmeyer, A., Eikhoff, S., Kellermann, T., Falkenberg, D.I., Schneider, F.,Habel, U., 2010. Multidimensional assessment of empathic abilities: neuralcorrelates and gender differences. Psychoneuroendocrinology 35, 67–82.
Diener, C., Kuehner, C., Brusniak, W., Struve, M., Flor, H., 2009. Effects of stressorcontrollability on psychophysiological, cognitive and behavioural responses inpatients with major depression and dysthymia. Psychological Medicine 39,77–86.
Dolan, R.J., Morris, J.S., de Gelder, B., 2001. Crossmodal binding of fear in voice andface. Proceedings of the National Academy of Sciences 98, 10006–10010.
Drevets, W.C., 1999. Prefrontal cortical-amygdalar metabolism in major depres-sion. Annals of the New York Academy of Science 877, 614–637.
Drevets, W.C., 2001. Neuroimaging and neuropathological studies of depression:implications for the cognitive-emotional features of mood disorders. CurrentOpinion in Neurobiology 11, 240–249.
Dziobek, I., Fleck, S., Kalbe, E., Rogers, K., Hassenstab, J., Brand, M., Kessler, J.,Woike, J.K., Wolf, O.T., Convit, A., 2006. Introducing MASC: a movie for theassessment of social cognition. Journal of Autism and Developmental Dis-orders 36, 623–636.
Ekman, P., 1982. Emotion in the human face. Cambridge University Press, New York.Ekman, P., 2003. Emotions inside out: 130 years after Darwin’s the expression of
the emotions in man and animals. New York Academy of Sciences, New York.Elliott, R., Rubinsztein, J.S., Sahakian, B.J., Dolan, R.J., 2002. The neural basis of
mood-congruent processing biases in depression. Archives of General Psy-chiatry 59, 597–604.
Emerson, C.S., Harrison, D.W.H., Everhart, D.E., 1999. Investigation of affectiveprosodic ability in school-aged boys with and without depression. Neuropsy-chiatry, Neuropsychology, and Behavioral Neurology 12, 102–109.
Ethofer, T., Pourtois, G., Wildgruber, D., 2006. Investigating audiovisual integrationof emotional signals in the human brain. Progress in Brain Research 156,345–361.
Please cite this article as: Schneider, D., et al., Empathic behavioralPsychiatry Research (2012), http://dx.doi.org/10.1016/j.psychres.201
Falkenberg, I., Kohn, N., Schoepker, R., Habel, U., 2012. Mood induction in depressivepatients: a comparative multidimensional approach. PLOS One 7, e30016.
Feinberg, T.E., Rifkin, A., Schaffer, C., Walker, E., 1986. Facial discrimination andemotional recognition in schizophrenia and affective disorders. Archives ofGeneral Psychiatry 43, 276–279.
Foti, D., Olvet, D.M., Klein, D.N., Hajak, G., 2010. Reduced electrocortical responseto threatening faces in major depressive disorder. Depression and Anxiety 27,813–820.
Fredrikson, M., Furmark, T., Olsson, M.T., Fischer, H., Andersson, J., Langstrom, B.,1998. Functional neuroanatomical correlates of electrodermal activity: apositron emission tomographic study. Psychophysiolology 35, 179–185.
Goodwin, A.M., Williams, J.M.G., 1982. Mood-induction research—its implicationfor clinical depression 20, 373–382.
Gotlib, I.H., Krasnoperova, E., Neubauer Yue, D., Joormann, J., 2004. Attentionalbiases for negative interpersonal stimuli in clinical depression. Journal ofAbnormal Psychology 113, 127–135.
Gross, J.J., Levenson, R.W., 1997. Hiding feelings: the acute effects of inhibitingnegative and positive emotion. Journal of Abnormal Psychology 106, 95–103.
Guinjoan, S.M., Bernabo, J.L., Cardinali, D.P., 1995. Cardiovascular tests of auto-nomic function and sympathetic skin responses in patients with majordepression. Journal of Neurology, Neurosurgery, and Psychiatry 58, 299–302.
Gur, R.C., Erwin, R.J., Gur, R.E., Zwil, A.S., Heimberg, C., Kraemer, H.C., 1992. Facialemotion discrimination, II: behavioral findings in depression. PsychiatryResearch 41, 241–251.
Hale, W.W., 1998. Judgement of facial expressions and depression persistence.Psychiatry Research 80, 265–274.
Hamilton, M., 1960. A rating scale for depression. Journal of Neurology, Neuro-surgery, and Psychiatry 23, 56–61.
Henriques, J.B., Davidson, R.J., 1991. Left frontal hypoactivation in depression.Journal of Abnormal Psychology 100, 535–545.
Kan, Y., Mimura, M., Kamijima, K., 2004. Recognition of emotion from movingfacial and prosodic stimuli in depressed patients. Journal of Neurology,Neurosurgery and Psychiatry 75, 1667–1671.
Keltner, D., Gross, J.J., 1999. Functional accounts of emotions. Cognition andEmotion 13, 467–480.
Laine, C.M., Spitler, K.M., Mosher, C.P., Gothard, K.M., 2009. Behavioral triggers ofskin conductance responses and their neural correlates in the primate amyg-dale. Journal of Neurophysiology 101, 1749–1754.
LeDoux, J., 1998. Neural circuits underlying anxiety and fear. Biological Psychiatry44, 1229–1238.
Lee, L., Harkness, K.L., Sabbagh, M.A., Jacobsen, J.A., 2005. Mental state decodingabilites in clinical depression. Journal of Affective Disorders 86, 247–258.
Leiberg, S., Anders, S., 2006. The multiple facets of empathy: a survey of theory andevidence. Progress in Brain Research 156, 419–440.
Leibetseder, M., Laireiter, A.-R., Koller, T., 2007. Structural analysis of the E-scale.Personality and Individual Differences 3, 547–561.
Leppanen, J.M., Milders, M., Bell, J.S., Terriere, E., Hietanen, J.K., 2004. Depression biasesthe recognition of emotionally neutral faces. Psychiatry Research 128, 123–133.
Leppanen, J.M., 2006. Emotional information processing in mood disorders: areview of behavioral and neuroimaging findings. Current Opinion in Psychia-try 19, 34–39.
Levkovitz, Y., Lamy, D., Ternochiano, P., Treves, I., Fennig, S., 2003. Perception ofdyadic relationship and emotional states in patients with affective disorder.Journal of Affective Disorder 75, 19–28.
Lewis, M., Haviland-Jones, J.M., Feldman Barrett, L., 2008. Handbook of emotions,third ed. Guilford Press, New York.
Massaro, D.W., Egan, P.B., 1996. Perceiving affect from the voice and the face.Psychonomic Bulletin and Review 3, 215–221.
Matthews, G.R., Antes, J.R., 1992. Visual attention and depression: cognitive biasesin the eye fixations of the dysphoric and the nondepressed. Cognitive Therapyand Research 16, 359–371.
Mayberg, H.S., 1997. Limbic-cortical dysregulation: a proposed model of depres-sion. Journal of Psychiatry and Clinical Neurosciences 9, 471–481.
Mayberg, H.S., Liotti, M., Brannan, S.K., McGinnis, S., Mahurin, R.K., Jerabek, P.A.,Silvia, J.A., Tekell, J.L., Martin, C.C., Lancaster, J.L., Fox, P.T., 1999. Reciprocallimbic-cortical function and negative mood: converging PET findings indepression and normal sadness. American Journal of Psychiatry 156, 675–682.
Mehrabian, A., 1981. Silent messages: implicit communication of emotions andattitudes. Wadsworth, Belmont, CA.
Nelson, L.D., Stern, S.L., 1988. Mood induction in a clinically depressed population.Journal of Psychopathology and Behavioral Assessment 10, 277–285.
Nesse, R.M., 2000. Is depression an adaptation? Archives of General Psychiatry 57,14–20.
Oldfield, R.C., 1971. The assessment and analysis of handedness: the Edinburghinventory. Neuropsychologica 9, 97–113.
Ochsner, K.N., Bunge, S.A., Gross, J.J., Gabrieli, J.D., 2002. Rethinking feelings: anFMRI study of the cognitive regulation of emotion. Journal of CognitiveNeuroscience 14, 1215–1229.
Ottowitz, W.E., Dougherty, D.D., Savage, C.R., 2002. The neural network basis ofabnormalities of attention and executive function in major depressive dis-order: implication of the medical disease model to psychiatric disorders.Harvard Review of Psychiatry 10, 86–99.
Persad, S.M., Polivy, J., 1993. Differences between depressed and nondepressedindividuals in the recognition of and response to facial emotional cues. Journalof Abnormal Psychology 102, 358–368.
and physiological responses to dynamic stimuli in depression.2.03.054

D. Schneider et al. / Psychiatry Research ] (]]]]) ]]]–]]]12
Phan, K.L., Wager, T., Taylor, S.F., Liberzon, I., 2002. Functional neuroanatomy ofemotion: a meta-analysis of emotion activation studies in PET and fMRI.NeuroImage 16, 331–348.
Plutchik, R., 1982. A psychoevolutionary theory of emotions. Social ScienceInformation 21, 529–553.
Plutchik, R., Kellermann, H., 1989. Emotion: Theory, Research, and Experience, vol.1–4. Academic Press, New York.
Preston, S.D., de Waal, F.B.M., 2002. Empathy: its ultimate and proximate bases.Behavioral and Brain Sciences 25, 1–72.
Raes, F., Hermans, D., Williams, J.M.G., 2006. Negative bias in the perception ofothers’ facial emotional expressions in major depression: the role of depres-sive rumination. Journal of Nervous and Mental Disease 194, 796–799.
Regenbogen, C., Schneider, D.A., Finkelmeyer, A., Kohn, N., Derntl, B., Kellermann,T., Gur, R.E., Schneider, F., Habel, U., 2012a. The differential contribution offacial expressions, prosody, and speech content to empathy. Cognition andEmotion 1, 1–20.
Regenbogen, C., Schneider, D.A., Gur, R.E., Schneider, F., Habel, U., Kellermann, T.,2012b. Multimodal human communication—targeting facial expressions,speech content and prosody. NeuroImage 60, 2346–2356.
Reitan, R.M., 1992. Trail making test: manual fur administration and scoring.Reitan Neuropsychology Laboratory, South Tucson, Arizona, USA.
Rottenberg, J., Gross, J.J., Gotlib, I.H., 2005. Emotion context insensitivity in majordepressive disorder. Journal of Abnormal Psychology 4, 627–639.
Rottenberg, J., 2005. Mood and emotion in major depression. Current Directions inPsychological Science 14, 167–170.
Rottenberg, J., Gross, J.J., 2007. Emotion and emotion regulation: a map of psy-chotherapy researchers. Clinical Psychology Science and Practice 14, 323–328.
Rubinow, D.R., Post, R.M., 1992. Impaired recognition of affect in facial expressionin depressed patients. Biological Psychiatry 31, 947–953.
Schmidt, K.H., Metzler, P., 1992. Wortschatztest (WST). Beltz, Weinheim.Seubert, J., Kellermann, T., Loughead, J., Boers, F., Brensinger, C., Schneider, F.,
Habel, U., 2010. Processing of disgusted faces is facilitated by odor primes: afunctional MRI study. NeuroImage 53, 746–756.
Siegle, G.J., Thompson, W., Carter, C.S., Steinhauer, S.R., Thase, M.E., 2007.Increased amygdala and decreased dorsolateral prefrontal BOLD responses inunipolar depression: related and independent features. Biological Psychiatry61, 198–209.
Singer, T., 2006. The neuronal basis and ontogeny of empathy and mind reading:review of literature and implications for future research. Neuroscience andBiobehavioral Reviews 30, 855–863.
Singer, T., Lamm, C., 2009. The social neuroscience of empathy. Annals of the NewYork Academy of Sciences 1156, 81–96.
Sloan, D.M., Strauss, M.E., Quirk, S.W., Sajatovic, M., 1997. Subjective andexpressive emotional response in depression. Journal of Affective Disorders46, 135–141.
Please cite this article as: Schneider, D., et al., Empathic behavioralPsychiatry Research (2012), http://dx.doi.org/10.1016/j.psychres.201
Surguladze, S., Senior, C., Young, A.W., Brebion, G., Travis, M.J., Phillips, M.L., 2004.Recognition accuracy and response bias to happy and sad facial expressions inpatients with major depression. Neuropsychology 18, 212–218.
Surguladze, S., Brammer, M.J., Keedwell, P.K., Giampietro, V., Young, A.W., Travis,M.J., Williams, S.C.R., Phillips, M.L., 2005. A differential pattern of neural
response toward sad versus happy facial expressions in major depressivedisorder. Biological Psychiatry 57, 201–209.
Suslow, T., Dannlowski, U., Lalee-Mentzel, J., Donges, U.S., Arolt, V., Kersting, A.,2004. Spatial processing of facial emotion in patients with unipolar depres-sion: a longitudinal study. Journal of Affective Disorders 83, 59–63.
Suslow, T., Konrad, C., Kugel, H., Rumstadt, D., Zwitserlood, P., Schoning, S.,Ohrmann, P., Bauer, J., Pyka, M., Kersting, A., Arolt, V., Heindel, W., Dannlowski,
U., 2010. Automatic mood-congruent amygdala responses to masked facialexpressions in major depression. Journal of Biological Psychiatry 67, 155–160.
Stevenson, R.A., VanDerKlok, R.M., Pisoni, D.B., James, T.W., 2011. Discrete neuralsubstrates underlie complementary audiovisual speech integration processes.NeuroImage 55, 1339–1345.
Taesdale, J.D., 1983. Negative thinking in depression: cause, effect, or reciprocalrelationship? Advances in Behaviour Research and Therapy 5, 3–25.
Trautmann, S.A., Fehr, T., Herrmann, M., 2009. Emotions in motion: dynamiccompared to static facial expressions of disgust and happiness reveal more
widespread emotion-specific activations. Brain Research 1284, 100–115.Tsai, J.L., Pole, N., Levenson, R.W., Munoz, R.F., 2003. The effects of depression on
the emotional responses of spanish-speaking latinas. Cultural Diversity andEthnic Minoring Psychology 9, 49–63.
Venables, P.H., Mitchell, D.A., 1996. The effects of age, sex and time of testing on
skin conductance activity. Biological Psychology 43, 87–101.Wells, K.B., Stewart, A., Hays, R.D., Burnam, M.A., Rogers, W., Daniels, M., Berry, S.,
Greenfield, S., Ware, J., 1989. The functioning and well-being of depressedpatients: results from the medical outcomes study. The Journal of the
American Medical Association 262, 914–919.Weyers, P., Muhlberger, A., Hefele, C., Pauli, P., 2006. Electromyographic responses
to static and dynamic avatar emotional facial expressions. Psychophysiology43, 450–453.
Williams, L.M., Phillips, M.L., Brammer, M.J., Skerrett, D., Lagopoulos, J., Rennie, C.,
Bahramali, H., Olivieri, G., David, A.S., Peduto, A., Gordon, E., 2001. Arousaldissociates amygdala and hippocampal fear responses: evidence from simul-
taneous fMRI and skin conductance recording. NeuroImage 14, 1070–1079.Wittchen, H.U., Zaudig, M., Fydrich, T., 1997. Strukturiertes Klinisches interview
fur DSM-IV: SKID. Hogrefe, Gottingen.Wolkenstein, L., Schonenberg, M., Schirm, E., Hautzinger, M., 2011. I can see what
you feel, but I can’t deal with it: impaired theory of mind in depression.
Journal of Affective Disorders 132, 104–111.
and physiological responses to dynamic stimuli in depression.2.03.054