Emissions Pricing to Stabilize Global Climate
23
NOTA DI LAVORO 80.2011 Emissions Pricing to Stabilize Global Climate By Valentina Bosetti , Fondazione Eni Enrico Mattei and CMCC, Italy Sergey Paltsev, Massachusetts Institute of Technology (MIT), USA John Reilly, Massachusetts Institute of Technology (MIT), USA Carlo Carraro, Fondazione Eni Enrico Mattei, University of Venice, CMCC, CEPR and CESifo
-
Upload
independent -
Category
Documents
-
view
3 -
download
0
Transcript of Emissions Pricing to Stabilize Global Climate
NOTA DILAVORO80.2011
Emissions Pricing to Stabilize Global Climate
By Valentina Bosetti, Fondazione Eni Enrico Mattei and CMCC, Italy Sergey Paltsev, Massachusetts Institute of Technology (MIT), USA John Reilly, Massachusetts Institute of Technology (MIT), USA Carlo Carraro, Fondazione Eni Enrico Mattei, University of Venice, CMCC, CEPR and CESifo

The opinions expressed in this paper do not necessarily reflect the position of Fondazione Eni Enrico Mattei
Corso Magenta, 63, 20123 Milano (I), web site: www.feem.it, e-mail: [email protected]
Climate Change and Sustainable Development Series Editor: Carlo Carraro
Emissions Pricing to Stabilize Global Climate By Valentina Bosetti, Fondazione Eni Enrico Mattei and CMCC, Italy Sergey Paltsev, Massachusetts Institute of Technology (MIT), USA John Reilly, Massachusetts Institute of Technology (MIT), USA Carlo Carraro, Fondazione Eni Enrico Mattei, University of Venice, CMCC, CEPR and CESifo Summary In the absence of significant greenhouse gas (GHG) mitigation, many analysts project that atmospheric concentrations of species identified for control in the Kyoto protocol could exceed 1000 ppm (carbon-dioxide-equivalent) by 2100 from the current levels of about 435 ppm. This could lead to global average temperature increases of between 2.5 and 6°C by the end of the century. There are risks of even greater warming given that underlying uncertainties in emissions projections and climate response are substantial. Stabilization of GHG concentrations that would have a reasonable chance of meeting temperature targets identified in international negotiations would require significant reductions in GHG emissions below “business-as-usual” levels, and indeed from present emissions levels. Nearly universal participation of countries is required, and the needed investments in efficiency and alternative energy sources would entail significant costs. Resolving how these additional costs might be shared among countries is critical to facilitating a wide participation of large-emitting countries in a climate stabilization policy. The 2°C target is very ambitious given current atmospheric concentrations and inertia in the energy and climate system. The Copenhagen pledges for 2020 still keep the 2°C target within reach, but very aggressive actions would be needed immediately after that. Keywords: Emissions Pricing, Climate Stabilization JEL Classification: Q54, Q58 The note is prepared for the IMF Workshop on Fiscal Policy and Climate Mitigation, September 16, 2011, Washington, DC. We are grateful to Ian Parry and all the participants to the Workshop for comments and suggestions. The usual disclaimer applies. Address for correspondence: Valentina Bosetti Fondazione Eni Enrico Mattei Corso Magenta 63 20123 Milan Italy E-mail: [email protected]
Emissions Pricing to Stabilize Global Climate
Valentina Bosettia, Sergey Paltsevb, John Reillyb, Carlo Carraroc
Abstract
In the absence of significant greenhouse gas (GHG) mitigation, many analysts project that
atmospheric concentrations of species identified for control in the Kyoto protocol could
exceed 1000 ppm (carbon-dioxide-equivalent) by 2100 from the current levels of about 435
ppm. This could lead to global average temperature increases of between 2.5 and 6° C by the
end of the century. There are risks of even greater warming given that underlying
uncertainties in emissions projections and climate response are substantial. Stabilization of
GHG concentrations that would have a reasonable chance of meeting temperature targets
identified in international negotiations would require significant reductions in GHG
emissions below “business-as-usual” levels, and indeed from present emissions levels. Nearly
universal participation of countries is required, and the needed investments in efficiency and
alternative energy sources would entail significant costs. Resolving how these additional
costs might be shared among countries is critical to facilitating a wide participation of large-
emitting countries in a climate stabilization policy. The 2°C target is very ambitious given
current atmospheric concentrations and inertia in the energy and climate system. The
Copenhagen pledges for 2020 still keep the 2°C target within a reach, but very aggressive
actions would be needed immediately after that.
a Fondazione Eni Enrico Mattei (FEEM), Italy
b Massachusetts Institute of Technology (MIT), USA
c University of Venice, Italy
The note is prepared for the IMF Workshop on Fiscal Policy and Climate Mitigation, September 16,
2011, Washington, DC. We are grateful to Ian Parry and all the participants to the Workshop for
comments and suggestions. The usual disclaimer applies.
2
1. Where are we headed in the absence of climate policy?
Climate change may pose substantial risks to natural and human systems (IPCC, 2007). In the
absence of a policy that targets a reduction of greenhouse gas (GHG) emissions, projected “likely”
temperature increases by the end of the century are in the range of 2.4 - 6.4°C above pre-industrial levels.
The IPCC defines “likely” as a 66% chance or greater.
(IPCC, 2007).1 A recent MIT study with updated climate and
socioeconomic parameters provide even higher values: a
90% range of 3.8 - 7°C with a mean value of 5.2°C (Sokolov
et al, 2009).
There are many efforts to project future emissions trends
and the range of projections over the 21st century is wide.
GDP and population growth are major determinants of
emissions growth, while increases in energy efficiency (e.g.,
cars with an ability to drive longer distances per unit of fuel,
or buildings that require less energy to heat them) and
increasing costs of fossil fuels had the opposing effect on
emissions. Most likely, economic growth will remain a major
factor in driving up emissions, whereas the role of population
will slowly fade over time as most population projections
forecast a stabilization of the world population in the second
half of the 21st century. What differs most across forecasting
models, hence causing the uncertainty affecting projections,
are the assumptions concerning future GDP growth; the
availability of fossil resources; the pace and direction of
technical change, in turn affecting the cost of low-carbon technologies and the energy intensity of the
economy; and behavioural shifts, affecting energy demand. Whether or not the world undertakes
significant policy directed toward reducing GHG emissions is an additional uncertainty on top of various
economic forces that will play out over the century.
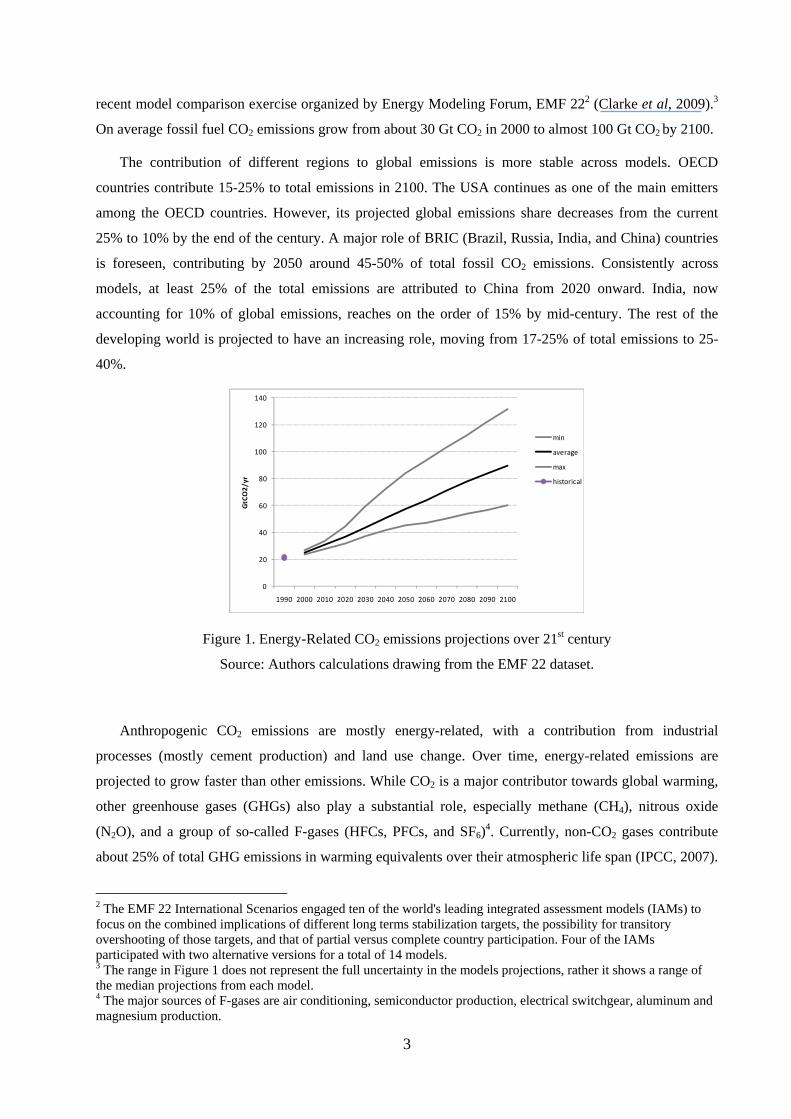
In the absence of a climate stabilization policy, energy-related CO2 emissions (the primary GHG) are
projected to increase substantially during the 21st century. Figure 1 shows the range of projections in a
1 To date, temperatures are estimated to have risen by approximately 0.75°C relative to pre-industrial (year 1750) levels.
Glossary: Greenhouse Gas (GHG): a gas that affects a temperature of the Earth. Kyoto Gases: six GHGs covered by the Kyoto Protocol: CO2, CH4, N2O, SF6, HFCs, PFCs. Gt: gigatonne is 1 billion (109) tonnes. ppm: parts per million by volume, or ppm, is a metric to express gas concentration in the atmosphere. It can refer to concentration of CO2 only, ppm CO2, or all GHGs converted to CO2, ppm of CO2 equivalent. Equivalent CO2 (CO2e): is the concentration of CO2 that would cause the same level of radiative forcing as a given type and concentration of greenhouse gas. Radiative forcing: difference between incoming and outgoing radiation energy; the metric for radiative forcing is watt per square meter.
3
recent model comparison exercise organized by Energy Modeling Forum, EMF 222 (Clarke et al, 2009).3
On average fossil fuel CO2 emissions grow from about 30 Gt CO2 in 2000 to almost 100 Gt CO2 by 2100.
The contribution of different regions to global emissions is more stable across models. OECD
countries contribute 15-25% to total emissions in 2100. The USA continues as one of the main emitters
among the OECD countries. However, its projected global emissions share decreases from the current
25% to 10% by the end of the century. A major role of BRIC (Brazil, Russia, India, and China) countries
is foreseen, contributing by 2050 around 45-50% of total fossil CO2 emissions. Consistently across
models, at least 25% of the total emissions are attributed to China from 2020 onward. India, now
accounting for 10% of global emissions, reaches on the order of 15% by mid-century. The rest of the
developing world is projected to have an increasing role, moving from 17-25% of total emissions to 25-
40%.
0
20
40
60
80
100
120
140
1990 2000 2010 2020 2030 2040 2050 2060 2070 2080 2090 2100
GtCO2/yr
min
average
max
historical
Figure 1. Energy-Related CO2 emissions projections over 21st century
Source: Authors calculations drawing from the EMF 22 dataset.
Anthropogenic CO2 emissions are mostly energy-related, with a contribution from industrial
processes (mostly cement production) and land use change. Over time, energy-related emissions are
projected to grow faster than other emissions. While CO2 is a major contributor towards global warming,
other greenhouse gases (GHGs) also play a substantial role, especially methane (CH4), nitrous oxide
(N2O), and a group of so-called F-gases (HFCs, PFCs, and SF6)4. Currently, non-CO2 gases contribute
about 25% of total GHG emissions in warming equivalents over their atmospheric life span (IPCC, 2007).
2 The EMF 22 International Scenarios engaged ten of the world's leading integrated assessment models (IAMs) to focus on the combined implications of different long terms stabilization targets, the possibility for transitory overshooting of those targets, and that of partial versus complete country participation. Four of the IAMs participated with two alternative versions for a total of 14 models. 3 The range in Figure 1 does not represent the full uncertainty in the models projections, rather it shows a range of the median projections from each model. 4 The major sources of F-gases are air conditioning, semiconductor production, electrical switchgear, aluminum and magnesium production.
4
CO2 emissions are projected to grow faster than non-CO2 emissions over the 21st century. Among CO2
emissions, land use emissions are also an important part of the story. The latest IPCC report estimates that
destruction of tropical forests and peat lands contributed 18% of global anthropogenic GHG emissions in
2004. Emissions from deforestation come primarily from a subset of tropical countries, like Brazil,
Indonesia, and some countries in Central and Western Africa. Reduced deforestation in these countries
and reforestation of temperate regions could contribute to mitigation efforts.
Emissions projections, absent significant policy show continued rapid increases in global
concentrations of GHGs. The EMF-22 scenarios discusses above result in CO2-equivalent concentrations
of 800-1500 ppm by 2100 counting concentrations of the gases identified for control in the Kyoto
protocol, up from 420 ppm in 2000. Other substances will also affect future climate. These include the
CFCs, whose emissions are largely phased out under the Montreal Protocol, but that remain in the
atmosphere as a powerful contribution to warming, and other short lived substances some of which are
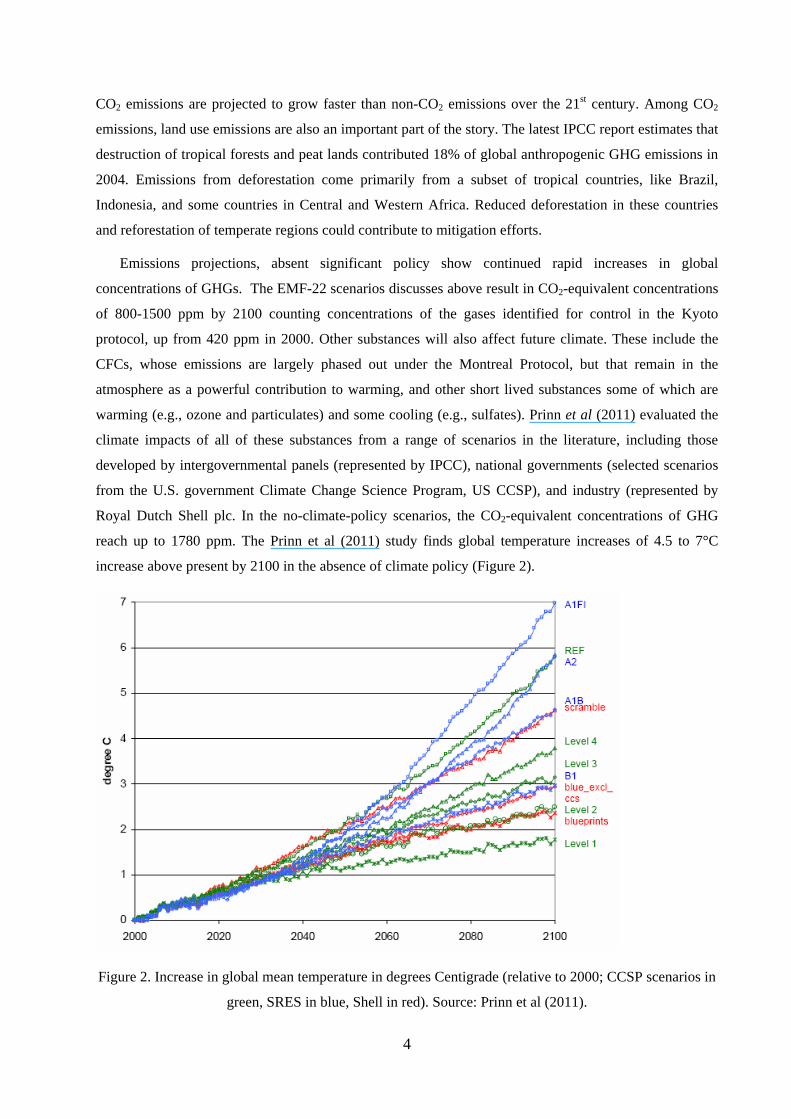
warming (e.g., ozone and particulates) and some cooling (e.g., sulfates). Prinn et al (2011) evaluated the
climate impacts of all of these substances from a range of scenarios in the literature, including those
developed by intergovernmental panels (represented by IPCC), national governments (selected scenarios
from the U.S. government Climate Change Science Program, US CCSP), and industry (represented by
Royal Dutch Shell plc. In the no-climate-policy scenarios, the CO2-equivalent concentrations of GHG
reach up to 1780 ppm. The Prinn et al (2011) study finds global temperature increases of 4.5 to 7°C
increase above present by 2100 in the absence of climate policy (Figure 2).
Figure 2. Increase in global mean temperature in degrees Centigrade (relative to 2000; CCSP scenarios in
green, SRES in blue, Shell in red). Source: Prinn et al (2011).
5
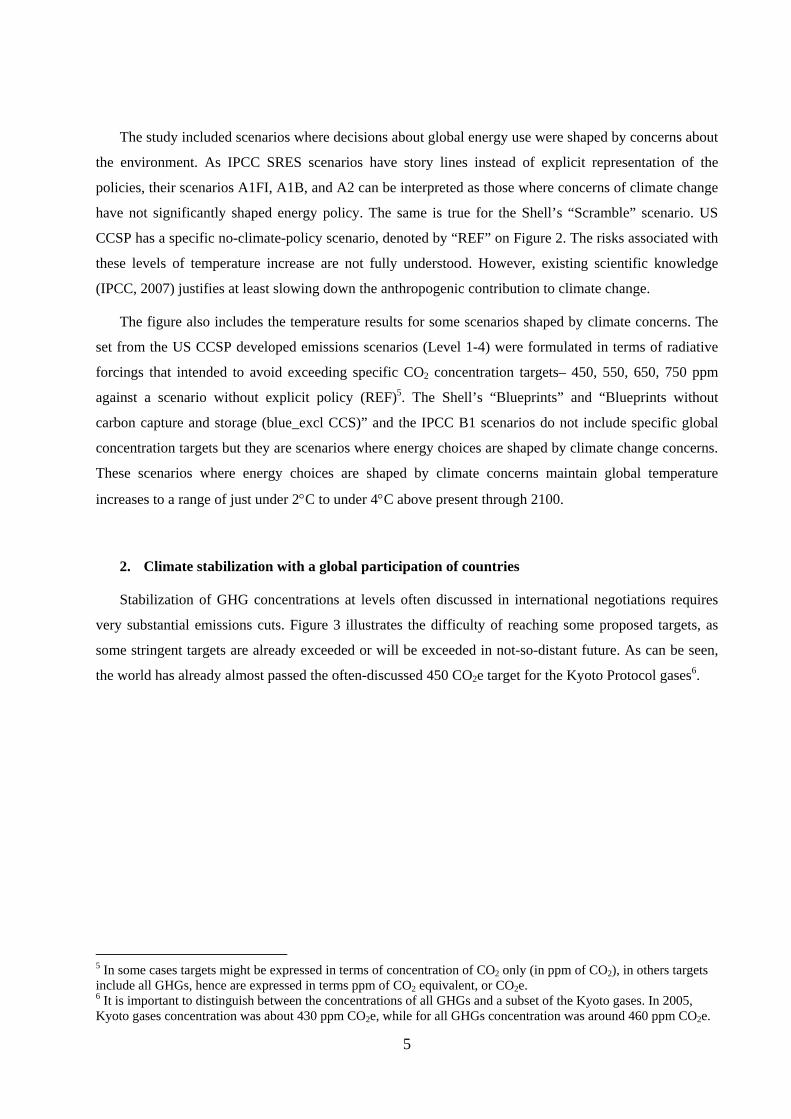
The study included scenarios where decisions about global energy use were shaped by concerns about
the environment. As IPCC SRES scenarios have story lines instead of explicit representation of the
policies, their scenarios A1FI, A1B, and A2 can be interpreted as those where concerns of climate change
have not significantly shaped energy policy. The same is true for the Shell’s “Scramble” scenario. US
CCSP has a specific no-climate-policy scenario, denoted by “REF” on Figure 2. The risks associated with
these levels of temperature increase are not fully understood. However, existing scientific knowledge
(IPCC, 2007) justifies at least slowing down the anthropogenic contribution to climate change.
The figure also includes the temperature results for some scenarios shaped by climate concerns. The
set from the US CCSP developed emissions scenarios (Level 1-4) were formulated in terms of radiative
forcings that intended to avoid exceeding specific CO2 concentration targets– 450, 550, 650, 750 ppm
against a scenario without explicit policy (REF)5. The Shell’s “Blueprints” and “Blueprints without
carbon capture and storage (blue_excl CCS)” and the IPCC B1 scenarios do not include specific global
concentration targets but they are scenarios where energy choices are shaped by climate change concerns.
These scenarios where energy choices are shaped by climate concerns maintain global temperature
increases to a range of just under 2°C to under 4°C above present through 2100.
2. Climate stabilization with a global participation of countries
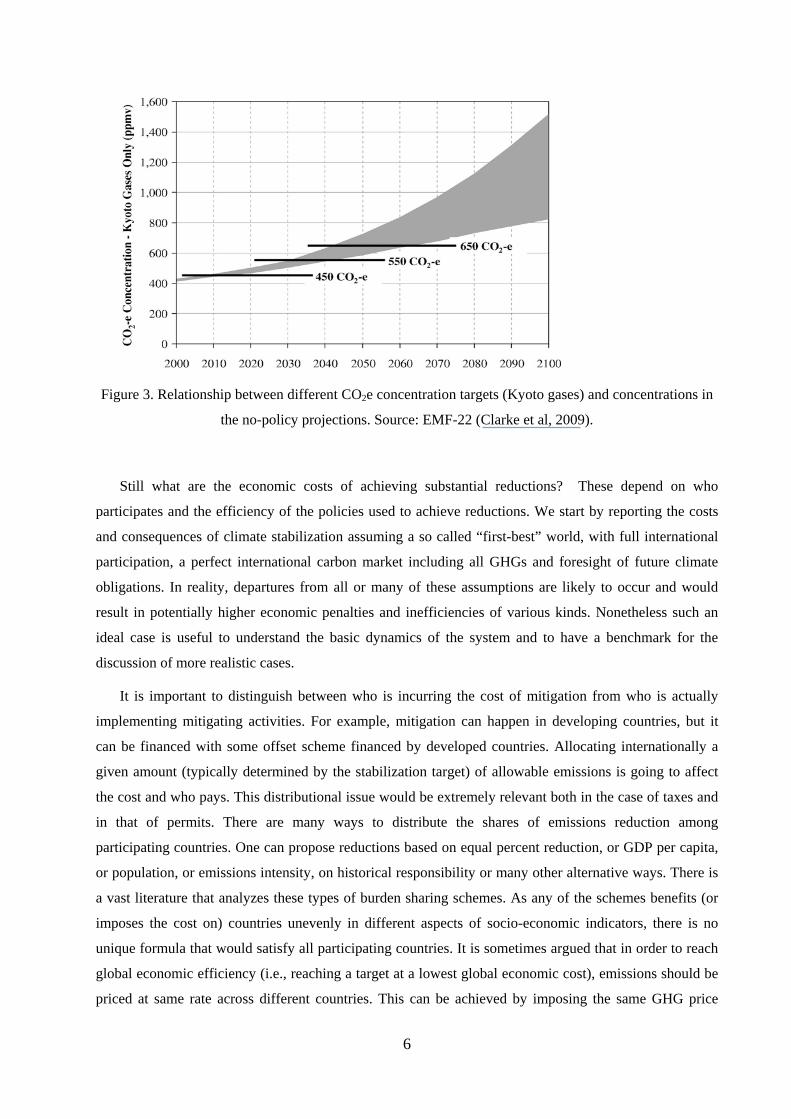
Stabilization of GHG concentrations at levels often discussed in international negotiations requires
very substantial emissions cuts. Figure 3 illustrates the difficulty of reaching some proposed targets, as
some stringent targets are already exceeded or will be exceeded in not-so-distant future. As can be seen,
the world has already almost passed the often-discussed 450 CO2e target for the Kyoto Protocol gases6.
5 In some cases targets might be expressed in terms of concentration of CO2 only (in ppm of CO2), in others targets include all GHGs, hence are expressed in terms ppm of CO2 equivalent, or CO2e. 6 It is important to distinguish between the concentrations of all GHGs and a subset of the Kyoto gases. In 2005, Kyoto gases concentration was about 430 ppm CO2e, while for all GHGs concentration was around 460 ppm CO2e.
6
Figure 3. Relationship between different CO2e concentration targets (Kyoto gases) and concentrations in
the no-policy projections. Source: EMF-22 (Clarke et al, 2009).
Still what are the economic costs of achieving substantial reductions? These depend on who
participates and the efficiency of the policies used to achieve reductions. We start by reporting the costs
and consequences of climate stabilization assuming a so called “first-best” world, with full international
participation, a perfect international carbon market including all GHGs and foresight of future climate
obligations. In reality, departures from all or many of these assumptions are likely to occur and would
result in potentially higher economic penalties and inefficiencies of various kinds. Nonetheless such an
ideal case is useful to understand the basic dynamics of the system and to have a benchmark for the
discussion of more realistic cases.
It is important to distinguish between who is incurring the cost of mitigation from who is actually
implementing mitigating activities. For example, mitigation can happen in developing countries, but it
can be financed with some offset scheme financed by developed countries. Allocating internationally a
given amount (typically determined by the stabilization target) of allowable emissions is going to affect
the cost and who pays. This distributional issue would be extremely relevant both in the case of taxes and
in that of permits. There are many ways to distribute the shares of emissions reduction among
participating countries. One can propose reductions based on equal percent reduction, or GDP per capita,
or population, or emissions intensity, on historical responsibility or many other alternative ways. There is
a vast literature that analyzes these types of burden sharing schemes. As any of the schemes benefits (or
imposes the cost on) countries unevenly in different aspects of socio-economic indicators, there is no
unique formula that would satisfy all participating countries. It is sometimes argued that in order to reach
global economic efficiency (i.e., reaching a target at a lowest global economic cost), emissions should be
priced at same rate across different countries. This can be achieved by imposing the same GHG price
7
across the countries through a system of carbon taxes, or by allowing a full trade in emissions permits
among all countries and all sectors of the economy7.
(i) Emissions and Emissions Prices
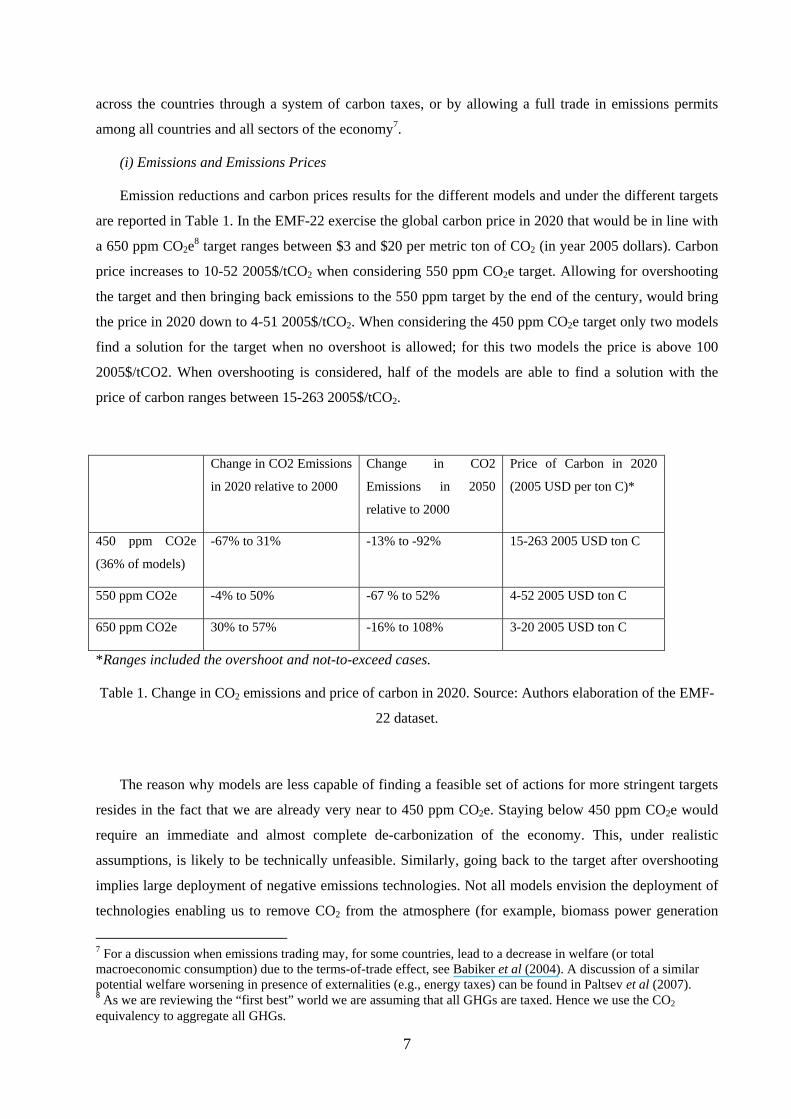
Emission reductions and carbon prices results for the different models and under the different targets
are reported in Table 1. In the EMF-22 exercise the global carbon price in 2020 that would be in line with
a 650 ppm CO2e8 target ranges between $3 and $20 per metric ton of CO2 (in year 2005 dollars). Carbon
price increases to 10-52 2005$/tCO2 when considering 550 ppm CO2e target. Allowing for overshooting
the target and then bringing back emissions to the 550 ppm target by the end of the century, would bring
the price in 2020 down to 4-51 2005$/tCO2. When considering the 450 ppm CO2e target only two models
find a solution for the target when no overshoot is allowed; for this two models the price is above 100
2005$/tCO2. When overshooting is considered, half of the models are able to find a solution with the
price of carbon ranges between 15-263 2005$/tCO2.
Change in CO2 Emissions
in 2020 relative to 2000
Change in CO2
Emissions in 2050
relative to 2000
Price of Carbon in 2020
(2005 USD per ton C)*
450 ppm CO2e
(36% of models)
-67% to 31% -13% to -92% 15-263 2005 USD ton C
550 ppm CO2e -4% to 50% -67 % to 52% 4-52 2005 USD ton C
650 ppm CO2e 30% to 57% -16% to 108% 3-20 2005 USD ton C
*Ranges included the overshoot and not-to-exceed cases.
Table 1. Change in CO2 emissions and price of carbon in 2020. Source: Authors elaboration of the EMF-
22 dataset.
The reason why models are less capable of finding a feasible set of actions for more stringent targets
resides in the fact that we are already very near to 450 ppm CO2e. Staying below 450 ppm CO2e would
require an immediate and almost complete de-carbonization of the economy. This, under realistic
assumptions, is likely to be technically unfeasible. Similarly, going back to the target after overshooting
implies large deployment of negative emissions technologies. Not all models envision the deployment of
technologies enabling us to remove CO2 from the atmosphere (for example, biomass power generation
7 For a discussion when emissions trading may, for some countries, lead to a decrease in welfare (or total macroeconomic consumption) due to the terms-of-trade effect, see Babiker et al (2004). A discussion of a similar potential welfare worsening in presence of externalities (e.g., energy taxes) can be found in Paltsev et al (2007). 8 As we are reviewing the “first best” world we are assuming that all GHGs are taxed. Hence we use the CO2 equivalency to aggregate all GHGs.
8
coupled with CO2 capture and storage). These technologies deployed at a massive scale would allow
bringing down concentrations emission pathways later in the century9.
As the “first best” assumption allows for the full trading in emissions permits, the 2020 carbon price
will increase over time at a discount rate because of perfect substitutability of trading in emissions permits
and other financial instruments. Different modeling groups assume different discount rates, usually in the
range of 3-5%, so the carbon price would also increase over time at the same rate.
Looking at emission reductions needed to be in line with the different targets (first and second
column in Table 1) it is important to notice that, for the near- and medium-term, there is not much
difference in appropriate emission prices for 550 and 650 ppm—but very large emission reductions are
required, even in the short run for the 450 ppm CO2e scenario.
(ii) Policy Costs
The carbon price might be a misleading indicator for the economic cost of climate policy as it does
not univocally translates in macroeconomic or welfare impacts (for a detailed discussion, see, for
example, Appendix B in Paltsev et al, 2009). Indeed economists usually measure the cost in terms of
welfare loss (or loss in consumption measured as equivalent variation, that roughly can be interpreted as
the macroeconomic combination of the cost of producing with more efficient technologies, or cleaner but
more expensive fuels, the forgone benefits to households from cutting back on energy use, etc.). GDP loss
is another popular measure for the cost of a policy, as many of the models used for climate policy analysis
do not report welfare10. Most of the studies focus on emissions mitigation costs as climate benefits and
potential ancillary non-climate benefits of GHG mitigation are much more uncertain.
EMF-22 reports the net present value of GDP costs (discounted at 5%) in the range of $2-24 trillion
(year 2005 US dollars) for 650 ppm CO2e stabilization, in the range of $16-45 trillion 2005$ for 550 ppm
CO2e stabilization, and $55-125 trillion 2005$ for 450 ppm CO2e stabilization (losses as shares of the
world GDP in net present value are discussed in the next section).
US CCSP (Clarke et al, 2007) does also reports the cost of climate policy as a percentage reduction in
the global GDP, but rather than a net present values, reports the loss in different periods of time. The most
stringent stabilization level in this study is roughly equal to 550 ppm CO2e (450 ppm when only CO2
contributions are considered). The loss of the world GDP in comparison to a scenario with no climate
policy is in the range of 1-4% in 2040 and 1-16% in 2100.
9 Currently, these negative carbon technologies are highly speculative. For a discussion concerning the potential role of bioenergy and carbon capture and storage technologies on the costs of stringent policy see Tavoni and Tol (2010). For a discussion about potential technological and economic obstacles for air capture technologies see Ranjan (2010). 10 As GDP measures not only consumption, but also government spending, investment and net trade, it is less satisfactory indicator of cost of a policy. For additional discussion, see Appendix B in Paltsev et al (2009).
9
Emissions pricing will induce emissions reductions in the sectors where these reductions are cheapest.
Models have different views about the timing of emissions reduction, but most of the projections agree
that the power generation sector will be the first area where less-carbon-emitting (e.g., natural gas) or
almost-zero-carbon-emitting technologies (e.g., nuclear, hydro, renewables) are introduced because of
various economic substitutes that already exist in this sector11. Less-emitting technologies in
transportation (e.g., gasoline/electric hybrid vehicles, more fuel efficient conventional vehicles) and
energy-saving technologies in buildings and industry are also promising, but currently look more
expensive. Substantial reductions in GHG emissions in agriculture and cement production are also costly,
but to achieve climate stabilization, emissions from all sectors of the economy need to be reduced
drastically. For more stringent climate stabilization targets, the reductions are needed to begin in the near
future, and if the models are correct, some very ambitious targets (i.e., 450 ppm CO2e) might be already
out of reach. Previous economic analyses have estimated that there may be significant and relatively
inexpensive and cost effective opportunities for protecting and enhancing global forest carbon stocks.
Linking REDD (Reducing Emissions from Deforestation and forest Degradation) could be extremely
beneficial as it is a low cost carbon abatement opportunity, although several implementation issues would
need to be overcome. Deforestation mitigation could lower the total costs of climate stabilization policies
by around 10-25% depending on the policy scenario, and could enable additional reductions of about 20
ppm CO2e with no added costs compared to an energy-sector only policy (Bosetti et al, 2011). However,
most of rainforest countries have not yet developed the implementation capacity for monitoring and
enforcing country scale projects and this might diminish the role of REDD in the next decade.
Deferring the bulk of mitigation action to later periods can make sense if we are optimistic about the
availability, cost and speed of deployment of low-emissions technologies. A further degree of freedom is
represented by negative emissions technologies. However, relying on a technological future which might
not evolve as expected comes at a risk of missing the target completely.
3. Incomplete participation and delayed action
Carbon prices as well as mitigation costs depend critically on assumptions about (1) innovation and
the availability of low-carbon alternatives to conventional fossil fuels, (2) flexibility of substitution within
the energy-economic system, (3) the credibility of future policies that triggers long term investments and
(4) the immediate action of all countries or of major emitters. In this section we investigate the latter
crucial assumption and how it might influence results presented so far.
For a given stabilization target, delayed global action implies a higher post peak reduction rate. Short
term inaction would then result in a required pace of de-carbonization so rapid that replacement of capital
11 Jacoby et al (2012) provide an assessment of the role of natural gas in a potential U.S. climate policy considering recent shale gas development.
10
would need to be abrupt and very costly. Only under the optimistic assumption of large-scale CO2
removal, the tradeoff between costs and timing of action can be less severe. If the world continues
according to business-as-usual until 2030, stabilization at 550 ppm CO2e will no longer be possible,
according to most models. The target might still be feasible if ambitious mitigation policies at global scale
are postponed until 2020, but this delay could substantially scale up global mitigation cost. Climate policy
aiming at 450 ppm CO2e target leaves even less leeway for a delay of cooperative mitigation action
(Edenhofer et al, 2009).
Rather than complete global inaction, more likely we will face asymmetry of actions across world
regions. Significant mitigation actions are planned to take place in some developed countries within the
next decade (e.g., the EU has committed to the 20% reduction below 1990 levels target by 2020).
However, it is unlikely that emerging economies will make substantial emissions reductions in the
coming decade.
Even asymmetric participation may rule out some of the more stringent targets, while scaling-up the
global costs of those stabilization scenarios that still remain feasible. Inaction in developing countries
clashes with the fact that the bulk of emissions in the next decades will be coming from non-OECD
countries. If CO2 emissions are not regulated in some major emitting countries, two inefficiencies arise. A
static inefficiency, as mitigation does not take place where mitigation costs are lowest. A dynamic
inefficiency, as unregulated countries are those where most of new investments will take place. Investing
instead in fossil technologies, fast growing countries eventually lock-in in these long-lived technologies
(e.g., a new coal plant may be in use for 50 years) and later conversion to low-carbon technologies
becomes more costly, or simply impossible if early scrapping is deemed unfeasible. Finally, non-
participating countries might react to lower fossil fuel prices, deriving from the contraction in the
demand, and increase their emissions, thus partially offsetting the environmental benefit of early movers.
One solution frequently pointed out by economist is the use of incentive systems (as for example an
evolution of the Clean Development Mechanism) to induce reductions in developing countries while
limiting leakage (see Bosetti and Frankel, 2009, for a detailed discussion of political feasibility of
alternative targets).
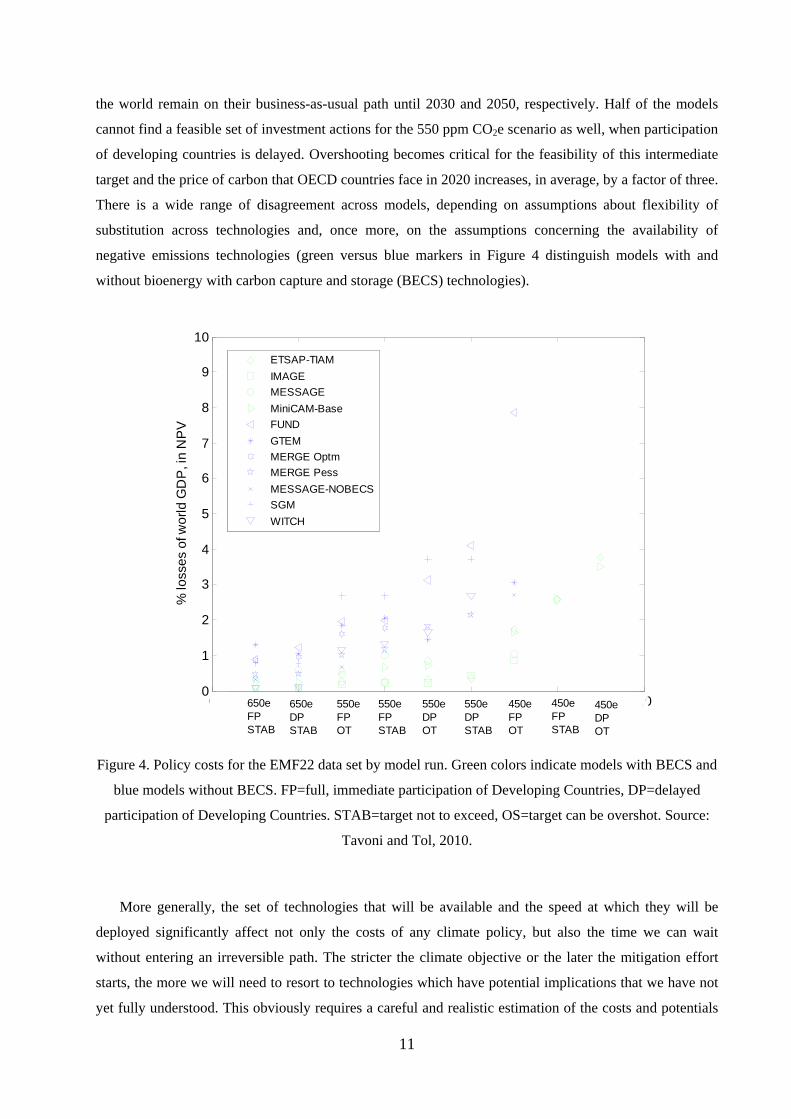
For a more detailed discussion we report again results from to the latest Energy Modeling Forum
exercise (EMF-22, Clarke et al, 2009) that looked extensively into the issue of asymmetry of participation
to a climate agreement and how this would affect the feasibility of stabilization scenarios as well as the
costs. Figure 4 reports the results in terms of percentage of loss in the world GDP (in net present value)
for different models, different targets, different emission pathways (including and excluding
overshooting), and for different levels of participation (full and delayed).
The key result, consistent across models, is that the 450 ppm CO2e stabilization scenarios is basically
unfeasible if only OECD coalition immediately undertake mitigation action, while BRICs and the rest of
11
the world remain on their business-as-usual path until 2030 and 2050, respectively. Half of the models
cannot find a feasible set of investment actions for the 550 ppm CO2e scenario as well, when participation
of developing countries is delayed. Overshooting becomes critical for the feasibility of this intermediate
target and the price of carbon that OECD countries face in 2020 increases, in average, by a factor of three.
There is a wide range of disagreement across models, depending on assumptions about flexibility of
substitution across technologies and, once more, on the assumptions concerning the availability of
negative emissions technologies (green versus blue markers in Figure 4 distinguish models with and
without bioenergy with carbon capture and storage (BECS) technologies).
0 2 4 6 8 100
1
2
3
4
5
6
7
8
9
10
% lo
sses
of w
orld
GD
P, i
n N
PV
ETSAP-TIAMIMAGEMESSAGEMiniCAM-BaseFUNDGTEMMERGE OptmMERGE PessMESSAGE-NOBECSSGMWITCH
650eFPSTAB
650eDPSTAB
550eFPOT
550eFPSTAB
550eDPOT
550eDPSTAB
450eFPOT
450eFPSTAB
450eDPOT
Figure 4. Policy costs for the EMF22 data set by model run. Green colors indicate models with BECS and
blue models without BECS. FP=full, immediate participation of Developing Countries, DP=delayed
participation of Developing Countries. STAB=target not to exceed, OS=target can be overshot. Source:
Tavoni and Tol, 2010.
More generally, the set of technologies that will be available and the speed at which they will be
deployed significantly affect not only the costs of any climate policy, but also the time we can wait
without entering an irreversible path. The stricter the climate objective or the later the mitigation effort
starts, the more we will need to resort to technologies which have potential implications that we have not
yet fully understood. This obviously requires a careful and realistic estimation of the costs and potentials
12
of these technologies, the research development and demonstration requirements to make them available
with a reasonable level of certainty, and the potential barriers and external costs that might be linked to
their deployment on a large-scale.
How do projections we have discussed so far compare with the current state of climate negotiations?
Instead of an ideal global system, countries agreed on submitting their “pledges” during the meetings in
Copenhagen in 2009 and Cancun in 2010, where most of developed countries submitted their emissions
reductions targets relative to emissions in 1990, 2000, or 200512. Brazil, Mexico, Indonesia, South Africa
and South Korea proposed the reductions relative to their business-as-usual emissions13, and China and
India submitted carbon intensity reduction targets (i.e., CO2 emissions per unit of GDP). Some of the
pledges have conditions attached, such as the provision of finance and technology or ambitious actions
from other countries; some pledges were provided as ranges. This leads to a degree of freedom in their
implementation and a range of potential outcomes rather than a single estimate.14
The implications of these pledges for 2020 global emissions will hence depend on what pledges are
implemented and what rules will be applied. Many scientific groups have estimated global emissions in
2020 based on the Copenhagen Accord pledges. The 2010 Emission Gap Report (den Elzen et al, 2010)
collects these estimates and shows that, on one hand, emissions in 2020 could be as low as 49 GtCO2e
(range: 47-51 GtCO2e) when countries implement their conditional pledges in their more stringent
declination. On the other hand, they could be as high as 53 GtCO2e (range: 52-57 GtCO2e) when
countries implement unconditional pledges in their more lenient declination.
Emission pathways consistent with a “likely” chance of meeting the 2°C limit generally peak before
2020, have emission levels in 2020 around 44 GtCO2e (range: 39-44 GtCO2e), have steep emission
reductions afterwards and/or reach negative emissions in the longer term. Hence, the ranges implied by
Copenhagen pledges do not necessarily rule out the 2°C target, as the two ranges are not severely distant
from one another. However, as previously discussed, the larger the overshoot will be, the faster the de-
carbonization in the second half of the century will be needed, with all the implications that we have
discussed above.
The consideration that the 2° C target could be out of reach should not be a reason to inaction. Even
limited actions towards reducing GHG concentrations result in a substantial reduction in risk of exceeding
a certain temperature threshold. Table 2 (adapted from Webster et al, 2009) illustrates the benefits of at
least some mitigation actions in comparison to the no-action scenario. For example, stabilization at 800
ppm reduces the probability of exceeding 4°C in 2100 to 7 percent from 85 percent in the no-policy
12 Typical targets for developed regions like the U.S., EU, Canada, Japan are in the range of 20 percent GHG reduction relative to 2000 levels. 13 Targets expressed with respect to baseline emissions are particularly tricky as they can be interpreted in very different ways depending on the baseline projection adopted. 14 The reader is referred to the UNEP website for an overview of all pledges http://www.unep.org/climatepledges/
13
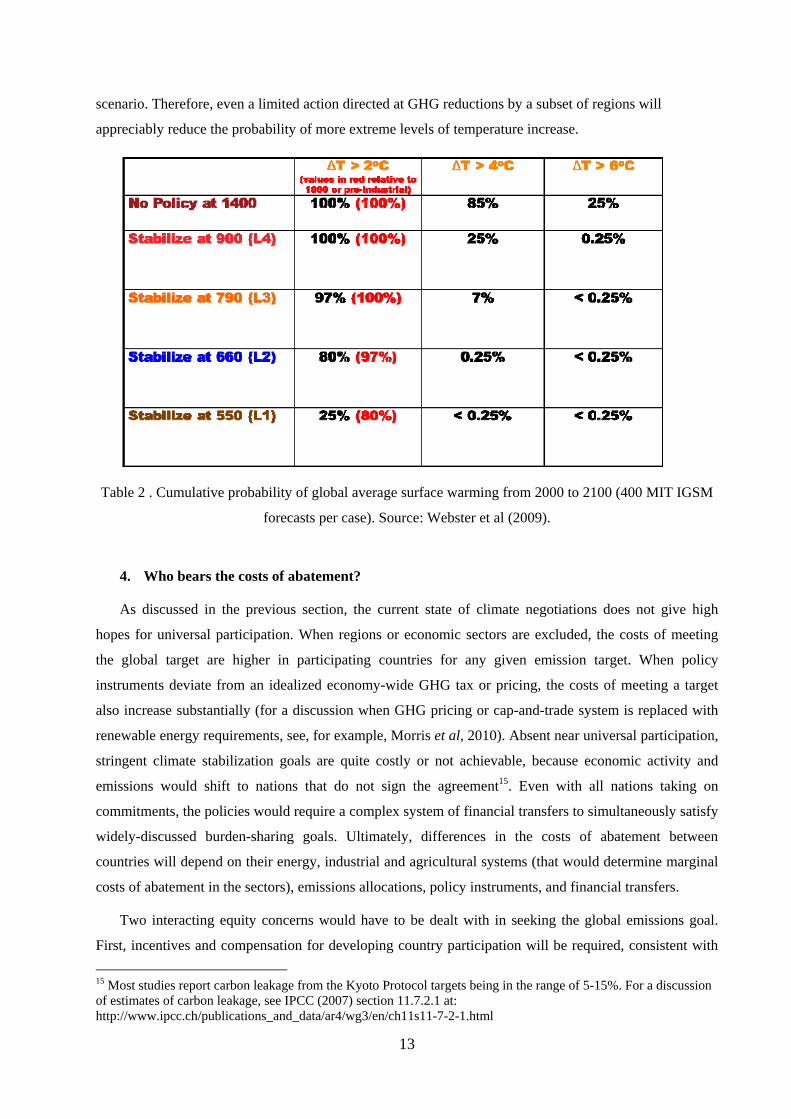
scenario. Therefore, even a limited action directed at GHG reductions by a subset of regions will
appreciably reduce the probability of more extreme levels of temperature increase.
Table 2 . Cumulative probability of global average surface warming from 2000 to 2100 (400 MIT IGSM
forecasts per case). Source: Webster et al (2009).
4. Who bears the costs of abatement?
As discussed in the previous section, the current state of climate negotiations does not give high
hopes for universal participation. When regions or economic sectors are excluded, the costs of meeting
the global target are higher in participating countries for any given emission target. When policy
instruments deviate from an idealized economy-wide GHG tax or pricing, the costs of meeting a target
also increase substantially (for a discussion when GHG pricing or cap-and-trade system is replaced with
renewable energy requirements, see, for example, Morris et al, 2010). Absent near universal participation,
stringent climate stabilization goals are quite costly or not achievable, because economic activity and
emissions would shift to nations that do not sign the agreement15. Even with all nations taking on
commitments, the policies would require a complex system of financial transfers to simultaneously satisfy
widely-discussed burden-sharing goals. Ultimately, differences in the costs of abatement between
countries will depend on their energy, industrial and agricultural systems (that would determine marginal
costs of abatement in the sectors), emissions allocations, policy instruments, and financial transfers.
Two interacting equity concerns would have to be dealt with in seeking the global emissions goal.
First, incentives and compensation for developing country participation will be required, consistent with 15 Most studies report carbon leakage from the Kyoto Protocol targets being in the range of 5-15%. For a discussion of estimates of carbon leakage, see IPCC (2007) section 11.7.2.1 at: http://www.ipcc.ch/publications_and_data/ar4/wg3/en/ch11s11-7-2-1.html

14
the principle of common but differentiated responsibilities. Second, since mitigation costs and
compensation payments by developed countries will be substantial, they also will need to find an
acceptable burden-sharing arrangement among themselves. Simple emissions reduction rules are
incapable of dealing with the highly varying circumstances of different countries.
Successful climate negotiations will need to be grounded in a full understanding of the substantial
amounts at stake. For example, for 50% global emissions reductions by 2050 relative to 2000, Jacoby et
al (2009) show that if developing countries (including China and India) are fully compensated for the
costs of mitigation in the period to 2050, then the average welfare cost to developed countries is around
2% of GDP in 2020 (relative to reference level), rising to 10% in 2050. The implied financial transfers are
large—over $400 billion per year in 2020 and rising to around $3 trillion in 2050. The United States’
share of these transfers is $200 billion in 2020, and over a trillion dollars in 205016.
With less than full compensation the welfare burden on developing countries would rise, but the
international financial transfers would remain of unprecedented scale. It is an extreme assumption that
developing countries will demand complete compensation. If, as is likely, they are willing to bear some
costs, then the welfare burden on the developed countries will be reduced. Also, the burden is lowered
somewhat if compensation only covers direct mitigation costs and not other losses associated with the
policy, as might come through terms-of-trade effects. In the process the required financial transfers are
reduced as well, but they remain large17.
In general, the cost of mitigation is higher in energy-exporting countries, while energy-importers have
some counter-effects in terms-of-trade due to a lower fossil fuel prices that allow them to reduce the cost
of participation. The welfare costs can be both substantial and wildly different across regions depending
on the allocation methods and policy instruments chosen18. What makes matters worse is that climate
change related damages vary wildly as well but in a very different way, adding up to the complexity of
the problem. For success in dealing with the climate threat any negotiation of long-term goals and paths to
achievement need to be grounded in a full understanding of the substantial amounts at stake.
16 Given large budget deficits at present, these transfers seem even more unrealistic. Even one of the Copenhagen Accord goals of $100 billion per year by 2020 for climate financing from “a wide variety of sources” seems quite questionable at this point, which illustrates a degree of difficulty to reach a global agreement when developing countries are expecting to get help with GHG emissions mitigation. 17 In this case the annual financial transfers to developing countries are lower by $77 billion in 2020 and by $108 billion in 2050 (Jacoby et al, 2009). 18 Higher the deviation from the “first-best” instruments (such as universal carbon taxes), larger the costs are.

15
5. Conclusions
We summarize below main conclusions.
• Without significant emissions mitigation actions, the likely atmospheric temperature
increase is projected to range between 2.5 and 6° C by the end of the century. The risks
associated with temperature increases above 2°C are not fully understood. Existing
scientific knowledge justifies at least slowing down the anthropogenic contribution to
climate change.
• The 2°C target, the goal identified in the Copenhagen Accord (COP 15) and reiterated in
the Cancun Agreements (COP 16), is very ambitious given current atmospheric
concentrations and inertia in the energy and climate system. The Copenhagen pledges for
2020 still keep the 2°C target within a reach, but very aggressive actions would be
needed immediately after that.
• In 2000 global GHG emissions were about 40 gigatonnes (Gt), a successful
implementation of the Copenhagen Accord is expected to result in about 50 Gt in 2020.
To be on a 2°C target path, by 2050 most models project the global emissions in the
range of 15-20 Gt. Some models envision a development of (still unproven) negative
carbon technologies that would allow the postponement of some mitigation action.
• Postponing the mitigation actions, especially in emerging countries where large portions
of energy capital is being installed for the first time, can be very costly. Extra cost
associated with the delayed actions increases non-linearly with the stringency of the
target, and some more stringent targets become infeasible if action is postponed.
• To reduce the cost while achieving an equitable sharing of them, decisions about where
emissions reductions are taken and how they are paid for should be separated. Emission
mitigation should take place where it is most efficient. Equity considerations can be
addressed through agreed upon mechanisms that result in transfers from those better able
to pay to those with less ability to bear these costs. Negotiating such a transfer scheme is
likely one of the most difficult aspects of reaching agreement.
• A global carbon tax starting at 20 USD in 2020 and rising at 3-5 % per year would be in
line with more lenient targets. Even these less severe targets can still substantially reduce
the risk of reaching high temperature increases.
• Innovation, both on energy efficiency and alternative energy sources, is needed. Carbon
pricing (e.g., carbon taxes or a price established through a cap and trade system) would

16
provide a signal to trigger both innovation and adoption of technologies needed for a low
carbon economy.

17
6. References and Suggestions for Further Reading
Babiker, M., Reilly, J., Viguier, L., (2004). Is international emissions trading always beneficial? Energy Journal, 25(2), 33-56.
Bosetti, V., Lubowski R., Golub A., Markandya A., (2011). Linking reduced deforestation and a global carbon market: implications for clean energy technology and policy flexibility, Environment and Development Economics, 16(4), 479-505.
Bosetti, V., Frankel, J. (2009). “Global Climate Policy Architecture and Political Feasibility: Specific Formulas and Emission Targets to Attain 460 ppm CO2 Concentrations“ NBER Working Paper No. 15516, Issued in November 2009
Clarke, L., Edmonds, J., Jacoby, H., Pitcher, H., Reilly, J., Richels, R. (2007). Scenarios of the Greenhouse Gas Emission and Atmospheric Concentrations. Sub-report 2.1A of Synthesis and Assessment Product 2.1 by the U.S. Climate Change Science Program and the Subcommittee on Global Change Research. Washington, USA: Department of Energy, Office of Biological & Environmental Research.
Clarke, L., Edmonds, J., Krey, V., Richels, R., Rose, S. and Tavoni, M. (2009). International climate policy architectures: Overview of the EMF 22 International Scenarios, Energy Economics 31(Supplement 2): S64-S81.
den Elzen, M. et al., (2010). The Emissions Gap Report: Are the Copenhagen Accord pledges sufficient to limit global warming to 2 deg. C or 1.5 deg. C? A preliminary assessment, United Nations Environment Programme.
Edenhofer, O., Carraro, C., Hourcade, J-C., Neuhoff, K., Luderer, G., Flachsland, C., Jakob, M., Popp, A., Steckel, J., Strohschein, J., Bauer, N., Brunner, S., Leimbach, M., Lotze-Campen, H., Bossetti, V., de Cian, E., Tavoni, M., Sassi, O., Waisman, H., Crassous-Doerfler, R., Monjon, S., Dröge, S., van Essen, H., del Río, P. and Türk, A. (2009). RECIPE - The Economics of Decarbonization. Synthesis Report.
IPCC [Intergovernmental Panel on Climate Change] (2007). Fourth Assessment Report, Geneva, Switzerland.
Jacoby, H., Babiker, M., Paltsev, S., Reilly, J. (2009). Sharing the Burden of GHG Reductions, in Post-Kyoto International Climate Policy, J. Aldy and R. Stavins (Eds), Cambridge University Press, p. 753-785.
Jacoby, H., O'Sullivan, F., Paltsev, S. (2012). “The Influence of Shale Gas on U.S. Energy and Environmental Policy”, Economics of Energy and Environmental Policy, 1(1), (in press).
Morris, J., Reilly, J., Paltsev, S. (2010). Combining a Renewable Portfolio Standard with a Cap-and-Trade Policy: a General Equilibrium Analysis, The MIT Joint Program on the Science and Policy of Global Change, Report 187, Cambridge, MA. Available at: http://globalchange.mit.edu/pubs/abstract.php?publication_id=2069
Paltsev, S., Reilly, J., Jacoby, H., Tay, K. (2007). How (and why) do climate policy costs differ among countries? in Human-Induced Climate Change: An Interdisciplinary Assessment, M. Schlesinger et al. (Eds.), Cambridge University Press, p. 282-293.
Paltsev, S., Reilly, J., Jacoby, H., Morris J. (2009). The Cost of Climate Policy in the United States, The MIT Joint Program on the Science and Policy of Global Change, Report 173, Cambridge, MA. Available at: http://globalchange.mit.edu/pubs/abstract.php?publication_id=1965
18
Prinn R., Paltsev, S., Sokolov, A., Sarofim, M., Reilly, J., Jacoby, H. (2011). Scenarios with MIT Integrated Global System Model: Significant Global Warming Regardless of Different Approaches, Climatic Change, 104 (3-4), 515-537.
Ranjan, M. (2010). Feasibility of Air Capture, Master Thesis, Engineering Systems Division, Massachusetts Institute of Technology, Cambridge, MA. Available at: http://sequestration.mit.edu/pdf/ManyaRanjan_Thesis_June2010.pdf
Sokolov, A., Stone, P., Forest, C., Prinn, R., Sarofim, M., Webster, M., Paltsev, S., Schlosser, A., Kicklighter, D., Dutkiewicz, S., Reilly, J., Wang, C., Felzer, B., Melillo, J., Jacoby, H. (2009). Probabilistic Forecast for 21st Century Climate Based on Uncertainties in Emissions (without Policy) and Climate Parameters, Journal of Climate, 22(19), 5175-5204.
Tavoni, M., Tol, R.S.J. (2010). Counting only the hits? The risk of underestimating the costs of stringent climate policy, Climatic Change, 100, 769-778.
Webster, M., Sokolov, A., Reilly, J., Forest, C., Paltsev, S., Schlosser, A., Wang, C., Kicklighter, D., Sarofim, M., Melillo, J., Prinn, R., Jacoby, H. (2009). Analysis of Climate Policy Targets Under Uncertainty, The MIT Joint Program on the Science and Policy of Global Change, Report 180, Cambridge, MA. Forthcoming in Climatic Change (doi: 10.1007/s10584-011-0260-0), Available at: http://globalchange.mit.edu/pubs/abstract.php?publication_id=1989
NOTE DI LAVORO DELLA FONDAZIONE ENI ENRICO MATTEI
Fondazione Eni Enrico Mattei Working Paper Series
Our Note di Lavoro are available on the Internet at the following addresses: http://www.feem.it/getpage.aspx?id=73&sez=Publications&padre=20&tab=1
http://papers.ssrn.com/sol3/JELJOUR_Results.cfm?form_name=journalbrowse&journal_id=266659 http://ideas.repec.org/s/fem/femwpa.html
http://www.econis.eu/LNG=EN/FAM?PPN=505954494 http://ageconsearch.umn.edu/handle/35978
http://www.bepress.com/feem/
NOTE DI LAVORO PUBLISHED IN 2011 SD 1.2011 Anna Alberini, Will Gans and Daniel Velez-Lopez: Residential Consumption of Gas and Electricity in the U.S.:
The Role of Prices and Income SD 2.2011 Alexander Golub, Daiju Narita and Matthias G.W. Schmidt: Uncertainty in Integrated Assessment Models of
Climate Change: Alternative Analytical Approaches SD 3.2010 Reyer Gerlagh and Nicole A. Mathys: Energy Abundance, Trade and Industry Location SD 4.2010 Melania Michetti and Renato Nunes Rosa: Afforestation and Timber Management Compliance Strategies in
Climate Policy. A Computable General Equilibrium Analysis SD 5.2011 Hassan Benchekroun and Amrita Ray Chaudhuri: “The Voracity Effect” and Climate Change: The Impact of
Clean Technologies IM 6.2011 Sergio Mariotti, Marco Mutinelli, Marcella Nicolini and Lucia Piscitello: Productivity Spillovers from Foreign
MNEs on Domestic Manufacturing Firms: Is Co-location Always a Plus? GC 7.2011 Marco Percoco: The Fight Against Geography: Malaria and Economic Development in Italian Regions GC 8.2011 Bin Dong and Benno Torgler: Democracy, Property Rights, Income Equality, and Corruption GC 9.2011 Bin Dong and Benno Torgler: Corruption and Social Interaction: Evidence from China SD 10.2011 Elisa Lanzi, Elena Verdolini and Ivan Haščič: Efficiency Improving Fossil Fuel Technologies for Electricity
Generation: Data Selection and Trends SD 11.2011 Stergios Athanassoglou: Efficiency under a Combination of Ordinal and Cardinal Information on PreferencesSD 12.2011 Robin Cross, Andrew J. Plantinga and Robert N. Stavins: The Value of Terroir: Hedonic Estimation of
Vineyard Sale Prices SD 13.2011 Charles F. Mason and Andrew J. Plantinga: Contracting for Impure Public Goods: Carbon Offsets and
Additionality SD 14.2011 Alain Ayong Le Kama, Aude Pommeret and Fabien Prieur: Optimal Emission Policy under the Risk of
Irreversible Pollution SD 15.2011 Philippe Quirion, Julie Rozenberg, Olivier Sassi and Adrien Vogt-Schilb: How CO2 Capture and Storage Can
Mitigate Carbon Leakage SD 16.2011 Carlo Carraro and Emanuele Massetti: Energy and Climate Change in China SD 17.2011 ZhongXiang Zhang: Effective Environmental Protection in the Context of Government Decentralization SD 18.2011 Stergios Athanassoglou and Anastasios Xepapadeas: Pollution Control with Uncertain Stock Dynamics:
When, and How, to be Precautious SD 19.2011 Jūratė Jaraitė and Corrado Di Maria: Efficiency, Productivity and Environmental Policy: A Case Study of
Power Generation in the EU SD 20.2011 Giulio Cainelli, Massimiliano Mozzanti and Sandro Montresor: Environmental Innovations, Local Networks
and Internationalization SD 21.2011 Gérard Mondello: Hazardous Activities and Civil Strict Liability: The Regulator’s Dilemma SD 22.2011 Haiyan Xu and ZhongXiang Zhang: A Trend Deduction Model of Fluctuating Oil Prices SD 23.2011 Athanasios Lapatinas, Anastasia Litina and Eftichios S. Sartzetakis: Corruption and Environmental Policy:
An Alternative Perspective SD 24.2011 Emanuele Massetti: A Tale of Two Countries:Emissions Scenarios for China and India SD 25.2011 Xavier Pautrel: Abatement Technology and the Environment-Growth Nexus with Education SD 26.2011 Dionysis Latinopoulos and Eftichios Sartzetakis: Optimal Exploitation of Groundwater and the Potential for
a Tradable Permit System in Irrigated Agriculture SD 27.2011 Benno Torgler and Marco Piatti. A Century of American Economic Review SD 28.2011 Stergios Athanassoglou, Glenn Sheriff, Tobias Siegfried and Woonghee Tim Huh: Optimal Mechanisms for
Heterogeneous Multi-cell Aquifers SD 29.2011 Libo Wu, Jing Li and ZhongXiang Zhang: Inflationary Effect of Oil-Price Shocks in an Imperfect Market: A
Partial Transmission Input-output Analysis SD 30.2011 Junko Mochizuki and ZhongXiang Zhang: Environmental Security and its Implications for China’s Foreign
Relations SD 31.2011 Teng Fei, He Jiankun, Pan Xunzhang and Zhang Chi: How to Measure Carbon Equity: Carbon Gini Index
Based on Historical Cumulative Emission Per Capita SD 32.2011 Dirk Rübbelke and Pia Weiss: Environmental Regulations, Market Structure and Technological Progress in
Renewable Energy Technology — A Panel Data Study on Wind Turbines SD 33.2011 Nicola Doni and Giorgio Ricchiuti: Market Equilibrium in the Presence of Green Consumers and Responsible
Firms: a Comparative Statics Analysis
SD 34.2011 Gérard Mondello: Civil Liability, Safety and Nuclear Parks: Is Concentrated Management Better? SD 35.2011 Walid Marrouch and Amrita Ray Chaudhuri: International Environmental Agreements in the Presence of
Adaptation ERM 36.2011 Will Gans, Anna Alberini and Alberto Longo: Smart Meter Devices and The Effect of Feedback on Residential
Electricity Consumption: Evidence from a Natural Experiment in Northern Ireland ERM 37.2011 William K. Jaeger and Thorsten M. Egelkraut: Biofuel Economics in a Setting of Multiple Objectives &
Unintended Consequences CCSD 38.2011 Kyriaki Remoundou, Fikret Adaman, Phoebe Koundouri and Paulo A.L.D. Nunes: Are Preferences for
Environmental Quality Sensitive to Financial Funding Schemes? Evidence from a Marine Restoration Programme in the Black Sea
CCSD 39.2011 Andrea Ghermanti and Paulo A.L.D. Nunes: A Global Map of Costal Recreation Values: Results From a Spatially Explicit Based Meta-Analysis
CCSD 40.2011 Andries Richter, Anne Maria Eikeset, Daan van Soest, and Nils Chr. Stenseth: Towards the Optimal Management of the Northeast Arctic Cod Fishery
CCSD 41.2011 Florian M. Biermann: A Measure to Compare Matchings in Marriage Markets CCSD 42.2011 Timo Hiller: Alliance Formation and Coercion in Networks CCSD 43.2011 Sunghoon Hong: Strategic Network Interdiction CCSD 44.2011 Arnold Polanski and Emiliya A. Lazarova: Dynamic Multilateral Markets CCSD 45.2011 Marco Mantovani, Georg Kirchsteiger, Ana Mauleon and Vincent Vannetelbosch: Myopic or Farsighted? An
Experiment on Network Formation CCSD 46.2011 Rémy Oddou: The Effect of Spillovers and Congestion on the Segregative Properties of Endogenous
Jurisdiction Structure Formation CCSD 47.2011 Emanuele Massetti and Elena Claire Ricci: Super-Grids and Concentrated Solar Power: A Scenario Analysis
with the WITCH Model ERM 48.2011 Matthias Kalkuhl, Ottmar Edenhofer and Kai Lessmann: Renewable Energy Subsidies: Second-Best Policy or
Fatal Aberration for Mitigation? CCSD 49.2011 ZhongXiang Zhang: Breaking the Impasse in International Climate Negotiations: A New Direction for
Currently Flawed Negotiations and a Roadmap for China to 2050 CCSD 50.2011 Emanuele Massetti and Robert Mendelsohn: Estimating Ricardian Models With Panel Data CCSD 51.2011 Y. Hossein Farzin and Kelly A. Grogan: Socioeconomic Factors and Water Quality in California CCSD 52.2011 Dinko Dimitrov and Shao Chin Sung: Size Monotonicity and Stability of the Core in Hedonic Games ES 53.2011 Giovanni Mastrobuoni and Paolo Pinotti: Migration Restrictions and Criminal Behavior: Evidence from a
Natural Experiment ERM 54.2011 Alessandro Cologni and Matteo Manera: On the Economic Determinants of Oil Production. Theoretical
Analysis and Empirical Evidence for Small Exporting Countries ERM 55.2011 Alessandro Cologni and Matteo Manera: Exogenous Oil Shocks, Fiscal Policy and Sector Reallocations in Oil
Producing Countries ERM 56.2011 Morgan Bazilian, Patrick Nussbaumer, Giorgio Gualberti, Erik Haites, Michael Levi, Judy Siegel, Daniel M.
Kammen and Joergen Fenhann: Informing the Financing of Universal Energy Access: An Assessment of Current Flows
CCSD 57.2011 Carlo Orecchia and Maria Elisabetta Tessitore: Economic Growth and the Environment with Clean and Dirty Consumption
ERM 58.2011 Wan-Jung Chou, Andrea Bigano, Alistair Hunt, Stephane La Branche, Anil Markandya and Roberta Pierfederici: Households’ WTP for the Reliability of Gas Supply
ES 59.2011 Maria Comune, Alireza Naghavi and Giovanni Prarolo: Intellectual Property Rights and South-North Formation of Global Innovation Networks
ES 60.2011 Alireza Naghavi and Chiara Strozzi: Intellectual Property Rights, Migration, and Diaspora CCSD 61.2011 Massimo Tavoni, Shoibal Chakravarty and Robert Socolow: Safe vs. Fair: A Formidable Trade-off in Tackling
Climate Change CCSD 62.2011 Donatella Baiardi, Matteo Manera and Mario Menegatti: Consumption and Precautionary Saving: An
Empirical Analysis under Both Financial and Environmental Risks ERM 63.2011 Caterina Gennaioli and Massimo Tavoni: Clean or “Dirty” Energy: Evidence on a Renewable Energy Resource
Curse ES 64.2011 Angelo Antoci and Luca Zarri: Punish and Perish? ES 65.2011 Anders Akerman, Anna Larsson and Alireza Naghavi: Autocracies and Development in a Global Economy: A
Tale of Two Elites CCSD 66.2011 Valentina Bosetti and Jeffrey Frankel: Sustainable Cooperation in Global Climate Policy: Specific Formulas
and Emission Targets to Build on Copenhagen and Cancun CCSD 67.2011 Mattia Cai, Roberto Ferrise, Marco Moriondo, Paulo A.L.D. Nunes and Marco Bindi: Climate Change and
Tourism in Tuscany, Italy. What if heat becomes unbearable? ERM 68.2011 Morgan Bazilian, Patrick Nussbaumer, Hans-Holger Rogner, Abeeku Brew-Hammond, Vivien Foster, Shonali
Pachauri, Eric Williams, Mark Howells, Philippe Niyongabo, Lawrence Musaba, Brian Ó Gallachóir, Mark Radka and Daniel M. Kammen: Energy Access Scenarios to 2030 for the Power Sector in Sub-Saharan Africa
CCSD 69.2011 Francesco Bosello, Carlo Carraro and Enrica De Cian: Adaptation Can Help Mitigation: An Integrated Approach to Post-2012 Climate Policy
ES 70.2011 Etienne Farvaque, Alexander Mihailov and Alireza Naghavi: The Grand Experiment of Communism: Discovering the Trade-off between Equality and Efficiency
CCSD 71.2011 ZhongXiang Zhang: Who Should Bear the Cost of China’s Carbon Emissions Embodied in Goods for Exports?

CCSD 72.2011 Francesca Pongiglione: Climate Change and Individual Decision Making: An Examination of Knowledge, Risk Perception, Self-interest and Their Interplay
CCSD 73.2011 Joseph E. Aldy and Robert N. Stavins: Using the Market to Address Climate Change: Insights from Theory and Experience
CCSD 74.2011 Alexander Brauneis and Michael Loretz: Inducing Low-Carbon Investment in the Electric Power Industry through a Price Floor for Emissions Trading
CCSD 75.2011 Jean-Marie Grether, Nicole A. Mathys and Jaime de Melo: Unravelling the Worldwide Pollution Haven Effect ES 76.2011 Benjamin Elsner: Emigration and Wages: The EU Enlargement Experiment CCSD 77.2011 ZhongXiang Zhang: Trade in Environmental Goods, with Focus on Climate-Friendly Goods and TechnologiesES 78.2011 Alireza Naghavi, Julia Spies and Farid Toubal: International Sourcing, Product Complexity and Intellectual
Property Rights CCSD 79.2011 Mare Sarr and Tim Swanson: Intellectual Property and Biodiversity: When and Where are Property Rights
Important? CCSD 80.2011 Valentina Bosetti, Sergey Paltsev, John Reilly and Carlo Carraro: Emissions Pricing to Stabilize Global
Climate