Electrophoretic methods for process monitoring and the quality assessment of recombinant...
23
2572 M. Tavema et al. Electrophoresis 1998, 19, 2572-2594 Review Myriam Taverna' Nguyet Thuy Tran' Tony Merry2 Eszter Horvath' Danielle Ferrier' 'Laboratoire de Chimie Analytique, Facult6 de Pharmacie, Chitenay-Mdabry, France 2Biomed Labs, Newcastle upon Tyne, UK Contents 1 2 2.1 2.1.1 2.1.1.1 2.1.1.2 2.1.2 2.1.3 2.2 2.2.1 2.2.1.1 2.2.1.2 2.2.1.3 2.2.1.4 Electrophoretic methods for process monitoring and the quality assessment of recombinant glycoproteins In many ways electrophoretic techniques appear ideal for quality monitoring of proteins and are thus well suited for the analysis of recombinant glycoproteins. The requirements of high throughput, comparative analysis and resolution of many variants are met by several electrophoretic techniques. A wide variety of such techniques are available to biotechnologists in the rapidly developing area of recombinant glycoproteins. It is the aim of this review to specifically cover recent work which has been applied to the analysis of DNA-derived glycoproteins, both from a process control standpoint and final product validation. All major areas of electrophoresis including sodium dodecyl sulfate-polyacrylamidegel electrophore- sis (SDS-PAGE), isoelectric focusing and techniques utilizing capillary electro- phoresis are covered, with emphasis on analysis of glycoforms and oligosaccharide profiles of recombinant glycoproteins. As illustration, actual examples rather than standard glycoproteins are given to indicate the potential and limitations which may be encountered. It is anticipated that this review will prove a useful and Dractical guide to the latest developments by indicating the relevant merits of hifferent kethods. .......... 2572 Introduction ........... .. Glycoform analysis .................. 2573 Conventional electrophoresis ........... 2573 Focusing techniques ................. 2573 IEF ............................. 2573 IPG ............................. 2575 2-D electrophoresis .................. 2576 CE ............................. 2577 CZE and MEKC ................... 2577 Process monitoring .................. 2578 Purity assessment ................... 2578 Lot-to-lot consistency ................ 2579 Stability and quantification of the final product .......................... 2579 SDS-PAGE ....................... 2575 Correspondence: Dr. M. Tavema, Laboratoire de Chimie Analytique, Facult6 de Pharmacie, Rue J.B. Cltment, F-92290 Chitenay-Malabry, France (Tel: +33-1-4683-5462; Fax: +33-1-4683-5458; E-mail: myriam. taverna @ cep.u-psud. fr) Abbreviations: a-AGP, a-acid glycoprotein; 2-AA, 2-aminoanthranilic acid; AMAC, 2-aminoacridone; ANTS, 8-aminonaphthalene-1,3,6-trisul- fonic acid; 2-AP, 2-aminopyridine; AT III, antithrombin 111; BHK, baby hamster kidney; CGE, capillary gel electrophoresis; CHO, Chinese hamster ovary; CIEF, capillary isoelectric focusing; CZE, Capillary zone electrophoresis; DSPAal, Desmodus salivary plasminogen activator; FACE, fluorophore-assisted carbohydrate electrophoresis; FIX, clotting factor IX, GM-CSF, granulocyte-macrophagecolony stimulating factor; HPMC, hydroxypropylmethylcellulose; IGF-I, insulin-like growth factor I; IgG, immunoglobulin G; mAb, monoclonal antibody; MALDI-TOF- MS, matrix-assisted laser desorption ionization - time-of-flight - mass spectrometry; PED, pulsed electrochemical detection; PEG, polyethylene glycol; PNGase F, peptide N-glycopeptidase F; PVA, polyvinyl alcohol; rDNA, recombinant DNA; rhEPO, recombinant human erythropoietin; rhGH, recombinant human growth hormone; rhuMAbHER2, recombi- nant humanized monoclonal antibody HER2; rtPA, recombinant tissue plasminogen activator; SEC, size exclusion chromatography Keywords: Electrophoresis / Capillary electrophoresis / Proteins / Glycoproteins / Recombinant / Quality control / Process monitoring / Glycosylation I Oligosaccharides / Glycoforms I Review 0 WILEY-VCH Verlag GmbH, 69451 Weinheim, 1998 2.2.1.5 Natural versus recombinant glycoprotein comparisons ....................... 2580 2.2.1.6 CZE and MS coupling ............... 2580 2.2.2 CIEF ............................ 2580 2.2.2.1 General considerations ............... 2580 2.2.2.2 Applications of CIEF to recombinant glycoproteins ...................... 2582 2.2.2.3 CIEF-MS coupling .................. 2584 2.2.2.4 Quantitative analysis by CIEF .......... 2584 2.2.3 CGE ............................ 2584 3 Oligosaccharide profiling ............. 2587 3.1 CE ............................. 2587 3.2 PAGE of carbohydrates .............. 2587 4 Peptide and glycopeptide mapping ....... 2589 5 Conclusion. ....................... 2591 6 References ........................ 2592 1 Introduction A large number of proteins of therapeutic value are now obtained from recombinant DNA (rDNA) technology. In general, these biotechnology-derivedproducts are produced using living cells which have been modified in such a way that they express the protein of interest. Typical host cells are Escherichia coli (E. coli), Saccharomycescerevisiae and cell lines like Chinese hamster ovary cells (CHO), C127 or baby hamster kidney cells (BHK). The eucaryotic proteins often show posttranslational modifications, one of the most important being glycosylation. For this reason, animal cells are preferred as they have the correct machinery and glycosyl transferasesto perform this modification. However, the glycosylation profile of proteins produced in this way needs to be monitored to check for consistency. In glycoproteins, glycans are conjugated to peptide chains by two types of linkages: N-glycosyl or 0-glycosyl. The N- linked oligosaccharides are covalently attached through an asparagine residue while the 0-linked ones are attached to a serine or a threonine side chain. Generally a single 0173-0835/98/1515-2572 $17.50+.50/0
-
Upload
independent -
Category
Documents
-
view
2 -
download
0
Transcript of Electrophoretic methods for process monitoring and the quality assessment of recombinant...

2572 M. Tavema et al. Electrophoresis 1998, 19, 2572-2594
Review
Myriam Taverna' Nguyet Thuy Tran' Tony Merry2 Eszter Horvath' Danielle Ferrier'
'Laboratoire de Chimie Analytique, Facult6 de Pharmacie, Chitenay-Mdabry, France 2Biomed Labs, Newcastle upon Tyne, UK
Contents 1 2 2.1 2.1.1 2.1.1.1 2.1.1.2 2.1.2 2.1.3 2.2 2.2.1 2.2.1.1 2.2.1.2 2.2.1.3 2.2.1.4
Electrophoretic methods for process monitoring and the quality assessment of recombinant glycoproteins
In many ways electrophoretic techniques appear ideal for quality monitoring of proteins and are thus well suited for the analysis of recombinant glycoproteins. The requirements of high throughput, comparative analysis and resolution of many variants are met by several electrophoretic techniques. A wide variety of such techniques are available to biotechnologists in the rapidly developing area of recombinant glycoproteins. It is the aim of this review to specifically cover recent work which has been applied to the analysis of DNA-derived glycoproteins, both from a process control standpoint and final product validation. All major areas of electrophoresis including sodium dodecyl sulfate-polyacrylamide gel electrophore- sis (SDS-PAGE), isoelectric focusing and techniques utilizing capillary electro- phoresis are covered, with emphasis on analysis of glycoforms and oligosaccharide profiles of recombinant glycoproteins. As illustration, actual examples rather than standard glycoproteins are given to indicate the potential and limitations which may be encountered. It is anticipated that this review will prove a useful and Dractical guide to the latest developments by indicating the relevant merits of hifferent kethods.
. . . . . . . . . . 2572 Introduction . . . . . . . . . . . . . Glycoform analysis . . . . . . . . . . . . . . . . . . 2573 Conventional electrophoresis . . . . . . . . . . . 2573 Focusing techniques . . . . . . . . . . . . . . . . . 2573 IEF . . . . . . . . . . . . . . . . . . . . . . . . . . . . . 2573 IPG . . . . . . . . . . . . . . . . . . . . . . . . . . . . . 2575
2-D electrophoresis . . . . . . . . . . . . . . . . . . 2576 CE . . . . . . . . . . . . . . . . . . . . . . . . . . . . . 2577 CZE and MEKC . . . . . . . . . . . . . . . . . . . 2577 Process monitoring . . . . . . . . . . . . . . . . . . 2578 Purity assessment . . . . . . . . . . . . . . . . . . . 2578 Lot-to-lot consistency . . . . . . . . . . . . . . . . 2579 Stability and quantification of the final product . . . . . . . . . . . . . . . . . . . . . . . . . . 2579
SDS-PAGE . . . . . . . . . . . . . . . . . . . . . . . 2575
Correspondence: Dr. M. Tavema, Laboratoire de Chimie Analytique, Facult6 de Pharmacie, Rue J.B. Cltment, F-92290 Chitenay-Malabry, France (Tel: +33-1-4683-5462; Fax: +33-1-4683-5458; E-mail: myriam. taverna @ cep.u-psud. fr)
Abbreviations: a-AGP, a-acid glycoprotein; 2-AA, 2-aminoanthranilic acid; AMAC, 2-aminoacridone; ANTS, 8-aminonaphthalene-1,3,6-trisul- fonic acid; 2-AP, 2-aminopyridine; AT III, antithrombin 111; BHK, baby hamster kidney; CGE, capillary gel electrophoresis; CHO, Chinese hamster ovary; CIEF, capillary isoelectric focusing; CZE, Capillary zone electrophoresis; DSPAal, Desmodus salivary plasminogen activator; FACE, fluorophore-assisted carbohydrate electrophoresis; FIX, clotting factor IX, GM-CSF, granulocyte-macrophage colony stimulating factor; HPMC, hydroxypropylmethylcellulose; IGF-I, insulin-like growth factor I; IgG, immunoglobulin G; mAb, monoclonal antibody; MALDI-TOF- MS, matrix-assisted laser desorption ionization - time-of-flight - mass spectrometry; PED, pulsed electrochemical detection; PEG, polyethylene glycol; PNGase F, peptide N-glycopeptidase F; PVA, polyvinyl alcohol; rDNA, recombinant DNA; rhEPO, recombinant human erythropoietin; rhGH, recombinant human growth hormone; rhuMAbHER2, recombi- nant humanized monoclonal antibody HER2; rtPA, recombinant tissue plasminogen activator; SEC, size exclusion chromatography
Keywords: Electrophoresis / Capillary electrophoresis / Proteins / Glycoproteins / Recombinant / Quality control / Process monitoring / Glycosylation I Oligosaccharides / Glycoforms I Review
0 WILEY-VCH Verlag GmbH, 69451 Weinheim, 1998
2.2.1.5 Natural versus recombinant glycoprotein comparisons . . . . . . . . . . . . . . . . . . . . . . . 2580
2.2.1.6 CZE and MS coupling . . . . . . . . . . . . . . . 2580 2.2.2 CIEF . . . . . . . . . . . . . . . . . . . . . . . . . . . . 2580 2.2.2.1 General considerations . . . . . . . . . . . . . . . 2580 2.2.2.2 Applications of CIEF to recombinant
glycoproteins . . . . . . . . . . . . . . . . . . . . . . 2582 2.2.2.3 CIEF-MS coupling . . . . . . . . . . . . . . . . . . 2584 2.2.2.4 Quantitative analysis by CIEF . . . . . . . . . . 2584 2.2.3 CGE . . . . . . . . . . . . . . . . . . . . . . . . . . . . 2584 3 Oligosaccharide profiling . . . . . . . . . . . . . 2587 3.1 CE . . . . . . . . . . . . . . . . . . . . . . . . . . . . . 2587 3.2 PAGE of carbohydrates . . . . . . . . . . . . . . 2587 4 Peptide and glycopeptide mapping . . . . . . . 2589 5 Conclusion. . . . . . . . . . . . . . . . . . . . . . . . 2591 6 References . . . . . . . . . . . . . . . . . . . . . . . . 2592
1 Introduction A large number of proteins of therapeutic value are now obtained from recombinant DNA (rDNA) technology. In general, these biotechnology-derived products are produced using living cells which have been modified in such a way that they express the protein of interest. Typical host cells are Escherichia coli (E. coli), Saccharomyces cerevisiae and cell lines like Chinese hamster ovary cells (CHO), C127 or baby hamster kidney cells (BHK). The eucaryotic proteins often show posttranslational modifications, one of the most important being glycosylation. For this reason, animal cells are preferred as they have the correct machinery and glycosyl transferases to perform this modification. However, the glycosylation profile of proteins produced in this way needs to be monitored to check for consistency. In glycoproteins, glycans are conjugated to peptide chains by two types of linkages: N-glycosyl or 0-glycosyl. The N- linked oligosaccharides are covalently attached through an asparagine residue while the 0-linked ones are attached to a serine or a threonine side chain. Generally a single
0173-0835/98/1515-2572 $17.50+.50/0

Electrophoresis 1998, 19, 2572-2594 Electrophoresis of recombinant glycoproteins 2573
glycoprotein is composed of an heterogenous population of differently glycosylated variants of a common polypeptide, referred to as the glycoforms. Glycosylation is often a critical determinant in many properties of therapeutic proteins including biological activity, immunogenicity, clearance rate, solubility, stability, and protease resistance [I , 21.
Glycosylation of recombinant proteins has been shown to depend greatly on the cell culture conditions, on the nature and the age of the host cells, and on the recovery processes [1, 31. In addition, transformed cells tend to show a certain degree of genetic instability that may result in a low consistency of the recombinant product active substance. During processing, proteolysis and aggregation can cause significant product modifications, (especially aggregation) which are frequently immunogenic and may present a risk to the patient. Moreover, products from recombinant technol- ogy can contain contaminants such as host cell proteins, and/ or DNA from host cells and vectors. Additionally, some cells in culture can release glycosidase enzymes which may degrade the product [4]. Due to special production procedures and the complexity of the active substance, biotech products are subject to specific regulatory require- ments [5 ] .
Liquid chromatography is in widespread use for this purpose and has been shown to provide a validated method for the quality control of recombinant protein. The complexity of the biotechnologically-derived product and the polymor- phism associated with the glycan moiety (termed micro- heterogeneity) of glycoproteins, require a set of complementary techniques to fully assess the quality and the safety of the product, to ensure its batch-to-batch consistency or to monitor its production and its purification [6]. Conventional electrophoresis such as isoelectric focus- ing (IEF), sodium dodecyl sulfate - polyacrylamide gel electrophoresis (SDS-PAGE) or two-dimensional PAGE (2-D PAGE) are already established techniques which have proven their usefulness in the purity control and the routine analysis of recombinant glycoproteins. More recently, it has been recognized that the high resolution efficiency combin- ed with the versatility of capillary electrophoresis (CE), due to the various modes in which separation can be performed, permits the development of CE methods for process monitoring, purity assessment and product quality evalua- tion. Several recent reviews examined the potential of CE to achieve separations of isoforms and glycoforms of (g1yco)- proteins or to compare the natural and the recombinant protein [7-91. In particular, Schwer [lo] evaluated in a recent review, the potential of CIEF as a routine analysis method for protein analysis in quality and routine control as well as for the detection of degradation products. Addition- ally, a book on CE in analytical biotechnology appeared in 1996 reporting all the work published on the CE analysis of rDNA derived proteins [ 111.
In the present review we would like to focus on the glycosylation of recombinant proteins with the additional complexity arising from the presence of the carbohydrate heterogeneity. Glycoprotein analysis can be performed from the intact molecule with the aim to either quantify the set of glycoforms or to test for the presence of contaminants. One
advantage of this straightforward method is that it does not require extensive sample preparation and information concerning the identity or the purity of the product can be readily obtained. The high purity requirement for rDNA- based therapeutic proteins has stimulated developments in advanced electrophoretic techniques. While SDS-PAGE or IEF have become indispensable tools for identifying proteins, recent developments in 2-D gel electrophoresis [ 121, immobilized pH gradients for isoelectric focusing [ 13, 141, and capillary electrophoresis have brought new possibilities for detection and purity evaluation of recombi- nant proteins during the purification processes.
Often, the mapping of the isolated oligosaccharides, released either chemically or enzymatically from the glycoprotein, adds further information on the glycosylation consistency. Oligosaccharide mapping based on electrophoretic methods is possible with the use of fluorophore-assisted carbohydrate electrophoresis (FACE) [15, 161 and CE. A detailed review by El Rassi [ 171 summarizes the recent development of CE for the analysis of oligosaccharides. Finally, (g1yco)peptide mapping where the protein is cleaved to peptide and glycopeptide fragments can be employed not only to detect subtle changes in the primary structure of the protein but also to monitor the glycosylation of the protein at individual sites and to provide evidence of the protein identity. Glycopeptide mapping is commonly used to analyze recombinant-derived glycoproteins.
Due to the numerous reviews which have appeared in the field of CE and proteins, emphasis will be placed on the last three years' literature reporting electrophoretic methods (including conventional techniques and capillary electro- phoresis) that were applied to validate DNA-derived glycoproteins, to ensure their batch-to-batch consistency, their purity, as well as to monitor production and purification processes.
2 Glycoform analysis
2.1 Conventional electrophoresis
2.1.1 Focusing techniques 2.1.1.1 IEF IEF is a special form of PAGE. Performed on a slab gel under denaturing or nondenaturing conditions, this method separates protein samples in a pH gradient created by carrier ampholyte molecules. The charged molecules migrate in the applied electric field until they reach the region of pH corresponding to their isoelectric point (pZ value), where they lose their net charge and therefore become immobile. Diffusion of the molecules in this region endows them with a charge. They are moved back to their equilibrium zone and thus focus in narrow zones. The bands are then usually visualized by staining and evaluated by densitometry. The method gives, at best, semiquantitative results due to limitations in the staining step. Other inherent disadvantages of the technique are long analysis times, time-consuming preparation and developing steps, the large volumes of reagents necessary, and the generation of hazardous waste. It is however possible to analyze several samples at the same time, a factor not to be overlooked in routine control

2574 M. Taverna et al. Electrophoresis 1998, 19, 2572-2594
laboratories where analysis time has to be reduced as much as possible to meet the rhythm of production.
A further major advantage is its capability to separate molecules with pl values differing by as little as 0.01 pH units. Due to this advantage, IEF is widely used in the quality control of recombinant glycoproteins, since varying sialylation due to posttranslational processing gives rise to a series of glycoforms with different pl: information on the p l obtained by IEF is suitable for identity confirmation, and by evaluating microheterogeneity, the presence or absence of variants containing a variable number of sialic acid residues depicting lot-to-lot consistency. Since different degrees of glycosylation affect therapeutic parameters such as distri- bution or half-life, interest in IEF by biotechnological quality control units and authorities is understandable. A comprehensive review by Gianazza [ 181 deals with the role of IEF and IPG for the investigation of posttranslational processing (including glycosylation) and chemical modifi- cation of proteins.
Traditionally, protein mixtures of known, well-defined pl values were and are still used for calibration. Most commercially available markers are either single proteins or mixtures, covering narrow or broad pH-ranges. The conventional protein mixtures of known, well-defined pZ values are, however, not suitable as marker molecules under denaturing conditions, since their p l value changes due to the modification of their accessible charge. Watts and Singh [19] reported the choice of peptides as standards for IEF performed under denaturing conditions using urea. The authors draw attention to a number of precautions to be taken, e.g. peptides focus more rapidly than proteins (care must therefore be taken to focus proteins to completion) and a major drawback, the amount of peptide required to give a well-stained band at the pH extremes. However, they concluded that under denaturing conditions, peptides provide an accurate means of calibration in IEF gels.
Since IEF separations are based on a pH gradient formed by camer ampholyte molecules, their quality is of utmost
importance. Chen et al. [20] compared four commercially available products for the IEF separation of rtPA glycoforms (Fig. 1). Each product focused rtPA into 3 4 major and 5-6 minor bands. The focused bands appeared to be similarly resolved by all carrier ampholytes except Ampholines, where the bands were closely grouped and intensely stained. Servalyts did not produce the larger number of bands observed with Pharmalytes and Bio-Lytes. The pattern variations are probably due to the complex composition of carrier ampholytes. IEF is often employed as a first (or second) dimension in combination with other methods such as SDS-PAGE in order to complete the characterization of the analyte molecules. Examples of this application are given in Section 2.1.3. Apart from its analytical role, IEF is also used on the preparative scale to isolate individual isofoms of a biomolecule.
Mulders et al. [21] predicted the in vivo biological activity of human recombinant follicle stimulating hormone (FSH) using quantitative IEF. This glycoprotein contains approx- imately 35% carbohydrate which introduces considerable microheterogeneity. A relationship exists between the pZ values of the isohormones of human FSH and their in vivo biological activity. Results of IEF followed by visualization by Coomassie Brilliant Blue (3-250 staining and quantitation by densitometry revealed a close correlation to in vivo bioassay data. Quantitative charge profiling may prove useful in the estimation of potency in other therapeutic glycoproteins such as luteinizing hormone, chorionic gonadotropin, thyroid stimulating hormone, and erythro- poietin. Ackermann et al. [22] employed IEF to test the influence of cell- and media-derived factors on the integrity of a human monoclonal antibody (mAb). Integrity was tested in the supernatants from an insect and from several mammalian cell lines commonly used for the production of recombinant proteins, as well as in the human-mouse heterohybridoma cell line to investigate their degrading potential for mAb in the extracellular environment. The methods used for these assays were IEF, SDS-PAGE and an antigen binding assay. IEF revealed partial mAb modifica- tion by factors secreted by the insect cell line, while
Figure 1. Comparison of four different carrier ampholytes for the separation of rtPA glycofonns by IEF (A) Pharmalytes; (B) Ampholines; (C) Bio-Lytes; (D) Serva- lyts. Slab gel was 0.4 mm thick, containing 4% acrylamide, 8 M urea and 2.4% w/v pH 3-10 and 5-8 ampholytes in the ratio 65:35. Focusing was performed for 2 h at 4"C, at constant power, followed by constant volt- age. 1 M phosphoric acid and 1 M NaOH as anolyte and catholyte, respectively. Fixation with 5% sulfosalicylic acid and 10% wlv trichloroacetic acid and staining with Coo- massie Brilliant Blue. From. [ 2 0 ] , with permission.

Electrophoresis 1998, 19, 2512-2594 Electrophoresis of recombinant glycoproteins 2575
mammalian cells were found to be more suitable expression systems for the in vivo production of human mAbs.
Watson and Yao [23] investigated the separation of the glycoforms in recombinant human erythropoietin (rhEPO) expressed in CHO cells. rhEP0 is a glycoprotein hormone that plays a role in the production of red blood cells. It has a molecular mass of 35 kDa, consisting of about 40% carbohydrates, with glycoforms arising from both 0- and N-linked glycosylation. The three N-linked sites contain a variety of complex-type oligosaccharides with two, three and four sialic acids. The authors made use of IEF for two purposes. First, they compared the information on glyco- forms obtained from the electropherograms to that provided by conventional analytical IEF. Second, preparative IEF was used to isolate individual glycoforms for the spiking of rhEPO to provide evidence of the resolution of the glycoforms.
IEF has also been used as a means of corroborating results obtained by other techniques, be it analytical or preparative. Arndt e f al. [24] suggest the utilization of IEF for the validation of carbohydrate-deficient transferrin (CDT) analysis methods and for the verification of odd results. Already existing IEF methods have been used by several authors as a reference method to validate novel capillary IEF (CIEF) separations (see Section 2.2.2) developed for recombinant glycoproteins such as rtPA [20, 251 and recombinant humanized monoclonal antibody (rHuMAb) [26]. Wood et aZ. [27] used the heterogeneity of human creatine kinase, with 1 Da deamidation changes depicted by IEF, as a reference to support the accurate molecular weight results (2 1 Da) obtained by electrospray ionization coupled with Fourier-transform mass spectrometry. Finally, the following articles found by bibliographic search, may not strictly report on the routine analysis of recombinant glycoproteins, yet the interesting variety of IEF applications presented, clearly demonstrates its essential role in the analysis of biomolecules. IEF was used for the analysis or preparative separation of recombinant proteins by several authors [28-301. IEF has a widespread clinical use as well [31, 331.
2.1.1.2 IPG
IEF in immobilized pH gradients (IPG) uses a linear or nonlinear (e.g. sigmoid) IPG to perform a separation. Unlike E F , the pH gradient is generated not during, but prior to the electrophoretic step with the aid of a two-vessel gradient mixer [13]. The buffers are covalently fixed to the polyacrylamide gel matrix, thus the immobilized gradient shows great stability. The technique permits the resolution of molecules with plvalues differing by as little as 0.001 pH. It can be applied to analytical as well as preparative use. The technique does not yet exist in the capillary format. A number of reviews have summarized recent developments in the field of IEF in IPG. Righetti and Bossi [ 13, 141 reported on analytical as well as preparative features of IPG, while Righetti et al. [34] focused on multicompartment electro- lyzers with isoelectric membranes as a method of protein purification. IPG is frequently used as the first step of 2-D gel electrophoresis with SDS-PAGE as the second step. These applications are discussed in Section 2.1.3. IPG can be
coupled with the nonelectrophoretic techniques in order to obtain a more complete picture of the characteristics of biomolecules. Breme et al. [351 studied the properties of proteins by coupling IEF in IPGs, resulting in information on net surface charge, with electrospray ionization-mass spectrometry (ESI-MS), which differentiates the proteins according to their molecular mass. Extraction of the proteins from the IPG matrix with an acetonitrile-water-trifluoro- acetic acid mixture gave recoveries of 8 0 4 5 % . Since no interference was observed with the MS analysis, this coupling is deemed excellent for the characterization of protein microheterogeneities.
Although IPG is an attractive method, to date, no application to recombinant glycoproteins has been found by biblio- graphic search. However, IPG is widely used in the analysis of a variety of recombinant proteins, as illustrated by the articles of Bossi et al. [36]; Wenisch et aZ. [37]; Violand et al. [38]; Bischoff et al. [39, 411; Ettori et al. [40]. Recent advances in the practical aspects of IPG have also been described by some authors. Esteve-Romero et al. [42] investigated and explained the phenomenon of sample streaks and smears in immobilized pH gradients, containing the pK 7.0 acrylamido buffer among the buffering ions. Rabilloud et al. [43] described a novel method for sample application in IPG to improve the resolution of 2-D gel electrophoresis using IPG as a first step.
2.1.2 SDS-PAGE
For the determination of molecular weight of proteins and glycoproteins, SDS-PAGE is a useful appropriate method in routine quality control. The method is based on the binding of SDS to proteins at a constant weight ratio which confers an identical charge-to-mass ratio to the proteins. The adsorbed SDS masks the intrinsic charge of the protein resulting in a SDS-protein complex of approximately constant charge, per unit of protein mass. Western blot analysis, where the protein is transferred to a nitrocellulose membrane after the SDS-PAGE separation, combines the electrophoretic technique with immunochemical detection. Western blotting is used routinely for the quality control of various recombinant glycoproteins after purification in the production process. However, SDS-PAGE has some limi- tations, one of the most important limitations being the anomalous SDS binding characteristics of glycoproteins due to their carbohydrate moiety. SDS does not bind to the carbohydrate moiety and thus prevents a precise determi- nation of molecular weight. In addition, highly basic proteins tend to have decreased charge-to-mass ratios when complexed with SDS hecause of the large number of positively charged amino acids whereas hydrophobic proteins exhibit a higher charge-to-mass ratio. This tech- nique has been extensively employed for the quality control of recombinant glycoprotein, including monitoring of the production and purification processes, purity testing and analysis of final products. In this section we have selected only a few recent examples to illustrate the potential of this technique to analyze biotechnologically-derived glycopro- teins.
Alteplase is a tissue plsminogen activator (t-PA) produced by recombinant technology. The glycoprotein is synthetized
2576 M. Taverna et al. Electrophoresis 1998, 19, 2572-2594
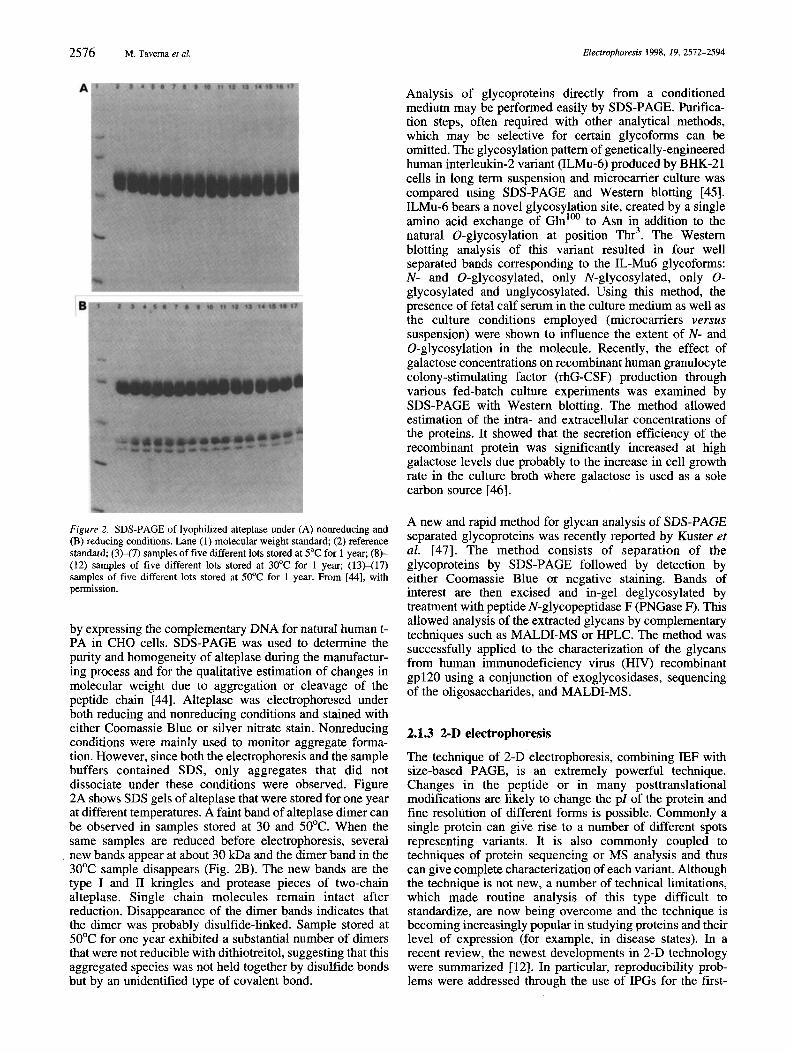
Figure 2. SDS-PAGE of lyophilized alteplase under (A) nonreducing and (B) reducing conditions. Lane (1) molecular weight standard (2) reference standard; (3H7) samples of five different lots stored at 5°C for 1 year; (8)- (12) samples of five different lots stored at 30°C for 1 year; (13)-(17) samples of five different lots stored at 50°C for 1 year. From [MI, with permission.
by expressing the complementary DNA for natural human t- PA in CHO cells. SDS-PAGE was used to determine the purity and homogeneity of alteplase during the manufactur- ing process and for the qualitative estimation of changes in molecular weight due to aggregation or cleavage of the peptide chain [44]. Alteplase was electrophoresed under both reducing and nonreducing conditions and stained with either Coomassie Blue or silver nitrate stain. Nonreducing conditions were mainly used to monitor aggregate. forma- tion. However, since both the electrophoresis and the sample buffers contained SDS, only aggregates that did not dissociate under these conditions were observed. Figure 2A shows SDS gels of alteplase that were stored for one year at different temperatures. A faint band of alteplase dimer can be observed in samples stored at 30 and 50°C. When the same samples are reduced before electrophoresis, several new bands appear at about 30 kDa and the dimer band in the 30°C sample disappears (Fig. 2B). The new bands are the type I and I1 kringles and protease pieces of two-chain alteplase. Single chain molecules remain intact after reduction. Disappearance of the dimer bands indicates that the dimer was probably disulfide-linked. Sample stored at 50°C for one year exhibited a substantial number of dimers that were not reducible with dithiotreitol, suggesting that this aggregated species was not held together by disulfide bonds but by an unidentified type of covalent bond.
Analysis of glycoproteins directly from a conditioned medium may be performed easily by SDS-PAGE. Purifica- tion steps, often required with other analytical methods, which may be selective for certain glycoforms can be omitted. The glycosylation pattern of genetically-engineered human interleukin-2 variant (ILMu-6) produced by BHK-21 cells in long term suspension and microcarrier culture was compared using SDS-PAGE and Western blotting [45]. ILMu-6 bears a novel glycosylation site, created by a single amino acid exchange of GlnlW to Asn in addition to the natural 0-glycosylation at position Thr3. The Western blotting analysis of this variant resulted in four well separated bands corresponding to the ILMu6 glycoforms: N- and 0-glycosylated, only N-glycosylated, only 0- glycosylated and unglycosylated. Using this method, the presence of fetal calf serum in the culture medium as well as the culture conditions employed (microcarriers versus suspension) were shown to influence the extent of N- and 0-glycosylation in the molecule. Recently, the effect of galactose concentrations on recombinant human granulocyte colony-stimulating factor (rhG-CSF) production through various fed-batch culture experiments was examined by SDS-PAGE with Western blotting. The method allowed estimation of the intra- and extracellular concentrations of the proteins. It showed that the secretion efficiency of the recombinant protein was significantly increased at high galactose levels due probably to the increase in celI growth rate in the culture broth where galactose is used as a sole carbon source [46].
A new and rapid method for glycan analysis of SDS-PAGE separated glycoproteins was recently reported by Kuster er al. [47]. The method consists of separation of the glycoproteins by SDS-PAGE followed by detection by either Coomassie Blue or negative staining. Bands of interest are then excised and in-gel deglycosylated by treatment with peptide N-glycopeptidase F (PNGase F). This allowed analysis of the extracted glycans by complementary techniques such as MALDI-MS or HPLC. The method was successfully applied to the characterization of the glycans from human immunodeficiency virus (HIV) recombinant gp120 using a conjunction of exoglycosidases, sequencing of the oligosaccharides, and MALDI-MS.
2.1.3 2-D electrophoresis
The technique of 2-D electrophoresis, combining IEF with size-based PAGE, is an extremely powerful technique. Changes in the peptide or in many posttranslational modifications are likely to change the p l of the protein and fine resolution of different forms is possible. Commonly a single protein can give rise to a number of different spots representing variants. It is also commonly coupled to techniques of protein sequencing or MS analysis and thus can give complete characterization of each variant. Although the technique is not new, a number of technical limitations, which made routine analysis of this type difficult to standardize, are now being overcome and the technique is becoming increasingly popular in studying proteins and their level of expression (for example, in disease states). In a recent review, the newest developments in 2-D technology were summarized [ 121. In particular, reproducibility prob- lems were addressed through the use of IPGs for the first-

Electrophoresis 1998, 19, 2512-2594 Electrophoresis of recombinant glycoproteins 2577
dimensional separation. The technique is now extremely reproducible and can also employed for micropreparative purposes.
The potential of this technique for detecting small changes in proteins would make it a useful addition for testing the consistency of recombinant proteins. However, there have been relatively few reports published so far, which reflects the difficulties in analyzing such data. The application for the control of quality and consistency in production systems has been described by Harant et al. [48] who compared a nonrecombinant human melanoma cell line and recombi- nant CHO cells as examples of long-term in vitro fermentation in protein-free media by electrophoresis. Secreted proteins from a melanoma cell line cultivated in a continuous fermentation system over a period of 22 months were monitored. 2-D patterns of all secreted proteins were compared. They concluded that the high resolution of complex polypeptide mixtures and the possibility to detect even minor differences in the composition of protein patterns, makes this a valuable tool for quality assessment in animal cell culture technology. Another report by Foster et al. [49] investigated expression of full-length chicken growth hormone (cGH) cDNA expressed in Spodoptera frugiperda (SB) insect cells. The partially purified recombinant cGH was analyzed by 2-D electrophoresis. Recombinant cGH and purified native cGH revealed similar immunoreactive charge isoforms and size variants. They were able to show that cGH expressed in insect cells is biologically and immunologically active, and that a variety of isoforms are secreted which exhibit size and charge properties similar to those of pituitary-derived cGH. An area where 2-D electrophoresis may prove useful is optimization of culture conditions by permitting the effect of changes on several different aspects of the protein under study both in the peptide and in post-translational modification to be monitored. However, there is still the problem of pattern interpretation and in getting sufficiently reproducible separations in the two dimensions on a routine basis.
2.2 CE
2.2.1 CZE and MEKC Owing to their ease of automation and facilitating the development of reproducible routine analysis, capillary zone electrophoresis (CZE) and micellar electrokinetic capillary chromatography (MEKC) appear well-suited for quality control of recombinant glycoproteins. The mobility of samples in CZE can be correlated to their mass and charge. CZE separation is based on charge-to-mass ratio. In the case of glycoform determination, CZE is useful for the separation of variants with different amounts of glycosylation and different number of sialic acid residues. It has been shown that neutral glycoforms can also be separated by careful selection of the separation conditions.
MEKC was developed to aid in the separation of neutral compounds but this method works equally well for ionic compounds and mixtures containing both charged and uncharged compounds. In MEKC, surfactants, which can be anionic, cationic or neutral, are added to the running buffer at a concentration exceeding the critical micelle
concentration (CMC). SDS is usually used for CE glycoprotein analyses because of its ability to interact with (g1yco)proteins. Due to this interaction, the greater their mass, the more negatively-charged they become. Although surfactants have been generally used to prevent glycopro- tein-capillary wall interactions [50, 511 or to assist in solubilization of glycoprotein by denaturation, surfactant micelles (present in the buffer medium) may also facilitate separation of glycoprotein analytes, as a result of both electrostatic and hydrophobic interactions of glycoproteins with micelles.
Several authors have reported the usefulness of 1,4- diaminobutane (DAB) and diaminoalkanes for glycoform separation by CZE [5240] to reduce interactions between glycoproteins and the capillary surface and to modulate the electroosmotic flow (EOF). Watson and Yao [52] reported the separation of the glycoforms of rhEP0 into six well resolved peaks using an uncoated fused-silica capillary in a tricine buffer (pH 6.2), supplemented with 2.5 rm DAB and 7 M urea. Glycoforms eluted, in a predictable manner, in order of increasing numbers of sialic acid residues. In the same way, these authors described the optimum conditions for the separation of the glycoforms of recombinant human granulocyte-macrophage colony stimulating factor (GM- CSF) using a 50 rm phosphate-50 m borate buffer, pH 8.0, with 2.5 rm DAB [61]. Other authors have also shown the usefulness of borate complexation in the resolution of glycoprotein glycoforms [55, 57, 621. Although it is possible to achieve good separations of intact recombinant glycoproteins on bare-silica uncoated capillaries, one of the main limitations of this method is the adsorption of the glycoprotein on the capillary wall. Several strategies have been proposed to overcome this limitation. First, working at low pH may weaken electrostatic interactions while buffers with pH > pl of the glycoproteins may induce electrostatic repulsions. The other possibility is to use various buffer additives to give the best shield of silanol groups. Finally, capillary coating may render silanol groups inert. Since the 1990's, several groups have developed CZE of glycopro- teins using different hydrophilic polymeric coatings; covalently attached methylcellulose and dextran, copolymer of hydroxypropylcellulose and 2-hydroxyethylmethacrylate, polyethylene glycol (PEG), polyacrylamide, linear poly- acrylamide and polyvinyl alcohol (PVA) [63]. In addition, our group [62] obtained an uncomplete resolution of several glycoforms of rtPA using fused-silica capillaries in phosphate buffer (pH 3.6), due to the ability of phosphate ions to strongly bind to the silica surface of the capillary converting the residual acidic silanols to a protonated silica- phosphate complex [64]. This strategy was also utilized by Tran et al. 1651 to separate rHuEP0 in different glycoform populations.
According to James et al. [50], borate also appears to be superior to phosphate as an MEKC electrolyte buffer. Kats et al. [66] used MEKC to fully separate four major isoforms of the chimeric monoclonal antibody BR96 in the presence of 25 rm SDS in a 12 rm sodium borate buffer, pH 9.4, at different temperatures. The exact identity of the separated species remained unknown but was shown not to result from carbohydrate moiety heterogeneity or partial oxidation/ deamidation of AsdGln residues, but rather from different

2578 M. Tavema et al. Electrophoresis 1998, 19, 2512-2594
forms of the same primary structures. The same authors [67] further applied MEKC for separation and quantitation of three structurally similar isoforms/conformers of BR96 sFv- PE40 using cholic acid as a micelle-forming surfactant in a pH 9.0 borate buffer. Two well-known modifiers of protein structure, guanidine hydrochloride and trifluoroethanol, were shown to affect the separation profile in a concen- tration-dependent manner. The differences in the electro- phoretic mobilities of closely-related species may be assigned to the differences in the exposure of polar and hydrophobic pattern on the globular surface of the protein via formation of distinct protein-micelle association com- plexes. An alternative to the use of ionic surfactants for the MEKC of glycoproteins is the employment of neutral or zwitterionic surfactants, which can be utilized over a wide range of buffer conditions without contributing to the solution conductivity. They alter the net charge of the analytes and induce protein denaturation. In this way, a zwitterionic surfactant, N-dodecyl-N,N-dimethyl-3-amino- 1-propanesulfonate (DAPS), has been utilized to provide separation of recombinant DNA insulin-like growth factor I (IGF-I) variants using a coated capillary in the presence of an organic modifier by Nashabeh et al. [68]. To summarize, MEKC glycoprotein separations can be optimized through the manipulation of the hydrophobic, hydrophilic or electro- static glycoprotein-micelle association; and compound migration times are related to their hydrophobicity.
In conclusion, CZE may be used for on-line analysis of bioproduction of pharmaceutical glycoproteins at different stages of the purification or production process (i.e. during fermentation or in downstream processing). CZE may also contribute to assessing the recombinant glycoprotein identity, its purity, heterogeneity, quantity and stability. MEKC, which is one of the most robust modes of CE, has significant potential in analytical chemistry of rDNA- derived glycoproteins and particularly in process control and purity testing.
2.2.1.1 Process monitoring
Reif and Freitag [69] reported the control of the fermentation process of recombinant antithrombin 111 (r-AT III), the main inhibitor of thrombin, by CE. The downstream process was monitored by CZE under acidic conditions with voltage ramping using an uncoated capillary. The separation was performed using 50 mM phosphate buffer with 0.1% hydroxypropylmethylcellulose (HPMC) (pH 2.0) at 2OoC. The detection limit was found to be 50 pg/ml using detection at 200 nm to increase the sensitivity. One advantage of using CZE is the short analysis time of 10 min which is regarded as acceptable, especially as the down-stream process takes several hours. Characterization of proteinase A glycoforms secreted to the fermentation broth by recombinant Saccha- romyces cerevisiae was described by Pedersen and Bieder- man [70]. CZE was employed to study microheterogeneity of the proteinase A for the evaluation of product purity and also of the suitability of the host organism. The CZE analysis of the proteinase A and the variant glycoform was performed, using an untreated silica capillary with 100 m acetate-phosphate buffer (pH 3.2). This study revealed that approximately 70% of the product was native proteinase A presenting two glycosylation sites and
I
io 45 60 75 90 105
Time [min]
Figure 3. MEKC electropherogam of native IFN-o expressed in CHO- cells (medium supplemented with 1% fetal calf semm (FCS). Influence of the process times (4 days and 8 days) on the glycoform pattern. Conditions: PA-coated capillary (1 10 cm X 50 pn), buffer: 150 mM H3B03 and 50 m SDS, pH 9.3, 20 kV, 25OC. From [71], with permission.
whereas the remaining 30% was a proteinase A variant glycoform lacking the carbohydrate moiety at Both molecules resolved into three peaks that probably corre- spond to charge heterogeneities attributable to differences in the hosphorylation level of the carbohydrate group at Am'. Kopp et al. [71] investigated the monitoring of the glycosylation pattern of recombinant Interferon-w (IFN-w) with MEKC on a polyacrylamide-coated capillary in a borate buffer containing 50 m SDS. To elucidate the robustness of IFN-w glycosylation with regard to process modifications, CHO-cells expressing human IFN-w were cultivated under different fermentation conditions. The most significant glycosylation alterations resulted from the various parameters, such as initial ammonia concentration in the production medium, fermentation mode or process time. As shown in Fig. 3 the glycoform pattern obtained by the analysis of IFN-w MEKC at four and eight days process time was markedly different from the reference material.
2.2.1.2 Purity assessment
Although not studying a glycoprotein, Roddy et al. [72] reported an interesting method for separation of recombinant acidic fibroblast growth factor (aFGF) from its recombinant production impurities by CZE with 50 m phosphate buffer, pH 2.5, with a 0.25% HPMC additive. These conditions were employed after the turbidity study of aFGF in buffer solutions to determine its physical stability and to ensure that

Electrophoresis 1998, 19, 2572-2594
the protein would not precipitate during CE analysis. This system provided the best efficiency and selectivity and was developed for pharmaceutical purity analysis. In another work, MEKC was shown to be a rapid and easy technique to estimate the protein purity of a highly glycosylated hepatitis C virus (HCV) protein, expressed in CHO-cells [73]. This paper describes a MEKC separation of r-DNA HCV protein which was produced by two production methods and purified by a standard protocol, utilizing fused-silica capillary and a high concentration of SDS (100 mM) in borate buffer (pH 9.5). MEKC electropherograms of CHO- HCVl protein prepared by method 1 and 2 showed the same pattern of two unresolved peaks. The profile for the CHO- HCVl prepared by method 2 presented an additional peak at longer migration times. The CHO-HCV1 protein, prepared by method 1 and 2, yielded (for the mixed major peak) a purity of 92.2% and 45%, respectively. The quantitative purity results obtained by the present MEKC method were in good agreement with the results obtained from the conven- tional SDS-PAGE technique.
2.2.1.3 Lot-to-lot consistency
Hoffstetter-Kuhn et al. [74] described the use of CZE as a sensitive technique to analyze batch-to-batch consistency in production based on complex formation of borate with carbohydrates in alkaline solutions to monitor mAb carbohydrate heterogeneity. It was found that lower temper- atures, higher borate concentrations and higher pH values improved the separation by stabilizing the complex. The separation profile of the mAb in a borate buffer, pH 9.4, gave three peaks detected by UV absorbance at 200 nm. Linearity of the peak areas was measured up to a protein concentration of 0.1% w/v, with correlation coefficients better than 0.999. The separation method was also validated for reproducibility (n = 6 ) as the individual peaks were quantified with fairly good precision with relative standard deviations (RSD) of the peak area ranging from 5.5% to 7.3%. The electrophero- grams of three different batches of the mAb show two profiles quite similar while the third is markedly different. Although all three peaks were detected in the latter profile, the relative peak areas deviated significantly.
2.2.1.4 Stability and quantification of the final product
The preceeding method described by Hoffstetter-Kuhn et al. [74] was also successfully employed for stability testing of the final product formulations. After antibody storage in glass vials for three months at different temperatures, the separation profiles changed distinctly. Pronounced degrada- tion (only one of the initial three peaks could be clearly detected) was observed at 37°C and even more after storage at 37OC for six months. Other stability studies of recombi- nant protein (recombinant human tumor necrosis factor beta: rhTNF-p) or cell culture protein (immunoglobulin G: IgG) were reported successful using CZE [75, 761.
Bietlot and Girard [77] developed a CZE method, as a sensitive, selective and reproducible procedure for the characterization and quantification of rhEP0 glycoforms in final drug formulations. Large amounts of human serum albumin (HSA) are generally added to rhEP0 as a protein excipient. Because of their similar physical characteristics in
Electrophoresis of recombinant glycoproteins 2579
solution, a complete separation of the two proteins as well as separation of rhEPO into several glycoform populations could only be achieved through the addition of 1 m~ nickel chloride to a 200 mM sodium phosphate buffer, pH 4.0, in a fused-silica capillary without affecting the glycoform resolution pattern (Fig. 4). Metal ions are known to interact with proteins and to affect their properties and conformation. In this case, nickel ions may selectively alter the electro- phoretic mobility of HSA. This nickel-supplemented CZE method was linear over the concentration range of 0.03- 1.92 mg/mL,, with limits of detection and quantitation of 0.01 and 0.03 mg/mL, respectively. The precision of the method was evaluated from intra- and inter-day triplicate injections of rhEP0 standard solutions and formulations over four batches. This method was found to be useful for quantitative rhEP0 determination in formulations (within- and between-batch variances were less than 5%). In addition, the method was also capable of distinguishing products from different manufacturers. Quantitative lot-to- lot variations for rhEP0 content from two manufacturers was observed.
Yowell et al. [78] described the CZE analysis of a recombinant GM-CSF utilizing a C8 bonded capillary and a 50 m~ sodium phosphate (pH 6.8) -0.05% Brij 35 buffer. Two injection procedures were examined. When using hydrostatic injection the assay percent of two dosage forms reached 94.5 to 99.5 of the labeled values while percentages hardly reached 16.3 using electrokinetic injection. In addition, RSD of the assay was more than tenfold higher
1
D L C
Figure 4. CZE electropherograms of (A) HSA, (B) bulk rhEP0, (C) rhEP0 formulations, using an untreated capillary (40 cm X 50 pm), 1 m~ nickel chloride hexahydrate, added to 200 m~ sodium phosphate buffer, pH 4.0, 8 kV, 2OoC. Inset: expanded view of the region between 30-45 min in electropherogram, showing separation between HSA and rhEP0. From [77], with permission.

2580 M. Taverna et al. Electrophoresis 1998, 19, 2572-2594
with the electrokinetic injection. With hydrostatic injection 99.9 and 94.5% for the 0.7 and 0.4 mg/vial dosage forms were obtained, respectively. The GM-CSF dosage form contains a high salt concentration when reconstituted. Therefore the effect of salt concentration of the sample on quantitation for both injection processes was examined. Salt concentration did not affect peak areas when the pressure injection technique was employed, which appears to be more robust and preferable. To maintain good peak symmetry and an efficiency of 5 1 000 theoretical plates (observed with the pressure injection technique), the salt concentration of both the sample and standard should be no more than half that of the separation buffer. On the other hand, linearity was observed from 1.0 mg/mL to 30 pg/mL with a correlation coefficient of 0.997.
2.2.1.5 Natural versus recombinant glycoprotein
CZE is useful in comparing interleukin-2 (IL-2) in its native state and E. coli derived recombinant IL-2 (rIL-2) [79]. Using a coated capillary and 100 m phosphate buffer, pH 2.5, at 10 kV, CZE of natural interleukin-2 (nIL-2) shows three different forms; nonglycosylated, glycosylated-mono- sialylated and glycosylated-disialylated. These results cor- relate well with those obtained by SDS-PAGE and demonstrate the high selectivity of CZE for separation of proteins with a single charge difference. For the recombinant IL-2 (nonglycosylated), SDS-PAGE separation shows only one band but CZE analysis reveals two peaks with approximately the same electrophoretic mobility as the first peak in the nIL-2 pattern obtained under the same conditions. One of the two peaks probably represents a rIL-2 form with a slightly modified conformation.
For a nonglycosylated protein, Mc Nerney et al. [80] reported an interesting application of the CZE method for the detection of the effects of different fermentation conditions on rhGH production from E. coli. The rhGH and its variants from very crude mixtures of E. coli, could be resolved in less than 20 min, using a 250 m phosphate, pH 6.8, -1% v/v propylene glycol buffer and a phosphate deactivated fused-silica capillary. By contrast, three differ- ent HPLC separations were required to detect the natural rhGH and its variants. Recently, Thorne et al. [81] demonstrated the potential of CZE for routine analytical characterization of glycoform heterogeneity of a complex protein such as rtPA. Excellent precision of method was determined thanks to reproducibility of the high migration time (RSD C 0.2%) and full protein recovery, owing to the addition of 0.01% v/v Tween 80 to the running buffer. CZE proved reliable using a a-amino acids buffer with poly- acrylamide and PVA coated capillaries for the separation of rtPA variants.
comparisons
2.2.1.6 CZE-MS coupling
While CZE is a promising approach to demonstrate lot-to-lot consistency of different batches of a recombinant glyco- protein, this method does not allow a characterization of glycoproteins. In this context, the combination of CZE and off-line matrix-assisted laser desorption ionization - time of flight - mass spectrometry (MALDI-TOF-MS) should be a valuable technique for the analysis of glycoform populations
of intact glycoproteins. Chakel et al. [82] described the successful analysis of two highly heterogeneous glycopro- teins, ovalbumin and desmodus salivary plasminogen activator (DSPAal). For the DSPAal CZE analyses, 100 m phosphate buffer, pH 3.0, was used with a bovine serum albumin (BSA) coated capillary. The CZE fractions were mixed 1 : 1 with the UV-absorbing MALDI matrix and subjected to mass analysis. Distinct mass trends were observed but each collected fraction was still a mixture of glycoforms. Although the explanation of relative mobilities or masses of different fractions is not possible, the ability to perform off-line MALDI-TOF-MS of fractions from com- plex electropherograms will be a powerful tool to demon- strate product consistency in the manufacturing of glycoprotein pharmaceuticals. More recently, Yeung et al. [83] developed a method to analyze high mannose-contain- ing proteins by on-line CE-ESI-MS. The method was applied to ribonuclease B (RNase B) and to a recombinant human bone morphogenic protein-2 (rhBMP-2). For the latter, a total of six dimer isoforms were found, with each of them carrying glycoforms derived from the high mannose glycans. After reduction and alkylation, a much improved separation was obtained because the individual glycoforms within each isoforms were also resolved. For the on-line CE- ESI-MS, a nonvolatile acidic p-alanine buffer was employed. The separation was performed on a linear polyacrylamide-coated capillary without EOF.
2.2.2 CIEF
CIEF combines the high resolving power of conventional IEF with the advantages of automatization and speed offered by the capillary technique. The separation of charged analyte molecules takes place in a pH gradient created in a capillary by carrier ampholytes under the influence of an electric field. For glycoproteins the pZ depends on the number and type, of charged amino acids in the protein backbone and the number of sialic acid residues in the glycan moiety present at the surface of the three-dimensional molecular structure. Since CIEF offers a resolution of at least 0.01-0.02 units of pH [84], it is possible to reveal minor differences in the composition of glycoforms. In addition, the concentrating effect, occurring during the focusing step, enables the detection of components present in small quantities. A major difference between IEF and CIEF is the method of detection: in CIEF detection is performed in most cases with an UV or photodiode array detector placed near one end of the capillary. In order to visualize the stationary zones formed in the capillary, its contents must therefore be mobilized in an additional step so that they pass in front of the detector window.
2.2.2.1 General considerations
Several practical aspects of CIEF, with useful hints for experts and beginners alike, have been extensively treated in the literature. These include the problems associated with pZ markers, the choice of carrier ampholytes, mobilization procedures, and protein solubility. Although CZE has also been used to determine pZ values [85, 861, CIEF remains the method of choice for this purpose. The determination of pl values by CIEF is generally based on the comparison of migration times of the unknown peaks to those of pZ

Electrophoresis 1998, 19, 2572-2594 Electrophoresis of recombinant glycoproteins 258 1
standards added to the sample mixture (internal standards). This presumes stability of the markers under the electro- phoretic conditions, a high degree of purity, a high solubility under focusing conditions, sufficient absorption at the detection wavelength, and the absence of interaction with the sample molecules andor the carrier ampholytes [87]. To date, most of the reagents (carrier ampholytes, solubilizers, etc.) used in CIEF are adopted from traditional IEF. Protein standards are no exception but this may have a number of drawbacks, especially in the case of denaturing conditions. Several alternative approaches to such a calibration have been reported. Rodriguez-Diaz et al. [88] described the synthesis of low molecular weight, substituted aromatic aminophenols which fulfill all of the requirements for pZ standards for CLEF and assure a 0.06% pZ reproducibility.
Another approach to modified peptides was reported by Kobayashi et al. [89] who used synthetic, UV-absorbing peptides as pZ markers to evaluate pH gradient formation of several commercially available carrier ampholytes. Dansyl chloride derivatization endows these peptides with UV absorption in the range 280-300 nm. They cover a wide pZ- range, and are therefore deemed suitable candidates as internal standards. Shimura and Kasai [90] chose fluores- cence labeling to produce peptides suitable as pZ markers with fluorescence detection. This mode of detection confers a high sensitivity to the analytical method, however, it necessitates the additional step of sample labelling. Kilar [91] offered a novel way to circumvent the use of pl markers, making use of the changes in the current observed during a run. Based on p l values obtained from the literature, a calibration curve of pZ us. measured current can be plotted wich can then be used to determine the isoelectric point of peaks appearing in the electrophero- gram. Illustrating this method on forms of transferrin, he attained a reported error of about 0.03 pH units for the pZ values.
Better knowledge of the chemistry of carrier ampholyte molecules is important for IEF techniques because for the generation of pH gradients highly complex mixtures are used. The dissociation theory and the properties of aqueous ampholyte solutions was studied by Stoyanov and Righetti [92]. They proposed a model for describing ampholyte behavior during focusing, capable of explaining, for example, the phenomenon of conductivity of isoelectric ampholytes. An increasing number of carrier ampholyte mixtures are commercially available, but the supplier has to be carefully chosen to suit the molecule to be separated. Commercially available ampholytes have recently been compared by two different groups. Kobayashi et al. [89] evaluated four different carrier ampholytes with the aid of ampholyte derivatives obtained by dansylation. They demonstrated the limitations of detection by high signal- to-noise ratios in the UV region of the commercially available ampholytes. As part of a validation procedure of CIEF and IEF of rtPA isoforms, Chen et al. [20] investigated the ruggedness of these methods by evaluating four commercially available carrier ampholytes for their suit- ability to separate rtPA glycoforms under denaturing conditions in urea. They concluded that in CIEF, high background UV absorbance and instrument-ampholyte spectrum incompatibilities may rule out the interchange- ability of certain carrier ampholytes. Conti et al. [93]
succeeded in resolving glycated hemoglobins of a minute pZ difference (<0.03) in human adult blood by using a mixture of carrier ampholytes with two different short chain liquid polyacrylamide and an equimolar mixture of two “separa- tors”, p-alanine and 6-aminocaproic acid. The latter compounds flatten the pH gradient in the pZ region of the two hemoglobins, allowing baseline resolution.
In theory, once the focusing step has been completed, there is no further molecular movement in the capillary. A mobilization step is thus required to drive the focused zones past the detector. To overcome excessive band broadening during this additional step, a number of mobilization techniques have been developed and discussed. Mobilization can be performed essentially in two ways. In the “two-step” method, focusing and mobilization take place sequentially, the latter is achieved independently after the focusing step, either by hydrodynamic force (pressure mobilization or gravity mobilization) or by replacing the catholyte or the anolyte with a salt (chemical mobilization). The “one-step’’ method mobilizes the components simultaneously with the focusing, by means of electroosmotic flow. During mobi- lization, the focusing voltage is maintained in order to keep the focused zones intact. In spite of these efforts, mobilization remains an important factor in zone dispersion.
Schwer [ 101 investigated the possibility of using CIEF as a routine method for quality and purity control of proteins as well as for the detection of degradation products. The three most widely used mobilization techniques, namely chemi- cal, pressure and EOF mobilization, were compared with respect to linearity of the calibration curve, resolution, and reproducibility. With EOF mobilization (“one-step meth- od”) linearity of pZ vs. migration time could not be achieved, with the exception of short pZ ranges. The method is robust and could be further improved by the addition of internal standards. It was found suitable for the analysis of proteins with neutral pl, with short analysis times. For hydrodynamic mobilization, the effect of focusing voltage and time was investigated. Excellent linearity and reproducibility for migration times and for pZ values, determined with internal calibration, were found. The technique is suitable for the separation of strongly basic proteins. In the case of chemical mobilization, a good correlation coefficient was measured for the calibration curve. Acceptable reproducibility for migration times and pZ values determined with internal calibration was found. This method gives the best resolution for proteins with small pl differences and strongly basic proteins. Diode array detectors may give a noisy baseline and poorer results than UV detection at 280 nm, a phenomenon observed in all mobilization techniques.
Manabe et al. [94] studied the effect of anions on cathodic (chemical) mobilization, and concluded that for acidic proteins, like human plasma proteins, weak organic acids give the best resolution. Tang and Lee [95], in turn, investigated the role of carrier ampholytes in the reduction of EOF in fused-silica capillaries due to their adsorption on the capillary wall. They studied several approaches for mobilizing proteins in uncoated capillaries. Rodriguez-Diaz et al. [87] investigated possibilities of improving the performance of CIEF separations using iron-free human transferrin and human hemoglobin variants A, F, C and S as

2582 M. Tavema et al. Electrophoresis 1998, 19, 2512-2594
model analytes. They studied the robustness of CIEF, addressing some well-known problems of CIEF such as (i) the effect of sample salt concentration, (ii) use of reagents with buffering capacity as catholyte and mobilizer, (iii) the identity and concentration of the mobilizing salt in chemical mobilization, (iv) the effect of the pressure applied during pressure mobilization, (v) the use of gravity mobilization, and (vi) use of internal pZ markers. The dispersion arising during pressure mobilization was studied in detail by Minarik et al. [96], who investigated the two phenomena which contribute to a large extent to the dispersion of zones: the parabolic hydrodynamic flow profile due to the applied pressure, andlor the adsorption of molecules to the capillary wall.
Protein insolubility at their pl is a crucial problem in CIEF, even more than in the case of IEF, since the precipitated proteins can clog the small-diameter capillaries used. Additional inconveniences are irreproducible migration times and peak areas, unstable current, and slow mobiliza- tion [88]. Precipitation occurs due to the formation of protein aggregates by hydrophobic interactions and hydrogen bonding. To avoid precipitation, a number of additives have been suggested by different authors. Urea and ionic detergents, for example SDS, are efficient, but they have denaturing properties and are therefore not always appli- cable. Nonionic detergents, such as Triton X-100, Nonidet P-40 and zwitterionic detergents, have been successfully employed alone or in combination. Rabilloud [97], in his detailed review, summarized the rationale of protein solubilization, examining the nature of the possible inter- actions and the most frequent interfering substances. A description of the main solubilization protocols for the most frequently used electrophoretic techniques are given, illustrated by selected references. Canti et al. [84] inves- tigated the use of a large number of solubilizers for analysis by CIEF and IPGs of several proteins and of a glycopeptide antibiotic. In most cases they were successful with mixtures of mild agents, capable of fully preserving the three- dimensional structure and full activity of biomolecules. The solubilizing agents evaluated were (i) nondetergent sulfo- betaines, (ii) zwitterionic detergents such as taurine and CHAPS, and Good's buffers, such as bicine and CAPS, (iii) nonionic detergents such as Nonidet, (iv) neutral additives such as sucrose, sorbose, sorbitol, glycerol, ethylene and propylene glycols, and PVA, and (v) in the case of the hydrophobic peptide, urea and trifluoroethanol. A further possible agent, n-octylglucoside was exploited by Schmerr et al. [98] for the solubilization of the scrapie prion protein (PrP'") in infected sheep brain, the vector glyco- protein of the bovine spongiform encephalopathy. Con- firmed by IEF and immunoblot, they reported, for the first t ime, an ac id ic p l fo r a spec ies of PrPSC
2.2.2.2 Applications of CIEF to recombinant
A number of detailed reviews dealing with CIEF in general and with its application to the analysis of proteins or glycoproteins have been published [9,88,99-1041. rtPA is a complex glycoprotein used in the treatment of myocardial infarction. It possesses three N-linked glycosylation sites which give rise to two types of molecule: Type I glycosylated at Asn 117 (mainly high mannose type), 184
gl ycoproteins
and 448 (both N-acetyllactosamine type, with differences in the sialic acid content) and Type 11 glycosylated only at Asn 117 and 448. In addition, one molecule of fucose is attached to a serine residue. The molecule exists therefore, in a variety of glycoforms. Thorne et al. [8 11 compared the use of three different CE techniques for the routine analysis of rtPA. For CIEF, a two-step method with pressure mobi- lization was utilized. Fifty pm ID capillaries with a polymer solution or 25 pm ID narrow-bore, PVA-coated capillaries without a polymer solution were employed. In the latter case, attention was drawn to the possible signal loss due to the decreased optical path length. Different carrier ampho- lytes were investigated. With Ampholine as carrier ampho- lytes and denaturing conditions optimized by addition of urea, rtPA was resolved into at least eight species, with pl values ranging from 6.4 to 9.2. The optimized method was shown to be reliable by such criteria as acceptable total protein recovery from the capillary, reproducibility and precision of migration time. The latter could be considerably improved if the glycoform peaks were bracketed with peptide pZ markers, and their migration time calculated relative to the marker peaks. The resulting profiles were compared to those obtained by slab gel IEF.
Moorhouse et aZ. [25] developed a rapid (< 10 min) one-step CIEF method to monitor charged glycoforms of rtPA. Focusing and mobilization take place simultaneously: the glycoforms are focused between the detector and the anode, and the EOF sweeps the separated glycoforms past the detector. A neutral, coated capillary of 50 pm ID was used with HPMC added to reduce EOF to a constant and reproducible value. A 5050 mixture of two different carrier ampholytes at a 3% concentration, 4 M urea, 7.5% TEMED and 0.1 % HPMC ensure the best resolution and the solubility of the glycoprotein throughout the focusing, resolving the sample into ten glycoforms. The ratio of the two carrier ampholytes (pH 5-8 and pH 3-10), sample concentration, the concentration of urea, HPMC and TEMED were optimized. Under optimized conditions inter-assay precision for migration time and for normalized areas was adequate. The ruggedness of the method was shown by studying different capillaries. The resolving capabilities of the method were demonstrated by analyzing neuraminidase- digests of the original molecule, with resultant removal of increasing amounts of sialic acid residues. The number of isoforms separated was compared to IEF results of the intact molecule, types I and 11, and neuraminidase-digested rtPA. The results showed excellent correlation. CIEF was found to be a suitable adjunct to slab-gel IEF in the characterization and routine analysis of the consistency of recombinant glycoproteins.
The above one-step method with minor modifications was validated in detail by Moorhouse et al. [105]. Utilization of pZ standards revealed nonlinear elution with pH as well as altered mobility of the pZ standards in the presence of the protein. Investigation of linearity of the total peak area, limit of detection, recovery and precision was complemented by a test performed over a period of three days, analyzing three different samples of rtPA. RSD values for individual normalized peak areas were found to increase with capillary age. RSD values for individual peak migration times were found to decrease both during the day and between days, in

Electrophoresis of recombinant glycoproteins 2583
A s.
8.
8.
a E <
s?
~
Electrophoresis 1998. 19, 2512-2594
Czm
S r o n d 3 0 m d l d 1
Fimt30mdkal
B 0 jlar A\ -
pi 8.4
a * € 0 <
0
P -
1 2 3 4 5 6 7 8 9 10 11 12 13 14 15 16 17 18 19
L d 2 \
Mlnutu
Figure 5. Capillary to capillary variability and stability indicating properties of a CIEF separation of C2B8. (A) Evaluation of two different segments of a single 1 m length capillary. (B) Evaluation of four different lots of the same type of capillary. (C) Comparison of C2B8 samples subjected to various modes of degradation. Conditions: BioCAP LPA capillaries of 24 cm X 50 pm ID thermostatted at 20OC. The final carrier ampholyte solution consisted of a 8: l : l mixture of 2% solutions of Pharmalyte 8-10.5, Bio-Lyte 7-9 and Bio-Lyte 3-10, each containing 0.5% v/v TEMED and 0.2% w/v HPMC. Focusing was performed at 417V/cm for 6 min, using 20 m phosphoric acid and 40 m~ NaOH as anolyte and catholyte, respectively. Chemical mobilization was carried out with Bio- Rad CIEF mobilizer at 625 V/cm for 20 min. From [107], with permission.
accordance with increasing EOF. The ruggedness of the method was tested by determining the influence of several factors on the separation: (i) lot-to-lot variability of capillary coating revealed production inconsistency, (ii) capillary temperature did not significantly affect the overall reso- lution, (iii) TEMED concentration and the applied voltage changed the migration times, and (iv) resolution was found to depend on the nature of carrier ampholytes.
Kubach and Grimm [lo61 developed a CIEF method for analyzing glycoforms of rtPA under denaturing conditions. Bare fused-silica capillaries with 50 pm ID and of different lengths were used. Samples were first denatured in 8 M urea, the separation was then carried out in 0.75% carrier ampholytes in the presence of 4 M urea and 0.4% HPMC (or PEG). Urea was also present in the anolyte and catholyte. Pressure mobilization was utilized. Optimization with respect to the resolution included such parameters as concentration of dynamic coating agents HPMC and PEG, concentration of carrier ampholytes, mixtures of carrier ampholytes, and sample concentration. In the 56 cm capillaries the RSD values were greater than in the 25 cm capillaries. The method was subsequently applied with success to two other glycoproteins, rhEPO and a mAb, with different carbohydrate contents (3-55%). For rhEPO, the same tendency of RSD values was found.
Hunt et al. [ 1071 gave a detailed description and the results of validation procedure of CIEF for determining the identity and the charge distribution of recombinant C2B8, a mouse/ human chimeric mAb to human CD20 antigen. The molecule contains one Asn-linked glycosylation site, no terminal sialic acids and its charge heterogeneity possibly results from C-terminal modification and deamidation. The validation was performed consistent with ICH guidelines, studying such parameters as linearity, accuracy, limits of detection and quantitation, repeatability, intermediate pre- cision, specificity, robustness (evaluated with respect to the lot-to-lot variability of the reagents), focusing and mobiliz- ing voltage, capillary-to-capillary variability (Fig. 5A, 5B), use of alternate capillaries and alternate instruments, sample stability, and suitability for monitoring stability (Fig. 5C). The results in Fig. 5 show that poor section in a capillary does not necessarily imply that the whole lot of capillaries is unsatisfactory and that the method is also able to detect all modes of degradation tested. The method proved to be satisfactory with respect to each parameter studied, and was deemed suitable for testing the bulk and final product.
Lee [lo81 developed a rapid (< 5 min) one step high performance IEF method for examining murine mAbs, which exhibit microheterogeneity mainly due to post- translational glycosylation. The aim of the method is to permit the monitoring of the lot-to-lot consistency and of the purification of mAbs, molecules widely used in the immunodiagnostics industry. Fused-silica capillaries of 50 ym ID were used, with reverse polarity. Samples and standards were dissolved in carrier ampholyte-HPMC mixtures, with or without addition of urea, necessary for solubilization of mAbs precipitating at their pZ. Absence of TEMED as basic blocker was justified by using a carrier ampholyte mixture spanning the pZ range of antibodies to separate in a way that the range of pH of interest fell into the ‘active’ length of the capillary. Analyses both with and without urea, performed on three consecutive days, using two different sets of reagents and capillaries, showed that the migration times of isoforms were highly reproducible. Linearity of pZ calibration was also investigated. Addition of urea resulted in correlation coefficients slightly lower than in its absence, probably due to pZ modification of the protein standards under denaturing or partially denaturing conditions. Microheterogeneity fingerprints of mAbs can

2584 M. Taverna er al. Electrophoresis 1998, 19, 2572-2594
thus be determined and monitored in a simple, rapid and economical way.
Microheterogeneity of the isoforms of monoclonal antiFcyR1 antibody from a culture of a hybridoma cell line was analyzed by Veillon et al. [109]. Coated capillaries of 50 pm ID were used with methylcellulose in the anolyte, the catholyte and the sample mixture. The antibody was separated into four isoforms. Recombinant humanized monoclonal antibody HER2 (rhuMAbHER2) is an antibody directed against the human epidermal growth factor-2 p185 gene product ~ 1 % ~ ~ ~ ~ . It is a nonsialic acid containing glycoprotein subject to charged heterogeneity, resulting from C-terminal clipping and deamidation. Hunt et al. [26] assessed high performance capillary methods for analyzing rhuMAbHER2 as potential substitute for the traditional slab gel techniques, hitherto used for the characterization and quality control (identity, purity, lot-to-lot consistency, and stability) of proteins in biotechnology. For CIEF, a two-step method with chemical mobilization was employed, utilizing 50 pm ID capillaries. With a mixture of three different kinds of commercially available carrier ampholytes of different pH range, they separated rhuMAbHER2 into five charged isoforms in the pZ range 8.6-9.1. The method was validated, based on the linear range, the limit of detection, intra-assay precision and inter-assay precision. It was considered acceptable for a quality control assay.
ATIII and Factor IV (FIX), two human plasma glycoproteins from the blood clotting cascade, were investigated by both CIEF and capillary gel electrophoresis (CGE) by Buchacher et al. [110], who compared the results obtained by the capillary techniques to those obtained by the traditional IEF and SDS-PAGE methods. Both glycoproteins show micro- heterogeneity, and the authors chose these molecules as models for the use of CE in in-process control and quality control. CIEF of the two glycoproteins required different measuring conditions: ATIII gave best results with a linear polyacrylamide-coated capillary, a mixture of carrier ampholytes of pH 3-10 and 3-5, as well as TEMED and HPMC as additives. FIX was separated in a CElect-H15O coated capillary using a mixture of carrier ampholytes pH 2.5-5, 4.2-4.9 and 3-10, with only HPMC as additive. In both cases a cathodic mobilizing reagent was used to achieve mobilization, but the anolyte-catholyte couple was different, a result of extensive optimization experiments. These methods showed six isoforms of ATIII and four of FIX, permitting the determination of their pls, supported by the results of IEF gel. Since both glycoproteins are also produced by recombinant mammalian cells, the newly developed capillary methods can be useful in the routine control process in biotechnological production. Reif and Freitag [69] employed CIEF as a possible technique to control the fermentation process of recombinant ATIII in BHK cells. The pZ values determined were used to characterize the purified product. The results compared with published pZ values of human serum ATIII can reveal faulty glycosylation patterns.
2.2.2.3 CIEF-MS coupling
biotechnological quality control laboratories. Yang et al. [ 11 11 explored the potential of CIEF coupled with ESI-MS as a possible two-dimensional system to analyze bovine serum apotransferrin glycoforms. The combination of CIEF with ESI-MS offers the possibility of selectivity enhance- ment, the direct identification of protein analytes, and the structure analysis of protein molecules in an MS-MS mode. Due to its great resolving power, speed and sensitivity for glycoprotein analysis, it may be useful in the biopharma- ceutical industry to demonstrate lot-to-lot consistency.
2.2.2.4 Quantitative analysis by CIEF
Although, to date, most of the applications of CIEF are of a qualitative nature, quantitative analysis has also been successfully demonstrated. Yowell er al. 1781 reported on the quantitative analysis of recombinant GM-CSF dosage form by CZE and CIEF. By comparing the quantitative results obtained by CE techniques with HPLC, all methods were found to be acceptable, CIEF having only a limited linear range. Although HPLC is a more rugged technique and less liable to problems inherent to CE techniques, such as sensitivity to salt concentration of the sample, CE methods offer the advantages of reduced analysis times and lower consumption of solvents. As a further advantage, CIEF can be coupled to other analytical techniques such as spectroscopic methods or off-line techniques like sequenc- ing.
2.2.3 CGE
Although SDS-PAGE is the most commonly used method for the routine control of proteins, its limitation (long separation time and difficulties in quantification) has led several authors to examine the separation in capillaries. Denaturing SDS-capillary gel electrophoresis (SDS-CGE) is generally used to estimate the molecular weight of proteins and provides data similar to SDS-PAGE. Molecular weight estimates are made by comparison with molecular weight standards. In the production and quality control of therapeutic proteins, CGE may also be used to evaluate the purity as well as to detect the presence of nondissociable aggregates or fragmentation of the initial product. Early approaches to SDS-CGE involved cross-linked polyacryl- amide gels as sieving matrix in the capillary 11121, with pore sizes generally controlled by varying the concentration of acrylamide. The major disadvantages of gel-filled capillaries are the poor stability of the gel, the limited sensitivity due to the W absorption and cross-contamination through the matrix. For this reason the use of replaceable linear polymers was introduced [113-1161. In this mode, the capillary is flushed and refilled after each analysis to provide a fresh medium for the next analysis. This CE mode is referred to as polymer network, entangled polymer or nongel sieving electrophoresis. Commonly employed polymers are: dex- tran, linear polyacrylamide, polyethylene oxide, agarose or PEG. For glycoproteins, migration times do not directly correlate to molecular size. Indeed, in contrast to proteins which bind SDS with an average of 1.4 g of SDS associated per g of protein, glycoproteins, possessing carbohydrate, exhibit a lower than predicted charge-to-mass ratio leading
Coupled techniques, by enhancing the capabilities of the individual methods, are bound to become accepted tools in
to an overestimation of molecular masses. The Fergusson plot has been proposed to minimize inaccuracies of

Electrophoresis 1998, 19, 2512-2594
a
Electrophoresis of recombinant glycoproteins 2585
b
C d
I"
1 - I 'I
Figure 6. Comparison of SDS-PAGE and SDS-CGE for the analysis of different human ATIII concentrates. (A) SDS-PAGE in a 7.5-15% gradient gel under reducing conditions. A total of 2 bg protein was applied to each lane. Lane (1) molecular mass marker of Bio-Rad; (2) Atenativ, (3) Thrombhibin and (4) Athimbin HS. (B) to (D) SDS-CGE, samples were injected at 0.3 mg/mL: (B) Atenativ, (C) Thrombhibin (D) Athimbin. From [l lo], with permission.
glycoproteins molecular mass determination in the presence of SDS. The Fergusson method is based on the determi- nation of the relative migration of glycoproteins as a function of gel concentration. Fergusson [117] made the observation that the logarithm of a protein's mobility varies linearly as a function of the gel concentration employed to determine the mobility. The slope of this line yields a parameter called retardation coefficient (IQ, proportional to the protein's molecular weight. Standard curves may be constructed by plotting the logarithm of known protein molecular weight markers as a function of the square roots of the retardation coefficients. The application of the Fergusson method to CGE with replaceable sieving matrix was proposed by Werner et al. [ 1 181.
Guttman et al. [ 1191 described a replaceable low viscosity gel formulation and a coated capillary for rapid separation of protein ranging from 20 to 200 kDa with excellent intra- and inter-day reproducibility. The RSD of the uncorrected migration times of eighteen runs of the standard protein ranged from 0.4 to 0.8%. CGE provided easier quantitation while in slab gel the frequently used visualization dye Coomassie Brilliant Blue does not bind in a stochiometric fashion. Monomer and dimer forms of the recombinant human ciliary neutrophic factor could be monitored by this method under reducing and nonreducing conditions. The same approach was employed by Denton et al. [7] to
quantitate a recombinant human albumin (rHA) in Saccha- romyces cerevisiae culture supernatants. The rHA monomer peak was well resolved from the other culture supernatant components (e.g. yeast proteins) but the application of this technique as a routine analytical assay has been hindered by problems related to instrument robustness and irreproduci- bility of rHA quantitation. Klyushnichenko and Kubo [76] have developed a SDS-polymer CE to monitor cell culture processes by performing on-line analysis of real fermenta- tion broth. During IgG production, both the media proteins and to some extent IgG are degraded. In addition, after 8 to 10 days fermentation, many additional proteins and peptides could be detected. Several sample preconcentration methods such as ultrafiltration by centrifugation or precipitation in a ethanol-chloroform solution were tested. The preconcentra- tion method was shown to influence resolution and a 5 to 10 x concentration of the culture supernatant, by precipitation prior to analysis was found to be more effective in terms of protein stability and reproducibility of the patterns.
Hunt et al. [26] compared SDS-CGE and traditional slab-gel SDS-PAGE methods for the evaluation of the purity or the consistency and percent distribution of rhuMabHER2. SDS- CGE provided excellent resolution of rhuMabHER2 light and heavy chains under reducing conditions, seven peaks being detected with a nonreduced sample. This result correlated well with the seven bands observed using SDS-

2586 M. Taverna ef al. Electrophoresis 1998, 19, 2512-2594
PAGE. The peak area attributed to high molecular mass aggregates is consistent with that found by size exclusion chromatography (SEC) with an SDS-containing mobile phase. The glycoprotein stored at 5°C and 37°C for 27 days was also analyzed by SDS-CGE. A slight increase in peak area for the lower mass peaks was observed for the sample stored at 37"C, possibly due to fragmentation of the molecule at elevated temperature. The method could therefore be used for testing stability. Intra- and inter-assay precision of migration times was 1.7% or less and precision of the normalized peak area for smaller peaks between 2.7 and 8.1%. Linearity in the concentration range of 0.5- 500 pg/mL was demonstrated and the limit of detection of the intact rhuMabHER2 under nonreducing conditions was determined to be 0.5 pg/mL.
The feasability of using SDS-CE with a coated capillary for the quantitation of rtPA variants (Type I and II), exhibiting different activities, was illustrated by Thome et al. [81]. The potential of this method for purity assay was shown by analyzing rtPA Type I, &A Type I1 and rtPA treated by plasminogen to produce three polypeptide chains. The separation was performed with a commercial kit employing a polymer for sieving and a neutrally coated capillary. Recently, the purity of two glycoprotein preparations: ATIII (55 000 Da) and FIX 57 000-72 000 Da) from different manufacturers was investigated by SDS-PAGE and SDS-CE [ 1101. Both proteins are also produced from recombinant
K E Y
0 Fucose
0 Mannose E4 N-AC glucosaniinc
A Gnlactoqe
4 Sialic acld
mammalian cells. As shown in Fig. 6, in the case of two antithrombin preparations, two well separated peaks were observed due to the presence of HSA used as stabilizer. ATIII shows in the CE separation a higher apparent mass than HSA. This contradictory result was explained by the high degree of glycosylation of ATIII in contrast to the nonglycosylated HSA. For FIX, SDS-CGE gave similar results to those obtained by SEC and SDS-PAGE but proved less sensitive in detecting protein impurities at low concentrations. The main accompanying protein contami- nant of FIX has a molecular mass of 80 kDa and its position in the SDS-gel was very close to FIX. These two bands were well resolved in the slab gel whereas the two peaks were not baseline resolved using SDS-CE. Moreover, additional bands detected in SDS-PAGE could not be detected in SDS-CE and it was concluded that as far as analysis of FIX is concerned, SDS-PAGE cannot be replaced by molecular sieving CE. The molecular mass of ATIII was determined by Reif and Freitag [69] using CGE. Two different capillary coatings were investigated: linear polyacrylamide or dextran coating as proposed by Hjertkn and Kubo 11203. No differences could be found between these capillaries and relative standard deviation of approximately 2% was found attributed in part to the replacement of the gel in the capillary between each run. The molecular weight of the recombinant ATIII determined with molecular weight standards (59 kDa) matched very well the value evaluated by protein and complementary DNA (cDNA) sequencing.
!
J
Figure 7. Oligosaccharide mapping of rtPA by MEKC. N indicates the migration position of neutral oligosaccharides; Conditions: fused-silica capillary 90 cm X 75 pm: buffer 50 m~ phosphate, 10 m~ MgCIz, pH 7, 22 kV, 3OoC, detection 200 nm. From [140], with permission.

Electrophoresis 1998, 19, 2512-2594 Electrophoresis of recombinant glycoproteins 2587
3 Oligosaccharide profiling
3.1 CE In the biotechnological production of glycoproteins, the assessment of oligosaccharide microheterogeneity is an important analytical task. Oligosaccharide mapping, after chemical or enzymatic release from the glycoprotein, is an approach particularly useful to assess the batch-to-batch consistency of the glycosylation of a recombinant protein. Although the exact sequence of the separated oligosaccha- rides cannot often be determined from mapping, the relative amount of each separated structure provides information on subtle changes in the glycosylation pattern of a glycoprotein. Since 1990, an increasing number of publications have reported successful separations of oligosaccharides, released from glycoproteins, using CE. Two major problems are encountered in CE of carbohydrates derived from glyco- proteins. With the exception of complex oligosaccharides charged through sialylation and/or sulfatation, oligosacchar- ides such as high mannose chains are neutral, precluding their direct separation in electrophoretic systems. Carbohy- drates weakly absorb UV and can be detected only at nonspecific low wavelengths such as 200 nm. Detailed reviews have discussed the different strategies proposed to render oligosaccharides amenable to separation [ 17, 121- 1241.
One approach was to exploit the ability of carbohydrate to form charged complexes with borate ions or with metal ions. Alternatively, the use of MEKC has been also successfully employed. Derivatization of carbohydrates with a suitable tag, conferring to the oligosaccharide a constant charge, is now the most employed strategy. This approach offers the advantage of providing either a chromophore or a fluoro- phore to the carbohydrate chains allowing high sensitivities of detection. In addition, derivatization may sometimes convert the carbohydrate to hydrophobic derivatives permit- ting their separation by MEKC. Since Hase 1125) and Paulus and Klockow [126] have previously reviewed the derivati- zation of carbohydrate for CE, we will only briefly discuss this aspect. In reductive amination, a wide variety of derivatization reagents has been suggested in the literature for glycan labeling. Among those, one of the first was the 2- aminopyridine (2-AP) introduced by Honda et al. [127,128]. A similar compound, 6-aminoquinoline was reported by Nashabeh and El Rassi [129] and Sudor and Novotny [130]. Quinoline carboxaldehyde (CBQCA) was the first fluores- cent tag introduced by Novotny's group [ 13 11. Honda [ 1321 reported CE analysis of oligosaccharides derivatized using l-phenyl-3-methyl-5-pyrazolone (PMP), allowing sensitive UV detection. Camillieri's group [133, 1341 introduced a neutral reagent, 2-aminoacridone (AMAC), as a sensitive fluorophore for oligosaccharides. In the meanwhile, mono-, di- and trisulfonated aminonaphtalene have been extensively studied for carbohydrate mapping by CE. The sulfonic acid group imparts both electric charge and fluorescence to the saccharides [1351. More recently, l-aminopyrene-3,6,8- trisulfonate (AF'TS) for CE-laser induced fluorescence (CE-LIF) analysis using an argon ion laser, was introduced by Guttman's group [136138].
Over the past years oligosaccharide mapping using CE has been intensively studied, however, in spite of the very high
sensitivity afforded by the derivatization and the good resolution exceeding in many cases that obtained by HPLC, little work has been reported on the use of this technique for quality control. A MEKC method for the profiling of underivatized oligosaccharides has been reported by our group [ 139,1401 to compare the glycosylation pattern of two variants of an rtPA which differ by the presence or the absence of glycans at one of the glycosylation sites. rtPA produced from CHO cells consists of a mixture of two variants. The addition of Mg++ cations to SDS solutions provided an effective means to enhance the selectivity of separation. Figure 7 displays the CE oligosaccharide mapping of rtPA with more than 20 structures separated. In this profile, two trisialylated structures, differing by the type of linkage between the sialic acid and the galactose residue, could be resolved. More recently, a separation of oligosaccharide derivatized with the 2-aminobenzamide, a neutral fluorophore and chromophore, was described using anionic cyclodextrins as a pseudostationary phase [ 1411. Current work in progress is directed toward its application for the profiling of a recombinant envelope glycoprotein (gp160) of the human immunodeficiency virus-1 (HIV- 1). Hughes [ 1421 described a CE method to analyze mixtures of underivatized 0-linked and N-linked oligosaccharides from IgG. Two different separation conditions based on the addition of borate were proposed depending on the kind of oligosaccharides analyzed (sialylated or not). The addition of trimethylammonium-propanesulfonate (TMAPS) as a modifier in the running buffer was shown to increase the separation efficiency of the neutral species. Thermally degraded oligosaccharide could also be monitored by this method.
Guttman and Starr [ 1431 compared the performance of slab gel electrophoresis and CE at low pH for profiling of N- linked oligosaccharides released from HIV envelope recombinant glycoprotein (gp 120). Using CE with a neutrally coated capillary, oligosaccharides were separated as their 8-aminonaphthalene-l,3,6-trisulfonic acid (ANTS)- derivatives and monitored with laser-induced fluorescence. The use of an acetate buffer, pH 4.75, as running buffer resulted in high reproducibility of migration times (RDS < 1 9%). With this method, an excellent resolution was attained without the use of a sieving matrix. CE was able to separate at least a dozen peaks whereas only nine to ten bands were found on PAGE.
3.2 PAGE of carbohydrates
Another type of electrophoresis technique which is well suited to batch-to-batch analysis of recombinant glycopro- teins glycans is PAGE which is an attractive technique owing to its speed and simplicity. The analysis of glycosylation by PAGE go hand in hand with separations of the peptide or glycopeptide, as described in the next section. Two major types of analysis are commonly performed, namely analysis of monosaccharide composition [15, 161 or profiling of intact oligosaccharides or glycans [144, 1451. For quantitative analysis, it is important to ensure that there is no selectivity in labeling and that this reaction is optimized. Using 2-aminoanthranilic acid (2-AA), the effect of a number of variables in the reductive amination were examined and optimum conditions for labeling of oligosac-

2588 M. Tavema er al. Electrophoresis 1998, 19. 2572-2594
Table 1. Fluorescent labels used in carbohydrate electrophoresis
Type of Label Formula NY so,
ANTS 8-aminonapthalene- 1,3,6-trisuIphonate
mNH2 AMAC 2-aminoacridone
I H
2-AA
2-amino-anthanilic (benzoic) acid
Advantages
Charge gives glycans high
mobility
High fluoresence intensity
No charge
Small size Single negative
charge Glycan properties
predominate in separation
charides were determined [146], all having the same reducing terminal monosaccharide. If a standard is used, it should have the same terminal monosaccharide, e.g. chitotriose for a standard for N-linked glycans. The efficiency of labeling of different monosaccharides may vary and standard monosaccharides must be labeled under the same conditions as the sample.
The use of ANTS for quantifying monosaccharides was described by Jackson [147] who provides detailed protocols. This technique is being increasingly used for the routine determination of monosaccharides in recombinant glyco- proteins for which monitoring the relative amounts of known monosaccharides is relevant rather than trying to determine the composition in an unknown sample [148]. PAGE of oligosaccharides is complex and a wide variety of possible structures must be taken into consideration [149, 1501. In many cases the two major properties influencing separation, namely the charge and size of the molecules, can produce opposite effects [ 1441 with resultant band overlapping. Good separations of glycans derived from a number of recombi- nant glycoproteins were achieved by PAGE but the technique does not yet give the resolution offered by most HPLC separations. Often, however, the characteristic profile may be adequate for batch-to-batch comparison and this may even be an advantage to resolve only major glycans for easier interpretation and facilitated comparison [ 15 11. Of prime concern is the reproducibility and the ability to detect significant changes in glycosylation patterns between glycoproteins [ 1471.
PAGE analysis of carbohydrates is complicated because (i) many carbohydrates, with the exception of those containing sialic acid residues or phosphate or sulfate substitutions, do not cany any net charge and therefore do not migrate electrophoretically in most buffer systems, and (ii) carbohy- drates possess no chromogenic groups or have selective staining properties, rendering detection difficult. Fortu- nately, these limitations could generally be overcome, by a derivatization procedure, which addresses both of these
Disadvantages
High mobility may mask glycan properties
Separations based on glycan charge
(substituents or borate complexes)
Lower fluorescence intensity
problems. In 1990 Jackson [152] reported a technique utilizing ANTS which both provides the necessary charge and also enables detection by fluorescence. The derivatiza- tion employs conjugation via a Schiff's base on carbohy- drates which have a free aldehyde reducing terminus. It is then stabilized by reduction in a reductive amination to give a product suitable for electrophoresis on polyacrylamide gels. He also described the preparation of gels with a high percentage of monomer when it is necessary to prepare gels with smaller pore size than generally used for protein work and when it is essential to give good resolution of such relatively small molecules. Since then, the use of other fluorophores has been described in particular M A C and 2- AA, both coupled through reductive amination reactions. Each of the labels have specific properties (Table 1).
In a recent review [ 1471, the principles of the separation of carbohydrates by PAGE and of the use of different buffer systems was described. The separation of small sugars, such as mono-, di- or trisaccharides or oligosaccharides by using suitable buffers was illustrated. For ANTS labeled glycans, stacking buffers containing chloride and running buffers containing glycine may be used. With M A C a borate buffer lacking a charge must be used to complex neutral glycans. Numerous examples of separation of protein glycans labeled with ANTS are reported with detailed protocols for the analysis of differing amounts of glyco- protein as well as details of imaging by Polaroid photog- raphy and by charge coupled device (CCD) camera systems. The technology was also reviewed by Starr et al. [16]. They present data on the kinetics of labeling with ANTS showing that reproducible labeling could be obtained if the amount of glycan was less than 20 nmol. By quantitative imaging with a CCD camera from 5 to 500 pmol per band could be detected, with a %CV of less than 10%. Data are presented for glycans released from glycoproteins, glycolipids and free glycosaminoglycans, with detailed protocols for each type of glycoconjugate. Monosaccharide analysis can also be performed by using a borate buffer because the formation of the borate complex allows separation in the gel. Further

Electrophoresis 1998, 19, 2572-2594 Electrophoresis of recombinant glycoproteins 25 89
information can be obtained by using specific exoglycosi- dases to digest the glycans before analysis on the gel. Additional information is provided by using enzymes in fingerprinting of glycan pools from glycoproteins to show different types of glycan present and to detect modifications such as sulfation and phosphorylation. The technique is considered ideal for applications such as process develop- ment and quality control where monitoring of glycosylation is required.
The technique of fluorophore-assisted carbohydrate electro- phoresis, occasionally referred to as FACE, is finding growing application in the field of analysis of glycoprotein glycosylation, particularly when routine and comparative analysis is required such as in the monitoring of batch-to- batch consistency. This technology has recently been approved by the Food and Drug Administration (FDA) for prerelease analysis of batches of recombinant proteins, and an even wider application in future may be envisaged. Masada et al. [153] applied the technique in a quality control environment and determined quantitatively the effect of a number of variables in samples preparation, electrophoresis and gel formulation, on the analysis of N-linked oligosac- charides. Enzymatic degradation with the enzyme PNGaseF was investigated on a number of standard glycoproteins, and followed by an analysis of the consistency of released glycans under different electrophoretic conditions and with different gel batches. Relative luminance of bands gave good consistency with < 5% CV for most standard glycoproteins, with temperature being an important param- eter for consistency. Detailed practical protocols for analysis of N-linked oligosaccharides, O-linked oligosaccharides and imaging were also provided by Klock and Starr [148] who dealt with all aspects of glycan release and labeling. Guidance on problems that may occur in running gels and on-imaging are also provided.
The analysis of IgG glycans labeled with 2-AA was reported by Frears and Axford [ 1541. A combination of this tag with Tns-glycine buffer gives excellent resolution of closely related neutral structures such as the bi-antennary glycans in IgG. Although not yet applied to recombinant proteins, this would be a good means for routine assessment of the glycosylation of monoclonal IgG hybridomas. Given the increasing number of such antibodies being produced for therapeutic purposes, this technique shows great promise for monitoring their glycosylation patterns. The simplicity of the technique and the ability to provide comparative data with a straightforward interpretation make this an attractive option in a monitoring environment. If required, the techniques can also be supplemented with more sophisti- cated electrophoretic, HPLC or MS techniques.
4 Peptide and glycopeptide mapping
Peptide mapping to demonstrate structural equivalence with their natural counterpart is an important requirement for recombinant proteins for a drug regulatory standpoint and for patenting. It is widely used for checking and validating the lot-to-lot consistency of recombinant proteins. In order to reduce the size and hence facilitate analysis and to provide information on presumptive changes, the proteins or glycoproteins are usually cleaved enzymatically or chemi-
cally to generate peptides and glycopeptides fragments, more readily amenable for further characterization. Peptide maps allow both comparison of homologuous proteins and the identification of protein variants.
Despite the fact that RP-HPLC is the most widely used method for the analysis of tryptic peptides, a number of authors have reported generation of peptide mapping using CZE. The commonly adopted conditions for peptide mapping using CZE are strongly acidic buffers (pH 2-2.5) in uncoated capillaries. At low pH the majority of the peptides are positively charged and migrate toward the cathode. In addition, at this pH the negative charge of silanol groups on the capillary wall is negligible thus minimizing peptide-silica surface interaction [MI. However, satisfactory separation is not always obtained using acidic buffers and the conductivity of the buffer for these separations is generally excessively high permitting only application of low voltages with resultant long analysis times. Moreover, even under acidic conditions, the more basic peptides still tend to bind to the residual negative charges on the capillary, reducing the efficiency of separation. An alternative is to perform the CE separation under alkaline conditions [155, 1561 or to use micellar buffer systems [157]. It is assumed that at alkaline pH both peptides and the silica surface of the capillary are negatively charged, reducing electrostatic interactions. However, the high EOF generated are often detrimental to resolution. In an attempt to overcome these limitations, various permanent or dynamic coatings have been reported for peptide mapping. The most common permanent coatings employed for protein and peptide separation were recently summarized in a review [63] and will not therefore be described in the present review. Other strategies include the addition of ion pairing agents in the buffer such as phytic acid [158, 1591, tetramethylammonium bromide [160] or heptane sufonic acid [161, 1621. Very recently, Capelli et al. [1631 presented a novel alternative to achieve separations under acidic conditions (pH 2.8-3.1) in the presence of isoelectric buffers, ensuring much lower conductivities and allowing high voltages to be applied with dramatically reduced analysis time.
Nielsen et al. [164] showed that HPLC and CZE displayed marked differences in selectivity for the separation of the tryptic peptides from an human growth hormone produced by rDNA-technology. Elution in RP-HPLC was mainly related to the relative hydrophobicity of the fragments while the peak order in CZE was predominantly determined by charge, with some dependence on size and hydrophobicity. Rudnick et al. [165] also compared the tryptic map of the recombinant IGF-I obtained by CZE in a citrate buffer, pH 2.5, or HPLC, also stressing the great differences in selectivity. It appears that CZE is a useful tool for both structural and purity confirmation in peptide mapping experiments and the differences in selectivity make it complementary to HPLC. The proteolytic digest of the recombinant DSPAal expressed in CHO cells was analyzed using a phosphate deactivated capillary with an extended light path (bubble cell) and a phosphate buffer, pH 2.4, containing 100 ~lul NaCl. The usefulness of CE relies on the possibility to reanalyze the HPLC fractions with an orthogonality of the separation mechanism [166]. In many cases, CZE and conventional HPLC are complementary for
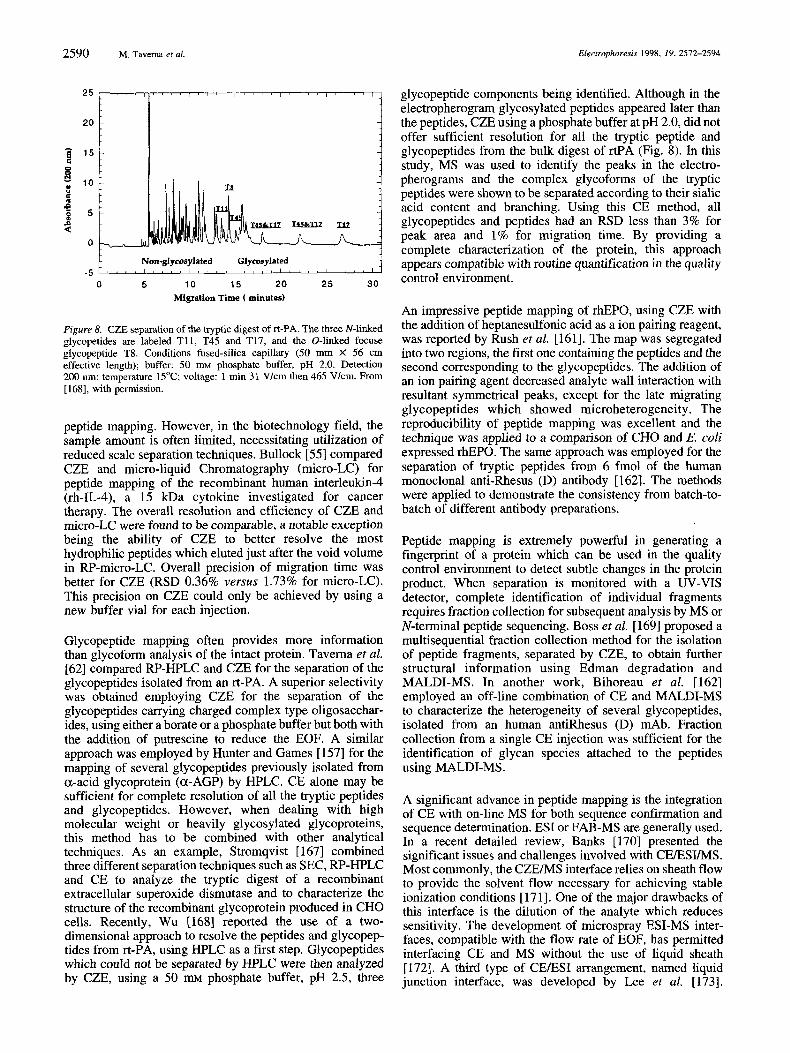
2590 M. Taverna et al. Electrophoresis 1998, 19, 2572-2594
Non-glycosylated Glycosylated -5 ~ ~ ' ' ~ ' ~ " 1 ~ ' ' ' 1 " ' ' ' " ' ' ~ ' ' " 1
Migration Time ( minutes) 0 5 10 15 20 25 30
Figure 8. CZE separation of the tryptic digest of a-PA. The three N-linked glycopetides are labeled T11, T45 and T17, and the 0-linked focuse glycopeptide T8. Conditions fused-silica capillary (SO mrn X 56 crn effective length); buffer: 50 m~ phosphate buffer, pH 2.0. Detection 200 nm; temperature 15°C; voltage: 1 min 31 Vlcm then 465 Vkm. From [168], with permission.
peptide mapping. However, in the biotechnology field, the sample amount is often limited, necessitating utilization of reduced scale separation techniques. Bullock [ S S ] compared CZE and micro-liquid Chromatography (micro-LC) for peptide mapping of the recombinant human interleukin-4 (rh-IL-4), a 15 kDa cytokine investigated for cancer therapy. The overall resolution and efficiency of CZE and micro-LC were found to be comparable, a notable exception being the ability of CZE to better resolve the most hydrophilic peptides which eluted just after the void volume in RP-micro-LC. Overall precision of migration time was better for CZE (RSD 0.36% versus 1.73% for micro-LC). This precision on CZE could only be achieved by using a new buffer vial for each injection.
Glycopeptide mapping often provides more information than glycoform analysis of the intact protein. Taverna et al. [62] compared RP-HPLC and CZE for the separation of the glycopeptides isolated from an rt-PA. A superior selectivity was obtained employing CZE for the separation of the glycopeptides carrying charged complex type oligosacchar- ides, using either a borate or a phosphate buffer but both with the addition of putrescine to reduce the EOF. A similar approach was employed by Hunter and Games [ 1571 for the mapping of several glycopeptides previously isolated from a-acid glycoprotein (a-AGP) by HPLC. CE alone may be sufficient for complete resolution of all the tryptic peptides and glycopeptides. However, when dealing with high molecular weight or heavily glycosylated glycoproteins, this method has to be combined with other analytical techniques. As an example, Stromqvist [ 1671 combined three different separation techniques such as SEC, RP-HPLC and CE to analyze the tryptic digest of a recombinant extracellular superoxide dismutase and to characterize the structure of the recombinant glycoprotein produced in CHO cells. Recently, Wu [168] reported the use of a two- dimensional approach to resolve the peptides and glycopep- tides from rt-PA, using HPLC as a first step. Glycopeptides which could not be separated by HPLC were then analyzed by CZE, using a 50 m~ phosphate buffer, pH 2.5, three
glycopeptide components being identified. Although in the electropherogram glycosylated peptides appeared later than the peptides, CZE using a phosphate buffer at pH 2.0, did not offer sufficient resolution for all the tryptic peptide and glycopeptides from the bulk digest of rtPA (Fig. 8). In this study, MS was used to identify the peaks in the electro- pherograms and the complex glycoforms of the tryptic peptides were shown to be separated according to their sialic acid content and branching. Using this CE method, all glycopeptides and peptides had an RSD less than 3% for peak area and 1% for migration time. By providing a complete characterization of the protein, this approach appears compatible with routine quantification in the quality control environment.
An impressive peptide mapping of rhEPO, using CZE with the addition of heptanesulfonic acid as a ion pairing reagent, was reported by Rush et al. [161]. The map was segregated into two regions, the first one containing the peptides and the second corresponding to the glycopeptides. The addition of an ion pairing agent decreased analyte wall interaction with resultant symmetrical peaks, except for the late migrating glycopeptides which showed microheterogeneity. The reproducibility of peptide mapping was excellent and the technique was applied to a comparison of CHO and E. coli expressed rhEPO. The same approach was employed for the separation of tryptic peptides from 6 fmol of the human monoclonal anti-Rhesus (D) antibody [ 1621. The methods were applied to demonstrate the consistency from batch-to- batch of different antibody preparations.
Peptide mapping is extremely powerful in generating a fingerprint of a protein which can be used in the quality control environment to detect subtle changes in the protein product. When separation is monitored with a UV-VIS detector, complete identification of individual fragments requires fraction collection for subsequent analysis by MS or N-terminal peptide sequencing. Boss et al. [ 1691 proposed a multisequential fraction collection method for the isolation of peptide fragments, separated by CZE, to obtain further structural information using Edman degradation and MALDI-MS. In another work, Bihoreau et al. [162] employed an off-line combination of CE and MALDI-MS to characterize the heterogeneity of several glycopeptides, isolated from an human antiRhesus (D) mAb. Fraction collection from a single CE injection was sufficient for the identification of glycan species attached to the peptides using MALDI-MS.
A significant advance in peptide mapping is the integration of CE with on-line MS for both sequence confirmation and sequence determination. ESI or FAB-MS are generally used. In a recent detailed review, Banks [170] presented the significant issues and challenges involved with CEESUMS. Most commonly, the CZE/MS interface relies on sheath flow to provide the solvent flow necessary for achieving stable ionization conditions [171]. One of the major drawbacks of this interface is the dilution of the analyte which reduces sensitivity. The development of microspray ESI-MS inter- faces, compatible with the flow rate of EOF, has permitted interfacing CE and MS without the use of liquid sheath [172]. A third type of CEESI arrangement, named liquid junction interface, was developed by Lee et al. [173].

Electrophoresis 1998, 19, 2512-2594 Electrophoresis of recombinant glycoproteins 2591
Table 2. Applications of on-line CE-MS for peptide mapping of proteins and glycoproteins
Protein Coupling mode References
RNase B Equine cytochrome c
Bovine cytochrome c Bovine candida Krusei Human hemoglobin P-Lactoglobulin
a- and P-Chains hemoglobulin Ovalbumin Horseradish peroxidase Erythrina corallodendron Bovine serum albumin
rhGH Plant lectin from Phaseolus vulaaris
CE-ESI-MS CE-ESI-MS CZE-CF-FAB CE-ESI-IT/reTOF CE-ESI-MS CE-API-MS-MS
CE-ESI-IT/reTOF
CZE-MS-MS CE-ESI-IT/reTOF C E - E S I - M S
CE-ESI-MS CZE-ESI-MS
CZE-CF-FAB-MS
CZE-ESI-MS
CE-ESI-MS
CZE-MS-MS CZE-CF-FAB CZFdES-MS
Although CEMS provides high efficiency combined with high information content, this technique has as yet been relatively unexploited for the analysis of DNA recombinant glycoproteins and most of the literature published on this topic is concerned with well-characterized proteins. Table 2 summarizes the various applications reporting of on-line coupling of CE with MS for the analysis of such glycoproteins.
Many authors have reported the resolution of complex peptide mixtures using CE and UV detection at low wavelengths. Although the use of capillaries with extended light path, using bubble cells [ 1661 or optical Z-cells [ 1621, has permitted an increase in the level of detection, this method still suffers from low sensitivity and lack of specificity. A few reports have focused on the development of new detection methods to enhance the sensitivity of peptides and glycopeptides. Novotny's group [ 1741 proposed the selective derivatization of arginine containing peptides with a fluorescent tag to achieve high sensitivity peptide mapping by CE. This approach would also offer the advantage of reducing the complexity of the peptide map of large proteins, facilitating their interpretation. An alternate approach which employed pulsed electrochemical detection (PED) was presented by Weber and Lunte [ 1751. UV and PED detection were compared for the separation of four glycopeptides, isolated from a recombinant coagulation factor VII. The use of the UV detection at low wavelength which allows the detection of both peptides and glycopep- tides was useful to detect contaminating peptides in the glycopeptide fractions isolated by RP-HPLC. CZE-PED was particularly useful to analyze the glycopeptides subjected to glycosidic digestion. In contrast to CZE-UV, CZE-PED was able to detect both the parent peptide and its attached oligosaccharide chain after PNGase F digestion of the glycopeptides. Detection by PED of carbohydrates requires relatively high pH to achieve good sensitivities but alkaline pH values are generally unsuitable for efficient CZE separation due to excessive EOF and Joule heating. A 17 mM borate buffer, pH 9.4 was found to represent a good
compromise between high efficiency and high sensitivity. Weber et al. [ 1761 have demonstrated the benefit of CE-PED in the analysis of a tryptic digest of rtPA. Moreover, structural information on the peptides, such as glycosylation could be deduced by applying different detection potentials. Peaks in the peptide map exhibiting a higher ratio of response following the increase of the detection potential were attributed to fragments containing a higher ratio of hydroxyl to amino groups, as glycosylated peptides.
On-line peptide mapping, performed with an enzyme modified fused-silica microreactor integrated with a CZE separation capillary, was also described and applied to p- casein [177] or a-AGP [178]. The main advantage of this technique is that typical problems with protein digestions, including sample loss and contamination, are overcome by performing both steps on-line.
5 Conclusion A wide variety of electrophoretic techniques have been successfully applied to the analysis of DNA-derived glycoproteins and although the efficiency of these tech- niques has improved each of these techniques alone is still inadequate for quality control of these complex macro- molecules. For glycoform analysis, conventional IEF techniques can provide a sensitive means for the detection of changes in the glycoprotein both in the peptide and oligosaccharide and in other posttranslational modifications. Application of immobilized pH gradients may further improve the reliability and resolution of IEF. CIEF affords the advantage of automation and high reproducibility. For even greater resolution IEF may be combined with PAGE in 2-D techniques, although at present this is not widely used in routine glycoprotein profiling. Optimized CZE and MEKC provide a most useful addition for monitoring glycoprotein production as well as for quality control. However, as recently pointed out by Buchacher et al. [ 1101, application of CE methods for routine analysis depends on the particular separation problem involved. CE techniques may also be applied for a comparative analysis of samples, once an optimized procedure has been developed. There are now many examples of the use of electrophoretic techniques in glycoform analysis and increasing use of such techniques may be expected.
For CE analysis of oligosaccharides, many of the initial problems of labeling and of reproducibility have now been overcome. Although some procedures are well established, for a particular type of profile further optimization is still required. PAGE of oligosaccharides along with fluorescent labelling is proving to be a convenient way of screening glycosylation profiles of recombinant glycoproteins. Finally electrophoretic techniques are capable of providing peptide maps, generating in some cases complementary information to HPLC mapping. A multidimensional approach may sometimes be required for complete characterization. It seems that with the advantages of high throughput and automation, CE will become an increasingly attractive technique for routine glycoprotein analysis.
Received September 29, 1998

Electrophoresis 1998, 19, 2512-2594 2592 M. Tavema et al.
6 References [I] Goochee, C. F., Gramer, M. J., Anderson, D. F., Bahr, J. B.,
Rasmussen, J. R., Biotechnology 1991, 9, 1347-1355. [21 Goochee, C. F., Gramer, M. J., Andersen, D. C., Bahr, J. B., Am.
Chem. SOC. 1992, 2, 199-240. [31 Andersen, D. C., Goochee, C. F., Curr. Opin. in Biotechnol. 1994,5,
546-549. [41 Warner, T. G., Chang, J., Ferrari, J., Harris, R., McNerney, T.,
Bennett, G., Burnier, J., Sliwkowski, M. B., Glycobiology 1993, 5, 455463.
[5] Braun, A., Gassmann, R., Kraus, K., Lorenzi, G., Weigel, U., Pharm. Acta Helv. 1996, 71, 447458.
[61 Bichsel, V. E., Curcio, V., Gassmann, R., Otto, H., Phunn. Acta Helv. 1996, 71, 439-446.
[71 Denton, K. A., Tate, S. A., J. Chromatogr. B 1997, 697, 111-121. [81 Teshima, G., Wu, S. L., Methods Enzymol. 1996, 271, 264-293. [91 Strege, M. A., Lagu, A. L., Electrophoresis 1997, 18, 2343-2352.
[lo] Schwer, C., Electrophoresis 1995, 16, 2121-2126. [ l l ] Righetti, P. G. (Ed.), Capillary Electrophoresis in Analytical
Biotechnology, CRC Press, New York 1996. [121 Wilkins, M. R., Sanchez, J. C., Williams, K. L., Hochstrasser, D. F.,
Electrophoresis 1996, 17, 830-838. [13] Righetti, P. G., Bossi, A., Anal. Biocheni, 1997, 247, 1-10. [141 Righetti, P. G., Bossi, A,, J. Chromatogr. B 1997, 699, 77-89. [15] Jackson, P., SOC. Biochem. Trans. 1993, 21, 121-125. U61 Starr, C. M., Masada, R. I., Hague, H., Skop, E., Klock, J. C.,
[171 El Rassi, Z., Electrophoresis 1997, 18, 2400-2407. [18] Gianazza, E., J. Chromatogr. A 1995, 705, 67-87. t191 Watts, N. R. M., Singh, R. P., Electrophoresis 1995, 16, 22-27. [201 Chen, A. B., Rickel, C. A., Flanigan, A,, Hunt, G., Moorhouse,
K. G . , J . C h r o m a t o g r . A 1996, 744, 279-284. [211 Mulders, J. W. M., Derksen, M., Swolfs, A., Maris, F., Biologicals
[221 Ackermann, M., Max, U., Jager, V., Biotechnol. Bioeng. 1995,45,
[23] Watson, E., Yao, F., Anal. Biochem. 1993, 210, 389-393. [241 Amdt, T., Hackler, R., Kleine, T. O., Gressner, A. M., Clin. Chem.
[251 Moorhouse, K. G., Eusehio, C. A., Hunt, G., Chen, A. B.,
[261 Hunt, G., Hotalong, T., Chen, A. B., J. Chromatogr. A 1996, 744,
[271 Wood, T. D., Chen, L. H., White, C. B., Babbitt, P. C., Kenyon, G. L., McLafferty, F. W., Proc. Nut. Acad. Sci. USA 1995, 92, 11451- 11455.
[281 Mozetic-Francky, B., Cotic, V., Ritonja, A,, Zerovnik, E., Francky, A., Protein Expres. Puri$ 1997, 9, 115-124.
[291 Arredondo-Peter, R., Moran, J. F., Sarath, G., Luan, P., Klucas, R . V . , P l a n t . P h y s i o l . 1 9 9 7 , 1 1 4 , 493-500.
[301 Yanase, H., Manning, L. R., Vandegriff, K., Winslow, R. M., Manning, J. M.;Protein Sci. 1995, 4, 21-28.
[311 Krasnewich, D. M., Holt, G. D., Brantly, M., Skovby, F., Redwine, J., Gahl, W. A., Glycobiology 1995, 5, 503-510.
[321 Schnierle, P., Hering, F., Seiler, H., Urol. Res. 1996, 24, 79-82. [331 Dejong, G., Feelders, R., Vannoort, W. L., Vaneijk, H. G.,
J. Chromatogr. A 1996, 720, 295-321.
1997, 25, 269-281.
97-106.
1998,44,27-34.
J. Chromatogr. A 1995, 717, 6149.
295-301.
Glycoconjugate J. 1995, 12, 219-226. [341 Righetti, P. G., Bossi, A., Wenisch, E., Orsini, G., J. Chromatogr. B
1997,699, 105-115. 1351 Breme, U., Breton, J., Visco, C., Orsini, G., Righetti, P. G.,
Electrophoresis 1995, 16, 138 1-1384. [361 Bossi, A., Righetti, P. G., Visco, C., Breme, U., Mauriello, M.,
Valsasina, B., Orsini, G., Wenisch, E., Electrophoresis 1996, 17, 932-937.
[371 Wenisch, E., Vorauer, K., Jungbauer, A,, Katinger, H., Righetti, P. G., Electrophoresis 1994, 15, 647453.
[381 Violand, B. N., Schlittler, M. R., Lawson, C. Q., Kane, J. F., Siege], N. R., Smith, C. E., Kolodziej, E. W., Duffin, K. L., Protein Sci. 1994.3, 1089-1097.
[391 Bischoff, R., Lepage, P., Jaquinod, M., Cauet, G., Acker-Klein, M., Clesse, D., Laporte, M., Bayol, A., Van Dorsselaer, A., Roitsch, C., Biochemistry 1993,32, 725-734.
1401 Ettori, C., Righetti, P. G., Chiesa, C., Frigerio, F., Galli, G., Grandi, G., J. Biotechnol. 1992, 25, 307-318.
[411 Bischoff, R., Roecklin, D., Roitsch, C., Electrophoresis 1992, 13, 2 14-2 19.
[42] Esteve-Romero, J., Simo-Alfonso, E., Bossi, A,, Bresciani, F., Righetti, P. G., Electrophoresis 1996, 17, 704-708.
[43] Rabilloud, T., Valette, C., Lawrence, J. J., Electrophoresis 1994, 15, 1552-1558.
[44] NGuyen, T. H., Ward, C., in: Wang, Y. J., Pearlman, R. (Eds.), StabiliQ and Characterization of Proteins and Peptide Drugs: Case Histories, Plenum Press, New York 1993, pp. 91-134.
[45] Gawlitzek, M., Valley, U., Nimtz, M., Wagner, R., Conradt, H. S., J. Biotechnol. 1995, 42, 117-131.
[461 Bae, C. S. , Yang, D. S., Chang, K. R., Seong, B. L., Lee, J., Biotechnol. Bioeng. 1998, 57, 600-609.
[471 Kuster, B., Wheeler, S. F., Hunter, A. P., Dwek, R. A., Harvey, D. J., Anal. Biochem. 1997, 250, 82-101.
[481 Harant, H., Wimmer, K., Wenisch, E., Strutzenberger, K., Reiter, M., Bluml, G., Gaida, T., Schmatz, C., Katinger, H., &totechnology 1992, 8:2, 119-127.
[491 Foster, D. N., Proudman, J. A., Harmon, S . A,, Foster, L. K., Comp. Biochem. Physiol. B Biochem. Mol. Biol. 1997, 117, 233-239.
[501 James, D. C., Freedman, R. B., Hoare, M., Jenkins, N., Anal. Biochem. 1994,222, 315-322.
[511 Andrieux, K., Olivier, J. C., Taverna, M., Vauthier, C., Couvreur, P., Ferrier, D., J. Liq. Chrom. Rel. Technol. 1996, 19, 3333-3353.
[521 Watson, E., Yao, F., Anal. Biochem. 1993, 210, 389-393. [531 Landers, J. P., Oda, R. P., Madden, B. J., Spelsberg, T. C., Anal.
[541 Bullock, J. A., Yuan, L. C., J. Microcolumn Sep. 1991, 3, 241-248. [551 Bullock, J. A., J. Chromatogr. 1993, 633, 235-244. [561 Morheck, D. E., Madden, B. J., Mc Cormick, D. J., J. Chromatogr. A
[571 Oda, R. P., Landers, J. P., Mol. Biotechnol. 1996, 5, 165-170. [581 Klausen, N. K., Komfelt, T., J. Chromatogr. A 1995, 718, 195-202. [591 Corradini, D., Cannarsa, G., Fabbri, E., Corradini, C., J. Chroma-
[601 Legaz, M. E., Pedrosa, M. M., J. Chromatogr. A 1996, 719,
1611 Watson, E., Yao, F., J . Chromutogr. 1993, 630, 442446. 1623 Taverna, M., Baillet, A., Biou, D., Schlutter, M., Werner, R., Fenier,
D., Electrophoresis 1992, 13, 359-366. [631 Szoko, E., Electrophoresis 1997, 18, 74-81. [641 Mc Connick, R. M., Anal. Chem. 1988, 60, 2322-2328. [651 Tran, A. D., Park, S., Lisi, P. J., Huynh, 0. T., Ryall, R., Lane, P. A,,
[661 Kats, M., Richberg, P. C., Hugues, D. E., Anal. Chem. 1995, 67,
Biochem. 1992, 205, 115-124.
1994, 680, 217-224.
togr. A 1995, 709, 127-134.
159-170.
J . Chromatogr. A 1991, 542, 459471.
2943-2948. [671 Kats, M., Richberg, P. C., Hugues, D. E., J. Chromatogr. A 1997,
766, 205-213. [681 Nashabeh, W., Greve, K. F., Kirby, D., Foret, F., Karger, B. L., Anal.
[691 Reif, 0. W., Freitag, R., J. Chromatogr. 1994, 680, 383-394. [701 Pedersen, I.,. Biedetman, K., Biotechnol. Appl. Biochem. 1993, 18,
[711 Kopp, K.,. Schlutter, M., Werner, R. G., Arzneim.Forsch./Drug Res.
[721 Roddy, T. P., Molnar, T. E., Mc Kern, R. E., Foley, J. P.,
[731 Kundu, S., Fenters, C., Lopez, M., Calfin, B., Winkler, M., Robey,
[741 Hoffstetter-Kuhn, S., Alt, G., Kuhn, R., Electrophoresis 1996, 17,
[751 Yao, Y. J., Loh, K. C., Chung, M. C. M., Li, S. F. Y., Electro-
[761 Klyushnichenko, V., Kula, M. R., Electrophoresis 1997, 18,
[77] Bietlot, H. P., Girard, M., J. Chromatogr. A 1997, 759, 177-184. [781 Yowell, G. G., Fazio, S. D., Vivilecchia, R. V.., J . Chromatogr. A
[791 Knuver-Hopf, J., Mob, H., J . Chromatogr. A 1995, 717, 71-74. [801 Mc Nerney, T. M., Watson, S. K., Sim, J. H., Bridenbaugh, R. L.,
Chem. 1994, 66, 2148-2154.
377-388.
1996, 46, 1191-1196.
J. Chromatogr. B 1997, 695, 49-58.
W. G., J. Capil. Electrophor. 1996, 6, 301-307.
418422.
phoresis 1995, 16, 647-653.
20 19-2023.
1993,652, 215-224.
J . Chromatogr. A 1996, 744, 223-229.
Electrophoresis 1998, 19, 2512-2594 Electrophoresis of recombinant glycoproteins 2593
[81] Thorne, J. M., Goetzinger, W. K., Chen, A. B., Moorhouse, K. G.,
[82] Chakel, J. A,, Pungor, Jr, E., Hancock, W. S., Swedberg, S. A,,
[83] Yeung, B., Porter, T. J., Vath, J. E., Anal. Chem. 1997, 69,
[84] Conti, M., Galassi, M., Bossi, A,, Righetti, P. G., J. Chromatogr. A
[85] Klepamik, K., Slais, K., Bocek, P., Electrophoresis 1993, 14,
[86] Yao, Y. J., Khoo, K. S., Chung, M. C. M., Li, S. F. Y., J. Chroma-
[87] Rodriguez-Diaz, R., Zhu, M., Wehr, T., J. Chromatogr. A 1997, 772,
[88] Rodriguez-Diaz, R., Web, T., Zhu, M., Electrophoresis 1997, 18,
[89] Kobayashi, H., Aoki, M., Suzuki, M., Yanagisawa, A., Arai, E.,
[90] Shimura, H., Kasai, K., Electrophoresis 1995, 16, 1479-1484. [91] Kilar, F., J. Chromatogr. 1991, 545, 403406. [92] Stoyanov, A. V., Righetti, P. G., Electrophoresis 1997, 18,
[93] Conti, M., Gelfi, C., Bosisio, A. B., Righetti, P. G., Electrophoresis
[94] Manabe, T., Miyamoto, H., Iwasaki, A,, Electrophoresis 1997, 18,
[95] Tang, Q., Lee, C. S., J . Chromatogr. A 1997, 781, 113-118. [96] Minarik, M., Groiss, F., Gas, B., Blaas, D., Kenndler, E.,
[97] Rabilloud, T., Electrophoresis 1996, 17, 813-829. [98] Schmerr, M. J., Cutlip, R. C., Jenny, A,, J. Chromatogr. A 1998,802,
[99] Righetti, P. G., Gelfi, C., Conti, M., J. Chromatogr. B 1997, 699,
[lo01 Righetti, P. G., Bossi, A,, Gelfi, C., J. Capil. Electrophor. 1997, 004,
[ 1011 Roche, M. E., Oda, R. P., Landers, J. P., Biotechnol. Prog. 1997,13,
[lo21 Pritchett, T. J., Electrophoresis 1996, 17, 1195-1201. [lo31 Liu, X., Sosic, Z., Krull, I. S., J. Chromatogr. A 1996, 735, 165-190. [lo41 Steinmann, L., Mosher, R. A,, Thormann, W., J. Chromatogr. A
[lo51 Moorhouse, K. G., Rickel, C. A,, Chen, A. B., Electrophoresis 1996,
[lo61 Kubach, J., G r i m , R., J. Chromatogr. A 1996, 737, 281-289. [lo71 Hunt, G., Hotaling, T., Chen, A. B., J. Chromatogr. A 1998, 800,
[lo81 Lee, H. G., J. Chromatogr. A 1997, 790, 215-223. [I091 Veillon, J. F., Ramon, C., Bihoreau, N., in: Parvez, H., Caudy, P.,
Parvez, S., Roland-Gosselin, P. (Eds.), Progress in HPLC-HPCE, VSP, Utrecht 1997, pp. 155-172.
[ I101 Buchacher, A., Schulz, P., Choromanski, J., Schwinn, H., Josic, D., J. Chromatogr. A 1998, 802, 355-366.
[111] Yang, L., Tang, Q., Harrata, A. K., Lee, C. S.,Anal. Biochem. 1996, 243, 14G149.
[112] Cohen, A. S., Karger, B. L., J . Chromatogr. 1987, 397, 409-417. [ 1131 Ganzler, K., Greve, K. S., Cohen, A. S., Karger, B. L., Guttman, A,,
Cooke, N. C., Anal. Chem. 1992, 64, 2665-2671. [114] Wu, D., Regnier, F. E., J. Chromatogr. 1992, 608, 349-356. [115] Tsuji, K., J . Chromatogr. B 1994, 662, 291-299. [116] Benedek, K., Thiede, S., J. Chromatogr. A 1994, 676, 209-217. [117] Fergusson, K. A., Metabolism 1964, 13, 985-1002. [118] Werner, W. E., Demorest, D. M., Wiktorowicz, J. E., Electrophore-
[119] Guttman, A,, Nolan, J. A., Cooke, N., J. Chromatogr. 1993, 632,
[120] Hjertin, S., Kubo, K., Electrophoresis 1993, 14, 390-395. [I211 El Rassi, Z., Mechref, Y., Electrophoresis 1996, 17, 275-301. [122] Oefner, P. J., Chiesa, C., Glycobiology 1994, 4, 397412. [123] Honda, S., J. Chromatogr. A 1996, 720, 337-351. [124] Chiesa, C., ONeill, R. A., Horvath, C. G., Oefner, P. J., Righetti,
P. G., in: Righetti, P, G. (Ed.), Capillary Electrophoresis in Analytical Biotechnology, CRC Press, New York 1996, pp. 343-392.
Karger, B. L., J. Chromatogr. A 1996, 744, 155-165.
J . Chromatogr. B 1997, 689, 215-220.
25 10-2516.
1997, 757, 237-245.
475479.
togr. A 1994, 680, 431-435.
145-160.
21342144.
J . Chromatogr. A 1997, 772, 137-144.
1944-1950.
1996, 17, 1590-1596.
92-97.
J . Chromatogr. A 1996, 738, 123-128.
135-141.
9 1-104.
47-59.
659-668.
1996, 756, 219-232.
17, 423430.
355-367.
sis 1993, 14, 759-763.
171-175.
[125] Hase, S., J. Chromatogr. A 1996, 720, 173-182.
[I261 Paulus, A,, Klockow, A., J. Chromatogr. A 1996, 720, 353-376. [127] Honda, S., Iwase, S., Makino, A., Fujiwara, S., Anal. Biochem. 1989,
[128] Honda, S., Makini, A,, Suzuki, S., Kakehi, K., Anal. Biochem. 1990,
[I291 Nashabeh, W., El Rassi, Z., J. Chromatogr. 1992, 600, 279-287. [130] Sudor, J., Novotny, M. V., Anal. Biochem. 1995, 67, 42054209. [131] Liu, J., Shirota, O., Wiesler, D., Novotny, M., Proc. Natl. Acad. Sci.
[132] Honda, S. , J. Chromatogr. 1992, 608, 289-295. [133] Greenaway, M., Okafo, N. O., Camillieri, P., Dhanak, D., J. Chem.
SOC. Chem. Commun. 1994, 1691-1692. [134] Camillieri, P., Harland, G. B., Okafo, G., Anal. Biochem. 1995,230,
115-122. [135] Chiesa, C., ONeill, R. A,, Electrophoresis 1994, 15, 1132-1140. [136] Guttman, A,, Chen, F. T. A,, Evanlegista, R. A,, Cooke, N., Anal.
[137] Guttman, A., Chen, F. T. A., Evanlegista, R. A,, Electrophoresis
[138] Evanlegista, R. A., Chen, F. T. A,, Guttman, A,, J. Chromatogr. A
[139] Taverna, M., Baillet, A,, Baylocq-Ferrier, D., Chromatographia
[I401 Taverna, M., Baillet, A,, Schluter, M., Baylocq-Femer, D., Biomed.
[141] Tran, N. T., Taverna, M., Deschamps, F. S., Morin, P., Ferrier, D.,
[142] Hugues, D. E., J. Chromatogr. B 1994, 657, 315-326. [143] Guttman, A,, Starr, C., Electrophoresis 1995, 16, 993-997. [144) Jackson, P., Method Enzymol. 1994, 230, 250-256. [145] Hu, G. F., J. Chromatogr. A 1995, 705, 89-103. [146] Bigge, J. C., Patel, T. P., Brice, J. A., Goulding, P. N., Charles,
S. M., Parekh, R. B., Anal. Biochem. 1995, 230, 229-238. [147] Jackson, P. in: Jackson, P., Gallagher, J. T. (Eds.), A Laboratory
Guide to Glycoconjugate Analysis, Birkhauser Verlag, Basel 1998,
[148] Klock, J. C., Starr, C. M. in: Hounsel, E. F. (Ed.), Methods in Molecular Biology, Vol. 76, Humana Press, Totowa 1998, pp.
[I491 Monica, T. J., Williams, S. B., Goochee, C. F., Maiorella, B. L., Glycobiology 1995, 5:2, 175-185.
[150] Kumar, H. P., Hague, C., Haley, T., Starr, C. M., Besman, M. J., Lundblad, R. L., Baker, D., Biotechnol. Appl. Biochem. 1996, 3,
I1511 Friedman, Y., Higgins, E. A,, Anal. Biochem. 1995, 228,
[152] Jackson, P., Biochem. J. 1990, 270, 705-713. [153] Masada, R. I., Skop, E., Starr, C. M., Biotechnol. Appl. Biochem.
[154] Frears, E. R., Axford, J., Biochem. SOC. Trans. 1997, 25, S662. [155] Zhu, M., Rodriguez, R., Hansen, D., Wehr, T., J. Chromatogr. 1990,
[156] Nielsen, R. G., Rickard, E. C., J. Chromatogr. 1990, 516, 99-114. [157] Hunter, A. P., Games, D., Rapid Comm. Mass Spectrom. 1995, 9,
[158] Okafo, G. N., Birell, H. C., Greenaway, M., Haran, M., Camillieri,
[159] Kornfelt, T., Vinther, A., Okafo, G. N., Camillieri, P.,
[160] Nashabeh, W., El Rassi, Z., J. Chromatogr. 1991, 536, 3142. [161] Rush, R. S., Derby, P. L., Suickland, T. W., Rohde, M. F., Anal.
[162] Bihoreau, N., Ramon, C., Lazard, M., Schmitter, I. M.,
[I631 Capelli, L., Stoyanov, A. V., Wajcman, H., Righetti, P. G.,
[I641 Nielsen, R. G., Riggin, R. M., Rickard, E. C., J. Chromatogr. 1989,
[165] Rudnick, S. E., Hiker Jr., V. J., Worosila, G. D., J. Chromatogr. A
[166] Appfel, A., Chakel, J., Udiavar, S., Hancock, W. S., Souders, C.,
[167] Stromqvist, M., J. Chromatogr. A 1994, 667, 304-310. [168] Wu, S. L., Anal. Biochem. 1997,253, 85-97.
176, 72-77.
191, 228-234.
USA 1991.88, 2302-2306.
Biochem. 1996,233, 234-242.
1996, 17, 412-417.
1996, 745, 273-280.
1993,37,415-422.
Chromatogr. 1995, 9, 59-67.
Electrophoresis 1998, 19, 2630-2638.
pp. 113-140.
115-129.
207-216.
22 1-225.
1996, 24, 195-205.
516, 123-131.
42-56.
P., Anal. Biochem. 1994, 219, 201-206.
J. Chromatogr. A 1996, 726, 223-228.
Chem. 1993, 65, 1834-1842.
J. Chromatogr. B 1997, 697, 123-133.
J. Chromatogr. A 1997, 791, 313-322.
480, 393401.
1994, 672, 219-229.
Pungor Jr., E., J. Chromatogr. A 1995, 717, 41-60.

2594 M. Taverna et al. Electrophoresis 1998, 19, 2572-2594
[I691 Boss, H. J., Rohde, M. F., Rush, R. S., Anal. Biochem. 1995, 230,
[170] Banks, J. F., Electrophoresis 1997, 18, 2255-2266. [1711 Smith, R. D., Barinaga, C. J., Udseth, H. R., Anal. Chem. 1988, 60,
[172] Wahl, J. H., Gale, D. C., Smith, R. D., J. Chromatogr. A 1994,659,
[173] Lee, E. D., Muck, W., Henion, J. D., Covey, T. R., J. Chromatogr.
[174] Cobb, K. A., Novotny, M. V., Anal. Chem. 1992, 64, 879-886. [175] Weber, P. L., Kornfelt, T., Klausen, N. K., Lunte, S. M., Anal.
[1761 Weber, P. L., Lunte, S. M., Electrophoresis 1996, 17,
[1771 Amankwa, L. N., Kuhr, W. G., Anal. Chem. 1993, 65, 2993-2697. [178] Licklider, L., Kuhr, W. G., Anal. Chem. 1994, 66, 4 4 0 W 7 .
123-129.
1948-1952.
217-222.
1988,458, 313-321.
Biochem. 1995, 225, 135-142.
302-309.
[1791 Kelly, J. F., Locke, S. J., Ramaley, L. R:, Thibault, P., J. Chromtogr. A 1996, 720,409-427.
[180] Caprioli, R. M., Moore, W. T., Martin, M., DaGue, B. B., Wilson, W., Moring, S., J . Chromatogr. 1989, 480, 247-257.
[181] Wu, J. T., Qian, M. G., Li, M. X., Liu, L., Lubman, D. M., Anal. Chem. 1996, 68, 3388-3396.
[182] Johansson, I. M., Huang, E. C., Henion, J. D., Zweigenbaum, J., J. Chromatogr. 1991, 554, 311-327.
“31 Suter, M. J. F., DaGue, B. B., Moore, W. T., Lin, S. N., Caprioli, R . M . , J . C h r o m a t o g r . 1991, 5 5 3 , 101-116.
[184] Figeys, D., Oosteven, I. V., Ducret, A,, Aebersold, R., Anal. Chem.
[185] Li, M. X., Liu, L., Wu, J. T., Lubman, D. M., Anal. Chem. 1997,69,
[186] Bateman, K. P., White, R. L., Thibault, P., Rapid Comm. Mass
1996, 68, 1822-1828.
245 1-2456.
Spectrom. 1997, 11, 307-315.