Electronic Sensors for Assessing Interactions between Healthcare Workers and Patients under Airborne...
7
Electronic Sensors for Assessing Interactions between Healthcare Workers and Patients under Airborne Precautions Jean-Christophe Lucet 1,2 *, Ce ´ dric Laouenan 2,3,4 , Guillaume Chelius 5 , Nicolas Veziris 6,7 , Didier Lepelletier 1¤ , Adrien Friggeri 5 , Dominique Abiteboul 8 , Elisabeth Bouvet 2,9 , France Mentre 2,3,4 , Eric Fleury 5 1 Infection Control Unit, Bichat-Claude Bernard Hospital, Assistance Publique-Ho ˆ pitaux de Paris, Paris, France, 2 Univ Paris Diderot, Sorbonne Paris Cite ´, Paris, France, 3 Institut National de la Sante ´ et de la Recherche Me ´ dicale U738, Paris, France, 4 Service de Biostatistiques, Bichat-Claude Bernard Hospital, Assistance Publique-Ho ˆ pitaux de Paris, Paris, France, 5 Laboratoire de l’Informatique du Paralle ´ lisme, Unite ´ Mixte de Recherche 5668, Ecole Normale Supe ´ rieure, Institut National de Recherche en Informatique Applique ´ e, Universite ´ Claude Bernard 1, Lyon, France, 6 Equipe d’Accueil 1541, Universite ´ Pierre et Marie Curie, Paris, France, 7 Laboratoire de Bacte ´ riologie- Hygie `ne et Centre National de Re ´fe ´rence des Mycobacte ´ries et de la Re ´sistance des Mycobacte ´ries aux Antituberculeux, Ho ˆ pital Pitie ´ -Salpe ˆtrie `re, Assistance Publique- Ho ˆ pitaux de Paris, Paris, France, 8 Department of Occupational Health, Bichat-Claude Bernard Hospital, Assistance Publique-Ho ˆ pitaux de Paris, Paris, France, 9 Infectious Diseases Department, Bichat-Claude Bernard Hospital, Assistance Publique-Ho ˆ pitaux de Paris, Paris, France Abstract Background: Direct observation has been widely used to assess interactions between healthcare workers (HCWs) and patients but is time-consuming and feasible only over short periods. We used a Radio Frequency Identification Device (RFID) system to automatically measure HCW-patient interactions. Methods: We equipped 50 patient rooms with fixed sensors and 111 HCW volunteers with mobile sensors in two clinical wards of two hospitals. For 3 months, we recorded all interactions between HCWs and 54 patients under airborne precautions for suspected (n = 40) or confirmed (n = 14) tuberculosis. Number and duration of HCW entries into patient rooms were collected daily. Concomitantly, we directly observed room entries and interviewed HCWs to evaluate their self- perception of the number and duration of contacts with tuberculosis patients. Results: After signal reconstruction, 5490 interactions were recorded between 82 HCWs and 54 tuberculosis patients during 404 days of airborne isolation. Median (interquartile range) interaction duration was 2.1 (0.8–4.4) min overall, 2.3 (0.8–5.0) in the mornings, 1.8 (0.8–3.7) in the afternoons, and 2.0 (0.7–4.3) at night (P,10 24 ). Number of interactions/day/HCW was 3.0 (1.0–6.0) and total daily duration was 7.6 (2.4–22.5) min. Durations estimated from 28 direct observations and 26 interviews were not significantly different from those recorded by the network. Conclusions: The RFID was well accepted by HCWs. This original technique holds promise for accurately and continuously measuring interactions between HCWs and patients, as a less resource-consuming substitute for direct observation. The results could be used to model the transmission of significant pathogens. HCW perceptions of interactions with patients accurately reflected reality. Citation: Lucet J-C, Laouenan C, Chelius G, Veziris N, Lepelletier D, et al. (2012) Electronic Sensors for Assessing Interactions between Healthcare Workers and Patients under Airborne Precautions. PLoS ONE 7(5): e37893. doi:10.1371/journal.pone.0037893 Editor: Vittoria Colizza, INSERM & Universite Pierre et Marie Curie, France Received February 28, 2012; Accepted April 30, 2012; Published May 25, 2012 Copyright: ß 2012 Lucet et al. This is an open-access article distributed under the terms of the Creative Commons Attribution License, which permits unrestricted use, distribution, and reproduction in any medium, provided the original author and source are credited. Funding: This work was supported by a public grant from the French National Agency for Food, Environmental and Occupational Health Safety (ANSES/AFSSET, EST 2007-50). The funders had no role in study design, data collection and analysis, decision to publish, or preparation of the manuscript. Competing Interests: The authors have declared that no competing interests exist. * E-mail: [email protected] ¤ Current address: Bacteriology and Hygiene Department, Nantes University Hospital, and University of Nantes - EA, UFR Medicine, Nantes, France Introduction Most of the published data on interactions between patients and healthcare workers (HCWs) in the hospital were obtained by direct observation of samples of patients and/or HCWs. Direct observation is tedious, time-consuming, and costly and is therefore feasible only over short periods. Therefore, the results may fail to accurately reflect interactions between patients and HCWs. Despite progress in prevention and treatment, tuberculosis (TB) remains a major public health problem in the developing world. In industrialized countries, the incidence of TB is declining and public health authorities now focus on specific interventions such as early diagnosis and treatment or contact detection when a TB case is identified. Improvements in TB infection control in hospitals over the last two decades [1] have decreased the incidence of HCW contamination due to contact with TB patients [2]. PLoS ONE | www.plosone.org 1 May 2012 | Volume 7 | Issue 5 | e37893
-
Upload
independent -
Category
Documents
-
view
2 -
download
0
Transcript of Electronic Sensors for Assessing Interactions between Healthcare Workers and Patients under Airborne...

Electronic Sensors for Assessing Interactions betweenHealthcare Workers and Patients under AirbornePrecautionsJean-Christophe Lucet1,2*, Cedric Laouenan2,3,4, Guillaume Chelius5, Nicolas Veziris6,7,
Didier Lepelletier1¤, Adrien Friggeri5, Dominique Abiteboul8, Elisabeth Bouvet2,9, France Mentre2,3,4,
Eric Fleury5
1 Infection Control Unit, Bichat-Claude Bernard Hospital, Assistance Publique-Hopitaux de Paris, Paris, France, 2Univ Paris Diderot, Sorbonne Paris Cite, Paris, France,
3 Institut National de la Sante et de la Recherche Medicale U738, Paris, France, 4 Service de Biostatistiques, Bichat-Claude Bernard Hospital, Assistance Publique-Hopitaux
de Paris, Paris, France, 5 Laboratoire de l’Informatique du Parallelisme, Unite Mixte de Recherche 5668, Ecole Normale Superieure, Institut National de Recherche en
Informatique Appliquee, Universite Claude Bernard 1, Lyon, France, 6 Equipe d’Accueil 1541, Universite Pierre et Marie Curie, Paris, France, 7 Laboratoire de Bacteriologie-
Hygiene et Centre National de Reference des Mycobacteries et de la Resistance des Mycobacteries aux Antituberculeux, Hopital Pitie-Salpetriere, Assistance Publique-
Hopitaux de Paris, Paris, France, 8Department of Occupational Health, Bichat-Claude Bernard Hospital, Assistance Publique-Hopitaux de Paris, Paris, France, 9 Infectious
Diseases Department, Bichat-Claude Bernard Hospital, Assistance Publique-Hopitaux de Paris, Paris, France
Abstract
Background: Direct observation has been widely used to assess interactions between healthcare workers (HCWs) andpatients but is time-consuming and feasible only over short periods. We used a Radio Frequency Identification Device (RFID)system to automatically measure HCW-patient interactions.
Methods: We equipped 50 patient rooms with fixed sensors and 111 HCW volunteers with mobile sensors in two clinicalwards of two hospitals. For 3 months, we recorded all interactions between HCWs and 54 patients under airborneprecautions for suspected (n = 40) or confirmed (n = 14) tuberculosis. Number and duration of HCW entries into patientrooms were collected daily. Concomitantly, we directly observed room entries and interviewed HCWs to evaluate their self-perception of the number and duration of contacts with tuberculosis patients.
Results: After signal reconstruction, 5490 interactions were recorded between 82 HCWs and 54 tuberculosis patients during404 days of airborne isolation. Median (interquartile range) interaction duration was 2.1 (0.8–4.4) min overall, 2.3 (0.8–5.0) inthe mornings, 1.8 (0.8–3.7) in the afternoons, and 2.0 (0.7–4.3) at night (P,1024). Number of interactions/day/HCW was 3.0(1.0–6.0) and total daily duration was 7.6 (2.4–22.5) min. Durations estimated from 28 direct observations and 26 interviewswere not significantly different from those recorded by the network.
Conclusions: The RFID was well accepted by HCWs. This original technique holds promise for accurately and continuouslymeasuring interactions between HCWs and patients, as a less resource-consuming substitute for direct observation. Theresults could be used to model the transmission of significant pathogens. HCW perceptions of interactions with patientsaccurately reflected reality.
Citation: Lucet J-C, Laouenan C, Chelius G, Veziris N, Lepelletier D, et al. (2012) Electronic Sensors for Assessing Interactions between Healthcare Workers andPatients under Airborne Precautions. PLoS ONE 7(5): e37893. doi:10.1371/journal.pone.0037893
Editor: Vittoria Colizza, INSERM & Universite Pierre et Marie Curie, France
Received February 28, 2012; Accepted April 30, 2012; Published May 25, 2012
Copyright: � 2012 Lucet et al. This is an open-access article distributed under the terms of the Creative Commons Attribution License, which permitsunrestricted use, distribution, and reproduction in any medium, provided the original author and source are credited.
Funding: This work was supported by a public grant from the French National Agency for Food, Environmental and Occupational Health Safety (ANSES/AFSSET,EST 2007-50). The funders had no role in study design, data collection and analysis, decision to publish, or preparation of the manuscript.
Competing Interests: The authors have declared that no competing interests exist.
* E-mail: [email protected]
¤ Current address: Bacteriology and Hygiene Department, Nantes University Hospital, and University of Nantes - EA, UFR Medicine, Nantes, France
Introduction
Most of the published data on interactions between patients
and healthcare workers (HCWs) in the hospital were obtained
by direct observation of samples of patients and/or HCWs.
Direct observation is tedious, time-consuming, and costly and is
therefore feasible only over short periods. Therefore, the results
may fail to accurately reflect interactions between patients and
HCWs.
Despite progress in prevention and treatment, tuberculosis (TB)
remains a major public health problem in the developing world. In
industrialized countries, the incidence of TB is declining and
public health authorities now focus on specific interventions such
as early diagnosis and treatment or contact detection when a TB
case is identified. Improvements in TB infection control in
hospitals over the last two decades [1] have decreased the
incidence of HCW contamination due to contact with TB patients
[2].
PLoS ONE | www.plosone.org 1 May 2012 | Volume 7 | Issue 5 | e37893

However, there is a need for additional information about
occupational TB, in order to improve infection-control measures.
For example, data on risk factors for acquiring latent TB from an
index patient are limited, as they derive only from outbreak
investigations and expert opinion [1]. Similarly, little is known
about HCW exposure to patients with active TB. Assessment of
the latent TB risk in HCWs relies on several factors, including the
presence in the index patient of a cough and/or of lung
involvement with acid-fast bacilli (AFB) in sputum smears,
estimated infectiousness of the patient, use of aerosol-generating
procedures, and exposure time without personal protective
equipment [1]. Exposure time is evaluated based on recollection
by the HCW of the number and duration of contacts with the
patient, which may be inaccurate. Likewise, the exposure time
cutoff above which an investigation is initiated varies across
countries [3].
To address these limitations and to obtain accurate data on
interactions between patients and HCWs, radiofrequency identi-
fication (RFID) systems are being developed. We used a RFID to
continuously and accurately measure interactions between in-
patients with suspected or confirmed TB and HCWs exposed to
these patients over a 3-month period. Our objectives were (i) to
assess the pattern of interactions between TB patients placed
under airborne precautions and HCWs, and (ii) to compare the
accuracy of interaction data obtained using three surveillance
systems, i.e., the RFID, direct observation, and interviews about
HCW perceptions.
Methods
Study DesignThis was an observational, prospective, study in two centers.
HCWs were recruited from two clinical wards that regularly
admitted patients with TB. One clinical unit was a 34-bed, 32-
room ward in the infectious diseases department at the Bichat -
Claude Bernard Teaching Hospital, Paris, France. The other unit
was a 25-bed, 18-room ward in the pulmonology unit of the Pitie-
Salpetriere Teaching Hospital, Paris, France. In both wards, all
HCWs who had regular direct contact with TB patients were
invited to participate in the study, on a volunteer basis.
Volunteering HCWs signed a consent form.
The study was approved by the ethics committee of the Bichat-
Claude Bernard Teaching Hospital and by the Institutional
Review Board (Patient’s Protection Committee, CPP) of the Ile-de-
France region where both hospitals are located.
PatientsOnly interactions with patients included in the study were
analyzed. Patients were included if they had suspected or
confirmed TB as defined by any of the following: AFB-positive
sputum-smear examination, AFB-negative sputum-smear exami-
nation but bacteriologically-confirmed TB, or airborne isolation
precautions pending results of an AFB sputum-smear examination.
Patients were included only for as long as airborne isolation lasted,
excluding the first and last day, because the times of initiation and
discontinuation of airborne precautions were not collected. For
each patient, the following information was collected: unit and
room, dates of admission and discharge, dates of starting and
stopping airborne isolation precautions, and results of the AFB
sputum-smear examination and bacteriological culture for Myco-
bacterium tuberculosis.
Deployment of the Radio Frequency Identification DeviceWe deployed a RFID in both clinical units (i.e., 50 patient
rooms), first in the infectious diseases ward for 3 months then in
the pulmonology ward for another 3-month period. RFID nodes
included fixed devices in patient rooms and mobile devices carried
by HCWs. Because of energy constraints and for simplicity, we
used an asymmetric network. Each room was equipped with a fixed
sensor that continuously listened to radio signals. The sensor was
secured to the television arm at a height of 2.5 meters and was
plugged into a power outlet. Each HCW carried an autonomous
mobile sensor in a pocket of their uniform. Each mobile sensor
weighed about 30 grams and was about the size of a pager. Mobile
sensors were programmed to emit a radio packet containing their
unique identification number, at intervals of 5 seconds. Radio
signals emitted by mobile sensors were recorded by nearby fixed
sensors, according to a four-level intensity scale (from lowest, 1; to
highest, 4). Signal intensity reflected the distance between the
mobile and fixed sensors and the presence of an obstacle between
the two sensors. The asymmetric deployment of the RFID
simplified communication between nodes and guaranteed privacy
for the HCWs. The method for sensor deployment has been
described in detail elsewhere [4].
Signal ReconstructionAll interactions between mobile HCW sensors and fixed sensors
in study patient rooms were collected during the study period.
Signal reconstruction was performed to discard false-positive
signals and to restore false-negative signals. False-positive signals
could occur if the HCW stayed in front of the open door but
outside the patient’s room and false-negative signals if the body of
Figure 1. Flow-chart of healthcare workers participating in thestudy.doi:10.1371/journal.pone.0037893.g001
RFID and Tuberculosis
PLoS ONE | www.plosone.org 2 May 2012 | Volume 7 | Issue 5 | e37893
the HCW was between the mobile sensor and the fixed sensor.
Consequently, of the mobile-sensor signals emitted every 5
seconds, only those received at intensity levels of 3 or 4 were
used to reconstruct actual interactions [4]. The results were
validated by comparison with data from direct observation during
a validation phase. In addition, long interaction durations
recorded by the RFID were routinely compared to the patient’s
chart and nurse log.
Direct Observation and Healthcare-worker InterviewsDuring the period of RFID deployment, direct observation of
patient-HCW interactions was performed and HCWs were
interviewed about their recollections of interactions with study
patients.
Direct observation was performed during day shifts. Each entry
of any HCW into a study patient room was recorded over periods
of 20 to 30 minutes. The following data were collected: name of
the HCW, room number, identification of the fixed and mobile
sensors, and time spent by the HCW in the room.
Perceptions of interactions by HCWs were collected by
interviewing HCWs 1 to 7 days after contact with a study patient.
HCWs were asked to report the perceived frequency of room
entries during a specific day and the total time spent in the room
during their shift.
Statistical AnalysisTime spent by HCWs in patient rooms was described as median
(interquartile range, minimum and maximum value). These
durations were compared across job categories and shifts using
the non-parametric Kruskal-Wallis test. To compare durations
recorded by the RFID to durations determined from paired direct
observations and HCW interviews, we used the non-parametric
paired Wilcoxon test. All tests were two-sided at the 0.05
significance level. All analyses were performed with SAS version
9.2 (SAS Institute, Cary, NC, USA).
To assess agreement between RFID-recorded interactions and
either direct observation or interview data, we constructed Bland-
Altman plots [5].
Results
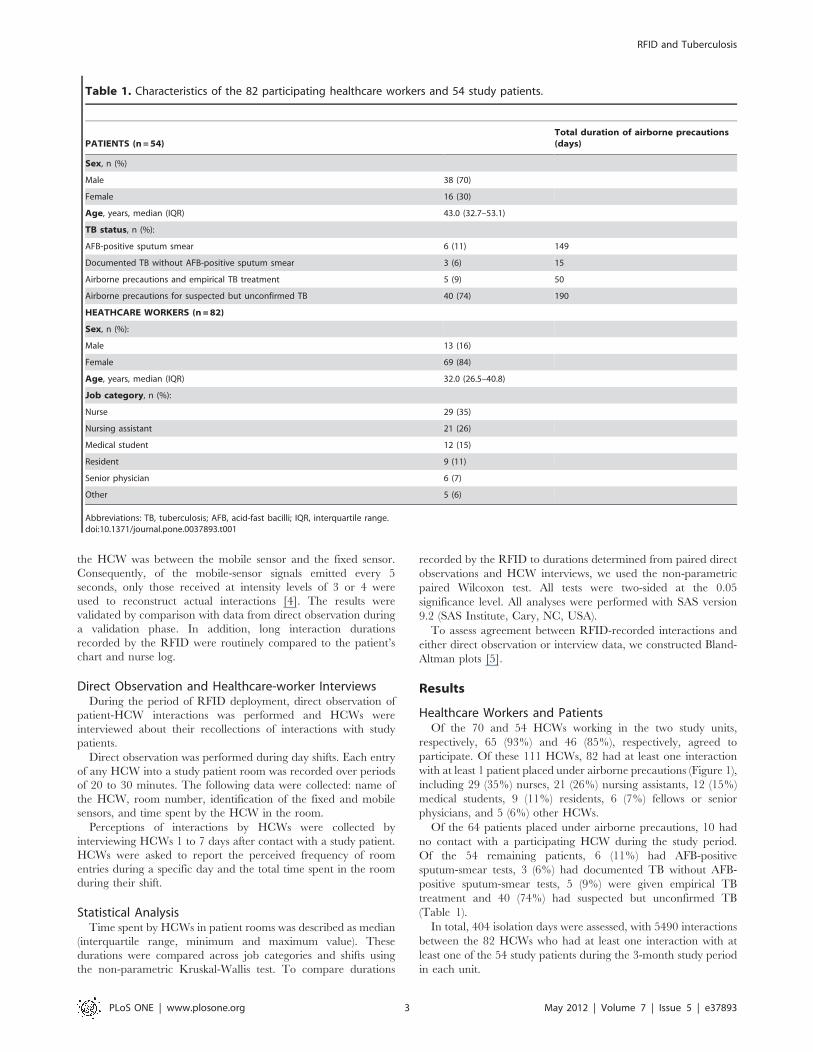
Healthcare Workers and PatientsOf the 70 and 54 HCWs working in the two study units,
respectively, 65 (93%) and 46 (85%), respectively, agreed to
participate. Of these 111 HCWs, 82 had at least one interaction
with at least 1 patient placed under airborne precautions (Figure 1),
including 29 (35%) nurses, 21 (26%) nursing assistants, 12 (15%)
medical students, 9 (11%) residents, 6 (7%) fellows or senior
physicians, and 5 (6%) other HCWs.
Of the 64 patients placed under airborne precautions, 10 had
no contact with a participating HCW during the study period.
Of the 54 remaining patients, 6 (11%) had AFB-positive
sputum-smear tests, 3 (6%) had documented TB without AFB-
positive sputum-smear tests, 5 (9%) were given empirical TB
treatment and 40 (74%) had suspected but unconfirmed TB
(Table 1).
In total, 404 isolation days were assessed, with 5490 interactions
between the 82 HCWs who had at least one interaction with at
least one of the 54 study patients during the 3-month study period
in each unit.
Table 1. Characteristics of the 82 participating healthcare workers and 54 study patients.
PATIENTS (n=54)Total duration of airborne precautions(days)
Sex, n (%)
Male 38 (70)
Female 16 (30)
Age, years, median (IQR) 43.0 (32.7–53.1)
TB status, n (%):
AFB-positive sputum smear 6 (11) 149
Documented TB without AFB-positive sputum smear 3 (6) 15
Airborne precautions and empirical TB treatment 5 (9) 50
Airborne precautions for suspected but unconfirmed TB 40 (74) 190
HEATHCARE WORKERS (n=82)
Sex, n (%):
Male 13 (16)
Female 69 (84)
Age, years, median (IQR) 32.0 (26.5–40.8)
Job category, n (%):
Nurse 29 (35)
Nursing assistant 21 (26)
Medical student 12 (15)
Resident 9 (11)
Senior physician 6 (7)
Other 5 (6)
Abbreviations: TB, tuberculosis; AFB, acid-fast bacilli; IQR, interquartile range.doi:10.1371/journal.pone.0037893.t001
RFID and Tuberculosis
PLoS ONE | www.plosone.org 3 May 2012 | Volume 7 | Issue 5 | e37893

InteractionsWe first plotted the number per hour and duration per hour of
each patient-HCW interaction according to time of day, after
signal reconstruction over 1 week during the study period.
Figure 2A reports the global distribution by week days of
interactions according to time of day. Most interactions occurred
during the first weekdays, with a peak between 11 a.m. and 1 p.m.
Mean interaction duration according to time of day was evenly
distributed over the week (Figure 2B).
Overall, data were obtained for a median of 65.0 (IQR, 36.0–
86.0) shifts per HCW over the 3-month period. The median total
number of interactions with patients was 20.0 (IQR, 7.0–123.0)
per HCW and the median total duration of interactions was 57.3
(IQR, 13.7–379.6) minutes per HCW. The median number and
duration of interactions per shift were 0.4 (IQR, 0.1–1.5) and 1.1
(IQR, 0.4–5.9) minutes, respectively.
The median duration per HCW-patient interaction was 2.1
(IQR, 0.8–4.4) minutes overall, 2.3 (IQR, 0.8–5.0) minutes during
the morning shift (7 a.m.–1 p.m.), 1.8 (IQR, 0.7–3.7) minutes
during the afternoon shift (1 p.m.–9 p.m.), and 2.0 (IQR, 0.7–4.3)
minutes during the night shift (9 p.m.–7 a.m.) (P,1024). The
number of interactions per hour was higher in the morning
Figure 2. Distribution of (A) number per hour and (B) mean duration per hour of 5490 interactions between 82 healthcare workersand 54 patients placed under airborne precautions over one week during the study period. Footnote: The graphs show cumulative datafrom 5490 interactions during the 3-month study period in both study wards.doi:10.1371/journal.pone.0037893.g002
RFID and Tuberculosis
PLoS ONE | www.plosone.org 4 May 2012 | Volume 7 | Issue 5 | e37893

(n = 413) than in the afternoon (n= 238) or at night (n = 110)
(Table 2).
The median total time spent by each HCW interacting with all
TB patients was 7.6 minutes (IQR, 2.4–22.5 minutes; range, 0.2
minutes-5.3 hours) and the median number of interactions/day/
HCW was 3.0 (IQR, 1.0–6.0).
The total number of interactions was 1899 for nurses (n = 65 per
nurse), 1393 for nursing assistants (n = 66 per nursing assistant),
1125 for residents and senior physicians (n = 125 per physician),
and 804 for medical students (n = 67 per student). Median
interaction duration varied significantly across job categories
(P,1024) (Table 2).
Direct Observation and Healthcare-worker InterviewsOf the 79 direct observation periods, 67 were performed during
the 404 days of assessed airborne precautions, and 28 could be
evaluated. The 39 missing pairs were related to nonparticipation
of observed HCWs in the study, absence of carrying the sensor by
the HCW, failure of signal reconstruction if the HCW-stay in the
room was brief or interrupted with several entries and exits, or
technical sensor failure. Median interaction duration by direct
observation was 2.0 (IQR, 1.5–5.6) minutes and was not
significantly different from the corresponding value collected by
the RFID (2.5 [IQR, 1.6–4.7] minutes; P=0.6).
Of 91 HCW interviews about the number and duration of
interactions between the interviewed HCW and a specific TB
patient on a specific day, 26 could be evaluated. The remaining 65
interviews were not assessable, for the same reasons as listed above
for direct observation. Median daily interaction duration as
perceived by the HCWs was 10.0 (IQR, 3.0–20.0) minutes, which
was not significantly different from the median duration collected
by the RFID (6.8 [IQR, 2.6–16.7] minutes; P=0.2).
The Bland-Altman plots of the difference between RFID-
recorded interactions and paired direct observations or interviews
are shown in Figure 3A and 3B, respectively. Agreement was
good, although variability was greater for long than for short
interactions.
Discussion
We deployed a large RFID in two clinical units to measure
interactions between HCWs and patients with TB. Calibration
and signal reconstruction allowed us to obtain data on interaction
duration, as confirmed by the comparison with direct observation
data during the validation phase. Although daily median in-
teraction duration per HCW and per TB patient was short, i.e.,
7.6 minutes, 25% of interactions were longer than 22.5 minutes
and some interactions lasted several hours. Physicians and medical
students were exposed as frequently but for longer times,
compared to nurses and nursing assistants. Finally, perceptions
collected by HCW interviews accurately reflected exposure to TB
patients.
Most data on interactions between HCWs and patients are
obtained via direct observation by trained observers. Direct
observation data may be biased, however, chiefly via the
Hawthorne effect. The Hawthorne effect is a change in the
behavior of people who know they are being observed. Although
not systematically evaluated, several studies in the field of hand
hygiene suggested overestimation of compliance related to the
Hawthorne effect [6,7]. Other biases are observer bias, with
observers from the audited unit tending to report higher
compliance; and selection bias, with direct observation being
performed in units or during periods believed to be characterized
by better compliance [8]. In addition, direct observation is time-
consuming. However, the World Health Organization considered
direct observation to be the reference standard for assessing hand-
hygiene compliance rates.
Social network specialists and infection control specialists
recently developed automatic systems for collecting interactions
between HCWs and patients. These systems have proved helpful
for assessing contact patterns and studying the spread of
respiratory viruses, with the goal of setting up prevention strategies
[9,10,11]. Also, compliance with hand hygiene at room entry and
exit can be measured using electronic devices [12]. Electronic
methods allow continuous and automatic collection of person-to-
person interactions in hospitals [10]. For our study, we selected
tuberculosis because of its epidemiological simplicity, with a single
reservoir and exclusive airborne transmission. Moreover, much
remains to be learned about the transmission of M. tuberculosis to
HCWs.
We had some concern that the HCWs might perceive the
sensors as intrusive. However, the study was well accepted, with
a high participation rate. We were therefore able to describe
interactions between HCWs and patients in two large clinical
units. However, we encountered unexpected difficulties in
calibrating and reconstructing interactions. Obstacles to the
Table 2. Interactions between 82 healthcare workers and 54 patients placed under airborne precautions.
Morning (7 a.m.–1p.m.)
Afternoon (1 p.m.–9p.m.) Night (9 p.m.–7 a.m.) P value
Total number 2480 1905 1105
Total number/hour 413 238 110
Duration of each interaction (min.), median (IQR) 2.3 (0.8–5.0) 1.8 (0.7–3.7) 2.0 (0.7–4.3) ,1024
Nursen=29
Nursingassistantn =21
Residentn=9
Medicalstudentn=12
Seniorphysiciann=6
OthersHCWsn=5
P value
Interactions (n):
Total number 1899 1393 1125 804 209 60
Total number/HCW 65 66 125 67 35 12
Duration of each interaction (min.), median (IQR) 1.7 (0.7–3.8) 1.9 (0.7–4.1) 2.5 (0.9–5.5) 2.7 (1.0–6.0) 1.9 (0.8–4.1) 1.7 (0.5–2.8) ,1024
Abbreviations: IQR, interquartile range; HCW, Healthcare worker.doi:10.1371/journal.pone.0037893.t002
RFID and Tuberculosis
PLoS ONE | www.plosone.org 5 May 2012 | Volume 7 | Issue 5 | e37893

collection of accurate data included technical issues and
problems related to real-life conditions (e.g., the body of the
HCW shielding the fixed sensor from the emissions by the
mobile sensor). These technical aspects have been reported
previously [4]. Our experience shows that investigators who
intend to implement an electronic system for describing social
interactions should consider potential obstacles and plan a de-
tailed calibration phase.
Figure 3. Bland-Altman plots of paired interactions. (A) Difference between sensor recordings and direct observation; (B) Difference betweensensor recordings and interview data.doi:10.1371/journal.pone.0037893.g003
RFID and Tuberculosis
PLoS ONE | www.plosone.org 6 May 2012 | Volume 7 | Issue 5 | e37893

Interactions during the morning shift (7 a.m.–1 p.m.) were
about twice as numerous as those during the afternoon shift (1
p.m.–9 p.m.) and four times more numerous than during the night
shift (9 p.m.–7 a.m.). In addition, interaction duration was
significantly longer during the morning shift. This distribution is
in accordance with the organization of care in the wards.
The median duration of each interaction was only 2.1 minutes.
This is not surprising, as TB patients are usually self-sufficient and
do not require major nursing procedures. However, daily care
duration was as long as several hours in some TB patients,
suggesting a risk of TB transmission to HCWs in the absence of
airborne isolation precautions. However, most HCWs had short
interaction durations. These data should prove helpful for
investigations by occupational physicians working on risks to
HCWs. The interaction duration cutoff above which a contact
investigation should be considered after exposure to an infectious
TB patient in the absence of airborne isolation precautions varies
widely across recommendations, from 1 hour in France to 8 hours
for aircraft passengers in close contact with the case [3]. Our
results in two hospital wards show that prolonged contact is rare.
Our finding of longer interactions between TB patients and
medical students and residents, compared to HCWs in other job
categories, indicates a need for including students and residents
into contact investigations. Medical students may not be under
monitoring by the hospital occupational physicians and may
therefore fail to receive active surveillance after exposure.
The good correlation between direct observation data and
RFID data confirmed the accuracy of the recorded interactions.
HCW perceptions of daily interaction durations were accurate
during interviews conducted after 1 to 7 days. However, some
correlations between RFID data and data from either direct
observation or interviews were weaker, especially for long
interactions, suggesting that signal reconstruction may not always
be accurate (presence of false-positive and false-negative signals
despite signal reconstruction). Technological improvements will be
available soon, such as ultra-wideband radio signals, and will
improve indoor sensor network localization.
To our knowledge, only one study evaluated interactions
between HCWs and patients in a pediatric clinical ward. The
authors obtained a high participation rate from HCWs, as in our
study. Although not validated by direct observations, the results
were essentially similar to our data, with a short median duration
of each interaction between participants and large variations of the
number and duration of contacts between participants and within
job categories [10].
In conclusion, this preliminary study demonstrates that inter-
actions between HCWs and patients can be recorded accurately
and continuously using a RFID. Electronic sensors can be used as
an alternative or as a complement to time-consuming short-term
direct observation. RFIDs hold promise for better describing
exposure and risk, provided correct calibration is performed before
data acquisition and appropriate signal reconstruction methods
are used. RFIDs could be used for assessing the risk of
transmissible infectious diseases.
Acknowledgments
The authors thank Amandine DUPRE and Floriane GOYER for their
technical assistance, and the healthcare staff of the two clinical units for
enthusiastically participating in the study.
Author Contributions
Conceived and designed the experiments: JCL FM EF GC. Performed the
experiments: JCL GC NV DL AF. Analyzed the data: JCL GC CL FM EF.
Contributed reagents/materials/analysis tools: DA EB. Wrote the paper:
JCL CL FM GC NV DL FM EF.
References
1. Jensen PA, Lambert LA, Iademarco MF, Ridzon R (2005) Guidelines for
preventing the transmission of Mycobacterium tuberculosis in health-care
settings, 2005. MMWR Recomm Rep 54: 1–141.
2. Manangan LP, Bennett CL, Tablan N, Simonds DN, Pugliese G, et al. (2000)
Nosocomial tuberculosis prevention measures among two groups of US
hospitals, 1992 to 1996. Chest 117: 380–384.
3. World Health Organization (2008) Tuberculosis and air travel. Guidelines for
Prevention and Control. 3rd ed. ed. pp. Available: http://www.who.int/tb/
publications/2008/9789241547505/en/. Accessed 2012 May 5.
4. Friggeri A, Chelius G, Fleury E, Fraboulet A, Mentre F, et al. (2011)
Reconstructing social interactions using an unreliable sensor network. Computer
Communications 34: 609–618.
5. Bland JM, Altman DG (1986) Statistical methods for assessing agreement
between two methods of clinical measurement. Lancet 1: 307–310.
6. Eckmanns T, Schwab F, Bessert J, Wettstein R, Behnke M, et al. (2006) Hand
rub consumption and hand hygiene compliance are not indicators of pathogen
transmission in intensive care units. J Hosp Infect 63: 406–411.
7. Pittet D, Simon A, Hugonnet S, Pessoa-Silva CL, Sauvan V, et al. (2004) Hand
hygiene among physicians: performance, beliefs, and perceptions. Ann InternMed 141: 1–8.
8. Muller MP, Detsky AS (2010) Public reporting of hospital hand hygienecompliance–helpful or harmful? JAMA 304: 1116–1117.
9. Gundlapalli A, Ma X, Benuzillo J, Pettey W, Greenberg R, et al. (2009) Social
network analyses of patient-healthcare worker interactions: implications fordisease transmission. AMIA Annu Symp Proc 2009: 213–217. pp 213–217.
10. Isella L, Romano M, Barrat A, Cattuto C, Colizza V, et al. (2011) CloseEncounters in a Pediatric Ward: Measuring Face-to-Face Proximity and Mixing
Patterns with Wearable Sensors. PLoS One 6: e17144.
11. Stehle J, Voirin N, Barrat A, Cattuto C, Isella L, et al. (2011) High-resolutionmeasurements of face-to-face contact patterns in a primary school. PLoS One 6:
e23176.12. Marra AR, Moura DF Jr., Paes AT, dos Santos OF, Edmond MB (2010)
Measuring rates of hand hygiene adherence in the intensive care setting:a comparative study of direct observation, product usage, and electronic
counting devices. Infect Control Hosp Epidemiol 31: 796–801.
RFID and Tuberculosis
PLoS ONE | www.plosone.org 7 May 2012 | Volume 7 | Issue 5 | e37893