Renormalization flow and universality for ultracold fermionic atoms
ARTICLES
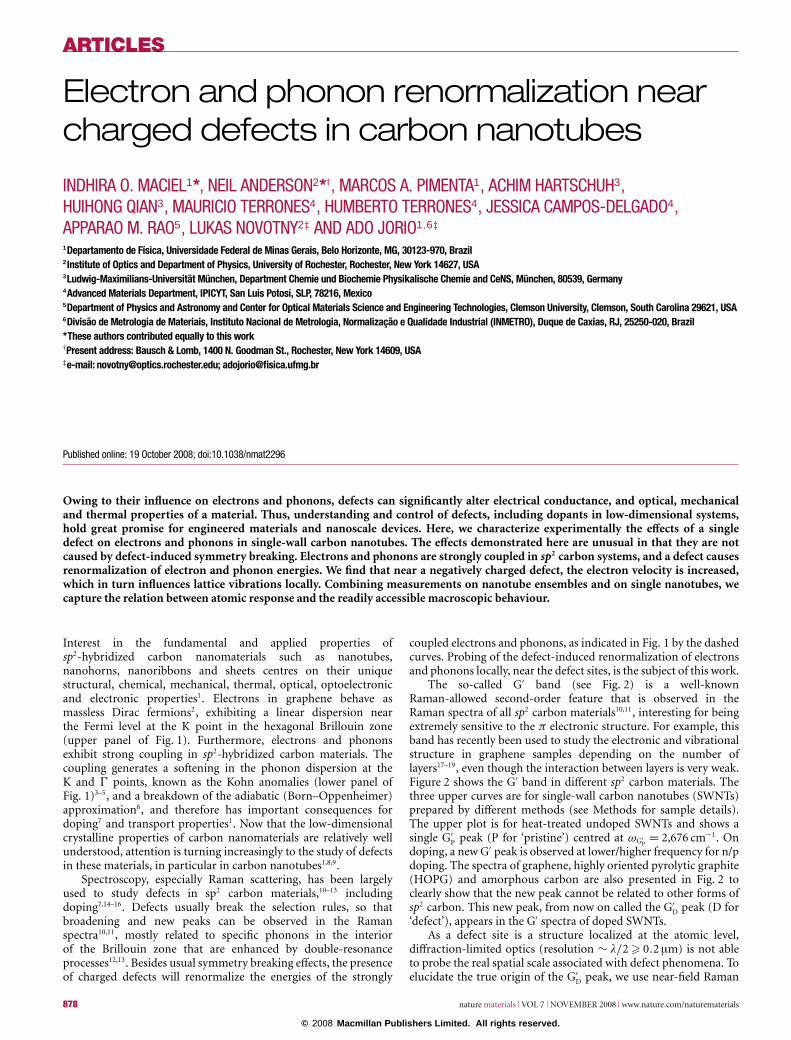
Electron and phonon renormalization nearcharged defects in carbon nanotubes
INDHIRA O. MACIEL1*, NEIL ANDERSON2*†, MARCOS A. PIMENTA1, ACHIM HARTSCHUH3,HUIHONG QIAN3, MAURICIO TERRONES4, HUMBERTO TERRONES4, JESSICA CAMPOS-DELGADO4,APPARAO M. RAO5, LUKAS NOVOTNY2‡ AND ADO JORIO1,6‡
1Departamento de Fısica, Universidade Federal de Minas Gerais, Belo Horizonte, MG, 30123-970, Brazil2Institute of Optics and Department of Physics, University of Rochester, Rochester, New York 14627, USA3Ludwig-Maximilians-Universitat Munchen, Department Chemie und Biochemie Physikalische Chemie and CeNS, Munchen, 80539, Germany4Advanced Materials Department, IPICYT, San Luis Potosı, SLP, 78216, Mexico5Department of Physics and Astronomy and Center for Optical Materials Science and Engineering Technologies, Clemson University, Clemson, South Carolina 29621, USA6Divisao de Metrologia de Materiais, Instituto Nacional de Metrologia, Normalizacao e Qualidade Industrial (INMETRO), Duque de Caxias, RJ, 25250-020, Brazil*These authors contributed equally to this work†Present address: Bausch & Lomb, 1400 N. Goodman St., Rochester, New York 14609, USA‡e-mail: [email protected]; [email protected]
Published online: 19 October 2008; doi:10.1038/nmat2296
Owing to their influence on electrons and phonons, defects can significantly alter electrical conductance, and optical, mechanicaland thermal properties of a material. Thus, understanding and control of defects, including dopants in low-dimensional systems,hold great promise for engineered materials and nanoscale devices. Here, we characterize experimentally the effects of a singledefect on electrons and phonons in single-wall carbon nanotubes. The effects demonstrated here are unusual in that they are notcaused by defect-induced symmetry breaking. Electrons and phonons are strongly coupled in sp2 carbon systems, and a defect causesrenormalization of electron and phonon energies. We find that near a negatively charged defect, the electron velocity is increased,which in turn influences lattice vibrations locally. Combining measurements on nanotube ensembles and on single nanotubes, wecapture the relation between atomic response and the readily accessible macroscopic behaviour.
Interest in the fundamental and applied properties ofsp2-hybridized carbon nanomaterials such as nanotubes,nanohorns, nanoribbons and sheets centres on their uniquestructural, chemical, mechanical, thermal, optical, optoelectronicand electronic properties1. Electrons in graphene behave asmassless Dirac fermions2, exhibiting a linear dispersion nearthe Fermi level at the K point in the hexagonal Brillouin zone(upper panel of Fig. 1). Furthermore, electrons and phononsexhibit strong coupling in sp2-hybridized carbon materials. Thecoupling generates a softening in the phonon dispersion at theK and 0 points, known as the Kohn anomalies (lower panel ofFig. 1)3–5, and a breakdown of the adiabatic (Born–Oppenheimer)approximation6, and therefore has important consequences fordoping7 and transport properties1. Now that the low-dimensionalcrystalline properties of carbon nanomaterials are relatively wellunderstood, attention is turning increasingly to the study of defectsin these materials, in particular in carbon nanotubes1,8,9.
Spectroscopy, especially Raman scattering, has been largelyused to study defects in sp2 carbon materials,10–13 includingdoping7,14–16. Defects usually break the selection rules, so thatbroadening and new peaks can be observed in the Ramanspectra10,11, mostly related to specific phonons in the interiorof the Brillouin zone that are enhanced by double-resonanceprocesses12,13. Besides usual symmetry breaking effects, the presenceof charged defects will renormalize the energies of the strongly
coupled electrons and phonons, as indicated in Fig. 1 by the dashedcurves. Probing of the defect-induced renormalization of electronsand phonons locally, near the defect sites, is the subject of this work.
The so-called G′ band (see Fig. 2) is a well-knownRaman-allowed second-order feature that is observed in theRaman spectra of all sp2 carbon materials10,11, interesting for beingextremely sensitive to the π electronic structure. For example, thisband has recently been used to study the electronic and vibrationalstructure in graphene samples depending on the number oflayers17–19, even though the interaction between layers is very weak.Figure 2 shows the G′ band in different sp2 carbon materials. Thethree upper curves are for single-wall carbon nanotubes (SWNTs)prepared by different methods (see Methods for sample details).The upper plot is for heat-treated undoped SWNTs and shows asingle G′
P peak (P for ‘pristine’) centred at ωG′P= 2,676 cm−1. On
doping, a new G′ peak is observed at lower/higher frequency for n/pdoping. The spectra of graphene, highly oriented pyrolytic graphite(HOPG) and amorphous carbon are also presented in Fig. 2 toclearly show that the new peak cannot be related to other forms ofsp2 carbon. This new peak, from now on called the G′
D peak (D for‘defect’), appears in the G′ spectra of doped SWNTs.
As a defect site is a structure localized at the atomic level,diffraction-limited optics (resolution ∼ l/2 > 0.2 µm) is not ableto probe the real spatial scale associated with defect phenomena. Toelucidate the true origin of the G′
D peak, we use near-field Raman
878 nature materials VOL 7 NOVEMBER 2008 www.nature.com/naturematerials
© 2008 Macmillan Publishers Limited. All rights reserved.

ARTICLES
Wave vector K
K M K'Ph
onon
ene
rgy
Elec
tron
ener
gy
Γ
iTO
Ev
EF
Ec
Figure 1 Schematic model showing the renormalization of electron and phononenergies near a negatively charged defect, and its influence on thedouble-resonance G ′ scattering process discussed in this work. The upperpanel shows the dispersion of the π and π ∗ electrons along the KMK ′ direction inthe hexagonal Brillouin zone, near the Fermi level (EF). The lower panel shows theiTO phonon branch along the 0K direction. The arrows in the upper panel indicateelectron transitions by photon absorption (vertical arrows) and phonon scattering(nearly horizontal arrows). The arrows in the lower panel indicate the energies forthe same phonons scattering electrons in the upper panel. Dashed lines representthe renormalized structure near the defect sites.
and near-field photoluminescence imaging and spectroscopy tospatially resolve local defect states/sites along an individual SWNT(ref. 20). Figure 3a shows the photoluminescence spectra acquiredfrom a (9, 1) SWNT. The (9, 1) structural (n,m) assignment1 isbased on determining the peak position of the emission spectra(l = 904 nm) and the radial breathing mode (ωRBM = 302 cm−1)in the corresponding Raman spectrum, shown in Fig. 3b. Figure 3cshows a near-field photoluminescence image of the (9, 1) SWNT,where the image contrast is provided by spectrally integratingover the photoluminescence peak centred at l = 904 nm. Themost striking feature in this image is the high degree of spatiallocalization of the photoluminescence emission along the SWNT.This is evident by inspection of the extended topography imageof the nanotube shown in Fig. 3f, and also of the near-fieldRaman image of the tangential C–C stretching mode (named theG band, near 1,590 cm−1) shown in Fig. 3d. Whereas from Fig. 3dwe observe that the G band Raman scattering is present along theentire length of the nanotube, from Fig. 3e we observe increasedsymmetry-breaking defect-induced Raman scattering (D band,∼1,300 cm−1) (refs 10–13) localized at the same region wherephotoluminescence was detected. Localized photoluminescenceemission along single-wall carbon nanotubes is often observed inour near-field experiments, and it correlates with the local D bandintensity, suggesting the existence of trapped excitons. Therefore, itis evident that bright photoluminescence emission, that is, excitonrecombination, originates from a defect site along the SWNT. Oncethe defect site is located, we can monitor the G′ band and show thata clear change in the G′ line shape is measured near the defect site(see Fig. 3g), as expected.
The G′ band feature has been well characterized in theliterature, and its frequency is known to depend both on excitationlaser energy and tube diameter21,22. In our near-field experiment,with a l = 633 nm laser, the G′ feature for the (9, 1) SWNT isexpected to exhibit a single Lorentzian peak located at 2,613 cm−1
(refs 21,22). Although the G′
P peak is observed in excellentagreement with expectations (ωG′
P=2,610 cm−1), over the defective
2,600
Amorphouscarbon
HOPG
Graphene
Undoped SWNTs
n-doped SWNTs
p-doped SWNTs
2,700Raman shift (cm–1)
2,800
Norm
aliz
ed in
tens
ity
Figure 2 The G ′ Raman band in different sp2 carbon materials measured atroom temperature with E laser = 2.41 eV (514 nm). The arrows point todefect-induced peaks in the G ′ for doped SWNTs. The p/n doping comes fromsubstitutional boron/nitrogen atoms15,16, the nearest neighbours of carbon in theperiodic table. The spectra of graphene, HOPG and amorphous carbon are shown forcomparison. See Methods for sample details.
region, a new G′
D peak is observed (see asterisks in Fig. 3g),redshifted from the G′
P peak (ωG′D
= 2,591 cm−1). The localizedcharacter of the G′
D scattering process is thus established.Besides the p/n charge signal effect (shown in Fig. 2) and the
localized emission (shown in Fig. 3), for a deeper understandingof the physics behind the defect-induced G′
D band, we analyse thedependence of the G′ peaks on the excitation laser energy (Elaser),as shown in Fig. 4a. The evolution of the G′ peak frequencies ωG′
P
and ωG′D
for n-doped SWNTs are plotted in Fig. 4b, and fitted witha linear relation
ωG′ = AElaser +B. (1)
For the defect-induced G′
D peak, the value of A is smaller and thevalue of B is larger when compared with the corresponding valuesfor the G′
P peak (see caption to Fig. 4 for A and B values). Thesechanges reveal the renormalization effect caused by the negativelycharged defect on the local electronic and vibrational structure, asdiscussed below.
The second-order symmetry-allowed G′ Raman scatteringprocess occurs in all sp2 carbon materials, involving in-planetransversal optical (iTO) phonons near the K point in thehexagonal Brillouin zone, selected by the double-resonanceprocess10–13. An excited electron with wave vector k resonantly
nature materials VOL 7 NOVEMBER 2008 www.nature.com/naturematerials 879
© 2008 Macmillan Publishers Limited. All rights reserved.

ARTICLES
PL G
TopographyD
800 850 900 950Emission wavelength (nm) Raman shift (cm–1)
Raman shift (cm–1)
1,000 1,050 1,100 0
DG'
G
400
RBM iTOLAIFM
800 1,200 1,600 2,000 2,400 2,800
2,550 2,600 2,650
Inte
nsity
(arb
. uni
ts)
2,700
a
c
e
d g
f
b
Figure 3 Near-field Raman and photoluminescence spectroscopy and imaging of a (9, 1) SWNT with E laser = 1.96 eV (633 nm). a, Photoluminescence emission atl = 904 nm. b, Raman spectrum. The Raman features are labelled21. c, Near-field photoluminescence image of the SWNT revealing localized excitonic emission. The scalebar denotes 250 nm. d,e, Near-field Raman imaging of the same SWNT, where the image contrast is provided by spectrally integrating over the tangential G (d) anddefect-induced D bands (e). f, Corresponding topography image. g, Evolution of the G ′ band spectra near the defective segment of the (9, 1) SWNT. The spectra were taken insteps of 25 nm along the nanotube, showing the defect-induced G ′
D peak (dotted Lorentzian). The asterisks denote the spatial locations where localized photoluminescenceand defect-induced D band scattering were measured (see yellow circles in c and e, respectively). The ωG ′
P−ωG ′
Dsplitting observed in g is smaller than the splitting
observed in the second (from the top) spectrum in Fig. 2 because the spectra were measured with different excitation laser energies, as discussed in the text.
selects a phonon with wave vector q ≈ −2k (refs 12,13,23). Whenconsidering one-dimensional nanotubes, momentum conservationfor electron–phonon interaction requires that both linear andangular momenta are preserved. In the zone-folding picture, thisis similar to two-dimensional linear momentum conservation ingraphene23. Therefore, the graphene picture can be transferred tocarbon nanotubes, and it will be used here because it is moredidactic and general for sp2 carbons. This relation between kand q, together with the Dirac–Fermion behaviour for high-speedelectrons (vF = c/300, where vF is the Fermi velocity and c is thespeed of light)2 and the Kohn anomaly for phonons3, makes the G′
band strongly dependent on the particular electronic structure.The linear dispersion for electrons has been broadly used to
explain the frequencies of many dispersive features in the Ramanspectra of undoped sp2 carbon materials10–13. The excited electronwith wave vector of modulus k is generated by resonance with theexcitation laser12,13
Elaser = Ec−Ev = 2hvFk ≈ hvFq, (2)
where the subscripts v and c stand for valence and conductionbands, respectively. Changing Elaser changes k linearly, andconsequently q, so that the electronic structure can be probed using
phonon measurements12,13,17–19. A schematic model showing thedefect-induced renormalization of electron and phonon energiesand its influence on the double-resonance G′ scattering processis shown in Fig. 1. The two resonant processes, the opticalabsorption and the scattering of the excited electron by aphonon, are represented by the vertical and nearly horizontalarrows, respectively. The G′
P follows the unperturbed process(solid lines), whereas the G′
D follows the process where electronand phonon energies are renormalized (dashed lines). The G′
phonon wave vector q connecting the two excited electronic states(nearly horizontal arrows) is selected by Elaser (vertical arrows),according to equation (2). Considering a linear dispersion, theconstant B in equation (1) gives the G′ frequency at the Kpoint, and the increase in B near the defect location is a directmeasure of the hardening of the iTO phonon branch at theK point, due to the renormalization of the phonon energies3,4
near the defect site. Phonon renormalization has been observedrecently for the tangential G band (∼1,580 cm−1) in SWNT-based5
and graphene-based6 transport devices, although under differentexperimental conditions, that is, on gate-induced doping. Thegate doping experiments on single-24 and bi-layer25 graphene andon carbon nanotubes26 show a G′ frequency behaviour that isin quantitative agreement with our findings, indicating that the
880 nature materials VOL 7 NOVEMBER 2008 www.nature.com/naturematerials
© 2008 Macmillan Publishers Limited. All rights reserved.

ARTICLES
2,500
2.54 eV
2.41 eV
2.18 eV
1.92 eV
2,600Raman shift (cm–1)
2,700 2,800
Norm
aliz
ed in
tens
ity
2.02,580
2,610
2,640
2,670
2,700
2.2Energy (eV)
2.4 2.6 2.0 2.2Energy (eV)
I G' D/I G
' P
2.4 2.6
Peak
pos
ition
(cm
–1)
0
1
2
330 35 40
ω ωG'P – G'D
(cm–1)
a
b c
Figure 4 Dependence of the G ′ band on E laser for the n-doped SWNT sample.a, The G ′ band spectra with different E laser. b, The peak position as a function ofE laser, obtained by fitting the spectra in a with two Lorentzians. The error bars showthe uncertainty in frequency definition. Common full-width at half-maximums areused, and the values increase linearly with E laser, from Γ = 43 to 53 cm−1. The solidlines are linear fits (see equation (1)), giving ωG ′
P= (97±5)E laser + (2,442±11) and
ωG ′
D= (71±4)E laser + (2,465±11). c, G ′ intensity ratio (IG ′
D/ IG ′
P) as a function of
E laser. The vertical error bars show the uncertainty in IG ′
D/ IG ′
P. The horizontal error
bars show the uncertainty in the frequency splitting ωG ′
P−ωG ′
D= 26E laser −23,
which is shown on the upper axis.
effect observed here for chemically doped SWNTs can be broadlyapplied to doping of sp2-hybridized carbon materials in general. Toexplain the G′
D behaviour observed in Fig. 4, the phonon hardeningindicated by the constant B alone is not sufficient; otherwise thedefect-induced G′
D peak would always be observed at a higherfrequency than the G′
P peak. The observation of G′
D at the lowerfrequency side is due to the weaker dependence of G′
D on Elaser,given by the parameter A in equation (1). The smaller value of thedispersion coefficient A is a measure of the renormalization of thephonon and electron energies near the K point (A = vq/vF, wherevq is the slope of the iTO phonon branch near K), the defect causinga change in the Fermi velocity vF as well. Although the defectincreases the phonon energies by reducing the phonon branch slopevq near the K point (dashed curve in the lower panel of Fig. 1), theincrease in the electronic Fermi velocity vF (dashed curves in theupper panel) causes the double-resonance process to select a lowerfrequency phonon (dashed arrow in the lower panel) and exhibita smaller dispersion with Elaser, as observed in Fig. 4. Therefore, thedata in Fig. 4 indicate that electrons near a negatively charged defect
site actually have higher energies, that is, higher speed vF than itsunperturbed counterpart.
Electron and phonon renormalization under doping isexpected from theory24,27–30. Das et al.24 carried out first-principlescalculations to study the iTO frequency changes related to theoptimization of the lattice parameters in gate-doped graphene.They considered that the G′ phonons are too far away from theK point to suffer the effects of the Kohn anomaly. Although theircalculations are in qualitative agreement with our observations,showing a G′ asymmetric redshift versus blueshift for n- versusp-gate doping, the predicted shifts are much smaller than theexperimental values, confirming that phonon renormalizationalone cannot explain the G′ doping behaviour. Phononrenormalization due to non-local exchange-correlation effectswas also demonstrated theoretically27. Electron renormalizationunder doping is expected theoretically due to many differenteffects, such as disorder in the electron hopping28 and severalmany-body interactions, including non-Fermi liquid behaviour29
and electron–phonon coupling renormalizing the electronicenergies30. As the many-body corrections generally give a negativerenormalization to the electronic energies, independent of dopingsign29,30, our data indicate that the most important effect forelectron renormalization is the changes in the value of the hoppingamplitude caused by lattice distortion28. The connection betweenthe local lattice distortions28 and the double-resonance model basedon energy-momentum dispersions10–13 is an interesting theoreticalproblem and a matter for future studies.
Although the experiments discussed so far have been carriedout on well-characterized SWNTs, the G′ effect can now be used tostudy different SWNT samples. Figure 5a relates to n doping withphosphorous. In both nitrogen- and phosphorous-doped samples,we see a similarly downshifted G′
D peak. Interestingly, increasingthe level of phosphorous doping increases the intensity of thelower energy G′
D peak without changing its frequency (not shown),showing that the phenomenon here is local. By local, we mean thenumber of defect sites increases with doping level, thus increasingthe G′
D intensity, but there is no correlation between defect sites,so that ωG′
Ddoes not change. For nitrogen doping, a different
intensity behaviour is observed. A low level of nitrogen doping (upto 7% in weight) actually reduces the G′
D peak observed in pristinesamples, and increases G′
D again for higher nitrogen concentrations(not shown). This result supports the hypothesis that nitrogendoping in small quantities induces higher nanotube crystallinity7.This different behaviour for nitrogen and phosphorous dopingcan be related to their ionic radius r as compared with carbon,where rN < rC < rP. First-principles calculations indicate thatphosphorous is incorporated substitutionally in the body of thetube, but this atom pops out of the tubular structure, whereas thenitrogen atoms remain in-plane7,31.
Besides addressing the effect of intentional doping, we nowanalyse the G′ band in pristine samples prepared by the chemicalvapour deposition (CVD) method without any nitrogen orphosphorous precursor (see Fig. 5b). Surprisingly, a small G′
D
peak is observed in the as-grown sample (see down-arrow atthe top spectrum of Fig. 5b). Although the defect structure hereis unknown (some sort of doping, vacancy or other structuralheterogeneity), the observation of the redshifted G′
D band indicatesthe presence of n-charged defects in the structure. It is interestingthat, differently from the intentionally doped SWNT samples (withnitrogen or phosphorous), the G′
D peak in the pristine SWNTsdisappears after annealing the sample at 200 ◦C in an argon flow,as shown in Fig. 5b. The n-type charged defects were present onlybefore the annealing step.
The ‘pristine’ (before heat treatment, grown by arc-discharge orCVD), the nitrogen and the phosphorous SWNT doped samples all
nature materials VOL 7 NOVEMBER 2008 www.nature.com/naturematerials 881
© 2008 Macmillan Publishers Limited. All rights reserved.

ARTICLES
100 200 300 2,600Raman shift (cm–1)
Raman shift (cm–1)
As-grown
200 °C
400 °C
600 °C
2,700 2,800
Norm
aliz
ed in
tens
ityNo
rmal
ized
inte
nsity
100 200 300 2,600
Phosphorous doped
Undoped
2,700 2,800
1,200 1,300 1,400
a
b
Figure 5 The use of the G ′ feature to study doping in other SWNT samples.a, RBM (100–350 cm−1) and G ′ band (2,550–2,770 cm−1) spectra for pristine andphosphorous-doped SWNTs after heat treatment. The RBM spectra are shown formonitoring the tube diameter (dt) distribution (ωRBM ∝ 1/dt) (ref. 1). The arrowindicates the behaviour of the defect-induced G ′
D peaks on doping. The inset showsthe respective disorder-induced D band spectra10–13 normalized to the G band (notshown). b, The effect of heat treatment on the RBM and G ′ band spectra on pristine(unintentionally doped) CVD-grown SWNTs. The heat treatment temperatures areshown near the respective spectra. Annealing at 600 ◦C reduces the number of morereactive small-diameter tubes (larger ωRBM—bottom spectrum in b), causing a shiftin the G ′
P band, in agreement with the diameter dependence of ωG ′
P(refs 21,22). The
Raman spectra of the different SWNT samples were measured at room temperaturewith E laser = 2.41 eV (l = 514 nm). See Methods for sample details.
exhibit a lower frequency G′
D Raman peak with similar frequencies(see Supplementary Information for a comparative analysis),indicating that the electron and phonon renormalization nearthe defect site is caused by the presence of one extra electron.In the case of boron doping, the renormalization goes in theopposite direction, related to the presence of one hole. Thisextra electron/hole increases/decreases the electron speed locally,thus changing the atomic vibrations. The electron and phononrenormalization effects are not symmetric, being more pronouncedfor electron doping, in agreement with gate-induced dopingexperiments24–26. Our combined near-field photoluminescence andRaman data (Fig. 3) show that highly localized light emission isconnected to a lower frequency G′
D, which results from n-typedoping. Surprisingly this G′ defect-induced effect is common. Ithas been broadly observed in SWNTs (ref. 32) and in double-wallcarbon nanotubes33, although the underlying importance of defectsin these structures has never been addressed. The multitude ofsamples exhibiting consistent results shows the generality of these
findings. There exist other reports of localized optical emissionfrom SWNTs (refs 20,34) and the physics discussed here willcertainly apply to any other sp2 carbon material3,4,10,11.
The behaviour of the G′
D peak is, therefore, an effectiveprobe to accurately measure the local effect of a single defect(including dopants) on the electronic and vibrational propertiesof carbon nanotubes, carbon nanoribbons, n-layer graphene orany other sp2-hybridized carbon material. For quantitative dopinglevel analysis, careful calibration studies have to be carried out,because the G′ intensity depends on tube diameter, metallicityand excitation laser energy1. Notice that the intensity of thedefect-induced peak (IG′
D) is higher than IG′
Pfor lower Elaser values,
whereas IG′D/IG′
Pgoes to zero for higher Elaser values (see Fig. 4a).
Figure 4c shows the intensity ratio IG′D/IG′
Pas a function of Elaser
(bottom axis) and the splitting between G′
P and G′
D (top axis).IG′
Dis much less than IG′
Pwhen ωG′
P− ωG′
Dis large. The ratio
IG′D/IG′
Pincreases when the splitting gets smaller than the full-width
at half-maximum of the G′ peaks (Γ ∼ 43–53 cm−1, see captionto Fig. 4) and the unperturbed and perturbed levels mix. Theoccupation of the defect-induced electronic states can be monitoredfrom a G′ intensity analysis, shedding light on the field of excitedelectron dynamics1,35.
METHODS
SAMPLE DETAILSNitrogen-doped SWNTs were grown by the CVD method at 950 ◦C using asolution of ethanol with 1.25% in weight of ferrocene and benzilamine indifferent concentrations (0%, 3.0%, 7.0% and 11.0% in weight) as a precursorcarried by a 1.2 l min−1 flux of argon for 30 min. The diameter range isfrom 0.7 to 2.2 nm. The nitrogen content in the tubes has been evaluated bydetailed X-ray photoelectron spectroscopy, resulting in 0.3 at.% incorporatedin the nanotube lattice, regardless of the feedstock composition (Ayala et al.,manuscript in preparation). For this reason, most of the results discussed inour article, and shown in Figs 2 and 4, focus on the lowest initial content ofbenzilamine (3.0% in weight). The X-ray photoelectron spectroscopy resultsalso indicate the nitrogen incorporates into the SWNT lattice in both the sp2
substitutional and the pyridinic bonding.Boron-doped SWNTs were grown by the pulsed laser vaporization
technique using targets with three different boron concentrations, undoped,1.5 at.% and 3.0 at.%. The laser ablation technique is known to generaterelatively pure and high-quality nanotubes as compared with CVD samples,and the lower frequency (n-type related) G′
D peak is never observed, thusmaking it possible to unambiguously probe the p-doping behaviour. Thediameter range of these samples varies with doping within the range of 1.1to 1.7 nm. Clear evidence for substitutional boron doping into the SWNTlattice has been obtained from Raman spectroscopy, thermoelectric power,temperature-dependent magnetization measurements, electric and thermaltransport14,15 and most recently from nuclear magnetic resonance and Meissnereffect experiments36. The amount of doping is small (less than 1 at.%).Furthermore, consistent with what is known about boron incorporation ingraphite, addition of more than 3.0 at.% boron in the graphite target was foundto inhibit the formation of SWNTs. Soot generated from targets containing 1.5at.% boron gives the best doped SWNTs with respect to level of doping versusquality of tube structure15. For this reason, the sample we used to draw theconclusions in our article, and shown in Fig. 2, was the SWNTs grown in the1.5 at.% boron-doping condition.
The CVD SWNTs doped with phosphorous were grown at 950 ◦C using asolution of ethanol with 1.25% in weight of ferrocene and triphenilphosphinein different concentrations (0%, 0.1%, 0.15%, 0.20% and 0.25% in weight)as a precursor carried by a 0.8 l min−1 flux of argon with 5% of hydrogen for30 min. The spectrum shown in Fig. 5a is for the 0.20% concentration. Thediameter range is from 0.7 to 2.2 nm. When compared with nitrogen and borondoping, phosphorous doping is still in the development stage. Phosphorousincorporation in multi-wall carbon nanotube lattices has already beendemonstrated31, and the result discussed in Fig. 5a provides an unprecedentedindication for the incorporation of phosphorous into SWNT lattices.
Thermal treatments (shown in Fig. 5) were carried out in a 0.5 l min−1
argon flow to avoid tube oxidation, for 30 min at 200, 400 and 600 ◦C.
882 nature materials VOL 7 NOVEMBER 2008 www.nature.com/naturematerials
© 2008 Macmillan Publishers Limited. All rights reserved.

ARTICLES
The SWNT samples used in the near-field measurements were producedby arc-discharge, dispersed in a solution of dichloroethane, sonicated in anultrasonic bath and spin-cast at 3000 r.p.m. onto a glass coverslip. The samplewas then inspected by confocal Raman scattering. The resulting images revealedisolated spots indicative of well-separated nanotubes. The observation of thelocalized G′
D peak, along with the bi-modal n/p-type-dependent G′
D behaviourin agreement with gate-induced doping experiments in carbon nanotubes26,represents the initial motivation for this study.
The graphene sample was obtained by micromechanical cleavage ofgraphite on the surface of a Si sample with a 300 nm layer of SiO2.
EXPERIMENTAL DETAILSFar-field Raman measurements were carried out with a Dilor XYtriple-monochromator equipped with a CCD (charged-coupled device)detector. The backscattering configuration using a ×80 objective and differentexcitation laser energies were used for resonance micro-Raman measurements.The excitation came from an ArKr laser (Elaser = 1.91, 2.18, 2.41 and 2.54 eV).Mapping of the RBM dependence on Elaser was carried out with a larger numberof excitation energies, ranging from 1.61 to 2.71 eV (ArKr, Ti:sapphire and dyelaser) for a precise characterization of the sample diameters.
Near-field Raman and near-field photoluminescence measurementswere carried out on an inverted optical microscope with the addition of anx,y-stage for raster-scanning samples. Light from a He–Ne laser (633 nm)is reflected by means of a dichroic beam splitter and then focused onto thesurface of the sample using a high numerical aperture objective (N.A. = 1.4),with 103 W cm−2 at the sample. Having obtained a tight focal spot at thesample surface, we then position a sharp metal tip into the focal region. Usingthe x,y-scan stage to raster-scan the sample, the Raman scattered light andphotoluminescence are collected by the same microscope objective and recordedusing either a single-photon counting avalanche photodiode or a spectrographwith a CCD cooled to −124 ◦C.
Received 28 February 2008; accepted 19 September 2008; published 19 October 2008.
References1. Jorio, A., Dresselhaus, M. S. & Dresselhaus, G. Carbon Nanotubes: Advanced Topics in the Synthesis,
Structure, Properties and Applications Vol. 111 (Springer Series in Topics in Appl. Phys.,Springer, 2008).
2. Novoselov, K. S. et al. Two-dimensional gas of massless Dirac Fermions in graphene. Nature 438,197–200 (2005).
3. Piscanec, S., Lazzeri, M., Mauri, F., Ferrari, A. C. & Robertson, J. Kohn anomalies andelectron–phonon interactions in graphite. Phys. Rev. Lett. 93, 185503 (2004).
4. Ando, T. Anomaly of optical phonon in monolayer graphene. J. Phys. Soc. Jpn. 75, 124701 (2006).5. Tsang, J. C., Freitag, M., Perebeinos, V., Liu, J. & Avouris, P. Doping and phonon renormalization in
carbon nanotubes. Nature Nanotech. 2, 725–730 (2007).6. Pisana, S. et al. Breakdown of the adiabatic Born–Oppenheimer approximation in graphene. Nature
Mater. 6, 198–201 (2007).7. Terrones, M., Souza Filho, A. G. & Rao, A. M. Doped Carbon Nanotubes: Synthesis, Characterization
and Applications Vol. 111, 531–566 (Springer Topics in Appl. Phys., Springer, 2008).8. Jones, M. et al. Extrinsic and intrinsic effects on the excited-state kinetics of single-walled carbon
nanotubes. Nano Lett. 7, 300–306 (2007).9. Cognet, L. et al. Stepwise quenching of exciton fluorescence in carbon nanotubes by single-molecule
reactions. Science 316, 1465–1468 (2007).10. Ferrari, A. C. & Robertson, J. Raman spectroscopy in carbons: From nanotubes to diamond. Phil.
Trans. R. Soc. Lond. A 362, 2267–2565 (2004).11. Pimenta, M. A. et al. Studying disorder in graphite-based systems by Raman spectroscopy. Phys.
Chem. Chem. Phys. 9, 1276–1291 (2007).12. Thomsen, C. & Reich, S. Double resonant Raman scattering in graphite. Phys. Rev. Lett. 85,
5214 (2000).13. Saito, R. et al. Probing phonon dispersion relations of graphite by double resonance Raman
scattering. Phys. Rev. Lett. 88, 027401 (2002).
14. Rao, A. M., Eklund, P. C., Bandow, S., Thess, A. & Smalley, R. E. Evidence for charge transfer indoped carbon nanotube bundles from Raman scattering. Nature 388, 257–259 (1997).
15. McGuire, K., Gothard, N., Gai, P. L., Dresselhaus, M. S., Sumanasekera, G. & Rao, A. M. Synthesisand Raman characterization of boron-doped single-walled carbon nanotubes. Carbon 43,219–227 (2005).
16. Villapando-Paez, F. et al. Synthesis and characterization of long strands of nitrogen-dopedsingle-walled carbon nanotubes. Chem. Phys. Lett. 424, 345–352 (2006).
17. Ferrari, A. C. et al. Raman spectrum of graphene and graphene layers. Phys. Rev. Lett. 97,187401 (2006).
18. Gupta, A., Chen, G., Joshi, P., Tadigadapa, S. & Eklund, P. C. Raman scattering from high-frequencyphonons in supported n-graphene layer films. Nano Lett. 6, 2667–2673 (2006).
19. Malard, L. M. et al. Probing the electronic structure of bilayer graphene by Raman scattering. Phys.Rev. B 76, 201401 (2007).
20. Anderson, N., Hartschuh, A., Cronin, S. & Novotny, L. Nanoscale vibrational analysis of single-walledcarbon nanotubes. J. Am. Chem. Soc. 127, 2533–2537 (2005).
21. Dresselhaus, M. S., Dresselhaus, G., Saito, R. & Jorio, A. Raman spectroscopy of carbon nanotubes.Phys. Rep. 409, 47–99 (2005).
22. Souza Filho, A. G. et al. Competing spring constant versus double resonance effects on the propertiesof dispersive modes in isolated single-wall carbon nanotubes. Phys. Rev. B 67, 035427 (2003).
23. Samsonidze, Ge. G. et al. Phonon trigonal warping effect in graphite and carbon nanotubes. Phys.Rev. Lett. 90, 027403 (2003).
24. Das, A. et al. Monitoring dopants by Raman scattering in an electrochemically top-gated graphenetransistor. Nature Nanotech. 3, 210–215 (2008).
25. Das, A. et al. Phonon renormalization in doped bilayer graphene, Preprint at<http://arxiv.org/abs/0807.1631> (2008).
26. Corio, P., Jorio, A., Demir, N. & Dresselhaus, M. S. Spectro-electrochemical studies of single wallcarbon nanotubes films. Chem. Phys. Lett. 392, 396–402 (2004).
27. Lazzeri, M., Attaccalite, C., Wirtz, L. & Mauri, F. Impact of the electron–electron correlation onphonon dispersions: Failure of LDA and GGA functionals in graphene and graphite. Phys. Rev. B 78,081406(R) (2008).
28. Peres, N. M. R. et al. Electron waves in chemically substituted graphene. Europhys. Lett. 80,67007 (2007).
29. Hwang, E. H., Hu, B. Y.-K. & Sarma, S. D. Density dependent exchange contribution to ∂η/∂n andcompressibility in graphene. Phys. Rev. Lett. 99, 226801 (2007).
30. Park, C-.H., Giustino, F., Cohen, M. L. & Louie, S. G. Velocity renormalization and carrier lifetime ingraphene from the electron–phonon interaction. Phys. Rev. Lett. 99, 086804 (2007).
31. Cruz-Silva, E. et al. Heterodoped nanotubes: Theory, synthesis, and characterization ofphosphorus-nitrogen doped multiwalled carbon nanotubes. Acs Nano. 2, 441–448 (2008).
32. Cardenas, J. F. & Gromov, A. Double resonance Raman scattering in solubilised single walled carbonnanotubes. Chem. Phys. Lett. 442, 409–412 (2007).
33. Pfeiffer, R., Kuzmany, H., Simon, F., Bokova, S. N. & Obraztsova, E. Resonance Raman scatteringfrom phonon overtones in double-wall carbon nanotubes. Phys. Rev. B 71, 155409 (2005).
34. Freitag, M. et al. Scanning photovoltage microscopy of potential modulations in carbon nanotubes.Appl. Phys. Lett. 91, 031101 (2007).
35. Perebeinos, V. & Avouris, Ph. Phonon and electronic nonradiative decay mechanisms of excitons incarbon nanotubes. Phys. Rev. Lett. 101, 057401 (2008).
36. Murata, M. et al. Superconductivity in thin films of boron–doped carbon nanotubes. Phys. Rev. Lett.101, 027002 (2008).
Supplementary Information accompanies the paper at www.nature.com/naturematerials.
AcknowledgementsThe authors acknowledge A. H. Castro-Neto, R. B. Capaz, J. Lefebvre and R. Dickman for helpfuldiscussions. I.O.M., M.A.P. and A.J. acknowledge financial support from the Rede Nacional dePesquisa em Nanotubos de Carbono, Rede National de SPM, Instituto de Nanotecnologia (MCT-CNPq)and CAPES/DAAD-Probral. A.H. and H.Q. acknowledge financial support from the DeutscheForschungsgemeinschaft (Me 1600/6-1/2). M.T, H.T and J.C.D acknowledge financial support fromCONACYT-Mexico Grants No.45762, 45772, 41464-Inter American Collaboration, 42428-InterAmerican Collaboration and PUE-2004-CO2-9 Fondo Mixto de Puebla. A.M.R acknowledgesK. McGuire and financial support from NSF DMR 0304019. N.A. and L.N. acknowledge financialsupport from the DOE (grant DEFG02-05ER46207) and NSF (grant CHE-0454704).
Author contributionsProject planning: A.J.; sample preparation: I.O.M., N.A., M.T, H.T., J.C.D., A.M.R.; far-fieldmeasurements: I.O.M, M.A.P., A.J.; near-field measurements: N.A., A.H., H.Q., L.N., A.J.; all authorscontributed to data analysis and scientific discussions.
Author informationReprints and permissions information is available online at http://npg.nature.com/reprintsandpermissions.Correspondence and requests for materials should be addressed to L.N. or A.J.
nature materials VOL 7 NOVEMBER 2008 www.nature.com/naturematerials 883
© 2008 Macmillan Publishers Limited. All rights reserved.
Copyright © 2022 FDOKUMEN