Natural hexavalent chromium in groundwaters interacting with ophiolitic rocks
Upload
jainuniversityCategory
view
3download
0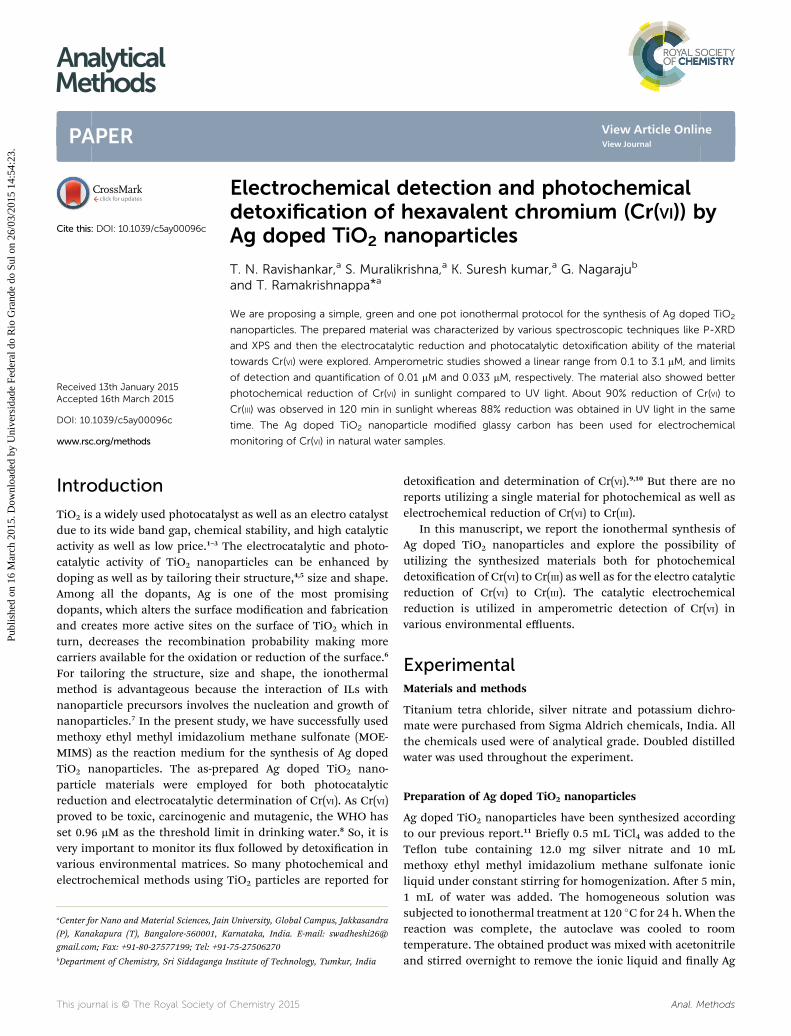
AnalyticalMethods
PAPER
Publ
ishe
d on
16
Mar
ch 2
015.
Dow
nloa
ded
by U
nive
rsid
ade
Fede
ral d
o R
io G
rand
e do
Sul
on
26/0
3/20
15 1
4:54
:23.
View Article OnlineView Journal
Electrochemical
aCenter for Nano and Material Sciences, Jain
(P), Kanakapura (T), Bangalore-560001, K
gmail.com; Fax: +91-80-27577199; Tel: +91bDepartment of Chemistry, Sri Siddaganga I
Cite this: DOI: 10.1039/c5ay00096c
Received 13th January 2015Accepted 16th March 2015
DOI: 10.1039/c5ay00096c
www.rsc.org/methods
This journal is © The Royal Society of
detection and photochemicaldetoxification of hexavalent chromium (Cr(VI)) byAg doped TiO2 nanoparticles
T. N. Ravishankar,a S. Muralikrishna,a K. Suresh kumar,a G. Nagarajub
and T. Ramakrishnappa*a
We are proposing a simple, green and one pot ionothermal protocol for the synthesis of Ag doped TiO2
nanoparticles. The prepared material was characterized by various spectroscopic techniques like P-XRD
and XPS and then the electrocatalytic reduction and photocatalytic detoxification ability of the material
towards Cr(VI) were explored. Amperometric studies showed a linear range from 0.1 to 3.1 mM, and limits
of detection and quantification of 0.01 mM and 0.033 mM, respectively. The material also showed better
photochemical reduction of Cr(VI) in sunlight compared to UV light. About 90% reduction of Cr(VI) to
Cr(III) was observed in 120 min in sunlight whereas 88% reduction was obtained in UV light in the same
time. The Ag doped TiO2 nanoparticle modified glassy carbon has been used for electrochemical
monitoring of Cr(VI) in natural water samples.
Introduction
TiO2 is a widely used photocatalyst as well as an electro catalystdue to its wide band gap, chemical stability, and high catalyticactivity as well as low price.1–3 The electrocatalytic and photo-catalytic activity of TiO2 nanoparticles can be enhanced bydoping as well as by tailoring their structure,4,5 size and shape.Among all the dopants, Ag is one of the most promisingdopants, which alters the surface modication and fabricationand creates more active sites on the surface of TiO2 which inturn, decreases the recombination probability making morecarriers available for the oxidation or reduction of the surface.6
For tailoring the structure, size and shape, the ionothermalmethod is advantageous because the interaction of ILs withnanoparticle precursors involves the nucleation and growth ofnanoparticles.7 In the present study, we have successfully usedmethoxy ethyl methyl imidazolium methane sulfonate (MOE-MIMS) as the reaction medium for the synthesis of Ag dopedTiO2 nanoparticles. The as-prepared Ag doped TiO2 nano-particle materials were employed for both photocatalyticreduction and electrocatalytic determination of Cr(VI). As Cr(VI)proved to be toxic, carcinogenic and mutagenic, the WHO hasset 0.96 mM as the threshold limit in drinking water.8 So, it isvery important to monitor its ux followed by detoxication invarious environmental matrices. So many photochemical andelectrochemical methods using TiO2 particles are reported for
University, Global Campus, Jakkasandra
arnataka, India. E-mail: swadheshi26@
-75-27506270
nstitute of Technology, Tumkur, India
Chemistry 2015
detoxication and determination of Cr(VI).9,10 But there are noreports utilizing a single material for photochemical as well aselectrochemical reduction of Cr(VI) to Cr(III).
In this manuscript, we report the ionothermal synthesis ofAg doped TiO2 nanoparticles and explore the possibility ofutilizing the synthesized materials both for photochemicaldetoxication of Cr(VI) to Cr(III) as well as for the electro catalyticreduction of Cr(VI) to Cr(III). The catalytic electrochemicalreduction is utilized in amperometric detection of Cr(VI) invarious environmental effluents.
ExperimentalMaterials and methods
Titanium tetra chloride, silver nitrate and potassium dichro-mate were purchased from Sigma Aldrich chemicals, India. Allthe chemicals used were of analytical grade. Doubled distilledwater was used throughout the experiment.
Preparation of Ag doped TiO2 nanoparticles
Ag doped TiO2 nanoparticles have been synthesized accordingto our previous report.11 Briey 0.5 mL TiCl4 was added to theTeon tube containing 12.0 mg silver nitrate and 10 mLmethoxy ethyl methyl imidazolium methane sulfonate ionicliquid under constant stirring for homogenization. Aer 5 min,1 mL of water was added. The homogeneous solution wassubjected to ionothermal treatment at 120 �C for 24 h. When thereaction was complete, the autoclave was cooled to roomtemperature. The obtained product was mixed with acetonitrileand stirred overnight to remove the ionic liquid and nally Ag
Anal. Methods
Analytical Methods Paper
Publ
ishe
d on
16
Mar
ch 2
015.
Dow
nloa
ded
by U
nive
rsid
ade
Fede
ral d
o R
io G
rand
e do
Sul
on
26/0
3/20
15 1
4:54
:23.
View Article Online
doped TiO2 nanoparticles were separated by centrifugation. Thenal product was calcined at 400 �C for 3 h.
Preparation of Ag doped TiO2 modied glassy carbonelectrode
Prior to modication, glassy carbon electrode (3 mm diameter)was polished on micro cloth with 1.0, 0.3 and 0.05 micron sizealumina. Then the electrode was sonicated in water for about 10min followed by ethanol. Finally, the electrode was allowed todry at room temperature. About 10 mg of Ag doped TiO2
nanoparticle composite was dispersed well in the solution (2mL distilled water + 10 mL 0.2% Naon) by sonication for 30min. Then 20 mL of the above suspension was cast onto the pre-treated glassy carbon electrode and allowed to dry for 2 h atroom temperature.
Techniques
Electrochemical measurements were performed on a standardthree-electrode electrochemical cell with a CHI 800 electro-chemical workstation (CH Instrument, USA) with a TiO2 Agnanoparticle modied glassy carbon electrode as the workingelectrode, a platinum wire as the counter electrode and asaturated calomel electrode (SCE) as the reference electrode,respectively. All pH measurements were carried out using adigital pH meter MK VI of Systronics make.
Electrochemical monitoring of Cr(VI) in aqueous samples
Amperometric measurements were performed in a stirredsolution with an applied potential of 0.29 V. The electrolyte wasdeaerated with nitrogen gas for 30 min before each measure-ment. Aliquot of tap water was directly injected into the elec-trolyte (0.1 M HCl) for amperometric analysis of Cr(VI) whereasthe lake water samples were ltered using Whatman lter paperbefore analysis.
Fig. 1 SEM images of Ag doped TiO2 nanoparticles.
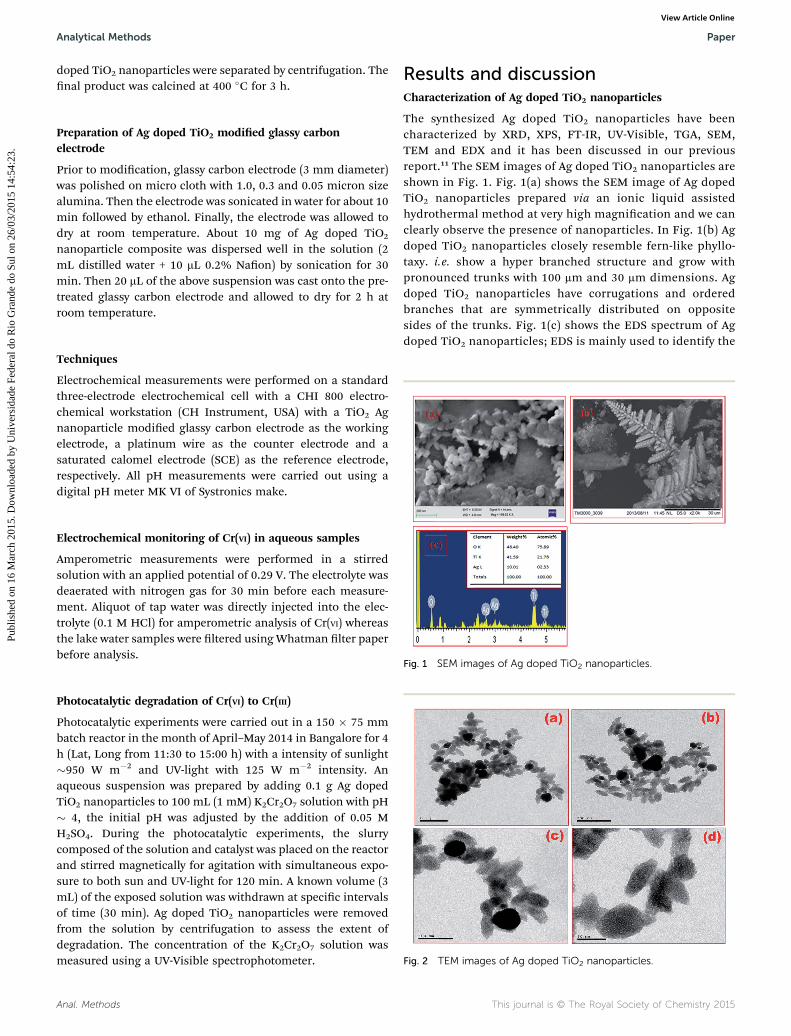
Fig. 2 TEM images of Ag doped TiO2 nanoparticles.
Photocatalytic degradation of Cr(VI) to Cr(III)
Photocatalytic experiments were carried out in a 150 � 75 mmbatch reactor in the month of April–May 2014 in Bangalore for 4h (Lat, Long from 11:30 to 15:00 h) with a intensity of sunlight�950 W m�2 and UV-light with 125 W m�2 intensity. Anaqueous suspension was prepared by adding 0.1 g Ag dopedTiO2 nanoparticles to 100 mL (1 mM) K2Cr2O7 solution with pH� 4, the initial pH was adjusted by the addition of 0.05 MH2SO4. During the photocatalytic experiments, the slurrycomposed of the solution and catalyst was placed on the reactorand stirred magnetically for agitation with simultaneous expo-sure to both sun and UV-light for 120 min. A known volume (3mL) of the exposed solution was withdrawn at specic intervalsof time (30 min). Ag doped TiO2 nanoparticles were removedfrom the solution by centrifugation to assess the extent ofdegradation. The concentration of the K2Cr2O7 solution wasmeasured using a UV-Visible spectrophotometer.
Anal. Methods
Results and discussionCharacterization of Ag doped TiO2 nanoparticles
The synthesized Ag doped TiO2 nanoparticles have beencharacterized by XRD, XPS, FT-IR, UV-Visible, TGA, SEM,TEM and EDX and it has been discussed in our previousreport.11 The SEM images of Ag doped TiO2 nanoparticles areshown in Fig. 1. Fig. 1(a) shows the SEM image of Ag dopedTiO2 nanoparticles prepared via an ionic liquid assistedhydrothermal method at very high magnication and we canclearly observe the presence of nanoparticles. In Fig. 1(b) Agdoped TiO2 nanoparticles closely resemble fern-like phyllo-taxy. i.e. show a hyper branched structure and grow withpronounced trunks with 100 mm and 30 mm dimensions. Agdoped TiO2 nanoparticles have corrugations and orderedbranches that are symmetrically distributed on oppositesides of the trunks. Fig. 1(c) shows the EDS spectrum of Agdoped TiO2 nanoparticles; EDS is mainly used to identify the
This journal is © The Royal Society of Chemistry 2015

Fig. 3 CV graphs obtained (a) on the Ag doped TiO2 nanoparticle modified GC, in different 0.1 M acidic media as electrolytes (scan rate 0.1 mVs�1 and 0.1 mM Cr(VI)). (b) In different concentrations of HCl (0.05 to 0.2 M) as electrolytic medium (scan rate 0.1 mV s�1 and 0.1 mM Cr(VI)).
Paper Analytical Methods
Publ
ishe
d on
16
Mar
ch 2
015.
Dow
nloa
ded
by U
nive
rsid
ade
Fede
ral d
o R
io G
rand
e do
Sul
on
26/0
3/20
15 1
4:54
:23.
View Article Online
elements present in the prepared materials and it clearlyshows the presence of Ti, O, and Ag.11 Fig. 2(a)–(d) show theTEM images of Ag doped TiO2 nanoparticles prepared at 120�C for 1 day, which have a shape almost like rice and the sizeof a nanoparticle is found to be �60 nm. Due to the largeatomic radius of the silver atom, they cannot interpenetratein TiO2 crystals to form a solid solution alloy. Therefore,silver metal distributes in the form of separated nano-particles. In general, the TiO2 particles appear transparent.The dark region indicated by the arrow clearly indicates thepresence of almost spherical shaped Ag particles.11 The samematerial is used for electrochemical monitoring of Cr(VI) inaqueous samples and photocatalytic degradation of Cr(VI) toCr(III).
Fig. 4 CV graphs obtained (a) on different electrodes (A) bare GCelectrode in the absence of 0.1 mM Cr(VI) (scan rate 0.1 mV s�1 and 0.1M HCl electrolyte) (B) bare GC electrode in the presence of 0.1 mMCr(VI) (scan rate 0.1 mV s�1 and 0.1 M HCl electrolyte) (C) Ag dopedTiO2 nanoparticle modified GC in the absence of 0.1 mM Cr(VI) (scanrate 0.1 mV s�1 and 0.1 M HCl electrolyte) (D) Ag doped TiO2 nano-particle modified GC in the presence of 0.1 mM Cr(VI) (scan rate 0.1 mVs�1 and 0.1 M HCl electrolyte).
This journal is © The Royal Society of Chemistry 2015
Electrochemical reduction studies of Cr(VI)
The electrocatalytic properties of the Ag doped TiO2 nano-particles towards Cr(VI) reduction were evaluated by CV studies.Various parameters that affect the electrochemical reduction ofthe Cr(VI) were evaluated.
Optimization of the electrolytic medium and its concentration
It was proved that the acidic environment plays a crucial role inelectrocatalytic reduction of Cr(VI).12,13 Various acidic electro-lytes were tested for electrocatalytic reduction of Cr(VI) by CVstudies. From Fig. 3(a) it is evident that HCl is the suitableelectrolyte for the electrochemical reduction of Cr(VI) becausethe well-dened irreversible reduction peak for 0.1 mM Cr(VI)was obtained compared to HNO3 and H2SO4. As chloride, ionsare normally present in natural samples it is advisable to use thesame medium for the electro reduction process. To get furthermechanistic insights, the effect of pH was studied with differentconcentrations of HCl. From Fig. 3(b), it is clear that thereduction current increases initially with the concentration of
Fig. 5 CV graphs with different concentrations (0–8 mM) of Cr(VI)(scan rate 0.1 mV s�1 and 0.1 M HCl electrolyte).
Anal. Methods

Fig. 6 CV graphs obtained (a) with different scan rates, from 0.1 to 1.0 mV s�1 (scan rate 0.1 mV s�1, 0.1 mM Cr(VI) and 0.1 M HCl electrolyte). (b)The plot of current vs. square root of scan rate.
Fig. 7 Amperometric graphs obtained on the Ag doped TiO2 nano materials modified GC electrode (a) potential 0.29 V, electrolytic medium 0.1M HCl and Cr(VI) (0 to 3.1 mM), (b) interference studies carried out with a potential of 0.29 V, electrolytic medium.
Analytical Methods Paper
Publ
ishe
d on
16
Mar
ch 2
015.
Dow
nloa
ded
by U
nive
rsid
ade
Fede
ral d
o R
io G
rand
e do
Sul
on
26/0
3/20
15 1
4:54
:23.
View Article Online
the acid (up to 0.1 M) but later the trend reversed. The decreasein the reduction current at higher concentrations (beyond 0.1M) of the HCl mediummay be due to the increase in the Cl� ionconcentration in the medium. Therefore, 0.1 M HCl was used asthe electrolyte in all electrochemical studies.
Table 1 Interference studies
Interferent ion Threshold limit (mM)
Fe3+ 1000Cr3+ 1000Mn7+ 500K+ 2000Na+ 2000Mg2+ 2000Ca2+ 2000NO3
� 500
Cyclic voltammetric studies
Fig. 4 shows the cyclic voltammograms obtained for Cr(VI) in 0.1M HCl medium on bare GC as well as Ag doped TiO2 nano-particle composite modied GC. There is an reduction peakaround 0.289 V on Ag doped TiO2 nanoparticle compositemodied GC whereas there is no such peak obtained for thesame concentration of Cr(VI) on the bare GC electrode. Thisconrms that the Ag doped TiO2 nanoparticle compositematerials catalyzed the electrochemical reduction processotherwise the reduction is very insignicant on bare GC andcannot be used for detection of Cr(VI) in microgram levels. FromFig. 5 it is clear that the reduction current increases linearlywith the concentration of Cr(VI). The interesting thing in thepresent studies is that, the reduction potential obtained around0.29 V, which is a more positive potential than some of thereported gold based electrodes and with increase in scan ratethere is a negative shi in reduction potentials indicating that
Anal. Methods
the electrochemical process is irreversible14 (Fig. 6(a)). Fig. 6(b)shows the relationship between reduction peak currents andscan rates. Further, the reduction peak currents are linearlyrelated to the square root of the scan rates. This conrms thatthe kinetics of the reaction is diffusion controlled.
Determination of Cr(VI) by amperometry
The analytical characteristics of the Ag doped TiO2 nano-material modied GC electrode towards Cr(VI) monitoring wasevaluated by amperometry. Under optimized conditions the
This journal is © The Royal Society of Chemistry 2015
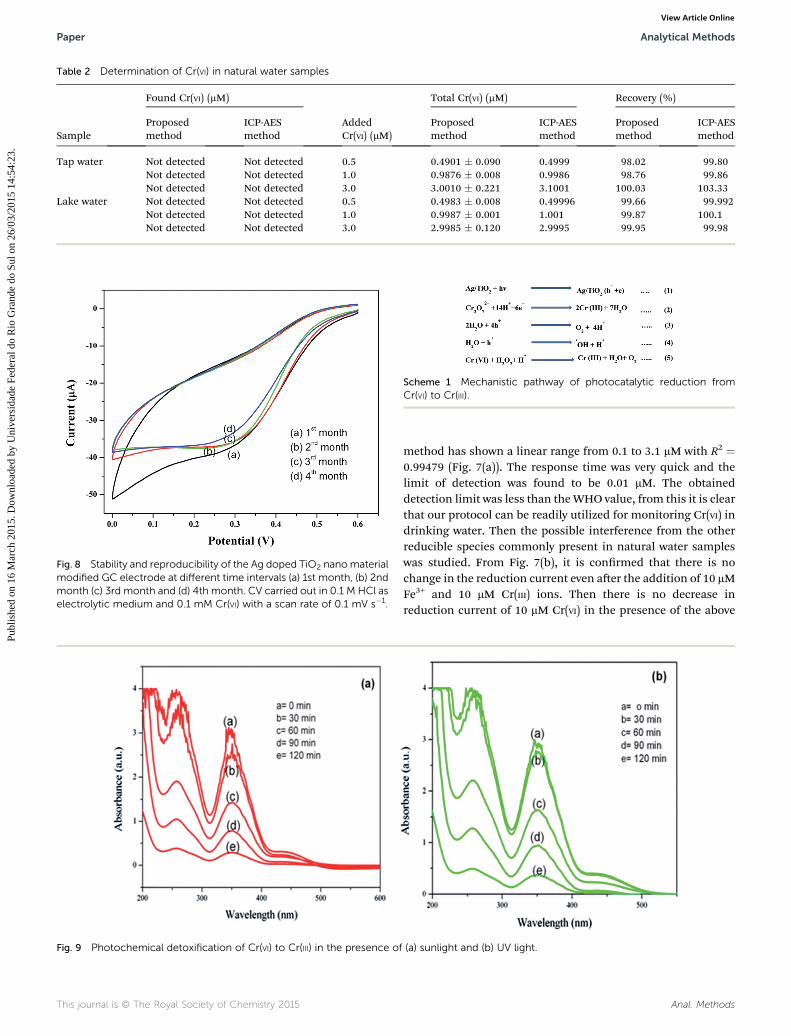
Table 2 Determination of Cr(VI) in natural water samples
Sample
Found Cr(VI) (mM)
AddedCr(VI) (mM)
Total Cr(VI) (mM) Recovery (%)
Proposedmethod
ICP-AESmethod
Proposedmethod
ICP-AESmethod
Proposedmethod
ICP-AESmethod
Tap water Not detected Not detected 0.5 0.4901 � 0.090 0.4999 98.02 99.80Not detected Not detected 1.0 0.9876 � 0.008 0.9986 98.76 99.86Not detected Not detected 3.0 3.0010 � 0.221 3.1001 100.03 103.33
Lake water Not detected Not detected 0.5 0.4983 � 0.008 0.49996 99.66 99.992Not detected Not detected 1.0 0.9987 � 0.001 1.001 99.87 100.1Not detected Not detected 3.0 2.9985 � 0.120 2.9995 99.95 99.98
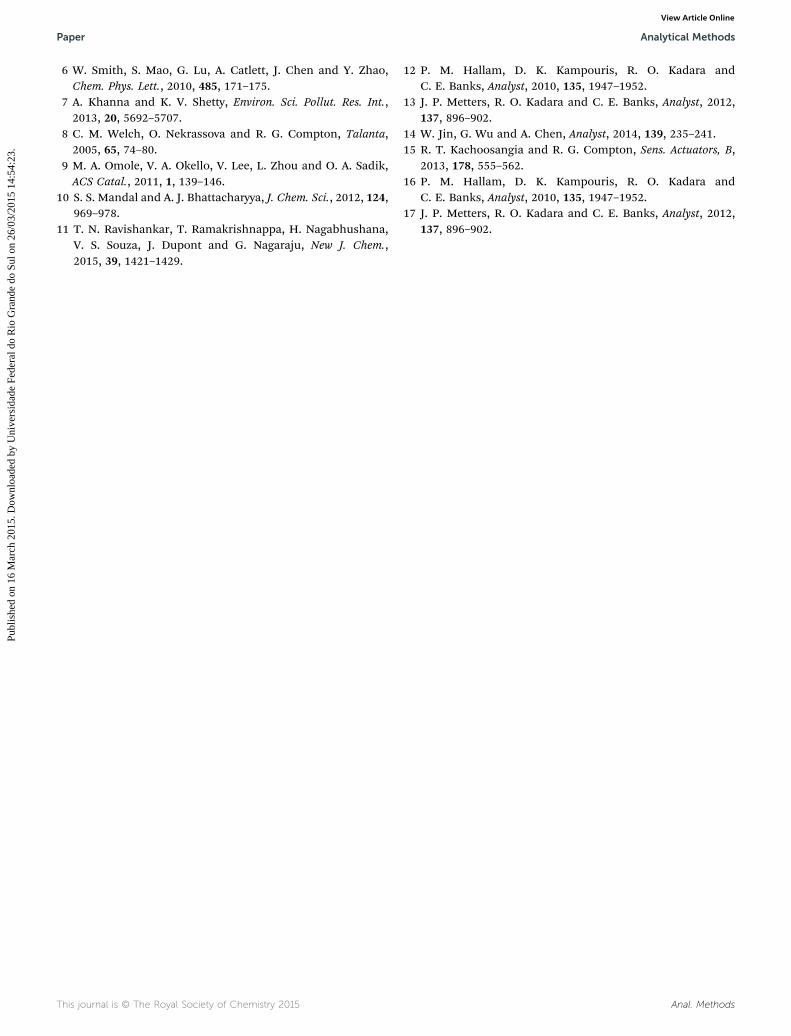
Fig. 9 Photochemical detoxification of Cr(VI) to Cr(III) in the presence of
Fig. 8 Stability and reproducibility of the Ag doped TiO2 nanomaterialmodified GC electrode at different time intervals (a) 1st month, (b) 2ndmonth (c) 3rd month and (d) 4th month. CV carried out in 0.1 M HCl aselectrolytic medium and 0.1 mM Cr(VI) with a scan rate of 0.1 mV s�1.
Scheme 1 Mechanistic pathway of photocatalytic reduction fromCr(VI) to Cr(III).
This journal is © The Royal Society of Chemistry 2015
Paper Analytical Methods
Publ
ishe
d on
16
Mar
ch 2
015.
Dow
nloa
ded
by U
nive
rsid
ade
Fede
ral d
o R
io G
rand
e do
Sul
on
26/0
3/20
15 1
4:54
:23.
View Article Online
method has shown a linear range from 0.1 to 3.1 mM with R2 ¼0.99479 (Fig. 7(a)). The response time was very quick and thelimit of detection was found to be 0.01 mM. The obtaineddetection limit was less than theWHO value, from this it is clearthat our protocol can be readily utilized for monitoring Cr(VI) indrinking water. Then the possible interference from the otherreducible species commonly present in natural water sampleswas studied. From Fig. 7(b), it is conrmed that there is nochange in the reduction current even aer the addition of 10 mMFe3+ and 10 mM Cr(III) ions. Then there is no decrease inreduction current of 10 mM Cr(VI) in the presence of the above
(a) sunlight and (b) UV light.
Anal. Methods

Table 3 Comparison of the analytical parameters of the proposed method with the reported protocols
ElectrodeReduction potential(V)
Linear range(mM)
Limit of detection(mM) Reference
Gold electrode — — 4.3 8Gold plated carbon based composite 0.5 20–2000 4.4 15Graphite screen printed electrode 0.025 100–1000 19.0 16Gold screen printed macro electrodes — 10–1600 4.4 17Au nanoparticle-decorated titania nanotubes on gold electrode — 0.1–105 0.03 14Ag doped TiO2 on glassy carbon 0.289 0.1–3.1 0.033 Present work
Analytical Methods Paper
Publ
ishe
d on
16
Mar
ch 2
015.
Dow
nloa
ded
by U
nive
rsid
ade
Fede
ral d
o R
io G
rand
e do
Sul
on
26/0
3/20
15 1
4:54
:23.
View Article Online
said ions in the medium. The threshold limit values of thevarious cations and anions present commonly in water for Cr(VI)determination are given in Table 1. To check the practicalapplicability of the method we had carried out the chromiumdetection in natural water samples collected from the lakes andin tap waters. The results are presented in Table 2. Chromiumwas not detected in the tap water as well as lake water samples,then we spiked the samples with Cr(VI) and recovery studieshave been carried out and the recovery values are found to bemore than 95%. The results obtained by our method werevalidated by analyzing the samples by the ICP-AES techniqueand the results of the proposed method were found to be ingood agreement with ICP-AES analysis results.
Repeatability, reproducibility and stability of the sensor
For any sensor the above parameters are very important. Inorder to assess the repeatability of the sensor ve replicate CVmeasurements were performed with 0.1 mM Cr(VI) with a scanrate of 0.1 mV s�1 in 0.1 M HCl. The cathodic peak currentsobtained were the same and the RSD of these ve measure-ments were found to be 1.2%. This study conrms that thesensor has considerable repeatability for Cr(VI) reduction. Thenfor reproducibility 5 electrodes (Ag doped TiO2 nanoparticlemodied GC) were prepared in a similar manner and Cr(VI)reduction was studied by CV with 0.1 mM Cr(VI) with a scan rateof 0.1 mV s�1 in 0.1 M HCl. The differences in cathodic peakcurrents obtained were negligible and the RSD of thesemeasurements was 3.9%. Finally, the stability of the sensor wasstudied by conducting CV measurements with 0.1 mM Cr(VI)with a scan rate of 0.1 mV s�1 in 0.1 M HCl with Ag doped TiO2
nanoparticle modied GC electrodes stored at ambienttemperature for about 4 months. The electrode exhibited thesame performance i.e. almost the same cathodic peak currentseven aer 4 months with a retention of 93% of that of the peakcurrent obtained in the initial days (Fig. 8). All these studiesclearly indicate that the present sensor is highly reproducible,repeatable and exhibits stability for a longer time.
Photochemical detoxication of Cr(VI)
Photochemical detoxication of Cr(VI) to Cr(III) in the presenceof sunlight and UV light is shown in Fig. 9(a) and (b), respec-tively. Our catalyst is found to be more active in sunlightcompared to UV light. The photocatalytic reduction of K2Cr2O7
(1 � 10�3 M) having pH 4 was carried out by adding 0.1 g Ag
Anal. Methods
doped TiO2 nanoparticles into a photocatalytic reactor insunlight; it is clear that within 120 min about 90% reductionwas achieved, whereas in UV light about 88% reduction wasachieved. This clearly indicates that our material showed goodphotocatalytic reduction from Cr(VI) to Cr(III) in sunlightcompared to the UV-light. This may be due to the decrease inthe band gap of TiO2 particles achieved by doping of Ag. Themechanistic pathway of photocatalytic reduction from Cr(VI) toCr(III) is shown in Scheme 1.
Conclusions
In this work, we have demonstrated a simpler and greenerprotocol for ionic liquid-assisted hydrothermal synthesis of Agdoped TiO2 nanoparticles for photochemical detoxication aswell as electrocatalytic reduction of Cr(VI) to Cr(III). The preparedmaterials showed better photocatalytic activity in sunlightcompared to UV light, which is advantageous in photo catalyticstudies. The above material also showed better electrochemicalreduction properties in shiing the reduction current of Cr(VI)to the positive side when compared to some of the reportedones (Table 3). More importantly, the detection limits obtainedwere lower than those of the WHO guidelines. Hence, ourmaterial can be scaled-up for the development of onlinemonitoring electrochemical systems for Cr(VI) for drinkingwater analysis and photocatalytic reacting systems for detoxi-cation of drinking water.
Acknowledgements
One of the authors, Ravishankar TN wishes to acknowledge JainUniversity for nancial support to carry out the research work.
References
1 B. Cheng, Y. Le and J. Yu, J. Hazard. Mater., 2010, 117, 971–977.
2 W. X. Li, J. Austra. Ceram. Soc., 2013, 49, 41–46.3 A. L. Manoj, V. Shaji and S. N. Santhosh, Catalysts, 2012, 2,572–601.
4 X. B. Li, Q. Liu, X. Y. Jian and J. Huang, Int. J. Electrochem.Sci., 2012, 7, 11519–11527.
5 G. Nagaraju, T. N. Ravishankar, K. Manjunatha, S. Sarkar,H. Nagabhushana, R. Goncalves and J. Dupont, Mater.Lett., 2013, 109, 27–30.
This journal is © The Royal Society of Chemistry 2015
Paper Analytical Methods
Publ
ishe
d on
16
Mar
ch 2
015.
Dow
nloa
ded
by U
nive
rsid
ade
Fede
ral d
o R
io G
rand
e do
Sul
on
26/0
3/20
15 1
4:54
:23.
View Article Online
6 W. Smith, S. Mao, G. Lu, A. Catlett, J. Chen and Y. Zhao,Chem. Phys. Lett., 2010, 485, 171–175.
7 A. Khanna and K. V. Shetty, Environ. Sci. Pollut. Res. Int.,2013, 20, 5692–5707.
8 C. M. Welch, O. Nekrassova and R. G. Compton, Talanta,2005, 65, 74–80.
9 M. A. Omole, V. A. Okello, V. Lee, L. Zhou and O. A. Sadik,ACS Catal., 2011, 1, 139–146.
10 S. S. Mandal and A. J. Bhattacharyya, J. Chem. Sci., 2012, 124,969–978.
11 T. N. Ravishankar, T. Ramakrishnappa, H. Nagabhushana,V. S. Souza, J. Dupont and G. Nagaraju, New J. Chem.,2015, 39, 1421–1429.
This journal is © The Royal Society of Chemistry 2015
12 P. M. Hallam, D. K. Kampouris, R. O. Kadara andC. E. Banks, Analyst, 2010, 135, 1947–1952.
13 J. P. Metters, R. O. Kadara and C. E. Banks, Analyst, 2012,137, 896–902.
14 W. Jin, G. Wu and A. Chen, Analyst, 2014, 139, 235–241.15 R. T. Kachoosangia and R. G. Compton, Sens. Actuators, B,
2013, 178, 555–562.16 P. M. Hallam, D. K. Kampouris, R. O. Kadara and
C. E. Banks, Analyst, 2010, 135, 1947–1952.17 J. P. Metters, R. O. Kadara and C. E. Banks, Analyst, 2012,
137, 896–902.
Anal. Methods
Copyright © 2022 FDOKUMEN