Electrochemical characterization of galvanically coupled single phases and nanocrystalline...
11
Electrochemical characterization of galvanically coupled single phases and nanocrystalline NdFeB-based magnets in NaCl solutions A.A. EL-MONEIM 1,2 and A. GEBERT 2, * 1 Physical Chemistry Department, National Research Center, Cairo, Egypt 2 Institute for Solid State and Materials Research Dresden, PO Box 270016, D-01171Dresden, Germany (*author for correspondence, fax: +49 (0)351 4659 541, e-mail: [email protected]) Received 26 October 2002; accepted in revised form 28 February 2003 Key words: galvanic coupling, intergranular corrosion, NdFeB permanent magnet, pitting Abstract Galvanic interaction between intermetallic phases occurring in NdFeB-based permanent magnets was investigated for the purpose of understanding the electrochemical behaviour of nanocrystalline hot pressed Nd 14 Fe 80 B 6 and Nd 12 Dy 2 Fe 73.3 Co 6.6 Ga 0.6 B 5.6 magnets in 0.5 M NaCl solution of pH 8.4. The microstructure of multiphase nanocrystalline magnets was characterized using XRD, SEM and EDX techniques. The electrochemical behaviour was assessed using zero resistance amperometry and potentiodynamic polarization measurements. From the electrochemical data obtained, it was concluded that the Nd-rich phase/ferromagnetic (/)- phase couple generated the highest galvanic current density. The strength of the galvanic coupling effect was typically controlled by the oxidation rate of Nd-rich phase, which is the least polarizable. Pitting and intergranular corrosion were detected on the surface of nanocrystalline magnets and found to be dependent on each other, since intergranular corrosion processes nucleated on the pit walls and propagated from there. Crystallographic tunneling was found to be the way of both pit and intergranular corrosion propagation. Co and Ga additions generally increase localized corrosion resistance of NdFeB-based magnets due to the significant reduction in the strength of galvanic coupling effect between magnet phases. 1. Introduction NdFeB-based magnets find a rapidly growing variety of applications, because of their outstanding magnetic properties, like high remanence, coercivity and energy products [1]. On the other hand, the corrosion resistance of those magnets is one of the key parameters in assessing their applicability. NdFeB magnets are very sensitive to climatic and corrosive environments. The poor corrosion resistance of these magnets is due to their high content of Nd and the coexistence of several phases in the microstructure, which are necessary to ensure the required magnetic properties [2]. The micro- structure comprises of the ferromagnetic matrix-phase or F-phase (Nd 2 Fe 14 B) surrounded by intergranular regions consisting of B-rich (Nd 1+e Fe 4 B 4 ) and Nd-rich (Nd 4 Fe) phases [3]. Other beneficial phases stabilized by alloying additions such as Al, Co, Cu, Cr, Mo, Nb and Ga may also be present [2–4]. Meanwhile, the volume fraction of the ferromagnetic matrix phase in sintered microcrystalline magnets is about 84%, while those of Nd and B-rich phases are 14 and 2%, respectively. In hot pressed nanocrystalline magnets, the total volume fraction of intergranular phases is reduced to about 13% due to the low Nd content in these types of magnets [3]. Hence, this significant variation in the chemical com- position and volume fraction of magnet phases with large electrochemical potential differences between them present an obvious threat of galvanic corrosion, which has not been fully clarified, yet. So far, the majority of corrosion tests have been performed on single phases of the magnet and micro- crystalline permanent magnets prepared by sintering rather than on nanocrystalline magnets prepared by nonequilibrium powder preparation techniques and by subsequent hot pressing. Tests have been conducted in humid atmospheres [3] and electrolytes such as H 3 PO 4 , H 2 SO 4 , Na 2 HPO 4 and Ringers solution under deaer- ated conditions [3, 5–7]. According to Sugimoto [8], the susceptibility of single phases to dissolution in acidic media increased in the following order: Nd 2 Fe 14 B < Nd 4 Fe < Nd 1+e Fe 4 B 4 . Schultz et al. [3] referred to some other order in humid atmosphere: Nd 2 Fe 14 B < Nd 1+e Fe 4 B 4 < Nd 4 Fe. A third order, proposed by Bala et al. [9], was Nd 1+e Fe 4 B 4 < Nd 2 - Fe 14 B < Nd 4 Fe in 0.5 M Na 2 SO 4 solutions of several pH values. In the view of these facts, the Nd–rich intergranular phase is generally considered as local anode with respect to the matrix phase. Consequently, the corrosion mechanism of NdFeB magnets in the Journal of Applied Electrochemistry 33: 795–805, 2003. 795 Ó 2003 Kluwer Academic Publishers. Printed in the Netherlands.
-
Upload
independent -
Category
Documents
-
view
1 -
download
0
Transcript of Electrochemical characterization of galvanically coupled single phases and nanocrystalline...
Electrochemical characterization of galvanically coupled single phases
and nanocrystalline NdFeB-based magnets in NaCl solutions
A.A. EL-MONEIM1,2 and A. GEBERT2,*1Physical Chemistry Department, National Research Center, Cairo, Egypt2Institute for Solid State and Materials Research Dresden, PO Box 270016, D-01171Dresden, Germany(*author for correspondence, fax: +49 (0)351 4659 541, e-mail: [email protected])
Received 26 October 2002; accepted in revised form 28 February 2003
Key words: galvanic coupling, intergranular corrosion, NdFeB permanent magnet, pitting
Abstract
Galvanic interaction between intermetallic phases occurring in NdFeB-based permanent magnets was investigatedfor the purpose of understanding the electrochemical behaviour of nanocrystalline hot pressed Nd14Fe80B6 andNd12Dy2Fe73.3Co6.6Ga0.6B5.6 magnets in 0.5 M NaCl solution of pH 8.4. The microstructure of multiphasenanocrystalline magnets was characterized using XRD, SEM and EDX techniques. The electrochemical behaviourwas assessed using zero resistance amperometry and potentiodynamic polarization measurements. From theelectrochemical data obtained, it was concluded that the Nd-rich phase/ferromagnetic (/)- phase couple generatedthe highest galvanic current density. The strength of the galvanic coupling effect was typically controlled by theoxidation rate of Nd-rich phase, which is the least polarizable. Pitting and intergranular corrosion were detected onthe surface of nanocrystalline magnets and found to be dependent on each other, since intergranular corrosionprocesses nucleated on the pit walls and propagated from there. Crystallographic tunneling was found to be the wayof both pit and intergranular corrosion propagation. Co and Ga additions generally increase localized corrosionresistance of NdFeB-based magnets due to the significant reduction in the strength of galvanic coupling effectbetween magnet phases.
1. Introduction
NdFeB-based magnets find a rapidly growing variety ofapplications, because of their outstanding magneticproperties, like high remanence, coercivity and energyproducts [1]. On the other hand, the corrosion resistanceof those magnets is one of the key parameters inassessing their applicability. NdFeB magnets are verysensitive to climatic and corrosive environments. Thepoor corrosion resistance of these magnets is due totheir high content of Nd and the coexistence of severalphases in the microstructure, which are necessary toensure the required magnetic properties [2]. The micro-structure comprises of the ferromagnetic matrix-phaseor F-phase (Nd2Fe14B) surrounded by intergranularregions consisting of B-rich (Nd1+eFe4B4) and Nd-rich(Nd4Fe) phases [3]. Other beneficial phases stabilized byalloying additions such as Al, Co, Cu, Cr, Mo, Nb andGa may also be present [2–4]. Meanwhile, the volumefraction of the ferromagnetic matrix phase in sinteredmicrocrystalline magnets is about 84%, while those ofNd and B-rich phases are 14 and 2%, respectively. Inhot pressed nanocrystalline magnets, the total volumefraction of intergranular phases is reduced to about 13%due to the low Nd content in these types of magnets [3].
Hence, this significant variation in the chemical com-position and volume fraction of magnet phases withlarge electrochemical potential differences between thempresent an obvious threat of galvanic corrosion, whichhas not been fully clarified, yet.So far, the majority of corrosion tests have been
performed on single phases of the magnet and micro-crystalline permanent magnets prepared by sinteringrather than on nanocrystalline magnets prepared bynonequilibrium powder preparation techniques and bysubsequent hot pressing. Tests have been conducted inhumid atmospheres [3] and electrolytes such as H3PO4,H2SO4, Na2HPO4 and Ringers solution under deaer-ated conditions [3, 5–7]. According to Sugimoto [8],the susceptibility of single phases to dissolution inacidic media increased in the following order:Nd2Fe14B < Nd4Fe < Nd1+eFe4B4. Schultz et al. [3]referred to some other order in humid atmosphere:Nd2Fe14B < Nd1+eFe4B4 < Nd4Fe. A third order,proposed by Bala et al. [9], was Nd1+eFe4B4 < Nd2-Fe14B < Nd4Fe in 0.5 M Na2SO4 solutions of severalpH values. In the view of these facts, the Nd–richintergranular phase is generally considered as localanode with respect to the matrix phase. Consequently,the corrosion mechanism of NdFeB magnets in the
Journal of Applied Electrochemistry 33: 795–805, 2003. 795� 2003 Kluwer Academic Publishers. Printed in the Netherlands.

above electrolytes was described as preferential dissolu-tion of intergranular phases followed by the separationof ferromagnetic grains from magnet surface beforetheir dissolution [3, 10–13].Since the corrosion of NdFeB magnets is of concern
in industrial and marine environments as well as inautomotive environment containing de-icing salts, testsperformed in aerated, neutral electrolytes such asNa2SO4 and NaCl will probably be more relevant tothe actual service conditions. The corrosion behaviourof NdFeB magnets and their constituent phases inenvironments containing chloride ions has not beendocumented in detail. The aim of this study is tocharacterize the electrochemical behaviour of uncoupledand galvanically coupled single phases occurring inNdFeB-based magnets in weakly alkaline solutioncontaining chloride ions. A deeper knowledge of theseelectrochemical phenomena, such as pitting and galva-nic corrosion, contributes to a more comprehensiveunderstanding of the overall complex corrosion processof hot pressed nanocrystalline NdFeB magnets with andwithout Co and Ga additions.
2. Experimental details
The as-cast material of the three phases generallyoccurring in NdFeB-based magnets were received fromthe Department of Chemistry of the Technical Univer-sity of Czestochowa, Poland. Microstructural analysisand chemical composition of these phases were verifiedand identified in detail elsewhere [3, 9, 14]. Additionally,two types of bulk material prepared from commercialnanocrystalline melt-spun powders (ribbon flakes) of thenominal compositions Nd14Fe80B6 and Nd12Dy2Fe73.3-Co6.6Ga0.6B5.6 with commercial names MQP-A andMQU-G (from Magenquench Int.), respectively, wereused as typical examples for permanent magnets. Thepowders were hot pressed in vacuum at 700 �C, applyinga pressure of 150 MPa to obtain a highly densifiedmagnet with diameter of 8 mm and a height of 8 mm.Characterization of grain sizes, shapes and phasedistribution were carried out on hot pressed magnetsusing scanning electron microscopy (SEM, Jeol JSM-6400) complemented with energy dispersive X-ray anal-ysis (EDX) (Noran-Voyager).Singles phases and permanent magnets were cut and
embedded in epoxy resin and mechanically polished upto 1 lm using diamond paste. After polishing, testspecimens were ultrasonically cleaned with ethanol anddried in air. Electrochemical measurements were per-formed in aerated borate buffer solution (0.075 M
Na2B4O7–0.3 M H3BO4) with pH 8.4 containing 0.5 M
NaCl.For time dependent galvanic corrosion measurements,
a nonperturbative electrochemical technique such aszero-resistance amperometry (ZRA) is required. Adetailed description of this type of measurement is givenelsewhere [15, 16]. By inserting a zero-resistance amp-
erometer in the electrical circuit that connects two singlephases, it was possible to measure the galvanic currentbetween phases and simultaneously, the galvanic poten-tial of the pair was registered against a saturated calomelelectrode (SCE) as a reference electrode. The galvaniccurrent and potential was measured at sampling rate of1 point s)1. The ZRA was programmed to record 600points potential and current plots for each hour of total24 h measurement duration.Polarization measurements were generated using a
Solartron electrochemical interface, which also acted asZRA. The auxiliary electrode was platinum. Potentialsweep rate was 1 mV s)1. After open circuit immersionor polarization, investigations using light optical mi-croscopy and scanning electron microscopy (SEM) wereperformed on the samples in order to examine andlocate pits and/or intergranular corrosion phenomena.
3. Results and discussion
3.1. Microstructural characterization of nanocrystallinemagnets
Figure 1(a) and (b) show SEM micrographs in thebackscattered electron mode of polished sample surfacesfor hot pressed Nd14Fe80B6 (MQP-A) and Nd12Dy2-Fe73.3Co6.6Ga0.6B5.6 (MQU-G) magnets, respectively. Inthese micrographs, finely dispersed clusters and contin-uous regions of white contrast with a thickness of about1�3 lm at the ribbon flake boundaries were identifiedby EDX analysis as Nd-rich region. Gray contrastsrepresent regions mainly consisting of the ferromagneticmatrix phase. Detailed analysis using TEM revealed thatthe grains of the matrix phase with sizes in the range of50–100 nm are surrounded by a thin (1–5 nm) contin-uous network of Nd-rich grain boundary phase [17, 18].Figure 2 shows a typical SEM micrograph of a
fractured surface of a hot pressed Nd14Fe80B6 (MQP-A) sample. As seen, the microstructure is very fine withhomogeneous grain size distribution. No significantchange in the microstructure is observed for a samplewith Co and Ga additions, though the mean grain size ofthe matrix phase is slightly reduced from 100 to 60 nm[19].EDX analysis for the NdFeB magnet (MQP-A)
revealed that the concentration of neodymium in theNd-rich regions (corresponding to Figure 1(a)) at flakesboundaries is about 93 at %. The combined addition of6.6 at % Co and 0.6 at % Ga (MQU-G) results in astrong depletion in the total amount of rare earth (RE)-elements in these regions (67 at %) as indicated inTable 1 [11]. Therefore, it is reasonable to assume thatminor addition of Ga besides Co generate new inter-granular phases. This agrees well with earlier investiga-tions by Szymura et al. [20], Yamamoto et al. [21] andFidler et al. [22] of sintered microcrystalline permanentmagnets, where the formation of Nd16Fe13Ga,Nd3(Ga,Fe), Nd5(Ga,Fe)3, and Nd3Co intergranular
796

type phases was found. Furthermore, it is detected thatCo and Ga additions do not influence the content ofRE-elements in the matrix phase or modify its structuresignificantly. In this concern, Schultz et al. [3] reportedthat partial substitution of Fe with Co, Al and Ga in hotpressed nanocrystalline magnets prepared by hydrogendisproportination desorption reaction (HDDR) signifi-cantly reduces the electrostatic surface potential differ-ence between matrix and intergranular phases measuredin air by means of an AFM (atomic force microscope)using it as an electrostatic force microscope (EFM). This
indicates that, Co and Ga additions reduce the strengthof galvanic interaction between the magnet phases.
3.2. Electrochemical characterization
3.2.1. Electrochemical characterization of uncoupledand two galvanically coupled single phasesFigure 3(a–c) demonstrate the superposition of polari-zation curves of two single phases, with electrode surfacearea ratio (1:1), traced after 1 h immersion under freecorrosion condition in 0.5 M NaCl solution of pH 8.4.In these Figures, the corrosion current density (icorr) ofuncoupled phases is determined at the intersection pointof anodic and cathodic Tafel lines with the verticalthrough the corrosion potential (Ecorr). In the light ofmixed potential theory, the intersection point of polar-ization curves of two different phases defines the mixedpotential (Ecouple) and the galvanic current density(icouple).For uncoupled single phases, it is seen in Figure 3 that
the Nd-rich phase (Nd-phase) dissolves actively, where-as the ferromagnetic phase (/-phase) and the B-richphase (B-phase) are spontaneously passive and sufferfrom pitting attack with anodic polarization in 0.5 M
NaCl solution of pH 8.4. In addition, the polarizationplots show that the corrosion potential (Ecorr) of the Nd-rich phase is far more negative than those of ferromag-netic and B-rich phases. Meanwhile, icorr values ofuncoupled single phases reveal that the electrochemicalactivity increases in the following order: F-phase < B-rich phase < Nd-rich phase (Table 2). Therefore, thegalvanic interaction between these phases is clearlyposed.On the other hand, the polarization curves (Fig-
ure 3(a)) of ferromagnetic and B-rich phases are veryclose to each other. Therefore, no significant effect isnoticed in their polarization behavior when they gal-vanically interact as obvious from the comparison of(icorr) and (Ecorr) values for the single phases and (icouple)and (Ecouple) values for the coupled pair (Table 2). In
Fig. 1. SEM micrographs (backscattered electron mode) of polished surfaces of hot pressed (a) NdFeB (MQP-A) and (b) NdDyFeCoGaB
(MQU-G) magnets.
Fig. 2. SEM micrograph of a fractured surface of a hot pressed MQP-
A magnet.
Table 1. Concentration of magnets components (at %) (EDX analy-
sis) at triple points of Nd-rich regions at ribbon flakes boundaries
Nd Dy Fe Co Ga
MQP-A* 92.6 7.40
MQU-G� 60.10 6.15 6.40 14.11 13.18
* See Figure 1(a).� See Figure 1(b).
797
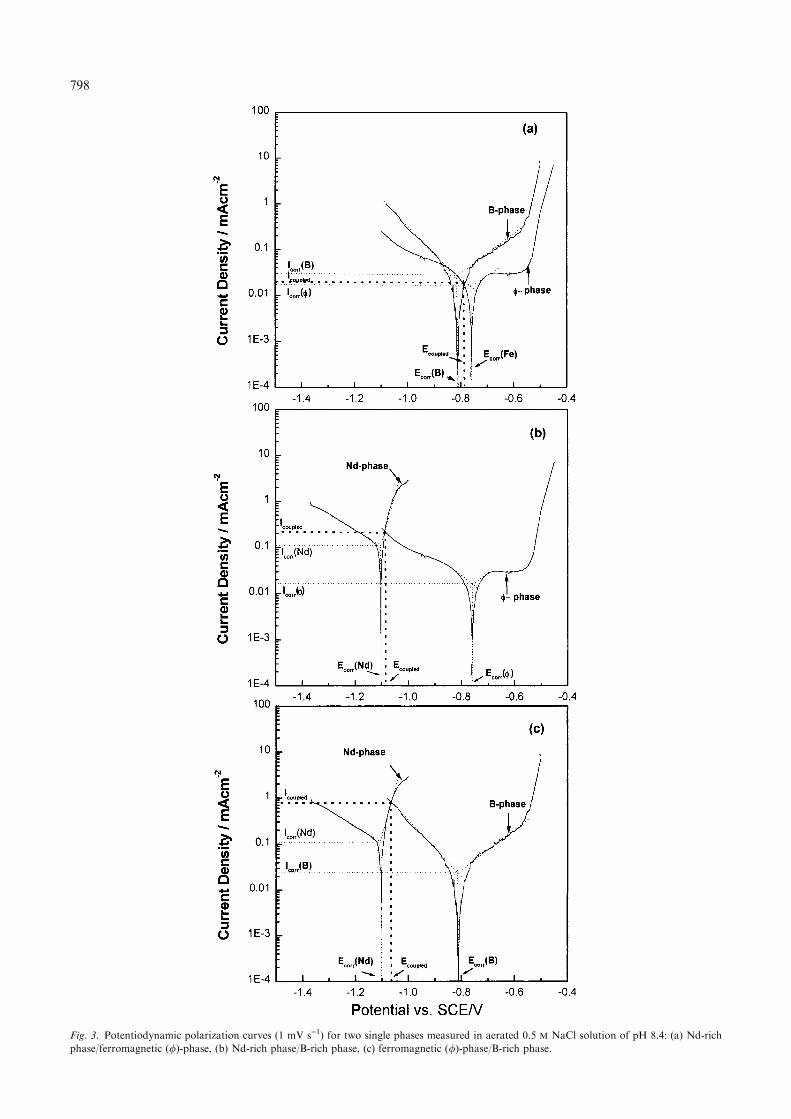
Fig. 3. Potentiodynamic polarization curves (1 mV s)1) for two single phases measured in aerated 0.5 M NaCl solution of pH 8.4: (a) Nd-rich
phase/ferromagnetic (/)-phase, (b) Nd-rich phase/B-rich phase, (c) ferromagnetic (/)-phase/B-rich phase.
798

contrast, the dissolution current density (icorr) of the Nd-rich phase at Ecorr of about )1.105 V vs SCE increasesfrom 0.123 mA cm)2 to 0.234 and 0.785 mA cm)2
(icouple) at mixed potentials (Ecouple) corresponding to)1.092 and )1.069 V vs SCE upon coupling with theferromagnetic /-phase (Figure 3(b)) and the B-rich(Figure 3(c)) phase, respectively. Consequently, thestrength of the galvanic coupling effect of all these pairsof single phases in weakly alkaline chloride solution isthe highest for the Nd-rich phase/B-rich phase coupleand both, the ferromagnetic phase and the B-rich phaseare cathodically polarized when galvanically coupledwith the Nd-rich phase, which acts as a local anode.
For time-resolved characterization of the galvaniccorrosion behaviour of all pairs of single phases, ZRAmeasurements were carried out under the experimentalconditions previously described. Due to the significantfluctuations of both, galvanic potential and currentdensity values in the present investigation, the sampledpotential and current density data of each time recordwere statistically analysed and expressed in terms ofmean and standard deviation values. These valuesgenerally give a basic correlation between the intensityof potential and current fluctuations and rate and modeof corrosion attack [16, 23, 24]. Figure 4(a) and (b)presents the estimated mean galvanic current density
Fig. 4. Mean galvanic current density (a) and mean galvanic potential (b) of all pairs of coupled phases in 0.5 M NaCl solution of pH 8.4
determined by the ZRA method. Standard deviations of current density (c) and potential (d) data of all pairs of coupled phases are also shown for
comparison.
Table 2. Comparison of Ecorr and icorr values of uncoupled magnet phases with Ecouple and icouple values obtained from superposition of
polarization curves of two coupled single phases of NdFeB magnets in aerated 0.5 M NaCl solution of pH 8.4. Ecouple and icouple values obtained
from ZRA measurements after immersion for 1 and 24 h are also shown for comparison
Potentiodynamic polarization ZRA
Ecorr, 1 h
/V vs SCE
icorr, 1 h
/mA cm)2Ecouple, 1 h
/V vs SCE
icouple, 1 h
/mA cm)2Ecouple, 1 h
/V vs SCE
icouple, 1 h
/mA cm)2Ecouple, 24 h
/V vs SCE
icouple, 24 h
/mA cm)2
Nd-phase/F-phase )1.105 0.123 )1.092 0.233 )1.060 0.239 )0.988 0.094
Nd-phase/B-phase )0.811 0.026 )1.069 0.785 )1.038 0.440 )0.988 0.043
B-phase/F-phase )0.762 0.0187 )0.774 0.012 )0.748 0.015 )0.699 0.011
799

and potential values for 24 h measurement duration inaerated 0.5 M NaCl solution of pH 8.4 for the surfacearea ratio (1:1) of coupled phases, respectively. Standarddeviation values due to potential and current fluctua-tions are also presented in Figure 4(c) and (d), respec-tively. The inserts of (a) and (b) show typical examplesof simultaneously measured galvanic current densitiesand potentials during the first hour of the 24 h ofmeasurement.In Figure 4(a) it is clearly seen that, the mean values
of galvanic current densities generally attain their steadystates after about 3 h immersion for all coupled pairs. Itis also worth noting that the highest mean currentdensity values during the initial 3 h are that of the Nd-rich phase/B-rich phase couple. These results, particu-larly those obtained after 1 h immersion of pairs,correlate with the results gained from slowly measuredpotentiodynamic polarization curves, seen in Figure 3(and Table 2). During the steady state, the highest meancurrent density values are obtained from Nd-rich phase/ferromagnetic phase couple. The reason for this alter-ation in the electrochemical behavior with time is notclear, yet. Standard deviation results shown in Fig-ure 4(c) are well correlated with the results in Fig-ure 4(a), that is, the highest standard deviations valuescoincide with the highest corrosion rates originated fromgalvanic coupling of the Nd-rich phase with the ferro-magnetic and B-rich phases. Meanwhile, all galvanicpotential values which were determined by both types ofmeasurements (potentiodynamic polarization and ZRA)are summarized in Table 2. For Nd-rich phase/ferro-magnetic phase and Nd-rich phase/B-rich phase couples(Ecouple) values are generally located in the closeproximity of the (Ecorr) value of the Nd-rich singlephase. Hence, the overall galvanic reaction in thesecoupled systems seems to be mainly governed by theanodic oxidation of the Nd-rich phase, which is thehighest active and least polarizable.
3.2.2. Electrochemical characterization of three coupledphasesIn general, at the mixed potential (Ecouple) of multiphasematerial systems the conditions
Pianode ¼
Picathode has
to be fulfilled to maintain charge neutrality [25]. For themagnets single phases this condition can be fulfilled ifthe Nd-rich phase acts as the anode and both noblerphases (i.e., B-rich and ferromagnetic phases) act asthe cathodes. Accordingly, the mixed potential (Ecouple)for three coupled phases is a consequence ofiNd-rich phase ¼ iB-rich phase + iferromagnetic phase. Underthis condition and as shown in Figure 5(a), the estima-ted value of (Ecouple) for the three-phase compositionwith a surface area ratio (1:1:1) is )1.057 V vs SCE. Thisvalue is nearby the intersection of polarization curves ofNd-rich and B-rich phases, because at the mixedpotential the B-rich phase (igalvanic (Nd-rich/B-rich) oricathodic(B-rich phase) ¼ )0.798 mA cm)2) contributesmuchmore to the sum of the cathodic current densities than theferromagnetic phase (igalvanic (Nd-rich/ferromagnetic) or
icathodic(/-phase) ¼ )0.233 mA cm)2, see Table 3). Be-cause of polarization, the anodic current density or totalgalvanic current density for the Nd-rich phase corre-sponds to ianodic ¼ +1.028 mA cm)2. This value is relat-ed to the surface area of the corroding Nd-rich singlephase. However, the surface area of Nd-rich single phaseoccupies only a third of the entire electrode surface(A) for the phase composition (1:1:1) (A ¼ AB-rich +ANd-rich + Aferromagnetic). Therefore, all current densitiesrelated to the entire surface are lowered by a factor of 1/3(ianodic ¼ +0.343 mA cm)2), as seen in Table 3.On other hand, the entire surface area related to
polarization curves allows comparison with otherphase composition like (1:10:100) (A ¼ AB-rich +ANd-rich + Aferromagnetic). With respect to the multiphasepermanent magnet microstructure, this ratio seems to bemore realistic than the ratio (1:1:1) since Nd- and B-richphases occupy only small intergranular regions aroundthe large volume fraction of the ferromagnetic grains, as
Fig. 5. Potentiodynamic polarization curves for three-phase composi-
tion with surface area ratio of (a) 1:1:1 (B-rich phase:Nd-rich phase:F-
phase) and (b) 1:10:100 in 0.5 M NaCl solution of pH 8.4.
800

already discussed. Consequently, the polarization curvesof B- and Nd-rich phases in Figure 5(a) have to bemultiplied by 1/100 and 1/10, respectively, to obtainpolarization curves related to the entire surface of themultiphase composition (1:10:100) (Figure 5(b)). Theestimated mixed potential values for the new ratio (i.e.,1:10:100) is )1.045 V vs SCE, which occurs also invicinity of the (Ecorr) value of the Nd-rich phase andeven closer to the mixed potential of Nd-rich phase/ferromagnetic phase coupled pair (Table 2). In addition,it is only slightly more positive than the mixed potentialcorresponding to the area ratio (1:1:1). This demon-strates again that, the anodic oxidation of the Nd-richphase is the dominating process of the overall surfacereaction of such a three-phase system in a weaklyalkaline chloride solution of pH 8.4. In contrast, Bark-leit et al. [25] have shown that, the estimated mixedpotential for the same coupled systems in 0.1 M H2SO4
solution is generally located near the (Ecorr) value of theferromagnetic phase. This is an indication that theoverall surface reaction of such a system in acidicenvironment is more under cathodic regime.Furthermore, in the chloride-containing solution the
dissolution current density related to the entire surfaceof the three-phase composition (1:10:100) rises from0.012 mA cm)2 at the corrosion potential of the Nd-richphase to ianodic ¼ +0.144 mA cm)2 at the mixed po-tential (Ecouple) (Nd, / and B; Table 3). But the anodicdissolution current density (ianodic) only related to thesmall area of corroding Nd-rich phase, as it may occurin the intergranular regions of a permanent magnet, ishigher by factor 10 (ianodic ¼ +1.440 mA cm)2). Mean-while, the corresponding cathodic current density rela-ted to the entire surface is generally distributed betweenthe ferromagnetic phase ()0.133 mA cm)2) and the B-rich ()0.011 mA cm)2) phase (Table 3) and is mainlyrelated to reduction of water or dissolved oxygen.
3.2.3. Electrochemical characterization of nanocrystallinemagnetsAnalysis of the data in Table 3 reveals that, theestimated current density values for the Nd-rich phaseupon coupling seem to be high enough to initiate anddevelop localized attack on the surface of NdFeB-basedmagnets in weakly alkaline solution containing chlorideions. This gives rise to more detailed studies on the
pitting corrosion behavior of permanent magnets,though localized corrosion processes are very complexand thus, hardly to describe in detail for those multi-phase materials. The following investigations aim forcomparing the pitting susceptibility of Nd14Fe80B6
(MQP-A) and Nd12Dy2Fe73.3Co6.6Ga0.6B5.6 (MQU-G)magnets under the same defined experimental condi-tions. At first, both types of magnets were immersed in0.5 M NaCl solution of pH 8.4 for a selected period of24 h, similarly to [26], for studying the pitting under freecorrosion conditions. Within this period, at the opencircuit potential (OCP) pitting is revealed only for theMQP-A magnet, whereas the MQU-G magnet did notexhibit local damages. Nevertheless, our in-situ investi-gations under the same experimental conditions usingnondistributive electrochemical noise technique (whichis out of the scope of the current article) showed that theincubation periods for pitting initiation on MQP-A andMQU-G magnets are about 12 and 27 h, respectively.Figure 6(a) and (b) presents light optical microscopy
images of the MQP-A magnet surface obtained after24 h open circuit immersion in 0.5 M NaCl solution withpH 8.4. White thick corrosion product is formed on thesurface of the magnet (Figure 6(a)), which when anal-ysed in the SEM with EDX revealed the presence ofsignificant amounts of O, Cl and Nd with traces of Fe.After polishing using 1 lm diamond paste, pronouncedpitting attack is noticed along the ribbon flake bound-aries of the melt-spun and hot pressed material indicat-ing that Nd-rich regions act as pitting initiation sites, asshown in Figure 6(b). Additionally, the observed pitsare significantly ramified presenting an irregular shape.Obviously, at OCP surface precipitates inhibit an ionexchange between the forming pit and the bulk electro-lyte and thus, control the kinetics of the pitting processwhich in result leads to this distinct pit morphology.Furthermore, the pitting behaviour of the magnets
under anodic polarization conditions on a shorter time-scale was investigated. Figure 7 shows potentiodynamiccyclic polarization curves for Nd14Fe80B6 (MQP-A) andNd12Dy2Fe73.3Co6.6Ga0.6B5.6 (MQU-G) magnets re-corded with 1 mV s)1 after 1 h immersion in 0.5 M
NaCl solution with pH 8.4. From previous studies [2, 3,10] it is known that, the overall degradation process ofNdFeB-based magnets in humid environments is theconsequence not only of electrochemical reactions but
Table 3. Anodic dissolution current density (ianode) and corresponding cathodic current densities (icathode) for NdFeB magnets derived from the
superposition of three coupled single phases with different surface area ratio in 0.5 M NaCl solution of pH 8.4
Current density
/mA cm)2
Related to single phase area Related to entire surface
ianodic of
Nd-rich phase
icathodic of
B-rich phase
icathodicof F-phase
ianodic of
Nd-rich phase
icathodic of
B-rich phase
icathodicof F-phase
Ratio of area 1:1:1* +1.028 )0.798 )0.233 +0.343 )0.266 )0.077Ratio of area 1:10:100* +1.440 )0.100 )1.330 +0.144 )0.011 )0.133
*B-rich:Nd-rich:F-phase.
801

also of mechanical degradation. In order to minimizethe probability of occurrence of those mechanicaldegradation processes during the experiment, a potentialscan-rate somewhat faster than the scan-rate recom-mended by the ASTM society for studying pittingprocesses of metals and alloys, 60.5 mV s)1, waschosen. As seen, both magnets are spontaneouslypassive and suffer from pitting corrosion with anodicpolarization at higher potential. Nevertheless, theNdFeB-based magnet with Co and Ga (MQU-G)addition exhibits better resistance to pitting corrosionunder the given polarization conditions.In general, DEi ¼ Erepassivation ) Ecorr and DEg ¼
Epitting ) Erepassivation values can serve as criteria forevaluating the pitting susceptibility of an electrode. Inthis concern, Epitting is a critical potential value beyondwhich (E P Epitting) pit propagation occurs (i.e., forma-tion of stable pit) indicated by a steep rise if the currentdensity. At E < Epitting stable pits cannot be formed.Erepassivation is a potential value for which atE P Erepassivation pits can initiate (i.e., formation meta-stable pit or pit embryo), but at E < Erepassivation thematerial remains passive. Accordingly, a more negativevalue of DEi indicates the higher affinity of an electrodefor pit initiation under free corrosion condition. Fur-thermore, a larger DEg value or area under the hysteresisloop obtained during slow cycling polarization refers toa high rate of pit propagation or pit growth on theelectrode surface [27]. Fundamental papers of Leckieand Uhlig [26] and Heusler and Fischer [28] pointed outthat pitting processes are strongly kinetically controlled.This is expressed, for example, in a significant incuba-tion time for pit initiation. Thus, determination ofcritical pitting potentials must be performed with theslowest possible potential shift (scan rate) to realizequasi-stationary conditions. In general, the potentialscan rate affects both the critical pitting and repassiva-tion potential. An increase in scan rate shifts the pittingpotential to move noble values and the repassivationpotential to less positive potentials. However, the slightincrease in the scan rate from 0.5 mV s)1 to 1 mV s)1
will not affect the reliability of our experiment forcomparison of the pitting corrosion behaviour of MQP-A and MQU-G magnets.By analysis of curves shown in Figure 7, the estimated
values of DEi and DEg are )0.03 and 0.38 V vs SCE forthe MQP-A magnet and 0.02 and 0.32 V vs SCE for theMQU-G magnet, respectively. It follows from the abovediscussion that the combined addition of Co and Gadiminishes both, the pit initiation and the pit propaga-tion tendency on the surface of a NdFeB-based magnet.Co and Ga additions do not lead to a significant changein the mean grain size and phase distribution of theNdFeB-based magnets, but they are mainly enriched inthe intergranular regions. Consequently, the Nd contentof these regions is significantly reduced [21, 22]. Also,they do not have a passivating character in the inves-tigated medium [29]. The reduction of the strength of thegalvanic coupling effect between matrix and intergranu-
Fig. 6. Light optical micrographs of a MQP-A magnet surface after
immersion for 24 h under free corrosion condition in 0.5 M NaCl
solution of pH 8.4: (a) as-corroded surface and (b) surface after short
polishing.
Fig. 7. Potentiodynamic polarization curves (1 mV s)1) for MQP-A
and MQU-G magnets in aerated 0.5 M NaCl solution of pH 8.4.
802
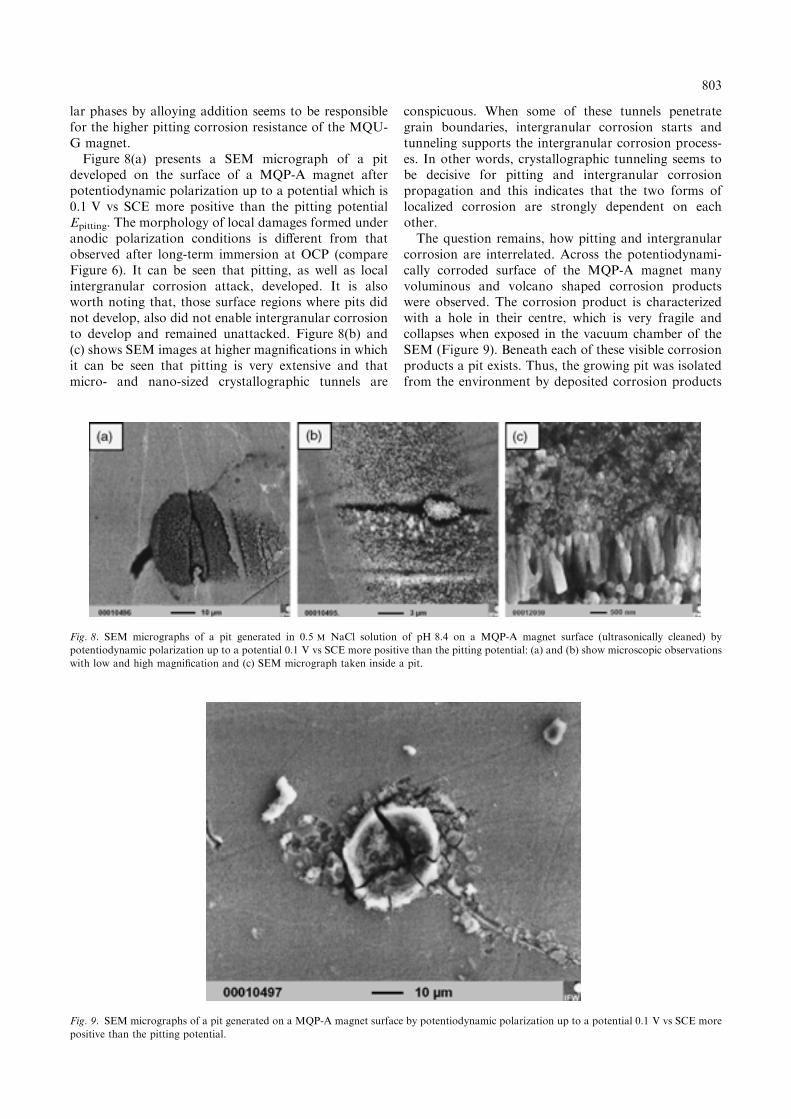
lar phases by alloying addition seems to be responsiblefor the higher pitting corrosion resistance of the MQU-G magnet.Figure 8(a) presents a SEM micrograph of a pit
developed on the surface of a MQP-A magnet afterpotentiodynamic polarization up to a potential which is0.1 V vs SCE more positive than the pitting potentialEpitting. The morphology of local damages formed underanodic polarization conditions is different from thatobserved after long-term immersion at OCP (compareFigure 6). It can be seen that pitting, as well as localintergranular corrosion attack, developed. It is alsoworth noting that, those surface regions where pits didnot develop, also did not enable intergranular corrosionto develop and remained unattacked. Figure 8(b) and(c) shows SEM images at higher magnifications in whichit can be seen that pitting is very extensive and thatmicro- and nano-sized crystallographic tunnels are
conspicuous. When some of these tunnels penetrategrain boundaries, intergranular corrosion starts andtunneling supports the intergranular corrosion process-es. In other words, crystallographic tunneling seems tobe decisive for pitting and intergranular corrosionpropagation and this indicates that the two forms oflocalized corrosion are strongly dependent on eachother.The question remains, how pitting and intergranular
corrosion are interrelated. Across the potentiodynami-cally corroded surface of the MQP-A magnet manyvoluminous and volcano shaped corrosion productswere observed. The corrosion product is characterizedwith a hole in their centre, which is very fragile andcollapses when exposed in the vacuum chamber of theSEM (Figure 9). Beneath each of these visible corrosionproducts a pit exists. Thus, the growing pit was isolatedfrom the environment by deposited corrosion products
Fig. 8. SEM micrographs of a pit generated in 0.5 M NaCl solution of pH 8.4 on a MQP-A magnet surface (ultrasonically cleaned) by
potentiodynamic polarization up to a potential 0.1 V vs SCE more positive than the pitting potential: (a) and (b) show microscopic observations
with low and high magnification and (c) SEM micrograph taken inside a pit.
Fig. 9. SEM micrographs of a pit generated on a MQP-A magnet surface by potentiodynamic polarization up to a potential 0.1 V vs SCE more
positive than the pitting potential.
803

and thus, the electrolyte in the pit became more andmore acidic with high chloride ion concentration.Indeed, local acidification is one of the possible mech-anisms of accelerated pit propagation [30, 31]. In thisacidified environment, pits grow on the magnets surfacethrough the micro- and/or nano-sized tunnels andpenetrate along grain and flake boundaries. Hence,intergranular corrosion starts.To confirm the above statement, MQP-A and MQU-
G magnets surfaces were inspected with SEM after10 min immersion in 0.001 M HCl solution, which maysimulate a typical pit environment. It is clearly seen inFigure 10(a) and (b) that the Nd-rich region along flakeboundaries and intergranular regions of the MQP-Amagnet are preferentially attacked (Figure 10(a)),though the MQU-G magnets surface exhibits much lessintergranular corrosion damage Figure 10(b). This ob-servation confirms the above view and indicates thebeneficial effect of Co and Ga addition in retarding thepropagation of pitting and intergranular corrosion.Therefore, it can be postulated that acidic environmentis essential to stimulate the intergranular corrosion forNdFeB-based magnets. If there are no occluded cells(such as pits), and if the bulk environment is weakly
alkaline, then intergranular corrosion should not bepronounced.
4. Conclusions
The electrochemical behavior of uncoupled and two orthree galvanically coupled single phases generally oc-curring in NdFeB-based magnets has been characterizedin 0.5 M NaCl solution with pH 8.4. Electrochemicalcharacterization of multiphase nanocrystalline hotpressed Nd14Fe80B6 and Nd12Dy2Fe73.3Co6.6Ga0.6B5.6
magnets has been also established. Based on the resultspresented in this study, the following conclusions can bedrawn:(i) The Nd-rich phase dissolves actively, while the B-
rich phase and the ferromagnetic (/)-phase sufferfrom pitting corrosion with anodic polarization.The order of corrosion sensitivity of the uncoupledsingle phases is: /-phase < B-rich phase < Nd-rich phase.
(ii) The Nd-rich phase/ferromagnetic phase couplegenerates the highest galvanic coupling currentdensity among all pairs of coupled phases. Uponcoupling, the Nd-rich phase represents the typicalanode, whereas the B-rich phase and the ferro-magnetic phase act as cathodes.
(iii) Pitting corrosion initiates on Nd-rich regions at theflakes boundaries of hot pressed nanocrystallinemagnets. Intergranular corrosion initiates on pitwalls and propagates from them. Crystallographictunneling seems to be a supporting process of pit-ting and intergranular corrosion propagation.
(iv) Co and Ga additions reduce the rate of initiationand propagation of pitting corrosion of NdFeB-based magnets due to modification of the compo-sition of magnet phases, (i.e., intergranular phases)resulting in the reduction of the strength of thegalvanic coupling effect.
Acknowledgements
The authors thank Prof. Bala from the Department ofChemistry of the Technical University of Czestochowa,Poland for providing single phase materials. We alsothank Dr Gutfleisch from the IFW Dresden for supply-ing NdFeB-based melt-spun powders (MagnequenchInt.) and for fruitful discussions. Dr Guth from the IFWDresden is acknowledged for SEM investigations. DrEl-Moneim is grateful to the International Office of theBMBF (FZ-Juelich), Germany for financial support ofhis research stay at the IFW Dresden, Germany.
References
1. S. Hirosawa and Y. Kaneko, Proceedings of the 15th international
workshop on ‘Rare Earths and their Applications’, Dresden,
Germany (1998), p. 43.
Fig. 10. SEM micrographs for (a) MQP-A and (b) MQU-G magnets
surfaces after immersion in 0.001 M HCl solution for 10 min.
804

2. H. Bala, G. Pawlowska, S. Szymura, V.V. Sergeev and Yu.M.
Rabinovich, J. Magn. Magn. Mater. 87 (1990)1255.
3. L. Schultz, A.M. El-Aziz, G. Barkleit and K. Mummert, Mater.
Sci. Eng. A267 (1999) 307.
4. G. Schneider, E-T. Hennig, G. Petzow and H. Stadelmaier, Z.
Metallkunde 77 (1986) 755.
5. G.W. Warren, G. Gao and Q. Li, J. Appl. Phys. 70 (1991) 6609.
6. T.S. Chin, R.T. Chang, W.T. Tsai and M.P. Hung, IEEE Trans.
Magn. 24 (1988) 1927.
7. H. Bala, S. Szymura and J.J. Wyslocki, J. Mater. Sci. 25 (1991)
571.
8. K. Sugimoto, T. Sohma, T. Minowa and M. Honshima, Japan
Metal Society Fall Meeting, (1987), p. 604.
9. H. Bala, G. Pawlowska, S. Szymura and Yu.M. Rabinovich, Br.
Corros. J. 33 (1998) 37.
10. A.A. El-Moneim, A. Gebert, F. Schneider, O. Gutfleisch and L.
Schultz, Corros. Sci. 44 (2002) 1097.
11. A.A. El-Moneim, A. Gebert, M. Uhlemann, O. Gutfleisch and L.
Schultz, Corros. Sci. 44 (2002) 1857.
12. A.A. El-Moneim, O. Gutfleisch, A. Plotnikov and A. Gebert, J.
Mag. Mag. Mater. 248 (2002) 121.
13. A. Gebert, A.A. El-Moneim, O. Gutfleisch and L. Schultz, IEEE
Trans. Magn. 38 (2002) 2979.
14. G. Pawlowska, PhD thesis, Polytechnica of Czestochowa, Poland
(1996).
15. H.P. Hack, ‘Galvanic Corrosion-Test Methods’ (NACE Interna-
tional, 1993).
16. A. Igual-Munoz, J. Carcia-Anton, J.L. Guinon and V. Perez-
Herranz, Corrosion 57 (2001) 516.
17. L. Li and C.D. Graham, Jr, J. Appl. Phys. 67 (1992) 2130.
18. L. Li, PhD thesis, University of Pennsylvania (1992).
19. A. Kirchner, W. Grunberger, O. Gutfleisch, V. Neu, K-H Muller
and L. Schultz, Proceedings of the 15th international workshop on
‘Rare Earths and their Applications’, Dresden, Germany, (1998),
p. 373.
20. S. Szymura, H. Bala, G. Pawlowska, Yu.M. Rabinovich, V.V.
Sergeev and D. Pokrovskii, J. Less Common Metals 175 (1991)185.
21. H. Yamamoto, S. Hirodawa, S. Fujimura, K. Tokuhara, H.
Nagata and M. Sagawa, IEEE Trans. Magn. 23 (1987) 2100.
22. J. Fidler, IEEE Trans. Magn. 21 (1985) 1955.
23. J.S. Bendat and A.G. Piersol, ‘Random Data: Analysis and
Measurement Procedures’ (Wiley-Interscience, New York, 1971).
24. F. Mansfeld and H. Xiao, J. Electrochem. Soc. 140 (1993) 2205.
25. G. Barkleit, A.M. El-Aziz, F. Schneider and K. Mummert, Mater.
Corros. 52 (2001) 193.
26. H.P. Leckie and H.H. Uhlig, J. Electrochem. Soc. 113 (1966) 1262.
27. Z. Szklarska Smialowska, ‘Pitting Corrosion’ (NACE, 1986).
28. K.E. Heusler and L. Fischer, Mater. Corros. 27 (1976) 551.
29. M. Pourbaix, ‘Atlas of Electrochemical Equilbria in Aqueous
Solution’ (Pergamon, oxford, 1966).
30. D.E. Williams, C. Wetscott and M. Fleischmann, J. Electrochem.
Soc. 132 (1985) 1804.
31. D.E. Williams and C. Wetscott, M. Fleischmann, J. Electrochem.
Soc. 132 (1985) 1796.
805