Protection by 20-5,14-HEDGE Against Surgically Induced Ischemia Reperfusion Lung Injury in Rats

1 23
Targeted Oncology ISSN 1776-2596 Targ OncolDOI 10.1007/s11523-013-0260-2
EGFR intron-1 CA repeat polymorphismis a predictor of relapse and survival incomplete resected only surgically treatedesophageal cancer
Yogesh K. Vashist, Florian Trump,Florian Gebauer, Asad Kutup, CenapGüngör, Viacheslav Kalinin, RatherMuddasar, Eik Vettorazzi, et al.

1 23
Your article is protected by copyright and
all rights are held exclusively by Springer-
Verlag France. This e-offprint is for personal
use only and shall not be self-archived in
electronic repositories. If you wish to self-
archive your work, please use the accepted
author’s version for posting to your own
website or your institution’s repository. You
may further deposit the accepted author’s
version on a funder’s repository at a funder’s
request, provided it is not made publicly
available until 12 months after publication.

ORIGINAL RESEARCH
EGFR intron-1 CA repeat polymorphism is a predictorof relapse and survival in complete resected only surgicallytreated esophageal cancer
Yogesh K. Vashist & Florian Trump & Florian Gebauer &
Asad Kutup & Cenap Güngör & Viacheslav Kalinin &
Rather Muddasar & Eik Vettorazzi & Emre F. Yekebas &
Burkhard Brandt & Klaus Pantel & Jakob R. Izbicki
Received: 21 September 2012 /Accepted: 14 January 2013# Springer-Verlag France 2013
Abstract Basal transcription regulation of the epidermalgrowth factor receptor is dependent upon a CA simplesequence repeat polymorphism in the intron-1 (CA-SSR-1). Here, we evaluate the role of CA-SSR-1 in completeresected esophageal cancer (EC) patients without neoadju-vant or adjuvant treatment. Genomic DNA was extractedfrom peripheral blood leukocytes of 241 patients. To deter-mine the number of the CA repeats in the CA-SSR-1, DNAwas amplified by polymerase chain reaction and sequenced.The results were correlated with clinicopathological param-eters and clinical outcome. Three genotypes were definedbased on cut-off points for short allele (S) with ≤18 and longallele (L) >18 CA repeats. A steadily increasing risk wasevident between LL, SL, and SS genotype for larger tumorsize, presence of lymph node metastases, and disseminatedtumor cells in bone marrow as well as tumor recurrence (P<0.001, chi-square test). A gradual decrease in disease-freeand overall survival (OS) was present among LL, SL, and SSpatients (P<0.001, log-rank test). The different outcomes
were also evident in nodal status and histological type ad-justed subgroup analyses. CA-SSR-1 was identified as thestrongest independent prognosticator of tumor recurrenceand OS (P<0.001, Cox regression analysis). CA-SSR-1 isa strong predictive factor for tumor recurrence and overallsurvival in patients with complete resected esophageal can-cer without neoadjuvant or adjuvant therapy.
Keywords Esophageal cancer . Survival . Relapse . EGFR .
CA polymorphism
Introduction
Despite multimodal treatment, the recurrence rate remainshigh in esophageal cancer (EC), and the 5-year survival ratereaches around 25 % only [1]. Up to 20 % of the node-negative and >90 % of node-positive patients are at risk todevelop distant relapse [2]. Surgery remains the standardtherapy for resectable EC [3]. However, effective tools aremissing to predict the clinical course of EC patients. Properutilization of multimodal therapeutic approaches requiresallocation of EC patients into different risk profiles.Approaches to improve the poor prognosis include introduc-tion of targeted therapy in EC [4, 5]. Molecular character-ization of the primary tumor has revealed high expression ofepidermal growth factor receptor (EGFR) in adeno- (AC)and squamous cell carcinoma (SCC) of the esophagus [6–8].There are currently several approved anti-EGFR drugsencompassing monoclonal antibody and small kinase inhib-itors [9, 10]. Anti-EGFR therapy has been evaluated in onlyvery few studies with small study population, advanceddisease stages, and mostly as second-line treatment in EC.
Y. K. Vashist (*) : F. Trump : F. Gebauer :A. Kutup :C. Güngör :V. Kalinin :R. Muddasar : E. F. Yekebas : J. R. IzbickiDepartment of General, Visceral and Thoracic Surgery, UniversityMedical Center Hamburg-Eppendorf, Martini Strasse 52,20246 Hamburg, Germanye-mail: [email protected]
B. Brandt :K. PantelDepartment of Tumor Biology, University Medical CenterHamburg-Eppendorf, Martini Strasse 52,20246 Hamburg, Germany
E. VettorazziDepartment of Medical Biometry and Epidemiology, UniversityMedical Center Hamburg-Eppendorf, Martini Strasse 52,20246 Hamburg, Germany
Targ OncolDOI 10.1007/s11523-013-0260-2
Author's personal copy

The reported response rates range from 10 to 90 % [11–13].Despite the variety of anti-EGFR drugs, the patient selectioncriteria are still under investigation. Most frequent, theEGFR status of a tumor is either evaluated by immunohis-tochemistry (IHC) or fluorescence in situ hybridization(FISH) analysis, which does not reflect necessarily the acti-vation stage and regulation of EGFR [7, 8, 14–16]. Morefunctional parameters are needed to establish clinical suc-cessful treatment modalities.
Transcription of the EGFR gene is dependent upon twoenhancer elements [17, 18]. One enhancer is located inintron-1 neighbored to an upstream CA simple sequencerepeat polymorphism (CA-SSR-1). Several studies havereported on inverse correlation between CA-SSR-1 lengthand EGFR protein expression [18–21]. Furthermore, CA-SSR-1 has been evaluated as a prognostic marker in othertumor types [22–26]. Recently, Huang et al. and Tiseo et al.[27, 28] reported on predictive value of CA-SSR-1 in non-small cell lung cancer (NSCLC) patients with gefitinibtreatment.
In EC, high EGFR expression has been reported as aprognostic marker of poor outcome [6–8]. These studieswere based on IHC or FISH assays, and the study popula-tion was heterogeneous in terms of treatment. Up to now,the role of CA-SSR-1 has not been evaluated in EC. There isa paucity of prognostic markers in EC. Genetic variations incancer patients may serve as important prognostic indicatorsof clinical outcome since germ-line DNA remains unbiasedby the genomic instability occurring in tumor tissue.
In this study, we assessed the CA-SSR-1 in a homoge-nous study population of only surgically treated EC patientswithout neoadjuvant or adjuvant treatment. The results werecorrelated to clinicopathological parameters, presence ofdisseminated tumor cells (DTC) in bone marrow as indicatorof early micrometastasis, and to clinical outcome to evaluatethe role of CA-SSR-1 in EC.
Patients and methods
The study was approved by the Medical Ethical Committeeof Hamburg, Germany. All patients enrolled in this studyunderwent esophageal resection at the department of gen-eral, visceral, and thoracic surgery at the UniversityMedical Center Hamburg–Eppendorf. Only patients withhistopathologically proven EC after complete resection(R0) were included into the study. In total, 241 patientswere eligible. None of the patients received neoadjuvantor adjuvant treatment. Informed consent was obtainedfrom all patients before including them in a prospectivedatabase. Clinical follow-up data were obtained by study-ing the patient clinical charts and/or by contacting them orthe general practitioner.
DNA extraction, sequencing and analysis of CA-SSR-1
Whole blood leukocyte DNAwas extracted and purified bystandard procedures using QIAamp tissue kit (Qiagen). Foramplification of the intron 1 region with the repeated (CA)nsequence by polymerase chain reaction (PCR), we used asense fluorescent labeled primer EG-F-Fam (5′-fam-GTTTGAAGAATTTGAGCCAAACC) and an antisenseprimer EG-R (5′-CGAAGCCAGACTCGCTCATG).
PCR for the fragment-length analysis was performed in a25-μl reaction mix consisting of 0.25 μl extracted DNA,2.5 μl 10× PCR buffer IV (ABgene®, Epsom, UK), 4 μldeoxyribonucleotide triphosphate (1.25 mm), EG-F-Fam/EG-R primers, and 1.25 U Taq-Polymerase. PCR con-ditions consisted of 35 repeated cycles at 95 °C for 30 s, 55 °Cfor 30 s, and 72 °C for 1 min. Electrophoresis of PCR productwas processed on a 2.5 % agarose gel. The sizes of theamplified fragments were determined by capillary electropho-resis with an ABI Prism 310 Genetic Analyser® (AppliedBiosystems, Foster City, CA, USA) using a composition of40 μl formamide (Hi-Di), 0.2 μl Genescan-500-ROXStandard (Applied Biosystems, Foster City, CA, USA), aswell as 0.1–2.0 μl of PCR product (selected quantity wasdependent on the band quality determined by electrophoresis).Samples were heated at 94 °C for 2 min before application.
CA-SSR-1 repeats were calculated regarding size markerhomozygous DNA. For this purpose, DNA was amplified asdescribed with nonlabeled primers EG-F1 (5′- AGAGCTCATCCTGGCCAACA) and EG-R. Fragment was purifiedwith QIAquick PCR purification kit (Qiagen) and sequencedwith primer EG-F2 (TGGCCAACACCATGGTGTTT).Sequencing was processed in 20 μl mix containing 3.0 μlDNA fragment, 2.0 μl buffer (ABI 5× sequencing buffer;Appl ied Biosystems) , 4 .0 μ l ABI BigDye® di-deoxyterminator sequencing mix version 1.1 (AppliedBiosystems), and primer EG-F2. Synthesis program was de-naturation at 95 °C for 2 min followed by 30 cycles at 95 °Cfor 45 s, 50 °C for 10 s, and 60 °C for 4 min. The product wasthen analyzed by automatic sequencer ABI3110. Size markerswere two homozygous DNA samples with 16 and 20 CArepeats, respectively.
CA-SSR-1 alleles with ≤18 repeats were classified asshort (S) and >18 repeats as long (L) alleles. Hence, basedon the combination of S and L allele SS, SL and LLgenotypes were defined according to Buerger et al.[29]
DTC detection
Detection of disseminated tumor cells in the bone marrowhas been previously described in detail according to internalstandard [30]. Briefly, bone marrow aspirates of 4–8 mLwere obtained from the iliac crest of patients on the day ofsurgery. The aspirates were collected in heparin, and
Targ Oncol
Author's personal copy

mononuclear cells were isolated by density-gradient cen-trifugation through Ficoll-Hypaque (Pharmacia, Freiburg,Germany) at 400×g for 30 min. Cells were then subjectedto cyto-centrifugation at 150 × g for 3 min at roomtemperature, to apply cells to a glass slide. To detect tumorcells in bone marrow, we used monoclonal antibody A45-B/B3 (IgG1; Micromet, Munich, Germany) that detects anepitope on various cytokeratins, including cytokeratins 8,18, and 19. Unspecific IgG1 was used as a control anti-body. Visualization was performed by the APAAP tech-nique. Counterstaining was done with Mayer ’shematoxylin. We used the Automated Cellular ImagingSystem (ChromaVision, Medical Systems Inc., CA) toscreen immunostained bone marrow slides for disseminat-ed tumor cells.
Statistical analysis
For statistical analysis SPSS for Windows (Chicago, IL,USA) was used. Descriptive statistics were used to describepatient baseline characteristics. To evaluate a potential as-sociation between the CA-SSR-1 genotype and clinicopath-ological parameters, the chi-square test was used. Survivalcurves of the patients were plotted using the Kaplan–Meiermethod and analyzed using the log-rank test. Results arepresented as median survival with 95 % confidence interval(95 % CI) and number of patients at risk. Mean values arepresented and specifically indicated in case if the mediansurvival was not reached. The overall survival (OS) wascomputed as the time period from the date of surgery toeither the date of death or last follow-up, whichever oc-curred first. The disease-free survival (DFS) was definedas the time period from the date of surgery to the date ofrecurrence, last follow-up or date of death, whichever oc-curred first. Patients alive without recurrence at the lastfollow-up date were censored. Cox regression hazard modelwas used for multivariate analysis to assess the independentinfluence of CA-SSR-1 and other covariates on survival andtumor recurrence. Results are presented as hazard ratio (HR)and 95 % CI. Significant statements refer to P values of two-tailed tests that were <0.05.
Results
Characterization of the study population
Two hundred forty-one patients were included in this study.The median age of the study population was 62.8 years(range=34.5–85.1). Majority of the patients were male(79.7 %). All patients underwent complete esophageal re-section with histologically proven tumor free margins andwithout evidence of distant organ metastases. Due to
presence of nonregional lymph-node metastases 23(9.5 %), patients were classified as M1a positive.Adenocarcinoma was histologically proven in 123 (51 %)and SCC in 118 (49 %). None of the patient received neo-adjuvant or adjuvant chemo- or radio-chemotherapy. Almost70 % of the patients were also evaluated for DTC, whichwere detected in 29.9 % of these patients. Based on the cut-off points for CA repeat, the LL genotype was found in 57(23.7 %), the SL in 116 (48.1 %) of the patients, and theremaining 68 (28.2 %) patients displayed two short alleles(SS genotype). Table 1 depicts the tumor specific character-istics of the entire study population.
CA-SSR-1 and clinicopathological parameters
The three CA-SSR-1 genotypes were correlated to clinico-pathological parameters. Tumor size, presence of nodalmetastases, and DTC as well as the tumor recurrence ratewere strongly associated with CA-SSR-1. A significantgradual increase in risk for more aggressive tumor biologywas evident among LL, SL, and SS genotype patients. TheLL patients had smaller tumors, lacked lymph node metas-tases, and DTC. The relapse rate of LL patients was signif-icantly lower compared to SL and SS genotype patients.Between SL and SS genotype, a tendency towards moreaggressive tumors was present. These findings applied toboth tumor subtypes (AC and SCC). Adenocarcinomapatients with the SS genotype predominantly displayedG3 tumors. An association between the CA-SSR-1 andM1a lymph node metastasis was only apparent in the entirestudy cohort, but in stratified subanalyses according to theunderlying tumor typing, the significant correlation faded.Interestingly, in the SCC group, almost 50 % of the LLgenotype patients were female. Table 1 summarizes thefindings of the correlation between CA-SSR-1 and tumor-specific parameters in the entire study population and strat-ified to AC and SCC.
CA-SSR-1 and clinical outcome
Fourteen patients died perioperatively and were excludedfrom the survival analyses. The median follow-up time was17.5 months (range=2.3–60). During the observation peri-od, 156 (64.7 %) patients experienced a relapse and 193(80.1 %) patients died. The CA-SSR-1 genotype had asignificant impact on DFS and OS. Kaplan–Meier analysesdemonstrated a distinctly decreasing DFS and OS amongLL, SL, and SS patients (Fig. 1a and b, Tables 2 and 3). Tofurther examine the impact of CA-SSR-1 on the clinicaloutcome, the study population was stratified according tohistology and nodal status. Patients with presence of nonre-gional lymph node metastases (M1a positive) were excludedfrom the stratification criteria since M1a represents stage IV
Targ Oncol
Author's personal copy

Tab
le1
Patient
characteristicsandcorrelationof
CA-SSR-1
with
clinicop
atho
logicalparameters
Total
Adeno
carcinom
aSqu
amou
scellcarcinom
a
Variables
NLL
SL
SS
Pvalue
LL
SL
SS
Pvalue
LL
SL
SS
Pvalue
Total
241(100
)57
(23.7)
116(48.1)
68(28.2)
30(24.4)
53(43.1)
40(32.5)
27(22.9)
63(53.4)
28(23.7)
Sex
Male
192(79.7)
37(64.9)
97(83.6)
58(85.3)
23(76.7)
45(84.9)
32(80)
14(51.9)
5282
.5)
26(92.9)
Fem
ale
49(20.3)
20(35.1)
19(16.4)
10(14.7)
0.00
67(23.3)
8(15.1)
8(20)
0.6
13(48.1)
11(17.5)
2(7.1)
0.00
1
Age
(years)
≤60
116(48.1)
27(47.4)
59(50.9)
30(44.1)
13(43.3)
24(45.3)
13(32.5)
14(51.9)
35(55.6)
17(60.7)
>60
125(51.9)
30(52.6)
57(49.1)
38(55.9)
0.7
17(56.7)
29(54.7)
27(67.5)
0.4
13(48.1)
28(44.4)
11(39.3)
0.8
Tum
orsize
pT1
38(15.8)
21(36.8)
14(12.1)
3(4.4)
12(40)
8(15.1)
1(2.5)
9(33.3)
6(9.5)
2(7.1)
pT2
76(31.5)
18(31.6)
42(36.2)
16(23.5)
10(33.3)
24(45.3)
14(35)
8(29.6)
18(28.6)
2(7.1)
pT3
110(45.6)
18(31.6)
55(47.4)
37(54.4)
8(26.7)
20(37.7)
18(45)
10(37)
35(55.6)
19(67.9)
pT4
17(7.1)
-5(4.3)
12(17.6)
<0.00
1-
1(1.9)
7(17.5)
<0.00
1-
4(6.3)
5(17.9)
0.00
1
Nod
alstatus
Negative
77(32)
38(66.7)
29(25)
10(14.7)
17(56.7)
12(22.6)
6(15)
21(77.8)
17(27)
4(14.3)
Positive
164(68)
19(33.3)
87(75)
58(85.3)
<0.00
113
(43.3)
41(77.4)
34(85)
<0.00
16(22.2)
46(73)
24(85.7)
<0.00
1
Non
region
alno
dalstatus
(M1a)
Negative
218(90.5)
54(94.7)
108(93.1)
5682
.4)
28(93.3)
49(92.5)
33(82.5)
26(96.3)
59(93.7)
23(82.1)
Positive
23(9.5)
3(5.3)
8(6.9)
12(17.6)
0.03
2(6.7)
4(7.5)
7(17.5)
0.2
1(3.7)
4(6.3)
581
7.9)
0.1
Tum
orgrading
G1
25(10.4)
8(14)
12(10.3)
5(7.4)
2(6.7)
4(7.5)
3(7.5)
6(22.2)
8(12.7)
2(7.1)
G2
119(49.4)
34(59.6)
60(51.7)
25(36.8)
17(56.7)
19(35.8)
9(22.5)
17(63)
41(65.1)
16(57.1)
G3
97(40.2)
15(26.3)
44(37.9)
38(55.9)
0.02
11(36.7)
30(56.6)
28(70)
0.06
4(14.8)
14(22.2)
10(35.7)
0.3
Tum
orrecurrence
No
71(29.5)
29(52.7)
29(26.9)
11(17.2)
17(56.7)
13(26.5)
5(13.9)
14(56)
16(27.1)
6(21.4)
Yes
156(64.7)
26(47.3)
79(73.1)
53(82.8)
<0.00
113
(43.3)
36(73.5)
31(86.1)
0.00
111
(44)
43(72.9)
22(78.6)
0.01
Disseminated
tumor
cells
inbo
nemarrow
Negative
96(39.8)
32(82.1)
48(56.5)
16(36.4)
16(84.2)
20(57.1)
9(36)
16(80)
28(56)
7(36.8)
Positive
72(29.9)
7(17.9)
3743
.5)
28(63.6)
<0.00
13(15.8)
15(42.9)
16(64)
0.00
64(20)
22(44)
12(63.2)
0.02
Tum
ortype
Squ
amou
scellcarcinom
a118(49)
27(47.4)
63(54.3)
28(41.2)
––
––
––
Adeno
carcinom
a12
3(51)
30(52.6)
53(45.7)
40(58.8)
0.2
––
––
––
––
Rou
ndparenthesesindicate
percentages;LL.SLandSSreferto
CA-SSR-1
geno
type;Pindicatessign
ificance
bychi-square
test
Targ Oncol
Author's personal copy

Fig. 1 a, b Kaplan–Meier plotsof disease-free and overallsurvival in relation to CA-SSR-1 genotype in the entire studypopulation
Targ Oncol
Author's personal copy

disease. However, M1a-positive patients were analyzed sep-arately as well.
Throughout all stratified subgroups, a markedly betterDFS and OS was evident for LL genotype patients com-pared to SL and SS genotype patients. Between SL andSS patients, a further decrease was apparent (Tables 2and 3). In few small subgroups (i.e., AC patients withoutlymph node metastasis), although the differences did notreach statistical significance, a tendency towards a dif-ferent outcome was observed. In addition, in some clin-icopathological defined subgroups (i.e., SCC and ACpatients without lymph node metastasis), only very fewnumbers of patients were present with the SS genotype.For example, in SCC group, only three nodal negativepatients had the SS genotype. This number is insufficientto make a substantial statement on survival but under-lines the strong correlation between CA-SSR-1 lengthand nodal metastasis.
The median OS in M1a-positive patients was 12.3 months(95 % CI=8.1–16.5). Out of the total 23 patients withpresence of distant lymph node metastases, one patient diedperioperatively. Out of the 22 patients, only three patientspresented the LL genotype. Eight patients had the SL and 11the SS genotype. A distinctive OS difference was presentbetween the SL genotype with 14.8 months (95 % CI=8.6–21.0) and SS genotype patients with 9.7 months (95 % CI=6.6–12.9). This finding did not reach statistical significance(P=0.1).
CA-SSR-1: a prognostic factor for relapse and survival
Multivariate analysis according to the Cox regression hazardmodel using age, gender, tumor size, presence of regionallymph node and distant lymph node metastasis, tumor dif-ferentiation, cell type, and CA-SSR-1 were performed toevaluate the prognostic value of CA-SSR-1 in only
Table 2 CA-SSR-1 and overall survival
Total Adenocarcinoma Squamous cell carcinoma
Genotype N Mediansurvival(months)
95 % CI P value N Mediansurvival(months)
95 % CI P value N Mediansurvival(months)
95 % CI P value
All patients
Total 227 18.0 16.1–19.9 <0.001 115 18.0 15.1–20.8 <0.001 112 18.0 15.5–20.5 <0.001
LL 55 55.0 41.9–68.0 <0.001b/<0.001c
30 40.8 11.6–70.0 <0.001b/<0.001c
25 56.6 44.6–68.6 <0.001b/0.004c
SL 108 17.2 14.7–19.8 49 19.3 14.1–24.6 59 16.5 13.7–19.2
SS 64 11.6 9.1–14.2 36 10.4 5.9–14.8 28 12.9 8.8–17.1
Node negative (N0M0) patients
Total 73 43.4 28.5–58.4 <0.001 34 43.4 18.6–68.2 0.01 39 38.0 26.2–49.8 <0.001
LL 37 50.3a 45.1–55.5 <0.001b/0.2c
17 48.6a 39.3–57.9 0.1b/0.002c 20 56.6 46.7–66.5 <0.001b/0.9c
SL 28 22.2 1.4–42.9 12 35.4 22.9–47.8 16 15.3 10.6–20.0
SS 8 19.1 11.4–26.8 5 20.8 6.9–34.7 3 18.5 –
Node positive (N1M0) patients
Total 121 15.4 13.9–17.1 <0.001 69 15.4 12.6–18.2 <0.001 63 15.5 12.8–18.1 <0.001
LL 15 33.1 24.8–41.4 <0.001b/<0.001c
11 27.7 22.1–33.2 0.02b/0.001c
4 52.2a 39.7–64.7 0.004b/0.03c
SL 72 16.9 13.6–20.4 33 18.0 12.2–23.8 39 16.5 12.7–20.2
SS 45 10.9 7.8–14.2 25 10.4 6.3–14.4 20 12.5 6.7–18.3
Non regional node positive (M1a) patients
Total 22 12.3 8.1–16.5 0.3 12 8.6 7.1–10.2 0.4 10 12.5 10.8–14.2 0.2
LL 3 12.3 6.4–18.2 0.8b/0.1c 2 8.7 – 0.3b/0.8c 1 12.3 – 0.04b/0.8c
SL 8 14.8 8.6–21.0 4 4.0 0–18.7 4 14.8 10.4–19.2
SS 11 9.7 6.6–12.8 6 7.8 4.9–10.7 5 10.7 8.7–12.6
P value indicates significance according to log-rank test. 95 % CI represents 95 % confidence intervalaMean survival since median was not reachedb LL vs. SL genotypec SL vs. SS genotype
Targ Oncol
Author's personal copy
surgically treated EC patients. CA-SSR-1 was found to be astrong prognosticator of tumor recurrence and OS withsteadily increasing risk among LL, SL, and SS patients(Table 4). The prognostic value applied to both tumor typing(AC and SCC). The HR of CA-SSR-1 for tumor recurrenceand OS in SCC was 2.5 (95 % CI=1.3–4.8, P=0.005) and3.5 (95 % CI=2.1–6, P<0.0001), respectively. Accordingly,in AC patients, CA-SSR-1 had an HR of 2.7 (95 % CI=1.7–4.3, P<0.0001) for recurrence and 1.7 (95 % CI=1.2 to 2.8,P=0.01) for OS.
Discussion
This is the first study to evaluate the role of the CA simplesequence repeat polymorphism in intron-1 of the EGFRgene in complete resected only surgically treated EC. Wewere able to show that the CA-SSR-1 is an independentprognosticator of postoperative clinical outcome in com-plete resected only surgically treated EC patients. Our dataindicate that the prognostic value of CA-SSR-1 applies toAC and SCC of the esophagus.
EGFR, a membrane-associated tyrosine kinase receptor,is a major regulator of signaling pathways for cell surviv-al, migration, and tissue regeneration [17, 31]. It belongsto the erbB gene family, which has been identified as an
attractive target for new therapeutic strategies in variousmalignant neoplasms [32]. Currently, EGFR targetingagents are approved for treatment of NSCLC, head andneck SCC, and colorectal cancer, indicating potential ef-ficacy of anti-EGFR targeted therapy in AC and SCC[33–37].
It has become widely accepted that expression of EGFRis regulated at the level of transcription [17]. For EGFR, theregulatory sequences of the gene have been demonstratedwithin the 5′-flanking region and intron-1. Close to thedownstream enhancer, a polymorphic simple CA repeatsequence is found. The length of CA-SSR-1 is inverselycorrelated with the transcription of the EGFR gene [19, 20,29]. The prognostic value of CA-SSR-1 has been reported inseveral tumor types [21, 23, 25, 29, 38, 39]. Dube et al. [22]demonstrated prognostic value of CA-SSR-1 in NSCLCpatients. In that study, DNA was extracted from tumortissue, and the total sum of repeats correlated with thesurvival. Furthermore, a recent report identified CA-SSR-1as a predictor of gefitinib treatment in NSCLC [27]. Tzenget al. [25] reported that the shorter CA-SSR-1 is associatedwith worse pancreatic cancer clinical prognosis and re-sponse to erlotinib.
To our knowledge nothing has been reported on the roleof CA-SSR-1 in EC so far. Very few studies have focused onEGFR protein expression as a prognostic factor in EC [8,
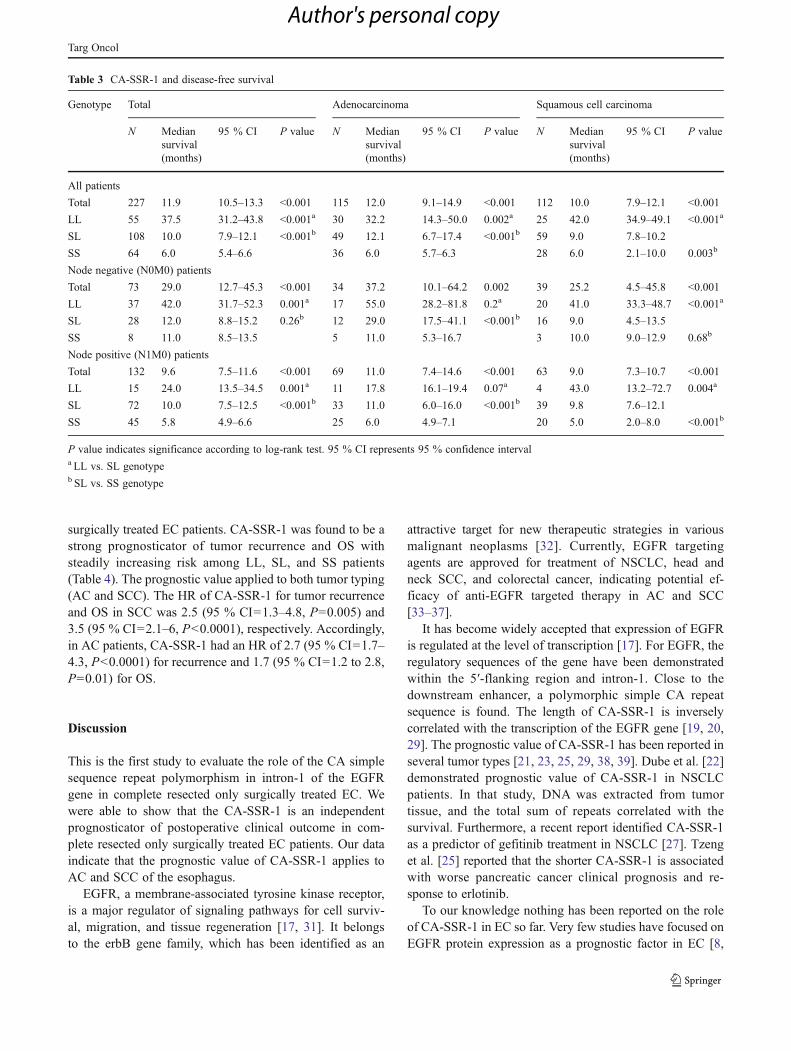
Table 3 CA-SSR-1 and disease-free survival
Genotype Total Adenocarcinoma Squamous cell carcinoma
N Mediansurvival(months)
95 % CI P value N Mediansurvival(months)
95 % CI P value N Mediansurvival(months)
95 % CI P value
All patients
Total 227 11.9 10.5–13.3 <0.001 115 12.0 9.1–14.9 <0.001 112 10.0 7.9–12.1 <0.001
LL 55 37.5 31.2–43.8 <0.001a 30 32.2 14.3–50.0 0.002a 25 42.0 34.9–49.1 <0.001a
SL 108 10.0 7.9–12.1 <0.001b 49 12.1 6.7–17.4 <0.001b 59 9.0 7.8–10.2
SS 64 6.0 5.4–6.6 36 6.0 5.7–6.3 28 6.0 2.1–10.0 0.003b
Node negative (N0M0) patients
Total 73 29.0 12.7–45.3 <0.001 34 37.2 10.1–64.2 0.002 39 25.2 4.5–45.8 <0.001
LL 37 42.0 31.7–52.3 0.001a 17 55.0 28.2–81.8 0.2a 20 41.0 33.3–48.7 <0.001a
SL 28 12.0 8.8–15.2 0.26b 12 29.0 17.5–41.1 <0.001b 16 9.0 4.5–13.5
SS 8 11.0 8.5–13.5 5 11.0 5.3–16.7 3 10.0 9.0–12.9 0.68b
Node positive (N1M0) patients
Total 132 9.6 7.5–11.6 <0.001 69 11.0 7.4–14.6 <0.001 63 9.0 7.3–10.7 <0.001
LL 15 24.0 13.5–34.5 0.001a 11 17.8 16.1–19.4 0.07a 4 43.0 13.2–72.7 0.004a
SL 72 10.0 7.5–12.5 <0.001b 33 11.0 6.0–16.0 <0.001b 39 9.8 7.6–12.1
SS 45 5.8 4.9–6.6 25 6.0 4.9–7.1 20 5.0 2.0–8.0 <0.001b
P value indicates significance according to log-rank test. 95 % CI represents 95 % confidence intervala LL vs. SL genotypeb SL vs. SS genotype
Targ Oncol
Author's personal copy

40–42]. Therapeutic strategies of EC vary widely through-out the world depending on the underlying histologicaltumor subtype. SCC and AC might be either approachedby chemo-radiotherapy in a curative intent and surgery onlybe considered as a salvage procedure or a combination ofboth may be undertaken [43, 44]. It is of utmost importanceto define a homogeneous patient population when reportingon a prognostic marker [45].
In our study, we enrolled only patients who were neitherneoadjuvantly nor adjuvantly treated and who only under-went complete surgical resection in a curative intent. In thishomogeneous study population, we identified the germ-lineCA-SSR-1 in leukocyte DNA as an independent prognosticmarker for tumor recurrence and survival. The CA-SSR-1represents an inherited nonchangeable transcription activityof the EGFR gene, which is unbiased by genomic instabilityoccurring in cancer tissue [17]. This is even of more impor-tance when the outcome of a specific therapy is correlated toCA-SSR-1 [9].
Therapy decision for adoption of EGFR-targeting agentsdepends on the pathological EGFR staging. Currently,EGFR staging is dependent upon IHC and FISH analysesfor assessment of the protein/gene expression level. Besidesthe fact that these evaluation tools are dependent on avail-ability of tumor tissue, they lack high sensitivity. Sauter etal. investigated the correlation of various EGFR detection
methods and the number of patients that might be con-sidered or benefit from anti-EGFR treatment. IHC wasreported to be an insufficient tool. In addition, Sauter etal. [46] outlined an overestimation of potential patientsconsidered for anti-EGFR therapy based on EGFR evalu-ation by IHC. In contrast, to the IHC the FISH methodwas addressed as a more reliable tool. Other studiespinpointed the limitations of confined interpretation ofFISH results since detection of low gene copy numbersare missed by FISH [46, 47].
It is likely that the tumor biology needs characterizationby other features than absolute protein expression or copynumbers of the amplified gene [17]. Hence, the need of amolecular biomarker, which is capable to predict and mon-itor the clinical outcome, is undeniable.
Based on our data, one may address CA-SSR-1 as aprognostic marker for tumor recurrence and survival inresected EC patients who are not otherwise treated. So far,the setting in our study allows following the natural courseof EC in correlation to CA-SSR-1. The strong correlation ofCA-SSR-1 and presence of DTC in bone marrow in bothtumor subtypes indicates a pivotal role of EGFR in earlyhaematogenous dissemination of the tumor cells in EC[48–50]. In consequence, the regulatory function of theCA-SSR-1 for EGFR transcriptional activity might demandmultimodular therapeutic approaches.
Table 4 Multivariate analysis for tumor recurrence and overall survival
Variables Recurrence Overall survival
Hazardratio
95 % confidenceinterval
P value Hazardratio
95 % confidenceinterval
P value
Sex
Male vs. female 0.8 0.5–1.2 0.2 0.8 0.5–1.2 0.2
Age (years)
≤60 vs. >60 1.1 0.8–1.6 0.4 0.9 0.7–1.3 0.8
Tumor size
pT1 and 2 vs. pT3 and 4 1.8 1.2–2.5 0.03 1.4 0.9–2.0 0.05
Nodal status
Negative vs. positive 2.5 1.6–3.9 <0.001 2.0 1.3–3.0 0.001
Non regional nodal status (M1a)
Negative vs. positive 1.4 0.8–2.3 0.2 1.4 0.9–2.3 0.1
Tumor grading: G1 reference
G1 vs. G2 1.4 0.8–2.5 0.3 1.7 0.9–3.1 0.08
G1 vs. G3 2.2 1.2–4.1 0.01 1.9 1.0–3.5 0.04
Tumor type
Squamous cell carcinoma vs. adenocarcinoma 0.9 0.7–1.3 0.6 0.9 0.7–1.4 0.9
CA-SSR-1 genotype
LL vs. SL 2.3 1.4–3.8 0.001 3.3 1.9–5.4 <0.001
LL vs. SS 6.0 3.3–10.8 <0.001 6.5 3.6–11.6 <0.001
P value indicate significance according to Cox regression hazard model for covariates as specified
Targ Oncol
Author's personal copy

In conclusion, our data indicate a pivotal role of CA-SSR-1in EC progression. The prognostic value of CA-SSR-1 appliesto AC and SCC. Even in high-risk subgroups like node-positive patients, CA-SSR-1 is able to build a new risk strat-ification, which is necessary in the era of individualized andtargeted therapies to improve the overall disease prognosis.
Conflict of interest statement The authors declare that they have noconflict of interest.
References
1. Malthaner RA, Wong RK, Rumble RB, Zuraw L (2004) Neo-adjuvant or adjuvant therapy for resectable esophageal cancer: asystematic review and meta-analysis. BMC Med 2:35
2. Peyre CG, Hagen JA, DeMeester SR et al (2008) Predictingsystemic disease in patients with esophageal cancer after esoph-agectomy: a multinational study on the significance of the numberof involved lymph nodes. Ann Surg 248:979–985
3. Malthaner R, Wong RK, Spithoff K (2010) Preoperative or post-operative therapy for resectable oesophageal cancer: an updatedpractice guideline. Clin Oncol (R Coll Radiol) 22:250–256
4. Karamouzis MV, Grandis JR, Argiris A (2007) Therapies directedagainst epidermal growth factor receptor in aerodigestive carcino-mas. Jama 298:70–82
5. Tabernero J, Macarulla T, Ramos FJ, Baselga J (2005) Noveltargeted therapies in the treatment of gastric and esophageal can-cer. Ann Oncol 16:1740–1748
6. Ferry DR, Anderson M, Beddard K et al (2007) A phase II study ofgefitinib monotherapy in advanced esophageal adenocarcinoma:evidence of gene expression, cellular, and clinical response. ClinCancer Res 13:5869–5875
7. Gibault L, Metges JP, Conan-Charlet V et al (2005) Diffuse EGFRstaining is associated with reduced overall survival in locallyadvanced oesophageal squamous cell cancer. Br J Cancer93:107–115
8. Wang KL, Wu TT, Choi IS et al (2007) Expression of epidermalgrowth factor receptor in esophageal and esophagogastric junctionadenocarcinomas: association with poor outcome. Cancer109:658–667
9. Gusterson BA, Hunter KD (2009) Should we be surprised at thepaucity of response to EGFR inhibitors? Lancet Oncol 10:522–527
10. Linardou H, Dahabreh IJ, Bafaloukos D et al (2009) SomaticEGFR mutations and efficacy of tyrosine kinase inhibitors inNSCLC. Nat Rev Clin Oncol 6:352–366
11. Janmaat ML, Gallegos-Ruiz MI, Rodriguez JA et al (2006) Pre-dictive factors for outcome in a phase II study of gefitinib insecond-line treatment of advanced esophageal cancer patients. JClin Oncol 24:1612–1619
12. Rao S, Starling N, Cunningham D et al (2008) Phase I study ofepirubicin, cisplatin and capecitabine plus matuzumab in previous-ly untreated patients with advanced oesophagogastric cancer. Br JCancer 99:868–874
13. Javle M, Pande A, Iyer R et al (2008) Pilot study of gefitinib,oxaliplatin, and radiotherapy for esophageal adenocarcinoma:tissue effect predicts clinical response. Am J Clin Oncol31:329–334
14. Hanawa M, Suzuki S, Dobashi Y et al (2006) EGFR protein over-expression and gene amplification in squamous cell carcinomas ofthe esophagus. Int J Cancer 118:1173–1180
15. Inada S, Koto T, Futami K et al (1999) Evaluation of malignancyand the prognosis of esophageal cancer based on an immunohis-tochemical study (p53, E-cadherin, epidermal growth factor recep-tor). Surg Today 29:493–503
16. Sunpaweravong P, Sunpaweravong S, Puttawibul P et al (2005)Epidermal growth factor receptor and cyclin D1 are independentlyamplified and overexpressed in esophageal squamous cell carcino-ma. J Cancer Res Clin Oncol 131:111–119
17. Brandt B, Meyer-Staeckling S, Schmidt H et al (2006) Mecha-nisms of egfr gene transcription modulation: relationship to cancerrisk and therapy response. Clin Cancer Res 12:7252–7260
18. Packeisen J, Nakachi K, Boecker W et al (2005) Cytogeneticdifferences in breast cancer samples between German and Japa-nese patients. J Clin Pathol 58:1101–1103
19. Gebhardt F, Burger H, Brandt B (2000) Modulation of EGFR genetranscription by a polymorphic repetitive sequence—a link be-tween genetics and epigenetics. Int J Biol Markers 15:105–110
20. Gebhardt F, Zanker KS, Brandt B (1999) Modulation of epidermalgrowth factor receptor gene transcription by a polymorphic dinu-cleotide repeat in intron 1. J Biol Chem 274:13176–13180
21. Suzuki M, Kageyama S, Shinmura K et al (2008) Inverse relation-ship between the length of the EGFR CA repeat polymorphism inlung carcinoma and protein expression of EGFR in the carcinoma.J Surg Oncol 98:457–461
22. Dubey S, Stephenson P, Levy DE et al (2006) EGFR dinucleotiderepeat polymorphism as a prognostic indicator in non-small celllung cancer. J Thorac Oncol 1:406–412
23. Kersting C, Agelopoulos K, Schmidt H et al (2008) Biologicalimportance of a polymorphic CA sequence within intron 1 of theepidermal growth factor receptor gene (EGFR) in high gradecentral osteosarcomas. Genes Chromosom Cancer 47:657–664
24. Liu W, Wu X, Zhang W et al (2007) Relationship of EGFRmutations, expression, amplification, and polymorphisms to epi-dermal growth factor receptor inhibitors in the NCI60 cell lines.Clin Cancer Res 13:6788–6795
25. Tzeng CW, Frolov A, Frolova N et al (2007) Pancreatic cancerepidermal growth factor receptor (EGFR) intron 1 polymorphisminfluences postoperative patient survival and in vitro erlotinibresponse. Ann Surg Oncol 14:2150–2158
26. Zhou Q, Cheung YB, Jada SR et al (2006) EGFR Intron 1 poly-morphism in Asian Populations and its correlation with EGFRgene expression and amplification in breast tumor tissues. CancerBiol Ther 5:1445–1449
27. Huang CL, Yang CH, Yeh KH et al (2009) EGFR intron 1 dinu-cleotide repeat polymorphism is associated with the occurrence ofskin rash with gefitinib treatment. Lung Cancer 64:346–351
28. Tiseo M, Capelletti M, De Palma G et al (2008) Epidermal growthfactor receptor intron-1 polymorphism predicts gefitinib out-come in advanced non-small cell lung cancer. J Thorac Oncol3:1104–1111
29. Buerger H, Gebhardt F, Schmidt H et al (2000) Length and loss ofheterozygosity of an intron 1 polymorphic sequence of egfr isrelated to cytogenetic alterations and epithelial growth factor re-ceptor expression. Cancer Res 60:854–857
30. Fehm T, Braun S, Muller V et al (2006) A concept for the stan-dardized detection of disseminated tumor cells in bone marrowfrom patients with primary breast cancer and its clinical imple-mentation. Cancer 107:885–892
31. Dragovich T, Campen C (2009) Anti-EGFR-targeted therapy foresophageal and gastric cancers: an evolving concept. J Oncol2009:804108
32. Hynes NE, MacDonald G (2009) ErbB receptors and signalingpathways in cancer. Curr Opin Cell Biol 21:177–184
33. Allegra CJ, Jessup JM, Somerfield MR et al (2009) AmericanSociety of Clinical Oncology provisional clinical opinion: test-ing for KRAS gene mutations in patients with metastatic
Targ Oncol
Author's personal copy

colorectal carcinoma to predict response to anti-epidermalgrowth factor receptor monoclonal antibody therapy. J ClinOncol 27:2091–2096
34. Eberhard DA, Giaccone G, Johnson BE (2008) Biomarkers ofresponse to epidermal growth factor receptor inhibitors in Non-Small-Cell Lung Cancer Working Group: standardization for usein the clinical trial setting. J Clin Oncol 26:983–994
35. Engelman JA, Janne PA (2008) Mechanisms of acquired resistanceto epidermal growth factor receptor tyrosine kinase inhibitors innon-small cell lung cancer. Clin Cancer Res 14:2895–2899
36. Langer CJ (2008) Targeted therapy in head and neck cancer: stateof the art 2007 and review of clinical applications. Cancer112:2635–2645
37. Linardou H, Dahabreh IJ, Kanaloupiti D et al (2008) Assessmentof somatic k-RAS mutations as a mechanism associated withresistance to EGFR-targeted agents: a systematic review andmeta-analysis of studies in advanced non-small-cell lung cancerand metastatic colorectal cancer. Lancet Oncol 9:962–972
38. Buerger H, Packeisen J, Boecker A et al (2004) Allelic length of aCA dinucleotide repeat in the egfr gene correlates with the fre-quency of amplifications of this sequence—first results of an inter-ethnic breast cancer study. J Pathol 203:545–550
39. Brandt B, Hermann S, Straif K et al (2004) Modification of breastcancer risk in young women by a polymorphic sequence in the egfrgene. Cancer Res 64:7–12
40. Boone J, van Hillegersberg R, Offerhaus GJ et al (2009) Targetsfor molecular therapy in esophageal squamous cell carcinoma: animmunohistochemical analysis. Dis Esophagus 22:496–504
41. Ressiot E, Dahan L, Liprandi A et al (2008) Predictive factors ofthe response to chemoradiotherapy in esophageal cancer. Gastro-enterol Clin Biol 32:567–577
42. Wei Q, Chen L, Sheng L et al (2007) EGFR, HER2 and HER3expression in esophageal primary tumours and corresponding me-tastases. Int J Oncol 31:493–499
43. Mariette C, Piessen G, Triboulet JP (2007) Therapeutic strategiesin oesophageal carcinoma: role of surgery and other modalities.Lancet Oncol 8:545–553
44. Quiros RM, Bui CL (2009) Multidisciplinary approach to esoph-ageal and gastric cancer. Surg Clin N Am 89:79–96, viii
45. McShane LM, Altman DG, Sauerbrei W et al (2005) Reportingrecommendations for tumor marker prognostic studies. J ClinOncol 23:9067–9072
46. Sauter G, Simon R, Hillan K (2003) Tissue microarrays in drugdiscovery. Nat Rev Drug Discov 2:962–972
47. Roetger A, Brandt B, Barnekow A (1997) Competitive-differential polymerase chain reaction for gene dosage estima-tion of erbB-1 (egfr), erbB-2, and erbB-3 oncogenes. DNACell Biol 16:443–448
48. Pantel K, Brakenhoff RH (2004) Dissecting the metastatic cascade.Nat Rev Cancer 4:448–456
49. Pantel K, Brakenhoff RH, Brandt B (2008) Detection, clinicalrelevance and specific biological properties of disseminating tu-mour cells. Nat Rev Cancer 8:329–340
50. Pantel K, Cote RJ, Fodstad O (1999) Detection and clinicalimportance of micrometastatic disease. J Natl Cancer Inst91:1113–1124
Targ Oncol
Author's personal copy
Copyright © 2022 FDOKUMEN