Efficient autonomous pushback and taxiing - HAW Hamburg
80
1 Master Thesis Department Fahrzeugtechnik und Flugzeugbau Efficient autonomous pushback and taxiing- a step forward to reducing costs and pollution Dwayne Raes 2008-07-08 1
-
Upload
khangminh22 -
Category
Documents
-
view
5 -
download
0
Transcript of Efficient autonomous pushback and taxiing - HAW Hamburg
1
Master Thesis Department Fahrzeugtechnik und Flugzeugbau Efficient autonomous pushback and taxiing- a step forward to reducing costs and pollution
Dwayne Raes
2008-07-08
1
2
Katholieke Hogeschool Brugge – Oostende Departement Industriële Wetenschappen – Technologie Campus Oostende Zeedijk 101 B-8400 Oostende Belgium In cooperation with: Hochschule für Angewandte Wissenschaften Hamburg Departement Fahrzeugtechnik und Flugzeugbau Berliner Tor 9 20099 Hamburg Germany Author: Raes Dwayne Delivery date: 30. June 2008 1. Examiner: Prof. Dr.-Ing. Dieter Scholz 2. Examiner: Dipl.-Ing. Francisco Gomez Tutor: Dipl.-Ing. Francisco Gomez
2
(c)
Commercial use strictly prohibited. Your request may be directed to: Prof. Dr.-Ing. Dieter Scholz, MSME E-Mail see: http://www.ProfScholz.de Download this file from: http://Bibliothek.ProfScholz.de

3
Abstract The current Pushback and Taxi procedures are very fuel inefficient these days. That is caused by the use of different airports and different types of airplanes. There are many different procedures and facilities. Therefore a low cost ground handling aircraft is going to be built. This is the purpose of the ALOHA project. All the changes will be done on an AIRBUS A320 while it is the most commonly used aircraft as low cost carriers, so a low cost and independent aircraft will be designed. This paper will deal with the taxi and pushback procedure and not the other ground handlings like de-icing, energy supply, boarding in,… To see if the integration of a new system is more efficient than the current-state-of-the-art, a detailed cost breakdown for ground operations and fuel consumption have to be carried out. Also all the ground handling procedure must be fully understood in order to minimize the time aspect and costs of them. There are proposals done of making a full towing procedure or putting an electromotor in the nose gear, so the aircraft can drive autonomous. Of both proposals a procedure time schedule and a total cost calculation is made. This includes depreciation, fuel savings and maintenance cost. What also is taken in consideration is the extra DOC cost of the aircraft due to the extra weight. Depending on the procedure there are time reductions and cost reductions. An other issue of a shorter pushback and taxi procedure is the emission and noise reduction. It is logic that with a shorter use of the main engines that there is a lower pollution in and around the airport, what means an environmental improvement occurs. As seen in the procedure schedules and conclusion, it will be made clear that an optimization of the procedure reduces the costs and pollution.
3

4
DEPARTMENT OF AUTOMOTIVE AND AERONAUTICAL ENGINEERING
Efficient Autonomous Pushback and Taxiing – A Step towards Reduced Costs and Pollution Task for a Project
Background Current pushback and taxiing procedures are very fuel-inefficient and noisy mission phases. Furthermore, the necessity of a pushback tractor and a controller clearance to perform the operations leads to undesirable time consumption. However, two solutions have been proposed for this problem so far: a) Full towing aircraft from apron to holding area, b) Electrical driven nose landing gear. According to Virgin Airlines, “Towing aircraft from a stand substantially can reduce the amount of time they need to taxi with their engines running and reduces the time spent queuing before take-off”, but despite this operation has been used by some airlines, this improvement has not been clearly proven yet. On the other hand, it is claimed than an electrical driven nose landing gear may be the best solution for autonomous pushback and taxiing, but it is still under early development. This project is part of the aircraft design research project "ALOHA" (http://ALOHA.ProfScholz.de). Task The project task is to evaluate existing solutions as well as identify promising new solution for the efficiency improvement of the autonomous pushback and taxing operations. The task includes
• gathering information about the current state-of-the-art of technologies and operations,
• proposing new and innovative solutions for the problem, • checking feasibility of proposed technologies by means of draft system layout and
sizing, • comparing proposed solutions with the current operation in order to evaluate the
improvement, • identifying the most suitable technologies and further developments.
The report has to be written in English based on German or international standards on report writing.
4

5
Declaration This Thesis is entirely my own work. Where work has been used from others, it has totally been acknowledged and referenced. Date Signature June 30, 2008
5
6
Contents
Page Abstract…. ................................................................................................................................. 3 Task description ......................................................................................................................... 4 Declaration ................................................................................................................................. 5 List of Pictures ........................................................................................................................... 9 List of Tables............................................................................................................................ 10 List of Abbreviations................................................................................................................ 11 List of Symbols ........................................................................................................................ 12 Terms and Definitions.............................................................................................................. 13 1 Introduction ......................................................................................................... 14 1.1 Motivation ............................................................................................................. 14 1.2 Objectives.............................................................................................................. 14 1.3 Report overview .................................................................................................... 14 2 Current state-of-the-art of technologies and operations.................................. 16 2.1 Equipment: Pushback and Pushback Truck .......................................................... 16 2.2 Time: Current pushback and taxi procedure ......................................................... 17 2.2.1 Pushback procedure............................................................................................... 17 2.2.2 Taxi procedure....................................................................................................... 18 2.3 Fuel consumption: Engines and their fuel consumption ....................................... 21 2.3.1 Auxiliary Power Unit ............................................................................................ 21 2.3.2 Head Engine’s ....................................................................................................... 22 2.4 Costs ...................................................................................................................... 22 3 Change of equipment .......................................................................................... 25 3.1 introduction: APS.................................................................................................. 25 3.2 Electrical driven nose gear .................................................................................... 25 3.3 Auxiliary Power Unit ............................................................................................ 26 3.4 Mechanical calculations ........................................................................................ 27 3.5 Procedure change .................................................................................................. 29 3.6 Cost APS ............................................................................................................... 31 4 New Procedures ................................................................................................... 33 4.1 Autonomous Pushback and taxi ............................................................................ 33 4.2 Costs Autonomous Pushback and taxi .................................................................. 35 4.3 After landing taxiing ............................................................................................. 36
6

7
5 Full Towing .......................................................................................................... 37 5.1 Research and principles......................................................................................... 37 5.2 Demands for Full Towing .................................................................................... 37 5.3 Procedure Schedule ............................................................................................... 38 5.4 Costs Full Towing ................................................................................................ 39 5.5 Pollution ................................................................................................................ 41 5.6 Conclusion ............................................................................................................ 41 6 Emission gasses/ pollution................................................................................... 42 6.1 Research ................................................................................................................ 42 6.2 Problems Involving Emission Gasses ................................................................... 42 6.3 Emission Gasses .................................................................................................... 44 6.4 Conclusion............................................................................................................. 47 7 DOC ...................................................................................................................... 48 7.1 Ground handling.................................................................................................... 48 7.2 Fuel costs............................................................................................................... 48 7.3 Aircraft DOC ........................................................................................................ 49 7.4 Depreciation ......................................................................................................... 52 7.5 Maintenance .......................................................................................................... 53 7.6 Total costs.............................................................................................................. 57 8 Overview............................................................................................................... 58 8.1 Conclusion............................................................................................................. 58 8.2 Comparison of results ........................................................................................... 58 8.3 Further development ............................................................................................. 60 Literature list .......................................................................................................................... 61 APPENDIX A ......................................................................................................................... 63 A.1 Excel sheet Current procedure .............................................................................. 63 A.2 Excel sheet procedure 2: APS ............................................................................... 65 A.3 Excel sheet procedure 3: APS + Taxi.................................................................... 67 A.4 Excel sheet procedure 4: Full Towing................................................................... 69 APPENDIX B.......................................................................................................................... 71 B.1 Dimensions A320 .................................................................................................. 71 B.2 Preliminary info tow truck forces.......................................................................... 72 APPENDIX C Emission gasses in kg/min per flight phase ................................................ 74 APPENDIX D Excel sheet with aircraft DOC calculation ................................................ 75
7

8
APPENDIX E Excel sheet with the maintenance cost calculation .................................... 78 APPENDIX F CD with thesis in PDF and the excel worksheet ........................................ 80
8
9
List of pictures Picture 2.1 Pushback, gate and ground staff........................................................................ 17 Picture 2.2 Gantt’s Table current procedure........................................................................ 20 Picture 3.1 A320 sizing........................................................................................................ 26 Picture 3.2 Mechanical balance schedule A320................................................................... 27 Picture 3.3 Gantt’s Table procedure 2 APS ......................................................................... 31 Picture 4.1 Gantt’s Table procedure 3 APS+Taxi................................................................ 34 Picture 5.1 Gantt’s Table procedure 4 Full Towing............................................................. 39 Picture 6.1 Jet engine combustion principle ........................................................................ 43 Picture 6.2 Health effects of emission gasses ...................................................................... 43 Picture 6.3 Environmental effects of emission gasses ......................................................... 44 Picture 6.4 UHC and CO in function of engine speed ......................................................... 45 Picture 6.5 NOx in function of engine speed ....................................................................... 46 Picture 7.1 Procedure of the maintenance of an electro motor ............................................ 55 Picture 8.1 Price calculation of wheeltug............................................................................. 59
9
10
List of Tables Table 2.1 Gantt’s table current procedure.................................................................... 20 Table 2.2 Ground handling costs ................................................................................. 23 Table 2.3 Characteristic fuel consumption current procedure ..................................... 24 Table 2.4 results of current procedure ......................................................................... 24 Table 3.1 Power for Sizing electrical engine .............................................................. 28 Table 3.2 values for the Gantt’s Table APS................................................................. 30 Table 3.3 Characteristic fuel consumption APS .......................................................... 32 Table 3.4 results of APS .............................................................................................. 32 Table 4.1 values for the Gantt’s Table APS and taxi................................................... 34 Table 4.2 Characteristic fuel consumption APS and taxi ............................................ 35 Table 4.3 Results of APS and Taxi .............................................................................. 35 Table 5.1 Values for the Gantt’s Table Full Towing ................................................... 39 Table 5.2 Characteristic fuel consumption Full Towing.............................................. 40 Table 5.3 Results of Full Towing................................................................................. 40 Table 6.1 Emission gasses ground handling Finn air................................................... 43 Table 6.2 Emission table in kg/min per flight phase ................................................... 46 Table 6.3 Emission table in kg/year per procedure ..................................................... 47 Table 7.1 Fuel costs overview...................................................................................... 49 Table 7.2 Input data aircraft DOC ............................................................................... 51 Table 7.3 DOC calculation results ............................................................................... 52 Table 7.4 Failure to removal ratio................................................................................ 54 Table 7.5 Example calculation maintenance costs....................................................... 56 Table 7.6 Total cost overview...................................................................................... 57 Table 8.1 comparison with wheeltug ........................................................................... 60
10

11
List of Abbreviations AC Alternating current APS Autonomous Pushback System APU Auxiliary Power Unit FTRR Failure to repair ratio DMC Direct maintenance cost DOC Direct Operation cost DOCsys Direct Operation Cost system ME Main Engines MLG Main Landing Gear MTBF Mean time between failures MTBUR Mean time between unscheduled failures MTOW Maximum Take Off Weight PM Particle Matter RT Repair time TBL Tow Less Bar UHC Unburned Hydro Carbons
11

12
List of Symbols h hour hP horsepower km kilometers MA Moment around point A min minute P Power sec second V Volt
Greek Symbols µ friction of the tires ρ density
12

13
Explanation of terms and definitions Tug "A tug is an other word for a pushback truck“ Apron “The airport ramp or apron is part of an airport. It is usually the area where aircraft are parked, unloaded or loaded, refueled or boarded. Although the use of the apron is covered by regulations, such as lighting on vehicles, it is typically more accessible to users than the runway or taxiway. However, the apron is not usually open to the general public and a license may be required to gain access” (Wikipedia 2008)
13
14
1 Introduction
1.1 Motivation With the recent consumption society we live in, it is necessary to make everything as efficient as possible. An efficient autonomous pushback and taxiing can be dealt with either. The changes have an influence on the environment, less fuel consumption, less noise, less pollution. Here for a project called ALOHA is funded by Airbus, Airport Hamburg and HAW Hamburg. The task is to make a low fare autonomous aircraft.
1.2 Objectives . The task is to evaluate the existing current-state-of-the-art technologies. This is done by making a theoretical standard procedure and calculating the current costs as well as to identify promising new solutions for the efficiency improvement of the autonomous pushback and taxing operations. The final results can only be found by gathering information about the current state-of-the-art of technologies and operations, proposing new and innovative solutions for the problem, checking feasibility of proposed technologies by means of draft system layout and sizing, comparing proposed solutions with the current operation in order to evaluate the improvement and at last identifying the most suitable technologies and further developments. With these results the ALOHA project is a step closer to reduce the ground handling costs and turn around time.
1.3 Report Structure Chapter 2 contains all the information about the material that is necessary to perform the current pushback procedure with the associated costs. A theoretical case study of the current pushback and taxi procedure is made. Together with brief introduction about the ME and APU, ground handling costs and a detailed fuel consumption calculation. Chapter 3 deals with the APS. The design concept is explained, the sizing is calculated and compared with other models. Also explanation of the APU which will feed the APS. Then a new procedure with only an autonomous pushback is introduced with the necessary calculations of fuel consumption and time aspects.
14

15
Chapter 4 has a change of the time aspect: procedure change. Here a full autonomous
pushback and taxi procedure is proposed with the including charts and cost calculation of fuel consumption. Also the after landing aspect is mentioned.
Chapter 5 is about the full towing procedure. Tests and results of other paper are included and controlle calculations. All the necessary aspects are discussed and out of these a
conclusion about this procedure is made. Chapter 6 contains all the troubleshooting and explanation of the emission gasses which
Increase or decrease on the airport due to the procedure changes. The effects on humans and the environment can be found and also a calculation of the proposed procedures.
Chapter 7 is a completion of the previous chapters in order to the cost aspect. Both DOC of an aircraft and DOC of the system are integrated. Depreciation and maintenance of the APS is also taken into account. Here a total cost schedule is set up. Chapter 8 contains the conclusion of the paper. Every previous result is written down
again and discussed. This includes further development and proposals in order to perfect the procedure and get better results.
15
16
2 Current state-of-the-art of technologies and operations
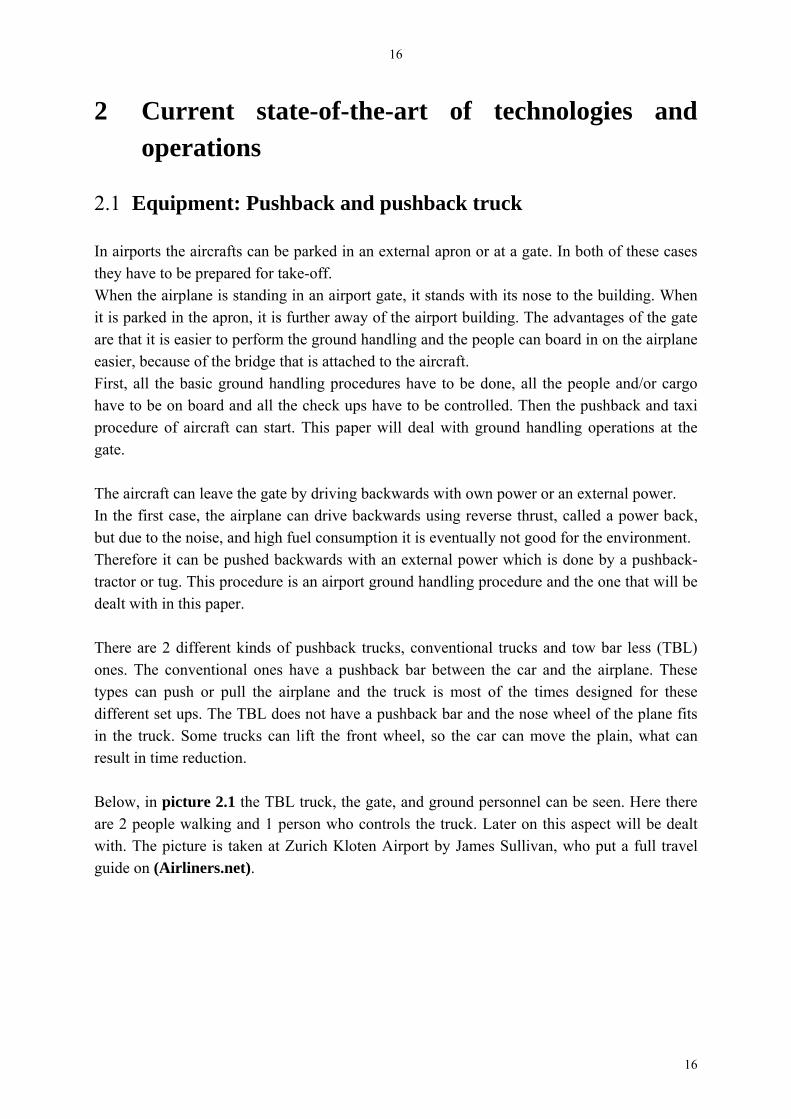
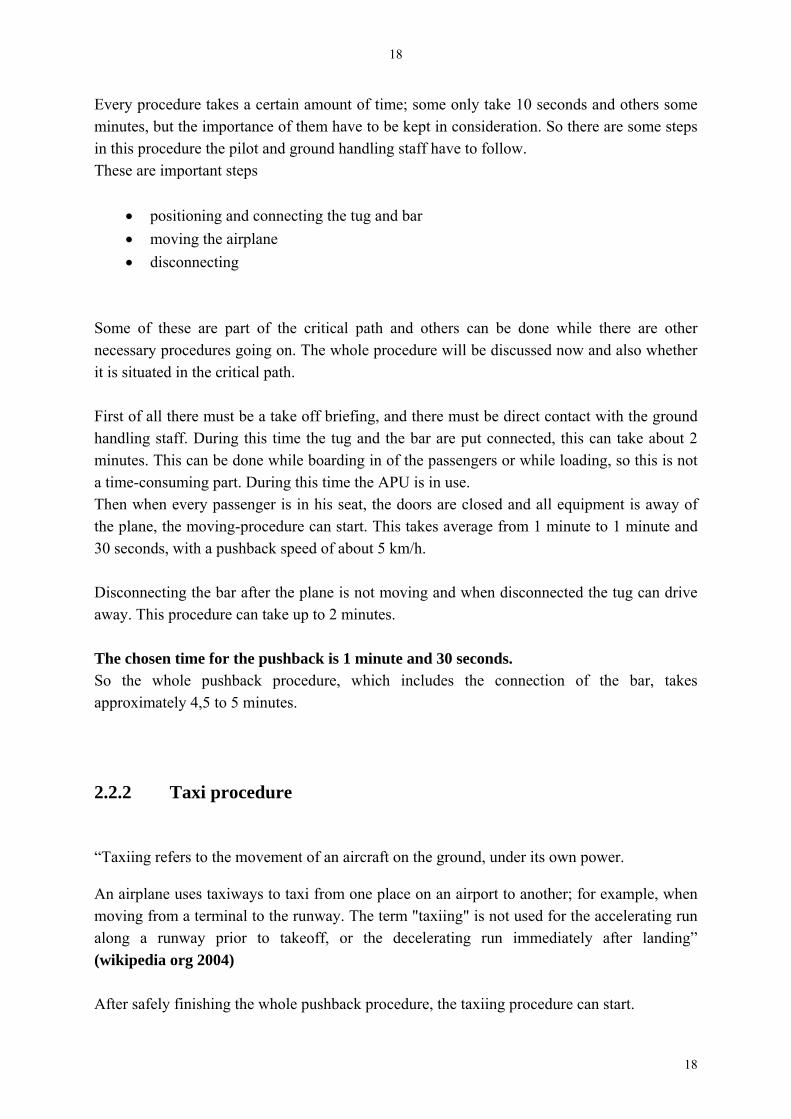
2.1 Equipment: Pushback and pushback truck In airports the aircrafts can be parked in an external apron or at a gate. In both of these cases they have to be prepared for take-off. When the airplane is standing in an airport gate, it stands with its nose to the building. When it is parked in the apron, it is further away of the airport building. The advantages of the gate are that it is easier to perform the ground handling and the people can board in on the airplane easier, because of the bridge that is attached to the aircraft. First, all the basic ground handling procedures have to be done, all the people and/or cargo have to be on board and all the check ups have to be controlled. Then the pushback and taxi procedure of aircraft can start. This paper will deal with ground handling operations at the gate. The aircraft can leave the gate by driving backwards with own power or an external power. In the first case, the airplane can drive backwards using reverse thrust, called a power back, but due to the noise, and high fuel consumption it is eventually not good for the environment. Therefore it can be pushed backwards with an external power which is done by a pushback-tractor or tug. This procedure is an airport ground handling procedure and the one that will be dealt with in this paper. There are 2 different kinds of pushback trucks, conventional trucks and tow bar less (TBL) ones. The conventional ones have a pushback bar between the car and the airplane. These types can push or pull the airplane and the truck is most of the times designed for these different set ups. The TBL does not have a pushback bar and the nose wheel of the plane fits in the truck. Some trucks can lift the front wheel, so the car can move the plain, what can result in time reduction. Below, in picture 2.1 the TBL truck, the gate, and ground personnel can be seen. Here there are 2 people walking and 1 person who controls the truck. Later on this aspect will be dealt with. The picture is taken at Zurich Kloten Airport by James Sullivan, who put a full travel guide on (Airliners.net).
16

17
Picture 2.1 An A320 with TBL pushback truck at the gate, with the ground handling staff
2.2 Time: Pushback and taxiing procedure
y procedure takes time and can be reduced with
urrent procedure has been produced by means of real ground handling
2.2. Pus a t procedure during which an aircraft is pushed backwards away from n airport gate by external power, when there isn't enough room for the aircraft to turn around
ime is a big aspect of the procedures, everT
proper study and changes. Some examples of ground handling procedures: de-icing, boarding in, standard check-up, connecting the tug ...The procedures that are being worked on here are the pushback and taxi procedure. It also includes the start up from the engines and the fuel consumption.
full theoretical cAprocedure videos available at the internet. But with guidance advice and help of a pilot and flight Director of Thomas Cook (Raes 2008) The procedure is being explained in the next paragraphs.
1 Pushback procedure
“ hb ck is an airporaunder its own power (which requires some degree of forward motion). Pushback procedures are carried out by special, low-profile vehicles called pushback tractors or tugs” (Wikipedia 2008)
17
18
Every procedure takes a certain amount of time; some only take 10 seconds and others some minutes, but the importance of them have to be kept in consideration. So there are some steps in this procedure the pilot and ground handling staff have to follow. These are important steps
• positioning and connecting the tug and bar • moving the airplane • disconnecting
ome of these are part of the critical path and others can be done while there are other ssed now and also whether
irst of all there must be a take off briefing, and there must be direct contact with the ground andling staff. During this time the tug and the bar are put connected, this can take about 2 inutes. This can be done while boarding in of the passengers or while loading, so this is not
his time the APU is in use. hen when every passenger is in his seat, the doors are closed and all equipment is away of
the plane, the moving-procedure can start. This takes average from 1 minute to 1 minute and
e pushback is 1 minute and 30 seconds.
ax ent of an aircraft on the ground, under its own power.
e on an airport to another; for example, when v The term "taxiing" is not used for the accelerating run n o takeoff, or the decelerating run immediately after landing”
After safely finishing the whole pushback procedure, the taxiing procedure can start.
Snecessary procedures going on. The whole procedure will be discuit is situated in the critical path. Fhma time-consuming part. During tT
30 seconds, with a pushback speed of about 5 km/h. Disconnecting the bar after the plane is not moving and when disconnected the tug can drive away. This procedure can take up to 2 minutes. The chosen time for thSo the whole pushback procedure, which includes the connection of the bar, takes approximately 4,5 to 5 minutes.
.2.2 Taxi procedure 2
“T iing refers to the movem
An airplane uses taxiways to taxi from one placmo ing from a terminal to the runway. alo g a runway prior t(wikipedia org 2004)
18
19
This procedure is the driving on own power of the airplane, from the gate (after pushback) to the runway. This procedure is nowhere the same, because every airport has different accommodations,
Unfamiliarity of the pilots with the airport Different taxiways and procedures
o the whole taxi period depends on the airport, and that makes it hard to make a standard
n the next paragraphs.
ut the Gantt’s Table is just a figure to see the overview of the procedure.
task is being
he yellow blocks before the blue in the Pushback procedure mean the connection of the ar, which consumes 2 minutes and can be performed while boarding in, loading the luggage,
l time problem. he yellow bl k after the pushback m ns the disconnecting of the bar and driving away the
truck. This is a more critical time consuming procedure, because it has to be done before the rocedure
U is u tarting ME1 and ME2, after that the APU of. When the APU is
he ta dure start for 7m d 20 seconds, fo y the actual take-off.
the theoretical study is the fact that the taxiing starts es aft necting the bar ty of ground ha taff.
chosen ta for the theoretical is 7 minutes and 20 seconds.
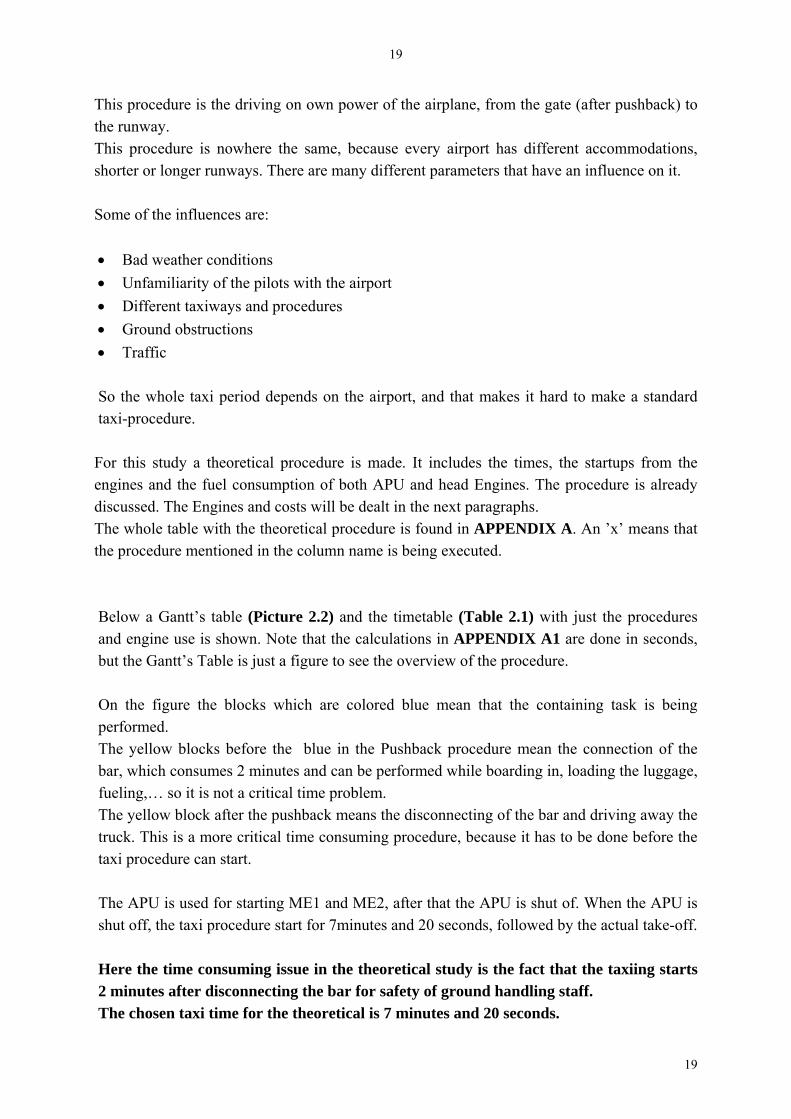
shorter or longer runways. There are many different parameters that have an influence on it. Some of the influences are: • Bad weather conditions ••• Ground obstructions • Traffic Staxi-procedure. For this study a theoretical procedure is made. It includes the times, the startups from the engines and the fuel consumption of both APU and head Engines. The procedure is already discussed. The Engines and costs will be dealt iThe whole table with the theoretical procedure is found in APPENDIX A. An ’x’ means that the procedure mentioned in the column name is being executed. Below a Gantt’s table (Picture 2.2) and the timetable (Table 2.1) with just the procedures and engine use is shown. Note that the calculations in APPENDIX A1 are done in seconds, b On the figure the blocks which are colored blue mean that the containingperformed. Tbfueling,… so it is not a criticaT oc ea
taxi p can start.
The AP sed for s is shut shut off, t xi proce inutes an llowed b Here the time consuming issue in2 minut er discon for safe ndling sThe xi time
19
20
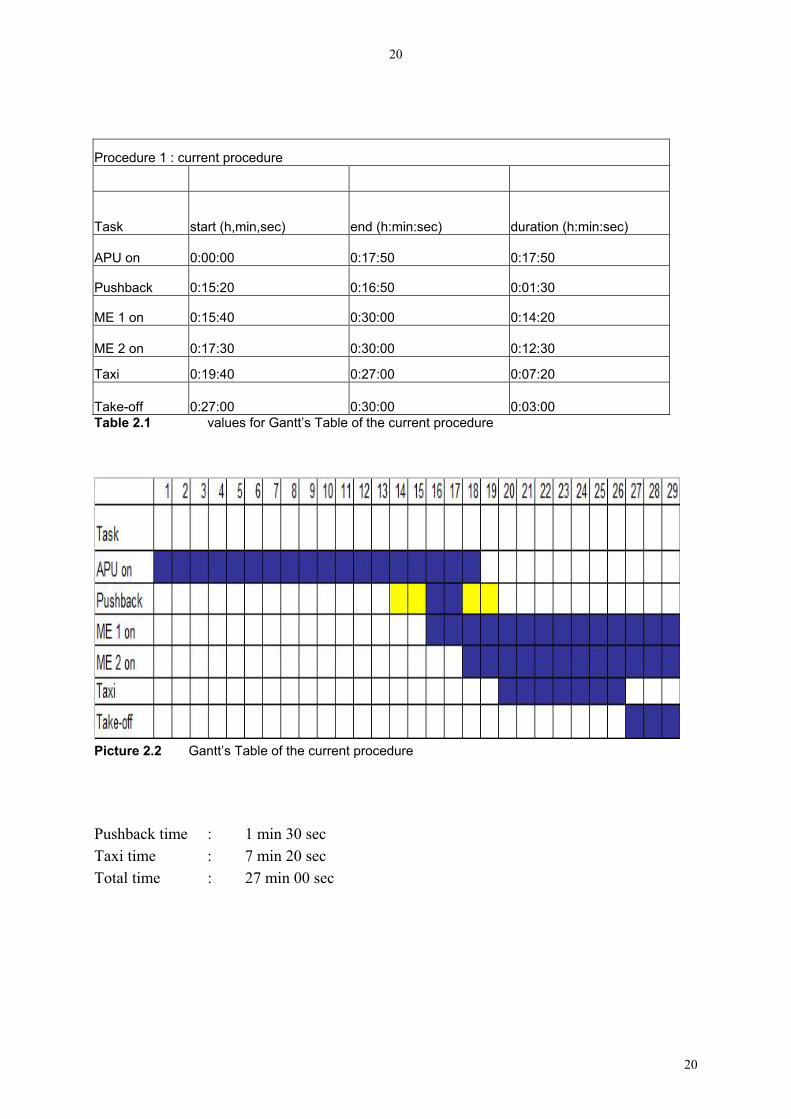
rocedure 1 : current procedure
P
Task start (h,min,sec) end (h:min:sec) duration (h:min:sec)
APU on 0:00:00 0:17:50 0:17:50
Pushback 0:15:20 0:16:50 0:01:30
ME 1 on 0:15:40 0:30:00 0:14:20
ME 2 on 0:17:30 0:30:00 0:12:30
Taxi 0:19:40 0:27:00 0:07:20
Take-off 0:27:00 0:30:00 0:03:00 Table 2.1 values for Gantt’s Table of the current procedure
Picture 2.2 Gantt’s Table of the current procedure Pushback time : 1 min 30 sec Taxi time : 7 min 20 sec Total time : 27 min 00 sec
20

21
2.3 Fuel consumption: Engines and their fuel consumption
2.3 r Unit On an airplane it is required to have several kinds of energy to run the systems on board.
APIC APS 3200
or electrical systems on board. The APU uses 75 kg/h Raes 08). In some cases the airplane
kes electricity and pneumatic power from the airport. Together with air conditioning the PU can be on full load. For starting the main engines the APU is used. So the APU is
lways in full load. From the startup from the APU until shutdown, it takes approximately 25 mption of 150 kg/h.
APU is
the Air-conditioning system and pushback for starting ME1 and after the
the end of the pushback for starting ME2. When both ME’s are running the
.1 Auxiliary Powe
Because it takes some time for starting the main engines and because of the high fuel consumption of them, an auxiliary power unit (APU) is installed. This engine can create pneumatic power to start the main engines, The APU is a gas turbine engine, which is being used for the power supply to the electrical, pneumatic and hydraulic systems, when the main engines are not in use or do not function. But as said before an important function is to start to start up the main engines (ME) with pneumatic power.
n the Airbus A320 series there are 3 available APU’s O
• Honeywell 36-300 APU standard • Honeywell 131-9(A) •
As soon as the pilots get in the cabine, they start the APU. It is needed for the air conditioning and sometimes for the electrical supply fof jet fuel without any loads and 150 kg/h with full load (taAaminutes, and that at a fuel consu For the theoretical case study, see [APENDIX A1] and (Table 2.1), this means theon for almost 17 minutes. There is not a specific rule on how to use the APU for these systems. In the theoretical case the APU is started up and used for Electrical supply. Then it is used during theprocedure or at APU is shut of immediately. (Raes 08) The fuel costs are being explained in the next paragraph.
21
22
2.3.2 Main Engines
gines on board, 2 CFM556-5 from CFM International. “l multi-stage compressor with one-stage h( Tathe engine’s are started they have each a fuel consumption of 275kg/h, value of General Electric CFM56. Ii
calculated here are for 1 procedure take-off.
rd current theoretical procedure of picture 2.2 APPENDIX A1
ption during taxi is only a smart fracture of the total fuel consumption ple calculation is used. For evaluation with the later on ethod will be integrated and explained for the total costs of
the procedures. Because m at can be changed will be dealt with. So in this case it is only the fuel andling c so pushback truck and ground handling staff, whi airport.
The ground handling costs depend on the airport. Or the airport charges for the ground handling costs or the groun rnal ground handling company, which works together with e below there are ples of the fees charged by some airports in ly and Switzerland. (Aena 99)
An A320 has 2 main en
A CFM56-5 is a high bypass turbofan; coaxial front fan/booster driven by multistage ow pressure turbine, igh pressure turbine and annular combustor.” U.S. DOT 98)
he first Main Engine starts up while the pushback is busy. During pushback, one engine runs utonomous and at the end of the pushback, the pilots are busy starting the second one. Once
n the theoretical example the fuel consumption calculation stops before the take off, because t isn’t a part of the Taxi procedure.
2.4 Costs First of all there has to be said that all the costs which are before the Also this part of calculation is for the standaand shown in Since the fuel consumduring the whole flight, a simfollowing proposals the DOC m
oney has to be saved, only the costs thconsumption and the ground h osts, ch are charged by the
d handling is arranged by an extethe airport. In the tabl some exam Spain, Ita
22

23
Airport handling cost €
Salzburg Airport towing truck 79,3
headset and pushback control 36,1
manpower per person 18,1
Total cost 133,5
Tallinn Airport pushback 63,27
Tow bar 22,37
manpower per person 15,98
Total cost 101,62
Aena Spanish Airports up staff 8,17 Communication with pushback or start
Equipment for communication 8,17
Pushback bar 22,07
Push back operation 84,19
Total cost 122,6 Table 2.2 The average ground handling cost of these airport charges is 119,24€. In the theoretical
Aena-cost is sed because it is close to the average.
s, power supply and services.
ts of both APU and Main Engines depends on how much the fuel osts, the characteristic fuel consumption (kg/h) of the engines and total mass of fuel
(
procedure, the Spanish u A problem in calculation can occur because some Airports have 1 Airport price which includes all handling For the rest of the calculations, the ground handling costs are converted to $. The rate can be found below. The fuel consumption coscconsumed during the procedure. At the moment of writing the price for jet fuel A is 3.0840 $/gallon. IATA 2007)
The jet fuel’s density ρ = 0.8 kg/l The exchange rate of dollar and € at the moment of writing is 1€ 1.5898$= A detailed fuel cost calculation in an Excel sheet depending on the procedure can be found
APPENDIX A1 in
23
24
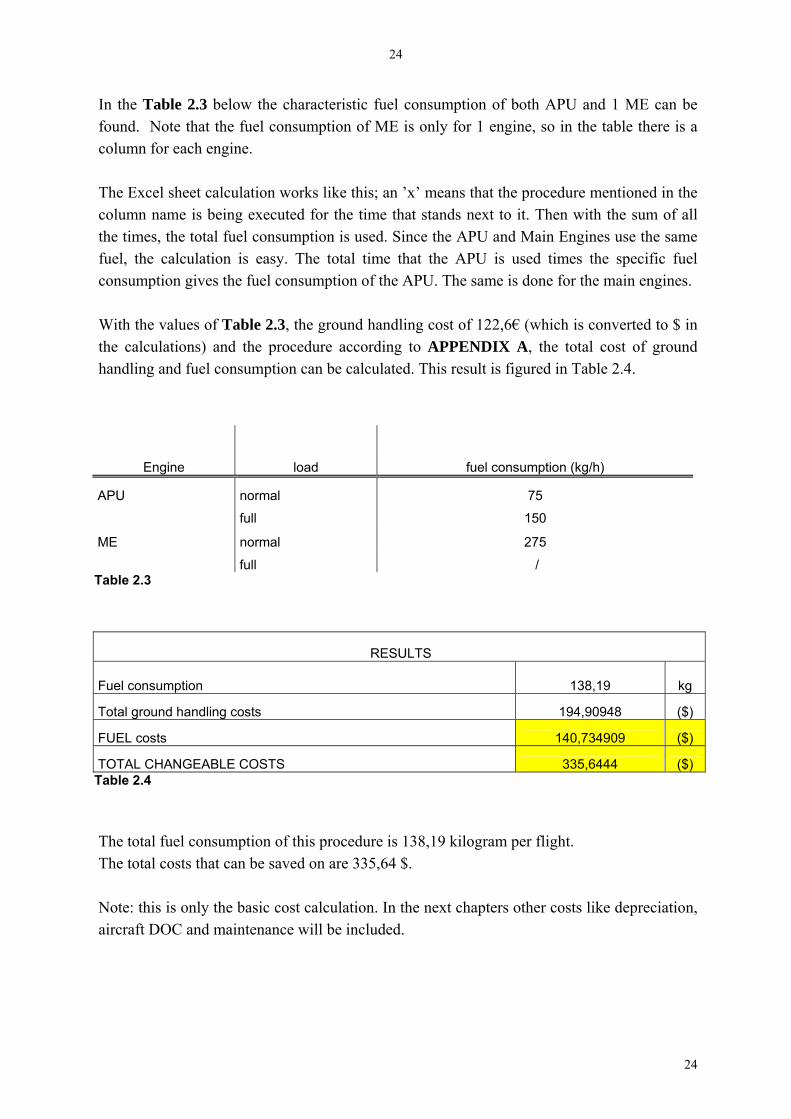
In the Table 2.3 below the characteristic fuel consumption of both APU and 1 ME can be found. Note that the fuel consumption of ME is only for 1 engine, so in the table there is a
n for each engin
Excel sheet calculation works like this; an ’x’ means that the procedure mentioned in the being ecuted for the time that stands next to it. Then with the sum of all
uel consumption is used. Since the APU and Main Engines use the same el, the calculation is easy. The total time that the APU is used times the specific fuel
consumption gives the fuel consumption of the APU. The same is done for the main engines.
Table 2.3, the ground handling cost of 122,6€ (which is converted to $ in APPENDIX A, the total cost of ground
handling and fuel consumption can be calculated. This result is figured in Table 2.4.
colum e. The column name is
e times, the total f ex
thfu
With the values ofthe calculations) and the procedure according to
Engine load fuel consumption (kg/h)
APU normal 75
full 150
ME normal 275
full / T
RESULTS
able 2.3
Fuel consumption 138,19 kg
Total ground handling costs 194,90948 ($)
FUEL costs 140,734909 ($)
TOTAL CHANGEABLE COSTS 335,6444 ($) Table 2.4 The total fuel consumption of this procedure is 138,19 kilogram per flight.
ion. In the next chapters other costs like depreciation, cluded.
The total costs that can be saved on are 335,64 $. Note: this is only the basic cost calculataircraft DOC and maintenance will be in
24
25
3 Change of Equipment
The goal is to improve the pushback procedure and make it more efficient. So a choice has
een made to put an electrical engine in the NLG. can be done on the following parameters:
me n this chapter the equipment change will be orked out and the out of that following procedure changes and costs.
oing out of the principle that no external power (the tug) has to be used and the aircraft can
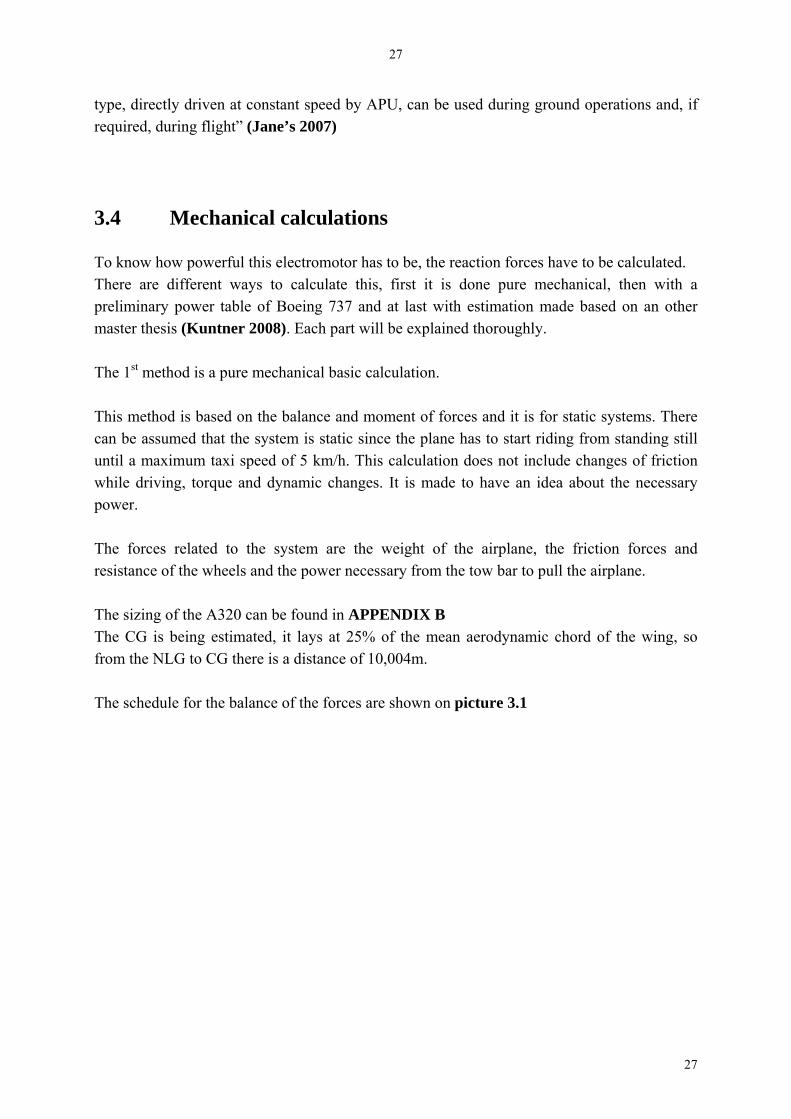
3.2 Electrical Driven Nose gear A change of equipment can lead to a more efficient pushback. Because the current pushback procedure takes a lot of time and costs about 122€ on equipment that has to be rented every time before take-off. The following change might be a solution: putting an electromotor in the nose gear, so the airplane can drive on own power. There is already a model made and load tests are done. This part of the design is handled with in the thesis of Mr. Kuntner. (Kuntner 2007) In picture 3.1 on the left side the test setup of the firm Wheeltug (Wheeltug 2007) and on the
bBasically if solutions want to be figured out, itequip nt, time or fuel consumption reduction. Iw
3.1 Introduction: APS For specific procedure changes, some changes in both system and procedure have to be made. An independent aircraft has to be build or an existing airplane has to be adapted. Gdrive on its own with the APS, a new procedure is figured out and explained.
right side the proof of the test setup.
25
26
Picture 3.1 The theoretical production unit of the Firm Weeltug (Weeltug 2007) In real life this is not realizable, so an integrated system has to be made. At the moment of writing this paper, there is already a prototype of an integrated electromotor in the rims of the
he energy to supply the electromotor has to come from somewhere. The main engines use to is the APU.
• APIC APS 3200
procedures are made considering that the amount off power needed, can be delivered y the APU.
nstant equency generators, providing 115/200 V three-phase AC at 400 Hz; third generator of same
NLG. There is a design of an integrated electromotor in the rims.
.3 Auxiliary Power Unit 3 Tmuch fuel, so the other energy supplier on the airplane The auxiliary power unit (APU) is a gas turbine engine, which is being used for the powersupply to the electrical, pneumatic and hydraulic systems, when the main engines are not on. For the Airbus A32O series there are 3 APU’s available (Jane’s 2007)
• Honeywell 36-300 APU standard • Honeywell 131-9(A)
The APU feeds the electrical generator which on his turn will feed the new electromotor. The estimated power needed for the electromotor is 50 kW. The generator can give 90 kVA, so with a good and efficient use of the APU it is possible to feed the APS. All the b “The primary electrical system powered by two Hamilton Sundstrand 90 kVA cofr
26
27
type, directly driven at constant speed by APU, can be used during ground operations and, if
cal calculations
as to be, the reaction forces have to be calculated. mechanical, then with a
reliminary power table of Boeing 737 and at last with estimation made based on an other master thesis (Kuntner 2008). Each part will be explained thoroughly The 1st method is a pure mechanical basic calculation.
This method is based on the balance and moment of forces and it is for static systems. There can be assumed that the system is static since the plane has to start riding from standing still until a maximum taxi speed of 5 km/h. This calculation does not include changes of friction
hile driving, torque and dynamic changes. It is made to have an idea about the necessary
ne, the friction forces and sistance of the wheels and the power necessary from the tow bar to pull the airplane.
he sizing of the A320 can be found in APPENDIX Bted, it lays at 2 of the mean aerodynamic chord of the wing, so
om the NLG to CG there is a distance of 10,004m.
required, during flight” (Jane’s 2007)
3.4 Mechani To know how powerful this electromotor hThere are different ways to calculate this, first it is done pure p
.
wpower. The forces related to the system are the weight of the airplare TThe CG is being estima 5%fr The schedule for the balance of the forces are shown on picture 3.1
27
28
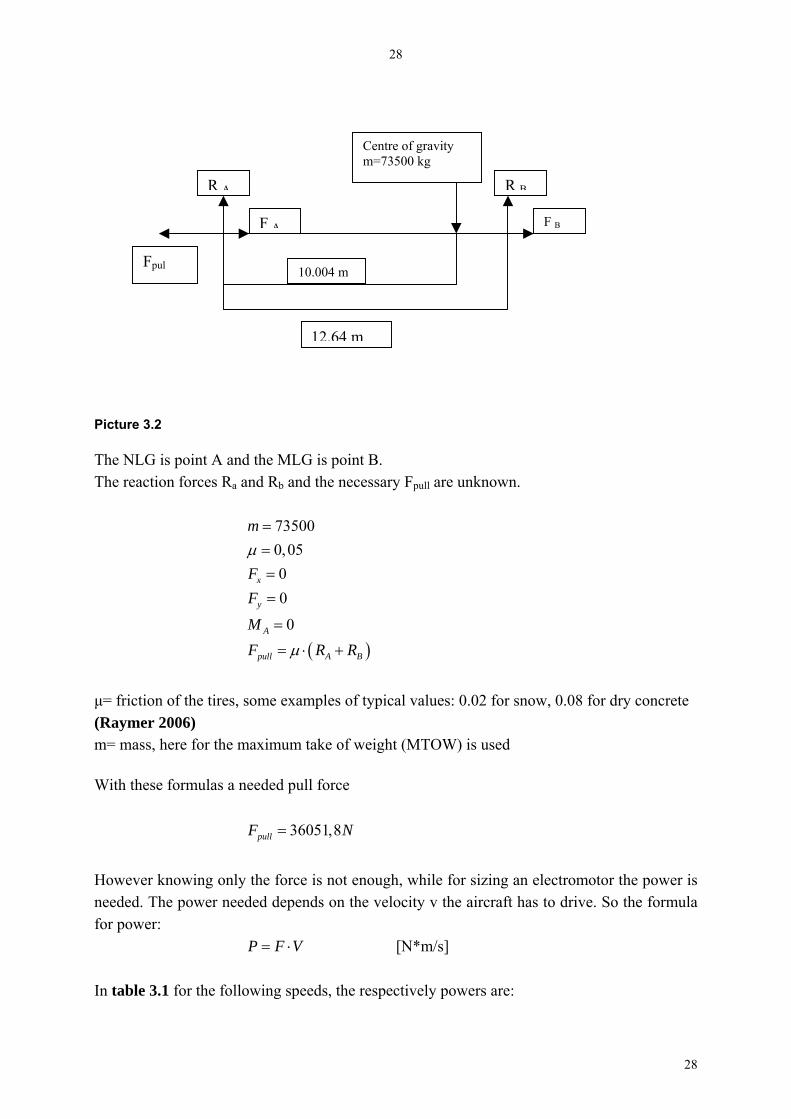
Picture 3.2 The NLG is point A and the MLG is point B. The reaction forces Ra and Rb and the necessary Fpull are unknown.
0
0y
A
pull A B
F
MF R Rµ
=
=
= ⋅ +
[N*m/s]
ectively powers are:
73500m =
( )
0,050xF
µ ==
µ= friction of the tires, some examples of typical values: 0.02 for snow, 0.08 for dry concrete (Raymer 2006) m= mass, here for the maximum take of weight (MTOW) is used With these formulas a needed pull force 36051,8pullF N=
However knowing only the force is not enough, while for sizing an electromotor the power is needed. The power needed depends on the velocity v the aircraft has to drive. So the formula for power: P F V= ⋅ In table 3.1 for the following speeds, the resp
10.004 m
12.64 m
Centre of gravm=73500 kg
ity
R A R B
F A F B
Fpul
28

29
Speed (km/h) Power (kW) power (hP)
20 200288 268
10 100144 135
5 50072 70 Table 3.1
hese results can be interpreted noT w: if an engine of 268 hP wants to be used, a big place is
APPENDIX B the force needed to
zum Manövrieren des Flugzeuges am Bodensimple” the following results can be found as a previous methods. There is need of 40 kW mechanical, so because of the
ficiency of energy converting, there has to be an electrical power of 50 kW and a torque of 11kNm (Kuntner 2008)
needed, because an engine of such a power is quite large. A 70 hP is acceptable, but it has to be checked. The result will follow in the 2nd method. What has to be considered is, can an engine, powerful enough so it can drive up to 30km/h, be designed into the nose gear system? In this case the engine only needs to be powerful enough for the pushback. As said before the pushback speed is only 5km/h, thus an engine of 70 hP is enough. 2nd method As we know, the current pushback is done by a pushback truck. There are a lot of different aircrafts which are different in size and mass. So there are tables to see what force (power) is needed.
ith the preliminary design tables, which can be found in Wpull the airplane can be configured. For the same circumstances as in method 1 a force of approximately 2900kg ~= 30kN is needed. It can be seen that it is almost the same needed force as method 1. 3rd method There are currently more people working on this design phase, so there is information vailable. Based on the thesis: “Integration eines Fahrwerkantriebes a
check up for the ef
29
30
The calculated are 50 kW in t method, 41,6 k e second and as on 50 e 3rd method. Ke ind that tests have ne on the possible
like slopes, rain, acceleration,…
.5 Procedure change
Theoretically there is an aircraft with the APS, which will indirectly be fed with energy from e of the MEs and APU.
n extra estimated 25kg/h fuel consumption of the APU is used to feed the electromotor. (TU elft 2007). This estimation has been made looking to the air-conditioning system which has
similar overall power and thus same fuel consumption. tromotor is estimated to be lower then the dropout
he next procedure is the same as in chapter 2, but the APU has now a consumption of 75kg/h when it performs the pushback procedure. due to the extra power needed for the APS
oing out of the same time consumptions as the current procedure (taxi time of 7 minutes 20 econds and a pushback of 1 minute and 30 seconds), due to the keeping of the same ushback and taxi speed, the following procedure is made and is shown in Table 3.2. and
ote that the picture is not as accurate as the numbers shown in table 3.2.
he procedure will be explained now. The APU is on for the same time as in procedure 1 supply of electrical and
en estimated that the APU is powerful enough for the normal use (electrical power and air-conditioning) and pushback. Then when the pushback starts the APU uses 175kg/h.
er already and then starting the main engines is impossible,
after 1 minute. lmost 1 minute after the start-up of ME2 the taxi procedure starts for 7 minutes and 20
powers the firs W in thcomparisspeed and circum
kW in thstances
ep in m to be do
3
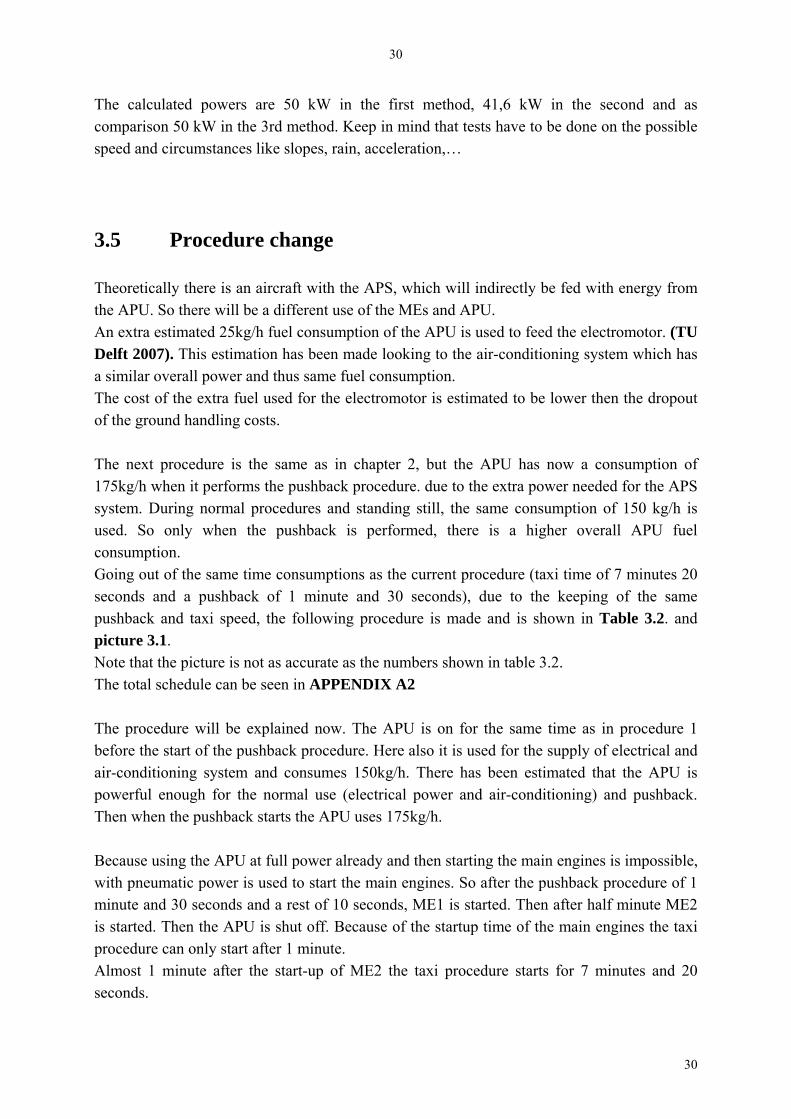
the APU. So there will be a different usADaThe cost of the extra fuel used for the elecof the ground handling costs. T1system. During normal procedures and standing still, the same consumption of 150 kg/h is used. So only when the pushback is performed, there is a higher overall APU fuel consumption. Gsppicture 3.1. NThe total schedule can be seen in APPENDIX A2 Tbefore the start of the pushback procedure. Here also it is used for theair-conditioning system and consumes 150kg/h. There has be
Because using the APU at full powwith pneumatic power is used to start the main engines. So after the pushback procedure of 1minute and 30 seconds and a rest of 10 seconds, ME1 is started. Then after half minute ME2 is started. Then the APU is shut off. Because of the startup time of the main engines the taxi procedure can only start Aseconds.
30
31
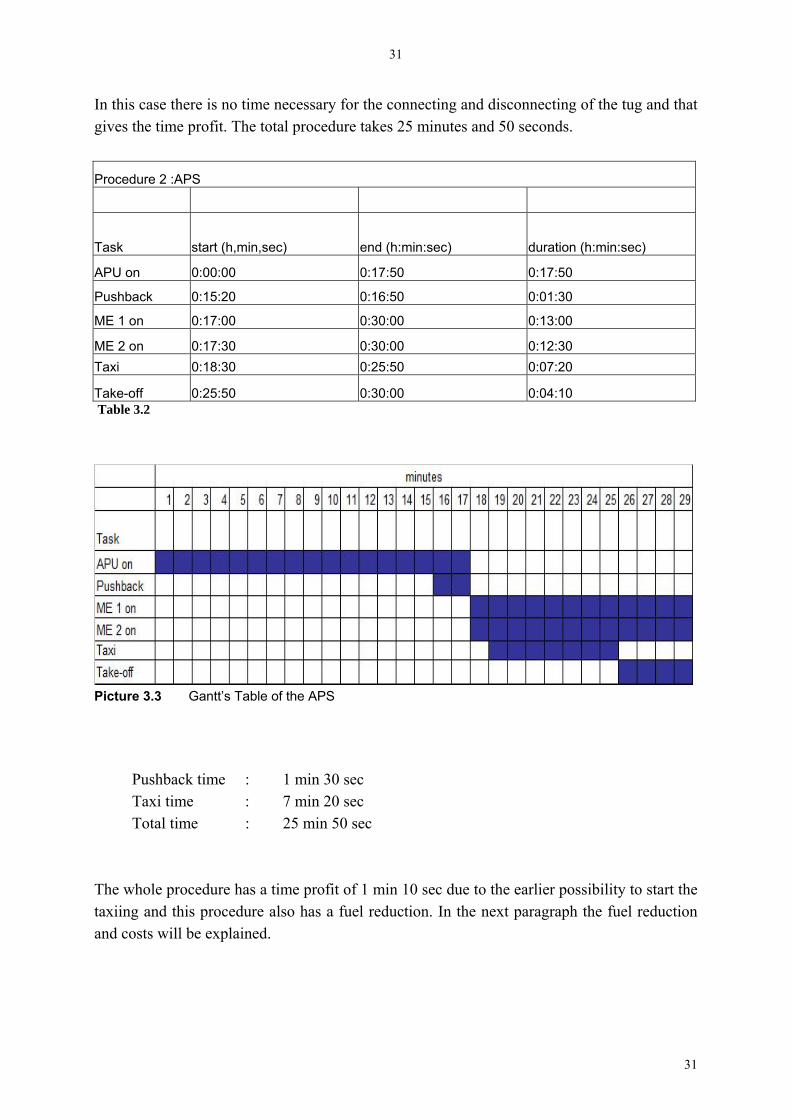
In this case there is no time necessary for the connecting and disconnecting of the tug and that gives the time profit. The total procedure takes 25 minutes and 50 seconds.
Procedure 2 :APS
Task start (h,min,sec) end (h:min:sec) duration (h:min:sec)
APU on 0:00:00 0:17:50 0:17:50
Pushback 0:15:20 0:16:50 0:01:30
ME 1 on 0:17:00 0:30:00 0:13:00
ME 2 on 0:17:30 0:30:00 0:12:30 Taxi 0:18:30 0:25:50 0:07:20
Take-off 0:25:50 0:30:00 0:04:10 Table 3.2
Picture 3.3 Gantt’s Table of the APS Pushback time : 1 min 30 sec
Taxi time : 7 min 20 sec Total time : 25 min 50 sec
e profit of 1 min 10 sec due to the earlier possibility to start the xiing and this procedure also has a fuel reduction. In the next paragraph the fuel reduction
The whole procedure has a timtaand costs will be explained.
31
32
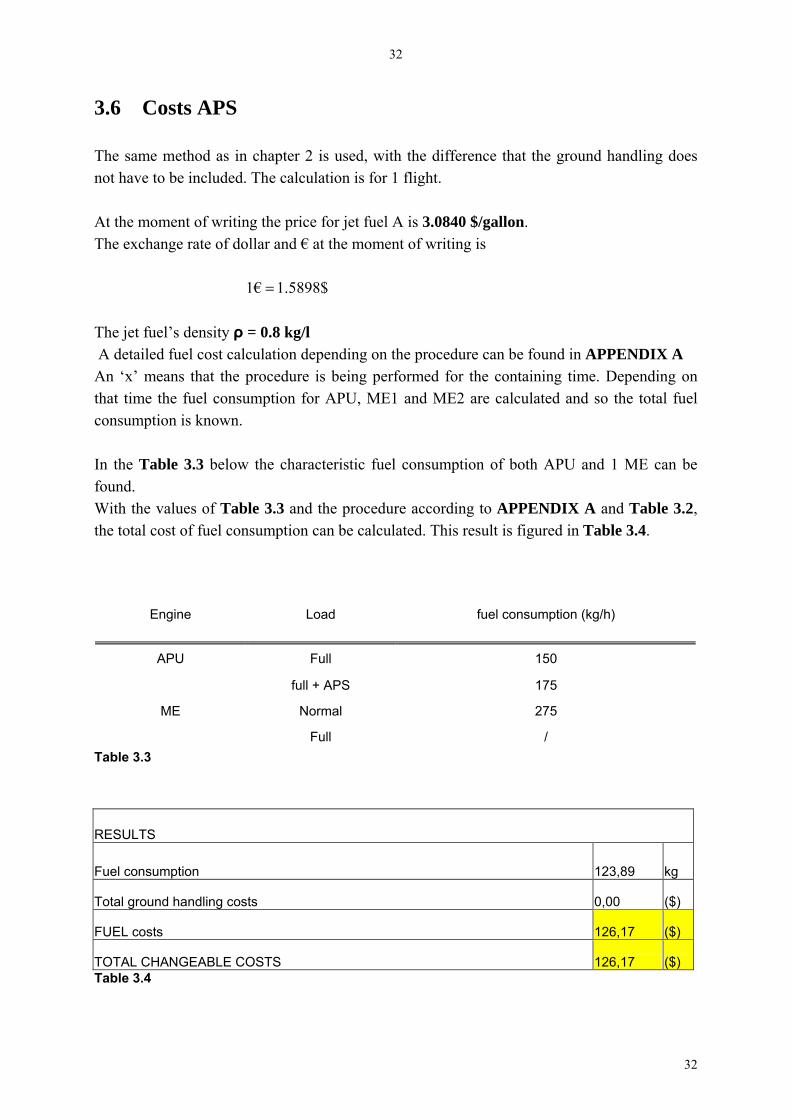
3.6 Costs APS The same method as in chapter 2 is used, with the difference that the ground handling does ot have to be included. The calculation is for 1 flight.
m 40 $/gallon. he exchange rate of dollar and € at the moment of writing is
n At the oment of writing the price for jet fuel A is 3.08T 1€ 1.5898$= he jet fuel’s density ρ = 0.8 kg/l
the Table 3.3 below the characteristic fuel consumption of both APU and 1 ME can be
Load fuel consumption (kg/h)
T A detailed fuel cost calculation depending on the procedure can be found in APPENDIX A An ‘x’ means that the procedure is being performed for the containing time. Depending on that time the fuel consumption for APU, ME1 and ME2 are calculated and so the total fuel consumption is known. Infound. With the values of Table 3.3 and the procedure according to APPENDIX A and Table 3.2, the total cost of fuel consumption can be calculated. This result is figured in Table 3.4.
Engine
APU Full 150
full + APS 175
ME Normal 275
Full / Table 3.3
RESULTS
Fuel consumption 123,89 kg
Total ground handling costs 0,00 ($)
FUEL costs 126,17 ($)
TOTAL CHANGEABLE COSTS 126,17 ($) Table 3.4
32
33
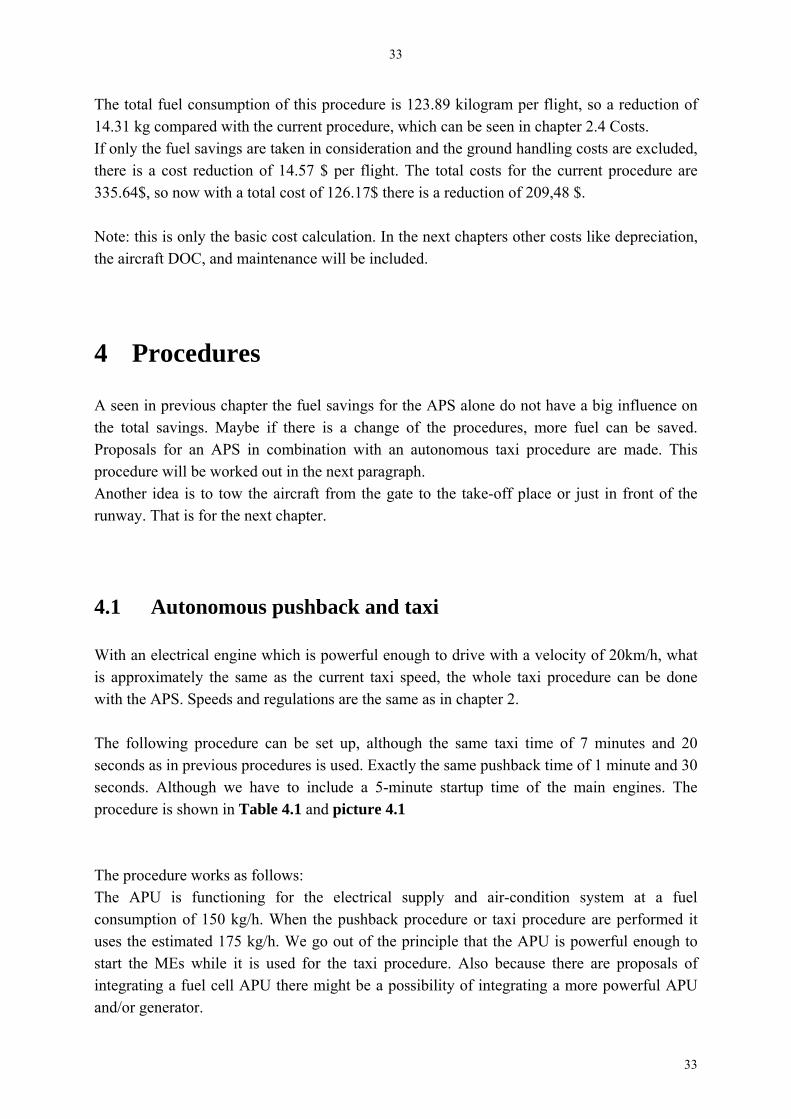
The total fuel tion of this proc 123.89 kilogram ht, so a reduction of omp h the current pro e see ter 2.4 Costs.
ken in consideration and the ground handling costs are excluded, 14.57 $ per flight. The total costs for the current procedure are
so no total cost of 126.17$ there is a reduction of 209,48 $.
is only the basic cost calcula he next chapters sts like depreciation, t DOC, and maintenance will be included.
Procedures
viou cha vings for the APS alone do not have a big influence on ings ay change of the procedures, more fuel can be saved.
roposals for an APS in combination with an autonomous taxi procedure are made. This rocedure will be worked out in the next paragraph.
.1 Autonomous pushback and taxi
ith an electrical engine which is powerful enough to drive with a velocity of 20km/h, what
he following procedure can be set up, although the same taxi time of 7 minutes and 20 time of 1 minute and 30
lude a 5-minute startup time of the main engines. The
The procedure works as follows:
onsumption of 150 kg/h. When the pushback procedure or taxi procedure are performed it
MEs while it is used for the taxi procedure. Also because there are proposals of
consump edure is per flig14.31 kg c ared wit cedure, which can b n in chapIf only the fuel savings are tathere is a cost reduction of 335.64$, w with a Note: this
e aircraftion. In t other co
th
4 A seen in pre s pter the fuel sathe total sav . M be if there is aPpAnother idea is to tow the aircraft from the gate to the take-off place or just in front of the runway. That is for the next chapter.
4 Wis approximately the same as the current taxi speed, the whole taxi procedure can be done with the APS. Speeds and regulations are the same as in chapter 2. Tseconds as in previous procedures is used. Exactly the same pushbackseconds. Although we have to incprocedure is shown in Table 4.1 and picture 4.1
The APU is functioning for the electrical supply and air-condition system at a fuelcuses the estimated 175 kg/h. We go out of the principle that the APU is powerful enough to start theintegrating a fuel cell APU there might be a possibility of integrating a more powerful APU and/or generator.
33
34
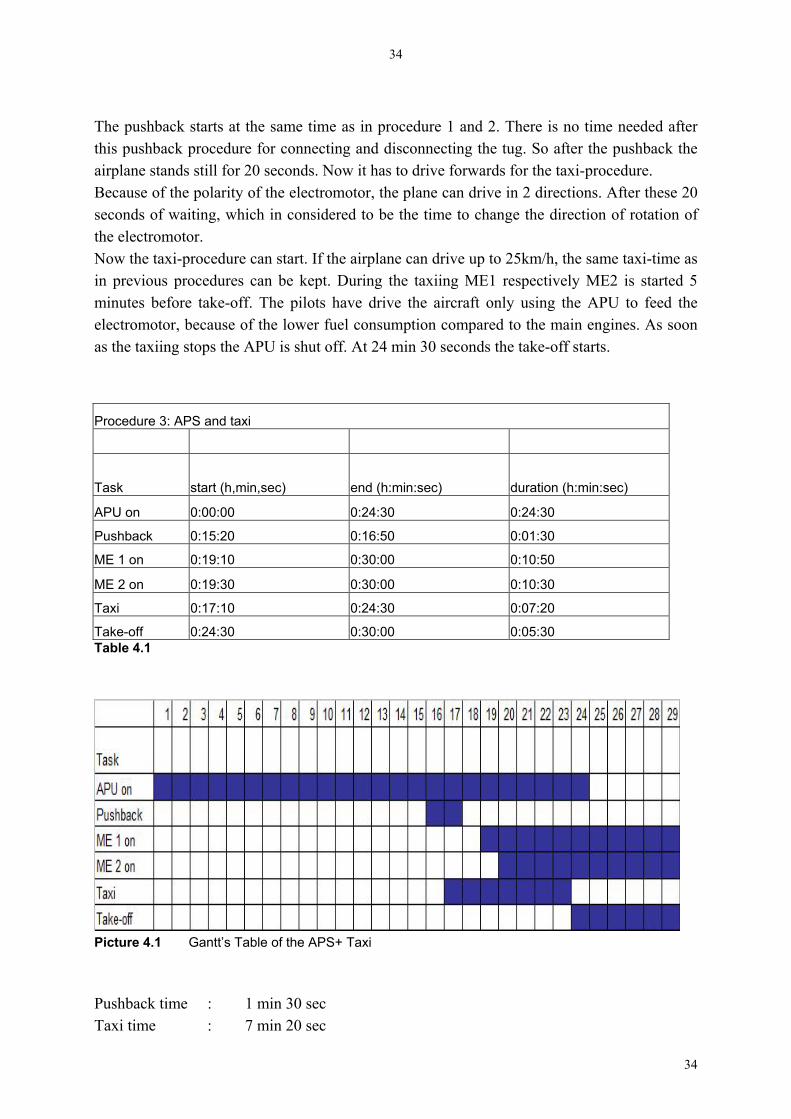
The pushback starts at the same time as in procedure 1 and 2. There is no time needed after
hback procedur onnecting and disconnec he pushback the airplane stands still for 20 seconds. Now it has to drive forwards for the taxi-procedure. Because of the polarity of the electromotor, the plane can drive in 2 directions. After these 20
idered to be the tim irection of rotation of e electromotor.
the taxi-procedure t. If the airplane can drive up to 25km/h, the same taxi-time as in previous procedures can be kept. During the taxiing ME1 respectively ME2 is started 5
inutes before take-of e pilots have drive the aircraft only using the APU to feed the tor, because of the lower fuel consumption compared to the main engines. As soon
At 24 min 30 seconds the take-off starts.
Procedure 3: APS and taxi
this pus e for c ting the tug. So after t
seconds of waiting, which in cons e to change the dthNow can star
m f. Theas the taxiing stops the APU is shut off.lectromo
Task start (h,min,sec) end (h:min:sec) duration (h:min:sec)
APU on 0:00:00 0:24:30 0:24:30
Pushback 0:15:20 0:16:50 0:01:30
ME 1 on 0:19:10 0:30:00 0:10:50
ME 2 on 0:19:30 0:30:00 0:10:30
Taxi 0:17:10 0:24:30 0:07:20
Take-off 0:24:30 0:30:00 0:05:30 Table 4.1
P
icture 4.1 Gantt’s Table of the APS+ Taxi
axi time : 7 min 20 sec
Pushback time : 1 min 30 sec T
34

35
Total time : 24 min 30 sec The whole procedure has a time profit of 2 min 30 sec due an even earlier possibility to start the taxiing. In the next paragraph the fuel reduction and costs will be explained.
tonomous pushback and taxi
and 3 is used, with the difference that the ound handling does not have to be included and that there is a longer use of the APU. The
calc At llon.
he jet fuel its density ρ = 0.8 kg/l he exchange rate of dollar and € at the moment of writing is
4.2 Costs Au The same method for calculating as in chapter 2 gr
ulation is for 1 flight.
the moment of writing the price for jet fuel A is 3,0840 $/gaTT 1€ 1.5898$=
A detailed fuel cost calculation depending on the procedure can be found in APPENDIX A3
the Table 4.2 below the characteristic fuel consumption of both APU and 1 ME can be
e procedure according to APPENDIX A3 and Table 4.1, ption can be calculated. This result is figured in Table 4.3.
Infound.
ith the values of Table 4.2 and thWthe total cost of fuel consum
engine Load fuel consumption (kg/h)
APU Full 150
full + APS+Taxi 175
ME Normal 275
Full /
Table 4.2 RESULTS
Fuel consumption 112,29 kg
35

36
Total ground handling costs 0,00 ($)
FUEL costs 114,36 ($)
TOTAL CHANGEABLE COSTS 114,36 ($)
Table 4.3
is 112.29 kilogram per flight, so a reduction of kg
reduction of 221.9$
The e emingly higher then the normal APS procedure. A l c xi time, the more duel is saved. This is easy to calculate as foll s ing with the APS, but the main engines are not on yet, consumes
.917 kg. The taxiing with the main engines on, like in the current procedure, is 9.167 kg.
e conclusion of chapter 8.
ead of the main ngines there is a fuel reduction of 68.2%
is unnecessary to make a schedule, while it is a fact that there is a fuel reduction and
deration are:
• Will there be a time problem, thus will the critical path be an issue?
The total fuel consumption of this procedure5.90 per flight. 2
If only the fuel savings are taken in consideration and the ground handling costs are excluded,
the ground handling costs included, so there is a cost reduction of 26.4 $ per flight. And withcompared with the 335.64$ of the current procedure a
fu l consumption savings are seogi result is, the longer the taow . 1 minute driv
2That is a reduction of 68.2% per minute that the main engines are off. Note: this is only the basic cost calculation. In the next chapters other costs like depreciation, the aircraft DOC, and maintenance will be included. The practical part will be discussed in th
4.3 After Landing Taxiing The same procedure change can be done for when the aircraft landed. In the current official procedure 1 engine has to be shut down, for noise reduction and unnecessarily air pollution. Then the APU can be started again. As known from previous procedures that every minute of using the APU insteNote that this is calculated for 2 engines. In the normal procedure there is only 1 engine running, that means a cost reduction of 50%. The total savings are thus 34.1%. Itemission reduction. Things that have to be taken in consi
36

37
• Is the fuel reduction worth of the work? • Do the pilots have time to make a change of procedure?
5 Full Towing
.1 Research 5 Another idea to get the aircraft from the apron or gate to the runway is to push/pull it with a pushback truck, which has been worked out in sight of reducing fuel consumption, but more
ecause of reduction of the air pollution. he Dutch Ministerie van Verkeer en Waterstaat (Ministry of Traffic and Water state) already sted this issue together with Virgin Atlantic Airways (VAA) and British Airport authority. n these tests this chapter is written (MVW 2007)
he current pushback procedure with a pushback truck has been explained in chapter 2, so for e new full towing procedure the same setup and equipment can be used. the current procedure the airplane starts its engines during or after the pushback, because
they need to heat up for minimu axi can start and 5 minutes before ke-off. During heating up the engines, the airplane taxies the resting time/distance to the
takeoff place on the runway. Then it is ready for take-off.
f pushing the airplane b d to the starting g re the airplane ca p s and drive on own power to the runway and takeoff place, the pushback truck will
l the airplane to the take-off place on the runway.
emands for full towing
e arguments that have to be considered. tion mostly do not match.
o the following arguments that has to be dealt with:
• Infr a ort
bTteO TthIn
m 1 minute before the tta
Instead o ackwar rid whe n start uhis enginepush/pul
5.2 D To perform this whole operation there are somBecause in most cases theoretical and practical informaS
astructure of the irp
37
38
• Material, pushback truck • Org
frastructure of the airport must be adapted to the requirements of the new full towing rocedure, because the runway must be free for take offs and landings, there must be enough
e pushback truck can be disconnected. For some airports is is impossible because of a lack of available space. Additional lanes or space for a save
he material required is an amount problem. The pushback takes approximately 5 minutes, in the truck can be reused
he problem now is that the truck is operative for double the time if it does the taxiing. Like
nd 20 seconds, a few minutes of connection time and extra time due to the slower
ith investments from the airport or ground-handling firms for new trucks this is acceptable. A doubling or even tripling of the amount of trucks, which cost 800'000 € each, will be
to provide eve plane the full tow
ose gear is not d for long mechanical external forces according to Boeing/Airbus nd no data about any ts can be provided aptations to the nose gear must be done in
r to suite to the ne dure.
zation of traffic has to be completely changed. With the extra trucks driving around nd the tight schedules, it’s even a harder job then the current state of operating.
5.3
re is almost the same as the current procedure. The APU is on with a en while standing at the gate, during other ground handling
s the tug can be connected. After that the pushback procedure starts at the same oment as the other previous procedures. After that, the taxiing can start immediately. 5 inutes before take off the engines have to be on, because they have to warm up. The tug has
anization Inpstarting grids or some areas where ththreturn of the trucks is also necessarily. Tthat time the connecting, pushback and disconnecting is included. Soafter 10 minutes. The taxi-speed is also slower then when the airplane drives on own power. Tin the theoretical examples with a taxi-time of 7 minutes and 20 seconds, a pushback of 1 minute adriving then normal taxi-speed it takes between 10 and 15 minutes. But the truck has to return to the apron for the next airplane, so it’s only standby after 20 to 30 minutes. W
enough ry air ing procedure. The n esigneda tes . Adorde w proce The organia
Procedure schedule This proceduconsumption of 150 kg/h. Thproceduremmto be disconnected, so after 1 or 2 minutes the aircraft is ready for take off.
38

39
The whole procedure has a time profit of 50 sec so it is not a very profitable procedure according to the time aspect. In the next paragraph the fuel reduction and costs will be xplained.
e
Procedure 1 : Full Towing
Task start (h,min,sec) end (h:min:sec) duration (h:min:sec)
APU on 0:00:00 0:19:10 0:19:10
Pushback 0:15:25 0:16:55 0:01:30
ME 1 on 0:18:55 0:26:10 0:07:15
ME 2 on 0:19:40 0:26:10 0:06:30
Taxi 0:17:10 0:24:40 0:07:30
Take-off 0:26:10 0:30:00 0:03:50Table 5.1
Picture 5.1 Gantt’s Table of the Full Towing procedure
Pushback time : 1 min 30 sec Taxi time : 7 min 20 sec Total time : 26 min 10 sec
39

40
5.4 C
The same gain we have to integrate the round handling costs. The calculation is for 1 flight.
t the moment of writing the costs for jet fuel A is 3.0840 $/gallon. he jet fuel its density ρ = 0.8 kg/l detailed fuel cost calculation depending on the procedure can be found in APPENDIX A4
the Table 5.2 below the characteristic fuel consumption of both APU and 1 ME can be und. ith the values of Table 5.2 and the procedure according to APPENDIX A4 and Table 2.2, e total cost of fuel consumption and ground handling can be calculated. This result is gured in Table 5.3.
(kg/h)
osts Full Towing
method as in previous chapters is used, but here ag ATA InfoWthfi
Engine load fuel consumption
APU norma full
l 75 150
E normal 275 M full / Table 5.2
RESULTS
Fuel consumption 113,23 kg
Total ground handling costs 194,90948 ($)
FUEL costs 115,310688 ($)
TOTAL CHANGEABLE COSTS 240,9947 ($) Table 5.3
he total fuel consumption of this procedure is 113.23 kilogram per flight, so a reduction of
2 $ per ight.
T24.97 kg per flight compared with the current procedure. In this case the ground handling has to be paid so there is a cost reduction of 25.4fl Note: this is only the basic cost calculation. In the next chapters other costs like depreciation, the aircraft DOC, and maintenance will be included.
40

41
There are some extra factors that have an influence on this cost calculation. The price of the
ause the me that the truck is operating, has tripled. Then we would see an even higher end price. The
.5 Pollution
ith engine data it can be calculated that every flight 1.5ton of CO2 gas is saved. This is the ajor and only advantage of the full towing procedure. ther gases are reduced, but the truck brings extra pollution (Finn air 2007). With taxi times nger then 10 minutes the e l advant better.
sion
n Table 5.3 the fuel savings are not enough to cover the expenses of the pushback
and not efficient
There are also test done on the Boeing747 in London Airports, but because of too many operational and practical problems this has been cancelled. They did not give detailed information and just informed that it was not operational enough. Other problems that have to be taken care of and these are also reasons not to do the full towing are:
• If the aircraft has Engine startup problems, the airplane has to be taxied back for reparation
• The engines have to start up to full power while the tug and personnel is close to the aircraft, so according to safety rules is forbidden.
• Some trucks can not ride as powerful in 2 directions.
This is not a good proposal and does not have to be taken in consideration for future projects.
ground handling is just the normal one. In this case the Tug is used for 30 minutes instead of 5 to 10. So the airport will probably charge more. If we just double the current price for the use of all ground handling equipment, bectiamount of fuel saved then does not cover the extra tug cost
5 WmOlo nvironmenta ages become
5.6 Conclu As seen itruck. The costs and changes that the airports have to make are too complicated enough to introduce the full towing for big airplanes.
41
42
6 Emission gasses and pollution
6.1 Research
very engine its exhaust contains certain emission gasses and each in a certain amount. Some of the emission gasses are poisenous or cause direct or indirect effect on the environment. One of the popular problems nowadays is global warming. There are rules and norms and due to the global warming these rules get stronger and stronger every year. Because of the big increase of CO and NOx gasses The Committee on Aviation Environmental Protection (CAEP) and current international standard (ICAO, 1998a) have set some goals for reduction of emissions. These have to be met with an extra 40 percent margin for nitrogen oxide (NOx), carbon oxide (CO), hydrocarbon (CxHy) and smoke.
6.2 Problems involving Emission gasses The discussed procedures occur in the airport and so the emission gasses have influences on both people and the environment close to the airport. These are the effects that occur:
those due to acute xposures and those due to chronic exposures. Acute health effects are experienced
mediately or within a few hours of the exposure. Health effects due to chronic exposure time, typically months or
ears. Environm also be divided into three broad categories: ecological effects (effec o other than humans), damage to materials (soiling, etc.) and visibi h the atmosphere).” (EPA420 1999)
E
“Health effects due to pollutants may be divided into two classes: eimmay only become apparent after an extended period of y
ental effects can ts n plants and animalslity (effects on transmission of light throug
42
43
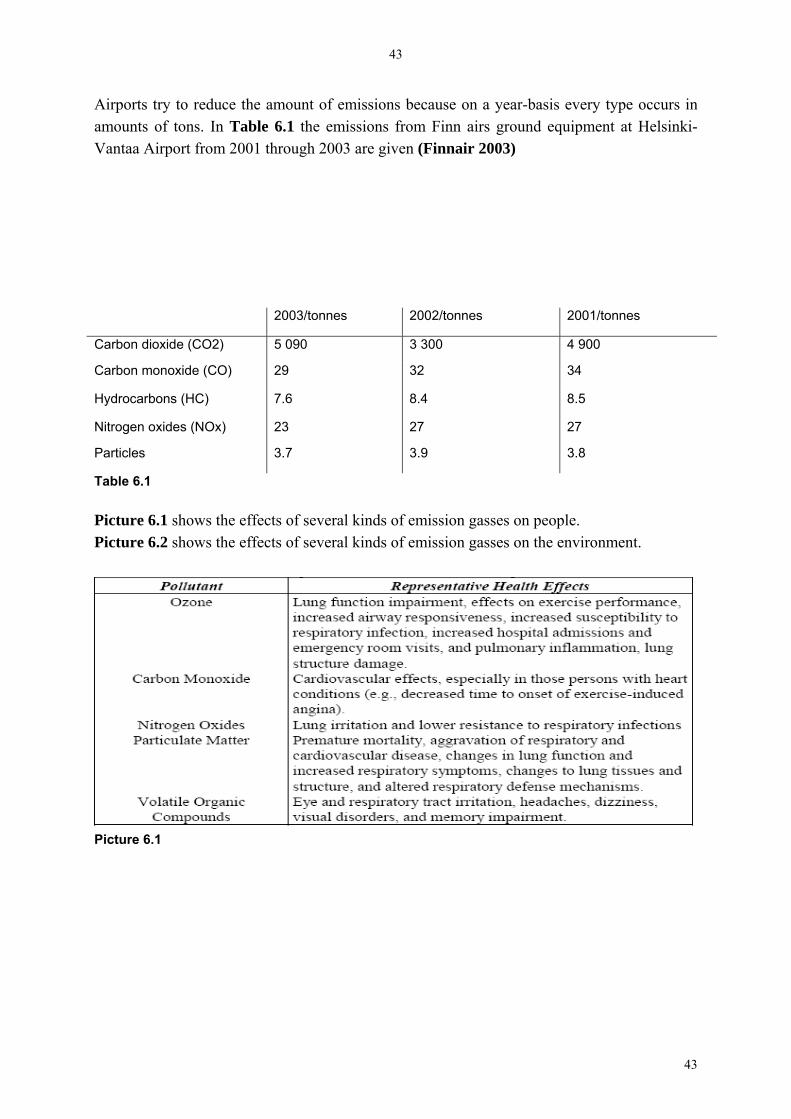
Airports try to reduce the amount of emissions because on a year-basis every type occurs in amou .1 the emissions from Finn airs ground equipment at Helsinki-Vantaa Airport from 2001 through 2003 are given (Finnair 2003)
nts of tons. In Table 6
2003/tonnes 2002/tonnes 2001/tonnes
Carbon dioxide (CO2) 5 090 3 300 4 900
Carbon monoxide (CO) 29 32 34
Hydrocarbons (HC) 7.6 8.4 8.5
Nitrogen oxides (NOx) 23 27 27
Particles 3.7 3.9 3.8
Table 6.1 Picture 6.1 shows the effects of several kinds of emission gasses on people. Picture 6.2 shows the effects of several kinds of emission gasses on the environment.
Picture 6.1
43
44
Picture 6.2 All the procedures in and around the airport that are more fuel efficient or that reduce the
ean they re not important.
amount of emission have to be used, because of the increasing norms.
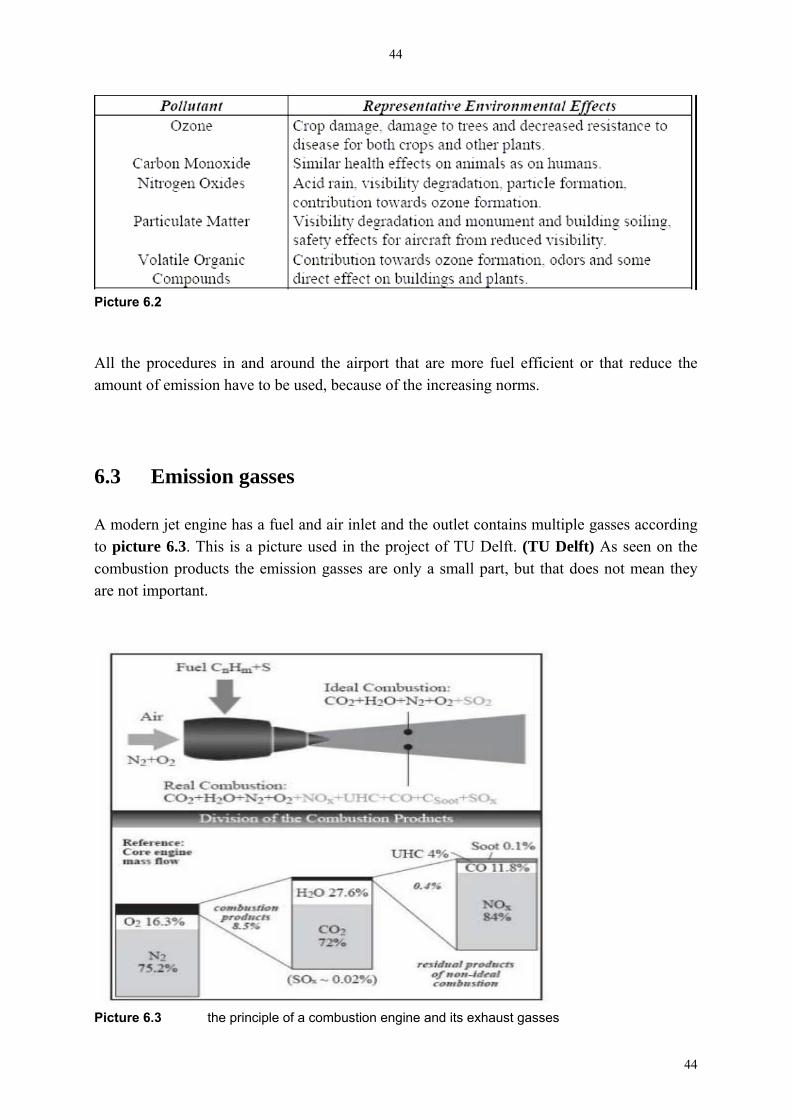
6.3 Emission gasses A modern jet engine has a fuel and air inlet and the outlet contains multiple gasses according to picture 6.3. This is a picture used in the project of TU Delft. (TU Delft) As seen on the ombustion products the emission gasses are only a small part, but that does not mc
a
Picture 6.3 the principle of a combustion engine and its exhaust gasses
44
45
The following exhaust gasses and material can occur:
• Carbon dioxide CO2 • Carbon oxide CO
• Particular matters • …
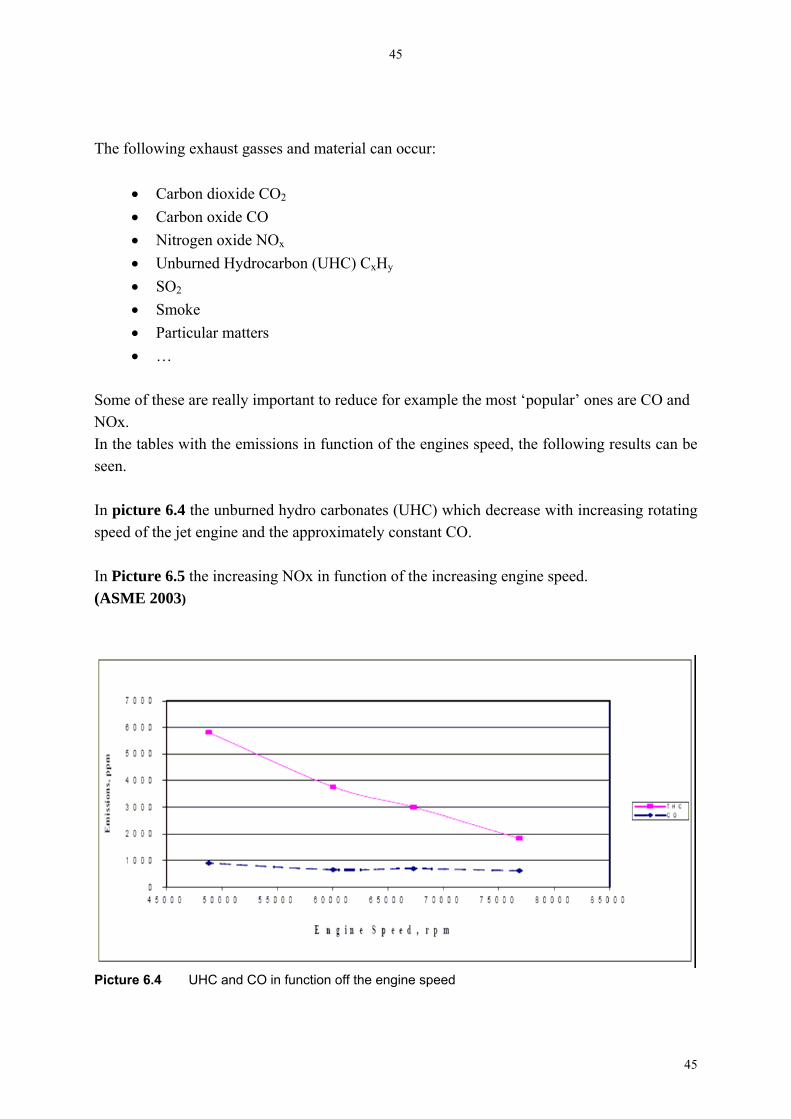
ome of these are really important to reduce for example the most ‘popular’ ones are CO and Ox. the tables with the emissions in function of the engines speed, the following results can be
een.
picture 6.4 the unburned hydro carbonates (UHC) which decrease with increasing rotating peed of the jet engine and the approximately constant CO.
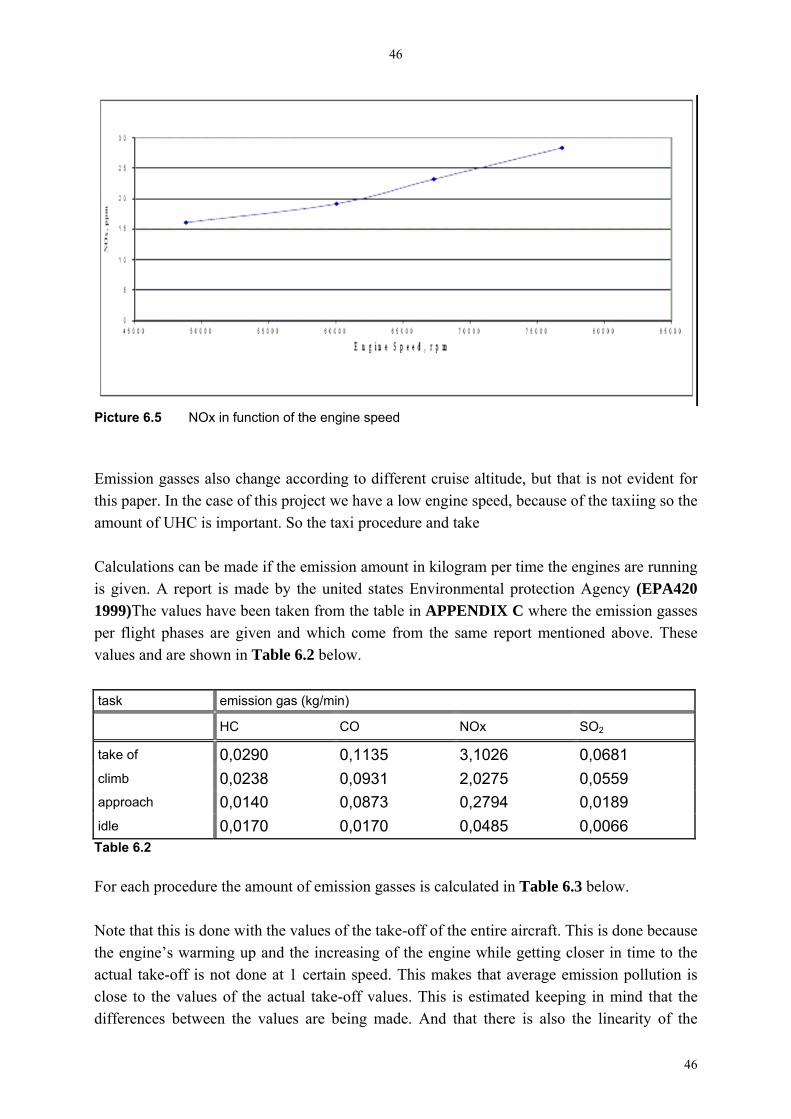
creasing NOx in function of the increasing engine speed. SME 2003)
• Nitrogen oxide NOx • Unburned Hydrocarbon (UHC) CxHy • SO2 • Smoke
SNIns Ins In Picture 6.5 the in(A
Picture 6.4 UHC and CO in function off the engine speed
45
46
Pictu 6.5 NOx in functire on of the engine speed
task emission gas (kg/min)
Emission gasses also change according to different cruise altitude, but that is not evident for this paper. In the case of this project we have a low engine speed, because of the taxiing so the amount of UHC is important. So the taxi procedure and take Calculations can be made if the emission amount in kilogram per time the engines are running is given. A report is made by the united states Environmental protection Agency (EPA420 1999)The values have been taken from the table in APPENDIX C where the emission gasses per flight phases are given and which come from the same report mentioned above. These alues and are shown in Table 6.2 below. v
HC C 2O NOx SO
take of 0,0290 0,1135 3,1026 0,0681 climb 0,0238 0,0931 2,0275 0,0559 approach 0,0140 0 0,2794 89 ,0873 0,01idle 0,0170 0,0170 0,0485 0,0066 Table 6.2
amount of emission gasses is calculated in Table w.
ote that this is done with the values of the take-off of the entire aircraft. This is done because ng of the engine while getting closer in time to the eed. This makes that average emission pollution is
is estimated keeping in mind that the ifferences between the values are being made. And that there is also the linearity of the
For each procedure the 6.3 belo Nthe engine’s warming up and the increasiactual take-off is not done at 1 certain spclose to the values of the actual take-off values. Thisd
46
47
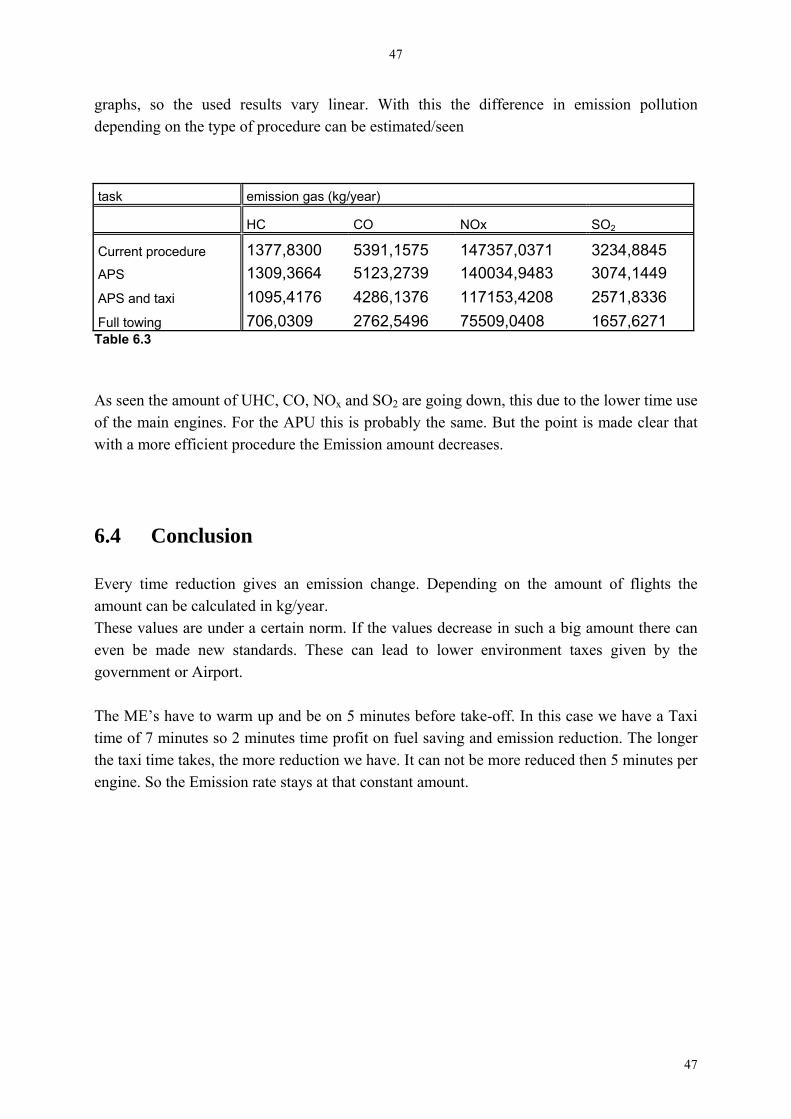
graphs, so the used results vary linear. With this the difference in emission pollution depending on the type of procedure can be estimated/seen
ask emission gas (kg/year)
t
HC CO NOx SO2
Current procedure 1377,8300 5391,1575 147357,0371 3234,8845 APS 1309,3664 5123,2739 140034,9483 3074,1449 APS and taxi 1095,4176 4286,1376 117153,4208 2571,8336 Full towing 706,0309 2762,5496 75509,0408 1657,6271 T
able 6.3
As seen the amount of UHC, CO, NOx and SO2 are going down, this due to the lower time use of the main engines. For the APU this is probably the same. But the point is made clear that with a more efficient procedure the Emission amount decreases.
6.4 Conclusion Every time reduction gives an emission change. Depending on the amount of flights the mount can be calculated in kg/year.
t there can
minutes time profit on fuel saving and emission reduction. The longer e taxi time takes, the more reduction we have. It can not be more reduced then 5 minutes per
ission rate stays at that constant amount.
aThese values are under a certain norm. If the values decrease in such a big amouneven be made new standards. These can lead to lower environment taxes given by the government or Airport. The ME’s have to warm up and be on 5 minutes before take-off. In this case we have a Taxi time of 7 minutes so 2 thengine. So the Em
47

48
7 Costs To make an evaluation of the total costs, some cost calculation systems have to be used.
very change in an aircraft has its direct and indirect cost changes. In this case a new system
because not all of the aircraft costs change. he following parts have an influece on the total cost: ground handling, fuel cost, depreciation f the APS system, maintenance of the APS system, change of the aircraft DOC.
or the new system there has to be dealt with following points • weight • price • maintenance • fuel consumption • compability of the system • functionality of the system
andling
handling costs were discuss in chapter 2 pic 2.4und handling costs only th costs are used. Not the entire convenient
costs is, t ort t sts are the sa
aratly for back proc ure and ut oround han . That pri includ k p
fees. Furt r details and proposals will follow in chapter.
ts
ngines and APU, there is a fuel consumption reduction epending on the procedures mentioned in chapter 4. Because of the small amount of fuel
costs for the procedures are used. he fuel used for the taxi and pushback procedures in the previous chapters is between 4,7 %
and 7,9% of the total mission fuel mass according to the Aircraft DOC.
Ehas been added, so a cost schedule has to be made. Some parts of the costs are more important then the other. So there has to be dealt with every part. Only the costs that are changed will be handled, To F
7.1 Ground H The ground ed to Costs. For the gro e pushbackDOC for aircrafts.The problem with this kind of hat not in every airp he co me. Some airports ask money sep push ed manpower, b ther airports charge 1 price for the whole g dling ce es the pushbac rocedure, but it is hardly impossible to change the airport hethe next
7.2 Fuel cos Due to a different use of both main edcompared to the fuel use for a whole flight, only the fuel T
48

49
Going out of specific fuel consumption (kg/h) and the used time for the procedures the fuel mass can be calculated as in chapter 2. With a known price of 3,0840$/gallon the price in $ is known. In the table 7.1 below the fuel price for all of the 4 procedures is given.
ach separate cost is calculated in the chapters 3.6 Cost savings APS, 4.2 Costs Autonomous shb ck a taxi, 5.4 Costs Full Towing
EPu a nd
pro ure mass of consumed fuel (kg) ced
Price ($)
Procedure 1 :standard procedure 138,19 140,73
procedure 2: APS 123,89 126,17
procedure 3: APS and Taxi 112,29 114,36
procedure 4: full towing 113,23 115,31 Table 7.1
he APS has a fuel reduction of 10.4% he APS and Taxi a reduction of 18.75% he full Towing procedure has a reduction of 18.1%
of the electro motor during the whole flight lculated in a next parag
craft DOC
gh to just calculate the fuel cost and the f the APS. Due to the ght, which is 100 kg (Kuntner 2008), the aircraft will use more fuel to carry the
can easily be done with
ince this is part of a whole project, the ALOHA project, with weight reduction and addition f new parts, the whole aircraft DOC has to be recalculated. This is beyond the scope of this aper. Thus the following calculation is proposed. In the conclusions later on, there are
al with the payload change in case of cargo and/or passenger nce on the revenue, so for the whole weight change this is
TTT The extra fuel used because of the extra weightwill be ca raph.
7.3 Air It is not enou depreciation oextra weiextra weight. So the whole aircraft cost has to be recalculated. This the (AEA 1989 DOC) calculation methods. Sopproblems discussed which de
ansport. This has an influetrimportant.. In this paper only the electro motor its weight is added, to show that the DOC changes.
49
50
To know how much the extra costs per flight are, one has to know the amount of flights per year (yearly flight cycles), the ‘normal aircraft DOC costs’ without the APS and the DOC costs with the APS. The difference between these last two gives the cost per flight.
ents have to be done. ) the payload decreases. The
omparison between DOC and payload is made and can be calculated with the revenue rate
usions.
The 100 kg extra weight is added to the Maximum Take Off Weight (MTOW)! First the ‘normal’ aircraft DOC is being calculated with the norm l values of the A320 low
re flights.
osen values are
e values are kept in mind, because further cost calculations are bond them.
Table 7.2 l worksheet for AEA 1989 DOC are shown is the ‘normal’ DOC cost, the left table is the one with the APS
ystem.
Now the question is: in which weight parameter does the 100 kg has to be added. If the MTOW is changed, there is more power needed, thus bigger main engines. Or structural adjustmIf the 100 kg is added to the Empty Operation Weight (OEWcFR TKO (Scholz 2008)
. . 0,6€ /TKOF R tokm=
This means with 100 kg and 1000 km averaged per flight, an increase of 60€/flight. This is a high cost, so there is chosen to change the MTOW. Further explanation will be given in the concl
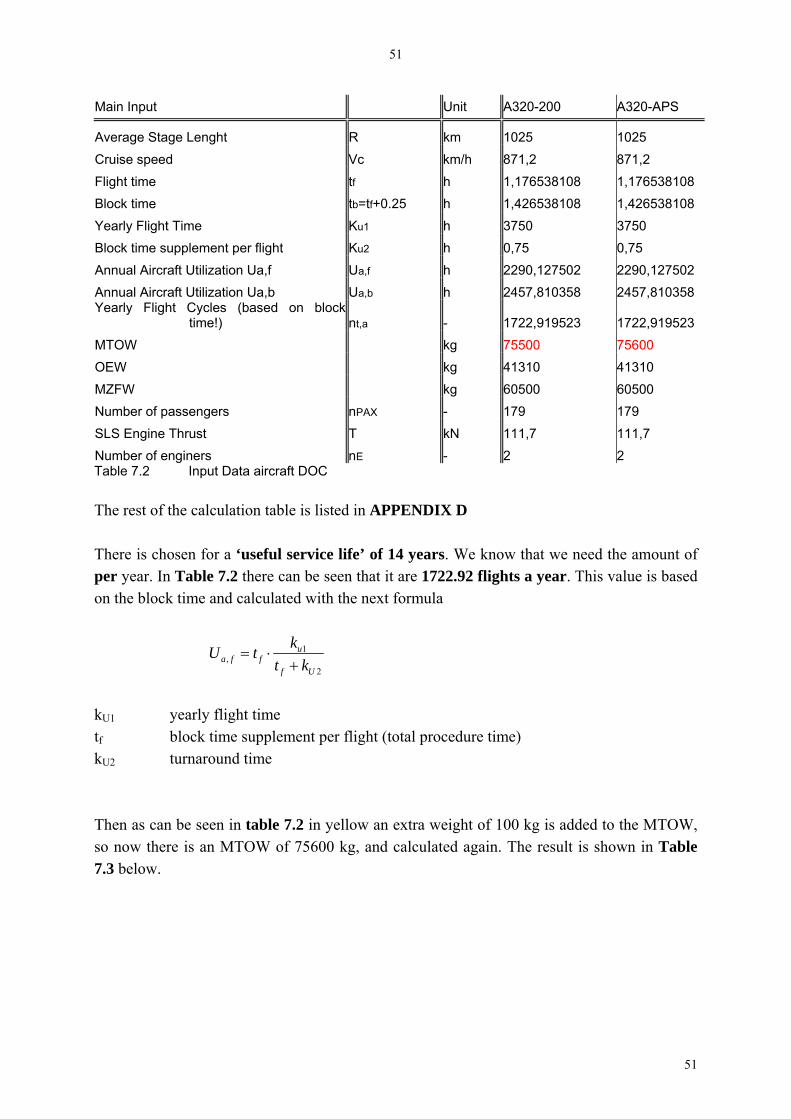
afa Since in this paper it is not the goal of calculating an aircraft DOC, pre chtaken from a preliminary design and DOC tool, in Microsoft Excel, from the AERO group of the HAW Hamburg. Thesto In the main input values for the Exceand explained. The left Tables
50
51
Main Input Unit A320-200 A320-APS
Average Stage Lenght R km 1025 1025
Cruise spe Vc km/h 871,2 871,2 ed
Flight time tf h 1,176538108 1,176538108 Block time tb=tf+0.25 h 1,426538108 1,426538108
Ku1 h 3750 3750 Yearly Flight Time ent per flight Ku2 h 0,75 0,75 Block time supplem
Annual Aircraft Utilization Ua,f Ua,f h 2290,127502 2290,127502 Annual Aircraft Utilization Ua,b Ua,b h 2457,810358 2457,810358 Yearly Flight Cycles (based on block
time!) nt,a - 1722,919523 1722,919523 MTOW 75600 kg 75500 OEW kg 41310 41310
MZFW kg 60500 60500 Number of passengers nPAX - 179 179
SLS Engine Thrust T kN 111,7 111,7 Number of enginers nE - 2 2 Table 7.2 Input Data aircraft DOC The rest of the calculation table is listed in APPENDIX D There is chosen for a ‘useful service life’ of 14 years. We know that we need the amount of per year. In Table 7.2 there can be seen that it are 1722.92 flights a year. This value is based on the block time and calculated with the next formula
1,
2
ua f f
f U
kU tt k
= ⋅+
kU1 arly flight time
time) yeblo
U2 turnaround time
hen as can be seen in table 7.2 in yellow an extra weight of 100 kg is added to the MTOW, is an MTOW of 75600 kg, and calculated again. The result is shown in Table
tf ck time supplement per flight (total procedurek Tso now there 7.3 below.
51
52
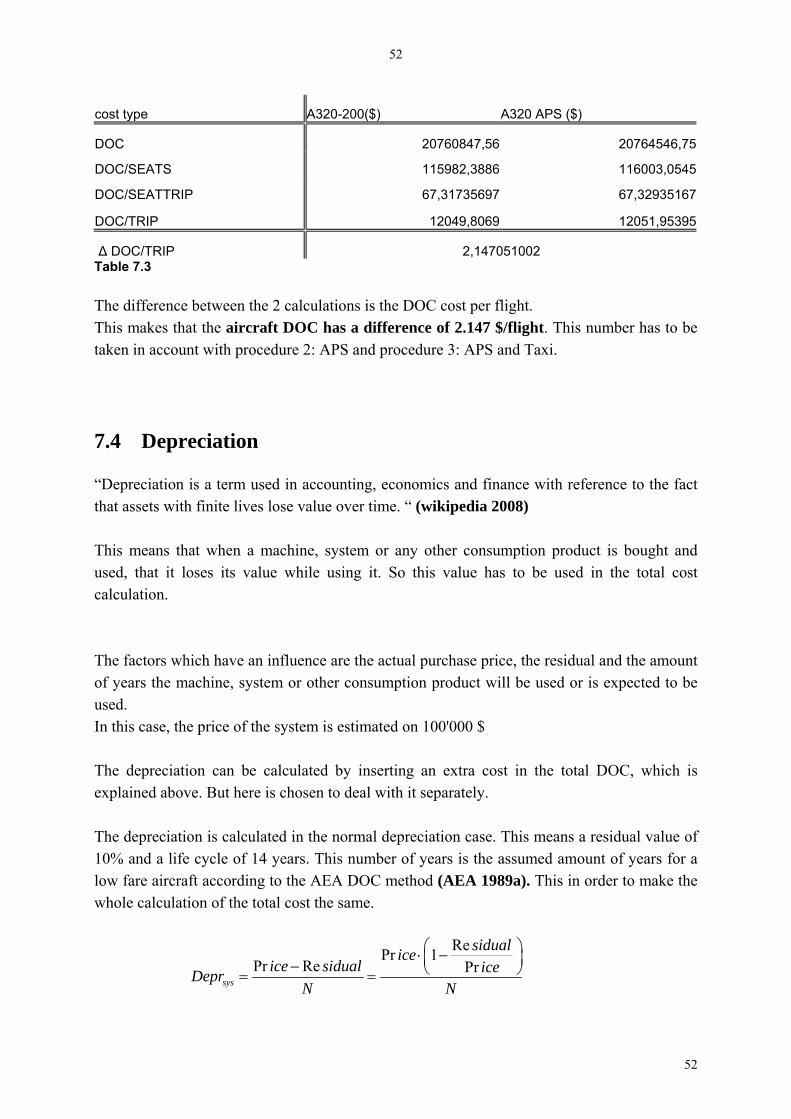
co pst ty e A320-200($) A320 APS ($)
DOC 20760847,56 20764546,75
DOC/SEATS 115982,3886 116003,0545
DOC/SEATTRIP 67,31735697 67,32935167
DOC/TRIP 12049,8069 12051,95395
∆ DOC/TRIP 2,147051002 Table 7.3
e
.4 Depreciation
“Depreciation is a term used in accounting, economics and finance with reference to the fact ith finite lives lose value over time. “ (wikipedia 2008)
roduct is bought and alue has to be used in the total cost
alculation.
this case, the price of the system is estimated on 100'000 $
C, which is xplained above. But here is chosen to deal with it separately.
The depreciation is calculated in the normal depreciation case. This means a residual value of
ber of years is the assumed amount of years for a rd o the AEA DOC method (AEA 1989a). This in order to make the
lation of the total cost the same.
he difference b tween the 2 calculations is the DOC cost per flight. T
This makes that the aircraft DOC has a difference of 2.147 $/flight. This number has to be taken in account with procedure 2: APS and procedure 3: APS and Taxi.
7
that assets w This means that when a machine, system or any other consumption pused, that it loses its value while using it. So this vc The factors which have an influence are the actual purchase price, the residual and the amount of years the machine, system or other consumption product will be used or is expected to be used. In The depreciation can be calculated by inserting an extra cost in the total DOe
10% and a life cycle of 14 years. This numlow fare aircraft acco ing twhole calcu
RePr 1r Re
sys
sidualiceice sidual iceDepr
N N
⎛ ⎞⋅ −⎜ ⎟− ⎝ ⎠= =
P Pr
52
53
So the depreciation cost according to the following for ula is 6071.43 $/year ore useful value, so with 1723 flights a year, the depreciation
3,52$/fligh
anc
echanical industry electro motors are well designed and good working e in a solid housing and d ot need a lot of maintenance. For
le there is a maintenance guide that proofs that after 10’000 working hours only the oil hanged. This will be shown later.
ut to make a schedule between maintenance and costs, some theories or calculations ethods have to be used. Here is chosen for the DOC system method. (Scholz 1998)
MC Total Maintenance Costs
Indirect Maintenance Costs (durch die Wartungsumgebung verursacht)
nly the direct costs are calculated for the DOC costs.
C Material Costs, which have to be estimated R Labour rate: For creating a worst case scenario the most expensive price is taken,
" at a rate of 69 $/FH (Flight Hour) an Hour
MH Line Maintenance (on the aircraft)
ual amount of time that the engine is running is taken. This can easily be alculated by taking the yearly flight cycles from chapter 7.3 Aircraft DOC and multiply it ith time the engine is working. This depends on the procedure that is used, and so a
calculation is made for every procedure. Each calculation can be found in APPENDIX E
mThe depreciation per flight is a mper flight is t 7.5 Mainten e As known in the mmachines. They are mad o nexamphas to be cBm This is the method for calculating the DOC The total maintenance costs consist of direct and indirect costs.
TMC DMC IMC= + TDMC Direct Maintenance Costs (durch das Flugzeug verursachte Kosten) IMC O
( ).on offDMC MMH MMH LR MC= + +
ML
the LR with "overheadMMH Maintenance MM on
MMH off Shop Maintenance (off the aircraft) Here for FH, the actcw
53
54
The hours that need to be worked otime between 2 failures of the sam
n the m de system e, the failure rate (ho aintenance
ght hours, which have been calculated already. the following procedure:
achine have to/machin
be calculated, these depenw much m
on the
it needs) and the fliThis leads to
MTBUR FTRR MTBF= ⋅ MTBF ime Between Failu alue
le 7.4 hosenemo
Mean T res, this v has to be estimated FTRR Failure To Removal Ration, see tab , here is c
vals for 0.7
MTBUR Mean Time Between Unscheduled R Table 7.4 shows the Failure To Removal Ratio (FTRR) System FTRR Failure rate
Elektronik 0,3…0,4 Elektrik 0,6…0,7
Hydraulik 0,8…0,9
Mechanik 1,0
Table 7.4
he amount of yearly waiting-results are calculated with MTBUR
T
MFHn
MTBUR=
This number together with the man hours and the time needed to repair the ystem/parts/machine give the maintenance man hours
s
on on M
off off M
MMH RT nMMH RT n
= ⋅= ⋅
RT on/off Repair Time on/off the system
een looked to a maintenance manual of an electromotor from the ompany Nord. In the manual of the common electromotor (Nord 2004) there is referred to
proof gearbox. es the procedure of the maintenance that has to be done on the
reproof gear motor. (Nord 2004)
For the MTBF there has bcfollow the procedure for a fireThe following Picture 7.1 givfi
54

55
Picture 7.1 For each procedure, both APS and APS + Taxi, it has been calculated. The total Excel sheets can be founding APPENDIX E Here an example for procedure 2: APS There is each time a use of the electromotor for 5 minutes. That together with the yearly flight cycles from paragraph 7.3, which are 1723 flights there are 143,5766 working hours, called in this example FH. After 100 working hours only a visual check has to be done, The repair time, which is just a visual control, is estimated on 5 minutes = 0.1 h
100 working hours
e visual control
55

56
MTBF 100 [h] FTRR 0,6 [ / ] FH 143,5766 [FH] RT on 0,1 [h] RT off 0 [h] LR/FH 69 [$/FH] 0 [$] MTUBR 60,00 [h] nm 2,392944 [FH/h] MMHon 0,239294 [h] 16,51131 [$] MMHoff 0 [h] 0 [$]
DMC 16,51131 [$] Table 7.5 For the complete calculation there is an extra material cost of 1500$ included. The repair times are estimated and can be seen in the complete calculation in APPENDIX E
both cases an extra material cost of 1500$ is included. ing hours (FH) and that is equal to approximately 70 years in
or procedure 2: APS the cost per flight is 0.0127$/flight
InThe total cost is for 10000 workthe case of procedure 1: APS. FFor procedure 3: APS + Taxi the maintenance cost per flight is 0.0522$/flight As predicted these costs are not high compared with the other costs. Though they have to be included.
7 .6 Total costs
56
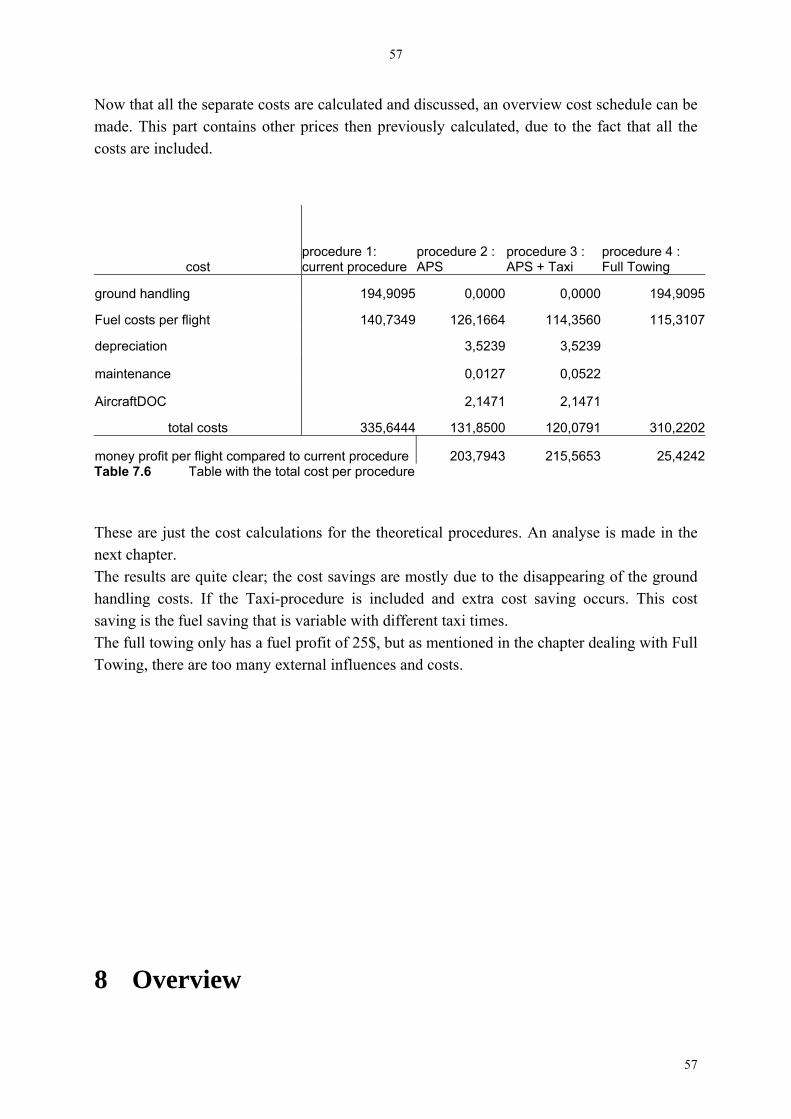
57
Now that all the separate costs are calculated and discussed, an overview cost schedule can be ade. This part contains other prices then previously calculated, due to the fact that all the
APS + Taxi Full Towing
mcosts are included.
cost procedure 1: current procedure
procedure 2 : APS
procedure 3 : procedure 4 :
ground handling 194,9095 0,0000 0,0000 194,9095
Fuel co 349 126,1664 114,3560 115,3107sts per flight 140,7
depreciation 3,5239 3,5239
mainten 0,0127 0,0522 ance
Airc tDraf OC 2,1471 2,1471
total costs 335,6444 131,8500 120,0791 310,2202
money profit per flight compared to current procedure 203,7943 215,5653 25,4242Table 7 with the total cost per procedure The the ext chapter. he results are quite clear; the cost savings are mostly due to the disappearing of the ground andling costs. If the Taxi-procedure is included and extra cost saving occurs. This cost aving is the fuel saving that is variable with different taxi times. he full towing only has a fuel profit of 25$, but as mentioned in the chapter dealing with Full owing, there are too many external influences and costs.
Overview
.6 Table
se are just the cost calculations for the theoretical procedures. An analyse is made innThsTT
8
57
58
8.1 Conclusion
ue to the APS system the ground handling costs can be eliminated, this is the biggest part of
engines have to start 5 axi procedure is nger then that time. Ehe same analogy counts for the Emission gasses.
8.2 Compariso
posed m orrect, comparising with other methods have to e used. A company
Electrical Driven Nose
f e nose wheels, it will rcraft of all sizes full ground mobility(forward and reverse with
steering) without turbin be owered by the APU which, while technically a turbine, is designed for this sort of
(Whe
hey also have an online Financial Benefits Calculator, which works for several types of
Their procedure is theresults of this paper and he site of wheeltug, a comparison can be seen.
he following parameters that were used during the whole paper are used.
• a ground taxi tim• A fuel price of 3.• A turnaround saving of 2.5 minutes
A screenshot is taken fr
Dthe cost savings. The procedure gets more efficient with longer taxi times. Since the main
minutes before take-off, it get more profitable if the Tlo very minute has a fuel efficiency of 68% T
n of results To see if the pro ethod is good and/or cb called Wheeltug made the theoretical test structure (see chapter 3.2
Gear). “WheelTug is a fully integrated ground propulsion system for airdraft. Built into the hubs oth give ai
es or external tugs. It will not require airframe modifications. It willpapplication.” eltug 2007)
Taircrafts and also the A320.
closest to the pushback+Taxi procedure of chapter 4. If we use the put them in t
T
e of 7 minutes. 0840$/gl
• 4.72 flights per day (depending on the yearly flight cycles)
om the site and shown in Picture 8.1
58

59
Picture 8.1 input and results of www.wheeltug.com As seen the method of the site is about the same, they seem to have aproximatly the same fuel reduction. The maintenance price is bigger, but this is due to the whole system and electric they have. prices are aproximatly the same. This paper has a total reduction of aproximatly 215$ in total, so it is quite the same. In table 8.1 the comparison between the 2 calculations are shown.
59
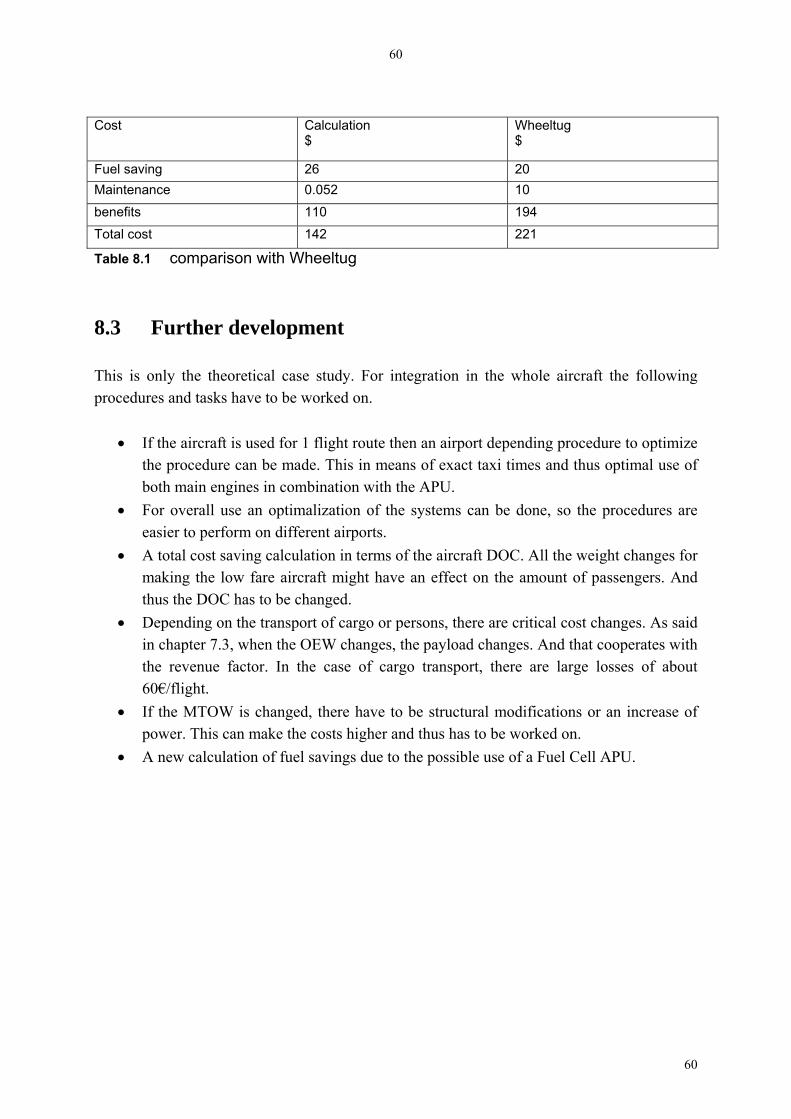
60
Cost Calculation
$ Wheeltug $
Fuel saving 26 20 Maintenance 0.052 10
benefits 110 194
Total cost 142 221
Table 8.1 ar n wit Whee g
8.3 Further evel ment T the etical case st y. For inte atio in th airc following p e ks ve to e wor on.
af used r 1 fli t rou then n airport depending pro o optiur a be made. This in means of ex t tax nd th mal us
o en es in mbination w the PUo l u an o imalization o he stem can be d e, so t eduresa erf m on different airports.
t s ing ca ulation in ter e aircraft DOC ll the w hangee l fare ircraft ight ve effe on the ount o gers. OC as to chan . o he tra port o argo r pe ns, there are critical cos s. As7.3 hen e OEW han s, th paylo d change And th rates e ctor. the c e of argo rans rt, there re larg of a
0 W is cha ed, th e ha to be structural modifications ncreas
o is c make the costs high and us h to be w ked on.ul on of el sav gs du to th poss le use of Fuel C .
comp iso h ltu
d op
his is only the or ud gr n e whole raft the rocedur s and tas ha b ked
• If the aircr t is fo gh te a cedure t mize the proced e c n ac i times a us opti e of b th main gin co ith A .
• F r overal se pt f t sy s on he proc are e sier to p or
• A total cos av lc ms of th . A eight c s for making th ow a m ha an ct am f passen And thus the D h be ged
• Depending n t ns f c o rso t change said in chapter , w th c ge e a s. at coope with the revenu fa In as c t po a e losses bout 6 €/flight.
• If the MTO ng er ve or an i e of p wer. Th an er th as or
• A new calc ati fu in e e ib a ell APU
60
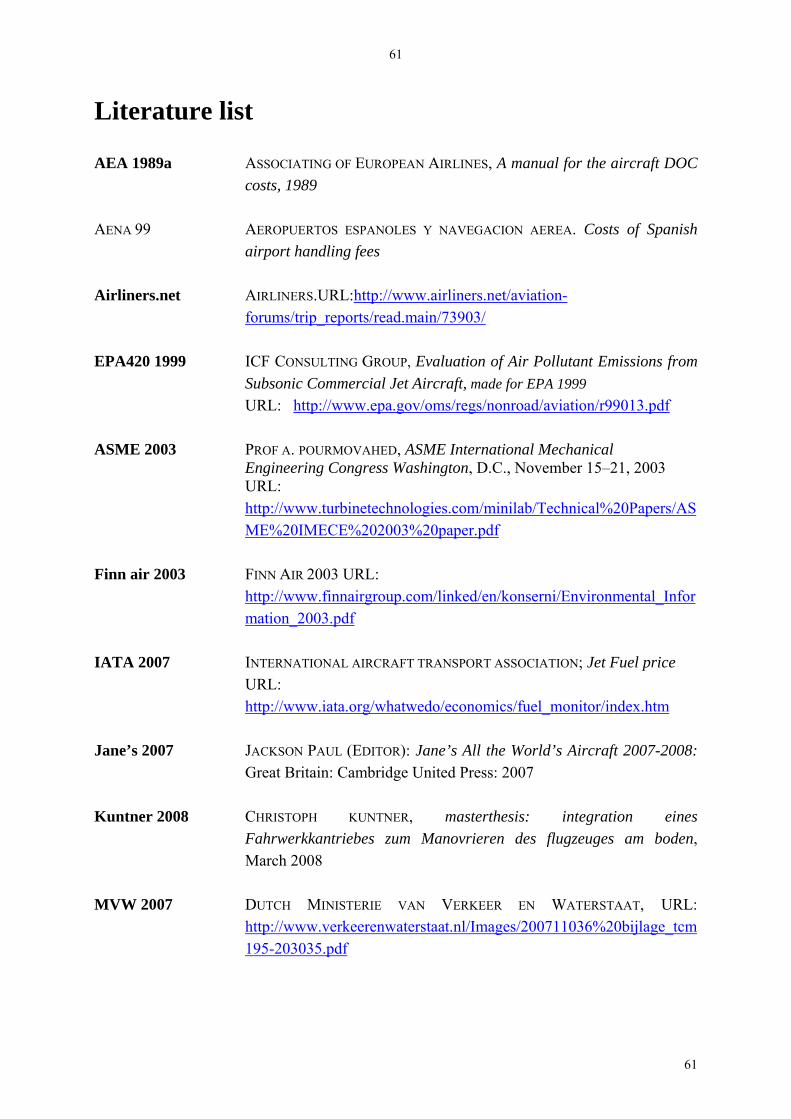
61
Literature list A ASSOCIATING OF EU PEA A , A m ual for craft D
costs, 1989 A AEROPUERTOS ESPANOLES Y NAVEGACION A. f Spa
airpo hand g fee A s AIRLINERS.U :http://www.airliners.net/aviation-
EA 1989a an the air OC RO N IRLINES
Costs o nish ENA 99 AERE
rt lin s
irliner .net RLforum /trip_ orts ad.m in 3903/s rep /re a /7
E ICF G , v uation of A Polluta sions
Subsonic Commercial Jet Aircraft, made for EPA 199 URL: http://www.epa.gov/oms/regs/nonroad/aviation/r99013.pdf
PA420 1999 E al ir nt Emis from CONSULTING ROUP
9
A PROF A. POUR OVA D, A Internation Mecha
Engineering Congress Washington, D.C., November 15–21, 2003 URL
http://www.turbinetechnologies.com/minila /Techni apers
SME 2003 SME al nical M HE
: b cal%20P /AS
ME%20IMECE%202003%20paper.pdf F FINN IR 2003 URL: http://www.finnairgroup.com/linked/en/kon rni/Env ntal_I
inn air 2003 Ase ironme nfor
mation_2003.pdf I INTERNATIONAL AIRCRAFT TRANSPORT ASSOCIATION; Jet Fuel price URL
http: ww.i .org/ hatw do/e omics/fuel_monitor/index.htm
ATA 2007 : //w ata w e con
ane’s 2007 JACKSON PAUL (EDITOR): Jane’s All the World’s Aircraft 2007-2008:
Great Britain: Cambridge United Press: 2007
untner 2008 CHRISTOPH KUNTNER, masterthesis: integration eines Fahrwerkkantriebes zum Manovrieren des flugzeuges am boden, March 2008
VW 2007 DUTCH MINISTERIE VAN VERKEER EN WATERSTAAT, URL: http://www.verkeerenwaterstaat.nl/Images/200711036%20bijlage_tcm
J
K
M
195-203035.pdf
61
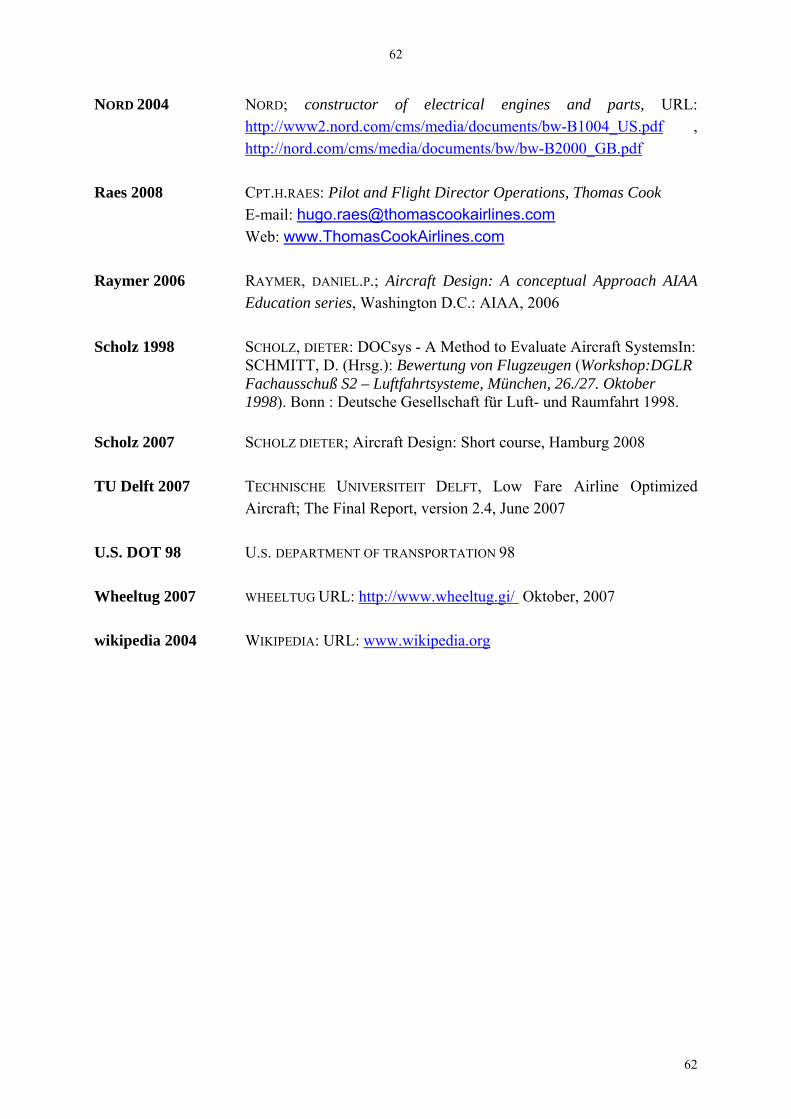
62
NORD 2004 NORD; constructor of electrical engines and parts, URL: www2.nord.com/cms/media/documents/bw-B1004_US.pdfhttp:// ,
http://nord.com/cms/media/documents/bw/bw-B2000_GB.pdf Raes 2008 CPT.H.RAES: Pilot and Flight Director Operations, Thomas Cook E-m c iail: hugo.raes@thomas ookairl nes.com
W a o lieb: www.Thom sCo kAir nes.com
R RAYMER, DA EL.P.; ircr t De n: A tual Ap oach AIA
Education series, Wa ing D.C AIA S 9 SCHO , DIETER: DOCsys - A Method to Evaluate Aircraft SystemsI
SCHMITT, D. (Hrsg.): Bewertung von Flugzeugen (Workshop:DGLFachausschuß S2 – Luftfahrtsyste e, Mü 6./27. O ober 1998 onn : eutsc Ge llsch t für Raumfahrt 1998.
S 0 SCHOLZ DIETE ; Aircraft Design: Short course, Hamburg 2008 T TECHNISCHE NIVE ITEI DELFT, Lo Air timiz
Aircraft; The Final Report, version 2.4, June 2007 U T U.S. DEPARTMENT OF TRANSPORTATION 9 W g WHEELTUG URL: http://www.wheeltug.gi/
aymer 2006 NI A af sig concep pr A sh ton .: A, 2006
cholz 1 98 LZ n: R
m nchen, 2 kt). B D he se af Luft- und
cholz 2 07 R
U Delft 2007 U RS T w Fare line Op ed
.S. DO 98 8
heeltu 2007 O tober, 2 w a WIKIPEDIA: URL: www.wikipedia.org
k 007
ikipedi 2004
62
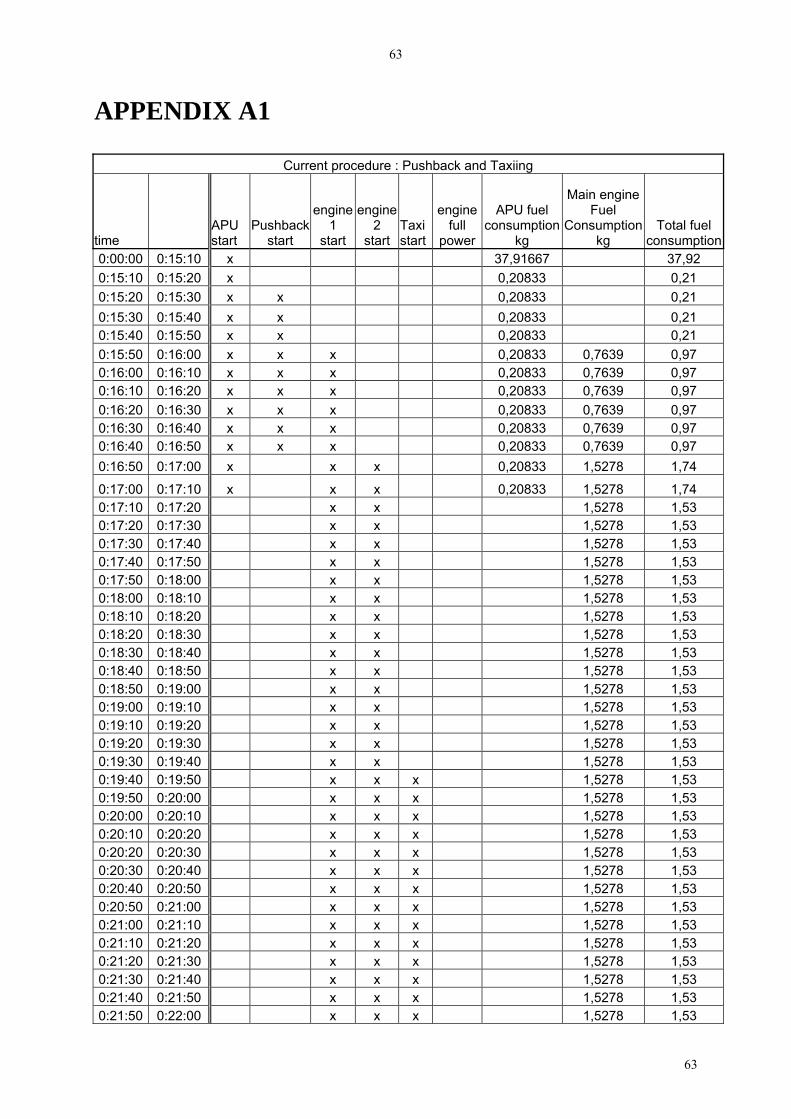
63
APPENDIX A1
urrent procedure : Pushback and TaxiingC
t APU sta
Push ck st
en e
st
eng 2
stTasta
eng fu
power
APU fuel consum ion
kg
MainF
Cons Totaconsuime rt
baart
gin1 art
ine
art xi rt
inell pt
engine uel umptionkg
l fuel mption
0:00:00 0:15:10 x 37,91 7 3766 ,92 0:15:10 0:15:20 x 0,208 0,33 21 0:15:20 0:15:30 x x 0,208 0,33 21 0:15:30 0:15:40 x x 0,208 0,33 21 0:15:40 0:15:50 x x 0,208 0,33 21 0:15:50 0:16:00 x x x 0,208 0, 0,33 7639 97 0:16:00 0:16:10 x x x 0,208 0, 0,33 7639 97 0:16:10 0:16:20 x x x 0,208 0, 0,33 7639 97 0:16:20 0:16:30 x x x 0,208 0, 0,33 7639 97 0:16:30 0:16:40 x x x 0,208 0, 0,33 7639 97 0:16:40 0:16:50 x x x 0,208 0, 0,33 7639 97 0:16:50 0:17:00 x x 0,208 1, 1,x 33 5278 74
0:17:00 0:17:10 x x x 0,208 1, 1, 33 5278 74 0:17:10 0:17:20 x x 1, 1, 5278 53 0:17:20 0:17:30 x x 1,5278 1,53 0:17:30 0:17:40 x x 1,5278 1,53 0:17:40 0:17:50 x x 1,5278 1,53 0:17:50 0:18:00 x x 1,5278 1,53 0:18:00 0:18:10 x x 1,5278 1,53 0:18:10 0:18:20 x x 1,5278 1,53 0:18:20 0:18:30 x x 1,5278 1,53 0:18:30 0:18:40 x x 1,5278 1,53 0:18:40 0:18:50 x x 1,5278 1,53 0:18:50 0:19:00 x x 1,5278 1,53 0:19:00 0:19:10 x x 1,5278 1,53 0:19:10 0:19:20 x x 1,5278 1,53 0:19:20 0:19:30 x x 1,5278 1,53 0:19:30 0:19:40 x x 1,5278 1,53 0:19:40 0:19:50 x x x 1,5278 1,53 0:19:50 0:20:00 x x x 1,5278 1,53 0:20:00 0:20:10 x x x 1,5278 1,53 0:20:10 0:20:20 x x x 1,5278 1,53 0:20:20 0:20:30 x x x 1,5278 1,53 0:20:30 0:20:40 x x x 1,5278 1,53 0:20:40 0:20:50 x x x 1,5278 1,53 0:20:50 0:21:00 x x x 1,5278 1,53 0:21:00 0:21:10 x x x 1,5278 1,53 0:21:10 0:21:20 x x x 1,5278 1,53 0:21:20 0:21:30 x x x 1,5278 1,53 0:21:30 0:21:40 x x x 1,5278 1,53 0:21:40 0:21:50 x x x 1,5278 1,53 0:21:50 0:22:00 x x x 1,5278 1,53
63
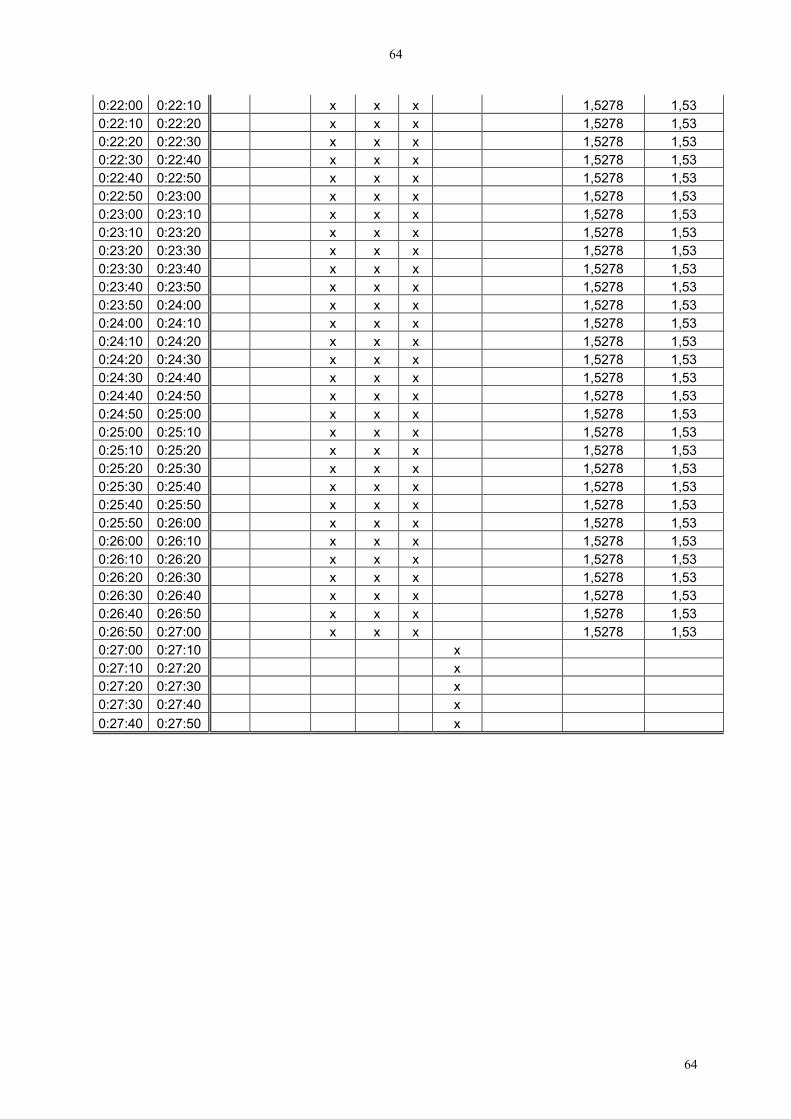
64
0:22:00 0:22:10 x x x 1,5278 1,53 0:22:10 0:22:20 x x x 1,5278 1,53 0:22:20 0:22:30 x x x 1,5278 1,53 0:22:30 0:22:40 1,5278 1,53 x x x 0:22:40 0:22:50 x x x 1,5278 1,53 0:22:50 0:23:00 x x x 1,53 1,5278 0:23:00 0:23:10 x x x 1,5278 1,53 0:23:10 0:23:20 x x x 1,5278 1,53 0:23:20 0:23:30 x x x 1,5278 1,53 0:23:30 0:23:40 1,5278 x x x 1,53 0:23:40 0:23:50 1,5278 x x x 1,53 0:23:50 0:24:00 1,5278 x x x 1,53 0:24:00 0:24:10 1,5278 x x x 1,53 0:24:10 0:24:20 1,5278 x x x 1,53 0:24:20 0:24:30 1,5278 x x x 1,53 0:24:30 0:24:40 1,5278 x x x 1,53 0:24:40 0:24:50 1,5278 x x x 1,53 0:24:50 0:25:00 1,5278 x x x 1,53 0:25:00 0:25:10 1,5278 x x x 1,53 0:25:10 0:25:20 1,5278 x x x 1,53 0:25:20 0:25:30 1,5278 x x x 1,53 0:25:30 0:25:40 1,5278 x x x 1,53 0:25:40 0:25:50 1,5278 x x x 1,53 0:25:50 0:26:00 1,5278 x x x 1,53 0:26:00 0:26:10 1,5278 x x x 1,53 0:26:10 0:26:20 1,5278 x x x 1,53 0:26:20 0:26:30 1,5278 x x x 1,53 0:26:30 0:26:40 x x x 1,5278 1,53 0:26:40 0:26:50 x x x 1,5278 1,53 0:26:50 0:27:00 x x x 1,5278 1,53 0:27:00 0:27:10 x 0:27:10 0:27:20 x 0:27:20 0:27:30 x 0:27:30 0:27:40 x 0:27:40 0:27:50 x
64

65
APPENDIX A2
nly a nom ushbacko uto ous p
t APU st
Pusst rt
engine
s t
engine rt
Taxi s t
engine full
power
l on
H ine
C fuel c ptionime art
hback a
1 tar
2 sta tar
APU fueconsumpti
kg
ead engFuel
onsumptionkg
Total onsum
0:00:00 0:15:10 x 2 37,91667 37,90:15:10 0:15:20 x 2 0,41667 0,40:15:20 0:15:30 x x 9 0,48611 0,40:15:30 0:15:40 x x 9 0,48611 0,40:15:40 0:15:50 x x 9 0,48611 0,40:15:50 0:16:00 x x 0,48611 0,49 0:16:00 0:16:10 x 0,48611 ,49 x 00:16:10 0:16:20 x 0,48611 ,49 x 00:16:20 0:16:30 x 0,48611 ,49 x 00:16:30 0:16:40 x 0,48611 ,49 x 00:16:40 0:16:50 x 0,48611 ,49 x 00:16:50 0:17:00 x 0,41667 0,42
0:17:00 0:17:10 x x 0,41667 0,7639 1,18 0:17:10 0:17:20 x x 0,41667 0,7639 1,18 0:17:20 0:17:30 x x 0,41667 0,7639 1,18 0:17:30 0:17:40 x x x 0,41667 1,5278 1,94 0:17:40 0:17:50 x x x 0,41667 1,5278 1,94 0:17:50 0:18:00 x x 1,5278 1,53 0:18:00 0:18:10 x x 1,5278 1,53 0:18:10 0:18:20 x x 1,5278 1,53 0:18:20 0:18:30 x x 1,5278 1,53 0:18:30 0:18:40 x x x 1,5278 1,53 0:18:40 0:18:50 x x x 1,5278 1,53 0:18:50 0:19:00 x x x 1,5278 1,53 0:19:00 0:19:10 x x x 1,5278 1,53 0:19:10 0:19:20 x x x 1,5278 1,53 0:19:20 0:19:30 x x x 1,5278 1,53 0:19:30 0:19:40 x x x 1,5278 1,53 0:19:40 0:19:50 x x x 1,5278 1,53 0:19:50 0:20:00 x x x 1,5278 1,53 0:20:00 0:20:10 x x x 1,5278 1,53 0:20:10 0:20:20 x x x 1,5278 1,53 0:20:20 0:20:30 x x x 1,5278 1,53 0:20:30 0:20:40 x x x 1,5278 1,53 0:20:40 0:20:50 x x x 1,5278 1,53 0:20:50 0:21:00 x x x 1,5278 1,53 0:21:00 0:21:10 x x x 1,5278 1,53 0:21:10 0:21:20 x x x 1,5278 1,53 0:21:20 0:21:30 x x x 1,5278 1,53 0:21:30 0:21:40 x x x 1,5278 1,53 0:21:40 0:21:50 x x x 1,5278 1,53 0:21:50 0:22:00 x x x 1,5278 1,53
65

66
0:22:00 0:22:10 x x x 1,5278 1,53 0:22:10 0:22:20 x x x 1,5278 1,53 0:22:20 0:22:30 x x x 1,5278 1,53 0:22:30 0:22:40 x 1,5278 1,53 x x 0:22:40 0:22:50 x x x 1,5278 1,53 0:22:50 0:23:00 x x x 1,53 1,5278 0:23:00 0:23:10 x x x 1,5278 1,53 0:23:10 0:23:20 x x x 1,5278 1,53 0:23:20 0:23:30 x x x 1,5278 1,53 0:23:30 0:23:40 x x 1,5278 3 x 1,50:23:40 0:23:50 x x 1,5278 3 x 1,50:23:50 0:24:00 x x x 1,5278 1,53 0:24:00 0:24:10 x x 1,5278 3 x 1,50:24:10 0:24:20 x x 1,5278 3 x 1,50:24:20 0:24:30 x x 1,5278 3 x 1,50:24:30 0:24:40 x x 1,5278 3 x 1,50:24:40 0:24:50 x x 1,5278 3 x 1,50:24:50 0:25:00 x x 1,5278 3 x 1,50:25:00 0:25:10 x x 1,5278 3 x 1,50:25:10 0:25:20 x x 1,5278 3 x 1,50:25:20 0:25:30 x x 1,5278 3 x 1,50:25:30 0:25:40 x x 1,5278 3 x 1,50:25:40 0:25:50 x x 1,5278 3 x 1,50:25:50 0:26:00 x 0:26:00 0:26:10 x 0:26:10 0:26:20 x 0:26:20 0:26:30 x 0:26:30 0:26:40 x
66

67
APPENDIX A3
New procedu : Au omous Pushback and xiing re ton Ta
time APU sta
Pus ack st t
engine
st t
engine
st t Taxi st
engine full
power
APU fuel consu
k
Head e Fuel
Consumption kg
Total fuel consu ption rt
hbar
1 ar
2 ar art
mption g
engin
m0:00:00 0:15:10 x 37,91667 37,92 0:15:10 0:15:20 x 0,41667 0,42 0:15:20 0:15:30 x x 0,48611 0,49 0:15:30 0:15:40 x x 0,48611 0,49 0:15:40 0:15:50 x x 0,48611 0,49 0:15:50 0:16:00 x x 0,48611 0,49 0:16:00 0:16:10 x x 0,48611 0,49 0:16:10 0:16:20 x x 0,48611 0,49 0:16:20 0:16:30 x x 0,48611 0,49 0:16:30 0:16:40 x x 0,48611 0,49 0:16:40 0:16:50 x x 0,48611 0,49 0:16:50 0:17:00 x 0,41667 0,42
0:17:00 0:17:10 x 0,41667 0,42 0:17:10 0:17:20 x x 0,48611 0,49 0:17:20 0:17:30 x x 0,48611 0,49 0:17:30 0:17:40 x x 0,48611 0,49 0:17:40 0:17:50 x x 0,48611 0,49 0:17:50 0:18:00 x x 0,48611 0,49 0:18:00 0:18:10 x x 0,48611 0,49 0:18:10 0:18:20 x x 0,48611 0,49 0:18:20 0:18:30 x x 0,48611 0,49 0:18:30 0:18:40 x x 0,48611 0,49 0:18:40 0:18:50 x x 0,48611 0,49 0:18:50 0:19:00 x x 0,48611 0,49 0:19:00 0:19:10 x x 0,48611 0,49 0:19:10 0:19:20 x x x 0,48611 0,7639 1,25 0:19:20 0:19:30 x x x 0,48611 0,7639 1,25 0:19:30 0:19:40 x x x x 0,48611 1,5278 2,01 0:19:40 0:19:50 x x x x 0,48611 1,5278 2,01 0:19:50 0:20:00 x x x x 0,48611 1,5278 2,01 0:20:00 0:20:10 x x x x 0,48611 1,5278 2,01 0:20:10 0:20:20 x x x x 0,48611 1,5278 2,01 0:20:20 0:20:30 x x x x 0,48611 1,5278 2,01 0:20:30 0:20:40 x x x x 0,48611 1,5278 2,01 0:20:40 0:20:50 x x x x 0,48611 1,5278 2,01 0:20:50 0:21:00 x x x x 0,48611 1,5278 2,01 0:21:00 0:21:10 x x x x 0,48611 1,5278 2,01 0:21:10 0:21:20 x x x x 0,48611 1,5278 2,01 0:21:20 0:21:30 x x x x 0,48611 1,5278 2,01 0:21:30 0:21:40 x x x x 0,48611 1,5278 2,01 0:21:40 0:21:50 x x x x 0,48611 1,5278 2,01 0:21:50 0:22:00 x x x x 0,48611 1,5278 2,01
67
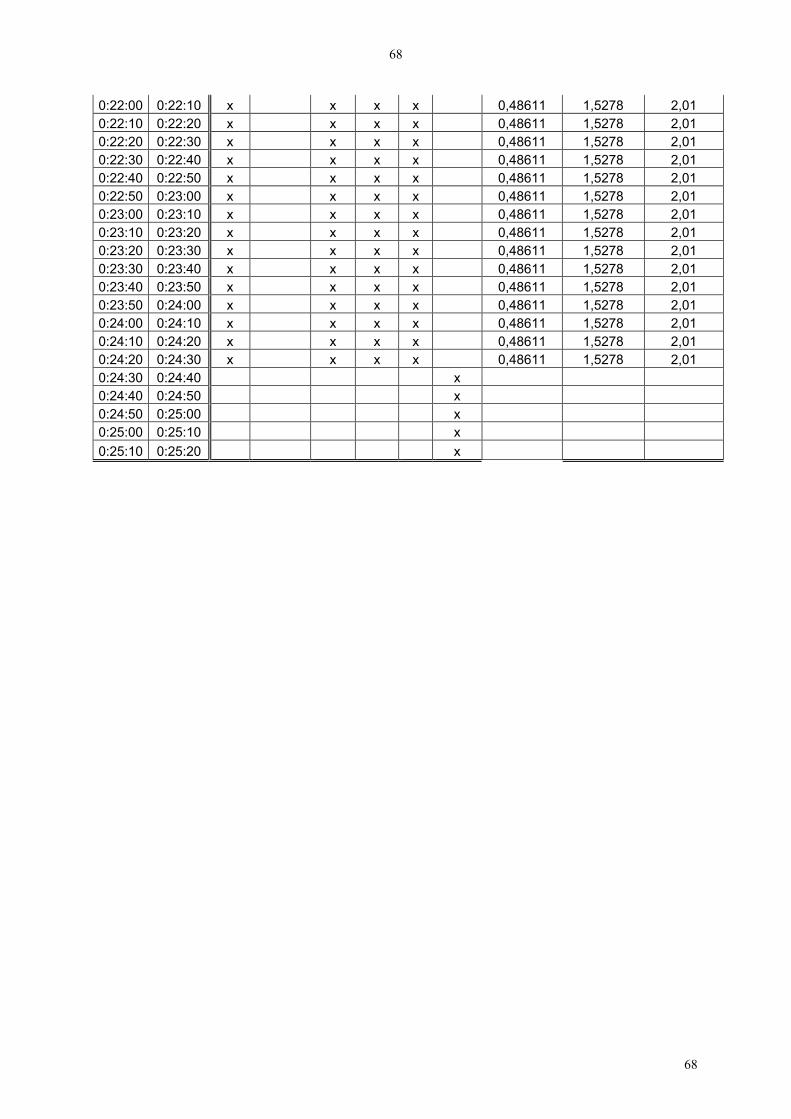
68
0:22:00 0:22:10 x x x x 0,48611 1,5278 2,01 0:22:10 0:22:20 x x x x 0,48611 1,5278 2,01 0:22:20 0:22:30 x x x x 0,48611 1,5278 2,01 0:22:30 0:22:40 x x x x 0,48611 1,5278 2,01 0:22:40 0:22:50 x x x x 0,48611 1,5278 2,01 0:22:50 0:23:00 x x x x 0,48611 1,5278 2,01 0:23:00 0:23:10 x x x x 0,48611 1,5278 2,01 0:23:10 0:23:20 x x x x 0,48611 1,5278 2,01 0:23:20 0:23:30 x x x x 0,48611 1,5278 2,01 0:23:30 0:23:40 x x x x 0,48611 1,5278 2,01 0:23:40 0:23:50 x x x x 0,48611 1,5278 2,01 0:23:50 0:24:00 x x x x 0,48611 1,5278 2,01 0:24:00 0:24:10 x x x x 0,48611 1,5278 2,01 0:24:10 0:24:20 x x x x 0,48611 1,5278 2,01 0:24:20 0:24:30 x x x x 0,48611 1,5278 2,01 0:24:30 0:24:40 x 0:24:40 0:24:50 x 0:24:50 0:25:00 x 0:25:00 0:25:10 x 0:25:10 0:25:20 x
68
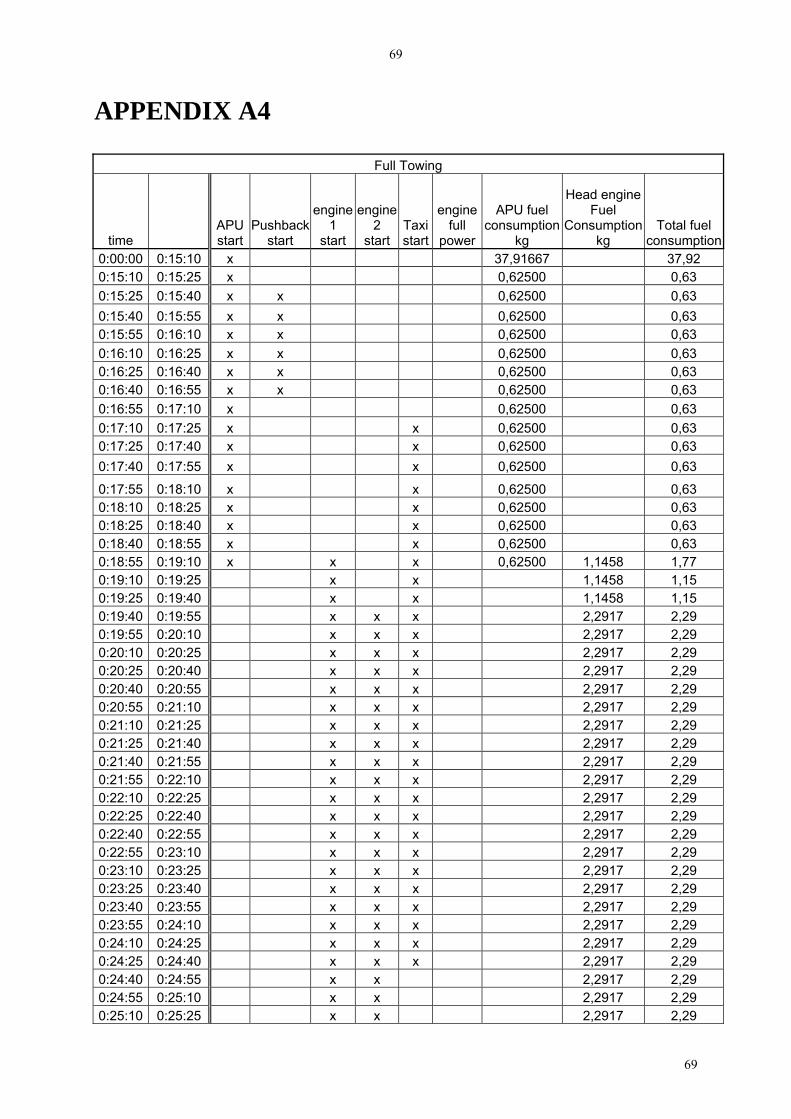
69
APPENDIX A4
Full Towing
time start startAPU Pushback
engine 1
start
engine 2
start Taxi start
engine full
power
APU fuel consumption
kg
Head engine Fuel
Consumption kg
Total fuel consumption
0:00:00 0:15:10 x 37,91667 37,92 0:15:10 0:15:25 x 0,62500 0,63 0:15:25 0:15:40 x x 0,62500 0,63 0:15:40 0:15:55 x x 0,62500 0,63 0:15:55 0:16:10 x x 0,62500 0,63 0:16:10 0:16:25 x x 0,62500 0,63 0:16:25 0:16:40 x x 0,62500 0,63 0:16:40 0:16:55 x x 0,62500 0,63 0:16:55 0:17:10 x 0,62500 0,63 0:17:10 0:17:25 x x 0,62500 0,63 0:17:25 0:17:40 x x 0,62500 0,63 0:17:40 0:17:55 x x 0,62500 0,63
0:17:55 0:18:10 x x 0,62500 0,63 0:18:10 0:18:25 x x 0,62500 0,63 0:18:25 0:18:40 x x 0,62500 0,63 0:18:40 0:18:55 x x 0,62500 0,63 0:18:55 0:19:10 x x x 0,62500 1,1458 1,77 0:19:10 0:19:25 x x 1,1458 1,15 0:19:25 0:19:40 x x 1,1458 1,15 0:19:40 0:19:55 x x x 2,2917 2,29 0:19:55 0:20:10 x x x 2,2917 2,29 0:20:10 0:20:25 x x x 2,2917 2,29 0:20:25 0:20:40 x x x 2,2917 2,29 0:20:40 0:20:55 x x x 2,2917 2,29 0:20:55 0:21:10 x x x 2,2917 2,29 0:21:10 0:21:25 x x x 2,2917 2,29 0:21:25 0:21:40 x x x 2,2917 2,29 0:21:40 0:21:55 x x x 2,2917 2,29 0:21:55 0:22:10 x x x 2,2917 2,29 0:22:10 0:22:25 x x x 2,2917 2,29 0:22:25 0:22:40 x x x 2,2917 2,29 0:22:40 0:22:55 x x x 2,2917 2,29 0:22:55 0:23:10 x x x 2,2917 2,29 0:23:10 0:23:25 x x x 2,2917 2,29 0:23:25 0:23:40 x x x 2,2917 2,29 0:23:40 0:23:55 x x x 2,2917 2,29 0:23:55 0:24:10 x x x 2,2917 2,29 0:24:10 0:24:25 x x x 2,2917 2,29 0:24:25 0:24:40 x x x 2,2917 2,29 0:24:40 0:24:55 x x 2,2917 2,29 0:24:55 0:25:10 x x 2,2917 2,29 0:25:10 0:25:25 x x 2,2917 2,29
69
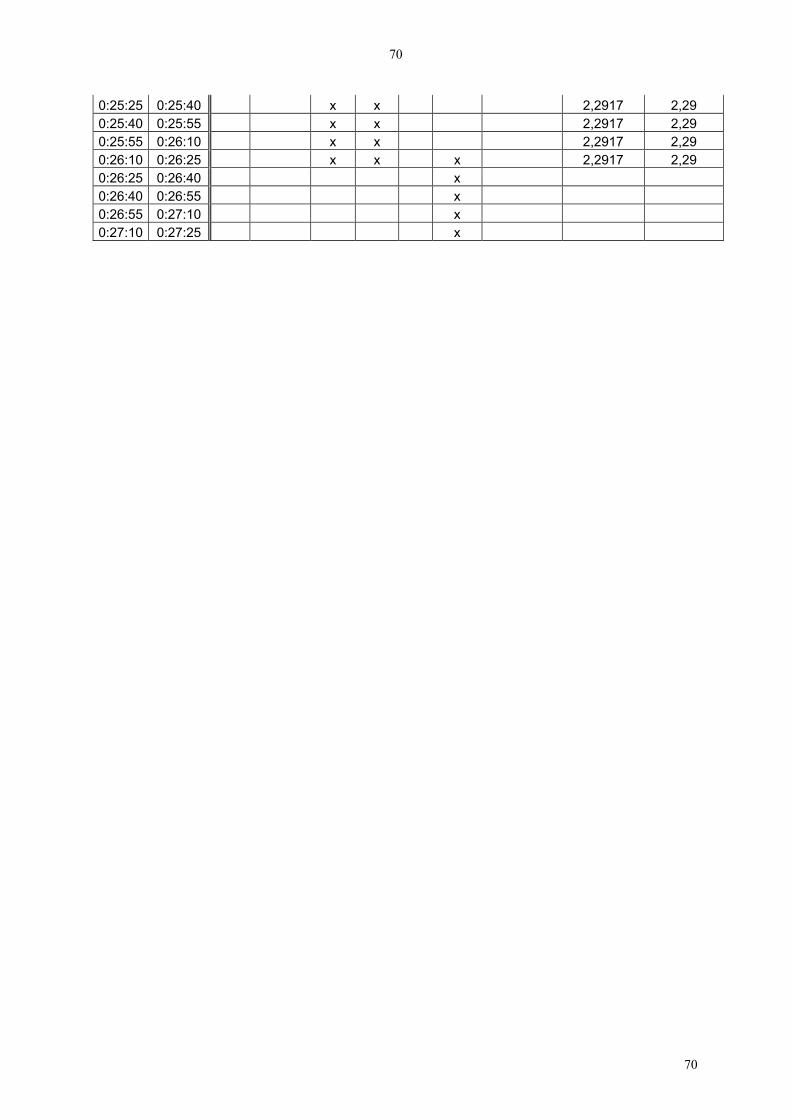
70
0:25:25 0:25:40 x x 2,2917 2,29 0:25:40 0:25:55 x x 2,2917 2,29 0:25:55 0:26:10 x x 2,2917 2,29 0:26:10 0:26:25 x x x 2,2917 2,29 0:26:25 0:26:40 x 0:26:40 0:26:55 x 0:26:55 0:27:10 x 0:27:10 0:27:25 x
70
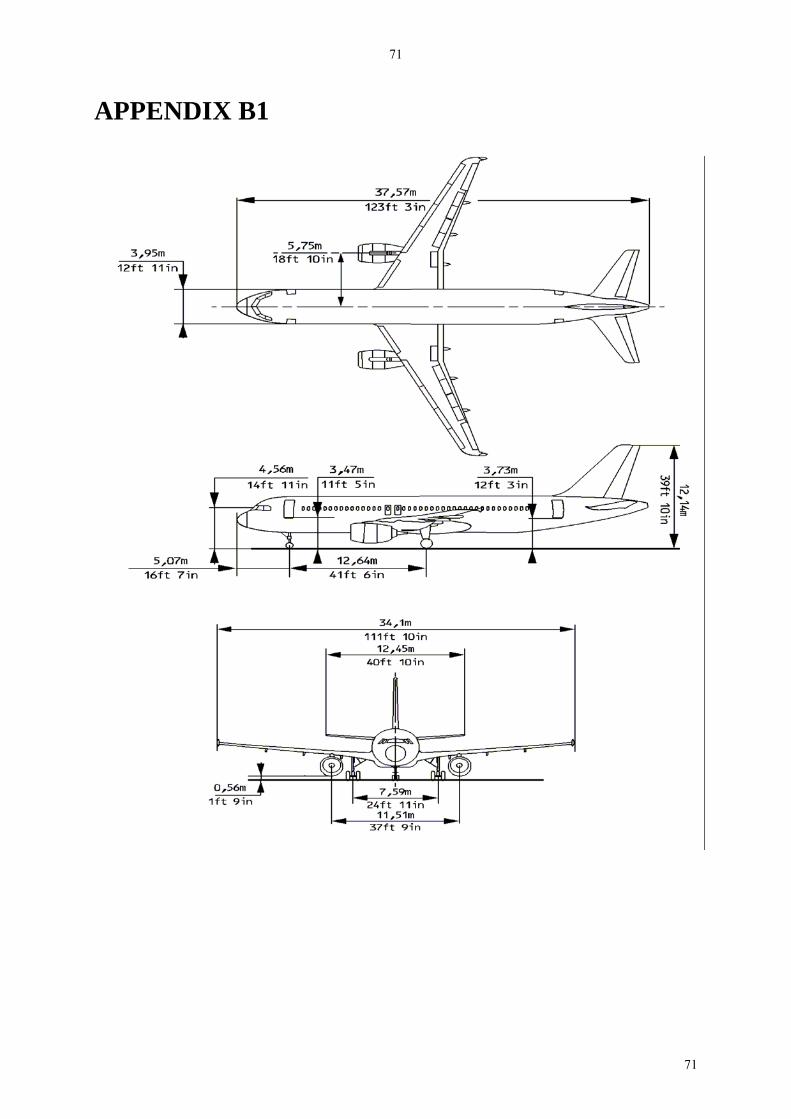
71
APPENDIX B1
71
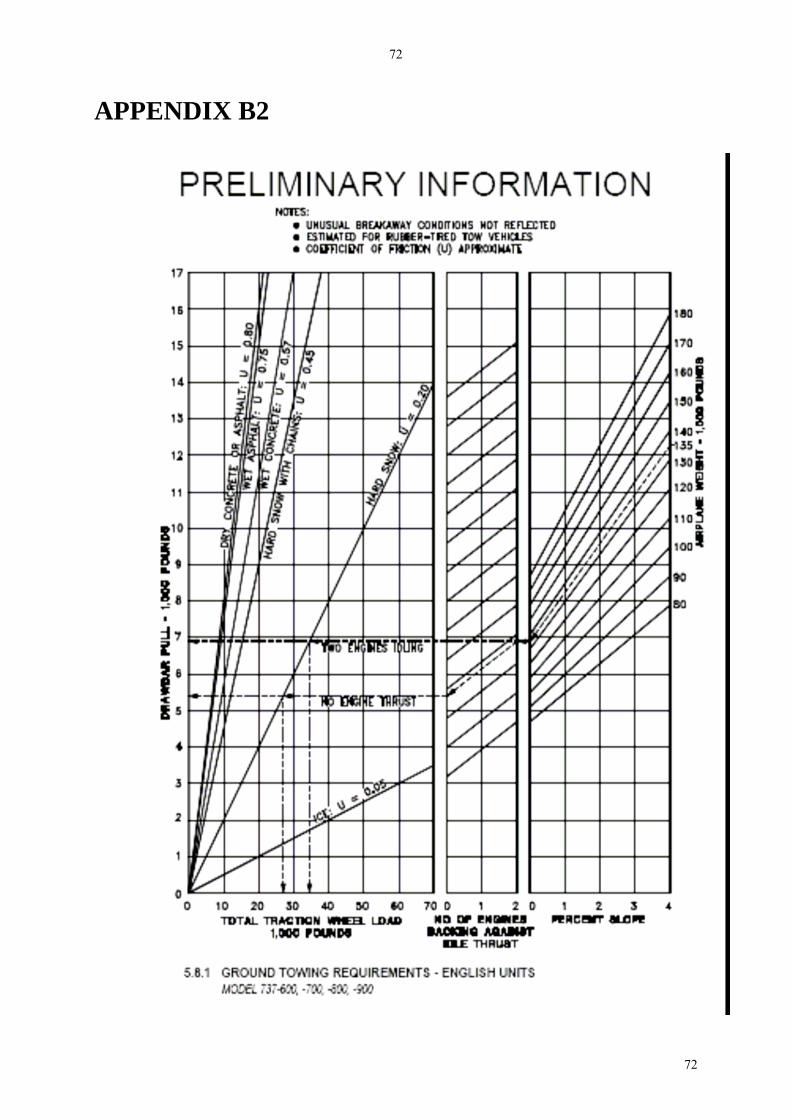
72
APPENDIX B2
72
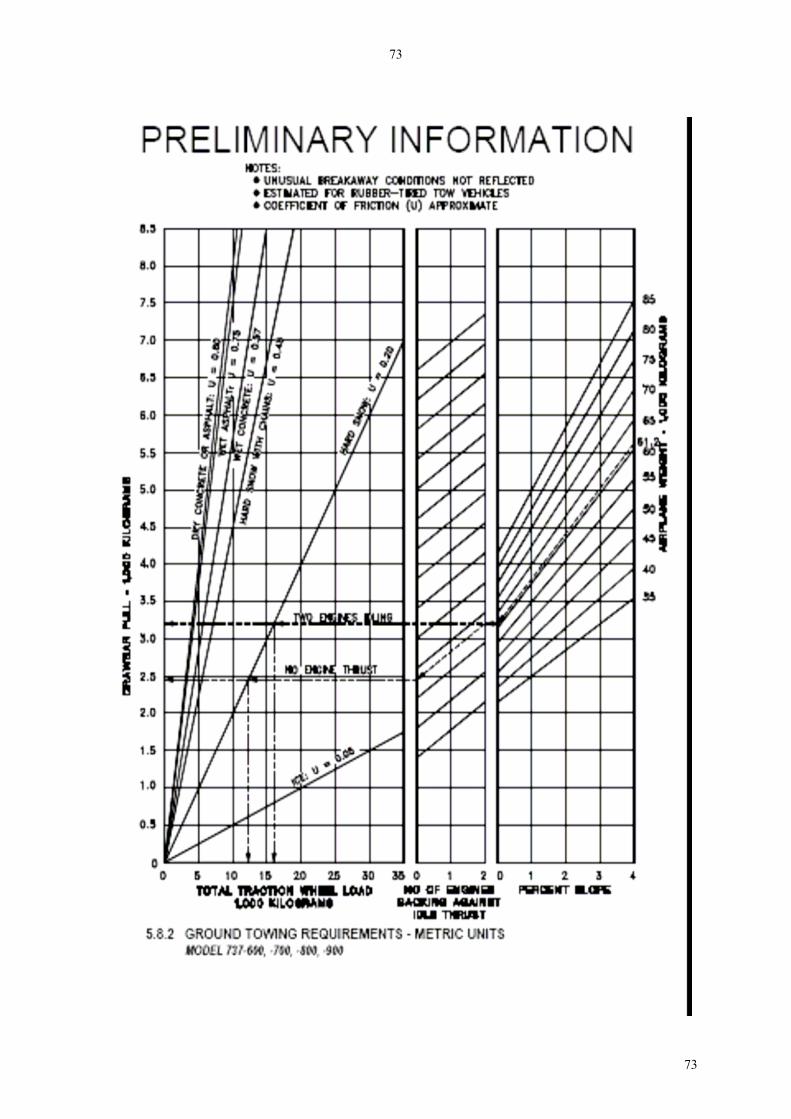
73
73
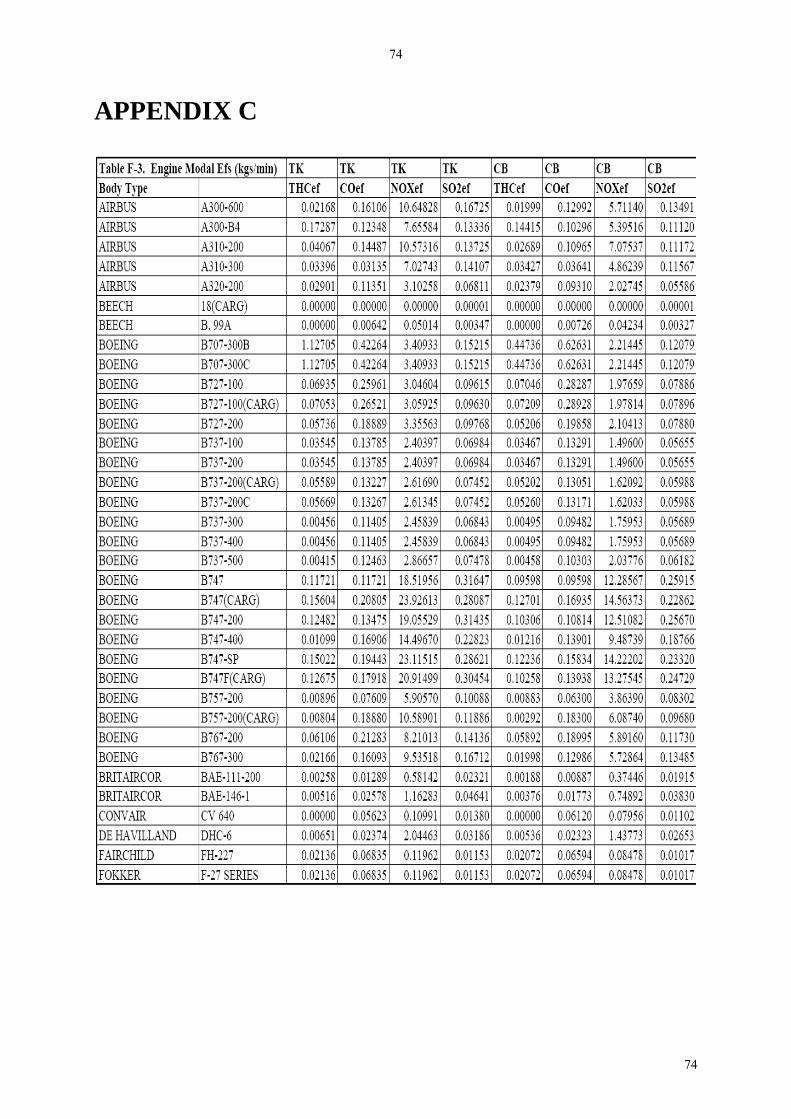
74
APPENDIX C
74
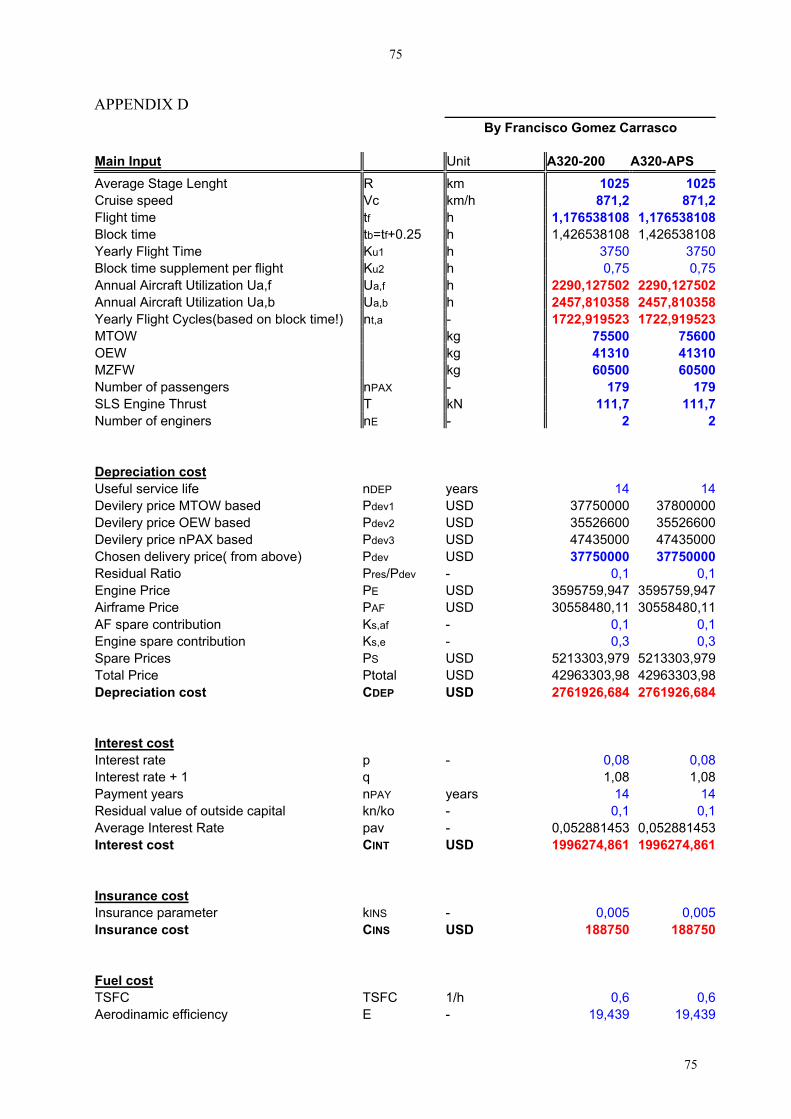
75
APPENDIX D By Francisco Gomez Carrasco Main Input Unit A320-200 A320-APS Average Stage Lenght R km 1025 1025Cruise speed Vc km/h 871,2 871,2Flight time tf h 1,176538108 1,176538108Block time tb=tf+0.25 h 1,426538108 1,426538108Yearly Flight Time Ku1 h 3750 3750Block time supplement per flight Ku2 h 0,75 0,75Annual Aircraft Utilization Ua,f Ua,f h 2290,127502 2290,127502Annual Aircraft Utilization Ua,b Ua,b h 2457,810358 2457,810358Yearly Flight Cycles(based on block time!) nt,a - 1722,919523 1722,919523MTOW kg 75500 75600OEW kg 41310 41310MZFW kg 60500 60500Number of passengers nPAX - 179 179SLS Engine Thrust T kN 111,7 111,7Number of enginers nE - 2 2 Depreciation cost Useful service life nDEP years 14 14Devilery price MTOW based Pdev1 USD 37750000 37800000Devilery price OEW based Pdev2 USD 35526600 35526600Devilery price nPAX based Pdev3 USD 47435000 47435000Chosen delivery price( from above) Pdev USD 37750000 37750000Residual Ratio Pres/Pdev - 0,1 0,1Engine Price PE USD 3595759,947 3595759,947Airframe Price PAF USD 30558480,11 30558480,11AF spare contribution Ks,af - 0,1 0,1Engine spare contribution Ks,e - 0,3 0,3Spare Prices PS USD 5213303,979 5213303,979Total Price Ptotal USD 42963303,98 42963303,98Depreciation cost CDEP USD 2761926,684 2761926,684 Interest cost Interest rate p - 0,08 0,08Interest rate + 1 q 1,08 1,08Payment years nPAY years 14 14Residual value of outside capital kn/ko - 0,1 0,1Average Interest Rate pav - 0,052881453 0,052881453Interest cost CINT USD 1996274,861 1996274,861 Insurance cost Insurance parameter kINS - 0,005 0,005Insurance cost CINS USD 188750 188750 Fuel cost TSFC TSFC 1/h 0,6 0,6Aerodinamic efficiency E - 19,439 19,439
75

76
Breguet Range Factor B km 28225,428 28225,428Cruise mass ratio - 0,964336699 0,964336699Engine start mass ratio - 0,99 0,99Taxi mass ratio - 0,99 0,99Take off mass ratio - 0,995 0,995Climb mass ratio - 0,98 0,98Descent mass ratio - 0,99 0,99Landing mass ratio - 0,992 0,992Total mass ratio - 0,905096962 0,905096962Breguet regression factor f - 1,200681879 1,200681879Corrected Cruise mass ratio - 0,957334432 0,957334432Mass ratio(choose corrected or total) - 0,905096962 0,905096962TOW kg 66843,6671 66843,6671Mission fuel mass mF kg 6343,667099 6343,667099Fuel price(check IATA) PF USD/kg 0,76 0,76Fuel cost CF USD 8306517,199 8306517,199 Maintenance cost Maintenance man hour LM USD 65 65Engine mass(check manufacturer) mE kg 3500 3500Installation correction KeKthr - 1,357 1,357Engine installation mass ME,inst - 9499 9499Airframe mass MAF kg 31811 31811Bypass Ratio BPR - 4,8 4,8Overall Average Pressure Ratio OAPR - 27,4 27,4MMH AF per flight hour MMH/FH 1/h 8,548951247 8,548951247AF maintenance cost per FH CM,M,AF,f USD/h 176,3161694 176,3161694Engine correction 1 k1 - 0,996297828 0,996297828Engine correction 2 k2 - 1,002277624 1,002277624Engine correction 3 k3 - 1,018 1,018Engine correction 4 k4 - 0,57 0,57Number of compressor stages nc - 14 14Number of shafts of the engine ns - 2 2MMH E per flight hour MMH/E 1/h 2,454151987 2,454151987E maintenance cost per FH CM,M,E,f USD/h 21,8899771 21,8899771Annual mean inflation rate pINF - 0,033 0,033Years from 1989 nY years 18 18Inflation factor kINF - 1,793931217 1,793931217Maintenance cost CM USD 3321555,559 3321555,559 Staff cost Cockpit crew nCO - 2 2Cabin crew nCA - 5,114285714 5,114285714Cockpit crew mean hourly rate LCO USD 246,5 246,5Cabin crew mean hourly rate LCA USD 81 81Staff cost CC USD 2229866,003 2229866,003 Fees and charges
ng parameter kLD USD/kg 0,0078 0,0078anding fee CFEE,LD USD 1820171,6 1822582,424avigation parameter kNAV USD/kmkg^.5 0,0022356 0,0022356avigation fee CFEE,NAV USD 1946086,866 1947375,239andling parameter kGND USD/kg 0,05 0,05
LandiLNNH
76

77
Handling fee
CFEE,GND USD 2965621,753 2965621,753
200($) A320 APS ($) cost type A320- DOC 25536770,53 25540469,72 DOC/SEATS 142663,5225 142684,1884 DOC/SEATTRIP 82,80335823 82,81535293 DOC/TRIP 14821,80112 14823,94817 ∆ DOC/TRIP 2,147051002
77
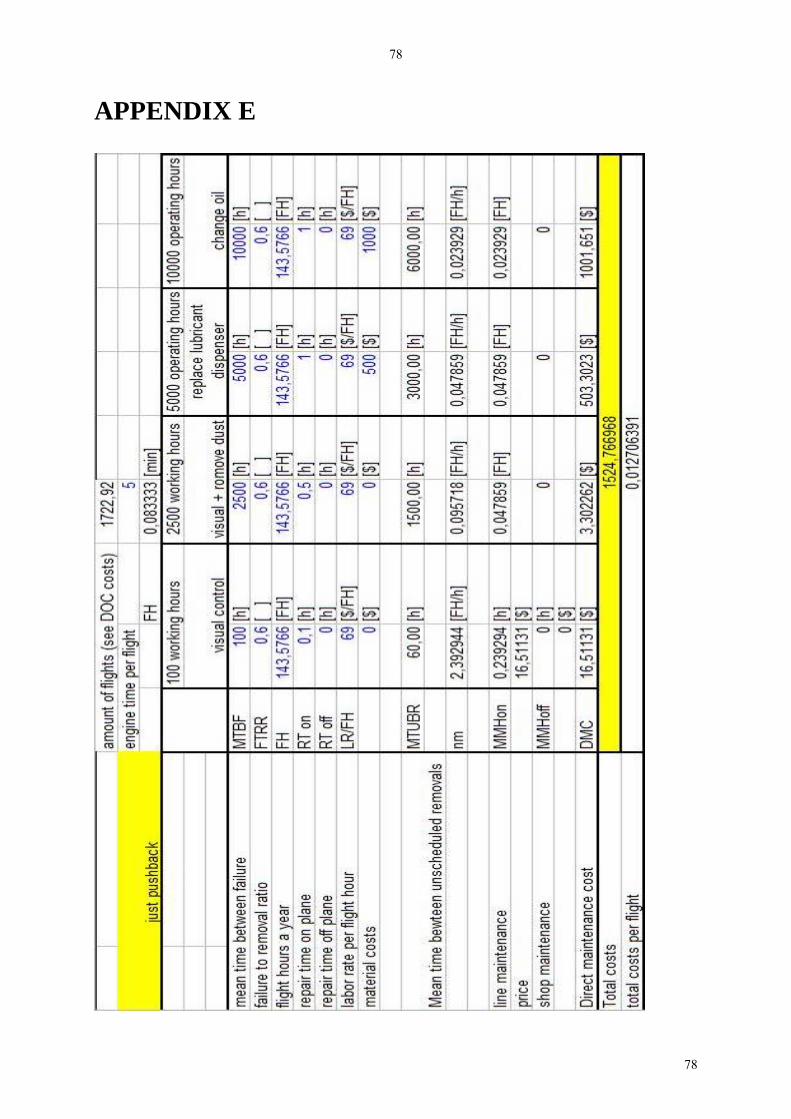
78
78
APPENDIX E
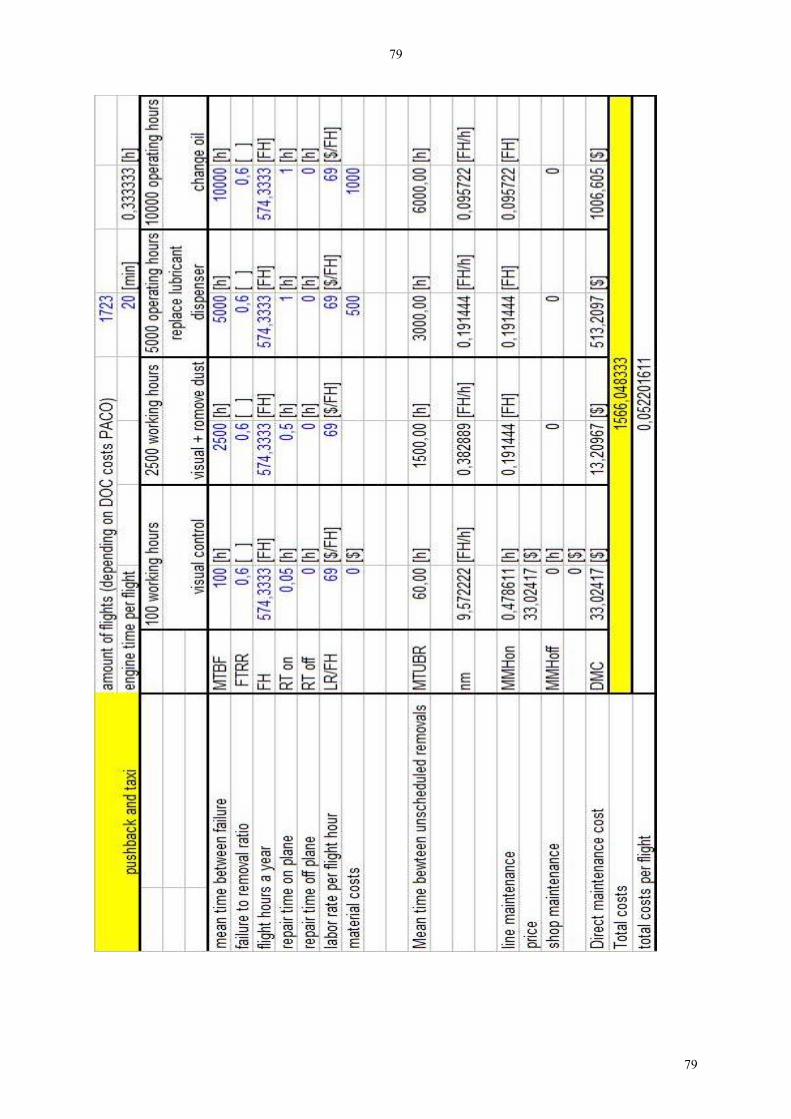
79
79

80
80
APPENDIX E This appendix contains the CD with the pdf file and excel worksheets.