Efficiency of Wood-Dust of Dalbergia sisoo as Low-Cost ...
13
nanomaterials Article Efficiency of Wood-Dust of Dalbergia sisoo as Low-Cost Adsorbent for Rhodamine-B Dye Removal Dibyashree Shrestha Citation: Shrestha, D. Efficiency of Wood-Dust of Dalbergia sisoo as Low-Cost Adsorbent for Rhodamine-B Dye Removal. Nanomaterials 2021, 11, 2217. https://doi.org/10.3390/ nano11092217 Academic Editor: Christos A. Aggelopoulos Received: 11 August 2021 Accepted: 19 August 2021 Published: 28 August 2021 Publisher’s Note: MDPI stays neutral with regard to jurisdictional claims in published maps and institutional affil- iations. Copyright: © 2021 by the author. Licensee MDPI, Basel, Switzerland. This article is an open access article distributed under the terms and conditions of the Creative Commons Attribution (CC BY) license (https:// creativecommons.org/licenses/by/ 4.0/). Department of Chemistry, Patan Multiple Campus, Tribhuvan University, Patan Dhoka, Lalitpur 44613, Nepal; [email protected] Abstract: Wood-dust of Dalbergia sisoo (Sisau) derived activated carbon (AC) was successfully tested as an adsorbent material for the removal of rhodamine B dye from an aqueous solution. The AC was prepared in a laboratory by the carbonization of wood powder of Dalbergia sisoo at 400 ◦ C in an inert atmosphere of N 2 , which was chemically activated with H 3 PO 4 . Several instrumental techniques have been employed to characterize the as-prepared AC (Db-s). Thermogravimetric analysis (TGA)/differential scanning colorimetry (DSC) confirmed that 400 ◦ C was an appropriate temperature for the carbonization of raw wood powder. The FTIR spectra clearly confirmed the presence of oxygenated functional groups such as hydroxyl (–OH), aldehyde/ketone (–CHO/C=O) and ether (C–O–C) at its surface. The XRD pattern showed the amorphous structure of carbon having the 002 and 100 planes, whereas the Raman spectra clearly displayed G and D bands that further confirmed the amorphous nature of carbon. The SEM images displayed the high porosity, and the BET analysis revealed a high surface area of 1376 m 2 g -1 , a pore volume of 1.2 cm 3 g -1 , and a pore size of 4.06 nm with the coexistence of micropores and mesopores. The adsorption of dyes was performed by varying the dye concentration, pH, time, and the sample dose. The maximum percent of RhB dye removal by AC (Db-s) was 98.4% at an aqueous solution of 20 ppm, pH 8.5, an adsorbent dose of 0.03 g, and a time of 5 min. This study proved to be successful in addressing the local problem of wastewater pollution of garment and textile industrial effluents using locally available agro-waste of Dalbergia sisoo. Keywords: activated carbon; Dalbergia sisoo; rhodamine B; contact time; contact temperature; pH 1. Introduction In present days, effluents discharged from various industries, such as textiles, paints, printing, cosmetics, pulp mills, paper, rubber, pharmaceuticals, plastics, foods, and leather, have become a universal problem. These industries extensively use a large volume of dyes and generate plentiful wastewater which pollutes the environment. They have been rated as the most infamous and unadorned pollutants amongst all other sectors owing to the fact that textile industries are the major dye consumers in each of their products [1]. Within dyes, textile dyes are one of the chief components among them [2] and, unfortunately, have a harmful effect on human and animal health [3]. These pollutant dye compounds change the color of water, and it makes the degrading quality of water for both flora and fauna [4]. It is reported that about 100,000 commercial dyes are in industry and larger than 7 × 10 5 tons of dyestuff are produced annually. The issue of enormous amounts of synthetic dyes to the water streams has stood a serious risk to the environment [5]. A very small amounts of dyes in water (less than 1 ppm for some dyes) is highly visible and undesirable [6]. Most dyes molecules are complex and stable and can be resistant to degradation upon contact with water, detergents, or any other thing [7]. In order to remove dyes from wastew- ater, a wide range of techniques, such as adsorption, coagulation and flocculation, biological treatment, ion exchange, membrane filtration chemical oxidation, reverse osmosis, and Nanomaterials 2021, 11, 2217. https://doi.org/10.3390/nano11092217 https://www.mdpi.com/journal/nanomaterials
-
Upload
khangminh22 -
Category
Documents
-
view
1 -
download
0
Transcript of Efficiency of Wood-Dust of Dalbergia sisoo as Low-Cost ...
nanomaterials
Article
Efficiency of Wood-Dust of Dalbergia sisoo as Low-CostAdsorbent for Rhodamine-B Dye Removal
Dibyashree Shrestha
�����������������
Citation: Shrestha, D. Efficiency of
Wood-Dust of Dalbergia sisoo as
Low-Cost Adsorbent for Rhodamine-B
Dye Removal. Nanomaterials 2021, 11,
2217. https://doi.org/10.3390/
nano11092217
Academic Editor: Christos
A. Aggelopoulos
Received: 11 August 2021
Accepted: 19 August 2021
Published: 28 August 2021
Publisher’s Note: MDPI stays neutral
with regard to jurisdictional claims in
published maps and institutional affil-
iations.
Copyright: © 2021 by the author.
Licensee MDPI, Basel, Switzerland.
This article is an open access article
distributed under the terms and
conditions of the Creative Commons
Attribution (CC BY) license (https://
creativecommons.org/licenses/by/
4.0/).
Department of Chemistry, Patan Multiple Campus, Tribhuvan University, Patan Dhoka, Lalitpur 44613, Nepal;[email protected]
Abstract: Wood-dust of Dalbergia sisoo (Sisau) derived activated carbon (AC) was successfully testedas an adsorbent material for the removal of rhodamine B dye from an aqueous solution. The ACwas prepared in a laboratory by the carbonization of wood powder of Dalbergia sisoo at 400 ◦Cin an inert atmosphere of N2, which was chemically activated with H3PO4. Several instrumentaltechniques have been employed to characterize the as-prepared AC (Db-s). Thermogravimetricanalysis (TGA)/differential scanning colorimetry (DSC) confirmed that 400 ◦C was an appropriatetemperature for the carbonization of raw wood powder. The FTIR spectra clearly confirmed thepresence of oxygenated functional groups such as hydroxyl (–OH), aldehyde/ketone (–CHO/C=O)and ether (C–O–C) at its surface. The XRD pattern showed the amorphous structure of carbon havingthe 002 and 100 planes, whereas the Raman spectra clearly displayed G and D bands that furtherconfirmed the amorphous nature of carbon. The SEM images displayed the high porosity, and theBET analysis revealed a high surface area of 1376 m2 g−1, a pore volume of 1.2 cm3 g−1, and a poresize of 4.06 nm with the coexistence of micropores and mesopores. The adsorption of dyes wasperformed by varying the dye concentration, pH, time, and the sample dose. The maximum percentof RhB dye removal by AC (Db-s) was 98.4% at an aqueous solution of 20 ppm, pH 8.5, an adsorbentdose of 0.03 g, and a time of 5 min. This study proved to be successful in addressing the local problemof wastewater pollution of garment and textile industrial effluents using locally available agro-wasteof Dalbergia sisoo.
Keywords: activated carbon; Dalbergia sisoo; rhodamine B; contact time; contact temperature; pH
1. Introduction
In present days, effluents discharged from various industries, such as textiles, paints,printing, cosmetics, pulp mills, paper, rubber, pharmaceuticals, plastics, foods, and leather,have become a universal problem. These industries extensively use a large volume of dyesand generate plentiful wastewater which pollutes the environment. They have been ratedas the most infamous and unadorned pollutants amongst all other sectors owing to the factthat textile industries are the major dye consumers in each of their products [1]. Withindyes, textile dyes are one of the chief components among them [2] and, unfortunately,have a harmful effect on human and animal health [3]. These pollutant dye compoundschange the color of water, and it makes the degrading quality of water for both flora andfauna [4]. It is reported that about 100,000 commercial dyes are in industry and largerthan 7 × 10⁵ tons of dyestuff are produced annually. The issue of enormous amountsof synthetic dyes to the water streams has stood a serious risk to the environment [5].A very small amounts of dyes in water (less than 1 ppm for some dyes) is highly visibleand undesirable [6].
Most dyes molecules are complex and stable and can be resistant to degradation uponcontact with water, detergents, or any other thing [7]. In order to remove dyes from wastew-ater, a wide range of techniques, such as adsorption, coagulation and flocculation, biologicaltreatment, ion exchange, membrane filtration chemical oxidation, reverse osmosis, and
Nanomaterials 2021, 11, 2217. https://doi.org/10.3390/nano11092217 https://www.mdpi.com/journal/nanomaterials
Nanomaterials 2021, 11, 2217 2 of 13
electrochemical processes [8], have been employed. Among all, adsorption technology,being very easy, economical, effective and flexible, has become the most preferred methodsfor the elimination of toxic and hazardous dyes from wastewater.
To greatly decease the cost of activated carbon (AC), various ACs prepared from non-conventional sources, such as coir pith [9], sawdust and rice husk [10], and pinewood [11],applied in the removal of some compounds have also been investigated, and better resultshave been attained.
The yield and absorptive property of AC is increased by using various suitableactivating agents, such as H3PO4, KOH, H2SO4, and Na2CO3. Among them, the ACprepared from H3PO4 has been reported to be the best in terms of active surface areas andporosity and functional groups. In this study, phosphoric acid (H3PO4) has been used as anactivating agent to open pores and enlarge the surface area of AC, so that the adsorptionpower will increase [12]. H3PO4 removes impurities contained in the carbon [13], as a resultof the carbonization process of biomass such as ketones, alcohols, acids, and aldehydes.Moreover, H3PO4 also helps to form a bridge that connects the fragments of biopolymers(layer of carbon structure) by forming phosphate bonds that make pores more open andenlarge the surface area. In the present study, basic/cationic water-soluble dyes rhodamineB (RhB), which is carcinogenic in nature, was selected for the adsorption experiment due toits presence in wastewaters from by-products of several industries such as textile, leather,jute, and food industries.
RhB is an amphoteric dye, listed in the class of the xanthene dye causing harmfuleffects such as acute oral toxicity. When consumed, it causes damage to the eyes or skinirritation and is hazardous to the aquatic organism with long-term effects. Therefore, thetreatment of effluent containing RhB dye becomes paramount before discharging them intowater streams so as to protect the aquatic organism and make the environment safer forthe public [14].
In addition, AC is amongst the most used adsorbents utilized due to its high surfacearea, pore volumes, fast adsorption rate, and high adsorption capacity. Herein, AC fromDalbergia sisoo has been prepared by chemical activation with H3PO4 [15]. The porous prop-erties, chemical functionality, and surface morphology of the prepared ACs are performedby N2 adsorption, FTIR, and SEM [16].
It is found from previous research that ACs modified by different surfactants havedifferent effects on various water qualities of dye wastewater. Therefore, it is necessary todetermine the coexistence of other ions that would affect the adsorption behavior. Mean-while, more information is still required in order to better understand the adsorptionbehavior of RhB cationic dyes on the modified AC. The physical and chemical characteris-tics of RhB is given in Table 1. The aim of this study was to examine the potential of usingthe as-prepared AC from wood powder of Dalbergia sisoo tree as a low-cost adsorbent toremove RhB dye from aqueous solutions using UV-Vis spectrophotometry. The effect ofthe precursor dose and time of adsorption was the central focus of this study.
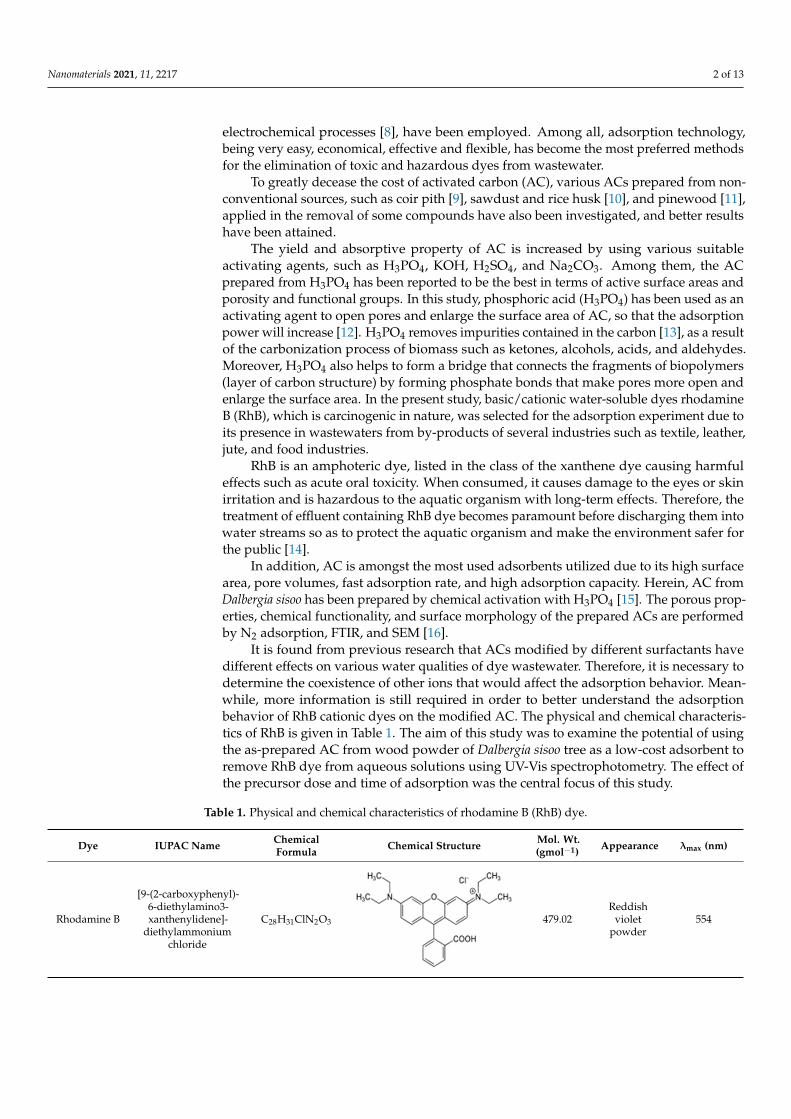
Table 1. Physical and chemical characteristics of rhodamine B (RhB) dye.
Dye IUPAC Name ChemicalFormula Chemical Structure Mol. Wt.
(gmol−1) Appearance λmax (nm)
Rhodamine B
[9-(2-carboxyphenyl)-6-diethylamino3-xanthenylidene]-
diethylammoniumchloride
C28H31ClN2O3
Nanomaterials 2021, 11, x 2 of 14
biological treatment, ion exchange, membrane filtration chemical oxidation, reverse os-mosis, and electrochemical processes [8], have been employed. Among all, adsorption technology, being very easy, economical, effective and flexible, has become the most pre-ferred methods for the elimination of toxic and hazardous dyes from wastewater.
To greatly decease the cost of activated carbon (AC), various ACs prepared from non-conventional sources, such as coir pith [9], sawdust and rice husk [10], and pinewood [11], applied in the removal of some compounds have also been investigated, and better results have been attained.
The yield and absorptive property of AC is increased by using various suitable acti-vating agents, such as H3PO4, KOH, H2SO4, and Na2CO3. Among them, the AC prepared from H3PO4 has been reported to be the best in terms of active surface areas and porosity and functional groups. In this study, phosphoric acid (H3PO4) has been used as an activat-ing agent to open pores and enlarge the surface area of AC, so that the adsorption power will increase [12]. H3PO4 removes impurities contained in the carbon [13], as a result of the carbonization process of biomass such as ketones, alcohols, acids, and aldehydes. Moreover, H3PO4 also helps to form a bridge that connects the fragments of biopolymers (layer of carbon structure) by forming phosphate bonds that make pores more open and enlarge the surface area. In the present study, basic/cationic water-soluble dyes rhoda-mine B (RhB), which is carcinogenic in nature, was selected for the adsorption experiment due to its presence in wastewaters from by-products of several industries such as textile, leather, jute, and food industries.
RhB is an amphoteric dye, listed in the class of the xanthene dye causing harmful effects such as acute oral toxicity. When consumed, it causes damage to the eyes or skin irritation and is hazardous to the aquatic organism with long-term effects. Therefore, the treatment of effluent containing RhB dye becomes paramount before discharging them into water streams so as to protect the aquatic organism and make the environment safer for the public [14].
In addition, AC is amongst the most used adsorbents utilized due to its high surface area, pore volumes, fast adsorption rate, and high adsorption capacity. Herein, AC from Dalbergia sisoo has been prepared by chemical activation with H3PO4 [15]. The porous properties, chemical functionality, and surface morphology of the prepared ACs are per-formed by N2 adsorption, FTIR, and SEM [16].
It is found from previous research that ACs modified by different surfactants have different effects on various water qualities of dye wastewater. Therefore, it is necessary to determine the coexistence of other ions that would affect the adsorption behavior. Mean-while, more information is still required in order to better understand the adsorption be-havior of RhB cationic dyes on the modified AC. The physical and chemical characteristics of RhB is given in Table 1. The aim of this study was to examine the potential of using the as-prepared AC from wood powder of Dalbergia sisoo tree as a low-cost adsorbent to re-move RhB dye from aqueous solutions using UV-Vis spectrophotometry. The effect of the precursor dose and time of adsorption was the central focus of this study.
Table 1. Physical and chemical characteristics of rhodamine B (RhB) dye.
Dye IUPAC Name Chemical Formula Chemical Structure Mol.Wt.
(gmol−1) Appearance λmax (nm)
Rhodamine B
[9-(2-carboxyphenyl)-6-diethylamino3-
xanthenylidene]-diethylammonium
chloride
C28H31ClN2O3
479.02 Reddish
violet powder
554
479.02Reddish
violetpowder
554
Nanomaterials 2021, 11, 2217 3 of 13
2. Materials and Methods2.1. Reagents
All the chemicals used in this study were of analytical grade and were used withoutfurther refinement. Phosphoric acid (85%) was obtained from Fischer Scientific, Pune,Maharashtra, India. Similarly, RhB (98%) was procured from Alfa Aesar A13572 (Haverhill,MA, USA), and aqueous NH3 (30%) were from Baker (Anford, ME, USA). Double-distilledwater was used throughout the experimental work. The wood dust of Dalbergia sisoo (Sisau)was collected from indigenous carpentry/sawmill, Kathmandu, Nepal. A commercialcarbon made from coconut shells having a surface area of 876.02 m2 g−1, a pore size of4.23 nm, and a pore volume of 0.19 cm3 g−1 was also used for comparing the results.
2.2. Methods2.2.1. Preparation of Wood Powder
Wood dust was sun-dried for a few days. Then, a few initial stages were done, suchas crushing, grinding, and sieving. The particle size was controlled by sieving througha 150 µm sized sieve. Thus, the obtained fine wood powder was used as a precursor forthe preparation of AC.
2.2.2. Preparation of AC by the Carbonization Method
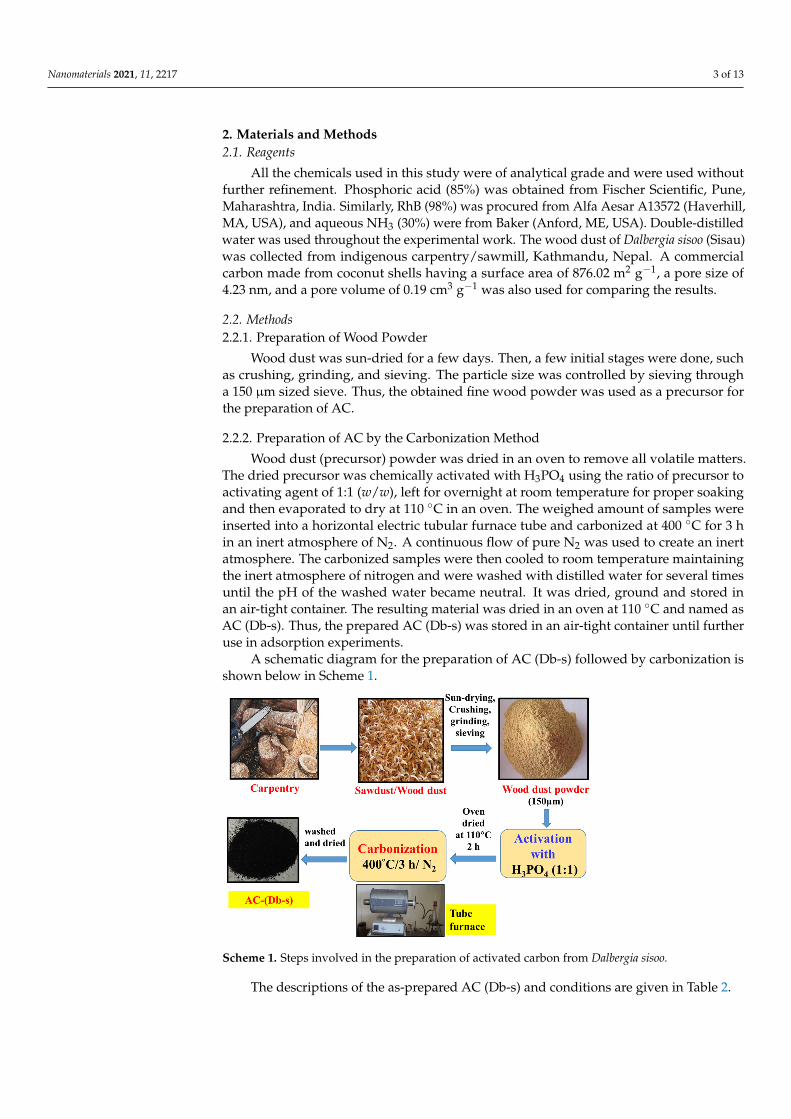
Wood dust (precursor) powder was dried in an oven to remove all volatile matters.The dried precursor was chemically activated with H3PO4 using the ratio of precursor toactivating agent of 1:1 (w/w), left for overnight at room temperature for proper soakingand then evaporated to dry at 110 ◦C in an oven. The weighed amount of samples wereinserted into a horizontal electric tubular furnace tube and carbonized at 400 ◦C for 3 hin an inert atmosphere of N2. A continuous flow of pure N2 was used to create an inertatmosphere. The carbonized samples were then cooled to room temperature maintainingthe inert atmosphere of nitrogen and were washed with distilled water for several timesuntil the pH of the washed water became neutral. It was dried, ground and stored inan air-tight container. The resulting material was dried in an oven at 110 ◦C and named asAC (Db-s). Thus, the prepared AC (Db-s) was stored in an air-tight container until furtheruse in adsorption experiments.
A schematic diagram for the preparation of AC (Db-s) followed by carbonization isshown below in Scheme 1.
Nanomaterials 2021, 11, x 3 of 14
2. Materials and Methods 2.1. Reagents
All the chemicals used in this study were of analytical grade and were used without further refinement. Phosphoric acid (85%) was obtained from Fischer Scientific, Pune, Ma-harashtra, India. Similarly, RhB (98%) was procured from Alfa Aesar A13572 (Haverhill, MA, USA), and aqueous NH3 (30%) were from Baker (Anford, ME, USA). Double-distilled water was used throughout the experimental work. The wood dust of Dalbergia sisoo (Si-sau) was collected from indigenous carpentry/sawmill, Kathmandu, Nepal. A commercial carbon made from coconut shells having a surface area of 876.02 m2 g−1, a pore size of 4.23 nm, and a pore volume of 0.19 cm3 g−1 was also used for comparing the results.
2.2. Methods 2.2.1. Preparation of Wood Powder
Wood dust was sun-dried for a few days. Then, a few initial stages were done, such as crushing, grinding, and sieving. The particle size was controlled by sieving through a 150 µm sized sieve. Thus, the obtained fine wood powder was used as a precursor for the preparation of AC.
2.2.2. Preparation of AC by the Carbonization Method Wood dust (precursor) powder was dried in an oven to remove all volatile matters.
The dried precursor was chemically activated with H3PO4 using the ratio of precursor to activating agent of 1:1 (w/w), left for overnight at room temperature for proper soaking and then evaporated to dry at 110 °C in an oven. The weighed amount of samples were inserted into a horizontal electric tubular furnace tube and carbonized at 400 °C for 3 h in an inert atmosphere of N2. A continuous flow of pure N2 was used to create an inert at-mosphere. The carbonized samples were then cooled to room temperature maintaining the inert atmosphere of nitrogen and were washed with distilled water for several times until the pH of the washed water became neutral. It was dried, ground and stored in an air-tight container. The resulting material was dried in an oven at 110 °C and named as AC (Db-s). Thus, the prepared AC (Db-s) was stored in an air-tight container until further use in adsorption experiments.
A schematic diagram for the preparation of AC (Db-s) followed by carbonization is shown below in Scheme 1.
Scheme 1. Steps involved in the preparation of activated carbon from Dalbergia sisoo.
The descriptions of the as-prepared AC (Db-s) and conditions are given in Table 2.
Scheme 1. Steps involved in the preparation of activated carbon from Dalbergia sisoo.
The descriptions of the as-prepared AC (Db-s) and conditions are given in Table 2.
Nanomaterials 2021, 11, 2217 4 of 13
Table 2. Description and preparation conditions of the sample.
Sample ParticleSize (µm)
ActivatingAgent
H3PO4:WoodPowder Ratio
(w/w)
PreheatingTemperature
(◦C)
CarbonizationTemperature
(◦C)
CarbonizationTime (h) Atmosphere
AC (Db-s) 150 H3PO4 1:1 110 400 3 N2
2.2.3. Characterization Technique of the As-Prepared AC (Db-s)
The moisture content, ash content, volatile matter, and fixed carbon of the precursorwere analyzed by proximate analysis. The pyrolytic behaviors of the raw wood powder ofDalbergia sisoo were investigated by thermogravimetric analysis (TGA)/differential scan-ning colorimetry (DSC; SDT Q600 V20.9 Build 20). The morphology of AC (Db-s) wasdetermined by a scanning electron microscope (Nanoeye, Korea). The phase state was eval-uated by using XRD (Rigaku RINT 2000 diffractometer). Similarly, surface carbon-oxygenfunctional groups present in the samples were identified performing FTIR measurementsusing an FTIR instrument (Bruker, Vertex 70, Germany). The % transmission of the sampleswas recorded between 4000 and 400 cm−1. The presence of the amorphous nature of AC(Db-s) was confirmed by Raman signals obtained by the labRAM HR800 (JOBIN YVON).The surface area, pore size, and pore volume of the AC (Db-s) were measured by BET(Micromeritics ASAP 2020 system).
2.2.4. Methodology of Dye Adsorption
A 20 ppm stock solution of RhB was been prepared by dissolving 0.02 g of the dyeper liter of double-distilled water. At first, a 100 mL RhB dye solution was taken in 250 mLErlenmeyer flasks, and 0.02 g of the as-prepared AC (Db-s) was added and stirred at400 rpm at neutral pH for 5 min on a magnetic stirrer at room temperature. During thestirring period, about 3 mL of the mixture solution were taken in a microcentrifuge tube inevery single minute time interval for 5 times. All the 5 microcentrifuge tubes were thencentrifuged for 5 min to separate the insoluble particles. The agitation speed was keptconstant at 400 rpm.
3. Results and Discussion3.1. Proximate Analysis
The results obtained from the proximate analysis of precursor (wood powder ofDalbergia sisoo) are given in Table 3. The low ash content in the samples indicated that theprecursor contained low inorganic matter, and the low moisture content exhibited the rawmaterial is good for the preparation of AC and the efficiency of reactivation.
Table 3. Proximate analysis of the precursor (wood powder of Dalbergia sisoo).
S.N. Parameter Observed Value (%)
1. Moisture 8.662. Total ash 1.073. Volatile matter 42.274. Total carbon 48.0
3.2. TGA/DSC
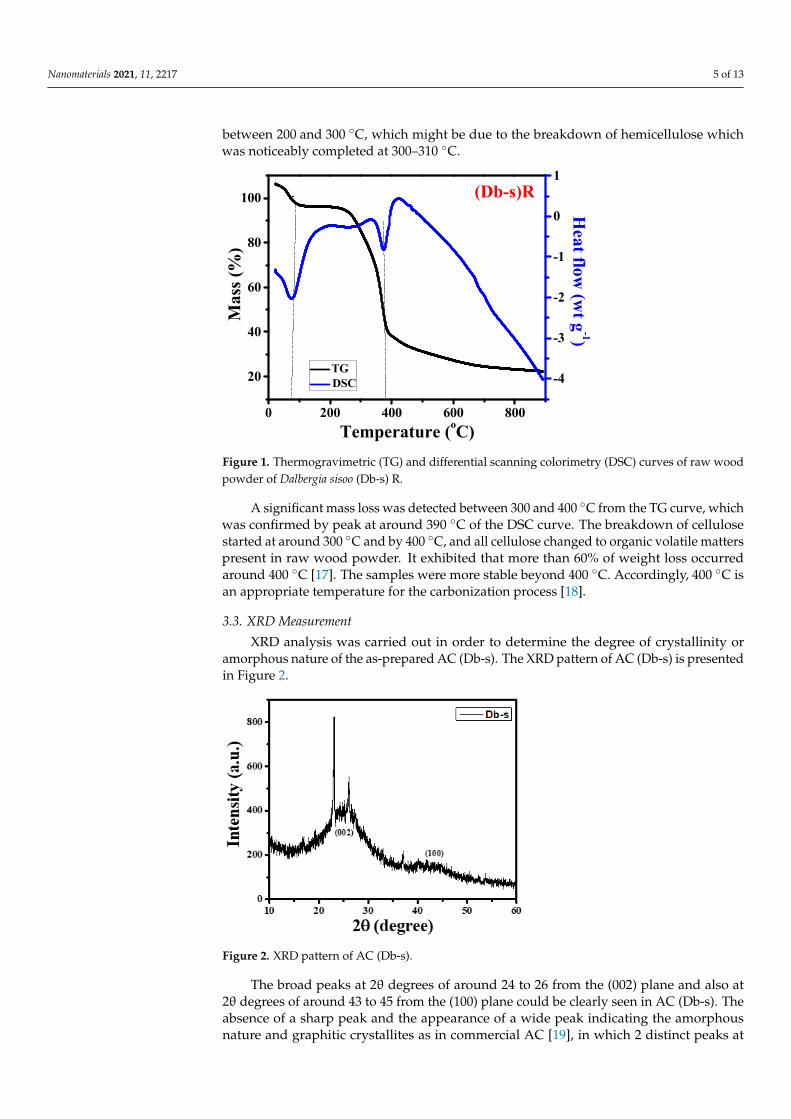
The pyrolytic behavior of the wood powder of Dalbergia sisoo (Sisau) was measuredby TGA/DSC. Figure 1 Illustrates the thermogravimetric (TG) and DSC curves of the rawwood powder of Dalbergia sisoo [(Db-s) R].
A minor mass loss was detected at around 100 ◦C in TG curves which might bedue to dehydration, which was again confirmed by a sharp peak of the DSC curve at100 ◦C. Similarly, at around 200–300 ◦C, there was a contracted peak, which was notclear in the TG plot. However, from the DSC curve, minor mass loss was clearly detected
Nanomaterials 2021, 11, 2217 5 of 13
between 200 and 300 ◦C, which might be due to the breakdown of hemicellulose whichwas noticeably completed at 300–310 ◦C.
Nanomaterials 2021, 11, x 5 of 14
°C, which might be due to the breakdown of hemicellulose which was noticeably completed at 300–310 °C.
A significant mass loss was detected between 300 and 400 °C from the TG curve, which was confirmed by peak at around 390 °C of the DSC curve. The breakdown of cel-lulose started at around 300 °C and by 400 °C, and all cellulose changed to organic volatile matters present in raw wood powder. It exhibited that more than 60% of weight loss oc-curred around 400 °C [17]. The samples were more stable beyond 400 °C. Accordingly, 400 °C is an appropriate temperature for the carbonization process [18].
Figure 1. Thermogravimetric (TG) and differential scanning colorimetry (DSC) curves of raw wood powder of Dalbergia sisoo (Db-s) R.
3.3. XRD Measurement XRD analysis was carried out in order to determine the degree of crystallinity or
amorphous nature of the as-prepared AC (Db-s). The XRD pattern of AC (Db-s) is pre-sented in Figure 2.
0 200 400 600 800
20
40
60
80
100
TG DSC
Temperature (oC)
Mas
s (%
)
-4
-3
-2
-1
0
1
Heat flow
(wt g
-1)(Db-s)R
Figure 1. Thermogravimetric (TG) and differential scanning colorimetry (DSC) curves of raw woodpowder of Dalbergia sisoo (Db-s) R.
A significant mass loss was detected between 300 and 400 ◦C from the TG curve, whichwas confirmed by peak at around 390 ◦C of the DSC curve. The breakdown of cellulosestarted at around 300 ◦C and by 400 ◦C, and all cellulose changed to organic volatile matterspresent in raw wood powder. It exhibited that more than 60% of weight loss occurredaround 400 ◦C [17]. The samples were more stable beyond 400 ◦C. Accordingly, 400 ◦C isan appropriate temperature for the carbonization process [18].
3.3. XRD Measurement
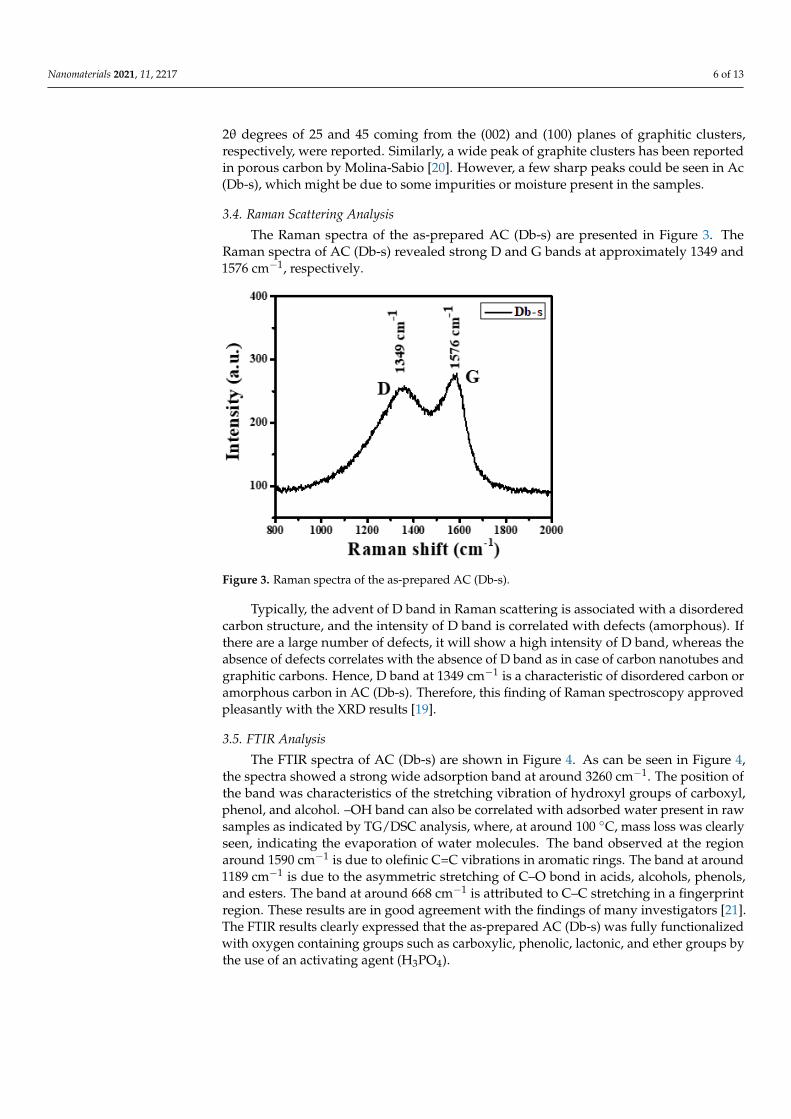
XRD analysis was carried out in order to determine the degree of crystallinity oramorphous nature of the as-prepared AC (Db-s). The XRD pattern of AC (Db-s) is presentedin Figure 2.
Nanomaterials 2021, 11, x 5 of 14
°C, which might be due to the breakdown of hemicellulose which was noticeably completed at 300–310 °C.
A significant mass loss was detected between 300 and 400 °C from the TG curve, which was confirmed by peak at around 390 °C of the DSC curve. The breakdown of cel-lulose started at around 300 °C and by 400 °C, and all cellulose changed to organic volatile matters present in raw wood powder. It exhibited that more than 60% of weight loss oc-curred around 400 °C [17]. The samples were more stable beyond 400 °C. Accordingly, 400 °C is an appropriate temperature for the carbonization process [18].
Figure 1. Thermogravimetric (TG) and differential scanning colorimetry (DSC) curves of raw wood powder of Dalbergia sisoo (Db-s) R.
3.3. XRD Measurement XRD analysis was carried out in order to determine the degree of crystallinity or
amorphous nature of the as-prepared AC (Db-s). The XRD pattern of AC (Db-s) is pre-sented in Figure 2.
0 200 400 600 800
20
40
60
80
100
TG DSC
Temperature (oC)
Mas
s (%
)
-4
-3
-2
-1
0
1
Heat flow
(wt g
-1)
(Db-s)R
Figure 2. XRD pattern of AC (Db-s).
The broad peaks at 2θ degrees of around 24 to 26 from the (002) plane and also at2θ degrees of around 43 to 45 from the (100) plane could be clearly seen in AC (Db-s). Theabsence of a sharp peak and the appearance of a wide peak indicating the amorphousnature and graphitic crystallites as in commercial AC [19], in which 2 distinct peaks at
Nanomaterials 2021, 11, 2217 6 of 13
2θ degrees of 25 and 45 coming from the (002) and (100) planes of graphitic clusters,respectively, were reported. Similarly, a wide peak of graphite clusters has been reportedin porous carbon by Molina-Sabio [20]. However, a few sharp peaks could be seen in Ac(Db-s), which might be due to some impurities or moisture present in the samples.
3.4. Raman Scattering Analysis
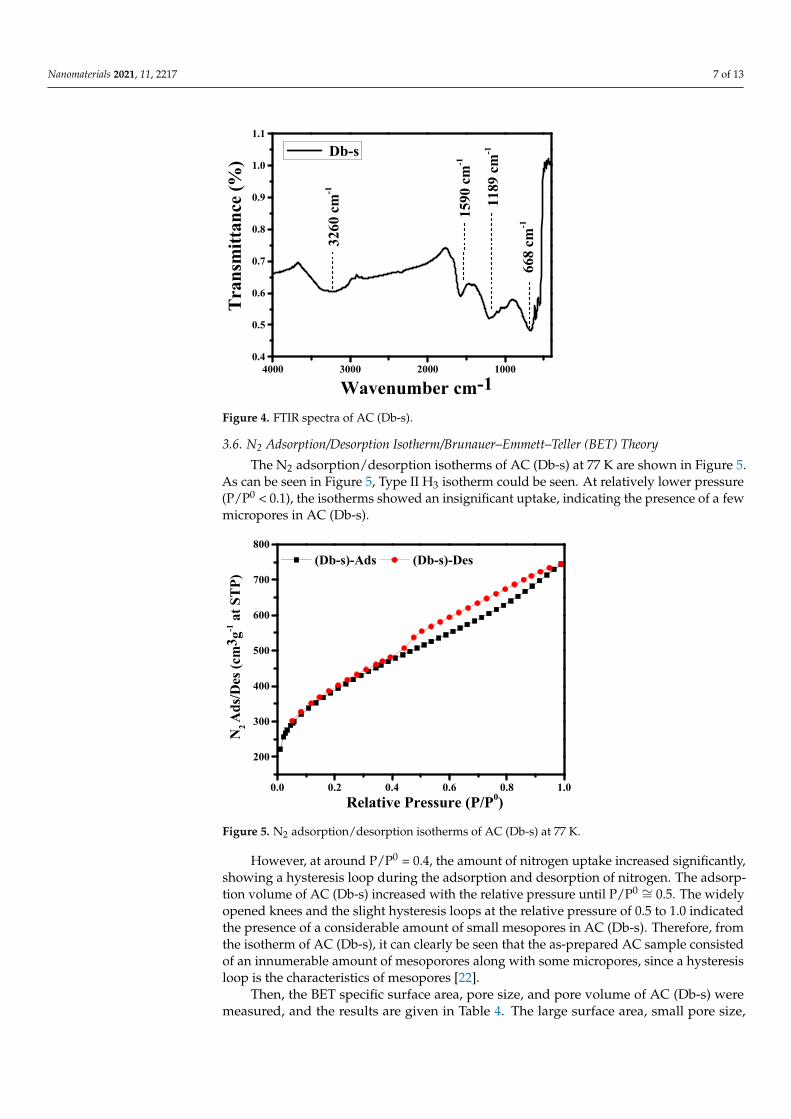
The Raman spectra of the as-prepared AC (Db-s) are presented in Figure 3. TheRaman spectra of AC (Db-s) revealed strong D and G bands at approximately 1349 and1576 cm−1, respectively.
Nanomaterials 2021, 11, x 6 of 14
Figure 2. XRD pattern of AC (Db-s).
The broad peaks at 2θ degrees of around 24 to 26 from the (002) plane and also at 2θ degrees of around 43 to 45 from the (100) plane could be clearly seen in AC (Db-s). The absence of a sharp peak and the appearance of a wide peak indicating the amorphous nature and graphitic crystallites as in commercial AC [19], in which 2 distinct peaks at 2θ degrees of 25 and 45 coming from the (002) and (100) planes of graphitic clusters, respec-tively, were reported. Similarly, a wide peak of graphite clusters has been reported in po-rous carbon by Molina-Sabio [20]. However, a few sharp peaks could be seen in Ac (Db-s), which might be due to some impurities or moisture present in the samples.
3.4. Raman Scattering Analysis The Raman spectra of the as-prepared AC (Db-s) are presented in Figure 3. The Ra-
man spectra of AC (Db-s) revealed strong D and G bands at approximately 1349 and 1576 cm−1, respectively.
Figure 3. Raman spectra of the as-prepared AC (Db-s).
Typically, the advent of D band in Raman scattering is associated with a disordered carbon structure, and the intensity of D band is correlated with defects (amorphous). If there are a large number of defects, it will show a high intensity of D band, whereas the absence of defects correlates with the absence of D band as in case of carbon nanotubes and graphitic carbons. Hence, D band at 1349 cm−1 is a characteristic of disordered carbon or amorphous carbon in AC (Db-s). Therefore, this finding of Raman spectroscopy ap-proved pleasantly with the XRD results [19].
3.5. FTIR Analysis The FTIR spectra of AC (Db-s) are shown in Figure 4. As can be seen in Figure 4, the
spectra showed a strong wide adsorption band at around 3260 cm−1. The position of the band was characteristics of the stretching vibration of hydroxyl groups of carboxyl, phe-nol, and alcohol. –OH band can also be correlated with adsorbed water present in raw samples as indicated by TG/DSC analysis, where, at around 100 °C, mass loss was clearly seen, indicating the evaporation of water molecules. The band observed at the region around 1590 cm−1 is due to olefinic C=C vibrations in aromatic rings. The band at around 1189 cm−1 is due to the asymmetric stretching of C–O bond in acids, alcohols, phenols, and
Figure 3. Raman spectra of the as-prepared AC (Db-s).
Typically, the advent of D band in Raman scattering is associated with a disorderedcarbon structure, and the intensity of D band is correlated with defects (amorphous). Ifthere are a large number of defects, it will show a high intensity of D band, whereas theabsence of defects correlates with the absence of D band as in case of carbon nanotubes andgraphitic carbons. Hence, D band at 1349 cm−1 is a characteristic of disordered carbon oramorphous carbon in AC (Db-s). Therefore, this finding of Raman spectroscopy approvedpleasantly with the XRD results [19].
3.5. FTIR Analysis
The FTIR spectra of AC (Db-s) are shown in Figure 4. As can be seen in Figure 4,the spectra showed a strong wide adsorption band at around 3260 cm−1. The position ofthe band was characteristics of the stretching vibration of hydroxyl groups of carboxyl,phenol, and alcohol. –OH band can also be correlated with adsorbed water present in rawsamples as indicated by TG/DSC analysis, where, at around 100 ◦C, mass loss was clearlyseen, indicating the evaporation of water molecules. The band observed at the regionaround 1590 cm−1 is due to olefinic C=C vibrations in aromatic rings. The band at around1189 cm−1 is due to the asymmetric stretching of C–O bond in acids, alcohols, phenols,and esters. The band at around 668 cm−1 is attributed to C–C stretching in a fingerprintregion. These results are in good agreement with the findings of many investigators [21].The FTIR results clearly expressed that the as-prepared AC (Db-s) was fully functionalizedwith oxygen containing groups such as carboxylic, phenolic, lactonic, and ether groups bythe use of an activating agent (H3PO4).
Nanomaterials 2021, 11, 2217 7 of 13
Nanomaterials 2021, 11, x 7 of 14
esters. The band at around 668 cm−1 is attributed to C–C stretching in a fingerprint region. These results are in good agreement with the findings of many investigators [21]. The FTIR results clearly expressed that the as-prepared AC (Db-s) was fully functionalized with oxygen containing groups such as carboxylic, phenolic, lactonic, and ether groups by the use of an activating agent (H3PO4).
Figure 4. FTIR spectra of AC (Db-s).
3.6. N2 Adsorption/Desorption Isotherm/Brunauer–Emmett–Teller (BET) Theory The N2 adsorption/desorption isotherms of AC (Db-s) at 77 K are shown in Figure 5.
As can be seen in Figure 5, Type II H3 isotherm could be seen. At relatively lower pressure (P/P0 < 0.1), the isotherms showed an insignificant uptake, indicating the presence of a few micropores in AC (Db-s).
Figure 5. N2 adsorption/desorption isotherms of AC (Db-s) at 77 K.
4000 3000 2000 10000.4
0.5
0.6
0.7
0.8
0.9
1.0
1.1
668
cm-1
3260
cm
-1
1189
cm
-1
1590
cm
-1
Wavenumber cm-1
Tran
smitt
ance
(%)
Db-s
0.0 0.2 0.4 0.6 0.8 1.0
200
300
400
500
600
700
800 (Db-s)-Ads (Db-s)-Des
Relative Pressure (P/P0)
N2 A
ds/D
es (c
m3 g
-1 a
t STP
)
Figure 4. FTIR spectra of AC (Db-s).
3.6. N2 Adsorption/Desorption Isotherm/Brunauer–Emmett–Teller (BET) Theory
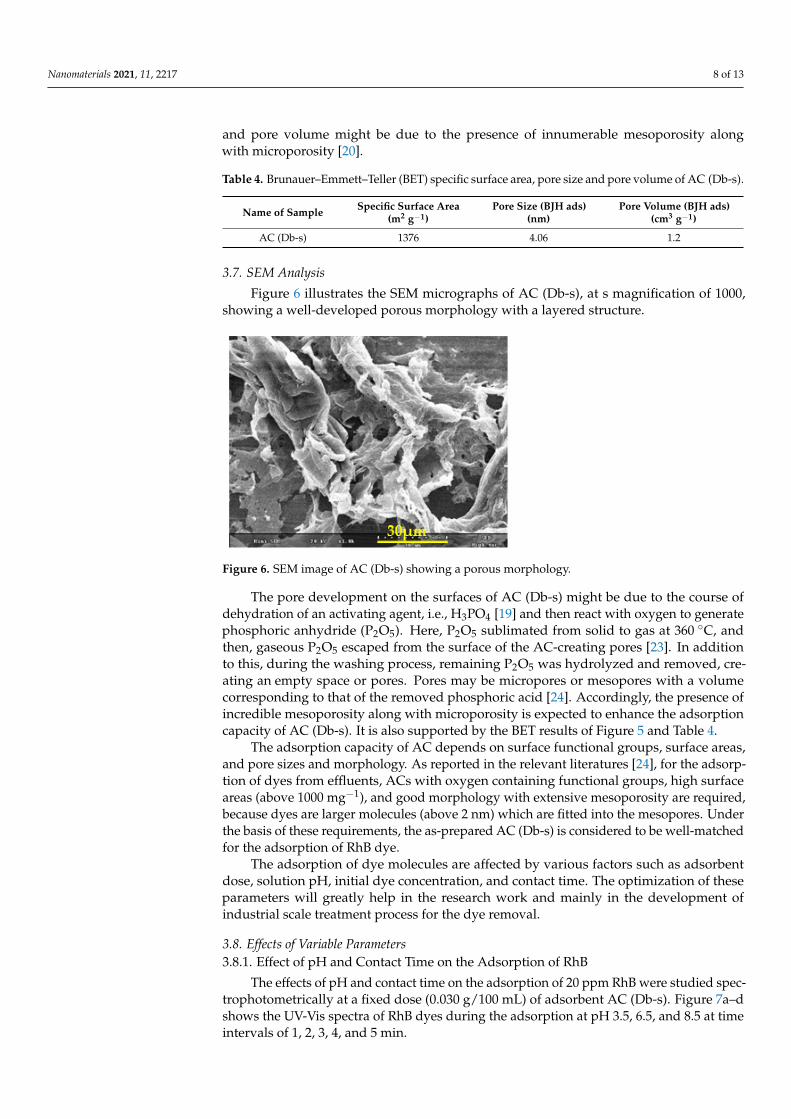
The N2 adsorption/desorption isotherms of AC (Db-s) at 77 K are shown in Figure 5.As can be seen in Figure 5, Type II H3 isotherm could be seen. At relatively lower pressure(P/P0 < 0.1), the isotherms showed an insignificant uptake, indicating the presence of a fewmicropores in AC (Db-s).
Nanomaterials 2021, 11, x 7 of 14
esters. The band at around 668 cm−1 is attributed to C–C stretching in a fingerprint region. These results are in good agreement with the findings of many investigators [21]. The FTIR results clearly expressed that the as-prepared AC (Db-s) was fully functionalized with oxygen containing groups such as carboxylic, phenolic, lactonic, and ether groups by the use of an activating agent (H3PO4).
Figure 4. FTIR spectra of AC (Db-s).
3.6. N2 Adsorption/Desorption Isotherm/Brunauer–Emmett–Teller (BET) Theory The N2 adsorption/desorption isotherms of AC (Db-s) at 77 K are shown in Figure 5.
As can be seen in Figure 5, Type II H3 isotherm could be seen. At relatively lower pressure (P/P0 < 0.1), the isotherms showed an insignificant uptake, indicating the presence of a few micropores in AC (Db-s).
Figure 5. N2 adsorption/desorption isotherms of AC (Db-s) at 77 K.
4000 3000 2000 10000.4
0.5
0.6
0.7
0.8
0.9
1.0
1.1
668
cm-1
3260
cm
-1
1189
cm
-1
1590
cm
-1
Wavenumber cm-1
Tran
smitt
ance
(%)
Db-s
0.0 0.2 0.4 0.6 0.8 1.0
200
300
400
500
600
700
800 (Db-s)-Ads (Db-s)-Des
Relative Pressure (P/P0)
N2 A
ds/D
es (c
m3 g
-1 a
t STP
)
Figure 5. N2 adsorption/desorption isotherms of AC (Db-s) at 77 K.
However, at around P/P0 = 0.4, the amount of nitrogen uptake increased significantly,showing a hysteresis loop during the adsorption and desorption of nitrogen. The adsorp-tion volume of AC (Db-s) increased with the relative pressure until P/P0 ∼= 0.5. The widelyopened knees and the slight hysteresis loops at the relative pressure of 0.5 to 1.0 indicatedthe presence of a considerable amount of small mesopores in AC (Db-s). Therefore, fromthe isotherm of AC (Db-s), it can clearly be seen that the as-prepared AC sample consistedof an innumerable amount of mesoporores along with some micropores, since a hysteresisloop is the characteristics of mesopores [22].
Then, the BET specific surface area, pore size, and pore volume of AC (Db-s) weremeasured, and the results are given in Table 4. The large surface area, small pore size,
Nanomaterials 2021, 11, 2217 8 of 13
and pore volume might be due to the presence of innumerable mesoporosity alongwith microporosity [20].
Table 4. Brunauer–Emmett–Teller (BET) specific surface area, pore size and pore volume of AC (Db-s).
Name of Sample Specific Surface Area(m2 g−1)
Pore Size (BJH ads)(nm)
Pore Volume (BJH ads)(cm3 g−1)
AC (Db-s) 1376 4.06 1.2
3.7. SEM Analysis
Figure 6 illustrates the SEM micrographs of AC (Db-s), at s magnification of 1000,showing a well-developed porous morphology with a layered structure.
Nanomaterials 2021, 11, x 8 of 14
However, at around P/P0 = 0.4, the amount of nitrogen uptake increased significantly, showing a hysteresis loop during the adsorption and desorption of nitrogen. The adsorp-tion volume of AC (Db-s) increased with the relative pressure until P/P0 ≅ 0.5. The widely opened knees and the slight hysteresis loops at the relative pressure of 0.5 to 1.0 indicated the presence of a considerable amount of small mesopores in AC (Db-s). Therefore, from the isotherm of AC (Db-s), it can clearly be seen that the as-prepared AC sample consisted of an innumerable amount of mesoporores along with some micropores, since a hysteresis loop is the characteristics of mesopores [22].
Then, the BET specific surface area, pore size, and pore volume of AC (Db-s) were measured, and the results are given in Table 4. The large surface area, small pore size, and pore volume might be due to the presence of innumerable mesoporosity along with mi-croporosity [20].
Table 4. Brunauer–Emmett–Teller (BET) specific surface area, pore size and pore volume of AC (Db-s).
Name of Sample
Specific Surface Area (m2 g−1)
Pore Size (BJH ads) (nm)
Pore Volume (BJH ads) (cm3 g−1)
AC (Db-s) 1376 4.06 1.2
3.7. SEM Analysis Figure 6 illustrates the SEM micrographs of AC (Db-s), at s magnification of 1000,
showing a well-developed porous morphology with a layered structure.
Figure 6. SEM image of AC (Db-s) showing a porous morphology.
The pore development on the surfaces of AC (Db-s) might be due to the course of dehydration of an activating agent, i.e., H3PO4 [19] and then react with oxygen to generate phosphoric anhydride (P2O5). Here, P2O5 sublimated from solid to gas at 360 °C, and then, gaseous P2O5 escaped from the surface of the AC-creating pores [23]. In addition to this, during the washing process, remaining P2O5 was hydrolyzed and removed, creating an empty space or pores. Pores may be micropores or mesopores with a volume correspond-ing to that of the removed phosphoric acid [24]. Accordingly, the presence of incredible mesoporosity along with microporosity is expected to enhance the adsorption capacity of AC (Db-s). It is also supported by the BET results of Figure 5 and Table 4.
The adsorption capacity of AC depends on surface functional groups, surface areas, and pore sizes and morphology. As reported in the relevant literatures [24], for the ad-sorption of dyes from effluents, ACs with oxygen containing functional groups, high sur-face areas (above 1000 mg−1), and good morphology with extensive mesoporosity are re-quired, because dyes are larger molecules (above 2 nm) which are fitted into the
Figure 6. SEM image of AC (Db-s) showing a porous morphology.
The pore development on the surfaces of AC (Db-s) might be due to the course ofdehydration of an activating agent, i.e., H3PO4 [19] and then react with oxygen to generatephosphoric anhydride (P2O5). Here, P2O5 sublimated from solid to gas at 360 ◦C, andthen, gaseous P2O5 escaped from the surface of the AC-creating pores [23]. In additionto this, during the washing process, remaining P2O5 was hydrolyzed and removed, cre-ating an empty space or pores. Pores may be micropores or mesopores with a volumecorresponding to that of the removed phosphoric acid [24]. Accordingly, the presence ofincredible mesoporosity along with microporosity is expected to enhance the adsorptioncapacity of AC (Db-s). It is also supported by the BET results of Figure 5 and Table 4.
The adsorption capacity of AC depends on surface functional groups, surface areas,and pore sizes and morphology. As reported in the relevant literatures [24], for the adsorp-tion of dyes from effluents, ACs with oxygen containing functional groups, high surfaceareas (above 1000 mg−1), and good morphology with extensive mesoporosity are required,because dyes are larger molecules (above 2 nm) which are fitted into the mesopores. Underthe basis of these requirements, the as-prepared AC (Db-s) is considered to be well-matchedfor the adsorption of RhB dye.
The adsorption of dye molecules are affected by various factors such as adsorbentdose, solution pH, initial dye concentration, and contact time. The optimization of theseparameters will greatly help in the research work and mainly in the development ofindustrial scale treatment process for the dye removal.
3.8. Effects of Variable Parameters3.8.1. Effect of pH and Contact Time on the Adsorption of RhB
The effects of pH and contact time on the adsorption of 20 ppm RhB were studied spec-trophotometrically at a fixed dose (0.030 g/100 mL) of adsorbent AC (Db-s). Figure 7a–dshows the UV-Vis spectra of RhB dyes during the adsorption at pH 3.5, 6.5, and 8.5 at timeintervals of 1, 2, 3, 4, and 5 min.
Nanomaterials 2021, 11, 2217 9 of 13
Nanomaterials 2021, 11, x 9 of 14
mesopores. Under the basis of these requirements, the as-prepared AC (Db-s) is consid-ered to be well-matched for the adsorption of RhB dye.
The adsorption of dye molecules are affected by various factors such as adsorbent dose, solution pH, initial dye concentration, and contact time. The optimization of these parameters will greatly help in the research work and mainly in the development of in-dustrial scale treatment process for the dye removal.
3.8. Effects of Variable Parameters 3.8.1. Effect of pH and Contact Time on the Adsorption of RhB
The effects of pH and contact time on the adsorption of 20 ppm RhB were studied spectrophotometrically at a fixed dose (0.030g/100mL) of adsorbent AC (Db-s). Figure 7a–d shows the UV-Vis spectra of RhB dyes during the adsorption at pH 3.5, 6.5, and 8.5 at time intervals of 1, 2, 3, 4, and 5 min.
(a) (b)
(c) (d)
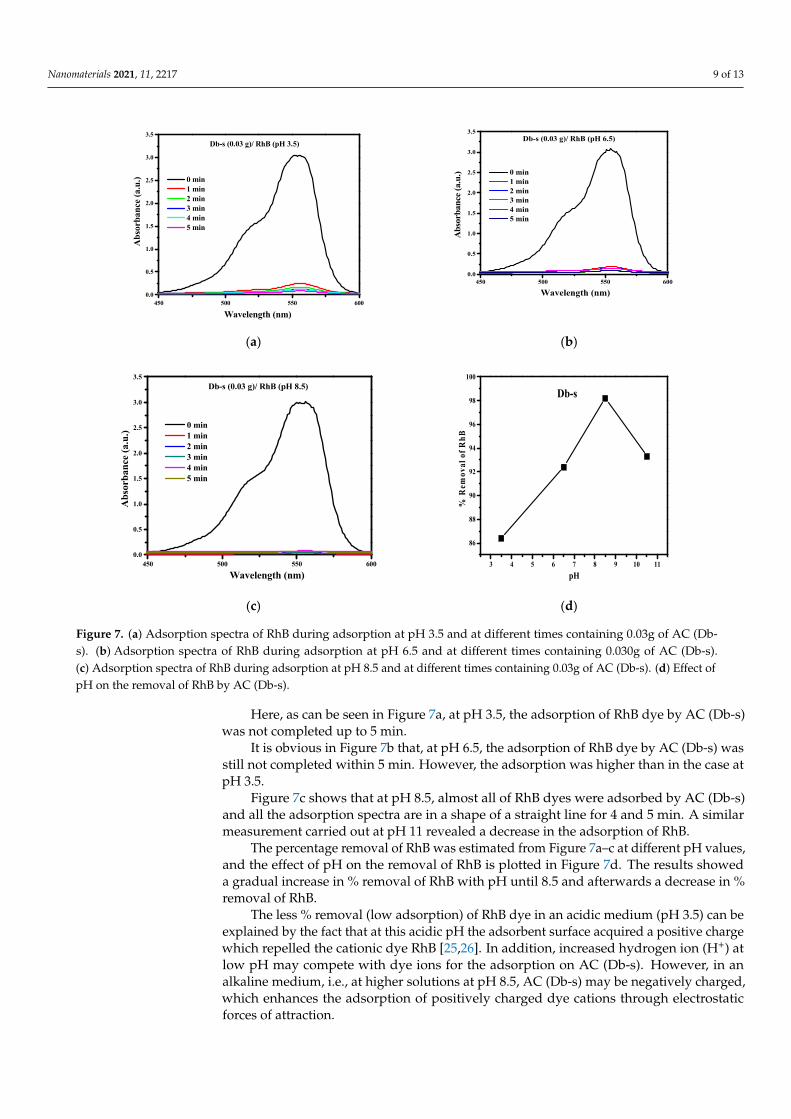
Figure 7. (a) Adsorption spectra of RhB during adsorption at pH 3.5 and at different times containing 0.03g of AC (Db-s). (b) Adsorption spectra of RhB during adsorption at pH 6.5 and at different times containing 0.030g of AC (Db-s). (c) Adsorption spectra of RhB during adsorption at pH 8.5 and at different times containing 0.03g of AC (Db-s). (d) Effect of pH on the removal of RhB by AC (Db-s).
Here, as can be seen in Figure 7a, at pH 3.5, the adsorption of RhB dye by AC (Db-s) was not completed up to 5 min.
It is obvious in Figure 7b that, at pH 6.5, the adsorption of RhB dye by AC (Db-s) was still not completed within 5 min. However, the adsorption was higher than in the case at pH 3.5.
450 500 550 6000.0
0.5
1.0
1.5
2.0
2.5
3.0
3.5
Wavelength (nm)
Abs
orba
nce (
a.u.
)Db-s (0.03 g)/ RhB (pH 3.5)
0 min 1 min 2 min 3 min 4 min 5 min
450 500 550 6000.0
0.5
1.0
1.5
2.0
2.5
3.0
3.5
Wavelength (nm)
Abs
orba
nce (
a.u.
)
0 min 1 min 2 min 3 min 4 min 5 min
Db-s (0.03 g)/ RhB (pH 6.5)
450 500 550 6000.0
0.5
1.0
1.5
2.0
2.5
3.0
3.5
Abs
orba
nce
(a.u
.)
Wavelength (nm)
0 min 1 min 2 min 3 min 4 min 5 min
Db-s (0.03 g)/ RhB (pH 8.5)
3 4 5 6 7 8 9 10 11
86
88
90
92
94
96
98
100
% R
emov
al o
f RhB
pH
Db-s
Figure 7. (a) Adsorption spectra of RhB during adsorption at pH 3.5 and at different times containing 0.03g of AC (Db-s). (b) Adsorption spectra of RhB during adsorption at pH 6.5 and at different times containing 0.030g of AC (Db-s).(c) Adsorption spectra of RhB during adsorption at pH 8.5 and at different times containing 0.03g of AC (Db-s). (d) Effect ofpH on the removal of RhB by AC (Db-s).
Here, as can be seen in Figure 7a, at pH 3.5, the adsorption of RhB dye by AC (Db-s)was not completed up to 5 min.
It is obvious in Figure 7b that, at pH 6.5, the adsorption of RhB dye by AC (Db-s) wasstill not completed within 5 min. However, the adsorption was higher than in the case atpH 3.5.
Figure 7c shows that at pH 8.5, almost all of RhB dyes were adsorbed by AC (Db-s)and all the adsorption spectra are in a shape of a straight line for 4 and 5 min. A similarmeasurement carried out at pH 11 revealed a decrease in the adsorption of RhB.
The percentage removal of RhB was estimated from Figure 7a–c at different pH values,and the effect of pH on the removal of RhB is plotted in Figure 7d. The results showeda gradual increase in % removal of RhB with pH until 8.5 and afterwards a decrease in %removal of RhB.
The less % removal (low adsorption) of RhB dye in an acidic medium (pH 3.5) can beexplained by the fact that at this acidic pH the adsorbent surface acquired a positive chargewhich repelled the cationic dye RhB [25,26]. In addition, increased hydrogen ion (H+) atlow pH may compete with dye ions for the adsorption on AC (Db-s). However, in analkaline medium, i.e., at higher solutions at pH 8.5, AC (Db-s) may be negatively charged,which enhances the adsorption of positively charged dye cations through electrostaticforces of attraction.
Nanomaterials 2021, 11, 2217 10 of 13
RhB is an aromatic amino acid with amphoteric characteristics due to the presenceof both the amino group (–NHR2) and the carboxyl group (–COOH). Thus, the chargestate of RhB is dependent on the solution pH. When the pH increases higher than 8.5, theionization of the carboxyl group takes place which is attracted to positive charges on thexanthane group and the zwitterions form of RhB is formed. The zwitterions form of RhBin water may increase the dimerization of RhB, which makes the molecule too large toenter most of the pore structure of AC. The inaccessibility to the pore structure of AC,which is smaller than the dimer’s effective size, results in a decrease in RhB removal atpH above 8.5. The variation of the RhB removal with the solution pH is similar to thatreported previously [27–30].
Figure 7a–d reveals that the initial adsorption percentage of dyes was quite rapid.Almost 80% of the dyes were adsorbed within a single minute. Then, the adsorptionprocess was more or less constant up to 5 min. This is probably due to a high surface areaof 1376 m2 g−1 with extensive mesoporosity in AC (Db-s). Highly developed mesoporousACs are favorable for the adsorption of larger molecules such as dyes [27]. This might bedue to the fact that initially all the sites of the AC samples were vacant and available fordye molecules to get occupied. Later, the percentage removal/adsorption rate of dye wasdecreased significantly, resulting from the saturation of dye molecules on the surfaces ofthe AC samples.
3.8.2. Optimization of the Dose of AC (Db-s)
The efficiency of adsorbent doses on the RhB dye adsorption is reported by manyresearchers to determine the most economical minimum dosage. In general, the dyeremoval percentage increases with the increase of the adsorbent dosage [28].
Here, various doses of adsorbent AC (Db-s) were mixed with a fixed amount of dyesolutions, and the mixture was agitated in a mechanical shaker. The adsorption capacitiesfor different doses were determined at 1 min interval till 5 min by keeping all otherfactors constant.
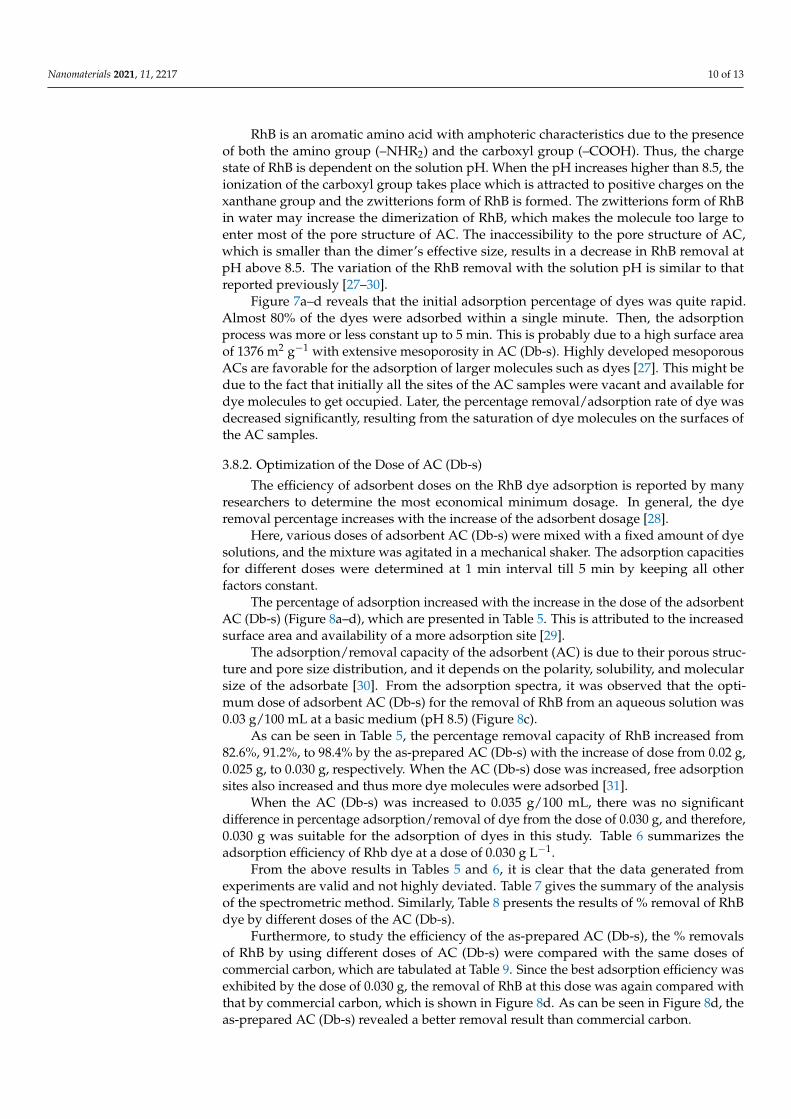
The percentage of adsorption increased with the increase in the dose of the adsorbentAC (Db-s) (Figure 8a–d), which are presented in Table 5. This is attributed to the increasedsurface area and availability of a more adsorption site [29].
The adsorption/removal capacity of the adsorbent (AC) is due to their porous struc-ture and pore size distribution, and it depends on the polarity, solubility, and molecularsize of the adsorbate [30]. From the adsorption spectra, it was observed that the opti-mum dose of adsorbent AC (Db-s) for the removal of RhB from an aqueous solution was0.03 g/100 mL at a basic medium (pH 8.5) (Figure 8c).
As can be seen in Table 5, the percentage removal capacity of RhB increased from82.6%, 91.2%, to 98.4% by the as-prepared AC (Db-s) with the increase of dose from 0.02 g,0.025 g, to 0.030 g, respectively. When the AC (Db-s) dose was increased, free adsorptionsites also increased and thus more dye molecules were adsorbed [31].
When the AC (Db-s) was increased to 0.035 g/100 mL, there was no significantdifference in percentage adsorption/removal of dye from the dose of 0.030 g, and therefore,0.030 g was suitable for the adsorption of dyes in this study. Table 6 summarizes theadsorption efficiency of Rhb dye at a dose of 0.030 g L−1.
From the above results in Tables 5 and 6, it is clear that the data generated fromexperiments are valid and not highly deviated. Table 7 gives the summary of the analysisof the spectrometric method. Similarly, Table 8 presents the results of % removal of RhBdye by different doses of the AC (Db-s).
Furthermore, to study the efficiency of the as-prepared AC (Db-s), the % removalsof RhB by using different doses of AC (Db-s) were compared with the same doses ofcommercial carbon, which are tabulated at Table 9. Since the best adsorption efficiency wasexhibited by the dose of 0.030 g, the removal of RhB at this dose was again compared withthat by commercial carbon, which is shown in Figure 8d. As can be seen in Figure 8d, theas-prepared AC (Db-s) revealed a better removal result than commercial carbon.
Nanomaterials 2021, 11, 2217 11 of 13
Nanomaterials 2021, 11, x 12 of 14
(a) (b)
(c) (d)
Figure 8. (a) RhB dye adsorption by AC (Db-s) at a dose of 0.02 g; (b) RhB dye adsorption by AC (Db-s) at a dose of 0.025 g; (c) RhB dye adsorption by AC (Db-s) at a dose of 0.03 g; (d) comparison of the % removals of RhB by AC (Db-s) and commercial carbon (at 0.030 g).
Table 8. Percentage of RhB dye adsorbed by different doses of the as-prepared AC (Db-s).
S.N. Dye Adsorbent Dose
Result 0.020 mg 0.025 mg 0.030 mg 0.035 mg
1 RhB 83.1 91.2 98.4 98.4 No effect after
0.035 mg
Furthermore, to study the efficiency of the as-prepared AC (Db-s), the % removals of RhB by using different doses of AC (Db-s) were compared with the same doses of com-mercial carbon, which are tabulated at Table 9. Since the best adsorption efficiency was exhibited by the dose of 0.030 g, the removal of RhB at this dose was again compared with that by commercial carbon, which is shown in Figure 8d. As can be seen in Figure 8d, the as-prepared AC (Db-s) revealed a better removal result than commercial carbon.
Table 9. Details of the comparison of the % removal of RhB dye using different doses of AC (Db-s) and commercial carbon.
450 500 550 6000.0
0.5
1.0
1.5
2.0
2.5
3.0
3.5
0 min 1 min 2 min 3 min 4 min 5 min
Db-s (0.02 g)/ RhB (pH 8.5)
Abs
orba
nce
(a.u
.)
Wavelength (nm)450 500 550 600
0.0
0.5
1.0
1.5
2.0
2.5
3.0
3.5
Wavelength (nm)
Abs
orba
nce
(a.u
.)
0 min 1 min 2 min 3 min 4 min 5 min
Db-s (0.025 g)/ RhB (pH 8.5)
450 500 550 6000.0
0.5
1.0
1.5
2.0
2.5
3.0
3.5
Wavelength (nm)
Abs
orba
nce
(a.u
.)
0 min 1 min 2 min 3 min 4 min 5 min
Db-s (0.03 g)/ RhB (pH 8.5)
0.020 0.022 0.024 0.026 0.028 0.03060
65
70
75
80
85
90
95
100
Db-s Com-c
Dosage of adsorbents (g/L)
% R
emov
al o
f RhB
Figure 8. (a) RhB dye adsorption by AC (Db-s) at a dose of 0.02 g; (b) RhB dye adsorption by AC(Db-s) at a dose of 0.025 g; (c) RhB dye adsorption by AC (Db-s) at a dose of 0.03 g; (d) comparison ofthe % removals of RhB by AC (Db-s) and commercial carbon (at 0.030 g).
Table 5. Adsorption efficiency of RhB dye with the surface area, pH, and doses of the samples and adsorption capacity in 5 min.
S.N. Surface Area (m2 g−1) Number of Adsorption Dose (g L−1) Initial Conc.(ppm) Adsorption Capacity (%) D@A=
1
1376
A1 0.015
20
81.5 1.2252 A2 0.020 83.1 1.6623 A3 0.025 91.2 2.284 A4 0.030 98.4 2.9525 A5 0.035 98.4 3.444
Table 6. Adsorption efficiency of RhB dye at a dose of 0.030 g L−1.
S.N. No. of Adsorption (N) Dose (g L−1) Initial Concentration(ppm)
Adsorption Capacity (%)(X) X − µ (X − µ)2
1 A1
0.030 20
98.4 98.4 − 98.36 = −0.04 0.00162 A2 98.2 98.2 − 98.36 = −0.16 0.02563 A3 98.5 98.5 − 98.36 = 0.14 0.01964 A4 98.4 98.4 − 98.36 = 0.04 0.00165 A5 98.3 98.3 − 98.36 = 0.06 0.0036
Table 7. Accuracy and precision of the spectrometric method for the determinations of RhB dye.
S.N. Surface Area (m2 g−1) Dose Taken (µmg L−1) Dose Found (µmg L−1) Mean StandardDeviation (%)
Relative StandardDeviation (%)
1
1376
15 14.78 ± 0.226 98.5 1.52 20 19. 84 ± 0.157 99.2 0.83 25 24.87 ± 0.126 99.5 0.54 30 29.99 ± 0.015 99.9 0.15 35 39.99 ± 0.012 99.9 0.1
Nanomaterials 2021, 11, 2217 12 of 13
Table 8. Percentage of RhB dye adsorbed by different doses of the as-prepared AC (Db-s).
S.N. DyeAdsorbent Dose
Result0.020 mg 0.025 mg 0.030 mg 0.035 mg
1 RhB 83.1 91.2 98.4 98.4 No effect after 0.035 mg
Table 9. Details of the comparison of the % removal of RhB dye using different doses of AC (Db-s) and commercial carbon.
Surfactant Surface Area (m2 g−1) Dye pH Initial Conc. (ppm) Dosage (g L−1) Time (min) % Removal
Db-s 1376 RhB 8.5 200.020
583.1
0.025 91.20.030 98.4
Com. C 876.02 RhB 8.5 200.020
564.4
0.025 840.030 95
4. Conclusions
From the results on the removal of RhB dye, from agro waste of Dalbergia sisoo in thisstudy, the following conclusions can be drawn:
1. AC was successfully prepared from the agro waste of Dalbergia sisoo by activatingwith H3PO4 followed by carbonization at 400 ◦C.
2. BET measurements showed the formation of a mesoporous structure with an activesurface area of 1376 m2 g−1, a pore volume of 1.2 cm3 g−1, and a pore size of 4.06 nm.
3. AC (Db-s) was found to possess the best adsorption capacity at pH 8.5 and a doseof 0.030 g. Under this condition, 98.4% of 20 ppm of RhB dye was removed froman aqueous solution within 5 min.
4. The results revealed that laboratory prepared phosphoric acid AC derived fromagro waste such as wood dust of Dalbergia sisoo can be converted into value-addedmaterials for the removal of toxic dyes such as RhB.
Funding: This research received no external funding.
Institutional Review Board Statement: Not applicable.
Informed Consent Statement: Not applicable.
Data Availability Statement: Data can be made available upon request.
Acknowledgments: Dibyashree Shrestha is thankful to Patan Multiple Campus, Tribhuvan Univer-sity, Patan Dhoka, lalitpur and Central Department of Chemistry, Tribhuvan University, Kathmandu,Nepal, and Global Research Laboratory, Sun Moon University, South Korea for their support to carryout this research.
Conflicts of Interest: The author declares no conflict of interest.
References1. Javaid, A.; Bajwa, R.; Shafique, U.; Anwar, J. Removal of heavy metals by adsorption on Pleurotus ostreatus. Biomass Bioenergy
2011, 35, 1675–1682. [CrossRef]2. Ding, L.; Zou, B.; Gao, W.; Liu, Q.; Wang, Z.; Guo, Y.; Wang, X.; Liu, Y. Adsorption of Rhodamine-B from aqueous solution using
treated rice husk-based activated carbon. Colloids Surf. A Physicochem. Eng. Asp. 2014, 446, 1–7. [CrossRef]3. Geçgel, Ü.; Üner, O.; Gökara, G.; Bayrak, Y. Adsorption of cationic dyes on activated carbon obtained from waste Elaeagnus stone.
Adsorpt. Sci. Technol. 2016, 34, 512–525. [CrossRef]4. Tang, L.; Cai, Y.; Yang, G.; Liu, Y.; Zeng, G.; Zhou, Y.; Li, S.; Wang, J.; Zhang, S.; Fang, Y.; et al. Cobalt nanoparticles-
embedded magnetic ordered mesoporous carbon for highly effective adsorption of rhodamine B. Appl. Surf. Sci. 2014, 314,746–753. [CrossRef]
5. Lacerda, V.D.S.; López-Sotelo, J.B.; Correa-Guimarães, A.; Hernández-Navarro, S.; Bascones, M.S.; Gracia, L.M.N.;Martín-Ramos, P.; Martín-Gil, J. Rhodamine B removal with activated carbons obtained from lignocellulosic waste.J. Environ. Manag. 2015, 155, 67–76. [CrossRef] [PubMed]
6. Laasri, L.; Elamrani, M.K.; Cherkaoui, O. Removal of two cationic dyes from a textile effluent by filtration-adsorption on woodsawdust. Environ. Sci. Pollut. Res. 2007, 14, 237–240. [CrossRef] [PubMed]
Nanomaterials 2021, 11, 2217 13 of 13
7. Adegoke, K.A.; Bello, O.S. Dye sequestration using agricultural wastes as adsorbents. Water Resour. Ind. 2015, 12, 8–24. [CrossRef]8. Inyinbor, A.A.; Adekola, F.A.; Olatunji, A.G. Adsorption of Rhodamine B dye from aqueous solution on Irvingia gabonensis
biomass: Kinetics and thermodynamics studies. S. Afr. J. Chem. 2015, 68, 115–125. [CrossRef]9. Dahri, M.K.; Kooh, M.R.R.; Lim, L.B.L. Remediation of Rhodamine B Dye from Aqueous Solution Using Casuarina equisetifolia
Cone Powder as a Low-Cost Adsorbent. Adv. Phys. Chem. 2016, 2016, 9497378. [CrossRef]10. Lim, L.B.L.; Priyantha, N.; Fang, X.Y.; Mohamad Zaidi, N.A.H. Artocarpusodoratissimus peel as a potential adsorbent in
environmental remediation to remove toxic Rhodamine B dye. J. Mater. Environ. Sci. 2017, 8, 494–502.11. Bello, O.S.; Lasisi, B.M.; Adigun, O.J.; Ephraim, V. Scavenging Rhodamine B dye using moringa oleifera seed pod. Chem. Speciat.
Bioavailab. 2017, 29, 120–134. [CrossRef]12. Rasapoor, M.; Young, B.; Asadov, A.; Brar, R.; Sarmah, A.K.; Zhuang, W.-Q.; Baroutian, S. Effects of biochar and activated carbon
on biogas generation: A thermogravimetric and chemical analysis approach. Energy Convers. Manag. 2020, 203, 112221. [CrossRef]13. Suiuay, C.; Sudajan, S.; Katekaew, S.; Senawong, K.; Laloon, K. Production of gasoline-like-fuel and diesel-like-fuel from hard-resin
of Yang (Dipterocarpus alatus) using a fast pyrolysis process. Energy 2019, 187, 115967. [CrossRef]14. Senturk, H.B.; Ozdes, D.; Duran, C. Biosorption of Rhodamine 6G from aqueous solutions onto almond shell (Prunus dulcis) as
a low cost biosorbent. Desalination 2010, 252, 81–87. [CrossRef]15. Guo, Y.; Tan, C.; Sun, J.; Li, W.; Zhang, J.; Zhao, C. Porous activated carbons derived from waste sugarcane bagasse for CO2
adsorption. Chem. Eng. J. 2020, 381, 122736. [CrossRef]16. Yagmur, E.; Gokce, Y.; Tekin, S.; Semerci, N.I.; Aktas, Z. Characteristics and comparison of activated carbons prepared from
oleaster (Elaeagnus angustifolia) fruit using KOH and ZnCl2. Fuel 2020, 267, 117232. [CrossRef]17. Gonzalez-Serrano, E.; Cordero, T.; Rodriguez-Mirasol, J.; Cotoruelo, L.; Rodriguez, J. Removal of water pollutants with activated
carbons prepared from H3PO4 activation of lignin from kraft black liquors. Water Res. 2004, 38, 3043–3050. [CrossRef]18. Wang, J.-G.; Yang, Y.; Huang, Z.-H.; Kang, F. Incorporation of nanostructured manganese dioxide into carbon nanofibers and its
electrochemical performance. Mater. Lett. 2012, 72, 18–21. [CrossRef]19. Shrestha, D.; Maensiri, S.; Wongpratat, U.; Lee, S.W.; Nyachhyon, A.R. Shorea robusta derived activated carbon decorated with
manganese dioxide hybrid composite for improved capacitive behaviors. J. Environ. Chem. Eng. 2019, 7, 103227. [CrossRef]20. Molina-Sabio, M.; Rodriguez-Reinoso, F. Role of chemical activation in the development of carbon porosity. J. Collids Surf.
Physicochem. Eng. 2004, 241, 15–25. [CrossRef]21. Shi, K.; Ren, M.; Zhitomirsky, I. Activated carbon-coated carbon nanotubes for energy storage in supercapacitors and capacitive
water purification. ACS Sustain. Chem. Eng. 2014, 2, 1289–1298. [CrossRef]22. Kondrat, S.; Perez, C.R.; Presser, C.R.; Gogotsi, Y.; Kornyshev, A.A. Effect of pore size and its dispersity on the energy storage in
nanoporous supercapacitors. Energy Environ. Sci. 2012, 5, 6474. [CrossRef]23. Sarkar, A.; Singh, A.K.; Sarkar, D.; Khan, G.G.; Mandal, K. Three-Dimensional Nano-Architecture of BiFeO3 anchored TiO2
Nanotube Arrays for Electrochemical Energy Storage and Solar Energy Conversion. J. ACS Sustain. Chem. Eng. 2015, 3,2254–2263. [CrossRef]
24. Tawfik, A.S.; Gaddafi, I.D. Adsorptive desulfurization of dibenzothiophene from fuels by rubber tyres-derived carbons: Kineticsand isotherms evaluation. Proc. Safe. Environ. Prot. 2016, 102, 9–19.
25. Arivoli, S.; Viji, J.M.; Rajachandrasekar, T. Cobalt Adsorption on a Low Cost Carbon-Kinetic, Equilibrium and Mechanistic Studies.Mat. Sci. Res. India 2006, 3, 241–250.
26. Doumic, L.I.; Soares, P.A.; Ayude, M.A.; Cassanello, M.; Boaventura, R.A.; Vilar, V.J. Enhancement of a solar photo-Fentonreaction by using ferrioxalate complexes for the treatment of a synthetic cotton-textile dyeing wastewater. Chem. Eng. J. 2015, 277,86–96. [CrossRef]
27. Stavropoulos, G.; Zabaniotou, A. Production and characterization of activated carbons from olive-seed waste residue. MicroporousMesoporous Mater. 2005, 82, 79–85. [CrossRef]
28. Sen, T.K.; Dawood, S. Review on Dye Removal from Its Aqueous Solution into Alternative Cost Effective and Non-ConventionalAdsorbents. J. Chem. Process. Eng. 2013, 1, 104. [CrossRef]
29. Namasivayam, C.; Radhika, R.; Suba, S. Uptake of dyes by a promising locally available agricultural solid waste: Coir pith. WasteManag. 2001, 21, 381–387. [CrossRef]
30. Bedmohata, M.A.; Chaudhari, A.R.; Singh, S.P.; Choudhary, M.D. Adsorption Capacity of Activated Carbon prepared by ChemicalActivation of Lignin for the Removal of Methylene Blue Dye. Int. J. Adv. Res. Chem. Sci. 2015, 2, 1–13.
31. Chen, Y.; Zhu, Y.; Wang, Z.; Li, Y.; Wang, L.; Ding, L.; Gao, X.; Ma, Y.; Guo, Y. Application studies of activated carbon derived fromrice husks produced by chemical-thermal process—A review. Adv. Colloid Interface Sci. 2011, 163, 39–52. [CrossRef] [PubMed]