
Efficiency and Convergence in the Jamaican banking sector 1998-2007
23
1 Efficiency and Convergence in the Jamaican banking sector 1998-2007 Jenifer Daley* and Kent Matthews** *Department of Management Studies, University of the West Indies, Mona, Kingston 7, Jamaica **Cardiff Business School, Cardiff University, Colum Drive, Cardiff, CF10 3EU, Wales, U.K. Abstract Deregulation, re-regulation and continuing globalisation embody an imperative that banks increase efficiency to survive. We employ non-parametric bootstrap DEA to measure technical efficiency among Jamaican banks between 1998 and 2007. In addition, we test for conditional convergence to identify pointing variables for technical efficiency. Overall, the results suggest that there has been a tendency towards improvement in bank efficiency levels for the largest banks. The findings show strong evidence of conditional convergence, which means that each bank is converging to its own steady-state and that GDP growth, ownership and size are the major influences on levels of technical efficiency. Keywords: Bank efficiency, DEA, bootstrap, convergence, Jamaica JEL Codes: G21, G28 Corresponding author: J. Daley, Tel. +(876) 977 3808, Fax. +(876) 977 3829, Email: [email protected] We gratefully acknowledge funding support from The University of the West Indies, Mona Campus, and NCB Foundation.
-
Upload
independent -
Category
Documents
-
view
3 -
download
0
Transcript of Efficiency and Convergence in the Jamaican banking sector 1998-2007
1
Efficiency and Convergence in the Jamaican banking sector 1998-2007
Jenifer Daley* and Kent Matthews**
*Department of Management Studies, University of the West Indies, Mona, Kingston
7, Jamaica
**Cardiff Business School, Cardiff University, Colum Drive, Cardiff, CF10 3EU,
Wales, U.K.
Abstract
Deregulation, re-regulation and continuing globalisation embody an imperative that banks
increase efficiency to survive. We employ non-parametric bootstrap DEA to measure
technical efficiency among Jamaican banks between 1998 and 2007. In addition, we test for
conditional convergence to identify pointing variables for technical efficiency. Overall, the
results suggest that there has been a tendency towards improvement in bank efficiency levels
for the largest banks. The findings show strong evidence of conditional convergence, which
means that each bank is converging to its own steady-state and that GDP growth, ownership
and size are the major influences on levels of technical efficiency.
Keywords: Bank efficiency, DEA, bootstrap, convergence, Jamaica
JEL Codes: G21, G28
Corresponding author: J. Daley, Tel. +(876) 977 3808, Fax. +(876) 977 3829, Email:
We gratefully acknowledge funding support from The University of the West Indies, Mona
Campus, and NCB Foundation.

2
1. Introduction
The expectation is for an intensely challenging period in world financial systems as a result
of the US-led fallout in financial entities, the full impact of which remains to be seen. As in
other parts of the world, the recent turmoil in global financial markets has raised some
fundamental questions for Jamaica: Are banks operating at a level that will secure their
survival in the face of a worldwide financial crisis? Has the battery of methodologies
employed by regulators been sufficiently reinforced since the crisis of the 1990s to
effectively handle the global challenges?
The Jamaican banking sector of today is largely the legacy of unprecedented financial
crisis during the last decade of the twentieth century and has undergone many changes
consequentially. The crisis resulted in a transformation of the sector in terms of number,
types, and ownership of banks.1 In addition, regulatory amendments imposed by the central
bank, and reporting changes imposed by an amended Companies Act and Jamaica’s adoption
of International Financial Reporting Standards (IFRS) have also had, as expected, significant
impact of the reported performance of banks (see, for example, Daley, 2003).
While the explanations for Jamaica’s past banking problems vary, there is tacit
consensus that the macroeconomic environment as well as bank size, ownership and
operational efficiency were among the most significant factors contributing to the failure of
banks. We make a rigorous attempt to measure efficiency relative to best practice to answer
this question: what statistical inference can we draw from point-estimates of efficiency
provided by the use of bootstrapping technology? In other words, are measures of relative
efficiency provided by Data Envelopment Analysis (DEA) significantly different from the
benchmark for the panel of Jamaican banks over the period 1998 to 2007? In our
investigation of the post-crisis efficiency levels of individual Jamaican banks we implicitly
1 The number of banks was reduced due mainly to regulator-initiated closures and mergers.

3
address whether the hypothesis of greater correlation between efficiency and increased
foreign ownership holds true for Jamaican banks.
We address the presumption that a sound regulatory framework can serve as a
bulwark from instability and engender increased operational performance within banks by
implicitly investigating whether the profusion of post-crisis enhancements to the regulatory
and supervisory framework is evidenced in improved operational efficiency among Jamaican
banks. Specifically, has the regulatory reform focused on transparency and accuracy of non-
performing loans (NPLs) influenced greater efficiency within banks? We examine this is by
the inclusion of NPLs, and also isolating NPLs as a bad output, in one of the frontier models.
Another benefit of our paper is the information it provides from tests of convergence
specified on the bank efficiency estimates. Utilising the concept of β-convergence borrowed
from the growth convergence literature, we examine for conditional convergence among
banks in the sample frame. In testing for conditional convergence within peer groups (bank
categories) we address the question: are banks converging to a steady-state or are they
diverging? In other words, are the less efficient banks catching up with the more efficient
ones and, if so, what are the variables that point to movements in efficiency levels?
Generally speaking, the findings are indicative of improvement in efficiency for the
largest banks. There is strong evidence that the banks are converging, not towards the same
steady-state as benchmark efficient banks but, rather, towards a steady-state that is
conditional on each bank’s own level of efficiency.
The next section contextualises Jamaica’s banking sector. Section 3 reviews the
literature on bank efficiency for developing countries and the DEA methodology. Section 4
discusses model strategy and data. Section 5 presents the results, including a discussion of the
convergence tests and section 6 concludes.

4
2. Efficiency and Jamaica’s banking sector in context
Jamaica’s banking environment has changed markedly over the last decade. In the early
1990s following a period of deregulation in the financial sector, there was a proliferation of
banks in the island: 37 by 1993 of which 30 were locally owned.2 However, a weak
institutional and regulatory framework, regulatory forbearance and internal weaknesses
within banks resulted in high levels of non-performing loans, poor capitalisation and
inefficiency (Daley, 2007).3 By January 1997, the government was forced to intervene to
mitigate the effects of a system-wide crisis.4 Daley (2007) reports the following table as
evidence of the trend in the 21 banks that failed over the decade of the 1990s for commercial
and merchant banks in Jamaica.5
Table 1 Bank Failures in Jamaica – Selected years by type of bank
Year end 1994 1996 1997 1998
Commercial banks - 1 3 1
Merchant banks 1 1 1 13
Source: Daley (2007).
Evidently, 61% of the failures are grouped in one year. Daley (2007) argues that the
peculiar features of the failed banks played a more significant role in the event of failure than
did the ‘macro’ factors during that year that would have affected all banks. According to
Daley et al. (2008) ‘… the likelihood of failure in any year, t, is significantly related to the
…the level of efficiency with which management conducts its affairs in t-3 and in t-1 …’
(p.295). The importance of the inefficiency variable in discriminating between failed and
non-failed banks are highlighted in their findings.
Of course, there are significant potential welfare gains from efficiencies within the
banking sector. The finance-growth nexus suggests strong positive correlation between
2‘Banks’ refer to deposit-taking entities that may be commercial banks or merchant banks. As a consequence of continual
restructuring within the Jamaican banking sector, 5 of the 6 commercial banks operating at the end of 2007 had majority
foreign ownership. 3 Efficiency (or inefficiency) in this instance was measured by a higher ratios of expenses to income. 4 See, for example, Duncan and Langrin (2004), Tennant (2006) and Daley (2007) for more detailed discussions of the crisis. 5 Failure is defined to include closure, bailout and regulator-induced or supervised mergers.

5
financial market development and economic growth in developing countries where banks are
the primary intermediary, as capital markets tend to be thin and not well developed (see, for,
La Porta example et al., 1998). The events taking place both within and outside of the
Jamaican banking sector since the 1990s dictate the need for continued focused attention and
examination of those factors that are significant correlates to banks’ performance and
ultimately banking and financial sector system stability.
Jamaican banks may have been further challenged by the effects of unregistered
financial organisations (UFOs). UFOs refer to a group of unregulated investment clubs that
compete with the traditional banking sector by offering clients supernormal returns.6 Perhaps
the potentially most debilitating impact on the formal banking sector is any non-performing
loans resulting as the clubs collapse and the funds are not returned to the traditional banking
market; bank efficiency becomes an even greater imperative since spreads cannot be
increased infinitely in order to maintain or improve profitability.7
The efficiency optimisation imperative is acknowledged and, indeed, well-understood
in Jamaica, where efficiency is increasingly emphasised as a priority in performance targets.8
Unfortunately, banking efficiency in Jamaica remains under-researched. This is probably due
to the relatively small number of banks and the inaccessibility to high-quality bank-specific
data. While several authors make reference to efficiency in relation to bank spreads (for
example, Tennant, 2006) or bank failure (Daley, 2007; Daley et al., 2008), Bailey (2006) is
the only known study to have specifically examined efficiency in the Jamaican banking
sector between 2005 and 2006. We contribute to the literature on banking efficiency in
developing countries by examining the efficiency of Jamaican banks at the firm level
6 Anecdotal evidence suggests that returns ranged from 120% to 240% per annum and that the UFOs reflected financial
liabilities that were of a magnitude equal to or greater than traditional bank deposits. The Sunday Gleaner, March 30, 2008
(p. G2), reported a total of 19 such unregistered organisations operating in Jamaica (these schemes are also referred to as
alternative investment schemes). Since that time, they have all disappeared. 7 Tennant (2006) discusses the issue of interest rate spreads and the link to efficiency. 8 See, for example, http://www.firstcaribbeanbank.com/uploads/pdf/2004_3rd_jamaica.pdf,
http://www.sun.com/software/cluster/NB-Jamica.pdf

6
between 1998 and 2007. This is the first work to our knowledge to examine efficiency in
banking using non-parametric bootstrapping technology and to perform a test of convergence
on bank efficiency for Jamaica.
3. Bank efficiency literature and methodology
Tennant’s (2006) examination of interest rate spreads in Jamaica argues that interest rate
spreads act as ‘a key indicator of [an] institution’s efficiency’ (p.88), and reports from a
survey of Jamaican financial sector stakeholders that recorded high spreads have been
attributed to inefficiency, inter alia. Consequently, he notes the perception that increased
operational efficiencies can help to reduce bank spreads.
According to Bailey (2006), technical efficiency for the Jamaican banking sector in
general declined during 2006 relative to 2005. A Stochastic Frontier Approach (SFA) was
applied to quarterly data for the period December 2004 to December 2006 and resulted in
average technical inefficiency of 25.7% and 9% for commercial and merchant banks,
respectively, in 2006 relative to 4.1% and 2.0%, respectively, in 2005.
Not surprisingly, extensive research has been conducted on bank efficiency using data
for the United States of America. However, there is also a growing body of literature for
developing countries with an increasing number of studies conducted using data for transition
economies in Europe, for Pakistan, India and China (see, for example, Berger et al., 2009 for
a brief survey). Generally speaking, the empirical findings relating to bank ownership and
efficiency are mixed. Berger et al. (2009:115) note that: ‘The most common findings for
developing nations are that on average, foreign banks are more efficient than or
approximately equally efficient to private [non-state] domestic banks. …there are variations
on all of these findings.’
We discern two approaches to measuring bank efficiency. From an accounting
perspective, bank efficiency has been traditionally evaluated by a cost-to-income ratio,

7
defined as:
NIIII
CER
+=
(1)
where C is non-interest expenses, II is net interest income and NII is non-interest income.9
Indeed, empirical research on bank efficiency has also utilised this relatively simple ratio.10
Many Jamaican banks use an accounting ratio akin to this to monitor efficiency.11
Arguably,
while ratios are useful and do give some indication of the level and changes in efficiency over
time, they represent a final outcome and do not allow identification of the sources of any
inefficiency and where improvements are necessary. Moreover, Berger et al. (2009:116)
caution that: ‘Ratio analyses do not control for individual bank outputs, input prices, or other
exogenous factors facing banks in the way that studies using modern efficiency methodology
do, and so may give misleading results.’
The alternative approach is neoclassical production theory, which has become
increasingly common in empirical analyses. In this case, a bank is assessed as an economic
unit and managers have the option of evaluating efficiency by considering multiple inputs
and outputs and also of decomposing cost efficiency into allocative and technical efficiency.
Perhaps it is as a result of the heterogeneity of the outputs and inputs related to banks
why there is a lack of consensus in the literature as to their precise classifications.
Consequently, the intermediation and production approaches are often utilised as
classification guides. The intermediation approach assesses deposit-taking entities as
financial intermediaries that utilise labour and capital to transform deposits into loans and
other earning assets; the production approach is predicated on the entity as a producer of loan
and deposit services from labour and capital (see, for example, Drake, 2003). The choice of
9 See the United States Federal Financial Institutions Examination Council
http://www.ffiec.gov/PDF/UBPR/06UBPRS31.pdf 10 Li et al., (2001) utilise ratio analysis to compare bank performance in China and Forster and Shaffer (2005) for Latin
America. 11http://mycmmb.com/docs/SMW/SMW%202006/February%202006/SMR090206.pdf,
http://www.jncb.com/corp_info/news.asp?Story=275, http://www.capital-credit-mbank.com/viewnews.aspx?ID=60

8
approach may alter the efficiency scores obtained but not the qualitative conclusions (see, for
example, Berger et al., 1997).
The above approaches are now associated with conducting empirical research on
banking efficiency utilising frontier parametric and non-parametric techniques. The
parametric approaches impose a structural form on the data and are subject to criticism.
Despite certain drawbacks, non-parametric approaches are commonly used since they avoid
the restrictions of a defined functional form and infer the results from the banks’ output
directly.
Data Envelopment Analysis (DEA) is a mathematical programming technique
grounded in the principle of benchmarking and seeks to identify the most efficient entity
based on a ‘frontier’ of efficiency constructed over the data using the data in the sample
(Coelli et al., 2005).12
Because DEA provides an objectively determined numerical
efficiency value, Berger and Humphrey (1997:2) suggest that it may be ‘particularly valuable
in assessing and informing government policy regarding financial institutions.’ The standard
DEA model outcome for efficiency is a value between 0 and 1 (0% and 100%) indicating the
degree of efficiency from least to fully technically efficient (Coelli et al., 2005).
A technically efficient bank is one that cannot produce more outputs with the given
vector of inputs or the same set of outputs with fewer inputs. Let there be N banks. Let ix
represent the input matrix of the ith
bank and iy represent its output matrix. Let the KxN input
matrix be denoted as X and the MxN output matrix be denoted by Y. The efficiency measure
for each of the N banks is maximised by the DEA searching for the ratio of all weighted
outputs over all weighted inputs where the weights are selected from the dual of the linear
programming problem conventionally represented as:
12 The basis of DEA is an extension by Charnes et al. (1978) who popularised the method. Other commonly applied
techniques are the stochastic frontier approach (SFA), the Distribution-Free Approach (DFA) and the Thick-Frontier
Approach (TFA).

9
θλθ ,min
0≥+− φYyi (2)
subject to 0≥− φθ Xxi (3)
0≥φ where φ is a N x 1 vector of constants (reflecting the number of banks), θ is a scalar and is the
economic efficiency score of the ith
bank (0 < θ < 1).
The advantage of unconstrained functional parameters allows the DEA flexibility to
construct a linear frontier of relative efficiency by ‘enveloping’ the banks within the sample,
with the ‘best practice’ banks forming the frontier.13
However, a key drawback of this
technique is that data are assumed to be measured perfectly and no allowance is made for
random error due to luck or measurement error. For example, a deviation above the cost
frontier would be attributed completely to inefficiency, rather than to a combination of
inefficiency and random error (Drake, 2003).
We hypothesize, consistent with the extant literature, that post-crisis regulatory
enhancements leads to greater efficiency, and that the larger banks are more efficient as are
banks with greater foreign ownership. We therefore report the efficiency of banks generally
as well as by bank categories. In addition, we seek to identify whether there is discernable
convergence among peer groups.
To test our hypotheses we employ variations of the intermediation approach using
DEA with bank-specific financial accounting information to identify how well a bank is
expected to perform relative to other banks under the same exogenous conditions, utilising a
weighted bundle of inputs to produce the same weighted bundle of outputs.14
13 We use banks here but the same principles would apply to any other decision-making unit (DMU). Coelli et al. (2005:199)
note that this flexibility is superior to parametric methods but note that ‘… this aspect … can also create problems, especially
when dealing with small data sets.’ The caution is of particular importance in this study with a maximum of 12 banks for 10
years. 14 The issue of relative efficiency is stressed and the ‘smoothing’ of accounting data may results in measurement errors that
renders absolute measures misleading.
10
4. Measuring bank efficiency: model strategy and data
Given the relatively virgin research ground in Jamaica, there is the potential to construct
different models of varying specifications and sophistication that could be useful to a variety
of policy decisions relating to banks. However, our final models – both in number and design
– were determined by data availability. We utilise the full population of banks that existed
during the period 1998 to 2007 for the models summarised in Table 2 as the first stage of our
two-stage approach.
Model 1 has the income flows of a bank as the output. The traditional measure of
bank income is interest income, but many banks de-emphasise the less profitable ‘plain
vanilla’ banking function, promote a broader role and emphasize a wider range of services.
Model 2 sees output as the traditional items on the balance sheet and the position of other
investments (typically government and corporate liquid assets). Since interest income will be
positively correlated with the outputs of model 2, the main difference between the two
models will depend on the weight of non-interest income to interest income in a specific
bank. Model 3 differs from model 2 in that it takes performing loans as an output so as to
give zero weight to NPLs. We would expect the results of model 2 to be close to model 3 if
NPLs are not large. Model 4 treats NPLs as a bad output so that maximising output is the
same as minimising NPLs.
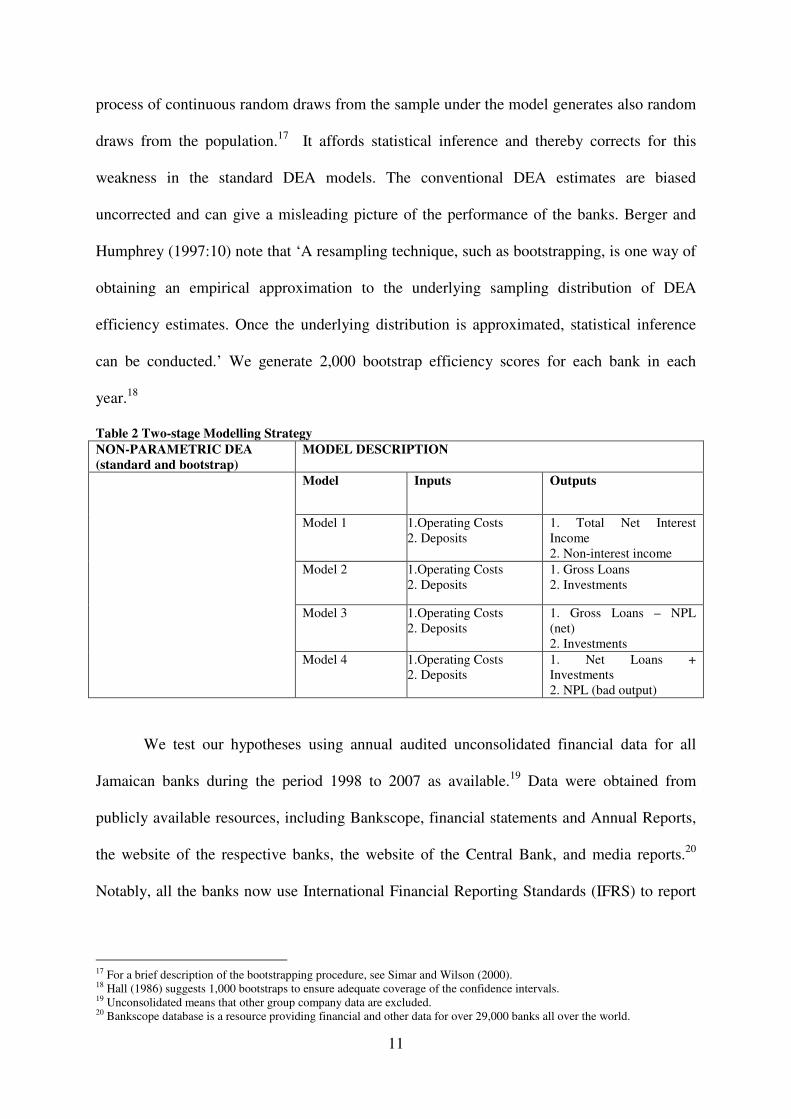
The choice of 2 inputs and 2 outputs is dictated by the dimensionality problem with
DEA.15
First, we test and compare the performance results for the banks, using the
specifications of DEA outlined in Table 2. Efficiency scores for each bank is first estimated
using the standard intermediation approach, followed by a bootstrap procedure to each of the
above frontier models.16
The bootstrap procedure is based on the notion that if the data can
be viewed as a random sample from an underlying population under a model, then the
15 Because of the small number of data points available we could only use the 2-input, 2-output. As a rule of thumb the
number of data points must exceed 3x(number of inputs + number of outputs). 16 By ‘standard’ here we refer to how the estimation is conducted: that is, without the bootstrapping.
11
process of continuous random draws from the sample under the model generates also random
draws from the population.17
It affords statistical inference and thereby corrects for this
weakness in the standard DEA models. The conventional DEA estimates are biased
uncorrected and can give a misleading picture of the performance of the banks. Berger and
Humphrey (1997:10) note that ‘A resampling technique, such as bootstrapping, is one way of
obtaining an empirical approximation to the underlying sampling distribution of DEA
efficiency estimates. Once the underlying distribution is approximated, statistical inference
can be conducted.’ We generate 2,000 bootstrap efficiency scores for each bank in each
year.18
Table 2 Two-stage Modelling Strategy
NON-PARAMETRIC DEA
(standard and bootstrap)
MODEL DESCRIPTION
Model Inputs Outputs
Model 1 1.Operating Costs
2. Deposits
1. Total Net Interest
Income
2. Non-interest income
Model 2 1.Operating Costs
2. Deposits
1. Gross Loans
2. Investments
Model 3 1.Operating Costs
2. Deposits
1. Gross Loans – NPL
(net)
2. Investments
Model 4 1.Operating Costs
2. Deposits
1. Net Loans +
Investments
2. NPL (bad output)
We test our hypotheses using annual audited unconsolidated financial data for all
Jamaican banks during the period 1998 to 2007 as available.19
Data were obtained from
publicly available resources, including Bankscope, financial statements and Annual Reports,
the website of the respective banks, the website of the Central Bank, and media reports.20
Notably, all the banks now use International Financial Reporting Standards (IFRS) to report
17 For a brief description of the bootstrapping procedure, see Simar and Wilson (2000). 18 Hall (1986) suggests 1,000 bootstraps to ensure adequate coverage of the confidence intervals. 19 Unconsolidated means that other group company data are excluded. 20 Bankscope database is a resource providing financial and other data for over 29,000 banks all over the world.

12
financial information.21
Data was not consistently available for all entities and, in a few
instances a number of working assumptions had to be made to fill gaps in the data.22
In the
final analysis we used an unbalanced panel of 12 banks with 101 bank-year observations. We
feel that it is reasonable to assume that the weighted median efficiency scores for the majority
of banks are indicative of the efficiency levels of each bank relative to other banks and do not
believe that the lack of a balanced panel refutes the value of our findings.
5. Empirical Results
We investigate the levels of technical efficiency between 1998 and 2007, and compare the
standard DEA with the bootstrap results. Appendix A shows selected frontier analyses
results. Column 1 indicates the individual banks, while columns 2-5 give the standard DEA
estimate, the bias-corrected bootstrap median and the 95% confidence intervals for the bias-
corrected efficiency estimates, respectively. The overall results (including those not reported)
show independence between the efficiency scores from the bootstraps and the standard DEA.
The statistical significance at the 95% level of confidence suggests that the DEA results
reflect significant bias.23
We can therefore conclude that the bootstrap results provide
superior results to the DEA and focus our attention on the median bootstrap results from this
point.24
Overall, there are three key results from the frontier analysis in Appendix A. First, it
is clear that there is wide variation in banking efficiency scores among Jamaican banks
between 1998 and 2007. In 1998, the scores ranged between 34.24% for CCMB and 84.33%
for FGB while in 2007 they ranged from 64.44% for CITIBANK to 94.69% for BNS (model
21 IFRS was adopted or all financial reporting on or after July 1, 2002. Some financial statements have therefore been
reported using the superseded local accounting standards (Local GAAP). Daley (2004), and Daley (2003), for example,
discuss the likely impact of the change. 22 While these assumptions are ‘conditioning’ factors that should be taken into account when interpreting the results, they are
not pervasive and are also in line with other researchers’ assumptions. 23 The results are also significantly different from unity 24 We report the median rather than the mean since the former should provide a more robust measure of location in skewed
distributions such as this (see, for example, Simar and Wilson, 1998). The complete DEA-bootstrap comparison is available
from the authors on request.

13
1). According to model 1, this suggests that even if substantial differences remain in banks’
efficiency levels in 2007, these differences have in fact decreased over the period. All other
models suggest that the differences have increased over the period.
The second key result is somewhat intuitive from the first: from Appendix A, model
1, shows all banks increasing in efficiency over the period, model 4 shows all banks
decreasing in efficiency over the period and for models 2 and 3 RBTT and FCIB are the only
banks that reflected increasing efficiency over the period. Further, there is no evidence of the
least efficient banks in 1998 catching-up to the more efficient banks by 2007 except for
modest movements by CCMB in model 1.
Third, while the inclusion of NPLs as a bad output in model 4 appears to have had a
generalised effect of lowering overall efficiency levels for most banks, there is a noticeable
further sharp decrease in 2002 for almost all banks in all models. Sharp decreases were also
evident in 2005. These relatively low levels of efficiency are indicative of significant
features having an impact on the data that point to potential structural breaks. It will be
recalled that in 2002 Jamaica adopted IFRS for accounting year-end on or after July 1.
Anticipated increased volatility in earnings and some balance sheet items has been noted by
Daley (2003), for example. Notwithstanding, an examination of the impact of IFRS on bank
reporting represents a potential area for future research.
Table 3 shows the year-by-year correlation coefficients between each model as a test
for consistency and robustness. The results of table 3 are mixed. Except for a few years,
there is no consistent and significant positive relation between model 1 and any of the other
3. There is a significant positive relation between model 2 and model 3 which is not a
surprise as in model 2, one of the outputs is total loans and in model 2 it is total performing
loans. However, there is a reasonable number of positive significant correlations between
model 4 and models 2 and 3 (14 out of 20) at the 10% level. While it is well known that DEA

14
can give different results for different combinations of inputs and outputs, the correlations
show that for the same input set, there is a relatively robust correspondence of scores from
models 2, 3, and 4.
Table 3: Correlation coefficient between models by year Year Model 1 Model 2 Model 3 Model 4
1998 Model 1
Model 2
Model 3
Model 4
1.0000
.0381 1.0000
.0987 .9877*** 1.0000
-.3046 .7405** .6917** 1.0000
1999 Model 1
Model 2
Model 3
Model 4
1.0000
.5521* 1.0000
.5972* .9747*** 1.0000
.1546 .5201* .5700* 1.0000
2000 Model 1
Model 2
Model 3
Model 4
1.0000
.0025 1.0000
.1174 .9457*** 1.0000
.0806 .5124* .4255 1.0000
2001 Model 1
Model 2
Model 3
Model 4
1.0000
.5759* 1.0000
.5771* .9990*** 1.0000
.7121** .6065** .5886* 1.0000
2002 Model 1
Model 2
Model 3
Model 4
1.0000
-.0994 1.0000
-.0824 .7984** 1.0000
.4724 -.0283 .1196 1.0000
2003 Model 1
Model 2
Model 3
Model 4
1.0000
-.2633 1.0000
-.6163** .5166* 1.0000
-.1682 .5751* -.0884 1.0000
2004 Model 1
Model 2
Model 3
Model 4
1.0000
-.0887 1.0000
-.0858 .9980*** 1.0000
.1759 .8129*** .8197*** 1.0000
2005 Model 1
Model 2
Model 3
Model 4
1.0000
-.1481 1.0000
-.2151 .9627*** 1.0000
-.0647 .6190** .7405** 1.0000
2006 Model 1
Model 2
Model 3
Model 4
1.0000
.4592 1.0000
.4553 .9997*** 1.0000
.4176 .8011*** .8059*** 1.0000
2007 Model 1
Model 2
Model 3
Model 4
1.0000
.4317 1.0000
.4528 .9992*** 1.0000
.0275 .2674 .2633 1.0000 * significant at the 10%, ** 5%, ***1%
Overall, wide variation in efficiency levels over time with a tendency towards a
general decline was reflected in all models although there was a lag in some models; larger,
foreign-owned commercial banks reflected a tendency towards improvement since 2005. An

15
important question is therefore, how do these efficiency scores evolve over time and what
drives them in the process? Whether these differences will actually translate into changes in
efficiency ranks is examined in the test for convergence.
Tests for conditional convergence
In the second stage of our two-stage approach we seek to identify variables that have a
significant association with, or that point to, the movements in efficiency and question
whether the volatility in efficiency scores noted above alters the ranking of the banks’
efficiency. We investigate whether the inefficient banks (scores less than 100%) are
improving and therefore converging on the benchmark or on a cluster of peers. We borrow
from the growth convergence literature of Barro and Sala-i-Martin (1991) and Sala-i-Martin
(1996) to test for conditional convergence. Conditional convergence implies that initial
differences in technical efficiency can create permanent deviations from the benchmark even
in steady-state. Banks will form into clusters of peer groups and converge on the peer group
average. Following Fung (2006) we estimate conditional convergence using panel estimation
techniques. Equation (1) below describes the basic model.
titiitti uTEZTE ,1,,, +++=∆ −λβα (4)
Where TE = technical efficiency,
Z represents categorical and environmental variables, and
u is a stochastic disturbance.
A negative value of λ is a necessary condition for convergence. The larger the
absolute value of λ, the faster the speed of convergence. We experimented with a number of
bank specific and macroeconomic variables. The bank specific variables were the total assets
of the banks as an indicator of size, cost-income ratio as an accounting measure of
management efficiency, and net interest margin as an accounting measure of risk
management efficiency. The rate of growth of GDP was used as a macroeconomic
environmental variable that affected the banking market as a whole. Categorical variables
were zero-one dummy variables representing type of specialisation (retail or merchant),
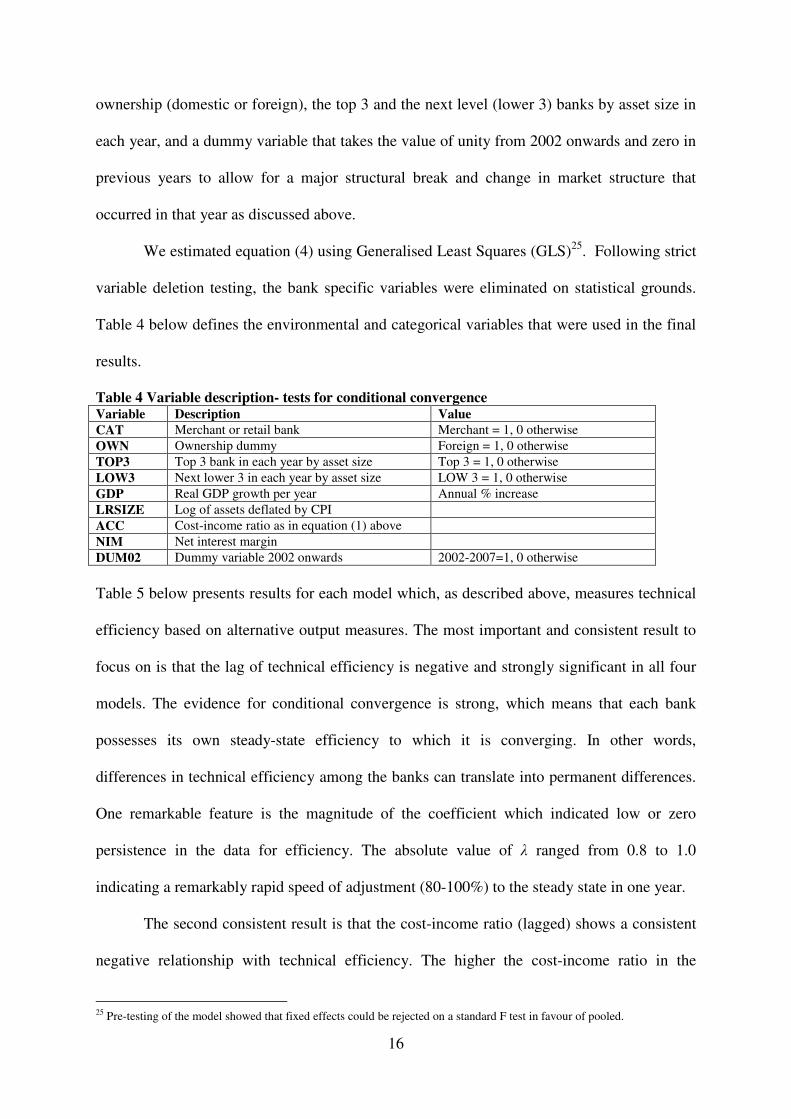
16
ownership (domestic or foreign), the top 3 and the next level (lower 3) banks by asset size in
each year, and a dummy variable that takes the value of unity from 2002 onwards and zero in
previous years to allow for a major structural break and change in market structure that
occurred in that year as discussed above.
We estimated equation (4) using Generalised Least Squares (GLS)25
. Following strict
variable deletion testing, the bank specific variables were eliminated on statistical grounds.
Table 4 below defines the environmental and categorical variables that were used in the final
results.
Table 4 Variable description- tests for conditional convergence Variable Description Value
CAT Merchant or retail bank Merchant = 1, 0 otherwise
OWN Ownership dummy Foreign = 1, 0 otherwise
TOP3 Top 3 bank in each year by asset size Top 3 = 1, 0 otherwise
LOW3 Next lower 3 in each year by asset size LOW 3 = 1, 0 otherwise
GDP Real GDP growth per year Annual % increase
LRSIZE Log of assets deflated by CPI
ACC Cost-income ratio as in equation (1) above
NIM Net interest margin
DUM02 Dummy variable 2002 onwards 2002-2007=1, 0 otherwise
Table 5 below presents results for each model which, as described above, measures technical
efficiency based on alternative output measures. The most important and consistent result to
focus on is that the lag of technical efficiency is negative and strongly significant in all four
models. The evidence for conditional convergence is strong, which means that each bank
possesses its own steady-state efficiency to which it is converging. In other words,
differences in technical efficiency among the banks can translate into permanent differences.
One remarkable feature is the magnitude of the coefficient which indicated low or zero
persistence in the data for efficiency. The absolute value of λ ranged from 0.8 to 1.0
indicating a remarkably rapid speed of adjustment (80-100%) to the steady state in one year.
The second consistent result is that the cost-income ratio (lagged) shows a consistent
negative relationship with technical efficiency. The higher the cost-income ratio in the
25 Pre-testing of the model showed that fixed effects could be rejected on a standard F test in favour of pooled.

17
previous year, the lower the level of technical efficiency (and by implication, the higher is
cost inefficiency). The role of the cost-income ratio suggests that there is information content
in the measure as an indicator of efficiency but it is only partial. As we can see, from Table 5
other factors are also related to technical efficiency.
Table 5 Short-run tests for conditional convergence in technical efficiency by models 1999-2007 Variable Model 1 Model 2 Model 3 Model 4
Intercept 131.1 (.000)*** 137.0 (.000)*** 135.5 (.000)*** 120.8 (.000)***
TEt-1 -.870 (.000)*** -1.17 (.000)*** -1.07 (.000)*** -1.04 (.000)***
GDP growth 3.41 (.065)* -3.44 (.017)** -2.83 (.093)* -4.32 (.024)**
LRSIZE -9.36 (.000)*** -3.55 (.015)** -4.36 (.010)*** -3.97 (.193)
ACC(-1) -.174 (.079)* -.239 (.008)*** -.228 (.008)*** -.144 (.155)
NIM(-1) -69.2 (.062)* - - -
OWN - -18.0 (.000)*** -17.9 (.000)*** -22.6 (.001)***
TOP3 17.4 (.013)** 31.3 (.003)*** 31.1 (.002)*** 12.4 (.291)
LOW3 - 19.1 (.005)*** 18.3 (.006)*** -7.49 (.336)
DUM02 19.8 (.000)*** -17.5 (.000)*** -20.0 (.001)*** -
Log L* -382.9 -378.0 -374.7 -387.5 Note: GLS panel estimation, heteroskedastic adjusted standard errors, p-values in parentheses
Third, size is associated with a lower level of efficiency, so that in general the larger
the bank the lower the level of efficiency. But, allowing for size generally, the top 3 banks
(which are also foreign owned banks) are associated with higher levels of efficiency.
Other factors produced mixed associations with the level of technical efficiency. The
dummy variable for 2002 onwards was always significant but did not have a consistent effect.
As with some results for the frontier analysis, the distinction is between model 1 and all the
other models.26
The rate of growth of GDP had a positive association with technical
efficiency in model 1, where output is a weighted combination of revenues but has a negative
association with output made up of a combination of interest earning assets, which suggests
that the inefficient banks slip behind the best-practice banks by 3 to 9 percentage points for
each one-percent growth in GDP. The categorical variables show that the ownership variable
is relatively more important, suggesting that foreign-owned banks achieve less technical
26We also experimented with using two dummy variables: the 2002 dummy along with another taking the value of unity
from 2005 onwards with zero in all previous years to examine for the influence of apparent structural breaks. For all models
except model 1, the inclusion of the second dummy variable had no effect on the final model as the dummy was early
eliminated. For model 1, the estimated coefficients for the lagged dependent variable and the categorical dummy are quite
robust to the addition of this variable, but the significance of this dummy variable resulted in the elimination of the dummy
for 2002 onwards and a reduction in the log likelihood. This implies that for model 1each dummy variable at least partly
captures influential characteristics related to the other.

18
efficiency than their local counterparts. The positive and significant coefficients for the Top 3
variable suggest that larger banks are able to achieve a higher level of technical efficiency
even being foreign- owned; the results for the lower 3 banks were significant but inconsistent.
The one period lagged net interest margin (NIM) had a significant association with technical
efficiency only in the case of model 1. The negative coefficient suggests that technically
inefficient banks are associated with wider spreads than more efficient banks, when revenue
represents the output of the bank. Evidently, bank-specific factors have a significant
influence on the convergence of technical efficiency.
6. Concluding Remarks
Motivated by the potential impact of recent events on Jamaica’s critical banking
sector, this paper has presented a number of models for measuring individual bank efficiency
in Jamaica. Frontier models show that the use of the bootstrapping technique mitigates bias
and therefore show superiority in favour of the bootstrapping technique over the standard
DEA. There were wide fluctuations in efficiency levels over the period 1998 to 2007 with a
trend towards improvement since 2005 for the larger, foreign-owned commercial banks. The
result of greater efficiency among large foreign-owned banks is in sympathy with the
literature (see, for example Bonin et al, 2005). In fact, Elyasiani and Rezvanian (2002) note
the importance of acknowledging this distinction between local and foreign banks
particularly where the presence of foreign banks is significant as is increasingly the case for
Jamaica.
The inclusion of the non-performing loans as a bad output produced more telling
results than mere its inclusion or exclusion. In general, efficiency levels declined significantly
when the bad output is introduced. With the introduction of IFRS, International Accounting
Standard (IAS) 39 mandates guidelines and a rigorous approach to credit provisioning which
must be observed. This increases the difficulty for banks to go undetected with under-

19
provisioning as with previous accounting requirements. In line with expectations, the post-
IFRS results appear to be more transparent and to better reflect the true economic value of
assets and liabilities.
The tests for conditional convergence in this study suggest that the steady-state
convergence is predicated on the macroeconomic state and some firm-specific variables.
Overall, the results point to the GDP growth and ownership as the main influences on bank
efficiency, with business focus (commercial or merchant) and size also having a major
influence in some models. The rapid speed of adjustment indicated that Jamaican banks
converge quickly to their peer cluster. While there is significant influence from the apparent
structural break in 2002, the effect is unclear. Obviously, the evidence of structural breaks in
2002 and, possibly, 2005 has had discernable effect on bank performance, although the
precise impact should be investigated as part of future research.
Issues regarding bank efficiency are of particular interest in Jamaica where there
banks compete for a share of the small, open market. A bank’s response to market conditions
is likely to be better the more efficiently that bank operates. Reliable information about the
level of efficiency and changes to these levels over time will assist bankers in determining
how to ‘bundle,’ price, and market banking services. Furthermore, any long-term impact on
bank profitability is likely to have relevance to customer welfare and economic development
and therefore to policymakers in a wider sense. The results from this paper inform an
exercise in measurement that may be used to improve managerial performance by
highlighting banks that score high on best practices and also to address research issues such
as the variation in efficiency based on different definitions of output. It is therefore useful for
policymakers at both the micro and the macro levels. These results must be considered in
relation to other factors such as banks’ productivity and the impact of accounting measures
on reported financial data that are used to impute efficiency levels in frontier analysis.

20
Obviously, improvement in efficiency will require purposeful, consistent and proactive
management supported by appropriate and adequate regulation.

21
Appendix A: Efficiency Scores by Model – DEA and Bootstrap Compared
Model 1 Model 2 Model 3 Model 4
DEA
Bstrap
Bias-
corrected
Lower
bound
Upper
bound DEA
Bstrap
Bias-
corrected
Lower
bound
Upper
bound DEA
Bstrap
Bias-
corrcted
Lower
bound
Upper
bound DEA
Bstrap
Bias-
corrected
Lower
bound
Upper
bound
1998
FGB 93.08* 84.33 59.58 91.95 100.0* 91.09 60.98 99.68 100.0* 93.37 73.46 99.71 74.98* 70.56 58.69 74.51
BNS 73.05* 64.35 38.64 72.26 100.0* 93.13 79.99 99.54 100.0* 93.39 76.04 99.78 70.54* 64.06 45.19 70.14
CCMB 42.24* 34.24 10.88 41.69 100.0* 90.52 60.18 99.66 100.0* 93.21 72.49 99.69 100.0* 78.78 27.91 99.10
FCIB 71.90* 65.82 45.51 71.18 61.78* 57.98 47.40 61.57 67.66* 64.60 56.44 67.49 52.93* 50.31 41.96 52.64
CIBC MB 100.0* 64.84 1.12 98.52 65.37* 62.30 54.35 65.10 71.68* 69.04 62.27 71.49 66.49* 63.29 52.93 66.16
CITIBANK 58.47* 52.76 34.79 57.94 67.55* 63.99 54.71 67.35 74.80* 71.39 62.38 74.67 46.68* 43.51 33.40 46.37
CITI MB 100.0* 59.43 0.00 98.37 100.0* 90.36 57.87 99.61 100.0* 93.36 72.00 99.76 100.0* 78.08 0.00 99.23
MAN MB 100.0* 73.73 0.00 98.04 100.0* 90.31 58.39 99.59 100.0* 93.19 73.12 99.74 79.20* 69.73 42.95 78.90
NCB 41.69* 37.38 24.81 41.21 88.48* 83.96 71.08 88.26 89.06* 85.55 75.96 88.87 85.52* 80.62 64.49 85.11
PCMB 100.0* 59.87 0.00 98.13 100.0* 90.85 64.41 99.57 100.0 93.31 71.55 99.75 100.0* 79.14 3.38 99.33
RBTT 44.16* 40.43 28.37 43.72 82.44* 77.32 64.53 82.14 79.96* 76.34 66.01 79.73 79.19* 75.37 62.89 78.80
2007
FGB 90.83* 86.99 75.23 90.63 100.0* 83.97 21.60 99.43 100.0* 83.44 19.06 99.39 100.0* 65.79 0.00 97.47
BNS 100.0* 94.69 82.34 99.75 65.22* 59.20 43.35 64.80 65.44* 59.61 43.81 64.91 51.70* 40.02 10.64 50.91
CCMB 86.15* 83.54 74.59 86.03 100.0* 83.56 39.87 99.43 100.0* 84.67 45.36 99.45 100.0* 70.33 5.10 96.97
FCIB 75.29* 72.52 64.35 75.11 96.57* 88.06 56.87 96.09 95.99* 87.27 57.07 95.57 48.66* 35.14 4.30 47.95
CITIBANK 67.02* 64.44 56.25 66.88 40.84* 37.19 25.86 40.62 40.92* 37.24 26.09 40.73 36.28* 30.51 11.90 36.04
NCB 93.44* 89.66 78.71 93.20 70.68* 63.56 40.78 70.30 71.12* 64.51 42.52 70.82 70.16* 59.14 22.96 69.73
PCMB 100.0* 94.38 73.50 99.78 100.0 83.87 9.98 99.44 100.0* 84.41 11.88 99.28 100.0* 22.12 0.00 97.78
RBTT 100.0* 94.36 74.11 99.76 100.0* 91.71 68.50 99.33 100.0* 91.92 69.24 99.18 77.76* 65.71 25.80 76.97
MF&G 100.0* 94.25 73.74 99.79 81.15* 75.07 56.31 80.68 82.53* 76.27 58.26 82.05 4.58* 3.85 1.48 4.54
*Significant bias at 95%

22
References
Bailey, S., 2006. An Assessment of Concentration & Efficiency in the Jamaican Banking
Sector, Bank of Jamaica Financial Stability Report, 84-89.
Barro, R. J., Sala-i-Martin, X., 1991. Convergence across States and Regions. Brookings
Papers on Economic Activity 1, 107-182.
Berger, A.N., Humphrey, D.B., 1997. Efficiency of Financial Institutions: International
Survey and Directions for Future Research. European Journal of Operational Research 98,
175-212.
Berger, A. N., Leusner, J., Mingo, J., 1997. The efficiency of Bank Branches. Journal of
Monetary Economics 40 (1), 141-162.
Berger, A. N., Hasan, I., Zhou, M., 2009. Bank ownership and efficiency in China: What will
happen the world’s largest nation? Journal of Banking and Finance 33, 113-130.
Bonin J, Hasan I., Wachtel P., 2005. Bank performance, efficiency and ownership in
transition countries. Journal of Banking and Finance 29, 31-53.
Charnes, A., Cooper, W.W., Rhodes, E., 1978. Measuring the Efficiency of Decision Making
Units. European Journal of Operational Research 2, 429-44.
Coelli, T., Rao, D. S. P., O’Donell, C. J., Battese, G. E., 2005. An introduction to Efficiency
and Productivity Analysis. Springer: New York.
Daley, J. A., 2003. The adoption of International Accounting Standards (IAS) in Jamaica:
Implications for financial stability. Mimeo. Bank of Jamaica: Kingston. URL:
http://www.boj.org.jm/uploads/pdf/papers_pamphlets/papers_pamphlets_the_adoption_of_ia
s_in_jamaica_-_implications_for_financial_stability.pdf)
Daley, J. A., 2004. IFRS: blessing or curse for developing markets? The Financial Regulator
8(2), 55-60.
Daley, J. A., 2007. Examining bank failure in developing countries: Lessons from Jamaica.
Sir Arthur Lewis of Social and Economic Studies: Kingston.
Daley, J., Matthews, K., Whitfield, K., 2008. Too-big-to-fail: Banking Failure and Banking
Policy in Jamaica. Journal of International Financial Markets, Institutions & Money 18, 290-
303.
Duncan, D., Langrin, B., 2004. Testing for Competition in the Jamaican Banking Sector:
Evidence from bank level data. Southwestern Journal of Economics VI, 1.
Drake, L., 2003. Costs and Efficiency in Banking: A Survey of the Evidence from the US, the
UK and Japan. In: Mullineux, A. W., Murinde, V. (Eds.), Handbook of International
Banking. Edward Elgar: Cheltenham.

23
Elyasiani, E., Rezvanian, R., 2002. A Comparative multiproduct cost study of foreign-owned
banks and domestic-owned US banks. Applied Financial Economics 12, 271-284.
Farrell, M.J., 1957. The measurement of productive efficiency of production. Journal of the
Royal Statistical Society Series A (120), 253-281.
Forster, J., Shaffer, S., 2005. Bank efficiency ratios in Latin America. Applied Economic
Letters 12, 529-532.
Fung, M.K., 2006. Scale economies, X-efficiency, and convergence of productivity among
bank holding companies. Journal of Banking and Finance 30, 2857-2874.
Hall, P., 1986. On the Number of Bootstrap Simulations Required to Construct a Confidence
Interval. Annals of Statistics 14(4), 1453-1462.
La Porta, R., Lopez-de-Silanese, F. Shleifer, A., Vishny, R.W., 1998., Law and Finance.
Journal of Political Economy 106, 1113-1155.
Li, S., Liu F., Liu, S., Whtimore, G.A., 2001. Comparative Performance of Chinese
Commercial Banks: Analysis, findings and policy implications. Review of Quantitative
Finance and Accounting 16, 149-170.
Sala-i-Martin, X. X., 1996. The Classical Approach to Convergence Analysis. The Economic
Journal 106(437), 1019-1036.
Simar, L., Wilson, P.W., 2000. A General Methodology for Bootstrapping in Non-Parametric
Frontier Models. Journal of Applied Statistics 27, 779-802.
Simar, L., Wilson, P.W., 1998. Sensitivity Analysis of Efficiency Scores: How to Bootstrap
in Non-Parametric Frontier Models. Management Science 44, 49-61.
Tennant, D., 2006. Are interest rate spreads in Jamaica too large? Views from within the
sector. Social and Economic Studies 55(3), 88-111.