Post-crisis cost efficiency of Jamaican banks
26
Cardiff Economics Working Papers Jenifer Daley, Kent Matthews and Tiantian Zhang Post-crisis cost efficiency of Jamaican banks E2011/27 CARDIFF BUSINESS SCHOOL WORKING PAPER SERIES This working paper is produced for discussion purpose only. These working papers are expected to be published in due course, in revised form, and should not be quoted or cited without the author’s written permission. Cardiff Economics Working Papers are available online from: http://www.cardiff.ac.uk/carbs/econ/workingpapers Enquiries: [email protected] ISSN 1749-6101 November 2011 Cardiff Business School Cardiff University Colum Drive Cardiff CF10 3EU United Kingdom t: +44 (0)29 2087 4000 f: +44 (0)29 2087 4419 www.cardiff.ac.uk/carbs
-
Upload
independent -
Category
Documents
-
view
0 -
download
0
Transcript of Post-crisis cost efficiency of Jamaican banks

Cardiff Economics
Working Papers
Jenifer Daley, Kent Matthews and Tiantian Zhang
Post-crisis cost efficiency of Jamaican banks
E2011/27
CARDIFF BUSINESS SCHOOL WORKING PAPER SERIES
This working paper is produced for discussion purpose only. These working papers are expected to be published in
due course, in revised form, and should not be quoted or cited without the author’s written permission.
Cardiff Economics Working Papers are available online from: http://www.cardiff.ac.uk/carbs/econ/workingpapers
Enquiries: [email protected]
ISSN 1749-6101
November 2011
Cardiff Business School
Cardiff University
Colum Drive
Cardiff CF10 3EU
United Kingdom
t: +44 (0)29 2087 4000
f: +44 (0)29 2087 4419
www.cardiff.ac.uk/carbs

Post-crisis cost efficiency of Jamaican banks
Jenifer Daley*, Kent Matthews** and Tiantian Zhang**
October 2011
*Department of Management Studies, University of the West Indies, Mona, Kingston
7, Jamaica
**Cardiff Business School, Cardiff University, Colum Drive, Cardiff, CF10 3EU,
Wales, U.K.
Abstract
Deregulation, re-regulation and continuing globalisation embody an imperative that banks
increase efficiency in order to survive. We employ the Simar-Wilson (2007) two-step double
bootstrap Data Envelopment Analysis method to measure whether cost efficiency among
Jamaican banks has improved between 1999 and 2009 following a number of post-crisis
responses aimed at strengthening and improving the sector. Efficiency is extracted from a
meta-frontier construction for the full sample period. In addition we conduct tests for
unconditional beta- and sigma-convergence and overall, the results suggest that there has
been a tendency towards improvement in bank efficiency levels for the industry as a whole
but there is also evidence that foreign banks show a higher trend improvement in efficiency.
Keywords: Bank efficiency, DEA, bootstrap, convergence, Jamaica
JEL Codes: G21, G28
Corresponding author: Kent Matthews, +44 2920 875855; email: [email protected]
We gratefully acknowledge funding support from The University of the West Indies, Mona
Campus, and NCB Foundation.
2
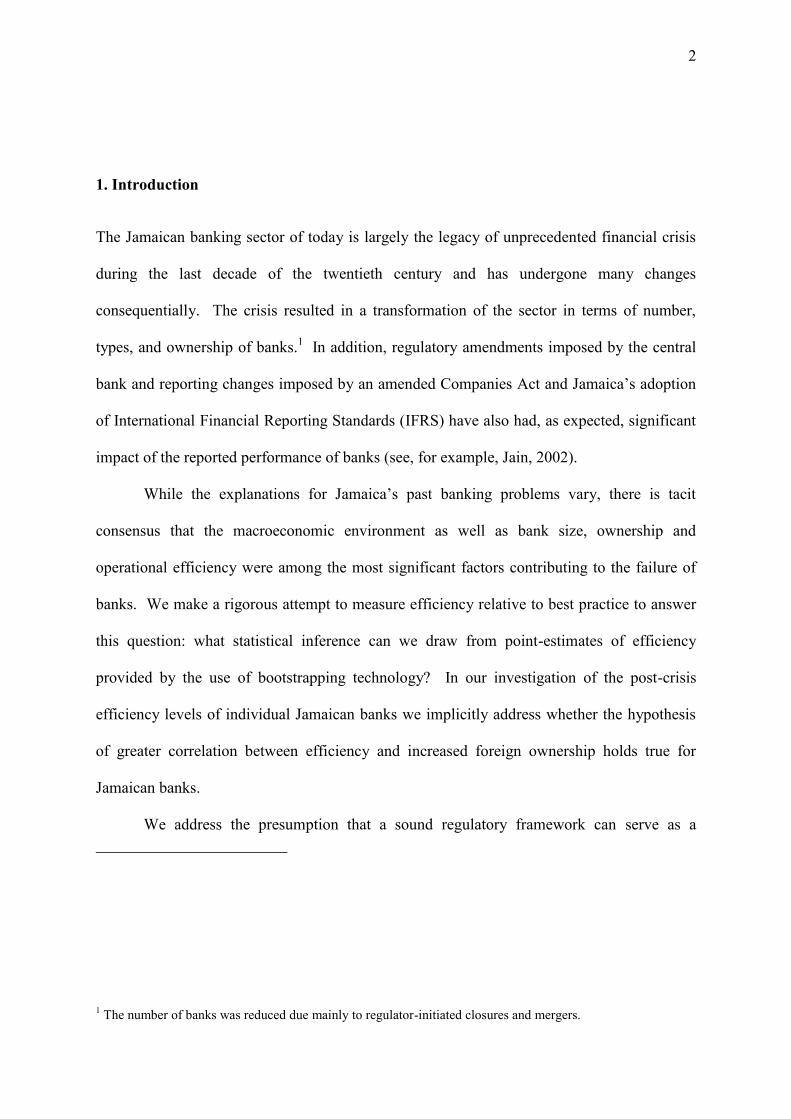
1. Introduction
The Jamaican banking sector of today is largely the legacy of unprecedented financial crisis
during the last decade of the twentieth century and has undergone many changes
consequentially. The crisis resulted in a transformation of the sector in terms of number,
types, and ownership of banks.1 In addition, regulatory amendments imposed by the central
bank and reporting changes imposed by an amended Companies Act and Jamaica’s adoption
of International Financial Reporting Standards (IFRS) have also had, as expected, significant
impact of the reported performance of banks (see, for example, Jain, 2002).
While the explanations for Jamaica’s past banking problems vary, there is tacit
consensus that the macroeconomic environment as well as bank size, ownership and
operational efficiency were among the most significant factors contributing to the failure of
banks. We make a rigorous attempt to measure efficiency relative to best practice to answer
this question: what statistical inference can we draw from point-estimates of efficiency
provided by the use of bootstrapping technology? In our investigation of the post-crisis
efficiency levels of individual Jamaican banks we implicitly address whether the hypothesis
of greater correlation between efficiency and increased foreign ownership holds true for
Jamaican banks.
We address the presumption that a sound regulatory framework can serve as a
1 The number of banks was reduced due mainly to regulator-initiated closures and mergers.
3
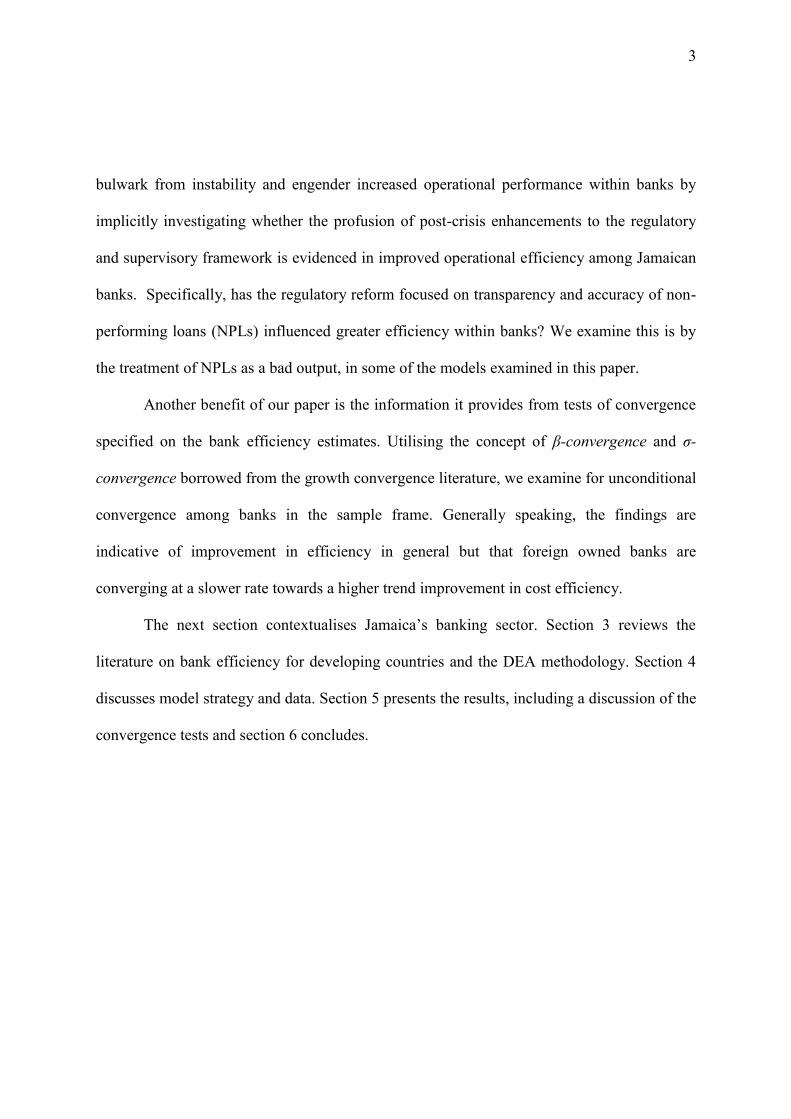
bulwark from instability and engender increased operational performance within banks by
implicitly investigating whether the profusion of post-crisis enhancements to the regulatory
and supervisory framework is evidenced in improved operational efficiency among Jamaican
banks. Specifically, has the regulatory reform focused on transparency and accuracy of non-
performing loans (NPLs) influenced greater efficiency within banks? We examine this is by
the treatment of NPLs as a bad output, in some of the models examined in this paper.
Another benefit of our paper is the information it provides from tests of convergence
specified on the bank efficiency estimates. Utilising the concept of β-convergence and σ-
convergence borrowed from the growth convergence literature, we examine for unconditional
convergence among banks in the sample frame. Generally speaking, the findings are
indicative of improvement in efficiency in general but that foreign owned banks are
converging at a slower rate towards a higher trend improvement in cost efficiency.
The next section contextualises Jamaica’s banking sector. Section 3 reviews the
literature on bank efficiency for developing countries and the DEA methodology. Section 4
discusses model strategy and data. Section 5 presents the results, including a discussion of the
convergence tests and section 6 concludes.
4
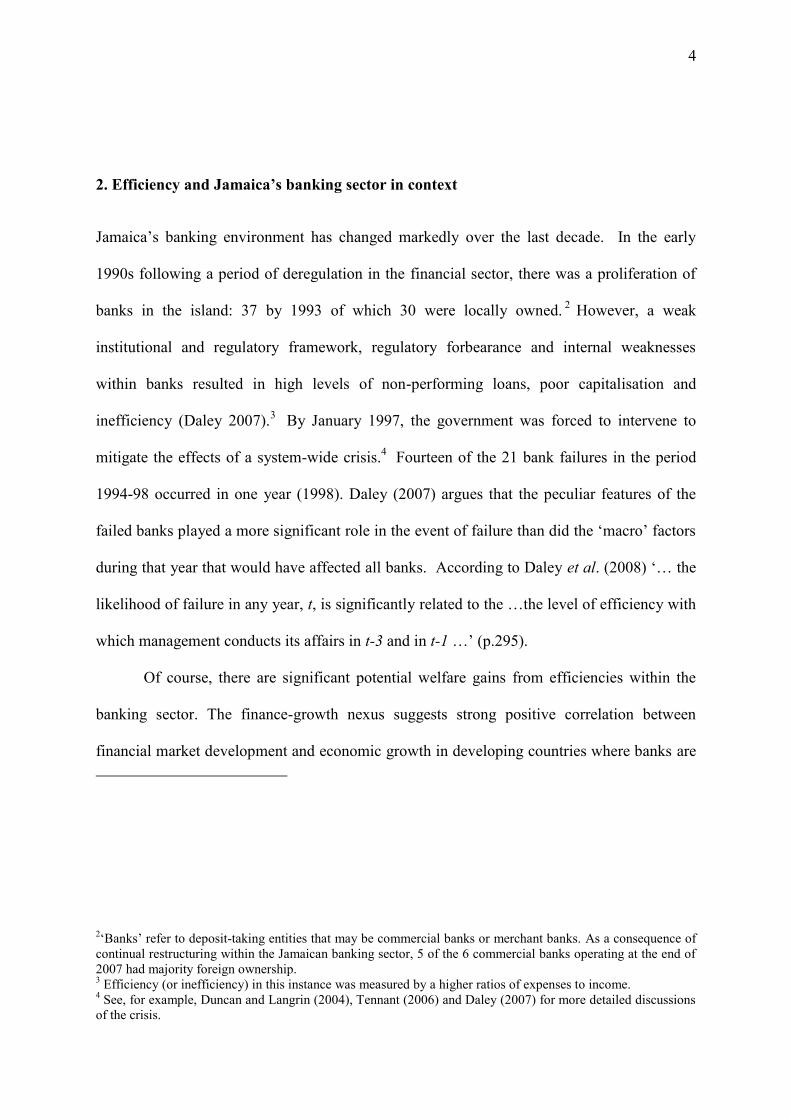
2. Efficiency and Jamaica’s banking sector in context
Jamaica’s banking environment has changed markedly over the last decade. In the early
1990s following a period of deregulation in the financial sector, there was a proliferation of
banks in the island: 37 by 1993 of which 30 were locally owned.2 However, a weak
institutional and regulatory framework, regulatory forbearance and internal weaknesses
within banks resulted in high levels of non-performing loans, poor capitalisation and
inefficiency (Daley 2007).3 By January 1997, the government was forced to intervene to
mitigate the effects of a system-wide crisis.4 Fourteen of the 21 bank failures in the period
1994-98 occurred in one year (1998). Daley (2007) argues that the peculiar features of the
failed banks played a more significant role in the event of failure than did the ‘macro’ factors
during that year that would have affected all banks. According to Daley et al. (2008) ‘… the
likelihood of failure in any year, t, is significantly related to the …the level of efficiency with
which management conducts its affairs in t-3 and in t-1 …’ (p.295).
Of course, there are significant potential welfare gains from efficiencies within the
banking sector. The finance-growth nexus suggests strong positive correlation between
financial market development and economic growth in developing countries where banks are
2‘Banks’ refer to deposit-taking entities that may be commercial banks or merchant banks. As a consequence of
continual restructuring within the Jamaican banking sector, 5 of the 6 commercial banks operating at the end of
2007 had majority foreign ownership. 3 Efficiency (or inefficiency) in this instance was measured by a higher ratios of expenses to income.
4 See, for example, Duncan and Langrin (2004), Tennant (2006) and Daley (2007) for more detailed discussions
of the crisis.

5
the primary intermediary, as capital markets tend to be thin and not well developed (see, for,
La Porta example et al. 1998). The events taking place both within and outside of the
Jamaican banking sector since the 1990s dictate the need for continued focused attention and
examination of those factors that are significant correlates to banks’ performance and
ultimately banking and financial sector system stability.
The efficiency optimisation imperative is acknowledged and, indeed, well-understood
in Jamaica, where efficiency is increasingly emphasised as a priority in performance targets.
Unfortunately, banking efficiency in Jamaica remains under-researched. This is probably due
to the relatively small number of banks and the inaccessibility to high-quality bank-specific
data. While several authors make reference to efficiency in relation to bank spreads (for
example, Tennant 2006) or bank failure (Daley 2007; Daley et al. 2008), Bailey (2006) is the
only known study to have specifically examined efficiency in the Jamaican banking sector
between 2005 and 2006. We contribute to the literature on banking efficiency in developing
countries by examining the efficiency of Jamaican banks at the firm level between 1998 and
2009. This is the first work to our knowledge to examine efficiency in banking using non-
parametric bootstrapping technology and to perform a test of convergence on bank efficiency
for Jamaica.
3. Bank efficiency literature and methodology
Tennant’s (2006) examination of interest rate spreads in Jamaica argues that interest rate
spreads act as ‘a key indicator of [an] institution’s efficiency’ (p.88), and reports from a
survey of Jamaican financial sector stakeholders that recorded high spreads have been
attributed to inefficiency, inter alia. Consequently, he notes the perception that increased
6
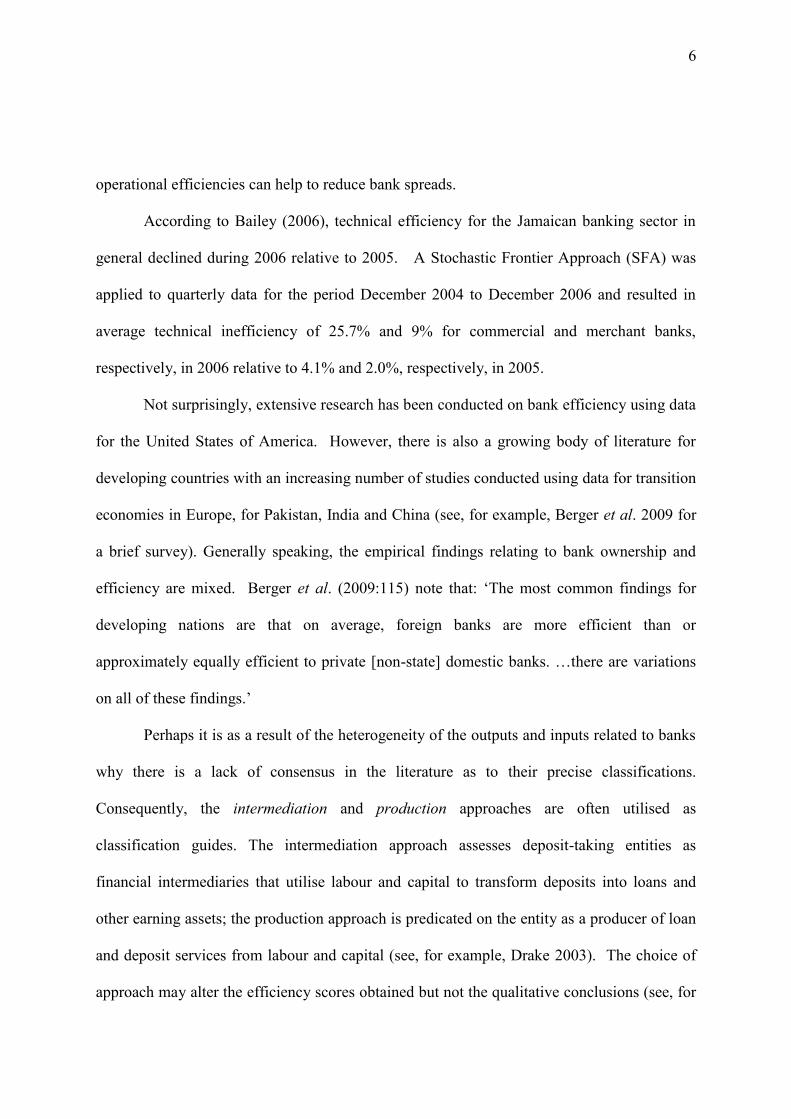
operational efficiencies can help to reduce bank spreads.
According to Bailey (2006), technical efficiency for the Jamaican banking sector in
general declined during 2006 relative to 2005. A Stochastic Frontier Approach (SFA) was
applied to quarterly data for the period December 2004 to December 2006 and resulted in
average technical inefficiency of 25.7% and 9% for commercial and merchant banks,
respectively, in 2006 relative to 4.1% and 2.0%, respectively, in 2005.
Not surprisingly, extensive research has been conducted on bank efficiency using data
for the United States of America. However, there is also a growing body of literature for
developing countries with an increasing number of studies conducted using data for transition
economies in Europe, for Pakistan, India and China (see, for example, Berger et al. 2009 for
a brief survey). Generally speaking, the empirical findings relating to bank ownership and
efficiency are mixed. Berger et al. (2009:115) note that: ‘The most common findings for
developing nations are that on average, foreign banks are more efficient than or
approximately equally efficient to private [non-state] domestic banks. …there are variations
on all of these findings.’
Perhaps it is as a result of the heterogeneity of the outputs and inputs related to banks
why there is a lack of consensus in the literature as to their precise classifications.
Consequently, the intermediation and production approaches are often utilised as
classification guides. The intermediation approach assesses deposit-taking entities as
financial intermediaries that utilise labour and capital to transform deposits into loans and
other earning assets; the production approach is predicated on the entity as a producer of loan
and deposit services from labour and capital (see, for example, Drake 2003). The choice of
approach may alter the efficiency scores obtained but not the qualitative conclusions (see, for
7
example, Berger et al. 1997).
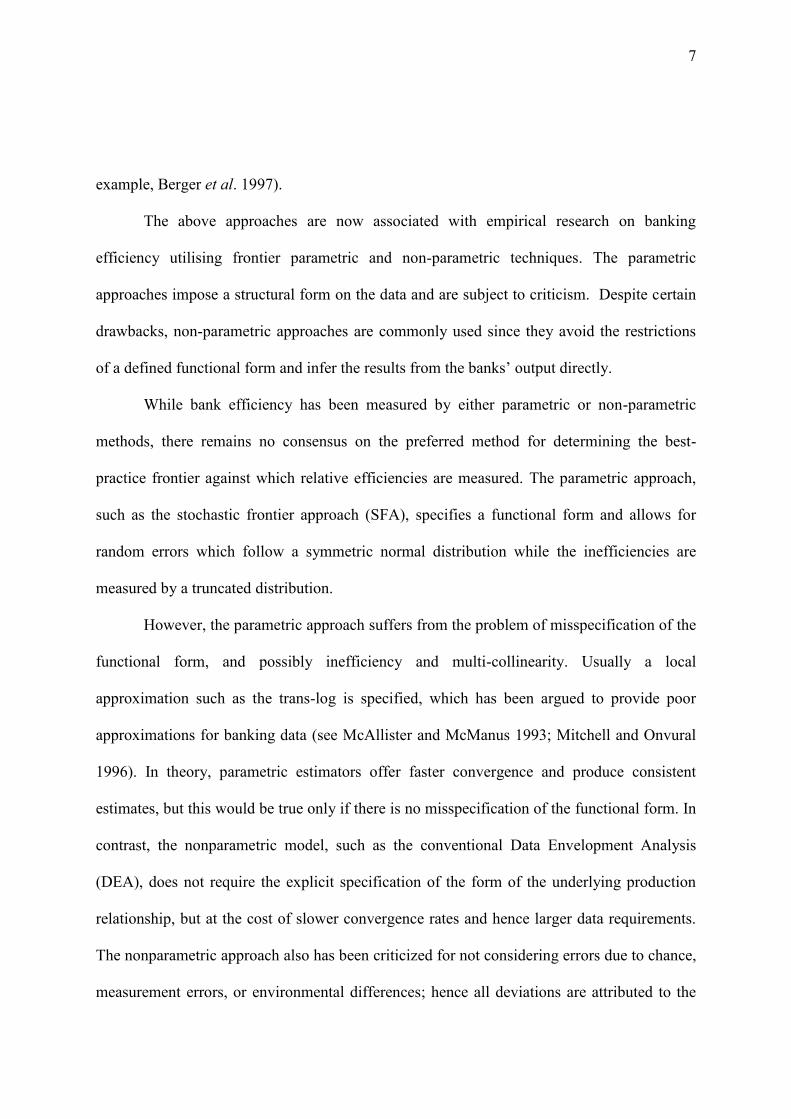
The above approaches are now associated with empirical research on banking
efficiency utilising frontier parametric and non-parametric techniques. The parametric
approaches impose a structural form on the data and are subject to criticism. Despite certain
drawbacks, non-parametric approaches are commonly used since they avoid the restrictions
of a defined functional form and infer the results from the banks’ output directly.
While bank efficiency has been measured by either parametric or non-parametric
methods, there remains no consensus on the preferred method for determining the best-
practice frontier against which relative efficiencies are measured. The parametric approach,
such as the stochastic frontier approach (SFA), specifies a functional form and allows for
random errors which follow a symmetric normal distribution while the inefficiencies are
measured by a truncated distribution.
However, the parametric approach suffers from the problem of misspecification of the
functional form, and possibly inefficiency and multi-collinearity. Usually a local
approximation such as the trans-log is specified, which has been argued to provide poor
approximations for banking data (see McAllister and McManus 1993; Mitchell and Onvural
1996). In theory, parametric estimators offer faster convergence and produce consistent
estimates, but this would be true only if there is no misspecification of the functional form. In
contrast, the nonparametric model, such as the conventional Data Envelopment Analysis
(DEA), does not require the explicit specification of the form of the underlying production
relationship, but at the cost of slower convergence rates and hence larger data requirements.
The nonparametric approach also has been criticized for not considering errors due to chance,
measurement errors, or environmental differences; hence all deviations are attributed to the
8
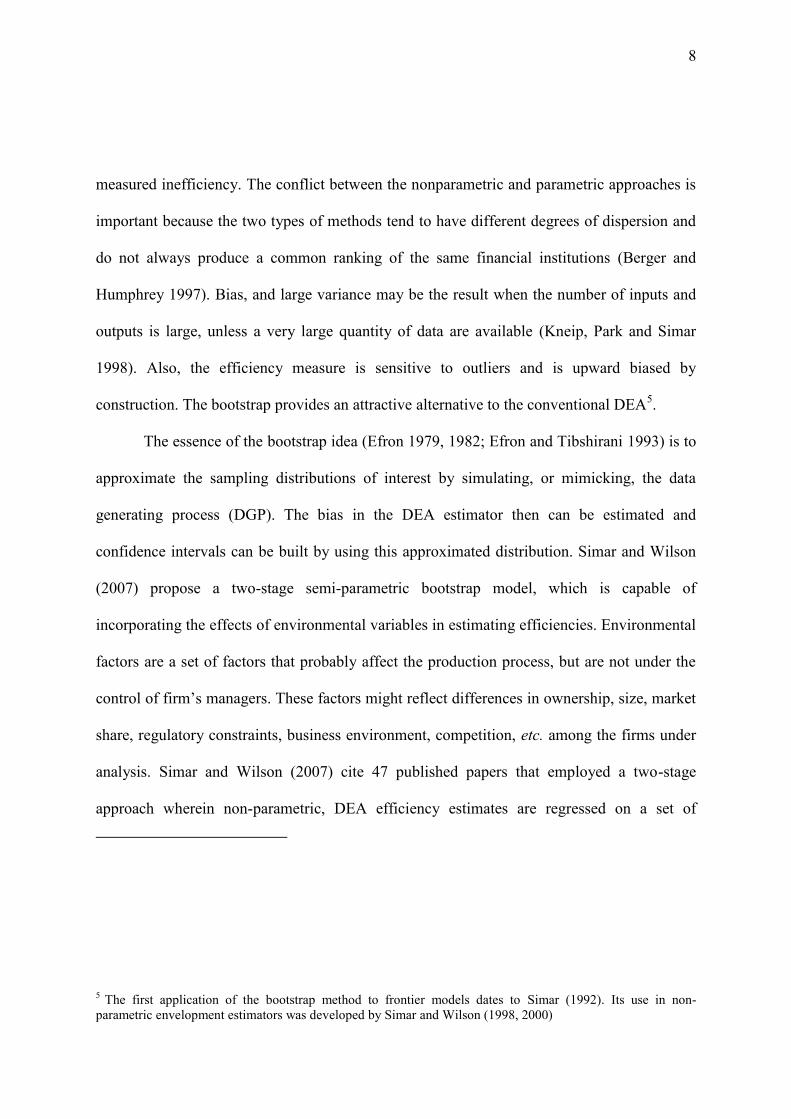
measured inefficiency. The conflict between the nonparametric and parametric approaches is
important because the two types of methods tend to have different degrees of dispersion and
do not always produce a common ranking of the same financial institutions (Berger and
Humphrey 1997). Bias, and large variance may be the result when the number of inputs and
outputs is large, unless a very large quantity of data are available (Kneip, Park and Simar
1998). Also, the efficiency measure is sensitive to outliers and is upward biased by
construction. The bootstrap provides an attractive alternative to the conventional DEA5.
The essence of the bootstrap idea (Efron 1979, 1982; Efron and Tibshirani 1993) is to
approximate the sampling distributions of interest by simulating, or mimicking, the data
generating process (DGP). The bias in the DEA estimator then can be estimated and
confidence intervals can be built by using this approximated distribution. Simar and Wilson
(2007) propose a two-stage semi-parametric bootstrap model, which is capable of
incorporating the effects of environmental variables in estimating efficiencies. Environmental
factors are a set of factors that probably affect the production process, but are not under the
control of firm’s managers. These factors might reflect differences in ownership, size, market
share, regulatory constraints, business environment, competition, etc. among the firms under
analysis. Simar and Wilson (2007) cite 47 published papers that employed a two-stage
approach wherein non-parametric, DEA efficiency estimates are regressed on a set of
5 The first application of the bootstrap method to frontier models dates to Simar (1992). Its use in non-
parametric envelopment estimators was developed by Simar and Wilson (1998, 2000)

9
environmental variables in a parametric, second-stage analysis. The typical two-stage
approaches do not provided a coherent description of a DGP, and the method of inference is
flawed since the DEA efficiency estimates are biased estimates and are serially correlated, in
a complicated, and unknown way.
In order to deal with the problem described above, Simar and Wilson (2007) define a
DGP that provides a rational basis for regressing non-parametric, DEA efficiency estimates
on some environmental variables in a second-stage analysis. In addition, they suggest
bootstrap procedures to provide valid inference in the second-stage regression, as well as to
increase the efficiency of estimation and correct the estimation bias6.
Following Färe, Grosskopf and Lovell (1985) the efficiency of a firm can be defined
and measured as the radial distance of its actual performance from a frontier. In the first
stage, we employ the Tone (2002) new cost efficiency model, which allows for heterogeneity
in unit prices of input. As a general rule, efficiency levels measured relative to one frontier
cannot be directly compared with efficiency levels measured relative to another frontier. In
order to make the later cross-time convergence analysis more sensible, we use a meta-frontier
framework, wherein, efficiencies of all observations are measured relative to a common
frontier for the full sample period. We chose to use the input oriented efficiency measure and
constant return to scale (CRS) is assumed as an optimal scale in the long run.
6 We adopt the algorithm 2 of the two-stage semi-parametric double bootstrapping method set out by Simar and
Wilson (2007).
10
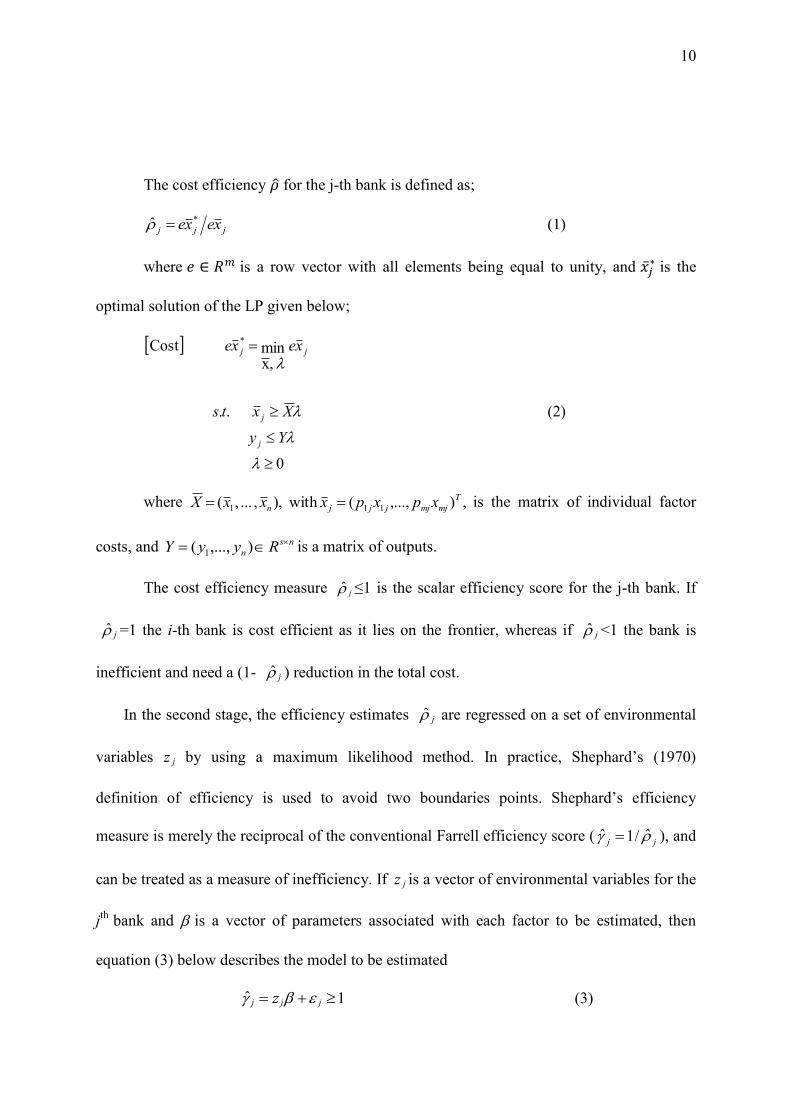
The cost efficiency for the j-th bank is defined as;
(1) ˆ *
jjj xexe
where is a row vector with all elements being equal to unity, and is the
optimal solution of the LP given below;
0
(2) ..
min ,x
Cost *
Yy
Xxts
xexe
j
j
jj
where ,),...,( with ),, ... ,( 111
T
mjmjjjjn xpxpxxxX is the matrix of individual factor
costs, and ns
n RyyY ),...,( 1 is a matrix of outputs.
The cost efficiency measure ≤1 is the scalar efficiency score for the j-th bank. If
j =1 the i-th bank is cost efficient as it lies on the frontier, whereas if j <1 the bank is
inefficient and need a (1- j ) reduction in the total cost.
In the second stage, the efficiency estimates j are regressed on a set of environmental
variables jz by using a maximum likelihood method. In practice, Shephard’s (1970)
definition of efficiency is used to avoid two boundaries points. Shephard’s efficiency
measure is merely the reciprocal of the conventional Farrell efficiency score ( jj ˆ/1ˆ ), and
can be treated as a measure of inefficiency. If jz is a vector of environmental variables for the
jth
bank and is a vector of parameters associated with each factor to be estimated, then
equation (3) below describes the model to be estimated
1ˆ jjj z (3)
j
11
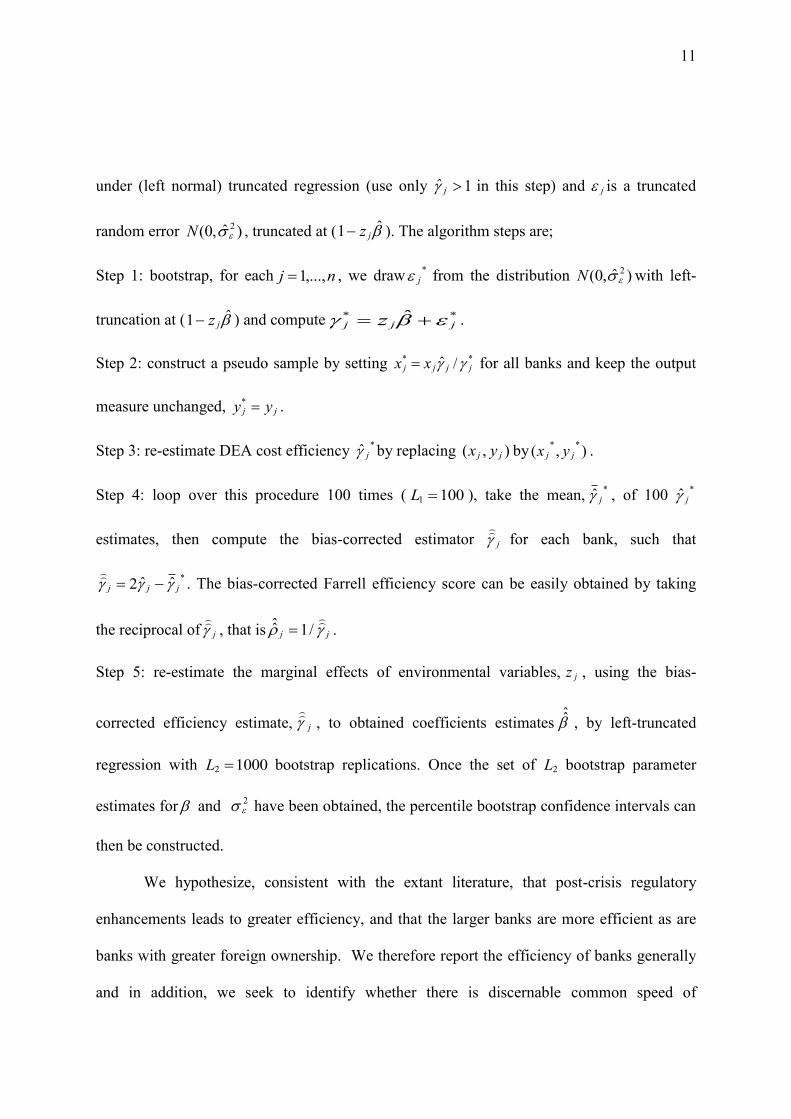
under (left normal) truncated regression (use only 1ˆ j in this step) and j is a truncated
random error )ˆ,0( 2N , truncated at ( 1 jz ). The algorithm steps are;
Step 1: bootstrap, for each nj ,...,1 , we draw*
j from the distribution )ˆ,0( 2N with left-
truncation at ( 1 jz ) and compute ** ˆjjj z .
Step 2: construct a pseudo sample by setting ** /ˆ jjjj xx for all banks and keep the output
measure unchanged, jj yy * .
Step 3: re-estimate DEA cost efficiency *
ˆ j by replacing ),( jj yx by ),(**
jj yx .
Step 4: loop over this procedure 100 times ( 1001 L ), take the mean,*
ˆ j , of 100 *
ˆ j
estimates, then compute the bias-corrected estimator j
for each bank, such that
*ˆˆ2 jjj
. The bias-corrected Farrell efficiency score can be easily obtained by taking
the reciprocal of j
, that is jj
/1ˆ .
Step 5: re-estimate the marginal effects of environmental variables, jz , using the bias-
corrected efficiency estimate, j
, to obtained coefficients estimates ˆ
, by left-truncated
regression with 10002 L bootstrap replications. Once the set of 2L bootstrap parameter
estimates for and 2 have been obtained, the percentile bootstrap confidence intervals can
then be constructed.
We hypothesize, consistent with the extant literature, that post-crisis regulatory
enhancements leads to greater efficiency, and that the larger banks are more efficient as are
banks with greater foreign ownership. We therefore report the efficiency of banks generally
and in addition, we seek to identify whether there is discernable common speed of
12
convergence across the banks.
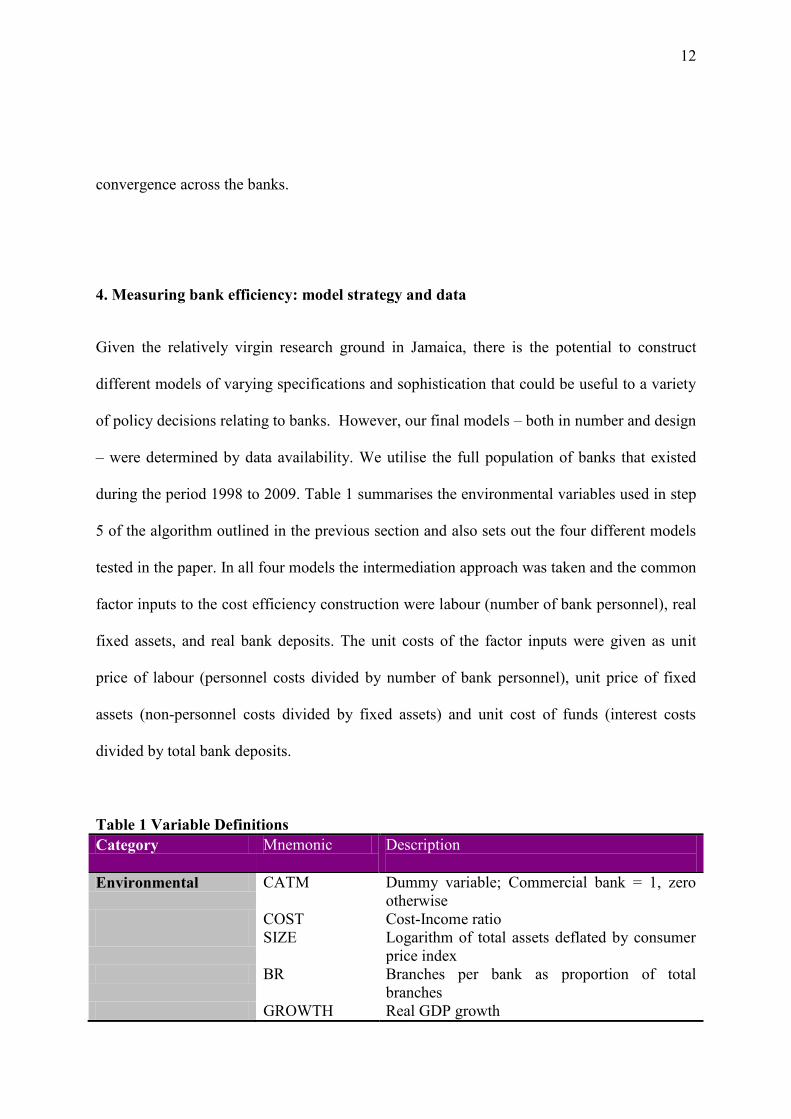
4. Measuring bank efficiency: model strategy and data
Given the relatively virgin research ground in Jamaica, there is the potential to construct
different models of varying specifications and sophistication that could be useful to a variety
of policy decisions relating to banks. However, our final models – both in number and design
– were determined by data availability. We utilise the full population of banks that existed
during the period 1998 to 2009. Table 1 summarises the environmental variables used in step
5 of the algorithm outlined in the previous section and also sets out the four different models
tested in the paper. In all four models the intermediation approach was taken and the common
factor inputs to the cost efficiency construction were labour (number of bank personnel), real
fixed assets, and real bank deposits. The unit costs of the factor inputs were given as unit
price of labour (personnel costs divided by number of bank personnel), unit price of fixed
assets (non-personnel costs divided by fixed assets) and unit cost of funds (interest costs
divided by total bank deposits.
Table 1 Variable Definitions
Category Mnemonic Description
Environmental CATM Dummy variable; Commercial bank = 1, zero
otherwise
COST Cost-Income ratio
SIZE Logarithm of total assets deflated by consumer
price index
BR Branches per bank as proportion of total
branches
GROWTH Real GDP growth
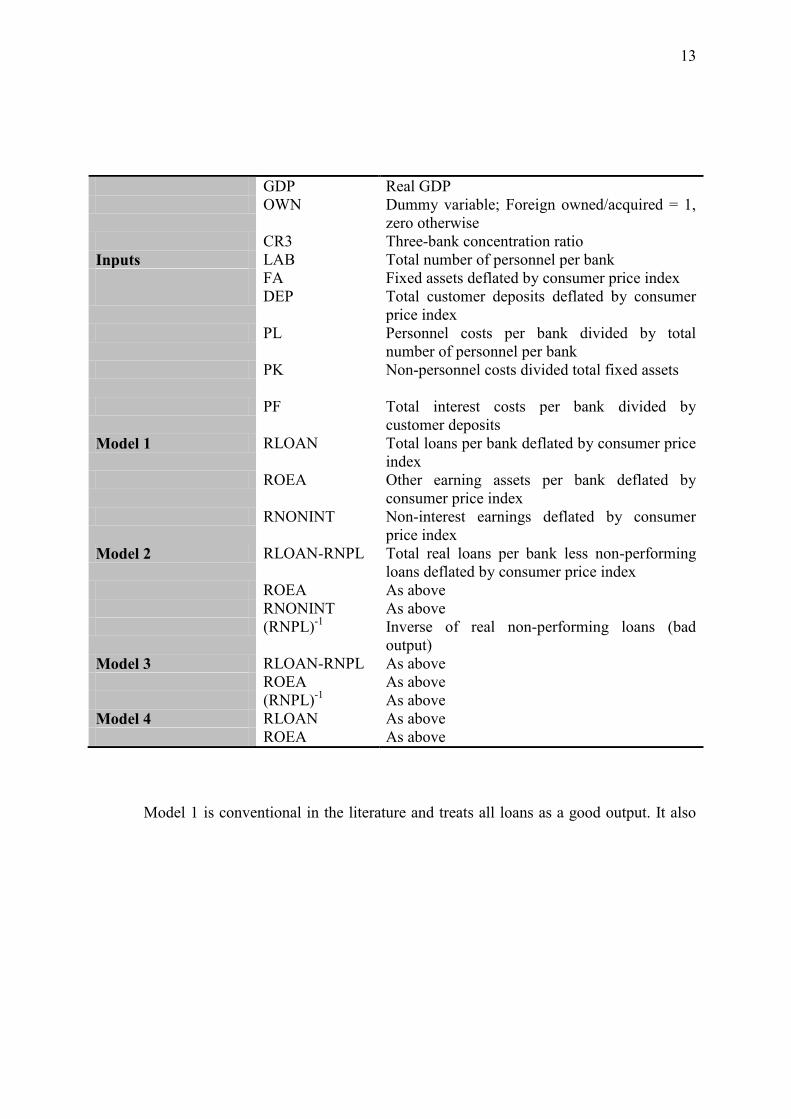
13
GDP Real GDP
OWN Dummy variable; Foreign owned/acquired = 1,
zero otherwise
CR3 Three-bank concentration ratio
Inputs LAB Total number of personnel per bank
FA Fixed assets deflated by consumer price index
DEP Total customer deposits deflated by consumer
price index
PL Personnel costs per bank divided by total
number of personnel per bank
PK Non-personnel costs divided total fixed assets
PF Total interest costs per bank divided by
customer deposits
Model 1 RLOAN Total loans per bank deflated by consumer price
index
ROEA Other earning assets per bank deflated by
consumer price index
RNONINT Non-interest earnings deflated by consumer
price index
Model 2 RLOAN-RNPL Total real loans per bank less non-performing
loans deflated by consumer price index
ROEA As above
RNONINT As above
(RNPL)-1
Inverse of real non-performing loans (bad
output)
Model 3 RLOAN-RNPL As above
ROEA As above
(RNPL)-1
As above
Model 4 RLOAN As above
ROEA As above
Model 1 is conventional in the literature and treats all loans as a good output. It also

14
treats the non-interest income flows of a bank as an output. The traditional measure of bank
income is interest income, but many banks de-emphasise the less profitable ‘plain vanilla’
banking function, to promote a broader role and emphasize a wider range of services7 (for
example, Drake 2003). Model 2 differs from model 1 in that it takes performing loans as an
output so as to give zero weight to NPLs and following Thanassoulis et al. (2008) treats
NPLs as a bad output by defining a variable that is its inverse. Model 3 removes non-interest
earnings from the set of outputs but continues to treat only performing loans as a good output
and NPLs as a bad output. Model 4 is a restrictive version of Model 1 and excludes non-
interest earnings from the set of output.
We test our hypotheses using annual audited unconsolidated financial data for all
Jamaican banks during the period 1998 to 2009 as available. Data were obtained from
publicly available resources, including Bankscope, financial statements and Annual Reports,
the website of the respective banks, the website of the Central Bank, and media reports.8
Notably, all the banks now use International Financial Reporting Standards (IFRS) to report
financial information.9 In the final analysis we used an unbalanced panel of 12 banks with
108 bank-year observations.
7 Non-interest earnings are a flow of income which proxies the stock equivalent so that the integrity of the
outputs as stocks is maintained. 8 Bankscope database is a resource providing financial and other data for over 29,000 banks all over the world.
9 IFRS was adopted or all financial reporting on or after July 1, 2002. Some financial statements have therefore
been reported using the superseded local accounting standards (Local GAAP). Daley (2004), Jain (2002) and
Daley (2002), for example, discuss the likely impact of the change.
15
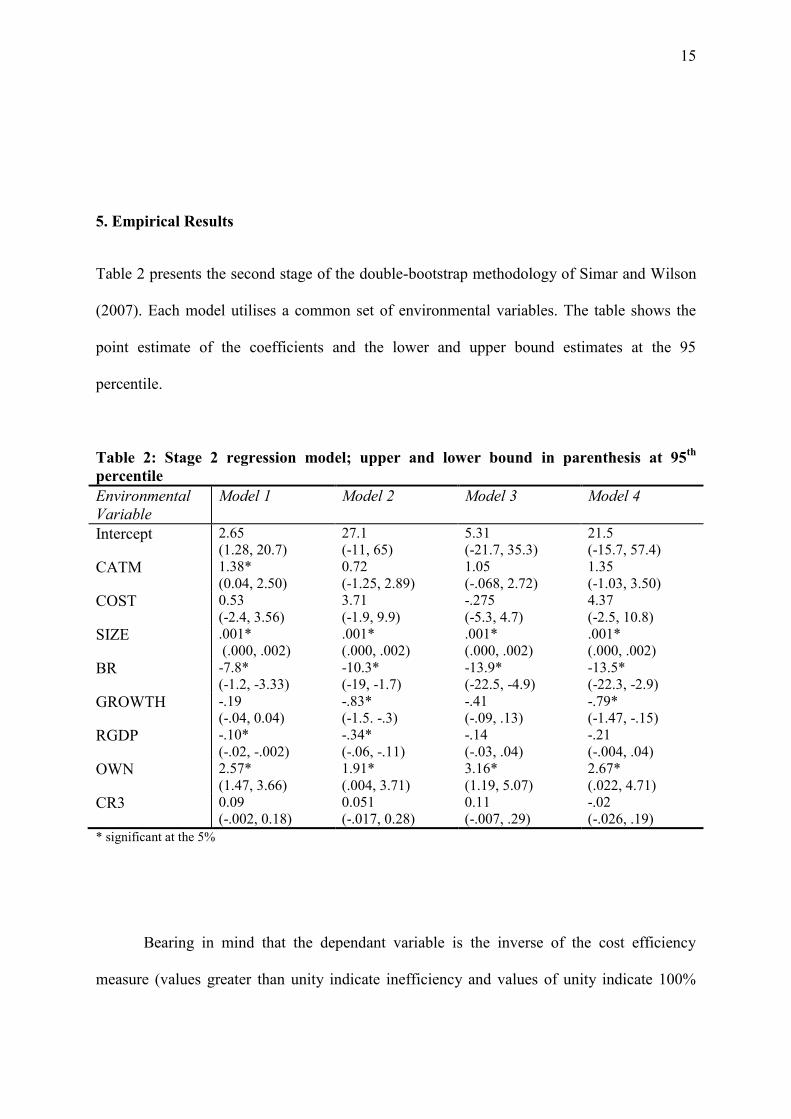
5. Empirical Results
Table 2 presents the second stage of the double-bootstrap methodology of Simar and Wilson
(2007). Each model utilises a common set of environmental variables. The table shows the
point estimate of the coefficients and the lower and upper bound estimates at the 95
percentile.
Table 2: Stage 2 regression model; upper and lower bound in parenthesis at 95th
percentile
Environmental
Variable
Model 1 Model 2 Model 3 Model 4
Intercept 2.65
(1.28, 20.7)
27.1
(-11, 65)
5.31
(-21.7, 35.3)
21.5
(-15.7, 57.4)
CATM 1.38*
(0.04, 2.50)
0.72
(-1.25, 2.89)
1.05
(-.068, 2.72)
1.35
(-1.03, 3.50)
COST 0.53
(-2.4, 3.56)
3.71
(-1.9, 9.9)
-.275
(-5.3, 4.7)
4.37
(-2.5, 10.8)
SIZE .001*
(.000, .002)
.001*
(.000, .002)
.001*
(.000, .002)
.001*
(.000, .002)
BR -7.8*
(-1.2, -3.33)
-10.3*
(-19, -1.7)
-13.9*
(-22.5, -4.9)
-13.5*
(-22.3, -2.9)
GROWTH -.19
(-.04, 0.04)
-.83*
(-1.5. -.3)
-.41
(-.09, .13)
-.79*
(-1.47, -.15)
RGDP -.10*
(-.02, -.002)
-.34*
(-.06, -.11)
-.14
(-.03, .04)
-.21
(-.004, .04)
OWN 2.57*
(1.47, 3.66)
1.91*
(.004, 3.71)
3.16*
(1.19, 5.07)
2.67*
(.022, 4.71)
CR3 0.09
(-.002, 0.18)
0.051
(-.017, 0.28)
0.11
(-.007, .29)
-.02
(-.026, .19)
* significant at the 5%
Bearing in mind that the dependant variable is the inverse of the cost efficiency
measure (values greater than unity indicate inefficiency and values of unity indicate 100%
16
efficiency), Table 2 provides consistent results for the role of size, branch network and
ownership. Size in terms of assets is associated with lower efficiency but banks with larger
branch networks are associated with higher efficiency. Contrary to expectations, foreign
ownership is associated with lower cost efficiency. One possible reason for this result is that
foreign acquisition of domestic banks occurred in the aftermath of the 1998-2000 banking
crisis picking up the weaker of the available banks. Macroeconomic factors play a role in
some of the models but the influence is not robust.
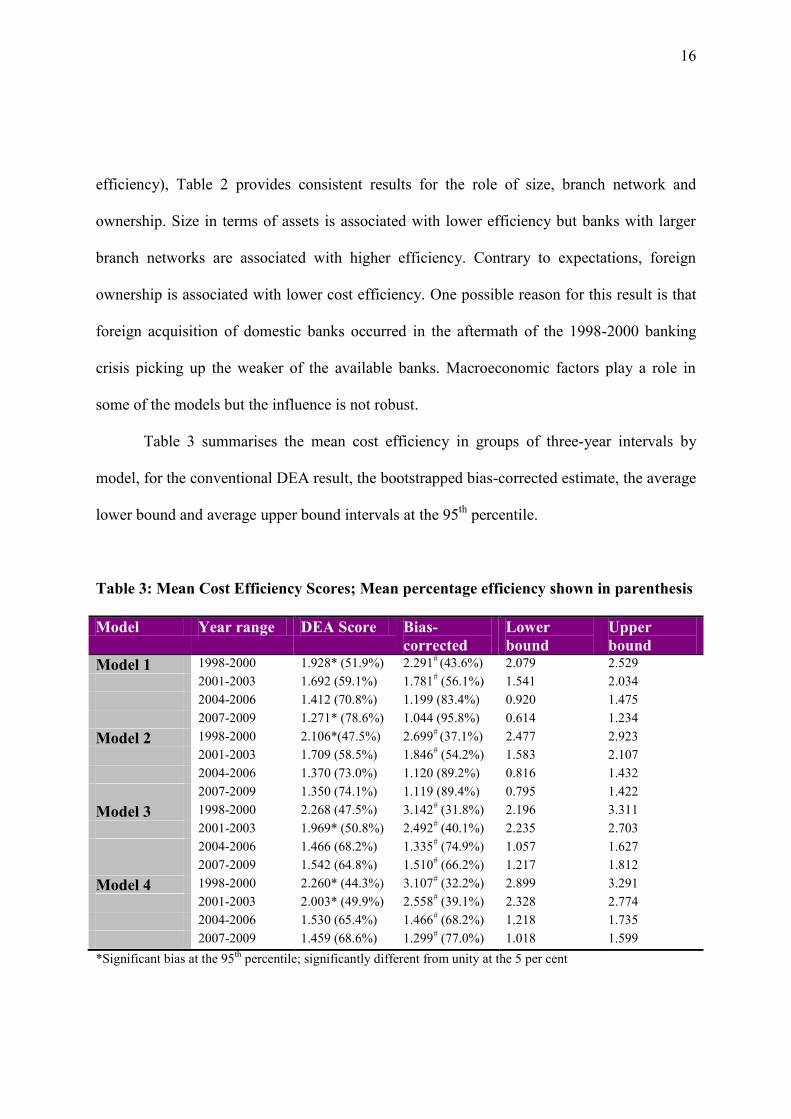
Table 3 summarises the mean cost efficiency in groups of three-year intervals by
model, for the conventional DEA result, the bootstrapped bias-corrected estimate, the average
lower bound and average upper bound intervals at the 95th
percentile.
Table 3: Mean Cost Efficiency Scores; Mean percentage efficiency shown in parenthesis
Model Year range DEA Score Bias-
corrected
Lower
bound
Upper
bound
Model 1 1998-2000 1.928* (51.9%) 2.291# (43.6%) 2.079 2.529
2001-2003 1.692 (59.1%) 1.781# (56.1%) 1.541 2.034
2004-2006 1.412 (70.8%) 1.199 (83.4%) 0.920 1.475
2007-2009 1.271* (78.6%) 1.044 (95.8%) 0.614 1.234
Model 2 1998-2000 2.106*(47.5%) 2.699# (37.1%) 2.477 2.923
2001-2003 1.709 (58.5%) 1.846# (54.2%) 1.583 2.107
2004-2006 1.370 (73.0%) 1.120 (89.2%) 0.816 1.432
2007-2009 1.350 (74.1%) 1.119 (89.4%) 0.795 1.422
Model 3 1998-2000 2.268 (47.5%) 3.142# (31.8%) 2.196 3.311
2001-2003 1.969* (50.8%) 2.492# (40.1%) 2.235 2.703
2004-2006 1.466 (68.2%) 1.335# (74.9%) 1.057 1.627
2007-2009 1.542 (64.8%) 1.510# (66.2%) 1.217 1.812
Model 4 1998-2000 2.260* (44.3%) 3.107# (32.2%) 2.899 3.291
2001-2003 2.003* (49.9%) 2.558# (39.1%) 2.328 2.774
2004-2006 1.530 (65.4%) 1.466# (68.2%) 1.218 1.735
2007-2009 1.459 (68.6%) 1.299# (77.0%) 1.018 1.599
*Significant bias at the 95th
percentile; significantly different from unity at the 5 per cent

17
As averages of individual scores the bias-corrected scores can only be interpreted as
indicative. However, they show that the bias in the plain DEA scores is not universally
frequent. Often the simple DEA score is not significantly different from the bias-corrected
score. However, the distribution of scores can confirm if the measured efficiency score is
significantly different from the benchmark. One noticeable feature is that the measure of
efficiency is lower in the models that include NPLs as a bad output. As a test for robustness
we report the simple correlation of the scores between each model for comparison10
. Table 4
shows the results.
Table 4 Simple correlations of efficiency scores
Model 1 Model 2 Model 3 Model 4
Model 1 1.0000
Model 2 0.9565 1.0000
Model 3 0.8717 0.9134 1.0000
Model 4 0.8947 0.8430 0.9315 1.0000
6. Tests for convergence
We borrow from the growth convergence literature of Barro and Sala-i-Martin (1992) to test
for unconditional β-convergence and σ-convergence. -convergence measures the speed of
10
Results from a Spearman rank correlation were very similar.
18
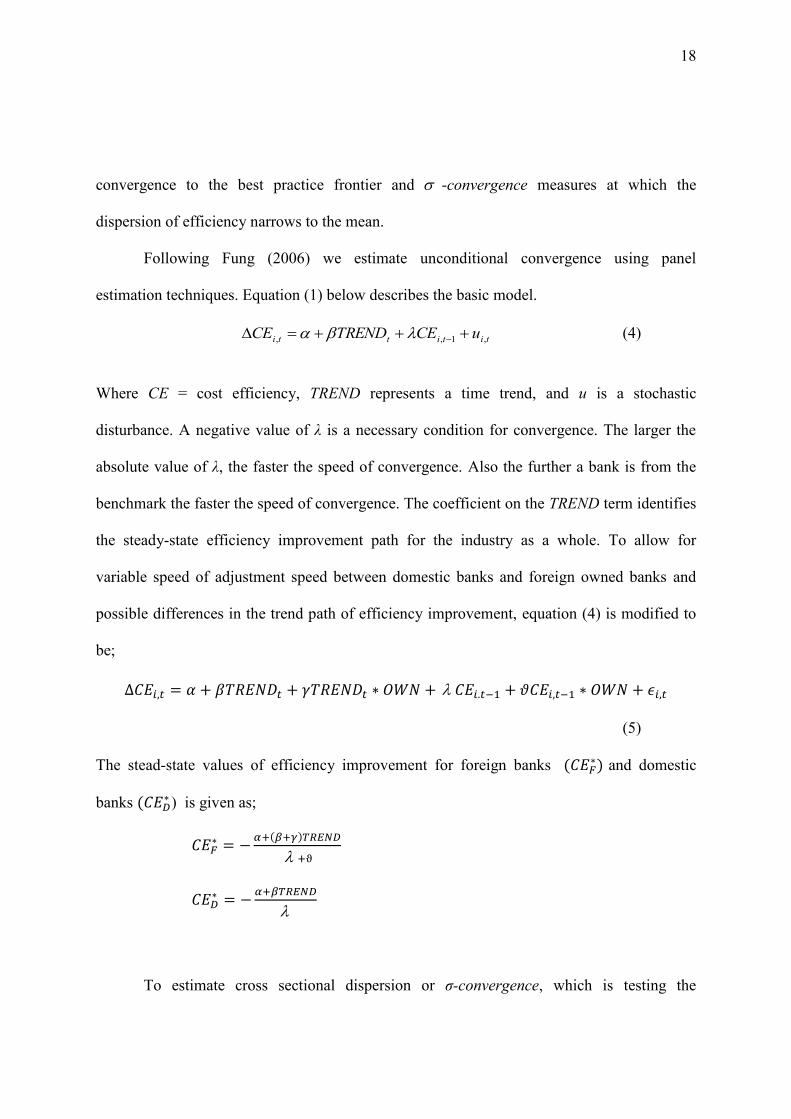
convergence to the best practice frontier and -convergence measures at which the
dispersion of efficiency narrows to the mean.
Following Fung (2006) we estimate unconditional convergence using panel
estimation techniques. Equation (1) below describes the basic model.
tititti uCETRENDCE ,1,, (4)
Where CE = cost efficiency, TREND represents a time trend, and u is a stochastic
disturbance. A negative value of λ is a necessary condition for convergence. The larger the
absolute value of λ, the faster the speed of convergence. Also the further a bank is from the
benchmark the faster the speed of convergence. The coefficient on the TREND term identifies
the steady-state efficiency improvement path for the industry as a whole. To allow for
variable speed of adjustment speed between domestic banks and foreign owned banks and
possible differences in the trend path of efficiency improvement, equation (4) is modified to
be;
(5)
The stead-state values of efficiency improvement for foreign banks and domestic
banks ) is given as;
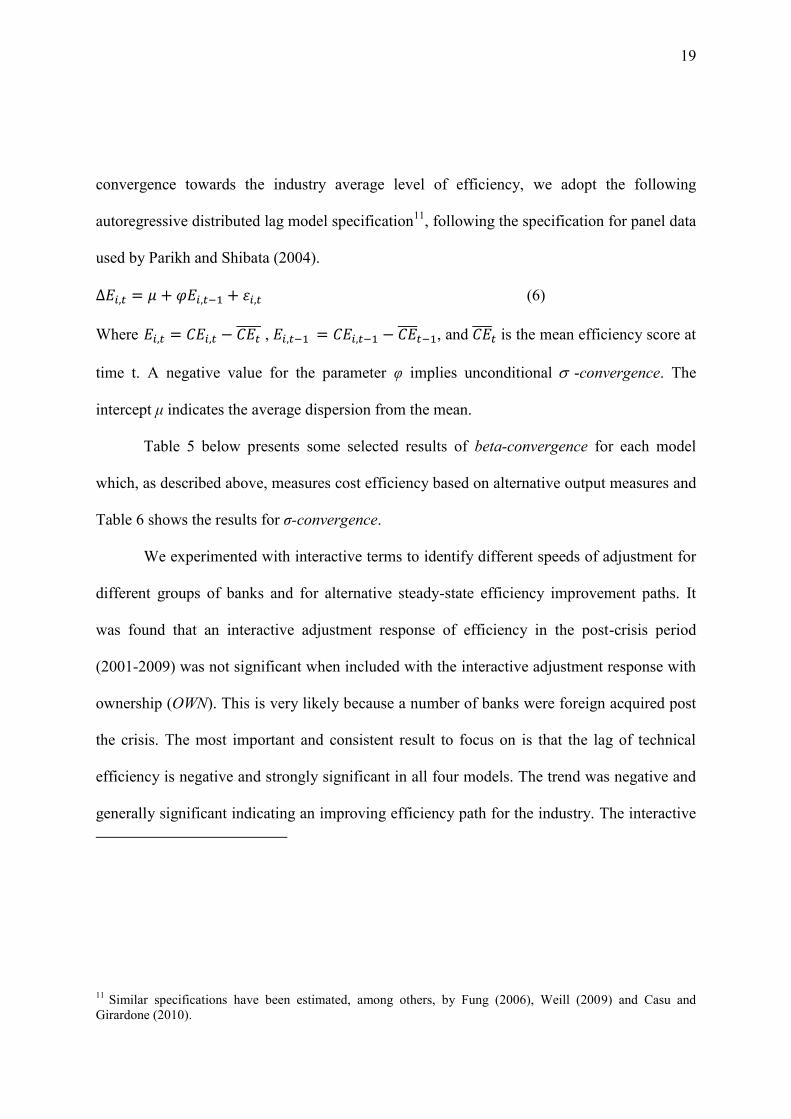
To estimate cross sectional dispersion or σ-convergence, which is testing the
19
convergence towards the industry average level of efficiency, we adopt the following
autoregressive distributed lag model specification11
, following the specification for panel data
used by Parikh and Shibata (2004).
(6)
Where , , and is the mean efficiency score at
time t. A negative value for the parameter φ implies unconditional -convergence. The
intercept μ indicates the average dispersion from the mean.
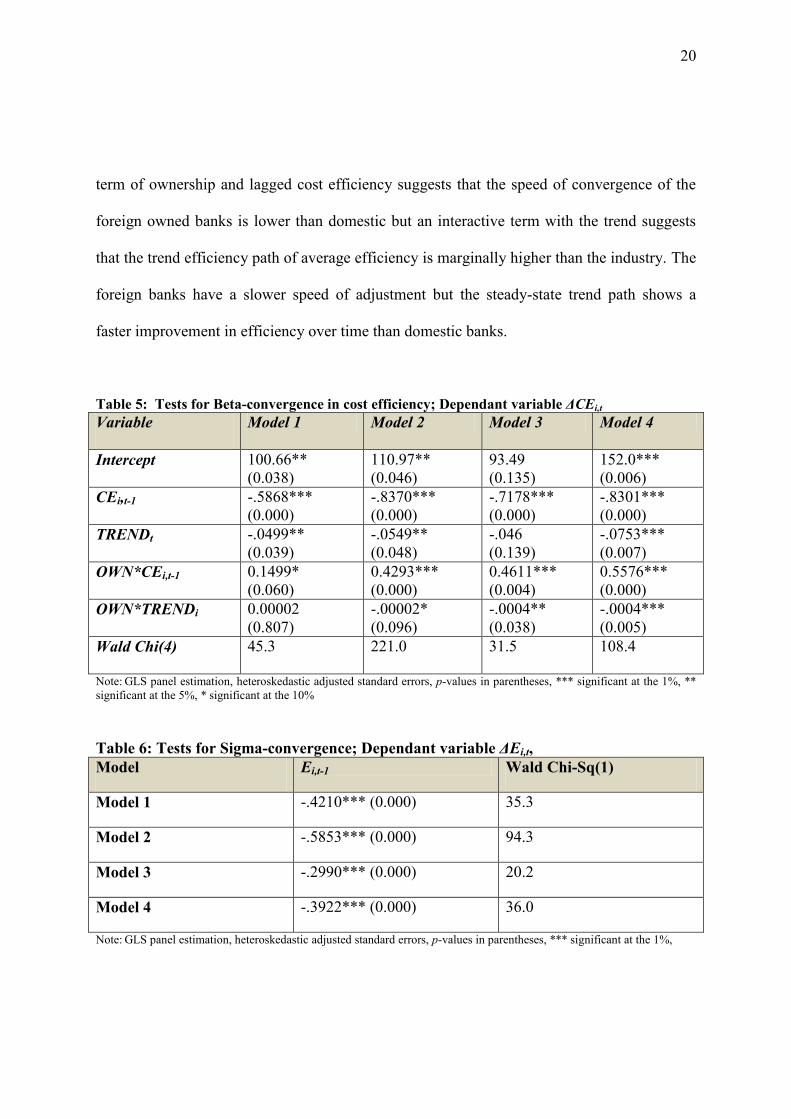
Table 5 below presents some selected results of beta-convergence for each model
which, as described above, measures cost efficiency based on alternative output measures and
Table 6 shows the results for σ-convergence.
We experimented with interactive terms to identify different speeds of adjustment for
different groups of banks and for alternative steady-state efficiency improvement paths. It
was found that an interactive adjustment response of efficiency in the post-crisis period
(2001-2009) was not significant when included with the interactive adjustment response with
ownership (OWN). This is very likely because a number of banks were foreign acquired post
the crisis. The most important and consistent result to focus on is that the lag of technical
efficiency is negative and strongly significant in all four models. The trend was negative and
generally significant indicating an improving efficiency path for the industry. The interactive
11
Similar specifications have been estimated, among others, by Fung (2006), Weill (2009) and Casu and
Girardone (2010).
20
term of ownership and lagged cost efficiency suggests that the speed of convergence of the
foreign owned banks is lower than domestic but an interactive term with the trend suggests
that the trend efficiency path of average efficiency is marginally higher than the industry. The
foreign banks have a slower speed of adjustment but the steady-state trend path shows a
faster improvement in efficiency over time than domestic banks.
Table 5: Tests for Beta-convergence in cost efficiency; Dependant variable ΔCEi,t
Variable
Model 1 Model 2 Model 3 Model 4
Intercept 100.66**
(0.038)
110.97**
(0.046)
93.49
(0.135)
152.0***
(0.006)
CEi,t-1 -.5868***
(0.000)
-.8370***
(0.000)
-.7178***
(0.000)
-.8301***
(0.000)
TRENDt -.0499**
(0.039)
-.0549**
(0.048)
-.046
(0.139)
-.0753***
(0.007)
OWN*CEi,t-1 0.1499*
(0.060)
0.4293***
(0.000)
0.4611***
(0.004)
0.5576***
(0.000)
OWN*TRENDi 0.00002
(0.807)
-.00002*
(0.096)
-.0004**
(0.038)
-.0004***
(0.005)
Wald Chi(4)
45.3 221.0 31.5 108.4
Note: GLS panel estimation, heteroskedastic adjusted standard errors, p-values in parentheses, *** significant at the 1%, **
significant at the 5%, * significant at the 10%
Table 6: Tests for Sigma-convergence; Dependant variable ΔEi,t,
Model Ei,t-1 Wald Chi-Sq(1)
Model 1 -.4210*** (0.000) 35.3
Model 2 -.5853*** (0.000) 94.3
Model 3 -.2990*** (0.000) 20.2
Model 4 -.3922*** (0.000) 36.0
Note: GLS panel estimation, heteroskedastic adjusted standard errors, p-values in parentheses, *** significant at the 1%,
21
Table 6 confirms the existence of σ-convergence, which says that the improvement in
efficiency of banks in post-crisis Jamaica has also resulted in the narrowing of the dispersion
of efficiency.
6. Concluding Remarks
Motivated by the potential impact of recent events on Jamaica’s critical banking sector, this
paper has presented a number of models for measuring individual bank efficiency in Jamaica.
Frontier models show that the use of the bootstrapping technique mitigates bias and therefore
show superiority in favour of the bootstrapping technique over the standard DEA. There
were wide fluctuations in efficiency levels over the period 1998 to 2009 but there was a
discernible trend towards improvement particularly for the foreign-owned commercial banks.
The inclusion of the non-performing loans as a bad output produced more telling
results than its mere inclusion or exclusion. In general, efficiency levels declined when the
bad output is introduced. With the introduction of IFRS, International Accounting Standard
(IAS) 39 mandates guidelines and a rigorous approach to credit provisioning which must be
observed. This increases the difficulty for banks to go undetected with under-provisioning as
with previous accounting requirements. In line with expectations, the post-IFRS results
appear to be more transparent and to better reflect the true economic value of assets and
liabilities.
Issues regarding bank efficiency are of particular interest in Jamaica where there
banks compete for a share of the small, open market. A bank’s response to market conditions
is likely to be better the more efficiently that bank operates. Reliable information about the
level of efficiency and changes to these levels over time will assist bankers in determining

22
how to ‘bundle,’ price, and market banking services. Furthermore, any long-term impact on
bank profitability is likely to have relevance to customer welfare and economic development
and therefore to policymakers in a wider sense. The results from this paper inform an
exercise in measurement that may be used to improve managerial performance by
highlighting banks that score high on best practices and also to address research issues such
as the variation in efficiency based on different definitions of output. It is therefore useful for
policymakers at both the micro and the macro levels. These results must be considered in
relation to other factors such as banks’ productivity and the impact of accounting measures
on reported financial data that are used to impute efficiency levels in frontier analysis.

23
References
Bailey, S. (2006). An assessment of concentration & efficiency in the Jamaican banking
sector. Bank of Jamaica Financial Stability Report, 84-89
Barro, R. J. and Sala-i-Martin, X. (1992). Convergence. Journal of Political Economy
100(2), 223.
Berger, A.N., and Humphrey, D.B. (1997). Efficiency of financial institutions: International
survey and directions for future research. European Journal of Operational Research, 98,
175-212.
Berger, A. N. and Humphrey, D. B. (1991). The dominance of inefficiencies over scale and
product mix economies in banking. Journal of Monetary Economics 28(1), 117-148.
Berger, A. N., Leusner, J. and Mingo, J. (1997). The efficiency of bank branches. Journal of
Monetary Economics, 40(1), 141-162
Berger, A. N., Hasan, I., and Zhou, M. (2009). Bank ownership and efficiency in China:
What will happen the world’s largest nation? Journal of Banking and Finance, 33, 113-130
Casu, B. and Girardone, C. (2010). Integration and efficiency convergence in EU banking
markets. Omega, 38(5), 260-67.
Charnes, A., Cooper, W.W., and Rhodes, E. (1978). Measuring the efficiency of decision
making units. European Journal of Operational Research, 2, 429-44.
Coelli, T., Rao, D. S. P., O’Donell, C. J., and Battese, G. E. (2005). An introduction to
efficiency and productivity analysis. Springer: New York.
Daley, J. A., (2002). The adoption of International Accounting Standards (IAS) in Jamaica:
Implications for financial stability. Mimeo. Bank of Jamaica: Kingston:
http://www.boj.org.jm/uploads/pdf/papers_pamphlets/papers_pamphlets_the_adoption_of_ia
s_in_jamaica_-_implications_for_financial_stability.pdf)
Daley, J. A. (2004). IFRS: blessing or curse for developing markets? The Financial
Regulator, 8,2, 55-60
Daley, J. A. (2007). Examining bank failure in developing countries: Lessons from
Jamaica, Sir Arthur Lewis of Social and Economic Studies: Kingston.
Daley, J., Matthews, K. and Whitfield, K. (2008). Too-big-to-fail: Banking failure and
banking policy in Jamaica. Journal of International Financial Markets, Institutions &
Money, 18, 290-303
Duncan, D. and Langrin, B. (2004). Testing for competition in the Jamaican banking sector:

24
Evidence from bank level data. Southwestern Journal of Economics, VI, 1,
Drake, L. (2003). Costs and efficiency in banking: A survey of the evidence from the US, the
UK and Japan. In Mullineux, A. W. and Murinde, V. (Eds.) Handbook of International
Banking. Cheltenham: Edward Elgar
Efron, B. (1979). Bootstrap methods: Another look at the Jackknife. The Annals of Statistics,
7(1), 1-26
Efron, B. (1982). The Jackknife, the bootstrap, and other resampling plans. Society of
Industrial and Applied Mathematics CBMS-NSF Monographs, 38.
Efron, B. and Tibshirani, R. (1993). An introduction to the bootstrap. New York: Chapman
& Hall.
Elyasiani, E. and Rezvanian, R. (2002). A comparative multiproduct cost study of foreign-
owned banks and domestic-owned US banks. Applied Financial Economics, 12, 271-284.
Färe, R., Grosskopf, S. and Lovell, C. A. K. (1985). The measurement of efficiency of
production. Boston: Kluwer-Nijhoff.
Farrell, M.J. (1957). The measurement of productive efficiency of production. Journal of the
Royal Statistical Society, Series A, 120, 253-281.
Forster, J. and Shaffer, S. (2005). Bank efficiency ratios in Latin America. Applied Economic
Letters, 12, 529-532.
Fung, M. K. (2006). Scale economies, X-efficiency, and convergence of productivity among
bank holding companies. Journal of Banking and Finance, 30, 2857-2874.
Hall, P. (1986). On the number of bootstrap simulations required to construct a confidence
Iinterval. Annals of Statistics, 14, 4, 1453-1462.
Jain, A. (2002) Jamaican Accounting Standards vs. International Standards – what’s the
difference? Available at Internet, URL:
http://www.pwcglobal.com/jm/images/pdf/Jamaica%20Standards%20Vs%20IAS.pdf
La Porta, R., Lopez-de-Silanese, F. Shleifer, A., and Vishny, R. W. (1998). Law and finance.
Journal of Political Economy, 106, 1113-1155
Li, S., Liu F., Liu, S. and Whtimore, G. A. (2001). Comparative performance of Chinese
commercial banks: Analysis, findings and policy implications. Review of Quantitative
Finance and Accounting, 16, 149-170
25
Kneip, A., Park, B. U. and Simar, L. (1998). A note on the convergence of nonparametric
DEA estimators for production efficiency scores. Econometric Theory, 14(06), 783-93.
McAllister, P. H. and McManus, D. (1993). Resolving the scale efficiency puzzle in banking.
Journal of Banking & Finance 17(2-3), 389-405.
Mitchell, K. and Onvural, N. M. (1996). Economies of scale and scope at large commercial
banks: Evidence from the fourier flexible functional form. Journal of Money, Credit and
Banking 28(2), 178-199.
Parikh, A. and Shibata, M. (2004). Does trade liberalization accelerate convergence in per
capita incomes in developing countries? Journal of Asian Economics 15(1), 33-48.
Shephard, R. W. (1970). Theory of cost and production functions. Princeton, N.J . Princeton
University Press.
Simar, L. (1992). Estimating efficiencies from frontier models with panel data: A comparison
of parametric, non-parametric and semi-parametric methods with bootstrapping. Journal of
Productivity Analysis, 3, 171-203.
Simar, L. and Wilson, P. W. (1998). Sensitivity analysis of efficiency scores: How to
bootstrap in non-parametric frontier models. Management Science, 44, 49-61
Simar, L. and Wilson, P. W. (2000a). Statistical inference in non-parametric frontier models:
The state of the art. Journal of Productivity Analysis, 13, 49-78
Simar, L. and Wilson, P. W. (2000b). A general methodology for bootstrapping in non-
parametric frontier models. Journal of Applied Statistics, 27, 779-802
Simar, L.and Wilson, P. W. (2007). Estimation and inference in two-stage, semi-parametric
models of production processes. Journal of Econometrics, 136(1), 31-64.
Tennant, D. (2006). Are interest rate spreads in Jamaica too large? Views from within the
sector. Social and Economic Studies, 55, 3, 88-111
Thanassoulis E, Portela M, and Despić O (2008). Data envelopment analysis: The
mathematical programming approach to efficiency analysis. In (Eds) H O Fried, C A Knox-
Lovell and S S Schmidt, The measurement of productive efficiency and productivity
growth, Oxford, Oxford University Press
Tone, K. (2002). A strange case of the cost and allocative efficiency in DEA. Journal of the
Operational Research Society. 53. 1225-1231.
Weill, L. (2009). Convergence in banking efficiency across European countries. Journal of
International Financial Markets, Institutions and Money, 19(5), 818-33.