Efficiency analysis of focal plane arrays in deep dishes
14
Experimental Astronomy (2004) 17: 149–162 C Springer 2005 EFFICIENCY ANALYSIS OF FOCAL PLANE ARRAYS IN DEEP DISHES MARIANNA V. IVASHINA, ∗ JAN SIMONS and JAN GERALT BIJ DE VAATE ASTRON, P.O. Box 2, 7990 AA Dwingeloo, The Netherlands ( ∗ author for correspondence, e-mail: [email protected]) (Received 19 August 2004; accepted 28 February 2005) Abstract. In this paper we demonstrate the practical analysis of a dense Focal Plane Array (FPA) for a deep dish radio telescope. The analytical model is used to optimize efficiency and bandwidth of deep dish system by varying design parameters such as feed size and FPA aperture field. A prototype FPA was evaluated on the Westerbork Synthesis Radio Telescope (WSRT) and the resulting efficiency is discussed. Keywords: reflector antennas, dense focal plane arrays, aperture efficiency, radio telescope 1. Introduction The main figure of merit of a radio telescope is the Aeff/Tsys ratio, where Aeff is the effective area of the reflector and Tsys is the noise temperature of the sys- tem. Successful hybrid reflector design requires separate knowledge of Aeff and Tsys. This information is especially important when developing a new feed system where characteristics such as aperture efficiency and system loss can be, or should be, optimized. Additional system level challenges in a FPA-based hybrid include developing techniques and design procedures for the dense FPA. This work pro- vides a detailed analysis of the Aeff of reflector systems and relates this to design parameters of FPAs. Maaskant (2004) introduces a model for the noise temperature for these systems. A more extensive study of noise in FPAs is underway. The aperture efficiency of a hybrid reflector antenna is described by the properties of the feeds’ far-field patterns and the geometry of the reflector (Balanis, 1982). However, precise modeling of far-field patterns for dense arrays can be difficult due to strong mutual coupling between array elements. In addition, analytical models for these structures do not provide sufficient accuracy for practical application (www.astron.nl, R&D project THEA; Boryssenko and Schaubert, May 2004; Craye, 2004). The question arises of how to estimate the efficiency of a hybrid reflector antenna with a small F/D, and how to relate efficiency to the design parameters of the FPAs. This paper outlines a simple FPA model, starting with a given feed size and a specified cosine function aperture field distribution. The model has been applied
Transcript of Efficiency analysis of focal plane arrays in deep dishes

Experimental Astronomy (2004) 17: 149–162 C© Springer 2005
EFFICIENCY ANALYSIS OF FOCAL PLANE ARRAYSIN DEEP DISHES
MARIANNA V. IVASHINA,∗ JAN SIMONS and JAN GERALT BIJ DE VAATEASTRON, P.O. Box 2, 7990 AA Dwingeloo, The Netherlands(∗author for correspondence, e-mail: [email protected])
(Received 19 August 2004; accepted 28 February 2005)
Abstract. In this paper we demonstrate the practical analysis of a dense Focal Plane Array (FPA) for adeep dish radio telescope. The analytical model is used to optimize efficiency and bandwidth of deepdish system by varying design parameters such as feed size and FPA aperture field. A prototype FPAwas evaluated on the Westerbork Synthesis Radio Telescope (WSRT) and the resulting efficiency isdiscussed.
Keywords: reflector antennas, dense focal plane arrays, aperture efficiency, radio telescope
1. Introduction
The main figure of merit of a radio telescope is the Aeff/Tsys ratio, where Aeffis the effective area of the reflector and Tsys is the noise temperature of the sys-tem. Successful hybrid reflector design requires separate knowledge of Aeff andTsys. This information is especially important when developing a new feed systemwhere characteristics such as aperture efficiency and system loss can be, or shouldbe, optimized. Additional system level challenges in a FPA-based hybrid includedeveloping techniques and design procedures for the dense FPA. This work pro-vides a detailed analysis of the Aeff of reflector systems and relates this to designparameters of FPAs. Maaskant (2004) introduces a model for the noise temperaturefor these systems. A more extensive study of noise in FPAs is underway.
The aperture efficiency of a hybrid reflector antenna is described by the propertiesof the feeds’ far-field patterns and the geometry of the reflector (Balanis, 1982).However, precise modeling of far-field patterns for dense arrays can be difficult dueto strong mutual coupling between array elements. In addition, analytical modelsfor these structures do not provide sufficient accuracy for practical application(www.astron.nl, R&D project THEA; Boryssenko and Schaubert, May 2004; Craye,2004).
The question arises of how to estimate the efficiency of a hybrid reflector antennawith a small F/D, and how to relate efficiency to the design parameters of the FPAs.
This paper outlines a simple FPA model, starting with a given feed size and aspecified cosine function aperture field distribution. The model has been applied
150 M. V. IVASHINA ET AL.
to reflector antennas with small F/D ratios varying from 0.3 to 0.6. In this modelwe address finite-size focal plane arrays with 7–20 elements in a row, with elementspacing of 0.2–0.5λ. This number of elements was chosen to ensure efficient re-flector illumination and to keep the number of RF signals to be combined withinreasonable limits. For such systems infinite array approximations, as well as largefinite array simulations break down. For an infinite array approximation there aretoo few array elements and the element patterns will vary significantly due to edgeeffects. The infinite array approximation is valid when the distance between thecentre and edge elements is larger than 2 wavelengths. Therefore, this approxima-tion would require a minimum of 23 elements (3 centre elements + 10 elementsfrom both sides) for an array with elements spaced 0.2λ . On the other hand, currentfinite array simulator such as HFSS, CST, and IE3D do not have the capacity toanalyze arrays larger than 5 × 5.
This paper also demonstrates the first FPA prototype made of a dense array ofVivaldi elements. The prototype was designed for the Westerbork Synthesis RadioTelescope (WSRT) reflector antenna, which has an F/D ratio of 0.35. The prototypewas designed using a conjugate field matching method and near field measurements.Results comparing modeled and measured reflector aperture efficiencies from theFPA model and prototype, respectively, are presented. While our approach wasvalidated for the WSRT with an F/D ratio of 0.35, the results are not limited to theWSRT application.
2. Modeling the focal plane array
2.1. FPA AS A FEED FOR REFLECTOR ANTENNAS
In practical analysis of reflector antennas, the array feeds are often modeled witha given element far-field pattern defined by a cosine function to the n-th power(Galindo-Israel et al., 1978; Balanis, 1982; Rahmat-Samii and Lee, 1983; Lam etal., 1985). In many practical antennas including horns and coaxial waveguides,the pattern represents the major part of the main lobe. Horn and waveguide arraysare usually sparse and the “active” element patterns are similar to the “isolated”element patterns. However, for the dense arrays with the element spacing less than0.5λ, this condition is not valid due to strong mutual coupling. Furthermore, thepatterns are different from element to element, depending on the location of theelement in the array (Boryssenko and Schaubert, 2004; Craye, 2004).
Bird (1982) successfully approximates the behavior of a circular waveguidearray using a different feed model excited with the TE11 mode. But we do not havea priori known information about the operation modes of the elements in densearrays.
Here, instead of modeling each element separately, the field distribution of adense array feed is specified on the feed aperture in cosine-form. For a circular
EFFICIENCY ANALYSIS OF FOCAL PLANE ARRAYS IN DEEP DISHES 151
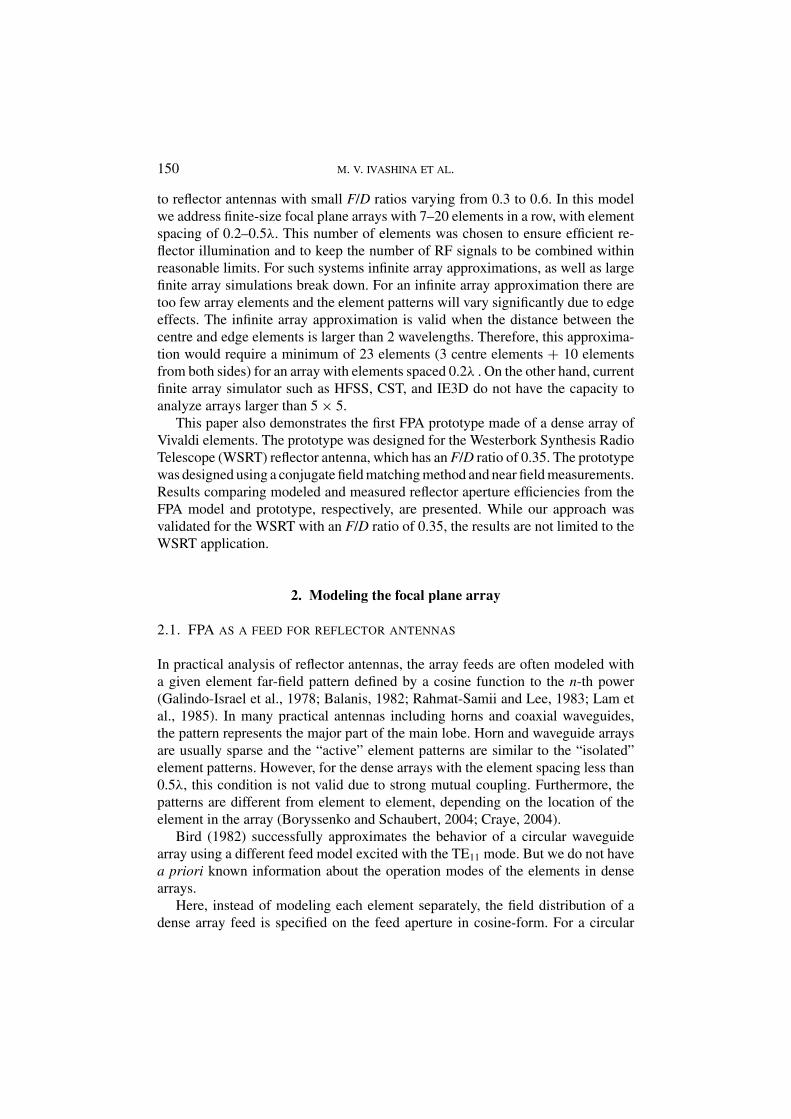
Figure 1. Aperture-field pattern cuts for the FPA model with r = 0.5λ. E (n)T = 0 (no edge effects).
aperture of the feed the field distribution is defined as:
|EA(r )| = E (n)T + E (n)
0 cosn(πr/2rmax), (1)
where 0 ≤ r ≤ rmax, rmax is the radius of the feed; E (n)0 (V/m) is a normalization
constant; and E (n)T (V/m) is the illumination taper at the feed edges. This model
has three design parameters including rmax, n, and E (n)T . Figure 1 shows the field
magnitude E (r )A for a circular feed distribution with a 0.5λ radius and constant
phase over the aperture. A practical range of aperture field distributions is coveredby setting the cos-power value n to 1, 2, 4, and 8. The constant E (n)
0 is normalized insuch a way that the feed radiates the same amount of power for all n values. In thisarticle we will not use E (n)
T , effectively setting it to zero. The phase is assumed tobe constant across the aperture and the cross-polarization component is negligiblysmall.
The main beam and side lobes could also be described by continuous fields, suchas |sin(r )/r |, allowing more advanced field distributions to be analyzed. However,such a model would only be possible with large arrays in order to approximate therequired distribution with sufficient accuracy.
Given a specific efficiency, the corresponding feed size can be determined usingconjugate field matching for the main beam and its first sidelobe (Born and Wolf,1975; Clarricoats and Poulton, 1977). Operating efficiencies of 80–90% can beobtained for various F/D ratios and an ideal feed with a radius close to r = λ.A 5% increase in efficiency can be obtained by matching the second side lobein the focal field using a feed radius of r = 1.5λ. In order to realize this highefficiency with a FPA, the aperture field must be sampled with a large numberof elements. A practical field synthesis requires a minimum of about five samplepoints per wavelength (Boryssenko and Schaubert, 2004; Ivashina et al., 2004).For example, a 0.2λ-cell rectangular array will need at least 15 × 15 elements forsampling the main beam and its first sidelobe in the aperture field. Inclusion of the

152 M. V. IVASHINA ET AL.
second sidelobe will increase the required number of elements to 25×25, capturing(only) 5% more of the total power. This approach only applies to arrays with largenumbers of elements.
Lam et al. (1985) have shown that the superdirectivity phenomenon would ap-pear for a dense array feed whose elements produce an amplitude distribution witha number of sidelobes on the array aperture, and have a phase either 0 or π . Thiswould make the system highly sensitive to variations in the excitation coefficients,and, therefore, in practice very difficult to realize. Brisken et al. (2004) found asimilar excitation form for an optimized Vivaldi array feed of the VLA. The lastfeed consists of a 9 × 10 × 2 element array and is excited with an amplitude distri-bution which has a large number of sidelobes and phase changes between adjacentelements. The predicted efficiency of this system is 60–80% over a 25% bandwidth.It remains to be studied, however, if such an aperture field is realizable with Vivaldiarrays.
In this paper we will only model the FPA whose aperture field distribution isrepresented by a cosine function, according to Equation (1).
2.2. EFFICIENCY OF ARBITRARY REFLECTOR ANTENNAS WITH A SIMPLIFIED
FPA MODEL
The aperture efficiency of reflectors with arbitrary F/D ratios was simulated fordifferent design parameters, r and n, of a circular feed array. The following definitionof the aperture efficiency for reflector antennas in the transmit situation was usedfor these simulations (Balanis, 1982):
ηA = ηspηTηPhηPolηb, (2)
where ηsp is the spillover efficiency, determined by the fraction of the total powerthat is radiated by the feed, intercepted, and collimated by the reflecting surface; ηT
is the taper efficiency, related to the uniformity of the amplitude distribution of thefeed pattern over the surface of the reflector; ηPh is the phase efficiency, related tothe uniformity of the phase distribution of the feed pattern over the surface of thereflector; ηPol is the polarization efficiency; and ηb is the blockage efficiency. Theefficiencies are related to the reflector geometry and the far-field pattern propertiesof the feed.
The FPA model definition can be simplified toηA = ηspηT using the following as-sumptions: (i) the spillover and taper efficiencies dominate and (ii) the phase, polar-ization, and blockage efficiencies are ideal (equal to 1). In these simulations far-fieldpatterns were recalculated from the aperture fields of the feed specified in Equation(1). Using the GRASP8 software package (http://www.ticra.com) the fields spec-ified in the aperture plane were transformed into equivalent currents. The radiatedpattern in the far field was then determined using these equivalent currents. TheGRASP model was an unblocked parabolic reflector with a feed located in the focus.

EFFICIENCY ANALYSIS OF FOCAL PLANE ARRAYS IN DEEP DISHES 153
TABLE I
Optimal radius
Aperture Circular Equivalent rectangularfield feed feed radiusdistribution radius (req = r
√π/2)
Cos(r) 0.54λ 0.67λ
Cos2(r) 0.69λ 0.87λ
Cos4(r) 0.85λ 1.07λ
Cos8(r) 1.15λ 1.44λ
Figure 2. Far-field pattern cuts for the FPA model with the optimal radius and for the circular waveg-uide with r = 0.5λ.
2.3. NUMERICAL RESULTS
The calculated far-field pattern cuts in E- and H-plane for the FPA model with theoptimal radius (see conclusions and Table I) are illustrated in Figure 2. Patternsof a conventional waveguide feed with the radius of 0.5λ supporting the dominantmode of propagation were derived using the same software for reference. Givena practical reflector with a half-opening angle <70◦, this FPA model is in goodagreement with a circular waveguide.
Figure 3 shows the simulation results of the aperture efficiency and efficiencycomponents obtained for the 0.35 F/D reflector with the FPA model. The resultsindicate that a small feed provides a high ηT and a lower ηsp due to the broad far-fieldpattern. Conversely, a large feed provides high ηsp and a low ηT due to the narrowfar-field pattern. From Figure 3 we draw the following conclusions with regards tothe aperture efficiency:
1. The circular feed model demonstrates a maximum aperture efficiency of 72%for a reflector F/D ratio of 0.35. This value represents the trade-off between thetaper and spillover efficiencies.

154 M. V. IVASHINA ET AL.
Figure 3. Aperture efficiency ηA, spillover efficiency ηsp, and taper efficiency ηt of the 0.35 F/Dreflector fed with the FPA model.
Figure 4. Aperture efficiency of the arbitrary F/D reflectors fed with model FPAs of the radius r andcosn(r ) aperture distribution.
2. The optimal radius of the feed, providing maximum reflector efficiency, doubleswhen n is varied from 1 to 8 (see the Table I). This implies that an electricallylarge feed needs to be excited with an aperture distribution with fast and strongtapering at the edges. (See an example for n = 8 in Figure 1). For dense arrays, a

EFFICIENCY ANALYSIS OF FOCAL PLANE ARRAYS IN DEEP DISHES 155
strong tapering can only be realized by adding several rings of dummy elementsaround the feed, which significantly increases the total array size.
3. The optimal radius values in Table I correspond to approximately the half powerradius in the aperture field distributions for the different n values.
Comparable simulations were performed for the reflectors with F/D ratio of0.3–0.6. These results are presented in Figure 4 with the aperture efficiency as afunction of the F/D ratio and the radius of the circular feed. We then find:
4. For any aperture field (any design parameter n), the maximum efficiency ηmax isbetween 72 and 80%. Efficiency varies as a function of F/D; a larger F/D resultsin a higher efficiency. The numbers are comparable with the values of efficiencyobtained with a different approach (Clarricoats and Poulton, 1977).
5. For the reflectors under study the optimum radius is ropt = 0.5–1.55λ for thecircular feed, and ropt = 0.63–1.94λ for the equivalent rectangular feed.
6. A 60–80% aperture efficiency is possible for the FPA model over a wide fre-quency band (3:1).
3. FPA prototype for the WSRT 25 m reflector antenna
3.1. SYNTHESIS PROCEDURE
Based on the results obtained for the FPA model in Section 2 the question arises:Is the modeled aperture field distribution of the array feed appropriate for Vivaldiarrays? Is it possible to attain the predicted efficiency with a practical feed that doesnot have theoretical attributes assumed in the FPA model, i.e. phase uniformity, idealpolarization purity, and small edge effects?
To demonstrate the implementation of the approach an example is shown forthe actual design of the FPA developed for the WSRT 25 m reflector antenna withan F/D ratio of 0.35 (http://www.astron.nl/ Westerbork Observatory). A wide-bandVivaldi array with a rectangular grid of 8 × 9 elements spaced 2.7 cm apart (Chioand Schaubert, 1999) was used as the prototype FPA.
The reflector system was modeled in a receive situation using GRASP8 and theconjugate field method as described in Ivashina and van ‘t Klooster (2002). Thefocal field distribution of the incident field was computed using both the modeledand simulated results. Later, these results were used as a reference for the aperturefield synthesis of the receiving feed design. The aperture-field pattern was sampledwith the array elements, which were arranged into rings and excited according tothe focal field structure. In the initial FPA design the positions of sample ringswere fixed and the physical and effective areas of the array elements were assumedto be equal. In reality, the strong mutual coupling in the Vivaldi array causes theeffective area of the sample rings to appear larger, requiring excitation coefficientcorrection. The correction factor was determined by comparing the aperture patterns
156 M. V. IVASHINA ET AL.
of the fixed grid sample rings to direct near-field measurements. More informationabout the synthesis approach can be found in Ivashina et al. (2004).
3.2. RESULTS FOR DESIGN PARAMETERS AND PERFORMANCE
Low and high frequency sub-bands are represented by 5 × 5 and 5 × 5/3 × 3 arrayfeeds, respectively. The elements of the 5×5 and 3×3 feeds were combined into 6and 3 rings, respectively. For verification of the FPA synthesis, the efficiency of thereflector system with the FPA prototype was analyzed. First, the far-field patterns ofthe array feed were determined using direct near-field measurements. Then, usingEquation (2), the aperture efficiency of the WSRT reflector was calculated and thefeed far-field patterns obtained.
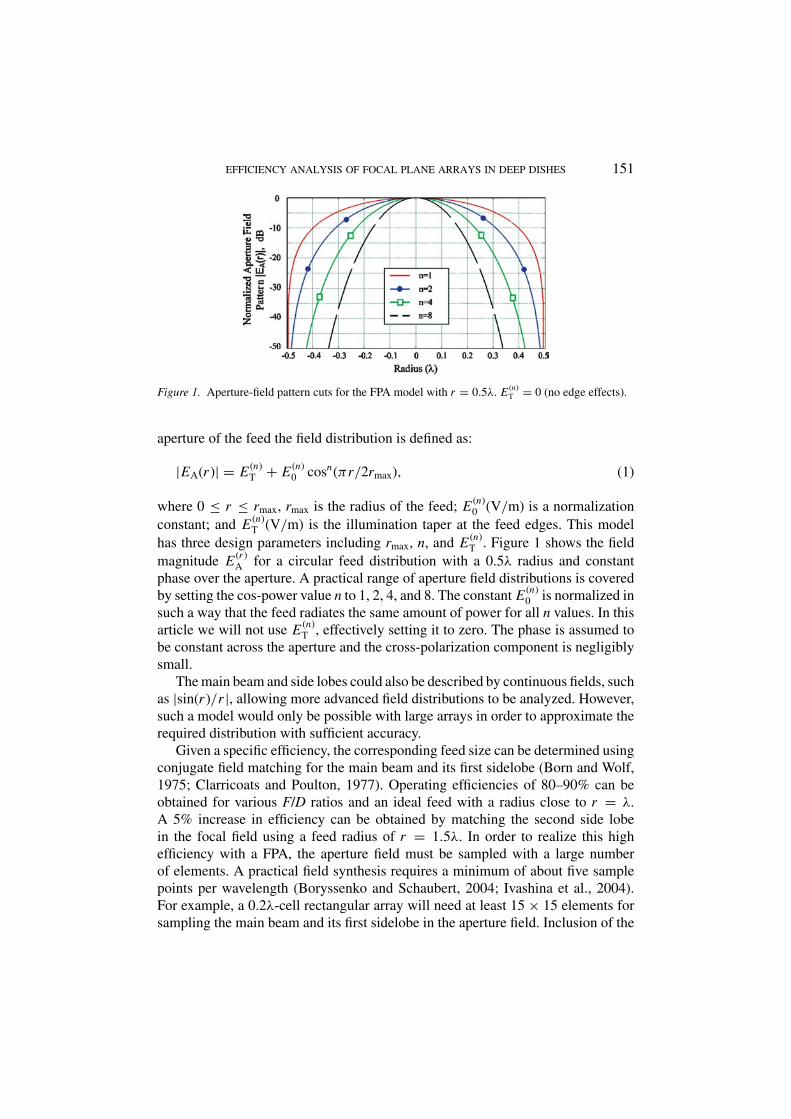
Figure 5 illustrates experimental results for the 5 × 5 element FPA prototype at2.3 GHz. The aperture-field pattern cuts of this feed and the aperture-field patternsmodeled with n = 8 on the equivalent rectangular aperture of the same area areillustrated in Figures 5a and 5b, respectively. In this example the model of the fielddistribution agrees fairly well with aperture field of the Vivaldi array. The majorpart of the beam pattern follows the modeled cosine distribution and the phaseis nearly uniform. The magnitude and phase variations close to the edges of thefeed (r → rmax) show some deviations from the ideal model. Figure 5c presents
Figure 5. Amplitude distribution cuts (a) and phase distribution cuts (b) of the aperture-field patternsfor the FPA prototype (bold lines) and the FPA model (dashed lines); Far-field pattern cuts (c) forco-polar components (bold lines) and cross-polar components (dashed lines) of the FPA prototype.

EFFICIENCY ANALYSIS OF FOCAL PLANE ARRAYS IN DEEP DISHES 157
TABLE II
Design parameters and performance characteristics of FPA developed for the WSRT single dish of0.35 F/D
Efficiency components and aperture
efficiency of WSRT with FPA, % TotalElement aperture
Frequency spacing # elements ηsp ηT ηPh ηPol ηA = ηspηT efficiency %
2.3 GHz 0.20λ 5 × 5 99 61 96 99 60 58
4.8 GHz 0.432λ 3 × 3 98 63 85 99 62 52
5.5 GHz 0.5λ 5 × 5 98 60 78 99 59 45
measured far-field pattern cuts (magnitude) for the FPA prototype and shows thephase distribution of the far-field pattern to be nearly uniform (Ivashina et al., 2004).The prototype’s measured cross-polar component is low and was not considered inthe model. Measured and modeled cross-polar components are illustrated in Figure5c. A similar far-field amplitude distribution, with a stronger phase variation, hasalso been experimentally observed at 5.5 GHz (Ivashina et al., 2004).
Table II presents the design parameters and performance characteristics of the3×3 and 5×5 FPAs optimized for the WSRT. The optimized results were obtainedfor the array feeds operating from 2.3 to 5.5 GHz with a passive beamformer. Thepassive beamformer provides optimal excitation coefficients of the array elementsand consists of several combiners, phase shifters, and attenuators. The actual beam-former was developed at the high frequency sub-band around 5 GHz and connectedwith a 3 × 3 array feed. This system was evaluated by mounting it onto one of thedishes of the WSRT (number RT6) and comparing the outcome to that of standardreflectors (number RT5).
The FPA prototype has an efficiency of 60% at 2.3 GHz (see columnηA = ηspηT).The modeled efficiency for the equivalent circular aperture with the radius of 1λ is70% (see Figure 3 for n = 4). Considering the model’s simplicity, this efficiencyis in good agreement with that of the prototype. The 10% discrepancy is primarilycaused by the model’s constraints on zero-illumination taper of the edges of thefeed. As Figure 5a shows, the field levels close to the edges are higher for the 8×9array with only 5 × 5 elements excited and the remaining elements dummy loaded.
4. Comparing efficiency of the FPA model with the prototype for WSRT
Summarizing the results obtained from the FPA model and prototype analysis wecan draw the following conclusions:
1. The maximum aperture efficiency (ηmax = 72%) simulated with the FPA modelis 14–27% higher than of the aperture efficiency obtained for the FPA prototype.In both cases the element spacing varies from 0.2λ to 0.5λ.

158 M. V. IVASHINA ET AL.
The total error in definition of the efficiency with the FPA model is related tothe following effects:
2. The phase efficiency is dismissed in the analysis approach, (settingηPh = 100%),which introduces sampling errors. At the low frequency of the band this error isabout 4% (5 samples/λ), while at the high frequency the resulting error can beas high as 22% (3 samples/λ).
3. Another assumption was zero taper in illuminating the FPA model edges. Theerror in the definition of ηspηT remained stable over the frequency band andwas equal to 10–13%. In practice, complete loading of dummy elements canimprove the edge taper.
Conclusions 1, 2, and 3 can be generalized for a practical dense array with anelement spacing ranging d = 0.2 − 0.5λ feeding a reflector system with an F/Dranging from 0.3 to 0.6. The following statements can be made by combining theseconclusions with 4 and 5 of Section 2.2:
4. The maximum aperture efficiency of reflectors with an FPA element spacing ofd = 0.2–0.5λ is ηmax = 45–66%. The size of the FPA without dummy radiatorsis at least 5 × 5 and 3 × 3 elements for d = 0.2λ and d = 0.5λ, respectively.Two rows of dummy elements surrounding the feed are loaded.
Over a frequency band the highest aperture efficiency (ηmax = 58–66%)occurs at the lowest frequency, when the elements spacing of the FPA is d =0.2λ. Similarly, the lowest aperture efficiency (ηmax = 45–53%) is at the highestfrequency, with an element spacing of d = 0.5λ.
The lower efficiency at the higher frequencies is primarily due to the effectsof increased element spacing. This makes it difficult to illuminate the reflectorwith uniform phase across the band. This effect was observed also in Ivashinaet al. (2004).
5. The efficiencies which can be attained with FPAs (Table II) are very close towhat can be realized with existing horn antennas (Ivashina et al., 2004). Thus, theFPAs enable one to construct a closely interspaced multi-beam system withoutdegrading total efficiency relative to existing horn antennas.
5. Demonstration of the FPA at WSRT
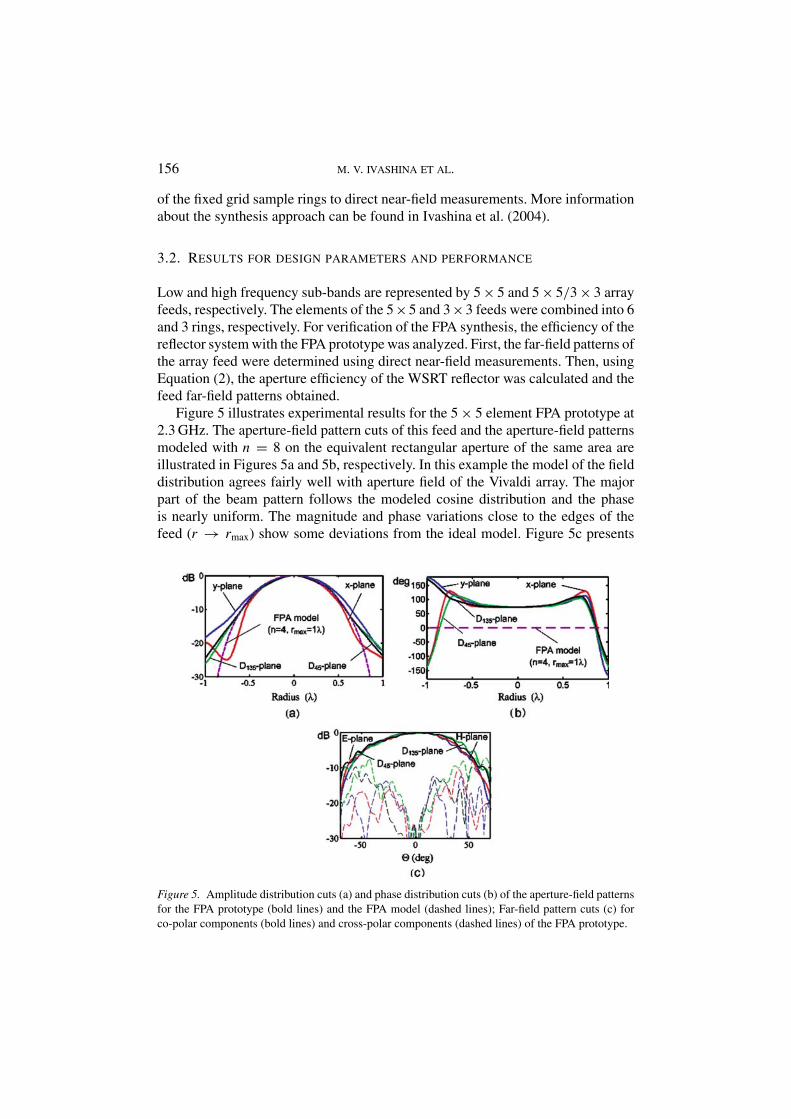
Tests with the FPA were performed the Westerbork Synthesis Radio Telescope(WSRT) with one polarization in the 4590–4750 MHz and 4850–5010 MHz fre-quency bands (http://www.astron.nl, Westerbork Observatory). Figure 6 shows aphotograph of the 3 × 3 FPA with the beamformer on the back of the Vivaldi arrayfeed. The nine central elements are connected with LNAs and then combined inrings. The rings are fed to vector modulators which perform amplitude and phasecontrol of the first and second ring, after which they are added to the central element
EFFICIENCY ANALYSIS OF FOCAL PLANE ARRAYS IN DEEP DISHES 159
Figure 6. 3 × 3 FPA synthesized with the Vivaldi antenna.
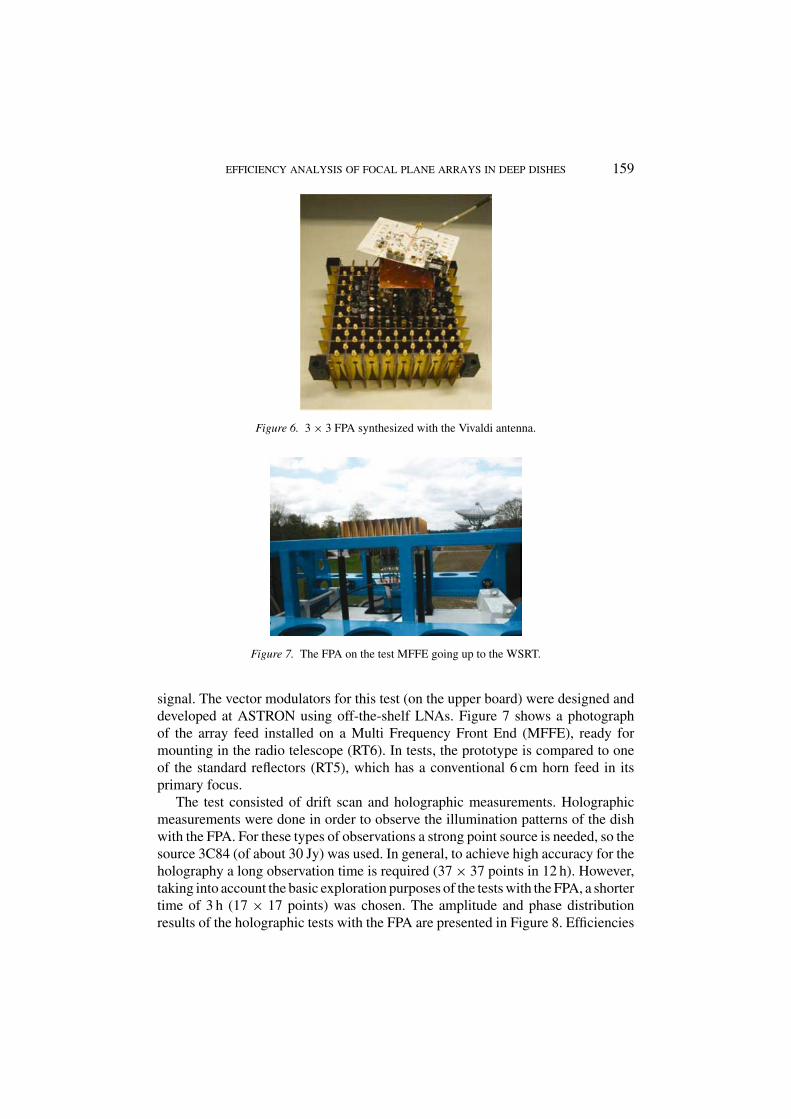
Figure 7. The FPA on the test MFFE going up to the WSRT.
signal. The vector modulators for this test (on the upper board) were designed anddeveloped at ASTRON using off-the-shelf LNAs. Figure 7 shows a photographof the array feed installed on a Multi Frequency Front End (MFFE), ready formounting in the radio telescope (RT6). In tests, the prototype is compared to oneof the standard reflectors (RT5), which has a conventional 6 cm horn feed in itsprimary focus.
The test consisted of drift scan and holographic measurements. Holographicmeasurements were done in order to observe the illumination patterns of the dishwith the FPA. For these types of observations a strong point source is needed, so thesource 3C84 (of about 30 Jy) was used. In general, to achieve high accuracy for theholography a long observation time is required (37 × 37 points in 12 h). However,taking into account the basic exploration purposes of the tests with the FPA, a shortertime of 3 h (17 × 17 points) was chosen. The amplitude and phase distributionresults of the holographic tests with the FPA are presented in Figure 8. Efficiencies
160 M. V. IVASHINA ET AL.
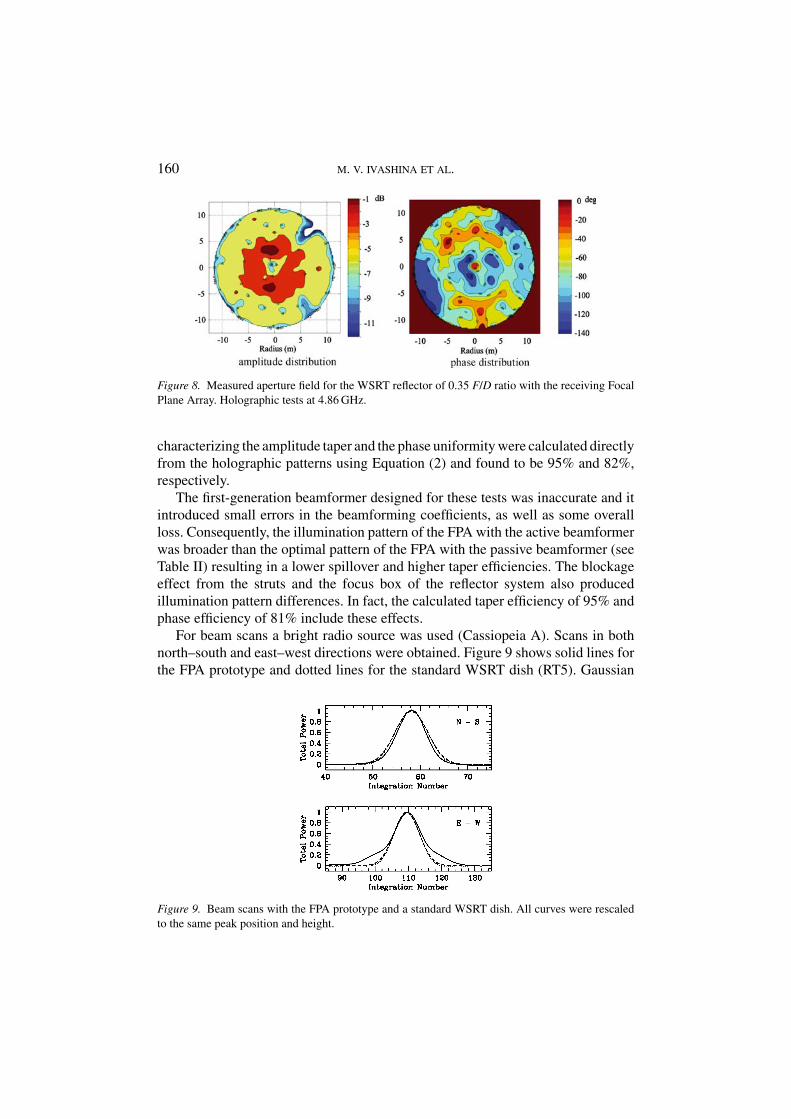
Figure 8. Measured aperture field for the WSRT reflector of 0.35 F/D ratio with the receiving FocalPlane Array. Holographic tests at 4.86 GHz.
characterizing the amplitude taper and the phase uniformity were calculated directlyfrom the holographic patterns using Equation (2) and found to be 95% and 82%,respectively.
The first-generation beamformer designed for these tests was inaccurate and itintroduced small errors in the beamforming coefficients, as well as some overallloss. Consequently, the illumination pattern of the FPA with the active beamformerwas broader than the optimal pattern of the FPA with the passive beamformer (seeTable II) resulting in a lower spillover and higher taper efficiencies. The blockageeffect from the struts and the focus box of the reflector system also producedillumination pattern differences. In fact, the calculated taper efficiency of 95% andphase efficiency of 81% include these effects.
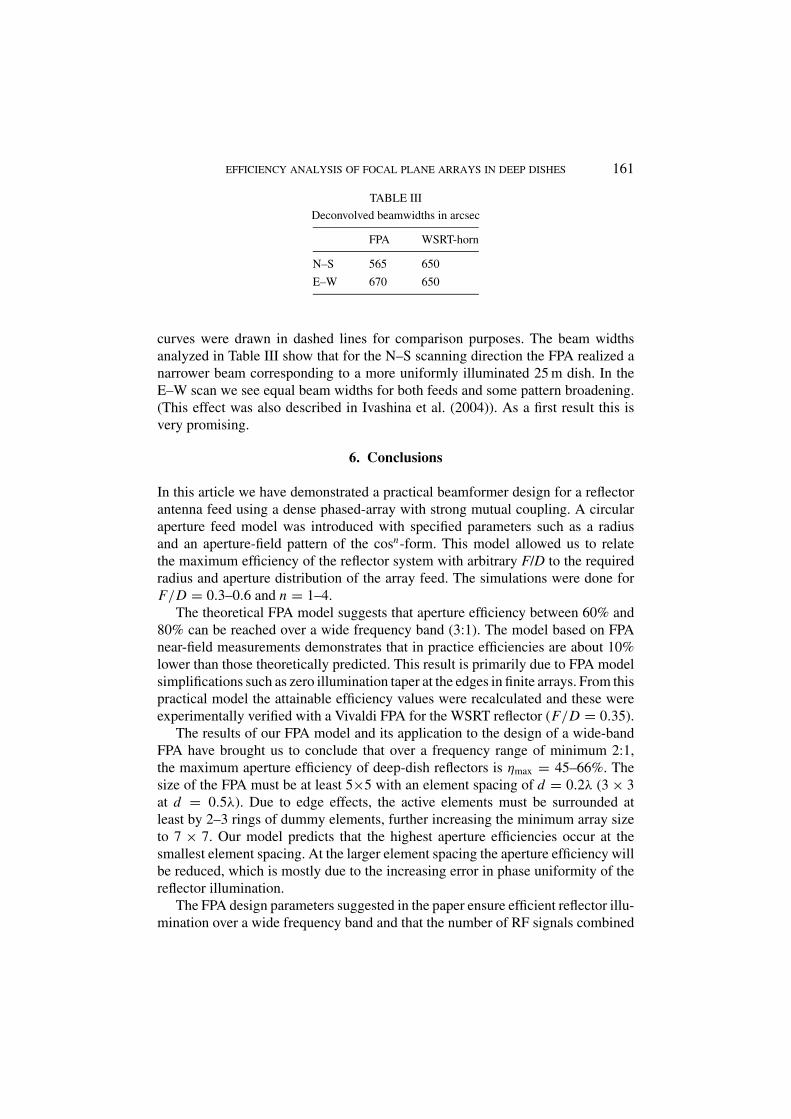
For beam scans a bright radio source was used (Cassiopeia A). Scans in bothnorth–south and east–west directions were obtained. Figure 9 shows solid lines forthe FPA prototype and dotted lines for the standard WSRT dish (RT5). Gaussian
Figure 9. Beam scans with the FPA prototype and a standard WSRT dish. All curves were rescaledto the same peak position and height.
EFFICIENCY ANALYSIS OF FOCAL PLANE ARRAYS IN DEEP DISHES 161
TABLE III
Deconvolved beamwidths in arcsec
FPA WSRT-horn
N–S 565 650
E–W 670 650
curves were drawn in dashed lines for comparison purposes. The beam widthsanalyzed in Table III show that for the N–S scanning direction the FPA realized anarrower beam corresponding to a more uniformly illuminated 25 m dish. In theE–W scan we see equal beam widths for both feeds and some pattern broadening.(This effect was also described in Ivashina et al. (2004)). As a first result this isvery promising.
6. Conclusions
In this article we have demonstrated a practical beamformer design for a reflectorantenna feed using a dense phased-array with strong mutual coupling. A circularaperture feed model was introduced with specified parameters such as a radiusand an aperture-field pattern of the cosn-form. This model allowed us to relatethe maximum efficiency of the reflector system with arbitrary F/D to the requiredradius and aperture distribution of the array feed. The simulations were done forF/D = 0.3–0.6 and n = 1–4.
The theoretical FPA model suggests that aperture efficiency between 60% and80% can be reached over a wide frequency band (3:1). The model based on FPAnear-field measurements demonstrates that in practice efficiencies are about 10%lower than those theoretically predicted. This result is primarily due to FPA modelsimplifications such as zero illumination taper at the edges in finite arrays. From thispractical model the attainable efficiency values were recalculated and these wereexperimentally verified with a Vivaldi FPA for the WSRT reflector (F/D = 0.35).
The results of our FPA model and its application to the design of a wide-bandFPA have brought us to conclude that over a frequency range of minimum 2:1,the maximum aperture efficiency of deep-dish reflectors is ηmax = 45–66%. Thesize of the FPA must be at least 5×5 with an element spacing of d = 0.2λ (3 × 3at d = 0.5λ). Due to edge effects, the active elements must be surrounded atleast by 2–3 rings of dummy elements, further increasing the minimum array sizeto 7 × 7. Our model predicts that the highest aperture efficiencies occur at thesmallest element spacing. At the larger element spacing the aperture efficiency willbe reduced, which is mostly due to the increasing error in phase uniformity of thereflector illumination.
The FPA design parameters suggested in the paper ensure efficient reflector illu-mination over a wide frequency band and that the number of RF signals combined
162 M. V. IVASHINA ET AL.
and processed in the beamformer remains reasonable. These parameters providesystem simplicity ensuring good noise-performance required for radio astronomy.
Acknowledgements
This publication arose out of the FARADAY Project supported by the EuropeanCommunity–Access to Research Infrastructure action of the Improving HumanPotential Programme, and the Commonwealth Scientific and Industrial ResearchOrganisation of Australia.
References
‘Astron Project Documentation for THEA and SKA’ , (see www.astron.nl, R&D project THEA).Balanis, C.: 1982, Antenna Theory, Analysis and Design, Wiley, New York.Bird, T. S.: 1982, Proc. IEEE (H) 129, 293–298.Born, M. and Wolf, E.: 1975, Principles of Optics, Pergamon, Oxford, UK.Boryssenko, A. O. and Schaubert, D. H.: 2004, ‘UMass Method of Moment Electromagnetic Solver’,
in Focal Plane Array Workshop, Dwingeloo, The Netherlands (see www.astron.nl, R&D projectFARADAY).
Brisken, W., Craeye, C., Veidt, B. and Napier, P.: 2004, ‘Focal Plane Arrays for VLA?’, in FocalPlane Array Workshop, Dwingeloo, The Netherlands.
Chio, T.-H. and Schaubert, D. H.: 1999, ‘Design of Dual-Polarized Tapered Slot Antenna Arrays’, inTechnical Report, Antenna Laboratory, ECE Department, University of Massachusetts, Amherst,MA 01003, USA.
Clarricoats, P. and Poulton, G. T.: 1977, Proc. IEEE 65, 1470–1504.Craye, C.: 2004, ‘Efficient Simulation of Finite Wideband Arrays for Focal Plane Applications’, in
Focal Plane Array Workshop, Dwingeloo, The Netherlands.Galindo-Israel, V., Lee, S-W. and Mittra, R.: 1978, IEEE Trans. AP AP-26, 220–228.Ivashina, M. V., Bij de Vaate, J. G., Braun, R. and Bregman, J. D.: June 2004, ‘Focal Plane Arrays for
Large Reflector Antennas: First Results of a Demonstrator Project’, in Astronomical Telescopesand Instrumentation, SPIE Conference, Glasgow, UK.
Ivashina, M. V. and van ‘t Klooster, C. G. M.: 2002, ‘Focal Fields in Reflector Antennas and AssociatedArray Feed Synthesis for High Efficiency Multi-Beam Performances’, in 25th ESA AntennaWorkshop on Satellite Antenna Technology, Noordwijk, The Netherlands.
Lam, P., Lee, S-W., Chang, D. C. D. and Lang, K. C.: 1985, IEEE Trans. AP AP-33, 1163–1174.Maaskant, R.: 2004, ‘On the Overall Signal to Noise Ratio of Focal Plane Array Receiving Systems’,
in Focal Plane Array Workshop, Dwingeloo, The Netherlands.Rahmat-Samii, Y. and Lee, S.-W.: 1983, IEEE Trans. AP AP-31, 463–470.http://www.ticra.com.http://www.astron.nl, Westerbork Observatory.