Estimation of the nutritional balance of food dishes by color ...
6
Introduction At present, there are a number of dietary lifestyle-relat- ed issues in Japan. In particular, the increase in lifestyle- based diseases, including cancer and cardiovascular dis- ease, is an important social issue. A National Health and Nutrition Examination Survey conducted in 2011 reported that 30.3 % of men and 21.5 % of women over the age of 20 were obese, and 15.7 % of men and 7.6 % of women had pre-diabetes, about 1.3 times higher than reported in 2006. In response to these issues, the Shokuiku Basic Act was passed by the Cabinet Office in 2005 and the Shokuiku Promotion Basic Plan was implemented in 2006 in order to promote Shokuiku, or food education, for all Japanese in order to promote healthy dietary habits. That is to say the cultivation of the ability to manage one’s healthy dietary life is expected. However, it may be difficult for individu- als who lack adequate knowledge about nutrition and food to make appropriate food choices. In addition, opportuni- ties to learn how to select and prepare food in order to maintain and/or promote one’s health are decreasing due to changes in lifestyle and the increasing prevalence of ready-made meals and dining-out. On the other hand, due to the progress of IT and the widespread use of digital cameras, mobile phones and smart phones, many studies have been reported describ- ing the estimation of the ingested nutrients of a meal from a photograph 1-5) . Although the photographic diet record method was easy for diners, the determination automati- cally the menu and the estimation of the amounts of ingre- dients from a one-dimensional photograph were difficult and inaccurate. For proper dietary management, not only are the amounts of nutrients ingested important, but also the nu- tritional balance. Therefore, in the present study the pos- sibility of evaluating nutritional balance using color analy- sis of photographs of food dishes was demonstrated using salad as a model. Original Article Estimation of the nutritional balance of food dishes by color analysis of photographs - using salad as a model dish Yukari Muramoto 1) , Momoko Yaeo 1) , Motoko Matsui 2) , Kimiko Ohtani 2) 1) Kyoto Prefectural University * 2) Graduate School of Kyoto Prefectural University ** Summary The possibility of the estimation of nutritional balance using color analysis of photographs of food dishes was in- vestigated in the case of salad. A total of 78 photographs of different salad varieties obtained from a recipe book and recipe website were analyzed. The ingredients of each salad were painted with 10 different colors and the area % of each color was calculated using the Feelimage Analyzer (VIVA Computer Ltd.). The weight average food com- position was determined for each color using recipes indicating trace nutrients and dietary fiber. The amounts of in- gredients estimated by color analyses were corrected using correlation equations obtained from the correlation anal- yses between the amount of nutrients estimated from the area % of the color and the amounts calculated per 100 g of salad from the recipe. The estimated nutrient content obtained using the weight average food composition for each color was then compared with those calculated per 100 g of salad based on the recipe. Of the 78 varieties of salad analyzed, in more than 50 % of cases the contents of potassium, dietary fiber, vitamin B1 and phosphorus could be estimated to within ±30 % of those calculated from recipe. In order to validate this method, an additional three varieties of salad were analyzed. While the possibility of the evaluation of nutritional balance using color analy- sis of salad photographs was suggested by the results of this study, an increase in accuracy to estimate the amounts of ingredients and the weight average food composition for each color will be required. * Address: 1-5, Hangi-cho, Shimogamo, Sakyo-ku, Kyoto, 606-8522, Japan ** Address: 1-5, Hangi-cho, Shimogamo, Sakyo-ku, Kyoto, 606-8522, Japan ― 1 ― Trace Nutrients Research 30 : 1−6(2013)
-
Upload
khangminh22 -
Category
Documents
-
view
2 -
download
0
Transcript of Estimation of the nutritional balance of food dishes by color ...

Introduction
At present, there are a number of dietary lifestyle-relat-ed issues in Japan. In particular, the increase in lifestyle-based diseases, including cancer and cardiovascular dis-ease, is an important social issue. A National Health and Nutrition Examination Survey conducted in 2011 reported that 30.3 % of men and 21.5 % of women over the age of 20 were obese, and 15.7 % of men and 7.6 % of women had pre-diabetes, about 1.3 times higher than reported in 2006.
In response to these issues, the Shokuiku Basic Act was passed by the Cabinet Office in 2005 and the Shokuiku Promotion Basic Plan was implemented in 2006 in order to promote Shokuiku, or food education, for all Japanese in order to promote healthy dietary habits. That is to say the cultivation of the ability to manage one’s healthy dietary life is expected. However, it may be difficult for individu-als who lack adequate knowledge about nutrition and food to make appropriate food choices. In addition, opportuni-ties to learn how to select and prepare food in order to
maintain and/or promote one’s health are decreasing due to changes in lifestyle and the increasing prevalence of ready-made meals and dining-out.
On the other hand, due to the progress of IT and the widespread use of digital cameras, mobile phones and smart phones, many studies have been reported describ-ing the estimation of the ingested nutrients of a meal from a photograph1-5). Although the photographic diet record method was easy for diners, the determination automati-cally the menu and the estimation of the amounts of ingre-dients from a one-dimensional photograph were difficult and inaccurate.
For proper dietary management, not only are the amounts of nutrients ingested important, but also the nu-tritional balance. Therefore, in the present study the pos-sibility of evaluating nutritional balance using color analy-sis of photographs of food dishes was demonstrated using salad as a model.
Original Article
Estimation of the nutritional balance of food dishes by color analysis of photographs - using salad as a model dish
Yukari Muramoto1), Momoko Yaeo1), Motoko Matsui2), Kimiko Ohtani2)
1)Kyoto Prefectural University *
2)Graduate School of Kyoto Prefectural University **
SummaryThe possibility of the estimation of nutritional balance using color analysis of photographs of food dishes was in-
vestigated in the case of salad. A total of 78 photographs of different salad varieties obtained from a recipe book and recipe website were analyzed. The ingredients of each salad were painted with 10 different colors and the area % of each color was calculated using the Feelimage Analyzer (VIVA Computer Ltd.). The weight average food com-position was determined for each color using recipes indicating trace nutrients and dietary fiber. The amounts of in-gredients estimated by color analyses were corrected using correlation equations obtained from the correlation anal-yses between the amount of nutrients estimated from the area % of the color and the amounts calculated per 100 g of salad from the recipe. The estimated nutrient content obtained using the weight average food composition for each color was then compared with those calculated per 100 g of salad based on the recipe. Of the 78 varieties of salad analyzed, in more than 50 % of cases the contents of potassium, dietary fiber, vitamin B1 and phosphorus could be estimated to within ±30 % of those calculated from recipe. In order to validate this method, an additional three varieties of salad were analyzed. While the possibility of the evaluation of nutritional balance using color analy-sis of salad photographs was suggested by the results of this study, an increase in accuracy to estimate the amounts of ingredients and the weight average food composition for each color will be required.
* Address: 1-5, Hangi-cho, Shimogamo, Sakyo-ku, Kyoto, 606-8522, Japan** Address: 1-5, Hangi-cho, Shimogamo, Sakyo-ku, Kyoto, 606-8522, Japan
― 1 ―
Trace Nutrients Research 30 : 1−6(2013)

amounts of nutrients in the salads.
6. Validation of the use of color analysis of salad
photographs to estimate nutritional balance
In order to verify the possible use of color analyses to estimate the nutritional balance from salad photographs, three additional varieties of salads (pumpkin salad, greens and chicken salad , Bagna Cauda salad) as shown in Fig. 1 were analyzed using the correlation formulae and weight average food composition. The estimated amounts of nu-trients were then compared with those obtained per 100 g of salads using the recipes and Excel eiyou-kun Ver.6.
7. Statistical analysis
Correlation analyses were performed by using Micro-soft Excel 2010.
Results and Discussion
1. Color analyses
The area % of each of 10 different colors in photographs of 78 varieties of salads is shown in Fig. 2, and the weight % of the ingredients represented by each color is shown in Table 1. The area % of white was the largest (30.2 %) followed by yellow-green (22.1 %) and green (21.5 %). The total area % of white, yellow-green, and green colors in 78 varieties of salad accounted for more 70 % of the area, due
Materials and Methods
1. Materials
A total of 78 photographs of different varieties of salads obtained from a recipe book6) and recipe website7), where the amount of each ingredient was indicated, were ana-lyzed. In this study, salads which consisted primarily of seafood, such as conger eel, salmon roe, crab, shrimp, and scallop, and those containing a large amount of sauce were excluded from the analyses.
2. Color analysis of salad photographs
Using Adobe Photoshop 7.0, the ingredients in each sal-ad photograph were painted with one of 10 colors, i.e., black, white, green, yellow-green, yellow, orange, red, brown, pink or purple, and the serving dish and back-ground were painted blue in order to exclude it from color analysis. The area % of each color in the salad was calcu-lated by using the Feelimage Analyzer (VIVA Computer Ltd.).
3. Revision the estimated amounts of ingredients
Correlation analyses between the amounts estimated from the area % of color and those calculated from the recipe per 100 g of salad were performed for all 10 colors. Using the correlation equation obtained for each color, the estimated amounts were revised to approximate the amounts calculated for all 78 varieties of salads.
4. Nutritional analysis
Based on the amounts of ingredients per 100 g of each of the 78 varieties of salads shown in the recipes, a weight average food composition table was prepared for all 10 colors using Excel eiyou-kun Ver.6 indicating the amount of potassium, calcium, magnesium, phosphorus, iron, reti-nol equivalent, vitamin B1, vitamin B2, folic acid, vitamin C and dietary fiber.
5. Revision of the estimated amount of nutrients
The estimated nutritional content was obtained using the revised % area and the weight average food composi-tion, and was calculated per 100 g of salad using the reci-pes for each of the 78 salads. A correlation analysis was performed for the amounts of 11 different nutrients; potas-sium, calcium, magnesium, phosphorus, iron, retinol equiv-alent, vitamin B1, vitamin B2, folic acid, vitamin C and di-etary fiber, and the resulting correlation equations were used to revise the estimated nutrient contents to more closely reflect the calculated amounts. This method was then used to compare the estimated and calculated
a b c
Fig. 1 Three additional varieties of salad used for validationa. pumpkin saladb. greens and chicken saladc. bagna cauda salad
White 30.2%
Yellow-green 22.1%
Green 21.5%
Red 5.9%
Yellow 5.7%
Orange 5.0%
Brown 4.3%
Black 2.7%
Pink 2.1% Purple
0.4%
White Yellow-green Green Red YellowOrange Brown Black Pink Purple
White 30.2 %
Yellow-green 22.1 %
Green 21.5 %
Red 5.9 %
Yellow 5.7 %
Orange 5.0 %
Brown 4.3 %
Black 2.7 %
Pink 2.1 % Purple
0.4 %
White Yellow-green Green Red YellowOrange Brown Black Pink Purple
Fig. 2 The area % of each color in 78 salad photographs
― 2 ―

recipes, the area % of each color was corrected using a correlation equation as shown in Table 2.
to the fact that the ingredients classified into these colors (potato, onion, lettuce, cucumber) were used more fre-quently regardless of the variety of salad. On the other hand, the small area % of brown and pink colors repre-sented animal foods such as sausage, ham and bacon. The purple color consisted of only seaweed (tosakanori) in the 78 varieties of salads examined.
2. Correlation of the estimated amounts of ingre-
dients with those calculated from the recipes
The correlation coefficients obtained from the correla-tion analyses between the estimated amounts, shown as the area %, and the calculated amounts of ingredients per 100 g of salad using the recipes, is shown in Table 2 for each of the 10 color categories. A representative correla-tion analysis for the color green is shown in Fig. 3. The es-timated amounts of ingredients classified as the color brown showed the highest correlation coefficient (r = 0.94) among the 10 colors. In the case of the other 8 colors, with the exception of purple which consisted of only one ingre-dient, the correlation coefficients were greater than 0.70. However, the estimated ingredients classified into the white and red colors were found to be less than when cal-culated from recipe.
In order to more closely approximate the estimated amounts shown as area % to the amounts calculated from
Table 1 Weight % of the ingredients in each color category
Color Weight % of the ingredient in each colorWhite potato (17.5 %), onion (13.4 %), japanese radish (8.7 %), tofu (6.4 %), cauliflower (6.0 %), bean sprout (5.9 %), tuna
(4.6 %), apple (3.2 %), celery (3.1 %), soybean (2.2 %), cuttlefish (2.0 %), yam (2.0 %), macaroni (2.0 %), turnip (1.9 %), egg white (1.8 %), lotus root (1.6 %), zucchini (1.5 %), sweet potato (1.4 %), eggplant (1.3 %), udo (1.2 %), radish (1.2 %), agar (1.1 %), shiitake mushroom (1.1 %), minced chicken (1.1 %), fried tofu (1.1 %), enoki mushroom (1.0 %), hiratake mushroom (0.7 %), boiled scallop (0.5 %), boiled crab (0.5 %), cheese spread (0.4 %), chicory (0.4 %), asparagus (0.4 %), mushroom (shimeji) (0.4 %), cod roe (mentaiko) (0.4 %), kidney beans (0.3 %), peanut (0.3 %), steamed fish paste (0.2 %), white radish sprouts (0.2 %), pickled cucumber (0.1 %), process cheese (0.1 %), sesame (0.1 %), roasted sesame (0.1 %)
Yellow-green lettuce (30.4 %), cucumber (24.5 %), cabbage (21.6 %), green soybean (6.7 %), lettuce (saladana) (6.2 %), celery (3.4 %), broccoli (2.1 %), red leaf lettuce (1.5 %), endive (1.3 %), asparagus (1.2 %), string been (sayaingen) (0.7 %), bitter melon (0.3 %)
Green string been (sayaingen) (24.9 %), spinach (14.7 %), corn marigold (8.6 %), string been (sayaendou) (6.8 %), cucumber (6.5 %), lettuce (saladana) (5.5 %), green pepper (4.4 %), broccoli (3.9 %), seaweed (kukiwakame) (3.7 %), bitter melon (3.6 %), watercress (2.4 %), rape blossoms (2.4 %), potherb mustard (2.4 %), dried wakame (1.9 %), asparagus (1.6 %), parsley (1.5 %), endive (1.4 %), white radish sprouts (0.9 %), zucchini (0.8 %), raw wakame (0.7 %), wakegi (0.6 %), pumpkin (0.6 %)
Red tomato (64.4 %), red pepper (16.0 %), mini-tomato (14.4 %), apple (1.6 %), bacon (1.2 %), sweet potato (1.0 %), radish (1.0 %), crab (0.3 %)
Yellow grapefruit (24.3 %), sweet potato (19.5 %), sweet corn (18.4 %), yellow pepper (14.4 %), egg yellow (7.1 %), bean sprout (6.8 %), process cheese (4.1 %), young corn (2.9 %), pineapple (2.6 %)
Orange carrot (63.1 %), pumpkin (32.0 %), tomato (4.9 %)Brown sausage (17.8 %), common mushroom (14.9 %), mushroom (shimeji) (11.0 %), shiitake mushroom (9.1 %), tuna (8.0 %),
enoki mushroom (6.8 %), mushroom (maitake) (6.8 %), dried fry (shirasu) (5.9 %), kidney bean (5.0 %), raisin (4.2 %), bacon (3.9 %), red leaf lettuce (2.1 %), black olive (2.0 %), umeboshi (1.1 %), pleurotus mushroom (1.1 %), dried bonito (0.5 %)
Black dried wakame (28.9 %), salted kombu (18.9 %), hijiki (18.6 %), eggplant (12.1 %), black olive (11.6 %), raw wakame (9.9 %)
Pink ham (53.4 %), bacon (14.4 %), sausage (9.1 %), salami (8.8 %), red pea (8.7 %), japanese ginger (5.5 %)Purple seaweed (tosakanori) (100.0 %)
Table 2 Correlation analyses between the estimated and calculated amounts of ingredients in each color category
Correlation coefficient
Correlation equation
Revision equation
Brown 0.94 y = 0.8939x × 0.8939Red 0.89 y = 1.2649x × 1.2649
Yellow 0.88 y = 0.8147x × 0.8147White 0.87 y = 1.2636x × 1.2636
Yellow-green 0.82 y = 0.8073x × 0.8073Pink 0.82 y = 0.8172x × 0.8172
Green 0.73 y = 0.7059x × 0.7059Black 0.73 y = 0.2738x × 0.2738
Orange 0.72 y = 0.7101x × 0.7101Purple 1.00 y = 1.0956x × 1.0956
y = 0.7059x R² = 0.5312
0102030405060708090
0 20 40 60 80 100
calc
ulat
ed a
mou
nt
estimated amount
Fig. 3 Representative correlation analysis in the case of green color category
― 3 ―

the calculated values in the 78 varieties of salads. In the case of potassium, dietary fi ber, vitamin B1 and phospho-rus, they could be estimated to within ±30 % of the calcu-
3. Nutritional analyses
In order to carry out the nutrition analyses, the weight average food composition for each of the 10 colors was ob-tained using the weight % of ingredients shown in the recipes as shown in Table 3.
According to the weight average food composition of each color category, the ingredients classified into the black color category were found to contain more potassi-um, calcium, magnesium, iron and dietary fiber, while those classified into the green color category contained more folic acid, those classifi ed into the orange color cate-gory had higher retinol equivalent, and those classified into the pink color category contained more phosphorus and vitamin B1.
4. Correlation analyses between the estimated and
calculated nutrient contents
Correlation analyses between the estimated nutrient contents obtained by using the revised area % and the weight average food composition table, and the calculated nutrient contents per 100 g of salads were performed. The correlation coefficients for the 11 different nutrients are shown in Table 4, and a representative correlation analy-sis in the case of vitamin B2 is shown in Fig. 4. The corre-lation coeffi cient of iron was the highest (r = 0.71) among the nutrients analyzed, followed by vitamin B2 (r = 0.67), dietary fiber (r = 0.63) and retinol equivalent (r = 0.61). However, that of folic acid was the lowest (r = 0.28). Green and yellow-green vegetables are generally thought to be the main sources of folic acid. Although green and yellow-green vegetables are often the main ingredients in salad, their nutrient estimation was diffi cult, since they were in some cases underestimated by being covered with other colorful vegetables used as toppings, but also overestimat-ed due to the large surface area when served in shallow plate in spite of their light weight per volume.
Fig. 5 shows the percentage of 11 different nutrients which were estimated to within ±30 % and/or ±50 % of
Table 3 The weight average food composition table for 10 color categories
Potassium(mg)
Calcium(mg)
Magnesium(mg)
Phosphorus(mg)
Iron(mg)
Retinol equivalent (µg)
VitaminB1 (mg)
VitaminB2 (mg)
Folic acid(µg)
Vitamin C (mg)
Dietary fi ber (g)
Black 1332 370 203 72 11.3 94 0.11 0.30 39 3 13.1White 253 32 20 63 0.5 3 0.06 0.06 27 17 1.6
Yellow-green 249 34 16 41 0.6 33 0.06 0.05 78 19 1.7Green 358 61 33 47 1.2 150 0.08 0.13 111 35 2.8Yellow 202 51 14 98 0.7 46 0.07 0.09 39 37 1.6Orange 325 22 14 30 0.3 537 0.05 0.05 29 17 2.7
Red 226 9 11 29 0.3 55 0.06 0.05 32 43 1.2Brown 319 43 23 169 0.8 18 0.17 0.21 30 5 2.5Purple 37 70 31 11 1.2 1 0.00 0.04 0 0 4.0Pink 242 12 21 258 0.8 2 0.46 0.12 3 35 0.8
y = 1.0344x R² = 0.3678
0.00
0.05
0.10
0.15
0.20
0.25
0.30
0.35
0.00 0.05 0.10 0.15 0.20
calc
utat
ed n
utri
ent
estimated nutrient
Fig. 4 Representative correlation analysis in the case of vita-min B2
Table 4 Correlation analyses between the estimated and calculated nutrients
Correlationcoeffi cient
Correlationequation
Revisionequation
Iron 0.71 y = 1.1109x × 1.1109Vitamin B2 0.67 y = 1.0344x × 1.0344
Dietary fi ber 0.63 y = 1.0163x × 1.0163Retinol equivalent 0.61 y = 0.8550x × 0.8550
Magnesium 0.51 y = 1.0206x × 1.0206Calcium 0.47 y = 1.0246x × 1.0246
Vitamin B1 0.47 y = 0.9801x × 0.9801Vitamin C 0.39 y = 1.0177x × 1.0177Phosphorus 0.39 y = 0.9743x × 0.9743Potassium 0.37 y = 1.0019x × 1.0019Folic acid 0.28 y = 0.9348x × 0.9348
0 % 20 % 40 % 60 % 80 % 100 %
PotassiumDietary fiber
VitaminPhosphorusMagnesiumVitamin
Folic acidRetinol equivalent
CalciumIron
Vitamin C
≦±30 % error ≦±50 % error ±50 % error<
Dietary fiberVitaminB1
MagnesiumVitaminB2
0% 20% 40% 60% 80% 100%
PotassiumDietary fiber
VitaminPhosphorusMagnesiumVitamin
Folic acidRetinol equivalent
CalciumIron
Vitamin C
≦±30 % error ≦±50 % error ±50 % error<
B1
B2
Fig. 5 Percentage of salad estimated to within ±30 % or ±50 % of calculated nutrientsn = 78
― 4 ―
coeffi cients in this study were relatively high may be due to the fact that this study restricted the analyses to only salad. That is to say, there are diffi culties in judging the menu and estimating the amounts of ingredients from one-dimensional photographs of various dishes. Moreover, the relative nutritional balance instead of the amounts of nutrients was analyzed in this study.
In order to manage a healthy dietary life, it is necessary to estimate the nutritional balance of one’s meals. Howev-
lated value in more than 50 % of the 78 salads. These re-sults would suggest that color analysis may be a possible method to estimate the amount of nutrients in salad.
5. The verifi cation of the estimation of nutritional
balance using color analysis
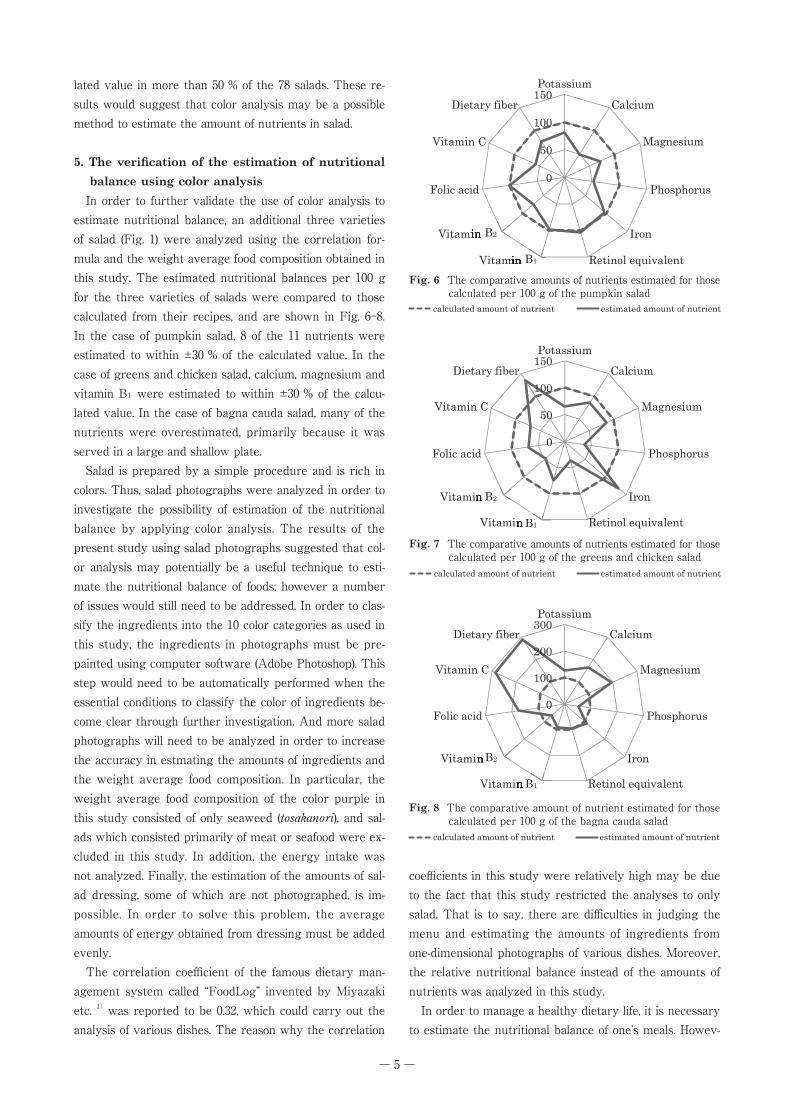
In order to further validate the use of color analysis to estimate nutritional balance, an additional three varieties of salad (Fig. 1) were analyzed using the correlation for-mula and the weight average food composition obtained in this study. The estimated nutritional balances per 100 g for the three varieties of salads were compared to those calculated from their recipes, and are shown in Fig. 6-8. In the case of pumpkin salad, 8 of the 11 nutrients were estimated to within ±30 % of the calculated value. In the case of greens and chicken salad, calcium, magnesium and vitamin B1 were estimated to within ±30 % of the calcu-lated value. In the case of bagna cauda salad, many of the nutrients were overestimated, primarily because it was served in a large and shallow plate.
Salad is prepared by a simple procedure and is rich in colors. Thus, salad photographs were analyzed in order to investigate the possibility of estimation of the nutritional balance by applying color analysis. The results of the present study using salad photographs suggested that col-or analysis may potentially be a useful technique to esti-mate the nutritional balance of foods; however a number of issues would still need to be addressed. In order to clas-sify the ingredients into the 10 color categories as used in this study, the ingredients in photographs must be pre-painted using computer software (Adobe Photoshop). This step would need to be automatically performed when the essential conditions to classify the color of ingredients be-come clear through further investigation. And more salad photographs will need to be analyzed in order to increase the accuracy in estmating the amounts of ingredients and the weight average food composition. In particular, the weight average food composition of the color purple in this study consisted of only seaweed (tosakanori), and sal-ads which consisted primarily of meat or seafood were ex-cluded in this study. In addition, the energy intake was not analyzed. Finally, the estimation of the amounts of sal-ad dressing, some of which are not photographed, is im-possible. In order to solve this problem, the average amounts of energy obtained from dressing must be added evenly.
The correlation coeffi cient of the famous dietary man-agement system called “FoodLog” invented by Miyazaki etc. 1) was reported to be 0.32, which could carry out the analysis of various dishes. The reason why the correlation
Fig. 8 The comparative amount of nutrient estimated for those calculated per 100 g of the bagna cauda salad
Fig. 7 The comparative amounts of nutrients estimated for those calculated per 100 g of the greens and chicken salad
Fig. 6 The comparative amounts of nutrients estimated for those calculated per 100 g of the pumpkin salad
0
100
200
300Potassium
Calcium
Magnesium
Phosphorus
Iron
Retinol equivalentVitamin
Vitamin
Folic acid
Vitamin C
Dietary fiber
calculated amount of nutrient estimated amount of nutrient
B1
B2
0
50
100
150Potassium
Calcium
Magnesium
Phosphorus
Iron
Retinol equivalentVitamin
Vitamin
Folic acid
Vitamin C
Dietary fiber
calculated amount of nutrient estimated amount of nutrient
B1
B2
0
50
100
150Potassium
Calcium
Magnesium
Phosphorus
Iron
Retinol equivalentVitamin
Vitamin
Folic acid
Vitamin C
Dietary fiber
calculated amount of nutrient estimated amount of nutrient
B1
B2
0
100
200
300Potassium
Calcium
Magnesium
Phosphorus
Iron
Retinol equivalentVitamin
Vitamin
Folic acid
Vitamin C
Dietary fiber
calculated amount of nutrient estimated amount of nutrient
VitaminVitamin B1
Vitamin B2
0
50
100
150Potassium
Calcium
Magnesium
Phosphorus
Iron
Retinol equivalentVitamin
Vitamin
Folic acid
Vitamin C
Dietary fiber
calculated amount of nutrient estimated amount of nutrient
VitaminVitamin B1
Vitamin B2
0
50
100
150Potassium
Calcium
Magnesium
Phosphorus
Iron
Retinol equivalentVitamin
Vitamin
Folic acid
Vitamin C
Dietary fiber
calculated amount of nutrient estimated amount of nutrient
VitaminVitamin B1
Vitamin B2
― 5 ―

3) Matsuzaki S, Ando F, Koike K, Gomibuchi H, Shi-bata A, Okano Y, Takei H, Kawabata T (2006) The Validity of the Dietary Survey Method (Pho-tographic Diet Record; PDR) Using Digital Photo-graphs. Kagawa Nutrition University 37: 5-12.
4) Suzuki A, Miyauchi M, Hattori I, Egami I, Wakai K, Tamakoshi A, Ando M, Nakayama T, Ohno Y, Kawamura T (2002) Inter-Observer Agreement and Validity of Photographic Dietary Assessment. Japanese Society of Public Health 49 (8): 749-758.
5) Joutou T, Hoashi H, Yanai K (2010) 50-Class Food-Image Recognition Employing Multiple Kernel Learning. The Institute of Electronics, Infoemation and Communication Engineers J93-D (8): 1397-1406.
6) Onoue T (1997) New Welldish Vol.3 Menu of Veg-etables/Salad
7) Bob & Angie, http://www.bob-an.com/
er, there have been no successful reports of doing so us-ing computer software without human support. Additional work will be required to further validate the effectiveness of this technique, and investigate its use for estimating the nutritional balance of not only salads but also for the anal-ysis of main dishes and side dishes.
References
1) Miyazaki T, Gamhewage C S, Aizawa K (2011) Im-age-based Calorie Content Estimation for Dietary Assessment. IEEE International Symposium on Multimedia: 363-368.
2) Hasegawa S, Yoshida T, Egami I, Yokota M, Mu-rakami Y (2006) Dietetic Education Using a Nutri-tion Management System with Camera Phones. Computer & Education 21: 107-113.
― 6 ―