Effects of Welfare Reform on Illicit Drug Use of Adult Women
51
NBER WORKING PAPER SERIES EFFECTS OF WELFARE REFORM ON ILLICIT DRUG USE OF ADULT WOMEN Hope Corman Dhaval M. Dave Nancy E. Reichman Dhiman Das Working Paper 16072 http://www.nber.org/papers/w16072 NATIONAL BUREAU OF ECONOMIC RESEARCH 1050 Massachusetts Avenue Cambridge, MA 02138 June 2010 This project was funded in part by Grant #R01HD60318 from the Eunice Kennedy Shriver National Institute of Child Health and Human Development. The authors thank Sandra Decker and Jeremy Arkes for helpful comments, and Julia Crum, Prisca Figaro, Jessica Fuller, and Oliver Joszt for valuable research assistance. The views expressed herein are those of the authors and do not necessarily reflect the views of the National Bureau of Economic Research. NBER working papers are circulated for discussion and comment purposes. They have not been peer- reviewed or been subject to the review by the NBER Board of Directors that accompanies official NBER publications. © 2010 by Hope Corman, Dhaval M. Dave, Nancy E. Reichman, and Dhiman Das. All rights reserved. Short sections of text, not to exceed two paragraphs, may be quoted without explicit permission provided that full credit, including © notice, is given to the source.
Transcript of Effects of Welfare Reform on Illicit Drug Use of Adult Women

NBER WORKING PAPER SERIES
EFFECTS OF WELFARE REFORM ON ILLICIT DRUG USE OF ADULT WOMEN
Hope CormanDhaval M. Dave
Nancy E. ReichmanDhiman Das
Working Paper 16072http://www.nber.org/papers/w16072
NATIONAL BUREAU OF ECONOMIC RESEARCH1050 Massachusetts Avenue
Cambridge, MA 02138June 2010
This project was funded in part by Grant #R01HD60318 from the Eunice Kennedy Shriver NationalInstitute of Child Health and Human Development. The authors thank Sandra Decker and Jeremy Arkesfor helpful comments, and Julia Crum, Prisca Figaro, Jessica Fuller, and Oliver Joszt for valuable researchassistance. The views expressed herein are those of the authors and do not necessarily reflect the viewsof the National Bureau of Economic Research.
NBER working papers are circulated for discussion and comment purposes. They have not been peer-reviewed or been subject to the review by the NBER Board of Directors that accompanies officialNBER publications.
© 2010 by Hope Corman, Dhaval M. Dave, Nancy E. Reichman, and Dhiman Das. All rights reserved.Short sections of text, not to exceed two paragraphs, may be quoted without explicit permission providedthat full credit, including © notice, is given to the source.

Effects of Welfare Reform on Illicit Drug Use of Adult WomenHope Corman, Dhaval M. Dave, Nancy E. Reichman, and Dhiman DasNBER Working Paper No. 16072June 2010JEL No. H53,I18,I38,K42
ABSTRACT
Exploiting changes in welfare policy across states and over time and comparing relevant populationsubgroups within an econometric difference-in-differences framework, we estimate the causal effectsof welfare reform on adult women’s illicit drug use from 1992 to 2002, the period during which welfarereform unfolded in the U.S. The analyses are based on all available and appropriate national datasets,each offering unique strengths and measuring a different drug-related outcome. We investigate self-reportedillicit drug use (from the National Surveys on Drug Use and Health), drug-related prison admissions(from the National Corrections Reporting Program), drug-related arrests (from the Uniform CrimeReports), drug-related treatment admissions (from the Treatment Episode Data Set), and drug-relatedemergency room episodes (from the Drug Abuse Warning Network). We find robust and compellingevidence that welfare reform led to declines in illicit drug use and increases in drug treatment amongwomen at risk for relying on welfare, and some evidence that the effects operate, at least in part, throughboth TANF drug sanctions and work incentives.
Hope CormanRider University2083 Lawrenceville RoadLawrenceville, NJ 08648and [email protected]
Dhaval M. DaveBentley UniversityDepartment of Economics175 Forest Street, AAC 195Waltham, MA 02452-4705and [email protected]
Nancy E. ReichmanRobert Wood Johnson Medical SchoolUniversity of Medicine and Dentistry of New Jersey97 Paterson St., Room 435New Brunswick, NJ [email protected]
Dhiman DasRobert Wood Johnson Medical SchoolUniversity of Medicine and Dentistry of New Jersey97 Paterson St., Room 435New Brunswick, NJ [email protected]
4
The Personal Responsibility and Work Opportunity Reconciliation Act (PRWORA) of
1996, often referred to as welfare reform, ended entitlement to welfare benefits under Aid to
Families with Dependent Children (AFDC) and replaced the AFDC program with Temporary
Assistance for Needy Families (TANF) block grants to states. Features of the legislation were
time limits on cash assistance, work requirements as a condition for receiving benefits, and
increased state latitude in establishing eligibility and program rules. Among the broad goals of
PRWORA were to reduce dependence on government benefits by promoting work, encouraging
marriage, and reducing non-marital childbearing. The legislation represented a convergence of
dissatisfaction with the welfare system on both sides of the political spectrum, with welfare
participation becoming viewed by many as a cause of dependence rather than a consequence of
disadvantage.
Much research has evaluated the effects of welfare reform on employment, welfare
caseloads, marital status, or fertility—outcomes that the reforms were intended to affect. Overall,
the evidence indicates that welfare reform has increased employment and decreased welfare
caseloads, but has had weak or mixed effects on family structure. Few studies have investigated
the effects of welfare reform on social behaviors, such as illicit drug use, that economic theory
suggests may be affected by the policy shift. Exploiting changes in welfare policy across states
and over time and comparing relevant population subgroups within an econometric difference-
in-differences framework, we estimate the causal effects of welfare reform on adult women’s
illicit drug use from 1992 to 2002, the period during which welfare reform unfolded. The
analyses are based on multiple datasets, each offering unique strengths and measuring a different
drug related outcome. We investigate self-reported illicit drug use (from the National Surveys on
Drug Use and Health), drug-related prison admissions (from the National Corrections Reporting

5
Program), drug-related arrests (from the Uniform Crime Reports), drug-related treatment
admissions (from the Treatment Episode Data Set), and drug-related emergency room visits
(from the Drug Abuse Warning Network). The data are augmented with state welfare
implementation and caseload measures as well as other potentially confounding economic and
policy measures. The results, which are robust across different model specifications, comparison
groups, and datasets that capture a range of drug-related outcomes reported by different entities,
indicate that welfare reform led to declines in illicit drug use and increases in drug treatment
among women at risk for relying on welfare.
Background
Illicit Drug Use
Illicit drug use results in substantial costs to families and communities that include
healthcare utilization, reduced productivity and unemployment, and criminal justice
expenditures. Although illicit drug use declined substantially in the U.S. during the 1980s and
1990s, it remains an important public health and policy issue. In 1979, 14.1% of the U.S.
population age 12 and older reported using illicit drugs in the past 30 days; that figure decreased
to 6.3% in 1998, with the sharpest drop occurring between 1985 and 1990 (Office of National
Drug Control Policy 2002). More recent figures indicate that rates have increased since then; the
rate was 7.1% in 2001 (Office of National Drug Control Policy 2002). Among adult women,
illicit drug use declined by more than 50% between 1979 and 1992 (from 9.4% to 4.2%)
(SAMHSA 1998), remained relatively constant into the late 1990s when TANF was fully
implemented (SAMHSA 1998), and appears to have increased starting in 2001.1 Data from the
Drug Abuse Warning Network indicate a 22% increase between 1995 and 2002 in drug-related
1 Source for 2001: Authors' calculations, based on weighted averages for any drug use past year and past month for women aged 18 to 49 in the 1999 to 2005 National Household Survey on Drug Abuse/National Survey on Drug Abuse and Health surveys.
6
hospital emergency department visits among women.2 The cost to society of illicit drug use has
been estimated at $181 billion annually (Office of National Drug Control Policy 2004).
Welfare Reform
Although welfare reform is often dated to the landmark 1996 PRWORA legislation,
reforms actually started taking place in the early 1990s when the Clinton Administration greatly
expanded the use and scope of “welfare waivers” to allow states to carry out experimental or
pilot changes to their AFDC programs, with random assignment required for evaluation. Waivers
were approved in 43 states, ranging from modest demonstration projects to broad-based
statewide changes, and constituted the first phase of welfare reform. Many policies and features
of state waivers were later incorporated into PRWORA. However, PRWORA departed from its
waiver precursors by imposing a “work first” approach that was designed to not only reduce
welfare dependence, but also to reconnect members of an increasingly marginalized underclass
to the mainstream ideals of a strong work ethic and civic responsibility (Katz 2001).
Explicit goals of PRWORA were to reduce welfare caseloads, increase employment,
increase marriage, and reduce non-marital childbearing. Among the features of PRWORA and
many waiver programs were time limits on the receipt of welfare, work requirements as a
condition of receiving welfare, and stricter sanctions for non-compliance with program rules. In
terms of reducing caseloads, welfare reform (including the pre-PRWORA waivers) has been
successful; at least one-third of the caseload decline can be explained by welfare reform. At the
same time, employment rates of low-skilled mothers rose dramatically (Ziliak 2006), and at least
some of that increase was a result of welfare reform (Schoeni & Blank 2000). The overall effects
on family structure, however, are less dramatic. A large literature on the effects of welfare
reform on marriage and a smaller one on cohabitation reveal mixed findings, and the literature on 2 Source: http://dawninfo.samhsa.gov/old_dawn/pubs_94_02/edpubs/2002final/
7
non-marital childbearing and female headship indicates slightly negative but inconsistent effects
of welfare reform. The inconsistent results suggest that the effects of welfare reform on family
structure are complex.3
The original 1996 bill was set to expire in September of 2002, and Congress passed
numerous reauthorizations as debate ensued. The TANF program was finally reauthorized under
the Deficit Reduction Act of 2005, which further strengthened the state work participation rate
requirement. While the debate centered on term limits, work requirements, and impacts on
welfare rolls and employment, welfare reform has led to a fundamental shift in individual
incentives and would be expected to have effects that are complex and multi-dimensional. To
gain a complete picture of the effects of welfare reform, it is necessary to look beyond the
immediate and targeted outcomes of caseloads, employment, marriage, and fertility. Several
empirically rigorous studies have gone in this direction by estimating effects of welfare reform or
pre-PRWORA waivers on: material hardship (e.g., Meyer & Sullivan 2004 and Winship &
Jencks 2004, both of which found had no deleterious effects), child well-being (e.g., Kaestner &
Lee 2005, which found modest negative effects on prenatal care use and birth weight; review by
Morris et al. 2005, which indicates some positive effects on child development), child
maltreatment (Paxson & Waldfogel 2002, which found mixed effects), health insurance coverage
of low-income women and children (e.g., DeLeire, Levine & Levy 2006; Kaestner & Kaushal
2003; Bitler, Gelbach & Hoynes 2005; and Cawley, Schroeder & Simon 2005, which revealed
mixed results) and women’s health and behaviors (e.g., Kaestner & Tarlov 2006, which looked at
a range of health behaviors (but not drug use) and found few effects; review by Bitler, Gelbach
3 An abundance of research on the effects of welfare reform on intended outcomes has been conducted and a detailed review is beyond the scope of this paper. Much of the information in this section is drawn from the following review articles: Blank (2002), Moffitt (1992, 1995, 1998), Grogger & Karoly (2005), Gennetian & Knox (2003), Peters, Plotnick & Jeong (2003), and Ratcliffe et al. (2002).
8
& Hoynes 2006, which found the most consistent effects for insurance coverage).4 Only the
Paxson & Waldfogel and Kaestner & Tarlov studies directly considered unintended effects of
welfare reform on behavioral change, which can have important implications for family and
child well-being and can serve as a test of whether the work first regime has encouraged
mainstream (or discouraged socially undesirable) behaviors.
By linking cash assistance to work and making benefits time limited, welfare reform is
likely to have affected the costs and benefits of using illicit drugs, as described later. The
PRWORA legislation also included direct policies vis-à-vis illicit drug use. In particular,
PRWORA denies TANF benefits, for life, to women who are convicted of a drug felony unless a
state enacts legislation to modify or opt out of the lifetime drug sanction.5 States can also test and
sanction recipients for illegal drug use. Although many states have chosen to implement drug
sanctions which are less strict than those initially proposed in the PRWORA legislation, TANF
has been much tougher than its predecessor AFDC in terms of drug use policy vis-à-vis welfare
benefits. These drug use policies under TANF would be expected to both decrease drug use and
increase treatment for drug abuse among mothers at risk for relying on welfare. In a survey of
state TANF agencies in 43 states and the District of Columbia, half of the states reported that
they refer clients who screen positive for drug use to substance abuse treatment and require those
individuals to participate in treatment as a condition of receiving benefits (Rubinstein 2002).
Welfare and Illicit Drug Use
A number of studies have investigated the relationship between welfare and women’s
drug use. Most, however, have explored the extent to which illicit drug use affects welfare
participation rather than how welfare affects drug use. In a study that pre-dates PRWORA,
4 The studies cited in this section are examples rather than exhaustive lists on the various topics. 5 By 2002, over half of states had either opted out or modified the lifetime denial of TANF benefits to women with felony drug convictions (GAO 2005).

9
Kaestner (1998), using data from the 1984 and 1988 surveys of the National Longitudinal Survey
of Youth (NLSY), found that past year drug use significantly increased future welfare use, but
that the effects were modest; the largest effect was for marijuana, a drug not generally associated
with addiction. Also using data from the NLSY, but over a longer time period, Cheng &
McElderry (2007) found no association between prior drug use and future welfare participation.
Pollack et al. (2002) found that about 20% of women receiving TANF in the 1998 NHSDA
reported using drugs in the previous year. Meara (2006) found that women who use drugs exit
the TANF rolls at about the same rate as women who do not use drugs. Thus, the existing
literature indicates that the majority of women on welfare do not use drugs and that drug use
does not necessarily cause welfare participation. However, as welfare reform plays out, there
could be negative effects of drug use on welfare participation since, as discussed earlier, some
states test TANF recipients for illicit drugs and impose sanctions on those who test positive, and
many impose a lifetime ban on benefits for women convicted of a drug felony (Rubinstein 2002
and GAO 2005 provide information on state TANF laws regarding drug use). Indeed, substance
use is more common among welfare recipients who are sanctioned for failing to comply with
TANF rules than among those who have not been sanctioned (Meara 2006).
Most studies of the demand for drugs focus on the effects of prices on drug use.
Grossman, Chaloupka & Shim (2002), in a comprehensive review, found that individuals
respond to the full cost of drugs, including monetary and non-monetary costs, as they do for
other goods. Most studies investigating the demand for illicit drugs do not focus specifically on
women. One exception is a study by Saffer & Chaloupka (1999) that explicitly examined the
demand for drugs by women using the NHSDA for 1988, 1990, and 1991. They found that the
demand for hard drugs (cocaine and heroin) is price elastic, consumption of marijuana and
10
cocaine increases with income, heroin consumption decreases with income, and marijuana
consumption increased with marijuana decriminalization. Another study found that poor mothers
with young children are responsive to drug prices (Corman et al. 2005). Finally, two studies
investigated effects of transfer payments on drug use. Shaner et al. (1995) found that disability
payments may facilitate drug use among individuals with both serious mental illness and drug
addiction, and Dobkin & Puller (2007) found that individuals on public assistance are more
likely to become hospitalized or die from substance abuse around the days that benefit checks are
distributed (they found a weak effect for welfare and a much stronger effect for disability
benefits). Overall, these studies point to the need for more research on the effects of cash benefits
on drug use.
Theory
We use economic theory to guide our exploration of the effects of welfare reform on drug
use of adult women. Following Saffer & Chaloupka (1999), we posit that the demand for drugs
derives from the same theoretical model as for other goods in which an individual maximizes
discounted lifetime utility subject to a budget constraint. Illicit drug use is a function of the full
price of drugs, the prices of other goods, income, the probability and harshness of sanctions, and
tastes. Demand will increase with a lower price of the good, lower prices of complementary
goods, higher prices of substitutes, and higher levels of income, as long as drugs are a normal
good. According to Saffer & Chaloupka, drug use may decrease health, and since health is a
normal good, it is not clear whether increases in income will lead to an increase or decrease in
the demand for drugs. The price of drugs includes the opportunity cost of time spent obtaining
drugs and under the influence, as well as the expected costs if caught. Criminal justice sanctions
vary considerably from one state to another, and are expected to shift the demand for drugs. For
11
welfare recipients, sanctions may include permanent loss of welfare. Tastes are particularly
relevant, as many proponents of welfare reform claimed that work would break a culture of
dependence by increasing self-sufficiency and reconnecting members of an increasingly
marginalized underclass to the mainstream ideals of a strong work ethic and civic responsibility
(Katz 2001). The logic was that connection to mainstream society through work would reduce
tastes for engaging in socially undesirable behaviors such as illicit drug use.
Welfare reform would decrease the demand for drugs if the opportunity cost of the
woman’s time increases as a result of employment, if income decreases (increases) and drugs are
normal (inferior), through increased sanctions, and/or if drugs become more distasteful when
women join the labor market. Welfare reform could result in a lower rate of time preference
(which would be consistent with “culture of poverty” arguments), which would reduce the
discounted net utility and consequently reduce illicit drug use. Additionally, welfare reform may
decrease the demand for drugs by increasing access to or requiring drug treatment. On the other
hand, welfare reform would increase the demand for drugs if income increases (decreases) and
drugs are normal (inferior), or if the stress of dealing with the realities of welfare reform
increases women’s utility from using drugs. For example, there have been concerns that some
individuals are ill-equipped to maintain stable employment (e.g., due to low job skills or
disability) and that the pro-work regime would marginalize, rather than mainstream, those
individuals by contributing to existing hardships (e.g., Katz 2001; Lichter & Jayakody 2002),
which could increase stress. Thus, welfare reform has the potential to increase, decrease, or not
affect the use of illicit drugs by women potentially eligible for welfare. However, given the
combination of strong work incentives and direct penalties for illicit drug use under PRWORA,
we expect that the negative effects on women’s illicit drug use will dominate the potential

12
competing and less direct effects. That is, we expect that welfare reform has reduced adult
women’s use of illicit drugs. In addition, because treatment is often necessary to discontinue
illicit drug use and because many states refer clients who screen positive to treatment and require
them to participate in treatment as a condition of receiving benefits, we expect that welfare
reform has increased drug treatment.
Data
We use all publicly-accessible national datasets that are both available and appropriate to
undertake a comprehensive analysis of the effects of welfare reform on illicit drug use of adult
women. First, we use the Substance Abuse and Mental Health Services Administration's annual
National Household Survey on Drug Abuse (NHSDA) survey, which was re-named the National
Household Survey on Drug Use and Health (NSDUH) in 2002. The NHSDA/NSDUH is a large-
scale nationally representative annual survey with a sample of about 20,000 individuals aged 12
and above in the earlier years (1992-1998) and over 50,000 individuals in the later years (1999 -
2002). The NHSDA/NSDUH is the pre-eminent source of statistics on adults’ illicit drug use in
the United States. We use NHSDA/NSDUH data from 1992 through 2002, which spans the
period of welfare reform, to estimate the effects of the reforms on self reports of any drug use in
the past year, any drug use other than marijuana in the past year, marijuana use in the past year,
and any drug use in the past month.
Beyond the self-reported measures of illicit drug use from the NHSDA, we consider
several objective measures from administrative records. Two sets of analyses investigate
involvement with the criminal justice system for drug offenses and two others investigate drug-
related encounters within the health care system. For the former, we investigate state-level drug-
related admissions into correctional facilities derived from the National Corrections Reporting
13
Program (NCRP), which annually gathers information from official state prison records and
provides a good measure of the flow of new inmates into the state prison system. These data
include the prisoner’s age, education, gender, and type of crime committed. We also investigate
monthly state-level drug-related and drug possession arrest rates from the Federal Bureau of
Investigation’s (FBI) crime reports, which are based on data collected by the FBI from most
large criminal justice agencies in the U.S. These data include the prisoner’s age, gender, and type
of crime committed. A description of how the measures of arrests were constructed is provided
in Appendix A. It is important to note that many arrestees are not convicted and that many
individuals who are convicted are not sent to state penitentiaries. Thus, individuals who are
imprisoned for a drug crime (as measured in the NCRP) represent a “hardcore” subset of all drug
arrestees.
In alternate analyses, we investigate state-level substance abuse treatment admissions
using the Treatment Episode Data Set (TEDS) which contains data on the number and
characteristics of persons admitted to public and private substance abuse treatment programs.
Within each state, treatment providers that receive any state agency funding, including federal
Substance Abuse Prevention and Treatment Block Grant funds, are required to provide TEDS
data for all clients admitted to treatment regardless of the source of funding for individual clients.
The TEDS data include information on the individual’s age, education, and marital status. We
also investigate state-level drug-related emergency room admissions from the Drug Abuse
Warning Network (DAWN) collected by the Substance Abuse and Mental Health Services
Administration (SAMHSA). The DAWN data are collected quarterly from hospitals in 21
metropolitan areas and include information about whether the emergency room visit was a direct
result of illicit drug use, as well as whether there was some indication that illicit drugs were
14
involved in the need for emergency care even when drugs were not the primary reason. The only
other relevant variable in this data set is the admitted individual’s gender. These data capture
serious health consequences related to illicit drug use.6
We follow the convention in prior literature with respect to the construction of the key
independent variables capturing the shifts in welfare-related policies (reviewed in Blank 2002).
The welfare reform measures can be classified into two phases. The first represents federal
waivers granted to states to experiment with AFDC rules prior to PRWORA. Since 1962, the
Secretary of Health and Human Services has had the authority to waive federal welfare rules if a
state proposed experimental or pilot programs that furthered the goals of AFDC. Some waivers
increased the amount of earnings that recipients were allowed to keep while maintaining welfare
eligibility; others expanded work requirements to larger groups, established term limits for cash
assistance, permitted states to issue sanctions to recipients who failed to meet work requirements,
or allowed states to eliminate increases in benefits to families who had additional children while
on welfare. The second represents the implementation of TANF programs post-PRWORA. It is
important to consider waivers and TANF separately, since they may have had different effects on
behavior. As discussed earlier, the PRWORA legislation explicitly banned welfare participation
for individuals with a conviction for a drug felony. Although states could opt out or modify the
ban, this rule imposed stricter sanctions that those imposed under AFDC waivers. Thus, the
effects of welfare reform on illicit drug use may be more negative (or less positive) under TANF
than under the waivers.
6 For all data sets other than DAWN, we use data for 1992 to 2002. Because of the smaller number of geographic units in the DAWN data, for those analyses we use information from 1990 to 2002 to increase the sample size and degrees of freedom. DAWN data were available quarterly from 1990 to the first half of 2001. For the second half of 2001and all of 2002, however, data are available only semi-annually. For those 6 quarters, we interpolated quarterly figures from the semi-annual data. Estimates are robust to the alternate use of semi-annual data throughout the sample period instead of the quarterly data.
15
Since state identifiers are not available for the NHSDA/NSDUH, our analyses of self-
reported drug use will exploit variations in welfare policy over time at the national level. For
those analyses, we characterize welfare reform several different ways. Our main measure is
welfare caseloads, as has been used in many previous studies of effects of welfare reform (e.g.
Currie and Grogger, 2002; Kaestner and Kaushal, 2003).7 Second, we use a dichotomous
measure of TANF implementation. PRWORA legislation was signed into law in late August of
1996 and most states did not implement their TANF programs until early 1997, so we
characterize welfare reform as a dichotomous variable equal to one for 1997 through 2002, and
zero for the years before 1997. This measure captures any discrete break in illicit drug use trends
pre- and post-TANF. Third, we use current welfare receipt and interact welfare receipt with a
dichotomous indicator for post-1996 (TANF regime). Advantages of this specification are that
welfare receipt is measured at the individual level and the estimated effects of welfare reform are
based on individuals who were definitely affected by the policy change. Fourth, we use the
proportion of the U.S. population that were exposed to AFDC waivers and TANF in a given
year, which we calculated using actual implementation dates in each state for both major AFDC
waiver programs and TANF and state population by year from the U.S. Census.8 We consider
waivers and TANF separately, since they may have had different effects on behavior. As
discussed earlier, PRWORA was much tougher than its predecessor AFDC on drug use, and as
such, the effects of welfare reform on illicit drug use may be more negative (or less positive)
7 Caseload data were obtained from the Administration for Children and Families Office of Family Assistance and can be found at: http://www.acf.hhs.gov/programs/ofa/caseload/caseloadindex.htm. 8 Information on state implementation of major AFDC waivers and TANF was obtained from the Assistant Secretary for Planning and Evaluation at the U.S. Department of Health and Human Services: http://aspe.hhs.gov/HSP/Waiver-Policies99/policy_CEA.htm. Census data were obtained from the following two web sites: http://www.census.gov/popest/archives/2000s/vintage_2001/CO-EST2001-12/CO-EST2001-12-00.html and www.census.gov/popest/states/tables/NST-EST2008-01.xls .

16
under TANF than under the waivers. Finally, we combined the percent of population exposed to
AFDC waivers and the percent of population exposed to TANF into one variable—percent of
population exposed to any welfare reform. Our combined measure allows us to gauge the
robustness of our results, while providing greater statistical power in our estimations.
In the NHSDA/NSDUH analyses, we incorporate the following individual-level
characteristics: age and age squared, race/ethnicity (non-Hispanic black, Hispanic, and other
non-white non-Hispanic, compared to non-Hispanic white), marital status (divorced/separated,
compared to never married), education (less than high school, compared to high school graduate
with no college), household size (total number of people in the household), and whether the
woman had ever used drugs as a minor (age of onset of drug use less than 18). The limited
marital status and education categories (e.g., no categories for married and college) reflect
sample restrictions based on those criteria, as discussed later. To capture trends in the national
economic and policy environment (other than welfare reform), we include indicators for year in
specifications that do not use the year to characterize welfare reform.
For all of the analyses based on administrative data (NCRP, FBI, TEDS, and DAWN),
we characterize welfare reform two different ways and exploit differences in the timing of
welfare reform across states with respect to both AFDC waivers and TANF. First, we include
separate indicators for both AFDC waivers and TANF. For AFDC, we include an indicator for
whether a given state in a given month (for FBI) or quarter (for DAWN) had a statewide waiver
in place that substantially altered the nature of AFDC with regard to time limits, Job
Opportunities and Basic Skills training (JOBS) work exemptions, JOBS sanctions, increased
earnings disregards, family caps, and/or work requirements. For the annual administrative
datasets (NCRP and TEDS), we define a similar indicator that captures the fraction of the year
17
that a given state had a major statewide waiver in place.9 A similar indicator is also defined for
TANF.10 Second, we include an indicator for any welfare reform (AFDC or TANF).
Method
The primary aim of this study is to evaluate the impact of welfare reform on adult
women’s illicit drug use. We employ a quasi-experimental research design – akin to a pre- and
post-comparison with treatment and control groups – in conjunction with multivariate regression
methods. Analyses based on individual-level data from the NHSDA/NSDUH are based on the
following model which relates changes in illicit drug use to welfare reform:
ittittit ZXWelfareD )()1( 11
Equation 1 posits that illicit drug use (D), for the ith woman during year t, is a function of welfare
policy (Welfare), characterized here by the log of welfare caseloads or one of the other measures
described earlier. In addition, illicit drug use depends on a vector of individual characteristics (X)
such as age, race, ethnicity, highest grade completed, and age of onset of drug use, and possibly a
vector of time-varying factors (Z). The parameter represents an individual classical error term.
A challenge in any policy analysis is in disentangling the effects of the policy of interest
from other time-variant factors that may also affect the outcome (Z). We account for such
confounding trends and other policy shifts that coincide with welfare reform in various ways. In
specifications that characterize welfare reform using post-1996 dichotomous measures, we
account for unobserved time-varying factors through a linear and quadratic time trend in addition
to controlling for the national annual unemployment rate, Medicaid enrollment, log of child 9 For instance, the indicator for Maryland, which enacted a major waiver on March 1, 1996, is coded as 0.667 for 1996 to reflect the eight months that the waiver was in place for that year (using October as the reference month, since the analyses are based on the October CPS). 29 states enacted such waivers, across various months, between 1992 and 1996. 10 States enacted TANF differentially throughout 1996 and 1997, with California being the last state to implement on January 1, 1998. Information on state implementation of major AFDC waivers and TANF was obtained from the Assistant Secretary for Planning and Evaluation at the U.S. Department of Health and Human Services: http://aspe.hhs.gov/HSP/Waiver-Policies99/policy_CEA.htm.

18
support caseload, and average child support payment in the U.S. 11 In specifications that
characterize welfare reform using continuous measures (welfare caseload, fraction of population
affected), we control for unobserved trends that may affect illicit drug participation through year
fixed effects.
The population of interest, that which is affected by welfare reform legislation, is all
women at risk of being on public assistance, and not just current or former program participants
(Kaestner & Tarlov 2006). Welfare reform can affect exit rates as well as entry rates.
Considering all women at risk addresses some of the limitations from leavers’ studies, which
focus solely on individuals who have left welfare. Potential welfare recipients are also shown to
behave strategically in their use of welfare benefits when faced with time limits and other
regulatory constraints (DeLeire et al. 2006; Grogger 2004). Thus, in order to identify the
population effect of welfare reform on key outcomes, the appropriate sample is all women at risk
of being on public assistance, which traditionally has consisted primarily of low-educated,
unmarried mothers. We can therefore estimate Equation 1 for this at-risk population group,
which we refer to as the target group.
In estimating Equation 1, the possibility of omitted variables remains despite the controls
for confounding trends and policy shifts. This problem can be addressed by also considering a
comparison group – individuals who are similar in many ways to the target group but are
11 Unemployment rates were from the Bureau of Labor Statistics: http://data.bls.gov/PDQ/servlet/SurveyOutputServlet?data_tool=latest_numbers&series_id=LNU04000000&years_option=all_years&periods_option=specific_periods&periods=Annual+Data. Medicaid enrollments (as a fraction of the population) were from the Centers for Medicare and Medicaid Services Data: http://www.cms.hhs.gov/NationalHealthExpendData/05_NationalHealthAccountsStateHealthAccountsResidence.asp#TopOfPage. Information on the numbers of low-educated (high school graduate or less) mothers receiving any child support and the size of the average child support payment for this group were obtained from the U.S. Census: http://www.census.gov/hhes/www/childsupport/reports.html. Since those data are available biennially, we interpolate between adjacent years.
19
unlikely to participate in public assistance programs and therefore not likely to be affected by
welfare reform policies. The assumption underlying this methodology is that in the absence of
welfare reform, outcomes would be similar across the target and comparison groups. Equation 1
can also be estimated for the comparison group, as follows:
(2) D*it = α*1 + π*1 (Welfaret) + Xitβ*+ Ztδ* + ε*it
Since the comparison group is not at risk of being on public assistance, outcomes for
these individuals should not be affected by changes in welfare policies. Thus, the coefficient
(π*1) on welfare reform in Equation 2 should be zero. If this parameter is non-zero, it reflects
omitted factors associated with both illicit drug use and welfare policies. We can therefore
subtract this estimate from the corresponding estimate in Equation 1 in order to derive the
impacts of welfare reform on illicit drug use, accounting for the omitted factors. This becomes a
difference-in-differences (DD) methodology. The impact of welfare reform is identified by
comparing changes in outcomes between target and comparison groups pre- and post-shifts in
welfare policy. The DD effects can also be obtained by combining Equations 1 and 2 into a
single specification estimated for the pooled sample of the target and comparison groups, as
follows:
isttititiit ZXTargetWelfareTargetD ''*11
*11
' )*)(()()3(
Equation 3 represents the baseline DD specification that will be estimated for the NSDUH to
identify the effects of welfare reform on illicit drug use. In the above equation, Target represents
a dichotomous indicator equal to one if the individual is in the target group (population at risk of
being on welfare) and zero if the individual is in the comparison group (population not at risk of
being on welfare). The DD estimate of the effect of welfare reform is the coefficient of the
interaction terms between the policy measure (Welfare) and the Target group indicator. Since the
20
NSDUH is only able to exploit national time-series variation in indicators of welfare policy,
standard errors are adjusted for arbitrary correlation across individuals in a given year.
The choice of target and comparison groups is integral to a valid implementation of the
DD methodology. Following the literature, we employ target and comparison groups that are
conventionally defined. To investigate how welfare reform has affected illicit drug use among
adult women who are at risk of being on welfare, we compare unmarried women ages 21-49
years with a high school education or below who have a child under the age of 18 in the
household (target group) to unmarried women in the same age range and educational group who
have no children (comparison group). If the comparison group is a valid counterfactual, then it
should look very similar to the target group with respect to both levels and trends prior to the
policy shift.
Table 1 shows the baseline means for drug use outcomes for the first two years of the
sample period (1992 and 1993).12 For past-year indicators of drug use, the responses pertain to
1991 and 1992 which generally predated welfare reform. Only three states (CA, MI, and NJ) had
enacted major waivers to their AFDC programs during this period and those were in the final
quarter of 1992. As can be seen in Table 1, there are no significant differences in illicit drug use
between individuals in the target and comparison groups prior to welfare reform. Furthermore,
changes in outcomes between 1992 and 1993 are also not significant between the groups. These
similarities in terms of both levels and trends in drug use, even before any adjustment for
observed covariates, add a note of confidence to the validity of the counterfactual assumption
underlying the DD framework.
12 Unfortunately, we could not use data from surveys before 1992 to examine trends due to the change in the design of the survey and the well-documented incompatibility of previous years with the years 1992 and beyond (See U.S. Department of Health and Human Services 1993).
21
In analyses using administrative datasets, we introduce a third “difference” (DDD)
through state variation in welfare policy.
isttsststst
ististist
YearStateZTANFAFDCWaiver
TargetTANFTargetAFDCWaiverTargetLnA
''''*
2*1
*22
*11
*11
'
)()(
)*)(()*)(()()4(
Equation 4 represents a DDD specification that exploits variation in welfare policy across
states, over time, and between target and control groups to identify the effects of welfare reform
on illicit drug use as proxied by drug-related prison admissions (NCRP), arrests (FBI),
emergency department visits (DAWN), or treatment admissions (TEDS) in state s during year t
(Ast).13 As discussed earlier, we include indicators for whether a given state had a major AFDC
waiver in place at time t, and the whether a given state had implemented TANF at time t. To
control for additional state-level variables (Zst) that may confound the relationship between
welfare reform and drug use, all of the models based on administrative data include the state/year
(and MSA/year for DAWN) unemployment rate and personal income per capita,14 poverty rate,15
minimum wage,16 criminal justice expenditures,17 substance abuse prevention and treatment
block grant,18 state population, and relevant measures of total state arrests. We also include
measures of the relevant population base depending on the analysis sample.
13 We present estimates from a semi-log model relating the natural log of state-level drug-related indicators to a vector of covariates, separately controlling for the log of the relevant population base and allowing its coefficient to remain unrestricted. Estimates are not sensitive to alternate functional forms: 1) natural log of the probability of the drug-related indicator: ln(Ast/Populationst); and 2) logistic transformation based on the natural log of the odds of the drug-related indicator: ln((Ast/Populationst)/(1-( Ast/Populationst)). Standard errors in all models are adjusted for arbitrary correlation within states over time. 14 These data were obtained from the U.S. Bureau of Labor Statistics. 15 Source: U.S. Bureau of the Census, Current Population Survey, Annual Social, and Economic Supplements. www.census.gov/apsd/techdoc/cps 16 Source: Unites States Department of Labor http://www.dol.gov/esa/whd/state/stateMinWageHis.htm 17 Expenditures data were obtained from U. S. Department of Justice Office of Justice Programs Bureau of Justice Statistics Website http://bjsdata.ojp.usdoj.gov/dataonline/Search/EandE/state_exp_next.cfm 18 Source: National Conference of State Legislatures website: www.ncsl.org

22
These specifications also account for unobserved state-specific time-invariant
heterogeneity through state fixed effects (States) and unobserved national trends through year
effects (Yeart). Alternative specifications further account for systematically-varying unobserved
state factors through state-specific linear trends. The coefficient of the interactions between the
welfare reform measures (AFDCWaiver and TANF) and the Target indicator represent the DDD
estimate of the impact of welfare policies on the outcome of interest.
For all of the datasets, we attempt to define the target and comparison groups as closely
as possible to the “gold standard” used in analyses of the NHSDA/NSDUH—unmarried women
ages 21-49 years with a high school education or below who have a child under the age of 18 in
the household (target group) and unmarried women in the same age range and educational group
who have no children (comparison group). Given the constraints in terms of variables and
sample sizes in the various administrative data sets, achieving the exact gold standard was not
possible although we match it fairly closely for prison admissions and substance use treatment.
For analyses of prison admissions (NCRP), we compare females ages 21-49 with less than a high
school education to females in the same age range with more than a high school education
(marital status is not available and the numbers of imprisoned females with more than a high
school education were very small). For analyses of substance use treatment admissions (TEDS),
we compare unmarried females ages 21-49 with a high school degree or below to married
females with the same age and education (whether the individual had children was not known).
For our analyses of arrests and emergency room admissions, we can only conduct female to male
comparisons. In particular, for drug-related and drug possession arrests (FBI), we compare
females age 21-49 to males age 21-49, and for drug-related hospital emergency room admissions
(DAWN), we compare all females to all males. To assess the validity of the various comparison
23
groups, we investigated baseline trends as we did for the NHSDA/NSDUH analyses. In addition,
we assessed the sensitivity of the NHSDA/NSDUH analyses to female and male treatment and
comparison groups as discussed later.
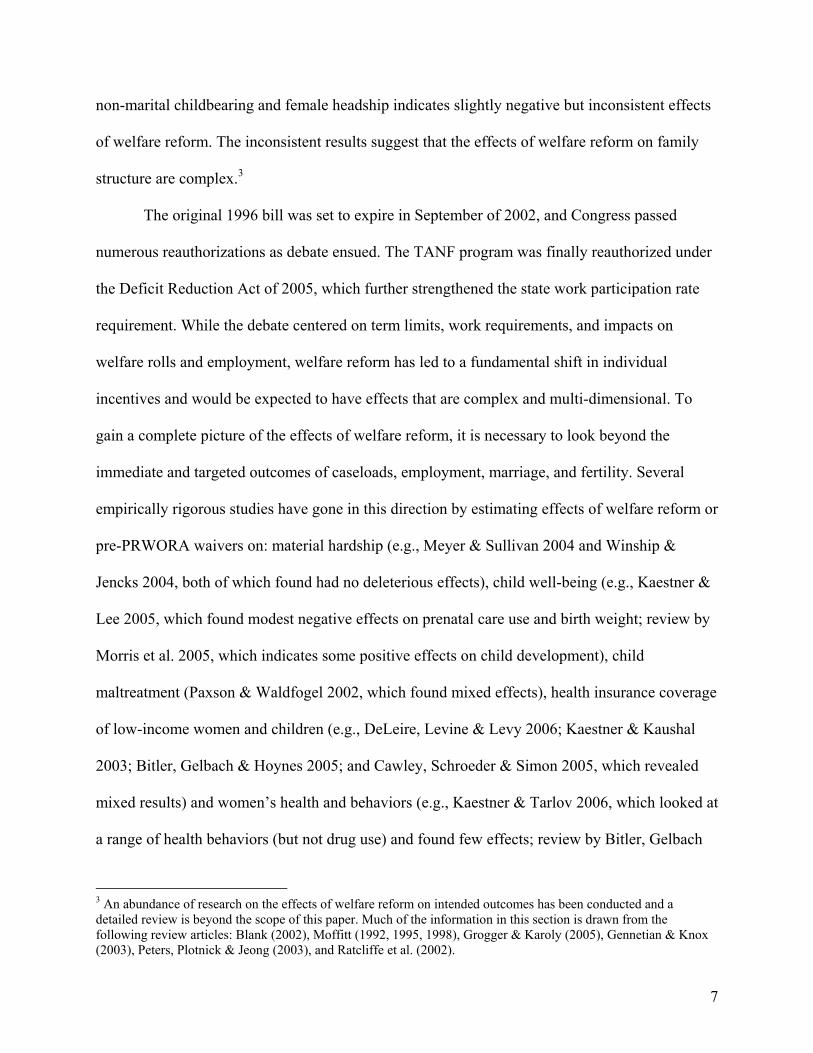
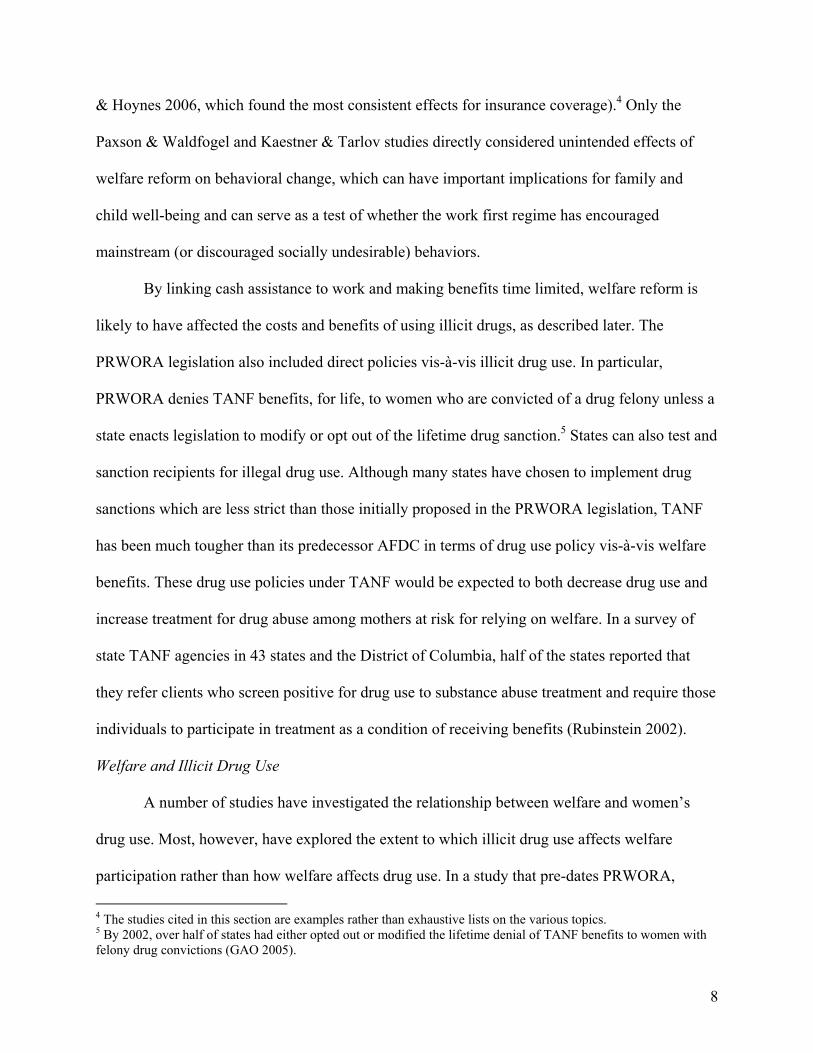
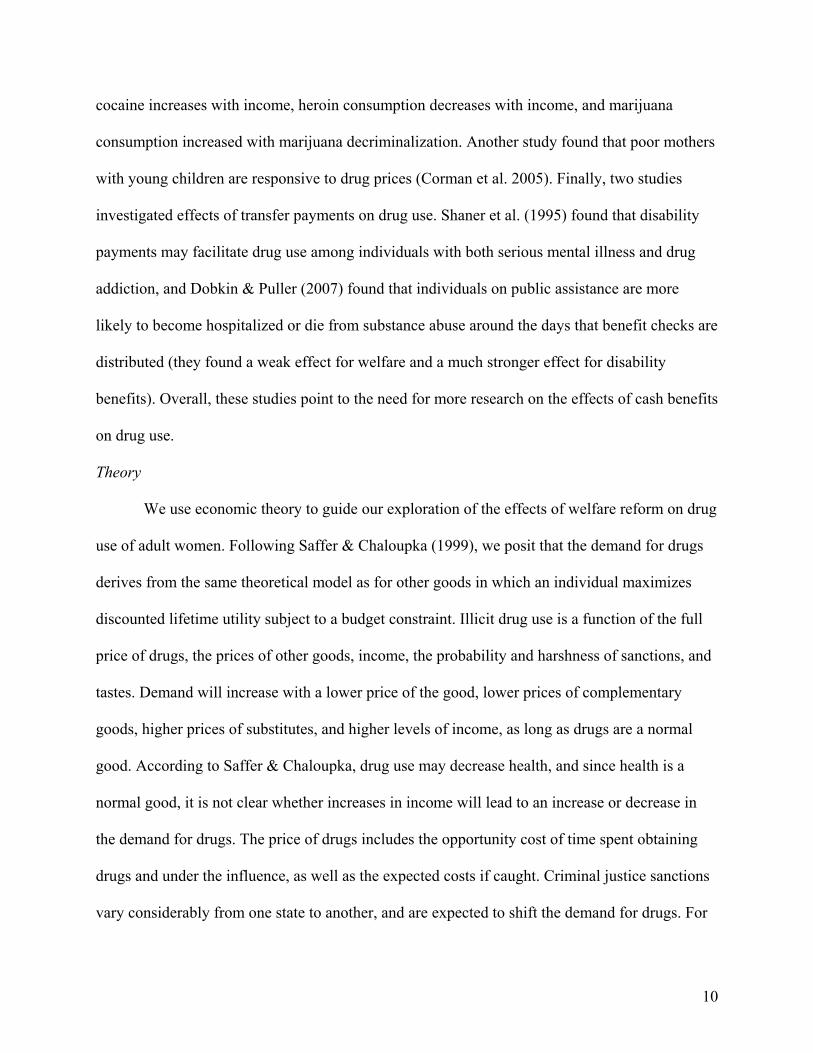
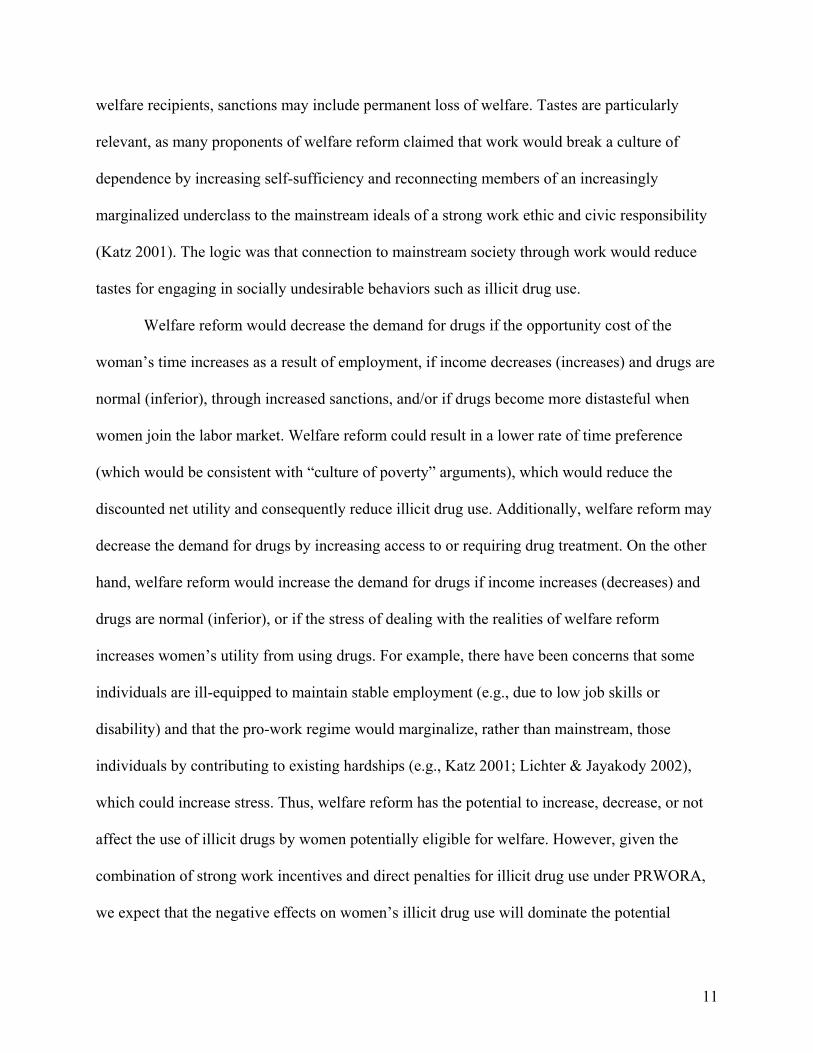
Figures 1-4 document baseline trends between our target and comparison groups, as
defined above, for each of the administrative data sets. In documenting these trends, we define
welfare reform in a given state as either the implementation of a major waiver to the state’s
AFDC program or implementation of TANF, whichever occurred first. Trends in the log of drug-
related prison admissions, arrests, drug-related hospital emergency episodes, and treatment
admissions are virtually similar between the target and comparison groups prior to welfare
reform. We test that the trends are not statistically different between the groups.19 Such “parallel”
pre-welfare reform trends are validating and lend plausibility to the assumption that individuals
in the comparison group represent a suitable counterfactual to individuals who are impacted by
welfare reform.20
Results
Table 2 presents DD estimates of the impact of welfare reform on log welfare caseloads,
based on Equation 3, using individual level data from the National Surveys of Drug Use and
Health (NSDUH). As explained earlier, our target group comprises low-educated (no higher than
a high school education) unmarried women aged 21 to 49 who had a child under the age of 18 in 19 We also estimated a model relating the natural log of drug-related indicators to an indicator for the target group, indicators for years since welfare reform (defined as the AFDC waiver or TANF, whichever was implemented first), and interactions between the target group indicator and years since welfare reform. The interaction terms were insignificant, suggesting that trends in total drug related indicators were not significantly different between individuals in the target and comparison groups in states prior to welfare reform. To conserve degrees of freedom and maximize statistical power, we also estimated a similar model replacing the dichotomous indicators for years since welfare reform with a continuous measure of years since welfare reform and interacting this measure with the target indicator. The interaction term is again insignificant; the estimated coefficient is small in magnitude (0.0039 for drug-related prison admissions; 0.0084 for drug-related arrests; -0.0077 for substance abuse treatment admissions; and -0.022 for drug-related hospital ED episodes). Accounting for quadratic effects yields similar results. 20 Note that, because population figures did not change substantially in the period of our analysis, trends in rates are quite similar to the trends in the admission/arrest numbers.
24
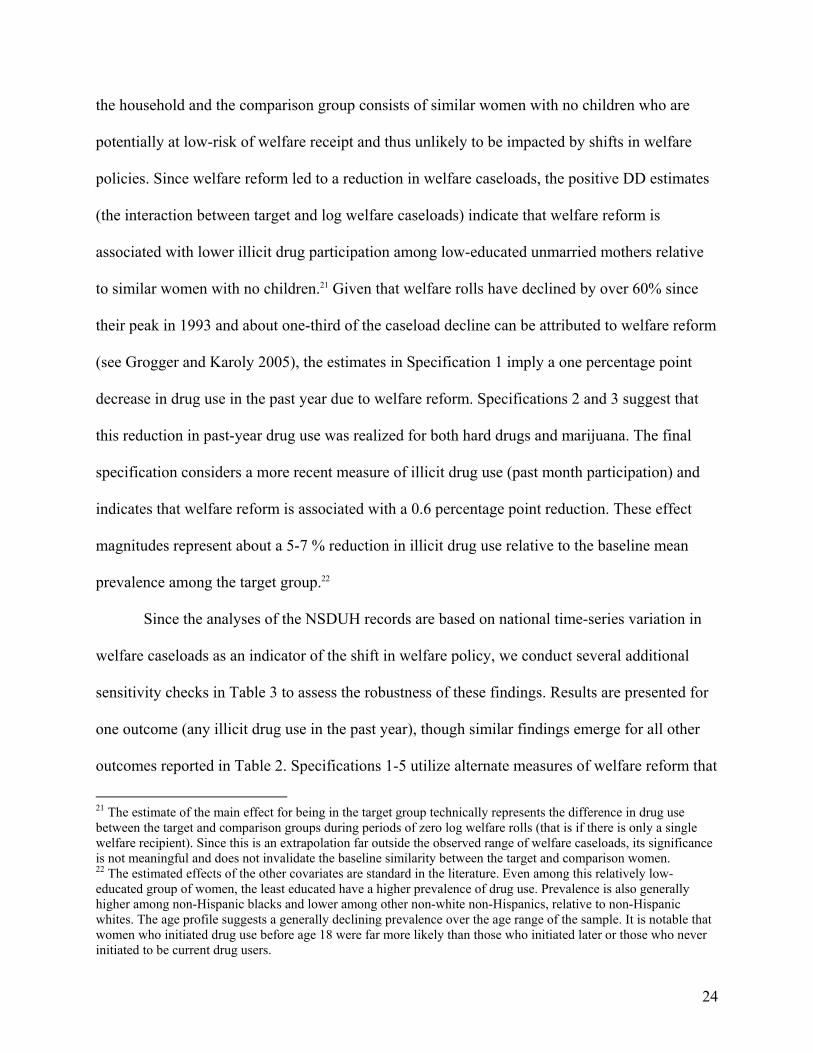
the household and the comparison group consists of similar women with no children who are
potentially at low-risk of welfare receipt and thus unlikely to be impacted by shifts in welfare
policies. Since welfare reform led to a reduction in welfare caseloads, the positive DD estimates
(the interaction between target and log welfare caseloads) indicate that welfare reform is
associated with lower illicit drug participation among low-educated unmarried mothers relative
to similar women with no children.21 Given that welfare rolls have declined by over 60% since
their peak in 1993 and about one-third of the caseload decline can be attributed to welfare reform
(see Grogger and Karoly 2005), the estimates in Specification 1 imply a one percentage point
decrease in drug use in the past year due to welfare reform. Specifications 2 and 3 suggest that
this reduction in past-year drug use was realized for both hard drugs and marijuana. The final
specification considers a more recent measure of illicit drug use (past month participation) and
indicates that welfare reform is associated with a 0.6 percentage point reduction. These effect
magnitudes represent about a 5-7 % reduction in illicit drug use relative to the baseline mean
prevalence among the target group.22
Since the analyses of the NSDUH records are based on national time-series variation in
welfare caseloads as an indicator of the shift in welfare policy, we conduct several additional
sensitivity checks in Table 3 to assess the robustness of these findings. Results are presented for
one outcome (any illicit drug use in the past year), though similar findings emerge for all other
outcomes reported in Table 2. Specifications 1-5 utilize alternate measures of welfare reform that
21 The estimate of the main effect for being in the target group technically represents the difference in drug use between the target and comparison groups during periods of zero log welfare rolls (that is if there is only a single welfare recipient). Since this is an extrapolation far outside the observed range of welfare caseloads, its significance is not meaningful and does not invalidate the baseline similarity between the target and comparison women. 22 The estimated effects of the other covariates are standard in the literature. Even among this relatively low-educated group of women, the least educated have a higher prevalence of drug use. Prevalence is also generally higher among non-Hispanic blacks and lower among other non-white non-Hispanics, relative to non-Hispanic whites. The age profile suggests a generally declining prevalence over the age range of the sample. It is notable that women who initiated drug use before age 18 were far more likely than those who initiated later or those who never initiated to be current drug users.
25
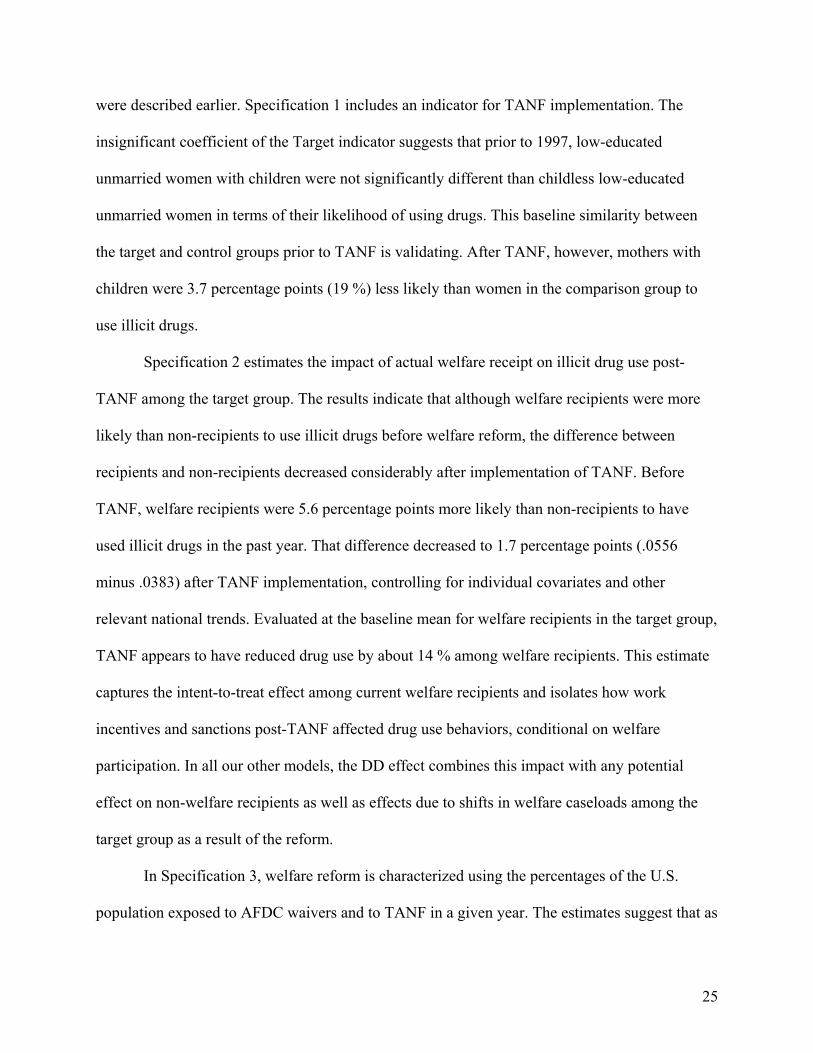
were described earlier. Specification 1 includes an indicator for TANF implementation. The
insignificant coefficient of the Target indicator suggests that prior to 1997, low-educated
unmarried women with children were not significantly different than childless low-educated
unmarried women in terms of their likelihood of using drugs. This baseline similarity between
the target and control groups prior to TANF is validating. After TANF, however, mothers with
children were 3.7 percentage points (19 %) less likely than women in the comparison group to
use illicit drugs.
Specification 2 estimates the impact of actual welfare receipt on illicit drug use post-
TANF among the target group. The results indicate that although welfare recipients were more
likely than non-recipients to use illicit drugs before welfare reform, the difference between
recipients and non-recipients decreased considerably after implementation of TANF. Before
TANF, welfare recipients were 5.6 percentage points more likely than non-recipients to have
used illicit drugs in the past year. That difference decreased to 1.7 percentage points (.0556
minus .0383) after TANF implementation, controlling for individual covariates and other
relevant national trends. Evaluated at the baseline mean for welfare recipients in the target group,
TANF appears to have reduced drug use by about 14 % among welfare recipients. This estimate
captures the intent-to-treat effect among current welfare recipients and isolates how work
incentives and sanctions post-TANF affected drug use behaviors, conditional on welfare
participation. In all our other models, the DD effect combines this impact with any potential
effect on non-welfare recipients as well as effects due to shifts in welfare caseloads among the
target group as a result of the reform.
In Specification 3, welfare reform is characterized using the percentages of the U.S.
population exposed to AFDC waivers and to TANF in a given year. The estimates suggest that as

26
a greater fraction of the population was exposed to AFDC waivers and TANF, there was a
decline in past-year illicit drug use among low-educated unmarried mothers relative to the
similar women with no children though the effect for AFDC waivers is imprecisely estimated.
Specification 4, which combines both measures of welfare reform into a single measure (defining
welfare reform as either implementation of an AFDC waiver or TANF, whichever occurred
first), similarly indicates that welfare reform is associated with a reduction in illicit drug use.
Specification 5 replicates the relevant analysis based on welfare caseloads (from Table 2) for
ease of comparison. The fact that the estimates are insensitive to how we characterize welfare
reform is validating.
To further explore the possibility that national trends other than welfare reform may be
responsible for these patterns, Specification 6 includes interaction terms between the indicator
for the target group and other relevant national economic and policy measures that were
concurrent with shifts in welfare policy—unemployment rate, Medicaid enrollment, log child
support caseloads, and average child support payments. Another potential concern relates to the
possibility that rising female incarceration rates may have reduced illicit drug use through
selection effects. For instance, between 1987 and 2003, the ratio of total female prison
admissions to male prison admissions increased from eight percent to 12 percent, and the ratio of
total female drug related admissions to similar male admissions increased from ten percent to 14
percent, based on the FBI crime reports. If the increase in female incarceration was related to
both welfare receipt and drug use, then the prevalence of drug use among the treatment group
would decline over time simply due to more incarcerated females being selected out of the
sample, and the DD estimator would misattribute the decline in drug use to welfare reform. To
address this possibility, Specification 6 also includes an interaction between the target indicator
27
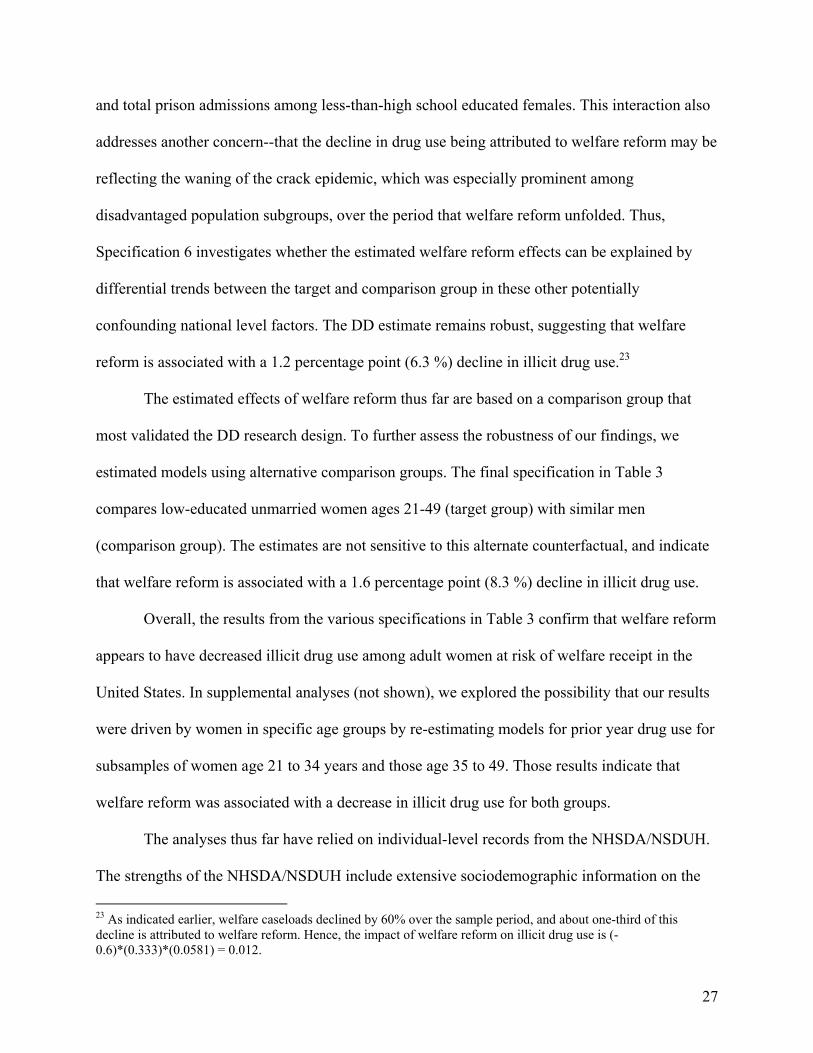
and total prison admissions among less-than-high school educated females. This interaction also
addresses another concern--that the decline in drug use being attributed to welfare reform may be
reflecting the waning of the crack epidemic, which was especially prominent among
disadvantaged population subgroups, over the period that welfare reform unfolded. Thus,
Specification 6 investigates whether the estimated welfare reform effects can be explained by
differential trends between the target and comparison group in these other potentially
confounding national level factors. The DD estimate remains robust, suggesting that welfare
reform is associated with a 1.2 percentage point (6.3 %) decline in illicit drug use.23
The estimated effects of welfare reform thus far are based on a comparison group that
most validated the DD research design. To further assess the robustness of our findings, we
estimated models using alternative comparison groups. The final specification in Table 3
compares low-educated unmarried women ages 21-49 (target group) with similar men
(comparison group). The estimates are not sensitive to this alternate counterfactual, and indicate
that welfare reform is associated with a 1.6 percentage point (8.3 %) decline in illicit drug use.
Overall, the results from the various specifications in Table 3 confirm that welfare reform
appears to have decreased illicit drug use among adult women at risk of welfare receipt in the
United States. In supplemental analyses (not shown), we explored the possibility that our results
were driven by women in specific age groups by re-estimating models for prior year drug use for
subsamples of women age 21 to 34 years and those age 35 to 49. Those results indicate that
welfare reform was associated with a decrease in illicit drug use for both groups.
The analyses thus far have relied on individual-level records from the NHSDA/NSDUH.
The strengths of the NHSDA/NSDUH include extensive sociodemographic information on the
23 As indicated earlier, welfare caseloads declined by 60% over the sample period, and about one-third of this decline is attributed to welfare reform. Hence, the impact of welfare reform on illicit drug use is (-0.6)*(0.333)*(0.0581) = 0.012.

28
individual, permitting a clean identification of welfare recipients and those who are potentially at
risk of relying on welfare (target group) versus those who are unlikely to be impacted by welfare
policies. The NHSDA/NSDUH also includes rich information on the various types of illicit drugs
used in addition to the age of onset of first use. However, as with all survey-based data,
individuals may underreport their use of illicit drugs. Generally, as long as the extent of
underreporting is not correlated with the policy measures of interest, estimates will be unbiased.
However, welfare reform increased both the real and perceived penalties associated with drug
use. Thus, underreporting may be correlated with welfare reform and what may appear as a
negative effect of welfare reform on drug use may instead reflect increased underreporting as
welfare reform unfolded. We address this concern by also analyzing objective outcomes related
to illicit drug use.24
Specifically, we utilize information on state-level drug-related prison admissions from
the NCRP, state-level drug-related arrests from the FBI’s Crime Reports, city-level drug-related
hospital emergency department (ED) visits from DAWN, and state-level flows into substance
abuse treatment admissions from TEDS. In addition to bypassing limitations associated with
self-reported data, these indicators also capture more intensive or frequent use relative to the self
reports. The use of multiple indicators of drug use measured over multiple data sets and samples
adds to the weight of the evidence bearing on the impact of welfare reform on illicit drug use.
24 We also replicated the analyses based on the NHSDA/NSDUH for a non-illicit measure of substance use, namely binge drinking, defined as consumption of 5 or more drinks at one time. Underreporting is less likely for measures of alcohol use than for drug use, for two reasons. First, the penalties instituted through welfare reform applied specifically to illicit drug use. Second, individuals are far more likely to underreport their consumption of cocaine, marijuana, and other such drugs since they are illegal per se relative to participation in licit substances such as alcohol or cigarettes. However, many of the mechanisms through which welfare reform may have impacted illicit drug use also pertain to other types of substance abuse such as problematic drinking. Hence, if welfare reform is found to have also decreased problematic alcohol consumption, then it adds to the weight of the evidence that the decline in substance abuse cannot fully be attributed to systematic underreporting. Consistent with Kaestner and Tarlov (2006), who used data from the Behavioral Risk Factor Surveillance System, we find that welfare reform is associated with a decline in women’s binge drinking by about 10 %.

29
Most importantly, these alternate data sources allow us to exploit variation in the timing of
AFDC waivers and TANF across states. The use of state-level variation in welfare policy in the
context of a DDD framework minimizes omitted variables bias and confounding differential
trends as long as the comparison group is a valid counterfactual for the target group. State-level
information also permits analyses of the potential roles of state work incentives and drug policies
under TANF in explaining the effects of welfare reform on women’s illicit drug use.
Table 4 presents estimates of the DDD specification as formulated in Equation 4, based
on drug-related prison admissions from the NCRP. Our primary target group is low-educated
(less than high school educated) women between the ages of 21-49. We compare this group to
higher-educated (high school educated or above) women. Specification 1 suggests that TANF
has reduced drug-related prison admissions among low-educated females by a significant 22 %
relative to higher-educated females. States that instituted major waivers to their AFDC programs
prior to TANF also appear to have reduced drug-related prison admissions among the target
group by about 16 %, though the effect is imprecisely estimated.25
It is possible that state experimentation with welfare reform through waivers and their
implementation of TANF may have been related to prior increases in the caseload and prior
economic conditions. This would suggest that there may be lagged unobservable time-varying
state factors related to the state’s economy and its welfare caseloads that may be correlated with
the state’s decision of whether and when to implement major waivers to AFDC and the timing of
TANF implementation. Specification 2 addresses this possibility by controlling for state-specific
trends, lagged state-level economic indicators (state-level unemployment rate and personal
25 The coefficient of the target indicator expectedly shows that drug-related prison admissions are higher among low-educated women (less than a high school education) relative to high-school graduates.

30
income per capita), and lags of the state’s welfare caseloads. The estimates remain robust and
suggest that welfare reform has reduced drug-related prison admissions by between 16-19 %.
Specifications 3 and 4 utilize an alternate single measure of welfare reform to maximize
statistical power and gauge the robustness of the results. Welfare reform is defined as either a
major waiver to the state’s AFDC program or TANF, whichever occurred first. In line with the
other estimates, we find that welfare reform appears to have reduced drug-related prison
admissions by about 18 % among the target group relative to individuals in the comparison
group.26
Since welfare reform appears to have reduced the demand for illicit drugs and treatment
is often necessary for discontinuing drug use, and because TANF increased drug testing and
treatment for welfare recipients, we expect that welfare reform increased substance abuse
treatment among women at risk for relying on welfare. Models reported in Table 5 explore
whether welfare reform has impacted flows into substance abuse treatment admissions, based on
treatment records from TEDS. We compare low-educated (high school education or below)
unmarried women ages 21-49 with similar married women.27 Specifications 1 and 2 indicate that
26 While this at first glance appears to be a relatively large effect magnitude, it is consistent with the estimates from the earlier analyses based on the NHSDA/NSDUH. The earlier estimates suggest that welfare reform has reduced past year illicit drug use participation by about 1.2 to 1.6 percentage points (6.3 - 8.3 %) among the target group potentially at risk of welfare assistance. Using the 1992 prevalence of any illicit drug use in the past year (1.94 million) among women in the target group, this translates into a decline of between 122,220 and 161,020 drug users in the target population (assuming a fixed population). The estimates from the NCRP-based analyses suggest a reduction in the number of drug-related prison admissions by about 914, which is plausible given the reduction in the number of drug users imputed above. This implies a marginal probability of a drug related prison admission conditional on past-year drug use between 0.006 and 0.008. Thus, for every 1000 individuals deterred from using drugs in a given year, drug-related prison admissions would decrease by about 6 to 8 in that year. If the function relating drug-related prison admissions to the number of drug users in the population is convex (as would be expected if it is easier to capture, arrest and convict drug users when they are more prevalent in the population), then the marginal probability would be higher than the average probability. Thus the average probability is predicted to be lower than 0.006-0.008; this can be readily observed given the estimated number of current female drug users in the population and the number of prison admissions for drug-related offenses. Combining data from the NHSDA/NSDUH with the NCRP, the average probability is estimated at around 0.002, consistent with the above estimates. 27 Information on children is not available in the TEDS. We are therefore unable to use the presence of children under the age of 18 in the definition of our target and comparison groups as was done in the analyses based on the
31
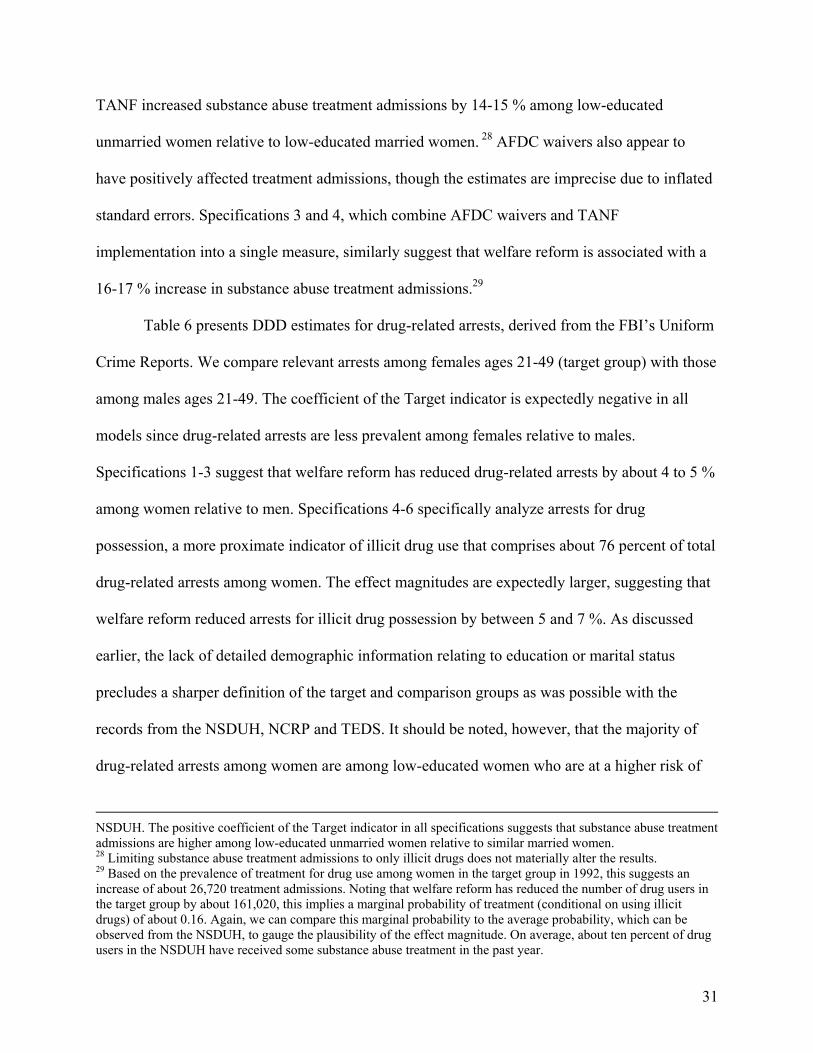
TANF increased substance abuse treatment admissions by 14-15 % among low-educated
unmarried women relative to low-educated married women. 28 AFDC waivers also appear to
have positively affected treatment admissions, though the estimates are imprecise due to inflated
standard errors. Specifications 3 and 4, which combine AFDC waivers and TANF
implementation into a single measure, similarly suggest that welfare reform is associated with a
16-17 % increase in substance abuse treatment admissions.29
Table 6 presents DDD estimates for drug-related arrests, derived from the FBI’s Uniform
Crime Reports. We compare relevant arrests among females ages 21-49 (target group) with those
among males ages 21-49. The coefficient of the Target indicator is expectedly negative in all
models since drug-related arrests are less prevalent among females relative to males.
Specifications 1-3 suggest that welfare reform has reduced drug-related arrests by about 4 to 5 %
among women relative to men. Specifications 4-6 specifically analyze arrests for drug
possession, a more proximate indicator of illicit drug use that comprises about 76 percent of total
drug-related arrests among women. The effect magnitudes are expectedly larger, suggesting that
welfare reform reduced arrests for illicit drug possession by between 5 and 7 %. As discussed
earlier, the lack of detailed demographic information relating to education or marital status
precludes a sharper definition of the target and comparison groups as was possible with the
records from the NSDUH, NCRP and TEDS. It should be noted, however, that the majority of
drug-related arrests among women are among low-educated women who are at a higher risk of
NSDUH. The positive coefficient of the Target indicator in all specifications suggests that substance abuse treatment admissions are higher among low-educated unmarried women relative to similar married women. 28 Limiting substance abuse treatment admissions to only illicit drugs does not materially alter the results. 29 Based on the prevalence of treatment for drug use among women in the target group in 1992, this suggests an increase of about 26,720 treatment admissions. Noting that welfare reform has reduced the number of drug users in the target group by about 161,020, this implies a marginal probability of treatment (conditional on using illicit drugs) of about 0.16. Again, we can compare this marginal probability to the average probability, which can be observed from the NSDUH, to gauge the plausibility of the effect magnitude. On average, about ten percent of drug users in the NSDUH have received some substance abuse treatment in the past year.

32
welfare receipt. Nevertheless, since not all females who are arrested are likely to be impacted by
welfare policy, the effect magnitudes are attenuated and should be interpreted as conservative
estimates.
Table 7 considers drug-related hospital emergency department (ED) visits as an objective
indicator of intensive or heavy drug use. Similar to our analyses of drug-related arrests, we
compare females (target group) with males (comparison group). The negative and significant
coefficient of the Target indicator suggests that drug-related ED visits are less prevalent among
females relative to males, partly due to a lower prevalence of illicit drug use in general as well as
a lower prevalence of hardcore or heavy drug use. Specifications 1 and 2 suggest that TANF
reduced the number of drug-related ED episodes by about 10 %, and that major waivers to state
AFDC programs are associated with about a 6 % decrease although these effects are imprecisely
estimated since DAWN does not sample cities in all states. Utilizing a single measure of welfare
reform (Specification 3) to improve statistical power, there is a significant 13.6 % decline in
drug-related episodes post-welfare welfare reform. Specifications 4-6 present similar models for
drug-related ED mentions. For each ED episode, up to four drugs may be reported. Because each
case may have multiple drug mentions, the number of mentions always exceeds the total number
of DAWN cases. The effect magnitudes remain robust.30
The estimates discussed thus far represent the “reduced-form” effects of welfare
reform—that is, the total effect of welfare reform on illicit drug use, operating through a variety
of potential (and possibly competing) mechanisms. Work is the centerpiece of the policy shift
and there is strong consensus that welfare reform has indeed increased employment and
30 In 1992, there were 95,367 drug-related ED episodes among women in the 21 DAWN cities. The estimates above suggest that welfare reform has reduced the number of such episodes by about 12,398.

33
decreased caseloads as intended. Our findings of effects for both waivers and TANF suggest that
at least some of the effects operate through work, as opposed to TANF drug policies.
We further broadly test the work mechanism through stratification analyses which
specifically exploit the extent to which states sanction welfare recipients for illicit drug use and
encourage work under their TANF programs. Both sanctions and work incentive policies (such
as benefit generosity and time limits) vary considerably across states. If the reduction in illicit
drug use associated with welfare reform identified above represents a causal effect, then we
would expect this effect to be stronger in states that imposed stricter sanctions and in states with
TANF policies that most encouraged employment.
Table 8 presents DDD models for drug-related prison admissions stratified by states’
TANF drug policy and their work incentives. Specification 1 in Panel A restricts the analysis to
states that impose a complete ban of TANF benefits to welfare recipients convicted of any drug
offense. The corresponding specification in Panel B restricts the analysis to states that impose no
ban or just a partial ban.31 Both sets of results indicate that TANF has led to a reduction in drug-
related prison admissions among individuals in the target group relative to the comparison group,
but the estimated effect is actually larger among states with a partial or no ban. This
counterintuitive finding may reflect a multitude of factors such as limited variation due to
reduced sample size or measurement error in drug-related prison admissions as a proxy for drug
use. While we are able to sharply define the target and comparison groups for the NCRP prison
admissions data, drug-related prison admissions confound both drug use and drug sale or
trafficking. Hence, the subsequent analyses with drug-related arrests and arrests for drug
31 The drug policy measures are based on TANF and not AFDC waivers. Ideally, these detailed state measures would reflect both phases of welfare reform. Unfortunately, uniform data on state drug policies under AFDC waivers are not available. That said, the TANF policies may be reflective of what occurred during the waivers. We exclude AK, AZ, GA, IA, LA, TN, and WV from the analysis due to missing information on TANF drug policy. Source: Rubenstein (2002)

34
possession may be better suited when considering the role of state-level variation in bans of
TANF benefits. Alternately, the results may also reflect that the reduction in illicit drug use is
driven relatively more through the work incentives embedded in welfare reform and increases in
employment and family income than through state TANF drug policy.
Specifications 2 and 3 stratify states based on the strength of the work incentives
embedded in their TANF programs. As discussed earlier, welfare reform can decrease the
demand for drugs if the opportunity cost of the woman’s time increases as a result of
employment, if family income increases, and/or if drugs become more distasteful or the rate of
time preference decreases when women join the labor market. Specification 2 compares the
effects of welfare reform on drug use in states that impose strict sanctions for non-compliance
with work requirements versus states that have lenient or moderate sanctions. Specification 3
stratifies states based on a broader gauge of work incentives, reflected in their benefit generosity,
time limits, earnings disregards, and sanctions (see Blank and Schmidt 2001). As hypothesized,
welfare reform (both AFDC waivers and TANF) generally has a stronger negative effect on
drug-related prison admissions among the stricter states. For instance, among the states with the
stronger work incentives, TANF (and AFDC waivers) reduced drug-related prison admissions by
37.6 % (32.7 %) versus 14.2 % (13.1 %) among the more lenient states. We also find evidence of
a dose-response relation. Stratifying Panel B further into states that have mixed work incentives
versus those that have weak incentives, we find larger negative effects in states with mixed work
incentives (results not shown). However, all of these estimates are imprecise due to small sample
sizes.
Table 9 presents corresponding stratification analyses for drug-related arrests. Here we
can specifically differentiate arrests for drug possession, which is a more proximate indicator
35
(than drug-related prison admissions) of illicit drug use. Specification 1 shows that TANF has
led to a significantly larger reduction in arrests for drug possession in states that completely ban
TANF benefits for drug convictions relative to states that do not (11% reduction vs. 5%
reduction), among individuals in the target group relative to the comparison group. The effect of
AFDC waivers in reducing illicit drug use is also relatively larger among states that fully ban
TANF benefits for drug offenses, though the estimate is imprecise. Specifications 2 and 3 also
confirm that the reduction in illicit drug use is larger in states with stronger work incentives. For
instance, states with strong work incentives in their TANF programs experienced about a 10 %
decline in arrests for drug possession post-TANF, compared to a 6 % decline among states with
mixed or weak incentives. The reduction associated with AFDC waivers was also about five
percentage points higher among the stricter states. The general direction and magnitude of these
estimates are not materially affected when considering all drug-related arrests (Specifications 4-
6). This is not surprising given that the vast majority (about 76 %) of drug-related arrests among
women reflect drug possession.
Overall, the patterns that emerge from the stratification analyses suggest that the negative
effects of welfare reform on women’s illicit drug use operate, at least in part, through both TANF
drug sanctions and employment. Past research has shown that corresponding with increases in
employment, welfare reform increased personal and family incomes on average as well as along
most of the income distribution (Blank 2002; Schoeni and Blank 2000). Thus, our findings are
consistent with drug use being an inferior good among women at risk for relying on welfare.
36
Conclusion
This study provides strong evidence that welfare reform led to declines in illicit drug use
among women at risk for relying on welfare. We used every available nationally representative
data set that is appropriate for addressing this question, considered outcome measures along the
continuum from marijuana use to more “hard core” drug use (drug-related imprisonment and
emergency room episodes), and used administrative data from a number of different sources in
addition to self-reported drug use. The patterns across the different datasets, measures of drug
use, characterizations of welfare reform, model specifications, and comparison groups paint a
remarkably consistent picture: Welfare reform reduced illicit drug use.
We found some evidence that the negative effects of welfare reform on women’s illicit
drug use operate, at least in part, through both drug sanctions and work incentives under TANF.
Additional work is needed to further elucidate the specific mechanisms. We also found that
TANF increased drug treatment, which is not surprising given its negative effects on drug use
(discontinuing drug use often requires treatment) and because TANF increased drug testing and
sanctioning of welfare recipients. The results from this study lend support to the argument that
limiting cash assistance and encouraging work lead women to refrain from socially unfavorable
behaviors. However, further research is needed before basing public policy on the findings from
this study as we have estimated average effects that coincided, for the most part, with a strong
economy. The overall effects could mask considerable heterogeneity within the target population
and might look very different during periods of economic recession.

37
References
Bitler, M. P., Gelbach, J. B., & Hoynes, H. W. (2006). What Mean Impacts Miss: Distributional
Effects of Welfare Reform Experiments. The American Economic Review, 988-1012.
Bitler, M. P., Gelback, J. B., & Hoynes, H. W. (2005). Welfare Reform and Health. Journal of Human Resources, 40 (2), 309-34.
Blank, R. M. (2002). Evaluating Welfare Reform in the United States. Journal of Economic Literature, 40 (4), 1105-66.
Blank, R. M., & Schmidt, L. (2001). Work, Wages and Welfare. In R. Blank & R. Haskins, The New World of Welfare (70–102). Washington DC: Brookings Institution Press.
Cawley, J., Schroeder, M., & Simon, K. (2005). Welfare Reform and the Health Insurance Coverage of Women and Children. Forum for Health Economics & Policy, 8 (1), 1012-12.
Cheng, T. C., & McElderry, C. (2007). How Do Drug Use and Social Relations Affect Welfare Participation? Social Service Review, 81 (1), 155-65.
Corman, H., Noonan, K., Reichman, N. E., & Dave, D. (2005). Demand for Illicit Drugs by Pregnant Women. In B. Lindgren, & M. Grossman (eds.), Substance Use: Individual Behaviour, Social Interactions, Markets and Politics (pp. 41-60). Elsevier.
Currie, J., & Grogger, J. (2002). Medicaid Expansions and Welfare Contractions: Offsetting Effects on Prenatal Care and Infant Health? Journal of Health Economics, 21(2), 313-35.
DeLeire, T., Levine, J. A., & Levy, H. (2006). Is Welfare Reform Responsible for Low-Skilled
Women's Declining Health Insurance Coverage in the 1990s? Journal of Human Resources, 41 (3), 495-528.
Dobkin, C., & Puller, S. L. (2007). The Effects of Government Transfers on Monthly Cycles in Drug Abuse, Hospitalization and Mortality. Journal of Public Economics, 91 (11-12), 2137-57.
GAO (2005). Various Factors May Limit the Impacts of Federal Laws That Provide for Denial of Selected Benefits. DC: U.S. Government Accountability Office.
Gennetian, L. A., & Knox, V. (2003). Staying Single: The Effects of Welfare Reform Policies on Marriage and Cohabitation, 85. New York: Next Generation Working Paper Series.
Grogger, J. (2004). Time Limits and Welfare Use. Journal of Human Resources, 39(2), 405-24. Grogger, J., & Karoly, L. A. (2005). Welfare Reform: Effects of a Decade of Change.
Cambridge, MA: Harvard University Press.
Grossman, M., Chaloupka, F., & Shim, K. (2002). Illegal Drug Use and Public Policy. Health Affairs, 21 (2), 134-45.
38
Kaestner, R. (1998). Drug Use and AFDC Participation: Is There a Connection? Journal of Policy Analysis and Management, 17 (3), 495-520.
Kaestner, R., & Kaushal, N. (2003). Welfare Reform and Health Insurance Coverage of Low-Income Families. Journal of Health Economics, 22 (6), 959-81.
Kaestner, R., & Lee, W. C. (2005). The Effect of Welfare Reform on Prenatal Care and Birth Weight. Health Economics, 14 (5), 497-511.
Kaestner, R., & Tarlov, E. (2006). Changes in the Welfare Caseload and the Health of Low-Educated Mothers. Journal of Policy Analysis and Management, 25 (3), 623-43.
Katz, M. B. The Price of Citizenship: Redefining the American Welfare State. New York, NY: Metropolitan Books, Henry Holt & Co., 2001.
Lichter, D. T., & Jayakody, R. (2002). Welfare Reform: How Do We Measure Success? Annual
Review of Sociology, 28, 117-41. Meara, E. (2006). Welfare Reform, Employment, and Drug and Alcohol Use Among Low-
Income Women. Harvard Review of Psychiatry, 14 (4), 223-32.
Meyer, B. D., & Sullivan, J. X. (2004). The Effects of Welfare and Tax Reform: The Material Well-Being of Single Mothers in the 1980s and 1990s. Journal of Public Economics, 88 (7-8), 1387-420.
Moffitt, R. A. (1992). Incentive Effects of the US Welfare System: A Review. Journal of Economic Literature, 30 (1), 1-61.
Moffitt, R. A. (1995). The Effect of the Welfare System on Nonmarital Childbearing. In Report to Congress on Out-of-Wedlock Childbearing. Washington: Department of Health and Human Services, 1995.
Moffitt, R. A. (1998). The Effects of Welfare on Marriage and Fertility. In R. Moffitt (ed.),
Welfare, the Family, and Reproductive Behavior: Research Perspectives (pp. 50-97). Washington, D.C.: National Academy Press.
Morris, P. A., Gennetian, L. A., & Duncan, G. J. (2005). Effects of Welfare and Employment
Policies on Young Children: New Findings on Policy Experiments Conducted in the Early 1990s, 20. SDRC.
Office of National Drug Control Policy. Drug Use Trends. Washington, DC: Executive Office of the President, 2002. Fact Sheet, available at: http://www.whitehousedrugpolicy.gov/publications/factsht/druguse/drugusetrends.pdf
Office of National Drug Control Policy. The Economic Costs of Drug Abuse in the United States: 1992–2002. Washington, DC: Executive Office of the President (Publication No. 207303), 2004.
39
Paxson, C., & Waldfogel, J. (2002). Work, Welfare, and Child Maltreatment. Journal of Labor Economics, 20 (3), 435-74.
Plotnick, R. D., Peters, E. H., & Jeong, S.-O. (2003). How Will Welfare Reform Affect Childbearing and Family Structure Decisions? In R. Gordon, & H. Walberg (eds.), Changing Welfare (pp. 59-91). New York: Kluwer Academic/Plenum Publishers.
Pollack, H. A., Danziger, S., Seefeldt, K. S., & Jayakody, R. (2002). Substance Use Among Welfare Recipients: Trends and Policy Responses. Social Service Review, 76 (2), 256-74.
Pollack, H. A., & Reuter, P. (2006). Welfare Receipt and Substance-Abuse Treatment Among Low-Income Mothers: The Impact of Welfare Reform. American Journal of Public Health , 96 (11), 2024-31.
Ratcliffe, C., McKernan, S.-M., & Rosenberg, E. (2002). Welfare Reform, Living Arrangements,
and Economic Well-Being: A Synthesis of Literature, 55. Washington, D.C.: The Urban Institute.
Rubenstein, G. (2002). The State of State Policy on TANF and Addiction: Findings from the Survey of State Policies and Practice to Address Alcohol and Drug Problems among TANF Recipients. Legal Action Center. Available at: http://www.lac.org/doc_library/lac/publications/state_of_state.pdf
Saffer, H., & Chaloupka, F. J. (1999). Demographic Differentials in the Demand for Alcohol and Illicit Drugs. In M. Grossman, W. Bickel, & H. Saffer (eds.), The Economic Analysis of Subsance Use and Abuse: An Integration of Econometric and Behavioral Economic Research (pp. 187-212). Chicago, IL: University of Chicago Press.
SAMHSA, Office of Applied Studies, National Household Survey on Drug Abuse, 1997. Available at (dated 1998): http://www.oas.samhsa.gov/nhsda/nhsda97/97tab.htm#E10E81
Schoeni, R.F., & Blank, R.M. What Has Welfare Reform Accomplished? Impacts on Welfare
Participation, Employment, Income, Poverty, and Family Structure. National Bureau of Economic Research Working Paper #7627, 2000.
Shaner, A., Eckman, T., & Roberts, L. (1995). Disability Income, Cocaine Use, and Repeated
Hospitalization Among Schizophrenic Cocaine Abusers - A Government-Sponsored Revolving Door? The New England Journal of Medicine, 333 (12), 777-83.
Strawn, J. (1997). Substance Abuse and Welfare Reform Policy. Welfare Information Network.
U.S. Department of Health and Human Services Peer Review Committee on National Household Survey on Drug Abuse. (1993, June 3). Evaluation of Results from the 1992 National Household Survey on Drug Abuse. Retrieved from U.S. Department of Health and Human Services, Substance Abuse and Mental Health Services Administration website: http://www.oas.samhsa.gov/methodsHY/PeerReview92.pdf
40
Winship, S., & Jencks, C. (2004). How Did the Social Policy Changes of the 1990s Affect Material Hardship Among Single Mothers? Evidence from the CPS Food Security Supplement. Cambridge, MA: Faculty Research Working Papers Series, 60.
Ziliak, J. P. (2005). Taxes, Transfers, and the Labor Supply of Single Mothers. Lexington, KY:
UKCPR Discussion Paper Series.
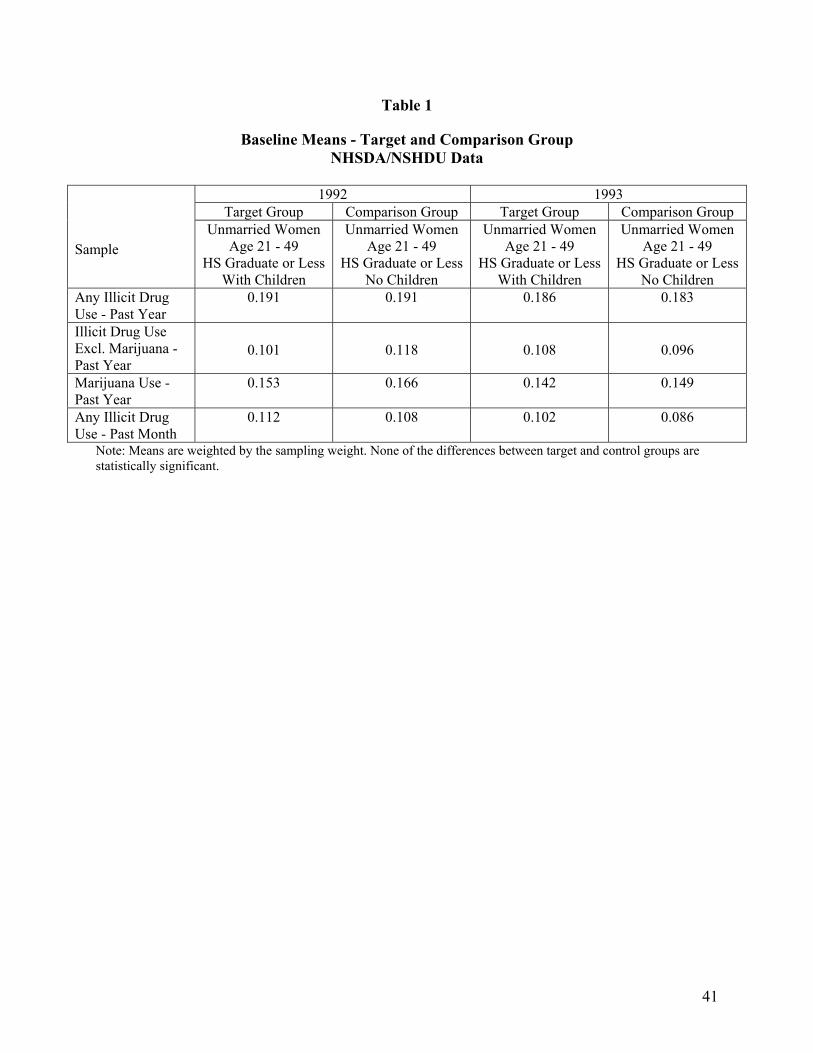
41
Table 1
Baseline Means - Target and Comparison Group NHSDA/NSHDU Data
Sample
1992 1993 Target Group Comparison Group Target Group Comparison Group
Unmarried Women Age 21 - 49
HS Graduate or Less With Children
Unmarried WomenAge 21 - 49
HS Graduate or Less No Children
Unmarried Women Age 21 - 49
HS Graduate or Less With Children
Unmarried WomenAge 21 - 49
HS Graduate or Less No Children
Any Illicit Drug Use - Past Year
0.191 0.191 0.186 0.183
Illicit Drug Use Excl. Marijuana - Past Year
0.101
0.118
0.108
0.096
Marijuana Use - Past Year
0.153 0.166 0.142 0.149
Any Illicit Drug Use - Past Month
0.112 0.108 0.102 0.086
Note: Means are weighted by the sampling weight. None of the differences between target and control groups are statistically significant.

42
01234567
‐10 ‐9 ‐8 ‐7 ‐6 ‐5 ‐4 ‐3 ‐2 ‐1
Figure 1Trend Lines ‐ Pre‐Welfare ReformLog Drug Related Prison Admissions
Target
Control
Target: Females <hs education, aged 21‐49Control: Females hs+ education, aged 21‐49
0
1
2
3
4
5
6
‐9 ‐8 ‐7 ‐6 ‐5 ‐4 ‐3 ‐2 ‐1
Figure 2 Trend Lines ‐ Pre‐Welfare Reform
Log Drug Related Arrests
Target
Control
Target: Females 21 ‐ 49Control: Males 21 ‐ 49
6
6.2
6.4
6.6
6.8
7
7.2
‐7 ‐6 ‐5 ‐4 ‐3 ‐2 ‐1
Figure 4Trend Lines ‐ Pre‐Welfare Reform
Log Drug‐Related Emergency Room Episodes
Target
Control
Target: Females 12+Control: Males 12+
0123456789
‐5 ‐4 ‐3 ‐2 ‐1
Figure 3Trend Lines ‐ Pre‐Welfare Reform
Log Substance Abuse Treatment Admissions
Target
Control
Target: Single Women, high school or less education, 21 ‐ 49Contol: Married Women, high school or less education 21 ‐ 49
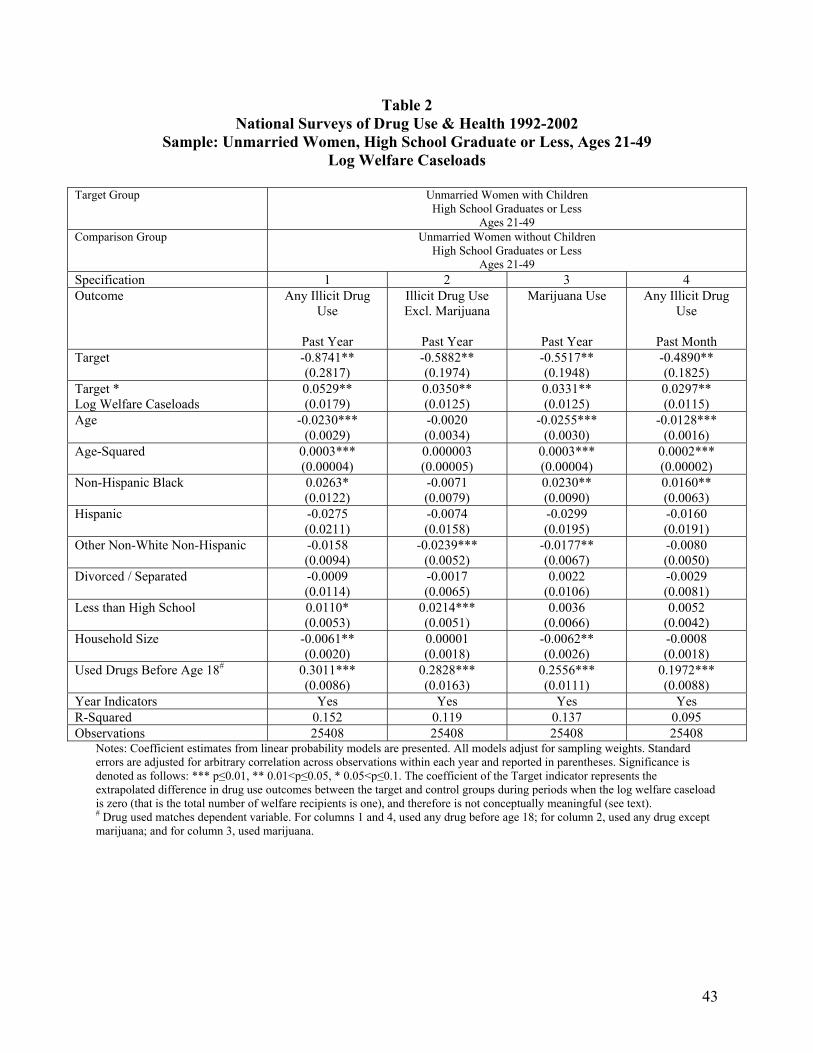
43
Table 2 National Surveys of Drug Use & Health 1992-2002
Sample: Unmarried Women, High School Graduate or Less, Ages 21-49 Log Welfare Caseloads
Target Group Unmarried Women with Children
High School Graduates or Less Ages 21-49
Comparison Group Unmarried Women without Children High School Graduates or Less
Ages 21-49 Specification 1 2 3 4 Outcome Any Illicit Drug
Use
Past Year
Illicit Drug Use Excl. Marijuana
Past Year
Marijuana Use
Past Year
Any Illicit Drug Use
Past Month
Target -0.8741** (0.2817)
-0.5882** (0.1974)
-0.5517** (0.1948)
-0.4890** (0.1825)
Target * Log Welfare Caseloads
0.0529** (0.0179)
0.0350** (0.0125)
0.0331** (0.0125)
0.0297** (0.0115)
Age -0.0230*** (0.0029)
-0.0020 (0.0034)
-0.0255*** (0.0030)
-0.0128*** (0.0016)
Age-Squared 0.0003*** (0.00004)
0.000003 (0.00005)
0.0003*** (0.00004)
0.0002*** (0.00002)
Non-Hispanic Black 0.0263* (0.0122)
-0.0071 (0.0079)
0.0230** (0.0090)
0.0160** (0.0063)
Hispanic -0.0275 (0.0211)
-0.0074 (0.0158)
-0.0299 (0.0195)
-0.0160 (0.0191)
Other Non-White Non-Hispanic -0.0158 (0.0094)
-0.0239*** (0.0052)
-0.0177** (0.0067)
-0.0080 (0.0050)
Divorced / Separated -0.0009 (0.0114)
-0.0017 (0.0065)
0.0022 (0.0106)
-0.0029 (0.0081)
Less than High School 0.0110* (0.0053)
0.0214*** (0.0051)
0.0036 (0.0066)
0.0052 (0.0042)
Household Size -0.0061** (0.0020)
0.00001 (0.0018)
-0.0062** (0.0026)
-0.0008 (0.0018)
Used Drugs Before Age 18#
0.3011*** (0.0086)
0.2828*** (0.0163)
0.2556*** (0.0111)
0.1972*** (0.0088)
Year Indicators Yes Yes Yes Yes R-Squared 0.152 0.119 0.137 0.095 Observations 25408 25408 25408 25408
Notes: Coefficient estimates from linear probability models are presented. All models adjust for sampling weights. Standard errors are adjusted for arbitrary correlation across observations within each year and reported in parentheses. Significance is denoted as follows: *** p≤0.01, ** 0.01<p≤0.05, * 0.05<p≤0.1. The coefficient of the Target indicator represents the extrapolated difference in drug use outcomes between the target and control groups during periods when the log welfare caseload is zero (that is the total number of welfare recipients is one), and therefore is not conceptually meaningful (see text). # Drug used matches dependent variable. For columns 1 and 4, used any drug before age 18; for column 2, used any drug except marijuana; and for column 3, used marijuana.

44
Table 3 Any Illicit Drug Use - Past Year
National Surveys of Drug Use & Health 1992-2002 Sensitivity Analyses
Target Group Unmarried Women with Children
High School Graduates or Less Ages 21-49
Unmarried Women HS Graduates or Less
Ages 21-49 Comparison Group Unmarried Women without Children
High School Graduates or Less Ages 21-49
Unmarried Men HS Graduates or Less
Ages 21-49 Specification 1 2a 3 4 5 6 b 7 b Welfare Receipt _ 0.0556***
(0.0101) _ _ _ _ _
Welfare Receipt * Post-1996
_ -0.0383** (0.0137)
_ _ _ _ _
Target -0.0091 (0.0164)
_ 0.0151 (0.0230)
0.0098 (0.0203)
-0.8741** (0.2817)
-8.0375 (5.0376)
5.9677*** (1.1499)
Target* % Population Exposed to AFDC Waivers
_ _ -0.0791 (0.0597)
_ _ _ _
Target* % Population Exposed to TANF
_ _ -0.0621** (0.0241)
_ _ _ _
Target * Post-1996
-0.0367* (0.0191)
_ _ _ _ _ _
Target * % Population Exposed to Welfare Reform
_ _ _ -0.0579** (0.0233)
_ _ _
Target * Log Welfare Caseloads
_ _ _ _ 0.0529** (0.0179)
0.0581* (0.0292)
0.0788*** (0.0167)
Post-1996 0.0696*** (0.0138)
0.0481** (0.0195)
_ _ _ _ _
Trend & Trend-Squared Yes Yes No No No No No Year Indicators No No Yes Yes Yes Yes Yes R-Squared 0.151 0.145 0.151 0.151 0.152 0.152 0.192 Observations 25408 15533 25408 25408 25408 25408 47848
Notes: Coefficient estimates from linear probability models are presented. All models adjust for sampling weights. Standard errors are adjusted for arbitrary correlation across observations within each year and reported in parentheses. All models also control for the additional covariates listed in Table 2 with two exceptions: models that control for post-1996 include trend & trend-squared rather than year indicators to bypass perfect collinearity; these models also control for the annual national unemployment rate, Medicaid enrollment, log of child support caseload, and average child support payment. The coefficient of the Target indicator in Specification 5 represents the extrapolated difference in drug use outcomes between the target and comparison groups during periods of zero unemployment, Medicaid enrollment, log child support caseload, average child support payment, and zero log welfare caseloads, and therefore is not conceptually meaningful. Significance is denoted as follows: *** p≤0.01, ** 0.01<p≤0.05, * 0.05<p≤0.1 aSample is limited to unmarried, low-educated women, ages 21-49, with children. In this model, the treatment that is welfare receipt. In all other models, the treatment is being in the target group, which is being in the sample and having a minor child. bSpecifications also control for interactions between the Target indicator and the unemployment rate, Medicaid enrollment rate, log of child support caseload, average child support payment, and log of total prison admissions among less-than-high school educated females. The coefficient of the Target indicator is not meaningful since it represents an extrapolation of each of these factors to 0.
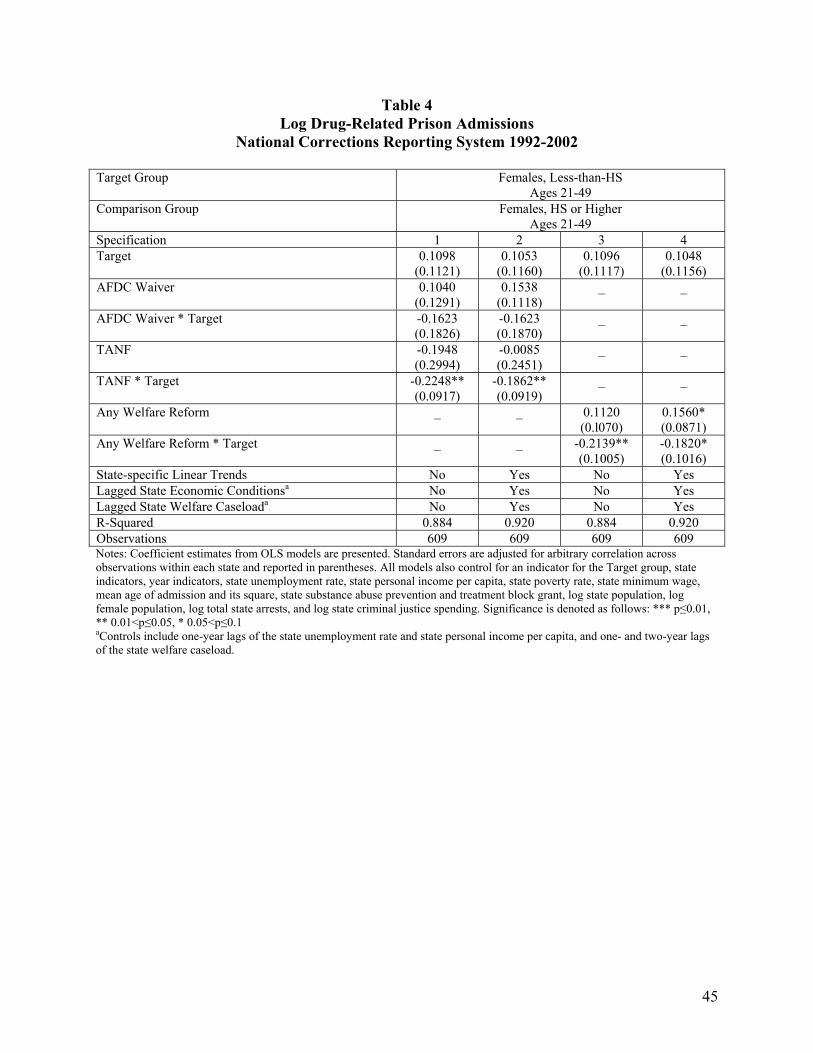
45
Table 4 Log Drug-Related Prison Admissions
National Corrections Reporting System 1992-2002
Target Group Females, Less-than-HS Ages 21-49
Comparison Group Females, HS or Higher Ages 21-49
Specification 1 2 3 4 Target 0.1098
(0.1121) 0.1053
(0.1160) 0.1096
(0.1117) 0.1048
(0.1156) AFDC Waiver 0.1040
(0.1291) 0.1538
(0.1118) _
_
AFDC Waiver * Target -0.1623 (0.1826)
-0.1623 (0.1870)
_
_
TANF -0.1948 (0.2994)
-0.0085 (0.2451)
_
_
TANF * Target -0.2248** (0.0917)
-0.1862** (0.0919)
_
_
Any Welfare Reform _
_
0.1120 (0.l070)
0.1560* (0.0871)
Any Welfare Reform * Target _
_
-0.2139** (0.1005)
-0.1820* (0.1016)
State-specific Linear Trends No Yes No Yes Lagged State Economic Conditionsa No Yes No Yes Lagged State Welfare Caseloada No Yes No Yes R-Squared 0.884 0.920 0.884 0.920 Observations 609 609 609 609 Notes: Coefficient estimates from OLS models are presented. Standard errors are adjusted for arbitrary correlation across observations within each state and reported in parentheses. All models also control for an indicator for the Target group, state indicators, year indicators, state unemployment rate, state personal income per capita, state poverty rate, state minimum wage, mean age of admission and its square, state substance abuse prevention and treatment block grant, log state population, log female population, log total state arrests, and log state criminal justice spending. Significance is denoted as follows: *** p≤0.01, ** 0.01<p≤0.05, * 0.05<p≤0.1 aControls include one-year lags of the state unemployment rate and state personal income per capita, and one- and two-year lags of the state welfare caseload.
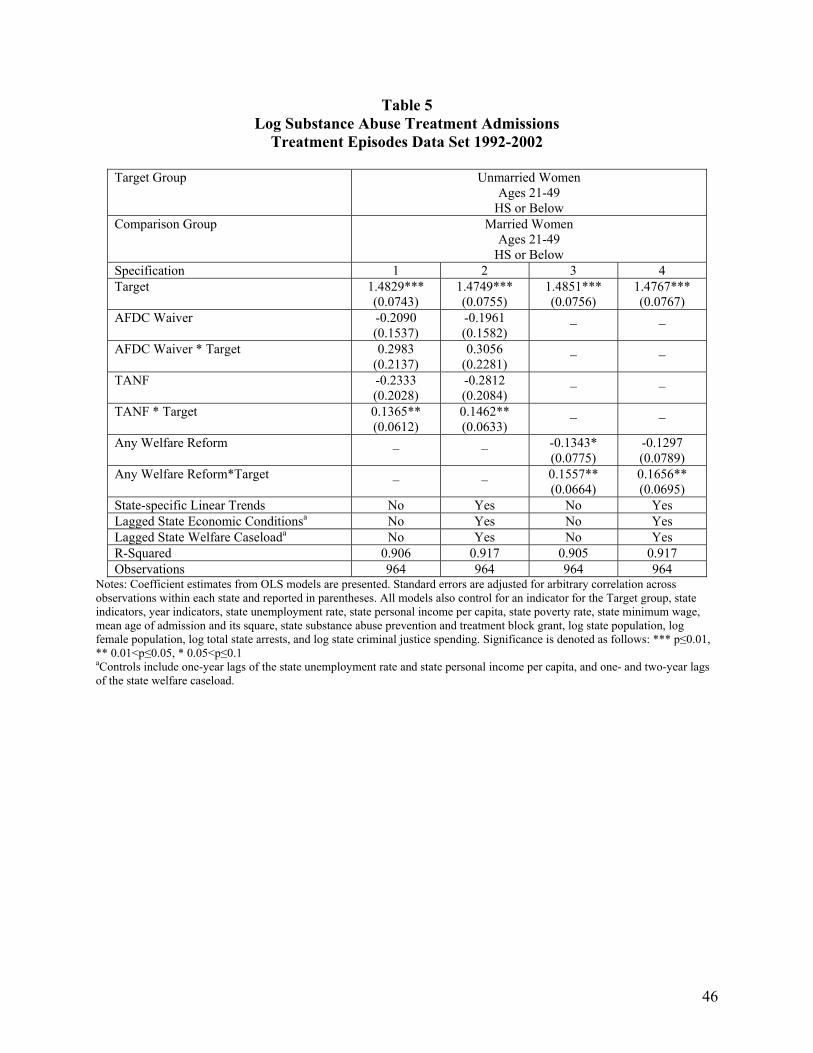
46
Table 5
Log Substance Abuse Treatment Admissions Treatment Episodes Data Set 1992-2002
Target Group Unmarried Women
Ages 21-49 HS or Below
Comparison Group Married Women Ages 21-49
HS or Below Specification 1 2 3 4 Target 1.4829***
(0.0743) 1.4749*** (0.0755)
1.4851*** (0.0756)
1.4767*** (0.0767)
AFDC Waiver -0.2090 (0.1537)
-0.1961 (0.1582)
_
_
AFDC Waiver * Target 0.2983 (0.2137)
0.3056 (0.2281)
_
_
TANF -0.2333 (0.2028)
-0.2812 (0.2084)
_
_
TANF * Target 0.1365** (0.0612)
0.1462** (0.0633)
_
_
Any Welfare Reform
_
_
-0.1343* (0.0775)
-0.1297 (0.0789)
Any Welfare Reform*Target _ _ 0.1557** (0.0664)
0.1656** (0.0695)
State-specific Linear Trends No Yes No Yes Lagged State Economic Conditionsa No Yes No Yes Lagged State Welfare Caseloada No Yes No Yes R-Squared 0.906 0.917 0.905 0.917 Observations 964 964 964 964
Notes: Coefficient estimates from OLS models are presented. Standard errors are adjusted for arbitrary correlation across observations within each state and reported in parentheses. All models also control for an indicator for the Target group, state indicators, year indicators, state unemployment rate, state personal income per capita, state poverty rate, state minimum wage, mean age of admission and its square, state substance abuse prevention and treatment block grant, log state population, log female population, log total state arrests, and log state criminal justice spending. Significance is denoted as follows: *** p≤0.01, ** 0.01<p≤0.05, * 0.05<p≤0.1 aControls include one-year lags of the state unemployment rate and state personal income per capita, and one- and two-year lags of the state welfare caseload.

47
Table 6 Log Drug-Related Arrests
FBI Crime Reports 1992-2002
Target Group Females Ages 21-49 Comparison Group Males Ages 21-49 Outcome Log Total Drug-Related Arrests Log Drug Possession Arrests Specification 1 2 3 4 5 6 Target -0.6237***
(0.1064) -0.7298***
(0.1421) -0.7296***
(0.1414) -0.5968***
(0.1384) -0.7115***
(0.1789) -0.7106***
(0.1773) AFDC Waiver 0.0477
(0.0585) 0.0537
(0.0689) _ 0.1231*
(0.0672) 0.1363* (0.0764)
_
AFDC Waiver * Target -0.0439 (0.0531)
-0.0440 (0.0514)
_ -0.0491 (0.0581)
-0.0483 (0.0562)
_
TANF 0.0613 (0.0471)
0.0434 (0.0472)
_ 0.0617 (0.0691)
0.0363 (0.0630)
_
TANF * Target -0.0541** (0.0253)
-0.0436* (0.0260)
_ -0.0690** (0.0310)
-0.0564* (0.0327)
_
Any Welfare Reform _ _ 0.0513 (0.0584)
_ _ 0.1155* (0.0667)
Any Welfare Reform * Target
_ _ -0.0436 (0.0276)
_ _ -0.0552* (0.0329)
State-specific Linear Trends No Yes Yes No Yes Yes Lagged State Economic Conditionsa No Yes Yes No Yes Yes Lagged State Welfare Caseloada No Yes Yes No Yes Yes R-Squared 0.961 0.967 0.967 0.956 0.964 0.964 Observations 11210 11210 11210 10940 10940 10940
Notes: Coefficient estimates from OLS models are presented. Standard errors are adjusted for arbitrary correlation across observations within each state and reported in parentheses. In addition to indicators for state, year, and month, all models also control for an indicator for the Target group, state indicators, year indicators, month indicators, state unemployment rate, state personal income per capita, state poverty rate, state minimum wage, state substance abuse prevention and treatment block grant, log state population of all agencies with population 50,000+, log covered population of reporting agencies, log total non-drug related state arrests, and log state criminal justice spending. Significance is denoted as follows: *** p≤0.01, ** 0.01<p≤0.05, * 0.05<p≤0.1 aControls include one-year lags of the state unemployment rate and state personal income per capita, and one- and two-year lags of the state welfare caseload.

48
Table 7 Log Drug-Related Hospital Emergency Room Visits
Drug Abuse Warning Network 1990-2002
Target Group Females Comparison Group Males Outcome Log Drug-Related ED Episodes Log Drug-Related ED Mentions Specification 1 2 3 4 5 6 Target -0.2053**
(0.0972) -0.2053** (0.0978)
-0.2279** (0.1045)
-0.2279** (0.1051)
AFDC Waiver 0.0679 (0.0756)
-0.0170 (0.0789)
_
0.0640 (0.0824)
-0.0198 (0.0861)
_
AFDC Waiver * Target
-0.0628 (0.0939)
-0.0628 (0.0945)
_
-0.0589 (0.1005)
-0.0589 (0.1011)
_
TANF 0.0806 (0.0758)
-0.0124 (0.0627)
_
0.0693 (0.0787)
-0.0212 (0.0651)
_
TANF * Target -0.1012 (0.0699)
-0.1012 (0.0703)
_
-0.0989 (0.0742)
-0.0989 (0.0746)
_
Any Welfare Reform _
_
0.0264 (0.0588)
_
_
0.0222 (0.0624)
Welfare Reform * Target
_
_
-0.1361** (0.0512)
_
_
-0.1350** (0.0530)
State-specific Linear Trends No Yes Yes No Yes Yes Lagged State Economic Conditionsa No Yes Yes No Yes Yes Lagged State Welfare Caseloada No Yes Yes No Yes Yes R-Squared 0.904 0.926 0.928 0.894 0.918 0.919 Observations 2024 2024 2024 2024 2024 2024
Notes: ED = Emergency Department. Coefficient estimates from OLS models are presented. Standard errors are adjusted for arbitrary correlation across observations within each metropolitan area and reported in parentheses. In addition to indicators for metropolitan area, year, and quarter, all models also control for an indicator for the Target group, state and MSA unemployment rates, state personal income per capita, state poverty rate, state minimum wage, state substance abuse prevention and treatment block grant, log state population, log MSA population, log total state arrests, and log state criminal justice spending. Significance is denoted as follows: *** p≤0.01, ** 0.01<p≤0.05, * 0.05<p≤0.1 aControls include one-year lags of the state unemployment rate, MSA unemployment rate and state personal income per capita, and one- and two-year lags of the state welfare caseload.
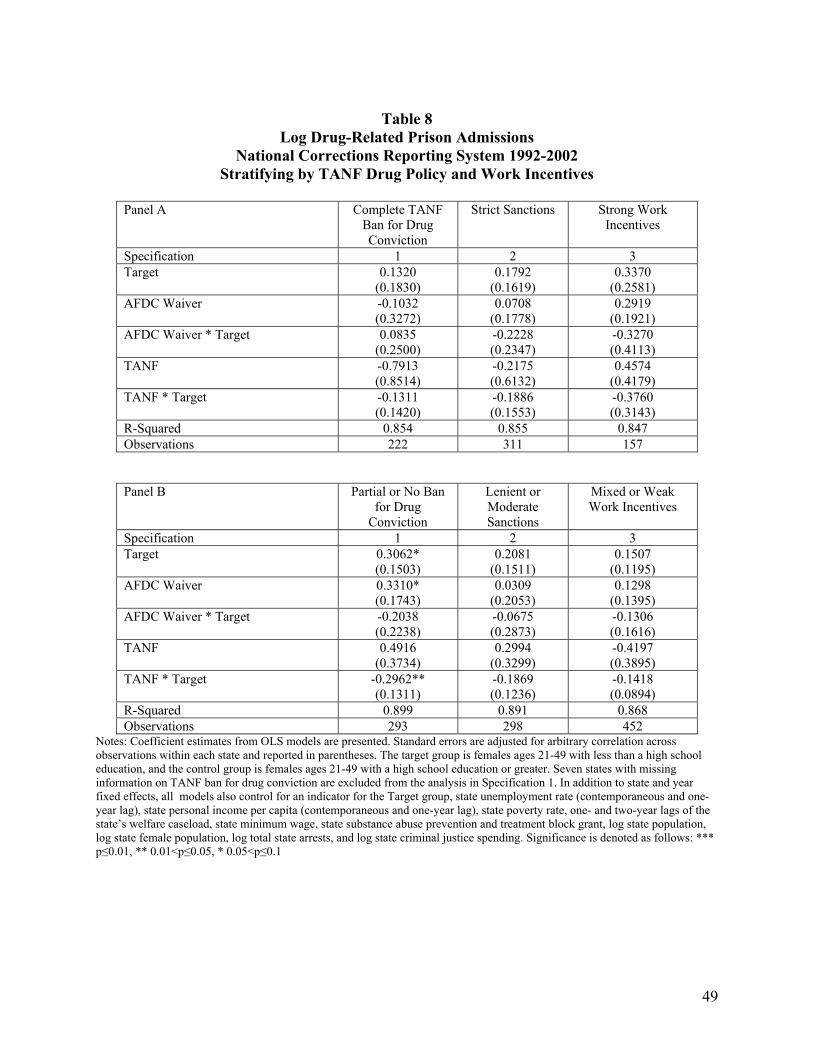
49
Table 8 Log Drug-Related Prison Admissions
National Corrections Reporting System 1992-2002 Stratifying by TANF Drug Policy and Work Incentives
Panel A Complete TANF
Ban for Drug Conviction
Strict Sanctions Strong Work Incentives
Specification 1 2 3 Target 0.1320
(0.1830) 0.1792
(0.1619) 0.3370
(0.2581) AFDC Waiver -0.1032
(0.3272) 0.0708
(0.1778) 0.2919
(0.1921) AFDC Waiver * Target 0.0835
(0.2500) -0.2228 (0.2347)
-0.3270 (0.4113)
TANF -0.7913 (0.8514)
-0.2175 (0.6132)
0.4574 (0.4179)
TANF * Target -0.1311 (0.1420)
-0.1886 (0.1553)
-0.3760 (0.3143)
R-Squared 0.854 0.855 0.847 Observations 222 311 157
Panel B Partial or No Ban for Drug
Conviction
Lenient or Moderate Sanctions
Mixed or Weak Work Incentives
Specification 1 2 3 Target 0.3062*
(0.1503) 0.2081
(0.1511) 0.1507
(0.1195) AFDC Waiver 0.3310*
(0.1743) 0.0309
(0.2053) 0.1298
(0.1395) AFDC Waiver * Target -0.2038
(0.2238) -0.0675 (0.2873)
-0.1306 (0.1616)
TANF 0.4916 (0.3734)
0.2994 (0.3299)
-0.4197 (0.3895)
TANF * Target -0.2962** (0.1311)
-0.1869 (0.1236)
-0.1418 (0.0894)
R-Squared 0.899 0.891 0.868 Observations 293 298 452
Notes: Coefficient estimates from OLS models are presented. Standard errors are adjusted for arbitrary correlation across observations within each state and reported in parentheses. The target group is females ages 21-49 with less than a high school education, and the control group is females ages 21-49 with a high school education or greater. Seven states with missing information on TANF ban for drug conviction are excluded from the analysis in Specification 1. In addition to state and year fixed effects, all models also control for an indicator for the Target group, state unemployment rate (contemporaneous and one-year lag), state personal income per capita (contemporaneous and one-year lag), state poverty rate, one- and two-year lags of the state’s welfare caseload, state minimum wage, state substance abuse prevention and treatment block grant, log state population, log state female population, log total state arrests, and log state criminal justice spending. Significance is denoted as follows: *** p≤0.01, ** 0.01<p≤0.05, * 0.05<p≤0.1
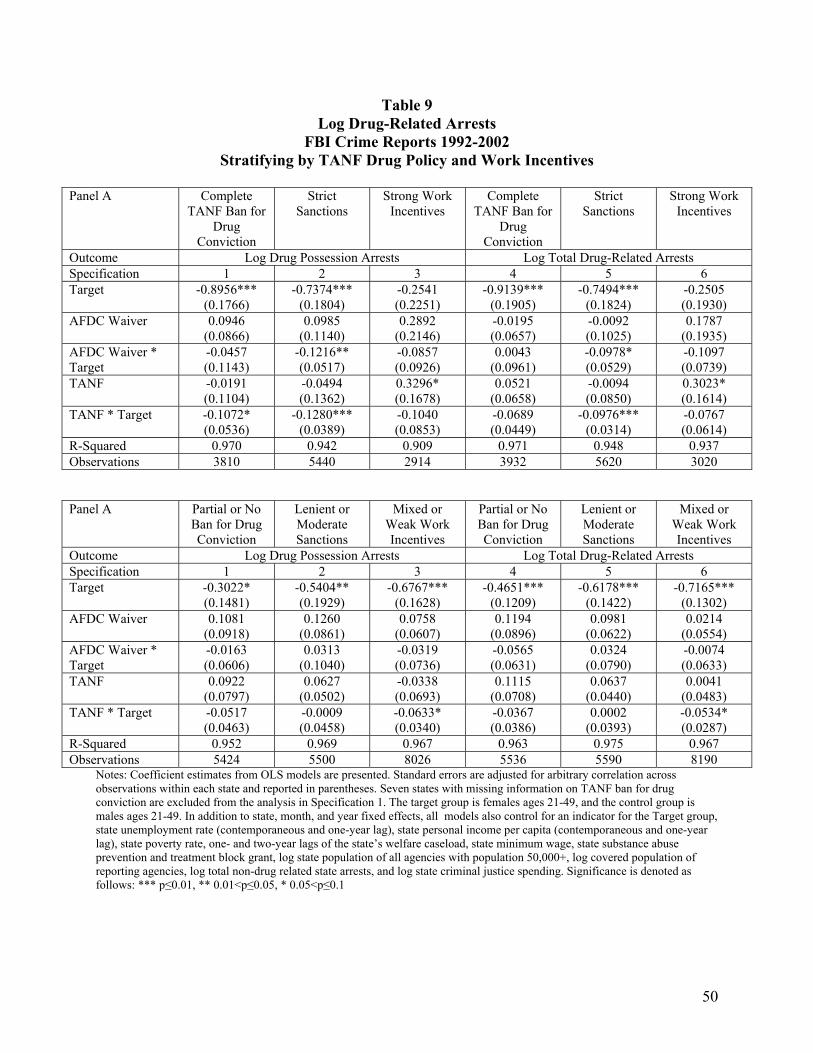
50
Table 9 Log Drug-Related Arrests
FBI Crime Reports 1992-2002 Stratifying by TANF Drug Policy and Work Incentives
Panel A Complete
TANF Ban for Drug
Conviction
Strict Sanctions
Strong Work Incentives
Complete TANF Ban for
Drug Conviction
Strict Sanctions
Strong Work Incentives
Outcome Log Drug Possession Arrests Log Total Drug-Related Arrests Specification 1 2 3 4 5 6 Target -0.8956***
(0.1766) -0.7374***
(0.1804) -0.2541 (0.2251)
-0.9139*** (0.1905)
-0.7494*** (0.1824)
-0.2505 (0.1930)
AFDC Waiver 0.0946 (0.0866)
0.0985 (0.1140)
0.2892 (0.2146)
-0.0195 (0.0657)
-0.0092 (0.1025)
0.1787 (0.1935)
AFDC Waiver * Target
-0.0457 (0.1143)
-0.1216** (0.0517)
-0.0857 (0.0926)
0.0043 (0.0961)
-0.0978* (0.0529)
-0.1097 (0.0739)
TANF -0.0191 (0.1104)
-0.0494 (0.1362)
0.3296* (0.1678)
0.0521 (0.0658)
-0.0094 (0.0850)
0.3023* (0.1614)
TANF * Target -0.1072* (0.0536)
-0.1280*** (0.0389)
-0.1040 (0.0853)
-0.0689 (0.0449)
-0.0976*** (0.0314)
-0.0767 (0.0614)
R-Squared 0.970 0.942 0.909 0.971 0.948 0.937 Observations 3810 5440 2914 3932 5620 3020
Panel A Partial or No Ban for Drug Conviction
Lenient or Moderate Sanctions
Mixed or Weak Work Incentives
Partial or No Ban for Drug Conviction
Lenient or Moderate Sanctions
Mixed or Weak Work Incentives
Outcome Log Drug Possession Arrests Log Total Drug-Related Arrests Specification 1 2 3 4 5 6 Target -0.3022*
(0.1481) -0.5404** (0.1929)
-0.6767*** (0.1628)
-0.4651*** (0.1209)
-0.6178*** (0.1422)
-0.7165*** (0.1302)
AFDC Waiver 0.1081 (0.0918)
0.1260 (0.0861)
0.0758 (0.0607)
0.1194 (0.0896)
0.0981 (0.0622)
0.0214 (0.0554)
AFDC Waiver * Target
-0.0163 (0.0606)
0.0313 (0.1040)
-0.0319 (0.0736)
-0.0565 (0.0631)
0.0324 (0.0790)
-0.0074 (0.0633)
TANF 0.0922 (0.0797)
0.0627 (0.0502)
-0.0338 (0.0693)
0.1115 (0.0708)
0.0637 (0.0440)
0.0041 (0.0483)
TANF * Target -0.0517 (0.0463)
-0.0009 (0.0458)
-0.0633* (0.0340)
-0.0367 (0.0386)
0.0002 (0.0393)
-0.0534* (0.0287)
R-Squared 0.952 0.969 0.967 0.963 0.975 0.967 Observations 5424 5500 8026 5536 5590 8190
Notes: Coefficient estimates from OLS models are presented. Standard errors are adjusted for arbitrary correlation across observations within each state and reported in parentheses. Seven states with missing information on TANF ban for drug conviction are excluded from the analysis in Specification 1. The target group is females ages 21-49, and the control group is males ages 21-49. In addition to state, month, and year fixed effects, all models also control for an indicator for the Target group, state unemployment rate (contemporaneous and one-year lag), state personal income per capita (contemporaneous and one-year lag), state poverty rate, one- and two-year lags of the state’s welfare caseload, state minimum wage, state substance abuse prevention and treatment block grant, log state population of all agencies with population 50,000+, log covered population of reporting agencies, log total non-drug related state arrests, and log state criminal justice spending. Significance is denoted as follows: *** p≤0.01, ** 0.01<p≤0.05, * 0.05<p≤0.1

51
Appendix A: Calculating Arrests from the FBI Monthly Arrest Reports
We used data from the Uniform Crime Reporting Program’s Monthly Master Files from
the U.S. Department of Justice Federal Bureau of Investigation (FBI) for 1992 through 2002,
which provide the number of arrests by age and gender for each month/offense
category/reporting agency. The data include a record for each criminal justice agency in the U.S.,
whether they reported to the FBI or not, indicating the population covered by that agency. Not all
criminal justice agencies report on the number of arrests by month/offense category and
reporting occurs more consistently in larger agencies. To obtain reasonably complete data, we
limited our data to agencies which cover at least 50,000 individuals. In 1996, the year that
welfare reform was enacted, agencies with population of 50,000 or more comprised about 55%
of the total U.S. population (147million/268 million, calculated from the FBI files and U.S.
Census data).
From these agency-based observations, we aggregated the data to the month/year/state
level. We calculated two drug use-related variables: the total number of drug-related arrests
(offense category 18) and the total number of arrests for drug possession (offense category 185).
Our target group was females aged 21-49 and our control group was males aged 21 to 49. Even
among the larger criminal justice agencies, not all agencies report in all months. For example, in
1996, of the total 147 million population people in the U.S. residing under the jurisdiction of
agencies of 50,000 people or more, about 106 million people (or about 72% of the population)
were covered by agencies which reported arrests for each of the 12 months to the FBI. A few of
the agencies reported arrests only for the month of December. Because some of these were
annual rather than monthly figures, we dropped agencies that reported only for December. For
December of 1996, there were 28 agencies in this category, encompassing 6 million people.

52
Furthermore, not all agencies separate drug possession from all drug offenses, so that there are
more observations for all drug arrests than for possession arrests.
To control for both the total population in agencies covering populations 50,000 and
above, and the population actually covered by the FBI arrests in a particular offense category for
the state/month/year, we include both the total state population in all agencies with populations
50,000 people or more, and the total population covered by the FBI arrest data for that
state/year/month/offense on the right-hand side in the models of arrests.
We computed arrest data for serious non-drug related offenses in the same manner. These
include murder, manslaughter, robbery, assault, rape, burglary, larceny, motor vehicle theft,
arson, forgery and counterfeiting, fraud, embezzlement, possession of stolen property,
vandalism, weapons offenses, vice, sex crimes, and gambling. We exclude the less serious
crimes such as vagrancy, suspicious behavior, and curfew violations.