Importance of the methanogenic archaea populations in anaerobic wastewater treatments
Upload
independentCategory
view
2download
0
ORIGINAL ARTICLE
Effects of temperature on the diversityand community structure of knownmethanogenic groups and other archaeain high Arctic peatLone Høj1, Rolf A Olsen2,3 and Vigdis L Torsvik1
1Department of Biology, University of Bergen, Bergen, Norway; 2Department of Chemistry, Biotechnology andFood Science, Norwegian University of Life Sciences, As, Norway and 3Department of Biology, The UniversityCentre in Svalbard, Longyearbyen, Norway
Archaeal populations are abundant in cold and temperate environments, but little is known abouttheir potential response to climate change-induced temperature changes. The effects of temperatureon archaeal communities in unamended slurries of weakly acidic peat from Spitsbergen werestudied using a combination of fluorescent in situ hybridization (FISH), 16S rRNA gene clonelibraries and denaturing gradient gel electrophoresis (DGGE). A high relative abundance of activearchaeal cells (11–12% of total count) was seen at low temperatures (1 and 5 1C), and this communitywas dominated by Group 1.3b Crenarchaeota and the euryarchaeal clusters rice cluster V (RC-V),and Lake Dagow sediment (LDS). Increasing temperature reduced the diversity and relativeabundance of these clusters. The methanogenic community in the slurries was diverse and includedrepresentatives of Methanomicrobiales, Methanobacterium, Methanosarcina and Methanosaeta. Theoverall relative abundance and diversity of the methanogenic archaea increased with increasingtemperature, in accordance with a strong stimulation of methane production rates. However, DGGEprofiling showed that the structure of this community changed with temperature and time. Whilethe relative abundance of some populations was affected directly by temperature, the relativeabundance of other populations was controlled by indirect effects or did not respond totemperature.The ISME Journal (2008) 2, 37–48; doi:10.1038/ismej.2007.84; published online 22 November 2007Subject Category: microbial population and community ecologyKeywords: archaea; Arctic microbiology; diversity; methane; peat; temperature
Introduction
Most climate models predict that by 2080, summertemperatures in Arctic regions will increase by 4.0–7.5 1C, and there will also be increased precipitation(Anisimov and Fitzharris, 2001). Motivated by thedemonstrated importance of temperature on emis-sions of the greenhouse gas methane from Arctic andsubarctic wetlands (Christensen et al., 2003), severalstudies have addressed the effect of temperature onthe methane production potential in these soils(Svensson, 1984; Dunfield et al., 1993; Kotsyur-
benko et al., 1996, 2004; Metje and Frenzel, 2005,2007; Ganzert et al., 2007).
Recently, archaeal community analysis was in-cluded in studies of temperature effects on metha-nogenesis and methanogenic pathways in subarcticpermafrost peat from Northern Finland (Metje andFrenzel, 2005) and Siberia (Metje and Frenzel,2007). Both the archaeal community structure andthe dominating methanogenic pathways differedsignificantly between the studied sites. In samplesof acidic (pH 4.1) peat from Northern Finland, thecommunity was dominated by hydrogenotrophicmethanogenesis and all methanogenic sequencesbelonged to Methanobacteriales (Metje and Frenzel,2005). In contrast, in samples of weakly acidic (pH5–6) peat from Siberia, acetoclastic methanogenesisaccounted for about 70% of the methanogenesis,and the archaeal community included Methano-sarcinales and Methanobacteriales (Metje and
Received 29 May 2007; revised 10 September 2007; accepted 11September 2007; published online 22 November 2007
Correspondence. Current address: L Høj, Australian Instituteof Marine Science, PMB No. 3, Townsville MC, Townsville,Queensland 4810, Australia.E-mail: [email protected]
The ISME Journal (2008) 2, 37–48& 2008 International Society for Microbial Ecology All rights reserved 1751-7362/08 $30.00
www.nature.com/ismej
Frenzel, 2007). For both sites, increased temperatureresulted in few changes in the archaeal communitystructure, and the methane production rates at 4 1Ccorresponded to as much as 10 and 17% of the ratesat the optimum temperature (25 1C and 26–28 1C,respectively).
The archaeal communities in peat from theweakly acidic, 6.0 in MgCl2 (pH) wetland atSolvatnet, Spitsbergen, include representatives of awide range of methanogenic groups, includinggroups with potential for hydrogenotrophic metha-nogenesis (Methanomicrobiales, Methanobacteria-ceae), acetoclastic methanogenesis (Methanosaeta)and both acetoclastic, hydrogenotrophic and methy-lotrophic methanogenesis (Methanosarcina) (Højet al., 2005). Previous studies of rice paddy soils,which harbor similar methanogenic groups, havedemonstrated changes in the archaeal communitystructure with temperature (Fey and Conrad, 2000).No information is however available on howincreased temperature will affect the archaeal com-munity structure in Arctic peat where all thesemethanogenic groups are represented.
Previous studies of archaeal communities insubarctic and Arctic wetlands have repeatedlydetected archaeal groups not expected to be in-volved in methane production (Kotsyurbenko et al.,2004; Metje and Frenzel, 2005; Høj et al., 2005,2006). The studies indicate that these groupshave a high relative abundance in the archaealcommunity, though little attention has been givento these findings as the studies were focused onthe methanogenic community. In contrast, increas-ing attention has been given to the relativelyhigh abundance of archaea in cold nonmethano-genic systems such as the Southern Ocean(DeLong et al., 1994; Murray et al., 1998; Churchet al., 2003), the Arctic Ocean (Wells and Deming,2003; Bano et al., 2004; Garneau et al., 2006;Kirchman et al., 2007) and an Arctic river (Galandet al., 2006). No information is however availableon how temperature affects the diversity andabundance of these nonmethanogenic archaealpopulations.
In this study, unamended slurries of peat fromSolvatnet were incubated at six temperatures in therange 1–25 1C. After 4 weeks incubation, activearchaeal cells were visualized and counted usingfluorescent in situ hybridization (FISH) and thearchaeal community structure was studied indetail for two selected temperatures (5 and 20 1C)by cloning of archaeal 16S rRNA genes. Archaealcommunity denaturing gradient gel electrophoresis(DGGE) fingerprints for six incubation tempera-tures and two time points revealed whether appar-ent temperature trends changed with time, andhence were due to indirect rather than directtemperature effects. The effect of temperature onmicrobial activities was addressed by monitoringthe accumulation of methane, CO2 and volatile fattyacids.
Materials and methods
Study site and sample collectionThe site Solvatnet is located on a marine terraceoutside the township of Ny-Alesund (781500N–111300E) on the west coast of Spitsbergen. The siteand peat characteristics, as well as the in situarchaeal community composition at two depths,have been described in detail elsewhere (Høj et al.,2005, 2006). The peat is classified as undecomposed(H1) and almost undecomposed (H2) using vonPost’s scale (Clymo, 1983). The peat has a highorganic content (88% of dry weight), a high watercontent (4600% of dry weight) and is weakly acidic(pH 6.8 in H2O). The site is grazed by BarnacleGeese (Branta leucopsis). Previously recorded CO2
emissions were in the range 0.18–0.51 gm!2 h!1,and methane emissions were in the range 93–2801 mgm!2 h!1 (Høj et al., 2005). Peat samples forthis experiment were collected in mid-August 2000using polyvinyl chloride corers (inner diameter5 cm, length 10 cm), as previously described (Højet al., 2005). The cores were stored for 4 months at2–4 1C until the experiment was commenced.
Preparation and incubation of soil slurriesSoil from the inner part (5–7 cm depth) of threecores was mixed to create a pooled compositesample, which was subsequently used to makeslurries. The peat slurries were made under N2
atmosphere by mixing 50 g wet peat (correspondingto 4.5 g dry peat) with 15ml sterile, anoxic water in a125ml serum bottle, which was then sealed andcapped. The slurries were gassed with N2 andincubated in the dark without shaking in preciselythermostated (70.01 1C) water baths at temperatures1, 5, 10, 15, 20 and 25 1C. Two parallel slurrieswere made for each temperature. One parallel wasterminated in week 4 to perform analyses of thearchaeal community structure, while the otherparallel was terminated in week 13. Due to the laborintensity associated with sample processing, sam-ples from no more than two temperatures wereprocessed per day. All temperatures were sampledwithin 5–6 days, with the highest temperaturesbeing sampled first.
Analytical techniquesBefore sampling the headspace gas, bottles wereshaken vigorously to allow equilibration betweenthe liquid and gas phases. The methane concentra-tions in 1ml of headspace gas was measured using aShimadzu GC-14A gas chromatograph equippedwith a Porapak Q stainless steel column (1.5m"1/8 inch) and a flame ionization detector, with N2 ascarrier gas. Injection, detection and column tem-peratures were 200, 240 and 45 1C, respectively. Thehydrogen concentration in 2ml headspace gas wasmeasured using a Varian Aerograph model 920 gas
Temperature effects on Arctic peat archaeaL Høj et al
38
The ISME Journal
chromatograph equipped with a Stainless SteelWashed Molesieve (Alltech, Deerfield, IL, USA)60/80 mesh column (2.0m" 1/8 inch) and a thermalconductivity detector (125mA), with Argon ascarrier gas. Injection, detection and column tem-peratures were 100, 100 and 50 1C, respectively.Carbon dioxide concentration in 2ml headspace gaswas determined using an infrared CO2 analyzer(Binos 100, Rosemount GmbH & Co., Geschafts-bereich Analysentechnik, Hanau, Germany).
Samples of slurry water (1ml) were stored frozenat !20 1C until analysis for volatile fatty acids by aSchimadzu GC 14A gas chromatograph equippedwith a flame ionization detector, with N2 as carriergas. Thawed samples were acidified by addition of10 ml HCl so that C2–C5 volatile fatty acids could beseparated as free acids on a 6 ft" 2mm i.d. glasscolumn packed with 10% SP-1200 and 1% H3PO4
on 80/100 Chromosorb W AW. Injection, detectionand column temperatures were 200, 200 and 125 1C,respectively.
CalculationsCalculations of methane accumulation were basedon the concentration in the gas phase, since theamount of dissolved methane can be assumed to below (Wilhelm et al., 1977). The partial pressure wascalculated based on the amount of methane in theheadspace using the ideal gas law. The CO2 partialpressure in the headspace was calculated as de-scribed above for methane.
Total counts and FISH analysisSoil samples (2.5 g) were fixed in 4% paraformal-dehyde (10ml) at 4 1C with shaking overnight. Thefixed soil was transferred to a 250ml Waring-blendersteel jar (Waring, CT, USA) with 12.5ml ice-cold0.2 mm filtered water and homogenized 10 times for1min, with 5min cooling between each blending.After the last blending, the homogenate was allowedto sediment for 1min, and two parallels of 1mlsamples were taken with a 1ml plastic syringewithout needle. The maximum amount of samplethat could be filtered while still keeping the linear
relationship between PicoGreen counts and samplevolume was determined for each sample (Fægriet al., 1977). Appropriate amounts of soil homo-genate was then filtered onto white polycarbonatefilters (pore size 0.2 mm, 25mm diameter; OsmonicsPoretics Products, Minnetonka, MN, USA), and air-dried filters were stored at !20 1C (Glockner et al.,1999). For each sample, two parallel filters fromeach parallel were processed, giving a total of fourfilters analyzed per sample. The dry weight of soilsamples was determined gravimetrically.
The DNA-specific stain PicoGreen (MolecularProbes, Invitrogen, Carlsbad, CA, USA) was chosenfor determination of total counts of bacteriaand archaea. This was based on initial experiments,which showed that PicoGreen was superior to40-6-diamidino-2-phenylindole (Porter and Feig,1980) in discriminating between cells and soilparticles, and caused less background on whitepolycarbonate filters than SYBRGreen I (MolecularProbes). Filter sections were stained with PicoGreen(1:100 dilution in 1"Tris-acetate-EDTA) in the darkfor 15min (Weinbauer et al., 1998) and mountedwith a drop of antifade solution (0.1% p-phenyle-nediamine, 50% glycerol, 0.5"PBS) (Noble andFuhrman, 1998).
The oligonucleotide probes used in this studywere labeled with a CY3 fluorochrome on the 50 end(Interactiva Biotechnologie, Ulm, Germany). Theprobes and used stringency conditions are presentedin Table 1. For each probe the stringency conditionswere optimized using control cultures of Escher-ichia coli, Archaeoglobus fulgidus, Methanococcusvoltae, Methanosaeta concilii, Methanosarcina sici-liae, Methanobacterium formicicum, Methanospir-illum hungatei and Sulfolobus solfataricus. Eachfilter was cut into six sections prior to hybridizationwith the labeled oligonucleotide probes. All hybri-dizations were performed at 42 1C overnight. Other-wise the hybridization and washing steps wereperformed as outlined by Glockner et al. (1999).The NaCl concentrations of the washing buffer wasadjusted according to the stringency condition ofeach probe as described in Pernthaler et al. (2001).Filter sections were mounted with antifade solutionas described above.
Table 1 Oligonucleotide probes used for FISH
Probe Sequence Specificity Stringency (% formamide) Reference
EUB338 50-GCTGCCTCCCGTAGGAGT Bacteria 30 Amann et al. (1990)NON338 50-ACTCCTACGGGAGGCAGC Negative control 30 Wallner et al. (1993)ARCH915 50-GTGCTCCCCCGCCAATTCCT Archaea 25 Amann et al. (1990)EURY498 50-CTTGCCCRGCCCTT Euryarchaeotaa 15 Burggraf et al. (1994)MSMX860 50-GGCTCGCTTCACGGCTTCCCT Methanosarcinales 35 Raskin et al. (1994)MB310 50-CTTGTCTCAGGTTCCATCTCCG Methanobacteriaceae 35 Raskin et al. (1994)
aThis probe has limited coverage of the phylum Euryarchaeaota (Jurgens et al., 2000). Inspection of retrieved clone 16S rRNA sequences revealeda perfect match for methanogenic archaea and most of cluster LDS. In contrast, EURY498 had mismatches with most 16S rRNA sequences fromcluster RC-V.
Temperature effects on Arctic peat archaeaL Høj et al
39
The ISME Journal
Filter sections were inspected using a ZeissAxioplan epifluorescence microscope (Zeiss, Jena,Germany) equipped with a 50W high pressuremercury bulb. The specific filter set Chroma HQ41007 (Chroma Tech. Corp., Rockingham, VT, USA)was used for CY3-labeled probes and the Zeiss filterset 09 was used for PicoGreen. For each sample andprobe combination, at least 10 fields of view werecounted per filter, corresponding to a total of at least40 fields of view. For determination of PicoGreentotal counts at least 2500 cells were counted persample. The statistical significance of differences intotal counts and fractions of cells detected byindividual FISH probes were analyzed using thenonparametric Mann–Whitney U-test (confidencelevel 0.05). Counts with FISH probes were regardedas statistically significant if they (on average) weresignificantly higher than the negative control probecounts (NON338, Mann–Whitney U-test, P40.05).
DNA extraction from soil slurriesSamples for DNA extraction were frozen at !80 1Cuntil processed. DNA extraction and purificationwas performed with the FastDNA SPIN Kit for soil(BIO 101/Qbiogene, Irvine, CA, USA) in combina-tion with a freeze-thaw lysis protocol (Nakatsu et al.,2000; Høj et al., 2005). Wet peat (0.4 g) and 1ml lysisbuffer (0.12M NaP (pH 8), 5% sodium dodecylsulfate) were combined in a MULTIMIX 2 TissueMatrix Tube provided in the kit. The tube was vortexmixed for 1min, incubated at 65 1C for 45min,followed by three quick freeze-thaw cycles (!80and # 65 1C). After this combined mechanical andfreeze-thaw lysis cycle, the DNAwas purified usingthe kit solutions as described by the manufacturer.Two parallel extractions were performed per sample,and the resulting eluates were mixed.
PCR amplification, cloning and sequencingTwo clone libraries were constructed using the DNAextracts from slurries incubated for 4 weeks at 5 and20 1C, respectively. A portion of the 16S rRNA genewas amplified using the archaea-specific primersA109f and A934b (Grosskopf et al., 1998a). Theoptimal template concentration was found using10-fold serial dilutions of the DNA extracts. Thereaction mixture of 25 ml contained 1 ml, 0.2 mM ofeach primer, 200 mM of each deoxyribonucleotidetriphosphate, 0.1% (w/v) bovine serum albumin,PCR buffer 1" (Tris-Cl, KCl, (NH4)2SO4, 15mM
MgCl2, pH 8.7) (Qiagen, Hilden, Germany) and1.25U ml!1 DNA polymerase (Qiagen). Amplificationwas performed with the following protocol: initialmelting at 94 1C for 3min, followed by 32 cyclesof 94 1C for 45 s, 52 1C for 1min, 72 1C for 1min,followed by a final extension at 72 1C for 7min. PCRproducts were purified by gel extraction using theQiaquick Gel Extraction Kit (Qiagen), following theprotocols recommended by the manufacturer.
Purified PCR products were cloned using a TOPOTA cloning kit, version K2 (Invitrogen), as recom-mended by the manufacturer. For each library, 50clones were randomly selected, and the clonedinsert was PCR amplified using the M13 primersupplied with the TOPO vector. Purified PCRproducts were sequenced using the ABI 3730XLGenetic Analyzer with A109f as sequencing primer.
Analysis of phylogeny and diversity of clone sequencesTo identify potentially chimeric molecules thesequences were analyzed using the computer pro-gram Mallard version 1.02. (Ashelford et al., 2006).Sequences were initially aligned with 16S rRNAgene sequences of their closest relatives available inthe GenBank database using the BLAST searchfacility of the National Center for BiotechnologyInformation (NCBI). Sequences derived from thisstudy and their relatives with the highest BLASTscores were added to a prealigned database of936 complete and partial (41000 bp) archaeal 16SrRNA gene sequences using the aligning toolsfrom the ARB program package (Technical Uni-versity of Munich, Munich, Germany; http://www.arb-home.de). The aligned sequences were checkedand corrected manually where required. Sequenceswere added to a preexisting maximum likelihoodtree supplied with the ARB database using a specialparsimony tool, and nodes not to be included in thetree were removed. Sequences with 97% or highersequence identity were assigned to the samephylotype, and one representative sequence for eachphylotype was included in the presented tree.Library coverage was calculated as (1!(a/b))" 100,where a was the number of phylotype represented inthe library, and b was the number of sequences inthe library. Diversity indices were calculated basedon the defined phylotypes using the computerprogram Estimates 8.0.0.
PCR amplification and DGGE analysisA nested protocol was used for amplification ofthe 16S rRNA gene of archaea using the primersPRARCH112F and PREA1100R in the first reaction,and the primers PARCH340-GC and PARCH519Rin a second touchdown reaction as previouslydescribed (Høj et al., 2005). DGGE and sequencingof bands was performed as described previously(Høj et al., 2005). Sequences were analyzed usingthe BLAST tool at the NCBI (http://www.ncbi.nlm.nih.gov/blast). Peak histograms for all profiles weredetermined using the computer program Gel2k(Svein Norland, Department of Biology, Universityof Bergen, Norway). Relative band intensities (Pi)were calculated for each profile as the relative peakarea in the profile (Pi$ni/Ni, where ni is the areaunder peak i and Ni is the sum of all peak areas inthe profile). For double bands, the relative bandintensity was determined by relating their combined
Temperature effects on Arctic peat archaeaL Høj et al
40
The ISME Journal
peak area to the sum of all peak areas in the profile.Potential correlations between relative band inten-sities and temperature were analyzed statisticallyusing Pearson’s product moment correlation (con-fidence level 0.05). The statistical significance ofother trends in relative band intensities was ana-lyzed using Student’s t-test (confidence level 0.05).
Nucleotide sequence accession numbersAll unique sequences generated in this study havebeen deposited in the EMBL database under acces-sion numbers AM712493–AM712556.
Results
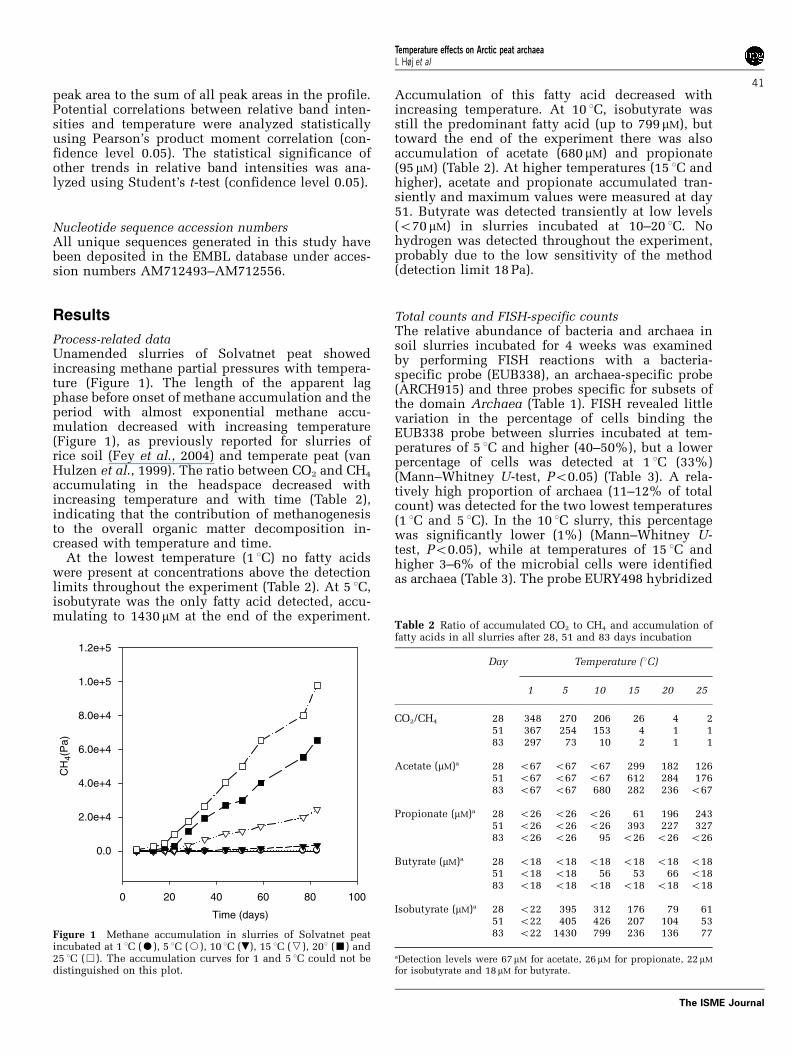
Process-related dataUnamended slurries of Solvatnet peat showedincreasing methane partial pressures with tempera-ture (Figure 1). The length of the apparent lagphase before onset of methane accumulation and theperiod with almost exponential methane accu-mulation decreased with increasing temperature(Figure 1), as previously reported for slurries ofrice soil (Fey et al., 2004) and temperate peat (vanHulzen et al., 1999). The ratio between CO2 and CH4
accumulating in the headspace decreased withincreasing temperature and with time (Table 2),indicating that the contribution of methanogenesisto the overall organic matter decomposition in-creased with temperature and time.
At the lowest temperature (1 1C) no fatty acidswere present at concentrations above the detectionlimits throughout the experiment (Table 2). At 5 1C,isobutyrate was the only fatty acid detected, accu-mulating to 1430 mM at the end of the experiment.
Accumulation of this fatty acid decreased withincreasing temperature. At 10 1C, isobutyrate wasstill the predominant fatty acid (up to 799 mM), buttoward the end of the experiment there was alsoaccumulation of acetate (680 mM) and propionate(95 mM) (Table 2). At higher temperatures (15 1C andhigher), acetate and propionate accumulated tran-siently and maximum values were measured at day51. Butyrate was detected transiently at low levels(o70 mM) in slurries incubated at 10–20 1C. Nohydrogen was detected throughout the experiment,probably due to the low sensitivity of the method(detection limit 18 Pa).
Total counts and FISH-specific countsThe relative abundance of bacteria and archaea insoil slurries incubated for 4 weeks was examinedby performing FISH reactions with a bacteria-specific probe (EUB338), an archaea-specific probe(ARCH915) and three probes specific for subsets ofthe domain Archaea (Table 1). FISH revealed littlevariation in the percentage of cells binding theEUB338 probe between slurries incubated at tem-peratures of 5 1C and higher (40–50%), but a lowerpercentage of cells was detected at 1 1C (33%)(Mann–Whitney U-test, Po0.05) (Table 3). A rela-tively high proportion of archaea (11–12% of totalcount) was detected for the two lowest temperatures(1 1C and 5 1C). In the 10 1C slurry, this percentagewas significantly lower (1%) (Mann–Whitney U-test, Po0.05), while at temperatures of 15 1C andhigher 3–6% of the microbial cells were identifiedas archaea (Table 3). The probe EURY498 hybridized
Time (days)
0 20 40 60 80 100
CH
4(P
a)
0.0
2.0e+4
4.0e+4
6.0e+4
8.0e+4
1.0e+5
1.2e+5
Figure 1 Methane accumulation in slurries of Solvatnet peatincubated at 1 1C (K), 5 1C (J), 10 1C (.), 15 1C (X), 201 (’) and25 1C (&). The accumulation curves for 1 and 5 1C could not bedistinguished on this plot.
Table 2 Ratio of accumulated CO2 to CH4 and accumulation offatty acids in all slurries after 28, 51 and 83 days incubation
Day Temperature (1C)
1 5 10 15 20 25
CO2/CH4 28 348 270 206 26 4 251 367 254 153 4 1 183 297 73 10 2 1 1
Acetate (mM)a 28 o67 o67 o67 299 182 12651 o67 o67 o67 612 284 17683 o67 o67 680 282 236 o67
Propionate (mM)a 28 o26 o26 o26 61 196 24351 o26 o26 o26 393 227 32783 o26 o26 95 o26 o26 o26
Butyrate (mM)a 28 o18 o18 o18 o18 o18 o1851 o18 o18 56 53 66 o1883 o18 o18 o18 o18 o18 o18
Isobutyrate (mM)a 28 o22 395 312 176 79 6151 o22 405 426 207 104 5383 o22 1430 799 236 136 77
aDetection levels were 67mM for acetate, 26mM for propionate, 22 mMfor isobutyrate and 18mM for butyrate.
Temperature effects on Arctic peat archaeaL Høj et al
41
The ISME Journal
with 1–3% of the microbial cells in all slurries(Table 3). For some slurries the counts with thisprobe were at or below (10 1C) the detection limit ofthe method and some counts had large standarddeviations (Table 3). Hence, differences in thepercentage of EURY498-positive cells were in mostcases not statistically significant. The fraction ofarchaea binding the EURY498 probe was howevershown to be higher at 20 1C (52%) than at 5 1C (19%)(Mann–Whitney U-test, Po0.05).
The morphology of cells detected by the probesARCH915 and EURY498 differed with temperature.Rods dominated the community at 1 1C and 5 1C,while cocci, sarcina-like clusters and highly orga-nized spheres dominated at higher temperatures.The number of cells binding the group-specificmethanogen probes MSMX860 (Methanosarcinales)and MB310 (Methanobacteriaceae) (Raskin et al.,1994) was below the detection limit of the method.Nevertheless, by examining a large number of fieldsof view, a few positive cells were identified inslurries incubated at temperatures of 10 1C or higher.The probe MB310 detected rod-shaped cells, and theprobe MSMX860 detected sarcina-like and sphere-formed cell aggregates. The size and the probe signalintensity of the aggregates were lower at 10 1C thanfor the higher temperatures.
Clone librariesA total of 100 archaea-specific 16S rRNA cloneswere analyzed from slurries incubated at 5 1C and
20 1C for 4 weeks (50 for each). The computerprogram Mallard identified one chimeric sequencein the 20 1C library, which was removed from furtheranalyses. In the subsequent statistical analysesclones representing known methanogenic groupsand other archaea were separated since they dis-played contrasting trends with temperature (Table 4).For simplicity the two library subsets are referred toas the methanogenic subset and the nonmethano-genic subset, although the second subset cantheoretically include organisms with a hithertounrecognized capability of methane production.
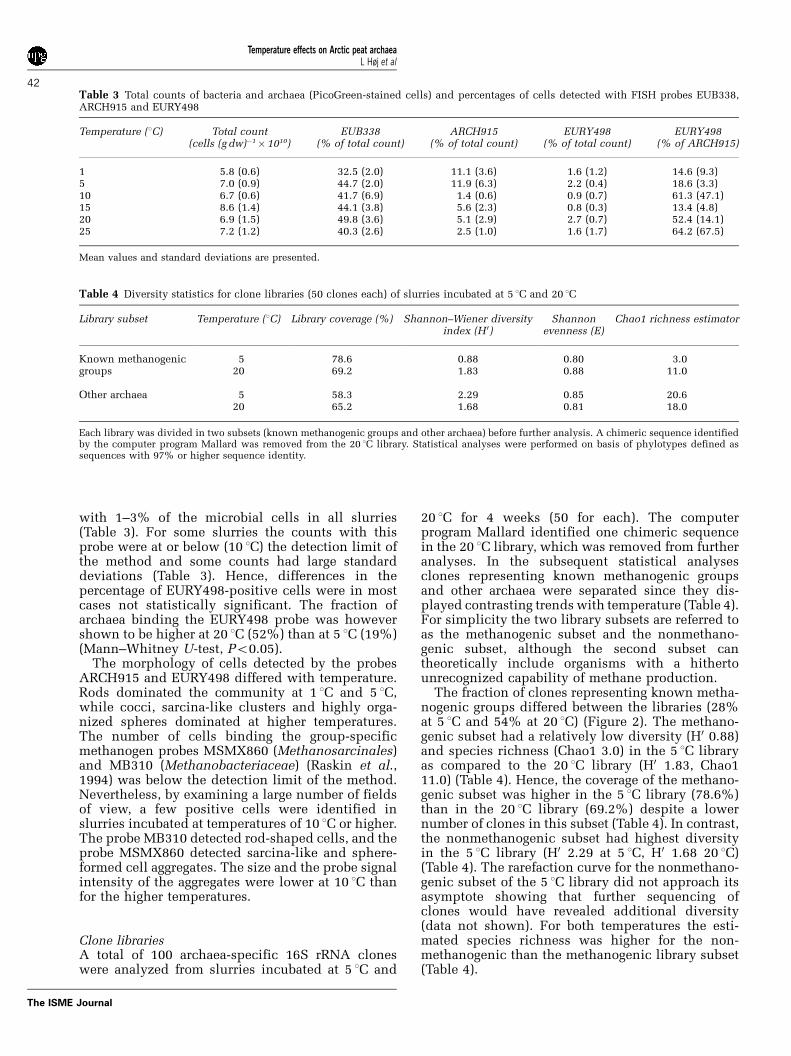
The fraction of clones representing known metha-nogenic groups differed between the libraries (28%at 5 1C and 54% at 20 1C) (Figure 2). The methano-genic subset had a relatively low diversity (H0 0.88)and species richness (Chao1 3.0) in the 5 1C libraryas compared to the 20 1C library (H0 1.83, Chao111.0) (Table 4). Hence, the coverage of the methano-genic subset was higher in the 5 1C library (78.6%)than in the 20 1C library (69.2%) despite a lowernumber of clones in this subset (Table 4). In contrast,the nonmethanogenic subset had highest diversityin the 5 1C library (H0 2.29 at 5 1C, H0 1.68 20 1C)(Table 4). The rarefaction curve for the nonmethano-genic subset of the 5 1C library did not approach itsasymptote showing that further sequencing ofclones would have revealed additional diversity(data not shown). For both temperatures the esti-mated species richness was higher for the non-methanogenic than the methanogenic library subset(Table 4).
Table 3 Total counts of bacteria and archaea (PicoGreen-stained cells) and percentages of cells detected with FISH probes EUB338,ARCH915 and EURY498
Temperature (1C) Total count(cells (g dw)!1" 1010)
EUB338(% of total count)
ARCH915(% of total count)
EURY498(% of total count)
EURY498(% of ARCH915)
1 5.8 (0.6) 32.5 (2.0) 11.1 (3.6) 1.6 (1.2) 14.6 (9.3)5 7.0 (0.9) 44.7 (2.0) 11.9 (6.3) 2.2 (0.4) 18.6 (3.3)10 6.7 (0.6) 41.7 (6.9) 1.4 (0.6) 0.9 (0.7) 61.3 (47.1)15 8.6 (1.4) 44.1 (3.8) 5.6 (2.3) 0.8 (0.3) 13.4 (4.8)20 6.9 (1.5) 49.8 (3.6) 5.1 (2.9) 2.7 (0.7) 52.4 (14.1)25 7.2 (1.2) 40.3 (2.6) 2.5 (1.0) 1.6 (1.7) 64.2 (67.5)
Mean values and standard deviations are presented.
Table 4 Diversity statistics for clone libraries (50 clones each) of slurries incubated at 5 1C and 20 1C
Library subset Temperature (1C) Library coverage (%) Shannon–Wiener diversityindex (H 0)
Shannonevenness (E)
Chao1 richness estimator
Known methanogenic 5 78.6 0.88 0.80 3.0groups 20 69.2 1.83 0.88 11.0
Other archaea 5 58.3 2.29 0.85 20.620 65.2 1.68 0.81 18.0
Each library was divided in two subsets (known methanogenic groups and other archaea) before further analysis. A chimeric sequence identifiedby the computer program Mallard was removed from the 20 1C library. Statistical analyses were performed on basis of phylotypes defined assequences with 97% or higher sequence identity.
Temperature effects on Arctic peat archaeaL Høj et al
42
The ISME Journal
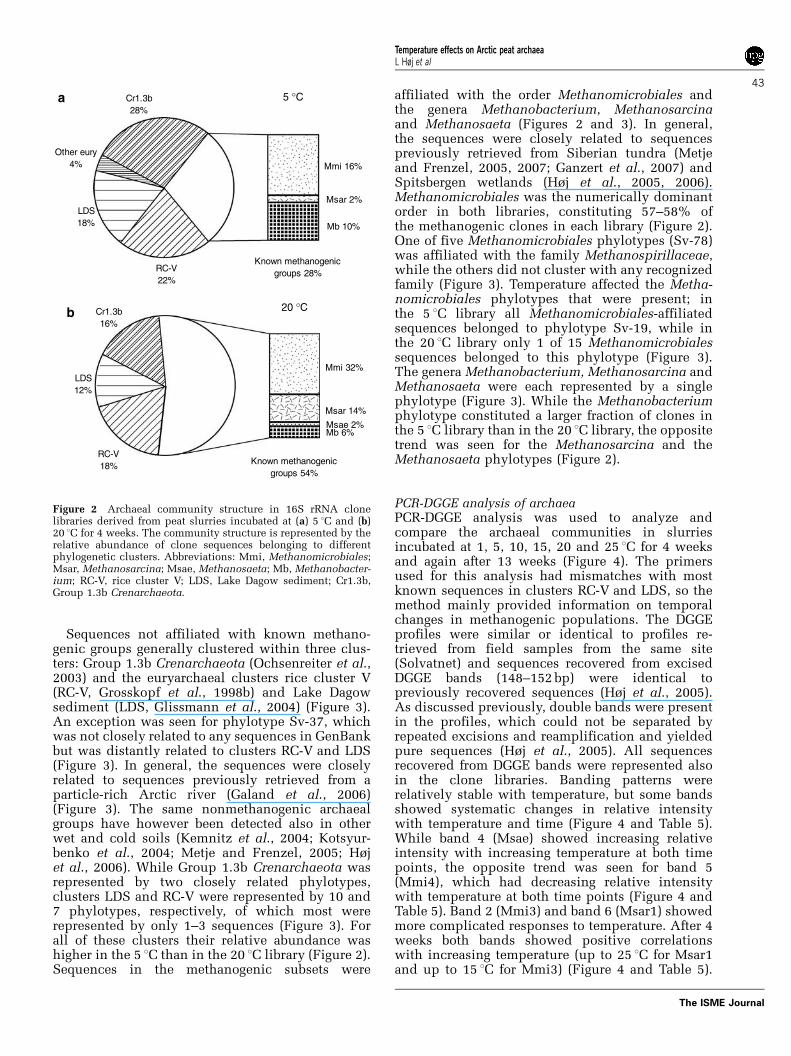
Sequences not affiliated with known methano-genic groups generally clustered within three clus-ters: Group 1.3b Crenarchaeota (Ochsenreiter et al.,2003) and the euryarchaeal clusters rice cluster V(RC-V, Grosskopf et al., 1998b) and Lake Dagowsediment (LDS, Glissmann et al., 2004) (Figure 3).An exception was seen for phylotype Sv-37, whichwas not closely related to any sequences in GenBankbut was distantly related to clusters RC-V and LDS(Figure 3). In general, the sequences were closelyrelated to sequences previously retrieved from aparticle-rich Arctic river (Galand et al., 2006)(Figure 3). The same nonmethanogenic archaealgroups have however been detected also in otherwet and cold soils (Kemnitz et al., 2004; Kotsyur-benko et al., 2004; Metje and Frenzel, 2005; Højet al., 2006). While Group 1.3b Crenarchaeota wasrepresented by two closely related phylotypes,clusters LDS and RC-V were represented by 10 and7 phylotypes, respectively, of which most wererepresented by only 1–3 sequences (Figure 3). Forall of these clusters their relative abundance washigher in the 5 1C than in the 20 1C library (Figure 2).Sequences in the methanogenic subsets were
affiliated with the order Methanomicrobiales andthe genera Methanobacterium, Methanosarcinaand Methanosaeta (Figures 2 and 3). In general,the sequences were closely related to sequencespreviously retrieved from Siberian tundra (Metjeand Frenzel, 2005, 2007; Ganzert et al., 2007) andSpitsbergen wetlands (Høj et al., 2005, 2006).Methanomicrobiales was the numerically dominantorder in both libraries, constituting 57–58% ofthe methanogenic clones in each library (Figure 2).One of five Methanomicrobiales phylotypes (Sv-78)was affiliated with the family Methanospirillaceae,while the others did not cluster with any recognizedfamily (Figure 3). Temperature affected the Metha-nomicrobiales phylotypes that were present; inthe 5 1C library all Methanomicrobiales-affiliatedsequences belonged to phylotype Sv-19, while inthe 20 1C library only 1 of 15 Methanomicrobialessequences belonged to this phylotype (Figure 3).The genera Methanobacterium, Methanosarcina andMethanosaeta were each represented by a singlephylotype (Figure 3). While the Methanobacteriumphylotype constituted a larger fraction of clones inthe 5 1C library than in the 20 1C library, the oppositetrend was seen for the Methanosarcina and theMethanosaeta phylotypes (Figure 2).
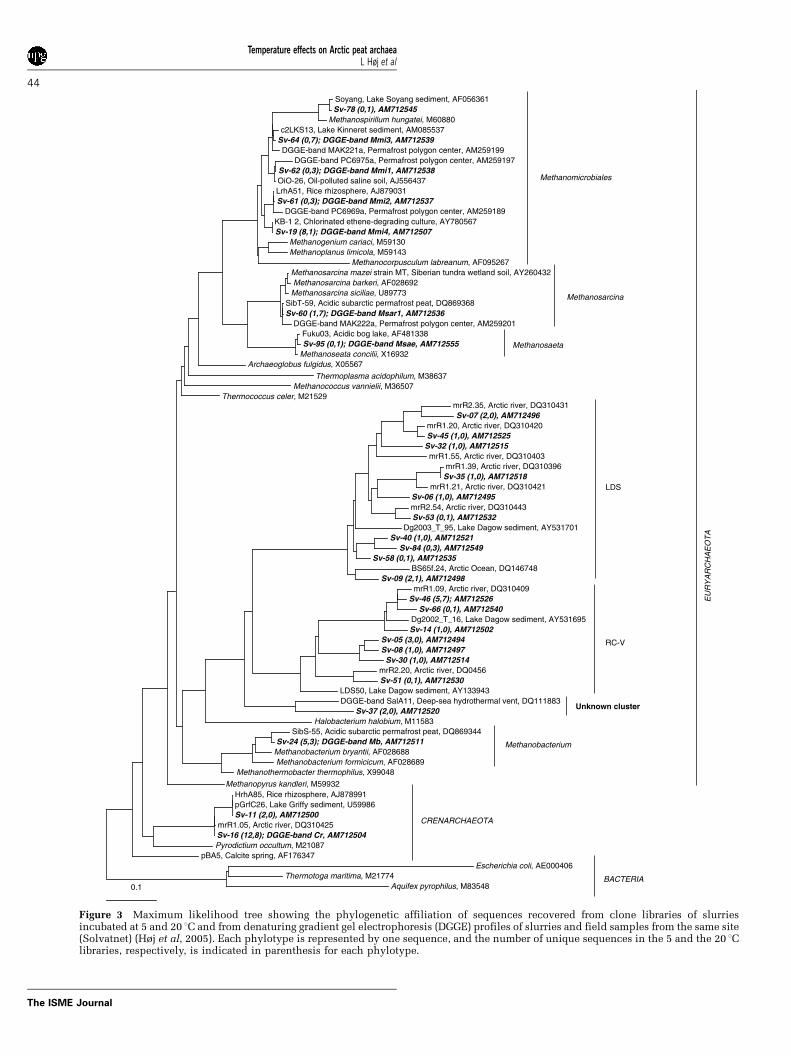
PCR-DGGE analysis of archaeaPCR-DGGE analysis was used to analyze andcompare the archaeal communities in slurriesincubated at 1, 5, 10, 15, 20 and 25 1C for 4 weeksand again after 13 weeks (Figure 4). The primersused for this analysis had mismatches with mostknown sequences in clusters RC-V and LDS, so themethod mainly provided information on temporalchanges in methanogenic populations. The DGGEprofiles were similar or identical to profiles re-trieved from field samples from the same site(Solvatnet) and sequences recovered from excisedDGGE bands (148–152bp) were identical topreviously recovered sequences (Høj et al., 2005).As discussed previously, double bands were presentin the profiles, which could not be separated byrepeated excisions and reamplification and yieldedpure sequences (Høj et al., 2005). All sequencesrecovered from DGGE bands were represented alsoin the clone libraries. Banding patterns wererelatively stable with temperature, but some bandsshowed systematic changes in relative intensitywith temperature and time (Figure 4 and Table 5).While band 4 (Msae) showed increasing relativeintensity with increasing temperature at both timepoints, the opposite trend was seen for band 5(Mmi4), which had decreasing relative intensitywith temperature at both time points (Figure 4 andTable 5). Band 2 (Mmi3) and band 6 (Msar1) showedmore complicated responses to temperature. After 4weeks both bands showed positive correlationswith increasing temperature (up to 25 1C for Msar1and up to 15 1C for Mmi3) (Figure 4 and Table 5).
RC-V18%
LDS12%
Cr1.3b16%
Mb 6%Msae 2%Msar 14%
Known methanogenicgroups 54%
Mmi 32%
RC-V22%
LDS18%
Other eury4%
Cr1.3b28%
Mmi 16%
Mb 10%
Msar 2%
Known methanogenic groups 28%
5 °C
20 °C
Figure 2 Archaeal community structure in 16S rRNA clonelibraries derived from peat slurries incubated at (a) 5 1C and (b)20 1C for 4 weeks. The community structure is represented by therelative abundance of clone sequences belonging to differentphylogenetic clusters. Abbreviations: Mmi, Methanomicrobiales;Msar, Methanosarcina; Msae, Methanosaeta; Mb, Methanobacter-ium; RC-V, rice cluster V; LDS, Lake Dagow sediment; Cr1.3b,Group 1.3b Crenarchaeota.
Temperature effects on Arctic peat archaeaL Høj et al
43
The ISME Journal
0.1
mrR2.35, Arctic river, DQ310431Sv-07 (2,0), AM712496
mrR1.20, Arctic river, DQ310420Sv-45 (1,0), AM712525Sv-32 (1,0), AM712515mrR1.55, Arctic river, DQ310403
mrR1.39, Arctic river, DQ310396Sv-35 (1,0), AM712518
mrR1.21, Arctic river, DQ310421Sv-06 (1,0), AM712495mrR2.54, Arctic river, DQ310443Sv-53 (0,1), AM712532
Dg2003_T_95, Lake Dagow sediment, AY531701Sv-40 (1,0), AM712521
Sv-84 (0,3), AM712549Sv-58 (0,1), AM712535
BS65f.24, Arctic Ocean, DQ146748Sv-09 (2,1), AM712498
mrR1.09, Arctic river, DQ310409Sv-46 (5,7); AM712526
Sv-66 (0,1), AM712540Dg2002_T_16, Lake Dagow sediment, AY531695Sv-14 (1,0), AM712502
Sv-05 (3,0), AM712494Sv-08 (1,0), AM712497
Sv-30 (1,0), AM712514mrR2.20, Arctic river, DQ0456Sv-51 (0,1), AM712530
LDS50, Lake Dagow sediment, AY133943DGGE-band SalA11, Deep-sea hydrothermal vent, DQ111883
Sv-37 (2,0), AM712520 Halobacterium halobium, M11583
SibS-55, Acidic subarctic permafrost peat, DQ869344Sv-24 (5,3); DGGE-band Mb, AM712511
Methanobacterium bryantii, AF028688Methanobacterium formicicum, AF028689
Methanothermobacter thermophilus, X99048
Soyang, Lake Soyang sediment, AF056361Sv-78 (0,1), AM712545
Methanospirillum hungatei, M60880c2LKS13, Lake Kinneret sediment, AM085537
Sv-64 (0,7); DGGE-band Mmi3, AM712539 DGGE-band MAK221a, Permafrost polygon center, AM259199
DGGE-band PC6975a, Permafrost polygon center, AM259197Sv-62 (0,3); DGGE-band Mmi1, AM712538 OiO-26, Oil-polluted saline soil, AJ556437LrhA51, Rice rhizosphere, AJ879031Sv-61 (0,3); DGGE-band Mmi2, AM712537
DGGE-band PC6969a, Permafrost polygon center, AM259189KB-1 2, Chlorinated ethene-degrading culture, AY780567Sv-19 (8,1); DGGE-band Mmi4, AM712507
Methanogenium cariaci, M59130Methanoplanus limicola, M59143
Methanocorpusculum labreanum, AF095267Methanosarcina mazei strain MT, Siberian tundra wetland soil, AY260432Methanosarcina barkeri, AF028692
Methanosarcina siciliae, U89773SibT-59, Acidic subarctic permafrost peat, DQ869368Sv-60 (1,7); DGGE-band Msar1, AM712536
DGGE-band MAK222a, Permafrost polygon center, AM259201Fuku03, Acidic bog lake, AF481338Sv-95 (0,1); DGGE-band Msae, AM712555
Methanoseata concilii, X16932Archaeoglobus fulgidus, X05567
Thermoplasma acidophilum, M38637Methanococcus vannielii, M36507
Thermococcus celer, M21529
Methanopyrus kandleri, M59932 HrhA85, Rice rhizosphere, AJ878991pGrfC26, Lake Griffy sediment, U59986Sv-11 (2,0), AM712500
mrR1.05, Arctic river, DQ310425Sv-16 (12,8); DGGE-band Cr, AM712504 Pyrodictium occultum, M21087
pBA5, Calcite spring, AF176347Escherichia coli, AE000406
Thermotoga maritima, M21774Aquifex pyrophilus, M83548
LDS
RC-V
Methanomicrobiales
Methanosarcina
Methanosaeta
Methanobacterium
EU
RY
AR
CH
AE
OT
A
CRENARCHAEOTA
BACTERIA
Unknown cluster
Figure 3 Maximum likelihood tree showing the phylogenetic affiliation of sequences recovered from clone libraries of slurriesincubated at 5 and 20 1C and from denaturing gradient gel electrophoresis (DGGE) profiles of slurries and field samples from the same site(Solvatnet) (Høj et al, 2005). Each phylotype is represented by one sequence, and the number of unique sequences in the 5 and the 20 1Clibraries, respectively, is indicated in parenthesis for each phylotype.
Temperature effects on Arctic peat archaeaL Høj et al
44
The ISME Journal

In contrast, there was no longer a direct correlationwith temperature for these bands (P40.05) after 13weeks but their relative intensity was higher at low(1–10 1C) as compared to high (15–25 1C) tempera-tures (Student’s t-test, Po0.05, Figure 4).
Discussion
This study showed that temperature affected boththe diversity and structure of archaeal communitiesin unamended slurries of high Arctic peat fromSolvatnet (Spitsbergen), with contrasting effectsseen for known methanogenic groups and otherarchaea. A polyphasic approach demonstrated thatafter 4 weeks of incubation, 10 1C was an importanttemperature for the selection of different archaealpopulations. At lower temperatures the archaealcommunity was dominated by nonmethano-genic groups, while methanogenic groups showed
increased diversity and relative abundance at highertemperatures. This was in accordance with increas-ing methane production rates with increasingtemperature.
After incubation for 4 weeks at 1 1C and 5 1C thearchaeal community in Solvatnet peat was relativelyabundant, representing 11–12% of the total count,or 20–25% of all cells detected by FISH. This highabundance of archaea at low temperatures is inaccordance with previous field studies of coldenvironments such as Siberian tundra soil (Kobabeet al. 2004), and marine plankton in Antarcticwaters (Murray et al, 1998) and the Beaufort Sea(Wells and Deming, 2003; Garneau et al., 2006).FISH demonstrated that at these temperatures mostof the archaeal cells had rod morphology, whileclone libraries showed that at 5 1C the communitywas dominated by Group 1.3b Crenarchaeaota andthe euryarchaeal clusters RC-V and LDS. Whileprevious studies have not specifically targeted theecophysiology of these groups, it has been shownthat Group 1.3b Crenarchaeota is relatively abun-dant in permanently flooded or wet soils fromSpitsbergen (Høj et al., 2006), and that in temperatesoils this groups is relatively more abundant duringwinter (Kemnitz et al., 2004). Since the absoluteabundance of archaea dropped significantly at 10 1C,this study indicated that some archaeal populationsin Solvatnet peat had a competitive advantage inslurries incubated at 1 and 5 1C for 4 weeks. It is notknown which physiological attributes that rendersthis advantage, as populations that are well adaptedto low temperatures do not necessarily have a lowoptimum temperature for growth (Cavicchioli,2006). It is intriguing however that a similar dropin the number of archaea at 10 1C was reported alsofor acidic peat from Northern Finland (Metje andFrenzel, 2005), suggesting that 10 1C may be animportant temperature for selection of differentarchaeal populations in Arctic soils.
The methanogenic community in slurries ofSolvatnet peat was diverse and included membersof the order Methanomicrobiales, and the generaMethanobacterium, Methanosarcina and Methano-saeta, in accordance with field studies from thesame site (Høj et al., 2005). Group-specific FISHprobes identified a few methanogenic archaea inslurries incubated at 10 1C and above. The signal
1-Cr*2-Mmi33-Mb4-Msae
5-Mmi46-Msar1
Week 4 Week 13
1 5 10 15 20 25 1 5 10 15 20 25
5
23
6
1
4
Figure 4 DGGE profiles of archaeal 16S rRNA genes amplifiedfrom Solvatnet peat slurries in weeks 4 and 13. Bands marked inthe gel were successfully sequenced. The bar on the right shows aschematic diagram of the identified DGGE bands, with doublebands indicated. Double bands could not be separated by repeatedexcisions and reamplification, and they yielded pure sequences.A sequence was successfully obtained for the band labeled * inour previous study (Mmi1) (Høj et al., 2005) though a sequencewas not recovered in the present study. The band labels areconsistent with this previous study of field samples fromSolvatnet (Cr, Crenarchaeota, Mmi1, Mmi3, Mmi4, Methanomi-crobiales; Mb, Methanobacterium; Msae, Methanosaeta; Msar1,Methanosarcina).
Table 5 Correlations with temperature for relative DGGE band intensities
Band Affiliation Week Temperature range (1C) Correlationa
2 (Mmi3) Methanomicrobiales 4 1–15 0.9563 (Po0.05)4 (Msae) Methanosaeta 4 1–25 0.9351 (Po0.01)
13 1–20 0.9655 (Po0.01)5 (Mmi4) Methanomicrobiales 4 1–25 !0.9614 (Po0.01)
13 1–25 !0.9534 (Po0.01)6 (Msar1) Methanosarcina 4 1–25 0.9176 (P$ 0.01)
aPearson’s product moment correlation.
Temperature effects on Arctic peat archaeaL Høj et al
45
The ISME Journal

intensity from positive cells and the size of cellaggregates were generally lower at 10 1C than athigher temperatures, in accordance with relativelylow methane production rates in this slurry(o0.2 mmol CH4 (g dw)!1 per day). Although theoverall diversity and relative abundance of metha-nogenic archaea increased with temperature,individual methanogenic populations showed dif-ferences in their temperature response. While somepopulations showed little or no response to tempera-ture, other populations showed systematic changesin their relative abundance with temperature andtime. This was reflected in clone libraries constructedfor slurries incubated at 5 1C and 20 1C for 4 weeks,but was more clearly showed by trends in the DGGEprofiles obtained for all slurries (1–25 1C) at two timepoints (4 and 13 weeks). Since the same inoculumwas used for all slurries and all samples wereprocessed in parallel, it could be assumed thatchanges in relative intensities of DGGE bands wererobust. In addition, for samples where both DGGEprofiles and clone library data were available, the twomethods, which depended on different primer sets,generally showed consistent trends.
The Methanosaeta population Sv-95 (Msae) in-creased in relative abundance with increasingtemperature at both time points, in accordance witha previous study of unamended rice soil slurries(Fey and Conrad, 2000). In contrast, one of theMethanomicrobiales populations (Sv-19, Mmi4) hadan apparent competitive advantage at low tempera-tures, suggesting that it was well adapted to theconditions prevailing in slurries incubated at lowtemperatures. This trend was supported both bydifferences in clone frequencies in the two clonelibraries and by DGGE profiles at both time points.Again, it is unknown which traits that give thispopulation a competitive advantage at low tempera-ture as proteomics studies of the cold-adaptedmethanogen Methanococcoides burtonii have iden-tified a range of cellular processes that are importantfor cold adaptation (Cavicchioli, 2006). DGGEprofiles after 13 weeks incubation showed that theMethanomicrobiales population Sv-64 (Mmi3) andthe Methanosarcina population Sv-60 (Msar1) couldalso grow at temperatures as low as 1 1C despitehaving relatively low abundance after 4 weeks, andafter 13 weeks their relative abundance was highestat the temperatures (1–10 1C) (Student’s t-test,Po0.05). The temporal change in their temperatureresponse suggested that their relative abundancewas controlled indirectly rather than directly bytemperature. Since the transient accumulation of atleast two fatty acids (acetate and propionate) wasalso delayed at low temperatures, it can be hypothe-sized that the observed indirect effect of temperaturecould be related to the availability of substrates orgrowth factors. This study was however not de-signed to elucidate the exact mechanism behindindirect temperature effects, and no direct link to aspecific fatty acid could be demonstrated.
The results from this study are in accordance withprevious studies of rice soil slurries (Chin et al.,1999a, b; Fey and Conrad, 2000), which also showedchanges in the archaeal community structure withtemperature. In contrast, no significant temperature-induced changes in the archaeal community struc-ture were observed in acidic peat from NorthernFinland (Metje and Frenzel, 2005) or from Siberia(Metje and Frenzel, 2007), where Methanobacter-iales only, or Methanobacteriales and Methanosar-cinales, respectively, were predominant at allincubation temperatures. We note that the stimulat-ing effect of temperature on methane productionrates was higher for Solvatnet peat than reported forthe acidic peat from Northern Finland (Metje andFrenzel, 2005) and from Siberia (Metje and Frenzel,2007), but it is unknown whether this can be linkedto differences in the temperature characteristics ofthe methanogenic communities. So far, no studieshave been able to link methane emissions ormethane production rates to the archaeal diversityand community composition (Høj et al., 2005;Ganzert et al., 2007).
In conclusion, this study demonstrated contrastingeffects of temperature on knownmethanogenic archaeaand other archaea present in peat from the high Arcticwetland Solvatnet, Spitsbergen. The diversity andrelative abundance of nonmethanogenic archaealgroups were highest at low temperature, and at leastsome members of Group 1.3b Crenarchaeota, and theeuryarchaeal clusters RC-Vand LDS appeared to have acompetitive advantage at low temperatures. The overalldiversity and relative abundance of methanogenicarchaea increased with increasing temperature, inconsistency with a strong stimulation of methaneproduction rates. Nevertheless, individual methano-genic populations showed differences in their tem-perature response. While the relative abundance ofsome populations showed the same temperature trend(increase or decrease) after both 4 and 13 weeks, therelative abundance of other populations was controlledby indirect effects or did not respond to temperature.
Acknowledgements
We thank Ingvild Wartiainen and Lars Egil Haugen forcollaboration in the field. This work was funded by TheNorwegian Research Council (Grant 121458/720) and bygrants from Meltzers høyskolefond and Bergen Myrdyr-kningsforenings fond to LH. The Norwegian Polar Instituteis acknowledged for financial support of the fieldwork.
References
Amann RI, Binder BJ, Olson RJ, Chisholm SW, DevereuxR, Stahl DA. (1990). Combination of 16S ribosomalRNA targeted oligonucleotide probes with flow-cyto-metry for analyzing mixed microbial populations.Appl Environ Microbiol 56: 1919–1925.
Temperature effects on Arctic peat archaeaL Høj et al
46
The ISME Journal
Anisimov O, Fitzharris B. (2001). Polar regions (Arctic andAntarctic). In: McCarthy JJ, Canziani OF, Leary NA,Dokken DJ, White KS (eds). Intergovernmental Panelon Climate Change Climate Change 2001: Impacts,Adaptation, and Vulnerability. Cambridge UniversityPress: Cambridge, pp 801–841.
Ashelford K, Chuzhanova N, Fry J, Jones A, Weightman A.(2006). New screening software shows that mostrecent large 16S rRNA gene clone libraries containchimeras. Appl Environ Microbiol 72: 5734–5741.
Bano N, Ruffin S, Ransom B, Hollibaugh J. (2004).Phylogenetic composition of Arctic Ocean archaealassemblages and comparison with antarctic assem-blages. Appl Environ Microbiol 70: 781–789.
Burggraf S, Mayer T, Amann R, Schadhauser S, Woese CR,Stetter KO. (1994). Identifying members of the domainArchaea with ribosomal-RNA-targeted oligonucleo-tide probes. Appl Environ Microbiol 60: 3112–3119.
Cavicchioli R. (2006). Cold-adapted archaea. Nat RevMicrobiol 4: 331–343.
Chin K-J, Lukow T, Conrad R. (1999a). Effect of tempera-ture on structure and function of the methanogenicarchaeal community in an anoxic rice field soil.Appl Environ Microbiol 65: 2341–2349.
Chin K-J, Lukow T, Stubner S, Conrad R. (1999b).Structure and function of the methanogenic archaealcommunity in stable cellulose-degrading enrichmentcultures at two different temperatures (15 and 301C).FEMS Microbiol Ecol 30: 313–326.
Christensen TR, Ekberg A, Strom L, Mastepanov M,Panikov N, Oquist M et al. (2003). Factors controllinglarge scale variations in methane emissions fromwetlands. Geophys Res Lett 30: Art. No. 1414.
Church MJ, DeLong EF, Ducklow HW, Karner MB, PrestonCM, Karl DM. (2003). Abundance and distribution ofplanktonic Archaea and Bacteria in the waters westof the Antarctic Peninsula. Limnol Oceanogr 48:1893–1902.
Clymo RS. (1983). Peat. In: Gore AJP (ed). Mires: Swamp,Bog, Fen and Moor. Elsevier Scientific PublishingCompany: Amsterdam, The Netherlands, pp 159–224.
DeLong EF, Wu KY, Prezelin BB, Jovine RVM. (1994). Highabundance of Archaea in Antarctic marine picoplank-ton. Nature 371: 695–697.
Dunfield P, Knowles R, Dumont R, Moore TR. (1993).Methane production and consumption in temperateand subarctic peat soils: response to temperature andpH. Soil Biol Biochem 25: 321–326.
Fægri A, Torsvik V, Goksøyr J. (1977). Bacterial and fungalactivities in soil: separation of bacteria and fungi by arapid fractionated centrifugation technique. Soil BiolBiochem 9: 105–112.
Fey A, Claus P, Conrad R. (2004). Temporal change of 13C-isotope signatures and methanogenic pathways in ricefield soil incubated anoxically at different tempera-tures. Geochim Cosmochim Acta 68: 293–306.
Fey A, Conrad R. (2000). Effect of temperature on carbonand electron flow and on the archaeal community inmethanogenic rice field soil. Appl Environ Microbiol66: 4790–4797.
Galand PE, Lovejoy C, Vincent WF. (2006). Remarkablydiverse and contrasting archaeal communities in alarge arctic river and the coastal Arctic Ocean. AquatMicrob Ecol 44: 115–126.
Ganzert L, Jurgens G, Munster U, Wagner D. (2007).Methanogenic communities in permafrost-affectedsoils of the Laptev Sea Coast, Siberian Arctic,
characterized by 16S rRNA gene fingerprints. FEMSMicrobiol Ecol 59: 476–488.
Garneau ME, Vincent WF, Alonso-Saez L, Gratton Y,Lovejoy C. (2006). Prokaryotic community structureand heterotrophic production in a river-influencedcoastal arctic ecosystem. Aquat Microb Ecol 42: 27–40.
Glissmann K, Chin KJ, Casper P, Conrad R. (2004).Methanogenic pathway and archaeal communitystructure in the sediment of eutrophic Lake Dagow:effect of temperature. Microb Ecol 48: 389–399.
Glockner F, Fuchs B, Amann R. (1999). Bacterioplanktoncompositions of lakes and oceans: a first comparisonbased on fluorescence in situ hybridization. ApplEnviron Microbiol 65: 3721–3726.
Grosskopf R, Janssen PH, Liesack W. (1998b). Diversityand structure of the methanogenic community inanoxic rice paddy soil microcosms as examined bycultivation and direct 16S rRNA gene sequenceretrieval. Appl Environ Microbiol 64: 960–969.
Grosskopf R, Stubner S, Liesack W. (1998a). Noveleuryarchaeotal lineages detected on rice roots and inthe anoxic bulk soil of flooded rice microcosms. ApplEnviron Microbiol 64: 4983–4989.
Høj L, Olsen RA, Torsvik VL. (2005). Archaeal commu-nities in High Arctic wetlands at Spitsbergen, Norway(781N) as characterized by 16S rRNA gene fingerprint-ing. FEMS Microbiol Ecol 53: 89–101.
Høj L, Rusten M, Haugen LE, Olsen RA, Torsvik VL.(2006). Effects of water regime on archaeal communitycomposition in Arctic soils. Environ Microbiol 8:984–996.
Jurgens G, Glockner FO, Amann R, Saano A, Montonen L,Likolammi M et al. (2000). Identification of novelArchaea in bacterioplankton of a boreal forest lake byphylogenetic analysis and fluorescent in situ hybridi-zation. FEMS Micobiol Ecol 34: 45–56.
Kemnitz D, Chin KJ, Bodelier P, Conrad R. (2004).Community analysis of methanogenic archaea withina riparian flooding gradient. Environ Microbiol 6:449–461.
Kirchman D, Elifantz H, Dittel A, Malmstrom R, CottrellM. (2007). Standing stocks and activity of Archaea andBacteria in the western Arctic Ocean. Limnol Ocea-nogr 52: 495–507.
Kobabe S, Wagner D, Pfeiffer EM. (2004). Characterisationof microbial community composition of a Siberiantundra soil by fluorescence in situ hybridisation.FEMS Microbiol Ecol 50: 13–23.
Kotsyurbenko OR, Chin KJ, Glagolev MV, Stubner S,Simankova MV, Nozhevnikova AN et al. (2004).Acetoclastic and hydrogenotrophic methane produc-tion and methanogenic populations in an acidic West-Siberian peat bog. Environ Microbiol 6: 1159–1173.
Kotsyurbenko OR, Nozhevnikova AN, Soloviova TI,Zavarzin GA. (1996). Methanogenesis at low tempera-tures by microflora of tundra wetland soil. AntonLeeuw Int J G 69: 75–86.
Metje M, Frenzel P. (2005). Effect of temperature onanaerobic ethanol oxidation and methanogenesis inacidic peat from a northern wetland. Appl EnvironMicrobiol 71: 8191–8200.
Metje M, Frenzel P. (2007). Methanogenesis and methano-genic pathways in a peat from subarctic permafrost.Environ Microbiol 9: 954–964.
Murray AE, Preston CM, Massana R, Taylor LT, Blakis A,Wu K et al. (1998). Seasonal and spatial variability ofbacterial and archaeal assemblages in the coastal
Temperature effects on Arctic peat archaeaL Høj et al
47
The ISME Journal
waters near Anvers Island, Antarctica. Appl EnvironMicrobiol 64: 2585–2595.
Nakatsu CH, Torsvik V, Øvreas L. (2000). Soil communityanalysis using DGGE of 16S rDNA polymerase chainreaction products. Soil Sci Soc Am J 64: 1382–1388.
Noble RT, Fuhrman JA. (1998). Use of SYBR Green I forrapid epifluorescence counts of marine viruses andbacteria. Aquat Microb Ecol 14: 113–118.
Ochsenreiter T, Selezi D, Quaiser A, Bonch-OsmolovskayaL, Schleper C. (2003). Diversity and abundance ofCrenarchaeota in terrestrial habitats studied by 16SRNA surveys and real time PCR. Environ Microbiol 5:787–797.
Pernthaler J, Glockner F-O, Schonhuber W, Amann R.(2001). Fluorescence in situ hybridization (FISH)with rRNA-targeted oligonucleotide probes. MethMicrobiol 30: 207–226.
Porter KC, Feig YS. (1980). The use of DAPI for identifyingand counting aquatic microflora. Limnol Oceanogr 25:943–948.
Raskin L, Stromley JM, Rittmann BE, Stahl DA. (1994).Group-specific 16S rRNA hybridization probes todescribe natural communities of methanogens. ApplEnviron Microbiol 60: 1232–1240.
Svensson BH. (1984). Different temperature optima formethane formation when enrichments from acid peatare supplemented with acetate or hydrogen. ApplEnviron Microbiol 48: 389–394.
van Hulzen JB, Segers R, van Bodegom PM, Leffelaar PA.(1999). Temperature effects on soil methane produc-tion: an explanation for observed variability. Soil BiolBiochem 31: 1919–1929.
Wallner G, Amann R, Beisker W. (1993). Optimizingfluorescent in situ hybridization with rRNA-targetedoligonucleotide probes for flow cytometric identifica-tion of microorganisms. Cytometry 14: 136–143.
Weinbauer M, Beckmann C, Hofle M. (1998). Utility ofgreen fluorescent nucleic acid dyes and aluminumoxide membrane filters for rapid epifluorescenceenumeration of soil and sediment bacteria. ApplEnviron Microbiol 64: 5000–5003.
Wells LE, Deming JW. (2003). Abundance of bacteria, thecytophaga-flavobacterium cluster and archaea in coldoligotrophic waters and nepheloid layers of thenorthwest passage, canadian archipelago. Aquat Mi-crob Ecol 31: 19–31.
Wilhelm E, Battino R, Wilcock R. (1977). Low-pressuresolubility of gases in liquid water.Chem Rev 77: 219–262.
Temperature effects on Arctic peat archaeaL Høj et al
48
The ISME Journal
Copyright © 2022 FDOKUMEN