Effects of Superpave Restricted Zone on Permanent ...
136
EFFECTS OF SUPERPAVE RESTRICTED ZONE ON PERMANENT DEFORMATION by Arif Chowdhury Engineering Research Associate Texas Transportation Institute Joe W. Button Senior Research Engineer Texas Transportation Institute and Jose D. C. Grau Graduate Research Assistant Texas Transportation Institute Report No. 201-2 Project No. ICAR 201 Research Project Title: Evaluation of Superpave Aggregate Specifications Sponsored by the International Center for Aggregate Research May 2001 TEXAS TRANSPORTATION INSTITUTE The Texas A&M University System College Station, Texas 77843-3135
-
Upload
khangminh22 -
Category
Documents
-
view
3 -
download
0
Transcript of Effects of Superpave Restricted Zone on Permanent ...

EFFECTS OF SUPERPAVE RESTRICTED ZONE ON
PERMANENT DEFORMATION
by
Arif ChowdhuryEngineering Research AssociateTexas Transportation Institute
Joe W. ButtonSenior Research Engineer
Texas Transportation Institute
and
Jose D. C. GrauGraduate Research Assistant
Texas Transportation Institute
Report No. 201-2
Project No. ICAR 201
Research Project Title: Evaluation of Superpave Aggregate Specifications
Sponsored by the
International Center for Aggregate Research
May 2001
TEXAS TRANSPORTATION INSTITUTE
The Texas A&M University System
College Station, Texas 77843-3135

ii
ABSTRACT
The purpose of this study is to evaluate the restricted zone effect using four different
aggregates: crushed granite, crushed limestone, crushed river gravel, and a mixture of crushed
river gravel as coarse aggregate with natural fines. As the restricted zone is a component of
Superpave, the blends prepared met most of the Superpave criteria, except the restricted zone
in selected mixtures and fine aggregate angularity in three mixtures. Each type of aggregate
was used for mixture design of three gradations: above, through, and below the restricted zone.
The twelve mixtures designed were tested in the laboratory to evaluate their relative resistance
to permanent deformation. Four types of tests were performed using Superpave equipment:
simple shear at constant height, frequency sweep at constant height, repeated shear at constant
stress ratio, and repeated shear at constant height. Rutting resistance of the mixtures was
measured using the Asphalt Pavement Analyzer.
Researchers found that there is no relationship between the restricted zone and
permanent deformation when crushed aggregates are used in the mixture design. Superpave
mixtures with gradations below the restricted zone were generally most susceptible to
permanent deformation while mixtures above the restricted zone were least susceptible to
permanent deformation. Recommendations include elimination of the restricted zone from
HMA design specifications.

iii
DISCLAIMER
The contents of this report reflect the views of the authors, who are responsible for the
facts and the accuracy of the data presented herein. The contents do not necessarily reflect the
official view or policies of the International Center of Aggregate Research (ICAR), Texas
Transportation Institute (TTI) or Texas A&M University. The report does not constitute a
standard, specification, or regulation, nor is it intended for construction, bidding, or permit
purposes.

iv
ACKNOWLEDGMENTS
The financial support of this research project by the Aggregates Foundation for
Technology, Research, and Education (AFTRE) is gratefully acknowledged.
Mr. David Jahn of Martin Marietta Technologies served as the primary technical contact
for the AFTRE. His guidance and advice were instrumental in developing and successfully
completing this project.
Special thanks are extended to Vulcan Materials Company, Martin Marietta
Technologies, and Fordyce Materials Company for providing several hundred pounds of
aggregates at no cost to the project. Koch Materials, Inc. graciously supplied the asphalt for
this project.

v
TABLE OF CONTENTS
Page
ABSTRACT . . . . . . . . . . . . . . . . . . . . . . . . . . . . . . . . . . . . . . . . . . . . . . . . . . . . . . . . . . . . . ii
DISCLAIMER . . . . . . . . . . . . . . . . . . . . . . . . . . . . . . . . . . . . . . . . . . . . . . . . . . . . . . . . . . . iii
ACKNOWLEDGMENTS . . . . . . . . . . . . . . . . . . . . . . . . . . . . . . . . . . . . . . . . . . . . . . . . . . iv
TABLE OF CONTENTS . . . . . . . . . . . . . . . . . . . . . . . . . . . . . . . . . . . . . . . . . . . . . . . . . . . v
LIST OF FIGURES . . . . . . . . . . . . . . . . . . . . . . . . . . . . . . . . . . . . . . . . . . . . . . . . . . . . . . viii
LIST OF TABLES . . . . . . . . . . . . . . . . . . . . . . . . . . . . . . . . . . . . . . . . . . . . . . . . . . . . . . . . x
CHAPTER 1 INTRODUCTION . . . . . . . . . . . . . . . . . . . . . . . . . . . . . . . . . . . . . . . . . . . . 1
1.1 GENERAL . . . . . . . . . . . . . . . . . . . . . . . . . . . . . . . . . . . . . . . . . . . . . . . . . . 1
1.2 PROBLEM STATEMENT . . . . . . . . . . . . . . . . . . . . . . . . . . . . . . . . . . . . . 2
1.3 OBJECTIVES OF STUDY . . . . . . . . . . . . . . . . . . . . . . . . . . . . . . . . . . . . . 3
1.4 ORGANIZATION OF REPORT . . . . . . . . . . . . . . . . . . . . . . . . . . . . . . . . . 4
CHAPTER 2 PERMANENT DEFORMATION . . . . . . . . . . . . . . . . . . . . . . . . . . . . . . . . 7
2.1 GENERAL . . . . . . . . . . . . . . . . . . . . . . . . . . . . . . . . . . . . . . . . . . . . . . . . . . 7
2.2 WHEEL PATH RUTTING . . . . . . . . . . . . . . . . . . . . . . . . . . . . . . . . . . . . . 7
2.3 RUTTING CHARACTERIZATION . . . . . . . . . . . . . . . . . . . . . . . . . . . . . . 8
2.3.1 Aggregates . . . . . . . . . . . . . . . . . . . . . . . . . . . . . . . . . . . . . . . . . . . . . . . . . . 9
2.3.2 Aggregate Gradation . . . . . . . . . . . . . . . . . . . . . . . . . . . . . . . . . . . . . . . . . . 9
2.3.3 Fine Aggregates . . . . . . . . . . . . . . . . . . . . . . . . . . . . . . . . . . . . . . . . . . . . . 10
2.3.4 Coarse Aggregates . . . . . . . . . . . . . . . . . . . . . . . . . . . . . . . . . . . . . . . . . . . 11
2.3.5 Filler . . . . . . . . . . . . . . . . . . . . . . . . . . . . . . . . . . . . . . . . . . . . . . . . . . . . . . 12
2.4 SPECIFICATIONS TO REDUCE RUTTING . . . . . . . . . . . . . . . . . . . . . 13
2.5 RECENT STUDIES ON SUPERPAVE RESTRICTED ZONE . . . . . . . . 13

vi
Page
CHAPTER 3 EXPERIMENTAL PROGRAM . . . . . . . . . . . . . . . . . . . . . . . . . . . . . . . . . 21
3.1 PLAN OF STUDY . . . . . . . . . . . . . . . . . . . . . . . . . . . . . . . . . . . . . . . . . . . 21
3.2 MATERIALS SELECTION AND ACQUISITION . . . . . . . . . . . . . . . . . 23
3.3 TESTS FOR ASPHALT CEMENT CHARACTERIZATION . . . . . . . . . 24
3.3.1 Dynamic Shear Rheometer, DSR . . . . . . . . . . . . . . . . . . . . . . . . . . . . . . . . 24
3.3.2 Bending Beam Rheometer, BBR . . . . . . . . . . . . . . . . . . . . . . . . . . . . . . . . 25
3.3.3 Direct Tension Tester, DTT . . . . . . . . . . . . . . . . . . . . . . . . . . . . . . . . . . . . 26
3.3.4 Rotational Viscometer, RV . . . . . . . . . . . . . . . . . . . . . . . . . . . . . . . . . . . . 26
3.3.5 Mixing and Compaction Temperature . . . . . . . . . . . . . . . . . . . . . . . . . . . . 26
3.4 TESTS FOR AGGREGATE CHARACTERIZATION . . . . . . . . . . . . . . 27
3.4.1 Coarse Aggregate Angularity (CAA) . . . . . . . . . . . . . . . . . . . . . . . . . . . . . 27
3.4.2 Fine Aggregate Angularity (FAA) . . . . . . . . . . . . . . . . . . . . . . . . . . . . . . . 29
3.4.3 Flat and Elongated Particles (F&E) . . . . . . . . . . . . . . . . . . . . . . . . . . . . . . 30
3.4.4 Clay Content . . . . . . . . . . . . . . . . . . . . . . . . . . . . . . . . . . . . . . . . . . . . . . . 30
3.4.5 Specific Gravity . . . . . . . . . . . . . . . . . . . . . . . . . . . . . . . . . . . . . . . . . . . . . 32
3.5 SUPERPAVE MIXTURE DESIGN . . . . . . . . . . . . . . . . . . . . . . . . . . . . . 33
3.5.1 Aggregate Blends . . . . . . . . . . . . . . . . . . . . . . . . . . . . . . . . . . . . . . . . . . . . 34
3.5.2 Preparation of Mixtures . . . . . . . . . . . . . . . . . . . . . . . . . . . . . . . . . . . . . . . 36
3.5.3 Compaction . . . . . . . . . . . . . . . . . . . . . . . . . . . . . . . . . . . . . . . . . . . . . . . . 36
3.5.4 Volumetric Analysis . . . . . . . . . . . . . . . . . . . . . . . . . . . . . . . . . . . . . . . . . 37
3.5.5 Design Asphalt Content . . . . . . . . . . . . . . . . . . . . . . . . . . . . . . . . . . . . . . . 39
3.6 TESTS FOR ASPHALT CONCRETE EVALUATION . . . . . . . . . . . . . . 40
CHAPTER 4 EVALUATING SUPERPAVE MIXTURES . . . . . . . . . . . . . . . . . . . . . . 43
4.1 SUPERPAVE SHEAR TESTER (SST) . . . . . . . . . . . . . . . . . . . . . . . . . . 43
4.2 PERFORMANCE TESTS . . . . . . . . . . . . . . . . . . . . . . . . . . . . . . . . . . . . . 43
4.3 SPECIMEN PREPARATION AND INSTRUMENTATION . . . . . . . . . . 45
4.4 FREQUENCY SWEEP AT CONSTANT HEIGHT . . . . . . . . . . . . . . . . . 48

vii
Page
4.4.1 Dynamic Shear Modulus (G*) and m-values . . . . . . . . . . . . . . . . . . . . . . . 48
4.4.2 Shear Phase Angle . . . . . . . . . . . . . . . . . . . . . . . . . . . . . . . . . . . . . . . . . . . 58
4.4.3 G*/sin δ Ratio . . . . . . . . . . . . . . . . . . . . . . . . . . . . . . . . . . . . . . . . . . . . . . 63
4.5 SIMPLE SHEAR TEST AT CONSTANT HEIGHT, SSCH . . . . . . . . . . 69
4.5.1 Maximum Shear Strain . . . . . . . . . . . . . . . . . . . . . . . . . . . . . . . . . . . . . . . 70
4.5.2 Permanent Shear Strain . . . . . . . . . . . . . . . . . . . . . . . . . . . . . . . . . . . . . . . 71
4.5.3 Recovered Shear Strain . . . . . . . . . . . . . . . . . . . . . . . . . . . . . . . . . . . . . . . 73
4.5.4 Permanent Shear Strain After the First Load Application . . . . . . . . . . . . . 74
4.6 REPEATED SHEAR AT CONSTANT STRESS RATIO . . . . . . . . . . . . 77
4.7 REPEATED SHEAR AT CONSTANT HEIGHT . . . . . . . . . . . . . . . . . . . 79
4.8 ASPHALT PAVEMENT ANALYZER . . . . . . . . . . . . . . . . . . . . . . . . . . 81
4.9 SUMMARY OF LABORATORY TEST DATA AND DISCUSSION . . 83
CHAPTER 5 CONCLUSIONS AND RECOMMENDATIONS . . . . . . . . . . . . . . . . . . 87
5.1 CONCLUSIONS . . . . . . . . . . . . . . . . . . . . . . . . . . . . . . . . . . . . . . . . . . . . 87
5.2 RECOMMENDATIONS . . . . . . . . . . . . . . . . . . . . . . . . . . . . . . . . . . . . . . 88
REFERENCES . . . . . . . . . . . . . . . . . . . . . . . . . . . . . . . . . . . . . . . . . . . . . . . . . . . . . . . . . 89
APPENDIX A ASPHALT CEMENT CHARACTERIZATION . . . . . . . . . . . . . . . . . . . 95
APPENDIX B SUPERPAVE MIXTURE DESIGN . . . . . . . . . . . . . . . . . . . . . . . . . . . . 105

viii
LIST OF FIGURES
FIGURE Page
1 Superpave Gradation controls . . . . . . . . . . . . . . . . . . . . . . . . . . . . . . . . . . . . . . . 35
2 Superpave Gyratory Compactor by Industrial Process Control . . . . . . . . . . . . . . 37
3 APA Testing Setup . . . . . . . . . . . . . . . . . . . . . . . . . . . . . . . . . . . . . . . . . . . . . . . 41
4 Cox SST Machine Used for HMA Evaluation . . . . . . . . . . . . . . . . . . . . . . . . . . 44
5 Complex Shear Modulus of Asphalt Cement versus Frequency . . . . . . . . . . . . . 51
6 River gravel, G* versus frequency at 4/C . . . . . . . . . . . . . . . . . . . . . . . . . . . . . . 53
7 River gravel, G* versus frequency at 20/C . . . . . . . . . . . . . . . . . . . . . . . . . . . . . 53
8 River gravel, G* versus frequency at 46/C . . . . . . . . . . . . . . . . . . . . . . . . . . . . . 54
9 Granite, G* versus frequency at 46/C . . . . . . . . . . . . . . . . . . . . . . . . . . . . . . . . . 54
10 Limestone, G* versus frequency at 46/C . . . . . . . . . . . . . . . . . . . . . . . . . . . . . . . 56
11 River Gravel + Rounded Natural Sand, G* versus Frequency at 46/C . . . . . . . . 56
12 Shear Phase Angle of Asphalt versus Frequency . . . . . . . . . . . . . . . . . . . . . . . . 59
13 River gravel, Phase Angle versus Frequency at 4/C . . . . . . . . . . . . . . . . . . . . . . 60
14 River gravel, Phase Angle versus Frequency at 20/C . . . . . . . . . . . . . . . . . . . . . 60
15 River gravel, Phase Angle versus Frequency at 46/C . . . . . . . . . . . . . . . . . . . . . 61
16 Granite, Phase Angle versus Frequency at 46/C . . . . . . . . . . . . . . . . . . . . . . . . . 61
17 Limestone, Phase Angle versus Frequency at 46/C . . . . . . . . . . . . . . . . . . . . . . 62
18 River Gravel + Rounded Natural Sand, Phase Angle versus Frequency at 46/C 62
19 G*/sin δ versus Frequency for Asphalt Cement . . . . . . . . . . . . . . . . . . . . . . . . . 65
20 River Gravel, G*/sin δ versus Frequency at 4/C . . . . . . . . . . . . . . . . . . . . . . . . . 66
21 River Gravel, G*/sin δ versus Frequency at 20/C . . . . . . . . . . . . . . . . . . . . . . . . 66
22 River Gravel, G*/sin δ versus Frequency at 46/C . . . . . . . . . . . . . . . . . . . . . . . . 67
23 Granite, G*/sin δ versus frequency at 46/C . . . . . . . . . . . . . . . . . . . . . . . . . . . . . 67
24 Limestone, G*/sin δ versus frequency at 46/C . . . . . . . . . . . . . . . . . . . . . . . . . . 68
25 River Gravel + Rounded Natural Sand, G*/sin δ versus Frequency at 46/C . . . 68
26 Maximum Shear Strain at 46/C for Different Mixtures . . . . . . . . . . . . . . . . . . . 71
27 Permanent Shear Strain at 46/C for Different Mixtures . . . . . . . . . . . . . . . . . . . 72

ix
FIGURE Page
28 Elastic Shear Strain at 46/C for Different Mixtures . . . . . . . . . . . . . . . . . . . . . . 74
29 Permanent Shear Strain of RG at 4/C and 20/C at First Load Cycle . . . . . . . . . 76
30 Permanent Shear Strain After the First Load Cycle at 46/C . . . . . . . . . . . . . . . . 76
31 Permanent Shear Strain After 10,000 Cycles for RSCSR Test . . . . . . . . . . . . . . 78
32 Rut Depth Measured by APA after 8000 Cycles . . . . . . . . . . . . . . . . . . . . . . . . . 83
A1 PG 64-22 Brookfield Viscosity versus Temperature . . . . . . . . . . . . . . . . . . . . . 103
B1 River Gravel Gradation Curves . . . . . . . . . . . . . . . . . . . . . . . . . . . . . . . . . . . . . 111
B2 Granite Gradation Curves . . . . . . . . . . . . . . . . . . . . . . . . . . . . . . . . . . . . . . . . . 112
B3 Limestone Gradation Curves . . . . . . . . . . . . . . . . . . . . . . . . . . . . . . . . . . . . . . . 113
B4 River Gravel + Rounded Natural Sand Gradation Curves . . . . . . . . . . . . . . . . 114

x
LIST OF TABLES
TABLE Page
1 Different Mixtures and Test Description . . . . . . . . . . . . . . . . . . . . . . . . . . . . . . . 22
2 Coarse Aggregate Angularity for River Gravel . . . . . . . . . . . . . . . . . . . . . . . . . . 28
3 Coarse Aggregate Angularity for Granite . . . . . . . . . . . . . . . . . . . . . . . . . . . . . . 29
4 Coarse Aggregate Angularity for Limestone . . . . . . . . . . . . . . . . . . . . . . . . . . . . 29
5 Fine Aggregate Angularity . . . . . . . . . . . . . . . . . . . . . . . . . . . . . . . . . . . . . . . . . 30
6 Flat and Elongated Particles for Aggregates . . . . . . . . . . . . . . . . . . . . . . . . . . . . 31
7 Clay Content . . . . . . . . . . . . . . . . . . . . . . . . . . . . . . . . . . . . . . . . . . . . . . . . . . . . 32
8 River Gravel Specific Gravity . . . . . . . . . . . . . . . . . . . . . . . . . . . . . . . . . . . . . . . 32
9 Granite Specific Gravity . . . . . . . . . . . . . . . . . . . . . . . . . . . . . . . . . . . . . . . . . . . 33
10 Limestone Specific Gravity . . . . . . . . . . . . . . . . . . . . . . . . . . . . . . . . . . . . . . . . . 33
11 Superpave Gyratory Compactive Effort . . . . . . . . . . . . . . . . . . . . . . . . . . . . . . . 38
12 Superpave Mixture Design Volumetric Criteria . . . . . . . . . . . . . . . . . . . . . . . . . 39
13 Specimen Characteristics . . . . . . . . . . . . . . . . . . . . . . . . . . . . . . . . . . . . . . . . . . . 45
14 Abbreviations Used in the Analysis . . . . . . . . . . . . . . . . . . . . . . . . . . . . . . . . . . 47
15 Frequencies, Number of Cycles Applied and Data Points per Cycle (FSCH) . . . 49
16 Parameter m of River Gravel Mixtures . . . . . . . . . . . . . . . . . . . . . . . . . . . . . . . . 50
17 Parameter m of Granite, Limestone, and Rounded Natural Sand Mixtures . . . . 50
18 Comparative Ranking Asphalt Mixtures Considering m-values . . . . . . . . . . . . . 57
19 Ranking Asphalt Mixtures Considering m-values . . . . . . . . . . . . . . . . . . . . . . . 57
20 Ranking Asphalt Mixtures Considering G* . . . . . . . . . . . . . . . . . . . . . . . . . . . . 58
21 Ranking Asphalt Mixtures Considering Phase Angle . . . . . . . . . . . . . . . . . . . . . 64
22 Ranking Asphalt Mixtures Considering G*/sinδ . . . . . . . . . . . . . . . . . . . . . . . . . 65
23 Stress Levels Applied in the SSCH Test . . . . . . . . . . . . . . . . . . . . . . . . . . . . . . . 69
24 Ranking Asphalt Mixtures Considering Maximum Shear Strain . . . . . . . . . . . . 70
25 Ranking Asphalt Mixtures Considering Permanent Shear Strain . . . . . . . . . . . . 72
26 Ranking Asphalt Mixtures Considering Recoverable Shear Strain . . . . . . . . . . . 73
27 Permanent Deformation after the First Load Repetition . . . . . . . . . . . . . . . . . . . 75

xi
TABLE Page
28 RSCSR, S-values at 46/C . . . . . . . . . . . . . . . . . . . . . . . . . . . . . . . . . . . . . . . . . . 78
29 Permanent Shear Strain Models from RSCSR . . . . . . . . . . . . . . . . . . . . . . . . . . 79
30 Permanent Shear Strain Models from RSCH . . . . . . . . . . . . . . . . . . . . . . . . . . . 80
31 RSCH S-values and Permanent Deformation after 10 Million ESALs . . . . . . . . 81
32 APA Rut Depths for Different Mixtures . . . . . . . . . . . . . . . . . . . . . . . . . . . . . . . 82
33 SST and APA Test Summary . . . . . . . . . . . . . . . . . . . . . . . . . . . . . . . . . . . . . . . 85
A1 PG 64-22 Requirements . . . . . . . . . . . . . . . . . . . . . . . . . . . . . . . . . . . . . . . . . . . 97
A2 Test Results on Original Binder from DSR . . . . . . . . . . . . . . . . . . . . . . . . . . . . . 98
A3 Test Results on RTFO Residue from DSR . . . . . . . . . . . . . . . . . . . . . . . . . . . . . 98
A4 Test Results on PAV Residue from DSR . . . . . . . . . . . . . . . . . . . . . . . . . . . . . . 99
A5 Test Results at -12/C from BBR . . . . . . . . . . . . . . . . . . . . . . . . . . . . . . . . . . . . . 99
A6 Test Results at -18/C from BBR . . . . . . . . . . . . . . . . . . . . . . . . . . . . . . . . . . . . 100
A7 Shear Complex Modulus at 46/C . . . . . . . . . . . . . . . . . . . . . . . . . . . . . . . . . . . 101
A8 Shear Complex Modulus at 20/C . . . . . . . . . . . . . . . . . . . . . . . . . . . . . . . . . . . 101
A9 Shear Complex Modulus at 7/C . . . . . . . . . . . . . . . . . . . . . . . . . . . . . . . . . . . . 102
B1 River Gravel Gradations . . . . . . . . . . . . . . . . . . . . . . . . . . . . . . . . . . . . . . . . . . 107
B2 Granite Gradations . . . . . . . . . . . . . . . . . . . . . . . . . . . . . . . . . . . . . . . . . . . . . . . 108
B3 Limestone Gradations . . . . . . . . . . . . . . . . . . . . . . . . . . . . . . . . . . . . . . . . . . . . 109
B4 River Gravel + Rounded Natural Sand Gradations . . . . . . . . . . . . . . . . . . . . . . 110
B5 River Gravel Mixture Design Data . . . . . . . . . . . . . . . . . . . . . . . . . . . . . . . . . . 115
B6 Granite Mixture Design Data . . . . . . . . . . . . . . . . . . . . . . . . . . . . . . . . . . . . . . 116
B7 Limestone Mixture Design Data . . . . . . . . . . . . . . . . . . . . . . . . . . . . . . . . . . . . 117
B8 River Gravel + Rounded Natural Sand Mixture Design Data . . . . . . . . . . . . . . 118
B9 River Gravel Through Restricted Zone SST Specimen Data . . . . . . . . . . . . . . 119
B10 River Gravel Above Restricted Zone SST Specimen Data . . . . . . . . . . . . . . . . 120
B11 River Gravel Below Restricted Zone SST Specimen Data . . . . . . . . . . . . . . . . 121
B12 Granite SST Specimen Data Through, Above, and Below Restricted Zone . . . 122
B13 Limestone SST Specimen Data Through, Above, and Below Restricted Zone 123

xii
TABLE Page
B14 River Gravel + Rounded Natural Sand SST Specimen Data Through,
Above, and Below Restricted Zone . . . . . . . . . . . . . . . . . . . . . . . . . . . . . . . . . . 124

1
CHAPTER 1
INTRODUCTION
1.1 GENERAL
The United States road network has 3.9 million miles of roadway, of which 61 percent
are paved (1). In order to improve the performance, durability, and safety of United States
roads, the Strategic Highway Research Program (SHRP) was established by Congress in 1987
as a five year research program. Fifty million dollars of the one hundred and fifty million
dollars of the SHRP research funds were used for the development of asphalt specifications to
directly relate laboratory analysis with field performance. SUPERPAVETM (Superior
Performing Asphalt Pavements) is the final product of the SHRP research effort. Superpave
is a complete mixture design and analysis system with three major components:
C Asphalt binder specification,
C Mixture design, and
C Analysis system.
The SHRP research effort mainly concentrated on properties and testing of asphalt
binder (2). The aggregate and asphalt-aggregate characteristics of Superpave mixtures were
developed by a group of 14 experts known as the Aggregate Expert Task Group (ETG). These
experts, who were selected by SHRP, used a modified Delphi procedure to select the aggregate
and mixture characteristics (3). The procedure consisted of three parts:
C Formulate questionnaires concerning the aggregate and mixture characteristics to
the experts,
C Compile and compare the responses, and
C Select aggregate and mixture characteristics from consensus responses.
2
The results of the modified Delphi process are summarized in SHRP-A-408 (3). It is
noteworthy that, even though aggregate constitutes approximately 95% of hot mix asphalt
(HMA) by weight, little effort was devoted to the study of the contribution of aggregates to the
pavement performance (2).
As a result, some aspects of Superpave aggregate specifications are not universally
accepted, being questioned by the agencies, mainly departments of transportation (DOTs), or
the industries, or by both.
1.2 PROBLEM STATEMENT
One of the products of the modified Delphi procedure was the Superpave aggregate
gradation controls. The components of this gradation control include the following items (4):
C Federal Highway Administration (FHWA) 0.45 Power Chart: used to define a
permissible gradation,
C Control Points: through which the combined mixture gradation must pass,
C Restricted Gradation Zone: an area lying along the maximum density line extending
from the No. 50 (0.30-mm) sieve to the No. 8 (2.36-mm) or No. 4 (4.75-mm) sieve,
through which it is undesirable for a mixture gradation to pass (5).
One of the most controversial components of the Superpave mixture design is the
aggregate gradation restricted zone. The purposes of the restricted zone, as mentioned in
Report FHWA-SA-95-003 (6), are to limit the inclusion of large amounts of natural sand that
cause humps in the gradation curve in the 0.6 mm range and to discourage the gradations which
fall on the maximum density line which often lacks adequate voids in mineral aggregate
(VMA). This restricted zone was adopted primarily to reduce premature rutting. The apparent
increase in HMA pavement rutting in recent years is due to higher traffic volumes, increased
loads and tire pressures, poor construction quality control, and decreased quality of HMA
mixtures (7).

3
In most cases, a humped gradation indicates an over-sanded mixture and/or a mixture
that possesses too much fine sand in relation to total sand. This gradation often results in a
mixture that poses compaction problems during construction (tenderness) and offers reduced
resistance to permanent deformation during its service life. These gradations are very sensitive
to asphalt content and can easily become plastic with an increase in asphalt content within the
tolerance allowed by most specifications (4). In some publications (4, 8), it is indicated that
improved mixture performance is generally achieved from gradations that pass below the
restricted zone.
Avoiding the restricted zone was merely a recommendation by Superpave, not a
mandatory specification. Superpave encourages design of mixtures with gradations below the
restricted zone. Nevertheless, some state highway agencies categorically rejected any mixture
passing through the restricted zone (9).
On the other hand, some highway agencies question the validity of the restricted zone,
stating that specified gradations of many successful mixtures pass through the restricted zone.
They further state that these high-performance mixtures contain high quality aggregates, which
are normally 100 percent manufactured aggregates with no rounded sands. Strict adherence to
the restricted zone may have negative effects on the economy of the mixture. Exclusion of
some particular sizes form the combined gradation (even though they are manufactured)
jeopardize the balanced aggregate skeleton and, hence, can potentially increase the cost of
mixture.
1.3 OBJECTIVES OF STUDY
The objective of this research is to evaluate the relationship between the restricted zone
and rutting while the shape and angularity of the aggregate remains unchanged. The concept
is to compare properties of HMA containing the same aggregate type with three different
gradations, passing through, above, and below the restricted zone. In these three gradations,
the coarse side (plus No. 4 sieve) of the grading curve was kept the same, while the fine side
(minus No. 4 sieve) was varied in order to pass through, above, or below this restricted zone.

4
The most interesting aggregate selected for this study was the river gravel because,
among the aggregates used, it was assumed to be one of the most sensitive since it presents the
least desirable particle shape and surface texture. Although it was crushed, it retained some
percentage of rounded faces with rather smooth surface textures. In this study, crushed granite,
crushed limestone, and rounded sand were also used in HMA mixtures, and mixture evaluation
tests were conducted to examine the influence of the restricted zone.
The origin and grade of binder employed in the different HMA mixtures was kept the
same to facilitate comparisons of the different performances obtained with the different
aggregates. Except for the mixtures through the restricted zone and fine aggregate angularity
(where indicated), the mixtures met all the Superpave criteria.
The twelve mixtures were tested in the laboratory to evaluate their relative resistance
to permanent deformation. Four types of fundamental tests, using the Superpave Shear Tester
(SST), were performed:
• Simple Shear at Constant Height,
• Frequency Sweep at Constant Height,
• Repeated Shear at Constant Stress Ratio, and
• Repeated Shear at Constant Height.
Although the repeated shear test at constant height is not required by Superpave, it was
performed because it is a simplified method to predict premature rutting (6). In addition to
these four tests, the mixtures were subjected to wheel tracking torture test using the Asphalt
Pavement Analyzer (APA).
1.4 ORGANIZATION OF REPORT
This report is divided into five chapters. Chapter I serves as an introduction, stating the
nature of the problem to be addressed, objectives of the research, and scope of work
accomplished.

5
Chapter II summarizes an overview of permanent deformation in asphalt pavements.
It covers the definition of permanent deformation, its different types and causes, and its
characterization. Selected studies conducted in the last five years related to the effect of
aggregate gradation, focusing specifically on the restricted zone, are described in this chapter.
Chapter III is a description of the experimental program. The work plan includes the
following tasks: plan of study, materials selection and acquisition, tests for characterizing
asphalt cement and aggregates, Superpave mixture design, and tests for asphalt concrete
mixture evaluation.
Chapter IV covers analysis of the results from different tests which have been conducted
to predict premature rutting in asphalt pavement: repeated shear at constant stress ratio,
frequency sweep at constant height, simple shear at constant height, repeated shear at constant
height, and rutting evaluation using the APA.
Chapter V presents conclusions and recommendations that arise from the study.


7
CHAPTER 2
LITERATURE REVIEW
2.1 GENERAL
Permanent deformation is the predominant type of distress found in flexible pavement
that concerns paving agencies. Three types of permanent deformation are described below.
C Structural deformation: a subsidence in the base, subbase, and/or subgrade
accompanied by subsidence and, possibly, distress cracking pattern in the
pavement.
C Plastic deformation: a depression in the asphalt pavement near the center of the
applied load usually with slight humps on either side of the depression.
C Consolidation or densification: a depression in the asphalt pavement near the center
of the applied load without the accompanying humps. This is a result of further
compaction of the asphalt pavement by traffic after construction.
2.2 WHEELPATH RUTTING
Wheelpath rutting is the most common form of permanent deformation exhibited in
flexible pavements (8). It typically occurs in the top 75-100 mm (3-4 inches) of asphalt
pavements. Wheel path rutting is produced by one or a combination of the three types of
rutting defined previously. This research was focused on the plastic deformation in asphalt
layers (the leading cause of permanent deformation). If an asphalt mixture ruts, it is normally
because the mixture has insufficient shear strength to support the stresses to which it is
submitted. Wheelpath rutting is a function of traffic volume and applied loads.
The purpose of a pavement is to provide a safe, smooth riding surface for vehicular
travel. Therefore, when rutting interferes with these purposes, it has become excessive. From
a safety point of view, the important factor is cross drainage of surface water. Rutting is not
normally a significant safety problem in dry weather unless it is sufficient to interfere with
vehicle control. However, when water begins to pond in the wheel path, the rutted pavement

8
poses a hazard because hydroplaning or sliding on ice in cold weather (6). The cross slope of
the pavement section is the controlling factor in determining when a rut depth is acceptable or
not. At speeds of 90 km/hr (55 mph) or more, pavements with crown slopes of the order of 2
percent and rut depths of about 1.25 cm (0.5 inch), ponding is sufficient to cause vehicles
hydroplaning.
There are several wheelpath rutting classifications, one of which was provided in 1979
by the Federal Highway Administration, which classified rutting into three levels of severity:
C Low, from 6 to 12.5 mm (0.25 to 0.5 inches),
C Medium, from 12.5 to 25 mm (0.5 to 1.0 inches), and
C High, over 25 mm (1 inch).
For normal cross slope values, a rut depth of 12.5 mm (0.5 inch) is typically accepted
as the maximum allowable rut depth (8, 12).
2.3 RUTTING CHARACTERIZATION
The components of asphalt concrete are aggregates, asphalt cement, and air voids.
Rutting is a complicated process, affected by the properties and proportions in which these
components are mixed. These three components interact to produce HMA properties. Asphalt
pavement rutting typically occurs during the summer. When higher pavement temperatures are
reached, the viscosity of the asphalt binder is low, and the traffic load is primarily carried by
the mineral aggregate structure (8). The resistance of HMA to rutting is considered the
combined resistance (shear strength) of the mineral aggregate and asphalt cement (4). The
Mohr-Coulomb equation is often used to illustrate how both materials (asphalt cement and
aggregates) contribute to the shear strength of the asphalt mixture:
τ = c + σ tan φ
where:
C τ is the shear strength of the asphalt mixture,
C c is the cohesion term, in our case, the portion of the mixture shear strength
provided by the asphalt cement,

9
C σ is the normal stress to which the asphalt mixture is subjected,
C φ is the angle of internal friction provided by the aggregate structure.
Of course, air void content plays an important role in the shear resistance of an HMA
mixture. Since this study concentrates on the Superpave aggregate gradations, the effect of
aggregate-related properties on rutting characterization of HMA will be discussed below.
2.3.1 Aggregates
The largest portion of the resistance to permanent deformation of the mixture is
provided by the aggregate structure. Aggregate is expected to provide a strong, stone skeleton
to resist repeated load applications. Gradation, shape, and surface texture have a great
influence on HMA properties. Angular, rough-textured aggregates provide more shear
strength than rounded, smooth-textured aggregates. When a load is applied to the aggregate
in an asphalt mixture, the angular, cubical, rough-textured aggregate particles lock tightly
together and function as a large, single elastic mass, thus increasing the shear strength of the
asphalt mixture. Conversely, instead of locking together, smooth, rounded aggregate particles
tend to slide past each other.
If the aggregate provides a high degree of internal friction, φ, the shear strength of the
asphalt mixture will be increased and, therefore, the resistance to rutting. This is accomplished
by selecting an aggregate that is angular, cubical, has a rough surface texture, and is graded in
a manner to develop particle to particle contact (6).
2.3.2 Aggregate Gradation
R. P. Elliot et al. (13) conducted an investigation to evaluate the effect of different
aggregate gradations on the properties of asphalt mixtures. The aggregate blends included:
coarse, fine, mid-band (job mix formula - JMF), and two poorly graded materials from coarser
than JMF to finer than JMF (coarse-fine gradation), and from finer than JMF to coarser than
JMF (fine-coarse gradation). From this investigation, they concluded that:
C Variations in gradation have the greatest effect when the general shape of the
gradation curve is changed (i.e., coarse-to-fine & fine-to-coarse gradations).

10
C Fine gradation produced the highest Marshall stability, while the fine-to-coarse
poorly graded gradation (with hump at sand sized) produced the lowest Marshall
stability.
N. C. Krutz and P. E. Sebaaly (14) evaluated the effects of aggregate gradation on
permanent deformation of HMA mixtures for the Nevada Department of Transportation and
concluded:
C The best aggregate gradation is dependent on the type and source of aggregate.
C Coarse aggregate gradations (bottom of band) performed the worst and fine
aggregate gradations (middle and top band) produced better performing mixtures.
R. B. Moore and R. A. Welke (15) found that, as the mixture gradation approached the
Fuller curve for maximum density, the Marshall stability increased.
T. W. Kennedy et al. (8) stated that, in order to prevent permanent deformation of HMA
pavements, one should:
C Avoid gradations near the maximum density because, although they theoretically
produces the strongest HMA mixtures, due to their relatively low voids in the
mineral aggregate, these types of mixtures are very sensitive to asphalt content and
present the risk of flushing due to inevitable variations during construction.
C It is better to use aggregates with angular particles because they exhibit greater
interlock and internal friction and, hence, result in greater mechanical stability than
rounded particles.
C It is better to use aggregates with rough surface texture because they tend to form
stronger mechanical bonds when compared to smooth-textured aggregates and
provide higher VMA in a compacted mass.

11
2.3.3 Fine Aggregates
C. Crawford (16) concluded from a study related to tender mixtures that particle shape
and the amount of material passing the No. 4 sieve (4.75-mm) were major factors contributing
to the tenderness of an asphalt concrete mixture. He also stated that rounded, uncrushed
aggregates are more likely to contribute to tender mixtures and, therefore, more rutting
susceptible, especially as the amount of uncrushed material passing No. 4 sieve increases.
M. Herrin and W. H. Goetz (17) found from a laboratory evaluation that the strength
of the asphalt mixture, regardless of the type of coarse aggregate, increased substantially when
the fine aggregate was changed from rounded sand to crushed fine aggregates.
B. F. Kallas and J. M. Griffith (18) studied the influence of fine aggregates on asphalt
paving mixtures and demonstrated that an increase in angularity of crushed fines increased the
Marshall and Hveem stability values at the optimum asphalt content. An increase in angularity
in the fine aggregate also increased the void content at a given compaction level and the
optimum asphalt content.
E. Shklarsky and M. Livneh (19) found that replacing natural sand materials with
crushed fine aggregate increased the stability and strength properties of Marshall specimens,
reduced permanent deformation, improved resistance to wear, reduced asphalt content
sensitivity, and increased VMA and air voids in the compacted specimen.
R. R. Lottman and W. H. Goetz (20) stated that increases in strength of HMA were
attributed to the angularity and the roughness of the crushed fine aggregates. The authors
recommended that some amount of crushed fine aggregate be used with natural sands in asphalt
mixtures to produce sufficient stability for high quality pavements.
J. W. Button and D. Perdomo (21) demonstrated that total deformation and rate of
deformation increased as the percentage of natural sand increased. Shape and texture of the
fine aggregate were major factors controlling plastic deformation in HMA. Replacing natural
sand material with manufactured sand increased the resistance of the HMA to permanent
deformation.

12
2.3.4 Coarse Aggregates
M. Yeggoni et al. (22) conducted a laboratory study to evaluate the influence of coarse
aggregate shape and texture on permanent deformation characteristics of HMA mixtures. The
authors concluded that an increase in the percentage of crushed coarse aggregate resulted in
increased Hveem stability, Marshall stability, and resistance to permanent deformation. They
also found a strong correlation between rutting potential and the shape of the coarse aggregate
particles as measured using image analysis.
E. R. Brown et al. (23) concluded that the maximum aggregate size greatly affected the
pavement performance and that larger maximum aggregate sizes produce higher stability, better
skid resistance, and lower optimum asphalt contents.
Y. R. Kim et al. (24) demonstrated that aggregate type has significant effects on fatigue
resistance and permanent deformation of asphalt concrete. Gradation had no significant effects
on permanent deformation. Interactions of aggregate type with gradation, asphalt type, air
voids, and temperature were found to be significant for the permanent deformation of asphalt
concrete.
C. E. Basset and E. R. Brown (25) concluded that:
C Very little change in indirect tensile strength as maximum aggregate size is
changed.
C If the maximum aggregate size increases, the mixture will be more resistant to
permanent deformation and will have greater resilient modulus values.
2.3.5 Filler
E. R. Brown et al. (23), from various laboratory and field studies, concluded that
additional minus No. 200 (filler) material produced a lower optimum asphalt content (filler
material fills the voids in certain asphalt mixtures and lowers the optimum asphalt content), a
higher stability, and a more asphalt sensitive mixture. Some filler is required for stability, but
an excessive amount (greater than 6 percent in conventional mixtures) produced unsatisfactory
mixtures.

13
D. A. Anderson (26) and J. P. Tarris and D. A. Anderson (27) stated that mineral filler
characteristics vary with the type and gradation of the filler. Care must be taken to consider
not only the amount of filler, but also its particle size distribution in evaluating whether an
excessive amount of filler is present in a mixture design. If the size of mineral filler particles
is smaller than about 10 microns, i.e., smaller than the asphalt film thickness in the HMA, the
filler acts as an extender of the asphalt binder. But, if the mineral filler size is larger than 10
microns, it acts more like an aggregate. If an excessive amount of large size mineral filler is
present, the asphalt demand may increase.
2.4 SPECIFICATIONS TO REDUCE RUTTING
Many agencies around the United States have adopted specifications to address rutting
distress in asphalt concrete pavements. The main criteria adopted are:
C Increase the percentage of VMA. For instance, Illinois DOT has increased VMA
from a minimum of 11-13 percent to a minimum of 15 percent for 1/2- inch
mixtures.
C Fix a minimum and maximum percentage of air voids in the asphalt concrete
mixture. For instance, Iowa DOT has fixed the limits at 3.5 and 6.0 percent.
C Increase the number of blows in the Marshall compaction (lower binder content).
C Limit the amount of natural sand. FHWA recommends no more than 15 percent.
C Fix a minimum percentage of crushed coarse and fine aggregate.
C Increase the percentage of filler in the mixture.
C Use stiffer asphalt cements binders.
C Use coarser aggregate gradations with appropriate asphalt binder for climate and
traffic conditions, as with Superpave.
The authors believe that, with coarser HMA mixtures, the VMA and possibly air void
content should likely decrease to improve resistance to rutting. This will be discussed more
later. In order to minimize permanent deformation in asphalt pavements, certain aggregate

14
requirements were fixed in Superpave: coarse aggregate angularity, fine aggregate angularity,
flat-elongated requirements, and gradation controls. These issues, as well as the other
Superpave requirements, will be discussed in the next chapter.
2.5 RECENT STUDIES ON SUPERPAVE RESTRICTED ZONE
Soon after the inception of the Superpave mixture design method, the paving industries
and agencies realized some of their successful HMA mixtures did not meet the Superpave
specifications. Some mixtures exhibiting good performance pass through the restricted zone.
A recent paper presented by Hand et al. (9) summarizes results of recent research focusing on
the effect of restricted zone on performance of HMA. This review of recent studies indicated
that good performance can be achieved with fine graded (ARZ and TRZ) mixtures and, in most
cases, fine Superpave mixtures out perform coarse Superpave mixtures. His study concluded
that there is no relationship between the Superpave restricted zone and HMA rutting or fatigue
performance.
In 1996, David Jahn (2) stated that most of the Georgia DOT mixtures which have
exhibited good performance pass through the restricted zone. Georgia DOT set a very narrow
band of combined aggregate gradation for their 19-mm mixtures. This band is well suited for
the local aggregate source, and resulting HMA mixtures have been used successfully for heavy
traffic. In order to pass the Georgia DOT specification, one (practically speaking) has to violate
the restricted zone. Watson et al. (28) indicated similar findings. He mentioned that Georgia
DOT’s good-performing Type B (19.0-mm nominal maximum size), Type F (9.5-mm NMS),
and Type E (12.5-mm NMS) mixtures usually encroach the restricted zone. These mixtures
resulted from extensive research and are performing well in high-volume traffic roads. The
Type B mixture exhibited exceptional field performance in rutting susceptibility.
T. Kuennen (29) discussed two years of field experience with Superpave pavements.
He mentioned that, in certain regions of the country, Superpave mixes are performing well even
though the mixtures include aggregate fines that fall within the restricted zone.
B. Prowell (30) studied the field and laboratory performance of HMA to evaluate the
performance of stabilizers and modifiers. Ten test sections were built in 1995 on IH 66, in

15
Virginia. The test sections were constructed using both dense-graded Marshall and coarse-
graded Superpave mixtures. Dense-graded Marshall mixtures followed all the Superpave
volumetric requirements except of the gradation, which passed through the restricted zone.
Prowell mentioned that all of the test sections are rut resistant and are performing well after 45
months of service.
Anderson et al. (3) evaluated a Superpave mixture design data base. In that study, the
researchers examined 128 trial aggregate blends used for mixture design during the period of
1992-96. Their objective was to set a guideline for the mixture designers, more specifically,
they were focused to identify the gradation or gradation characteristics which can yield
adequate VMA for the mixtures. They tried to find a correlation between VMA and the
distance from maximum density line on the 0.45 power gradation chart or distance from the
restricted zone. They did not find any statistically good correlation between VMA in an asphalt
mixture and the sum of the distances from the Superpave maximum density line or the sum of
the distances from the restricted zone. In the same study, the researchers designed and
evaluated HMA of four different gradations using only one aggregate source. The combined
gradations were a S-shaped coarse gradation, a fine gradation above the restricted zone, an
intermediate gradation passing through the restricted zone, and a S-shaped coarse but with
slightly humped gradation. The asphalt mixtures were evaluated using simple shear at constant
height and repeated shear at constant height test using the Superpave shear tester. The
researchers noticed that the gradation above restricted zone performed the best and those below
restricted zone performed the worst. They concluded that contrary to the common contention,
finer gradations have stronger aggregate structure than coarse gradations.
Sousa et al. (31) evaluated the effect of aggregate gradation on the fatigue life of HMA.
In this study, 100 percent crushed granite with gradations passing above, through, and below
the restricted were used. To evaluate fatigue life of HMA, four-point bending fatigue tests
were performed according to the SHRP M009 test protocol. Fatigue lives of 230 actual
laboratory tests were compared with predictions by Shell, Asphalt Institute, and SHRP-A003
fatigue predictive equations. One of their conclusions was that the fine-graded mixtures (above

16
(ARZ) and through (TRZ) the restricted zone) out-performed those below (BRZ) the restricted
zone, with respect to fatigue life.
Van-de-Ven et al. (32) reported on a joint study between University of Stellenbosch,
South Africa and South Central Superpave Center (located then at Austin, Texas). The
objective of this research was to examine the Superpave aggregate gradation and fine aggregate
angularity specification. Basically, three gradations: above, through, and below the restricted
zone were used. The nominal maximum size of 100 percent crushed aggregate used in the
study was 9.5 mm. For mixtures below restricted zone, researchers used fine aggregates with
different FAA values. Even though the mixtures were designed using the Superpave
volumetric method, some of the mixtures did not meet all of the Superpave requirements.
Obviously, the restricted zone requirement was violated intentionally. SST and Model Mobile
Load Simulator (MMLS) were used to evaluate relative properties of HMA. Dynamic creep
and indirect tensile tests were also performed. The authors pointed out that a small variation
in nominal maximum aggregate size of a mix may change the restricted zone of that mix.
Although based on the limited data, one of the conclusions of this research was that the
mixtures passing through the restricted zone perform well and sometimes better than those
below or above the restricted zone.
Cooley, (33) expressed concern that the Superpave coarse mixtures ( gradations passing
below the restricted zone) are more permeable than pavements previously designed with
Marshall hammer.
Rouque et al. (34) examined the influence of aggregate gradation on shear resistance
and volumetric properties of HMA. Other objectives of that study were to find an optimized
aggregate gradation to maximize shear resistance to determine if it is possible to produce dense
gradations that provide shear resistance equal to or greater than that of stone matrix asphalt
(SMA) mixture. Eighteen mixtures were prepared using different coarse aggregate gradations
ranging from SMA to those near the maximum density line. Gradations near the maximum
density line can be considered as TRZ (9). Shear resistance of mixtures were estimated using
the gyratory shear value determined from Corps of Engineers gyratory test machine. This study
showed that a broad range of aggregate gradations ranging from TRZ to SMA can yield good

17
shear resistance in HMA. Gradation of the coarse aggregate fraction is the most pronounced
factor affecting the shear resistance of the HMA. VMA could not be related to shear resistance
of the mixture.
El-Basyouny et al. (35) studied the effect of aggregate gradation, nominal maximum
size, and binder content on the rutting related volumetric properties of HMA mixtures. In that
study, mixtures were prepared using aggregate with different gradations (ARZ, TRZ, and BRZ).
Using the results from uniaxial creep tests, VESYS-3AM software predicted their rutting
potential. This software predicted a 10-mm rut depth for TRZ mixture and an 11-mm rut depth
for ARZ and BRZ mixture.
During 1994-95, a 2.9-km oval test track (WesTrack) was constructed at the Nevada
Automotive Test Center near Reno, Nevada under the sponsorship of FHWA (Project No.
DTFH61-94-C-00004) and National Cooperative Highway Research Program (NCHRP Project
No. 9-20). This full-scale test track contained 26 test sections. Two of the several objectives
of these test sections were to examine the effect of variability of construction and materials on
the performance of HMA and to establish a field verification of the Superpave mixture design
and analysis system. Beginning in 1996, loading was applied with driverless triple
trailers/trucks operating at a speed of 65 km/hr. During March 1996 to June 1998, 4.7 million
80-kN ESALs were applied (9). Numerous types of pavement performance data were collected
bi-weekly and monthly.
The WesTrack test sections originally constructed included three different gradations:
fine (ARZ), S-shaped coarse (BRZ), and fine plus (fine gradation with additional bag house
fines) graded mixtures. Crushed gravel and PG 64-22 asphalt were used for these sections.
The amount of filler, asphalt content, and air voids were varied systematically to simulate
construction variability in the field (9). The mixtures were designed following the Superpave
volumetric mixture design system. Performance of the BRZ mixture sections were
unexpectedly poor. These coarse-graded sections exhibited the greatest amount of rutting and
fatigue cracking of all mixture variable combinations. All coarse-graded sections were
replaced with similar gradations but different aggregate (100 percent crushed granite). Other
variables were kept essentially the same. The performance of these replacement sections were

18
even worse. Both types of fine-graded sections exhibited clearly better performance than the
coarse-graded sections.
National Pooled Fund Study 176 was conducted in two phases (36). One objective of
this study was to investigate the effect of aggregate gradation on permanent deformation of
HMA and validate the Superpave volumetric specification. Phase I of this study was limited
to only six mixtures containing limestone and limestone sand. Phase II of this study was
conducted with twenty-one mixtures. These mixtures were composed of two coarse aggregates
(granite and limestone) and three fine aggregates (granite, limestone, and natural sand). Two
aggregates (nominal maximum size 19.0 mm and 9.5 mm) with gradations ARZ, TRZ, and
BRZ were used for mixture design.
Mixture performance was evaluated (36) using Superpave volumetric mixture design
data, a triaxial test, PURWheel laboratory-scale wheel track test, and Indiana DOT/Purdue
University prototype-scale accelerated pavement test (APT). The triaxial test was performed
in the dry condition. Specimens compacted using the Superpave gyratory compactor (SGC)
were axially loaded at a constant confining pressure to 1.0 percent compressive strain. Stresses
obtained at this strain level were plotted against asphalt content. From that plot, the authors
suggest that the mixtures could be observed to transition from a stable state to unstable state.
PURWheel is a laboratory-scale torture test device. It can be operated on a compacted slab in
the dry or wet condition. Twenty thousand wheel passes or 12.5-mm rut (whichever comes
first) was applied on the compacted slab at a tire pressure of 793 kPa. The INDOT/Purdue
APT is a prototype-scale torture test device where one or two directional wheel (or dual wheel)
loads can be applied on compacted mat. The APT is more suitable to simulate the truck traffic
than the PURWheel.
The authors (36) summarized their observations stating that both laboratory and
prototype-scale performance tests indicated that adequate rutting performance can be achieved
with gradations ARZ, TRZ, and BRZ. They found that ARZ and TRZ mixtures might provide
slightly better performance than BRZ mixtures. APT results did not show clear trend.
Mallick et al. (37) conducted a related study. Their objective was to evaluate rutting
potential of HMA with gradations both complying with and violating the Superpave restricted

19
zone. In that study, researchers designed HMA mixtures containing granite, limestone, and
gravel. All three aggregates were crushed. Gradations used were ARZ, TRZ, and BRZ.
Mixtures were designed for wearing courses and binder courses using 12.5-mm and 19.0-mm
nominal maximum size of aggregate, respectively. Only one type of asphalt (PG 64-22) was
used. Test samples, compacted using the SGC, were tested using the APA and repeated shear
at constant height test. APA and RSCH tests were conducted using 8,000 and 5,000 cycles,
respectively.
The researchers (37) summarized their observations by stating that the statistical
analyses of APA rut depth data obtained on all mixtures indicated significant differences in
performance among different gradations. They observed that, for granite and limestone, BRZ
generally exhibited the highest and TRZ exhibited the lowest rut depths, and ARZ showed
intermediate rut depths. For river gravel mixtures, the order from highest to lowest rut depth
was ARZ, BRZ, and TRZ. Test results from RSCH was not as definitive as that from APA,
but it followed the same general trend. The BRZ limestone mixture yielded the highest peak
shearing strain for both wearing and binder courses. TRZ river gravel showed the lowest and
ARZ river gravel showed the highest peak shearing strain for both wearing and binder courses.
Very recently, the National Center for Asphalt Technology (NCAT) completed
construction of a 2.7-km oval test track near Auburn, Alabama. This track will be used for full-
scale accelerated testing of flexible pavements. HMA mixtures with coarse, fine, and through
restricted zone gradations mixtures will be used to construct the test sections. This full-scale
testing facility will provide an excellent opportunity to examine the effects of gradation on field
performance.
On the basis of results from previous research, the authors found that rut resistant HMA
can be developed using fine-graded mixtures. Most of the studies indicated that the ARZ
and/or TRZ gradation Superpave mixtures exhibit less permanent deformation than coarse-
graded BRZ Superpave mixtures. Some researchers concluded that mixtures with adequate rut
resistance can be produced with either of the gradations.


21
CHAPTER 3
EXPERIMENTAL PROGRAM
3.1 PLAN OF STUDY
This research focused on examining the effects of crushed and uncrushed aggregate
gradations on permanent deformation in Superpave HMA mixtures. The coarse side (plus No.
4 sieve) of the grading curve remained unchanged, while the fine side (minus No. 4 sieve) was
varied in order to pass through, above, and below the restricted zone. Laboratory tests were
used to predict pavement rutting (Table 1). The work plan was divided in the following steps:
C Materials selection and acquisition: This phase includes identification and
collection of the four aggregate types (partially crushed river gravel, crushed
granite, crushed limestone, combination of partially crushed river gravel & rounded
natural sand) and one binder to prepare the HMA blends.
C Asphalt cement and aggregate characterization: The individual mixture
components were tested to determine if they meet Superpave requirements.
C Superpave mixture design: Several trial blends were prepared to obtain the design
aggregate gradation and asphalt content for the different mixtures (4 aggregate types
× 3 gradations = 12 HMA designs).
C Asphalt concrete mixture evaluation: Performance tests to establish rut resistance
of the HMA mixtures were performed. Performance test of HMA includes the use
of Superpave Shear Tester and Asphalt Pavement Analyzer.
The test plan includes preparation of HMA specimens with three aggregate gradations
(ARZ, TRZ, and BRZ) with all four aggregates using design or optimum asphalt content. For
each of these aggregate gradations and asphalt contents, different sets of specimens were
prepared at different degrees of compaction (different air void levels). As specified in
Superpave, replicate specimens were tested to improve the reliability of the results.

22
Since the river gravel mixtures proved more susceptible to permanent deformation,
additional specimens were prepared with high and low asphalt contents (Table 1). After the
first three mixtures showed no effect of the restricted zone, a fourth low-quality mixture
containing river gravel and rounded (uncrushed) fines was designed. This was done to
determine if a rut-susceptible mixture containing rounded sand show any effect of the restricted
zone. This mixture did not meet all the Superpave criteria (FAA and VMA).
Table 1. Different Mixtures and Test Description
Aggregate Name ofTests
Asphalt Content Number ofSpecimens
AirVoids(%)
TestTemperature
(/C)
Partially
Crushed River
Gravel
SSCH
FSCH
RSCSR
RSCH
APA
Design, high, & low
Design, high, & low
High
Design
Design
2*
2*
2
2
3 pair
7
7
3
4
4
4, 20, and 46
4, 20, and 46
46
46
64
100 % Crushed
Granite
SSCH
FSCH
RSCSR
APA
Design
Design
High
Design
2*
2*
2
3 pair
7
7
3
4
46
46
46
64
100 % Crushed
Limestone
SSCH
FSCH
RSCSR
APA
Design
Design
High
Design
2*
2*
2
3 pair
7
7
3
4
46
46
46
64
Crushed River
Gravel &
Rounded Sand
SSCH
FSCH
RSCSR
APA
Design
Design
High
Design
2*
2*
2
3 pair
7
7
3
4
46
46
46
64
* Same specimen is used for both SSCH and FSCH test

23
3.2 MATERIALS SELECTION AND ACQUISITION
This study focused on crushed river gravel because, among the three primary aggregate
types, river gravel was assumed to be most prone to permanent deformation, since it presents
partially rounded particle shape and relatively smooth surface texture. Although the river
gravel was crushed, it retained some rounded faces with smooth surface texture. Studies
conducted by R. C. Ahlrich (38) and A. Chowdhury (39) demonstrated that crushed river gravel
aggregates often contain rounded particles with smooth surface texture even after crushing.
Granite and limestone were selected because they posses widely different characteristics and
are commonly used in asphalt pavements.
The origin of the aggregates used in this study are: partially crushed river gravel from
McAllen, Texas (Fordyce); crushed limestone from Brownwood, Texas (Vulcan Materials);
and crushed granite from Forsyth Quarry, Georgia (Martin Marietta). The fourth aggregate, i.e.,
the combination of coarse crushed river gravel and rounded natural sand was selected
intentionally to develop a poor HMA mixture. The rounded natural sand was collected from
the Brazos river valley in Brazos county, Texas. The crushed gravel, limestone, and granite
have demonstrated generally good field performance in HMA. About one ton of each of these
aggregates was obtained for mixture design and specimen preparation.
Binder selection was according to the Superpave binder specification (AASHTO MP1,
Appendix A). In this specification, the binders are selected on the basis of the climate and
traffic in which they are intended to serve. The geographic location selected for this study was
Lubbock, Texas, and the traffic level selected was between 3 and 10 million ESALs for
limestone, river gravel, and natural sand aggregates, and between 1 and 3 million ESALs for
granite. The traffic level for granite is different because its gradation curve passing through the
restricted zone is a gradation curve commonly used in Georgia (provided by the Georgia DOT),
and researchers could not achieve a Superpave volumetric mix design for 3 to 10 million
ESALs. These traffic (1 to 10 million ESALs) levels were selected because they correspond
to intermediate levels of analysis in Superpave, and they are anticipated to be the predominant
Superpave analysis used in typical highway applications (6). The PG grade that corresponds
to this geographic location and the traffic levels, obtained from Superpave Software version
24
2.0 program using a 98% reliability, is PG 64-22. Researchers assumed that the projected
pavements will be subjected to fast moving loads, so no adjustment for the binder grade was
required.
3.3 TESTS FOR ASPHALT CEMENT CHARACTERIZATION
One of the three major components of the Superpave mixture design process is the
asphalt binder performance grading specification (AASHTO MP1). Asphalt binder is tested
in conditions that simulate its critical stages during the service, such as:
C During transportation, storage, and handling - original binder is tested.
C During mix production and construction - simulated by short-term aging the
original binder in a rolling thin film oven (RTFO).
C After 5 to 10 years of service - simulated by long term aging the binder in the
rolling thin film oven test plus the pressure aging vessel (PAV). In the PAV, the
RTFO residue is exposed to high air pressure and temperature for 20 hours to
simulate the effect of long-term pavement aging.
Results of the binder tests are included in Appendix A.
3.3.1 Dynamic Shear Rheometer (DSR)
Researchers used the DSR to characterize viscous and elastic behavior of asphalt
binders at high and intermediate service temperatures. The DSR measures the complex shear
modulus (G*) and phase angle (δ) of asphalt binders at desired temperature and frequency of
loading. Complex modulus is a measure of the total resistance of a material to deformation
when repeatedly sheared. It consists of two components:
C Storage modulus (G!) or the elastic (recoverable) part,
C Loss modulus (G") or the viscous (non recoverable) part.

25
The lag time between the applied peak stress and resulting peak strain is the phase angle
(δ). For perfectly elastic materials the phase angle is 0 degrees, and for perfectly viscous fluid
materials it is 90 degrees. Asphalt binders behave like elastic solids at very low temperatures
and like viscous fluids at high temperatures. However, at typical pavement service
temperatures, it behaves like a viscoelastic material, therefore, δ will be greater than zero but
smaller than 90 degrees (4).
The DSR is used to determine the rutting parameter of the asphalt binder at high
temperatures for unaged binders and short-term aged binders. For rutting resistance, a high
complex shear modulus (G*) value and low phase angle (δ) are both desirable. Higher G*
values indicate stiffer binders that are more resistant to rutting. Lower δ values indicate more
elastic asphalts that are more resistant to rutting. Therefore, a larger G*/sin δ signifies more
resistance to permanent deformation by the asphalt binder.
The DSR is also used to determine the fatigue resistance of the asphalt binder at
intermediate temperatures for long-term aged binders. For fatigue resistance, a low complex
modulus value and a low phase angle are both desirable. Therefore, smaller values of G*sin
δ indicate more resistance to fatigue cracking.
3.3.2 Bending Beam Rheometer (BBR)
The BBR measures a binder’s resistance to thermal cracking. Thermal cracking may
occur in asphalt pavements when the temperature drops rapidly at low temperatures. The BBR
uses a transient creep bending load on the center of an asphalt beam specimen held at a constant
low temperature. This test is performed on asphalt binder that has been subjected to long-term
aging. From this test, two parameters are obtained:
C Creep stiffness - a measure of how the asphalt binder resists the constant creep
loading.
C m-value - which is a measure of the rate at which the creep stiffness changes with
time of loading.

26
If creep stiffness increases, the thermal stresses developed in the pavement due to
thermal shrinking also increase, and thermal cracking becomes more likely. If m-value
decreases (the curve flattens) the ability of the asphalt binder to relieve thermal stresses
decreases, and the propensity of thermal cracking increases.
3.3.3 Direct Tension Tester (DTT)
The DTT measures the low temperature ultimate tensile strain of the binder. This test
is performed using binder subjected to long-term aging. The DTT is performed only when the
asphalt creep stiffness obtained from the BBR is greater than 300 MPa but smaller than 600
MPa. The DTT is performed because there are some asphalt binders which may have high
creep stiffness but do not crack because they can stretch further before breaking. Larger failure
strain indicates more ductile binders and, therefore, more resistant to cracking.
3.3.4 Rotational Viscometer (RV)
The rotational viscometer was adopted in Superpave for determining the viscosity of
asphalt binder at high temperatures, primarily to ensure that it is sufficiently fluid for pumping
or mixing. Rotational viscosity is determined by measuring the torque required to maintain a
constant rotational speed of a cylindrical spindle. HMA mixing and compaction temperature
ranges are determined using the rotational viscometer
3.3.5 Mixing and Compaction Temperature
Superpave HMA mixtures are mixed and compacted under equiviscous temperature
conditions corresponding to 0.17 Pa-s and 0.28 Pa-s, respectively (6). Viscosity of the asphalt
was tested using Brookfield rotational viscometer at 135/C and 175/C. Plotting the result in
a viscosity versus temperature graph (log-normal), the mixing and compaction temperature
ranges were determined.
Details of the binder testing results and determination of the mixing and compaction
temperatures are described in Appendix A.

27
3.4 TESTS FOR AGGREGATE CHARACTERIZATION
Superpave specifications contain two categories of aggregate properties: consensus
properties and source properties (6). Consensus properties are those aggregate characteristics
which are critical to well performing asphalt mixtures. These properties include:
C Coarse aggregate angularity,
C Fine aggregate angularity,
C Flat and elongated particles, and
C Clay content.
The specific criteria for these consensus aggregate properties are based on traffic level and
position of the layer within the pavement structure.
Source properties are those aggregate properties that, although important for the asphalt
mixture performance, they were not considered critical, and no critical values for those
properties were defined by Superpave (4). Criteria for the aggregate source properties are left
for the local agencies. Those properties include:
C Toughness,
C Soundness, and
C Deleterious materials.
Only the consensus aggregate properties were considered in this study because they can
be related to permanent deformation in HMA mixtures. The source aggregate properties were
not examined since these tests do not correlate particularly well with pavement deformation
(40, 41).
3.4.1 Coarse Aggregate Angularity (CAA)
CAA is the percent by weight of aggregates larger than No. 4 (4.75-mm) with one or
more fractured faces. Higher CAA enhances coarse aggregate internal friction and thus HMA

28
rutting resistance (6). CAA was measured following ASTM D 5821-95. A fractured face is
defined as an angular, rough, or broken surface of an aggregate particle created by crushing, by
other artificial means or by nature. A face will be counted as fractured only if it has a projected
area at least as large as one quarter of the maximum projected area (maximum cross-sectional
area) of the particle and the face has sharp and well defined edges (42).
Superpave has a required minimum value for CAA as a function of traffic level and
position within the pavement. The traffic level selected was less than 3 million ESALs for
granite blends and less than 10 million ESALs for limestone and river gravel blends. The depth
from the surface selected was less than 100 mm primarily because the study is focused on
plastic deformation in the asphalt layers, and this type of rutting occurs mainly in the uppermost
asphalt layers.
Tables 2, 3, and 4 show that the aggregates meet the coarse aggregate angularity
requirements except for the 19-mm river gravel, which does not meet either of the fractured
faces criteria. However, this material can be used as long as the selected blend of coarse
aggregate meets the design criterion.
Table 2. Coarse Aggregate Angularity for River Gravel (also used with Rounded Sand)
Aggregate Size 1 + FracturedFaces
MinimumCriterion
2 + FracturedFaces
MinimumCriterion
19 mm 82 85 72 80
12.5 mm 89 85 84 80
9.5 mm 93 85 90 80
4.75 mm 98 85 95 80
Coarse Gradation 93* 85 89* 80
*Each of the three river gravel blends has the same coarse aggregate proportions.

29
Table 3. Coarse Aggregate Angularity for Granite
Aggregate Size 1 + FracturedFaces
MinimumCriterion
2 + FracturedFaces
MinimumCriterion
19 mm 90 75 85 -
12.5 mm 95 75 91 -
9.5 mm 97 75 94 -
4.75 mm 99 75 98 -
Coarse Gradation 97* 75 93* -
*Each of the three granite blends has the same coarse aggregate proportions.
Table 4. Coarse Aggregate Angularity for Limestone
Aggregate Size 1 + FracturedFaces
MinimumCriterion
2 + FracturedFaces
MinimumCriterion
19 mm 92 85 88 80
12.5 mm 96 85 93 80
9.5 mm 98 85 95 80
4.75 mm 99 85 97 80
Coarse Gradation 97* 85 94* 80
*Each of the three limestone blends has the same coarse aggregate proportions.
3.4.2 Fine Aggregate Angularity (FAA)
FAA is the percent air voids present in loosely compacted aggregates of a specified
gradation smaller than 2.36 mm. Higher void contents generally mean more fractured faces.
This criterion is designed to ensure a high degree of fine aggregate internal friction and thus
rutting resistance (6). The test procedure followed was ASTM C 1252, Method A. Superpave
has a required minimum value for fine aggregate angularity as a function of traffic level and

30
layer position within the pavement. Design traffic level and depth have been stated in Section
3.4.1. Test results are shown in Table 5.
Although limestone and crushed river gravel do not meet the FAA criteria (see Table
4), the values obtained were accepted because the measured values are very close to the
minimum criterion, and the aggregate has demonstrated good performance in HMA.
Chowdhury (39) demonstrated that FAA values for aggregate containing 100 percent crushed
but cubical particles were often lower than those for aggregates containing rounded particles.
Table 5. Fine Aggregate Angularity
FAA Minimum criterion (%)
River gravel 44.3 45
Granite 48.0 40
Limestone 43.5 45
River Gravel +Rounded Sand
39.0 45
3.4.3 Flat and Elongated Particles (F&E)
According to Superpave, F&E is the percentage by mass of coarse aggregate particles
larger than 4.75 mm that have a maximum to minimum dimension ratio greater than five. This
criterion is an attempt to avoid particles with a tendency to break during construction and under
traffic. The test procedure followed was ASTM D 4791 (Table 6).
Superpave has a required maximum value for F&E coarse aggregate particles as a
function of traffic level.
3.4.4 Clay Content
Clay content is the percentage of clay material (by volume) contained in the aggregate
fraction finer than 4.75 mm. Superpave has a required minimum value for clay content of fine
aggregate particles as a function of traffic level. This property ensures that the relative

31
proportion of clay-like or plastic fines in granular soils and fine aggregates is not too high. The
test procedure followed was ASTM D 2419-95 (Table 7).
Table 6. Flat and Elongated Particles for Aggregates
Aggregate Type
AggregateSize
Percent by Weight Flatand Elongated Particles
Requirement(maximum percent)
RiverGravel
19.0 mm 6
N/A12.5 mm 4
9.5 mm 3
4.75 mm 2
Coarsegradation
3* 10
Granite
19.0 mm 8
N/A12.5 mm 9
9.5 mm 8
4.75 mm 5
Coarsegradation
8* 10
Limestone
19.0 mm 6
N/A12.5 mm 4
9.5 mm 4
4.75 mm 2
Coarsegradation
4* 10
River Gravel +Rounded Sand
Coarsegradation
3*(Same as River Gravel)
10
* Three blends (ARZ, TRZ, and BRZ) of each aggregate has the same coarse aggregate proportions. ** F&E criterion for all traffic levels is a maximum of 10% F&E particles by weight of total particles > 4.75 mm.

32
Table 7. Clay Content
Aggregate Type Sand Equivalent (%) Minimum Criterion (%)
River gravel 88 45
Granite 79 40
Limestone 78 45
River Gravel +Rounded Sand
89 45
3.4.5 Specific Gravity
The specific gravity of the aggregates is required to determine fine aggregate angularity
as well as for the Superpave mixture design. The test procedure followed was ASTM C 127
for coarse aggregates and ASTM C 128 for fine aggregates.
The criteria for distinguishing between coarse and fine aggregates is the 4.75-mm (No.
4) sieve. Table 8, 9, and 10 provide the specific gravity values for each aggregate used in this
study. The specific gravity of the coarse portion of the rounded natural sand mixture was the
same as that listed for river gravel of river gravel.
Table 8. Crushed River Gravel and Rounded Natural Sand Specific Gravity
Aggregate Size Bulk SpecificGravity (oven dry)
Bulk SpecificGravity (SSD)*
ApparentSpecificGravity
+19 mm (coarse) 2.578 2.591 2.613
+12.5 mm(coarse) 2.603 2.617 2.642
+9.5 mm(coarse) 2.604 2.619 2.643
+4.75 mm(coarse) 2.597 2.616 2.647
!4.75 mm (fine) 2.578 2.609 2.662
Rounded Natural Sand (Fine) 2.572 2.592 2.643
* saturated surface dry.

33
Table 9. Granite Specific Gravity
Aggregate Size Bulk Specific Gravity(oven dry)
Bulk SpecificGravity (SSD)
ApparentSpecific Gravity
+19 mm (coarse) 2.706 2.719 2.743
+12.5 mm(coarse) 2.704 2.718 2.743
+9.5 mm(coarse) 2.704 2.717 2.743
+4.75 mm(coarse) 2.705 2.718 2.742
!4.75 mm (fine) 2.672 2.701 2.752
Table 10. Limestone Specific Gravity
Aggregate Size Bulk Specific Gravity(oven dry)
Bulk SpecificGravity (SSD)
ApparentSpecific Gravity
+19 mm (coarse) 2.668 2.689 2.729
+12.5 mm(coarse) 2.664 2.687 2.726
+9.5 mm(coarse) 2.667 2.687 2.723
+4.75 mm(coarse) 2.668 2.682 2.671
!4.75 mm (fine) 2.633 2.668 2.729
3.5 SUPERPAVE MIXTURE DESIGN
One of the three major components of Superpave is the mixture design procedure. Once
the aggregates and asphalt materials have been selected and tested, the following steps are
followed to develop the mixture design:
C Develop aggregate trial blends,
C Prepare mixtures,
C Compact specimens,

34
C Conduct volumetric analysis, and
C Determine the optimum asphalt content.
Superpave mixtures were designed using AASHTO PP 28-97 standards. The mixture
design data for the different blends is provided in Appendix B.
3.5.1 Aggregate Blends
To properly develop the aggregate blends, the aggregates were sieved and separated into
bins then recombined in preparing asphalt mixtures. This separation was very important in order
to obtain accurate mixture gradations, because the differences between the three gradations
developed (ARZ, TRZ, and BRZ) for the different aggregates were fairly small.
The Superpave aggregate gradation controls were maintained using the FHWA 0.45
power chart (Figure 1). This chart is used to define a permissible gradation. This chart uses a
unique graphing technique where the ordinate shows the percent passing and the abscissa is an
arithmetic scale of sieve size in millimeters, raised to the 0.45 power (4). The maximum density
gradation theoretically plots as a straight line from the maximum aggregate size (two sieve sizes
larger than the first sieve size to retain more than 10 percent) to the origin. The mix gradation
must pass between certain control points. These control points function as master ranges serving
three purposes: to control the top size of the aggregate, to control the relative proportion of
coarse and fine aggregate, and to control the proportion of dust (4).
There is an area called ‘restricted zone’ lying along the maximum density line extending
from the 0.30-mm (No. 50) sieve size to the 2.36-mm (No. 8) or 4.75-mm (No. 4) sieve size,
through which it is undesirable for a mix gradation to pass (5). The zone terminates at the 2.36-
mm or 4.75-mm sieve, depending on the nominal maximum size of aggregate used. This
restricted zone was established in an attempt to minimize the risk of poor volumetric properties;
to minimize the amount of rounded, fine sands; and to encourage the development of a strong
aggregate structure in the mixture.

35
Figure 1. Superpave Gradation Control for 19.0-mm Mixtures
The restricted zone was adopted by Superpave to reduce premature rutting. However,
it is one of the most controversial components of the Superpave mixture design procedure.
The location of the control points as well as the restricted zone depend on the aggregate
nominal maximum size. In Superpave, the nominal maximum size is defined as one sieve size
larger than the first sieve to retain more than 10 percent of the aggregates. Maximum size is
defined as one sieve size larger than the nominal maximum size. Each one of the aggregate
blends selected has the same nominal maximum size, which is 19 mm.
Detailed characterizations of the different aggregate blends is provided in Appendix B.
During the development of these aggregate blends, several trial blends were tested in order to
select viable blends.
36
3.5.2 Preparation of HMA Mixtures
Once the aggregate blends were selected and the initial trial asphalt binder content was
calculated, the HMA mixtures were prepared. This phase consists of the following main steps:
• Heating the aggregates and asphalt binder to the mixing temperature (159 ± 3/C).
• Mix both components and short-term age the mixture for 4 hours at 135/C.
• Compaction the mixture at a temperature of 145 ± 3/C.
3.5.3 Compaction
All specimens were compacted using the SGC manufactured by Industrial Product
Corporation, Inc., Australia (Figure 2). The SGC was developed by SHRP researchers to
achieve the following objectives:
C Obtain realistic compaction of specimens,
C Be an effective method of compaction for aggregate gradations with particle sizes
up to 37.5 mm,
C Be able to monitor compactability during the process of compaction, and
C Be portable;
The SGC was based on the Texas gyratory compactor and the French gyratory
compactor.
In Superpave, as with other mixture design procedures, asphalt mixtures are designed
using a specific compactive effort. Compactive effort is a function of the design number of
gyrations, Ndes. Ndes is used to vary the compactive effort of the design mixture as a function of
climate and traffic level. Two other compaction levels are of interest: the initial number of
gyrations (Nini) and maximum number of gyrations (Nmax).
Log Nini = 0.45 × Log Ndes
Log Nmax = 1.10 × Log Ndes

37
Climate is represented by the average design high air temperature. For Lubbock, Texas,
it is <39 /C. Selected traffic levels were 1-3 million ESALs for granite blends, and 3-10 million
ESALs for limestone, river gravel, and the rounded natural sand mixture, as stated before. For
the selected traffic levels, Nini, Ndes, and Nmax are indicated in Table 11. Specimens for the
volumetric analysis were compacted to Nmax.
Figure 2. Superpave Gyratory Compactor by Industrial Process Control
3.5.4 Volumetric Analysis
To complete the volumetric analysis, determination of the bulk specific gravity of the
specimens compacted at Nmax was required. Bulk specific gravity was determined using the

38
standard test method for non-absorptive compacted bituminous mixtures (ASTM D 2726). The
ratio between the measured bulk specific gravity and the estimated bulk specific gravity
obtained from the gyratory compactor at Nmax is the correction factor. This correction factor
was applied to the estimated bulk specific gravities of the specimen during the compaction
process. With the data obtained from the Superpave gyratory compactor and the bulk specific
gravity of the specimens, the volumetric analysis can be completed.
Table 11. Superpave Gyratory Compactive Effort
Nini Ndes Nmax
River Gravel 8 96 152
Granite 7 86 134
Limestone 8 96 152
River Gravel +Rounded Sand
8 96 152
Superpave specifies acceptable values for the following volumetric characteristics of the
specimen:
C Percentage of air voids at Ndes,
C Percentage of the theoretical maximum specific gravity of the mix (% Gmm) at Ninitial
and Nmax,
C Voids in the mineral aggregate (VMA), according to the nominal maximum
aggregate size (19-mm for the blends analyzed),
C Voids in the mineral aggregate filled with asphalt (VFA), according to the traffic
level,
C Dust proportion, which is the percent by mass of the material passing the 0.075-mm
sieve size divided by the effective asphalt binder content in percent.

39
Volumetric criteria for the different aggregates is given in Table 12.
Table 12. Superpave Mixture Design Volumetric Criteria
Volumetric Parameter RiverGravel
Granite Limestone River Gravel +Rounded Sand
Air voids at Nmax (%) >2 >2 >2 >2
Air voids at Nini (%) >11 >11 >11 >11
Air voids at Ndes (%) 4 4 4 4
VMA at Ndes (%) >13 >13 >13 >13
VFA at Ndes (%) 65-75 65-78 65-75 65-75
Dust proportion 0.6-1.2 0.6-1.2 0.6-1.2 0.6-1.2
Once the volumetric analysis has been conducted in the trial blends, the asphalt content
of these trial blends was corrected in order to estimate the asphalt content required to obtain 4%
air voids at Ndes (the most restrictive of all the requirements). With this estimated asphalt
content, the other volumetric characteristics of the blends will change, therefore, they are also
estimated with the equations provided in the FHWA report tilted “Background of Superpave
Asphalt Mixture Design and Analysis” (6). After establishing all the estimated properties, the
estimated values obtained for the different trial blends are compared with the volumetric
requirements to determine if any of the trial blends are acceptable or if more trials are needed.
3.5.5 Design Asphalt Content
The optimum asphalt content was determined by compacting and analyzing two
specimens at each of the following four asphalt binder contents:
C Estimated asphalt binder content (obtained previously from the trial blends),
C Estimated asphalt binder content + 0.5%,

40
C Estimated asphalt binder content - 0.5%, and
C Estimated asphalt binder content + 1.0%
Compaction and volumetric properties were evaluated for the selected blend at the
different asphalt binder contents. From these values, graphs of air voids, VMA, and VFA were
plotted as a function of asphalt content. The design asphalt binder content was established at
4.0 percent air voids, and the other mixture properties were checked.
3.6 TESTS FOR ASPHALT CONCRETE EVALUATION
The mixtures designed were tested in the laboratory primarily to evaluate their relative
resistance to permanent deformation. Three types of Superpave shear tests were performed on
all mixtures.
C Simple Shear at Constant Height- A specific shear stress is applied to the sample at
a constant rate. This stress value is maintained for 10 seconds, after which it is
reduced to zero at a defined rate. The height of the specimen is kept constant
throughout the test (43).
C Frequency Sweep at Constant Height- A sinusoidal shear strain with an amplitude
of ±0.05-mm/mm at different frequencies (from 0.1 to 10 Hz) is applied. The
number of cycles applied with each frequency is between 4 and 50 (44). The height
of the specimen is kept constant throughout the test.
C Repeated Shear Test at Constant Stress Ratio- Repeated shear and axial stresses are
applied with a ratio between 1.2 and 1.5 for a certain number of cycles. The
objective of this test is to identify whether the mix will exhibit tertiary plastic flow
(tertiary creep) (45).
For the river gravel mixtures, Repeated Shear at Constant Height was also peformed.
This test is not required by Superpave, but it was developed as a simplified method to predict
premature rutting. In this test, repeated shear and axial stresses are applied, but the axial stress,

41
Figure 3. APA Testing Setup (Rubber Hose is not Shown)
in this case, is required to maintain the specimen at constant height. A detailed explanation of
the tests and results is provided in the next chapter.
All mixtures were tested using Asphalt Pavement Analyzer (Figure 3). Loaded steel
wheels are oscillated over a pneumatic rubber hose located on cylindrical or beam specimens
for a specified number of cycles (usually 8,000) at certain test conditions. The depressions
formed on the sample are measured and termed as APA rut depth. APA rut depth provides an
indication of rut susceptibility of the HMA mixture on a pavement. In this study, only
cylindrical specimens compacted by SGC were tested in the dry condition to assess rutting
susceptibility (Figure 3).


43
CHAPTER 4
EVALUATING SUPERPAVE MIXTURES
4.1 SUPERPAVE SHEAR TESTER (SST)
The SST is used for both permanent deformation and fatigue testing. It is a closed-loop
feedback, servo hydraulic system that consists of four major components.
C Testing apparatus includes a reaction frame and a shear table. The shear table
imparts shear loads. The reaction frame is extremely rigid, so that precise specimen
displacement can be measured without displacements due to frame compliance.
C Test control unit consists of the system hardware and the software. The hardware
is the computer and its peripherals as well as the controllers and signal conditioners.
The software are the algorithms required to control the testing apparatus and to
acquire data.
C Environmental control unit maintains constant temperature and air pressure inside
the testing chamber.
C Hydraulic system provides the required force to load specimens according to the
required testing conditions.
The control unit and the testing apparatus are connected through linear variable
differential transducers (LVDTs). The LVDTs are fixed to the specimen to measure and control
specimen deformations (4).
4.2 PERFORMANCE TESTS
According to the traffic levels selected for this study, an intermediate analysis is required
for the HMA mixtures made using four aggregates. This analysis prediction of permanent
deformation requires:
C frequency sweep at constant height (FSCH),
C simple shear at constant height (SSCH), and
C repeated shear at constant stress ratio (RSCSR).

44
Figure 4. Cox SST Machine Used for HMA Evaluation
The simple shear at constant height and the frequency sweep tests, for Level II analysis,
are performed at a specified temperature called effective temperature for permanent
deformation, Teff(PD). Teff(PD) is defined as a single test temperature at which some amount
of permanent deformation would occur equivalent to that measured by considering each season
separately throughout the year. A detailed procedure for obtaining Teff(PD) is included in the
Superpave Mix Design Manual for New Construction and Overlays, Report SHRP-A-407 (45).
For this study, Teff(PD) was calculated as 46/C for Lubbock, Texas.
Repeated shear at constant stress ratio test is performed at a control temperature, Tc,
which is obtained from the Teff(PD) and the traffic level (45). Several specimens were prepared
and tested at Tc, but test results were questionable, therefore, new specimens were prepared and
tested at Teff(PD). The possible reasons for this inadequate test performance at Tc may be
because of the high temperatures (Reference 45 required testing at 62.8/C), and the
corresponding stress values selected to perform this test.

45
The frequency sweep at constant height and the simple shear at constant height tests
must be performed at three different asphalt contents:
C Design Asphalt Content- when 4 percent voids are achieved at the design number
of gyrations,
C High Asphalt Content- when 3 percent voids are achieved at the design number of
gyrations, and
C Low Asphalt Content- when 6 percent voids are achieved at the design number of
gyrations.
As stated previously, the river gravel was assumed to be more sensitive to permanent
deformation than the limestone or granite, therefore, in order to better characterize its behavior,
additional tests were performed which included additional frequency sweep and simple shear
at constant height tests at 4/C and 20/C, as well as repeated shear test at constant height. For
the granite, limestone and river gravel with rounded natural sand mixtures, a simplified
intermediate analysis was performed. Table 1 summarizes the specimen properties and test
condition for different mixtures.
4.3 SPECIMEN PREPARATION AND INSTRUMENTATION
Specimens were prepared according to the Superpave procedure, as indicated in
Chapter III. The specimens had the following general characteristics (Table 13):
Table 13. Specimen Characteristics
Aggregate mass 4700 gm (approx.)
Asphalt cement mass 250 gm (approx.)
Specimen height 125 mm (approx.)
Specimen diameter 150 mm

46
The specimens were prepared at different asphalt contents and compacted to different
air void contents, depending on the test to be performed:
C Frequency sweep at constant height and simple shear at constant height: River
gravel specimens were prepared at three different asphalt contents (high, design, and
low) and compacted to 7 percent air voids. All other aggregates specimens were
prepared with design asphalt content and 7 percent air voids.
C Repeated shear at constant height: Specimens were prepared at the design asphalt
content and compacted to 4 percent air voids;
C Repeated shear test at constant stress ratio: Specimens were prepared at high asphalt
content and compacted to 3 percent air voids.
The tolerance adopted for compaction was one percentage point for air voids for the
frequency sweep and simple shear at constant height. This is the tolerance suggested in ASTM
D 4867 M-96 (42) for specimens compacted to evaluate moisture sensitivity of asphalt
mixtures. In fact, there was no mention of tolerance for compaction in the AASHTO
provisional standard TP7 (until AASHTO Standard, Interim April 2001).
The tolerance for repeated shear tests at constant stress ratio and constant height was
reduced to 0.5 percentage points, because with low air voids, the mixtures are more sensitive
to permanent deformation. Reducing the tolerance was needed to increase accuracy. A
summary of air void content of compacted specimens is listed in Appendix B.
Both ends of all test specimens were sawed. These saw cuts were perpendicular to the
longitudinal axis of the specimens such that the height of the specimens was 75 ± 2.5 mm. Both
ends have to be smooth and mutually parallel within 2 mm. AASHTO TP7-94 (Standard Test
Method for Determining Permanent Deformation and Fatigue Cracking Characteristics of Hot
Mix Asphalt Using the SST) (43) indicates that, for a nominal maximum aggregate size of 19-
mm, the height of the specimen is 50 mm. As the objective in this research is to determine the
resistance to permanent deformation of different asphalt mixtures while applying shear stresses,
a specimen height of 75 mm was adopted to ensure adequate accuracy. With the greater height,

47
the distance between the ends of the saw cut specimen, which are glued to the platens, and the
LVDTs was greater, and therefore, the distortion due to their proximity to the glued platens was
smaller.
The specimens were glued to the platens using a Superpave gluing device which
compresses the specimen between the platens with a 32-kPa load for 30 minutes, while the glue
sets up. This gluing device rigidly holds the platens and specimen to ensure that the platen faces
are parallel. Test specimens were glued to the platens using Devcon high strength, 5-minute,
fast drying epoxy. After setting, the epoxy was subsequently allowed to cure overnight before
testing the specimens.
After marking their locations with a template, mounting screws were attached to the side
of the specimen with a cyanoacrylate glue with an accelerator, and, once it set up, the horizontal
LVDT holders were attached and the LVDTs were installed. The difference in horizontal
displacement was measured between the two LVDTs with a gage length of 38.1 mm. The tests
were conducted using the Cox & Sons 7000 SHRP Superpave Shear Tester.
The abbreviations used in this report are indicated in Table 14. For example, RGAd20
means River Gravel blend with the gradation passing Above the restricted zone with the Design
asphalt content and tested at 20/C.
Table 14. Abbreviations Used in the Analysis
RG River Gravel (Partially Crushed)
GR Granite (Crushed)
LS Limestone (Crushed)
NS Rounded Natural Sand (with RG as coarse portion)
T, A, B Through, Above, or Below the restricted zone, respectively
d, h, l design, high, or low asphalt content, respectively
4, 20, 46 Test temperature 4, 20, 46/C

48
4.4 FREQUENCY SWEEP AT CONSTANT HEIGHT
FSCH is a shear strain controlled test. The test applies a repeated sinusoidal horizontal
shear strain with a peak amplitude of approximately ± 0.005 percent and a variable axial stress
to maintain constant the height of the specimen. It is the only SST test which uses dynamic
loading. The shear strain is applied at different frequencies, including 10, 5, 2, 1, 0.5, 0.2, 0.1,
0.05, 0.02, and 0.01 Hz. The specified strain level was selected during the SHRP program to
ensure that the viscoelastic response of the asphalt mixture is within the linear range. This
means that the ratio of stress to strain is a function of loading time and not of the stress
magnitude. In some cases within this range of frequencies, it has been observed that, at the high
and low frequencies, the behavior becomes nonlinear. In Reference 47, it is shown that the
dynamic shear modulus (ratio of stress to strain) of asphalt cement is approximately linear
between the frequency range of 0.01to 10 Hz.
Before testing, the specimens were preconditioned by applying a controlled sinusoidal
shear strain at a frequency of 10 Hz for 100 cycles and a peak to peak amplitude of 0.0001
mm/mm. A detailed description of this test method is given in AASHTO TP7, Procedure E
(43) and Superpave Asphalt Mixture Analysis: Lab Notes (46). The number of cycles applied,
sampled cycles, and data points per cycle for the standard procedure were increased in order to
increase accuracy of the results (Table 15).
The axial deformation, shear deformation, axial load, and shear load at each of the ten
different frequencies were recorded. The data obtained from the FSCH test was used to
calculate the material properties: dynamic shear modulus (with its real and imaginary parts),
phase angle, and slope of the dynamic shear modulus versus frequency on a log-log scale.
4.4.1 Dynamic Shear Modulus (G* ) and m-values
Dynamic shear modulus is defined as the ratio of peak stress to peak strain at a given
frequency. It is a measure of total stiffness of asphalt mixtures. It consists of two parts:
C G!, real part or shear storage modulus, elastic behavior.
C G", imaginary part or loss storage modulus, viscous behavior.

49
Table 15. Frequencies, Number of Cycles Applied, and Data Points per Cycle (FSCH)
Frequency (Hz) Total No. of Cycles No. of CyclesSampled
Data Points PerCycle
10 50 10 60
5 50 10 60
2 20 10 60
1 20 10 60
0.5 10 10 60
0.2 10 10 60
0.1 10 10 60
0.05 5 1 60
0.02 5 1 60
0.01 5 1 60
In the Superpave distress model for permanent deformation, the m-value (slope of the
dynamic shear modulus versus frequency on a log-log scale) is used to calculate plastic strain
accumulation during N number of load applications. Validity of the model is based on the
assumption that the higher the test temperature, the higher the m-value will be; and the higher
the m-value, the greater the permanent deformation will be. In Tables 16 and 17 are listed the
different m-values for the different asphalt mixtures. As indicated previously, in some cases
at extreme frequencies, the behavior was not linear, and, therefore, those values were not
considered in obtaining the slope.
In order to compare the asphalt cement rheology with that of asphalt concrete, the
complex shear modulus and shear phase angle of unaged asphalt were determined using the
DSR machine at different frequencies and at three different temperatures (7, 20, and 46/C). The
test results are provided in Appendix A. Figure 5 exhibits the complex shear modulus (G*)
plotted on log-log chart against frequencies tested at three different temperatures. Complex

50
Table 16. Parameter m for River Gravel Mixtures
Mixture Type m-value at 4/C m-value at 20/C m-value at 46/C
RGTd (average) 0.278 0.407 0.260
RGTh (average) 0.287 0.404 0.270
RGTl (average) 0.242 0.342 0.304
RGAd (average) 0.265 0.427 0.283
RGAh (average) 0.393 0.422 0.226
RGAl (average) 0.261 0.339 0.240
RGBd (average) 0.289 0.394 0.210
RGBh (average) 0.321 0.459 0.152
RGBl (average) 0.283 0.419 0.254
Table 17. Parameter m for Granite, Limestone, and Rounded Natural Sand Mixtures
Aggregate Type Mixture Type m-value at 46/C
Crushed Granite GRTd (average) 0.362
GRAd (average) 0.330
GRBd (average) 0.314
Crushed Limestone LSTd (average) 0.440
LSAd (average) 0.419
LSBd (average) 0.337
Rounded Natural Sand NSTd (average) 0.355
NSAd (average) 0.396
NSBd (average) 0.475

51
Figure 5 Complex Shear Modulus of Asphalt Cement versus Frequency
shear modulus of the binder increases with decreasing temperatures and increasing frequencies.
The slope for the asphalt binder increases with increasing temperatures and approaches a value
of 1.0 indicating its tendency to behave as a Newtonian fluid at high temperatures.
From the complex shear modulus versus frequency chart, the m values of asphalt cement
were calculated as 0.613, 0.739, and 0.929 at 7, 20, and 46/C temperature, respectively.
In Figures 6 through11, the complex (dynamic) shear modulus of different mixtures are
plotted against the testing frequencies on log-log chart. The following conclusions appeared
warranted form the graphs:
C Based on Figures 6 to 11 and Tables 16 and 17, the asphalt mixture dynamic shear
modulus, G*, increases when the frequency increases as well as when the
temperature decreases (Note: only river gravel mixtures were tested at three different

52
temperatures). But the dynamic shear modulus slope (m-value) in the asphalt
mixtures behaves different than in the asphalt cement. The slope in the asphalt
mixtures increases with increasing temperatures; it reaches a peak and then
decreases. According to Zhang (47), this is because the rheology of asphalt
mixtures at high temperature is predominantly affected by the aggregate instead of
the asphalt binder. On the other hand, at low temperatures, asphalt cement and
mixtures show a similar trend, indicating that influence of the asphalt cement in the
rheology of the asphalt mixtures is more prominent at low temperatures.
C Validity of the Superpave performance model is based on the assumption that higher
test temperature indicate higher m-values and higher m-values indicate greater
permanent deformation. This assumption is not correct, because the m-value
increases with increasing temperatures, reaches a peak between 4/C and 46/C, and
then decreases. The 1993 Superpave performance model might yield unreasonable
predictions if the parameter m is used as the slope of the permanent deformation
performance model equation. As the parameter S of the performance model
equation is not related to the parameter m, it should be determined from a repeated
load test (47).
C Comparing the m-values of the mixtures with different asphalt contents and at
different temperatures (Table 16) shows that the m-value is greater with high asphalt
contents at low temperatures. But at high temperatures, the m-value is higher at low
asphalt contents. Therefore, at low temperatures, the greater the asphalt content, the
more sensitive to loading times the asphalt mixture will be, but not at high
temperatures.
C Two different “rankings” to characterize the m-values of the asphalt mixtures were
examined. In the first, the different blends (TRZ, ARZ, and BRZ) at the same
temperature and asphalt content were compared (Table 18). In the second, the

53
Figure 6 River Gravel, G* versus Frequency at 4/C
Figure 7 River Gravel, G* versus Frequency at 20/C

54
Figure 8 River Gravel, G* versus Frequency at 46/C
Figure 9 Granite, G* versus Frequency at 46/C

55
different blends were compared at the three different temperatures (Table 19). It is
observed that, at low temperatures, greater m-values correspond to the blends
passing below the restricted zone, but, at high temperatures, greater m-values
correspond to the blends passing through and above the restricted zone. Higher m-
values indicate more sensitivity to loading time for the asphalt mixture.
C G* is highly temperature and frequency dependent. The G* values in the asphalt
mixtures at 46/C, the most concern temperature in permanent deformation ranges
from 1.57×10⁷ to 2.96×10⁸ Pa in river gravel (ratio 18.8), from 3.14×10⁷ to
4.86×10⁸ Pa in granite (ratio 14.16), from 1.52×10⁷ to 3.43×10⁸ Pa in limestone
(ratio 22.5), and from 8.13×10⁶ to 1.29×10⁸ Pa in rounded natural sand mixture
(ratio 15.9). Based on these values, the aggregate most sensitive to gradation is
limestone and the least sensitive is the granite. The stiffest aggregate is granite and
the least is river gravel with rounded natural sand. That is, mixtures containing
rounded natural sand were most prone to rutting.
C Higher G* values indicate more resistance to HMA permanent deformation.
Comparing the G* curves for the different blends and temperatures shows that, for
the river gravel mixtures, greater G* are obtained with low asphalt contents and
lower G* values are achieved with high asphalt contents. Further, blends below the
restricted zone tend to have lower G* values. From the data obtained with the
granite mixtures, the stiffest blends are those which pass through the restricted zone.
For the limestone mixtures, no conclusion regarding which one is stiffer can be
achieved; results depend on frequency (see Table 20). G* for the ARZ mixture
containing rounded natural sand is higher than that of the TRZ and BRZ mixtures.

56
Figure 10 Limestone, G* versus Frequency at 46/C
Figure 11 River Gravel + Rounded Natural Sand, G* versus Frequencyat 46/C

57
Table 18. Comparative Ranking of Asphalt Mixtures Considering m-values
m-value
River Gravel Granite Limestone River Gravel +Natural Sand
High a/c
Design a/c
Low a/c
Design a/c
Design a/c
Design a/c
4/C A>B>T B>T>A B>A>T - - -
20/C B>A>T A>T>B B>T>A - - -
46/C T>A>B A>T>B T>B>A T>A>B A>T>B B>A>T
Table 19. Ranking of Asphalt Mixtures Considering m-values
m-value 1st
(worst)2nd 3rd 4th 5th 6th 7th 8th 9th
(best)
RG at 4/C Ah Bh Bd Th Bl Td Ad Al Tl
RG at 20/C 5h Ad Ah Bl Td Th BB Tl Al
RG at 46/C Tl Ad Th Td Bl Al Ah Bd Bh
GR at 46/C Td Ad Bd
LS at 46/C Ad Td Bd
NS at 46/C Bd Ad Td
(*) 1st indicates the greatest m-value and 9th indicates the smallest one.

58
Table 20. Ranking Asphalt Mixtures Considering G*
G* value 1st
(best)2nd 3rd 4th 5th 6th 7th 8th 9th
(worst)
RG at 4/C Ad Tl Td * * * Bh Bd Ah
RG at 20/C Tl * * * * * * Bd Bh
RG at 46/C Tl Al * * * * * Bd Bh
GR at 46/C Td Bd Ad - - - - - -
LS at 46/C * * Td - - - - - -
NS at 46/C Ad * * - - - - - -
* indicates that there is no clear classification.
- indicates there is no data available.
4.4.2 Shear Phase Angle
Shear phase angle is defined as the lag time between the application of a stress and the
corresponding strain.
Figures 12 through 18 show shear phase angle versus frequency for the asphalt cement
binder and the HMA mixtures tested. Based on these findings, the following conclusions
appear warranted:
C The shear phase angle in the asphalt cement is highly temperature and frequency
dependent. The phase angle values ranged from 45 to 89 degrees. At the high
temperature (46/C) and low frequency (0.01 Hz), the phase angle is very near 90
degrees. At the high frequency (10 Hz) and low temperature (7/C), the phase angle
was very near 45 degrees (i.e., elastic and viscous components of the asphalt cement
are similar).
C In the HMA mixtures, the shear phase angle decreases with increasing frequencies
and decreasing temperatures for intermediate (20/C) and low temperatures (4/C),
as with the asphalt cement. But at high temperatures, the shear phase angle

59
Figure 12 Shear Phase Angle of Asphalt versus Frequency
decreases with decreasing frequencies (opposite from the asphalt cement). In the
HMA mixtures, the slope of phase angle as a function of frequency at intermediate
and low temperatures is smaller than at high temperatures, which means that it is
less dependent on time of loading at low and intermediate temperatures than at high
temperatures (opposite from the asphalt cement).
C At low temperatures, the shear phase angle in the HMA mixtures for the frequencies
studied, ranged from 22 to 45 degrees; at intermediate temperatures, from 26 to 56
degrees; and at high temperatures, from 32 to 68 degrees. Therefore, at high
temperatures, the asphalt mixture exhibit more viscous behavior than at low
temperatures, but it will be highly dependent on loading time. At high temperatures,
the HMA mixture exhibited predominantly elastic behavior at low frequencies and
a viscous behavior at high frequencies. For the HMA mixtures at low and
intermediate temperatures, the elastic shear modulus component is generally greater
than the viscous component (mainly at high frequencies).

60
Figure 13 River Gravel, Phase Angle versus Frequency at 4/C
Figure 14 River Gravel, Phase Angle versus Frequency at 20/C

61
Figure 15 River Gravel, Phase Angle versus Frequency at 46/C
Figure 16 Granite, Phase Angle versus Frequency at 46/C

62
Figure 17 Limestone, Phase Angle versus Frequency at 46/C
Figure 18 River Gravel + Rounded Natural Sand Phase Angle versusFrequency at 46/C

63
C At low and intermediate temperatures, the shear phase angle of the asphalt cement
and asphalt mixture follow similar trends with the different frequencies because this
property of the asphalt mixture is primarily affected by the binder at these
temperatures. But, at high temperatures, asphalt cement and asphalt mixtures
exhibit opposite trends because, at high temperatures, the shear phase angle of the
mixture is more affected by the aggregate (mainly at low frequencies).
C Lower phase angles indicate more resistance to permanent deformation of the
asphalt mixture. Figures 13 through 15 show that high asphalt contents give higher
phase angles, and low asphalt contents give lower phase angles. See also Table 21.
C Regarding the restricted zone, no clear trends from the shear phase angle can be
obtained.
C The range of shear phase angle values in the HMA mixtures at 46/C is from 32 to
68 degrees in the river gravel mixtures (ratio 1.75), from 35 to 60 degrees in the
granite mixtures (ratio 1.50), from 36 to 58 degrees in the limestone mixtures (ratio
1.44), and from 12 to 67 degree in the gravel plus rounded natural sand mixtures
(ratio 5.6). The test results from the rounded natural sand mixture are questionable.
Even at the same frequency (0.01 Hz), the phase angle varies 12 to 30 degrees
among mixtures of different gradations, which is very unusual. Again, these data
indicate that the river gravel mixtures are the most susceptible to permanent
deformation (the phase angle values and its range are greater).
4.4.3 G*/sin δ Ratio
For rutting resistance to be contributed by asphalt cement, a high complex modulus, G*,
and low phase angle, δ, are both desirable. The ratio used in Superpave to determine the
resistance to permanent deformation by asphalt cements is G*/sin δ at different temperatures.
The greater this ratio, the more resistant to permanent deformation the asphalt cement will be.

64
Table 21. Ranking Asphalt Mixtures Considering Phase Angle
δ value 1st (worst) 2nd 3rd 4th 5th 6th 7th 8th 9th (best)
RG at 4/C Ah Bh Al * * * * Ad Tl
RG at 20/C Bh Th Ah * * * * Al Tl
RG at 46/C Bh Th * * * * Tl Al Bh
GR at 46/C * * Bd - - - - - -
LS at 46/C * * * - - - - - -
NS at 46/C * * * - - - - - -
* indicates that there is no clear classification.
- indicates there is no data available.
A comparison of the G*/sin δ values for the different asphalt mixtures was conducted.
Figures19 through 25 show G*/sin δ as a function of test frequency for the asphalt cement and
different mixtures. Comparing these figures has produced the following conclusions:
C For the river gravel mixtures, the blends through and above the restricted zone were
the more resistant to permanent deformation, at the temperatures tested, and the
blends below the restricted zone were more prone to rutting (Table 23). For the
granite mixtures, the blends through the restricted zone were most resistant to
permanent deformation. For the limestone mixtures, no clear trends were observed.
Note that G*/sin δ depends on the frequency selected.
C Lower asphalt contents indicate more resistance to permanent deformation of the
HMA mixture. The graphs, indicate that low asphalt contents give higher G*/sin
δ values than higher asphalt contents. For a constant air void content in all the
blends, higher asphalt contents generally yield higher susceptibility to permanent
deformation. See Table 22.

65
Figure 19 G*/sin δ versus Frequency for Asphalt Cement
C The rankings provided in Table 22 are very similar to those in Table 20 (rankings
of the asphalt mixtures considering G*). This indicates that G* has a much greater
effect than sin δ in the ratio G*/sin δ.
Table 22. Ranking Asphalt Mixtures Considering G*/sin δ
G*/sin δ 1st (best) 2nd 3rd 4th 5th 6th 7th 8th 9th (worst)
RG at 4/C Ad Tl Td Th * * * * Bd
RG at 20/C Tl Ad Al * * * * Bd Bh
RG at 46 /C Tl Al * * * * * Bd Bh
GR at 46/C Td Bd Ad - - - - - -
LS at 46/C * * Td - - - - - -
NS at 46/C Ad * * - - - - - -
* indicates that there is no clear classification
- indicates there is no computed data
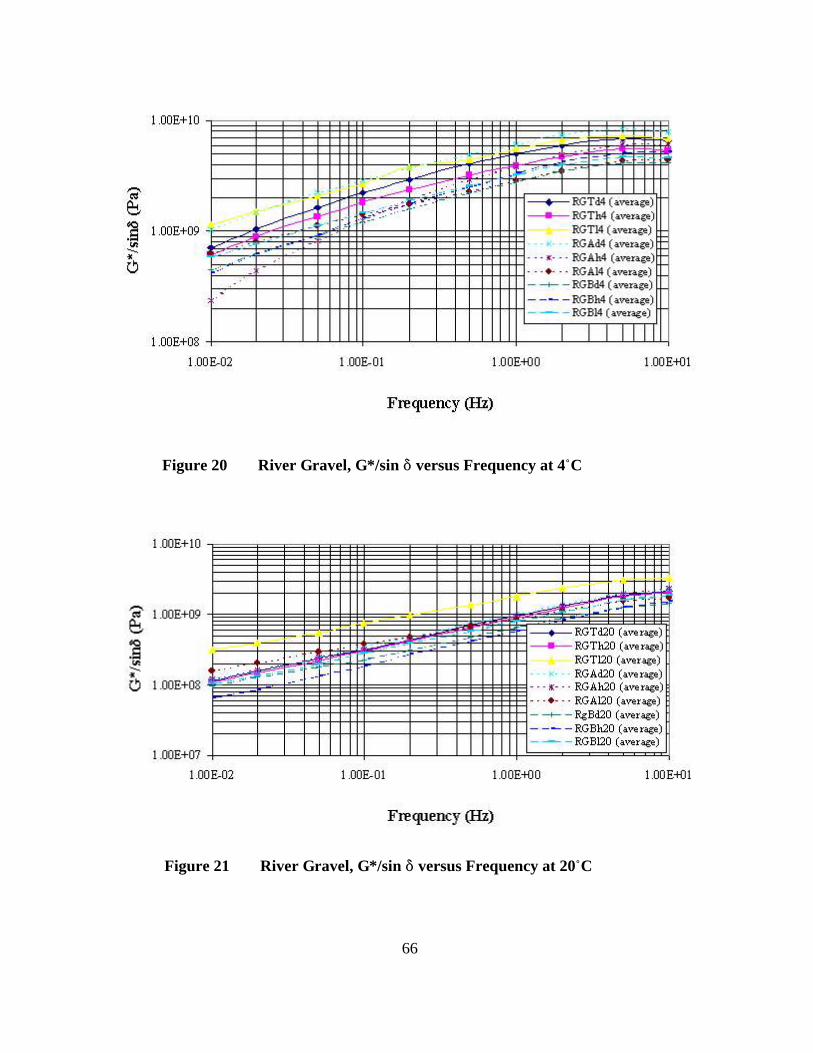
66
Figure 20 River Gravel, G*/sin * versus Frequency at 4/C
Figure 21 River Gravel, G*/sin * versus Frequency at 20/C

67
Figure 22 River Gravel, G*/sin * versus Frequency at 46/C
Figure 23 Granite, G*/sin * versus Frequency at 46/C

68
Figure 24 Limestone, G*/sin * versus Frequency at 46/C
Figure 25 River Gravel + Rounded Natural Sand, G*/sin* versusFrequency at 46/C

69
4.5 SIMPLE SHEAR AT CONSTANT HEIGHT
The SSCH is a shearing stress controlled test. The test is performed at different stress
levels depending on the test temperature. Shear stress was applied at a rate of 70 ± 5 kPa per
second up to the stress level indicated in Table 23. The stress level was maintained for 10
seconds, and, afterwards, it was reduced to 0 kPa at a rate of 25 kPa/s. As the specimen is
sheared, it tries to dilate (increase in height). A controlled axial load is applied to maintain a
constant specimen height.
All specimens were preconditioned for 100 cycles with a shear stress having a peak
magnitude of approximately 7 kPa. Each cycle has a duration of 0.7 seconds, consisting of a
0.1-second loading period followed by a 0.6-second rest period in a haversine wave form.
Table 23. Stress Levels Applied in the SSCH Test
Test Temperature Shear Stress, kPa
4/C 345
20/C 105
46/C 35
The SSCH was performed after the frequency sweep at constant height using the same
specimens. The tests at the lowest temperatures were performed first. A detailed description
of this test method is provided in AASHTO TP7, Procedure D (43) and Superpave Asphalt
Mixture Analysis: Lab Notes (46).
Material properties obtained from this test are maximum shear strain, plastic and elastic
shear strain, and permanent deformation after the first load application.
A summary of the blends and temperatures at which the SSCH test was performed is
given in Table 1.

70
4.5.1 Maximum Shear Strain
The maximum shear stress was the same for all SSCH specimens tested at a given
temperature. Therefore, it is possible to compare the expected performance of the different
mixtures based on the maximum shear strain resulting from the applied shear stress at a given
temperature. Mixtures exhibiting low strains are expected to be more resistant to permanent
deformation. From the rankings in Table 24 and Figure 26, the following conclusions are given:
C Blends more susceptible to permanent deformation are those which pass below the
restricted zone for river gravel and limestone and those which pass above the
restricted zone for granite. Blends more resistant to permanent deformation are
those which pass above the restricted zone for river gravel and limestone and those
which pass through the restricted zone for granite.
C Mixtures with higher asphalt contents exhibited more susceptibility to permanent
deformation.
C Performance of the HMA mixtures at 46/C and 20/C was similar, but, at 4/C, they
were different (Table 24).
C Both River gravel blends exhibited greater maximum shear strain than granite or
limestone blends, thus indicating more susceptibility to rutting (Figure 26).
Table 24. Ranking Asphalt Mixtures Considering Maximum Shear Strain
Max. Shear Strain
1st
(worst)2nd 3rd 4th 5th 6th 7th 8th 9th
(best)
RG at 4/C Ah Al Bd Th Bh Bl Td Ad Tl
RG at 20/C Bh Bd Bl Ah Td Al Ad Th Tl
RG at 46/C Bh Bd Bl Th Td Ah Ad Al Tl
GR at 46/C Ad Bd Td - - - - - -
LS at 46/C Bd Td Ad - - - - - -
NS at 46/C Bd Ad Td - - - - - -
- indicates there is no computed data.

71
Figure 26 Maximum Shear Strain at 46/C for Different Mixtures
4.5.2 Permanent Shear Strain
As indicated previously, the maximum shear stress was the same for all SSCH
specimens tested at a given temperature. Therefore, it is possible to compare the expected
performance of the different mixtures based on the permanent shear strain resulting from the
applied shear stress. Mixtures with low permanent strains are expected to be more resistant to
permanent deformation. From the rankings presented in Table 25 and Figure 27, the same
conclusions as those for the maximum shear strain are supported.

72
Figure 27 Permanent Shear Strain at 46/C for Different Mixtures
Table 25. Ranking Asphalt Mixtures Considering Permanent Shear Strain
Max. Shear Strain
1st
(worst)2nd 3rd 4th 5th 6th 7th 8th 9th
(best)
RG at 4 /C Ah Al Bd Bh Th Bl Td Ad Tl
RG at 20 /C Bh Bd Bl Ah Td Al Ad Th Tl
RG at 46 /C Bh Bd Bl Th Td Ah Ad Al Tl
GR at 46 /C Ad Bd Td - - - - - -
LS at 46 /C Bd Td Ad - - - - - -
NS at 46 /C Bd Td Ad - - - - - -
- indicates there is no computed data.

73
4.5.3 Recovered Shear Strain
Recovered (elastic) strains of the different SSCH specimens were compared to rankings
the blends. Recovered strain was measured 10 seconds after loading the specimen according
to AASHTO TP7, Procedure D (43). Analyzing the data revealed that at 46/C, the recoverable
strain is about 15 percent to 30 percent of the maximum strain. At 20/C, the recoverable strain
is between a 30 percent to 40 percent of the maximum strain. And, at 4/C, it is between a 40
percent to 50 percent of the maximum strain. A ratio between recovered and maximum
deformation in the different blends can be computed. Smaller recoverable strain in the SSCH
test indicates greater permanent and maximum shear strain and thus more rutting (assuming the
same temperature). Comparing the rankings prepared in Table 26 and Figure 28 indicate:
C Higher asphalt contents yield greater recoverable strain.
C The percentage of recoverable strain in a specimen increases when the temperature
decreases, because the asphalt cement is more elastic at low temperatures.
C For the river gravel mixtures, recoverable shear strain is greater in the blends
passing below the restricted zone. For the limestone and granite mixtures, the
higher recoverable strains are in the blends passing above the restricted zone.
Table 26. Ranking Asphalt Mixtures Considering Recoverable Shear Strain
Max. Shear Strain
1st
(Best) 2nd 3rd 4th 5th 6th 7th 8th 9th
(Worst)
RG at 4/C Ah Al Bd Th Bh Bl Tl Td Ad
RG at 20/C Bh Bd Bl Al Ah Td Ad Th Tl
RG at 46/C Bd Bh Bl Th Td Tl Ah Ad Al
GR at 46/C Ad Td Bd - - - - - -
LS at 46/C Ad Td Bd - - - - - -
NS at 46/C Td Bd Ad - - - - - -
- indicates there is no computed data

74
Figure 28 Elastic Shear Strain at 46/C for Different Mixtures
4.5.4 Permanent Shear Strain After the First Load Application
Permanent strain after the first load application from the SSCH is used as the
independent term in the Superpave performance model. To obtain the permanent shear strain
after the first load application, a loading time of 0.02 seconds was selected. This is
representative of the range of loading times occurring in practice and equivalent to a vehicle
speed of 70 km/hr (40 mph) according to McLean’s (49)square wave loading. This time of
loading value has also been suggested by Shell (50). In Table 27 and Figures 29 and 30,
permanent shear strains after the first load application are provided. These data support the
following conclusions:

75
C The blends which developed the greatest early permanent strains are those which
pass below the restricted zone for river gravel and limestone and those which pass
above the restricted zone for granite.
C Mixtures with higher asphalt contents usually exhibited greater early permanent
deformation.
C Rankings of blends at 46/C and 20/C was similar, but, at 4/C, the rankings were
different.
C Blends prepared with river gravel appeared more susceptible to rutting.
C Rankings obtained here are very similar to those obtained for maximum and
permanent shear strain.
Table 27. Permanent Deformation after the First Load Application
Max. Shear
Strain
Td Th Tl Ad Ah Al Bd Bh Bl
RG at 4/C 1.45E-6 2.99E-6 1.16E-6 1.25E-6 6.82E-6 4.62E-6 3.84E-6 2.93E-6 1.89E-6
RG at 20/C 2.85E-6 2.34E-6 1.08E-6 2.41E-6 2.91E-6 2.67E-6 4.59E-6 5.53E-6 3.50E-6
RG at 4/C 1.07E-5 1.23E-5 3.99E-6 7.00E-6 1.22E-5 5.48E-6 1.93E-5 1.97E-5 1.46E-5
GR at 46/C 2.83E-6 - - 4.21E-6 - - 3.37E-6 - -
LS at 46/C 5.41E-6 - - 3.65E-6 - - 7.50E-6 - -
NS at 46/C - - - - - - - - -
- indicates there is no data available

76
Figure 30 Permanent Shear Strain After the First Load Cycle at 46/C
Figure 29 Permanent Shear Strain of RG at 4/C and 20/C at First Load Cycle

77
4.6 REPEATED SHEAR AT CONSTANT STRESS RATIO
RSCSR evaluates the potential for tertiary flow of asphalt mixtures. This form of rutting
normally occurs at low air void contents and is the result of mixture instability.
In the RSCSR test, a repeated synchronized haversine shear and axial load pulses are
applied to the specimen. The load cycle requires 0.7 seconds, wherein a 0.1-second load is
followed by 0.6-second rest period. The ratio of haversine axial load to shear load was
maintained at a constant ratio within the range of 1.2 to 1.5. This test was performed at high
asphalt content (asphalt content corresponding to three percent air voids at Ndes) to enhance
tertiary rutting for the aggregate type and gradation. The shear stress and axial stress selected
correspond to a strong base condition was 98 kPa and 148 kPa, respectively(6, 46).
The specimens were preconditioned by applying 100 cycles of shear load pulses with
a peak magnitude of 7±1 kPa and corresponding axial loads. After preconditioning the
specimens, the repeated shear test was initiated. A detailed description of this test method is
given in AASHTO TP7, Procedure C (43).
Test specimens were subjected to 10,000 load cycles at a temperature of 46/C. No
tertiary flow was observed in any specimen, but the data obtained was analyzed to characterize
the asphalt mixtures at the test conditions. From this test and the Superpave performance model
(Table 28 and Figure 31), the following is concluded:
C Blends with highest permanent deformation, after 10,000 cycles, are those which
pass below the restricted zone for river gravel, limestone, and river gravel + rounded
sand and those which pass above the restricted zone for granite.
C Blends most resistant to permanent deformation are those which pass above the
restricted zone for river gravel, limestone, and river gravel + rounded sand and those
which pass below the restricted zone with granite.
C River gravel mixtures are more prone to permanent deformation than any other
mixture.
C Similar S-values (slope of log ε p (Ν) versus log (N)) were obtained for the different
gradations when the same aggregate, test temperature, and loading conditions were
used (Table 29).

78
Figure 31 Permanent Shear Strain After 10,000 Cycles for RSCSR Test
Table 28. RSCSR S-Values at 46/C
Aggregate Type S-value
River Gravel 0.537-0.571
Granite 0.347-0.406
Limestone 0.387-0.422
Rounded Natural Sand 0.386-0.419

79
Table 29. Permanent Shear Strain Models from RSCSR
River Gravel
RGTh46 log(ε (Ν)) = log(1.371E-4) + 0.5374 × log(N)
RGAh46 log(ε (Ν)) = log(6.721E-5) + 0.5625 × log(N)
RGBh46 log(ε (Ν)) = log(1.251E-4) + 0.5714 × log(N)
Granite
GRTh46 log(ε (Ν)) = log(1.605E-4) + 0.4062 × log(N)
GRAh46 log(ε (Ν)) = log(4.426E-4) + 0.3476 × log(N)
GRBh46 log(ε (Ν)) = log(3.045E-4) + 0.3846 × log(N)
Limestone
LSTh46 log(ε (Ν)) = log(3.033E-4) + 0.4226 × log(N)
LSAh46 log(ε (Ν)) = log(2.456E-4) + 0.3872 × log(N)
LSBh46 log(ε (Ν)) = log(2.641E-4) + 0.4186 × log(N)
River Gravel +
Rounded Natural
Sand
NSTh46 log (ε (N)) = log (2.687E-4) + 0.3862 * log (N)
NSAh46 log (ε (N)) = log (8.372E-5) + 0.4121* log (N)
NSBh46 log (ε (N)) = log (3.684E-4) + 0.4192 * log (N)
ε (Ν) is the permanent shear strain after N cycles
4.7 REPEATED SHEAR AT CONSTANT HEIGHT
The RSCH test is not required by Superpave. It was developed as a simplified method
for Superpave Levels 2 and 3 to estimate rut depth. In the RSCH test, repeated haversine shear
load pulses (68 kPa) are applied to the specimen. When the repeated shear load is applied, the
test specimen tends to dilate. To prevent vertical dilation, a controlled axial load is applied to
keep the specimen at a constant height. The load cycle requires 0.7 seconds, wherein a 0.1-
second load is followed by 0.6-second rest period. This test was performed at the design asphalt
content (asphalt content corresponding to four percent air voids at Ndes) using only the mixtures
containing river gravel.
Before testing, the specimens were preconditioned by applying 100 cycles of a
haversine shear load with a peak magnitude of 7±1 kPa. After preconditioning, the specimens

80
were subjected to 5,000 load cycles at a temperature of 59/C in accordance with ATS Manual,
Version 3.1 (48) and AASHTO TP7, Procedure F (43). This temperature was obtained from the
maximum pavement design temperature expected at a depth of 5 cm and increased by two times
the standard deviation to give 97 percent reliability.
The average (of two specimens) peak shearing strain obtained at the end of 5,000 load
cycles are reported in Table 30. With this number of cycles, the asphalt mixture was modeled
(Table 30). The equivalence between the load cycles applied at the test conditions described
and the number of ESALs is estimated to be (48):
log (test cycles) = - 4.36 + 1.24 × log (ESALs)
Table 30. Permanent Shear Strain Models from RSCH
Mixture Type Peak Shear Strain Model
RGTd46 0.046 log(ε (Ν)) = log(8.815E-4) + 0.4678 × log(N)
RGAd46 0.030 log(ε (Ν)) = log(4.733E-4) + 0.4838 × log(N)
RGBd46 0.057 log(ε (Ν)) = log(1.028E-4) + 0.4724 × log(N)
(*) ε (Ν) is the permanent shear strain after N cycles
The following are observed from the test results:
C Blends with higher permanent deformation are those which pass below the restricted
zone. The blends more resistant to permanent deformation are those which pass
above the restricted zone.
C The difference in performance between the gradation TRZ and that BRZ is small
(Table 31).
C Similar S-values (slope of log ε p (Ν) versus log (N)) were obtained for the three
different gradations. The S-values obtained from RSCH test and those obtained
from the RSCSR test show that, with the same aggregate type, test temperature, and

81
load conditions, similar S-values were achieved for the different gradations (Table
31).
Table 31. RSCH S-values and Permanent Deformation after 10 Million ESALs
Mixture S-value ε10ΜRGTd46 0.4678 0.0934
RGAd46 0.4838 0.0590
RGBd46 0.4724 0.1137
4.8 ASPHALT PAVEMENT ANALYZER
All twelve mixtures were tested for rutting using the Asphalt Pavement Analyzer. Four
cylindrical specimens for each mixture were prepared using the Superpave gyratory compactor.
Specimen size was 150 mm in diameter and 75 mm in height. The APA manufacturer
recommends using three pairs of specimens for each mixture. But due to shortage a of
materials, only two pairs of specimens were prepared for each mixture. Specimens were
prepared with 4% air voids and rutting tests were performed at 64 /C. Each set of specimens
was subjected to 8,000 load cycles (51). The wheel load and hose pressure were 445 N and 700
kPa, respectively. The average of two rut depths measured on two sets of specimens is reported
as mixture rut depth.
Table 32 exhibits the rut depths measured for each specimen after 8,000 APA load
cycles. There is no indication that mixtures passing through the restricted zone produce highest
rutting. The river gravel + rounded sand mixture yielded the highest rut depth and the river
gravel mixture yielded the second highest rut depth (Figure 32). Rut depth for river gravel +
rounded sand and crushed river gravel mixtures are similar. This phenomenon could be
attributed to the fact that the design asphalt contents for rounded sand mixtures were

82
significantly lower than those for the crushed river gravel mixtures. For both gravel mixtures,
those gradings passing below the restricted zone produced the highest rut depths.
Granite and limestone yielded much less rutting than the two river gravel mixtures. For
these mixtures, the highest rutting was shown for the granite BRZ mixture and the limestone
ARZ mixture.
Table 32. APA Rut Depths for Different Mixtures
Mixture Type Rut Depth (mm)
Specimen 1 Specimen 2 Average
River
Gravel
Above RZ 8.05 8.09 8.07
Through RZ 11.11 10.75 10.93
Below RZ 13.44 14.25 13.85
Granite Above RZ 4.27 2.74 3.51
Through RZ 2.88 3.47 3.18
Below RZ 5.22 4.23 4.73
Limestone Above RZ 4.75 5.11 4.93
Through RZ 4.61 3.84 4.22
Below RZ 4.68 4.09 4.38
Rounded
Natural
Sand
Above RZ 9.72 10.04 9.88
Through RZ 10.71 8.46 9.58
Below RZ 17.12 13.81 15.47

83
Figure 32 Average Rut Depth Measured by APA after 8,000 Cycles
4.9 SUMMARY OF LABORATORY TEST DATA AND DISCUSSION
4.9.1 General Observation
A summary of all the test data (Table 33) consistently reveals that the restricted zone has
no effect on the rutting susceptibility of the Superpave asphalt mixtures tested. The data further
reveals that, generally, the coarser mixtures BRZ are the most rut susceptible and the finer
mixtures ARZ are the least rut susceptible. Similar findings were reported by Hand et al. (9),
Hand et al. (36), and Mallick et al. (37). These findings refute the widely accepted concept that
coarse-graded mixtures are normally more resistant to rutting than similar fine-graded mixtures.
However, the authors still believe this concept to be generally true.
It should be pointed out that Superpave HMA mixtures are, by design, coarser graded
than preceding conventional mixtures, this is particularly true of those gradings passing below
the restricted zone, which were advocated by SHRP researchers. The authors believe this was

84
a move in the right direction. However, due to lack of funding to study the fundamentals of the
“new” aggregate gradations proposed by the SHRP researchers, the VMA requirement used with
former conventional dense-graded mixtures were adopted for the Superpave mixtures. Coarser
graded HMA mixtures, such as Superpave mixtures BRZ, possess a greater unit volume of
aggregate than conventional dense-graded mixtures and, for optimum rutting performance, may
have lower capacity for VMA and even air voids.
It should also be pointed out that this study examined 19-mm nominal maximum size
HMA mixtures. In order to meet the Superpave VMA requirements during design of mixtures,
the filler content had to be minimized in all the mixtures which, in turn, yielded a relatively low-
viscosity mastic and thick asphalt films, particularly for the coarser graded mixtures (BRZ)
which possess the lowest specific surface area of the three mixture types (ARZ, TRZ, and BRZ).
The low viscosity mastic and thick films may have contributed to the relatively poor rutting
performance of the HMA mixtures BRZ.
In conclusion, if VMA requirements for HMA mixtures are excessive, this may:
# cause difficulty in obtaining a mixture design that meets the VMA specification,
# force the use of fine-graded mixtures (ARZ),
# invite the introduction of excessive sand-size particles or the production of gap-
graded mixtures,
# disallow sufficient filler (minus No. 200 material),
# promote excessive film thickness,
# needlessly increase the asphalt binder content and thus the cost of the mixture,
# produce a mixture that exhibits tenderness during construction, and/or
# produce a more rut-susceptible mixture (just the opposite of the purpose of VMA
requirements)
All of these circumstances have been experienced at one time or another with Superpave
mixtures.

85
Table 33. SST and APA Test Summary
Test
Type
Measured Property Partially
Crushed River
Gravel
Crushed
Granite
Crushed
Limestone
Rounded
Natural Sand
FSCH G* A ≅ T > B T > A > B A ≅ B > T A > T ≅ B
G*/sinδ A ≅ T > B T > A > B A ≅ B > T A > T ≅ B
SSCH Max Shear Strain A > T > B A ≅ T > B A > T > B A > T > B
Perm Shear Strain A > T > B T > A > B A > T > B A > T > B
Elastic Shear Strain A > T > B A > T > B A ≅ T > B A ≅ B > T
Perm Shear Strain @ N=1 A > T > B T > B > A A > T > B -- -- --
RSCSR Perm Deformation A > T > B T > A ≅ B A > T ≅ B A > T > B
RSCH Perm Deformation A > T > B -- -- -- -- -- -- -- -- --
APA Rut Depth A > T > B T > A > B T > B > A T > A > B
A= Above, T= Through, B= Below; A > B Means A is more rut resistant than B
-- no data available.
4.9.2 Statistical Analysis
So far, all the tables prepared for ranking were based upon the numerical value of the
visually observed nature of graphs (average of two specimens). The ranking data in Table 33 was
examined statistically. Each HMA parameter was compared with respect t above, through, and
below the restricted zone gradations for each mixture type.
The frequency sweep test properties (e.g., G* and G*/sin*) were analyzed based on their
values at 10 Hz frequency only. This frequency level is comparable with highway speed.
Analysis of variance (ANOVA) and least significance difference (LSD) multiple comparison
method were used to analyze these parameters at a 5 percent confidence level. No difference was
found between the different gradations for any of the four mixtures.
At a 5 percent confidence level, maximum shearing strain measured by SSCH test for
granite, limestone, and river gravel mixtures do not show any difference between their three
gradations. In the case of the rounded natural sand mixture, below and through gradation and
through and above gradation are statistically the same, but above and below are not the same.

86
The below the restricted zone gradation mixture containing rounded natural sand produces
significantly more maximum shearing strain than the corresponding above restricted zone
gradation mixture. A similar trend is observed for permanent shearing strain measured by SSCH
test. Granite, limestone, and river gravel mixture do not exhibit any significant difference
between the different gradations for the permanent shearing strain property. But for the mixture
containing rounded natural sand, below the restricted zone gradation produce significantly more
strain than that of the above restricted zone gradation. There is no significant differences in
elastic shearing strain measured by SSCH test among the three gradations for mixtures
containing granite, limestone, and rounded natural sand. Elastic shearing strain for below
restricted zone is significantly higher than above and through restricted zone for the mixture
containing river gravel.
Above, through, and below gradation do not exhibit any significant difference with
respect to the property measured by RSCSR test for the mixtures containing granite, limestone,
and river gravel. Permanent shearing strain measured by the RSCSR test on the through
restricted zone rounded natural sand mixture is higher than that of the above restricted zone
rounded natural sand mixture. Again, the below restricted zone natural sand mixture yields
higher permanent shearing strain than the through restricted zone mixture. The RSCH test was
performed only with the river gravel mixture. There is no significant difference between the three
gradations with respect to the property measured by RSCH test.
The APA results were examined using ANOVA and LSD tests at a 5 percent confidence
level. The granite and limestone mixtures do not exhibit any statistically significant differences
between the three gradations. For the river gravel mixtures, the below gradation produced more
rut depth than the through gradation and the through gradation produce more rut depth than the
above gradation. For the mixtures containing rounded natural sand, the above and through
gradations produced statistically equivalent rut depths and they are lower than the rut depth
produced by the below gradation.
The above statistical analyses confirm that there is no indication that the through
restricted zone gradation yields inferior mixtures compared to other gradations, and in some
cases, the below restricted zone mixtures were inferior.

CHAPTER 5
CONCLUSIONS AND RECOMMENDATIONS
5.1 CONCLUSIONS
Laboratory experiments were performed to predict the permanent deformation of
Superpave HMA using four aggregate types with gradations that pass through, below, or above
the restricted zone. The aggregates selected for this research were 100 percent crushed granite,
100 percent limestone, 100 percent partially crushed siliceous river gravel, and partially crushed
river gravel plus rounded sand. Rutting susceptibility of HMA mixtures was measured using
SSCH, FSCH, RSCSR, and RSCH with the Superpave SST and the APA. Based on the
findings, the following conclusions and recommendations appear warranted:
• No relationship between the restricted zone and permanent deformation was found
using HMA mixtures of high to relatively low quality.
• Superpave HMA mixtures above the restricted zone were generally most resistant to
permanent deformation and mixtures below the restricted zone were generally most
susceptible to permanent deformation (see data summary in Table 33).
• Aggregate shape and surface texture play a very important role in permanent
deformation of HMA. Blends prepared with partially crushed river gravel were more
sensitive to permanent deformation than those prepared with quarried limestone or
granite. The crushed river gravel retained some of its original rounded surfaces and
smooth surface texture.
• Fairly consistent permanent deformation rankings for HMA were obtained using the
five different tests performed and nine different test parameters (Table 34).
• Asphalt mixture rheology responds differently at high temperatures than at low
temperatures. At high temperatures, HMA rheology is predominantly affected by the
aggregate, but at low temperatures, it is predominantly affected by the asphalt
cement.

88
• Similar S-values (slope of accumulated permanent strain versus number of loads
applications on a log-log scale) were obtained from the repeated shear test at constant
stress ratio and constant height for the different gradations when using the same
aggregate type and test conditions. This indicates that grading had little effect on
rutting even when the grading passed through the restricted zone.
• The m-value (slope of the dynamic shear modulus versus frequency on a log-log
scale) should not be used as the slope of the permanent deformation equation in the
Superpave performance model because this might yield unreasonable values of
permanent deformation.
• Extreme caution should be exercised when conducting SST procedures at high test
temperatures (> 55/C), because the accuracy of the results decrease at temperatures
above 55/C.
• Until validation of the 1993 Superpave performance model, which was used herein
to predict rutting, these tests results should only be used for comparative rankings.
5.2 RECOMMENDATIONS
• The restricted zone should be eliminated form the Superpave specifications.
• Test temperatures above 55/C should be avoided in the Superpave shear tester. Due
to the Superpave shear tester characteristics, it is possible to perform the tests at a
greater number of cycles without an excessive test temperature to simulate severe
loading conditions.
• Similar S-values (slope of accumulated permanent strain versus number of load
applications in a log-log scale) were obtained for HMA with different gradations
tested using the same aggregate type, test temperature, and load conditions. A wider
range of aggregate gradations should be tested in order to check this relationship.

89
REFERENCES
1. Federal Highway Administration. Our Nation’s Highway. PL-98-015. Federal Highway
Administration, Office of Highway Information Management, Washington, DC, 1998.
2. Jahn, D. W. A Closer Look at Superpave Aggregate Specification. 4th Annual Symposium
Proceedings, ICAR, Atlanta, Georgia, 1996.
3. Anderson, R. M. and H. U. Bahia. Evaluation and Selection of Aggregate Gradations for
Asphalt Mixtures Using Superpave. In Transportation Research Record 1583, TRB,
National Research Council, Washington, DC, 1997.
4. Asphalt Institute. Superpave Mix Design, Superpave Series No. 2. SP-2. Asphalt
Institute, Lexington, KY, 1996.
5. Cominsky, R., R. B. Leahy, and E. T. Harrigan. Level One Mix Design: Material
Selection, Compaction, and Conditioning. Report SHRP-A-408. Strategic Highway
Research Program, National Research Council, 1994.
6. McGennis, R. B., R. M. Anderson, T. W. Kennedy, and M. Solaimanian. Background
of Superpave Asphalt Mixture Design and Analysis. Report SA-95-003. Federal Highway
Administration, U.S. Department of Transportation, 1994.
7. Brown, E. R., and S. A. Cross. A National Study of Rutting in Hot Mix Asphalt (HMA)
Pavements. In Proceedings, Vol. 61, Association of Asphalt Paving Technologists, 1992.
8. Kennedy, T. W., P. S. Kandhal, S. F. Brown, D. Y. Lee, and F. L. Roberts. Hot Mix
Asphalt Materials, Mixture Design and Procedure. NAPA Research and Education
Foundation, Lanham, MD, 1996.
9. Hand, A. J. and A. L. Epps. Impact of Gradation Relative to the Superpave Restricted
Zone on HMA Performance. A Paper Submitted for Presentation and Publication at the
80th Annual Meeting of the Transportation Research Board, Washington, D. C., January
2001.

90
10. Cross, S. A., and E. R. Brown. Selection of Aggregates Properties to Minimize Rutting
of Heavy Duty Pavements. In American Society for Testing and Materials, STP 1147,
West Conshohocken, PA, 1992.
11. Hudson, S. W., and S. B. Seeds. Evaluation of Increased Pavement Loading and Tire
Pressures. In Transportation Research Record 1207, TRB, National Research Council,
Washington, DC, 1988.
12. Huang, Y. H. Pavement Analysis and Design. Prentice-Hall, Englewood Cliffs, NJ, 1993.
13. Elliot, R. P., M. C. Ford, M. Ghanim, and Y. F. Tu. Effect of Aggregate Gradation
Variation on Asphalt Concrete Mix Properties. In Transportation Research Record
1317, TRB, National Research Council, Washington, DC, 1991.
14. Krutz, N. C., and P. E. Sebaaly. The Effects of Aggregate Gradation on Permanent
Deformation of Asphalt Concrete. In Proceedings, Vol. 62, Association of Asphalt
Paving Technologists, 1993.
15. Moore, R. B., and R. A. Welke. Effects of Fine Aggregate Stability of Bituminous Mixes.
Report 78-TB-34-79F. Michigan Department of State Highways and Transportation,
1979.
16. Crawford, C. Tender Mixes: Probable Causes, Possible Remedies. Quality Improvement
Series 108-3186. National Asphalt Pavement Association, Lanham, MD, 1989.
17. Herrin, M., and W. H. Goetz. Effect of Aggregate Shape on Stability of Bituminous
Mixes. In Proceedings, Vol. 33, Highway Research Board, 1954.
18. Kallas, B. F., and J. M. Griffith. Influence of Fine Aggregates on Asphalt Paving
Mixtures. In Proceedings, Vol. 27, Association of Asphalt Paving Technologists, 1957.
19. Shklarsky, E., and M. Livneh. The Use of Gravels for Bituminous Mixtures. In
Proceedings, Vol. 33, Association of Asphalt Paving Technologists, 1964.
20. Lottman, R. R., and W. H. Goetz. Effect of Crushed Gravel Fine Aggregate on the
Strength of Asphalt Surfacing Mixtures. In Proceedings, No. 63, National Sand and
Gravel Circular, 1956.

91
21. Button, J. W., and D. Perdomo. Identifying and Correcting Rut-Susceptible Asphalt
Mixtures. Report FHWA-TX-91/1121-2F. Federal Highway Administration and Texas
Department of Transportation, 1991.
22. Yeggoni, M., J. W. Button, and D. G. Zollinger. Influence of Coarse Aggregate Size,
Shape, and Surface Texture on Rutting of Hot Mix Asphalt Concrete. Report FHWA-
TW-94/1244-6. Federal Highway Administration and Texas Department of
Transportation, 1994.
23. Brown, E. R., J. L. McRae, and A. B. Crawley. Effect of Aggregates on Performance of
Bituminous Concrete. In American Society for Testing and Materials, STP 1016, West
Conshohocken, PA, 1989.
24. Kim Y. R., N. Yim, and N. P. Khosla. Effects of Aggregate Type and Gradation on
Fatigue and Permanent Deformation of Asphalt Concrete. In American Society for
Testing and Materials, STP 1147, West Conshohocken, PA, 1992.
25. Basset, C. E., and E. R. Brown. The Effects of Maximum Aggregate Size on Rutting
Potential and other Properties of Asphalt-Aggregate Mixtures. In Transportation
Research record 1259, TRB, National Research Council, Washington, DC, 1990.
26. Anderson, D. A. Guidelines on the Use of Baghouse Fines. Information Series 101.
National Asphalt Pavement Association, Lanham, MD, 1987.
27. Tarris, J. P., and D. A. Anderson. Effect of Baghouse Fines on Mixture Design
Properties. QIP 102. National Asphalt Pavement Association, Lanham, MD, 1982.
28. Watson, D. E., A Johnson, and D. Jarred. The Superpave Gradation Restricted Zone and
Performance Testing with the Georgia Loaded Wheel Tester. Transportation Research
Record 1583, TRB, National Research Council, Washington, DC, 1997.
29. Kuennen, T. In-field Experience Revises Superpave Guidelines. Pavement Maintenance
and Reconstruction, Vol. 1998/01. 13(1) pp10-12, Johnson Hill Press, WI.
30. Prowell, B. D. Design, Construction, and Early Performance of Hot-Mix-Asphalt
Stabilizer and Modifier Test Section. Report Number: FHWA/VTRC 00-IR2, 2000.

92
31. Sousa, J. B., J. C. Paris, M. Prates, R. Barros, P. Langlois, and A. M. Leclerc. Effect of
Aggregate Gradation on Fatigue Life of Asphalt Concrete Mixes. In Transportation
Research record 1630, TRB, National Research Council, Washington, DC, 1998.
32. van-de-Ven, M., A. Smit, and R. Lorio, and R. McGennis. Validation of some Superpave
Design Parameters by Wheel Testing with the Scale Model Mobile Load Simulator.
Proceedings of the 8th International Conference on Asphalt Pavements, University of
Washington, Seattle, Washington, August 1997, Vol II, pp. 1245-1256.
33. Cooley, L. A. Permeability of Superpave Mixtures: Evaluation of Field Parameters.
Report Number: NCAT 99-1, National Center for Asphalt Technology, Auburn
University, AL, 1999.
34. Rouque, R., S. C. Huang, and B. Ruth. Maximizing Shear Resistance of Asphalt Mixtures
by Proper Selection of Aggregate Gradation. Proceedings of the 8th International
Conference on Asphalt Pavements, University of Washington, Seattle, Washington,
August 1997, Vol I, pp. 249-268.
35. El-Basyouny, M. and M. S. Mamlouk. Effect of Aggregate Gradation on the Rutting
Potential of Superpave Mixes. A Paper Submitted for Presentation and Publication at the
78th Annual Meeting of the Transportation Research Board, Washington, D. C., January
1999.
36. Hand, A. J., J. L. Stiady, T. D. White, A. S. Noureldin, and K. Galal. Gradation Effects
on HMA Performance. A Paper Submitted for Presentation and Publication at the 80th
Annual Meeting of the Transportation Research Board, Washington, D. C., January 2001.
37. Mallick, R. B. and P. S. Kandhal. Effect of Mix Gradation on Rutting Potential of Dense
Graded Asphalt Mixtures. A Paper Submitted for Presentation and Publication at the 80th
Annual Meeting of the Transportation Research Board, Washington, D. C., January 2001.
38. Ahlrich, R. C. Influence of Aggregate Gradation and Particle Shape/Texture on
Permanent Deformation of Hot Mix Asphalt Pavements. Report 20591. U.S. Department
of Transportation, Federal Aviation Administration, 1991.
39. Chowdhury, A. Evaluation of Superpave Fine Aggregate Specification. Texas A&M
University, Master of Science Thesis, 1999.
93
40. Amirkhanian, S. N., D. Kaczmarck, and J. L. Buratti. The Effects of Los Angeles
Abrasion Test Values on the Strength of Laboratory Marshall Specimens. In
Transportation Research Record 1301, TRB, National Research Council, Washington,
DC, 1991.
41. Dolar-Mantuani, L. Soundness and Deleterious Substances. In American Society for
Testing and Materials, STP 16B, West Conshohocken, PA, 1978.
42. American Society for Testing and Materials. ASTM Standards: Road and Pavement
Materials, Volume 04.03. American Society for Testing and Materials, West
Conshohocken, PA, 1998.
43. American Association of State Highway and Transportation Officials. Standard Test
Method for Determining the Permanent Deformation and Fatigue Cracking
Characteristics of Hot Mix Asphalt (HMA) Using the Simple Shear Test (SST) Device.
American Association of State Highway and Transportation Officials, Washington, DC,
1996.
44. Cominsky, R. J., G. A. Huber, E. T. Harrigan, T. M. Kennedy, H. V. Quintus, and J. S.
Moulthrop. Superior Performing Asphalt Pavements (Superpave): The Product of the
SHRP Asphalt Research Program. Report SHRP-A-410. Federal Highway
Administration, National Research Council, 1994.
45. Cominsky, R. J., G. A. Huber, T. M. Kennedy, and M. Anderson. The Superpave Mix
Design Manual for New Construction and Overlays. Report SHRP-A-407. Federal
Highway Administration, National Research Council, 1994.
46. Federal Highway Administration. Superpave Asphalt Mixture Analysis: Lab Notes.
Federal Highway Administration, Office of Technology Applications, Washington, DC,
1996.
47. Zhang, X. Evaluating Superpave Performance Prediction Models Using a Controlled
Laboratory Experiment. In Proceedings, Vol. 66, Association of Asphalt Pavement
Technologists, 1997.
48. Sousa, J. B., and M. Bronstein. ATS Manual, Version 3.1. SHRP Corporation, Walnut
Creek, CA, 1995.

94
49. McLean, D. B. Permanent Deformation Characteristics of Asphalt Concrete. Ph. D.
Dissertation, University of California, Berkeley, 1974.
50. Shell Pavement Design Manual - Asphalt Pavements and Overlays for Road Traffic,
Shell International Petroleum, London, 1978.
51. Asphalt Pavement Analyzer user’s Guide. Pavement Technology, Inc., Covington, GA,
1998.

95
APPENDIX A
ASPHALT CEMENT CHARACTERIZATION


97
The asphalt cement used in the asphalt mixtures was tested according to the Superpave
asphalt binder specification (AASHTO MP1). The mixing and compaction temperatures and
complex shear modulus at different frequencies and temperatures was determined. A summary
of the results is provided in Table A1. These results confirm that the grade of the asphalt cement
is PG 64-22.
Table A1. PG 64-22 Requirements
Binder Property Binder Aging
Condition
Test Result Superpave
Requirement
Flash Point (/C) Unaged 299 >230
Viscosity at 135/C (Pa-second) Unaged 0.41 <3.00
Dynamic Shear, G*/sin δ at 64/C (kPa) Unaged 1.045 >1.00
Mass Loss (%) RTFO aged 0.55 <1.00
Dynamic Shear, G*/sin δ at 64/C (kPa) RTFO aged 2.91 >2.20
Dynamic Shear, G*sin δ at 25/C (kPa) PAV aged 2842 <5000
Creep Stiffness, S at !12/C (MPa) PAV aged 176 <300
m-value at !12/C PAV aged 0.301 >0.300
The rheological properties of the asphalt cement were determined according to AASHTO
TP5. The test apparatus used was a Bohlin Controlled Stress Rheometer. In Table A2, A3, and
A4, test conditions and test results obtained using the Dynamic Shear Rheometer (DSR) are
listed.
The asphalt cement was aged using the rolling thin film oven test (ASTM D 2872 or
AASHTO T 240); and a pressure aging vessel (AASHTO PP1).
The stiffness of the asphalt cement at very low temperatures was measured according
to AASHTO TP1 using a bending beam rheometer. In Table A5 and A6, test results obtained
with the bending beam rheometer (BBR) are listed.
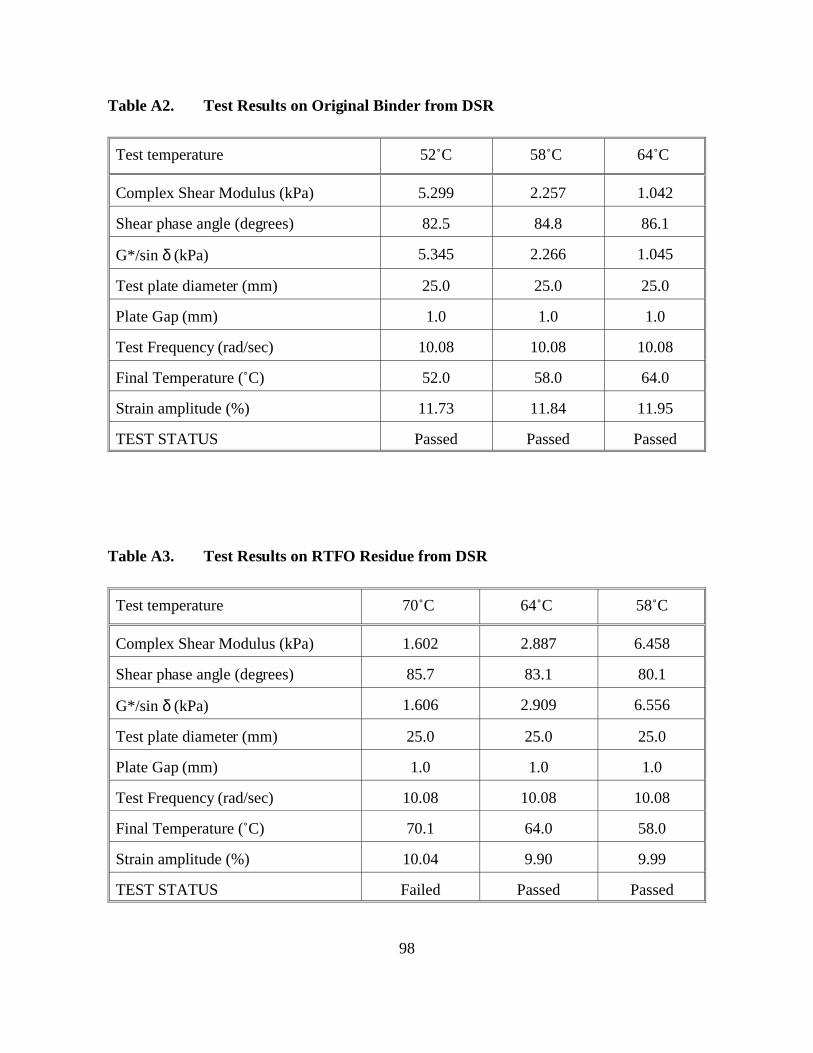
98
Table A2. Test Results on Original Binder from DSR
Test temperature 52/C 58/C 64/C
Complex Shear Modulus (kPa) 5.299 2.257 1.042
Shear phase angle (degrees) 82.5 84.8 86.1
G*/sin δ (kPa) 5.345 2.266 1.045
Test plate diameter (mm) 25.0 25.0 25.0
Plate Gap (mm) 1.0 1.0 1.0
Test Frequency (rad/sec) 10.08 10.08 10.08
Final Temperature (/C) 52.0 58.0 64.0
Strain amplitude (%) 11.73 11.84 11.95
TEST STATUS Passed Passed Passed
Table A3. Test Results on RTFO Residue from DSR
Test temperature 70/C 64/C 58/C
Complex Shear Modulus (kPa) 1.602 2.887 6.458
Shear phase angle (degrees) 85.7 83.1 80.1
G*/sin δ (kPa) 1.606 2.909 6.556
Test plate diameter (mm) 25.0 25.0 25.0
Plate Gap (mm) 1.0 1.0 1.0
Test Frequency (rad/sec) 10.08 10.08 10.08
Final Temperature (/C) 70.1 64.0 58.0
Strain amplitude (%) 10.04 9.90 9.99
TEST STATUS Failed Passed Passed

99
Table A4. Test Results on PAV Residue from DSR
Test temperature 19/C 22/C 25/C
Complex Shear Modulus (kPa) 8275.8 6190.0 4511.7
Shear phase angle (degrees) 42.4 41.36 39.05
G*sin δ (kPa) 5580.4 4090.3 2842.4
Test plate diameter (mm) 8.0 8.0 8.0
Plate Gap (mm) 2.0 2.0 2.0
Test Frequency (rad/sec) 10.08 10.08 10.08
Final Temperature (/C) 18.9 22.0 25.0
Strain amplitude (%) 1.01 1.01 1.03
TEST STATUS Failed Passed Passed
Table A5. Test Results at !12/C from BBR
Time
(sec)
Force
(mN)
Deflection
(mm)
Measured
Stiffness
(MPa)
Estimated
Stiffness
(MPa)
Difference
(%)
m-value
8 993 0.262 306 305 -0.327 0.249
15 994 0.309 259 260 0.386 0.265
30 994 0.374 214 215 0.467 0.283
60 995 0.457 176 176 0.000 0.301
120 995 0.565 142 142 0.000 0.318
240 1000 0.716 113 113 0.000 0.336
A = 2.69 B = -0.196 C = -0.0295 R2 = 0.999965

100
Table A6. Test Results at !18/C from BBR
Time
(sec)
Force
(mN)
Deflection
(mm)
Measured
Stiffness
(MPa)
Estimated
Stiffness
(MPa)
Difference
(%)
m-value
8 994 0.179 448 447 -0.223 0.230
15 994 0.209 383 385 0.522 0.246
30 994 0.249 322 322 0.000 0.264
60 994 0.300 267 267 0.000 0.282
120 995 0.367 219 218 -0.457 0.301
240 997 0.458 176 176 0.000 0.319
A = 2.83 B = -0.175 C = -0.0302 R2 = 0.999945
The flash point temperature was determined according to ASTM D 92. High temperature
viscosity was measured using ASTM D 4402. The viscosity at 135 /C was 410 cP (0.41 Pa-s).
See Figure A1.
In order to compare the asphalt cement rheology with that of the asphalt concrete, the
complex modulus and the shear phase angle were determined at different frequencies and
temperatures (Tables A7, A8, and A9).

101
Table A7. Shear Complex Modulus at 46/C
Temperature (/C) Frequency (Hz) Phase angle Shear Complex Modulus (Pa)
46 10 76.11 6.16E6
46 5 77.57 3.43E6
46 2 79.80 1.54E6
46 1 81.28 8.25E5
46 0.5 82.92 4.36E5
46 0.2 84.61 1.85E5
46 0.1 85.82 9.51E4
46 0.05 87.06 4.87E4
46 0.02 88.64 1.01E4
Table A8. Shear Complex Modulus at 20/C
Temperature (/C) Frequency (Hz) Phase angle Shear Complex Modulus (Pa)
20 10 58.77 5.19E6
20 5 60.64 3.46E6
20 2 63.37 1.91E6
20 1 65.40 1.22E6
20 0.5 67.19 7.36E5
20 0.2 69.67 3.71E5
20 0.1 71.09 2.17E5
20 0.05 73.15 1.20E5
20 0.02 76.67 3.13E4

102
Table A9. Shear Complex Modulus at 7/C
Temperature (/C) Frequency (Hz) Phase angle Shear Complex Modulus (Pa)
7 10 45.24 2.27E7
7 5 48.12 1.61E7
7 2 51.83 9.82E6
7 1 54.86 6.69E6
7 0.5 57.32 4.38E6
7 0.2 60.62 2.48E6
7 0.1 62.85 1.55E6
7 0.05 65.13 9.78E5
7 0.02 68.49 3.34E5

103
Figure A1. PG 64-22 Brookfield Viscosity versus Temperature


105
APPENDIX B
SUPERPAVE MIXTURE DESIGN

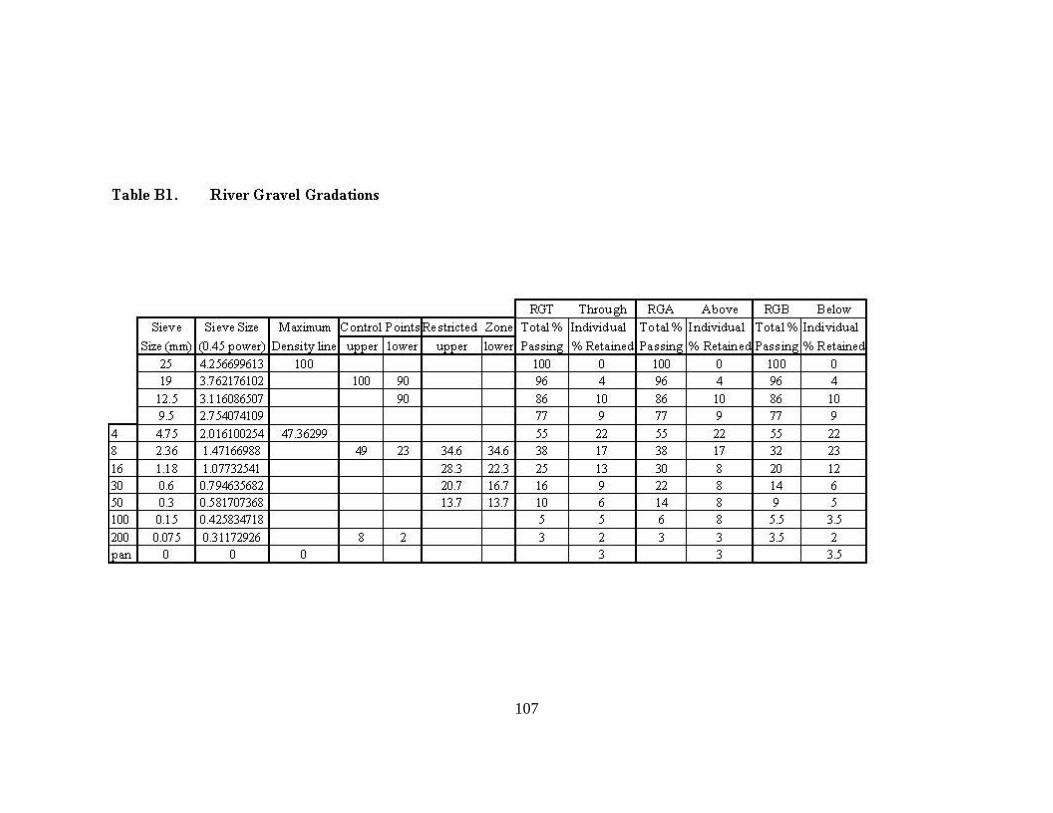
107

108

109

110

111
Figure B1. River Gravel Gradation Curves

112
Figure B2. Granite Gradation Curves

113
Figure B3. Limestone Gradation Curves

114
Figure B4. River Gravel + Rounded Sand Gradation Curves

115
Table B5. River Gravel Mixture Design Data

116
Table B6. Granite Mixture Design Data

117
Table B7. Limestone Mixture Design Data

118
Table B8. River Gravel + Rounded Natural Sand Mixture Design Data

119
Table B9. River Gravel Through Restricted Zone SST Specimen Data

120
Table B10. River Gravel Above Restricted Zone SST Specimen Data

121
Table B11. River Gravel Below Restricted Zone SST Specimen Data

122
Table B12. Granite SST Specimen Data (Through, Above, and Below Restricted Zone

123
Table B13. Limestone SST Specimen Data (Through, Above, and Below Restricted Zone)

124
Table B14. River Gravel + Rounded Sand SST Specimen Data (Through, Above, and Below Restricted Zone)