
Effects of Repeated Heating on Fatty Acid Composition ... - MDPI
16
Citation: Szabo, Z.; Marosvölgyi, T.; Szabo, E.; Koczka, V.; Verzar, Z.; Figler, M.; Decsi, T. Effects of Repeated Heating on Fatty Acid Composition of Plant-Based Cooking Oils. Foods 2022, 11, 192. https:// doi.org/10.3390/foods11020192 Academic Editor: Nicolò Merendino Received: 14 December 2021 Accepted: 10 January 2022 Published: 12 January 2022 Publisher’s Note: MDPI stays neutral with regard to jurisdictional claims in published maps and institutional affil- iations. Copyright: © 2022 by the authors. Licensee MDPI, Basel, Switzerland. This article is an open access article distributed under the terms and conditions of the Creative Commons Attribution (CC BY) license (https:// creativecommons.org/licenses/by/ 4.0/). foods Article Effects of Repeated Heating on Fatty Acid Composition of Plant-Based Cooking Oils Zoltan Szabo 1,† , Tamas Marosvölgyi 2,3,† , Eva Szabo 4, * , Viktor Koczka 4,5 , Zsofia Verzar 1 , Maria Figler 1,6 and Tamas Decsi 3 1 Institute of Nutritional Sciences and Dietetics, Faculty of Health Sciences, University of Pecs, 7621 Pecs, Hungary; [email protected] (Z.S.); verzar.zsofi[email protected] (Z.V.); maria.fi[email protected] (M.F.) 2 Institute of Bioanalysis, Medical School, University of Pecs, 7624 Pecs, Hungary; [email protected] 3 Department of Pediatrics, Clinical Centre, University of Pecs, 7623 Pecs, Hungary; [email protected] 4 Department of Biochemistry and Medical Chemistry, Medical School, University of Pecs, 7624 Pecs, Hungary; [email protected] 5 Doctoral School of Health Sciences, Faculty of Health Sciences, University of Pecs, 7621 Pecs, Hungary 6 2nd Department of Internal Medicine and Nephrology Centre, Clinical Centre, University of Pecs, 7624 Pecs, Hungary * Correspondence: [email protected] † Both authors contributed to the study equally as first authors. Abstract: Several polyunsaturated fatty acids are considered to have beneficial health effects, while saturated fatty acids and industrial trans fatty acids (TFAs) are linked to negative health consequences. Given the increased formation of TFAs during heating, many studies already investigated compo- sitional changes in oils after prolonged heating or at extremely high temperatures. In contrast, our aim was to measure changes in fatty acid composition and in some health-related indices in edible oils after short-time heating that resembles the conventional household use. Potatoes were fried in palm, rapeseed, soybean, sunflower and extra virgin olive oils at 180 ◦ C for 5 min, and samples were collected from fresh oils and after 1, 5 and 10 consecutive heating sequences. Regardless of the type of oil, the highest linoleic acid and alpha-linolenic acid values were measured in the fresh samples, whereas significantly lower values were detected in almost all samples following the heating sequences. In contrast, the lowest levels of TFAs were detected in the fresh oils, while their values significantly increased in almost all samples during heating. Indices of atherogenicity and throm- bogenicity were also significantly higher in these oils after heating. The present data indicate that prolonged or repeated heating of vegetable oils should be avoided; however, the type of oil has a greater effect on the changes of health-related indices than the number of heating sequences. Keywords: repeated heating; fatty acid composition; vegetable oil; frying; linoleic acid; alpha- linolenic acid; trans fatty acids; nutritional index 1. Introduction The fatty acid (FA) composition of edible oils plays an important role in human nutrition. Essential fatty acids (EFAs) cannot be synthesized in the human body and should be taken up with our diet. Both the omega–6 (n–6) EFA, linoleic acid (C18:2n–6, LA) and the omega–3 (n–3) EFA, alpha-linolenic acid (C18:3n–3, ALA) as well as their most important, longer chain derivates, arachidonic acid (C20:4n–6, AA), eicosapentaenoic acid (C20:5n–3, EPA) and docosahexaenoic acid (C22:6n–3, DHA) are considered to have beneficial health effects that can influence several areas of human physiology [1–4]. The physiologically important unsaturated fatty acids contain double bonds in cis configuration causing a bend of the molecule, while trans isomeric fatty acids (TFAs), similarly to saturated fatty acids (SFAs), exhibit linear spatial configuration. Because they Foods 2022, 11, 192. https://doi.org/10.3390/foods11020192 https://www.mdpi.com/journal/foods
-
Upload
khangminh22 -
Category
Documents
-
view
2 -
download
0
Transcript of Effects of Repeated Heating on Fatty Acid Composition ... - MDPI
�����������������
Citation: Szabo, Z.; Marosvölgyi, T.;
Szabo, E.; Koczka, V.; Verzar, Z.;
Figler, M.; Decsi, T. Effects of
Repeated Heating on Fatty Acid
Composition of Plant-Based Cooking
Oils. Foods 2022, 11, 192. https://
doi.org/10.3390/foods11020192
Academic Editor: Nicolò
Merendino
Received: 14 December 2021
Accepted: 10 January 2022
Published: 12 January 2022
Publisher’s Note: MDPI stays neutral
with regard to jurisdictional claims in
published maps and institutional affil-
iations.
Copyright: © 2022 by the authors.
Licensee MDPI, Basel, Switzerland.
This article is an open access article
distributed under the terms and
conditions of the Creative Commons
Attribution (CC BY) license (https://
creativecommons.org/licenses/by/
4.0/).
foods
Article
Effects of Repeated Heating on Fatty Acid Composition ofPlant-Based Cooking OilsZoltan Szabo 1,†, Tamas Marosvölgyi 2,3,† , Eva Szabo 4,* , Viktor Koczka 4,5 , Zsofia Verzar 1 , Maria Figler 1,6
and Tamas Decsi 3
1 Institute of Nutritional Sciences and Dietetics, Faculty of Health Sciences, University of Pecs,7621 Pecs, Hungary; [email protected] (Z.S.); [email protected] (Z.V.);[email protected] (M.F.)
2 Institute of Bioanalysis, Medical School, University of Pecs, 7624 Pecs, Hungary; [email protected] Department of Pediatrics, Clinical Centre, University of Pecs, 7623 Pecs, Hungary; [email protected] Department of Biochemistry and Medical Chemistry, Medical School, University of Pecs, 7624 Pecs, Hungary;
[email protected] Doctoral School of Health Sciences, Faculty of Health Sciences, University of Pecs, 7621 Pecs, Hungary6 2nd Department of Internal Medicine and Nephrology Centre, Clinical Centre, University of Pecs,
7624 Pecs, Hungary* Correspondence: [email protected]† Both authors contributed to the study equally as first authors.
Abstract: Several polyunsaturated fatty acids are considered to have beneficial health effects, whilesaturated fatty acids and industrial trans fatty acids (TFAs) are linked to negative health consequences.Given the increased formation of TFAs during heating, many studies already investigated compo-sitional changes in oils after prolonged heating or at extremely high temperatures. In contrast, ouraim was to measure changes in fatty acid composition and in some health-related indices in edibleoils after short-time heating that resembles the conventional household use. Potatoes were friedin palm, rapeseed, soybean, sunflower and extra virgin olive oils at 180 ◦C for 5 min, and sampleswere collected from fresh oils and after 1, 5 and 10 consecutive heating sequences. Regardless ofthe type of oil, the highest linoleic acid and alpha-linolenic acid values were measured in the freshsamples, whereas significantly lower values were detected in almost all samples following the heatingsequences. In contrast, the lowest levels of TFAs were detected in the fresh oils, while their valuessignificantly increased in almost all samples during heating. Indices of atherogenicity and throm-bogenicity were also significantly higher in these oils after heating. The present data indicate thatprolonged or repeated heating of vegetable oils should be avoided; however, the type of oil has agreater effect on the changes of health-related indices than the number of heating sequences.
Keywords: repeated heating; fatty acid composition; vegetable oil; frying; linoleic acid; alpha-linolenic acid; trans fatty acids; nutritional index
1. Introduction
The fatty acid (FA) composition of edible oils plays an important role in humannutrition. Essential fatty acids (EFAs) cannot be synthesized in the human body and shouldbe taken up with our diet. Both the omega–6 (n–6) EFA, linoleic acid (C18:2n–6, LA) and theomega–3 (n–3) EFA, alpha-linolenic acid (C18:3n–3, ALA) as well as their most important,longer chain derivates, arachidonic acid (C20:4n–6, AA), eicosapentaenoic acid (C20:5n–3,EPA) and docosahexaenoic acid (C22:6n–3, DHA) are considered to have beneficial healtheffects that can influence several areas of human physiology [1–4].
The physiologically important unsaturated fatty acids contain double bonds in cisconfiguration causing a bend of the molecule, while trans isomeric fatty acids (TFAs),similarly to saturated fatty acids (SFAs), exhibit linear spatial configuration. Because they
Foods 2022, 11, 192. https://doi.org/10.3390/foods11020192 https://www.mdpi.com/journal/foods
Foods 2022, 11, 192 2 of 16
use the same enzymes during their metabolism, TFAs can disturb the metabolism of n–3and n–6 fatty acids. Therefore, the unfavorable health effects of TFAs in the human bodycan be caused by both their more rigid structure in lipid membranes and by their disturbingeffect on fatty acid metabolism [5,6].
Although the first animal experiments showed a positive correlation between TFAintake and some unfavorable cardiovascular effects [7] as well as EFA deficiency [8,9]as early as the 1970s, reports of human data on the adverse effects of hydrogenated oilsand TFA intake on cardiovascular health appeared in greater numbers only from the1990s [10–13]. Regardless of the dietary source, TFAs can increase plasma concentrationsof triacylglycerols, total cholesterol and low density lipoprotein (LDL) [11,14], and lowerthat of high density lipoprotein (HDL) [11]. They can also increase the risk of myocardialinfarction [15] and coronary heart disease [12,16]; however, studies showing the correlationbetween their putative adverse effect and insulin sensitivity or the risk of developing type2 diabetes mellitus are rather controversial [17–19].
Naturally occurring TFAs are mainly produced in the stomachs of ruminants. The maindietary sources of human TFA exposure, however, are the partially hydrogenated vegetableoils, bakery products and deep-fried fast foods [20]. The ruminant derived TFAs can havedifferent health effects as compared to those from the industrial food sources [21,22].
Deep frying is a very popular food preparation process in several parts of the world [23,24]including Hungary [25], where many popular and traditional dishes are deep-fried. Inmany households all over the world oils are used not only once but reheated several times,despite reports of serious health hazards related to this procedure [26–30]. During heating,many chemical processes occur, like the oxidation of different fatty acids and triacylglyc-erols [31], polymer or cyclic compound formation [32–34], loss of volatile compounds [32]and the formation of polycyclic aromatic hydrocarbons [35]. During the heating processthe polyunsaturated fatty acid (PUFA) content of vegetable oils decreases while that ofsaturated fatty acids (SFAs) usually increases [36,37].
Different indices can be used, based on fatty acid composition, to characterize thehealth effects of different foods [38]. The index of atherogenicity (IA) includes the relation-ship between the sum of the main saturated (i.e., mostly pro-atherogenic) FAs and thatof the main unsaturated (i.e., mostly anti-atherogenic) FAs [39]. The index of thrombo-genicity (IT) reflects the thrombogenic potential of the foods that contain pro-thrombogenicFAs (i.e., mostly saturated) and anti-thrombogenic (MUFAs, n–3 and n–6 PUFAs) FAs indifferent ratios [39]. In the early 2000s, two further indices were developed for charac-terizing the health effects of foods: the hypocholesterolemic/hypercholesterolemic (HH)ratio [40] that describes the relationship between hypocholesterolemic FAs (mainly oleicacid [C18:1n–9, OA] and PUFAs) and hypercholesterolemic FAs (mainly SFAs) as well asthe health-promoting index (HPI) [41], which is the inverse of the IA.
While deep-frying, a popular food preparation method worldwide, has already beenreported to alter fatty acid composition of vigorously heated oils, our aim was to investigatethe changes of fatty acid composition in commonly used edible vegetable oils under conven-tional household conditions. We also investigated the effect of repeated heating processesand calculated nutritional indices to outline potential changes in their health effects.
2. Materials and Methods
Based on various databases of the Food and Agriculture Organization of the UnitedNations (FAO) [42] and United States Department of Agriculture (USDA) [43], we selectedthree of the most commonly used oils worldwide (palm, soybean and rapeseed oil) andtwo more oils that are frequently used in Hungary (sunflower and extra virgin (EV) oliveoil). Potatoes and oils were bought in a local hypermarket.
2.1. Frying Protocol
The frying procedure was based on The European Food Information Council (EU-FIC) [44] and the Hungarian National Food Chain Safety Office (Nébih) [45] protocols with
Foods 2022, 11, 192 3 of 16
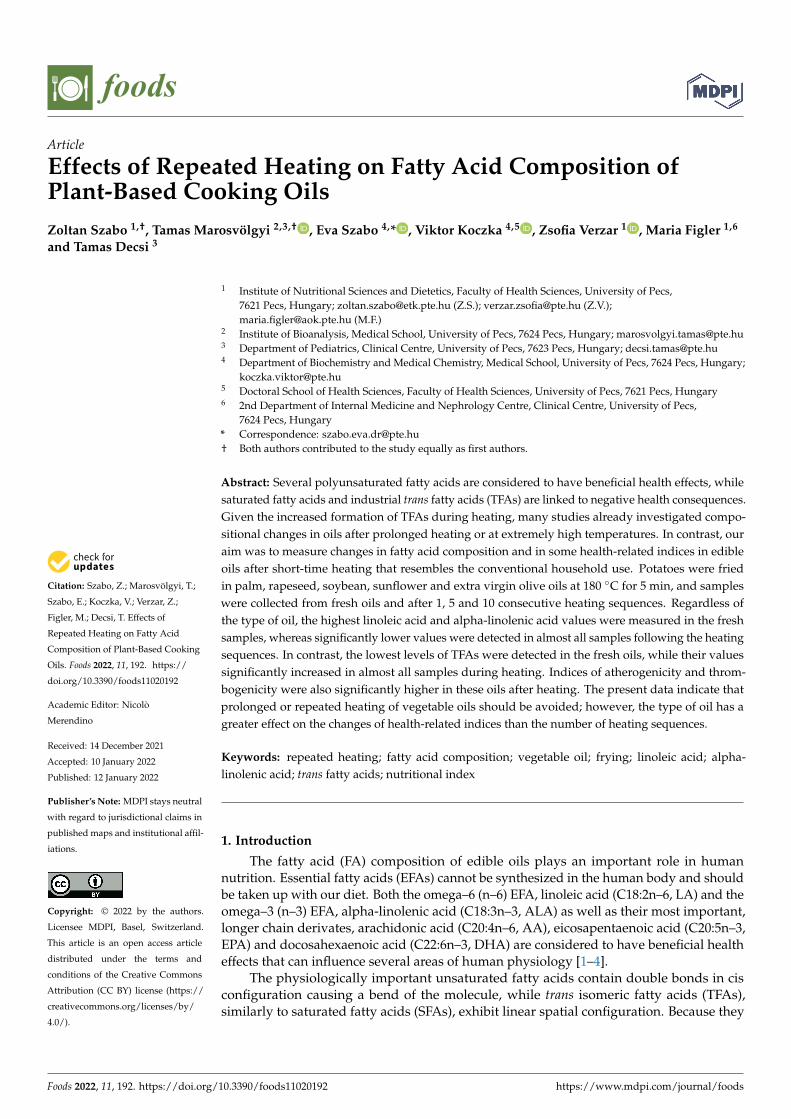
slight modifications. The freshly cut potatoes were fried on 180 ◦C for 5 min, then potatoslices were removed and oils were allowed to cool down to 70 ◦C. This procedure wasrepeated ten times after sieving and using freshly cut potatoes. Three different sampleswere collected from each fresh, unheated oil [Fresh] as well as after the 1st [1H], 5th [5H]and 10th [10H] frying period (Figure 1).
Foods 2022, 11, x FOR PEER REVIEW 3 of 17
2.1. Frying Protocol
The frying procedure was based on The European Food Information Council (EUFIC)
[44] and the Hungarian National Food Chain Safety Office (Nébih) [45] protocols with
slight modifications. The freshly cut potatoes were fried on 180 °C for 5 min, then potato
slices were removed and oils were allowed to cool down to 70 °C. This procedure was
repeated ten times after sieving and using freshly cut potatoes. Three different samples
were collected from each fresh, unheated oil [Fresh] as well as after the 1st [1H], 5th [5H]
and 10th [10H] frying period (Figure 1).
Figure 1. Flow diagram of the frying protocol and sample collection.
2.2. Reagents and Standards
Methanol (Suprasolv® for gas chromatography ECD and FID; Merck, Germany; Cat.
No.: 1.06011.2500); n-hexane (Suprasolv® for gas chromatography ECD and FID; Merck,
Germany; Cat. No.: 1.04371.1000); pyrogallol (ACS reagent >99%, Sigma-Aldrich, Ger-
many; Cat. No.: 16040-100G-R); acetyl chloride (puriss. p.a., >99.0% (T), Sigma-Aldrich,
Germany; Cat. No.: 00990-100ML); 6% K2CO3-solution (MSURE® ACS, Merck, Germany;
Cat. No.: 1049281000) and distilled water were used for sample preparation and analytical
measurements.
Peak identification of fatty acid methyl esters was performed by comparison with
authentic standards (NuChekPrep; Elysian, MN, USA: GLC–463, GLC–473, GLC–642,
GLC–643, GLC–674). We measured the following trans isomers: t18:1n–9/7, C18:2n–6tt,
C20:1n–9t in the plant-based oils and calculated total TFAs by adding their values to-
gether.
2.3. Fatty acid analysis
The oil samples were stored at −80 °C until chemical analysis. The analysis was per-
formed with a slight modification of our recently published method [46]. In detail, the oil
samples were melted at 37 °C, 2.0 μL was transferred into the extraction tube and 3 mL of
methanol/hexane (4/1 v/v) was added. To prevent auto-oxidation, 0.5% pyrogallol was
used. During shaking on a vortex mixer, 200 µL acetyl chloride was added. For derivati-
zation, the reaction tubes were placed into a heating block for 1 h at 100 °C. After cooling
down, 4.8 mL of K2CO3 solution (6% w/v) was added. The samples were centrifuged at
3200 rpm for 10 min at 4 °C. The upper, fatty acid methyl ester containing hexane phase
was transferred to vials and analyzed by gas chromatography (GC).
Figure 1. Flow diagram of the frying protocol and sample collection.
2.2. Reagents and Standards
Methanol (Suprasolv® for gas chromatography ECD and FID; Merck, Germany; Cat.No.: 1.06011.2500); n-hexane (Suprasolv® for gas chromatography ECD and FID; Merck,Germany; Cat. No.: 1.04371.1000); pyrogallol (ACS reagent >99%, Sigma-Aldrich, Ger-many; Cat. No.: 16040-100G-R); acetyl chloride (puriss. p.a., >99.0% (T), Sigma-Aldrich,Germany; Cat. No.: 00990-100ML); 6% K2CO3-solution (MSURE® ACS, Merck, Germany;Cat. No.: 1049281000) and distilled water were used for sample preparation and analyticalmeasurements.
Peak identification of fatty acid methyl esters was performed by comparison withauthentic standards (NuChekPrep; Elysian, MN, USA: GLC–463, GLC–473, GLC–642,GLC–643, GLC–674). We measured the following trans isomers: t18:1n–9/7, C18:2n–6tt,C20:1n–9t in the plant-based oils and calculated total TFAs by adding their values together.
2.3. Fatty Acid Analysis
The oil samples were stored at −80 ◦C until chemical analysis. The analysis wasperformed with a slight modification of our recently published method [46]. In detail,the oil samples were melted at 37 ◦C, 2.0 µL was transferred into the extraction tubeand 3 mL of methanol/hexane (4/1 v/v) was added. To prevent auto-oxidation, 0.5%pyrogallol was used. During shaking on a vortex mixer, 200 µL acetyl chloride was added.For derivatization, the reaction tubes were placed into a heating block for 1 h at 100 ◦C.After cooling down, 4.8 mL of K2CO3 solution (6% w/v) was added. The samples werecentrifuged at 3200 rpm for 10 min at 4 ◦C. The upper, fatty acid methyl ester containinghexane phase was transferred to vials and analyzed by gas chromatography (GC).
Fatty acid composition was determined by Agilent 6890N GC, which consisted ofautosampler 7683B, a flame ionization detector (FID), and cold on column injector. Separa-tion was performed on capillary column DB-23 (60 m × 0.25 mm × 0.25 µm; Agilent J&WScientific, Folsom, CA, USA).
The inlet temperature gradient was initially kept at 60 ◦C for 0.1 min, raised to 260 ◦Cat a rate of 114.94 ◦C·min−1 and kept at 260 ◦C until the end of the measurement. Thecolumn oven temperature gradient was initially kept at 50 ◦C for 2 min, raised to 160 ◦C ata rate of 40.15 ◦C·min−1, then raised to 184 ◦C at a rate of 12 ◦C·min−1, and held at 184 ◦Cfor 17.5 min. After this the temperature was raised to 190 ◦C at a rate of 10 ◦C·min−1, and
Foods 2022, 11, 192 4 of 16
kept there constantly for 17.0 min. Finally, the temperature was raised to 220 ◦C at a rate of15 ◦C·min−1, and kept at 220 ◦C for 5 min.
The carrier gas was H2, 2.5 mL/min. Fatty acids were determined from C8:0 to C24:0.The fatty acid composition of each oil sample was determined based on six chromatograms(from two parallel runs of the samples after three independent analytical procedures).Chromatograms were evaluated with Chromeleon 7.1 software (Version 7.1, Thermo FisherScientific, Sunnyvale, CA, USA).
2.4. Index Calculation
The nutritional indices of fatty acids (IA, IT, HH and HPI) were calculated based onthe calculation formulas published by Chen et al. [38].
n–3/n–6 polyunsaturated fatty acid (PUFA) ratio:
Σn − 3PUFAΣn − 6PUFA
.
Σn–3 PUFA denotes the sum of n–3 polyunsaturated fatty acids (C18:3n–3); Σn–6PUFA denotes sum of n–6 polyunsaturated fatty acids (C18:2n–6 + C20:2n–6 + C22:2n–6).
Unsaturation index (UI):
UI = 1·(% monoenoics) + 2·(% dienoics) + 3·(% trienoics) + 4·(% tetraenoics) + 5·(% pentaenoics),
monoenoics: C12:1+C15:1n–5+C16:1n–7+C18:1n–7+C18:1n–9+C20:1n–9+C22:1n–9; dienoics:C18:2n–6+C20:2n–6+C22:2n–6; trienoics: C18:3n–3
Index of atherogenicity (IA):
IA =C12 : 0 + 4·C14 : 0 + C16 : 0
ΣUFA.
ΣUFA=sum of unsaturated fatty acids (C12:1+C15:1n–5+C16:1n–7+C18:1n–7+C18:1n–9+C20:1n–9+C22:1n–9+C18:3n–3+C18:2n–6+
C20:2n–6+C22:2n–6).
Index of thrombogenicity (IT):
IT =C14 : 0 + C16 : 0 + C18 : 0
0.5·ΣMUFA + 0.5·Σn − 6PUFA + 3·Σn − 3PUFA.
ΣMUFA denotes the sum of monounsaturated fatty acids (C12:1 + C15:1n–5 + C16:1n-7 + C18:1n–7 + C18:1n–9 + C20:1n–9 + C22:1n–9); Σn–6 PUFA denotes the sum of n–6polyunsaturated fatty acids (C18:2n–6 + C20:2n–6 + C22:2n–6); Σn–3 PUFA denotes thesum of n–3 polyunsaturated fatty acids (C18:3n–3).
Hypocholesterolemic/hypercholesterolemic ratio (HH):
HH =cis C18 : 1n9 + ΣPUFA
C12 : 0 + C14 : 0 + C16 : 0
ΣPUFA denotes the sum of polyunsaturated fatty acids (C18:3n–3 + C18:2n–6 + C20:2n–6 + C2:2n–6).
2.5. Statistical Analysis
Significant differences were calculated by using one-way repeated measures ANOVAfollowed by the Bonferroni test. All analyses were conducted by IBM SPSS Statisticsfor Windows (Version 27.0, SPSS Inc., Chicago, IL, USA). Fatty acids are expressed as apercentage by the weight (w/w%) of total fatty acids. Data presented in the tables andfigures are mean values with standard deviations.
Foods 2022, 11, 192 5 of 16
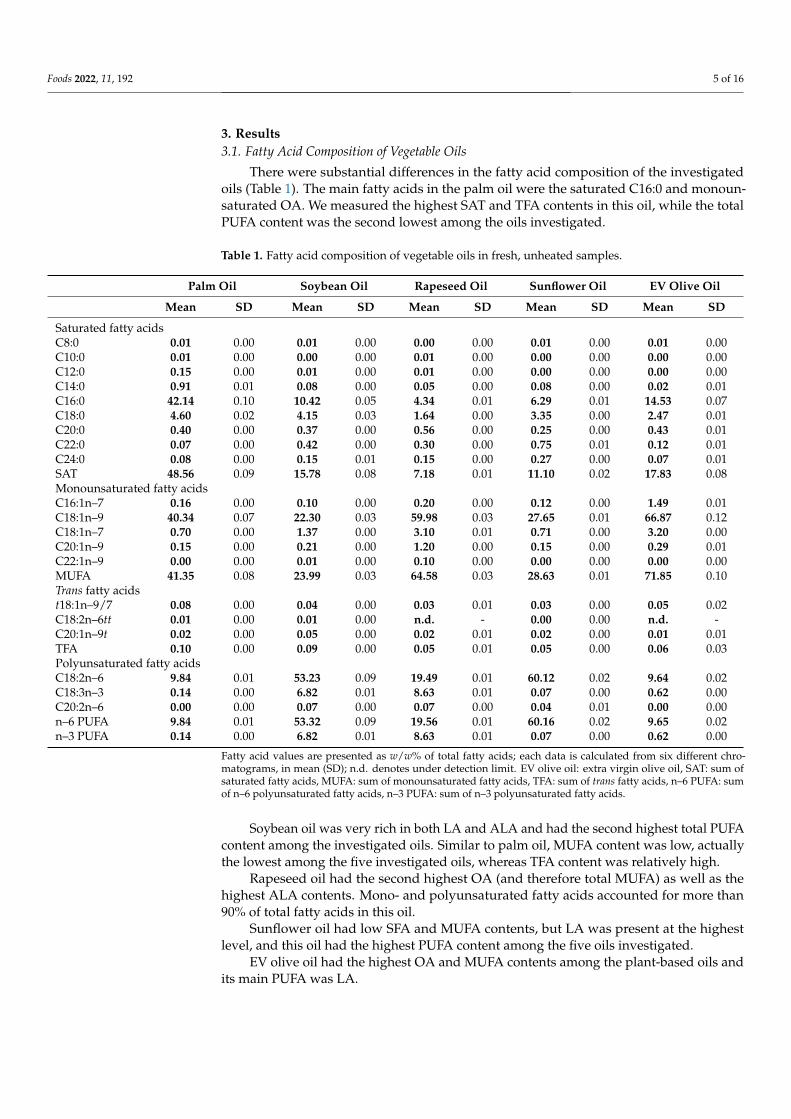
3. Results3.1. Fatty Acid Composition of Vegetable Oils
There were substantial differences in the fatty acid composition of the investigatedoils (Table 1). The main fatty acids in the palm oil were the saturated C16:0 and monoun-saturated OA. We measured the highest SAT and TFA contents in this oil, while the totalPUFA content was the second lowest among the oils investigated.
Table 1. Fatty acid composition of vegetable oils in fresh, unheated samples.
Palm Oil Soybean Oil Rapeseed Oil Sunflower Oil EV Olive Oil
Mean SD Mean SD Mean SD Mean SD Mean SD
Saturated fatty acidsC8:0 0.01 0.00 0.01 0.00 0.00 0.00 0.01 0.00 0.01 0.00C10:0 0.01 0.00 0.00 0.00 0.01 0.00 0.00 0.00 0.00 0.00C12:0 0.15 0.00 0.01 0.00 0.01 0.00 0.00 0.00 0.00 0.00C14:0 0.91 0.01 0.08 0.00 0.05 0.00 0.08 0.00 0.02 0.01C16:0 42.14 0.10 10.42 0.05 4.34 0.01 6.29 0.01 14.53 0.07C18:0 4.60 0.02 4.15 0.03 1.64 0.00 3.35 0.00 2.47 0.01C20:0 0.40 0.00 0.37 0.00 0.56 0.00 0.25 0.00 0.43 0.01C22:0 0.07 0.00 0.42 0.00 0.30 0.00 0.75 0.01 0.12 0.01C24:0 0.08 0.00 0.15 0.01 0.15 0.00 0.27 0.00 0.07 0.01SAT 48.56 0.09 15.78 0.08 7.18 0.01 11.10 0.02 17.83 0.08Monounsaturated fatty acidsC16:1n–7 0.16 0.00 0.10 0.00 0.20 0.00 0.12 0.00 1.49 0.01C18:1n–9 40.34 0.07 22.30 0.03 59.98 0.03 27.65 0.01 66.87 0.12C18:1n–7 0.70 0.00 1.37 0.00 3.10 0.01 0.71 0.00 3.20 0.00C20:1n–9 0.15 0.00 0.21 0.00 1.20 0.00 0.15 0.00 0.29 0.01C22:1n–9 0.00 0.00 0.01 0.00 0.10 0.00 0.00 0.00 0.00 0.00MUFA 41.35 0.08 23.99 0.03 64.58 0.03 28.63 0.01 71.85 0.10Trans fatty acidst18:1n–9/7 0.08 0.00 0.04 0.00 0.03 0.01 0.03 0.00 0.05 0.02C18:2n–6tt 0.01 0.00 0.01 0.00 n.d. - 0.00 0.00 n.d. -C20:1n–9t 0.02 0.00 0.05 0.00 0.02 0.01 0.02 0.00 0.01 0.01TFA 0.10 0.00 0.09 0.00 0.05 0.01 0.05 0.00 0.06 0.03Polyunsaturated fatty acidsC18:2n–6 9.84 0.01 53.23 0.09 19.49 0.01 60.12 0.02 9.64 0.02C18:3n–3 0.14 0.00 6.82 0.01 8.63 0.01 0.07 0.00 0.62 0.00C20:2n–6 0.00 0.00 0.07 0.00 0.07 0.00 0.04 0.01 0.00 0.00n–6 PUFA 9.84 0.01 53.32 0.09 19.56 0.01 60.16 0.02 9.65 0.02n–3 PUFA 0.14 0.00 6.82 0.01 8.63 0.01 0.07 0.00 0.62 0.00
Fatty acid values are presented as w/w% of total fatty acids; each data is calculated from six different chro-matograms, in mean (SD); n.d. denotes under detection limit. EV olive oil: extra virgin olive oil, SAT: sum ofsaturated fatty acids, MUFA: sum of monounsaturated fatty acids, TFA: sum of trans fatty acids, n–6 PUFA: sumof n–6 polyunsaturated fatty acids, n–3 PUFA: sum of n–3 polyunsaturated fatty acids.
Soybean oil was very rich in both LA and ALA and had the second highest total PUFAcontent among the investigated oils. Similar to palm oil, MUFA content was low, actuallythe lowest among the five investigated oils, whereas TFA content was relatively high.
Rapeseed oil had the second highest OA (and therefore total MUFA) as well as thehighest ALA contents. Mono- and polyunsaturated fatty acids accounted for more than90% of total fatty acids in this oil.
Sunflower oil had low SFA and MUFA contents, but LA was present at the highestlevel, and this oil had the highest PUFA content among the five oils investigated.
EV olive oil had the highest OA and MUFA contents among the plant-based oils andits main PUFA was LA.
Foods 2022, 11, 192 6 of 16
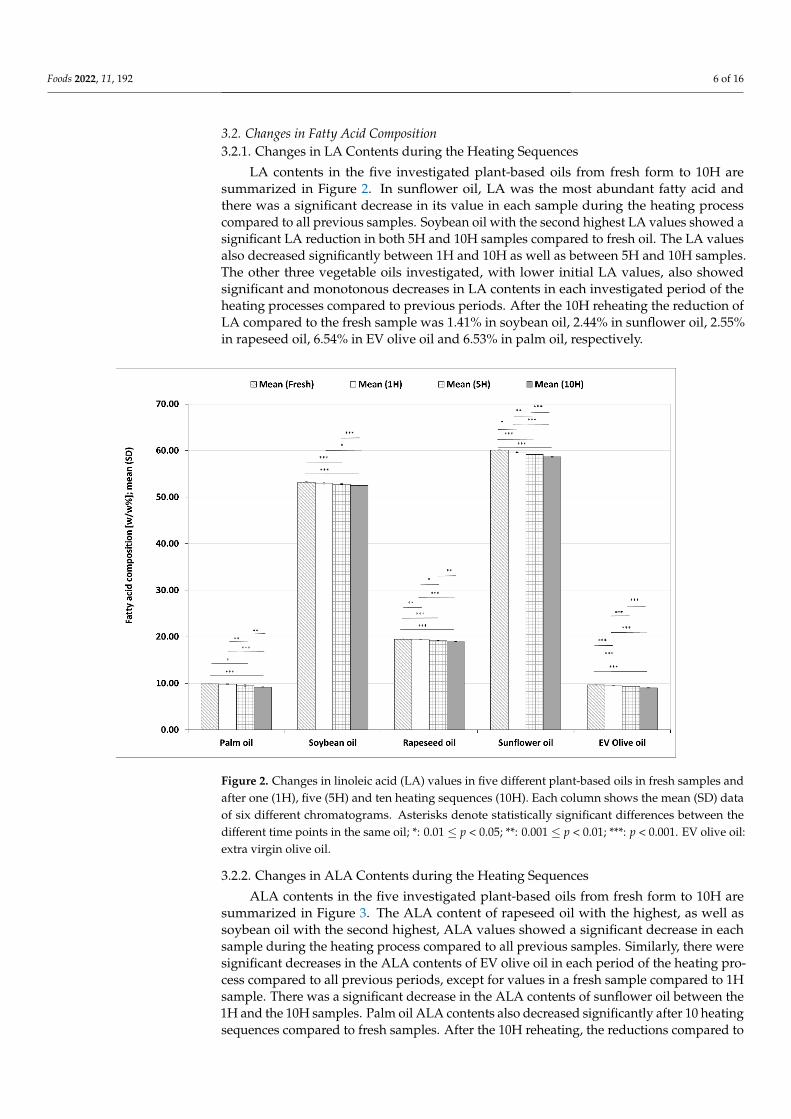
3.2. Changes in Fatty Acid Composition3.2.1. Changes in LA Contents during the Heating Sequences
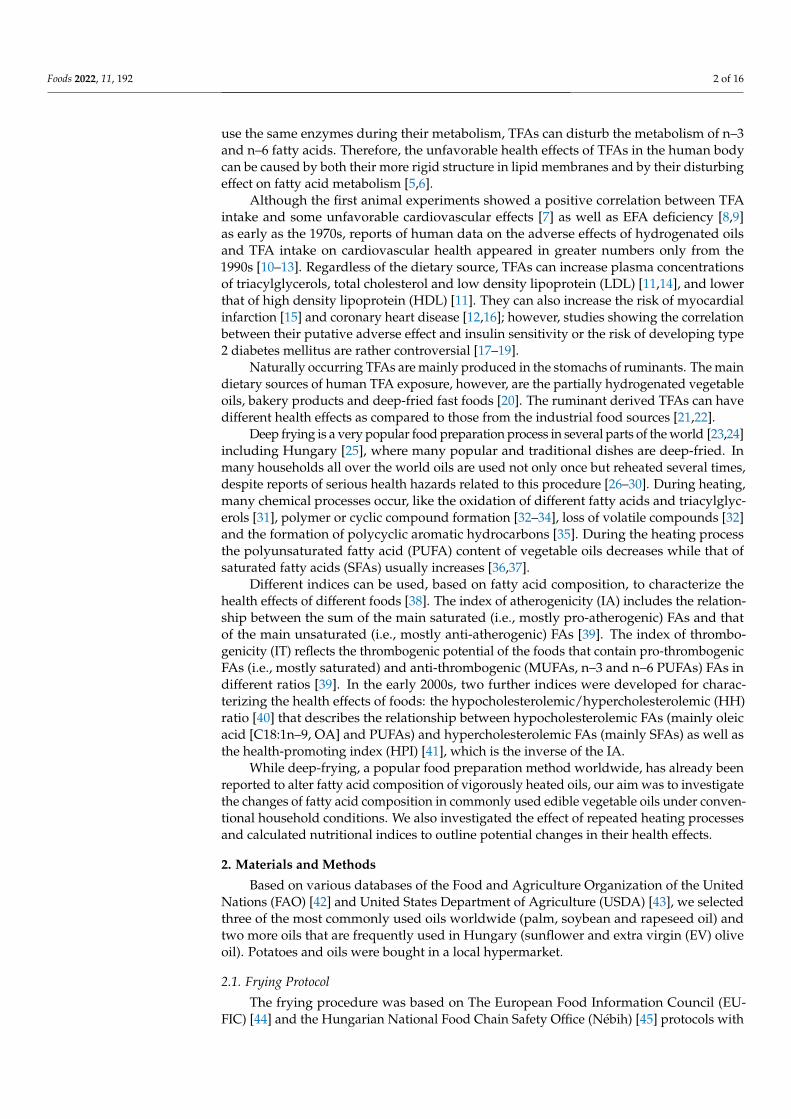
LA contents in the five investigated plant-based oils from fresh form to 10H aresummarized in Figure 2. In sunflower oil, LA was the most abundant fatty acid andthere was a significant decrease in its value in each sample during the heating processcompared to all previous samples. Soybean oil with the second highest LA values showed asignificant LA reduction in both 5H and 10H samples compared to fresh oil. The LA valuesalso decreased significantly between 1H and 10H as well as between 5H and 10H samples.The other three vegetable oils investigated, with lower initial LA values, also showedsignificant and monotonous decreases in LA contents in each investigated period of theheating processes compared to previous periods. After the 10H reheating the reduction ofLA compared to the fresh sample was 1.41% in soybean oil, 2.44% in sunflower oil, 2.55%in rapeseed oil, 6.54% in EV olive oil and 6.53% in palm oil, respectively.
Foods 2022, 11, x FOR PEER REVIEW 6 of 17
Soybean oil was very rich in both LA and ALA and had the second highest total
PUFA content among the investigated oils. Similar to palm oil, MUFA content was low,
actually the lowest among the five investigated oils, whereas TFA content was relatively
high.
Rapeseed oil had the second highest OA (and therefore total MUFA) as well as the
highest ALA contents. Mono- and polyunsaturated fatty acids accounted for more than
90% of total fatty acids in this oil.
Sunflower oil had low SFA and MUFA contents, but LA was present at the highest
level, and this oil had the highest PUFA content among the five oils investigated.
EV olive oil had the highest OA and MUFA contents among the plant-based oils and
its main PUFA was LA.
3.2. Changes in Fatty Acid Composition
3.2.1. Changes in LA Contents during the Heating Sequences
LA contents in the five investigated plant-based oils from fresh form to 10H are sum-
marized in Figure 2. In sunflower oil, LA was the most abundant fatty acid and there was
a significant decrease in its value in each sample during the heating process compared to
all previous samples. Soybean oil with the second highest LA values showed a significant
LA reduction in both 5H and 10H samples compared to fresh oil. The LA values also de-
creased significantly between 1H and 10H as well as between 5H and 10H samples. The
other three vegetable oils investigated, with lower initial LA values, also showed signifi-
cant and monotonous decreases in LA contents in each investigated period of the heating
processes compared to previous periods. After the 10H reheating the reduction of LA
compared to the fresh sample was 1.41% in soybean oil, 2.44% in sunflower oil, 2.55% in
rapeseed oil, 6.54% in EV olive oil and 6.53% in palm oil, respectively.
Figure 2. Changes in linoleic acid (LA) values in five different plant-based oils in fresh samples and
after one (1H), five (5H) and ten heating sequences (10H). Each column shows the mean (SD) data
of six different chromatograms. Asterisks denote statistically significant differences between the dif-
ferent time points in the same oil; *: 0.01 ≤ p < 0.05; **: 0.001 ≤ p < 0.01; ***: p < 0.001. EV olive oil: extra
virgin olive oil.
Figure 2. Changes in linoleic acid (LA) values in five different plant-based oils in fresh samples andafter one (1H), five (5H) and ten heating sequences (10H). Each column shows the mean (SD) dataof six different chromatograms. Asterisks denote statistically significant differences between thedifferent time points in the same oil; *: 0.01 ≤ p < 0.05; **: 0.001 ≤ p < 0.01; ***: p < 0.001. EV olive oil:extra virgin olive oil.
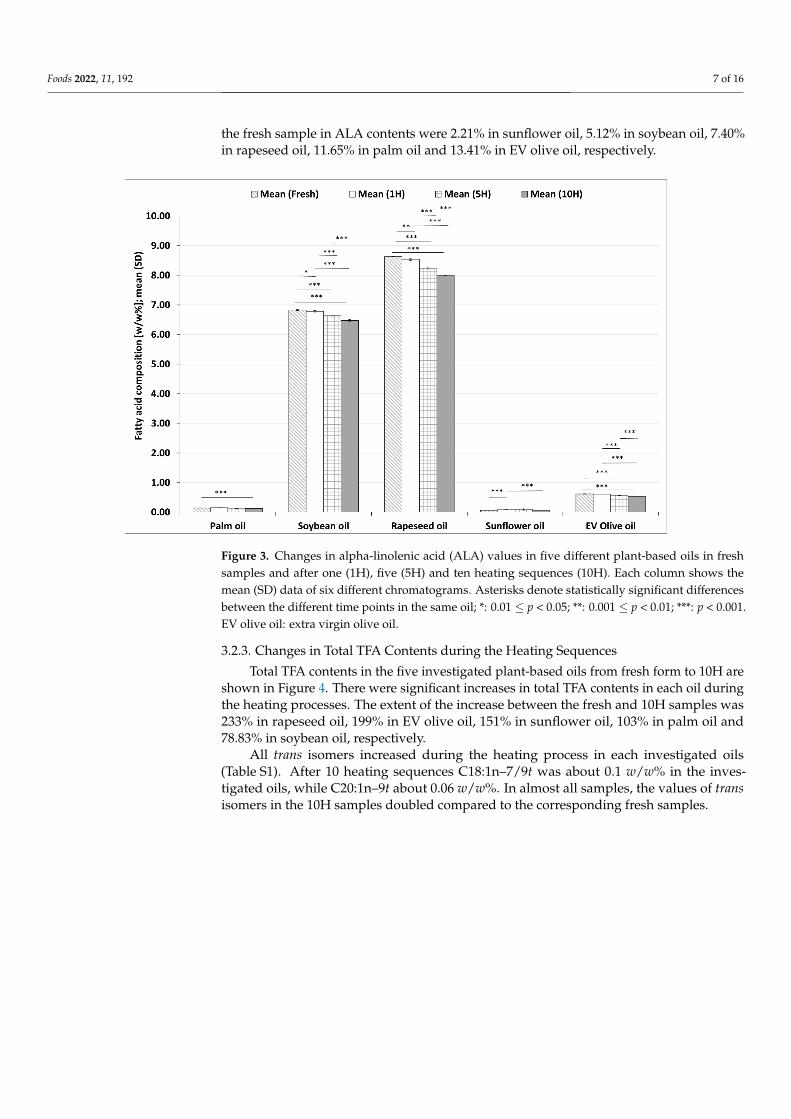
3.2.2. Changes in ALA Contents during the Heating Sequences
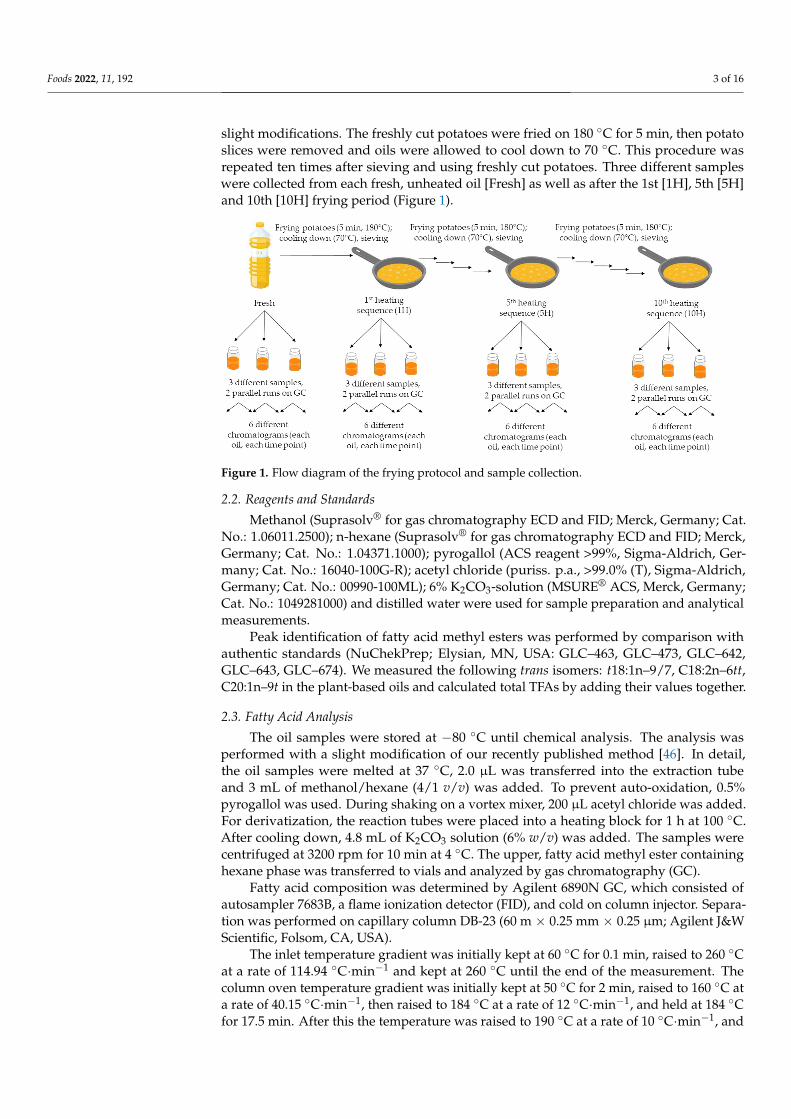
ALA contents in the five investigated plant-based oils from fresh form to 10H aresummarized in Figure 3. The ALA content of rapeseed oil with the highest, as well assoybean oil with the second highest, ALA values showed a significant decrease in eachsample during the heating process compared to all previous samples. Similarly, there weresignificant decreases in the ALA contents of EV olive oil in each period of the heating pro-cess compared to all previous periods, except for values in a fresh sample compared to 1Hsample. There was a significant decrease in the ALA contents of sunflower oil between the1H and the 10H samples. Palm oil ALA contents also decreased significantly after 10 heatingsequences compared to fresh samples. After the 10H reheating, the reductions compared to
Foods 2022, 11, 192 7 of 16
the fresh sample in ALA contents were 2.21% in sunflower oil, 5.12% in soybean oil, 7.40%in rapeseed oil, 11.65% in palm oil and 13.41% in EV olive oil, respectively.
Foods 2022, 11, x FOR PEER REVIEW 7 of 17
3.2.2. Changes in ALA Contents during the Heating Sequences
ALA contents in the five investigated plant-based oils from fresh form to 10H are
summarized in Figure 3. The ALA content of rapeseed oil with the highest, as well as
soybean oil with the second highest, ALA values showed a significant decrease in each
sample during the heating process compared to all previous samples. Similarly, there
were significant decreases in the ALA contents of EV olive oil in each period of the heating
process compared to all previous periods, except for values in a fresh sample compared
to 1H sample. There was a significant decrease in the ALA contents of sunflower oil be-
tween the 1H and the 10H samples. Palm oil ALA contents also decreased significantly
after 10 heating sequences compared to fresh samples. After the 10H reheating, the reduc-
tions compared to the fresh sample in ALA contents were 2.21% in sunflower oil, 5.12%
in soybean oil, 7.40% in rapeseed oil, 11.65% in palm oil and 13.41% in EV olive oil, re-
spectively.
Figure 3. Changes in alpha-linolenic acid (ALA) values in five different plant-based oils in fresh
samples and after one (1H), five (5H) and ten heating sequences (10H). Each column shows the
mean (SD) data of six different chromatograms. Asterisks denote statistically significant differences
between the different time points in the same oil; *: 0.01 ≤ p < 0.05; **: 0.001 ≤ p < 0.01; ***: p < 0.001.
EV olive oil: extra virgin olive oil.
3.2.3. Changes in Total TFA Contents during the Heating Sequences
Total TFA contents in the five investigated plant-based oils from fresh form to 10H
are shown in Figure 4. There were significant increases in total TFA contents in each oil
during the heating processes. The extent of the increase between the fresh and 10H sam-
ples was 233% in rapeseed oil, 199% in EV olive oil, 151% in sunflower oil, 103% in palm
oil and 78.83% in soybean oil, respectively.
All trans isomers increased during the heating process in each investigated oils (Table
S1). After 10 heating sequences C18:1n–7/9t was about 0.1 w/w% in the investigated oils,
while C20:1n–9t about 0.06 w/w%. In almost all samples, the values of trans isomers in the
10H samples doubled compared to the corresponding fresh samples.
Figure 3. Changes in alpha-linolenic acid (ALA) values in five different plant-based oils in freshsamples and after one (1H), five (5H) and ten heating sequences (10H). Each column shows themean (SD) data of six different chromatograms. Asterisks denote statistically significant differencesbetween the different time points in the same oil; *: 0.01 ≤ p < 0.05; **: 0.001 ≤ p < 0.01; ***: p < 0.001.EV olive oil: extra virgin olive oil.
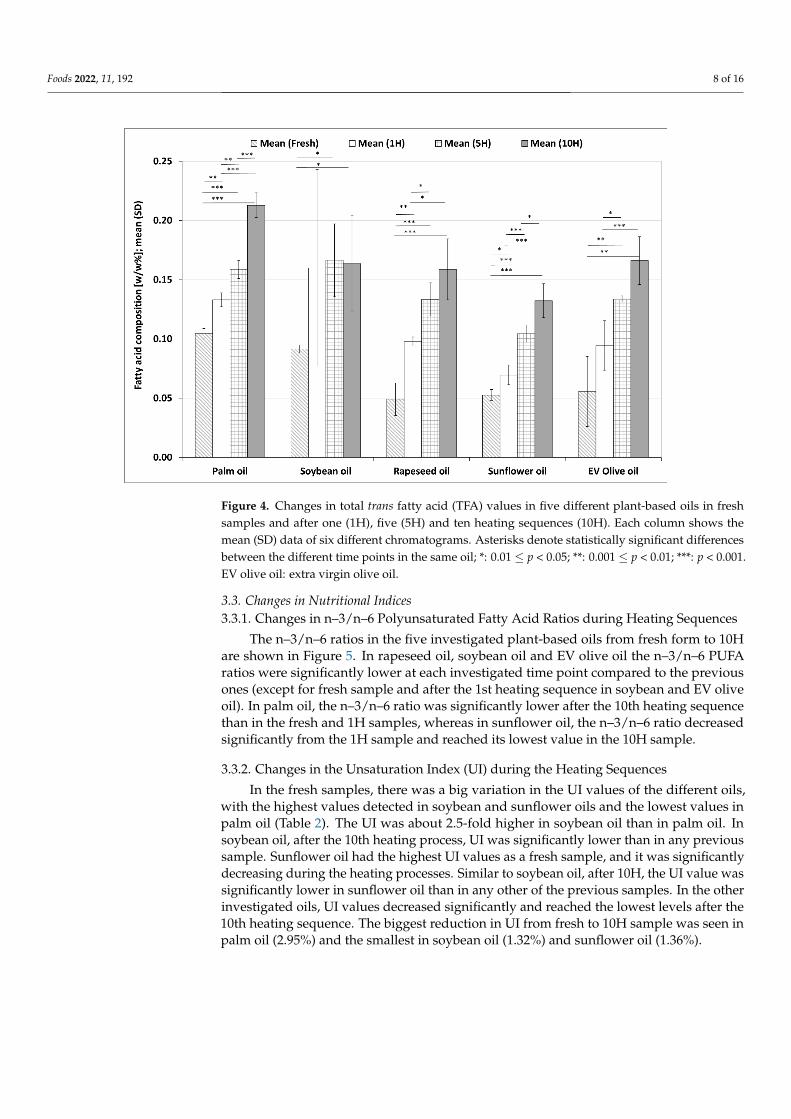
3.2.3. Changes in Total TFA Contents during the Heating Sequences
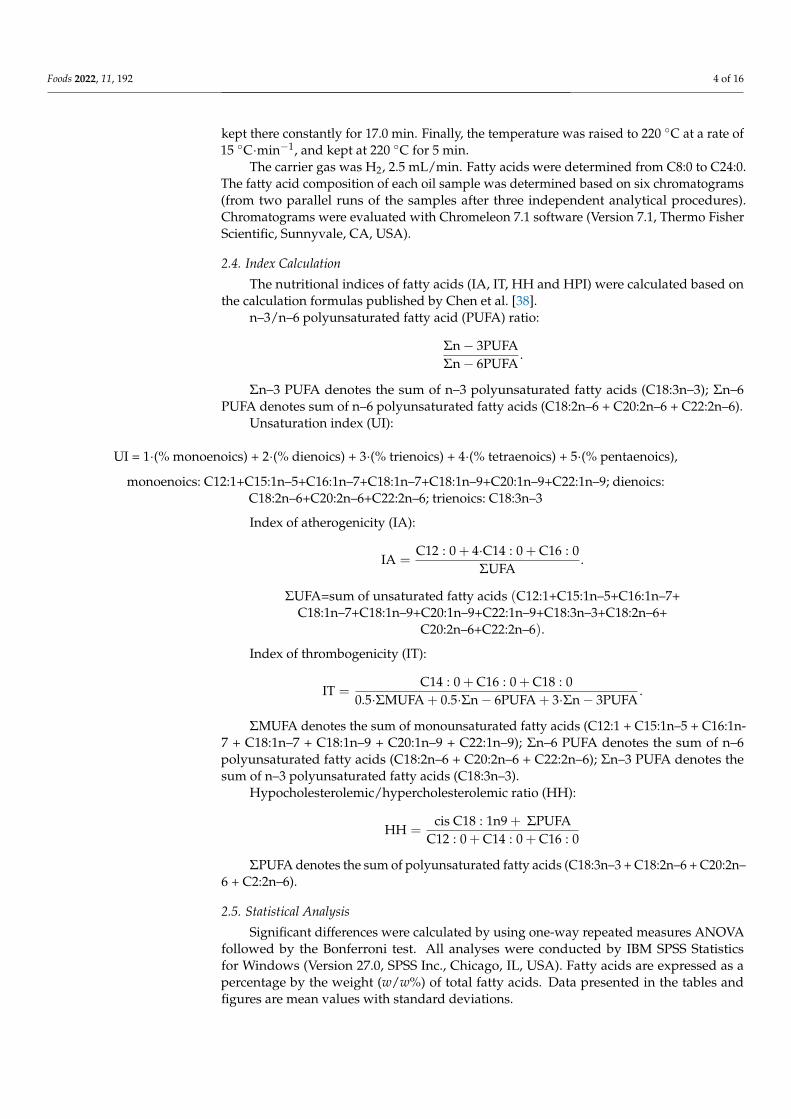
Total TFA contents in the five investigated plant-based oils from fresh form to 10H areshown in Figure 4. There were significant increases in total TFA contents in each oil duringthe heating processes. The extent of the increase between the fresh and 10H samples was233% in rapeseed oil, 199% in EV olive oil, 151% in sunflower oil, 103% in palm oil and78.83% in soybean oil, respectively.
All trans isomers increased during the heating process in each investigated oils(Table S1). After 10 heating sequences C18:1n–7/9t was about 0.1 w/w% in the inves-tigated oils, while C20:1n–9t about 0.06 w/w%. In almost all samples, the values of transisomers in the 10H samples doubled compared to the corresponding fresh samples.
Foods 2022, 11, 192 8 of 16Foods 2022, 11, x FOR PEER REVIEW 8 of 17
Figure 4. Changes in total trans fatty acid (TFA) values in five different plant-based oils in fresh
samples and after one (1H), five (5H) and ten heating sequences (10H). Each column shows the
mean (SD) data of six different chromatograms. Asterisks denote statistically significant differences
between the different time points in the same oil; *: 0.01 ≤ p < 0.05; **: 0.001 ≤ p < 0.01; ***: p < 0.001.
EV olive oil: extra virgin olive oil.
3.3. Changes in Nutritional Indices
3.3.1. Changes in n–3/n–6 Polyunsaturated Fatty Acid Ratios during Heating Sequences
The n–3/n–6 ratios in the five investigated plant-based oils from fresh form to 10H
are shown in Figure 5. In rapeseed oil, soybean oil and EV olive oil the n–3/n–6 PUFA
ratios were significantly lower at each investigated time point compared to the previous
ones (except for fresh sample and after the 1st heating sequence in soybean and EV olive
oil). In palm oil, the n–3/n–6 ratio was significantly lower after the 10th heating sequence
than in the fresh and 1H samples, whereas in sunflower oil, the n–3/n–6 ratio decreased
significantly from the 1H sample and reached its lowest value in the 10H sample.
3.3.2. Changes in the Unsaturation Index (UI) during the Heating Sequences
In the fresh samples, there was a big variation in the UI values of the different oils,
with the highest values detected in soybean and sunflower oils and the lowest values in
palm oil (Table 2). The UI was about 2.5-fold higher in soybean oil than in palm oil. In
soybean oil, after the 10th heating process, UI was significantly lower than in any previous
sample. Sunflower oil had the highest UI values as a fresh sample, and it was significantly
decreasing during the heating processes. Similar to soybean oil, after 10H, the UI value
was significantly lower in sunflower oil than in any other of the previous samples. In the
other investigated oils, UI values decreased significantly and reached the lowest levels
after the 10th heating sequence. The biggest reduction in UI from fresh to 10H sample was
seen in palm oil (2.95%) and the smallest in soybean oil (1.32%) and sunflower oil (1.36%).
Figure 4. Changes in total trans fatty acid (TFA) values in five different plant-based oils in freshsamples and after one (1H), five (5H) and ten heating sequences (10H). Each column shows themean (SD) data of six different chromatograms. Asterisks denote statistically significant differencesbetween the different time points in the same oil; *: 0.01 ≤ p < 0.05; **: 0.001 ≤ p < 0.01; ***: p < 0.001.EV olive oil: extra virgin olive oil.
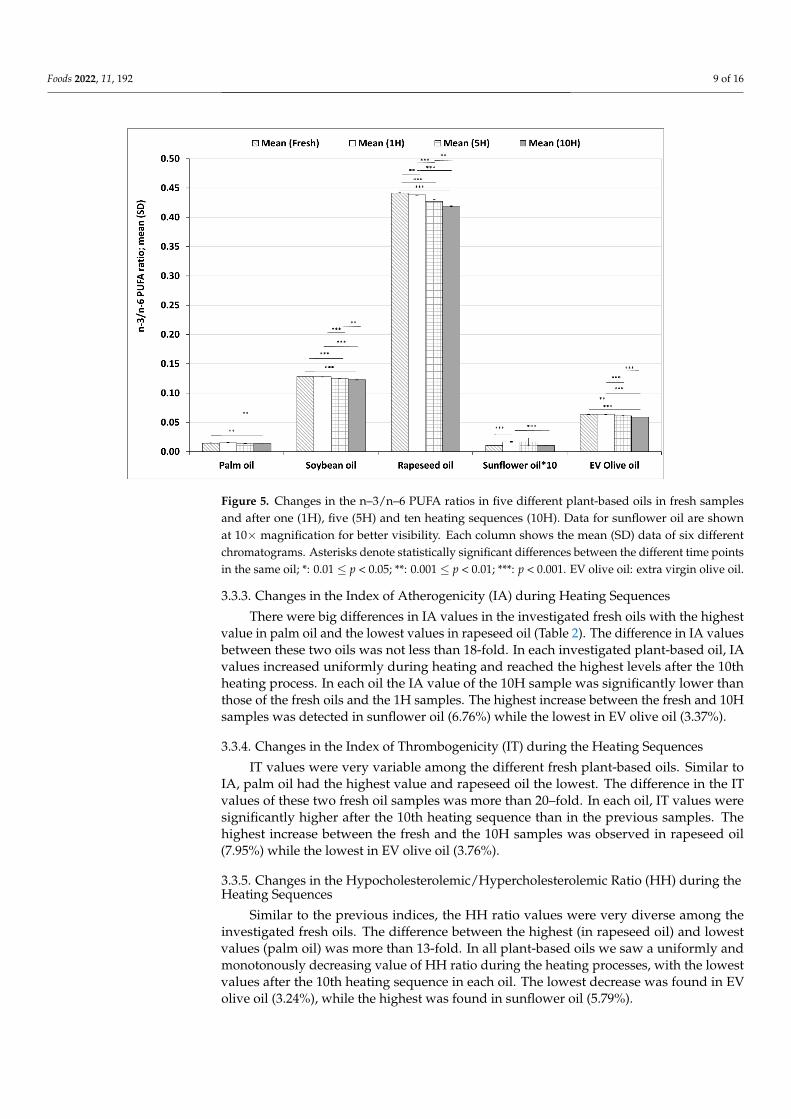
3.3. Changes in Nutritional Indices3.3.1. Changes in n–3/n–6 Polyunsaturated Fatty Acid Ratios during Heating Sequences
The n–3/n–6 ratios in the five investigated plant-based oils from fresh form to 10Hare shown in Figure 5. In rapeseed oil, soybean oil and EV olive oil the n–3/n–6 PUFAratios were significantly lower at each investigated time point compared to the previousones (except for fresh sample and after the 1st heating sequence in soybean and EV oliveoil). In palm oil, the n–3/n–6 ratio was significantly lower after the 10th heating sequencethan in the fresh and 1H samples, whereas in sunflower oil, the n–3/n–6 ratio decreasedsignificantly from the 1H sample and reached its lowest value in the 10H sample.
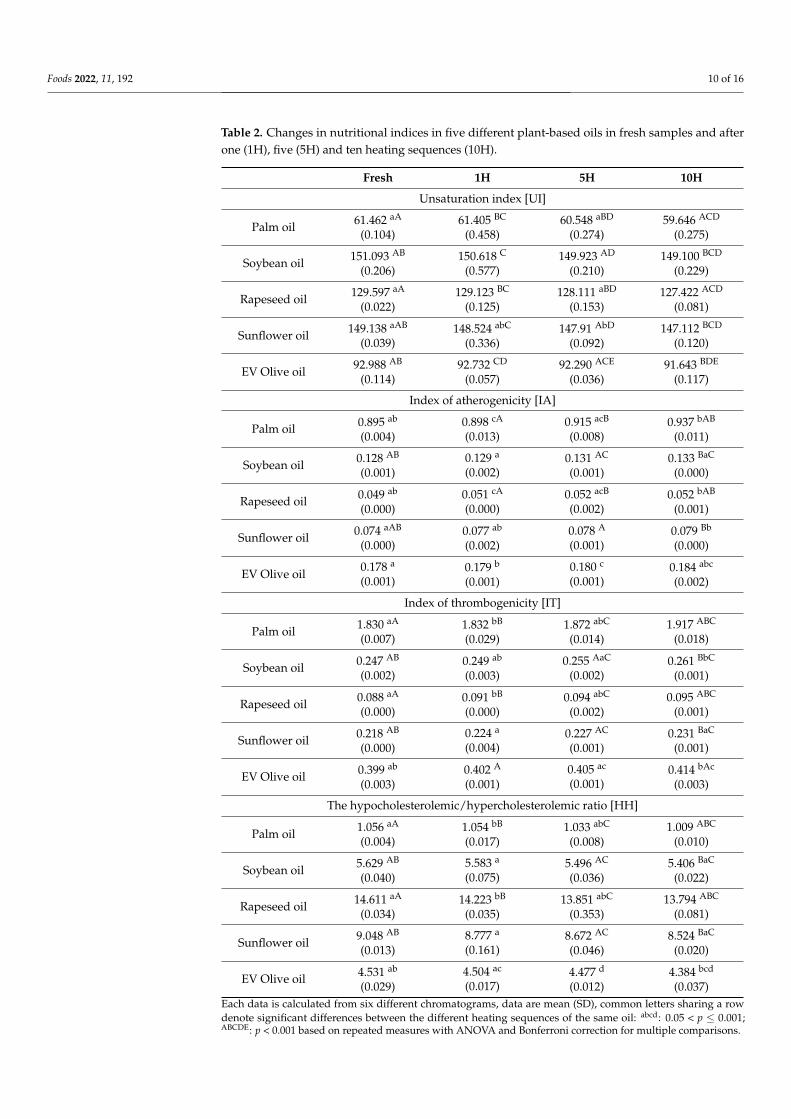
3.3.2. Changes in the Unsaturation Index (UI) during the Heating Sequences
In the fresh samples, there was a big variation in the UI values of the different oils,with the highest values detected in soybean and sunflower oils and the lowest values inpalm oil (Table 2). The UI was about 2.5-fold higher in soybean oil than in palm oil. Insoybean oil, after the 10th heating process, UI was significantly lower than in any previoussample. Sunflower oil had the highest UI values as a fresh sample, and it was significantlydecreasing during the heating processes. Similar to soybean oil, after 10H, the UI value wassignificantly lower in sunflower oil than in any other of the previous samples. In the otherinvestigated oils, UI values decreased significantly and reached the lowest levels after the10th heating sequence. The biggest reduction in UI from fresh to 10H sample was seen inpalm oil (2.95%) and the smallest in soybean oil (1.32%) and sunflower oil (1.36%).
Foods 2022, 11, 192 9 of 16Foods 2022, 11, x FOR PEER REVIEW 9 of 17
Figure 5. Changes in the n–3/n–6 PUFA ratios in five different plant-based oils in fresh samples and
after one (1H), five (5H) and ten heating sequences (10H). Data for sunflower oil are shown at 10x
magnification for better visibility. Each column shows the mean (SD) data of six different chroma-
tograms. Asterisks denote statistically significant differences between the different time points in
the same oil; *: 0.01 ≤ p < 0.05; **: 0.001 ≤ p < 0.01; ***: p < 0.001. EV olive oil: extra virgin olive oil.
3.3.3. Changes in the Index of Atherogenicity (IA) during Heating Sequences
There were big differences in IA values in the investigated fresh oils with the highest
value in palm oil and the lowest values in rapeseed oil (Table 2). The difference in IA
values between these two oils was not less than 18-fold. In each investigated plant-based
oil, IA values increased uniformly during heating and reached the highest levels after the
10th heating process. In each oil the IA value of the 10H sample was significantly lower
than those of the fresh oils and the 1H samples. The highest increase between the fresh
and 10H samples was detected in sunflower oil (6.76%) while the lowest in EV olive oil
(3.37%).
3.3.4. Changes in the Index of Thrombogenicity (IT) during the Heating Sequences
IT values were very variable among the different fresh plant-based oils. Similar to IA,
palm oil had the highest value and rapeseed oil the lowest. The difference in the IT values
of these two fresh oil samples was more than 20–fold. In each oil, IT values were signifi-
cantly higher after the 10th heating sequence than in the previous samples. The highest
increase between the fresh and the 10H samples was observed in rapeseed oil (7.95%)
while the lowest in EV olive oil (3.76%).
3.3.5. Changes in the Hypocholesterolemic/Hypercholesterolemic Ratio (HH) during the
Heating Sequences
Similar to the previous indices, the HH ratio values were very diverse among the
investigated fresh oils. The difference between the highest (in rapeseed oil) and lowest
values (palm oil) was more than 13-fold. In all plant-based oils we saw a uniformly and
monotonously decreasing value of HH ratio during the heating processes, with the lowest
values after the 10th heating sequence in each oil. The lowest decrease was found in EV
olive oil (3.24%), while the highest was found in sunflower oil (5.79%).
Figure 5. Changes in the n–3/n–6 PUFA ratios in five different plant-based oils in fresh samplesand after one (1H), five (5H) and ten heating sequences (10H). Data for sunflower oil are shownat 10× magnification for better visibility. Each column shows the mean (SD) data of six differentchromatograms. Asterisks denote statistically significant differences between the different time pointsin the same oil; *: 0.01 ≤ p < 0.05; **: 0.001 ≤ p < 0.01; ***: p < 0.001. EV olive oil: extra virgin olive oil.
3.3.3. Changes in the Index of Atherogenicity (IA) during Heating Sequences
There were big differences in IA values in the investigated fresh oils with the highestvalue in palm oil and the lowest values in rapeseed oil (Table 2). The difference in IA valuesbetween these two oils was not less than 18-fold. In each investigated plant-based oil, IAvalues increased uniformly during heating and reached the highest levels after the 10thheating process. In each oil the IA value of the 10H sample was significantly lower thanthose of the fresh oils and the 1H samples. The highest increase between the fresh and 10Hsamples was detected in sunflower oil (6.76%) while the lowest in EV olive oil (3.37%).
3.3.4. Changes in the Index of Thrombogenicity (IT) during the Heating Sequences
IT values were very variable among the different fresh plant-based oils. Similar toIA, palm oil had the highest value and rapeseed oil the lowest. The difference in the ITvalues of these two fresh oil samples was more than 20–fold. In each oil, IT values weresignificantly higher after the 10th heating sequence than in the previous samples. Thehighest increase between the fresh and the 10H samples was observed in rapeseed oil(7.95%) while the lowest in EV olive oil (3.76%).
3.3.5. Changes in the Hypocholesterolemic/Hypercholesterolemic Ratio (HH) during theHeating Sequences
Similar to the previous indices, the HH ratio values were very diverse among theinvestigated fresh oils. The difference between the highest (in rapeseed oil) and lowestvalues (palm oil) was more than 13-fold. In all plant-based oils we saw a uniformly andmonotonously decreasing value of HH ratio during the heating processes, with the lowestvalues after the 10th heating sequence in each oil. The lowest decrease was found in EVolive oil (3.24%), while the highest was found in sunflower oil (5.79%).
Foods 2022, 11, 192 10 of 16
Table 2. Changes in nutritional indices in five different plant-based oils in fresh samples and afterone (1H), five (5H) and ten heating sequences (10H).
Fresh 1H 5H 10H
Unsaturation index [UI]
Palm oil 61.462 aA
(0.104)61.405 BC
(0.458)60.548 aBD
(0.274)59.646 ACD
(0.275)
Soybean oil 151.093 AB
(0.206)150.618 C
(0.577)149.923 AD
(0.210)149.100 BCD
(0.229)
Rapeseed oil 129.597 aA
(0.022)129.123 BC
(0.125)128.111 aBD
(0.153)127.422 ACD
(0.081)
Sunflower oil 149.138 aAB
(0.039)148.524 abC
(0.336)147.91 AbD
(0.092)147.112 BCD
(0.120)
EV Olive oil 92.988 AB
(0.114)92.732 CD
(0.057)92.290 ACE
(0.036)91.643 BDE
(0.117)
Index of atherogenicity [IA]
Palm oil 0.895 ab
(0.004)0.898 cA
(0.013)0.915 acB
(0.008)0.937 bAB
(0.011)
Soybean oil 0.128 AB
(0.001)0.129 a
(0.002)0.131 AC
(0.001)0.133 BaC
(0.000)
Rapeseed oil 0.049 ab
(0.000)0.051 cA
(0.000)0.052 acB
(0.002)0.052 bAB
(0.001)
Sunflower oil 0.074 aAB
(0.000)0.077 ab
(0.002)0.078 A
(0.001)0.079 Bb
(0.000)
EV Olive oil 0.178 a
(0.001)0.179 b
(0.001)0.180 c
(0.001)0.184 abc
(0.002)
Index of thrombogenicity [IT]
Palm oil 1.830 aA
(0.007)1.832 bB
(0.029)1.872 abC
(0.014)1.917 ABC
(0.018)
Soybean oil 0.247 AB
(0.002)0.249 ab
(0.003)0.255 AaC
(0.002)0.261 BbC
(0.001)
Rapeseed oil 0.088 aA
(0.000)0.091 bB
(0.000)0.094 abC
(0.002)0.095 ABC
(0.001)
Sunflower oil 0.218 AB
(0.000)0.224 a
(0.004)0.227 AC
(0.001)0.231 BaC
(0.001)
EV Olive oil 0.399 ab
(0.003)0.402 A
(0.001)0.405 ac
(0.001)0.414 bAc
(0.003)
The hypocholesterolemic/hypercholesterolemic ratio [HH]
Palm oil 1.056 aA
(0.004)1.054 bB
(0.017)1.033 abC
(0.008)1.009 ABC
(0.010)
Soybean oil 5.629 AB
(0.040)5.583 a
(0.075)5.496 AC
(0.036)5.406 BaC
(0.022)
Rapeseed oil 14.611 aA
(0.034)14.223 bB
(0.035)13.851 abC
(0.353)13.794 ABC
(0.081)
Sunflower oil 9.048 AB
(0.013)8.777 a
(0.161)8.672 AC
(0.046)8.524 BaC
(0.020)
EV Olive oil 4.531 ab
(0.029)4.504 ac
(0.017)4.477 d
(0.012)4.384 bcd
(0.037)Each data is calculated from six different chromatograms, data are mean (SD), common letters sharing a rowdenote significant differences between the different heating sequences of the same oil: abcd: 0.05 < p ≤ 0.001;ABCDE: p < 0.001 based on repeated measures with ANOVA and Bonferroni correction for multiple comparisons.
Foods 2022, 11, 192 11 of 16
4. Discussion
During deep-frying, several changes occur that can affect the flavor, color and textureof deep-fried food as well as their nutritional quality. In the frying oil free fatty acid,peroxide, di- and polymer content increases, while the total unsaturated fatty acid contentdecreases [32]. In the present study we focused on the total fatty acid composition ofcommonly used plant-based oils and fats and found significant changes in the availabilityof important dietary fatty acids during the frying process.
In fresh form, there were substantial differences between the fatty acid compositions ofthe investigated oils. The present data were consistent with the literature by showing thatpalm oil is mainly composed of palmitic acid (C16:0) and OA [47], whereas the main fattyacids in soybean oil are OA and LA [36,48–54], in rapeseed oil OA, LA and ALA [36,48,52]and in sunflower oil [36,48,54–56] and olive oil [37,48,52,54–56] LA and OA.
In the present study, after 10 heating sequences at 180 ◦C, the TFA values in each oilwere significantly higher than in the fresh samples, with the highest increase detected inrapeseed oil (223%, p < 0.001). However, even after significant increases the TFA values werestill low and remained under 0.25 w/w%. TFAs certainly form under extreme circumstances,especially during heating at high temperatures for a long time, but studies are controversialwith respect to the extent of TFA formation. Heating of the analytic standards triolein andtrielaidin [57] at a relatively low temperature (160 ◦C) for 2 h resulted in the formation oftrans isomers from the cis OA; whereas addition of antioxidants to the reaction reducedTFA formation. Time- and temperature-dependent cis/trans isomerization of OA to elaidicacid (C18:1n–9t) was also reported from the same study. Heating however destabilized thedouble bond regardless to its configuration, so the concentration of trans elaidic acid alsodecreased to~50% after heating at 220 ◦C for 5 h, and was accompanied by the formation of~0.5% cis OA [57].
In another study with vegetable oils [50], TFA was only found in unheated hydro-genated but not in non-hydrogenated soybean oil. Heating had no effect on the formationof TFAs even at high temperature (220 ◦C) for long time (24 h). Similarly, neither heatingnor frying induced significant formation of TFAs in corn oil at 170 ◦C [58]. In contrast,Casal et al. [37] found increasing TFA values during the heating process in EV olive oil aswell as in the blend of refined and virgin olive oil and sunflower oil. Although the TFAcontent of these oils after a longer time of frying (15 to 27 h) did not reach 0.5% of total fattyacids (except for commercially blended refined and virgin olive oil: 0.58% after 27 h), therewas a highly significant positive correlation between TFA values and frying time in case ofeach oil. In refined olive pomace oil, only a small increase of TFA levels, about 1.6% of totalfatty acids could be measured even after 60× frying process [59]. However, under moreextreme circumstances (at 240 ◦C for 12 h), higher trans formation was observed and TFAsreached not less than 7.7% of total fatty acids [49].
Bhardwaj et al. [23] demonstrated that both heating and frying for 30 min increasedthe TFA content of each investigated plant-based oil even at a lower temperature (180 ◦C),whereas higher values were found at higher temperatures and after re-heating/re-frying. Inthis study, partially hydrogenated vegetable oil contained 13% TFAs in fresh form, and afterthe heating or frying process it reached 18.70% and 18.88%, respectively. The type of thefrying process also influences TFA formation in vegetable oil: deep-frying can lead to higherTFA formation than stir-frying or pan-frying [48]. As a summary, studies showed thatthe TFA formation can depend on several factors, like the type of oil [23,31,34,37,48,50,60],temperature [23,34,49,50] and time of heating [23,31,34,37,48,50,58–60], as well as the modeof cooking (e.g., heating, frying, stir-frying) [23,48,52,58]. Results of the present study alsoshowed that cis-trans isomerization occurs even at a lower temperature and with a shorterexposure to frying. Although TFA contents increased continuously with ongoing heatingperiods, this effect seems to be negligible from the physiological point of view. The WorldHealth Organization (WHO) [61,62], the European Food Safety Authority (EFSA) [63] andthe American Heart Association (AHA) [64] recommended that total TFA intake should beas low as possible, but less than 1% of total energy intake. Under the examined conditions
Foods 2022, 11, 192 12 of 16
of investigated oils (<180 ◦C; <10× use) TFA intake with fried food remains well below thisvalue: the highest observed TFA value in the oils investigated was found in palm oil to be0.21 w/w% after ten heating periods.
According to former studies, the TFA content can be very different among variousoil types: plant based oils contain less than 0.5% [31,37,48,49,60], or values even under thedetection limit [50,52], whereas refined and partially hydrogenated oils can reach as high as13.9 w/w% TFA [23] in their fresh forms. In the present study, fresh form of all investigatedoils contained only very small amounts of TFAs (lowest: 0.05 w/w% in rapeseed oil, highest:0.1 w/w% in palm oil).
In the present study, the EFA content of each vegetable oil decreased significantly inthe course of heating and there was a steady decline of LA content in each oil after theheating periods. Sunflower oil had the highest LA values in fresh form and the LA losswas 1.46 g/100 g after the 10th heating period. Fresh rapeseed oil had the highest ALAcontent among the five investigated oils, and the highest ALA loss was also observedhere (0.63 g/100 g). Although EV olive oil contained only a small amount of ALA, thelargest percentage drop in ALA (13.4%) was observed in this oil after the 10th heatingperiod. The decline in LA and ALA values during the heating process of vegetable oilsis much less clearly characterized than the rise in TFA values. This decline in LA val-ues was shown in avocado [60], canola [47], corn [54], EV olive [37], hemp [36], lupin [36],oat [36], olive [37,54,60,65], palm [47], rapeseed [34,36], soybean [49,50,53,54] and sunfloweroils [34,36,37,54,65,66]. In contrast, Cui et al. [48] found significantly higher LA values afterstir-frying and/or pan-frying in peanut, soybean, rapeseed, sunflower, rice bran and linseedoils than in their fresh forms, while in corn, olive and peony seed oils LA values decreased af-ter frying. ALA values also decreased in the course of heating/frying [34,37,47,49,50,53,54,66]except for some studies with soybean [36], avocado [60], corn [48], rice bran [48] andsunflower seed oils [48].
Unsaturated fatty acids are less stable at higher temperatures because cis doublebonds can be saturated, isomerized into trans configuration or other oxidation processesmay occur. Therefore, vegetable oils rich in the physiologically more beneficial MUFAsand PUFAs can be more susceptible to heating-related degradation than other fats rich insaturated fatty acids. During heating or frying an increase in SFA values can be measuredin a time-dependent manner. In the present study, SFA values increased significantly(data not shown) in the course of heating; this finding is in accordance with the resultsof previous studies [23,36,37,48,54,60,65,66]. This increase in SFA values seems to bemore consequent than the decrease in MUFAs and PUFAs, although some studies founddivergent results [49,50,67]. In the present study after the 10th heating sequence the valuesof LA and ALA decreased significantly (p < 0.001) in each oil compared to their freshsamples, while TFA (palm, rapeseed, sunflower oil: p < 0.001; EV olive oil: 0.001 ≤ p < 0.01;soybean oil: p < 0.05) and SFA values increased significantly. These results suggest, that inthe course of frying the PUFA loss can be explained partly by the cis-trans isomerizationand partly by the saturation of these double bonds.
Many indices were developed to characterize the nutritional effects of different foods;the first ones were IA and IT, developed in the early 1990s. IA shows the relationshipbetween the main pro-atherogenic saturated fatty acids (C12:0, C14:0 and C16:0) and theanti-atherogenic unsaturated fatty acids. IT characterizes the relationship between thepro-thrombogenic saturated fatty acids (C12:0, C14:0 and C16:0) and the anti-thrombogenicMUFAs, n–3 and n–6 PUFAs. As heating and frying result in a decrease in the MUFAand PUFA values as well as in an increase in SFA and TFA values, these indices willalso change into a more atherogenic and thrombogenic direction. Among different foodpreparation methods, frying can increase IA and IT values to the greatest extent [68–71];however, the nature of the oils used during the processes can also greatly influence thesevalues [51,55,56,68,72–74]. An experimental study showed that frying at lower tempera-ture, in small amounts of oil and for a short time resulted in the highest IA and PUFA/SFAvalues [75], so the nutritional quality of fried food could be optimized with careful prepara-
Foods 2022, 11, 192 13 of 16
tion. Not only frying, but other techniques depending on heat exposure can increase ITvalues and may also influence the n–3/n–6 PUFA ratios [76]. In the present study a similartrend was shown; after 10 heating sequences all the investigated oils had significantlyincreased IA and IT values representing less favorable health effects.
The two families of PUFAs can have opposite effects on cardiovascular health; PUFAsbelonging to the n–3 family (mainly EPA and DHA) are beneficial, while n–6 PUFAs (mainlyAA) may have adverse health effects [77]. Therefore, the n–3/n–6 PUFA ratio can be usedfor the potential cardiovascular (and health) effect of foods. In the present study, then–3/n–6 PUFA ratios were declining in each oil during heating sequences, in concert withprevious findings on the effect of frying on the n–3/n–6 PUFA ratios in different foods andoils [51,55,56,68–70,74,78–80].
The HH index is used for characterization of the effect of the fatty acid composition offoods on blood cholesterol levels. OA and PUFAs have hypocholesterolaemic, while SFAshypercholesterolaemic effects, so a decrease in HH indicates less beneficial cardiovasculareffects. Heating decreased the HH ratio in each plant-based oil investigated in the presentstudy. In contrast, a previous study didn’t find lower HH ratio in tilapia after frying [70],while in mussels the HH ratio was even increased compared to fresh samples [80]. To thebest of our knowledge, no previous studies have investigated the effect of heating on theHH ratio of oils, only in fried foods.
Previous studies have examined the change of only one or two indices, while in thepresent study the (five) most important nutritional indices were calculated for each oilat each time point and each index has changed in a less favorable direction as a result ofheating. The most stable oil, with the smallest changes was EV olive oil, while the mostsusceptible oils with the greatest changes in nutritional index values were sunflower andrapeseed oils.
5. Conclusions
In this study, repeated heating of vegetable oils resulted in a significant decrease inthe nutritionally mostly beneficial polyunsaturated fatty acid values, while values of transisomers and saturated fatty acids with mostly unfavorable nutritional effects significantlyincreased. Heating also caused a deterioration in several health-related biochemical indices,but the type of oil had a greater effect on the changes of the values of these indices than thenumber of heating sequences. These findings may support the recommendation that oilsrich in PUFA and low in SFA values should be chosen for food preparation, frying shouldbe performed at lower temperatures and multiple reheating should be avoided.
Supplementary Materials: The following are available online at https://www.mdpi.com/article/10.3390/foods11020192/s1, Table S1: Changes in trans isomeric fatty acids in five different plant-basedoils in fresh samples and after one (1H), five (5H) and ten heating sequences (10H).
Author Contributions: Conceptualization, Z.S. and M.F.; methodology, Z.S., V.K.; software, T.M.;investigation, T.M.; writing—original draft preparation, Z.S., V.K., T.M.; writing—review and editing,E.S., T.D.; visualization, T.M., E.S.; supervision, T.D., Z.V., M.F.; funding acquisition, T.D., M.F. Allauthors have read and agreed to the published version of the manuscript.
Funding: This research was funded by National Research, Development and Innovation Office(NKFIH), grant number K-120193 (T.D.), and University of Pécs, Research Fund (KA-2021-07), grantnumber K-300954 (E.S.). The APC was funded by National Research, Development and InnovationOffice (NKFIH) grant number K-120193.
Data Availability Statement: The data presented in this study are available upon request to thecorresponding author.
Conflicts of Interest: The authors declare no conflict of interest.

Foods 2022, 11, 192 14 of 16
References1. Lands, B. Consequences of essential fatty acids. Nutrients 2012, 4, 1338–1357. [CrossRef]2. Swanson, D.; Block, R.; Mousa, S.A. Omega-3 fatty acids epa and dha: Health benefits throughout life. Adv. Nutr. 2012, 3, 1–7.
[CrossRef] [PubMed]3. Simopoulos, A.P. Omega-3 fatty acids in health and disease and in growth and development. Am. J. Clin. Nutr. 1991, 54, 438–463.
[CrossRef]4. Innis, S.M. Dietary omega 3 fatty acids and the developing brain. Brain Res. 2008, 1237, 35–43. [CrossRef] [PubMed]5. Oteng, A.B.; Kersten, S. Mechanisms of action of trans fatty acids. Adv. Nutr. 2020, 11, 697–708. [CrossRef]6. Kummerow, F.A. The negative effects of hydrogenated trans fats and what to do about them. Atherosclerosis 2009, 205, 458–465.
[CrossRef]7. Raccuglia, G.; Privett, O.S. Influence of dietary trans,trans-linoleate on hematologic and hemostatic properties of rat blood. Lipids
1970, 5, 85–89. [CrossRef]8. Takatori, T.; Phillips, F.C.; Shimasaki, H.; Privett, O.S. Effects of dietary saturated and trans fatty acids on tissue lipid composition
and serum lcat activity in the rat. Lipids 1976, 11, 272–280. [CrossRef] [PubMed]9. Privett, O.S.; Phillips, F.; Shimasaki, H.; Nozawa, T.; Nickell, E.C. Studies of effects of trans fatty acids in the diet on lipid
metabolism in essential fatty acid deficient rats. Am. J. Clin. Nutr. 1977, 30, 1009–1017. [CrossRef]10. Ascherio, A.; Katan, M.B.; Zock, P.L.; Stampfer, M.J.; Willett, W.C. Trans fatty acids and coronary heart disease. N. Engl. J. Med.
1999, 340, 1994–1998. [CrossRef]11. Mensink, R.P.; Katan, M.B. Effect of dietary trans fatty acids on high-density and low-density lipoprotein cholesterol levels in
healthy subjects. N. Engl. J. Med. 1990, 323, 439–445. [CrossRef]12. Willett, W.C.; Stampfer, M.J.; Manson, J.E.; Colditz, G.A.; Speizer, F.E.; Rosner, B.A.; Sampson, L.A. Intake of trans fatty acids and
risk of coronary heart disease among women. Lancet 1993, 341, 5. [CrossRef]13. Hudgins, L.C.; Hirsch, J.; Emken, E.A. Correlation of isomeric fatty acids in human adipose tissue with clinical risk factors for
cardiovascular disease. Am. J. Clin. Nutr. 1991, 53, 474–482. [CrossRef]14. Gebauer, S.K.; Destaillats, F.; Dionisi, F.; Krauss, R.M.; Baer, D.J. Vaccenic acid and trans fatty acid isomers from partially
hydrogenated oil both adversely affect ldl cholesterol: A double-blind, randomized controlled trial. Am. J. Clin. Nutr. 2015, 102,1339–1346. [CrossRef] [PubMed]
15. Tavani, A.; Negri, E.; D’Avanzo, B.; La Vecchia, C. Margarine intake and risk of nonfatal acute myocardial infarction in italianwomen. Eur. J. Clin. Nutr. 1997, 51, 30–32. [CrossRef] [PubMed]
16. Pietinen, P.; Ascherio, A.; Korhonen, P.; Hartman, A.M.; Willett, W.C.; Albanes, D.; Virtamo, J. Intake of fatty acids and risk ofcoronary heart disease in a cohort of finnish men. The alpha-tocopherol, beta-carotene cancer prevention study. Am. J. Epidemiol.1997, 145, 876–887. [CrossRef]
17. Bendsen, N.T.; Haugaard, S.B.; Larsen, T.M.; Chabanova, E.; Stender, S.; Astrup, A. Effect of trans-fatty acid intake on insulinsensitivity and intramuscular lipids—A randomized trial in overweight postmenopausal women. Metabolism 2011, 60, 906–913.[CrossRef] [PubMed]
18. Mozaffarian, D.; de Oliveira Otto, M.C.; Lemaitre, R.N.; Fretts, A.M.; Hotamisligil, G.; Tsai, M.Y.; Siscovick, D.S.; Nettleton, J.A.Trans-palmitoleic acid, other dairy fat biomarkers, and incident diabetes: The multi-ethnic study of atherosclerosis (mesa). Am. J.Clin. Nutr. 2013, 97, 854–861. [CrossRef]
19. Riserus, U.; Vessby, B.; Arner, P.; Zethelius, B. Supplementation with trans10cis12-conjugated linoleic acid induces hyperproinsuli-naemia in obese men: Close association with impaired insulin sensitivity. Diabetologia 2004, 47, 1016–1019. [CrossRef]
20. Mozaffarian, D.; Katan, M.B.; Ascherio, A.; Stampfer, M.J.; Willett, W.C. Trans fatty acids and cardiovascular disease. N. Engl. J.Med. 2006, 354, 1601–1613. [CrossRef]
21. de Souza, R.J.; Mente, A.; Maroleanu, A.; Cozma, A.I.; Ha, V.; Kishibe, T.; Uleryk, E.; Budylowski, P.; Schunemann, H.; Beyene,J.; et al. Intake of saturated and trans unsaturated fatty acids and risk of all cause mortality, cardiovascular disease, and type 2diabetes: Systematic review and meta-analysis of observational studies. BMJ 2015, 351, h3978. [CrossRef]
22. Stender, S.; Astrup, A.; Dyerberg, J. Ruminant and industrially produced trans fatty acids: Health aspects. Food Nutr. Res. 2008,52, 1651. [CrossRef] [PubMed]
23. Bhardwaj, S.; Passi, S.J.; Misra, A.; Pant, K.K.; Anwar, K.; Pandey, R.M.; Kardam, V. Effect of heating/reheating of fats/oils, asused by asian indians, on trans fatty acid formation. Food Chem. 2016, 212, 663–670. [CrossRef] [PubMed]
24. Chang, C.; Wu, G.; Zhang, H.; Jin, Q.; Wang, X. Deep-fried flavor: Characteristics, formation mechanisms, and influencing factors.Crit. Rev. Food Sci. Nutr. 2020, 60, 1496–1514. [CrossRef] [PubMed]
25. Gere, A. A survey on operating conditions and quality of commercial frying fats in hungary. Z. Ernahr. 1985, 24, 120–132.[CrossRef]
26. Dhaka, V.; Gulia, N.; Ahlawat, K.S.; Khatkar, B.S. Trans fats-sources, health risks and alternative approach—A review. J. Food Sci.Technol. 2011, 48, 534–541. [CrossRef] [PubMed]
27. Mozaffarian, D.; Aro, A.; Willett, W.C. Health effects of trans-fatty acids: Experimental and observational evidence. Eur. J. Clin.Nutr. 2009, 63 (Suppl. S2), S5–S21. [CrossRef]
28. Gadiraju, T.V.; Patel, Y.; Gaziano, J.M.; Djousse, L. Fried food consumption and cardiovascular health: A review of currentevidence. Nutrients 2015, 7, 8424–8430. [CrossRef] [PubMed]
Foods 2022, 11, 192 15 of 16
29. Ganesan, K.; Sukalingam, K.; Xu, B. Impact of consumption of repeatedly heated cooking oils on the incidence of variouscancers—A critical review. Crit. Rev. Food Sci. Nutr. 2019, 59, 488–505. [CrossRef]
30. Moorthy, B.; Chu, C.; Carlin, D.J. Polycyclic aromatic hydrocarbons: From metabolism to lung cancer. Toxicol. Sci. 2015, 145, 5–15.[CrossRef]
31. Santos, C.S.P.; Garcia, L.M.; Cruz, R.; Cunha, S.C.; Fernandes, J.O.; Casal, S. Impact of potatoes deep-frying on commonmonounsaturated-rich vegetable oils: A comparative study. J. Food Sci. Technol. 2019, 56, 290–301. [CrossRef] [PubMed]
32. Choe, E.; Min, D.B. Chemistry of deep-fat frying oils. J. Food Sci. 2007, 72, R77–R86. [CrossRef] [PubMed]33. Dobarganes, C.; Marquez-Ruiz, G. Possible adverse effects of frying with vegetable oils. Br. J. Nutr. 2015, 113 (Suppl. S2), S49–S57.
[CrossRef] [PubMed]34. Gere, A. Decrease in essential fatty acid content of edible fats during the frying process. Z. Ernahr. 1982, 21, 191–201. [CrossRef]35. An, K.J.; Liu, Y.L.; Liu, H.L. Relationship between total polar components and polycyclic aromatic hydrocarbons in fried edible
oil. Food Addit. Contam. Part A Chem. Anal. Control Expo. Risk Assess 2017, 34, 1596–1605. [CrossRef]36. Multari, S.; Marsol-Vall, A.; Heponiemi, P.; Suomela, J.P.; Yang, B. Changes in the volatile profile, fatty acid composition and
other markers of lipid oxidation of six different vegetable oils during short-term deep-frying. Food Res. Int. 2019, 122, 318–329.[CrossRef]
37. Casal, S.; Malheiro, R.; Sendas, A.; Oliveira, B.P.; Pereira, J.A. Olive oil stability under deep-frying conditions. Food Chem. Toxicol.2010, 48, 2972–2979. [CrossRef] [PubMed]
38. Chen, J.; Liu, H. Nutritional indices for assessing fatty acids: A mini-review. Int. J. Mol. Sci. 2020, 21, 5695. [CrossRef] [PubMed]39. Ulbricht, T.L.; Southgate, D.A. Coronary heart disease: Seven dietary factors. Lancet 1991, 338, 985–992. [CrossRef]40. Santos-Silva, J.; Bessa, R.J.; Santos-Silva, F. Effect of genotype, feeding system and slaughter weight on the quality of light lambs
ii. Fatty acid composition of meat. Livest. Prod. Sci. 2002, 77, 187–194. [CrossRef]41. Chen, S.; Bobe, G.; Zimmerman, S.; Hammond, E.G.; Luhman, C.M.; Boylston, T.D.; Freeman, A.E.; Beitz, D.C. Physical and
sensory properties of dairy products from cows with various milk fatty acid compositions. J. Agric. Food Chem. 2004, 52, 3422–3428.[CrossRef]
42. Food and Agriculture Organization of the United Nations. Food Outlook. Available online: http://www.fao.org/3/cb4479en/cb4479en.pdf (accessed on 8 October 2021).
43. United States Department of Agriculture. Oilseeds: World Markets and Trade. Available online: https://usda.library.cornell.edu/concern/publications/tx31qh68h?locale=en (accessed on 8 October 2021).
44. The European Food Information Council. How to Choose Your Culinary Oil. Available online: https://www.eufic.org/en/whats-in-food/article/how-to-choose-your-culinary-oil (accessed on 30 May 2021).
45. National Food Chain Safety Office. Útmutató a Vendéglátás és Étkeztetés jó Higiéniai Gyakorlatához. Available online:https://portal.nebih.gov.hu/-/vendeglatas-ghp (accessed on 8 October 2021).
46. Szabó, É.; Marosvölgyi, T.; Szilágyi, G.; Korösi, L.; Schmidt, J.; Csepregi, K.; Márk, L.; Bóna, Á. Correlations between totalantioxidant capacity, polyphenol and fatty acid content of native grape seed and pomace of four different grape varieties inhungary. Antioxidants 2021, 10, 1101. [CrossRef] [PubMed]
47. Alireza, S.; Tan, C.P.; Hamed, M.; Che Man, Y.B. Effect of frying process on fatty acid composition and iodine value of selectedvegetable oils and their blends. Int. Food Res. J. 2010, 17, 295–302.
48. Cui, Y.; Hao, P.; Liu, B.; Meng, X. Effect of traditional chinese cooking methods on fatty acid profiles of vegetable oils. Food Chem.2017, 233, 77–84. [CrossRef]
49. Li, A.; Ha, Y.; Wang, F.; Li, W.; Li, Q. Determination of thermally induced trans-fatty acids in soybean oil by attenuated totalreflectance fourier transform infrared spectroscopy and gas chromatography analysis. J. Agric. Food Chem. 2012, 60, 10709–10713.[CrossRef]
50. Liu, W.H.; Inbaraj, S.B.; Chen, B.H. Analysis and formation of trans fatty acids in hydrogenated soybean oil during heating. FoodChem. 2007, 104, 10. [CrossRef]
51. Naseri, M.; Abedi, E.; Mohammadzadeh, B.; Afsharnaderi, A. Effect of frying in different culinary fats on the fatty acid compositionof silver carp. Food Sci. Nutr. 2013, 1, 292–297. [CrossRef]
52. Song, J.; Park, J.; Jung, J.; Lee, C.; Gim, S.Y.; Ka, H.; Yi, B.; Kim, M.J.; Kim, C.I.; Lee, J. Analysis of trans fat in edible oils withcooking process. Toxicol. Res. 2015, 31, 307–312. [CrossRef]
53. Troegeler-Meynadier, A.; Puaut, S.; Farizon, Y.; Enjalbert, F. Effects of the heating process of soybean oil and seeds on fatty acidbiohydrogenation in vitro. J. Dairy Sci. 2014, 97, 5657–5667. [CrossRef] [PubMed]
54. Zribi, A.; Jabeur, H.; Aladedunye, F.; Rebai, A.; Matthaus, B.; Bouaziz, M. Monitoring of quality and stability characteristics andfatty acid compositions of refined olive and seed oils during repeated pan- and deep-frying using gc, ft-nirs, and chemometrics. J.Agric. Food Chem. 2014, 62, 10357–10367. [CrossRef]
55. Ansorena, D.; Guembe, A.; Mendizabal, T.; Astiasaran, I. Effect of fish and oil nature on frying process and nutritional productquality. J. Food Sci. 2010, 75, H62–H67. [CrossRef]
56. Zotos, A.; Kotaras, A.; Mikras, E. Effect of baking of sardine (Sardina pilchardus) and frying of anchovy (Engraulis encrasicholus) inolive and sunflower oil on their quality. Food Sci. Technol. Int. 2013, 19, 11–23. [CrossRef]
57. Tsuzuki, W. Cis-trans isomerization of carbon double bonds in monounsaturated triacylglycerols via generation of free radicals.Chem. Phys. Lipids 2010, 163, 741–745. [CrossRef]
Foods 2022, 11, 192 16 of 16
58. Yang, M.; Yang, Y.; Nie, S.; Xie, M.; Chen, F.; Luo, P.G. Formation of trans fatty acids during the frying of chicken fillet in corn oil.Int. J. Food Sci. Nutr. 2014, 65, 306–310. [CrossRef]
59. Ben Hammouda, I.; Triki, M.; Matthaus, B.; Bouaziz, M. A comparative study on formation of polar components, fatty acidsand sterols during frying of refined olive pomace oil pure and its blend coconut oil. J. Agric. Food Chem. 2018, 66, 3514–3523.[CrossRef]
60. Berasategi, I.; Barriuso, B.; Ansorena, D.; Astiasaran, I. Stability of avocado oil during heating: Comparative study to olive oil.Food Chem. 2012, 132, 439–446. [CrossRef]
61. WHO. An Action Package to Eliminate Industrially-Produced Trans-Fatty Acids. Available online: https://www.who.int/docs/default-source/documents/replace-transfats/replace-action-package.pdf (accessed on 11 November 2021).
62. Astrup, A.; Bertram, H.C.; Bonjour, J.P.; de Groot, L.C.; de Oliveira Otto, M.C.; Feeney, E.L.; Garg, M.L.; Givens, I.; Kok, F.J.;Krauss, R.M.; et al. Who draft guidelines on dietary saturated and trans fatty acids: Time for a new approach? BMJ 2019, 366,l4137. [CrossRef] [PubMed]
63. EFSA. Scientific and Technical Assistance on Transfatty Acids. Available online: https://efsa.onlinelibrary.wiley.com/doi/pdf/10.2903/sp.efsa.2018.EN-1433 (accessed on 11 November 2021).
64. Arnett, D.K.; Blumenthal, R.S.; Albert, M.A.; Buroker, A.B.; Goldberger, Z.D.; Hahn, E.J.; Himmelfarb, C.D.; Khera, A.; Lloyd-Jones,D.; McEvoy, J.W.; et al. 2019 acc/aha guideline on the primary prevention of cardiovascular disease: Executive summary: Areport of the american college of cardiology/american heart association task force on clinical practice guidelines. Circulation 2019,140, e563–e595. [CrossRef]
65. Askin, B.; Kaya, Y. Effect of deep frying process on the quality of the refined oleic/linoleic sunflower seed oil and olive oil. J FoodSci. Technol. 2020, 57, 4716–4725. [CrossRef] [PubMed]
66. Sayyad, R. Effects of deep-fat frying process on the oil quality during french fries preparation. J. Food Sci. Technol. 2017, 54,2224–2229. [CrossRef] [PubMed]
67. Dordevic, D.; Kushkevych, I.; Jancikova, S.; Zeljkovic, S.C.; Zdarsky, M.; Hodulova, L. Modeling the effect of heat treatment onfatty acid composition in home-made olive oil preparations. Open Life Sci. 2020, 15, 606–618. [CrossRef] [PubMed]
68. Costa, S.; Afonso, C.; Bandarra, N.M.; Gueifao, S.; Castanheira, I.; Carvalho, M.L.; Cardoso, C.; Nunes, M.L. The emerging farmedfish species meagre (Argyrosomus regius): How culinary treatment affects nutrients and contaminants concentration and associatedbenefit-risk balance. Food Chem. Toxicol. 2013, 60, 277–285. [CrossRef] [PubMed]
69. Castro-Gonzalez, M.I.; Carrillo-Dominguez, S. Impact of six cooking techniques on fatty acid composition of marlin (Makairanigricans) and hake (Merluccius productus). Nutr. Hosp. 2015, 32, 1289–1299. [CrossRef]
70. Mekonnen, M.F.; Desta, D.T.; Alemayehu, F.R.; Kelikay, G.N.; Daba, A.K. Evaluation of fatty acid-related nutritional qualityindices in fried and raw nile tilapia, (Oreochromis niloticus), fish muscles. Food Sci. Nutr. 2020, 8, 4814–4821. [CrossRef] [PubMed]
71. Abdel-Naeem, H.H.S.; Sallam, K.I.; Zaki, H. Effect of different cooking methods of rabbit meat on topographical changes,physicochemical characteristics, fatty acids profile, microbial quality and sensory attributes. Meat Sci. 2021, 181, 108612.[CrossRef] [PubMed]
72. Alkaltham, M.S.; Ozcan, M.M.; Uslu, N.; Salamatullah, A.M.; Hayat, K. Characterization of oil uptake and fatty acid compositionof pre-treated potato slices fried in sunflower and olive oils. J. Oleo Sci. 2020, 69, 185–190. [CrossRef] [PubMed]
73. Al-Khusaibi, M.; Gordon, M.H.; Lovegrove, J.A.; Niranjan, K. Provenance of the oil in par-fried french fries after finish frying. J.Food Sci. 2012, 77, E32–E36. [CrossRef]
74. Al-Saghir, S.; Thurner, K.; Wagner, K.H.; Frisch, G.; Luf, W.; Razzazi-Fazeli, E.; Elmadfa, I. Effects of different cooking procedureson lipid quality and cholesterol oxidation of farmed salmon fish (Salmo salar). J. Agric. Food Chem. 2004, 52, 5290–5296. [CrossRef]
75. Sadhu, T.; Banerjee, I.; Lahiri, S.K.; Chakrabarty, J. Enhancement of nutritional value of fried fish using an artificial intelligenceapproach. Environ. Sci. Pollut. Res. Int. 2021. [CrossRef]
76. Akintola, S.L. Effects of smoking and sun-drying on proximate, fatty and amino acids compositions of southern pink shrimp(Penaeus notialis). J. Food Sci. Technol. 2015, 52, 2646–2656. [CrossRef]
77. Wijendran, V.; Hayes, K.C. Dietary n–6 and n–3 fatty acid balance and cardiovascular health. Annu. Rev. Nutr. 2004, 24, 597–615.[CrossRef] [PubMed]
78. Alfaia, C.M.; Alves, S.P.; Lopes, A.F.; Fernandes, M.J.; Costa, A.S.; Fontes, C.M.; Castro, M.L.; Bessa, R.J.; Prates, J.A. Effect ofcooking methods on fatty acids, conjugated isomers of linoleic acid and nutritional quality of beef intramuscular fat. Meat Sci.2010, 84, 769–777. [CrossRef] [PubMed]
79. Su, X.Q.; Babb, J.R. The effect of cooking process on the total lipid and n–3 lc-pufa contents of australian bass strait scallops,pecten fumatus. Asia Pac. J. Clin. Nutr. 2007, 16 (Suppl. S1), 407–411. [PubMed]
80. Biandolino, F.; Parlapiano, I.; Denti, G.; Di Nardo, V.; Prato, E. Effect of different cooking methods on lipid content and fatty acidprofiles of mytilus galloprovincialis. Foods 2021, 10, 416. [CrossRef] [PubMed]