
Effects of pro-nutrition television programming on children's ...
171
University of Montana University of Montana ScholarWorks at University of Montana ScholarWorks at University of Montana Graduate Student Theses, Dissertations, & Professional Papers Graduate School 1982 Effects of pro-nutrition television programming on children's Effects of pro-nutrition television programming on children's nutritional knowledge food preferences and eating behaviors nutritional knowledge food preferences and eating behaviors Polly E. Peterson The University of Montana Follow this and additional works at: https://scholarworks.umt.edu/etd Let us know how access to this document benefits you. Recommended Citation Recommended Citation Peterson, Polly E., "Effects of pro-nutrition television programming on children's nutritional knowledge food preferences and eating behaviors" (1982). Graduate Student Theses, Dissertations, & Professional Papers. 7960. https://scholarworks.umt.edu/etd/7960 This Thesis is brought to you for free and open access by the Graduate School at ScholarWorks at University of Montana. It has been accepted for inclusion in Graduate Student Theses, Dissertations, & Professional Papers by an authorized administrator of ScholarWorks at University of Montana. For more information, please contact [email protected].
-
Upload
khangminh22 -
Category
Documents
-
view
1 -
download
0
Transcript of Effects of pro-nutrition television programming on children's ...

University of Montana University of Montana
ScholarWorks at University of Montana ScholarWorks at University of Montana
Graduate Student Theses, Dissertations, & Professional Papers Graduate School
1982
Effects of pro-nutrition television programming on children's Effects of pro-nutrition television programming on children's
nutritional knowledge food preferences and eating behaviors nutritional knowledge food preferences and eating behaviors
Polly E. Peterson The University of Montana
Follow this and additional works at: https://scholarworks.umt.edu/etd
Let us know how access to this document benefits you.
Recommended Citation Recommended Citation Peterson, Polly E., "Effects of pro-nutrition television programming on children's nutritional knowledge food preferences and eating behaviors" (1982). Graduate Student Theses, Dissertations, & Professional Papers. 7960. https://scholarworks.umt.edu/etd/7960
This Thesis is brought to you for free and open access by the Graduate School at ScholarWorks at University of Montana. It has been accepted for inclusion in Graduate Student Theses, Dissertations, & Professional Papers by an authorized administrator of ScholarWorks at University of Montana. For more information, please contact [email protected].

COPYRIGHT ACT OF 1976Th i s is an u n p u b l i s h e d m a n u s c r i p t t k w h i c h c o p y r i g h t s u b
s i s t s . An y f u r t h e r r e p r i n t i n g o f its c o n t e n t s m u s t b e a p p r o v e dBY THE AUTHOR.
Ma n s f i e l d L i b r a r y Un i v e r s i t y 0 ^ fÿrgANA Da t e : 1 4
Reproduced with permission of the copyright owner. Further reproduction prohibited without permission.

Reproduced with permission of the copyright owner. Further reproduction prohibited without permission.

THE EFFECTS OF PRO-NUTRITION TELEVISION PROGRAMMING ON CHILDREN'S NUTRITIONAL KNOWLEDGE, FOOD PREFERENCES,
AND EATING BEHAVIORS
byPolly E. Peterson
B.A., Boise State University, 1977
Presented in partial fulfillment of the requirements for the degree of
Master of ArtsUNIVERSITY OF MONTANA
1982
Approved by:
Char
Da&ch of the Graduate" School
Date
Reproduced with permission of the copyright owner. Further reproduction prohibited without permission.

UMI Number; EP38761
All rights reserved
INFORMATION TO ALL USERS The quality of this reproduction is dependent upon the quality of the copy submitted.
In the unlikely event that the author did not send a complete manuscript and there are missing pages, these will be noted. Also, if material had to be removed,
a note will indicate the deletion.
UMTDis»8rtat)on Publishing
UMI EP38761
Published by ProQuest LLC (2013). Copyright in the Dissertation held by the Author.
Microform Edition © ProQuest LLC.All rights reserved. This work is protected against
unauthorized copying under Title 17, United States Code
ProQuest LLC.789 East Eisenhower Parkway
P.O. Box 1346 Ann Arbor, Ml 48106 - 1346
Reproduced with permission of the copyright owner. Further reproduction prohibited without permission.
Peterson, Polly E., M.A. Spring, 1982. . Psychology
THE EFFECTS- OF PRO-NUTRITION TELEVISION PROGRAMMING ON CHILDREN'S NUTRITIONAL KNOWLEDGE, FOOD PREFERENCES, AND EATING BEHAVIORS (156 pp.)
Director: D. Balfour Jeffrey, Ph.D.
Children in America watch a great deal of television, consequently they are exposed to innumerable television advertisements. A majority of these ads are for foods which are high in sugar and fat and, in general, considered low in nutritional value. The effects of the advertisements on children's eating habits is a growing concern for parents, child advocacy groups and researchers. Airing an increased number of pro-nutrition messages on television has been proposed as a remedy to offset the potentially negative effects of ads for low-nutrition foods; however, the efficacy of such a proposal has not yet been determined.
The purpose of the present study was to assess the effects of pro-nutritional television programming on kindergarten age children's nutritional knowledge, food preferences and eating behavior. A "hierarchy of effects" model was used as a conceptual basis. This model presents four levels with increasing complexity (recall, learning, preference, and behavior) which may each be affected by television.
A pretest - posttest control group design was employe^. Children from six kindergarten classes in Missoula, Montana, were exposed to a series of ten twenty-minute videotapes in their classroom over a period of ten class days. The videotapes were compiled from popular children's programming and public service announcements with themes stressing healthy eating habits and pro-nutritional concepts. Effects of the tapes were assessed using recall, information, preference and behavioral measures.
Strong significant results were obtained on the recall and information measures indicating the children could recall the programs and had learned the nutritional concepts. Furthermore, there were some indications of trends in the expected direction on the behavioral measures, The outcome provides support for the hierarchy of effects model, suggesting that behavior and preference are much more difficult to change than the lower levels of recall and information. Further research is encouraged to extend the empirical bases and understanding of this model.In order to maximize the positive use of pro-nutrition messages on television it will be necessary to develop material that highlights the salience of pro-nutrition foods as well as provides nutrition information. Such programming will probably need to be aired frequently, and over an extended period of time to have an impact on children's dietary habits.
1 1
Reproduced with permission of the copyright owner. Further reproduction prohibited without permission.
TABLE OF CONTENTS
ABSTRACT...................................................... ii
LIST OF TABLES................................................ vi
ACKt^OWLEDGEMENT................................................ viiiCHAPTER
I. INTRODUCTION ............................................ 1
Television Viewing Patterns. , ....................... 5Television Commercials................................. 8
Content of Televised Messages ....................... 8Counternutritional Theme of Television Advertisements 11
Children's Dietary Habits ........ 14Nutritional Intake................... ................ 14Food Preference................ 16INutritional Knowledge......... ■..................... 23
Effects of Television Commercials ..................... 29Attention and Recall................................. 29Understanding Television Coiranercials.............. . 31Purchase Influence Attempts ...................... . 36Consumption ................................... 37
Observational Learning Theory and Television Advertising 39Bandura's Observational Learning Model............... 40
Comstock.'s Multi-Component Response M o d e l ........... 46Experimental Studies................................. 54
Summary and Purpose . . . . . ......................... 62
II. METHODS................................................ 63
iii
Reproduced with permission of the copyright owner. Further reproduction prohibited without permission.
Subjects 63
Independent Measures . , , ............ , . , . 65
Dependent Measures 66
Behavioral Eating Test (BET)................. . 67
' Pretend Eating Test (PET), , , , . . 68
Nutritional Questionnaires 70Procedures . . . . . . . . .................... . . . 72
III. RESULTS. . . . . . . ................................... 75Class Characteristics. 75Attention to Programming 76Program Recall and Recognition .............. 76
Nutrition Information Measures 79
Preference Measure.............. 83I
Behavioral Measures............ 87
Individual F o o d s .............. 87Total Score Variables............................. 93
Analysis of BET Test-Retest Correlations .......... 104Correlation Between BET and PET..................... 104
IV DISCUSSION.............................................. 108
REFERENCES....................................................... 127APPENDICES...................................................... 139
A. Parental Permission Letter and Form . . . . . . . . . . 140
B. Video Tape Contents List........................... 142
C. Videotape Rating F o r m .................................. 146
iv
Reproduced with permission of the copyright owner. Further reproduction prohibited without permission.

D. Nutrition Questionnaire II.................................. 147
E. Nutrition Questionnaire III ................................ 149F. Seating Chart .................................. 151
G. Individual Case Data Analyses of Variance................. 152
H. Means and Standard Deviation for Individual Case Data . . . 154
V
Reproduced with permission of the copyright owner. Further reproduction prohibited without permission.

LIST OF TABLESTables Page
1. Experimental Design and General Procedure ............. 64
2. Television Recall Questionnaire, Means, Standard Deviations and Ranges (Treatment Group Only).......... 78
3. Nutrition Questionnaires I, II, & III, Means and Standard Deviations .................................... 80
, 4. Results of Univariate Analysis of Variance with repeatedMeasures on Nutrition Questionnaire II. . .......... 82
5. Results of Univariate Analysis of Variance with Repeated Measures on Nutrition Questionnaire III . .......... 84
6. Pretend Eating Test (PET) Means and Standard Deviations 85
7. Test-Retest Coefficients for individual PET foods . . . 868. Results of Univariate Analyses of Variance with Repeated
Measure on the Pretend Eating Test (PET)............... 88I9. Individual Foods Means and Standard Deviations........ 89
10. Individual Foods Means and Standard Deviations. . . . . 9011. Results of Pearson Product Moment Correlations of
Individual Foods........................................ 9212. Results of Univariate Analysis of Variance with Repeated
Measures on Apples...................................... 9413. Results of Univariate Analysis of Variance with Repeated
Measures on Grapes. ........................... 9614. Total Score Variables Means and Standard Deviations . . 97
15. Results of Pearson Product Moment Correlations of Total Score Variables with Covariates....................... 98
16. Means and Standard Deviations for Total Pro-NutritionFood Scores Excluding Graham Crackers ................. 101
17. Analysis of Variance with Repeated Measures on Total Pro-Nutrition Food Scores ............................. 102
VI
Reproduced with permission of the copyright owner. Further reproduction prohibited without permission.

LIST OF TABLES (Continued)Tables Page
18. Test-Retest Correlation Coefficients for the BET . . . . 105
19. Correlation Between Corresponding BET and PET Foods. . . 106
V I 1
Reproduced with permission of the copyright owner. Further reproduction prohibited without permission.

Acknowledgements
This thesis is fondly dedicated to William C. and Jessie S.McConahay, whose love and continuous support has contributed greatly to my graduate career.
Itwould like to take this opportunity to thank a number of people for their assistance on various aspects of this thesis. First, sincere appreciation is extended to my committee: Dr. D. Balfour Jeffrey(Chairman), Dr. James A. Walsh, Dr. George Camp and Dr. Greg Patent who all offered their time, efforts and encouragement throughout the project. Dr. Jeffrey deserves special recognition for his guidance and support from the study's inception to it's completion. Special thanks are expressed to Carol Bridgwater and Brenda Dawson who, as research team members, provided the backbone for the project. Thanks are extended to all those who helped with the data collection: Vanessa Blair, Dayle Comeslast, Karen Cowdry, Nic Herriges, Susan Miller,Martha Newby, Howard Phillips, Michael Phillips, Elizabeth Putalik,Brad Warner and Michael Whiting. I am especially grateful to Dorothy Marsh for her careful typing of the final draft ( and many first drafts before that). Appreciation is expressed to Washington Grade School; the teachers: Trudy Khoury, Pam Dix, Bobbie Tilton and Jan Opshal;and to all the children and parents who participated in the study.And finally, thanks to my family for their love and understanding, which seems to make it all worthwhile. ,
This study was supported, in part, by the following research grants awarded to D. Balfour Jeffrey, Principal investigator. National Institute of Child Health and Human Development, Grant Number HD 12073; and National Science Foundation, Grant Number ISP-8011449.
V l l l
Reproduced with permission of the copyright owner. Further reproduction prohibited without permission.
C H A P T E R I
INTRODUCTION
Children in our society watch an immense amount of television.
How they are affected by the numerous advertisements they are exposed
to while viewing television has been a matter of public concern and
heated controversy for over a decade (National Science Foundation,19 77). One area of particular interest involves the effects of the
profusion of televised food commercials on children's eating habits, food preferences, and nutritional knowledge.
An overwhelming majority of food advertisements shown on television are for high-calorie foods containing large amounts of sugar and fat with relatively few beneficial nutrients (Mauro & Feins,
1977; Choate, 1975). Since a diet which contains a disproportionateIamount of such food has been empirically established as a factor in
a number of diseases and dental problems (U.S. Senate Select Committee
on Nutrition and Human Needs, 19 77), advertising which encourages
children to eat such foods at the possible exclusion of more nutritious
diet is feared to pose a serious health risk.Consumer advocacy groups such as Action for Children's Television
(ACT) and the Council on Media, Merchandising and Children have been
formed with the intent of stimulating the public's interest regarding this and oth#r issues related to children and television. These
organizations have requested government intervention in establishing
regulatory guidelines to put a halt to advertising directed toward
Reproduced with permission of the copyright owner. Further reproduction prohibited without permission.
2children which may adversely affect their health and safety (ACT,
1977; Choate, 1976). Those critics claim that such advertisements
are inherently unfair and deceptive due to the child's limited cog
nitive abilities to comprehend their persuasive intent (ACT, 1977),
, In response to these requests, the Federal Trade Commission
(FTC) initiated rulemaking proceedings in 1978 to consider a regula
tory policy regarding television advertising directed toward children.
Consequently, the FTC staff prepared a report recommending that tele
vision advertising for highly sugared products directed toward young child viewing audiences be banned (FTC, 1978)., They found support for this recommendation in a growing body of scientific research
suggesting that television advertising does have a deleterious effect on children (c.f. Comstock, 1975a; NSF, 1977; FTC, 1978).
A great deal of public controversy has surrounded the FTC
staff's recommendation which resulted in widespread publicity,
editorial rhetoric, and active lobbying against the FTC by advertisers,
broadcasters, and the food industry.Ultimately, Congress intervened in the proceedings and imposed
a legislative veto forbidding the FTC from using the criterion
of unfairness by which to judge the appropriateness of ads. The
FTC was instructed to act solely against television advertising directed toward chidren which is deceptive. The FTC's response
was to call for comments on a remedial plan that proposes
food manufacturers voluntarily produce television spots promoting
Reproduced with permission of the copyright owner. Further reproduction prohibited without permission.
3good nutrition. This was suggested as an attempt to counterbalance
the current emphasis on the very narrow range of food products pro
moted on children's television. However, there is no conclusive
evidence with which to evaluate the effectiveness of this proposal.* ^
One fundamental reason for the lack of relevant findings on
which to base policy decision is that the questions asked by re
searchers, or their methods of investigation, have borne little relation to needs of policymakers. A very basic problem with any legislative action which affects social policy, and ultimately the rights of the public, involves the establishment of causal relationships.The burden of proof rests on the legislators who must be able to sup
port their decisions with conclusive evidence generated from sound research addressing the policy-relevant issues. Unfortunately, scien-
Itific inquiry into the effects of television advertising on children
is relatively recent; more than three-quarters of the research on this topic has been published since 1974 (NSF, 1977). Given the
scarcity of sound academic research, along with the complexity of
the issues, it is not surprising that few firm policy - relevant
conclusions can be reached at this point.Much of the research done to date has been correlational in
nature and has been useful in developing a better understanding of the intended effects of advertising and children's reactions to it.
However, more experimental evidence is necessary to demonstrate a
causal link between the viewing of television and its subsequent
effects on children's eating behaviors, especially with regard to
Reproduced with permission of the copyright owner. Further reproduction prohibited without permission.
pro-nutritional television advertisement. Scientific investigations
must be designed to go beyond the general lines laid down by the
studies reported to date if they are to be helpful in clarifying
these policy issues.
In light of the current proposal by the FTC, it seems clear that
there is a need to investigate the potential effectiveness of pro-
nutritional commercial food messages in communicating nutritional,
information to children, and the subsequent effects on their dietary habits.
It is the purpose of the present study to explore the effects
of such pro-nutrition television messages on children's eating behaviors, food preferences, and nutritional knowledge. Relevant literature bearing on this research question will be reviewed and discussed.
Initially, the television viewing patterns of young children will be examined, along with the nature and content of food messages which
are presented through this medium. The relative contribution of
food low in nutritive value to children's dietary habits will be
reviewed.
How television food ads may be linked to the eating habits of child
ren will then be discussed within the framework of social learning theory
and its enphasis on observational learning. An expanded observational-
learning model developed by Comstock,Chaffee, Katzman, McCombs, and Rob
erts (1978) will be explored within the context of children's consumption
of healthy foods. The model presents a behaviorial event as a function
Reproduced with permission of the copyright owner. Further reproduction prohibited without permission.

of three specific components: salience, repertoire, and arousal. How
these individual components relate to pro-nutritional television
messages and children's nutritional knowledge, food preferences and
actual eating behaviors will be explored- Finally, relevant research
which has been conducted to assess the effects of television ads on children's eating behavior will be reviewed and discussed in light of the theoretical aspects of the Comstock et al. model.
Television Viewing Patterns
Today approximately 98% of all households ;Ln America report to the U. S. Census Bureau that its possessions include at least one tele
vision set (Comstock, 1980) and it has been estimated that in excess of forty percent of the families in the United States own more than
one television (Barnouw, 1975). In 1947,,however, television was a rarity; less than 14,000 families owned sets (Lesser, 1974). Within
the span of 31 years, television has become the principal form of entertainment in America and is the biggest money making medium for
advertisers that exists today (Liebert, Neale, & Davidson, 1973).In describing the significant role of television in our lives,
Nobel (1975) poignantly addresses the unprecedented success and popu
larity of this medium:
the average American will spend 3,000 entire days— nearly nine years of his life— simply watching television. The fact that more time is spent televiewing than virtually any other activity suggests that television is meeting some fairly fundamental needs in modern societies; needs, moreover, that were not satisfied by the mass media which preceded television. Regrettably, social scientists tend to disregard televiewing as a research area, which leaves the
Reproduced with permission of the copyright owner. Further reproduction prohibited without permission.
question, 'Why is television so popular?', in large part unanswered. (p.7)
That there exists little scientific research into the reasons underlying our culture's seeming fixation with television does not,
however, dispute its popularity. Twenty years ago, in a pioneering work exploring the potential effects of television, Schramm, Lyle, and
Parker (1961) attempted to address the place this medium had come to
occupy in the lives of our nation's youth. Attesting to the instant success and virtually unquestioned popularity of television, they
excalimed that "overnight a new box appears in the home and thereafter
all leisure time is organized around it." (p.14) This is especially
true for children; in fact, there is widespread agreement that watch
ing television has beocme the predominant pastime of our nation'sI
youth (Greenberg, 1976).
Due to its ubiquity and accessibility, television transcends the
common boundaries which restrict other mass media. It is watched by
rich and poor, educated and illiterate, the elderly and the very young, alike. The specific effects of the prevasive nature and its impact in our lives are as yet not entirely understood, however, there
is ample evidence that television plays an enormous part in influenc
ing the development of children's values and attitudes. Many are in agreement that television has become a major socializing agent for our
nation's young people (Bandura, 1973; Belson, 1967; Comstock & Fisher,
1975; Palmer & Dorr, 1980; Rubinstein, Comstock, & Murray, 1972),
The television viewing habits of young children have been widely
studied and documented. There are numerous surveys which depict
Reproduced with permission of the copyright owner. Further reproduction prohibited without permission.

viewing patterns for various âge groups and demographic areas (cf.,
Chaffee, McLeod, & Atkin, 1971; Greenberg & Dervin, 1970; Himmelweit,
Oppenheim, & Vince, 1958; Lyle & Hoffman, 1972a, 1972b; Schramm, Lyle,
St Parker, 1961). Consequently, "average” amounts of television view
ing reported in the literature vary somewhat from study to study.The 1971 volume of Broadcasting Yearbook estimated that home tele
vision sets are turned on an average of six hours, eighteen minutes a
day (Lyle & Hoffman, 1972a). Children do most of the watching. In fact, preschool children, up to the age of six, constitute the single
heaviest television viewing audience in the United States (Lyle & Hof
fman, 1972a; Lesser, 1974; Ward, 1972), Comstock (1975b) has deter
mined that the average child begins watching television regularly around
the age of three. As the child grows older, the amount of time spentI
viewing builds to a peak around preschooi, declines slightly and then
rises again around adolescence, falling off after that (Lyle & Hoffman, 1972a). Liebert, Neale, and Davidson (1973) also found an increase in television viewing time that peaked around sixth grade and then dropped
off at tenth grade. In 1973, Nevill reported that young children watched between 3.3 and 5.0 hours of television a day. Nielson (1979) reported that children of all ages now average 28 hours per week.
By the time he or she graduates from high school, the typical American teenager will have spent over 15,000 hours television watch
ing, This is more time than is spent in school or with parents. In
fact, television viewing will consume more time in a child's life than
any other activity with the exception of sleep (Brown, 1976; Schramm,
Lyle & Parker, 1961).
Reproduced with permission of the copyright owner. Further reproduction prohibited without permission.

viewing patterns for various age groups and demographic areas (cf.,
Chaffee, McLeod, & Atkin, 1971; Greenberg & Dervin, 1970; Himmelweit,
Oppenheim, & Vince, 1958; Lyle & Hoffman, 1972a, 1972b; Schramm, Lyle,& Parker, 1961). Consequently, "average" amounts of television view
ing reported in the literature vary somewhat from study to study.The 1971 volume of Broadcasting Yearbook estimated that home tele
vision sets are turned on an average of six hours, eighteen minutes a
day (Lyle & Hoffman, 1972a). Children do most of the watching. In fact, preschool children, up to the age of six, constitute the single
heaviest television viewing audience in the United States (Lyle & Hoffman, 1972a; Lesser, 1974; Ward, 1972), Comstock (1975b) has deter
mined that the average child begins watching television regularly aroundthe age of three. As the child grows older, the amount of time spent
1
viewing builds to a peak around preschool, declines slightly and then rises again around adolescence, falling off after that (Lyle & Hoffman,
1972a). Liebert, Neale, and Davidson (1973) also found an increase in television viewing time that peaked around sixth grade and then dropped off at tenth grade. In 1973, Nevill reported that young children watched between 3.3 and 5.0 hours of television a day. Nielson (1979) reported that children of all ages now average 28 hours per week.
By the time he or she graduates from high school, the typical American teenager will have spent over 15,000 hours television watch
ing. This is more time than is spent in school or with parents. In
fact, television viewing will consume more time in a child's life than
any other activity with the exception of sleep (Brown, 1976; Schramm, Lyle & Parker, 1961).
Reproduced with permission of the copyright owner. Further reproduction prohibited without permission.

8
The peak hours of television viewing for young children are con
sistently reported throughout the literature as Saturday and Sunday
morning and right after school, although individual viewing patterns
vary somewhat (Lyle & Hoffman, 1972a; National Science Foundation,
1977). It is interesting to note that recent reports also indicate
that young children watch a considerable amount of television during
"prime-time" (7 p.m. to 9 p.m.); Resnik, Stern, and Alberty (1979)
reported that "prime-time" viewing accounts for more than 50% of the total hours children spend watching television.
Television Commercials Approximately one out of every five hours of television time is
devoted to commercial messages (Barcus, 1975). At the rate of television watching given above, the typical young child viewer will see
in excess of 200 hours of advertisements a year or roughly 22,000
commercial messages (Choate, 1976). Commercials are the number three
content category in on-the-air time, behind movies and comedy-variety
shows (Nielson, 1979). The content of television commercials will now
be reviewed to assess what, specifically, children are exposed to in
terms of television advertising.
Content of Televised MessagesA number of studies have been undertaken to determine the content
of network television ads (Atkin & Heald, 1977; Barcus, 1975; Barcus
& McLaughlin, 1978; Barcus & Wolkin; 1977), Results indicate that
well over half of all television commercials are for edible products.
Reproduced with permission of the copyright owner. Further reproduction prohibited without permission.
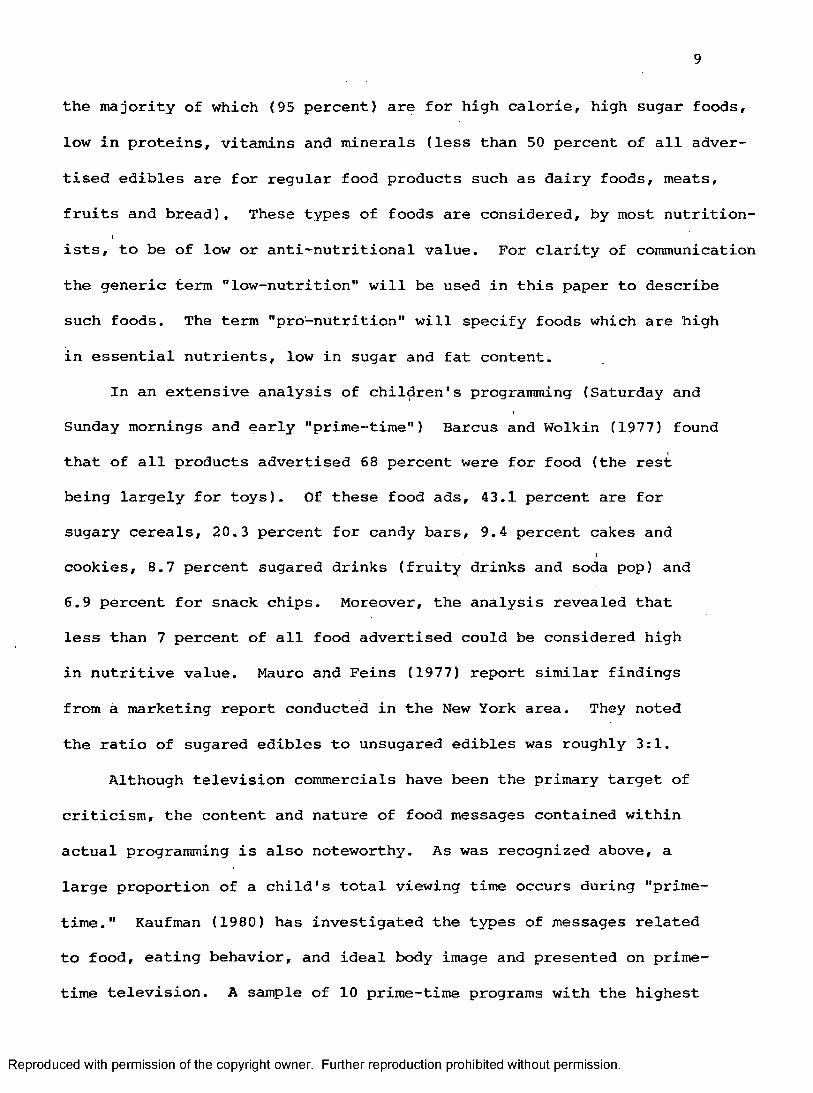
the majority of which (95 percent) are for high calorie, high sugar foods,
low in proteins, vitamins and minerals (less than 50 percent of all adver
tised edibles are for regular food products such as dairy foods, meats,
fruits and bread), These types of foods are considered, by most nutrition
ists, to be of low or anti-nutritional value. For clarity of communication the generic term "low-nutrition” will be used in this paper to describe
such foods. The term "pro-nutrition" will specify foods which are high
in essential nutrients, low in sugar and fat content.
In an extensive analysis of children's programming (Saturday and Sunday mornings and early "prime-time") Barcus and Wolkin (1977) found that of all products advertised 68 percent were for food (the rest being largely for toys). Of these food ads, 43.1 percent are for sugary cereals, 20.3 percent for candy bars, 9.4 percent cakes and
Icookies, 8.7 percent sugared drinks (fruity drinks and soda pop) and
6.9 percent for snack chips. Moreover, the analysis revealed that less than 7 percent of all food advertised could be considered high
in nutritive value. Mauro and Feins (1977) report similar findings
from à marketing report conducted in the New York area. They noted
the ratio of sugared edibles to unsugared edibles was roughly 3:1.
Although television commercials have been the primary target of
criticism, the content and nature of food messages contained within
actual programming is also noteworthy. As was recognized above, a
large proportion of a child's total viewing time occurs during "prime
time." Kaufman (1980) has investigated the types of messages related to food, eating behavior, and ideal body image and presented on prime
time television. A sample of 10 prime-time programs with the highest
Reproduced with permission of the copyright owner. Further reproduction prohibited without permission.

10
weekly ratings was selected and videotaped on two separate occasions.
These programs were reviewed for frequency of food-related behaviors. Her analysis revealed that program content is an important source of
food messages. References to food occurred on the average of three times within each of the twenty programs analyzed. The foods most
frequently referred to on television were beverages (mainly alcoholic
beverages and soda pop) and desserts and other sweets. Kaufman con
cludes that "the television diet consists of foods low in nutritional
value. . .television characters rarely ate a balanced meal, gave full
attention to what they ate, or ate explicitly to satisfy hunger. In
stead, they snacked between meals, ate on the go, and used food' pri
marily for the satisfaction of social and emotional needs. The
patterns of food choice on television, in short, are patterns usually associated in real life with problems in weight control'and (poor) nutrition." (p.45)
In the analysis of body type and body image, Kaufman further noted that television characters are rarely depicted as overweight, or
unhealthy. Thus, it appears that television offers a paradoxical message about ideal appearance, health, and actual eating behavior.
In short, it seems to be the case that a substantial majority of
the messages we see on television, both in commercial ads and program
content, depict food and food related acts. More alarming is the fact
that the diet being promoted on television is an imbalanced one which
falis to represent good foods or dietary habits and is strongly skewed
in the direction of low-nutrition,
Reproduced with permission of the copyright owner. Further reproduction prohibited without permission.
11
Counternutritional Themes of Television AdvertisementsTelevision is recognized by many educators, nutritionists and
advertisers alike as our nation's major source of nutrition knowledge (ACT, 1977; FTC, 1978; Mauro & Feins, 1977). Choate had the following
to say about the role of television in his testimony before the Select
Committee of Small Businesses: "Our nutritional knowledge and our
eating habits are influenced increasingly by one single source, the
television screen." (U.S. Senate Select Committee on Small Businesses, 1971). Joan Gussow (1972) has perhaps best summarized the edu
cational impact, of television on nutrition.
Assessing television's impact as a teaching medium is a trap. To suggest that television does not teach anything to small children who sit in front of it for up to six hours a day is, of course, arrant nonsense— a fact which the success of Sesame Street has tended to underscore. To say that we have not yet learned to measure all that it teaches appears to be true. What is misleading is that we often fail to look at the right messages.The most powerful messages television delivers are its implicit ones, the things that sell us when we don't even know we're being sold. The heavy advertising of beer and soft drinks, for example, delivers a message far more potent than urging to buy any one product. In terras of this message it doesn't really matter whether someone going to the refrigerator gets out a Pepsi or a Coke, a 7-up or a Budweiser. What matters is that a thirsty American in the 1970's goes to the refrigerator to open up a container rather than to the sink to open up the tap. That behavior has been sold to us. (p.50)
Young viewers are encouraged by advertisers to eat their products
on the basis that they taste sweet, will make them feel happy, may
give them more friends, and help them to achieve strength and athletic
prowess (ACT, 1973; FTC, 1978; Gussow, 1972; Thain, 1971; NSF, 1977).
ACT (1977) expressed the opinion that food habits promoted by
Reproduced with permission of the copyright owner. Further reproduction prohibited without permission.
12
television ads aimed at children teach that one eats food because it
is sweet or a way to get a toy, rather than that food is vital to
health and physical well being. Birch and Gussow (1970) point out
that most food advertised on television is depicted as "sweet, sparklyI
gay, colorful, chocolatey , magicky or crunchilly delicious." The
authors felt nine out of ten edibles are promoted for their sweetness or crisped qualities or because they are fun to eat. They remarked on
the total absence of pro-nutritional messages conveyed by the medium. Although there are more pro-nutrition public service announcements
I
(PSAs) aired today than when their comment was made, the content studies reviewed above attest to the fact that a gross imbalance still
exists. Given this imbalance, along with the fact that children learn by watching television, it can be inferred that the nutritional
Ilessons gained from television viewing are poor ones.
Mayer (1968) has stated that "many children's food advertisements
are nothing short of disasters. Small children would be better off if
they did not see TV ads because commercials have equated goodness with
sweetness and this notion, that is reinforced throughout advertising, is difficult to change past the age of six." (p.53) Sarson and
Charren told the U. S- Senate Select Committee on Nutrition and Human Needs (1977) that the amount of money spent by advertisers to produce
and air their commercials is an impressive argument regarding the effectiveness of commercials, otherwise why would they spend so many
dollars. Unfortunately, as they note, the vast majority of the dollars
are spent on sugar-rich foods which may play a major role in establishing poor dietary habits.
Reproduced with permission of the copyright owner. Further reproduction prohibited without permission.
13
The lifetime effects of exposure to counternutritional messages
on children must be considered. Choate (1976) believes that television today has contributed to the accelerated deterioration of the eating
practices of this country. In 1977, the U. S. Senate Select Committee on'Nutrition and Human Needs determined that 70 to 85 percent of all
food products advertised can be considered detrimental to our national
health. The White House Council on Food, Nutrition and Health (1974)
concluded that the population is not sufficiently knowledgeable to counteract the influence of the mass media upon our dietary habits.This Council reported that there exist large gaps in our public knowledge of what constitutes good nutrition. They note the actual misinformation about health and nutrition which is carried by television and conclude that these factors serve to exacerbate the poor health of our nation today. '
ACT (1971) takes the position that the continued exploitation of
the nation's children via food ads must be stopped or we can expect continued growth of heart disease, hypertension and poor dental health—
diseases that may result from poor eating habits established in childhood,
Mayer (1968) has stated that there is evidence that the switch to
sugar-rich snack foods may be causing nutritional deficiencies of
trace elements such as zinc and chromium. He notes that promotion of
highly sugared cereals, snacks, and soft drinks may also be a factor
in increasing the likelihood of diabetes in genetically vulnerable
individuals. Nizel (1974) believes decaying teeth to be the most prevalent nutritional problem in the U. S. today. For this reason,
he has advised a ban on advertising of sugar sweetened products in
Reproduced with permission of the copyright owner. Further reproduction prohibited without permission.
14
television programming aimed at children (Nizel, 1977). There is ample
evidence that the continued ingestion of highly sugared products drastically increases the likelihood of tooth decay (Mauro & Feins, 1977;
Federation of American Societies for Experimental Biology, 1976).I Many investigations have been conducted which establish that there
is a definite relationship between the consumption of low-nutritional,
sugary foods and degenerative diseases such as arteriosclerosis ànd
heart disease (Armstrong, 1951; Mayer, 1968). It follows that a regular diet high in such foods would present a health hazard. Consequently,a number of health associations, such as the American Heart Association,
»for example, have recommended that the American people reduce their consumption of sugar and fats (FTC, 1978).
Given the evidence that some of the major health problems in{America today are highly related to poor diets and inadequate nutrition,
the promotion of high caloric, high fat, sugary snacks on television appears to be contrary to the health needs of the American people.The question remains as to whether or hot the televised advertisement of these sorts of foods to children actually causes an increase in their consumption. In beginning to address this question it would be
valuable to first review the adequacy of the nutritional intake, food
preferences, and nutritional knowledge of our children.I
Children's Dietary Habits
Nutritional Intake
Food studies which have been conducted in the U. S. indicate that
in many instances dietary intakes for children are less than adequate
(Emmons, Hays, & Call, 1972; Metheny, 1962). Metheny conducted a study
Reproduced with permission of the copyright owner. Further reproduction prohibited without permission.

15
of Ohio school children and found that only one child in six had a diet
that met their Recommended Daily Allowances. Lund and Birk (1969)
found that 15 percent or more of a group of Minnesota school children
had intakes of less than 67 percent of the R. D. A. for niacin, vitamin
A,'vitamin C, and iron. Hendel, Lund, and Burk (1956) observed that
children's diets were low in vitamin A and vitamin C; thirty percent
were below two-thirds of the R. D. A. for vitamin C and twenty percent
for vitamin A.
In 1970, Todhunter reported that many children do not meet the
Recommended Daily Allowances and have inadequate diets. She observed frequent evidence of deficiencies of iron, calcium, vitamin A, vitamin
C, thiamine, and riboflavin. The Department of Health and Welfare (1974) has identified these as "problem nutrients" for elementary school age children. '
Sharaga (1974) found that over one-third of the children she studied had sub-standard nutrient intake, operationally defined as 67 percent or less of the R. D. A. for iron, vitamin A, vitamin C, and thiamine.
Snacks appear to contribute to this poor nutritional status of
our nation's youth. The Department of Agriculture's 1965 Household
Food Consumption Survey (reported in Sharaga, 1974) showed a drop in
the quality of diets of people in the U. S, since their 1955 survey.
The survey pointed out an increase in the consumption of between meal
eating and a substantially larger percent of families failing to meet the R. D, A. From 1961 to 1975 the consumption of bottled soda pop
has increased from 19.1 gallons per person in 1961 to 34.8 gallons per
Reproduced with permission of the copyright owner. Further reproduction prohibited without permission.
16
person in 1975. Milk consumption declined at the same time as did the
consumption of vitamin, mineral, and fiber rich fruits and vegetables, while the cookie market has grown twice as fast as the population
(Gussow, 1972). Henderson (1972) believed that this spiraling use of
snack foods will influence nutritional status in the immediate future. Potgieter (1965) has conducted extensive interviews with children about their snacking habits; although his material is somewhat dated, the findings are reflective of today's children to a great degree. Children reported consuming such snacks as cookies, cakes, candy, potato chips, and soft drinks. All children had at least one snack a day and many
had as many as seven. Researchers have found that between meal eating
accounts for approximately 25 percent of the total caloric value of the child's daily diet (Alston, 1973; Eppright & Swanson, 1955; Thomas &
Call, 1973). ,
The quality and quantity of between meal eating may play a critical
role in determining the nutritive value of the diet. Snacks can vary widely in nutrient content. In Eppright's and Swanson's study in 1955, children who attained at least 100 percent of their R, D. A. consumed snacks that were higher in quality than those children who failed to
reach the minimum R, D. A. According to Alston (1973), very little food value, other than carbohydrate and empty calories, is obtained from the
popular snacks.
Food PreferencesThe types of foods a child generally likes or finds desirable
constitutes that child's food preferences. Preferences are important
Reproduced with permission of the copyright owner. Further reproduction prohibited without permission.
17determinants of a child's consumptive patterns and, thus, his or her nutritional status {Brekenridge, 1959). PiIgram (1951) found that food
preferences are one of the most important predictors of consumptive
patterns and can account for 25 to 50 percent of the variance in food
consumption, although other factors, such as nutritional knowledge and
the availability of different types of foods enter into actual consumption.
Many factors have been suggested as contributing to the specific
likes and dislikes we develop for various foods. Family food attitudes which are handed down from generation to generation are partly responsible for shaping the preferences of individual family members ,
(Dichkens & Ferguson, 1958). Personality factors have been investigated with regard to willingness to try different foods and general food preferences (Schuck, 1961). Early experience has been ^ssumed to be
particularly important in the formation of children's food preferences; there is some evidence that there may be sensitive periods in early
life that are critical for the formation of food preference (Burghardt
& Hess, 1966; Garb & Stunkard, 1974). In addition, it has been suggested that food preferences established in early life persist throughout the life span, influencing preferences and consumption patterns during adult
hood (Beauchamp & Mailer, 1977; Greene, Desor,& Mailer, 1975).
Birch (1979a,b,c; 1980, in press) has recently conducted a series
of studies to determine the specific dimensions of food preferences in
preschool—age children and the factors which will affect these preferences. In her first study (Birch, 19 79a), she used a direct approach to
assess the food preferences of young children and determined that
Reproduced with permission of the copyright owner. Further reproduction prohibited without permission.
18children as young as three years of age can provide reliable, consistent
information regarding their food preferences. She asked the children to rank a set of fruits in order of their liking for them. Using multidimensional scaling techniques, the salient dimensions underlying
children's food preferences were found to be familiarity and sweetness.
She then repeated the ranking after a one week interval in order to get
a measure of the stability of food preferences and found that they remained quite stable.
In another study conducted to determine the relationship between food preferences and consumption, Birch (1980) asked children to rank
order a number of sandwiches with different kinds of spreads from best
to least liked- The children were subsequently allowed to select freely from plates containing the sandwiches they had rank ordered. The
relationship between consumption and stated preference was quite high.
Multidimensional scaling of the foods in this study also revealed that familiarity and sweetness were the two most salient dimensions in the child's food preferences, accounting for 51 and 2 3 percent of the
variance, respectively.Familiarity is a function of exposure and experience- Birch notes
that the consistent emergence of familiarity as a dimension in the
establishment of food preferences attests to the importance of experi
ence as a factor generating children's food preferences.Zajone (1968) has stated that mere repeated exposure of an individ
ual to a stimulus is a sufficient condition for the enhancement of his
or her attitude toward it. It follows that "mere repeated exposure"
leads to increased familiarity and produces increased preference and
Reproduced with permission of the copyright owner. Further reproduction prohibited without permission.

19desire for the stimulus. The mere repeated exposure hypothesis has
been investigated by Birch (1979b) who found some support for Zajonc's
claim. She systematically presented dates (selected because they are
not a well known food) to a group of ten preschool children every day »for a period of seven days. For the five children who were previously
unfamiliar with dates, their preference for the food increased significantly, while the group who were already familiar with dates did not
change their preference. Birch suggests that on the basis of these findings there is preliminary evidence that early exposure and experience with foods is very important in the formation of food preferences-
Birch (19 79c) has also investigated the social-affective context
in which foods are presented as they affect children’s food preferences. She investigated the influence of peer model's food selections and eating behaviors on preschooler's food preferences,and food choices and
eating behaviors during the lunch period. Based on a preliminary
assessment, a child who preferred a particular vegetable was seated with three or four peers with different preferences from the target child, but the same among them. The children were then presented with their preferred or non-preferred vegetable pair and asked to select one.
Choices were made in specified order. On the first day, the target child chose first, while on subsequent days (days 2, 3, & 4) , the peers
made their selections first. Seventeen situations of this type were
arranged. The target children showed significant shifts from choosing their preferred vegetable on day 1 to choosing the non-preferred vegetable on day 4. When target children's food preferences were reassessed
at intervals up to several weeks following the conclusion of the
Reproduced with permission of the copyright owner. Further reproduction prohibited without permission.
20
procedures, they still exhibited significant positive shifts in prefer
ence for the initially non-preferred vegetable. Consumption records
also indicated that target children consumed a significantly greater
amount of the non-preferred food over the duration of the testing
period. Birch concludes that exposing children to peers with different
preferences who select and eat another child's non-preferred food is
sufficient to change both preference and consumption patterns. She also notes age differences in her data which indicate that younger children show more positive preference shifts than older children. The results seem to indicate that modeling appears to have both immediate and long term effects on food preferences,
Birch states that the success of the social influence procedures in producing changes in food preferences suggests that if children were
Iroutinely exposed to other children with food preferences differing from their own, they would begin to broaden the set of foods acceptable
to them. An extension of this interpretation to television would seem
to be quite logical; that is, if children were exposed to more high
nutrition food ads, portraying peers with whom they can identify, enjoy
ing a variety of different foods, they may be more likely to try the
modeled food. How this process occurs and the likelihood of its occurrence will be discussed at greater length later in the present work
under observational learning theory.Birch (in press) draws a number of general conclusions from the
series of studies she conducted. The points relevant to the present issue of television viewing and the preference for pro-nutritional food will be summarized here.
Reproduced with permission of the copyright owner. Further reproduction prohibited without permission.

2 1
1. General food preferences seem to be established early in life
and are influenced by the experiences of the young child with different foods.
2- The context in which a food is presented and the dimensions of
the food itself seem to influence the formation of food preferences.
3. It is clear that young children's food preferences are very malleable and may be modified by such variables as exposure to new foods
and repeated contact with peers who model different food likes and dislikes.
Birch concludes by saying, "it should be possible to minimize the
contribution of context effects,to the enhancement of the preference of sweet foods, by avoiding practices of presentation of sweet foods in positive contexts. Positive social contexts could be used to enhance preference for foods lower in sugar content and,higher in
nutritional value that are not initially highly preferred by young
children." {p. 27)Atkin (1979) has specifically studied the effect of television on
children's food preferences and reports the following results. When questioned about why they liked a particular advertised food product,
younger children and heavy television viewers from all age groups
tended to give reasons that were not related to qualities of the food
itself. They would say they liked a particular advertised food because "you could get a prize" or because it was "fun to eat," for example.
Atkin also found that very few children gave the reason "that it is good
for you to eat" when asked why they liked a particular food.The sweetness factor in cereals and candies was found to be more
Reproduced with permission of the copyright owner. Further reproduction prohibited without permission.
2 2
important to younger children and heavy viewers: approximately 40 per
cent of the heavy viewers stated sweetness was an important factor
in preference for an advertised product as opposed to 30 percent of
the light viewers who gave this response. Atkin also notes that the
extent to which a food is considered fun to eat is a factor more for
younger viewers than older children only to a slight degree; however, heavy viewers are substantially more likely to emphasize fun as a factor, by a difference of 41 to 26 percent over light viewers.
Atkin concludes that children's viewing of food commercials is associated with higher preferences of advertised foods. Also, the more
the child is exposed to television cornuerciaIs, the more salien^ are the advertiser's reasons for desiring a food (e.g. sweetness, fun to eat, premium offers), rather than nutritional qualities of the food itself. In fact, Atkin notes that commercial viewing m^kes no contri
bution to nutritional learning and seems to be negatively correlated
with gaining such knowledge.Whether or not a child likes or dislikes a particular food appears
to be the result of a number of different factors including qualities of the food itself, past ejqserience of it, and, also, the context in
which it is presented. Although food preferences appear to be formed early in a child's life, research indicates that they may change as the
child is exposed to new foods. Food preferences may also be affected
by external factors, such as observation of peers eating different
foods which is then imitated and may affect a preference change- In
summary, television seems to have a major effect on food preferences,
especially for very young children or heavy television viewers.
Reproduced with permission of the copyright owner. Further reproduction prohibited without permission.

23Nutritional Knowledge
There appears to be appreciable variation among young children
regarding their nutritional knowledge. In a survey conducted by
Peterson and Kies (19 72), nine and ten year olds seemed to have aI
fairly good understanding of the kinds of foods they should eat.Seventy percent of the boys and 85 percent of the girls could identify
at least three of the four basic food groups. Of the six and seven year olds surveyed, however, fewer than 15 percent could name three
food groups. Although the researchers did report that there was a
keen recognition on the part of all children that "you should eat vegetables every day to be healthy," very few children in any age
group could give valid nutritional reasons for the necessity to eat these and other foods.
I
The question may arise as to whether or not young children are capable of learning complex nutritional concepts. In an attempt to evaluate the extent to which children can learn nutrition concepts,
nutrition experts have measured nutrition concept acquisiton after classroom instruction (Baker, 1972; Bell S Lamb, 1973; Boysen & Ahrens,
19 72; Lovett, Barker, & Marcus, 1970; Harrill, Smith, & Ganever, 19 72;
Head, 1974; Ireton & Guthrie, 1972).For example. Head (1974) presented a five-month nutrition program
to 4700 fifth, seventh,and tenth graders. The investigator purports
to have assessed changes in knowledge as well as behavior, however,
behavioral measures were based on the child's recall of food eaten.
The findings indicate that a five-month nutritional program is very effective in imparting nutritional concepts to both fifth and seventh
Reproduced with permission of the copyright owner. Further reproduction prohibited without permission.

24graders who scored significantly higher than the control group at post
test. The tenth grade group showed no change; however, analysis of
pretest revealed they already were quite sophisticated in terms of their
nutritional knowledge. Based on "dietary recall" the author reports
sighificant improvements in the diets Of the seventh graders ; however,
neither of the other age groups showed significant change.
In the study conducted by Boysen and Ahrens (19 72) second graders showed significant improvement in their nutrition knowledge and ability to select a balanced meal from a sample array presented to them. They also reported that the percentage of children in the experimental group
who were eating an adequate breakfast increased; however, this was based
on asking the child to recall what was eaten.In a series of studies, Feshbach, Jordan, and Diliman (19 76) investi
gated the use of graphic materials to convey nutritional information to
children. They initially piloted a number of devices to use with young children which would graphically display the nutrient content (protein,
vitamins, minerals, calories) contained in foods. On the basis oftheir preliminary research, a spaceman "Nutrition Computer" graphic was
designed. The robot had a number of bar graphs displayed on his chest area which could be moved to indicate the nutrient for selected adver
tised foods. They exposed a sample of 88 children ages four to ten to
this figure either with or without prior orientation training. Their
findings indicated that more than half of the first through fourth
graders exposed to graphic plus orientation were able to correctly reproduce the nutritional information on the model. More interestingly,
they were also able to evaluate the nutritional value of hypothetical
Reproduced with permission of the copyright owner. Further reproduction prohibited without permission.
25foods as depicted by means of the spaceman graphic. These findings
seem to indicate that even young children (first graders) are able
to comprehend nutritional concepts when represented graphically.
These findings imply that elementary school children instructed
in nutrition principles can readily learn nutrition concepts ; however,
evidence tends to be weak as to whether education influences a change in eating behavior- The effectiveness of nutritional instruction, in
producing actual behavioral change has not been adequately researched.
It was indicated previously that much of the food references made on television could be considered counternutritional. The relationship between television and children's nutritional knowledge will now be discussed. In a survey to determine children's nutritional knowledge Nevill and Clancy-Hepburn (1972) ^found the majority of children
agreed with nutritional claims made in television ads, elven though
many of these are false. Forty percent of the children in their study believed that "you should eat a bowl of cereal every day to be healthy and strong" and "Won de rb re ad is a more healthful bread for children to
eat than other white breads." Fifty-four percent of the children believed that "Hostess cupcakes are a nutritious snack." Overall,
the children tended to accept the food commercial appeals as true.These findings indicated that food commercial's claims contributed to
the children's opinions of the nutritional value of advertised foods.
The kinds of nutritional messages currently presented in food advertisements directed toward children are confusing and misleading.
As a result of the rising public concern over the nutritional statements made in food advertising, especially breakfast cereals, the
Reproduced with permission of the copyright owner. Further reproduction prohibited without permission.
26National Association of Broadcasters adopted the following policies with
regard to the promotion of food products on television:
Commercials for products, such as snacks, candies, gum, and soft drinks should not suggest or recommend indiscriminate use of the product.
I
Each commercial for a breakfast-type product should include at least one audio reference to and one video depiction of the role of the product within the framework of a balanced regimen- In executing this reference to a balanced regimen, it is permissible for the video to be animated and for the audio to be delivered by an animated character. However, a video title superimposed on the screen may not by itself be used to describe a balanced regimen, as some of the viewers do not read yet.(NSF, 1977 p. 100)
These are noteworthy guidelines and represent an attempt to
address the complex issue of television advertising and nutritionalknowledge of young child viewers. However, it is important to note
(
that the NAB is a voluntary, self-regulatory association of the tele
vision industry and its members represent only 60 percent of the stations in this country (Barcus & Wolkin, 1977).
Nonetheless, many advertisers have made attempts to incorporate
the NAB code. Virtually all breakfast cereal ads now contain reference
to a "balanced breakfast." However, research has indicated that many children, especially young children, do not understand the general concept of what a "balanced breakfast" implies (Roberts & Bachen,
19 79; Atkin & Gibson, 197 9). One problem lies in the way the adver
tisers choose to present this disclosure in the context of the ad itself. The NAB code makes no stipulation regarding the emphasis to
be placed on the disclosure and, in fact, is very lenient about the
way it may be included.
Reproduced with permission of the copyright owner. Further reproduction prohibited without permission.
27Roberts and Bachen (19 79) investigated the effects of within ad
disclosures as opposed to supplemental nutritional messages on children's
nutritional understanding and the concept of a "balanced breakfast."
They exposed first, third, and fifth graders to one of the following
commercials, embedded in a fifteen minute program: 1) a typicalbreakfast food commercial (taken off the air) with a within-ad dis
closure stating the cereal was "part of a good breakfast," 2) a
'boosted' within-ad disclosure where the experimenter substituted a
more direct statement of the concept of a balanced breakfast in the same commercial used above, or 3) a supplemental nutritional commercial spot produced especially for this investigation which explicitly
presents the concept of a balanced breakfast (i.e. a variety of foods, fruits high in vitamins, more milk than just on the cereal, etc.).After the presentation of the program and ad, the children's knowledge
of the "balanced breakfast" concept was measured by an open-ended interview. Responses were compared to a control group which viewed a non-breakfast cereal ad within the s ^ e program.
Results indicated that children across all age groups who viewed
the regular commercial gave fewer correct responses and had generally
less understanding of what a balanced breakfast entails than those in the other two experimental conditions. Those children who viewed the
supplemental nutritional message performed significantly better on
more of the measures than did any other group. Also, the older children (third and fifth graders) in the 'boosted' and supplemental
nutritional message groups did better on all measures than the first
graders across all treatment conditions- There were no statistically
Reproduced with permission of the copyright owner. Further reproduction prohibited without permission.
28significant differences between the regular commercial group and the
'boosted* commercial group, although the experimenters note trends in that direction.
The authors conclude that within-ad disclosures, as they now
stand, are ineffective means of conveying the "balanced breakfast” con
cept to children- However, their results indicate that this knowledge may potentially be gained {by older children at least) by viewing ads which employ a more explicit and direct presentation of this concept.
Atkin and Gibson (19 7 9) examined four to seven-year-old children's understanding of the "balanced breakfast" concept. In the laboratory, the children were shown a cereal ad containing the balanced breakfast
disclosure. When asked to recall which foods were portrayed with the cereal, two-thirds of the children could remember nothing. Furthermore, two-thirds of the children had no idea what the term "balanced break
fast" means. A follow-up item inquired whether a bowl of cereal alone would constitute a balanced breakfast. Sixty percent of the preschool
group thought that it would be sufficient while less than 20 percent
of the seven year olds agreed that it would. They also broke the children into heavy vs. light viewers and found that frequently viewing television commercials at home apparently contributes little to the child's understanding of nutritional concepts presented in within ad
disclosures.In summary, it seems that children's knowledge and understanding
of good eating habits and nutritional concepts varies a great deal, but that for most children, especially younger children, nutritional
knowledge is lacking. Food advertisements offer little nutritional
Reproduced with permission of the copyright owner. Further reproduction prohibited without permission.

29
informationr and those that do are not made explicit enough for children
to understand the concepts presented.
It has been demonstrated, however, that elementary school children
can learn nutritional concepts presented in school curriculums quite
readily. Fruthermore, there is preliminary evidence that information
about nutritional aspects can be effectively communicated within a
commercial format, provided the concepts are explicitly presented,
using techniques (such as graphics) which are geared toward young children.
Effects of Television Commercials
The effects of television advertisements on children have already been mentioned in regard to their food preferences and nutritionalknowledge. Research on the effects of television ads in terms of
)
attention and recall, understanding of commercials, purchase influence attempts, and consumption will now be explored.
Attention and RecallIn order for commercials to have an effect on children, the
child must attend to those commercials. A number of studies have been
conducted which show that young children do attend to and retain the
content of television advertisements (e.g. Ward, Levinson, & Wackman,
1972; Lorch, Anderson, & Levin, 1979).
Empirical analysis of television commercials indicates that
specific factors have been identified which increase children's attention to commercials. For example. Rust, Longbourne, and Watkins
Reproduced with permission of the copyright owner. Further reproduction prohibited without permission.

3 0
(1975) measured the attention paid to television by 80 six-to nine-year
old children (who were observed in groups of ten). They were interested in the specific commercial attributes which influenced attention.
Results indicated that for all age groups physical action increases
attention, as does a clear and concrete story. Static shots decreased
attention for the eight and nine year olds but not for the younger
children. Commercial messages delivered by one speaker in a monologue form also led to decreased attention for children of all age levels.In a similar study, Wartella and Ettema (19 74) found high auditory and
visual complexity to increase attention given the television stimulus for preschool age children.
In short, attention appears to be a function of both the age of the child and the particular format of the commercial. Younger children (kindergarten through third grade) appear to bte attracted by
the following features, in general:1. range in duration of 20-30 seconds2. high stimulus complexity
3. physical action, opposed to static shots and verbal monologue
4. clear and concrete presentation of message.
Recall of information presented in television ads is also necessary
for the child to learn. Ward, Wackman, and Wartella (1977) state that
when children attend to commercials they select and recall different information based on the attributes of the advertisement and the child’s cognitive development. In general, as children grow older, recall of
advertising becomes increasingly complex, multidimensional and complete
(Leifer, Collins, Gross, Taylor, Andrews, & Blackmer, 1971).
Reproduced with permission of the copyright owner. Further reproduction prohibited without permission.

31
Rubin (1981) studied children’s recall of a specific commercial
and found that product brand name recall was a function of age. His
data suggest that a clear portrayal of an information item, e.g., a very specific visual representation of product symbol, will facilitate recall, since younger children tend to focus on a few of the dominant
perceptual images presented in the commercial. As age increases,
recall embraces more and different kinds of information.
Understanding Television Commercials
Much of the research done on the influences of television advertisements has concentrated on younger children. Children's
age-related cognitive limitations have been shown to affect their perceptions of television programming, mediating their abilities to understand and learn from the medium (Comstock, 1975; Leifer, Gordon,
I& Graves, 1975). In considering the question of children's understanding of commercial messages, two related issues of viewer comprehension emerge. The first is whether or not children comprehend the nonreality of the medium and can tell the difference between a commercial and the program. The second issue involves the ability of the child to understand the selling purpose of the advertisement.
Research evidence indicates that children, especially young
children, have considerable difficulty distinguishing commercial from
program matter. Based on interview data, Blatt, Spencer, and Ward
(1972) found that although children could identify the term ’commercial,’
they exhibited little sound understanding of the concept. The
Reproduced with permission of the copyright owner. Further reproduction prohibited without permission.

32
researchers exposed 20 children ranging in age from five to twelve
years to a videotape of a typical Saturday morning programming, with
commercials, and then asked them a number of questions the following
day about what they had seen. Kindergarten children expressed the
most confusion, believing commercials were "more funny than shows" or that commercials are "just shorter programs."
Subsequent research has supported the Blatt et al. implication that young children have difficulties perceiving commerials as distinct from programs. In a series of investigative interviews. Ward and Wackman (1973) administered personal questionnaires in the home to 67 children ranging in age from five to twelve years. They asked the very
direct question "What is the difference between a commercial and a program?" and found very clear differences between the comprehension expressed by five through eight year olds and that of nine through
twelve year olds. Younger children generally exhibited a low level of differentiation based on recognition of various perceptual cues, such as "commercials are short and programs are long.” In contrast, most of the older children indicated they could accurately differentiate, based on responses indicating some understanding of the meaning of the message (e.g., "programs are supposed to entertain; commercials are to
sell things").The findings reported on this issue consistently demonstrate a
positive relationship between children's age and their ability to
descirbe the difference between commercials & program material (NSF,
1977; Comstock, 1980). More specifically, younger children either ex
pressed confusion about the difference, or used superficial, coincidental
Reproduced with permission of the copyright owner. Further reproduction prohibited without permission.

33reasoning and affective cues as the basis for the distinction.
Children's cognitive limitations regarding their comprehension of commercials can also be seen in their tending to view commercial
characters (i.e., the selling figure) as real and believable. White
( 19|79) assessed children's perception of television advertising selling
figures. Based on interviews with 223 four— , five— , six— and seven— year-old children. White found that children in her sample saw the
selling figure as their friend. They believed the commercial character
wanted them to eat the advertised product and also thought that the character, himself, eats that product. Whether or not the children in White's sample saw the selling figure as a "real person" depended on
the child's age. Younger children were more likely to attribute magical powers to the commercial character. White concluded that the general perception of young children toward television's selling figures is one
of benevolent trust. Ninety-two percent of the children in this study reported that they felt the commercial character wanted them to "eat things that are good for you," regardless of the food product being
advertised -In an earlier study exploring the reality/non-reality issue, Blatt,
Spencer and Ward (1972) interviewed kindergarteners, second, fourth and
sixth graders about the nature of commercials and commercial characters. They found that the fourth and sixth graders fully grasped the fundamental "reality" or "non-reality" of the characters and situation por
trayed in commercials. The kindergarteners and second graders, however, had difficulty making such distinctions. Lyle and Hoffman (1972a) also
found that the first graders were much more likely to accept television
Reproduced with permission of the copyright owner. Further reproduction prohibited without permission.

34characters as true to life (believing there were "real people in the
box") than were sixth and tenth graders. Quarforth (1979) studied
first through fourth graders and found that it was not until the second
grade that children could differentiate humans from animated characters and puppets when they were represented on television.
The conclusion to be drawn from these studies is that younger
children tend to see the characters presented in commercials as real
and believable figures and place a great deal of trust in them. White believes that young children "interpret the words and actions of television selling figures as they would that of their parents. They extend a trustful interpretation to the intent of these selling'figures,
which misleads them as to the true intent of the messages." (White,1978, p. 11).
Whether or not this persuasive intent of televisioh commercials
is understood is the second issue of concern relating to children's comprehension of television commercials.
There is consistent evidence that the persuasive intent of commercials is not understood by younger children (Robertson &
Rossiter, 1974; Ward, Reale, & Levinson, 1972; Ward & Wackman, 1973).
Generally, it is not until the child reaches fourth through sixth
grades that she or he can discern the persuasive nature of the message.
Older children tend to express more skeptical attitudes toward commercials and are more critical and less accepting of them (Ward,
Wackman, & Wartella, 1977) .In the study cited earlier by Ward and Wackman (1973) the five-
twelve year olds were asked aibout the purpose of television commercials.
Reproduced with permission of the copyright owner. Further reproduction prohibited without permission.

3 5
Forty—seven percent of the children failed to adequately explain the
selling motives of commercials. The researchers, who constructed a
three-level scale of cognitive functioning based upon Piaget's theory
of cognitive development, described the responses of the younger children as "lower cognitive level" responses. Based on Piaget's
theory, they hypothesized that younger children may be unable to abandon their own perspective enough to understand the interest of the advertiser.
Robertson and Rossiter (19 74) hypothesized that the child's ability to recognize the selling purpose of advertisements depends on whether or not he or she can make the following cognitive distinctions :
1. discrimination between programming and commercials;2. recognition of an external source;3- the realization that commercials are targeted itoward an
intended audience ; and4- awareness of the symbolic, as opposed to realistic, nature of
the advertisement.The researchers offer support of their hypotheses based on interview
data collected from 289 first, third and fifth grade boys. They found that the children who were able to correctly identify the persuasive intent of television advertisements were also able to meet the cognitive
distinctions given above. Robertson and Rossiter also found a positive
relationship to age; 53 percent of the first graders in their sample
could understand the selling intent of television ads, compared to 99 percent of the fifth graders. The authors point out that age not
only reflects maturational factors but also cumulative experience with
Reproduced with permission of the copyright owner. Further reproduction prohibited without permission.
36
commercial messages.
It appears, then, that younger children who are unaware of the
selling intent of television advertisements constitute an especially
vulnerable group. First of all, they watch greater amounts of television
(iii terms of sheer volume) and, thus, are exposed to a higher frequency
of commerical messages than any other age range. And secondly, they have
less sophisticated cognitive abilities which can function as a mediating factor between commercials and the intent of the advertiser, which is to sell the child a product.
Purchase Influence AttemptsThe effect of television advertisements has often been studied by
noting the frequency and effectiveness of a child's attempts to influence his parents to buy an advertised product. Since children do
I
not usually have an income of their own, and therefore, do not have any independent buying power, their; accessibility to the marketlace is through their parents. If a commercial's purpose is to get a child to
purchase a product, then the effectiveness of the commercial, for young
children, may be observed through their purchase influence attempts
(Ward, Wackman & Wartella, 1977).Atkin (1975) unobtrusively observed parent-child interactions in
the supermarket as they made cereal selection. He observed 516 families and found that children initiated the selection of cereal either by
demanding (46 percent) or requesting (20 percent) a specific brand.
It was noted in the paper under the heading of 'Content of Televised
Messages' that over 43. percent of all food ads directed toward children
Reproduced with permission of the copyright owner. Further reproduction prohibited without permission.

37are for sugary cereal. Atkin speculated that the fact that the children
he observed specified a specific brand can be attributed to their prior
viewing of television commercials ; however, he acknowledges that
children's exposure to cereal commercials would have to be experimentally
controlled in order to make conclusive statements about the effects of advertising.
Clancy-Hepburn (1974) studied 105 six through twelve year olds in two separate studies. She reported a significant correlation between the number of requests made for food products and the amount
of Saturday morning television viewing reported. She also noted a positive relationship bewteen the child's attitudes toward commercials and the frequency of purchase influence requests made.
Galst and White (19 76) found a strong indication that the more reinforcing television is for a child, the harder he or, she will try to attain the products they see advertised. Children in their study were required to push a button to keep the picture on a television screen. These children were later observed interacting with their
parents in a grocery store. The researchers discovered that the chil
dren who worked hardest to watch television, also made significantly more attempts to influence their parents to buy items in the market.
Cereal and candy were found to be both the most frequently advertised
and the most requested products.
Cons umpt i on
There is a great deal of correlational research along with preliminary experimental evidence which suggests that television commercials
Reproduced with permission of the copyright owner. Further reproduction prohibited without permission.

38
do have an effect of children's consumptive behaviors (Sharaga, 1974;
Ward & Wackman, 1971).
For example, Atkin ( 1975 ) surveyed 506 fourth through sixth
grade children and found a positive relationship between children's
exposure to commercials for candy and cereal and their consumption of these products.
In an experimental study commissioned by the FTC, Paulo (1975)
demonstrated that exposing a child to a commercial of an adult picking wild berries increased the chances that he or she would engage in similar behavior. The results were interpreted to suggest that commercials do affect behavioral responses in young children. Four commercials were shown to a sample of five to eleven year olds. Pre and post viewing questionnaires were administered to measure the children's beliefs about the edibility of certain plants shown to the children in photographs.
The photographs included both familiar and unfamiliar plants, some of which were toxic. The children's ratings of the edibility of
the toxic plants which most resembled those shown in the commercials
increased significantly over their edibility ratings of any other plant
not resembling those in the television ads.Additional research investigating the effects of television
commercials on children's eating behavior will be reviewed later in
the present paper.The research reviewed thus far indicates that the impact of food
advertising on children will vary depending upon the child's age, the
type of ad, and the particular food in question. Children have been
Reproduced with permission of the copyright owner. Further reproduction prohibited without permission.

39shown to attend to and acquire specific product information from food
commercials- There is preliminary evidence that information about the
pro-nutritional content and value of food can be effectively communi
cated with a commercial format, however, the material and presentation
must be such that the child will attend to it and also understand the
content- Also, commercials for food products have been shown to affect both the child's requests for those products and their con
sumption of them-Up to this point, the present paper has dealt with how much
television children watch, their viewing patterns, and the kinds of nutritional messages they are exposed to via this medium. It h^s been asserted that children learn by viewing television, and the effects of television viewing on their nutritional knowledge and food
preferences and consumptive behaviors have been reviewed- However,
the processes by which children learn from television have not yet been discussed- The next section will describe several theories about how television influences behavior.
Observational Learning Theory and
Television Advertising
Learning would be difficult and inefficient if people needed to
depend solely upon the effects of their actions to learn how to behave. According to Albert Bandura (1969, 1971, 1977), who has developed a com
prehensive theory of social learning, much of human behavior is learned
observâtionally through "modeling": attending to the behavior of others,
observing thé consequences of those behaviors and using this information
as a guide to one's own behavior. For a behavior to be acquired from
Reproduced with permission of the copyright owner. Further reproduction prohibited without permission.

40
television it must be observed and then copied, thus, Bandura's theory
would appear to be an appropriate model with which to conceptualize this process.
Bandura's Observational Learning Model
Briefly, his theory predicts that those who view an act (such as
watching someone consume a product in an advertisement) may vicariously acquire the behavior as a new behavior pattern, strenghen or weaken
inhibitions governing the expression of previously learned responses, and be reminded to perform already learned responses (Bandura, 1962). This process occurs by exposure to modeled stimuli as it interacts with the observer's perceptual and cognitive processes of attention, retention, motoric reproduction, and motivation.
To understand the effects of modeling, it is useful to distinguishtlearning from performance. The requirement for learning through model
ing, according to Bandura and Walters (1963), is observation of the model; it involves the processes of attention and retention.
Attention. Attention is involved when the observer focuses on the
modeled event. This requires discriminitive observation. The observer will fail to learn the matching behavior if he or she does not or is not
able to recognize the distinct features of the modeled responses, does
not attend to these factors, or does not perceive them accruately
(Bandura, 1971).Whether or not attention will be given to the model's behavior or
the event, depends on a number of features. The characteristics of the
model will play a role depending upon their salience for the observer
(Flanders, 1968; Fredrich & Stein, 1975). For example, if the model
Reproduced with permission of the copyright owner. Further reproduction prohibited without permission.

41is someone important to the observer, with whom he or she identifies
strongly, then the level of attention will be enhanced. The state of
arousal of the observer will also influence the amount of attention
given the modeling stimulus (Bandura, 19 73).
' Retention. The second process involved in learning the modeled behavior is retention. This is the encoding of the modeled behavior
in symbolic representational form within the observer’s memory (Bandura, 19 71}, Bandura states that observational learning involves two representational systems, one visual, one verbal. He notes that the visual system is responsible for the vivid imaginai representations one is able to elicit of absent physical stimuli (such as a picture of someone's
face or the image of a place where one has visited), but asserts that the verbal system is probably the more powerful, accounting for the notable speed of observational learning and long term retention of the modeled event that he has found in his investigations of this theory (Bandura, Grusec, & Menlove, 1967). After a modeled event has been
transformed into images or verbal symbols, these encoded symbols will
serve as guides for subsequent reproduction of matching responses-Bandura (19 71) discusses a number of factors which will facili
tate retention. Repetition of the observed display is one factor which
serves to strengthen the response by solidifying and stabilizing the
encoding process. Another means of strengthening retention is by rehersal, i.e. through either covert or overt practice of the
response.Motoric reproduction. The physical or verbal imitative response
involves the motor reproduction process. Provided there are adequate
Reproduced with permission of the copyright owner. Further reproduction prohibited without permission.
42incentives to respond and the behavior has been learned (attended to
and encoded) the symbolic representation may then be retrieved and
enacted. Factors affecting the motoric representation of the act involve
the physical capacities of the observer and whether or not he or she possesses the requisite skills to perform the act.
Motivation. Thus, a response which has been observed is learned
via the process of attention, and may then be reproduced motorically.
Whether or not the response will actually be performed will depend on the response consequences or incentives associated with the response (Bandura, 19 71). These are motivational processes and were demonstrated by Bandura (1965) in an experiment in which children observed a film of an adult modeling aggressive responses. For some children the model's responses were rewarded, for others, it was punished and for others there were no consequences associated with the act.
Imitative responses of aggressive behavior were greater for the children who observed the model receive a reward. When a reward was offered to
all three groups at a later time, the differences between the groups disappeared- Therefore, learning of the response had occurred in all
groups regardless of the portrayal of the consequences. Bandura
concludes that the differences between groups in performance indicate
the kind of reinforcement received by a model will affect observer
performance.A number of variables have been identified which may mitigate or
enhance learning through observation, they include, the age, race, sex,
socio-economic status and current affective state of the observer.
Bandura (19 71) has also investigated various model characteristics
Reproduced with permission of the copyright owner. Further reproduction prohibited without permission.

43which affect observational learning and has found:
1. those models who have high status, competence and power are
the most effective models;
2. those models who appeared to be most like the observer were
' imitated more frequently than models who were less like theobs e r ve r ;
3. models who are seen as reinforcing and nurturing will also be
modeled more frequently.
Also, it has been pointed out that people do not merely reproduce all of the characteristics of a preferred model, but will selectively
attend to those aspects which the observer finds reinforcing. Behavior of persons exposed to multiple models will be a function of elements of each model's behavior (Blake, 1958; Campbell, 1961; Flanders, 1968).
Empirical research investigating observational learning theory is quite extensive. Numerous behaviors have been shown to be affected by modeling. Aggression is probably one of the most widely studied behaviors in the context of observational learning and is especially relevant to the current discussion since it has largely been related to the effects of televised aggression and violence (Bandura, 1973). Other
areas of research include, phobias (Bandura, Grusec, & Menlove, 1967;
Hill, Libert, & Mott, 1968), drug abuse (Hanneman & McEwen, 1973), pro
social behavior (Morris, Marshall, & Miller, 1973), altruism (Bryan &
Test, 1967; Rosenhan & White, 1967), and language acquisition (Lovaas,
1966) .The studies which have been conducted on the efficacy of filmed
models are particularly salient to the current discussion- Bandura,
Reproduced with permission of the copyright owner. Further reproduction prohibited without permission.
44
Ross, and Ross (1963) found equal strength of modeling effects whether
the model was live or filmed. In a study presenting live or cartoon
models, Ellis and Sekyra (1972) also found no differences in degree of
effects. There appears to be conclusive evidence that behavior may be
acquired vicariously, through observation, no matter if the observed
model is live, filmed or a caricature (Bandura, 1973; Goranson, 1970; Liebert, Neale, & Davidson, 1973).
The conclusion may be drawn that Bandura's modeling theory provides a convincing explanation of how children learn from television watching. Since commercials are presented through this medium and, in essence, are produced specifically with the intent of inducing modeling behavior, this theory and process would certainly apply to them. Television food commercials directed toward children are especially designed to catch the child's attention. Quick action scenes, catchy
jingles, animation, a variety of attractive models are all employed to hold a youngster's attention and increase the salience of the advertised product. There is a substantial body of literature which indicates that
young children do attend to and retain the content of television ads (Barry & Hansen, 1973; Rust, Langbourne, & Watkins, 1975; Ward & Wackman,
1973; Zuckerman, Zeigler, & Stevenson, 1978; Atkin, 1975 ; Gorn & Gold
berg, 1976 ).Motivational aspects for the child to model the television ad may
be provided in a myriad of ways. Internally, by hunger or cravings;
externally by social pressure to eat; or through the stimuli of the ad itself by association of very positive characteristics to the advertised
product.
Reproduced with permission of the copyright owner. Further reproduction prohibited without permission.
45
The motoric reproduction would depend only on the child's ability
to feed her or himself and, ultimately, on the availibility of the product.
In addition to the basis of conceptualization which Bandura's observational learning theory provides for the study of the effects of
television food ads in children, the value of this theory lies in the
distinction it draws between learning of the response and actual per
formance of the behavior. Observers may be capable of attending to and
discriminating a modeled event, encoding and retrieving the various stimuli, enacting separate component responses, yet may not behavior-
ally enact the observed response. Bandura makes clear the necessary distinction that it is possible to have a change in attitudes or an acquisition of knowledge without performance following. Once a behavior has been acquired, modeling theory tells us t^at past experience and current incentives tend to determine whether or not it will be enacted. Unfortunately, within Bandura's framework, the relative importance of past consequences and current incentives are not made explicit, thus, when a particular act is likely to be modeled is
difficult to precisely predict.Comstock, Chaffee, Katznvan, McCombs, and Roberts (1978) have
developed a model which accepts the major precess of attention, reten
tion, motoric reproduction and motivation that Bandura has put forth.
Rather than attempting to further prove that effects can occur through
observation and modeling, they begin from the premise that these effects ^ occur and cite much of Bandura's research in support of
this. Comstock et al. are concerned with the relative contribution of
various components which lead to the performance of an act. They
Reproduced with permission of the copyright owner. Further reproduction prohibited without permission.

46
ask the question "when will the act be performed?" Their model is a
dynamic one and may potentially be used to predict the probability that
a given behavioral event will occur.
Comstock's Multi-Component Response Model ' Comstock et al. present their model in a general format and it
is discussed largely in the context of the effects of televised aggression. For the purposes of this explication it will be discussed solely as it relates to pro-nutritional television messages and their effects (or potential effects) on the eating behavior of children.Much of the complexity and detail of this model will necessarily be omitted; the interested reader is referred to their discussion'for the
theoretical development, as it is not within the confines of this discussion to explain their entire theory. Rather, their model will be suggested as a basis by which to conceptualize the effects of pro-
nutritional ads and messages presented on television and their current effects on children's behavior. The model will also be discussed in its ability to make predictions regarding the future effects of pro- nutritional television messages.
The central concept of their model is the act or actual behavior.
This is ultimately represented by the entire set of possible human behaviors. However, for this treatment, the act will be the consump
tion of foods high in nutritive value.Comstock et al. propose that the likelihood of a person behaving
in accordance with a given act is a function of three factors. The first
factor is salience, or the degree to which the particular behavior
exists psychologically for the individual. In other words, it is the
Reproduced with permission of the copyright owner. Further reproduction prohibited without permission.

4 7
intrinsic value, meaning, or importance of the act. The second factor,
repertoire, involves the sum of all possible acts for the person in
his or her given situation, that is, all possible behaviors which are
consistent with the act which the person could perform. The third
factor involved in performance of the act is arousal, which Comstock
et al. define as the extent to which the individual is activated to engage in any act within the present situation.
They summarize the probability of the occurrence of the act as represented by the following equation. Briefly, the probability that an individual will perform a given act is decreased to the extent that there are other possible acts in his or her repertoire, and increased
to the extent that he or she is aroused to do something.
act = . X arousalrepertoire ,
The implications of the equation are as follows. First, if the act lacks salience for the person, the behavior will not follow.Second, if there is no arousal, there will be no act, no matter how salient the act may otherwise be. If there is some degree of arousal and the act is at all salient, then there is at least a possibility of its occurrence, provided it is within the individual's behavioral repertoire. If the act does not exist within the person's behavioral repertoire it will not occur. Thus, if the person is not physically able to perform an act or he or she is not aware of the possibility of
the act it will not be exhibited. If it is the only act in the individual's repertoire, then it is maximally likely, limited only by
degree of arousal. On the other hand, an act that is only a minor
Reproduced with permission of the copyright owner. Further reproduction prohibited without permission.
48item in the person's repertoire, has little chance of occurring in a
given situation. However, with high arousal, given many trials, it would be expected to occur occasionally.
It follows that this equation is modified to the extent that events can alter the salience of the act, or the total repertoire of
acts available to the person, or the person's level of arousal.
Television commercials may affect the various components within the model which contribute to the act in the following ways. First, it may change the repertoire by providing an additional input of new
behaviors or information. Secondly, it could àffect arousal by adding external stimulation. Arousal, however is noted as highly situational and specific to the individual at a given time. The level will fluctuate depending on person variables. Decreases in arousal come about as a result of acting out a given behavior (either the act or
an alternative).Comstock et al. posit that television ads can affect the salience
of an act in two ways: by demonstrating the act (making it more
familiar) and by attaching positive or negative values to the act.They state that "it seems intuitively obvious that the more often, and
the more vividly a given act is portrayed for a person, the more
salient it will become to him." (p. 403) Familiarity and exposure have been discussed previously as very important factors in children's
food preferences which lends support to the role of these variables
as they affect the salience component of this model.The second way television can increase salience is by attaching
positive or negative values to the act. This happens as a result of
Reproduced with permission of the copyright owner. Further reproduction prohibited without permission.

49the observer experiencing the consequences or outcomes of the act as desirable and positive or undesirable and negative. If the child per
ceives that a positive event will result from the use of the advertised product, it will assume a positive valence for him or her thereby
ingreasing the salience even if he or she has never actually experienced the product.
Positive qualities can also be gained less directly, by association. Rather than having actual positive events follow the use of the product,
the product could be portrayed within a positive context. For example, commercials that portray happy, healthy, attractive children enjoying a certain food will increase the salience of eating that food fpr a child who is attracted to those qualities. Comstock et al. are careful to point out the role that viewer characteristics play; the meaning of the message depends on the viewer’s perception of it̂ , and of course,
what is positive to one child may not necessarily be so for another.What is perceived is a joint product of the attributes of the portrayal
(i.e. the specific context and nature of the commercial) and the characteristics of the viewer.
The authors further note that the performance of the act also depends on the environment to offer an opportunity for performance to
occur. If there is no chance that an appropriate situation for a particular act will present itself, then the probability of that act
occurring is small, regardless of the strength of the other factors.
The authors state that one "should expect social learning— in the
sense of acquiring actual behavior patterns— to be most likely when television portrays acts which the person has many opportunities to
Reproduced with permission of the copyright owner. Further reproduction prohibited without permission.

50
perform." (p. 405)
This model presents the hypothetical relationships among major
factors affecting behavior in the context of television viewing.
The individual components may be delineated with regard to pro-
nutritional eating behavior as follows;
1. act - is the consumption of pro-nutritional food.2. repertoire - the repertoire would be the consumption of any
food, including the act, plus all alterhative foods. Con
sidering the ingestion of virtually any food is within the child's physical ability, then the repertoire, in this instance, is limited only by availability, opportunity and the child's awareness of types of food.
3. arousal - arousal may be seen as the desire for food and is a function of hunger, the appetitive qualities of the food
itself, and external cues, such as other people eating. If the child is very hungry the motivation to seek food will be quite high, thus there will be a great deal of arousal.
4. Salience - salience, in this case, refers to the value and desirability of a specific food to the child. What is the
particular significance of that food in terms of his knowledge
of it, the perceived consequences of eating it and actual prior
experience of it.Pro-nutritional messages may affect each component as follows:
1. repertoire - the presentation of new and different healthy foods could add to the child's behavioral repertoire.
2. arousal - if a child is hungry a commerical may further stimulate
Reproduced with permission of the copyright owner. Further reproduction prohibited without permission.
51him or her to act; or, it may also activate the hunger response.
However, arousal alone is insufficient to determine the kind of food the child will eat.
3. salience - at least two identifiable factors emerge from the
• foregoing discussion which may directly affect the salience ofpro-nutritional food as it is currently depicted on television.
The first factor is the sheer volume of advertisements for foods low in nutrition and the relative lack of pro-nutritional food ads.
As stated above, Comstock et al. assert that salience is affected by demonstration of the act. Given the virtual non-existence of pro-
nutritional advertising on television the consumption of these foods
is not being adequately demonstrated compared to low-nutritional foods. Thus, pro-nutritional foods are much less familiar, via this medium.This point becomes even more significant when one recalls that familiar
ity, according to Birch (1979a, 1979b), is the most important and prominent dimension in the child's food preference and food choices.
The second factor affecting the salience of healthy foods is the
way they are presented in advertisements and PSAs. It is clearly evident from viewing pro-nutritional ads that they often lack technical
sophistication when compared to high budget ads for popular low-nutritional foods and do not employ many of the very persuasive selling techniques
which are normally seen in low-nutritional food ads. Catchy advertising tactics, such as animation, quick action, attractive models shown enjoy
ing the product, magical scenes, etc. have been shown to be very attrac
tive and effective for young viewers (NSF, 1977). In addition to holding
the young viewers' attention and increasing arousal, they also present
Reproduced with permission of the copyright owner. Further reproduction prohibited without permission.

52the product in a very positive way. According to Comstock et al., if
the act is portrayed in a positive manner it will become more desirable
and its salience will increase. This may happen by association (the
mere presence of the act within a positive context), but it is likely
to'have even more of an affect if positive events occur as a result of the act. Salience can also decrease if negative events are associated with or follow the act. Associating negative consequences (such as cavities, obesity, poor health) with alternative acts (eating low
nutritional foods) would decrease the salience of the alternatives, inversely adding to the salience of the act itself (eating healthy foods).
The above discussion is not exclusive of all of the complex components that enter into whether or not a child will consume healthy vs.
unhealthy food. It has been presented as an initial attempt to explore
the process involved in the development of children's eating habits.There are obviously many other variables in children's food choices (other than television) which have not been considered. This model is not intended to provide a comprehensive theory of television and children's eating behaviors. Its purpose is more to aid in conceptualization of some of the complex interactions involved and add to a more organized attempt to empirically test one aspect of the effects of
television on children's eating behavior.The Comstock et al. model makes it very clear that any act is a
very complex behavioral event and is a function of a number of components
which interact to produce any given act at a given time. When considered
together, Bandura's theory and Comstock et al.'s model would seem to
indicate that there are four distinct levels upon which television
Reproduced with permission of the copyright owner. Further reproduction prohibited without permission.

53
messages for food products can exert an effect. It may be possible to
attend to the televised message, learn nutritional concepts and even ex
perience a modification of preferences, yet not exhibit a change in behav
ior. In this way, television commercials may be seen to exert a hierachy of effects (Gorn & Goldberg, 1976). The likelihood of obtaining a change at any given level is inversely a function of the complexity of the components which serve to produce the effect. The specific hierachy of effects can be seen as follows:
1. attention - attention is the first essential component on the hierarchy. It is the least complex, yet, without it, there would be no effects at any other level.
2. learning or knowledge - learning from television is a function
of attention, comprehension, integration and retention. It
represents a relatively passive process, yet cognitive development and the ability to process and encode information are essential for learning to occur.
3. preference - preference is largely a function of salience alone. This may be influenced by familiarity, prior experience, and the valence (i.e. positive or negative) which is attached to the act.
4. behavior - the behavior is the most complex of the three
levels. Given Comstock et al.'s model, it can be seen asa function of a number of components which interact to pro
duce the behavior in very specific ways depending upon the
presence or degree of strength of each component.Thus, a child may attend to the television, yet not learn if he or
she does not comprehend or obtain the information. Also, learning may
take place without a change in preference and behavior because there are
Reproduced with permission of the copyright owner. Further reproduction prohibited without permission.

54
fewer factors involved at this level. Preferences may also change,
i.e. additional foods may gain salience, however, unless there is an
opportunity to express the acquired preference, and unless they become
more salient than alternatives within the repertoire, then the change
in preferences will not be expressed behaviorally. For a behavioral
change to occur a number of complex interactions must take place, with both learning and attitudinal change as necessary but insufficient components of the interaction.Experimental Studies
At this point several relevant studies which have used experimental procedures in an attempt to address more directly the issue of children's
behavioral responses to television commercials will be reviewed in light of the theoretical model just presented.
In 1976, Gorn and Goldberg assessed a number of levels of children's
responses to both single and repeated exposures to commercials for a
specific food product. The researchers had 151 eight to ten year old children view advertisements for a certain brand of ice cream which was previously unknown to them so they could assess the degree of learning from the commercials. The control group saw a program with no commercials, while the experimental group viewed either one, three, or five commercials which were inserted in the same program.
The degree of recall of the brand name and number of flavors of
ice cream available (which were featured prominently within each commercial) was assessed first. The results were that any exposure to
an advertisement for the product led to a significant number of the
children recalling both brand name and number of flavors.
The commercials were not as effective in influencing the children's
attitudes toward the advertised brand. Only the group which was ex-*
Reproduced with permission of the copyright owner. Further reproduction prohibited without permission.
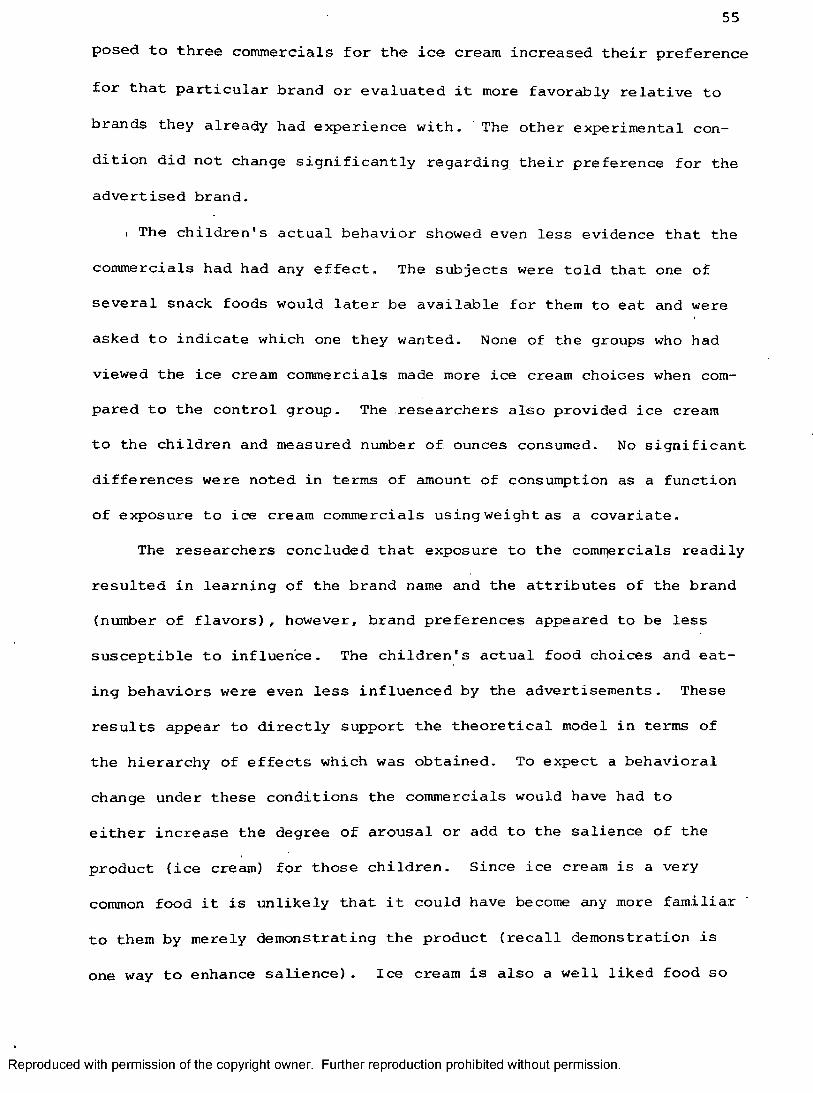
55posed to three commercials for the ice cream increased their preference
for that particular brand or evaluated it more favorably relative to
brands they already had experience with. The other experimental condition did not change significantly regarding their preference for the advertised brand.
. The children's actual behavior showed even less evidence that the
commercials had had any effect. The subjects were told that one of several snack foods would later be available for them to eat and were
asked to indicate which one they wanted. None of the groups who had
viewed the ice cream commercials made more ice cream choices when compared to the control group. The researchers also provided ice cream to the children and measured number of ounces consumed. No significant
differences were noted in terms of amount of consumption as a function of exposure to ice cream commercials using weight as a covariate.
The researchers concluded that exposure to the comrr^ercials readily
resulted in learning of the brand name and the attributes of the brand (number of flavors), however, brand preferences appeared to be less susceptible to influence. The children's actual food choices and eat
ing behaviors were even less influenced by the advertisements. These results appear to directly support the theoretical model in terms of
the hierarchy of effects which was obtained. To expect a behavioral change under these conditions the commercials would have had to either increase the degree of arousal or add to the salience of the
product (ice cream) for those children- Since ice cream is a very common food it is unlikely that it could have become any more familiar
to them by merely demonstrating the product (recall demonstration is
one way to enhance salience)- Ice cream is also a well liked food so
Reproduced with permission of the copyright owner. Further reproduction prohibited without permission.
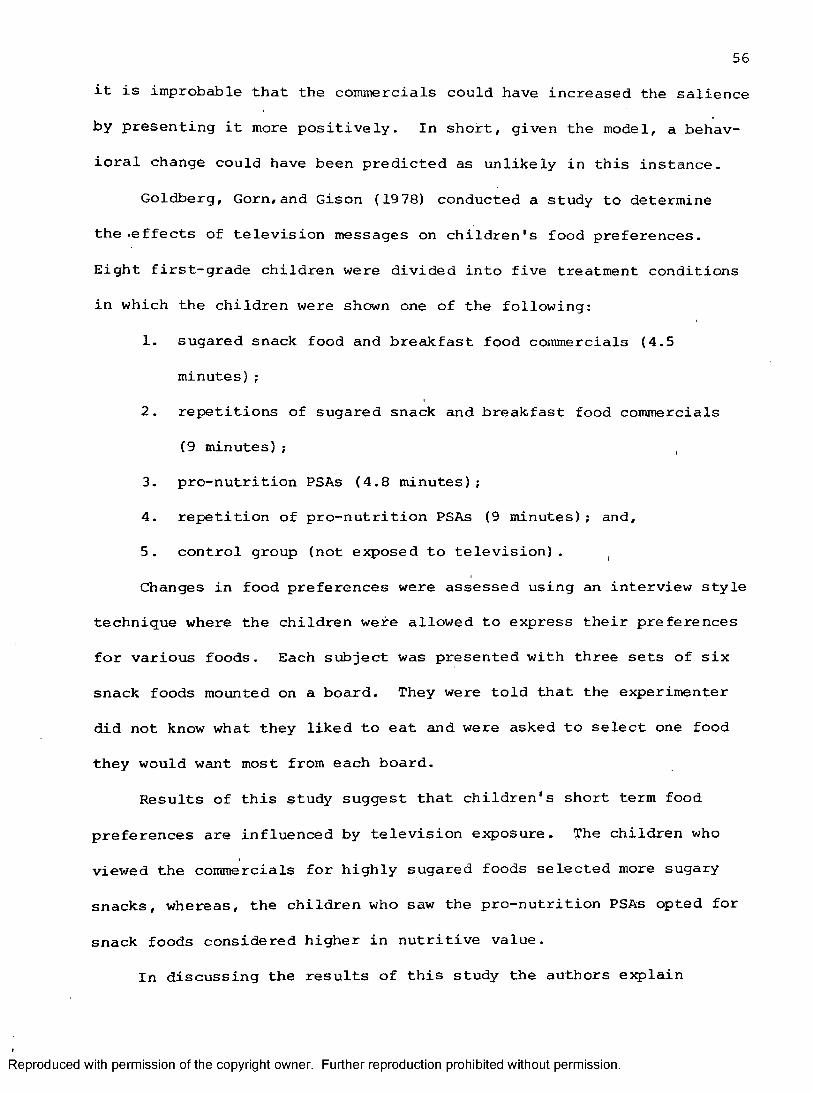
5 6
it is improbable that the commercials could have increased the salience
by presenting it more positively. In short, given the model, a behavioral change could have been predicted as unlikely in this instance.
Goldberg, Gorn,and Gison (19 78) conducted a study to determine
the .effects of television messages on children's food preferences.
Eight first-grade children were divided into five treatment conditions in which the children were shown one of the following:
1. sugared snack food and breakfast food commercials (4.5 minutes);
2. repetitions of sugared snack and breakfast food commercials (9 minutes);
3. pro-nutrition PSAs (4.8 minutes);4. repetition of pro-nutrition PSAs (9 minutes); and,5. control group (not exposed to television). ,
Changes in food preferences were assessed using an interview style technique where the children were allowed to express their preferences
for various foods. Each subject was presented with three sets of six snack foods mounted on a board. They were told that the experimenter
did not know what they liked to eat and were asked to select one food
they would want most from each board.Results of this study suggest that children's short term food
preferences are influenced by television exposure. The children who viewed the commercials for highly sugared foods selected more sugary snacks, whereas, the children who saw the pro-nutrition PSAs opted for
snack foods considered higher in nutritive value.
In discussing the results of this study the authors explain
Reproduced with permission of the copyright owner. Further reproduction prohibited without permission.

5 7
the increase in preference in pro-nutritional foods according to the
"mere exposure" hypothesis (Harrison, 1977; Zajonc, 1968) which was
described earlier in the present paper. They assert that the salience
of the pro-nutrition foods was increased by exposure to pro-nutritional
PSAs for that group of children, that is, pro-nutritional foods were
made more familiar to the children as a result of the television exposure.
In this same article, Goldberg et al. report a second study
which was basically an extension of the one reported above. The
researchers assessed the effectiveness of a television program which used appealing characters and presented pro-nutritional concepts in a very positive context in an effort to change children's snack food preferences. They divided 42 children into three groups; one group viewed the pro-nutritional program with no commercials, lone viewed the same program with pro-nutritional PSAs for maximal pro-nutrition exposure and the last group viewed the pro-nutritional program with regular sugared snack and breakfast food commercials as a "reality" condition. All groups selected significantly more healthy, pro-nutritive snacks than the control condition. The authors used the same dependent
measure described above and concluded that the pro-nutritional program was successful in altering children's short term food preferences, even
in the face of the effects of typical commercials for low-nutritional
foods which were embedded in the program.It is important to bear in mind that for both of these studies
the researchers were measuring food preferences and not eating behavior.
The results are encouraging in that they indicate that food preferences
Reproduced with permission of the copyright owner. Further reproduction prohibited without permission.

5 8
may be affected by presenting more healthy, nutritional food in a
positive context. This is consistent with the theoretical model which
would predict preference to change as a result of an increase in
salience for a given food or group of foods- Unfortunately, the
researchers did not attempt to measure actual eating behaviors, so
there is no way to judge, from these studies, if the effects of the pro-nutritional programming was strong enough to also change the , child's eating behavior.
A series of investigations into the effects of television advertising on children’s eating behaviors have been conducted at the
University of Montana (Fox, Jeffrey, Dahlkoetter, McLellarn, & Hickey,
1980; Jeffrey, Lemnitzer, Hickey, Hess, McLellarn, & Stroud, 1979; Jeffrey, McLellarn, 5 Fox, 1980; Lemnitzer, Jeffrey, Hess, Hickey, &
Stroud, 1979; Peterson, Hickey, Jeffrey, Bridgwater • Dahlkoetter, McLellarn, & Fox, 1981). These studies have been among the first to
use experimental procedures while attempting to measure actual eating behavior.
The first exploratory study conducted in the series compared the effect of toy ads, low-nutritional food ads and pro-nutritional food
ads on preschool ad kindergarten age children's actual food consumption (Lemnitzer et al., 19 79). Within each product category, three 30-
second advertisements were selected. These ads were embedded within a Ih minute program which remained the same for all conditions. Each
commercial was repeated once for a total of six ads within each
program;In order to test the effects of these advertisements on food
Reproduced with permission of the copyright owner. Further reproduction prohibited without permission.

59consumption, a behavioral eating test (BET) was developed (Jeffrey,
Lemnitzer, Hickey, Hess, McLellarn, & Stroud, 1980). This measure
required subjects to sample from a tray of 12 foods, half of which were
high in sugar and fat content with low nutritional value. The remaining half were considered to be high in nutrient contents.
The results of this study suggested that children who were shown
commercials for foods low in nutritional value, significantly increased the amount of food they consumed on the posttest from that eaten on pre
test measure. The children in the pro-nutritional condition, however, did not increase their consumption of pro-nutrit ion foods.
These results imply that consumption of low-nutritional food
is relatively easy to influence, possibly because it is already a much more salient activity for young children than the consumption of pro-nutritional food. '
In a second study. Fox et al. (1980) examined the effects of low-
and pro-nutritional advertisements on four and nine year old children, using the behavioral assessment procedure described above. For both age groups the amount of low-nutritional food that was consumed by the boys who had viewed low-nutrition ads was significantly greater at posttesting. Girls, however, did not show a similar effect. Also, the
pro-nutritional commercials did not appear to change the children's
eating patterns.On the basis of these studies, along with the research published
to date, there appears to be gaining empirical evidence that low-
nutritional food ads increase food consumption and preference for foods
which are low in nutritive value. However, the research involving the
Reproduced with permission of the copyright owner. Further reproduction prohibited without permission.
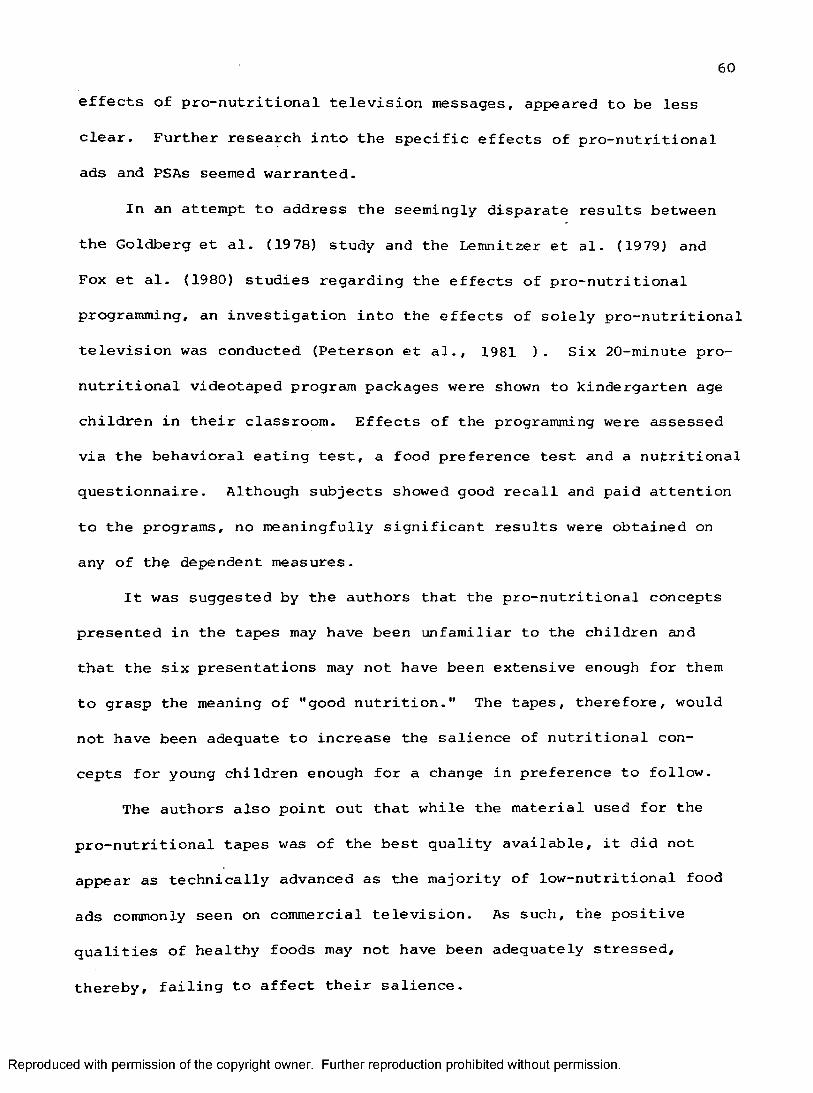
60effects of pro-nutritional television messages, appeared to be less
clear. Further research into the specific effects of pro-nutritional ads and PSAs seemed warranted.
In an attempt to address the seemingly disparate results between
the Goldberg et al. (19 78) study and the Lemnitzer et al. (1979) and
Fox et al. (1980) studies regarding the effects of pro-nutritional programming, an investigation into the effects of solely pro-nutritional
television was conducted (Peterson et al., 1981 ). Six 20-minute pro-
nutritional videotaped program packages were shown to kindergarten age children in their classroom. Effects of the programming were assessed via the behavioral eating test, a food preference test and a nutritional questionnaire. Although subjects showed good recall and paid attention
to the programs, no meaningfully significant results were obtained on
any of the dependent measures.It was suggested by the authors that the pro-nutritional concepts
presented in the tapes may have been unfamiliar to the children and that the six presentations may not have been extensive enough for them
to grasp the meaning of "good nutrition." The tapes, therefore, would not have been adequate to increase the salience of nutritional concepts for young children enough for a change in preference to follow.
The authors also point out that while the material used for the
pro-nutritional tapes was of the best quality available, it did not appear as technically advanced as the majority of low-nutritional food
ads commonly seen on commercial television. As such, the positive qualities of healthy foods may not have been adequately stressed,
thereby, failing to affect their salience.
Reproduced with permission of the copyright owner. Further reproduction prohibited without permission.

61Furthermore, the administration of the treatment tapes was
interrupted for nearly two weeks due to the eruption of the Mount St.
Helen's volcano, which tends to obscure the interpretation of the
results to some extent. Although attempts were made to remedy the
situation by repeating two of the programs, it is possible that
immediate effects were present, but not retained at the time of posttesting.
Given these considerations, the results of this study are consistent with what the Comstock et al. model would predict. The children were able to recall the content: of the tapes, but due to an insufficient duration of exposure and a possible lack of attraction
and appeal, the tapes did not affect the salience of pro-nutritional food concepts for the children to the degree of a preferential or behavioral change. It is clear, however, that the investigation of the
effects of pro-nutritional messages needs to be repeated and expanded
before any conclusive statements can be made.
When the foregoing research is reviewed collectively within the conceptual framework presented it becomes clear that what previously appeared to be contradictory findings are not contradictory, but in fact consistent and predictable given the "hierarchy of effects" model. For pro-nutritional messages presented on television to have
an impact on a child's actual consumption they must exert a sufficient
effect on the complex components which interact to produce that
behavior.
Reproduced with permission of the copyright owner. Further reproduction prohibited without permission.
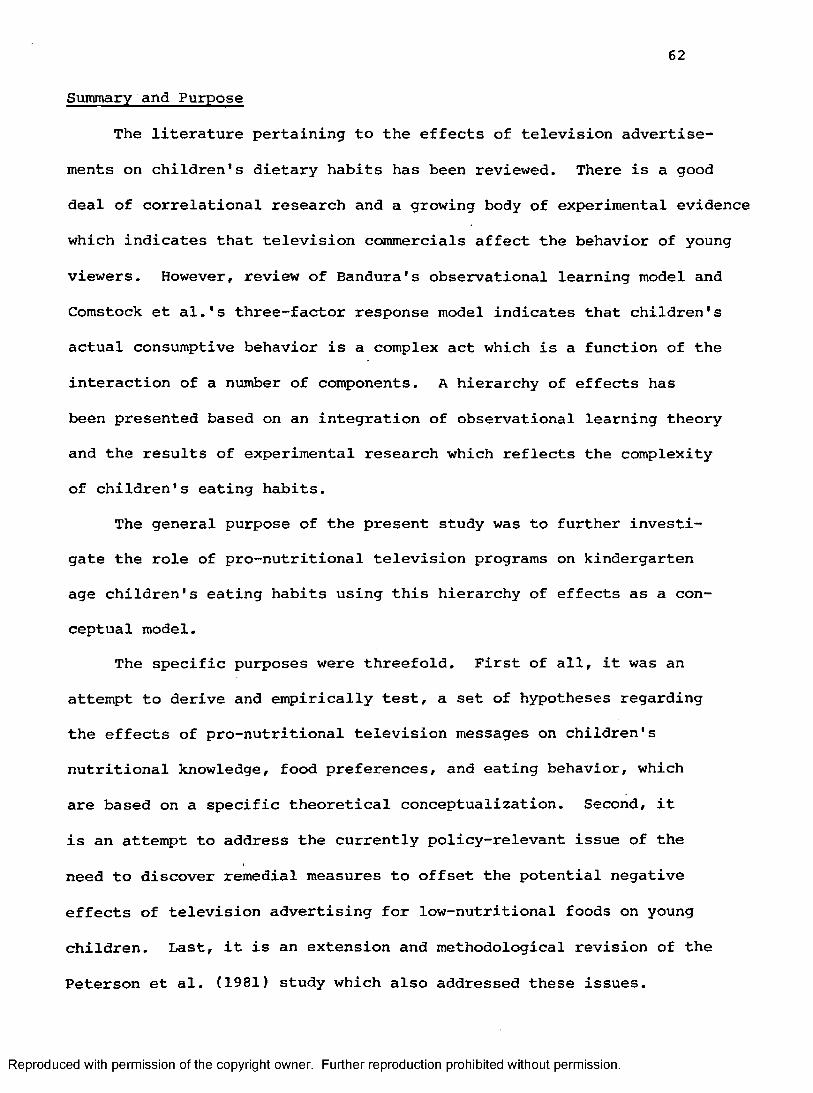
62
Summary and Purpose
The literature pertaining to the effects of television advertise
ments on children's dietary habits has been reviewed. There is a good
deal of correlational research and a growing body of experimental evidence
which indicates that television commercials affect the behavior of young
viewers. However, review of Bandura's observational learning model and
Comstock et al.'s three-factor response model indicates that children's
actual consumptive behavior is a complex act which is a function of the
interaction of a number of components. A hierarchy of effects has
been presented based on an integration of observational learning theory and the results of experimental research which reflects the complexity of children's eating habits.
The general purpose of the present study was to further investigate the role of pro-nutritional television programs on kindergarten age children's eating habits using this hierarchy of effects as a con
ceptual model.The specific purposes were threefold. First of all, it was an
attempt to derive and empirically test, a set of hypotheses regarding the effects of pro-nutritional television messages on children's
nutritional knowledge, food preferences, and eating behavior, which
are based on a specific theoretical conceptualization. Second, it
is an attempt to address the currently policy-relevant issue of the
need to discover remedial measures to offset the potential negative
effects of television advertising for low-nutritional foods on young
children. Last, it is an extension and methodological revision of the
Peterson et al. (1981) study which also addressed these issues.
Reproduced with permission of the copyright owner. Further reproduction prohibited without permission.

CHAPTER II
Method
Subjects
Subjects were kindergarten age children from Washington School
in Missoula, Montana. Of the eight kindergarten classes at the school, six were randomly selected and assigned to either the treatment or the control condition (three classes per condition, 15 - 21 students
per class). All students who returned affirmative parental permission forms (see Appendix A) were included for the total of 106 subjects.The SES of the subjects was relatively uniform across the two "treatment
and control conditions given the fact that all subjects came from the same school. Age (in months), sex, height and weight were obtained for
each child.Design
The experiment employed a pre-test, post-test control group design (Ccimpbell & Stanley, 1963). The independent variable consisted of exposures to ten 20-minute video programs, presented in the classroom over a period of ten regular class days. The dependent variables were changes assessed across treatment on the modified behavioral
eating test, the pretend eating test, and three nutritional information tests. (See Table I for flow chart of design and time sequence.)
ApparatusChildren in the experimental conditions viewed videotaped pro
grams on an 18-inch color monitor located in their classrooms. The
experimenter or a trained research assistant operated a 3/4-inch
63
Reproduced with permission of the copyright owner. Further reproduction prohibited without permission.

7JCD■ DOQ.C
gQ. Class Condition Familiarization Pretest Treatment Posttest■ DCD
(/)cn
CD83
l(a,m.)
2(p.m.)
3(p.m.)
Experimental
Children brought to lab in groups to meet experimenters and see trailer.
BET
PET
BETTen pro-nutritional video- PETtaped programs,One per day for 10 class days.
i3CDC
CD■o
Icao3
4(a.m.)
5(a.m.)
6(p.m.)
Control
Children brought to lab in groups to meet experimenters and see trailer.
BET
PET
BET
PETgcr
&
%C/)Ç2o'3
3-4 days was required to collect data on all of the dependent measures for each class
\he beginning of the treatment phase was staggered for each class in order that posttest data could be collected in the shortest time possible following the treatment phase a\

65
cassette recorder which was used to play the tape.
Testing was conducted in a 40-foot mobile laboratory unit which
was parked adjacent to the school. The trailer houses two separate,
soundproof experimental rooms where the subjects were administered
the dependent measures. Each of the experimental rooms contains a one
way mirror. These rooms are separated by a control room equipped with a refrigerator, gram scale, graduated cylinder and storage space so that all foods required for the BET were stored and prepared within the lab.
Independent Measures
Ten videotapes (averaging 20-minutes in length) were developed. Each included approximately 15 minutes of programs having a theme relating to healthy eating habits or the nutritional qualities of foods. Examples of the programs included are a number of the "Slim Goodbody"
pro-nutritional education segments from the Captain Kangaroo Show;
a selection of segments from the "Mulligan Stew" nutrition series produced by 4-H fpr PBS, and a number of pro-nutrition spots from PSA's
Sesame Street Productions. The remaining five minutes of each tape was composed of ten 30-second commercials or public service announcements (PSAs) promoting foods high in nutritional value and healthy
eating habits (for a complete list of all tape contents see Appendix
B.) Although different programs were used for each videotape, the commercials and PSAs which were embedded were repeated. This was done
to more accurately reflect common advertising practices where com
mercials are repeated over a number of weeks.
Reproduced with permission of the copyright owner. Further reproduction prohibited without permission.

6 6
It is evident from viewing such pro-nutritional messages on tele
vision that, although recently the quality has dramatically increased,
many of them still lack the technical sophistication and appeal when
compared to high budget commercial advertisements for popular low-
nutritional foods. However, the pro-nutritional programming selected
is the highest quality of that which is currently available.
As a comparative measure, the tapes were reviewed and rated by
20 independent judges who were solicited from an undergraduate psychology class. Five 10-minute segments of the pro-nutritional treatment tapes were randomly selected to be judged. The judges also viewed five 10-minute segments of regular Saturday morning children's programming. The tape segments were shown alternately in sets (one of the treatment tapes and one from the regular Saturday morning programs). Each judge rated the tapes in terms of; 1. Audio
quality; 2. Video quality; 3. level of technical sophistication; and 4. overall quality. The ratings were averaged and compared
using paired t tests to determine if there were any significant dif
ferences between the quality of the nutritional treatment tapes and the
kind of programming children are normally exposed to during Saturday morning viewing. (See Appendix C for rating form.) Results of these
analyses show that there were no significant differences between the
pro-nutrition treatment tapes and the regular Saturday morning pro
gramming on any of the demensions rated (all £'s>- ,05).Dependent Measures
Both direct and self-report measures were employed to gain as
Reproduced with permission of the copyright owner. Further reproduction prohibited without permission.
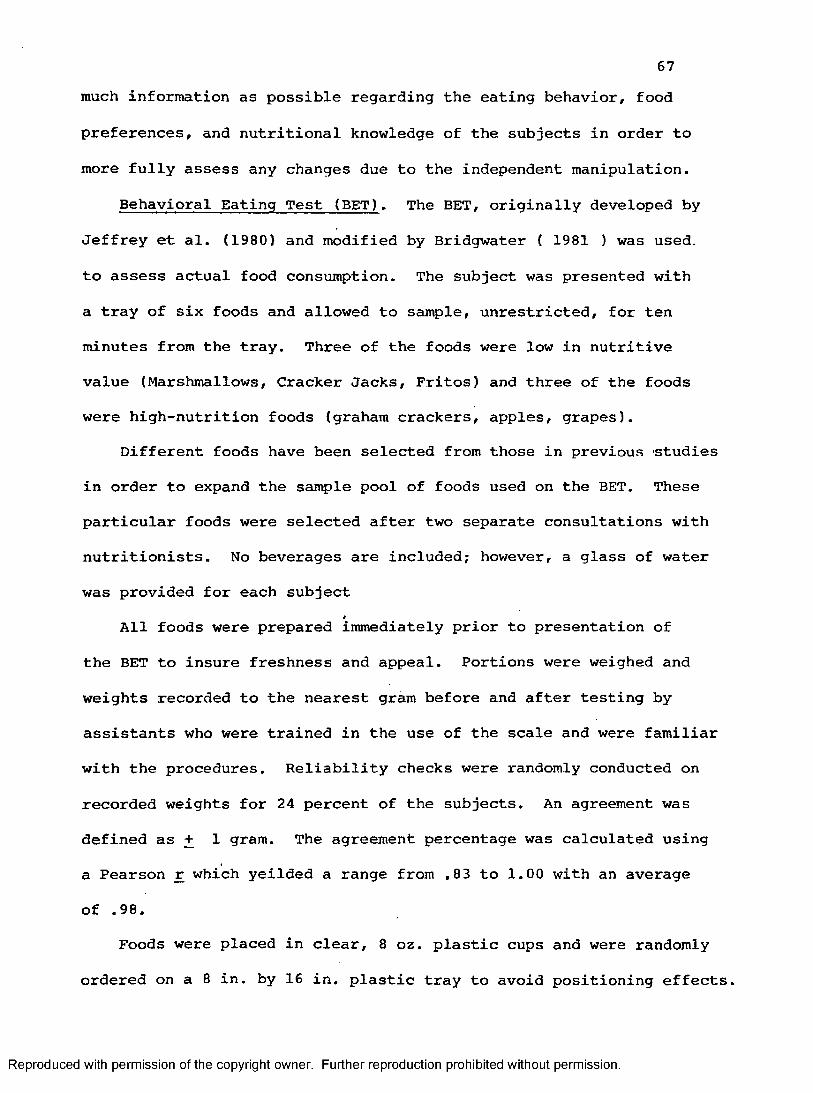
67much information as possible regarding the eating behavior, food
preferences, and nutritional knowledge of the subjects in order to
more fully assess any changes due to the independent manipulation.
Behavioral Eating Test (BET). The BET, originally developed by
Jeffrey et al. (1980) and modified by Bridgwater ( 1981 ) was used,
to assess actual food consumption. The subject was presented with
a tray of six foods and allowed to sample, unrestricted, for ten minutes from the tray. Three of the foods were low in nutritive value (Marshmallows, Cracker Jacks, Fritos) and three of the foods were high-nutrition foods (graham crackers, apples, grapes).
Different foods have been selected from those in previous studies in order to expand the sample pool of foods used on the BET. These particular foods were selected after two separate consultations with nutritionists. No beverages are included; however, a glass of water
was provided for each subjectAll foods were prepared immediately prior to presentation of
the BET to insure freshness and appeal. Portions were weighed and
weights recorded to the nearest gram before and after testing by
assistants who were trained in the use of the scale and were familiar with the procedures. Reliability checks were randomly conducted on
recorded weights for 24 percent of the subjects. An agreement was
defined as + 1 gram. The agreement percentage was calculated usinga Pearson r which yeilded a range from .83 to 1.00 with an average
of .98.Foods were placed in clear, 8 oz. plastic cups and were randomly
ordered on a 8 in. by 16 in. plastic tray to avoid positioning effects.
Reproduced with permission of the copyright owner. Further reproduction prohibited without permission.
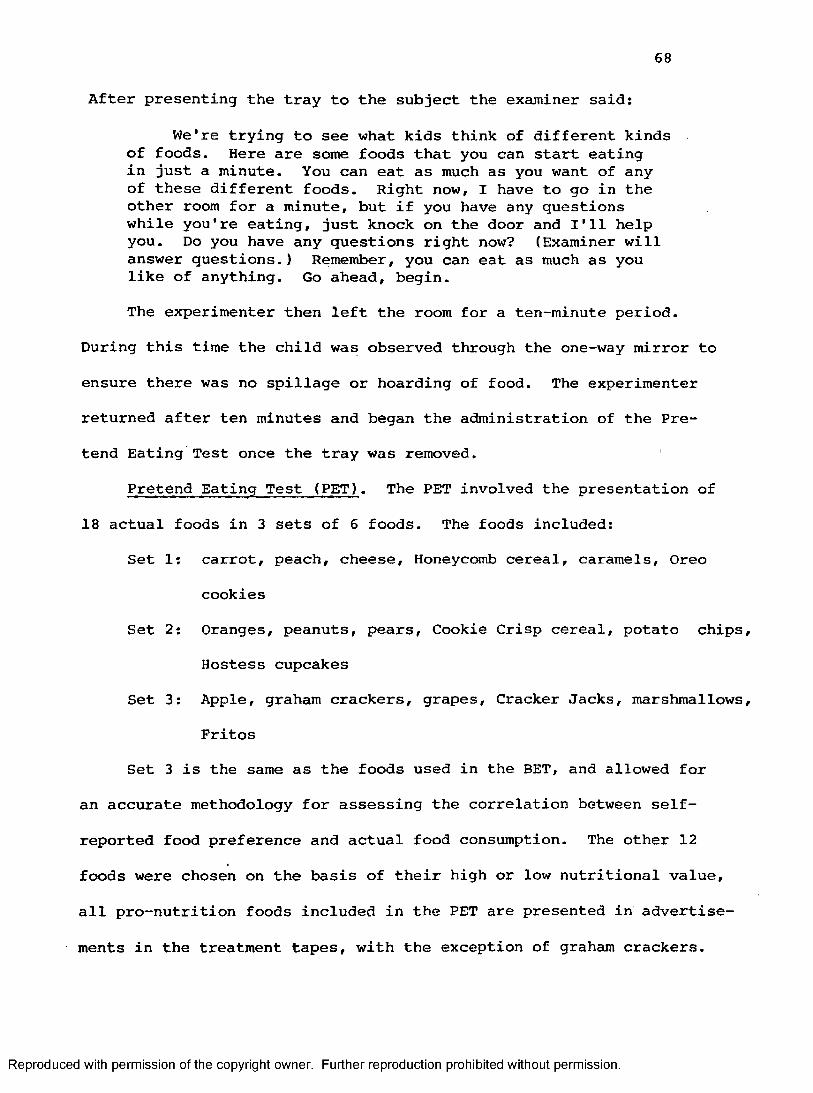
6 8
After presenting the tray to the subject the examiner said:
We're trying to see what kids think of different kinds of foods. Here are some foods that you can start eating in just a minute. You can eat as much as you want of any of these different foods. Right now, I have to go in the other room for a minute, but if you have any questions while you're eating, just knock on the door and I'll help you. Do you have any questions right now? (Examiner will answer questions.) Remember, you can eat as much as you like of anything. Go ahead, begin.The experimenter then left the room for a ten-minute period.
During this time the child was observed through the one-way mirror to
ensure there was no spillage or hoarding of food. The experimenter
returned after ten minutes and began the administration of the Pretend Eating Test once the tray was removed. '
Pretend Eating Test (PET). The PET involved the presentation of
18 actual foods in 3 sets of 5 foods. The foods included:Set 1: carrot, peach, cheese. Honeycomb cereal, caramels, Oreo
cookiesSet 2: Oranges, peanuts, pears. Cookie Crisp cereal, potato chips.
Hostess cupcakesSet 3: Apple, graham crackers, grapes. Cracker Jacks, marshmallows,
FritosSet 3 is the same as the foods used in the BET, and allowed for
an accurate methodology for assessing the correlation between self-
reported food preference and actual food consumption. The other 12
foods were chosen on the basis of their high or low nutritional value,
all pro-nutrition foods included in the PET are presented in advertise
ments in the treatment tapes, with the exception of graham crackers.
Reproduced with permission of the copyright owner. Further reproduction prohibited without permission.

69The six foods were presented in a linear fashion and randomized
for each subject to avoid positioning effects once again. The Bridg
water study suggested that children had a tendency to focus on one of
the two end foods during presentation and, consequently, chose those
foods significantly more often; thus, a cardboard shield was used by
the examiner to hide the array until all foods were presented. After
moving the shield the examiner said:
Now I want you to pretend something. Let's pretend that your Mommy and Daddy are going away on a vacation and I'm going to be your babysitter. You're hungry, and would like a snack. But I don't know what you like to eat, so you've got to tell me. We go to the kitchen to get your snack and find these six foods, do you know what all of them are? (Child names foods; if child can't name a food, it is noted on form and examiner names it for him or her.) Now you can only have one of these foods for your snack, which one would you pick?(Examiner then removes that food, leaving five foods on the table.)
O.K. Suppose we went to the kitchen and there were only these foods to choose from. Then which one would you pick?(Examiner removes the second food.)
Now let's pretend we went to the kitchen and there were only four foods to choose from. Which one would you choose for your snack?(Examiner removes the third food.)This procedure continued until there was only one food left. The
first food picked was scored a '6', the second food a '5', and so on,
with the last food receiving a score of *1'.The above procedure was repeated for the second and third sets of
foods, with the examiner saying the snack choices are for the second
and third days of babysitting.
Reproduced with permission of the copyright owner. Further reproduction prohibited without permission.

70
Nutritional Questionnaries. The nutritional questionnaire con
sists of three parts, the first part (NQI) was used to assess the child's
understanding of the nutritional value of the foods included in the PET.
The foods presented to the child were exactly the same as those used
in the PET. Following the PET administration, the examiner said:
Now we're going to do something different. You probably already know that there are some foods that are good for you because they have lots of vitamins and help you grow big and strong. Other foods are not so good for you because they have lots of sugar, fat or salt in them and can cause cavities or make you get too fat. Some foods that are healthy and good for you would be milk, meat and vegetables. Can you name another food that would be good and healthy for you to eat?(Child names food. If child cannot name another healthy food, the examiner provided an example.)
O.K. Now, some foods are not very good for you because they have too much sugar or salt or fat in them. Things like ice cream and cake have too much sugar and potato chips have too much salt and fat and are not very good for you. Can you tell me the name of another food that isn't very good for you?(Child names food. If child cannot think of anything, the examiner provided another example.)
O.K. Now I'm going to show you some foods and Iwant you to tell me whether they are good and healthyfor you, or whether they're bad fob you because theyhave too much sugar or fat in them.(Experimenter presented first food from the selection of foods previously shown on the PET.)
Is this food good for you or bad for you?
(The child's response was recorded as 1 for correct and 0 for incorrect. The next food was then presented with the same query.)This procedure continued until all of the 18 PET foods were pre
sented, The order in which the foods were shown to the subject was the
Reproduced with permission of the copyright owner. Further reproduction prohibited without permission.
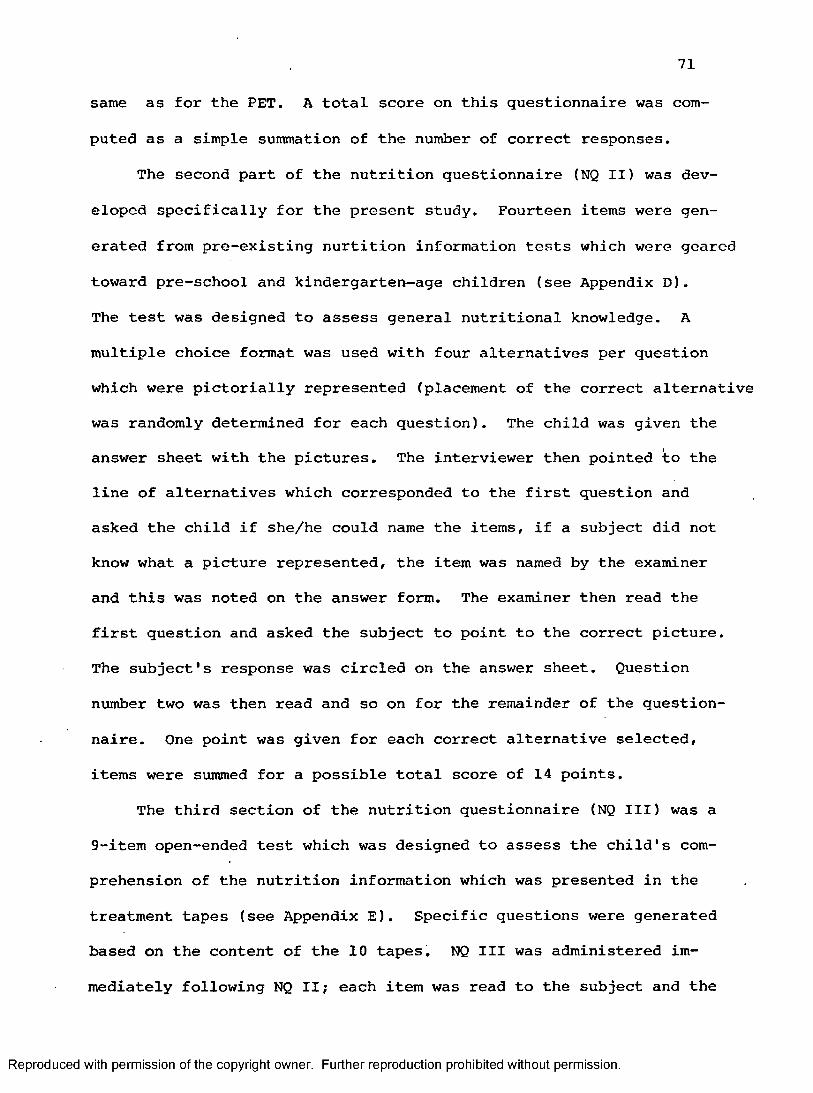
71
same as for the PET. A total score on this questionnaire was com
puted as a simple summation of the number of correct responses.
The second part of the nutrition questionnaire (NQ II) was dev
eloped specifically for the present study. Fourteen items were gen
erated from pre-existing nurtition information tests which were geared
toward pre-school and kindergarten-age children (see Appendix D).The test was designed to assess general nutritional knowledge. A
multiple choice format was used with four alternatives per question
which were pictorially represented (placement of the correct alternative was randomly determined for each question). The child was given the answer sheet with the pictures. The interviewer then pointed to the line of alternatives which corresponded to the first question and asked the child if she/he could name the items, if a subject did not know what a picture represented, the item was named by the examiner and this was noted on the answer form. The examiner then read the first question and asked the subject to point to the correct picture.The subject’s response was circled on the answer sheet. Question
number two was then read and so on for the remainder of the question
naire. One point was given for each correct alternative selected,
items were summed for a possible total score of 14 points.The third section of the nutrition questionnaire (NQ III) was a
9-item open-ended test which was designed to assess the child's comprehension of the nutrition information which was presented in the
treatment tapes (see Appendix E). Specific questions were generated based on the content of the 10 tapes, NQ III was administered im
mediately following NQ II ; each item was read to the subject and the
Reproduced with permission of the copyright owner. Further reproduction prohibited without permission.

72subject's response was recorded verbatim. The examiners were trained
in administration of the form; specifically, if the child responded
"I don't know", the examiners noted it on the answer sheet and replied
"think hard" or "take a guess". The examiners were instructed not
to question a wrong response, but were to query an incomplete answer or
ask the subject to clarify a confusing response (in all cases this
was noted on the form). Questions were repeated or explained as necessary for the subject to understand. For example, if a child did not know what "cavities" meant, the word was defined for him/her. The scoring of NQ III is described in the Results section.Procedures <
The school was contacted and the experiment, its focus and purpose explained. Cooperation from teachers, and consent of the ad
ministration was obtained. An introductory letter of explanation and a request for permission for the child to participate was then mailed to the parents. Included was a brief description of the procedures, dependent and independent measures, and time frame involved (see
Appendix A). The letter was followed by a telephone call to answer
any questions and ensure return of the consent form.Prior to the beginning of pre-testing, the experimenter went
to the individual classes and explained the procedures to the children. The experimenter showed the children the tray of BET foods and described what was to happen during the experiment. The classes were escorted
as a group through the trailer to allow them to acclimate to the
testing environment. This was done to acquaint the children with the
setting so as to avoid the chance that fluctuations would appear on
Reproduced with permission of the copyright owner. Further reproduction prohibited without permission.
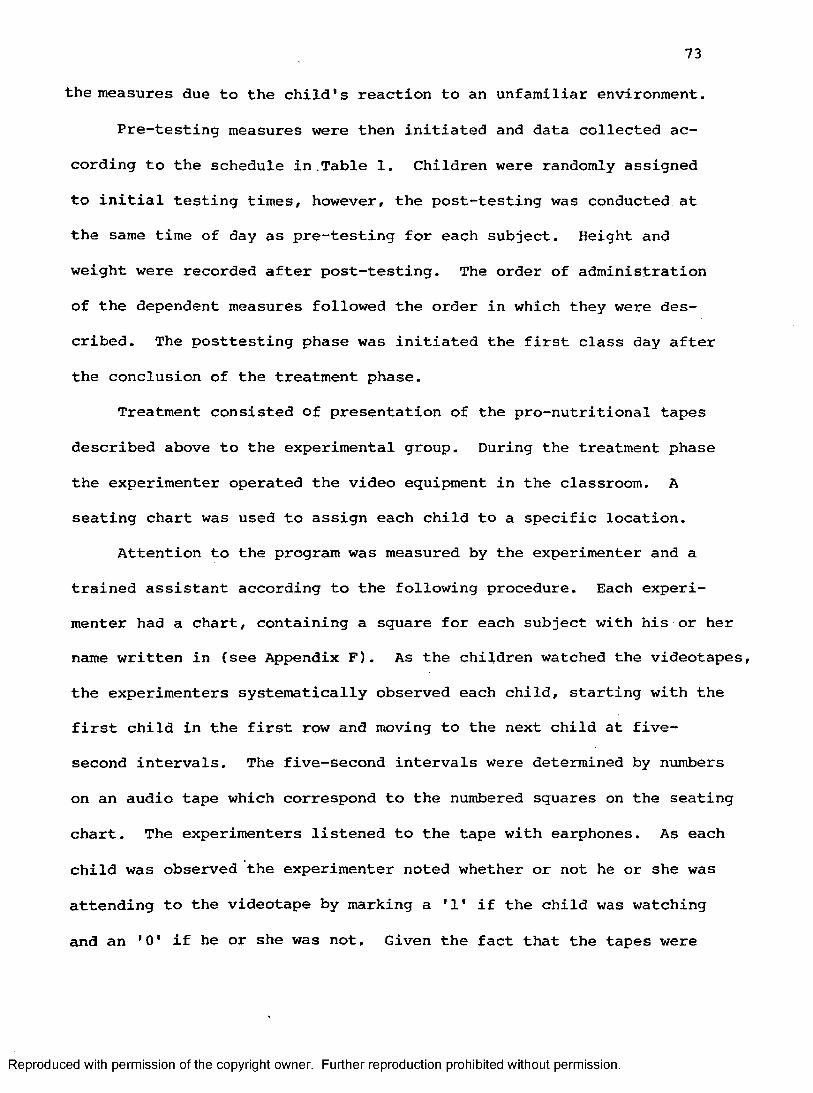
73
the measures due to the child's reaction to an unfamiliar environment.
Pre-testing measures were then initiated and data collected according to the schedule in.Table 1. Children were randomly assigned
to initial testing times, however, the post-testing was conducted at the same time of day as pre-testing for each subject. Height and
weight were recorded after post-testing. The order of administration of the dependent measures followed the order in which they were described. The posttesting phase was initiated the first class day after the conclusion of the treatment phase.
Treatment consisted of presentation of the pro-nutritional tapes
described above to the experimental group. During the treatment phase
the experimenter operated the video equipment in the classroom. A seating chart was used to assign each child to a specific location.
Attention to the program was measured by the experimenter and a trained assistant according to the following procedure. Each experimenter had a chart, containing a square for each subject with his or her name written in (see Appendix F). As the children watched the videotapes, the experimenters systematically observed each child, starting with the first child in the first row and moving to the next child at five- second intervals. The five-second intervals were determined by numbers
on an audio tape which correspond to the numbered squares on the seating chart. The experimenters listened to the tape with earphones. As each
child was observed the experimenter noted whether or not he or she was
attending to the videotape by marking a if the child was watching
and an 'O' if he or she was not. Given the fact that the tapes were
Reproduced with permission of the copyright owner. Further reproduction prohibited without permission.

7 4
20 minutes in length and the classes contained approximately 20 children
in them, this resulted in approximately 12 observations per child for
the 20-minute viewing period. Inter-rater reliability was computed
using a Pearson r.
Reproduced with permission of the copyright owner. Further reproduction prohibited without permission.
CHAPTER III
RESULTS
The design of the present experiment involves the random assignment
of intact classes to either the treatment or control condition. Because
classes were randomly assigned as a whole, the unit of analysis for all
of the statistical procedures performed on these data is the class mean
rather than the individual subject's. Unless otherwise stated, this is true of all of the analyses which follow.
An unfortunate loss of power due to decreased degrees of freedom resulted from the statistical procedures required of the present design.
Consequently, as a comparative measure of interest, the data were subse
quently analyzed by individual cases. A subset of 15 cases was randomly selected from each class resulting in a n of 45 for each of the treatment and control groups. This procedure yielded only one change in the significance of any measure, and is reported below. The significance and
pattern of the results for all remaining analyses were not altered by examining individual cases, compared to class means. Those analyses which yeilded significant results using individual case scores are presented in Appendix G .
Class Characteristics
There were 17,16 and 17 children in each of the respective classes
which were assigned to the control condition for a final of 50. In con
trol class 1, there were 9 males and 8 females, with a mean age of 74.64
months (6.22 years). Control class 2 contained 9 males and 7 females; mean
age was 77.20 months (6.43 years). Control class 3 had 8 males and 9 females
75
Reproduced with permission of the copyright owner. Further reproduction prohibited without permission.
76
with a mean age of 73.58 months (6.13 years).
The three treatment classes contained 15, 21, and 20 children, re
spectively, for a final jn of 56. Treatment class 1 included 7 males and
8 females with a mean age of 74.5 months (6,21 years); treatment class
2 had 11 males and 10 females, mean age was 75.75 months (6.31 years); and in treatment class 3 there were 10 males and 10 females with a mean
age of 74.42 months (6.20 years).
Attention to Programming Time spent watching the pro-nutritional programming by each class
was monitored by the experimenter and trained research assistants accord
ing to the procedure described previously. This was done to insure that the children were actually watching the programs, thus eliminating nonattending as a potential confound to the results. Reliability checks were performed on 10 of the 30 tape presentations. Interobserver agreement was determined using a Pearson r ; rate of agreement for individual class pre
sentations ranged from .92 to .98 with a mean of .95. The analysis of the observational data indicated that the percent of time spent watching the programs for each class ranged form 88.09 to 98.48. For all classes combined the children were attending to the tape presentations an average of
94.68% of the time.Program Recall and Recognition
Recall and recognition of the treatment tapes was assessed using a
5 - item, open ended questionnaire administered to the experimental group.
Interviewers received training in administration of the questionnaire
and recorded the subject's responses verbatim. However, the scoring of
individual items was problematic due to the fact that the questions were
Reproduced with permission of the copyright owner. Further reproduction prohibited without permission.
77
open ended and somewhat related, which allowed for a high degree of over
lap in responses. Consequently, the recall questionnaire was scored in
the following manner: The child received 1 point for naming any of the
four programs (Mulligan Stew, Sesame Street, Slim Goodbody or the Haunted
Mouth); 1 point for naming or adequately describing any character in the
programs, commercials or PSAs; 1 point for each program episode she/he
described; 1 point for a specific nutrition concept (such as "eat fruits
and vegetables" or "healthy snacks") in response to question 4 ("what
were the shows about?"); 1 point for a general nutrition concept (e.g.,"the four food groups" or "we need vitamins to be healthy.") in response to question 4; 1 point for each commercial or PSA named or described onquestion 5; and 1 point for each commercial or PSA named or described in response to questions 1-4. The mean, standard deviation and ranges for each scoring category and the total recall scores are given in Table 2.
Also, mean total recall scores are presented for each of the three treatment classes separately along with the number of days latency between the ending of the treatment phase and the beginning of post-testing for that
class.In general, the children in the treatment group readily recalled the
content of the treatment tapes. Mean recall score across the three classes
was 8.33. As would be expected, the fewer days between the end of the TV tapes and posttreatment assessment, the higher the total recall scores. Also,
the children recalled the Mulligan Stew program more frequently than the
other programs which is understandable since they saw six separate episodes
of Mulligan Stew, more than any other individual program. Sesame Street
was shown second most frequently (4 programs), followed by Slim Goodbody
Reproduced with permission of the copyright owner. Further reproduction prohibited without permission.
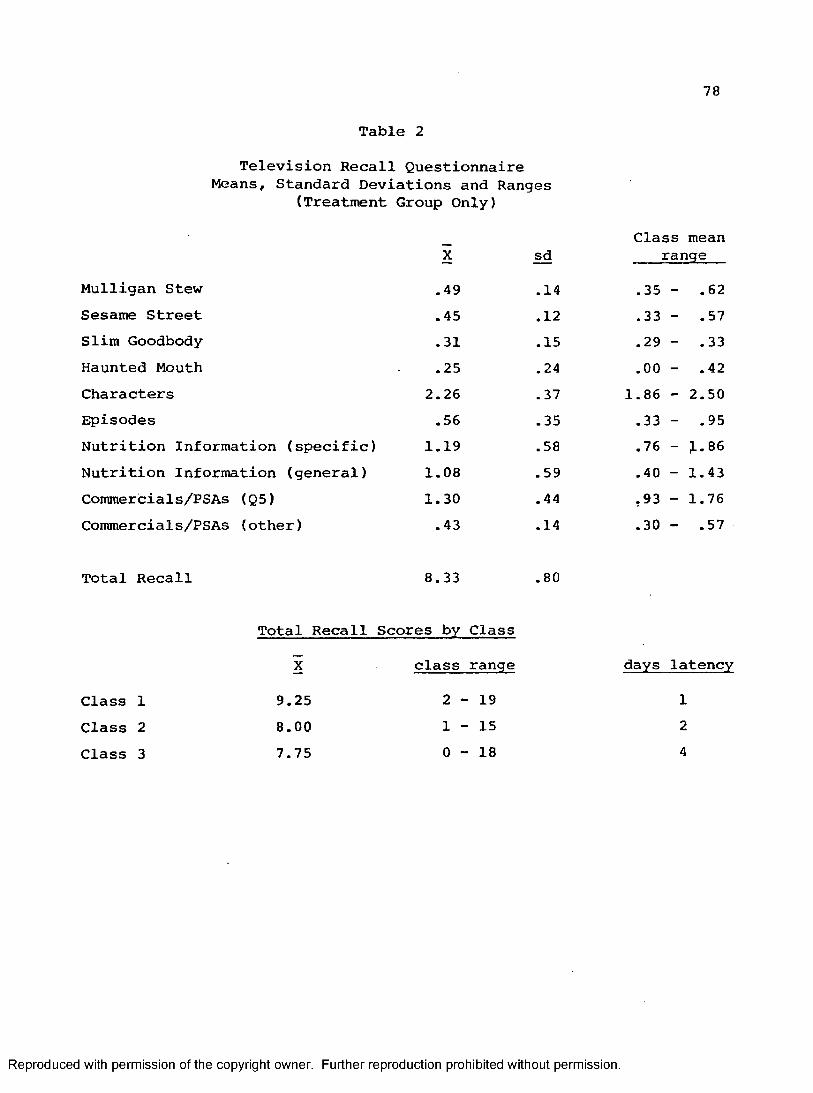
Table 2Television Recall Questionnaire
Means, Standard Deviations and Ranges (Treatment Group Only)
78
Class meanX sd range
Mulligan Stew .49 .14 .35 - .62Sesame Street .45 .12 .33 - .57Slim Goodbody .31 .15 .29 - .33Haunted Mouth .25 .24 .00 - .42Characters 2.26 .37 1.86 - 2.50Episodes .56 .35 .33 - .95Nutrition Information (specific) 1.19 .58 .76 - 1.86Nutrition Information (general) 1.08 .59 .40 - 1.43Commercials/PSAs (Q5) 1.30 .44 ,93 - 1.76Commercials/PSAs (other) .43 .14 .30 - .57
Total Recall 8.33 .80
Total Recall Scores by Class
X class range days latency
Class 1 9.25 2 -■ 19 1Class 2 8.00 1 -■ 15 2Class 3 7.75 0 -■ 18 4
Reproduced with permission of the copyright owner. Further reproduction prohibited without permission.
79
(2 programs) and finally the Haunted Mouth, which was only one single show.
Nutrition Information Measures
Three separate measures were used to assess nutrition knowledge. The
first test (NQI) was designed to measure the children's understanding of
the nutritional value of the specific foods included on the preference
measure (the PET). Means and standard deviations are listed in Table 3.
An analysis of variance with repeated measures performed on these data
revealed no significant differences between groups, trials or their inter
actions (all p's >.05). Table 3 reveals that the group means at pretest were quite high (15.02 and 15,30, out of a total possible of 18) and that the standard deviations were quite small which indicates that most of the children already had a very good understanding of whether or not the PET foods were healthy or unhealthy for them to eat. This implies that the failure to achieve results on this measure may have been due, at least in part, to ceiling effects of the measure.
In order to obtain an estimate of the stability of the NQI, test -
retest correlation coefficients were claculated on the control group with
a resulting r of ,81. Also, as a measure of the internal consistency, coefficient alpha was computed for the full scale which included pretest
scores on the 18 items, = .62,The second nutrition information questionnaire (NQ II) was developed
specifically for the present study in an attempt to measure the children's comprehension of general nutritional concepts, not necessarily limited to those included in the actual programming. This was a 14 - item multiple
choice form with four alternatives per item which were represented pic-
torally. Each correct response received one point; correct responses were
Reproduced with permission of the copyright owner. Further reproduction prohibited without permission.

Table 3Nutrition Questionnaires I, II, & III
Means and Standard Deviation
80
Group_ Pre X sd
Postsd
Pre-PostDifference
NQ I 12
15.0215.30
.48
.8014.9615.23
.59
.56-0.06-0.07
NQ II 12
10.85 .3810.89 .94
11.5412.14
.37
.510.691.25
NQ III 12
16.38 .8815.14 1.12
17.19 1.0319.23 .24
0.814.09
Group 1 = control Group 2 = treatment
Reproduced with permission of the copyright owner. Further reproduction prohibited without permission.
81summed to obtain a total score on this measure. Means and standard de
viations for this questionnaire are given in Table 3. An analysis of
variance with repeated measures was performed on these data which yielded
a significant main effect for trials, F (1,4) = 10.13, £ = .03 (see Table
4). When the same analysis was performed on individual cases a significant
group X trials interaction was obtained as well, F (1,88) = 4.55, £ = .04, which is also shown on Table 4.
The test-retest coefficient for this measure, calculated on the control
group, equaled .70; coefficient alpha for the pretest data was computed on
the total seale, yielding c* = .40.The final nutrition questionnaire was designed to assess the degree
to which children learned the specific nutrition concepts which were presented in the pro-nutrition programming. Nine open-ended questions were
included, which were scored in the following manner. The subject received 1 point for each fruit or vegetable named in response to question 1; 2
points for each food group named or 1 point for naming a specific food
within each food group on item 2; 1 point for each correct food named in
response to item 3; 3 points if she/he replied that meat contained proteinin response to item 4 or 1 point for a less specific, yet accurate nutrition
al concept (up to 3 points total) such as, "It's from one of the four food
groups " or "it gives you energy" or "it helps you grow" etc.; 3 points
if she/he couldîsay that fruits and vegetables have vitamins in response to question 5 or 1 point for a less specific response, such as "They don't
have sugar" or "They make healthy snacks" etc. (up to three points total);
1 point for each valid reason why sugar is unhealthy (e.g. "it gives you
cavities" or "it can make you fat") in response to question 6; 1 point for
each correct food named on question 7 ; 1 point for each correct food given
Reproduced with permission of the copyright owner. Further reproduction prohibited without permission.
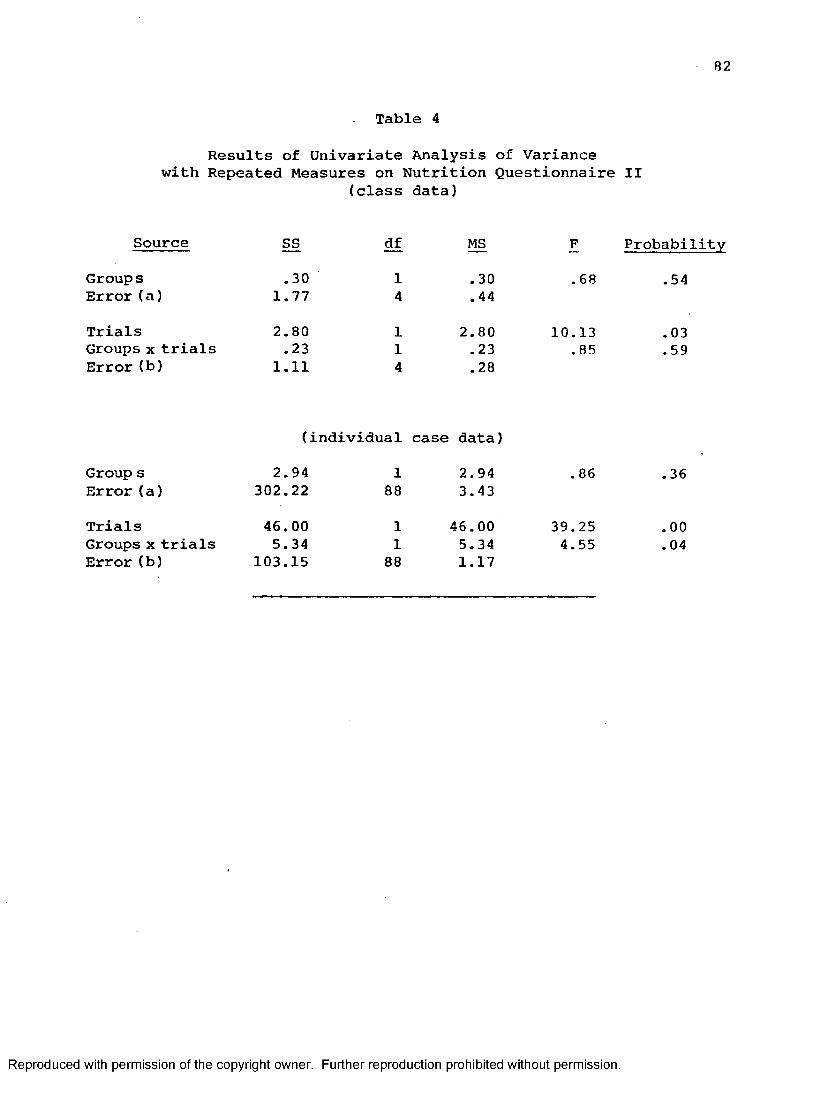
82
Table 4Results of Univariate Analysis of Variance
with Repeated Measures on Nutrition Questionnaire II(class data}
Source SS df MS F ProbabilityGroup s .30 1 .30 .68 .54Error (a) 1.77 4 .44Trials 2.80 1 2.80 10.13 .03Groups X trials .23 1 .23 .85 .59Error (b) 1.11 4 .28
(individual case data)Group s 2.94 1 2.94 .86 .36Error (a) 302.22 88 3.43Trials 46. 00 1 46.00 39.25 .00Groups X trials 5.34 1 5.34 4.55 .04Error (b) 103.15 88 1.17
Reproduced with permission of the copyright owner. Further reproduction prohibited without permission.
83
on question 8, and, finally, 2 points for the correct response ("breakfast")
on item 9. The scores for each item were computed and summed to give a
total score. Thus, the maximum total score that a subject could obtain on
NQ III was 30 points.
Table 3 presents the mean and standard deviation for this measure.
Repeated measures analysis of variance conducted on these date yielded a
significant group x trials interaction, F (1,4) = 28.48, £ = .009 which is displayed in Table 5.
The test-retest coefficient for this measure was .60 and coefficient alpha for the full scale, which was calculated on the pretest data, equaled
.45.Preference Measure
Means and standard deviations for the Pretend Eating Test (PET) are
presented in Table 6. The Total Pro-Nutrition PET score was formed by
combining rankings for apples, carrots, cheese, graham crackers, grapes,
oranges, peaches, nuts and pears. The rankings of the remaining nine
foods (caramels. Cookie Crisp, Cracker Jacks, Fritos, Honeycomb, Hostess Cakes, marshmallows, Oreos and potato chips) were summed to form the Total
Low-Nutrition PET score.Test-retest coefficients for individual food scores ranged from .16
to .50 as shown on Table 7; also shown are the stability coefficients for
the composite scores. Coefficient alpha for the Total Pro-Nutrition score
is .54 and for the Total Low-Nutrition score is .44 (computed on the pre
test scores).Repeated measures analysis of variance performed on the PET composite
scores revealed significant main effects for trials on both the Pro - and
Reproduced with permission of the copyright owner. Further reproduction prohibited without permission.
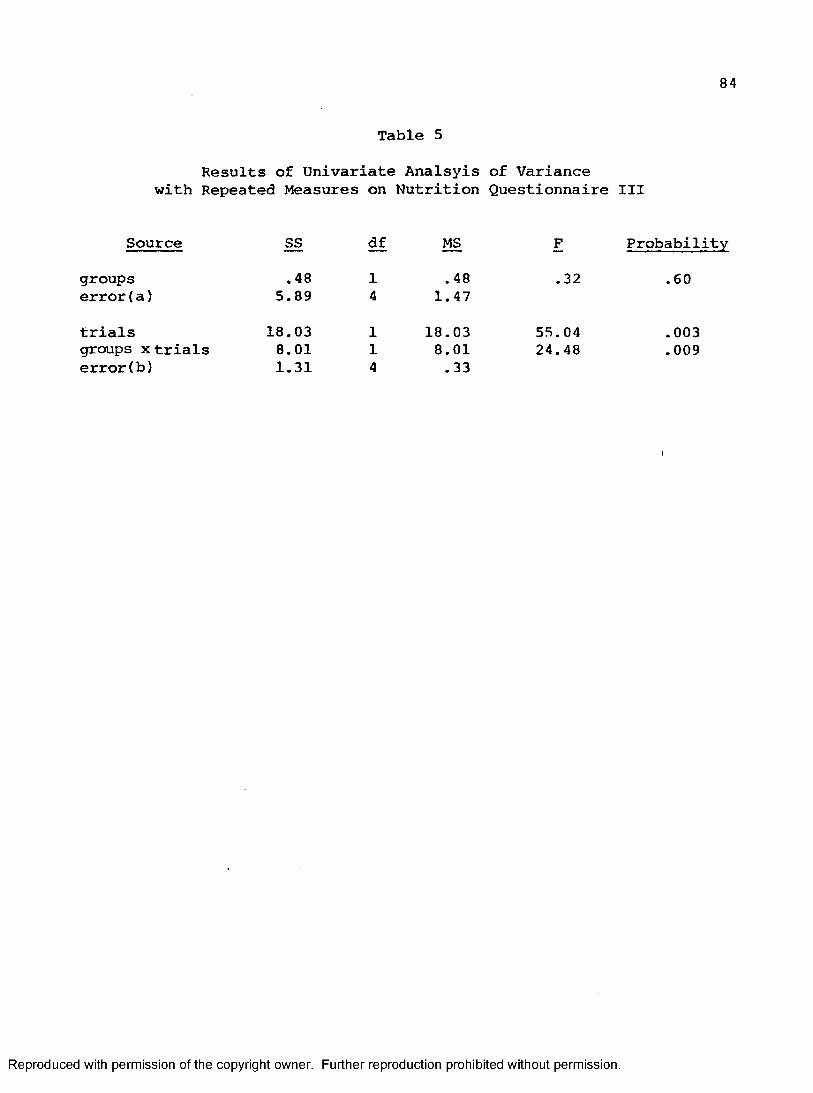
84
Table 5Results of Univariate Analsyis of Variance
with Repeated Measures on Nutrition Questionnaire III
Source SS df MS P Probability
groups .48 1 .48 .32 .60error(a) 5.89 4 1.47
trials 18.03 1 18.03 55.04 .003groups X trials 8.01 1 8.01 24.48 .009error(b) 1.31 4 .33
Reproduced with permission of the copyright owner. Further reproduction prohibited without permission.
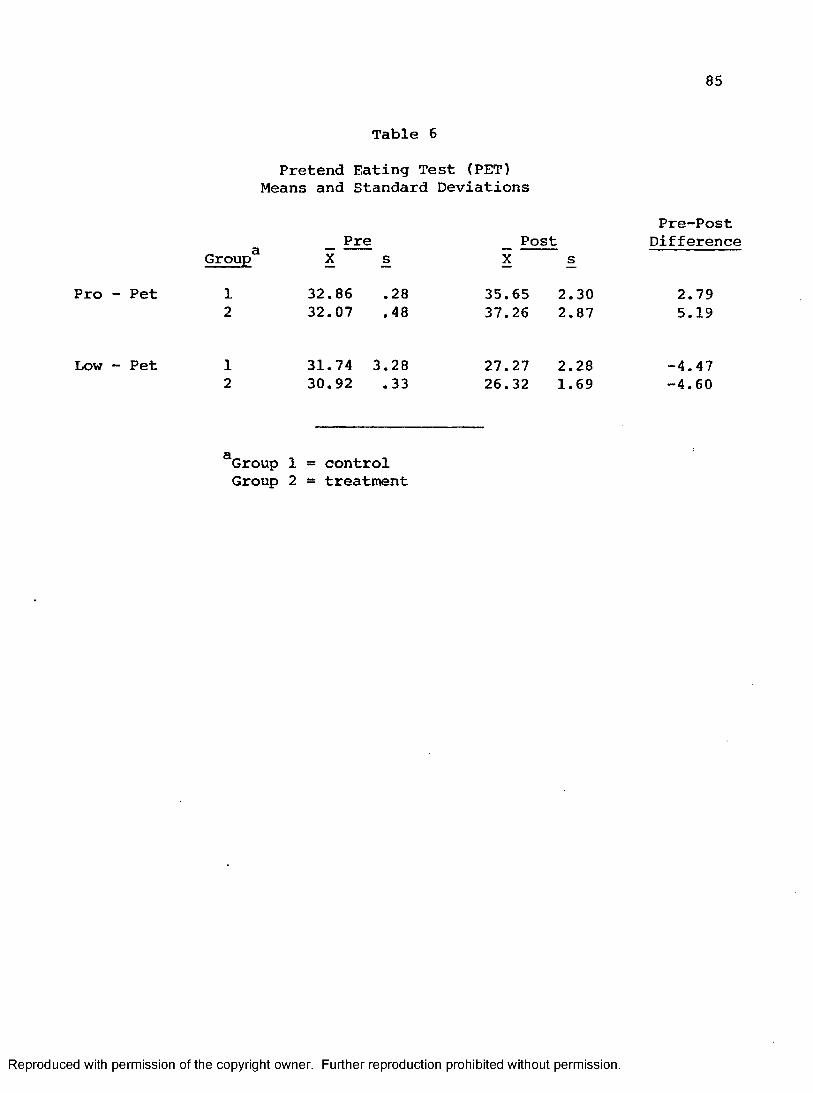
Table 6Pretend Eating Test (PET)
Means and Standard Deviations
GroupPre Post
85
Pre-PostDifference
Pro - Pet 12
32.8632.07
.28
.4835.6537.26
2.302.87
2.795.19
Low - Pet 12
31.74 3.2830.92 .33
27.2726.32
2.281.69
-4.47•4.60
aGroup 1 = control Group 2 = treatment
Reproduced with permission of the copyright owner. Further reproduction prohibited without permission.
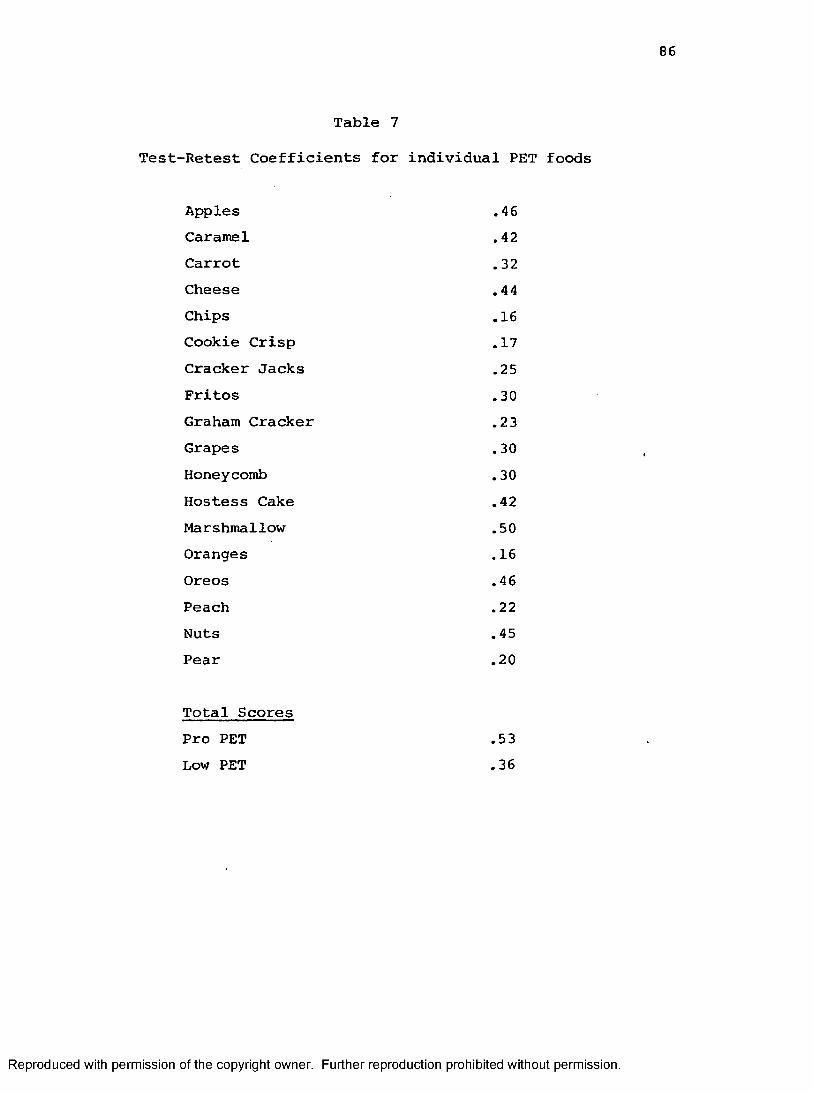
86
Table 7Test-Retest Coefficients for individual PET foods
Apples .46Caramel .42Carrot .32Cheese .44Chips .16Cookie Crisp .17Cracker Jacks .25Fritos .30Graham Cracker .23Grapes . 30Honeycomb .30Hostess Cake .42Marshmallow .50Oranges .16Oreos .46Peach .22Nuts .45Pear .20
Total ScoresPro PET .5 3Low PET .36
Reproduced with permission of the copyright owner. Further reproduction prohibited without permission.

87
Low - Total scores, these data are shown in Table 8. Inspection of the
means indicate that both the treatment and control groups ranked sign
ificantly more pro-nutrition foods higher at posttesting.
Behavioral Measures
Individual Foods
Means and standard deviations for grams of individual foods consumed
on the BET are listed in Table 9. The caloric conversions of these statistics are listed in Table 10. It is important to remember that the means listed represent an average of the three class means for each
group, thus the standard deviations are based on these three data points also. As a consequence, the standard deviations appear much lower than
those reported on the BET in past studies (Beattie, .1981 ; Bridgwater,1981 ; Fox, et al., 1980; McLellarn, 1981 ; Peterson, et al., 1981).
For comparison, the means and standard deviations on the individual case data are given in Appendix H.
Previous studies using the BET, while not entirely consistent, have found that the child's height and weight correlate significantly with consumption and have consequently been employed as covariates in the data
analyses (Fox et al., 1980; Jeffrey et al., 1980, Lemmitzer et al. 1979; McLellarn, 1981 ). Several additional variables were also hypothesized
by McLellarn to influence consumption. In the interest of consistency with
that study, data were collected on temperature at pre - and post - test and
time (estimated in quarter hour incriments) since the subject's last meal.
Also, it has been established in previous studies that the pattern of con
sumption varies for males and females (Fox et al., 1980; Mclellarn, 1981 )
Reproduced with permission of the copyright owner. Further reproduction prohibited without permission.

88
Table 8Results of Univariate Analyses of Variance
with Repeated Measures on the Pretend Eating Test (PET)
Pro-PET Total ScoresSource SS df ms F Probability
group s .50 1 .50 .17 .69error(a) 11.66 4 2.91trials 47.68 1 47.68 14.73 0.01groups X trials 4.32 1 4.32 1.33 0.31error (b) 12.94 4 3.23
Low--PET Total ScoresSource SS ÊÈ ms F Probability
group 2.37 1 2.37 0.71 0.55error(a) 13.33 4 3.33
trials 61.79 1 61.79 10.06 0. 03groups X trials 0.01 1 0.01 0.00 0.96error(b ) 24.56 4 6.14
Reproduced with permission of the copyright owner. Further reproduction prohibited without permission.

Table 9Individual Foods
Means and Standard Deviations (Grams)
89
GroupPre
sdPost
sd
Pre-PostDifference
Apples 1 25.60 3.52 28.10 6.20 2.502 22.61 9.01 29.04 6.63 6.43
Grapes 1 49.11 9.19 42.47 6.84 —6.642 51.86 14.79 54.21 17.55 2.35
Gr. Crackers 1 4.90 .73 5.12 1.75 0.222 5,31 .53 4.03 1.59 -1.28
Marshmallows 1 11.28 1.39 10.99 2.33 -0.292 9.22 1.33 9.13 3.31 -0.09
Cracker Jacks 1 6.59 4.07 5.44 2.20 -1.152 5.51 1.67 4.09 .16 -1.42
Fritos 1 9.57 2.63 10.44 3.41 0.872 8.69 .44 9.15 2.42 0.46
Group 1 = control Group 2 = treatment
Reproduced with permission of the copyright owner. Further reproduction prohibited without permission.

Table 10Individual Foods
Means and Standard Deviations (calories)
90
Pre PostPre-Post
DifferenceGroupé X sd X sd
Apples 1 14.07 .87 16.30 3.60 2.232 13.11 5.22 16.85 3.85 3.74
Grapes 1 29.47 5.51 25.48 4.11 -3.992 31.12 8.87 32.53 10.53 1.41
Gr. Crackers 1 15.96 2.40 16.64 5.67 0.682 17.27 1.71 13.11 5.19 -4.16
Marshmallows 1 37.67 4.63 36.88 7.55 -0.792 30.83 4.42 39.49 11.04 -0.34
Cracker Jacks 1 27.42 16.94 22.61 9.16 -4.812 22.93 6.93 17.01 .67 -5.92
Fritos 1 52.65 14.44 57.38 18.73 4.732 47.82 2.43 50.32 13.28 2.50
Group 1 = control Group 2 = treatment
Reproduced with permission of the copyright owner. Further reproduction prohibited without permission.

91
However, it was not the purpose of the present study to make differential
statements regarding the child's gender; therefore the effects of the var
iable were removed by using the subject's sex as a covariate.
A correlation analysis was performed on all of the above variables
with individual food scores on the BET to determine which, if any, of the potential covariates were significantly related to amount of food com-
sumed. The results of the analysis are presented in Table 11. Overall,
height, weight and temperature at posttesting appear to be most consistently related to individual food consumption, although, by no means is
there a perfect relationship among any of the covariates and the individual food scores. Height appears to be related to the consumption of apples and Fritos, as does weight. Temperature at posttesting exhibited the most consistently significant relationship, as it appeared to correlate highly with apples, grapes, Fritos and marshmallows. In order to remove the effects of these variables on individual food consumption, an analysis of covariance was performed on each food which showed a significant correlation to one or more of the covariates. These analyses were performed on the class means on a DEC - 20 computer system using the Bio-Medical
Data Program (BMDP) repeated measures analysis of covariance (Program
2V) which estimated the specific probability values (Searle. Speed, &
Henderson, 1981, pp. 16-33).The most recent.studies using the BET methodology (Bridgwater, 1981;
McLellarn, 1981; and Peterson et al., 1981) have examined the data for out
lying values (defined as any score which was + three standard deviations beyond the mean for a particular food) and have eliminated those data from the analysis in an attempt to get a more accurate picture of those results.
Reproduced with permission of the copyright owner. Further reproduction prohibited without permission.
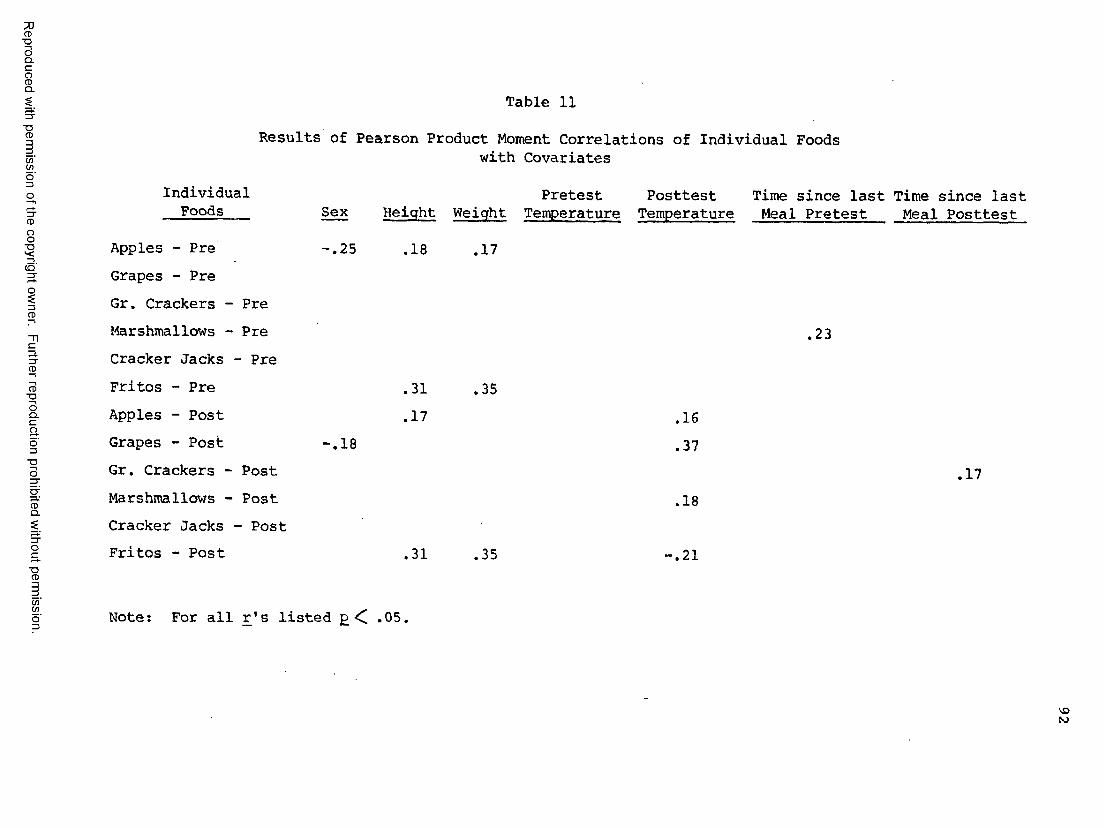
CD■aoQ.cgQ.
■ DCD
C/)C/)
8(O'
3.3"CD
CD" OOQ.O3" OOCDQ.
"OCD
Table 11Results of Pearson Product Moment Correlations of Individual Foods
with CovariatesIndividualFoods
Apples - Pre Grapes - Pre Gr. Crackers - Pre Marshmallows - Pre Cracker Jacks - Pre Fritos - Pre Apples - Post Grapes - Post Gr. Crackers - Post Marshmallows - Post Cracker Jacks - Post Fritos - Post
Sex Height Weight
- ,25 .18
,31,17
-.18
31
PretestTemperature
PosttestTemperature
Time since last Time since last Meal Pretest Meal Posttest
.17
.23
,35
.35
.16
.37
.18
.21
.17
C/)C/) Note: For all r's listed p .05.
NJ
93
However, this procedure is not as appropriate here, given that the unit
of analyses is the class mean, rather than individual case score. It is
interesting to note, however, that upon examination of the individual
case data, very few outliers were detected (5 at pretest and 4 at posttest). This is consistent with the results found by Bridgwater (1981)
with the revised BET methodology and with the fact that class means comprised the dependent measures.
Analyses of individual foods. Repeated measures analysis of variance
and covariance were conducted on each food. No meaningfully significant
treatment x trials interactions were obtained on any of these analyses (all £ > .05). There were, however, significant main effects for trials
for apples with the effects of covariates removed (see Table 12), indicating that both the treatment and control groups ate more apples at posttest.A trend in the direction of a groups-by trials interaction was detected for grapes (see Table 13). Inspection of the group means indicates there was a tendency for the treatment group to eat more grapes at posttest than the control group, however, this failed to achieve significance at
the .05 level.Total Score Variables
Total score variables means and standard deviations (both calories and grams consumed) are listed in Table 14. A procedure indentical to that used on the individual food scores to determine the relationships to the
covariates was used on the Total Score Variables. Table 15 lists the results of the correlational analysis of the secondary variables and the
Total Scores. The child's sex appeared to be most significantly related to the Total Score Variables, with r's greater than the .05 probability
Reproduced with permission of the copyright owner. Further reproduction prohibited without permission.

94
Table 12Results of Univariate Analysis of Variance
with Repeated Measures on Apples
Without CovariatesSource SS MS F Probability
group s 3.16 1 3.16 .04 .83error(a ) 287.09 4 71.77trials 59.85 1 59.85 3.69 .12groups:x trials 11.60 1 11.60 .72 .55error(b) 64.84 4 16.21
With Covariate: Sex
Source SS M MS F Probability
groups 2.64 1 2.64 .06 .82first covariate 159.74 1 159.74 3.68 .15error (a ) 130.12 3 43.37
trials 79.10 1 79.10 7.52 .05groups X trials 5.08 1 5.08 .48 .53error (b) 42.09 4 10.52
With Covariate : Height
Source SS MS F Probability
groups 30.44 1 30.44 .85 .42first covariate 182.45 1 182.45 5.10 .11error (a) 107.41 3 35.80
trials 79.10 1 79.10 7.52 .05groups X trials 5.08 1 5.08 .48 .53error (b) 42.07 4 10.52
Reproduced with permission of the copyright owner. Further reproduction prohibited without permission.

Table 12 (continued)
95
With Covariate: Weight
Source SS MS F Probability
groups 23.38 1 23.38 .47 .54first covariate 140.78 1 140.78 2.83 .19error(a ) 149.08 3 49.69
trials 79.10 1 79.10 7.52 .05groups Xtrials 5.08 1 5.08 .48 .53error (b) 42.09 4 10.52
Reproduced with permission of the copyright owner. Further reproduction prohibited without permission.
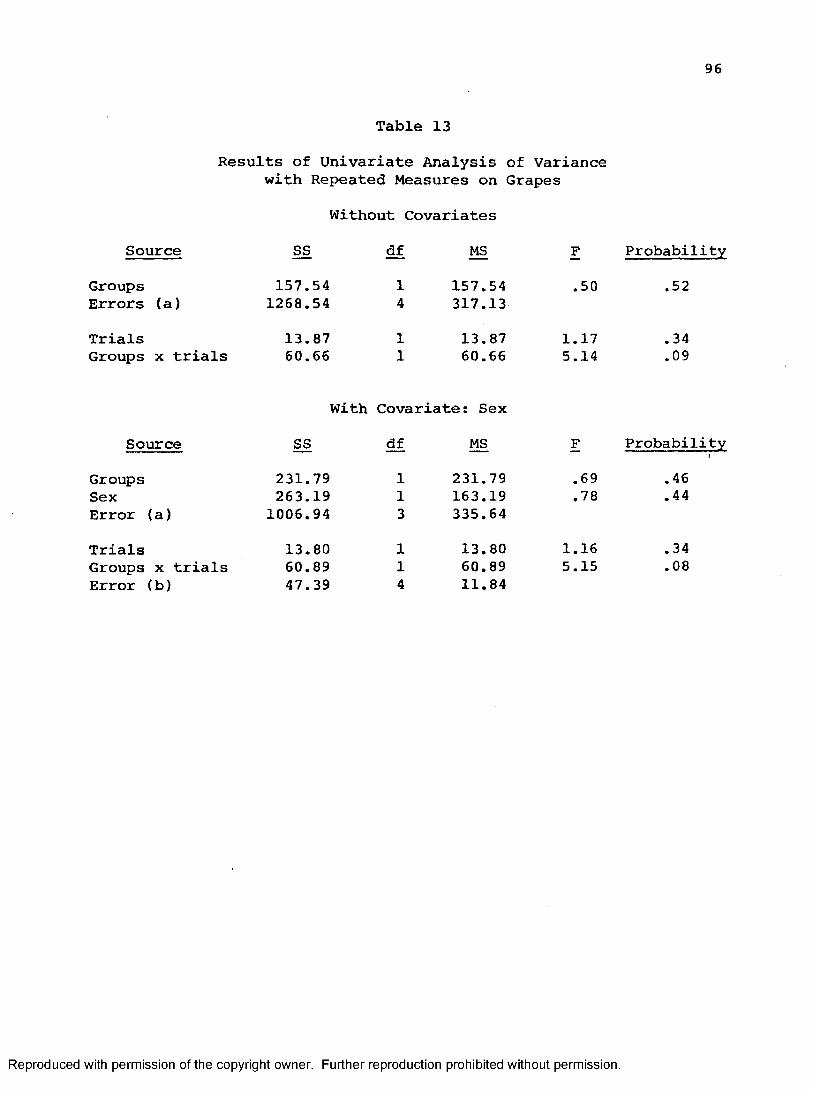
Table 13Results of Univariate Analysis of Variance
with Repeated Measures on Grapes
Without Covariates
96
Source SS MS F Probability
Groups 157.54 1 157.54 .50 ,52Errors (a) 1268.54 4 317.13Trials 13.87 1 13.87 1.17 .34Groups X trials 60.66 1 60.66 5.14 .09
With Covariate: Sex
Source SS MS F Probability
Groups 231.79 1 231.79 .69 .46Sex 263.19 1 163.19 .78 .44Error (a) 1006.94 3 335.64
Trials 13.80 1 13.80 1.16 .34Groups X trials 60.89 1 60.89 5.15 .08Error (b ) 47.39 4 11.84
Reproduced with permission of the copyright owner. Further reproduction prohibited without permission.
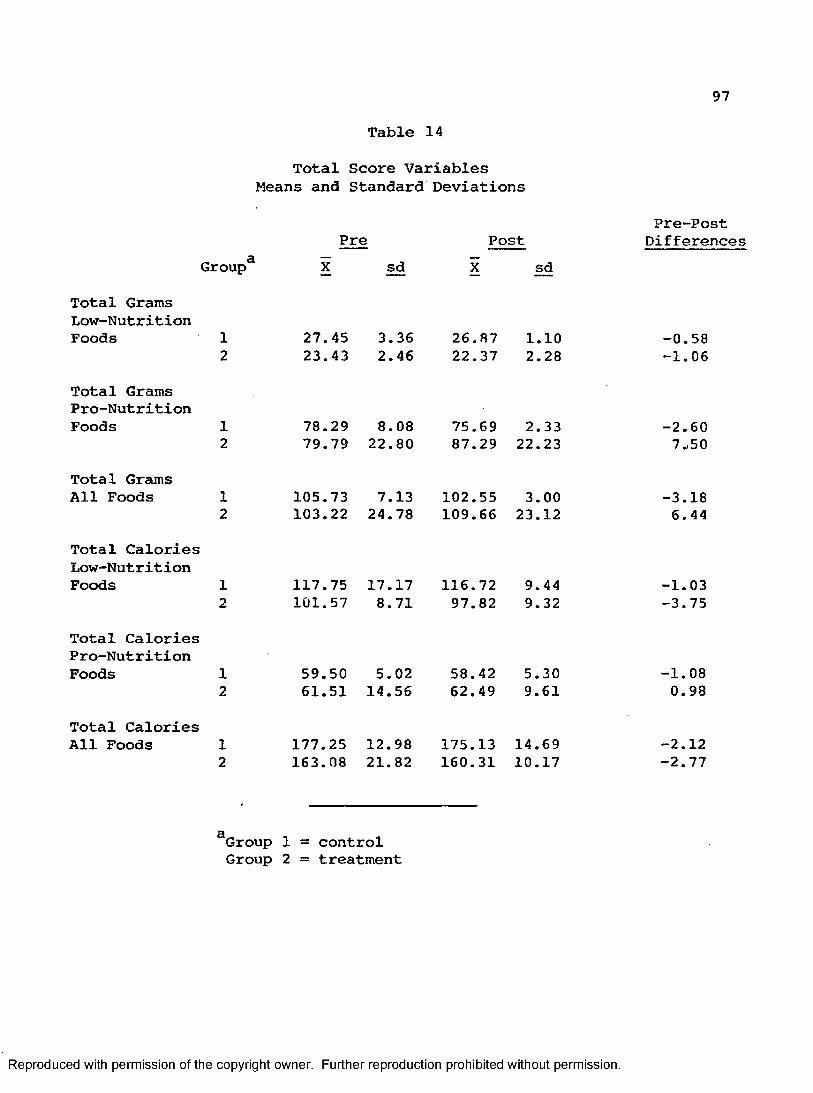
Table 14Total Score Variables
Means and Standard Deviations
97
GroupPre
X sdPost
sd
Pre-PostDifferences
Total GramsLow-NutritionFoods 1
227.45 3.36 26.A7 1.1023.43 2.46 22.37 2.28
•0.58■1.06
Total GramsPro-NutritionFoods 1
278.29 8.08 75.69 2.3379.79 22.80 87.29 22.23
-2.607.50
Total Grams All Foods 1
2105.73 7.13 102.55 3.00103.22 24.78 109.66 23.12
-3.18 6. 44
Total CaloriesLow-NutritionFoods 1
2117.75 17.17 116.72 9.44101.57 8.71 97.82 9.32
•1.03-3.75
Total CaloriesPro-NutritionFoods 1
259.50 5.02 58.42 5.3061.51 14.56 62.49 9.61
-1.080.98
Total Calories Ail Foods 1
2177.25 12.98 175.13 14.69163.08 21.82 160.31 10.17
-2.12■2.77
Group 1 = control Group 2 = treatment
Reproduced with permission of the copyright owner. Further reproduction prohibited without permission.
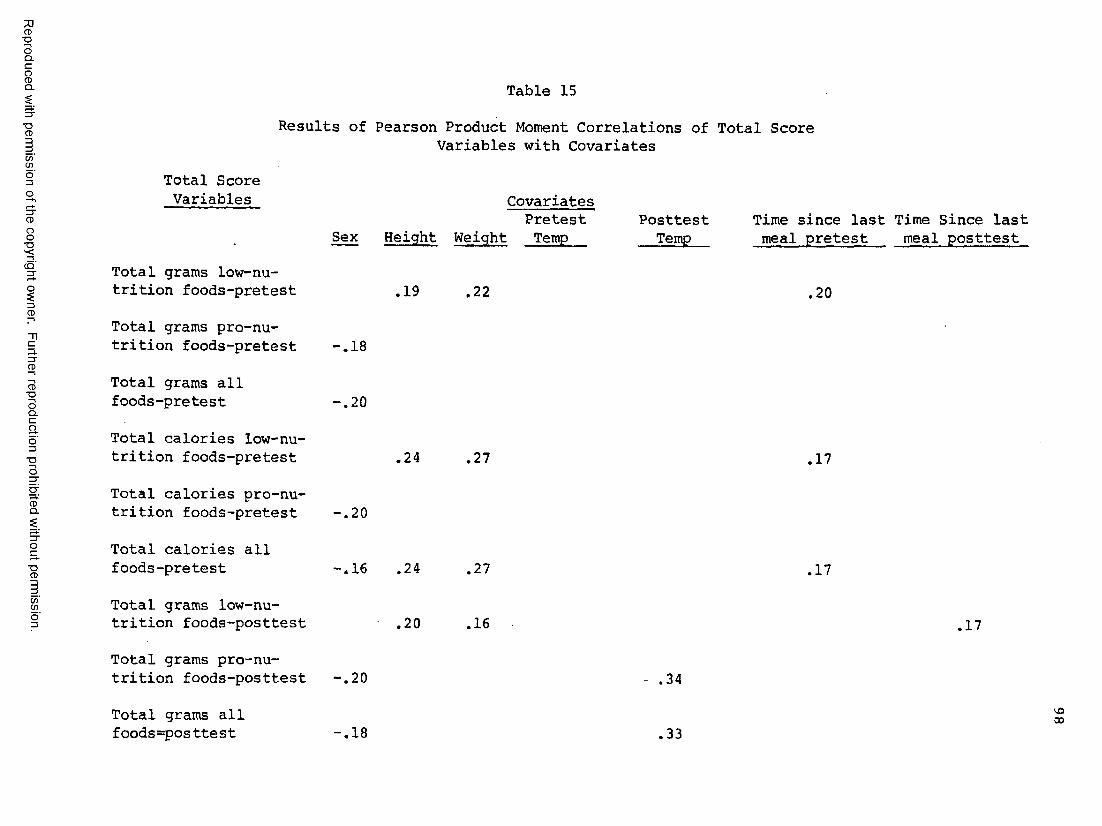
■DOD.CgQ. Table 15■D(D(/)C/)
83(O'
Results of Pearson Product Moment Correlations of Total ScoreVariables with Covariates
Total Score Variables
Total grams low-nutrition foods-pretest
CovariatesPretest Posttest
Sex Height Weight Temp Temp
.19 . 22
Time since last Time Since last meal pretest meal posttest
.20
33"CD
CD"OOQ.Cao3" Oo
CDQ.
Total grams pro-nutrition foods-pretest -.18
Total grams all foods-pretest -,20
Total calories low-nutrition foods-pretest
Total calories pro-nutrition foods-pretest -.20
,24 .27 .17
■DCDTotal calories all foods-pretest -.16 .24 .27 .17
C/)cn Total grams low-nu- trition foods-posttest .20 .16 .17Total grams pro-nutrition foods-posttest . 20 .34
Total grams all foods=posttest
VOGO-.18 .33

7)CD"OOQ.C
gQ.
"OCDC/)C/)
CD
3.3"CD
CD■DOQ.CaO3"OOCDQ.
■DCDC/)C/)
Table 15 (continued)Total ScoreVariables Covariates
Pretest Posttest Time since last Time since lastSex Height Weight Temp Temp meal pretest meal posttest
g Total calories low-nu-trition foods-posttest .24 .22 .15
Total calories pro-nutrition foods-posttest -.15 .24
Total calories allfoods-posttest ,23 .21 .19
Note; For all r's listed £ < .05.
V D

100
level on four of the six total score variables. Height and weight were related to exactly the same three (of six) total score variables. Tem
perature at posttest only again seemed to evidence a relationship with
three of the total scores. And, finally, the amount of time since the subject's last meal is seen to have a more consistent relationship with
total score variables than individual food scores.
Analysis of total score variables. Again, repeated measures analysis of variance and covariance were performed on all of the total score var
iables. No significant effects were obtained on any of these analyses (all £'s > .05).
A closer examination of the individual food scores which were summed to form the total score raised some question about whether or not graham crackers could legitimately be included as a pro-nutrition food. The mean score for graham crackers on the NQI (for all subjects at pretest) was .50 which is well below the average score for all foods on this measure which equaled .87 (range = .45 to 1.00), This indicates that the children were more confused about the status of graham crackers as a healthy or unhealthy food than they were about most of the other foods. Consequently, a separate analysis was performed on the Total Pro-Nutrition food scores (grams and calories) with graham crackers removed. Means and standard deviations are given in Table 16. A pretest - posttest repeated measures
analysis of variance was conducted on these scores, which is given in
Table 17. The same analysis which was conducted on the Total Pro-Nutrition
foods scores with graham crackers left in is also listed on Table 18 for conparison. Although significant effects were not obtained, it is clear
Reproduced with permission of the copyright owner. Further reproduction prohibited without permission.
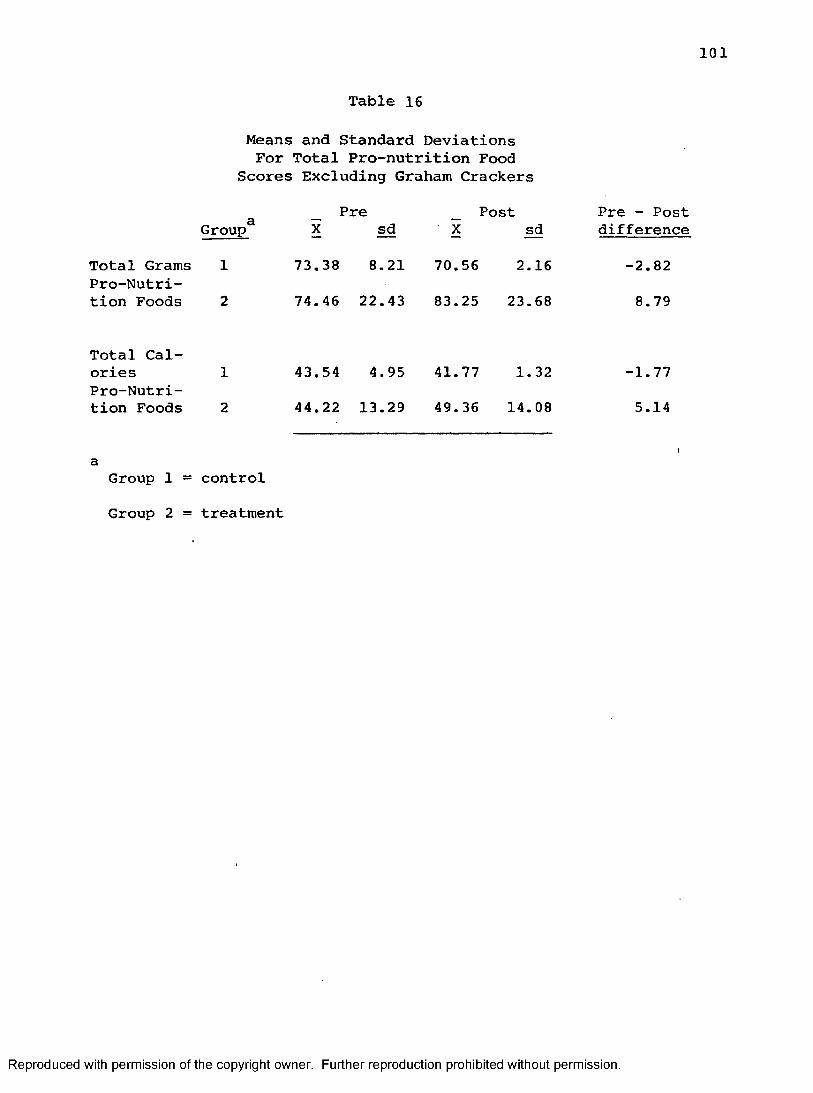
Table 16
101
Means and Standard Deviations For Total Pro-nutrition Food
Scores Excluding Graham Crackers
Pre Post Pre - PostGroup X sd X sd difference
Total Grams 1 73.38 8.21 70.56 2.16 -2.82Pro-Nutri- tion Foods 2 74.46 22.43 83.25 23.68 8.79
Total Calories 1 43.54 4,95 41.77 1.32 -1.77Pro-Nutri- tion Foods 2 44.22 13.29 49.36 14.08 5.14
Group 1 = control Group 2 = treatment
Reproduced with permission of the copyright owner. Further reproduction prohibited without permission.

102
Table 17
Analysis of Variance with RepeatedMeasures on Total Pro-Nutrition Food Scores
Without Graham CrackersGrams
Source SS §f MS F ProbabilityGroup 142.28 1 142.28 .26 .64Error 2190.13 4 547.53Trials 26.76 1 26.76 1.30 .32Group X trials 100.92 1 100.92 4.91 .09Error 82.08 4 20.52
CaloriesSource SS MS F Probability
Group 51.38 1 51.38 .26 .64Error 773.79 4 193.45
Trials 8.55 1 8.55 1.19 -34Group X trials 35.74 1 35.74 4.98 .09Error 28.65 4 7.16
With Graham Crackers
GramsSource SS df F Probability
Group 128.58 1 128.58 .25 .65Error 590.75 4 515.66
Trials 18.01 1 18.01 .67 .54Group X trials 76.61 1 76.61 2.85 .17Error 107.50 4 26.87
• CaloriesSource SS df MS F Probability
Group 27.63 1 27.63 .19 .69Error 590.75 4 31.08
Reproduced with permission of the copyright owner. Further reproduction prohibited without permission.

103
Table 17 (continued)Source SS df MS F Probability
Trials .007 1 .007 ,00 .99Group X trials 3.172 1 3.172 .10 .76Error 124.301 4 124,301
Reproduced with permission of the copyright owner. Further reproduction prohibited without permission.

104
that there is a trend in the direction of a treatment-by-trials interaction, indicating that there was a general tendency for the children in the treat
ment group to consume more of the pro-nutrition foods (excluding graham crackers) at posttesting then the children in the control group.
Analysis of BET Test-Retest Correlations
Test-retest correlation coefficients were calculated on all of the individual foods and total score variables on the BET as an indication of
the stability of the measure. Results of this analysis are listed in Table 19. Test-retest coefficients for the individual foods range from .45 to
.67 with a mean of .57, mean total score r = .57. Coefficient alpha, com
puted on the Total Grams score was .09, alpha for the Total Grams Pro score equaled .14 and on the Total Grams Low score, alpha was .07.
This stability of a measure is frequently influenced by the amount of time between pretest and posttest. Although attempts were made to conduct posttesting in as brief a period as possible, due to practical limitations there turned out to be differences among the classes in terms of the number of days between pretest and posttest. Therefore, stability coefficients are provided for the BET variables on each class separately (see Tabel 18), along with the number of days' latency between pretest and posttest. It is interesting to note that, as would be predicted, there is a fairly con
sistent relationship in terms of the longer the latency period, the lower the test-retest coefficient on this measure.
Correlation Between BET and PET In an effort to assess the relationship between the subjects' stated
preferences on the PET and their actual food consumption on the BET, a correlational analysis was performed on these measures. Table 19 displays
Reproduced with permission of the copyright owner. Further reproduction prohibited without permission.
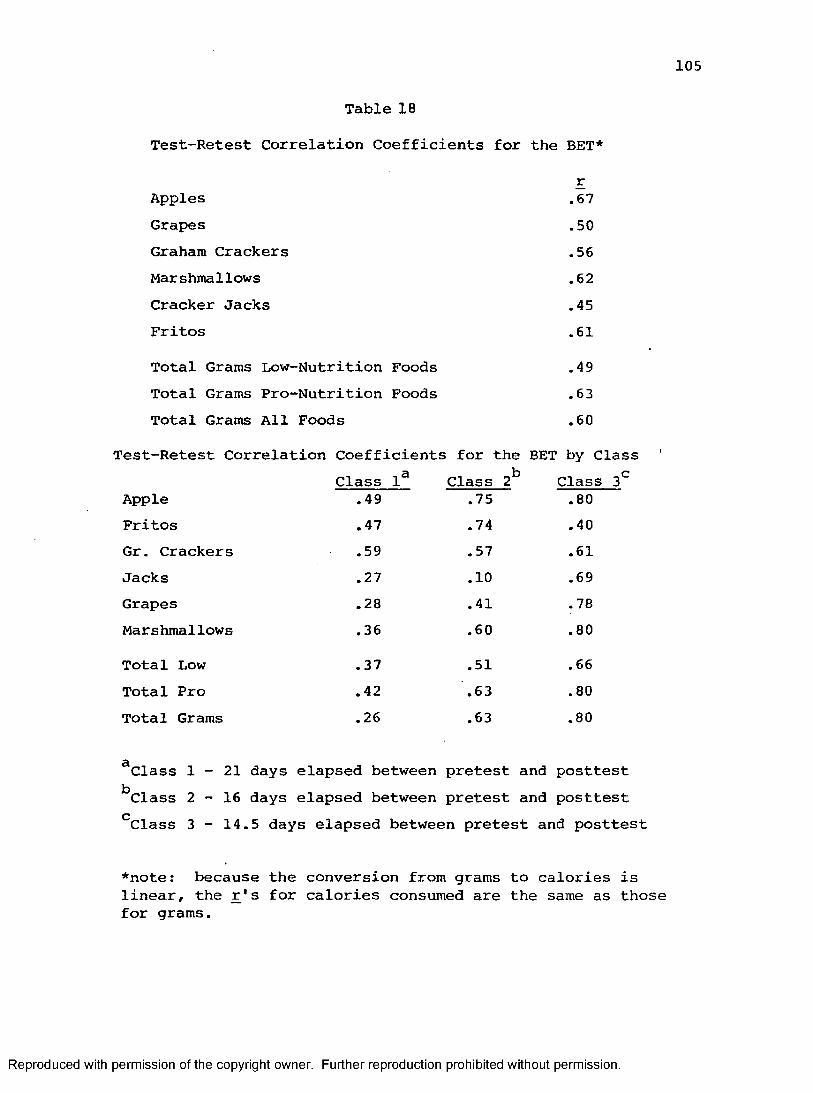
105
Table 18
Test-Retest Correlation Coefficients for the BET*
Applesr.67
Grapes .50Graham Crackers .56Marshmallows .62Cracker Jacks .45Fritos .61Total Grams Low--Nutrition Foods .49Total Grams Pro--Nutrition Foods .63Total Grams All Foods .60
Test-Retest Correlation Coefficients for the BET by Class
AppleClass 1^
.49Class 2^
.75Class 3^ .80
Fritos .47 .74 .40Gr. Crackers .59 .57 .61Jacks .27 .10 .69Grapes .28 .41 .78Marshmallows .36 .60 .80Total Low .37 .51 .66Total Pro .42 .63 .80Total Grams .26 .63 .80
^Class 1 - 2 1 days elapsed between pretest and posttest *^Class 2 - 1 6 days elapsed between pretest and posttest Class 3 - 14.5 days elapsed between pretest and posttest
*note: because the conversion from grams to calories is linear, the r's for calories consumed are the same as those for grams.
Reproduced with permission of the copyright owner. Further reproduction prohibited without permission.
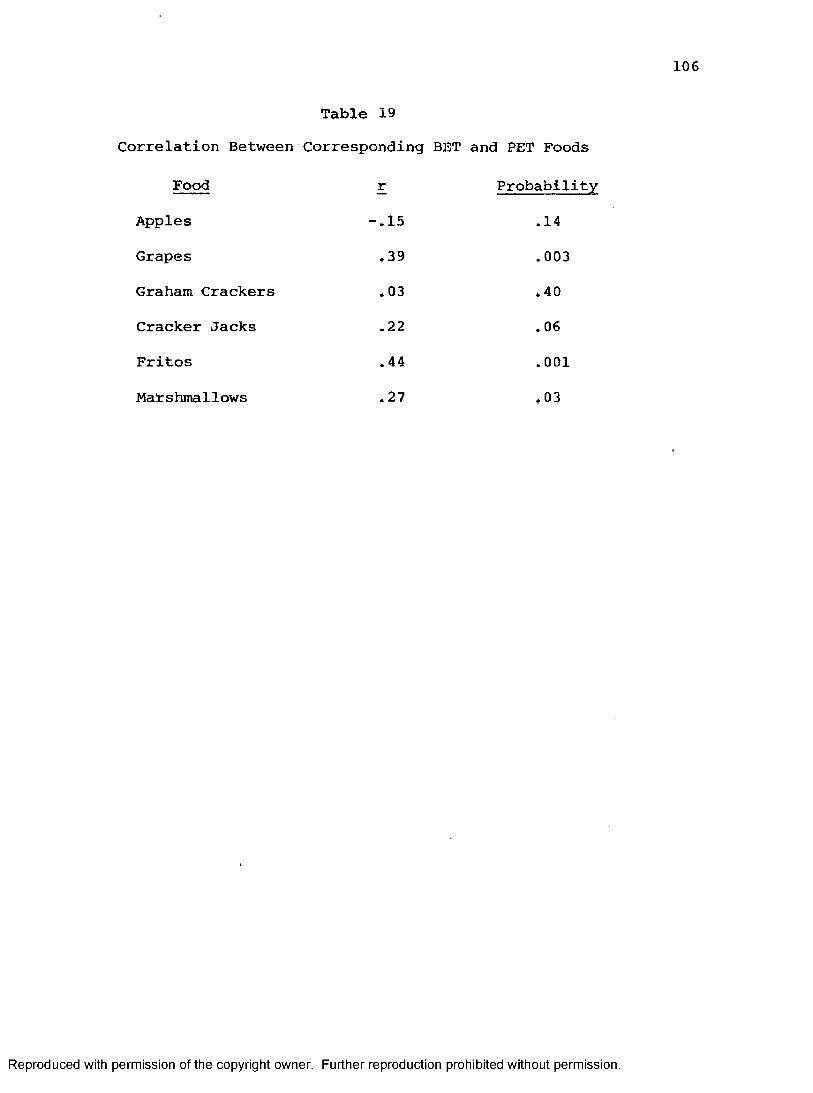
106
Table 19Correlation Between Corresponding BET and PET Foods
Food r Probability
Apples -.15 .14
Grapes .39 .003Graham Crackers .03 .40Cracker Jacks .22 .06Fritos .44 .001
Marshmallows .27 ,03
Reproduced with permission of the copyright owner. Further reproduction prohibited without permission.

107
the obtained r's on pretent data; Fritos, grapes and marshmallows show
significant positive correlations, however, apples. Cracker Jacks and
graham crackers do not. It is apparent that there is not a strong or
consistent relationship between these two measures.
Reproduced with permission of the copyright owner. Further reproduction prohibited without permission.
Chapter IV
DISCUSSION
The purpose of the present study was threefold. First, it was an
attempt to derive and empirically test a set of hypotheses regarding
the effects of pro-nutrition television programming on young children's eating habits. These hypotheses were based on a specific theoretical conceptualization which is presented as a "heirarchy of effects" model.Second, the present investigation was an extension of the Peterson et al. stu
dy; (1981) the methodological changes incorporated were specifically designed to address some of the weaknesses and areas of counfound therein. Finally, the study was designed to address the issue of social-policy and the need to develop remedial measures which would be effective in countering the . effects of low-nutrition food advertising on young children. Thus, the
results of the present experiment will be discussed with regard to theo
retical implications, methodological issues and inplications regarding
social policy.The children in the treatment condition attended to the program
ming at a very high rate, readily recalled the programs and advertise
ments and, more importantly, learned the nutrition information which was presented in the treatment package. However, the children did not show changes in preference which could be attributed to the treatment tapes; nor did they show any significant changes on any of the variables measuring consumption. Taken as a whole, these results
Reproduced with permission of the copyright owner. Further reproduction prohibited without permission.
109appear to offer support for the hierarchy of effects model. This model predicts that there are essentially four distinct levels upon which
televised food messages can exert an effect, Fruthermore, the levels
are ordered hierachically relative to the number of components which in
teract and by their degree of complexity. The lower levels are the less
complex and would be most easily affected by the pro-nutrition programming;
as the hierachy ascerds, however, a greater number of additional factors
may have an influence, aside from the programming alone.
More specifically, at the lowest level is the mere recall of the
program or ad. This is the level where television would be most likely
to have its initial effect because it is the least complex. In terms of the model, recall may be affected by amount of attention to a stimulus, the number of times the stimulus is observed and the individual's ability to retain the observation in memory. Yussen (1974) showed that children's recall of a visually demonstrated behavior is highly correlated with their visual attention to it. This finding was extended to television by Hayes Sr Birnbaum (1980) who found that the visual stimulus of television was attended to more highly than the auditory stimulus and accounted for more of the information which preschool age children were able to recall.Thus, the high levels of attention to the programming which were exhibited
by the children in the present study would explain their ability to recall
the content of the treatment tapes.
Recall is also affected by the number of repetitions of a stimulus.
In general, the more times a child views a modeled event the better the
recall of the event, up to the point of satiation where further repetition
Reproduced with permission of the copyright owner. Further reproduction prohibited without permission.
110
will no longer enhance learning, then recall will begin to level off or
decline. In the area of TV advertising this phenomenon has been dis
cussed as the inverted "U” pattern (Greenberg and Suttoni, 1973; Krugman,
1972). In the present study, the children recalled those commercials
which were seen most frequently and also had better recollection of the
characters and episodes of programs which were included as a series
(Mulligan Stew & Sesame Street). This finding tends to offer
support for the use of repetition in airing pro-nutrition programming,
although no attempts were made to directly measure the effects of repetition in the current study.
It appears, then, that the recall the children exhibited in the study was largely due to their high levies of attention to the programs and the number of times the tapes were shown. These findings suggest that for televised pro-nutrition programming to have an equal
effect, it must be shown at a time when children will be likely to see
it (attention) and aired frequently to enhance recall.Measurement of the child’s recall of the television programming in
the present study employed an open - ended questionnaire, which was
typical of those used by other researchers (Robertson & Rossiter, 1974;
Ward et al., 1977) but was not without its problems in administration
and scoring. The measure focused on verbal memory in a free-recall
situation. The issue of how best to measure retrieval of information
from memory deserves more attention than previous research on adver
tising and children has acknowledged. In particular, attention should
be paid to the distinction between recall and recognition.
Reproduced with permission of the copyright owner. Further reproduction prohibited without permission.

Ill
Wartella (1981) stresses that recall memory and recognition memory place
different task demands on the subject for actively accessing and retriev
ing information. Thus, to accurately assess a young child's optimal
performance in remenüsering the content of television programming it is
very important to use measures that tap more than just free-recall. Re
cognition measures should be included to avoid the risk of underestimating
young children's retentional abilities.
The second level in the hierarchy of effects model involves learning or the actual processing and assimilation of information. Learning is
more complex than simply recalling what was seen. In examining how children represent and process information, it is necessary to draw a distinction between two types of memory which Brown (1975) labels episodic memory, or the memory of a specific event which occured at a specific place and time, and semantic memory, or the accumulation of acquired knowledge about the
world. Episodic memory involves memory for directly experienced occurences, i.e. the actual input or verbatim recollection of experience and
discrete perceptual events. Thus episodic memory is, in essence, ver
batim recall and is limited, in this case, to remembering the basic elements of the television programming. On the other hand. Brown (1975)
notes that sematic memory involves assessing "meaningful systems of units"
which have undergone the cognitive processes of integration and assimi
lation beyond that experienced in episodic memory (recall). Semantic memory is a constructive process which is more holistic and accounts for
the degree to which the substantive aspects of the television program
are recognized and retained, i.e. learned. Learning, therefore, includes
recall as an essential component (thereby including the components of
Reproduced with permission of the copyright owner. Further reproduction prohibited without permission.
112
attention, retention and retrieval which function in recall), but goes
beyond recall in that it necessitiates integrative and constructive
cognitive operations. As such, learning represents a more complex re
sponse than recall and is therefore assumed to be one step up in terms of the hierarchy.
The children in the present study showed strong effects of learning the pro-nutrition constructs as they were presented in the treatment tapes as measured by Nutrition Questionnaire III, and also indications that they aquired more general and broad nutrition concepts which was evident in the individual case analysis on Nutrition Questionnaire II, This is a very positive finding, especially when one considers that learning occured as a result of passively viewing the programs. No efforts were made on the part of the researchers or teachers to enhance the concepts which were presented in the tapes. Although previous research has shown that children can acquire information from television (Lesser, 1974) and from graphics presented on a television format (Feshbach, Jordan & Dillman, 1976), this finding speaks positively to the use of this medium for teach
ing pro-nutritional concepts specifically.The above finding contradicts the results obtained by Peterson et al.
(1981) who failed to find effects on the information measure they employed.
The most likely explanation for this difference is the extension of the treatment phase in the present investigation from 5 days to 10 days. Further research which is designed to more directly determine the optimal
length of presentation is necessary. Also, the eruption of the Mt. Saint Helens volcano caused nine days latency between treatment and posttesting
Reproduced with permission of the copyright owner. Further reproduction prohibited without permission.
113
in their study,which the authors proposed as a possible explanation for
their failure to obtain significant results. It is clear from the pre
sent study that the latency between treatment and posttesting can have
an effect on how much the children remember. This can be seen by looking
at the total recall score means for each class and the days latency toposttesting on Table 2 in the Results section; there was à general de
cline in recall the longer the latency. Follow up measures must be included to explore the effects of latency and to establish how long the children will retain the information they have learned.
Another avenue of research which could be extended from the above finding would be to investigate methods which would enhance the abilities of the children to learn pro-nutritional concepts from TV. Feshbach (1980) has developed a curriculum which teaches children to be better con
sumers of television advertising; perhaps a similar effort could be made in the classroom with teachers using available pro-nutrition programming
as a cornerstone of a curriculum on nutrition and health.In regard to methodological issues on the nutrition information
measures, it was noted in the Results section that the high pretest means
for all classes on NQ I imply that the failure to achieve significance onthis measure may have been due to ceiling effects. In other words, child
ren already possessed a very accurate knowledge of the nutritional value of specific foods. This interpretation is supported by a study conducted by Esserman (1981) who found among the children she studied, a very high
knowledge of the nutritional benefits and hazards of various foods such
as candy, milks and fruits. Older children knew somewhat more about the
nutritional benefits and disadvantages of foods than younger children.
Reproduced with permission of the copyright owner. Further reproduction prohibited without permission.

114
but even among the youngest group (5 year olds), the majority knew a
great deal about the nutritive value of specific foods. Because the foods
used in the NQ I were all quite familiar to the children, the measure
lacked adequate discriminability. In order to increase the effectiveness
of this measure, foods which are not as easily defined by young children
into pro- or low-nutrition categories would need to be employed,
A final comment involves the psychometric properties of the nutri
tional information measures in general. The low reliabilities of these
measures indicate that they should be reviewed and revised prior to fu
ture use. In any research endeavor the degree of confidence one places
in the results is dependent in part upon the soundness of the measures.
Revision of the present measures which could increase their reliability and stability would add even greater strength to the present findings.
The last two levels within the heirarchy of effects model which may
be influenced by pro-nutrition programming are the child's specific food
preferences and his or her actual eating behavior- In the initial conceptualization of this model, preference was seen to constitute the third
level because it appears to be more stable and less reactive to momentary influences than behavior. In a broad sense, preference can be defined
as the child's specific likes or dislikes for particular classes or
categories of foods. It involves general attitudes toward foods which
are developed over time as a function of a child's experience with var
ious foods. Because it involves an emotional component (in terms of likes
& dislikes) it is much more complex, idcosyncratic and difficult to in
fluence than nutritional knowledge. What's more, nutritional knowledge may play a part in food preferences, yet is only one of many elements
Reproduced with permission of the copyright owner. Further reproduction prohibited without permission.

115
which comprise preference.Both the control and treatment groups selected significantly more pro
nutrition foods at posttesting on the preference measure in the present
investigation. This creates an unfortunate confound to the interpretation
of the results. Because both groups increased in the desired direction,
the increase cannot be attributed to the effects of the treatment pro
gramming, The most logical explanation of this finding is that something
happened as a result of the testing experience itself which caused the
children to rank pro-nutrition foods higher at posttesting. Support
for this interpretation can be seen when the procedures and order of administration of the measures are carefully scrutinized. The PET was followed, for all children on both trials, by the NQ I, which involved asking the subjects whether or not the individual foods they had just ranked were healthy and nutritious for them to eat. It has previously been pointed out that children at this age already have a clear and accurate understanding of the nutritional qualities of familiar foods. Following the PET with the NQ I most probabily created a "pro-nutrition"
response set for the specific foods on those measures. Thus, there was
a clear demand for the children to select more highly nutritious foods
on the next administration of the PET,
Acccording to Beauchamp & Mailer (1977) food preferences tend to be
relatively stable for a given individual. The general lack of stability
on this measure seems to further support the contention that the measure
may not have been assessing preference, but something else, Birch (1979b) and others have shown that food preference among children is largely a
Reproduced with permission of the copyright owner. Further reproduction prohibited without permission.
116
function of familiarity and salience. Because all of the snack foods
used on the preference measure were quite familiar to the children,
they may not have been making selections based on a real liking for one
food over another, but on the basis of some other dimension. For example, if a child were shown a banana, a cookie and a lollipop and asked to
select which food he or she prefers, it may be possible that all of those foods are liked equally. At that point preference, in an absolute sense, is no longer an issue and a selection will be made based on other criteria. For instance, has the child just eaten? What was eaten? How hungry is the child right now? How fresh is the banana? Is the child's mother present? and so forth. Therefore, it may well be that the children
made selections on the preference measure based on momentary and perhaps arbitrary considerations and not actually based on their true preferences.
The methodological constraints discussed above raise the critical
question as to how food preference can accurately be measured. It seems
important that measurement be conducted over a long period of time, with a large number of foods and repeated assessments so that clear and stable
patterns of likes and dislikes may be established. Also, moving the assessment setting from the laboratory to a more natural environment may
help to deal with some of the demand characteristics which were evident in the present study. Research addressing these methodological issues
is essential before further study of the effects of pro-nutritional television on food preference can be conducted.
The final level to be discussed in the heirarchy of effects model is
consumption. There were no significant effects obtained on any of the
Reproduced with permission of the copyright owner. Further reproduction prohibited without permission.
117
consumption measures in the present study; however, there were indications
of trends in the direction of increased consumption of pro-nutrition foods after viewing the pro-nutrition programming. This can be seen in a groups-
by-trials interaction at the .08 level for grapes and a groups-by-trials interaction at the .09 level for pro-nutrition foods(with graham crackers omitted).
According to the model, actual eating behavior is the most complex and, therefore, the most difficult level to change in a significant and
consistent direction. Consumption incorporates preference, i.e. if an individual dislikes a particular food the chances that that food will be eaten are quite small. However, what i^ eaten at any given point in
time is a function of much more than preference alone. For example,
degree of hunger, kinds of foods which have been eaten recently, availability or access to different foods and even one's awareness of varieties of foods all will have a bearing on what is eaten. Food consumption is a highly variable phenomenon, especially when observed in brief and discrete points in time; and therefore, is positioned at the top of the hier- arachy. Thus, the failure to achieve significant changes on the behavioral measures in the present study offers some confirmation of the ordering
of the hierarachy of effects model.The present study employed a more intensive exposure to pro-nutrition
programming than have previous studies as well as a number of methodological refinements, yet still did not obtain significant behavioral
effects. The children in the treatment group viewed 200 minutes of pro-
nutritional television programming over a period of 10 class days. It
could be expected that they would have seen approximately 330 ads
Reproduced with permission of the copyright owner. Further reproduction prohibited without permission.
118
for low-nutrition foods at home during that same period (Barcus, 1977).
It may be that any effects that the exposure to the pro-nutrition treat
ment tapes might have had were overridden by the subiect's everyday television viewing experiences. Given this massive exposure to low-
nutrition food ads in the children's natural environment and the high degree of variability in eating behavior, the fact that there are clearly
some trends in the direction of increased consumption of pro-nutrition food is a positive finding. The results suggest that the treatment tapes may have had some impact on what the children chose to eat on the Be
havioral Eating Test. It seems that the programming had a slight ten
dency to influence the children to eat an increased amount of pro-nu- trition food, yet not enough to achieve statistical significance., Perhaps
an even longer and more intensive extention of the treatment phase is
necessary to result in a significant impact on the children's actual consumption. Further research is necessary to determine what the optimal
length is; however, one must be aware of the cost/benefit issue in embarking on such research. For example, it would be expensive to conduct a study in which children were exposed to 20 minutes of daily pro-nu- trition programming over a six month period. Yet if such a study were undertaken and positive results were found, it would provide necessary support for the need to increase the frequency of pro-nutrition program
ming aired on commercial television.Most crucial in terms of the current discussion is how the behavioral
results are to be interpreted with respect to the hierarchy of effects model. The results of the current study, when taken as a whole, offer
general support and confirmation of the model. However, given the methodological confound of the preference measure, and the suggested trends
on the behavioral measure, a conclusive statement regarding the position-
Reproduced with permission of the copyright owner. Further reproduction prohibited without permission.
119
ing of these two levels is not possible. Further research designed to test this model, specifically investigating the relationship between pre
ference and consumption, is vital.It is possible that in the long run preference and behaivor converge.
For example, it may be the case that in general a particular individual prefers healthy and nutritious food- If his or her eating behavior was
monitored over a long period of time it could be shown that the majority of foods consumed were pro-nutritional. It follows that if availability of food is not a major limiting factor, food preference and eating be
havior would tend to overlap. Thus, food preferences may be represented behaviorally over the long run. However, on any specific occasion con-
sunption is influenced by much more than attitudes about foods or general
underlying food preferences. This seeming lack of correspondence be
tween preference and behavior in brief or discrete incidents is seen in the correlations obtained between the foods on the BET and the PET in the current study which seem to argue that there is little relationship between what a child says he or she prefers and what is actually eaten at one specific point in time. This is consistant with prior studies which have employed similar methodology {Fox et al.,1980; Jeffrey et al-,1980; Lemnitzer et al., 1979; & McLellarn, 1981). Once again, it must be stres
sed that research which directly addresses the relationship between preference and consumption must be conducted to determine their final positioning within the hierarchy.
The behavioral trends which can be seen in the current study suggest
that the pro-nutritional programming may have had some impact on the child
ren and implies that there is a positive potential in the use of this medium
Reproduced with permission of the copyright owner. Further reproduction prohibited without permission.

120
to develop healthy eating habits in children. In terms of social policy,
the implications are especially important given the current need for remedial measures which can be readily and easily employed. The best
solution to any policy issue is one which is effective in achieving the desired change, yet maintains the rights and freedoms of the individuals involved. Airing an increased number of high quality pro-nutrition programs, PSAs, commercials, etc. is much less controversial and restric
tive than a total or even a partial ban on advertising for children as has been done in some countries (Boddewyn, 1981).
Again, further investigation into the behavioral effects of pro
nutrition programming is required before any conclusive policy recommendations may be offered. In particular^ longitudinal studies exploring
the effects of intense exposure to pro-nutrition television would be of value. Also, follow-up measures were not conducted in the current study. These measures would be essential to assess the strength and duration of any obtained effects and would be critical in the determination of how frequent pro-nutrition material must be aired. However, based on the learning and advertising literature, it is already clear that it will be necessary to show pro-nutrition programs frequently to have any sustained effect.
One important area which has yet to be investigated regarding pro
nutrition programming is the programming itself. The results of the
current study suggest that in order for a real change in preference and behavior to occur the programming must include something more than in
struction in nutritional concepts. In fact, studies have shown that
children can have a high level of cognitive sophistication and a very
Reproduced with permission of the copyright owner. Further reproduction prohibited without permission.

121
accurate idea of the healthful qualities of foods, yet still be influ
enced by television to consume foods which are low in nutritional quality
(Fox et al., 1980; Beattie, 1981). Fox et al. conducted a developmental study and found that both nine-year-old males and four-year-old males
consumed significantly more calories of the low-nutrition foods at posttest (after having viewed low-nutrition advertising) despite the fact that the nine-year-olds were more cognitively developed and had a much greater awareness of a balanced diet. The implication is that knowledge and understanding of nutritional concepts are not sufficient to insure that the child will eat healthy foods. In terms of the nature and quality
of the programming, it seems evident that more than nutritional information must be considered when developing such material. Pro-nutritional televi
sion must be geared to enhance the salience of healthy foods and eating habits as well- It is in this area that scientific research could be
most valuable by investigating the use of psychological principles to make these foods more appealing to young children. Peterson et al.(1981) suggested that perhaps one reason for their failure to achieve results could have been due to the quality of the pro-nutrition programming. It was noted that, in general, the pro-nutrition PSAs and commercials did not appear as sophisticated as most ads for low-nutrition foods. It is very important that all of the advertising tactics that have proven so successful when used to sell low-nutrition foods products also be
employed with pro-nutrition foods.It was previously noted that the current study employed a substantial
number of methodological revisions. In particular a revised BET meth
odology was employed which had been empirically established to be more
Reproduced with permission of the copyright owner. Further reproduction prohibited without permission.

122
psychometrically sound (Bridgwater, 1981); yet even with this revised
BET, no significant results were obtained- It was pointed out in the
results section that the standard deviations reported on the BET var
iables are based on the class mean (i.e. on three data points) and, there
fore, are not comparative with previous studies using the BET. The
standard deviations based on individual cases in the current study (Appendix H) are quite large, indicating there is a great deal of variation in the children's sampling of the foods. Even though the variability has been reduced from previous studies (Fox et al. 1980; Lemnitzer et al.,
1979; McLellarn, 1981; Peterson et al., 1981) using the Bridgwater (1981) methodology, it still remains quite large. Given the substantial revisions which have been made in this measure, the question may be raised
as to whether there exists, at the present time, a feasible and practical way to validly measure consumption. In other words, the variability in
the measures is a problem which confounds accurate interpretation of the
data, yet this may, in fact, be a reflection of reality. That is, children's eating behavior quite variable and is affected by a myriad of factors, television being only one of them. Further methodological research on developing valid consumption measures is important if research
is to progress in this area.In the meantime, it may be necessary to forgo attempts to measure
the effects of television on actual eating behaviors (until such measures are developed and tested). Perhaps more emphasis should be paid to the
delineation of the relationships among the various components (in terms
of the hierarchy of effects model) which interact to determine consump
tive behavior. Smaller, more discrete and specific studies focusing on one aspect of the model should be considered. For example, one may in
Reproduced with permission of the copyright owner. Further reproduction prohibited without permission.

123
vestigate how television affects the salience of food or the effects of
television ads on arousal and hunger, etc. The combined results of a
series of well planned, discrete investigations would contribute to our
understanding of the effects of televised foods messages on the ultimate act of food consumption.
There are several additional findings which are of interest from the current study with regard to the behavioral measures. A number of covariates were employed in analyzing the results of the BET. They have
been used previously be McLellarn (1981) and Bridgwater (1981), on the basis of the present study and this prior research, height and weight appear to be the only covariates which warrant continued use. Although
several of the others were found to account for a significant portion of the variance of several of the behavioral measures, the pattern was inconsistent.
A second finding involves the stability of the BET over time.Attempts were made in the current study to initiate posttesting for each class with as little latency as possible after the treatment phase was completed. However, due to logistical constraints there was a difference in the amount of time elapsed for each of the three treatment classes.This difference was directly reflected in reduced test-retest coefficients
on the BET when computed for each class, i.e. the longer the latency, the lower the coefficient. This implies that the BET loses stability
to an appreciable degree over a relatively brief period of time. Peterson et al. (1981) reported low stability coefficients on the BET in
their study- The authors could only speculate as to the causes and posited that perhaps the delay in posttesting which resulted form the
Reproduced with permission of the copyright owner. Further reproduction prohibited without permission.

124
Mt. St. Helen's volcano erruption was, in part, responsible. Given
the comparative difference in the stability coefficients found in the present study, this explanation seems quite plausable. Once again, this
finding points to the need to develop better consumption measures.In summary, several general conclusions can be drawn from the in
vestigation. First, good recall of the treatment tape material was evident, largely as a result of the high levels of attention the children paid to the programming. Second, it was found that even very young
children can learn relatively complex nutritional concepts which are presented in a "television program" format. This is a very positive finding which argues strongly for an increased use of this medium to
teach children about healthy dietary habits and good nutrition. Third, there were no significant changes in either preference or behavior that could be attributed to the effects of the treatment tapes, although there was evidence of a trend in the direction of increased consumption of pro-nutrition food by the treatment group. When the complexity of food consumption and the myriad of factors which interact to produce such a behavioral event are taken into account, the fact that a trend in the predicted direction was found offers some encouragement for further in
vestigation of the potential use of pro-nutritional programming as an
effective measure to imporve the eating habits and health of our young
children. Taken as a whole, the above results provide support for the hierachy of effects model. This support is seen in very strong effects of the treatment tapes on recall and learning and the much weaker and
inconsistent effects of the tapes at the preference and behavioral levels.
Further research is needed to test this model. Emphasis should be paid
Reproduced with permission of the copyright owner. Further reproduction prohibited without permission.

125
to the delineation of the various components which interact to determine consumptive beahvior. More discrete and specific studies are encouraged
to investigate what relationships exist among components of pro-nu
tritional food consumption and the specific part television plays at each level. The results of the current investigation will hopefully
add to the growing body of empirical research on the role television plays in influencing the development of children's dietary habits.
Reproduced with permission of the copyright owner. Further reproduction prohibited without permission.

127
REFERENCES
Reproduced with permission of the copyright owner. Further reproduction prohibited without permission.

References
Action for Children's Television. Putting a lid on kid vid, 1971,Sales Management, 1971, 107, 39,
Action for Children's Television. Who is talking to our children?" Newtonville, Mass.: Author, 1973.
Action for Children's Television, Petition to promulgate a rule prohibiting the advertising of candy to children on television before the Federal Trade Commission, Newtonville, Mass.: Author, 1977.
Alston, E, Snacks: the American way of eating. Family Health, 1973,January, 27-29,
Armstrong, D. B. Obesity and its relation to health and disease.Journal of American Medical Association, 1951, 147, 1007-1012,
Atkin, C, K, Effects of television advertising on children: Surveyof pre-adolescent's responses to television commercials, Repot #6,submitted to the Office of Child Development, Ü.S.D.H.E.W. EastLansing, MI: Department of Communication, Michigan State University,1975a.
Atkin, C, K, Effects of television advertising on children: Secondyear experimental evidence. Final report submitted to the Office of Child Development, U.S.D.H.E.W, East Lansing, MI; Department of Communication, Michigan State University, 1975b,
Atkin, C. Testimony before the Federal Trade Commission's rulemaking on children and T.V. advertising, San Francisco, January, 1979.
Atkin, C. & Gibson, W, Children's nutritional learning from television advertising. Paper presented at the meeting of the Association for Education in Journalism, Houston, 1979.
Atkin, D. & Heald, G, The content of children’s toy and food commercials. Journal of Communication, 1977, Winter,
Baker, M.J, Influence of nutrition education on 4th and 5th graders. Journal of Nutritional Education, 1972, 55,
Bandura, A. Social learning through imitation. In M. R, Jones (Ed,), Nebraska Symposium on Motivation, Lincoln, Nebraska: University ofNebraska Press, 1962, 211-274,
Bandura, A, Principles of behavior modification. New York: Holt,Rinehart & Winston, 1969,
128
Reproduced with permission of the copyright owner. Further reproduction prohibited without permission.

129
Bandura, A, (Ed.) Psychological modeling; conflicting theories, Chicago: Aldine and Atherton, 1971,
Bandura, A. Aggression: A social learning analysis. Englewood Cliffs,N.J.; Prentice Hall, 1973,
Bandura, A. Social learning theory. Englewood Cliffs, New Jersey: Prentice Hall, 1977,
Bandura, A., Grusec, J.E., & Menlove, F.L, Vicarious extinction of avoidance behavior. Journal of Personality and Social Psychology,1967, 5, 16-23.
Bandura, A., Ross, D,, & Ross, S.A. Vicarious reinforcement and imitative learning. Journal of Abnormal and Social Psychology,1963, 601-607,
Bandura, A., & Walters, R.H. Social learning and personality development . New York: Holt, Rinehart & Winston, 1963,
Barens, E, Network programming and advertising in the Saturday children's hours: A June and November comparison. Newtonville, Mass.:Action for Children's Television, 1972,
Barcus, F. Weekend commercial Children's television. Newtonville:Mass.; Action for Children's Television, 1975.
Barcus, E & McLaughlin, L. Food advertising on children's television:An analysis of appeals and nutritional content, Newtonville, Mass.: Action for Children's Television, 1978,
Barcus, F.E, & Wolkin, R, Children's television; An analysis of programming and advertising. New York, N.Y,: Praeger Publishers, 1977.
Barnouw, E. Tube of plenty: The evolution of American television.New York: Oxford University Press, 1975.
Barry, T.E. & Hansen, R.W. How race affects children's T.V. commercials. Journal of Advertising Research, 1973, 13, 63-67,
Beattie, S. Relative importance of television influences, family influences, and the child's personal characteristics on children's food preferences. Masters thesis, University of Montana, 1981,
Beauchamp, G,K, & Mailer, O, The development of flavor perferences inhumans; A review. In M.R. Kail & O. Mailer (Eds,), The chemicalsenses and nutrition. New York: Academic Press, 1977, 292-315,
Bell, C, & Lamb, M, Nutrition education and dietary behavior of fifth graders. Journal of Nutrition Education, 1973, 5, 3-14,
Reproduced with permission of the copyright owner. Further reproduction prohibited without permission.
130
Belson, W, The impact of télévision, Hamden, Conn,: Action Books, 1967,
Birch, H,G, & Gussow, J. Disadvantaged children, health, nutrition, and school failure. Stratton, Ohio: Harcort Brace, 1970,
Birch, L. L. Dimensions of preschool children's food preferences.Journal of Nutrition Education, 1979, 77-80,a,
Birch, L. L. Preschool children's food preferences and consumptivepatterns. Journal of Nutrition Education, 1979, JLl, 189-192, b,
Birch L, L. The relationship between children's food preferences and those of their parents. Journal of Nutrition Education, 1979, 11, 14-18,c.
Birch, L, L. Effects of peer models' food choices and eating behaviors on preschooler's food preferences. Child Development. 1980, 51, 235-242.
Birch, L. L. Experimental determinants of children's food preferences.In L, Kalz (Ed.), Advances in Early Childhood Education. In press.
Blake, R, R. The other person in the situation. In R, Tagiuri & L,Petrullo (Eds.), Person perception and interpersonal behavior,Stanford, Calif.: Stanford University Press, 1958.
Blatt, J,, Spencer, L,, & Ward, S. A cognitive developmental study of children's reactions to television advertising. In E. A. Ruben- stein, G, A. Comstock, & J. P. Murray (Eds,), Television and social behavior: Volume 4. Washington, D.C.: Government Printing Office, 1972.
Boddewyn, J. J. Advertising to children: an international survey.Television and Children, 1981, Winter, 46-52.
Boysen, S., & Ahern, R. Nutrition instruction and lunch surveys with second graders. Journal of Nutrition Education, 1972, 172-181,
Brekenridge, M, Food attitudes of five to twelve year old children. Journal of American Dietary Association, 1959, 3^, 704-716.
Bridgwater, C.A. Assessing children's food consumption, self-reportedfood preferences, and nutritional knowledge:__A methodological study.Doctoral dissertation. University of Montana, 1981,
Brown,. A.L. The development of. memory. In H. W. Reese (Ed.), Ad-vances in child development and behavior, New York: Academic Press,TW7T, ------------------ '--------------------------------------------------------------------------------------------------------------------------------
Reproduced with permission of the copyright owner. Further reproduction prohibited without permission.

131
Brown, R, (Ed.) Children and television, Beverly Hills: Sage, 1976.
Bryan, J.H., & Test, M.A. Models and helping; Naturalistic studies in aiding behavior. Journal of Personality and Social Psychology, 1967, 6, 400 - 407,
Burghardt, G. M,, & Hess, E. H. Food imprinting in the snappingturtle. Science, 1966, 108-109,
Campbell, D.T. Conformity in Psychology's theories of acquired behavioral dispositions. In I, A, Berg & B, M, Bass (Eds.), Conformity and deviation. New York: Harper, 1961.
Campbell, D.T, & Stanley, J.C, Experimental and quasi-experimenta1 designs for research. Chicago; Rand McNally, 1966,
Chaffe, S ,, McLeod, J., & Atkin, C. Parental influences on adolescent media use. American Behavioral Scientist, 1971, 1_4, 323-40.
Choate, R. Testimony before the House Subcommittee on Communications. United States House of Representatives, Washington, D.C.: Councilon Children, Media and Merchandising, 1975,
Choate, R. Testimony before the Federal Trade Commission in the matter of a trade regulation rule on food/nutrition advertising. Washington D. C.: Council on Children, Media and Merchandising, 1976.
Clancy-Hepburn, K, Children's behavioral responses to television food advertisements. Journal of Nutrition Education, 1974, 6,93-96.
Comstock, G, Television and human behavior: The key studies. SantaMonica, Calif.: Rand Corp., 1975a,
Comstock, G , Effects of TV on children; What is the evidence?Santa Monica; Rand Corp., 1975b.
Comstock, G. Television in America. Beverly Hills; Sage Publication, 1980.
Comstock, G., Chaffee, S., Kotzman, N,, McCombs, M,, & Roberts, D.Television and human behavior. New York; Columbia University Press, 1978.
Comstock, G ,, & Fisher, M, Television and human behavior: A guideto the pertinent scientific literature. Santa Monica; Rand Corporation, 1975,
Reproduced with permission of the copyright owner. Further reproduction prohibited without permission.

132
Eagly, A. H., & Hiininelfarb, S, Attitudes and opinions. In M.R, Rosenzeig & L.W. Porter (Eds.), Annual Review of Psychology Vol. 29. Palo Alto: Annual Reviews, 1978,
Ellis, G. T., & Sekyra, F. The effects of aggressive cartoons onthe behavior of first grade children. Journal of Psychology, 1972, 81, 37-43,
Emmons, L., Hays, M., & Call, P, A study of school feeding programs:1, Economic eligibility and nutritional need. Journal of American Dietary Association, 1972, 262-284.
Eppright, E., & Swanson, M. Distribution of nutrients among meals and snacks of Iowa school children. Journal of the American Dietary Association, 1955, 3d, 356-362.
Federal Trade Commission, Staff report on television advertising tochildren. Washington, D.C.: U.S. Government Printing Office, 1978.
Federation of American Societies for Experimental Biology. Evaluation of the health aspects of sucrose as a food ingredient. Prepared for Food and Drug Administration, Department of Health, Education and Welfare, 1976,
Feshbach, N. The child as "Psychologist" and "Economist": two car-riculum training programs. Paper presented at the annual meeting of the American Psychological Association, Montreal, September, 1980
Feshbach, N.D., Jordan, T.S., & Diliman, A.S. The design of a graphic to convey nutritional information to children: Pilotstudies. In R. B. Choate (Ed.), To the Federal Trade Commission in the matter of a trade regulation on food/nutrition advertising. Washington, D.C.: Council on Children, Media and Merchandising,1976.
Flanders, J.P. A review of research on imitative behavior. Psychological Bulletin, 1968, £9, 316-337.
Fox, D., Jeffrey, D.B., Dahlkoetter, J., McLellarn, R.W., & Hickey,J.S. How television commercials affect children's attitudes and eating behavior. Paper presented at the meeting of the American Psychological Association, Montreal, September, 1980.
Fredrich, L.K., & Stein, A.H. Prosocial television and young children; The effects of verbal labeling and role playing on learning and behavior. Child Development, 19 75, j^, 27-38.
Galst, J.P., & White, M.A, The unhealthy persuader: The reinforcingvalue of television and children's purchase-influencing attempts at the supermarket. Child Development, 1976, £7, 1089-1096.
Reproduced with permission of the copyright owner. Further reproduction prohibited without permission.

133
Garb, J,L,, & Stunkard, A.J, Taste aversions in man, American Journal of Psychiatry, 1974, 131, 1204-1207,
Goldberg, M.E., Gorn, G.J., t, Gibflon, W. TV messages for snack and breakfast foods: - Do they influence children's preferences? The Journal of Consumer Research, 1970, 5, 73-81.
Goranson, R.E. Media violence and ngqrcHGive behavior; A review of experimental research. In L. Berkowitz (Ed,), Advances in experimental social psychology. Vol. 5. New York; Academic Press,1970, 1-31.
Gorn, G., & Goldberg, M.E. Children's reactions to advertising: Anexperimental approach. Journal of Consumer Research, 1976, 1, 69-75.
Gorn, G.J., & Goldberg, M.E, Children's television commercials: Dochildren viewers become saturated too? Unpublished manuscript, McGill University, Montreal, Canada, 1976,
Greenberg, A., & Suttoni, C. Television commercial wearout. Journal of Advertising Research, 1973, 1^, 47-54.
Greenberg, B. Viewing and listening parameters among British youngsters. In R. Brown (Ed.), Children and television. Beverly Hills: Sage,1976.
Greenberg, B., & Dervin, B. Use of mass media by the urban poor.New York; Praeger, 1970.
Greene, L., Desor, J., & Mailer, O, Heridity and experience: Theirrelative importance in the development of taste preference in man. Journal of Comparative Psysiological Psychology, 1975, 279-284.
Gussow, J. Counternutritional messages of television ads aimed at children. Journal of Nutrition Education, 1972, 48-54.
Hanneman, G.J., & McEwen, W.J. Televised drug abuse appeals: Acontent analysis. Journalism Quraterly, 1973, 5jO, 329-333.
Harrill, I., Smith, C., & Grangever, J. Food acceptance and nutrient intake of preschool children. Journal of Nutritional Education,1972, 4, 103.
Harrison, A,A, Mere exposure. In L, Berkowitz (ED,), Advances inExperimental Social Psychology, Vol. 10, New York Academic Press,1977.
Hayes, D.S.M.& Birnbaum, D.W, Preschooler's rentention of televised events; is a picture worth a thousand words? Developmental Psychology, 1980, 410-416,
Reproduced with permission of the copyright owner. Further reproduction prohibited without permission.
134
Head, M. A nutrition education program at three grade levels.Journal of Nutritional Education,. 1974, 56-67,
Hendel, J., Lund, M., & Burk, S. Socioeconimic factors influencing children’s diet. Journal of Home Economics, 1956, 5_7, 205-221.
Henderson, L. Nutritional problems, growing out of new patterns of food consumption, American Journal of Public Health, 1972, 62, 1194-1214.
Hill, J.H., Liebert, R.M., & Mott, D.E. Vicarious extinction ofavoidance behavior through films: An initial test. PsychologicalReports, 1968, 1^, 192,
Himmelweit, H., Opoenheim, A., & Vince, P. Television and the child. London: Oxford University Press, 1958.
Ireton, C., & Guthrie, H, Modification of vegetable-eating behavior in pre-school children. Journal of Nutrition Education, 1972,100.
Jeffrey, D . & , Lemnitzer, N.B., Hickey, J.S,, Hess, M.J,, McLellarn, R.W., & Stroud, J.M, The development of a behavioral eating test and its relationship to a food preference scale. Behaivoral Assessment, 1980, 2, 87-98.
Jeffrey, D.B., McLellarn, R.W., & Fox, D.T. A methodological refinement of a behavioral eating test and food attitude scale for young children. Paper presented at the annual convention of the American Psychological Association, Montreal, September, 1980.
Kaufman, L. Prime-time nutrition. Journal of Communication, 1980, Summer, 37-46.
Krugman, H. Why three exposures may be enough. Journal of Advertising Research, 1972, ]^, 11-14.
Leifer, A.D., Collins, A.W., Gross, B., Taylor, P., Andrews, L., & Blackmer, E, Developmental aspects of variables relevant to observational learning. Child Development, 1971, 4^, 1509-1516.
Leifer, A.D., Gordon, N., & Graves, S, Children’s television, more than mere entertainment. Harvard Educational Review, 1974, 4j4, 213-245.
Lemnitzer, N.B., Jeffrey, D.B., Hess, ■ M.J,, Hickey, J,S., &Stroud, J.M,.. television food advertising: Does it effect children'sfood consumption? Paper presented at the meeting of the Society for Research on Child Development, San Francisco, March 1979.
Reproduced with permission of the copyright owner. Further reproduction prohibited without permission.

135Lesser, G, Children and television: Lessons from Sesame Street.
New York: Vintage Boods, 1974.
Liebert, R.M., Neale, J.M., & Davidson, E.S. The early window:Effects of television en children and youth, Elmsford, N.Y.:Pergamon Press, 1973,
Lorch, E., Anderson, P., Levin, S. The relationship of visual attention to children's comprehension of television. Child Development, 1979, 722-727,
Lovaas, 0,1. A program for the establishment of speech in psychotic children. In J.K. Wing (Ed,), Early childhood autism. Oxford: Pergamon, 1966.
Lovett, R., Baker, E., & Marcus, B. The effect of nutrition education programs at the second grade level. Journal of Nutritional Education, 1970, 2, 81-94.
Lund, M., & Burk, S. A multidisciplinary analysis of children's food consumption behavior, Minnesota Agricultural Experimental Station, Technical Bulletin 265, University of Minnesota, 1969.
Lyle, J., & Hoffman, H.R. Children's use of television and other media. In E.A. Rubinstein, G.A. Comstock, & J.P. Murray (Eds.), Television and Social Behavior, Volume 4, Washington, D.C.: Government Printing Office, 1972a,
Lyle, J., & Hoffman, H. Explorations in patterns of preschooltelevision viewing by preschool-age children. In E.A. Rubinstein,G.A. Comstock, & J.P. Murray (Eds.), Television and Social Behavior, Volume 4. Washington, D.C.: Government Printing Office,1972b.
Mauro, F.J., & Feins, R.P. Kids, food and television: The compellingcase for state action. Albany, N.Y.: New York State Assembly, 1977.
Mayer, J. Overweight: Causes, cost, and control. Englewood Cliffs,N.J.: Prentice Hall, 1968.
McLellarn, R. The effects of repeated exposure to low-nutrition food commercials upon young children's eating behaviors. Masters thesis. University of Montana, 1981,
Metheny, N, The diets of preschool children: Nutritional sufficiencyfindings and family marketing practices. Journal of Home Economics, 1962, 5^, 297,
Morris, W.N., Marshall, H.M., & Miller, R.S, The effect of vicarious punishment on pro-social behavior in children. Journal of Experimental Child Psychology, 1973, 15, 222-236,
Reproduced with permission of the copyright owner. Further reproduction prohibited without permission.

136
National Science Foundation. Research on the effects of to)pvlsionadvertising on children; Review and recommendations. Washington, D.C.Î Author, 1977 (Grant No. APR 75-10126, executive auinmary).
Nevill, G., & Clancy-Hepburn, K. Not just any ole sugar: Televisionadvertising, F.T.C. and food. Human Ecology Forum, 1972, 3, 4-10.
Nielson, A.C, Nielson Television '79. A.C. Nielson Co., 1979.
Nizel, A. Nutrition and dental health. Statement before the SelectCommittee on Nutrition and Human Needs of the United States Senate. Washington, D.C.: Government Printing Office, 1974.
Nizel, A. Letter to Action for Children's Television. In Action for Children's Television, Petition to promulgate a rule prohibiting the advertising of candy to children on television before the Federal Trade Commission. Newtonville, Mass.: Action for Children's Television, 1977.
Noble, G. Children in front of the small screen. Beverly Hills, Calif.; Sage Publications, 1975.
Palmer, E.L., & Dorr, A. (Eds.) Children and the faces of television; Teaching, violence, selling. New York: Academic Press, 1980.
Paulos, R.W. Unintentional negative effects of food commercialson children; A case study. Media Action Research Center, Federal Trade Commission, 1975,
Peterson, M., & Kies, C. Nutrition knowledge and attitudes of earlyelementary teachers. Journal of Nutrition Education, 1972, 1, 11-15-
Peterson, P.E., Hickey, J.S., Jeffrey, D.B., Bridgwater, C.A., Dahlkoetter, J., McLellarn, R.W., & Fox, D. The effects of pro-nutritional television messages on children's eating behaviors. Paper presented at the annual meeting of the American Psychological Association,Los Angeles, 1981.
Pilgram, F.J. What foods do people accept or reject. Journal of American Dietary Association, 1961, 3^, 439-444.
Potgieter, M. Food habits of children. Journal of American Dietary Association, 1965, 31, 794-819.
Quarforth, J, Children's understanding of the nature of television characters. Journal of Communication, 1979, 210-219.
Resnick, A., Stern, B,, & Alberty, B, Integrating results fromchildren's television advertising research. Journal of Advertising, 1979, 8, 3-12.
Reproduced with permission of the copyright owner. Further reproduction prohibited without permission.

137
Roberts, D,, & Bachen, C, Testimony bef6te the Federal TradeCommission's rulemaking on children and television advertising,San Francisco, February, 1979.
Robertson, T., & Rossiter, J. Children and commercial persuasion:An attribution theory analysis. Journal of Consumer Research, 1974,1. 13-20.
Rosenhan, D., & White, G.M. Observation and rehearsal as determinants of prosocial behavior. Journal of Personality and Social Psychology, 1967, 424-431.
Rubinstein, E.A., Comstock, G.A., & Murray, J.P. Television and Social Behavior: Volume 4. Washington, D.C.: GovernmentPrinting Office, 1972.
Rust, A., Longboune, R., & Watkins, T, Children's commercials;Creative development. Journal of Advertising Research, 1975, 15,5-12.
Schramm, W,, Lyle, J., & Parder, B. Television in the lives of pur Children. Stanford, Calif.: Stanford University Press, 1961.
Schuck, C. Food preferences of South Dakota college students. Journal of Dietary Association, 1961, 29̂ , 593,
Senate Select Committee on Small Business. Testimony of RobertChoate, Chairman, Council on Children, Media and Advertising. Washington, D.C.: Government Printing Office, 1971.
Sharaga, S.J. The effects of television advertising on children's nutrition attitude, nutrition knowledge and eating habits. Dissertation Abstracts International, 1974, 35B: 7, 3417-3418.
Thain, G. The F.T.C. and advertising directed toward children.In E. Sarson (Ed.), Action for Children's Television: The firstnational symposium on the effect on children of television programming and advertising. New York: Avon Books, 1971.
Thomas, P.S., & Call, W.P. Eating between meals; A nutritionProblem among teenagers. Nutrition Reviews, 1973, 31, 137-149.
Todhunter, E. School feeding from a nutritionist point of view.American Journal of Public Health and the Nation's Health, 1970, j^, 2302-2315'.
U.S. Senate Select Committee, on Nutrition and Human Needs. Dietarygoals for the United States, Washington, D.C.: Government PrintingOffice, 1971,
Reproduced with permission of the copyright owner. Further reproduction prohibited without permission.

138
Ward, S., Levinson, D.M.& Wackman, D.B, Children's attention to television advertising.- In E.A. Rubinstein, G,A, Comstock,& J. P, Murray (Eds.), Television and social behavior. Volume 4. Washington, D.C.: Government Printing Office, 1972,
Ward, S., Reale, G., & Levinson, D. Children's perception, exploration and judgment of television advertising: A further exploration.In E.A. Rubinstein, G.A. Comstock, & J,P. Murray (Eds,),Television and social behavior, Volume 4. Washington, B.C.: Government Printing Office, 1972.
Ward, S., & Wackman, D.B, Children's information processing oftelevision advertising. In P. Clark (Ed.), New models for mass communication research. Volume 2. Beverly Hills, Calif.: SagePublications, 1973,
Ward, S., Wackman, D., & Wartella, E. How children learn to buy.Beverly Hills, Calif.: Sage Publications, 1977.
Wartella, E. The young child as consumer. In J.F. Esserman, Television Advertising and Children, New York: Child Research Institute, 1981.
Wartella, E., & Ettema, J. A cognitive developmental study ofchildren's attention to television commercials. Communications Research, 1974, 69-88.
White House Council on Food, Nutrition and Health. Annual Report.U.S. Government Printing Office, Washington, D.C., 1974.
White, M.A. Testimony before the Federal Trade Commission'srulemaking on children and television advertising. San Francisco, February, 1979.
Yussen, S.R. Determinants of visual attention and recall in observational learning by preschoolers and second graders. Developmental Psychology, 1974, ICI, 93-100.
Zajonc, R.B. The attitudinal effects of mere exposure. Journal of Personality and social Psychology, 1968, 9, 1-27.
Zucherman, P., Ziegler, M., & Stevenson, H.W, Children's viewing of television and recognition memory of commercials. Child Development, 1978, 96-104,
Reproduced with permission of the copyright owner. Further reproduction prohibited without permission.

139
APPENDICES
Reproduced with permission of the copyright owner. Further reproduction prohibited without permission.

A P P E N D IX A 1 4 0
U niversity of H lontana
rtlissoula, rriontana 598121)1',If P.ircnt :
Over the last three years, Missoula area parents and children have been p a r t i c i pating in a series of research projects studying the et feets of TV advertising on childreri's eating habits and food preferences. We would like to invite you and your child to help us in our current project.
T h i s research is being carried out by Dr. Balfour Jeffrey, a psychologist at the University of Montana, along with a number of graduate student assistants. Our st.udies are supfxjrted by federal funds. As part of the next phase of our overall program, wc are interested in pro-nutritional television programming and its potential positive impact on children's food preferences. Wc are starting a research firojoct at. Washin<jton School beginning the end of April. We have discussed this project with your child's principal, Mr. Lee Cork and nis/her teacher, Ms. Dix, Mrs. Khoury, Mrs. Hanson, Mrs. Opsahl or Mrs. Tilton. T h e y approve of the project and have agreed to lend their cooperation.
Specif ically, we would like your permission for your i liild to partic ipate in this project. The experiment will be conduc: ted as follows: A gradua i e student willescort your child to a trailer parked outside the school where he/she may sample from a tray containing apples, grapes, Froot Loops, Fritos, Cracker Jacks and cherry tomatoes. Your child may decline to taste any of the foods. After the foods have been removed, wo will show your child a variety of different food products commonly sold in grocery stores. We will simply ask your chi Id to indicate how much he/she likes that particular food and if he/she feels it is healthy and nutritious. They will not taste these foods. The entire procedure will take approximately 20 minutes.
After all children have been through this procedure, some ol the children will watch approximately 20 minutes of pro-nut.ritiona 1 TV progr,imming (for example programs developed by national health organizations) in their classroom for several d a y s . Then the procedure described above will be repeated for all cliildren.
We would truly appreciate your help in allowing your child to participate in this project. As an expression of our thanks to you, your child and the school, wcare donating $100 honorarium to the Washington School.
If you agree to allow your chi Id to part i cip.it c , file,me I ill out the enclosedP.irent Permission Form and return it i n the encloseii, se 11-mPirossed envelope. Wewill he happy to send you results of this study after they are ana I y zed (probably late summer). If you have any questions, don't hesitate to '.ontact us at 24.Î-5A64, 243-2862 , or 243-4521.
Thank you very much for your help.Si n cere 1 y ,
ÙIl. Balfour Jefi Associate Prof essor and Pr incipal Invest ig.i tor
( jiPolly PeW'rson, Research Assistant.
Reproduced with permission of the copyright owner. Further reproduction prohibited without permission.

APPENDIX A 141
DEPARTMENT OF PSYCHOLOGY
PAPEN r PERM Ï JON FORM
Child's Name:
Birthdate:
School:
Teacher
Does your child have any food allergies? If so, please indicate allergenic foods;
O.K. to call if necessary: Yes No
Telephone number : ___________________^
Best time to call:
I grant permission for my child to participate in the study beginning April 27, 1981, involving children's eating habits and food preterences.
Yes No
Parent Signature:
Date :
Reproduced with permission of the copyright owner. Further reproduction prohibited without permission.

142
Appendix B
TAPE CONTENTSTAPE #1Program: Slim Goodbody -
Sesame Street: -
Embedded Ads; 1st group (beginning)
2nd group (% between programs)
"Fruits & Vegetables"Slim talks about the importance of eating fruits & vegetables for vitamins, strong teeth and gums. They also make good snacks,
1. You are what you eat2. Big Bird tries an apple3. Bert's chew-in4. Pineapple5. Grandma's breakfast1, Nectarines2, S—A—L—A—D song '3, 4-food groups song
1. Potatoes2. Timer {animated character) -
carrot3. Milk Alley4. Sugar for breakfast - eat real
cereal3rd group (end)
1, Plums2, Earnie, Sherlock Hemlock-Oranges3, Peaches
Tape #2 Program:
Embedded Ads;
Mulligan Stew #1 - "The Great Nutrition Turn On".The Mulligan Stew kids are sent on a mission to try to discover what is wrong with the town "Lazy Susan", They discover people are asleep because they don't eat right. The kids teach the townspeople about the 4 food groups; they also promote some of the nutrients we get from certain foods.1st group (beginning)
1, Timer (animated character) - cheese
2, Grover - disappearing carrot3, Bartlett pears
Reproduced with permission of the copyright owner. Further reproduction prohibited without permission.

143
Tape #3
Programî
Embedded Adsi
Tape #4 Program;
Embedded Ads:
Tape #5
Program:
Appendix BTAPE CONTENTS (Cont,)
2nd group (h between programs)
1, Vegetables2. Timer (animated - nutty goody
3. Grover - apples4, Timer (animated
eat breakfast
character) -
character) -
3rd group (end)
1. grapes2. Frootsie - Tootsie
as a snack3. Brush your teeth
- eat fruit
Slim Goodbody -
Em b e d d e d Ads;
"Supper Bowl VII"A story about a character ("Lobe" who tries to sabotage the Slipper Bowl by telling people all they need to eat is his magic elixir instead of a healthy diet which includes a variety of foods from the four food groups.
(Same as tape #2, order will be varied).
Mulligan Stew #2 - "Look Inside Yourself"Story is about the importance of eating a good breakfast; the show repeats the 4 food groups and gives number of servings needed from each group every day (4-4-3-2 theme)(Same as tape #2, order will be varied).
Mulligan Stew #3 - "The Film-Flam Man"The Flim-Flam man tries to sell the Mulligan Stew kids his food diet. The kids challenge him to athletic competitions and win every event to prove that fad diets can't replace good nutrition gained from eating a variety of foods from the four food groups,
(Same as tape #1, order will be varied).
Reproduced with permission of the copyright owner. Further reproduction prohibited without permission.

144
Appendix BTAPE CONTENTS (Cont,)
Tape #6Program; Sesame Street -
Slim Goodbody
1, Eat right2, Name that food3, Milk for sale4, Nice fruits5, Strawberry yogurt6, Slow eating7, Breakfast song
"Nibble On" Slim talks and sings about healthy snacks.
Embedded Ads;
Tape # 7
Program:
Embedded Ads;
Tape #8 Program:
Embedded Ads:
(Same as tape #2, order will be varied).
Mulligan stew #4 "Getting it all Together"The Mulligan Stew kids are sent on a mission to prepare a meal for kids from all over the world. They show different foods which are available in other countries and recognize the essential nutrients in each. Finally, they put together a meal that has servings from the 4-food groups.(Same as tape #1, order will be varied).
Sesame Street - 1. The Raisins2, Snacks3, Fruita Mansana4, Limbo - Good Eating5, In the Bag6, Counting bites
(Same as tape #2, order will be varied).In addition: 1, Watch out for the munchies
2, Fruit and vegetable tree.
Reproduced with permission of the copyright owner. Further reproduction prohibited without permission.

145
Tape #9Program:
Embedded Ads;
Tape #10
Program
Embedded Ads;
Appendix BTAPE CONTENTS (Cont,)
Mulligan stew #5 "Count Down 4-4-3-2"The Mulligan Stew Kids' friend, Wilber Dooright is trapped while camping in the woods. He is forced to make his food last for 2 extra days. The nutrient content of a variety of foods is discussed and the 4-4-3-2 theme is stressed.
(Same as tape #1, order will be varied).
Mulligan stew #6 "The Racer that Lost his Edge"You are what you eat is the theme of this program. Just being full is not enough. Repeats the 4-4-3-2 theme and stresses the 4 food groups, '(Same as tape #2, order will be varied).
Reproduced with permission of the copyright owner. Further reproduction prohibited without permission.

146Appendix C
Videotape Rating Form
Rater's Name Tape No.
Please rate each segment of tape on each of the following criteria using this scale:
1 2 3 4 5 6 7Very Poor below average good very excel-Poor average good lent
Use your best judgment. Please wait until the entire segment has been shown before recording rating. Thank you.
_1. audio quality (is sound clear and distinct, can audiobe easily understood)
_2. video quality (is color accurate, is resolution sharp,clarity)
3. level of technical sophistication
4. overall quality
Reproduced with permission of the copyright owner. Further reproduction prohibited without permission.

147
Appendix D
Nutritional Questionnaire
Part II
Name:____ #:
Date:_______ Pre Post (circle one)1. Which one of these drinks is the best for you?
Kool-Aid Coke milk 7-Up
2. Which one of these meals is very important to eat each day?
breakfast lunch dinner bedtime snack3. Which one of these kids didn't eat breakfast today?
Helping in the garden talking with friend, laughingrunning & happy sitting in chair, tired and grouchy
4. Which one of these snacks doesn't cause cavities;
apple cake pie candy bar
5. Which one of these foods is a kind of meat?
milk corn crackers fish
6. Here are several different breakfasts (name them); which one of these is the best breakfast?
brkfst # 1 brkfst # 2 brkfst # 3 brkfst # 4
7. Which of these kinds of foods could make you fat or unhealthy if you eat too muchcelery, tomato, carrot apple, banana, orange pie, cake,cupcakegrapes, cherries, pineapple
8. Which of these snacks is the best for you? cookies pie doughnut grapes
Reproduced with permission of the copyright owner. Further reproduction prohibited without permission.
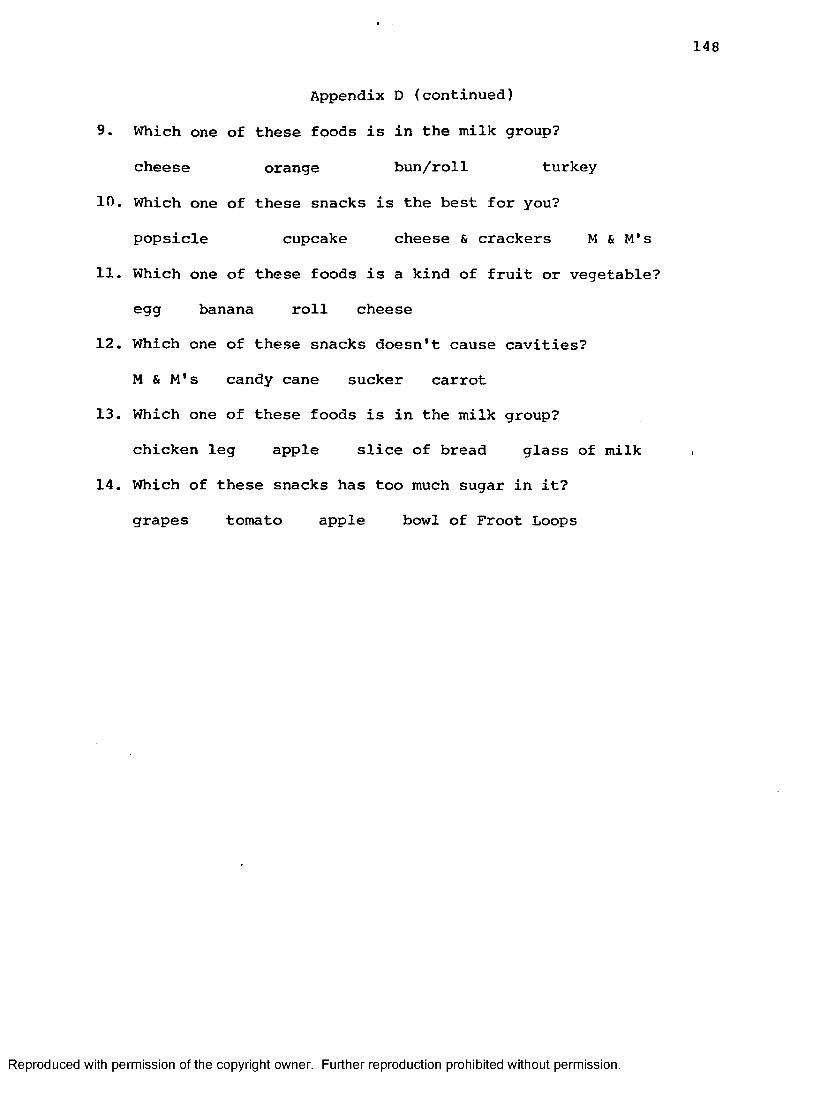
148
Appendix D (continued)9. Which one of these foods is in the milk group?
cheese orange bun/roll turkey
10. Which one of these snacks is the best for you?
popsicle cupcake cheese & crackers M & M's
11. Which one of these foods is a kind of fruit or vegetable? egg banana roll cheese
12. Which one of these snacks doesn't cause cavities?M & M's candy cane sucker carrot
13. Which one of these foods is in the milk group? chicken leg apple slice of bread glass of milk
14. Which of these snacks has too much sugar in it?
grapes tomato apple bowl of Froot Loops
Reproduced with permission of the copyright owner. Further reproduction prohibited without permission.

Nmme :
Date:
A[jpcnaxx \j
Pretest Po?r.ttest (circle one)
)I
)BREAKFA5T LUNCH DINNER
▼ w
BEDTIME 5NACK
0
Reproduced with permission of the copyright owner. Further reproduction prohibited without permission.
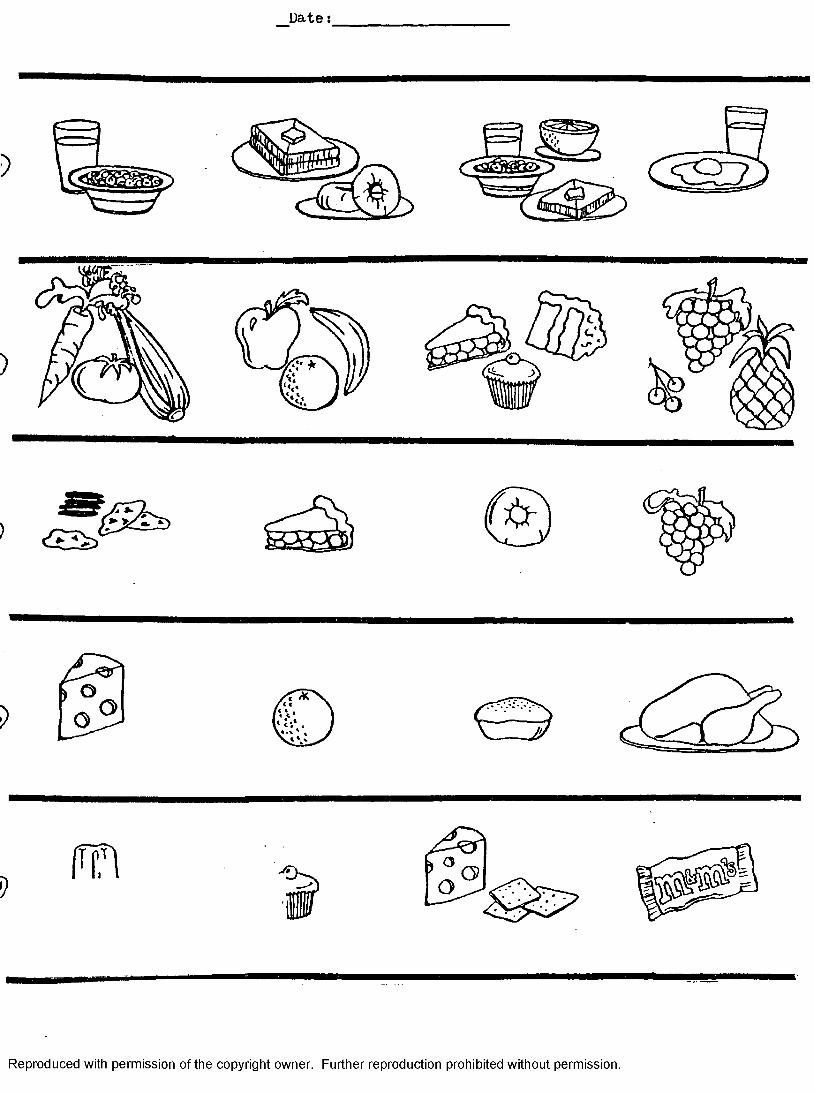
Date :
’ < £ l b '
oo
Reproduced with permission of the copyright owner. Further reproduction prohibited without permission.
Date:I’ji
Oo o
Reproduced with permission of the copyright owner. Further reproduction prohibited without permission.

152
Appendix E Nutritional Questionnaire
Part IIIName: #D a t e : __________ Pretest Posttest (circle one).
1. Name 3 kinds of fruits or vegetables.
2. There are 4 different types of food groups that we need to eçit every day to be healthy. Can you name them for me?
3, Name 3 foods that cause cavities.
4. Why is meat good for you to eat?
5, Why are fruits and vegetables good for you to eat?
6. Give me 2 reasons why sugar is bad tor you.
Reproduced with permission of the copyright owner. Further reproduction prohibited without permission.

153Appendix E (continued)
Name:Date : Pre Post
7. Name 3 different foods that make healthy snacks.
8. Name 3 different foods that come from milk.
9. What is the most important meal of the day; breakfast, lunch or dinner? ______________
Reproduced with permission of the copyright owner. Further reproduction prohibited without permission.

1 5 4
DateTime
Appendix F
Observer's Seating Form
Class No- Observer * s Name
(Back of Room)1 2 3 4 5
6 7 8 9 10
11 12 13 14 15
16 17 18 19 20
21 22 23 24 25
Reproduced with permission of the copyright owner. Further reproduction prohibited without permission.

155
Appendix G.lResults of Univariate Analysis of
Variance with Repeated Measures on Nutrition Questionnaire III
Individual Cases
Source ss ÊL MS F ProbabilityGroup 10.27 1 10.27 .42 .5172Error 2138.98 88 24.31Trials 296.45 1 296.45 28.63 .0000group X trials 136.94 1 136.94 13.23 .0005**
* *p. .05p. .01
Reproduced with permission of the copyright owner. Further reproduction prohibited without permission.

156Appendix G,2
Analysis of Variance with Repeated Measures Pretend Eating Test (PET) for
Individual CasesSource
GroupError
SS
20.634492.00
185
20.6352.85
F Probability .39 .5338
TrialsGroup X trials
790.7048.36
11
790.7048.36
30.181.85
.0000**
.1779
Group 15.46 1 15.46 .30 .5849Error 4371.71 85 51.43Trials 781.71 1 781.71 28.74 .0000**Group X trials 59.50 1 59.50 2.19 .1428Error 2311.71 85 27.20
* p.p.
.05
.01
Reproduced with permission of the copyright owner. Further reproduction prohibited without permission.
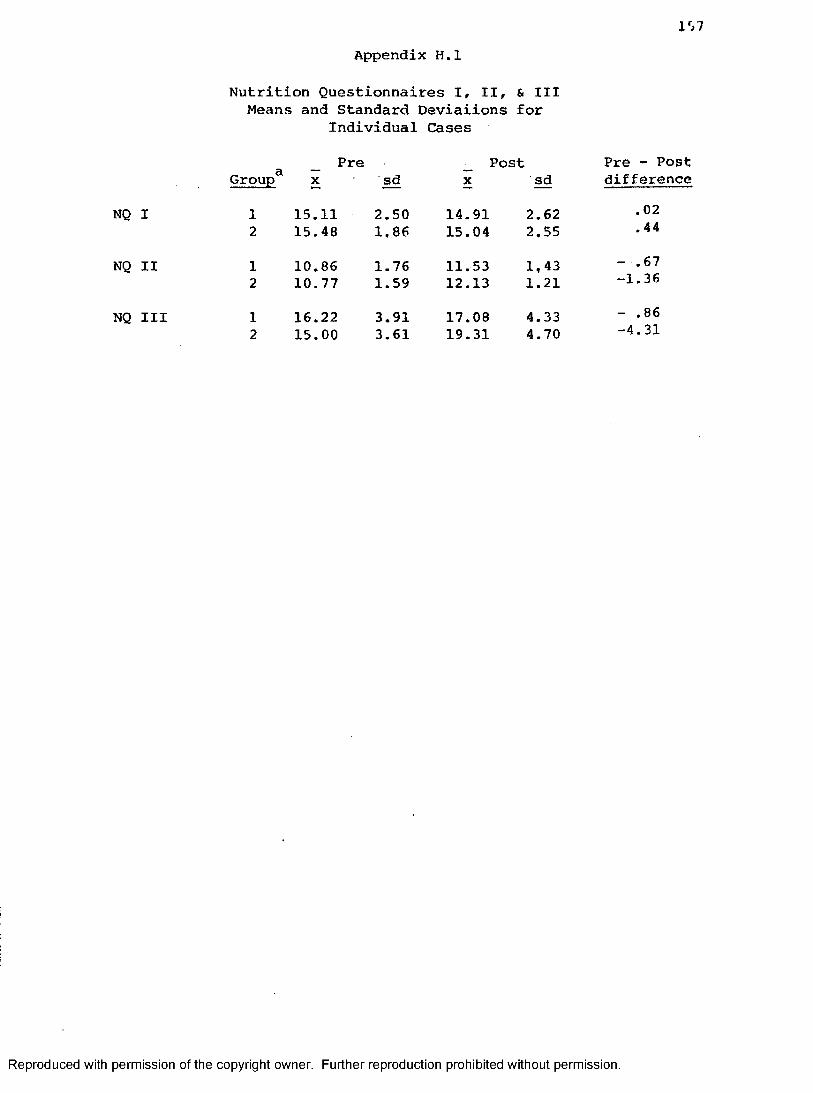
107Appendix H . l
Nutrition Questionnaires I, II, & III Means and Standard Deviaiions for
Individual CasesPre Post Pre - Post
Groupé X sd X sd différéNQ I 1 15.11 2.50 14.91 2.62 .02
2 15.48 1,86 15.04 2,55 .44
NQ II 1 10.86 1.76 11.53 1,43 — . 672 10.77 1.59 12.13 1.21 -1, 36
NQ III 1 16.22 3.91 17.08 4.33 - .862 15.00 3.61 19.31 4.70 -4.31
Reproduced with permission of the copyright owner. Further reproduction prohibited without permission.
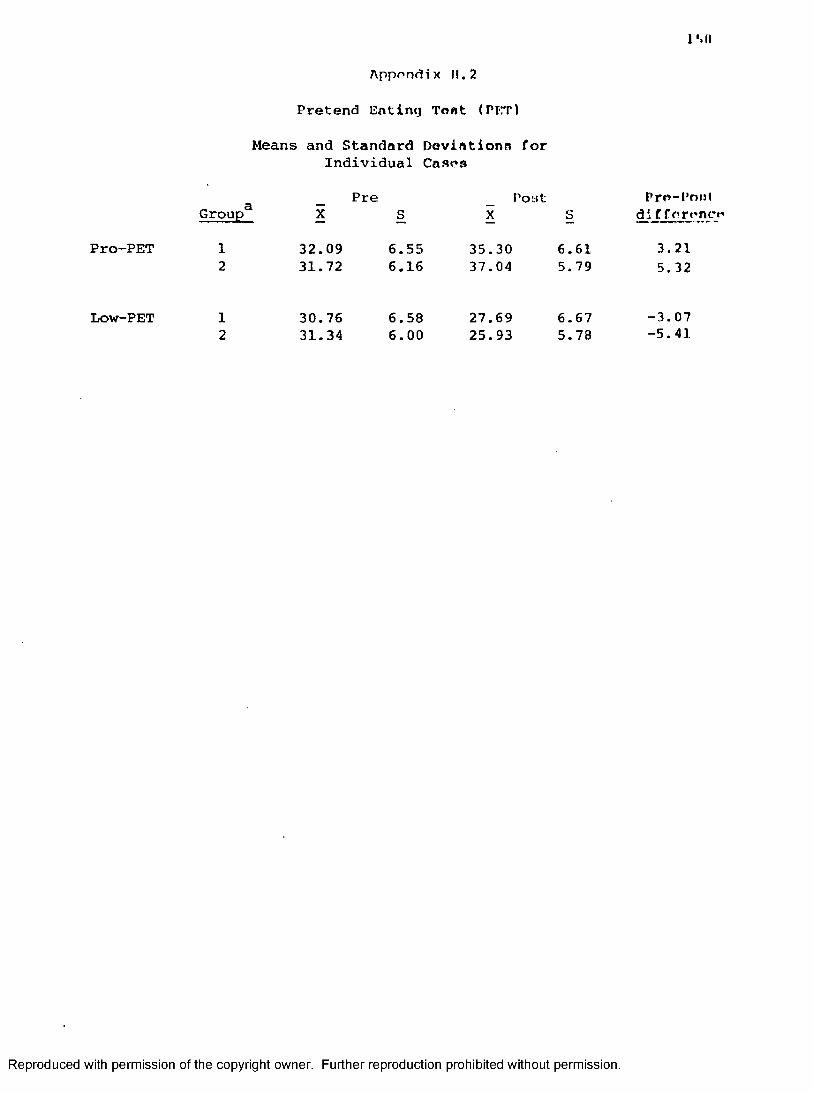
r.H
Appendix 11.2Pretend Eating Test (PFrr)
Means and Standard Deviations for Individual Cases
_ Pre _ Post Pre-Po m IGroup X S X S di Cf erenc-r»
Pro-PET 1 32.09 6.55 35.30 6.61 3.212 31.72 6.16 37.04 5.79 5.32
Low-PET 1 30.76 6.58 27.69 6.67 -3.072 31.34 6.00 25.93 5.78 -5.41
Reproduced with permission of the copyright owner. Further reproduction prohibited without permission.
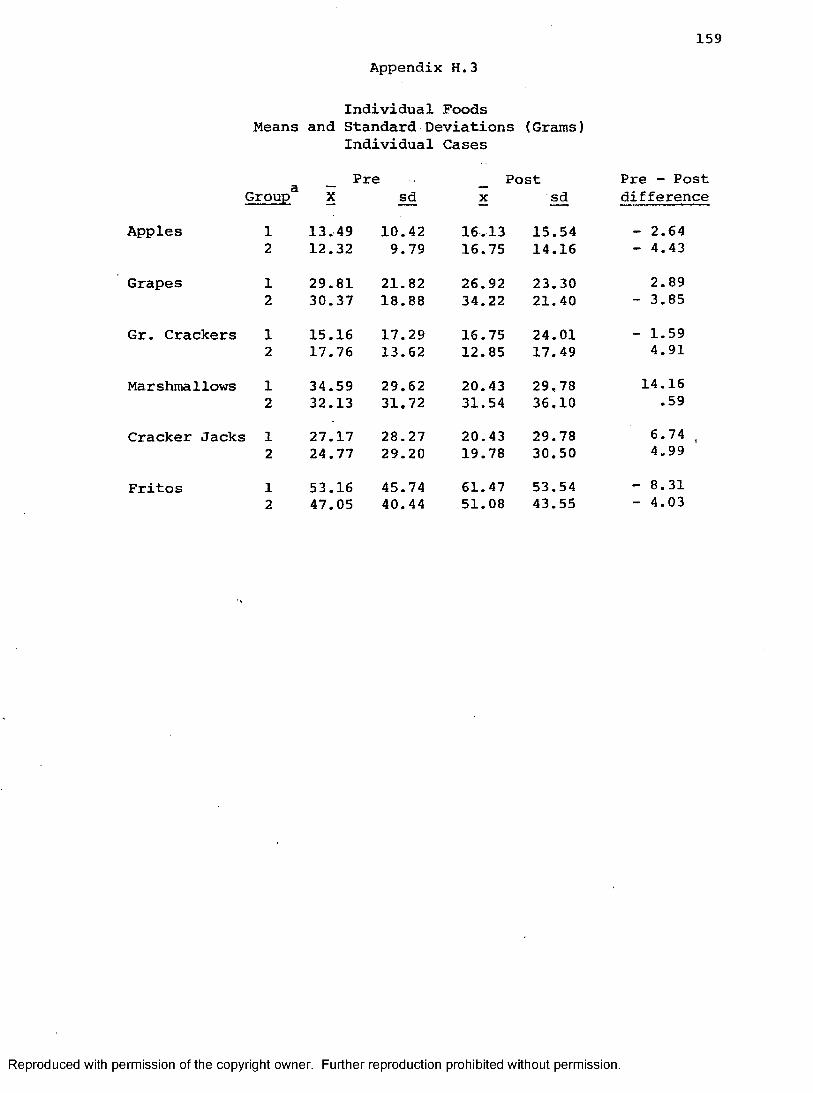
Appendix H.3
Individual Foods Means and Standard Deviations (Grams)
Individual Cases
159
Pre Post Pre - PostGroupé X sd X sd difference
Apples 1 13.49 10.42 16.13 15.54 - 2.642 12.32 9.79 16.75 14.16 - 4.43
Grapes 1 29.81 21.82 26.92 23.30 2.892 30.37 18.88 34.22 21.40 - 3.85
Gr. Crackers 1 15.16 17.29 16.75 24.01 - 1.592 17.76 13.62 12.85 17.49 4.91
Marshmallows 1 34.59 29.62 20.43 29,78 14.162 32.13 31.72 31.54 36,10 .59
Cracker Jacks 1 27.17 28.27 20.43 29.78 6.74 ,2 24.77 29.20 19.78 30.50 4.99
Fritos 1 53.16 45.74 61.47 53.54 - 8.312 47.05 40.44 51.08 43.55 — 4.03
Reproduced with permission of the copyright owner. Further reproduction prohibited without permission.