The impact of World War II on nutrition and children's health in ...
13
Please cite this article in press as: Daniele, V., Ghezzi, R. The impact of World War II on nutrition and children’s health in Italy. Investigaciones de Historia Económica - Economic History Research (2017). https://doi.org/10.1016/j.ihe.2017.09.002 ARTICLE IN PRESS G Model IHE-353; No. of Pages 13 Investigaciones de Historia Económica - Economic History Research xxx (2017) xxx–xxx Investigaciones de Historia Económica - Economic History Research www.elsevier.es/ihe Article The impact of World War II on nutrition and children’s health in Italy Vittorio Daniele ∗ , Renato Ghezzi Università Magna Graecia di Catanzaro, Dipartimento di Scienze Giuridiche, Storiche, Economiche e Sociali, Campus S. Venuta, 88100 Catanzaro, Italy a r t i c l e i n f o Article history: Received 7 May 2017 Accepted 14 September 2017 Available online xxx JEL classification: I10 N44 Keywords: Italy World War II Food rationing Anthropometry a b s t r a c t The impact of World War II on the nutrition and health of Italian children is examined. During the Sec- ond World War (1939–1945), both per capita GDP and consumption collapsed in Italy. Infant mortality increased. The anthropometric measurements of a sample of schoolchildren show a loss in weight and height in comparison with the pre-war years. Measurements of conscripts born during the conflict show an interruption in the secular increase in height, with a decrease in the mean height of conscripts born in 1945. The adverse impact of the war on height, particularly affected the northern regions, and appears to be related to the ‘geography of conflict’ in Italy. © 2017 Published by Elsevier Espa ˜ na, S.L.U. on behalf of Asociaci ´ on Espa ˜ nola de Historia Econ ´ omica. El impacto de la Segunda Guerra Mundial sobre la nutrición y la salud de los ni˜ nos en Italia Códigos JEL: I10 N44 Palabras clave: Italia Segunda Guerra Mundial Racionamiento Antropometría r e s u m e n El artículo examina el impacto de la Segunda Guerra Mundial sobre la nutrición y la salud de los ni˜ nos en Italia. Durante la guerra, tanto el PIB como los consumos per cápita disminuyeron notablemente. La mor- talidad infantil aumentó. Las medidas antropométricas sobre un muestreo de ni˜ nos, denota una reducción del peso y de la estatura con respecto al nivel pre-bélico. Los datos de los reclutas nacidas durante la guerra muestran como el proceso de crecimiento secular de la estatura se interrumpió. La estatura media de los reclutas nacidas en el a˜ no 1945 disminuyó. El impacto de la guerra en la estatura afectó principalmente a las regiones del Norte, y parece que esté relacionado con la «geografía del conflicto» en Italia. © 2017 Publicado por Elsevier Espa ˜ na, S.L.U. en nombre de Asociaci ´ on Espa ˜ nola de Historia Econ ´ omica. 1. Introduction War may have devastating and pervasive consequences for the living standards and health conditions of a population, particularly among children. Food rationing, hunger, population displacement, the loss of parents and breakdowns in medical, educational and public services, together with the direct effects of the conflict, including injuries and illnesses, may produce long-lasting effects ∗ Corresponding author. E-mail address: [email protected] (V. Daniele). on individuals’ lives and propagate across generations (Goldson, 1996; Hunt, 2008; Devakumar et al., 2014). These effects have been documented for conflicts involving diverse countries – such as Cambodia, Cote d’Ivoire, Rwanda, Zimbabwe and Vietnam – and with different durations (Alderman et al., 2006; Akresh et al., 2011; Merrouche, 2011; Minoiu and Shemyakina, 2014; Palmer et al., 2016). The anthropometric measurements of children and conscripts, together with health indicators, have been used in studies aimed at assessing the impact of conflicts, such as World War I and the autarchic policies and embargoes in Germany and Spain, on the biological wellbeing of individuals (Blum, 2011, 2013; Baten and https://doi.org/10.1016/j.ihe.2017.09.002 1698-6989/© 2017 Published by Elsevier Espa ˜ na, S.L.U. on behalf of Asociaci ´ on Espa ˜ nola de Historia Econ ´ omica.
-
Upload
khangminh22 -
Category
Documents
-
view
0 -
download
0
Transcript of The impact of World War II on nutrition and children's health in ...

Please cite this article in press as: Daniele, V., Ghezzi, R. The impact of World War II on nutrition and children’s health in Italy.Investigaciones de Historia Económica - Economic History Research (2017). https://doi.org/10.1016/j.ihe.2017.09.002
ARTICLE IN PRESSG Model
IHE-353; No. of Pages 13
Investigaciones de Historia Económica - Economic History Research xxx (2017) xxx–xxx
Investigaciones de Historia Económica - EconomicHistory Research
www.elsev ier .es / ihe
Article
The impact of World War II on nutrition and children’s health in Italy
Vittorio Daniele ∗, Renato Ghezzi
Università Magna Graecia di Catanzaro, Dipartimento di Scienze Giuridiche, Storiche, Economiche e Sociali, Campus S. Venuta, 88100 Catanzaro, Italy
a r t i c l e i n f o
Article history:
Received 7 May 2017Accepted 14 September 2017Available online xxx
JEL classification:
I10N44
Keywords:
ItalyWorld War IIFood rationingAnthropometry
a b s t r a c t
The impact of World War II on the nutrition and health of Italian children is examined. During the Sec-ond World War (1939–1945), both per capita GDP and consumption collapsed in Italy. Infant mortalityincreased. The anthropometric measurements of a sample of schoolchildren show a loss in weight andheight in comparison with the pre-war years. Measurements of conscripts born during the conflict showan interruption in the secular increase in height, with a decrease in the mean height of conscripts bornin 1945. The adverse impact of the war on height, particularly affected the northern regions, and appearsto be related to the ‘geography of conflict’ in Italy.
© 2017 Published by Elsevier Espana, S.L.U. on behalf of Asociacion Espanola de Historia Economica.
El impacto de la Segunda Guerra Mundial sobre la nutrición y la salud de losninos en Italia
Códigos JEL:
I10N44
Palabras clave:
ItaliaSegunda Guerra MundialRacionamientoAntropometría
r e s u m e n
El artículo examina el impacto de la Segunda Guerra Mundial sobre la nutrición y la salud de los ninos enItalia. Durante la guerra, tanto el PIB como los consumos per cápita disminuyeron notablemente. La mor-talidad infantil aumentó. Las medidas antropométricas sobre un muestreo de ninos, denota una reduccióndel peso y de la estatura con respecto al nivel pre-bélico. Los datos de los reclutas nacidas durante la guerramuestran como el proceso de crecimiento secular de la estatura se interrumpió. La estatura media de losreclutas nacidas en el ano 1945 disminuyó. El impacto de la guerra en la estatura afectó principalmentea las regiones del Norte, y parece que esté relacionado con la «geografía del conflicto» en Italia.
© 2017 Publicado por Elsevier Espana, S.L.U. en nombre de Asociacion Espanola de HistoriaEconomica.
1. Introduction
War may have devastating and pervasive consequences for theliving standards and health conditions of a population, particularlyamong children. Food rationing, hunger, population displacement,the loss of parents and breakdowns in medical, educational andpublic services, together with the direct effects of the conflict,including injuries and illnesses, may produce long-lasting effects
∗ Corresponding author.E-mail address: [email protected] (V. Daniele).
on individuals’ lives and propagate across generations (Goldson,1996; Hunt, 2008; Devakumar et al., 2014). These effects havebeen documented for conflicts involving diverse countries – suchas Cambodia, Cote d’Ivoire, Rwanda, Zimbabwe and Vietnam – andwith different durations (Alderman et al., 2006; Akresh et al., 2011;Merrouche, 2011; Minoiu and Shemyakina, 2014; Palmer et al.,2016).
The anthropometric measurements of children and conscripts,together with health indicators, have been used in studies aimedat assessing the impact of conflicts, such as World War I and theautarchic policies and embargoes in Germany and Spain, on thebiological wellbeing of individuals (Blum, 2011, 2013; Baten and
https://doi.org/10.1016/j.ihe.2017.09.0021698-6989/© 2017 Published by Elsevier Espana, S.L.U. on behalf of Asociacion Espanola de Historia Economica.

Please cite this article in press as: Daniele, V., Ghezzi, R. The impact of World War II on nutrition and children’s health in Italy.Investigaciones de Historia Económica - Economic History Research (2017). https://doi.org/10.1016/j.ihe.2017.09.002
ARTICLE IN PRESSG Model
IHE-353; No. of Pages 13
2 V. Daniele, R. Ghezzi / Investigaciones de Historia Económica - Economic History Research xxx (2017) xxx–xxx
Wagner, 2003; Cox, 2015; Puche, 2010; Puche et al., 2016; Paket al., 2011). Research, conducted in 13 European countries on alarge sample of adults (>50 years old), showed how the experienceof World War II (WWII) during childhood increased the probabil-ity of suffering from diabetes and depression, and was associatedwith less education and life satisfaction in adulthood (Kesternichet al., 2014). Studies conducted on cohorts of Dutch men, bornduring the German blockade of food supplies to the Netherlands(the ‘Hunger Winter’, 1944–1945), found that prenatal exposure tosevere malnutrition deficiencies, particularly in the first gestationperiod, was associated with a higher risk of personality disor-ders, coronary heart disease and metabolic disorders in later life(Neugebauer et al., 1999; Roseboom et al., 2001) and with persis-tent epigenetic changes (Heijmans et al., 2008). Prenatal exposureto the Dutch ‘Hunger Winter’ famine was, furthermore, negativelyrelated to individuals’ employment outcomes in adulthood (Scholteet al., 2015). Transient effects of food restrictions due to WWIIon schoolchildren’s anthropometric measurements were found instudies on Norway and the other Nordic Countries (Brundtlandet al., 1980; Angell-Andersen et al., 2004).
The effects of war-related shocks in childhood on adult healthand wellbeing were recently estimated by Havari and Peracchi(2016), using macro and micro-level data for 14 European countriesreferring to the period between the two world wars. Their findingsconfirm how exposure to war events and the experience of hungerin childhood and adolescence are related to worse mental and phys-ical health, education, and subjective wellbeing in adulthood. Thedetrimental impact of war also regards education. German chil-dren, who during WWII were school-aged, received from 0.3 to 1.2fewer years of schooling on average, and were about one centime-tre shorter in adulthood (Akbulut-Yuksel, 2014). For Austrian andGerman individuals, who during WWII were 10 years old, the edu-cational loss was associated with sizeable inferior earnings some40 years later (Ichino and Winter-Ebmer, 2004).
During WWII, Italy suffered notable costs in human andeconomic terms. The national production system and transportinfrastructures were seriously damaged; GDP per capita and house-hold consumption collapsed, returning to pre-war levels around1950. The scarcity of foodstuffs, due to the fall in production, wasmade worse by the ineffective rationing system and the very highinflation rate (Ronchi et al., 1948; Daneo, 1975; Zamagni, 1998).
Social and biological wellbeing in Italy has been examined ina historical perspective by a growing strand of research (Arcaleni,2006, 2012; Peracchi, 2008; Vecchi, 2011, 2017). Research showshow in Italy, as in other countries, a secular trend in average heightoccurred. Over the period 1861–1981 the average height of con-scripts increased by 11.6 cm; between 1901 and 1951, the gainwas 5.2 cm (A’Hearn and Vecchi, 2011, p. 56). Notwithstandingthe huge historiography on WWII in Italy (Collotti, 1973; Can-deloro, 1984; Labanca, 2015), the impact of the conflict on thebiological wellbeing of the population has hardly been investi-gated. The present paper’s aim is to fill this gap, at least in part, byoffering an examination of the effects of WWII on the nutritionalhealth of the Italian population. By using children’s anthropomet-ric measurements and data on the height of conscripts born inwartime, the analysis focuses, in particular, on the consequencesof the conflict on children’s health both at national and regionallevels.
The paper is organized as follows. The next section presents thetrend of the main economic indicators and data on average con-sumption levels and living standards during WWI. Section 3 focuseson childrens’ health: anthropometric measurements of schoolchil-dren and the height of conscripts born during WWII are used,coupled with other socioeconomic indicators, to analyze the effectof war on biological standards of living. Some conclusive remarksfollow.
2. The impact of WWII
2.1. Production and consumption
Italy entered WWII in June 1940. In July 1943, an expeditioncorps of 160,000 servicemen of the Allied forces landed on Sicily.The Allies quickly occupied the Southern regions, and only twomonths later, in September 1943, the King of Italy accepted anarmistice. The Central-Northern regions remained under the con-trol of the Nazis and Fascists and was administered by the ItalianSocial Republic (RSI) led by Mussolini.1 In the summer of 1944,Allied forces liberated much of central Italy, while in the North –above the so-called “Gothic line” – the conflict continued through-out 1944 and the first months of the subsequent year. In April 1945,the Partisan brigades and the Allies liberated the Northern regions,so ending the war (Morgan, 2007, p. 127; Labanca, 2015).
In human and economic terms, the costs of WWII for Italy wereimmense. Deaths among servicemen and civilians amounted to309,453 while another 135,070 were declared missing, for a totalof 444,523 persons (Istat, 1957, p. 3). The loss of life was, however,notably lower than in other countries such as Germany, Polandor Yugoslavia (Lowe, 2012). Aerial bombing on Italy started inMay 1940, after the declaration of war against France and GreatBritain, was intensified in 1943, when the country became onethe main theatres of the war, and ended in April 1945, duringthe Nazis’ retreat (Patricelli, 2007; Baldoli, 2010; De Bernardi andGanapini, 2010, p. 60). It has been estimated that during the warbombardments caused, in total, over 70,000 victims (Gioannini andMassobrio, 2007).
Industrial capital stock was partially damaged. Due to the sys-tematic bombing, some estimates give the proportion of industrialcapacity lost as 12.5% in the North, 38.5% in the Centre, 35% in theSouth and 12% in the Islands, with a weighted average of 19.4%(Jacoboni, 1949, pp. 50–51; Zamagni, 1998). Transport infrastruc-tures suffered substantial damage, thus hampering the provisionof raw materials and industrial products (Daneo, 1975). Privatehousing suffered aerial bombardments: 1.9 million rooms weredestroyed and about 5000 seriously damaged, out of a total of 33.6million rooms existing in 1941 (Zamagni, 1998). Agricultural pro-duction fell in all regions, thus reducing the availability of basicfoodstuffs for the entire population. Between 1940 and 1945, live-stock production diminished by 55% and that of grains halved(Istat, 1968).2 Per capita GDP dropped cumulatively by 57%. It wasthe largest output fall in Italian history (Fig. 1). Per capita GDPreached a minimum in 1945, and returned to the pre-war level onlyin 1949–1950. Household consumption followed a similar trend.While public consumption boomed due to the war effort, privateper capita consumption fell: in 1944–1945, its level was about halfthat of 1920 (Fig. 2).
During the war years 1940 and 1941, food production in Italywas maintained at about the pre-war levels. Food shortages becomeevident in 1942. In the subsequent year, due to military opera-tions, and a severe drought in the southern regions, nutritionalstandards deteriorated, and the average calorie intake fell to about
1 The Italian Social Republic (Republica Sociale Italiana) was established by Mus-solini on September 1943 and lasted until April 1945. Its territory included partof Central Italy not occupied by the Anglo-American army, and the North, with theexception of Friuli Venezia Giulia (Adriatisches Künstenland), Trentino Alto Adige andthe province of Belluno (Alpenvorland), which were directly controlled by the ThirdReich (De Bernardi and Ganapini, 2010, p. 283).
2 For example, between 1939 and 1945, the production of wheat dropped by 47%in the Northern regions, by 38% in the Centre and by 55% in the South and Islands.In Piedmont and Lombardy, production felt by 52%, in Friuli by 80%. In Sicily andApulia, two of the main grain producing regions, production in 1945 was about 40%of that of 1939 (Istat, 1948, pp. 164–165).

Please cite this article in press as: Daniele, V., Ghezzi, R. The impact of World War II on nutrition and children’s health in Italy.Investigaciones de Historia Económica - Economic History Research (2017). https://doi.org/10.1016/j.ihe.2017.09.002
ARTICLE IN PRESSG Model
IHE-353; No. of Pages 13
V. Daniele, R. Ghezzi / Investigaciones de Historia Económica - Economic History Research xxx (2017) xxx–xxx 3
40
30
20
10
-10
-20
-30
1861
1866
1871
1876
1881
1886
1891
1896
1901
1906
1911
1916
1921
1926
1931
1936
1941
1946
1951
1956
1961
1966
1971
1976
1981
1986
1991
1996
2001
2006
2011
0
Ye
arl
y c
ha
ng
es (
%)
Fig. 1. Per capita GDP growth in Italy 1861–2015 (%). Note: Chain-linked volumes (base year 2010).
Source: Data from Baffigi (2015).
250
200
150
100
50
0
1921 1923 1925 1927 1929 1931 1933 1935 1937 1939 1941 1943 1945 1947 1949 1951
Private per capita
Public
Private
Consum
ption 1
921 =
100
Fig. 2. Private, public and private per capita consumption in Italy 1921–51 (1921 = 100). Note: Consumption in constant prices (1938 Italian liras).
Source: Data from Baffigi (2015).
2000 calories per day. During 1944–1945, almost the entire pop-ulation was subject to relocation, and food consumption fell to anaverage of 1900 calories per day (U.S. Department of Agriculture,1946, p. 83). The trends of average calories available, and the shareof calories from proteins during the period 1911–1947 are illus-trated in Fig. 3. According to these estimates, derived from nationaleconomic accounts, in wartime, the availability of per capita calo-ries per day dropped with respect to the previous average, reachinga minimum of 1733 c./d. in 1945, and the share of calories derivingfrom protein followed a similar trend.
Data show how, during WWII, the availability of foodstuffs and,hence, average consumption levels, dropped. In 1945 the consump-tion of meat and fish was about half, and that of dry legumes threequarters, that of 5 years earlier (Table 1). Consumption of mostfoodstuffs returned to pre-war levels only in 1951.
Aggregate data from national economic accounts provide auseful, but partial, representation of the real consumption lev-els of individuals during WWII. The availability of calories doesnot completely coincide, in fact, with individuals’ effective calo-rie intake. Discrepancies derive, for example, from waste duringthe production process or final consumption. In addition, data onfood consumption from official statistics do not include food self-produced by households, a factor that was particularly relevant inrural areas, or foodstuffs purchased on the black market. However,
in wartime, the dramatic fall in agricultural and agro-industrial pro-duction, coupled with the rationing of foodstuffs, impacted notablyon the nutritional standards of households, especially in the urbancentres (Morgan, 2007, pp. 61–65). An inquiry conducted in 1942 ona sample of 334 households in 15 Italian provinces, concluded that39–42% of non-rural households suffered from starvation, whilethe nutrition of peasant households was, quantitatively, not sig-nificantly dissimilar to that of the pre-war years (Luzzatto Fegiz,1948, p. 13). For the greater part of population, the situation wasmade more dramatic by the very high inflation rate. In 1943, theconsumer price index increased by 67.7% with respect to the pre-vious year, and in 1944 by 344.4% (Table 2). In 1944, one kilogramof bread cost 48 times more than in 1940, one kilogram of pasta 95times more and one kilogram of beef about 30 times the pre-warprice.
During the war, scarce foodstuffs were distributed through arationing system implemented by national and local institutions.3
3 The rationing system was established by the Law no. 577 of the 6th May 1940,followed by the Ministerial Decree of the 12th September 1940 and subsequent reg-ulations. Essentially, the system was based on the compulsory pooling of agriculturalproducts (ammassi), that had been established in Italy since the 1930s, administeredprices and individual rationing cards (see Ronchi et al., 1948).

Please cite this article in press as: Daniele, V., Ghezzi, R. The impact of World War II on nutrition and children’s health in Italy.Investigaciones de Historia Económica - Economic History Research (2017). https://doi.org/10.1016/j.ihe.2017.09.002
ARTICLE IN PRESSG Model
IHE-353; No. of Pages 13
4 V. Daniele, R. Ghezzi / Investigaciones de Historia Económica - Economic History Research xxx (2017) xxx–xxx
3500
3000
2500
2000
1500
1000
15
14.5
14
13.5
13
13.6 13.6
1733
1911
1913
1915
1917
1919
1921
1923
1925
1927
1929
1931
1933
1935
1937
1939
1941
1943
1945
1947
Protein
19
11
19
13
19
15
19
17
19
19
19
21
19
23
19
25
19
27
19
29
19
31
19
33
19
35
19
37
19
39
19
41
19
43
19
45
19
47
Calories
Calo
ries
Pro
tein
share
/%
)
Figure 3. Average calories available and share of proteins in total calories, Italy1911–1947Note: data from national economic accounts.Source: Barberi (1961) and Istat (1968).
Table 1
Per capita consumption of some foodstuffs (kg per year) 1931–1951.
Meat Fish Potatoes Legumes Grains Sugar
1931 21.1 3.5 26.6 12.2 216.7 7.81940 21.2 4.1 44.6 10.1 208.2 7.81945 10.6 2.2 17.7 3.1 138.6 2.81948 13.4 3.3 41.9 5.8 186.1 9.71951 15.4 4.0 38.1 5.4 199.6 12.6
Source: Istat (1968).
Table 2
Annual changes in the consumer price index and to the prices of principal foodstuffsin Italy 1940–1949 (%).
Price index Bread Pasta Rice Potatoes Meat beef Milk
1940 16.7 8.6 6.5 9.7 41.7 23.2 10.81941 15.7 −1.4 15.6 4.4 19.6 19.0 25.01942 15.6 1.5 −1.9 0.6 36.1 4.5 26.71943 67.7 7.9 2.0 8.4 33.7 25.1 27.21944 344.4 413.3 614.4 1301.1 809.0 691.9 351.01945 97.0 96.2 81.9 123.2 68.9 84.4 113.11946 18.0 53.8 58.6 54.1 18.2 29.7 48.21947 62.1 95.6 81.9 93.5 28.2 100.5 55.01948 5.9 27.3 9.9 −34.5 −32.0 2.6 21.01949 1.5 6.3 3.0 −19.7 −5.9 −1.3 1.3
Source: Istat (2012), Serie storiche, http://seriestoriche.istat.it.
Note: For foods, price changes refer to kg units (litres for milk). For the years 1943onwards, free market prices for foodstuffs were considered, while for the years priorto the war legal prices were taken into account. The prices for bread and pasta from1944 to 1949 represent the average between legal prices and free market prices,weighted by the quantities sold in the two markets.
Due to flaws in organization and distribution, and for the scarcesupply of foodstuffs from agriculture to compulsory pooling(ammassi), the rationing system in Italy was far from effective(Ronchi et al., 1948; Morgan, 2007, pp. 66–68). The other flawregarded the rations in themselves. It has been estimated, in fact,
Table 3
Total average rations for normal consumers in some countries 1940–1944 (caloriesper head per day).
1940 1941 1942 1943 1944
Germany 2125 2020 1940 1990 2000Czechoslovakia, Prot. 2045 1950 1875 1800 1760Netherlandsa – 1800 1785 1845 1765Finland 1790 1650 1375 1640 1775Belgium – 1375 1325 1365 1555Norway – 1580 1445 1445 1445France – 1230 1110 1605 1135Poland – 1290 1235 1135 1160Italy – 1160 1020 930 990
Source: League of Nations Food (1946, pp. 18–19).a In the winter of 1944–1945, the area of the Netherlands occupied by Nazis troops
suffered a period of famine (Hart, 1993).
that the food rations distributed to individuals covered barely 60%of normal daily needs (Ronchi et al., 1948). The total calories per dayprovided by the rations in Italy and other countries are reportedin Table 3. Data refer to “normal consumers”, an administrativeconcept that comprised the overwhelming majorities of the popu-lations. Certain groups of people, such as children, had smallerrations than “normal consumers”; others, like heavy workers, largerrations (League of Nations Food, 1946, p. 11). In Italy, the total calo-ries provided by the rationing of these foodstuffs was lower thanin the other nations, even though the difference derived mainlyfrom the very low rations of potatoes, that were rationed locally,according to their availability.
In 1940–1944, in Germany, the total calorie level of rations fora normal consumer was remarkably close to 2000 per day; in theNetherlands, rations provided around 1800 calories; in the BalticStates, Belgium, Finland and Slovakia, the level varied between1300 and 1700 calories a day; in France and Poland about 1150calories. Italy, with barely 1000 calories a day, was at the bottom ofthe list (League of Nations Food, 1946, p. 21). Among countries witha total rationing system, only in Spain and Greece was the amountof daily calories provided by rations lower than in Italy (League ofNations, 1944). In Spain, in 1942, the rations of bread and cere-als provided 400 calories per head/day (League of Nations, 1942,p. 30); in the Balkans, the nutritional conditions were even morecritical, particularly in Greece, where in 1941–1942 a severe famineoccurred, and more 100,000 people starved to death (Lowe, 2012).
Physiological requirements change in the different periods ofindividual growth, and are also related to subjective conditions (e.g.
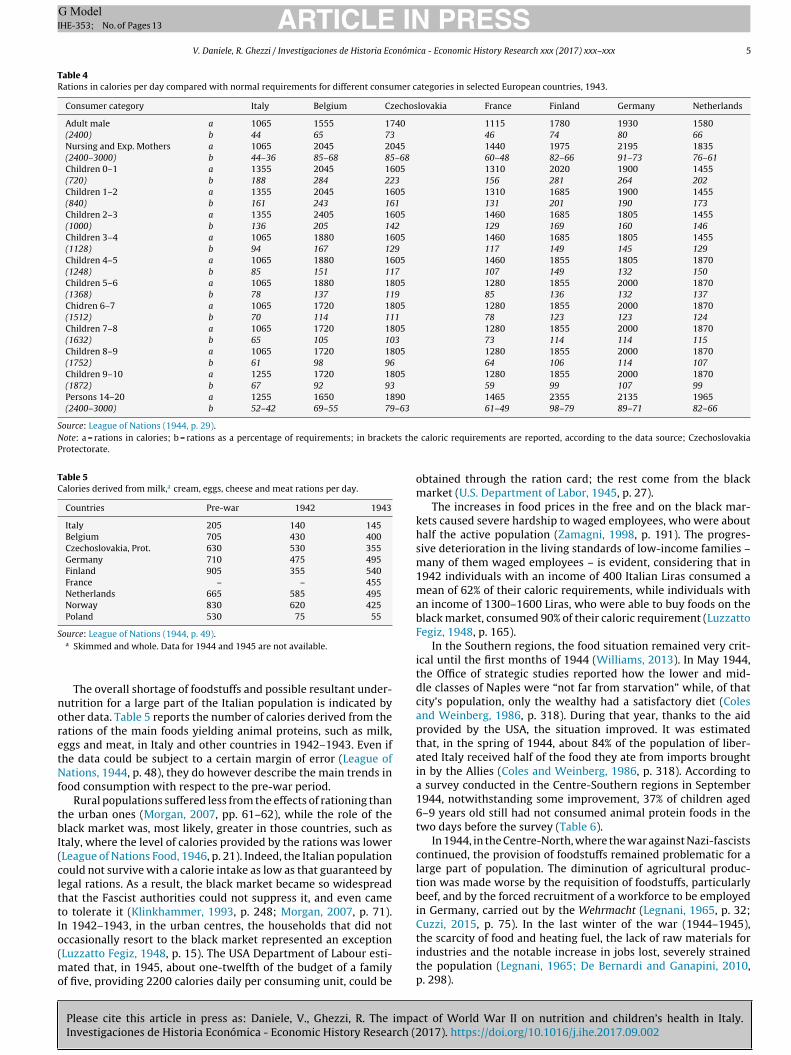
pregnancy or nursing). Food rations were, however, differentiatedfor diverse categories of individuals. Table 4 contains data for adultmales, nursing and expectant mothers, and for children at differentages and in diverse countries; it also contains the number of caloriesprovided by each ration, the caloric needs (in brackets), and theratio between the caloric requirements and real rations.
It is easy to see how the ratio between requirements and rationsis high throughout for the youngest age groups: for example, forchildren <1 age, ratios provided 264% of the needs in Germany, 284%in Belgium, 156% in France and 188% in Italy. This is explained bythe fact that, since it was difficult to change the rations of a child atfrequent intervals, children and adolescents were subdivided into3 or 4 groups. Hence, since physiological needs change at differentages, the ratio between requirements and rations diminished withthe increasing age of individuals (League of Nations, 1944). Nationalvariations are also explained by the differences in grouping and ofrations provided. From Table 4 it is apparent how ineffective therationing system in Italy was: for all the categories (adults, expect-ant mothers, and children aged 3+), the Italian population receivedthe lowest ratios between requirements and rations among thecountries considered.
Please cite this article in press as: Daniele, V., Ghezzi, R. The impact of World War II on nutrition and children’s health in Italy.Investigaciones de Historia Económica - Economic History Research (2017). https://doi.org/10.1016/j.ihe.2017.09.002
ARTICLE IN PRESSG Model
IHE-353; No. of Pages 13
V. Daniele, R. Ghezzi / Investigaciones de Historia Económica - Economic History Research xxx (2017) xxx–xxx 5
Table 4
Rations in calories per day compared with normal requirements for different consumer categories in selected European countries, 1943.
Consumer category Italy Belgium Czechoslovakia France Finland Germany Netherlands
Adult male a 1065 1555 1740 1115 1780 1930 1580(2400) b 44 65 73 46 74 80 66
Nursing and Exp. Mothers a 1065 2045 2045 1440 1975 2195 1835(2400–3000) b 44–36 85–68 85–68 60–48 82–66 91–73 76–61
Children 0–1 a 1355 2045 1605 1310 2020 1900 1455(720) b 188 284 223 156 281 264 202
Children 1–2 a 1355 2045 1605 1310 1685 1900 1455(840) b 161 243 161 131 201 190 173
Children 2–3 a 1355 2405 1605 1460 1685 1805 1455(1000) b 136 205 142 129 169 160 146
Children 3–4 a 1065 1880 1605 1460 1685 1805 1455(1128) b 94 167 129 117 149 145 129
Children 4–5 a 1065 1880 1605 1460 1855 1805 1870(1248) b 85 151 117 107 149 132 150
Children 5–6 a 1065 1880 1805 1280 1855 2000 1870(1368) b 78 137 119 85 136 132 137
Chidren 6–7 a 1065 1720 1805 1280 1855 2000 1870(1512) b 70 114 111 78 123 123 124
Children 7–8 a 1065 1720 1805 1280 1855 2000 1870(1632) b 65 105 103 73 114 114 115
Children 8–9 a 1065 1720 1805 1280 1855 2000 1870(1752) b 61 98 96 64 106 114 107
Children 9–10 a 1255 1720 1805 1280 1855 2000 1870(1872) b 67 92 93 59 99 107 99
Persons 14–20 a 1255 1650 1890 1465 2355 2135 1965(2400–3000) b 52–42 69–55 79–63 61–49 98–79 89–71 82–66
Source: League of Nations (1944, p. 29).
Note: a = rations in calories; b = rations as a percentage of requirements; in brackets the caloric requirements are reported, according to the data source; CzechoslovakiaProtectorate.
Table 5
Calories derived from milk,a cream, eggs, cheese and meat rations per day.
Countries Pre-war 1942 1943
Italy 205 140 145Belgium 705 430 400Czechoslovakia, Prot. 630 530 355Germany 710 475 495Finland 905 355 540France – – 455Netherlands 665 585 495Norway 830 620 425Poland 530 75 55
Source: League of Nations (1944, p. 49).a Skimmed and whole. Data for 1944 and 1945 are not available.
The overall shortage of foodstuffs and possible resultant under-nutrition for a large part of the Italian population is indicated byother data. Table 5 reports the number of calories derived from therations of the main foods yielding animal proteins, such as milk,eggs and meat, in Italy and other countries in 1942–1943. Even ifthe data could be subject to a certain margin of error (League ofNations, 1944, p. 48), they do however describe the main trends infood consumption with respect to the pre-war period.
Rural populations suffered less from the effects of rationing thanthe urban ones (Morgan, 2007, pp. 61–62), while the role of theblack market was, most likely, greater in those countries, such asItaly, where the level of calories provided by the rations was lower(League of Nations Food, 1946, p. 21). Indeed, the Italian populationcould not survive with a calorie intake as low as that guaranteed bylegal rations. As a result, the black market became so widespreadthat the Fascist authorities could not suppress it, and even cameto tolerate it (Klinkhammer, 1993, p. 248; Morgan, 2007, p. 71).In 1942–1943, in the urban centres, the households that did notoccasionally resort to the black market represented an exception(Luzzatto Fegiz, 1948, p. 15). The USA Department of Labour esti-mated that, in 1945, about one-twelfth of the budget of a familyof five, providing 2200 calories daily per consuming unit, could be
obtained through the ration card; the rest come from the blackmarket (U.S. Department of Labor, 1945, p. 27).
The increases in food prices in the free and on the black mar-kets caused severe hardship to waged employees, who were abouthalf the active population (Zamagni, 1998, p. 191). The progres-sive deterioration in the living standards of low-income families –many of them waged employees – is evident, considering that in1942 individuals with an income of 400 Italian Liras consumed amean of 62% of their caloric requirements, while individuals withan income of 1300–1600 Liras, who were able to buy foods on theblack market, consumed 90% of their caloric requirement (LuzzattoFegiz, 1948, p. 165).
In the Southern regions, the food situation remained very crit-ical until the first months of 1944 (Williams, 2013). In May 1944,the Office of strategic studies reported how the lower and mid-dle classes of Naples were “not far from starvation” while, of thatcity’s population, only the wealthy had a satisfactory diet (Colesand Weinberg, 1986, p. 318). During that year, thanks to the aidprovided by the USA, the situation improved. It was estimatedthat, in the spring of 1944, about 84% of the population of liber-ated Italy received half of the food they ate from imports broughtin by the Allies (Coles and Weinberg, 1986, p. 318). According toa survey conducted in the Centre-Southern regions in September1944, notwithstanding some improvement, 37% of children aged6–9 years old still had not consumed animal protein foods in thetwo days before the survey (Table 6).
In 1944, in the Centre-North, where the war against Nazi-fascistscontinued, the provision of foodstuffs remained problematic for alarge part of population. The diminution of agricultural produc-tion was made worse by the requisition of foodstuffs, particularlybeef, and by the forced recruitment of a workforce to be employedin Germany, carried out by the Wehrmacht (Legnani, 1965, p. 32;Cuzzi, 2015, p. 75). In the last winter of the war (1944–1945),the scarcity of food and heating fuel, the lack of raw materials forindustries and the notable increase in jobs lost, severely strainedthe population (Legnani, 1965; De Bernardi and Ganapini, 2010,p. 298).

Please cite this article in press as: Daniele, V., Ghezzi, R. The impact of World War II on nutrition and children’s health in Italy.Investigaciones de Historia Económica - Economic History Research (2017). https://doi.org/10.1016/j.ihe.2017.09.002
ARTICLE IN PRESSG Model
IHE-353; No. of Pages 13
6 V. Daniele, R. Ghezzi / Investigaciones de Historia Económica - Economic History Research xxx (2017) xxx–xxx
Table 6
Percentage of children 6–9 years old who in the two days before the survey con-sumed animal protein foods – September 1944.
Regions No times Once or twice 3 or more times Number
Umbria 36.8 32.8 30.4 201Latium 31.0 37.7 31.3 310Abruzzi 44.4 34.3 21.3 531Campania 39.0 31.9 29.1 764Apulia 46.0 29.9 24.1 659Basilicata 51.5 31.7 16.8 167Calabria 39.0 34.2 26.8 477Sicily 34.7 37.2 28.1 810Sardinia 10.0 30.2 59.8 401Total 37.0 33.4 29.6 4320
Source: Commissione alleata et al. (1945, p. 149).
It has been estimated that during WWII about 45–65% of theItalian population was undernourished (Vecchi, 2011, p. 22). How-ever, deprivation was even greater in the immediate post-waryears. In the second half of 1945, in Italy, the mean level of con-sumption of the non-farm population was about 1500 calories perday, compared to 2400–2900 calories in the Northern Europeannations (League of Nations Food, 1946, pp. 84–85). The pre-warestimated mean number of calories consumed in Italy was 2550(League of Nations Food, 1946, p. 84), a figure consistent withthe 2658 calories available per capita reported by Vecchi (2011,p. 417).
The war exacerbated the misery that was widespread through-out the entire territory, but especially in the Southern regions thatwere historically lagging behind. The North-South divide in percapita GDP, which progressively increased during the first half of20th century, reached 50% in 1951 (Daniele and Malanima, 2014). AParliamentary inquiry, carried out in the years 1951–1953, showedhow the Italian economy was particularly depressed (CommissioneParlamentare, 1953). The cited inquiry estimated that 1,357,000households (11.8% of the national total) had a standard of livingdefined as “miserable”, and another 1,345,000 households (11.6%)as “needy”; 7.5% of Italian households did not consume meat, sugaror wine at all, while another 8.9% had very scarce consumptionlevels. Overall, something like 45% of Italian households consumedinsufficient quantities of the mentioned foodstuffs (CommissioneParlamentare, 1953; Ruffolo, 1954).
3. The impact on children’s nutritional health
3.1. Infant mortality and natality
The adverse impact of war on nutritional health and biologicalwellbeing is particularly relevant for children. Nutritional short-ages, lack of sanitary provision, the absence or death of a fatherand the overall effects of war, produce physical and mental stressthat may have lasting consequences (Goldson, 1996; Shields andBryan, 2002; Devakumar et al., 2014).
From a sample of nearly 600,000 schoolchildren aged 6–19years old, Cox (2015) showed how the shipping embargo imposedby the Allies on Germany at the onset of the WWI, led to nutri-tional deprivation, causing significant loss in weight and heightamong German schoolchildren. In1918, boys were overall 2.57 cmshorter and 1.1 kg lighter than in 1914, while females lost 2.81 cmand 0.99 kg. A loss in physical stature has also been registered forthe Comunidad Valenciana during the Spanish Civil War and theautarchy period (Puche et al., 2016).
In Italy, because of the war, 52,056 people, among servicemenand civilians with children, perished or were declared ‘missing’(Table 7). As a result, 94,648 children lost at least one parent, almostalways the father: 81,516 children were younger than 15 years old
Table 7
Number of deaths and missing persons with children caused by WWII and numberof children of death or missing person in Italy.
Death or missing persons with children Number of children
Military Civilians Of death persons Of missing persons Total <15 years
46,692 5364 52,938 41,710 94,648 81,516
Source: Istat (1957, pp. 38–40).
when their parent died or disappeared due to the war. Children suf-fered the consequences of the conflict directly: 18,000 were injuredand 10,000–12,000 remained maimed for life (Brosse, 1950, p. 67).
The trend of the infant mortality rate (<1 age) in the period1930–1960 is illustrated in Fig. 4, together with the mortality ratefrom infectious and parasitic diseases. In Italy, the infant mortal-ity rate had declined from the end of the 19th century. A peakwas registered in 1918, however, due to the Spanish flu epidemic(Atella et al., 2011). From 1930 to 1940, the infant mortality ratediminished by about 40%. WWII interrupted the decreasing trend.Between 1940 and 1943, infant mortality rate rose from 97 to115 per thousand live births, then diminished. The mortality ratefor infectious and parasitic diseases followed a similar pattern: in1941, the mortality rate began to increase and peaked in 1943,when the conflict entered the Italian territory. It then declined,returning to its pre-war level in 1946. The increase was mainlydue to typhoid fever, the incidence of which went from 90 to 163deaths per one million inhabitants between 1939 and 1943; totuberculosis of the respiratory system, that went from 507 to 802deaths per million inhabitants; to other forms of tuberculosis andinfectious diseases, and to a recrudescence of malaria (Istat, 1950,p. 10).
In the Southern regions, infant mortality rates were histori-cally higher than in the Northern ones (Atella et al., 2011). In 1939for example, infant mortality rates in the Southern regions rangedbetween 95 and 147‰, while in the Northern ones between 61 and97‰ (Istat, 1950, p. 4). In wartime, the regional changes in infantmortality during the conflict were different. Fig. 5 shows the dif-ferences in infant mortality rates respect to the pre-war level, in1943 and 1945 in the twenty Italian regions. It is easy to see how,in 1943, infant mortality rates were higher than in 1939 every-where in the country, except for five regions in the Centre-NorthEast. In 1945, in the South and part of the Centre infant mor-tality rates returned to their pre-war level or were even lower;instead, in the rest of the country, the rates remained higher thanin 1939.
During WWII, the natality rate decreased in Italy. The num-ber of live births per 1000 inhabitants went from 23.6 in 1939 to18.5 in 1945; in 1946, it increased to 22.7 per 1000 (Istat, 1940,1952). Even though in the Southern regions, natality rates werehigher than in the Centre-North, the conflict impacted negativelyon all regions. Fig. 6 illustrates the regional differences in natal-ity rates in 1943 with respect to the 1939 levels, and in 1945 withrespect to the 1943 levels. The map shows how in 1943 natalitydiminished in all Italian regions, except in the Valle d’Aosta and inTrentino Alto Adige. During 1944–1945, in the North-Centre Italy,natality rates continued to decline, while in the South and Isles itincreased (Istat, 1952, p. 14). In fact, as shown in Fig. 6, natalityin the Centre-North remained notably lower than the 1943 level.Overall, the trends in infant mortality and natality rates seem toreflect the ‘geography of the conflict’ in Italy. As noted above, infact, in 1944 the South of Italy was controlled by the Allies, whilethe conflict continued in the rest of the country occupied by theNazi-Fascists.

Please cite this article in press as: Daniele, V., Ghezzi, R. The impact of World War II on nutrition and children’s health in Italy.Investigaciones de Historia Económica - Economic History Research (2017). https://doi.org/10.1016/j.ihe.2017.09.002
ARTICLE IN PRESSG Model
IHE-353; No. of Pages 13
V. Daniele, R. Ghezzi / Investigaciones de Historia Económica - Economic History Research xxx (2017) xxx–xxx 7
120
100
80
60
40
20
Infant mortality Infectious diseases
0
Ind
ex 1
93
0 =
10
0
1931
1932
1933
1934
1935
1936
1937
1938
1939
1940
1941
1942
1943
1944
1945
1946
1947
1948
1949
1950
1951
1952
1953
1954
1955
1956
1957
1958
1959
1960
Fig. 4. Infant mortality rate (<1 age) and mortality rate for infectious and parasitic disease in Italy, 1930–1960 (Index 1930 = 100).
Source: Infant mortality: Istat, serie storiche, http://seriestoriche.istat.it; infectious diseases: Istat (1976).
1943 1945
-10...00...10
10...2020...30
30...40
-10...00...10
10...2020...30
30...40
Fig. 5. Infant mortality in 1943 and 1945 in the Italian regions (index 1939 = 100). Note: Differences are in percentage points. Darker colour indicates higher mortality.Source: Calculations on Istat (1950, p. 4).
1943
<-20-20...-15-15...-10-10...-5-5...0>0
<-20-20...-15-15...-10-10...-5-5...0>0
1945
Fig. 6. Natality rates in 1943 (index 1939 = 100) and in 1945 (index 1943 = 100) in the Italian regions. Note: Differences are in percentage points. Darker colour indicateslower natality rates.
Source: Calculations on Istat (1940, p. 28–29; 1952, p. 14).

Please cite this article in press as: Daniele, V., Ghezzi, R. The impact of World War II on nutrition and children’s health in Italy.Investigaciones de Historia Económica - Economic History Research (2017). https://doi.org/10.1016/j.ihe.2017.09.002
ARTICLE IN PRESSG Model
IHE-353; No. of Pages 13
8 V. Daniele, R. Ghezzi / Investigaciones de Historia Económica - Economic History Research xxx (2017) xxx–xxx
Table 8
Rome, height of 6–11 year-old boys and girls, 1939–41, 1945, 1949, and differences between measurements (cm).
Boys Girls
(1) (2) (3) (4) (5) (6) (7) (8) (9) (10) (11)Ages 1939–1941 1945 1949 (3)–(2) (4)–(3) 1939–1941 1945 1949 (8)–(7) (9)–(8)
6 114.1 112.6 118.3 −1.5 5.7 114.7 114.1 115.3 −0.6 1.27 119.0 117.3 121.6 −1.7 4.3 118.4 117.5 120 −0.9 2.58 125.6 123.2 126.7 −2.4 3.5 123.9 123.5 126.3 −0.4 2.89 130.5 128 130.9 −2.5 2.9 128.4 128.2 130.4 −0.2 2.2
10 134.7 131.9 136.1 −2.8 4.2 133.3 133.1 133.9 −0.2 0.811 136.6 136.2 138.4 −0.4 2.2 138.2 136.6 141.3 −1.6 4.7
Source: For 1939–1941 and 1945, Galeotti (1948); for 1949, Bacchetta (1951, p. 93).
Table 9
Rome, weight of 6–11 year-old boys and girls, 1939–1941, 1945, 1949, and differences between measurements (kg).
Boys Girls
(1) (2) (3) (4) (5) (6) (7) (8) (9) (10) (11)Ages 1939–1941 1945 1949 (3)–(2) (4)–(3) 1939–1941 1945 1949 (8)–(7) (9)–(8)
6 20.3 20.2 25.5 −0.1 5.3 21 20.4 23.1 −0.6 2.77 22.4 22.3 26.6 −0.1 4.3 22.7 21.7 25.2 −1 3.58 25.7 24.8 28.3 −0.9 3.5 24.7 24.2 27.9 −0.5 3.79 28.2 27.2 30.3 −1 3.1 27 26.5 30.5 −0.5 4
10 30.7 29.3 33.8 −1.4 4.5 29.8 29.4 32.6 −0.4 3.211 32.4 31.4 34 −1 2.6 32.5 31.6 36.5 −0.9 4.9
Source: See Table 8.
3.2. Anthropometric data
Anthropometric measurements are widely used indicators ofthe standards of living of populations (Komlos and Meermann,2007; Silventoinen, 2003; Ayuda and Puche, 2014; Grasgruber et al.,2014). Anthropometric measurements, especially height, are theresult of the interaction between genes and environment (McEvoyand Visscher, 2009). Nutritional standards during pregnancy and inchildhood, together with health conditions, are key factors affectingheight, weight and, consequently, the body-mass index in adult-hood (Bogin, 2001). These factors also affect the incidence of somediseases in the course of life. There is evidence to show how expo-sure to war in childhood, diseases and environmental conditions,can affect the height and weight of children, producing long-lastingeffects on physical and psychological health. These effects havebeen documented, for example, for Germany during WWI (Blum,2011, 2013; Cox, 2015). In Spain too, the Civil War and the autarchicpolicies pursued during Franco’s dictatorship had a permanent,detrimental effect on children’s and conscript’s height (Martínez-Carrión et al., 2012; Puche et al., 2016). A transient reduction intemporal trends of children’s weight and height, related to foodrestriction, was instead observed for Norway and Finland duringWWII (Angell-Andersen et al., 2004).
In the case of Italy, there is little evidence concerning children’santhropometric measurements for the war period. In most cases,available anthropometric data refer to samples that changed overtime, regarded diverse Italian regions, or referred to years verydistant from each other: this somewhat limits analysis. There are,however, some studies regarding school-age children that makesome comparisons possible. Three studies refer to Rome and twoto Naples. A study of a sample of 2832 children, aged 6–11 yearsold, of which 52% (1480) were boys, was carried out in 1945 in theschools of Rome, with the aim of verifying the impact of WWII onchildren’s nutritional health (Galeotti, 1948). In Tables 8–9, heightand weight measurements are reported for boys and girls respec-tively, together with similar measurements regarding 1939–1941and 1949. The 1939–1941 data were collected by the Office ofPublic Health of the Municipality of Rome from a sample of 1800schoolchildren, and reported in the 1945 study by Galeotti (1948)
for comparison purposes. The measurements for Roman andNeapolitan schoolchildren in 1949 were collected during researchthat involved 13,619 schoolchildren in all the Italian regions and,in the same research, were separately reported and compared withprevious data regarding the two cities (Bacchetta, 1951, p. 48, 93).4
The comparisons clearly show how WWII impacted negativelyon the anthropometric measurements of schoolchildren in Rome.In 1945, at the age of 6 years old, boys were shorter by 1.5 cm than in1939–1941, while girls were 0.6 cm shorter (Table 8, col. 5). At theage of 11, the difference for boys was −0.4 cm and for girls −1.6 cm.In addition, the weight of both boys and girls in 1945 was less thanin 1939–1941 (Table 9, col. 5). For boys, the difference in weightbetween the samples from 1939 to 1941 and 1945 was very smallat the age of 6–7 years and about 1 kg for those aged 8–11 years;instead for girls, the larger differences were registered for the agesof 7 and 11 years old, and were 1 and 0.9 kg respectively. In thepost war period, there was a significant gain in height and weight.Between 1945 and 1949 the height of 11 year-old boys increasedby 2.2 cm, and their weight by 2.6 kg, on average (Tables 8 and 9,col. 6).
Even though these gains may appear large, given the rela-tively short time-span, it is noteworthy that for all the consideredages there were systematic and significant differences in anthro-pometric measurements between the three inquiries. Significantincreases in weight and height were also registered for schoolchil-dren in Naples between 1944 and 1949 (Tables 10 and 11). Itgoes almost unnoticed that the reported anthropometric dataconcern samples of children living in two large cities and, thus,cannot be considered as representative of the entire Italian nationalpopulation.5
4 This study does not report the number of observations for the Rome and Naplessamples but it is reported for the respective regions, that is 1403 schoolchildren(703 boys) for Latium and 976 (569 boys) for Campania (Bacchetta, 1951, p. 91).
5 The samples of schoolchildren in Rome and Naples may, to some extent, beconsidered representative of the urban population; it is, however, necessary to bearin mind that WWII had different regional impacts and that, in addition, the economicand nutritional conditions of Italian regions were heterogeneous.

Please cite this article in press as: Daniele, V., Ghezzi, R. The impact of World War II on nutrition and children’s health in Italy.Investigaciones de Historia Económica - Economic History Research (2017). https://doi.org/10.1016/j.ihe.2017.09.002
ARTICLE IN PRESSG Model
IHE-353; No. of Pages 13
V. Daniele, R. Ghezzi / Investigaciones de Historia Económica - Economic History Research xxx (2017) xxx–xxx 9
Table 10
Naples, height of 6–11 year-old boys and girls in 1944 and 1949, and differencesbetween 1944 and 1949 (cm).
Boys Girls
(1) (2) (3) (4) (5) (6) (7)Age 1944 1949 (3)–(2) 1944 1949 (6)–(5)
6 108.8 112.4 3.60 107.4 110.6 3.207 113.5 117.1 3.60 111.5 117.3 5.808 117.2 122.4 5.20 118.4 121.7 3.309 122.4 124.7 2.30 123.6 127.8 4.20
10 127.8 130.4 2.60 128.1 131.0 2.9011 130.3 136.8 6.50 132.6 133.2 0.60
Source: Bacchetta (1951, p. 93).
Table 11
Naples, weight of 6–11 year-old boys and girls in 1944 and 1949, and differencesbetween 1944 and 1949 (kg).
Boys Girls
(1) (2) (3) (4) (5) (6) (7)Age 1944 1949 (3)–(2) 1944 1949 (6)–(5)
6 18.0 19.89 1.89 17.7 18.85 1.157 20.3 22.11 1.81 19.9 21 1.108 22.3 23.77 1.47 21.7 24.16 2.469 24.5 25.13 0.63 24 25.06 1.06
10 26.7 27.23 0.53 26 27.47 1.4711 28.1 30.32 2.22 27.2 29.61 2.41
Source: See Table 10.
Even considering the possible limitations deriving from differ-ent samples or measurement methods used, the differences in thesomatic development of schoolchildren between 1945 and pre-warand post-war years, can be attributed to the precarious and insuf-ficient nutritional conditions during the conflict (Galeotti, 1948, p.57; Bacchetta, 1951). The diminution in height and weight between1939–1941 and 1945 observed for Roman schoolchildren and,especially, the gains registered in 1949 in the two cities sampled,are consistent with the trends in GDP and consumption per capita.Notwithstanding the aftermath of the war, and the destruction ofproductive capacity and infrastructures, by 1949 the fall in aggre-gate production and consumption levels had, in fact, been almostcompletely restored, and children’s height and weight reflectedthese general improvements.
Were the adverse effects of war on anthropometric measure-ments long-lasting or, instead, transient? Research indicates that, inthe human life-cycle, two growth periods are especially importantfor determining adult height: the first period goes from concep-tion to 2 years of age, while the second occurs before the onset ofpuberty (Perkins et al., 2016, p. 150). This last is defined as an oppor-tunity for ‘catch-up growth’: it is characterized by a body growththat is more rapid than normal for age, and follows a period ofgrowth inhibition (Perkins et al., 2016). This phase of ‘catch-up’ isnot always sufficient, however, to fully redress deficiencies in thefirst growth period and achieve full growth potential (Leroy et al.,2014).
To evaluate the eventual permanent effects of food deprivationor physiological stresses on health, height in adulthood is a moreappropriate indicator than children’s height. Adult height, in fact, isthe result of the cumulative balance between nutritional intake andloss during the life-cycle, particularly during the growth periods(Perkins et al., 2016). A child’s height or body mass index reflect,instead, current nutrition, or the immediate effect of environmentalfactors, and may not fully represent the effects of catch-up growth.
3.3. The effects on height
A strategy to evaluate possible permanent effects on healthof exposure to warfare during childhood and pre-adolescence isthat of using the height of conscripts. In Italy, military service wasmandatory, so 18-year-old males were subject to a medical exam-ination during which height, weight and thoracic circumferencewere recorded (Arcaleni, 1998, 2006).6 The average height of Ital-ian conscripts born in the years 1930–1960 is reported in Fig. 7. Thesecular increase in height that characterized Italy during the lastcentury, like other developed countries, is evident (Sanna, 2002;Danubio and Sanna, 2008; A’Hearn and Vecchi, 2011; Arcaleni,2012). The increasing trend was interrupted in 1943–1944, while in1945 the average height diminished with respect to the previousyear. This interruption of secular trend in height during the twoWorld wars was also found in other European countries, such asBelgium and Greece (Malina, 1990; Hatton and Bray, 2010).
Over the considered period, negative variations in height wereregistered in 1945 (−0.4 cm) and in 1948 (−0.1 cm) with respect tothe previous years. Conscripts born in 1945 were, therefore, 0.8 cmshorter than the 1946 cohort (Fig. 8).
Fig. 9 reports the histogram of height in the years 1943–1946.It is evident that the distribution changed between 1943 and 1946,with a marked increase in the shares of conscripts in the highestclasses (>169 cm) of the distribution. The diminution of the averageheight of the conscripts born in 1945 is explained by the increasein the share of individuals in the classes <165 cm and by a corre-sponding decrease of those falling in the classes >169. In 1946, thedistribution shows, instead, a comparatively higher frequency ofsubjects taller than 169 cm, while the frequency of those shorterthan 165 cm is lower.
In the last century, modifications in the distribution of meanheight have been documented for several countries (Hermanussenet al., 1995; Staub et al., 2015). In developed nations, the distribu-tion of height is nearly symmetrical (Arcaleni, 2006; A’Hearn et al.,2009; Staub et al., 2015). In the case of inadequate nutrition fora large proportion of a population, as in pre-modern times, or insome developing countries today, the shape of height distribution,instead, deviates from symmetry, presenting a left-tail (Deaton,2008; A’Hearn et al., 2009). For example, in Italy, in 1874, the dis-tribution of height of Italian conscripts was negatively skewed,indicating an over-representation of individuals in the left tail ofthe distribution. Skewness passed to values near to zero in 1938and, subsequently, assumed slightly positive values, indicating asmall excess of subjects in the right tail of the distribution; simulta-neously, kurtosis progressively decreased, assuming values typicalof a normal distribution (Terrenato and Ulizzi, 1983).
The changes in the distribution of height, and the negative varia-tion registered in 1945, may suggest a permanent, although small,adverse effect of the war, due to the nutritional deprivation thatthe 1945 cohort was subject to, in the first year of life or in utero,as has been suggested by previous studies (Grassivaro Gallo, 1972;Hermanussen et al., 1995). This conclusion could be misleading,however, if we do not consider the possible effects deriving fromthe regional changes regarding the cohort of conscripts born in
6 Compulsory military service was established in 1863. Initially, the medicalexamination for military recruitment was usually performed at the age of 20, butoccasionally at a younger age. Starting from the cohort born in 1941, the medicalexamination was performed at the age of 18 (Istat, 2012, p. 190). For this reason,national average height is standardized at the age of 20 (Istat, 1976, 1986). The dif-ference between the measured average height and that centred at 20 years was,however, significant until the 1930s; subsequently, the difference became negligi-ble (Arcaleni, 1998, p. 30). For the methodology of the adjustment of height at 20years of age see: Costanzo (1948), Arcaleni (1998, 2012), A’Hearn and Vecchi (2017,p. 81).

Please cite this article in press as: Daniele, V., Ghezzi, R. The impact of World War II on nutrition and children’s health in Italy.Investigaciones de Historia Económica - Economic History Research (2017). https://doi.org/10.1016/j.ihe.2017.09.002
ARTICLE IN PRESSG Model
IHE-353; No. of Pages 13
10 V. Daniele, R. Ghezzi / Investigaciones de Historia Económica - Economic History Research xxx (2017) xxx–xxx
174
173
172
171
170
169
168
167
166
165
164
Heig
ht(
cm
)
1930
19
31
193
2
193
3
193
4
193
5
193
6
193
7
193
8
193
9
1940
1941
1942
1943
1944
1945
1946
1947
1948
1949
1950
1951
1952
1953
1954
1955
1956
1957
1958
1959
1960
Fig. 7. Height of the Italian conscripts born in 1930–1960.
Source: Istat (1976, 1986).
1.2
1.0
0.8
0.6
0.4
0.2
0.0
-0.2
-0.4 -0.4
-0.1
0.8
-0.6
1930
193
1
193
2
193
3
193
4
193
5
193
6
193
7
193
8
193
9
1940
1941
1942
1943
1944
1945
1946
1947
1948
1949
1950
1951
1952
1953
1954
1955
1956
1957
1958
1959
1960
Average
Yearl
y v
ari
ations (
cm
)
Fig. 8. Yearly variations in the heights of the conscripts born in 1930–1960 (cm).
Source: See Fig. 7.
35
30
25
20
15
10
5
0
Fre
quencie
s(%
)
<145 145-149 150-154 155-159 160-164 165-169 170-174 175-179 180>
Height classes
1943
1944
1945
1946
Fig. 9. Histogram of height of conscripts born in 1943–1946.
Source: Calculations on Istat (2012), serie storiche, http://seriestoriche.istat.it.

Please cite this article in press as: Daniele, V., Ghezzi, R. The impact of World War II on nutrition and children’s health in Italy.Investigaciones de Historia Económica - Economic History Research (2017). https://doi.org/10.1016/j.ihe.2017.09.002
ARTICLE IN PRESSG Model
IHE-353; No. of Pages 13
V. Daniele, R. Ghezzi / Investigaciones de Historia Económica - Economic History Research xxx (2017) xxx–xxx 11
Table 12
Conscripts per macro-regions (%) and total numbers in Italy 1942–1946.
1942 1943 1944 1945 1946
North 43.6 43.0 43.8 40.1 42.5Centre 17.8 18.4 17.7 18.4 18.5South 38.7 38.6 38.5 41.6 39.0
Num. conscripts 356,126 355,899 349,578 337,422 398,280
Source: Istat (1969, 1970).
1945. In Italy, in fact, there are significant regional differences inaverage height (Arcaleni, 1998, 2006; A’Hearn and Vecchi, 2011).In the Centre-North, height is historically higher than in the South-Islands: the difference between the two areas was, respectively,4.9 cm in 1941, 3.9 cm in 1951 and 3.7 cm in 1961 (A’Hearn andVecchi, 2011, p. 56).7
As previously noted, until April 1945, the Northern regions wereoccupied by Nazi-Fascists, while the Allied forces had already lib-erated the Southern part of Italy in 1943. Since, in 1944, Northernregions were still involved in the conflict, natality fell in the subse-quent year. The fall in natality, modifying the regional shares ofconscripts born in 1945, could explain the reduction in averageheight and the modification of the shape of height distribution inthe national sample. In fact, in 1945, the number of male childrenborn in the Northern regions diminished by 14.4% with respect tothe previous year, while in the South it increased by 13.6% (Istat,1952). These changes in natality modified the regional shares ofconscripts at the military recruitment medical check-up. As shownin Table 12, the share of conscripts born in 1945 in the Southernregions was higher, and that of the Northern areas lower, than inthe other years considered.
These data suggest that the negative variation registered for theaverage height of Italian conscripts born in 1945 may be due to tworeasons: a ‘nutritional effect’ that impacted on height, and a ‘natal-ity effect’ that modified the regional shares of conscripts born inthat year. In order to disentangle these two effects on total varia-tion in height observed in Italy, we computed the average height in1945 by applying the 1944 regional distribution of the conscripts.Thus, we obtained a measure of average height that cancelled outthe effect due to changes in natality rates in the regional distri-bution of height. The difference between this measurement andthe height recorded in 1945 gives the variation due to nutritionalaspects, which accounts for about 55% of the total variation inheight registered for Italian conscripts between 1944 and 1945,and it is estimated at −0.22 cm.
The different impacts and the length of the conflict in the diverseareas of Italy, however, leaves us room to hypothesize that theimpact on height may have been territorially differentiated. To ver-ify this hypothesis, we considered the changes in height in each ofthe twenty Italian regions (Table 13).
Slight decreases in height for the 1943 cohort of conscripts wereregistered in four regions, three of which were in the Centre-South:Latium (−0.8 cm), Molise (−0.3 cm) and Campania (−0.2 cm). Datafor Latium and Campania are consistent with the anthropometricmeasurements of the schoolchildren of Rome and Naples previ-ously presented that, in both cases, show significant differences inaverage height between 1944 and 1949, for children at differentages. In the years 1944 and 1945, height diminished in the North-ern regions and in Latium and Abruzzo. In 1944–1945, the heightof conscripts decreased cumulatively by 1.3 cm in Valle D’Aosta,by 0.9 in Piedmont, Lombardy and in Trentino Alto Adige, and by0.7 cm in Liguria.
7 It is worth noting how in Italy regional differences in height are in part due togenetic factors (Cacciari et al., 2002; A’Hearn and Vecchi, 2017, pp. 71–72).
Table 13
Yearly variations in average height of conscripts in the Italian regions 1940–1945(cm).
Regions 1940 1941 1942 1943 1944 1945 1944–1945
North
Piedmont 0.3 0.1 0.1 −0.3 0.0 −0.8 −0.9Valle D’Aosta −0.4 0.9 0.0 0.3 −0.6 −0.7 −1.3Lombardy 0.2 0.0 0.0 0.4 0.0 −0.9 −0.9Liguria 0.1 0.2 −0.1 0.1 −0.5 −0.2 −0.7Trentino A. A 0.4 0.0 0.8 0.3 −0.9 0.0 −0.9Veneto 0.1 0.2 0.3 0.0 −0.1 0.0 0.0Friuli V.G. 0.6 0.1 0.0 0.2 −0.1 −0.1 −0.1Emilia R. 0.3 0.1 0.2 0.0 0.0 −0.1 −0.1
Centre
Toscana 0.3 −0.1 0.2 0.0 0.2 0.0 0.3Umbria 0.5 −0.3 0.9 0.0 −0.3 0.4 0.1Marche 0.4 0.2 0.4 0.3 0.1 0.0 0.1Latium 0.3 0.5 0.9 −0.8 −0.2 −0.3 −0.5
South and Isles
Abruzzo 0.0 0.1 0.5 0.2 −0.1 −0.5 −0.6Molise 0.1 0.2 0.2 −0.3 −0.1 1.4 1.3Campania 0.0 0.3 0.3 −0.2 0.9 −0.2 0.8Apulia 0.2 0.0 0.0 0.1 −0.1 0.1 0.0Basilicata 0.6 −0.3 0.5 0.0 0.2 −0.1 0.1Calabria −0.1 0.3 0.2 0.2 0.0 0.1 0.1Sicily 0.1 0.1 0.2 0.0 0.0 0.3 0.3Sardinia 0.4 0.5 −0.2 0.2 0.0 0.3 0.3Italy 0.3 0.2 0.2 0.0 0.1 −0.4 −0.3
Source: calculation on Istat (2012), serie storiche, http://seriestoriche.istat.it.
Note: For 1944–1945 cumulated yearly variations.
Table 14
Variations in height in the Italian regions in the period 1930–1950 (cm).
1930–1935 1935–1940 1940–1945 1945–1950
North
Piedmont 0.4 0.7 −0.9 1.2Valle D’Aosta 1.0 0.4 −0.1 1.3Lombardy 0.4 0.5 −0.5 1.3Liguria 0.6 0.7 −0.5 0.6Trentino A. A. 0.4 1.2 0.3 1.3Veneto 0.3 0.5 0.4 1.4Friuli V. G. 0.7 0.9 0.1 1.3Emilia Romagna 0.4 0.5 0.2 1.2
Centre
Tuscany 0.7 0.3 0.4 0.7Umbria 0.5 0.6 0.8 2.7Marche 0.5 1.0 0.9 0.9Latium 0.7 1.0 0.0 0.2
South and Isles
Abruzzo 0.6 0.6 0.2 3.0Molise 0.5 0.8 1.4 1.7Campania 0.6 −0.1 1.1 1.3Apulia 0.4 0.9 0.2 2.1Basilicata 0.3 1.0 0.3 1.9Calabria 0.6 0.3 0.8 1.4Sicily 0.2 0.5 0.7 1.3Sardinia 1.0 0.6 0.8 0.7Italy 0.5 0.7 0.0 1.1
Source: Calculation on Istat (2012), serie storiche, http://seriestoriche.istat.it.
Note: Absolute variations in the selected periods.
The variations in height for Italy and its twenty regions for the 5-year period between 1930 and 1950 are reported in Table 14. In theconsidered time span, the average height continuously increased inall regions, except for Campania in 1935–1940. Between 1940 and1945, height decreased in the four Northern Western regions andin Latium where, however, the diminution was close to zero. InPiedmont, height decreased by 0.9 cm, in Lombardy and Liguria by0.5 cm. In the case of Piedmont, a negative impact of WWII on heightand physical development was observed by Masali and Venturini(1964), who considered anthropometric measurements of samples

Please cite this article in press as: Daniele, V., Ghezzi, R. The impact of World War II on nutrition and children’s health in Italy.Investigaciones de Historia Económica - Economic History Research (2017). https://doi.org/10.1016/j.ihe.2017.09.002
ARTICLE IN PRESSG Model
IHE-353; No. of Pages 13
12 V. Daniele, R. Ghezzi / Investigaciones de Historia Económica - Economic History Research xxx (2017) xxx–xxx
of females and males born between 1940 and 1949, and which theyattributed to nutritional deficiencies.
It is worth noting how the regional picture that emerges fromthe changes in average height coincides with the course of theconflict in Italy: it was in the regions to the North of the GothicLine, where height diminished, that the war lasted until April 1945.Latium – and Rome particularly – suffered from the devastatingconsequences of the repeated air raids. In the Southern regions, therapid advance of the Allied troops in 1943, allowed the populationto suffer for a less time the effects of the war.
4. Conclusions
This paper has examined the effect of WWII on the nutritionalhealth of the Italian population and, particularly, of children. Recentreconstructions of national accounts show that, during the war, percapita GDP and private per capita consumption collapsed by about50% with respect to pre-war levels. The drop in agricultural pro-duction, the difficulties in the distribution of raw materials andthe necessities imposed by the economy of the war, including theprovisioning of the troops, caused a shortage of foodstuffs for theItalian civilian population (Morgan, 2007, p. 65). The shortage wasmade worse by the inefficiency of the rationing system. In Italy,the number of calories provided by rations in 1942–1943 was, infact, notably lower than in other Western Countries, such as France,Germany or Belgium (League of Nations, 1944; League of NationsFood, 1946).
Children in particular suffered the consequences of the conflict.About 94,600 children, 86% of which were younger than 15 yearsof age, lost at least one parent because of the war. Between 1939and 1943, infant mortality increased, given the recrudescence ofinfectious and parasitic diseases. During the war, the natality ratefell. At the regional level, the trends in infant mortality and natalitywere different, and appear to be related to the ‘geography of thewar’ in Italy. After 1943, in the Southern regions occupied by theAllies, infant mortality decreased, while natality rates increased; inthe Centre-North, where the conflict lasted until April 1945, infantmortality rates remained higher than the pre-war level, while thenatality rate continued to diminish.
The anthropometric measurements of some samples of chil-dren in Rome and Naples in 1945 provide evidence of the negativeimpact of the war on health. In a sample of Roman schoolchildrenof 1945, at 6 years of age, boys were 1.6 cm shorter and girls 0.6 cmshorter than in 1939–1941. At the age of 11 years, the differencein height was of −2.8 cm for boys and −0.2 cm for girls. Between1945 and 1949, both height and weight increased markedly for allage-groups.
To verify a possible long-lasting effect of war on nutritionalhealth, we considered the heights of conscripts. During the lastcentury, average height significantly increased in Italy (Peracchi,2008; Arcaleni, 2006, 2012; A’Hearn and Vecchi, 2011). As in othercountries (Hatton and Bray, 2010), the trend of increase was inter-rupted by WWII. A diminution of height of about 0.4 cm for thecohort of conscripts born in 1945, with respect to the previousyear, is apparent from the national data. This regress in height wasaccompanied by a reduction of the number of conscripts from theNorthern regions falling in the highest groups of height distribu-tion. We propose that these changes are in part explained by thechange in the shares of conscripts coming from the diverse Ital-ian regions. In 1944–1945, in fact, because of the war, natality inthe Northern regions, where the average height was comparativelyhigher, fell. This impacted both on the average national height andthe distribution of the same. However, regional data on the statureof conscripts indicate that WWII probably also had an adverse andlong-lasting effect on general health. For the cohort of conscripts
born in 1943, slight decreases in height were registered in four Ital-ian regions, three of which were in the Centre-South. In 1944–1945stature decreased in some Northern Italian regions, where the warof liberation from the Nazi-Fascists lasted longer.
Acknowledgments
The authors would like to thank four anonymous reviewers fortheir helpful comments that greatly contributed to improving thefinal version of the paper. The usual disclaimers apply.
References
A’Hearn, B., Vecchi, G., 2011. Statura. In: Vecchi, G. (Ed.), In ricchezza e in povertà. IlMulino, Bologna, pp. 37–72.
A’Hearn, B., Vecchi, G., 2017. Height measuring wellbeing. In: Vecchi, G. (Ed.), AHistory of Italian Living Standards. Oxford University Press, New York, pp. 43–87.
A’Hearn, B., Peracchi, F., Vecchi, G., 2009. Height and the normal distribution: evi-dence from Italian military data. Demography 46, 1–25.
Akbulut-Yuksel, M., 2014. Children of war. The long-run effects of large-scale phys-ical destruction and warfare on children. Journal of Human Resources 49 (3),634–662.
Akresh, R., Verwimp, P., Bundervoet, T., 2011. Civil war, crop failure, and child stunt-ing in Rwanda. Economic Development and Cultural Change 59 (4), 777–810.
Alderman, H., Hoddinott, J., Kinsey, B., 2006. Long term consequences of early child-hood malnutrition. Oxford Economic Papers 58 (3), 450–474.
Angell-Andersen, E., Tretli, S., Bjerknes, R., Forsén, T., Sørensen, T.I., Eriksson, J.G.,Räsänen, L., Grotmol, T., 2004. The association between nutritional conditionsduring World War II and childhood anthropometric variables in the Nordiccountries. Annals of Human Biology 31 (3), 342–355.
Arcaleni, E., 1998. La statura dei coscritti italiani delle generazioni 1854–1976. Bol-lettino di Demografia Storica 29, 23–59.
Arcaleni, E., 2006. Secular trend and regional differences in the stature of Italians,1854–1980. Economics & Human Biology 4, 24–38.
Arcaleni, E., 2012. Secular trend and regional differences in the stature of Italians.Journal of Anthropological Sciences 90, 1–5.
Atella, V., Francisci, S., Vecchi, G., 2011. Salute. In: Vecchi, G. (Ed.), In ricchezza e inpovertà. Il Mulino, Bologna, pp. 73–129.
Ayuda, M.I., Puche, J., 2014. Determinants of height and biological inequality inMediterranean Spain, 1859–1967. Economics and Human Biology 15, 101–119.
Bacchetta, V., 1951. Alimentazione e stato di nutrizione dei bambini italiani dopo laguerra. Consiglio Nazionale delle Ricerche. Centro di studio per la fisiopatologiadell’alimentazione infantile, Spoleto.
Baffigi, A., 2015. Il Pil per la storia d’Italia. Istruzioni per l’uso, Marsilio, Venezia.Baldoli, C., 2010. I bombardamenti sull’Italia nella Seconda Guerra Mondiale.
Strategia anglo-americana e propaganda rivolta alla popolazione civile. DEP,Deportate, Esuli, Profughe, 13–14, 34–49.
Barberi, B., 1961. I consumi nel primo secolo dell’unita d’Italia 1861–1960. Giuffrè,Milano.
Baten, J., Wagner, A., 2003. Autarchy, market disintegration, and health: the mor-tality and nutritional crisis in Nazi Germany, 1933–1937. Economics & HumanBiology 1 (1), 1–28.
Blum, M., 2011. Government decisions before and during the First World War and theliving standards in Germany during a drastic natural experiment. Explorationsin Economic History 48, 556–567.
Blum, M., 2013. War, food rationing, and socioeconomic inequality in Germanyduring the First World War. The Economic History Review 66 (4), 1063–1083.
Bogin, B., 2001. The Growth of Humanity. Wiley-Liss, New York.Brosse, T., 1950. War-Handicapped Children. Report on the European Situation.
Unesco, Paris.Brundtland, G.H., Liestol, K., Walloe, L., 1980. Height, weight and menarcheal age
of Oslo schoolchildren during the last 60 years. Annals of Human Biology 7,307–322.
Cacciari, E., Milani, S., Balsamo, A., et al., 2002. Italian cross-sectional growth chartsfor height, weight and BMI (6–20 y). European Journal of Clinical Nutrition 56,171–180.
Candeloro, G., 1984. Storia dell’Italia moderna La seconda guerra mondiale. Il crollodel fascismo. La resistenza 1939–1945. Feltrinelli, Milano.
Coles, H.L., Weinberg, A.K., 1986. Civil Affairs: Soldiers Become Governors UnitedStates Army in World War II. Special Studies. Center of Military History, UnitedStates Army, Washington D.C.
Collotti, E., 1973. La seconda guerra mondiale. Loescher, Torino.Commissione alleata, Presidenza del Consiglio dei Ministri, Istituto Nazionale di Sta-
tistica, 1945. Censimenti e indagini per la ricostruzione nazionale eseguiti nelsettembre 1944, Roma.
Commissione Parlamentare d’inchiesta sulla miseria in Italia e sui mezzi per com-batterla, 1953. Relazione generale. Istituto Editoriale Italiano, Milano.
Costanzo, A., 1948. La statura degli italiani ventenni nati dal 1854 al 1920, vol. 2.Annali di Statistica, Istat, Roma, pp. 59–123.
Cox, M.E., 2015. Hunger games: or how the Allied blockade in the First World Wardeprived German children of nutrition, and Allied food aid subsequently savedthem. Economic History Review 68 (2), 600–631.

Please cite this article in press as: Daniele, V., Ghezzi, R. The impact of World War II on nutrition and children’s health in Italy.Investigaciones de Historia Económica - Economic History Research (2017). https://doi.org/10.1016/j.ihe.2017.09.002
ARTICLE IN PRESSG Model
IHE-353; No. of Pages 13
V. Daniele, R. Ghezzi / Investigaciones de Historia Económica - Economic History Research xxx (2017) xxx–xxx 13
Cuzzi, M., 2015. Guerra e alimentazione nell’Italia dei conflitti mondiali. Progressus.Università di Siena, pp. 56–79.
Daneo, C., 1975. La politica economica della ricostruzione: 1945–1949. Einaudi,Torino.
Daniele, V., Malanima, P., 2014. Falling disparities and persisting dualism: Regionaldevelopment and industrialisation in Italy, 1891–2001. Investigaciones de His-toria Económica – Economic History Research 10 (3), 165–176.
Danubio, M.E., Sanna, E., 2008. Secular changes in human biological variables inWestern Countries: an updated review and synthesis. Journal of AnthropologicalSciences 86, 91–112.
De Bernardi, A., Ganapini, L., 2010. Storia dell’Italia unita. Garzanti, Milano.Deaton, A., 2008. Height, health, and inequality: the distribution of adult heights in
India. American Economic Review Papers and Proceedings 98, 468–474.Devakumar, D., Birch, M., Osrin, D., Sondorp, E., Wells, J.C., 2014. The intergenera-
tional effects of war on the health of children. BMC Medicine 12 (1), 12–57.Galeotti, G., 1948. Inchiesta sullo stato di nutrizione degli alunni delle Scuole Comu-
nali di Roma in periodi di restrizioni. Istituto della Nutrizione del ConsiglioNazionale delle Ricerche, Roma.
Gioannini, M., Massobrio, G., 2007. Bombardate l’Italia. Storia della guerra di dis-truzione aerea 1940–1945. Rizzoli, Milano.
Goldson, E., 1996. The effect of war on children. Child Abuse & Neglect 20, 809–819.Grasgruber, P., Cacek, J., Kalina, T., Sebera, M., 2014. The role of nutrition and genetics
as key determinants of the positive height trend. Economics and Human Biology15, 81–100.
Grassivaro Gallo, P., 1972. L’evoluzione della statura in Italia. Analisi sui coscrittidelle leve tra il 1927 e il 1949. Genus, 171–203.
Hart, N., 1993. Famine, maternal nutrition and infant mortality: a re-examination ofthe Dutch Hunger Winter. Population Studies 47 (1), 27–46.
Hatton, T.J., Bray, B.E., 2010. Long run trends in the heights of European men,19th–20th centuries. Economics and Human Biology 8, 405–413.
Havari, E., Peracchi, F., 2016. Growing up in wartime: evidencefrom the era of two world wars. Economics & Human Biology,http://dx.doi.org/10.1016/j.ehb.2016.09.002.
Heijmans, B.T., Tobi, E.W., Stein, A.D., et al., 2008. Persistent epigenetic differ-ences associated with prenatal exposure to famine in humans. Proceedings ofthe National Academy of Sciences of the United States of America 105 (44),17046–17049.
Hermanussen, M., Burmeister, J., Burkhardt, V., 1995. Stature and stature distributionin recent West German and historic samples of Italian and Dutch conscripts.American Journal of Human Biology 7 (4), 507–515.
Hunt, N., 2008. Health consequences of war and political violence. In: Kurtz, L.(Ed.), Encyclopedia of Violence, Peace, & Conflict. Academic Press, Oxford, pp.923–933.
Ichino, A., Winter-Ebmer, R., 2004. The long-run educational cost of World War II.Journal of Labor Economics 22 (1), 57–87.
Istat, 1940. Annuario statistico italiano 1940 – XVIII, vol. VII. Istituto Poligrafico delloStato, Roma.
Istat, 1948. Annuario statistico dell’agricoltura italiana 1939–1942. Tipografia F.Failli, Roma.
Istat, 1950. Le cause di morte in Italia nel decennio 1939–1948. Istituto Poligraficodello Stato, Roma.
Istat, 1952. Movimento della popolazione secondo gli atti dello stato civile negli anni1943–1948 Serie III, vol. I. Tipografia F. Failli, Roma.
Istat, 1957. Morti e dispersi per cause belliche negli anni 1940–45. Roma.Istat, 1968. Sommario di Statistiche storiche dell’Italia 1861–1965. Roma.Istat, 1969. Annuario statistico italiano 1969, Roma.Istat, 1970. Annuario statistico italiano 1970, Roma.Istat, 1976. Sommario di Statistiche storiche dell’Italia 1861–1975. Roma.Istat, 1986. Sommario di Statistiche storiche 1926–1985. Roma.Istat, 2012. L’Italia in 150 anni. Sommario di statistiche storiche 1861–2010. Roma.Jacoboni, A., 1949. L’industria meccanica italiana. Centro di studi e piani tecnico-
economici, Roma.Kesternich, I., Siflinger, B., Smith, J.P., Winter, J.K., 2014. The effects of World War
II on economic and health outcomes across Europe. Review of Economics andStatistics 96 (1), 103–118.
Klinkhammer, L., 1993. L’occupazione tedesca in Italia. Bollati Boringhieri, Torino.Komlos, J., Meermann, L., 2007. The Introduction of anthropometrics into develop-
ment and economics. Historical Social Research 32 (1), 260–270.Labanca, N., 2015. The Italian wars. In: Overy, R. (Ed.), The Oxford Illustrated History
of World War II. Oxford University Press, Oxford, pp. 74–109.League of Nations, 1942. Wartime Rationing and Consumption. Economic Intelli-
gence Service – League of Nations, Geneva.League of Nations, 1944. Food Rationing and Supply 1943/1944. Economic, Financial
and Transit Department of the League of Nations, Geneva.League of Nations Food, 1946. Famine and Relief 1940–46. Transit Department of
the League of Nations, Geneva.Legnani, M., 1965. Aspetti economici delle campagne settentrionali e motivi di polit-
ica agraria nei programmi dei partiti antifascisti (1942–45). Il Movimento diLiberazione in Italia 78, 3–50.
Leroy, J.L., Ruel, M., Habicht, J.P., Frongillo, E.A., 2014. Linear growth deficit continuesto accumulate beyond the first 1000 days in low and middle-income countries:global evidence from 51 national surveys. Journal of Nutrition 144, 1460–1466.
Lowe, K., 2012. Savage Continent. Europe in the Aftermath of World War II. PenguinBooks, London.
Luzzatto Fegiz, P., 1948. Alimentazione e prezzi in tempo di guerra (1942–1943).Editrice Università di Trieste, Trieste.
Malina, R.M., 1990. Research on secular trend in auxology. AnthropologischerAnzeiger 48 (3), 209–227.
Martínez-Carrión J.M., Puche J., Ramon-Munoz J.M., 2012. Nutrición y desigualdadsocial en la Espana de Franco: evidencia antropométrica’. In: Segura A., MayayoA., Abelló T., dirs., La dictadura franquista. La institucionalizació d’un règim.Universitat de Barcelona, Barcelona, pp. 271–284.
Masali, M., Venturini, C., 1964. Anomalie nell’accrescimento dei giovani piemontesinati nel periodo bellico (1940–1945). Medicina Sociale 14, 375–379.
McEvoy, B.P., Visscher, P.M., 2009. Genetics of human height. Economics & HumanBiology 7 (3), 294–306.
Merrouche, O., 2011. The long term educational cost of war: evidence from land-mine contamination in Cambodia. The Journal of Development Studies 47 (3),399–416.
Minoiu, C., Shemyakina, O.N., 2014. Armed conflict, household victimization, andchild health in Cote d’Ivoire. Journal of Development Economics 108, 237–255.
Morgan, P., 2007. The fall of Mussolini. Italy, the Italians and the Second World War.Oxford University Press, New York.
Neugebauer, R., Hoek, H.W., Susser, E., 1999. Prenatal exposure to wartime famineand development of antisocial personality disorder in early adulthood. JAMA282 (5), 455–462.
Pak, S., Schwekendiek, D., Kim, H.K., 2011. Height and living standards in NorthKorea, 1930s–1980s. The Economic History Review 64, 142–158.
Palmer, M., Nguyen, C., Mitra, S., Mont, D., Groce, N., 2016. The Long-Term Impact ofWar on Health. Households in Conflict Network. HiCN Working Paper 2016.
Patricelli, M., 2007. L’Italia sotto le bombe. Guerra aerea e vita civile 1940–1945.Laterza, Roma-Bari.
Peracchi, F., 2008. Height and economic development in Italy, 1730–1980. AmericanEconomic Review, Papers & Proceedings 98, 475–481.
Perkins, J.M., Subramanian, S.V., Smith, G.D., Özaltin, E., 2016. Adult height, nutrition,and population health. Nutrition Reviews 74 (3), 149–165.
Puche, J., 2010. Guerra Civil, autarquía franquista y bienestar biológico en el mundorural valenciano. Historia Agraria 52, 129–162.
Puche, J., Cámara, A.D., Martínez Carrion, J.M., 2016. Estatura y mortalidad infan-til durante la Guerra Civil y la dictadura franquista: la Comunidad Valenciana.Asociación Espanola de Historia Económica, AEHE, Documentos de trabajo.
Ronchi, V., Ghiretti, F., Tagliacarne, G., 1948. Approvvigionamenti e consumi alimen-tari. Enciclopedia Italiana Treccani, http://www.treccani.it (online).
Roseboom, T.J., van der Meulen, J.H.P., Ravelli, A.C.J., Osmond, C., Barker, D.J.P., Bleker,O.P., 2001. Prenatal exposure to the Dutch famine and disease in later life: anoverview. Twin Research and Human Genetics 4 (5), 293–298.
Ruffolo, G., 1954. L’inchiesta parlamentare sulla miseria. Moneta e Credito 7 (25),49–53.
Sanna, E., 2002. Il secular trend in Italia. Antropo 3, 23–49.Scholte, R.S., van den Berg, G.J., Lindeboom, M., 2015. Long-run effects of gestation
during the Dutch Hunger Winter famine on labor market and hospitalizationoutcomes. Journal of Health Economics 39, 17–30.
Shields, L., Bryan, B., 2002. The effect of war on children: the children of Europe afterWorld War II. International Nursing Review 49, 87–98.
Silventoinen, K., 2003. Determinants of variation in adult body height. Journal ofBiosocial Science 35, 263–282.
Staub, K., Floris, J., Woitek, U., Rühli, F., 2015. From left-skewness to symmetry: howbody-height distribution among Swiss conscripts has changed shape since thelate 19th century. Annals of Human Biology 42 (3), 260–267.
Terrenato, L., Ulizzi, L., 1983. Genotype-environment relationships: an analysis ofstature distribution curves during the last century in Italy. Annals of HumanBiology 10 (4), 335–346.
U.S. Department of Agriculture – Office of Foreign Agricultural Relations, 1946.World Food Situation 1946, Washington, D.C.
U.S. Department of Labor – Bureau of Labor Statistics, 1945. Wartime prices, pricecontrol, and rationing in foreign countries. Bulletin 851, Washington, D.C.
Vecchi, G., 2011. In ricchezza e in povertà. Il benessere degli italiani dall’Unità a oggi.Il Mulino, Bologna.
Vecchi, G., 2017. Measuring Wellbeing. A History of Italian Living Standards. OxfordUniversity Press, New York.
Williams, I., 2013. Allies and Italians Under Occupation. Sicily and Southern Italy1943–1945. Palgrave Macmillan, Basingstoke.
Zamagni, V., 1998. Italy: how to lose the war and win the peace. In: Harrison, M. (Ed.),The Economics of World War II. Six Great Powers in International Comparison.Cambridge University Press, Cambridge, pp. 204–246.