Effects of polymer viscosity on the polymerization switching and electro-optical properties of...
6
This article appeared in a journal published by Elsevier. The attached copy is furnished to the author for internal non-commercial research and education use, including for instruction at the authors institution and sharing with colleagues. Other uses, including reproduction and distribution, or selling or licensing copies, or posting to personal, institutional or third party websites are prohibited. In most cases authors are permitted to post their version of the article (e.g. in Word or Tex form) to their personal website or institutional repository. Authors requiring further information regarding Elsevier’s archiving and manuscript policies are encouraged to visit: http://www.elsevier.com/copyright
-
Upload
independent -
Category
Documents
-
view
1 -
download
0
Transcript of Effects of polymer viscosity on the polymerization switching and electro-optical properties of...
This article appeared in a journal published by Elsevier. The attachedcopy is furnished to the author for internal non-commercial researchand education use, including for instruction at the authors institution
and sharing with colleagues.
Other uses, including reproduction and distribution, or selling orlicensing copies, or posting to personal, institutional or third party
websites are prohibited.
In most cases authors are permitted to post their version of thearticle (e.g. in Word or Tex form) to their personal website orinstitutional repository. Authors requiring further information
regarding Elsevier’s archiving and manuscript policies areencouraged to visit:
http://www.elsevier.com/copyright

Author's personal copy
Effects of polymer viscosity on the polymerization switching and electro-opticalproperties of unaligned liquid crystal/UV curable polymer composites
Praveen Malik a,⁎, K.K. Raina b,⁎, A.K. Gathania c
a Department of Physics, Dr. B. R. Ambedkar National Institute of Technology, Jalandhar, 144 011, Punjab, Indiab School of Physics and Materials Science, Thapar University, Patiala, 147 004, Punjab, Indiac Department of Applied Science and Humanities, National Institute of Technology, 177 005, Hamirpur, India
a b s t r a c ta r t i c l e i n f o
Available online 25 August 2010
Keywords:Polymer dispersed ferroelectric liquid crystalDroplet morphologyPolymerization induced phase separationSpontaneous polarizationRise time
Polymer dispersed ferroelectric liquid crystal composite films consisting of varying polymer viscosities wereprepared by polymerization induced phase separation (PIPS) technique. It was found that polymer viscosityinfluences the polarization switching and optical responses. A polymer dispersed ferroelectric liquid crystalfilm of low polymer viscosity shows faster switching, however a higher optical transmission at ~70% wasobserved in a higher polymer viscosity film.
© 2010 Elsevier B.V. All rights reserved.
1. Introduction
Polymer dispersed liquid crystal [PDLC] composite films usuallyconsist of a fewmicron (~5 μmor less) size liquid crystal (LC) dropletsdispersed in transparent polymermatrix. In the last two decades PDLCfilms have gained tremendous importance due to wide rangingapplication from switchable to electro-optic displays [1–4]. Thesefilms can be switched from light scattering state (off state) totransparent state (on state) with an external applied electric field. Inthe off state, the symmetry axis of the LC droplets (i.e. dropletdirector) is randomly oriented. In this state, the refractive indexmismatch between LC droplets and polymer matrix produces a stronglight scattering and the sample appears opaque [1]. While in thepresence of an electric field, droplet director aligns in the direction ofthe applied electric field and the sample appears transparent. Thetransparency of the sample is due to the matching of the ordinaryrefractive index of LC droplets to the polymer i.e. no~np.
Recently, much emphasis is being devoted by the researchers andtechnologist to the development of new display materials for fastswitching and high contract electro-optic devices. Currently availablePDLCs devices consisting of nematic liquid crystal are not comparablewith the switching time of polymer–ferroelectric liquid crystals(FLCs) films. So keeping this idea in mind, polymer dispersedferroelectric liquid crystal films of faster switching time and enhancedelectro-optical responses have been prepared and studied. Theswitching time of such films depends on a variety of factors amongstwhich film morphology plays a crucial role [5–7]. This is determined
by surface treatment, composition, curing rate and dose, nature, kindof polymer and also the mutual solubility of FLC and pre-polymer [8–11].
In the present work, an attempt has been made to study the role ofpolymer viscosities without any surface treatment on glass substrateson polarization switching and electro-optical response of PDFLC films.Our previous work was emphasized on the effect of polymer viscosityon morphological and various electro-optic properties in alignedPDFLC films [15].
2. Experimental details
2.1. Materials
In this study, four PDFLC samples were prepared using UV curablepolymers of different viscosity ranges from 140 CPS, 1000 CPS, 2500CPS and 5000 CPS trade name (NOA-73, NOA-65, NOA-63 and NOA-68) (NORLAND, NJ) respectively [12] and a room temperature FLCmixture (ZLI-3654) (E. Merck Darmstadt) [13] by a standard PIPStechnique [14,15]. The phase sequence of the used FLC mixture isgiven by
b−30°C 62°C 76°C 86°CK→SmC*→SmA→Cholesteric→Iso:
2.2. Preparation of PDFLC films
Liquid crystal and polymer materials were taken in a fixed70:30 wt./wt. ratio [(LC/polymer)] in a vial. The homogenousmixtures of (LC–polymer) were heated to isotropic temperature of
Thin Solid Films 519 (2010) 1047–1051
⁎ Corresponding authors. Fax: +91 1812690 320.E-mail addresses: [email protected] (P. Malik), [email protected]
(K.K. Raina).
0040-6090/$ – see front matter © 2010 Elsevier B.V. All rights reserved.doi:10.1016/j.tsf.2010.08.041
Contents lists available at ScienceDirect
Thin Solid Films
j ourna l homepage: www.e lsev ie r.com/ locate / ts f
Author's personal copy
the LC by placing in a vacuum oven to obtain good mixing and ensureproper dispersion after shaking. Two untreated indium tin oxide (ITO)coated glass substrates were used as a sample cells separated by aMylar spacer with a thickness of 10 μm. These substrates were firstrinsed, cleaned and sealed. The homogenous mixture was then filledbetween ITO coated empty sample cells by capillary action by heatingthe mixture to the isotropic temperature of LC. The sample cells werethen cooled down to room temperature and then sealed. For completephase separation, filled sample cells were exposed to UV light ofintensity 2 mW/cm2 for one hour and then placed in a hot-stageattached with Temperature programmer (Model linkam TP 94 andTMHS 600) at an accuracy of ±0.1 °C. The micro-texture were viewedat a magnification of 10× through polarizing microscope (ModelOlympus BX 51P) fitted with charge coupling device (CCD) cameraand interfaced with a computer. The electric field was applied by afunction generator (Model Philips FG-8002). The electro-opticalresponses were measured through photomultiplier tube (ModelRCA 931) and detected on a digital storage oscilloscope (ModelTektronix TDS 2024) using Wave-Star software. Polarization switch-ing studies were carried out using polarization current technique[10,15]. The experimental setup for polarization switching and opticalresponses is shown in Fig. 1.
3. Results and discussion
3.1. Microscopy studies
The dispersion of ferroelectric liquid crystal mixture in polymermatrix shows submicron to micron size FLC droplets. The LC dropletsize was measured by taking the mean of major to minor axisdroplet diameter. Since droplet shapes are not completely circularso for the precise measurement average of around 10–15 randomdroplets were selected and measured. The droplet size was found inthe range of 5–55 μm. The dispersion of FLC mixture in thesepolymers and its size distribution was reported earlier [15]. A minorphase shift of 1–2 °C was noticed in SmC* to SmA phase in lowviscosity film, whereas approximately the same decrease oftransition in SmC* and SmA phases was also seen in higher viscosityfilms and confirmed by optical microscopy. Authors believe thatthis phase shift may be due to mainly two factors — the incompletephase separation and restricted LC droplets embedded intopolymer. Due to incomplete phase separation a small amount ofpolymer/LC materials remains dissolved in each other.
3.2. Polarization switching
Spontaneous polarization (Ps) in SmC* phase gives information notonly about the internal structure of themeso-phase but also about thequantity of phase separation since it is directly correlated to thefraction of switching molecules. Polarization current technique is oneof the most precise method for the measurement of electro-opticparameters in FLC and PDFLC materials [17]. In this method, asymmetric triangular wave applied to PDFLC film. Due to applicationof electric field the dipoles reorients between two stable polarizationstates (i.e. UP and DOWN) and molecular realignment in the form ofvoltage drop was detected on the storage oscilloscope across astandard resistance R (~100 kΩ). In PDFLC films, for a certain appliedvoltage the response of current I(t) consist of three components, thecapacitive term (IC) and the ionic conduction term (IR). The third termis polarization current (IP) due to the charge induced by the dipolerealignment in the form of polarization hump. Thus the contributionto the total current would be
I tð Þ = IR + IC + IP: ð1Þ
The area under the polarization hump is a measure of thespontaneous polarization is given by [18,19].
Ps =A V × tð Þ
R Area of Sampleð Þ ð2Þ
where A (V×t) is the area under the curve measured by integratingthe polarization hump in terms of voltage and time. The outputwaveform traced on oscilloscope in the form of area of polarizationhump in SmC* phase at different temperatures are shown in Fig. 2. Thearea of hump continuously decreases with increasing the temperatureand can be clearly seen in Fig. 2. The variation of Ps (external field —
10 V/μm, 100 Hz) with temperature at different viscosities is shown inFig. 3. It is observed that with increasing temperature, Ps decreasesand at SmC*–SmA transition temperature (Tc*A), suddenly drops tosmaller value. Decrease of Ps with temperature also reflect thesecondary order parameter of the SmC* phase. The temperaturedependence of Ps, follows the relation:
Ps Tð Þ = K Tc*A−T� �β ð3Þ
where K is constant and β is critical exponent. The calculatedvalue of β deduced from the fitting of Eq. (3) is plotted in Fig. 4.The value of β lies within the range of 0.262 to 0.631 and verycloser to the theoretical value 0.5 as obtained from mean fieldtheory.
The decreasing behavior of Ps with temperature can beexplained on the basis of intra-molecular rotation and interactionsin the system. A decrease in Ps value may be due to weak P–E(polarization–electric field) and P–θ (polarization–tilt angle) cou-pling in ferroelectric liquid crystals at higher temperature. Ourresults indicate that the PDFLC films of lower polymer viscosity(NOA-73) shows higher Ps (~8.89 nC/cm2) than the film exhibitinghigher polymer viscosity (NOA-68) (Ps~6.50 nC/cm2) whereas thepure FLC mixture has a Ps (~23 nC/cm2) at 30 °C [15]. Thus thepolymer viscosity affects Ps and lowers it by about 40% and 28% inlow and high viscosity polymer matrixes respectively. In the wholetemperature range we found that polarization decreases but at thesame time flexibility in the composite films has enhanced. A closerrepresentation of Ps dependence as a function of polymer viscosityat different temperatures is also shown in Fig. 5. It depicts that Psdecreases with increases of polymer viscosity. Our results indicatethat the films follow the Arrhenius behavior over all the viscosityranges.
PDFLC Sample holder RS 232cum hot stage
Function Generator Scientech ST4060
TemperaturecontrollerTHMS 600
StorageOscilloscopeTDS 2024
CHI CHII Gnd
P-IV InterfaceSystem
PR
PMT
Fig. 1. Experimental set up for the measurement of polarization switching.
1048 P. Malik et al. / Thin Solid Films 519 (2010) 1047–1051
Author's personal copy
3.3. Electro-optical responses
To analyze the electro-optical responses, wemeasured transmissionvariation with applied electric field at different polymer viscosities atroom temperature. The electric field was driven by a square wave pulse
at a frequency of 50 Hz. Fig. 6 shows the applied voltage dependence onoptical transmission for PDFLC films at 30 °C. Transmission increasesalmost linearly up to ~70%with voltage (90 V) and reaches saturation at≥100 V. It can be clearly seen from the Fig. 6 that higher viscosity PDFLCfilm shows enhanced transmission than low viscosity prepared PDFLC
28 30 32 34 36 38 40 42 44 46 48 50 52 54 56 58 60 62 64
Temperature (°C)
0.25
0.30
0.35
0.40
0.45
0.50
0.55
0.60
0.65
140 CPS
1000 CPS
2500 CPS
5000 CPS
Crit
ical
Exp
onen
t (β)
Fig. 4. Temperature dependence on critical exponent (β) at different polymerviscosities.
40oC 50oC
60oC
Fig. 2. Waveform of polarization hump in SmC* phase under electric field 10 V/μm (100 Hz) at different temperatures: (a) 40 °C (b) 50 °C (c) 60 °C.
28 30 32 34 36 38 40 42 44 46 48 50 52 54 56 58 60 62 64
3.0
3.5
4.0
4.5
5.0
5.5
6.0
6.5
7.0
7.5
8.0
8.5
9.0
9.5
10.0 140 CPS Fitting- 140 CPS 1000 CPS Fitting- 1000 CPS 2500 CPS Fitting-2500 CPS 5000 CPS Fitting-5000 CPS
Pol
ariz
atio
n (n
C/c
m2 )
Temperature (°C)
Fig. 3. Temperature dependence on spontaneous polarization at different polymerviscosities.
1049P. Malik et al. / Thin Solid Films 519 (2010) 1047–1051

Author's personal copy
film. The optical transmission as a function of varying polymerviscosities of PDFLC films is explained by the variation of liquid crystalsize distribution and its uniformity by the relation [15,16]
Vt =2g ρp−ρlc
h i:R
2
9μð4Þ
where μ represent polymer viscosity, ρp and ρlc are the density of thepolymer and liquid crystal respectively. R is the radius of liquid crystaldroplet dispersed into polymer network. Eq. (4) shows that the freevolume available to form the liquid crystal droplets (i.e. dropletradius) in the polymer matrix is dependent on polymer viscosity andincreases with increasing the polymer viscosity. The micro textures ofthese films shows that the number of LC droplets are higher in lowerviscosity PDSFLC film [15,17]. The incident light is highly scattered bythe LC droplets in lower viscosity PDFLC film and hence produceslower transmission than higher viscosity PDFLC film under zeroapplied field. P. Malik et al. and other groups [15,20] reported almost
similar type of LC size distribution and optical transmission behaviorwith polymer viscosities.
A small decrease in threshold voltage (Vth) with increasingpolymer viscosity films is also seen. The reason can be explained onthe basis of required applied voltage by the composite films. Aspolymer is a dielectric material, it consumes more parts of appliedvoltage and thus leads to reduced effective voltage for LC droplets forhigh viscosity film than lower viscosity films.
Contrast ratio (CR=TS/To, TS is the maximum transmission whenthe sample reaches at saturation level, To is the initial off-statetransmittance in the field off state) is an important parameter tomeasure the performance of display device. Fig. 7 shows that theincrease of polymer viscosity resulted in a corresponding increase incontrast ratio. Another critical factor for the film performance, is risetime (τR) and fall time (τF). τR and τF is defined as the time requiredfor the transmission change from 10 to 90% upon switching the fieldON, and transmission changes from 90 to 10% upon switching the fieldOff. These times are represented as [21]
1τR
=1γ1
Δε × E2−K l2−1� �a2
24
35 ð5Þ
τD =γ1 × a2
K l2−1� �
" #ð6Þ
where γ1 is the rotational viscosity of liquid crystal, E is the appliedelectric field,Δε is the dielectric anisotropy of the LC, K effective elasticconstant, a is major axis of LC droplet and l its anisotropy (ratio ofmajor to minor radius of droplet).
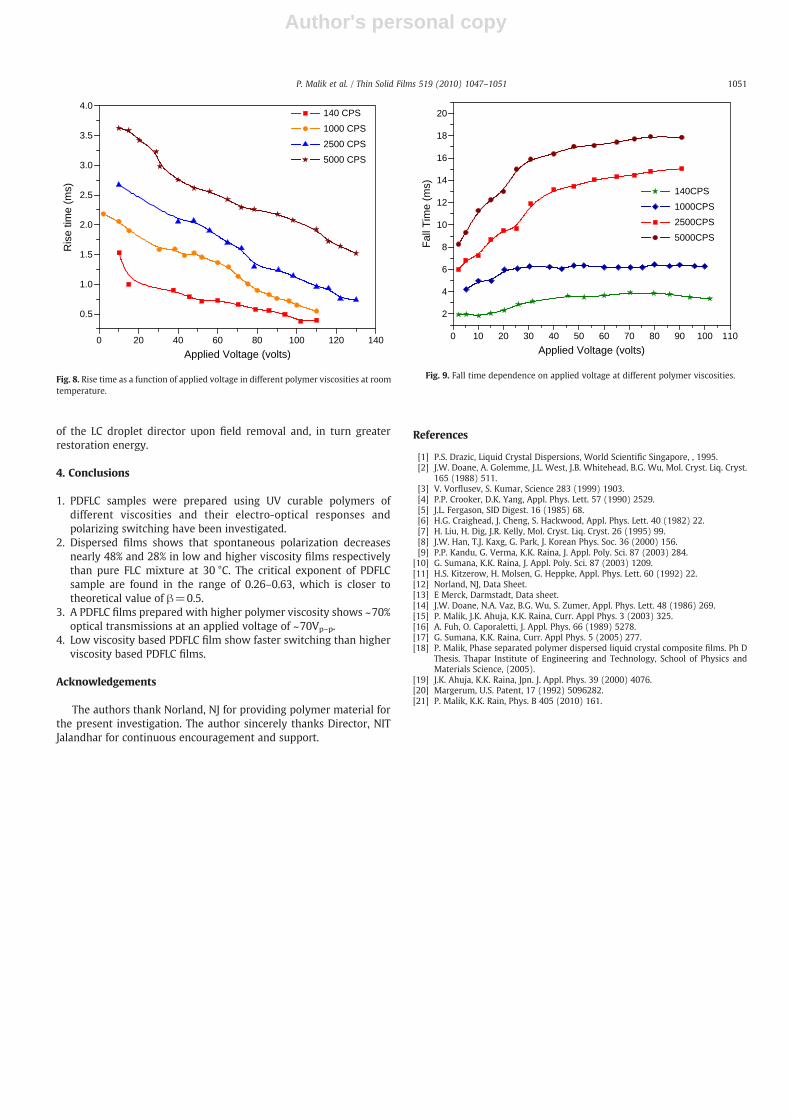
The analysis of Eqs. (5) and (6) indicates that τR decreases withvoltage, whereas τF depends on liquid crystal size, shape andinterfacial interaction between polymer and LC droplet interface.Figs. 8 and 9 show the applied voltage dependence on τR and τFrespectively. A decrease in τR was observed in all the samples,however the low viscosity sample show faster switching time thanhigher viscosity film, which is due to the requirement of much voltageto switch the film ON in comparison to lower viscosity film. On theother hand, τF shows opposite tendency and was apparentlyindependent of applied field. The increase of τF with voltage whichcan be seen from Fig. 9 suggests that the rotation and higher orderalignment of LC molecules along the applied E direction occurred at amuch higher driving voltage. This required a much greater distortion
0 500 1000 1500 2000 2500 3000 3500 4000 4500 50000
2
4
6
8
10
12
14
Con
tras
t Rat
io
Polymer Viscosity (CPS)
Fig. 7. Contrast ratio versus polymer viscosity at room temperature.
0 1000 2000 3000 4000 5000
5.0
5.5
6.0
6.5
7.0
7.5
8.0
8.5
9.0
Spo
ntan
eous
Pol
ariz
atio
n (n
C/c
m2 )
Polymer Viscosity (CPS)
30°C
35°C
40°C
50°C
Fig. 5. Effect of polymer viscosity on spontaneous polarization in SmC* phase.
20 40 60 80 100 120 1400
10
20
30
40
50
60
70
80
90
100
Tra
nsm
issi
on(%
)
Applied Voltage (Volts)
140 CPS
1000 CPS
2500 CPS
5000 CPS
Fig. 6. Applied voltage (f=50 Hz) dependence on optical transmission at differentpolymer viscosities.
1050 P. Malik et al. / Thin Solid Films 519 (2010) 1047–1051
Author's personal copy
of the LC droplet director upon field removal and, in turn greaterrestoration energy.
4. Conclusions
1. PDFLC samples were prepared using UV curable polymers ofdifferent viscosities and their electro-optical responses andpolarizing switching have been investigated.
2. Dispersed films shows that spontaneous polarization decreasesnearly 48% and 28% in low and higher viscosity films respectivelythan pure FLC mixture at 30 °C. The critical exponent of PDFLCsample are found in the range of 0.26–0.63, which is closer totheoretical value of β=0.5.
3. A PDFLC films prepared with higher polymer viscosity shows ~70%optical transmissions at an applied voltage of ~70Vp–p.
4. Low viscosity based PDFLC film show faster switching than higherviscosity based PDFLC films.
Acknowledgements
The authors thank Norland, NJ for providing polymer material forthe present investigation. The author sincerely thanks Director, NITJalandhar for continuous encouragement and support.
References
[1] P.S. Drazic, Liquid Crystal Dispersions, World Scientific Singapore, , 1995.[2] J.W. Doane, A. Golemme, J.L. West, J.B. Whitehead, B.G. Wu, Mol. Cryst. Liq. Cryst.
165 (1988) 511.[3] V. Vorflusev, S. Kumar, Science 283 (1999) 1903.[4] P.P. Crooker, D.K. Yang, Appl. Phys. Lett. 57 (1990) 2529.[5] J.L. Fergason, SID Digest. 16 (1985) 68.[6] H.G. Craighead, J. Cheng, S. Hackwood, Appl. Phys. Lett. 40 (1982) 22.[7] H. Liu, H. Dig, J.R. Kelly, Mol. Cryst. Liq. Cryst. 26 (1995) 99.[8] J.W. Han, T.J. Kaxg, G. Park, J. Korean Phys. Soc. 36 (2000) 156.[9] P.P. Kandu, G. Verma, K.K. Raina, J. Appl. Poly. Sci. 87 (2003) 284.
[10] G. Sumana, K.K. Raina, J. Appl. Poly. Sci. 87 (2003) 1209.[11] H.S. Kitzerow, H. Molsen, G. Heppke, Appl. Phys. Lett. 60 (1992) 22.[12] Norland, NJ, Data Sheet.[13] E Merck, Darmstadt, Data sheet.[14] J.W. Doane, N.A. Vaz, B.G. Wu, S. Zumer, Appl. Phys. Lett. 48 (1986) 269.[15] P. Malik, J.K. Ahuja, K.K. Raina, Curr. Appl Phys. 3 (2003) 325.[16] A. Fuh, O. Caporaletti, J. Appl. Phys. 66 (1989) 5278.[17] G. Sumana, K.K. Raina, Curr. Appl Phys. 5 (2005) 277.[18] P. Malik, Phase separated polymer dispersed liquid crystal composite films. Ph D
Thesis. Thapar Institute of Engineering and Technology, School of Physics andMaterials Science, (2005).
[19] J.K. Ahuja, K.K. Raina, Jpn. J. Appl. Phys. 39 (2000) 4076.[20] Margerum, U.S. Patent, 17 (1992) 5096282.[21] P. Malik, K.K. Rain, Phys. B 405 (2010) 161.
0 10 20 30 40 50 60 70 80 90 100 110
2
4
6
8
10
12
14
16
18
20
Fal
l Tim
e (m
s)
Applied Voltage (volts)
140CPS
1000CPS
2500CPS
5000CPS
Fig. 9. Fall time dependence on applied voltage at different polymer viscosities.
0 20 40 60 80 100 120 140
0.5
1.0
1.5
2.0
2.5
3.0
3.5
4.0
Ris
e tim
e (m
s)
Applied Voltage (volts)
140 CPS
1000 CPS
2500 CPS
5000 CPS
Fig. 8. Rise time as a function of applied voltage in different polymer viscosities at roomtemperature.
1051P. Malik et al. / Thin Solid Films 519 (2010) 1047–1051